

ABOUT CE FRANKLIN
For more than half a century, CE Franklin has been a wide. The Company’s core market is the Canadian oil used for drilling and completions, production, oil sands and enhanced recovery projects and supplies Company’s products and services facilitate and enhance pipelining operations.
We serve our customers through an extensive network of as internationally. Additional stocking locations storage sites. All are connected by state-of-the-art ment system.
Shares of CE Franklin trade on the Toronto Stock under the symbol “CFK.” At December 31, 2005, there ing. Smith International, Inc., the parent company of Company’s outstanding shares.
ANNUAL MEETING OF SHAREHOLDERS
CE Franklin’s 2006 Annual Meeting of Shareholders 319 – 5 Avenue S.W., Calgary, Alberta on Tuesday, parties are invited to attend.
Forward-Looking Information
Certain of the statements set forth in this annual report areforward-looking statements within the meaning of Section 27A of the United States Securities Act of 1933 and Section 21E of the United States Securities Exchange Act of 1934 and the Private Securities Litigation Reform Act of 1995. These statements include, but are not limited Customer to, with respect to commodity prices, projections relating to oilsands spending and estimated annual total revenue per employee. Although the Company believes that its expectations are based on reasonable assumptions, it can give no assurance that the expected results will be achieved. There are numerous risks and uncertainties that can affect the outcome and timing of such events, including many factors beyond the control of the Company. These factors include, but are not limited to, economic conditions, seasonality of drilling activity, commodity prices for oil and gas, currency fluctuations, and government regulations. Should one or more of these risks or uncertainties occur, or should underlying assumptions prove incorrect, the Company's actual results and plans for 2005 and beyond could differ materially from those expressed in the forward looking statements. Please refer to pages 34 to 37 for a detailed description of the Company's risk factors. | CONTENTS |
2005 Highlights 2 |
Message to Shareholders 4 |
Our Leadership Team 10 |
Customer Service and Quality 12 |
Serving Our Communities 14 |
Health, Safety and Environment 16 |
Our Mission and Operating Values 17 |
Management's Discussion and Analysis 18 |
Management's Report 38 |
Auditors' Report 39 |
Financial Statements 40 |
Notes to Financial Statements 44 |
Supplementary Information 54 |
Leadership Team Information 58 |
Board of Directors Information 59 |
Corporate Information 60 |
Our Dedicated Employees inside back cover |
| 2005 ANNUAL REPORT CE FRANKLIN LTD. 1 |
2005 Highlights
(in millions of Canadian, except per share amounts)
| 2005 | 2004 | 2003 | 2002 | 2001 |
Sales | 482.4 | 338.7 | 257.1 | 255.1 | 371.1 |
(1) | 36.0 | 15.9 | 7.9 | 1.7 | 4.2 |
(1)as a % of Sales | 7.5% | 4.7% | 3.1% | 0.7% | 1.1% |
Income (loss) from | 18.9 | 6.1 | 1.3 | (2.0) | (1.1) |
Net income (loss) | 18.9 | 6.1 | 0.4 | (2.5) | 0.6 |
Net income (loss) per share | | | |
- continuing operations | | | | |
Basic | 1.09 | 0.36 | 0.07 | (0.12) | (0.06) |
Diluted | 1.01 | 0.35 | 0.07 | (0.12) | (0.06) |
Net income (loss) per share | | | |
Basic | 1.09 | 0.36 | 0.02 | (0.15) | 0.04 |
Diluted | 1.01 | 0.35 | 0.02 | (0.15) | 0.04 |
Balance Sheet Results | | | | | |
Current assets | 180.0 | 131.4 | 100.6 | 79.0 | 89.8 |
Total assets | 192.5 | 145.5 | 117.6 | 99.5 | 112.9 |
Current liabilities | 116.1 | 90.2 | 68.4 | 49.7 | 58.9 |
Long-term liabilities | 0.4 | 1.2 | 1.6 | 2.6 | 4.0 |
Shareholders’ equity | 75.9 | 54.1 | 47.6 | 47.2 | 50.0 |
(1)EBITDA represents income from continuing operations before non-GAAP financial measure used by management, as well as as presented, represents a useful means of assessing the Company’s earnings trends without showing the impact of through to EBITDA and EBITDA as a percentage of sales because is not used by management as an alternative to net income as other measure of performance in conformity with generally activities as a measure of liquidity. Not all companies prescribed by GAAP. Accordingly, EBITDA, as the term is used page 25 for a reconciliation of income from continuing

| 2 CE FRANKLIN LTD. 2005 ANNUAL REPORT | |

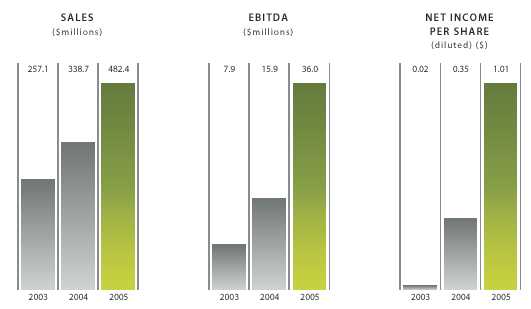
CE Franklin’s 42.4% growth in sales clearly outpaced the increase in activity levels, reflecting our ability to attract a larger share of the market through successful service, sales and marketing efforts.

CE Franklin’s EBITDA (earnings before interest, taxes, depreciation and amortization) increased 126% to $36 million in 2005 compared to $15.9 million for 2004.

Our commitment to build a profitable and sustainable business model through resulted in a 208% year-over-year increase share (diluted) rose 189% to $1.01.
| 2005 ANNUAL REPORT CE FRANKLIN LTD. 3 |
MESSAGE TO SHAREHOLDERS
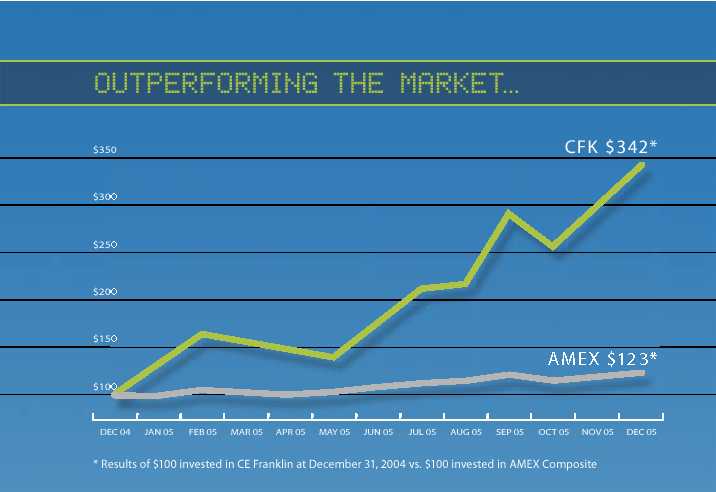
Outperforming the Market and Sustainable Growth
2005: Strong Results through
For CE Franklin, 2005 was a record-breaking year. We posted higher sales, net income per fully diluted share than any year in the Company's history. The financial community rewarded our performance, and our stock saw a significant increase in value.
Key financial results in 2005, compared to 2004:
Sales climbed 42.4% to $482.4 million
Net income rose 208% to $18.9 million
Net income per share (diluted) increased
Revenue per employee, a key efficiency
CE Franklin’s common shares appreciated and average trading volumes moved from 2005 to Dec. 31, 2005).
When the current management team assumed leadership of the Company in 2002,we implemented a strategy of disciplined growth. The successful execution of our strategy has enabled CE Franklin to enjoy 13 consecutive quarters of year-over-year improvement, and in 2005 the Company achieved four straight comparative quarters of record results.
Results Outperforming Market Activity
Our stated goal in 2005 was to outperform the market activity in our product and service segment, as measured by two exploration and production activity indicators.
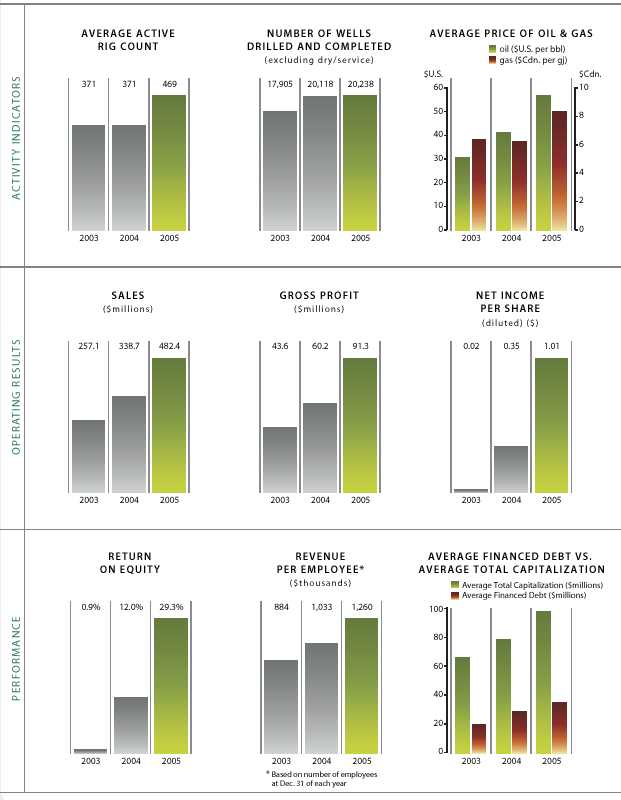
Rig activity rose 26.4% in 2005,to 469 average rigs compared to 371 the previous year. The total number of wells completed in Western Canada (excluding dry and service wells) remained relatively constant, rising just 0.6%during the year (20,238 versus 20,118 wells in 2004). CE Franklin's 42.4%growth in sales clearly outpaced the increase in activity levels,reflecting our ability to attract a larger share of the market through successful service, sales, and marketing ef forts.
Fulfilling Our Promises: 2002 vs. 2005
Our commitment to build a profitable and sustainable business model through disciplined growth resulted in a 208% year-over-year increase in net income to $18.9 million in 2005.Net income per share (diluted) rose 189% to $1.01.
In 2001,before the leadership change,CE Franklin showed a net loss from continuing operations of $1.1 million,despite achieving $371.1 million in sales. The strategies we implemented in 2002 led
| 4 CE FRANKLIN LTD. 2005 ANNUAL REPORT | |

to a turnaround in profitability in the third quarter of 2003.Continued enhancements to these operational improvements have resulted in 10 successive quarters of profitability.
These strategies ensure that all internal processes are performed consistently throughout the Company and that individual employees are accountable for their contribution to the organization.
CE Franklin's EBITDA (earnings before interest, taxes, depreciation and amortization) increased 126% to $36 million in 2005 compared to $15.9 million for 2004.We have continued to grow, but most importantly, we have continued to deliver profitable f low-through to the bottom line. The $143.7 million increase in sales resulted in 14%incremental f low-through to EBITDA, compared to 10%incremental f low-through to EBITDA in 2004.
We also made further improvements to EBITDA as a percentage of sales, which was 7.5%in 2005, up from 4.7%in 2004,3.1%in 2003,and 0.7%in 2002. CE Franklin measures revenue dollars per employee as another operating efficiency benchmark. Revenue per employee in 2005 was up 22% year-over-year and has improved by 58% since 2002. Our lines invoiced per employee, another productivity measure, improved 33% from the prior year.
These improvements to our bottom line were attained despite extreme cost pressures, such as higher wages due to the labour shortage in Western Canada, fuel cost increases, occupancy cost increases, and substantial cost increases in freight, vehicles and utilities. We did not implement price increases in 2004 or 2005,over and above increases by suppliers from the rise in steel prices.
| 2005 ANNUAL REPORT CE FRANKLIN LTD. 5 |
MESSAGE TO SHAREHOLDERS
Building A Market Leader
Strong partnerships with our vendors have also contributed to our success. Gross profit improved 51.6%in 2005 to $91.3 million from $60.2 million the year before. The improvement results from steps initiated in 2003 and supported in 2004 and 2005,including offshore procurement, vendor standardization of certain product lines, and more disciplined procurement practices.
In 2005 we opened three new field branches in Alberta to support new customer contracts and expanding markets in Rocky Mountain House, Strathmore, and Grande Cache. Same-store sales, which exclude sales from new stores, improved 45% over 2004.
We are committed to ensuring the Company's long-term success by developing its people. We put more staff through training and development programs in 2005 than in any previous year. We worked on developing the Company's technical skills as well as its leadership and behavioural skills. We also developed a solid succession planning program for key positions within the organization.
We will continue to support our employees by putting them through capability training and core competency training programs.We will also deliver more aggressive recruitment and retention programs in 2006,with the goal of hiring and retaining the best available work force.
In 2005,we were proud to add the Starlight Starbright Children's Foundation to the list of charities that we support. CE Franklin had the honour and privilege of helping sponsor four children's wishes in 2005 and was able to help make a difference in the lives of these sick children. Active involvement in our communities is a cornerstone of our success and a responsibility we take seriously in all 41 markets in which we operate.
 Foundation for Growth
Over the past three years, we have built a solid foundation for the Company's future growth. This growth will be driven by the same key disciplines and operating strategies that have guided us since 2002.We will continue to focus on enhancing our customer service, streamlining operations, and developing our people.
Going forward, we expect strong commodity prices and market activity levels to support high demand for CE Franklin's products and services. We intend to meet this demand by exploring potential new store openings and expanding the capacity of existing stores in Western Canada.
We will be looking to enhance our organic growth by diversifying our services and products primarily through joint ventures and acquisitions. We will explore opportunities to be involved in the total
product life cycle and better serve our customers with complementary products and services. All opportunities executed will be incremental to our growth and provide an immediate positive impact
on the bottom line.
We will also expand our global reach through partnerships and joint ventures. We are in the infancy of our international development and are committed to disciplined growth. As part of this initiative, we are leveraging the expertise of U.S.-based Wilson Supply to expand our markets and diversify our product lines. Wilson Supply is a division of Smith International, Inc., CE Franklin's major shareholder.
Our first international joint venture with Wilson will be in Libya and is currently in the business development stage. We expect to have the value model solidified in 2006 and be ready to contribute to profit in 2007.
| 6 CE FRANKLIN LTD. 2005 ANNUAL REPORT | |

| 2005 ANNUAL REPORT CE FRANKLIN LTD. 7 |
MESSAGE TO SHAREHOLDERS
Wilson and CE Franklin have been successful in joint marketing activities in the past and will leverage Wilson's international expertise to mitigate risk and maximize opportunities in the future.
Enhancing Shareholder Value
Shares of CE Franklin trade on the Toronto Stock Exchange under the symbol "CFT" and on the American Stock Exchange under the symbol "CFK." Our Company's performance during 2005 has attracted increased interest from the investment community in both Canada and the United States.
As a result, average daily trading volumes increased significantly from 106,000 shares in 2004 to 180,000 shares in 2005.The share price appreciated 242% year-over-year from U.S.$4.06 to U.S.$13.89.We are conf ident that shareholders will be well rewarded for their loyalty, as we continue to enhance shareholder value.
The Company's total capitalization (financed debt plus equity) comprised 28.1%debt at year-end 2005 (versus 33.3 %at year end 2004) and 71.9% equity (versus 66.7%), giving us a healthy debt to equity ratio of 0.39 and a solid platform for growth.
In Closing
In closing, I wish to congratulate employees for their efforts and the pride they took in their work, which generated record results. Without their dedication and expertise, our accomplishments would not have been possible. I would also like to acknowledge our Board of Directors for their continued support and invaluable guidance.
I also extend a sincere thanks to Salvatore (Sam) Secreti, who will be resigning from the position of Vice President and Chief Financial Officer of the Company, effective the end of May. Mr. Secreti has been with the Company since January 2001 and was instrumental in its successful return to profitability. We wish him well in his future endeavours.
CE Franklin is well positioned to become the leading supplier of products, services, and solutions to the energy industry worldwide. We will build on our successes by serving our customers, delivering strong incremental flow-through to the bottom line, and further enhancing shareholder value.

Michael S. West
Chairman, President and
Chief Executive Officer

| 8 CE FRANKLIN LTD. 2005 ANNUAL REPORT | |

| 2005 ANNUAL REPORT CE FRANKLIN LTD. 9 |

Our Leadership
1 RON BROWNVP, SALES
"We continue to increase sales by adhering to the basics of our business, knowing our customers and delivering a high level of Customer Service. We have built a Sales Team that supports these
objectives and will continue to work closely with operations to achieve our common goals."
2 RON KOPERVP, BUSINESS EFFECTIVENESS
"Piece by piece we are building a force in the marketplace, one which will drive sustained value for customers, employees, investors, Suppliers and communities. Re-investments in people, processes, products and quality have begun to show returns. It was an honour and privilege to serve, support and challenge CE Franklin people in 2005."
3 JIM BAUMGARTNERVP, OPERATIONS
"We continue to view and interact with our customers as business partners. The results of 2005 show that this practice, along with listening to the needs of our customers and employees is helping us achieve our operational objectives we established four years ago."
4 SAM SECRETIVP AND CHIEF FINANCIAL OFFICER
"The employees of CE Franklin should be proud of the turnaround of the Company. It is through their hard work, dedication and commitment to continuous improvement that has gotten us to this first milestone. We are proud of what we have accomplished but are not yet satisfied with the result."
| 10 CE FRANKLIN LTD. 2005 ANNUAL REPORT | |

5 MICHAEL S. WESTCHAIRMAN, PRESIDENT AND CHIEF EXECUTIVE OFFICER
"The Company is well positioned for the continuing challenges that lie ahead. Our appetite for continuous improvement remains strong. I am proud of our employees progress to date."
6 BRENT GREENWOODVP, MARKETING AND SUPPLY
"2005 was another year of continued progress. We achieved significant improvement to our bottom line results by continuing to focus on the basics of our business-customer service, operational efficiency and prudent management of our assets."
7 ROD TATHAMDIRECTOR, QUALITY AND CUSTOMER SERVICE
"I have always been amazed at what can be accomplished by a team of focused, motivated people. CE Franklin employees continue to demonstrate their commitment to Shared Success. Congratulations on a good result."
8TIM RITCHIEVP, STRATEGIC INITIATIVES
"The service and value that we deliver to our customers is supported by two pillars: talented people with a passion for continuous improvement and strong vendor partnerships. We will continue to focus on offering the best employment experience for our valued people and on increasing the level of collaboration with our vendors in order to drive ongoing improvement in our results."
| 2005 ANNUAL REPORT CE FRANKLIN LTD. 11 |
Customer Service and Quality
The backbone of any service company is the quality of its customer service. Whether we are serving our external customers, our vendors, employees, or shareholders, CE Franklin seeks to provide all our stakeholders with premier service. We do this by meeting and even exceeding their expectations, while continually improving our value offering.
In 2003, CE Franklin received ISO 9001-2000 quality management accreditation. We demonstrated our commitment to quality service by developing and implementing a quality management system.
This system is designed to measure and continually improve our performance with customers and stakeholders. The system is built on eight quality management principles, which serve as the foundation of the Company's total value offering. These are as follows:
 #1 CUSTOMER FOCUS
Operating in a service industry, the quality of customer service is what distinguishes CE Franklin from the competition. Our commitment to quality is built into the Company's Mission Statement and Operating Values: "We are committed to excellence in everything we do ;we strive for continuous improvement; we are passionate about exceeding expectations." We also recognize the need to know our capabilities and not to promise what we can't deliver.
To fulfill these promises, we developed a performance measurement system. We use this system to document customer
issues and feedback, ensure corrective action is taken, and achieve resolution in a timely manner. The system helps us make continual improvements in key ser vice areas, such as on-time delivery, order accuracy, and responsiveness.
#2 LEADERSHIP
Leadership behaviors are expected of all CE Franklin leaders and are built into their job profiles. As stated in our management system, we expect our leaders to create a clear direction for the Company, to define the role played by all team members in the Company's success, to model attitudes required for success, to fully empower employees by delegating effectively, and to involve others in decision-making processes that affect them.
In addition, the Company has developed a strategic planning process, where functional areas of the organization work together to set clear direction and goals for their operating unit. Our leaders establish working agreements with employees by engaging in structured conversations. This process identifies employee needs and contributions and also helps ensure the Company delivers on its commitments and promises.
#3 INVOLVEMENT OF PEOPLE
We recognize that our employees are our Company's most important asset. As such, we strive to enable employees to fully utilize their abilities for the organization's benefit. We continually seek to identify what our employees need and provide the systems, processes, and training for their success.
As a result, we have built a strong team that is customer-focused, results-driven, and fully accountable. Shared success is a personal value for each of our employees,as they work together to make our customers, the Company, and each other successful.
#4 PROCESS APPROACH
At CE Franklin, employees work together to document processes and procedures that will improve the organization and enhance customer satisfaction. This result is achieved by identifying issues and the actions required to address these issues satisfactorily.
As part of this process, we define key performance indicators to help the Company measure its progress toward organizational goals. Specifically, the progress we have made in streamlining operations
| 12 CE FRANKLIN LTD. 2005 ANNUAL REPORT | |

and ensuring all internal processes are performed consistently throughout the Company has continued to improve both customer service and operating performance.
#5 SYSTEM APPROACH TO MANAGEMENT
In addition to working on individual processes as described above, we also manage inter-related processes. We do this by building a unified system that contributes to the organization's effectiveness. Our Mission Statement and Operating Values underpin everything we do, as we strive to be the market leader in servicing the energy industry through our people, our performance, and our partnerships.
#6 CONTINUAL IMPROVEMENT
CE Franklin is committed to excellence in everything we do and aims to continually improve performance. Strategic planning and goal-setting drive our Company's continual improvement efforts.
The Senior Leadership Team is responsible for the development of a strategic plan as well as internal control and management systems. At regularly scheduled meetings, members of the Team review the Company's progress toward reaching its goals.
Management is responsible for identifying key performance indicators to measure the Company's success in meeting its goals. Management seeks to continually improve the Company's operations by identifying whether an action needs to be corrected or simply prevented. As par t of the process, management analyzes the root cause of specific issues that need to
be addressed.
#7 FACTUAL APPROACH TO DECISION-MAKING
CE Franklin is diligent in managing our business to ensure all our decisions are based on factual information with decisions clearly communicated and implemented. As a result, all the steps the Company has taken, since it transformed itself into a customer-service and team-oriented culture in 2002,have shown positive results.
We listen to our customers and employees, define key improvement measures, redesign processes, refocus resources as needed, and track our improvements. The strategies that we have put in place as a result of our factual approach to decision-making has positioned the Company to be the market leader in its industry.
#8 MUTUALLY BENEFICIAL SUPPLIER RELATIONSHIPS
CE Franklin enjoys a mutually beneficial relationship with its vendors. CE Franklin has developed a close working relationship with Wilson Supply, a division of Smith International, Inc., CE Franklin's major shareholder. We are leveraging the best practices of these two companies to develop a seamless worldwide supply chain for customers. In 2006,we plan to expand our global reach through an international joint venture with Wilson Supply. These and other initiatives are helping CE Franklin grow market share in Canada and internationally.
| 2005 ANNUAL REPORT CE FRANKLIN LTD. 13 |

Serving our Communities
CE Franklin had the honour and privilege of helping sponsor four childrens' wishes in 2005 through the Starlight Starbright Children's Foundation.
The Starlight Starbright Children's Foundation is a non-profit organization dedicated to brightening the lives of seriously ill children and their families by providing a broad array of both in-hospital and out patient programs designed to enhance their ability to cope with the stress of illness.
Please check www.starlightcanada.org for more information about this organization.
SAMANTHA’S WISH
Thirteen year old Samantha has Cerebral Palsy. She was wishing for a shopping spree at the mall where she and her best friend could pick out all kinds of cool clothes, along with the latest in music CD's and movies. Thanks to the generosity of CE Franklin, Samantha, her mom and her best friend went on Samantha's wish in early August. They had the best time, and Samantha was so surprised when the white stretch limousine pulled up in front of her house to drive her to the mall. In addition to her new clothes, she purchased some Hillary Duff and Britney Spears music CD's,and quite an extensive DVD collection to watch on her favourite purchase of the day -a new portable DVD player! Samantha said that "it was the most wonderful day in her life". | JESSE’S WISH
Jesse is a five year old boy diagnosed with Acute Lymphoblastic Leukemia. The frequent hospital stays and numerous rounds of chemotherapy and radiation were particularly hard on Jesse, making him sad. Jesse's parents noticed a remarkable difference once Jesse found out he would be receiving his Starlight Starbright wish to visit Disney World. Despite the pain involved in his treatments, Jesse seemed happier and more determined. During the week-long trip last October Jesse visited the Magic Kingdom, Epcot Center and Sea World. Highlights included a ride on Buzz Lightyear's Space Ranger Spin and a special meal with Disney's most popular characters. Jesse's family is thrilled with the positive impact this trip has had on Jesse's outlook and recovery. Thanks to the dedication and generosity of CE Franklin for helping to show him the power and magic of dreams! |
| 14 CE FRANKLIN LTD. 2005 ANNUAL REPORT | |
Active participation in our communities is a cornerstone of CE Franklin's success.
CE Franklin allocates 3%of employee time to serving our communities, thereby demonstrating our community commitment, enhancing staff morale, encouraging team building, and
strengthening our community relationships.
Each of the Company's local branches actively participate in their communities. The time and energy put forth is inspiring to others and
helps in making their communities a better place to live.
Among the many ways CE Franklin demonstrates its commitment to our communities is by giving to such worthwhile causes as these:
- -Alberta Children's Hospital
- -Alberta Lung Association
- -Alberta Mentor Foundation
- -Canadian Cancer Society
- -Children's Wish Foundation
- -CNIB Visions
- -Cross Cancer Institute
- -Hospice Society
- -Juvenile Diabetes Research
- -Motive Action Training Foundation
- -MS Society of Canada
- -United Way
- -Women in Need Society
KELSEY’S WISH
Kelsey is a wonderful 16 year old girl who faces the daily challenges associated with Sturge Weber Syndrome. When recovering from treat-
ments or dealing with her seizures Kelsey can always count on the Wiggles to help her get through. Thanks to your generous support, Kelsey was treated to a first class Wiggles experience!! After attending a huge Wiggles party at her home Kelsey and her family flew to Ottawa to attend a Wiggles concert in VIP seats. When she got to her hotel she found Wiggles gift packages with more videos, games, and toys than she could ever imagine!! To top off this incredible trip Kelsey attended a personal meet and greet session with the Wiggles guys back stage after the concert. | AMY’S WISH
Amy is a beautiful young girl who is struggling with her relapse from Burkitts Lymphoma. For her wish she decided on a trip to Los Angeles where she would visit the Hollywood Walk of Fame, Disneyland, and dip her foot in the
ocean.Due to the kindness of CE Franklin the Starlight Starbright Children's Foundation was able to make Amy's wish come true. Amy's dream vacation to California consisted of a stay in a luxurious hotel, three days at Disneyland
and day trips to Universal Studios and Knott's Berry Farm. Amy's wish provided a much needed break from the rigors of her treatment and frequent visits from doctors and nurses. Amy and her parents were able to take their wish trip in late August and Amy told us "it was better than I ever dreamed." |
| 2005 ANNUAL REPORT CE FRANKLIN LTD. 15 |
Health, Safety and Environment
CE Franklin Ltd. is committed to a safety and environmental program that protects our people, our partners, and our communities. All levels of the organization participate in and support this commitment, from the Board of Directors to the front-line employees. Health, safety and environment are an integral part of our operations.
At the Board of Directors level, an Environment, Health and Safety Committee meets quarterly. This Committee is responsible to oversee the management of the organization's risks, liabilities, policies, practices and procedures.
CE Franklin also maintains a Corporate Safety Steering Committee, which meets monthly to review the company's performance in the areas of environment and safety. The Committee is a resource to front-line employees to provide guidance, information, and standards as well as ensure the company complies with all regulations. Members of the Senior Leadership Team participate on this Committee, emphasizing the commitment to safety from the top level of the organization.
Our front-line employees participate in bi-monthly safety meetings and are given the training and resources to properly assess, investigate and eliminate potential hazards. Additionally, members of the Senior Leadership Team visit each one of our 41 branch locations to talk about safety on a regular basis.
 To support front-line employees, CE Franklin offers a series of online safety training courses. These courses are available to all employees. Based on job profiles and regulatory standards, various courses are compulsory to ensure safe working conditions and regulatory compliance. Courses offered include: Basic Safety Program IRP-16 on basic safety orientation; lifting; forklift operations; hazard assessment; WHIMIS (Workplace Hazardous Materials Information System), Canada's national standard; TDG (Transportation of Dangerous Goods); NORM (Naturally Occurring Radioactive Materials), as well as accident investigation and hazard reporting.
Training is supplemented and supported by a quarterly Safety Newsletter sent out to all employees. For information that requires a more timely response, Memos and Bulletins are communicated to employees, as required, to alert them to potential hazards or safety issues or to inform them of any changes in regulatory or Company requirements.
CE Franklin adopted the industry-wide, comprehensive safety management system IRP-9 in 2004. The program was developed by representative organizations of the petroleum industry, including PSAC (Petroleum Services Association of Canada); CAPP (Canadian Association of Petroleum Producers); CAODC (Canadian Association of Oilwell Drilling Contractors); and SEPAC (Small Explorers and Producers Association of Canada).
In addition to IRP-9,CE Franklin is an accredited member of the Partners in Injury Reduction (PIR). This program is a collaborative initiative with the Workers' Compensation Board. We have achieved our Certificate of Recognition (COR) in Alberta and are currently working toward achieving certification in British Columbia and Saskatchewan.
CE Franklin participates in Safety Stand Down week, an annual event sponsored by Enform. The event is designed to increase safety awareness and provide an opportunity for Senior Leadership to visit branch locations and talk safety with front-line workers.
CE Franklin holds safety among one of its highest priorities, and our dedication has helped make CE Franklin a recognized leader of service and safety in our industry.
| 16 CE FRANKLIN LTD. 2005 ANNUAL REPORT | |
Our Mission
CE Franklin will be the market leader in the supply of products, services and solutions to the energy industry. We will achieve leadership by delivering superior customer service through our people,our performance and our partnerships.
Our Operating Values
INTEGRITY
We adhere to the highest ethical standards.
CREDIBILITY
We say what we mean and do what we say.
PERFORMANCE
We are committed to excellence in everything we do; we strive for continuous improvement; we are passionate about exceeding expectations.
TEAMWORK
We achieve success by working as a team.
SERVICE ETHIC
We are driven by the needs of our customers, both external and internal; they are met by interested, competent, passionate individuals. Our success depends upon that of our customers.
TRUST
We trust, respect and support each other and we strive to earn the trust of our colleagues and partners.
RESPONSIBILITY
We take responsibility as individuals and as teams for our actions and we hold ourselves accountable.
COMMUNITY
We belong and contribute to the communities that we operate within through our actions and commitment to safety, our environmental responsibility and our personal involvement.
"SHARED SUCCESS"
| 2005 ANNUAL REPORT CE FRANKLIN LTD. 17 |
Management’s Discussion and Analysis
| 18 CE FRANKLIN LTD. 2005 ANNUAL REPORT | |

As at February 2, 2006
The following Management’s Discussion and Analysis of to assist readers in understanding CE Franklin’s financial may impact future performance of CE Franklin. This discussion Franklin and the related notes thereto.
The selected financial data presented below is presented in For a discussion of the principal differences between CE GAAP, see Note 17 to the financial statements of CE Franklin CE Franklin has made in this MD&A forward-looking statements Section 21E of the Securities Exchange Act of 1934. These CE Franklin’s operations, performance and financial results heading “Forward-Looking Statements.” Such statements are rially from those expressed or implied by the forward-looking and elsewhere in this MD&A and in CE Franklin’s other public CE Franklin undertakes no obligation to update or revise
OVERVIEW
CE Franklin distributes pipe, valves, flanges, fittings, oilfield supplies to producers of oil and gas in and cities that serve particular oil and gas fields Company distributes general oilfield supplies to the oilfield related industries such as the forestry and
The Company also distributes tubular products, including tubing that is used to bring the production to the producers of oil and gas in Canada. Tubular product Alberta, where most of the Canadian oil and gas branches in the western Canadian sedimentary basin. tories of the manufacturers or from Company owned will be laid.
| 2005 ANNUAL REPORT CE FRANKLIN LTD. 19 |
The Company operates its business in only one operating segment, which is the distribution of pipe, valves, flanges, fittings, tubular products, production equipment and general oilfield supplies to the producers of oil and gas in Canada. CE Franklin considers all of the products it distributes to have similar economic characteristics, and are sold to the same class of customers being producers of oil and gas. Operating results by product lines, geographic area or other lower level components or units of operations are not regularly reviewed by our chief operating decisions makers to make decisions about the allocation of resources to, or the assessment of performance of, such product lines, geographic areas or components or units of operations.
SALES
The Company’s sales are dependent upon the level of oil and gas exploration and production activity in the western Canadian sedimentary basin, including the oilsands. This activity is cyclical and is primarily influenced by worldwide energy prices, but may also be affected by expectations related to the worldwide supply of and demand for oil and natural gas, finding and development costs, economic and political events and uncertainties and environmental concerns. The Company mitigates the cyclical nature of its business by adjusting its variable and fixed (primarily salaries and benefits) selling, general and administrative costs (SG&A) as activity levels change.
The Company generates sales principally from the distribution of pipe, valves, flanges, fittings, production equipment, general oilfield supplies and tubular products to producers of oil and gas in the western Canadian sedimentary basin. The Company’s sales for the year ended December 31, 2005 were $482.4 million, compared to $338.7 million for the year ended December 31, 2004 and $257.1 million for the year ended December 31, 2003. The sales growth is attributable to an increase in market activity and anincrease in market share.
Commodity prices generally remained high in 2005. The price of oil and the price of gas as at December 31, 2005 were U.S. $61.04 per bbl (West Texas Intermediate) and Cdn. $9.01 per gj (AECO spot) respectively, and the average price of oil and the average price of gas for the year ended December 31, 2005 were U.S. $56.57 per bbl and Cdn $8.31 per gj respectively. This compares to U.S. $43.45 per bbl for oil and Cdn. $5.90 per gj for gas as at December 31, 2004, and to an average of U.S. $41.37 per bbl for oil and an average of Cdn. $6.22 per gj for gas for the year ended December 31, 2004. As at December 31, 2003 the price of oil and the price of gas were U.S. $32.79 per bbl and Cdn $6.88 per gj respectively, and the average price of oil and the average price for gas for the year ended December 31, 2003 were U.S. $31.04 per bbl and Cdn. $6.32 per gj respectively. The strong commodity prices resulted in Canadian oil and gas producers having increased cash flow which enabled them to increase capital spending on exploration and production activities.
The Company uses oil and gas well completions and average rig counts as industry activity measures. Oil and gas well completions require the products sold by the Company and therefore are a good general indicator of market activity. Average rig counts provide a general indication of energy industry activity levels.
For the year ended December 31, 2005 the total number of wells completed (excluding dry and service wells) in western Canada increased 0.6% to 20,238 wells compared to 20,118 wells for the year ended December 31, 2004.
For the year ended December 31, 2004, the total number of wells completed (excluding dry and service wells) in western Canada increased 12.4% to 20,118 wells, compared to 17,905 wells for the year ended December 31, 2003.
The average rig count for the year ended December 31, 2005 increased 26.4% to 469 average rigs as compared to 371 average rigs for the year ended December 31, 2004.
| 20 CE FRANKLIN LTD. 2005 ANNUAL REPORT | |
The average rig count for the year ended December 31, 2004 was 371 average rigs, which is the same as the average rig count for the year ended December 31, 2003.
The Company’s sales are also affected by weather conditions. Many exploration and production areas in the northern portion of the western Canadian sedimentary basin are accessible only in the winter months when the ground is frozen. As warm weather returns in the spring (April/May of each year), the ground thaws, rendering many secondary roads incapable of supporting the weight of the heavy equipment necessary for exploration and production activities in that region until they have dried out. As a result, the first and fourth quarters typically represent the busiest time and highest sales activity for the Company. Sales levels drop dramatically during the second quarter until such time as the roads have dried and road bans have been lifted. This typically results in a significant reduction in earnings during the second quarter as the Company does not reduce its SG&A expenses dur ing the second quarter to offset the reduction in sales.
The Company distributes its products through 41 branches and tubular stocking points, which are situated in the towns and cities that serve particular oil and gas fields of the western Canadian sedimentary basin. The Company will, from time to time, open or close branches to meet customers’ requirements and fluctuating market conditions, which will impact the Company’s sales. The Company also has a 100,000 square-foot centralized distribution centre located in Edmonton, Alberta. The distribution centre is strategically located within reasonable proximity to a majority of vendors and acts as the hub for its operations.
The Company’s sales, which are almost entirely comprised of product sales, are generally subject to arrangements which specify price and general terms and conditions. The Company recognizes product sales when title and the related risk of loss transfers to customers. Several customers have looked to the Company for its expertise in materials management and other service support. Through these alliances, the Company manages approximately 50 warehouses for its customers. CE Franklin consigns inventory to these customer warehouses and recognizes sales when the customer uses the products stored at these warehouses. The sales and profits from customer warehouses are insignificant from a financial perspective as compared to total sales and profitability. The trend is for the Company’s customers tofocus on their core competencies and outsource non-core supply chain areas to the Company.
The Company’s sales depend to a large extent on the Company’s strong relationships with its customers. To ensure coordination and close contact with all of the Company’s major customers, a sales group working out of Calgary, Alberta (where many of the head offices of the Company’s customers are located) act as account managers with specific individual responsibilities for managing the Company’s business and alliance relationships with its customers. In addition, the Company has regional area sales representatives that coordinate sales and activities in the field.
CE Franklin has two vendors with which it does significant business. If either of those relationships were terminated it could have a material effect on the Company’s sales, business and financial condition. The Company believes that it has historically had, and continues to have, a good relationship with these two suppliers, and alternate sources of supply are available for the products purchased from the supplier. Customers reaching a certain tonnage of tubular products, for the most part, could have the volume to bypass distribution companies such as CE Franklin and purchase directly from steel mills. Loss of such tubular product customers could have a material effect on the Company’s sales.
EXPENSES
The Company’s expenses are comprised of cost of sales, selling, general and administrative expenses, amortization expense, interest expense relating to the Company’s demand bank operating loan and obligations under capital leases, and other income and expenses. Each of the items is discussed below in detail.
| 2005 ANNUAL REPORT CE FRANKLIN LTD. 21 |
Cost of Sales
Cost of sales is comprised of the average cost of products purchased from various manufacturers and sold to the Company’s customers, net of vendor rebates from suppliers, freight expense and inventory obsolescence and shrink expenses. The Company’s 41 branches, and distribution centre stock 25,000 regularly-stocked Stock Keeping Units (“SKU’s”) of product/inventory for its customers. In addition, the Company will purchase and resell non-regularly stocked products as required by its customers. These products are purchased from various manufacturers at prices reflecting the volume of product purchased from the manufacturers. Inventories are valued at the lower of average cost or net realizable value.
Selling, General and Administrative Expenses
SG&A is comprised of certain fixed expenses such as employee salaries and benefits, sales and marketing costs, occupancy and warehouse costs, office and vehicle costs, as well as certain variable expenses such as agent’s commissions, which are paid to branch agents based on a percentage of gross profit dollars earned by the branch agent, and performance pay incentives to employees.
For the year-ended December 31, 2005, fixed expenses were approximately 68% of total SG&A (2004 – 75%; 2003 – 86%).
In 2006, SG&A expenses will include costs associated with the Company’s SOX404 certification (outside consulting and audit fees). It is anticipated that the SOX404 certification will cost the Company approximately $1.5 million to $2.0 million or $0.05 to $0.07 per share, diluted, in 2006.
Amortization
Amortization expense relates to the Company’s investment in property and equipment, which is recorded at cost, less related accumulated amortization. The Company’s property and equipment is comprised of investments in its enterprise and electronic commerce systems, building and leasehold improvements, equipment and machinery and furniture and office equipment relating to its 41 branch locations, its centralized distribution facility, and its corporate head office.
Property and equipment decreased 42.0% to $3.5 million as at December 31, 2005. This decrease reflects amortization expense of $4.4 million offset by capital expenditures of $587,000 and $1.2 million in additions to rental equipment assets and capital leases. As at December 31, 2005, approximately $388,000 in property and equipment (original cost of $16 million) relates to the Company’s investment in its enterprise and electronic commerce systems. This accounted for $2.3 million in amortization expensefor the year-ended December 31, 2005. As at December 31, 2005 the majority of these assets have been fully amortized and, as a result, the $2.3 million amortization expense incurred in 2005 will decrease to $388,000 in 2006 resulting in an increase in net income of approximately $0.06 per share diluted. The Company anticipates that its enterprise and electronic commerce systems will operate beyond 2006 without any significant costs for upgrades. However, there can be no assurances in this regard.
Interest
Interest expense is comprised of interest on the Company’s demand bank operating facility, and interest expense related to obligations under capital leases. The Company finances its working capital requirements, accounts receivable, inventory, bank overdraft, accounts payable and accrued liabilities with its bank operating loan. The Company will fund capital expenditures from cash flow from operating activities and capital leases where available.
| 22 CE FRANKLIN LTD. 2005 ANNUAL REPORT | |
Other Expenses (Income)
Other expenses include foreign exchange gains or losses relating to the purchase of inventory from U.S. and international suppliers, and gains or losses on the sale of property and equipment.
CRITICAL ACCOUNTING ESTIMATES
The preparation of the financial statements requires the Company to make estimates and judgments that affect the reported amounts of assets, liabilities, revenues and expenses, and related disclosure of contingent assets and liabilities. The Company evaluates its estimates on an ongoing basis, based on historical experience and other assumptions that are believed to be reasonable under the circumstances. Actual results may differ from these estimates under different assumptions and conditions.
The Company believes the following describes the significant judgments and estimates used in the preparation of its financial statements.
Accounts Receivable and SG&A Expenses
The Company extends credit to customers and other parties in the normal course of business. Management regularly reviews outstanding accounts receivable and provides for estimated losses through an allowance for doubtful accounts. In evaluating the level of the established allowance, management makes judgments regarding the parties’ ability to make required payments, economic events and other factors. As the financial condition of these parties change, circumstances develop or additional information becomes available, adjustments to the allowance for doubtful accounts may be required. These adjustments, if required, would result in a decrease in accounts receivable and an increase in bad debt expense included under SG&A. The effect on the overall performance of the Company would be dependent on the size of the customer in relation to the Company’s sales. For the three years ended December 31, 2005, 2004 and 2003, the Company’s bad debt expense has been $459,000, $244,000 and $266,000, respectively.
Carrying Value of Inventory and Cost of Sales
The Company has made significant investments in inventory to service its customers. On a routine basis, the Company uses judgments in determining the level of write-downs required to record inventory at the lower of average cost or market. Management’s estimates are primarily influenced by technological innovations, market activity levels and the physical condition of products. Changes in these or other factors may result in a write-down in the carrying value of inventory that would result in an increase in cost of sales and a reduction in inventories. For the three years ended December 31, 2005, 2004 and 2003 inventory write-downs included in cost of sales were $280,000, $1.5 million and $1.5 million respectively. Inventory write-downs declined dramatically in 2005 due to the Company focusing on the sale of its core products.
Future Tax Assets and Liabilities
Future tax assets and liabilities are recognized for differences between the book value and tax value of the net assets of the Company. In providing for future taxes, management considers current tax regulations, estimates of future taxable income and available tax planning strategies. If tax regulations, operating results or the ability to implement tax planning strategies vary, adjustments to the carrying valueof future tax assets and liabilities may be required. See note 7 to the financial statements for the significant components of the future income tax assets and liabilities, and a reconciliation of the Company’s income tax provision.
Stock-based Compensation
As of January 1, 2003, the Company adopted prospectively the fair value based method of accounting for stock options, which means that the amount expensed in each period for common share options granted to employees, officers and directors is the fair value of the options, calculated using the Black-Scholes options-pricing model and net of options forfeited in the period, amortized over the vesting period of the options. Compensation expense of $552,000 was recorded in 2005, $256,000 in 2004 and $36,000 was recorded in 2003. See note 8b to the financial statements for a description of the effect on the financial statements if the fair value method had been adopted for options awarded prior to January 1, 2003.
| 2005 ANNUAL REPORT CE FRANKLIN LTD. 23 |
Goodwill
The Company acquired certain operations during the past decade, which has resulted in the recording of a material amount of goodwill on the balance sheet. In accordance with Canadian GAAP, the Company is required to perform an annual goodwill impairment evaluation, which is largely influenced by future cash flow projections, earnings and cash flow multiples. Estimating future cash flows of the Company’s operations, earnings and cash flow multiples requires management to make judgments about future operating results and working capital requirements. The majority of the Company’s goodwill is the result of the combination by reverse takeover of Franklin Supply and Continental Emsco Company Limited on November 3, 1995.
A.
OPERATING RESULTS
The following table summarizes CE Franklin’s results of operations.
| (in thousands of Cdn. dollars except per share data) | | | | |
| For the years ended December 31 | | 2005 | | 2004 | | 2003 |
| Statements of Operations | | | | | | |
| Sales | $ | 482,403 | $ | 338,701 | $ | 257,125 |
| Gross Profit | | 91,314 | | 60,243 | | 43,550 |
| Gross Profit - % | | 18.9% | | 17.8% | | 16.9% |
| Other expenses (income) | | | | | | |
| Selling, general and administrative expenses | | 55,303 | | 44,299 | | 36,416 |
| Amortization | | 4,393 | | 4,328 | | 4,130 |
| Interest | | 1,945 | | 1,455 | | 959 |
| Other | | 8 | | 16 | | (749) |
| | | 61,649 | | 50,098 | | 40,756 |
| Income before income taxes | | 29,665 | | 10,145 | | 2,794 |
| Income tax expense | | 10,801 | | 4,003 | | 1,494 |
| Income from continuing operations | | 18,864 | | 6,142 | | 1,300 |
| Loss from discontinued operations | | - | | (27) | | (879) |
| Net income | $ | 18,864 | $ | 6,115 | $ | 421 |
| EBITDA(1) | | 36,003 | | 15,928 | | 7,883 |
| EBITDA as a % of sales | | 7.5% | | 4.7% | | 3.1% |
| Net income per share | | | | | | |
| Basic | $ | 1.09 | $ | 0.36 | $ | 0.02 |
| Diluted | $ | 1.01 | $ | 0.35 | $ | 0.02 |
(1) EBITDA represents income from continuing operations before interest, taxes, depreciation and amortization. EBITDA is a supplemental non-GAAP financial measure used by management, as well as industry analysts, to evaluate operations. Management believes that EBITDA, as presented, represents a useful means of assessing the performance of the Company’s ongoing operating activities, as it reflects the Company’s earnings trends without showing the impact of certain charges. The Company is also presenting EBITDA, incremental flow through to EBITDA and EBITDA as a percentage of sales because it is used by management as a supplemental measure of profitability. The use of EBITDA by the Company has certain material limitations because it excludes the recurring expenditures of interest, income tax, and amortization expenses. Interest expense is a necessary component of the Company’s expenses because the Company borrows money to finance its working capital and capital expend itures. Income tax expense is a necessary component of the Company’s expenses because the Company is required to pay cash income taxes. Amortization expense is a necessary component of the Company’s expenses because the Company uses property and equipment to generate sales. Management compensates for these limitations to the use of EBITDA by using EBITDA as only a supplementary measure of profitability. EBITDA is not used by management as an alternative to net income as an indicator of the Company’s operating performance, as an alternative to any other measure of performance in conformity with generally accepted accounting principles or as an alternative to cash flow from operating activities as a measure of liquidity. Not all companies calculate EBITDA in the same manner and EBITDA does not have a standardized meaning prescribed by GAAP. Accordingly, EBITDA, as the term is used herein, is unlikely to be comparable to EBITDA as reported by other entities.
| 24 CE FRANKLIN LTD. 2005 ANNUAL REPORT | |
The following is a reconciliation of income from continuing operations to EBITDA:
| (in thousands of Cdn. dollars) | | | | | | |
| For the years ended December 31 | | 2005 | | 2004 | | 2003 |
| Income from continuing operations | $ | 18,864 | $ | 6,142 | $ | 1,300 |
| Interest expense | | 1,945 | | 1,455 | | 959 |
| Income tax expense | | 10,801 | | 4,003 | | 1,494 |
| Amortization | | 4,393 | | 4,328 | | 4,130 |
| EBITDA | $ | 36,003 | $ | 15,928 | $ | 7,883 |
Year Ended December 31, 2005 Compared to Year Ended December 31, 2004
Sales
Sales for the year ended December 31, 2005 increased 42.4% or $143.7 million to $482.4 million from $338.7 million for the year ended December 31, 2004. The sales increase was due to strong commodity prices which resulted in improved industry economics coupled with an increase in market share from sales to new customers and increased sales to existing customers. Sales also increased due to increasing supplier prices reflecting energy, raw materials and operational costs.
Gross Profit
Gross profit increased 51.6% to $91.3 million for the year ended December 31, 2005 from $60.2 million for the year ended December 31, 2004. Gross profit margins increased to 18.9% for the year ended December 31, 2005 from 17.8% for the year ended December 31, 2004.
The overall improvement in gross profit margins for the year ended December 31, 2005 is a result of a reduction in inventory write-downs from $1.5 million in 2004 to $280,000 in 2005, coupled with margin initiatives implemented by the Company in 2003, which include offshore procurement, standardization of certain product lines and a more disciplined procurement practice. The Company did not implement price increases to customers in 2004 and 2005 over and above price increases by the Company’s suppliers as a result of the rise in supplier pricing.
Selling, General and Administrative Costs
SG&A costs increased $11.0 million or 24.8% to $55.3 million for the year ended December 31, 2005 from $44.3 million for the year ended December 31, 2004. The increase in SG&A for the year ended December 31, 2005 related to salaries and benefits for new employees hired to support the increase in sales for the year, employee performance pay incentives and agents’ commissions due to the increase in sales and gross profit. Fixed expenses, which exclude agents’ commissions and employee performance pay incentives, increased 15.8% as compared to 2004.
The total number of employees increased 16.8% to 383 employees as at December 31, 2005 compared to 328 employees as at December 31, 2004. Revenue per employee based on December 31, 2005 and 2004 employee counts increased 22.0% to $1.26 million per employee as compared to $1.03 million per employee the previous year. The improvement reflects standardization of processes and procedures, whereby all internal processes are performed consistently throughout the Company’s operations resulting in process improvement efficiencies.
EBITDA(1)
EBITDA for the year ended December 31, 2005 increased $20.1 million or 126.0% to $36.0 million compared to $15.9 million for the year ended December 31, 2004. The $143.7 million increase in sales resulted in a 14.0% incremental flow through to EBITDA. EBITDA as a percentage of sales was 7.5% for the year ended December 31, 2005 versus 4.7% for the year ended December 31, 2004. EBITDA is a supplemental non-GAAP financial measure used by management, as well as industry analysts, to evaluate operations. For a reconciliation of income from continuing operations to EBITDA, please see page 19.
| 2005 ANNUAL REPORT CE FRANKLIN LTD. 25 |
Income Before Income Taxes
Income before income taxes improved $19.6 million to $29.7 million for the year ended December 31, 2005 compared to $10.1 million for the year ended December 31, 2004. The improvement is a result of the $31.1 million increase in gross profit offset by the $11.0 million increase in SG&A and an increase of $547,000 in other costs. Other costs include amortization, interest expense and foreign exchange. The $143.7 million increase in sales for the year ended December 31, 2005 resulted in a 13.6% incremental flow through to income before income taxes.
Income Taxes
The Company’s effective tax rate for the year ended December 31, 2005 was 36.4%, as compared to an effective tax rate of 39.5% for the year ended December 31, 2004. The Company’s combined federal and provincial statutory tax rate for the period ended December 31, 2005 was 34.4%, compared to 34.6% forthe period ended December 31, 2004. The reduction in the effective tax rate for the year ended December 31, 2005 is due to non-deductible items and capital and other taxes totaling $608,000 (2004 - $493,000) becoming a smaller component of the overall income tax charge in 2005 due to the increase in income before income taxes. See note 7a to the financial statements for a detailed reconciliation of the effective tax rate.
Loss from Discontinued Operations
On March 31, 2004, the Company sold its 50% interest in its small horsepower compression operations for cash proceeds of $961,000. No gain or loss on disposition resulted from this transaction.
Loss from discontinued operations for the year ended December 31, 2004 was $27,000.
Net Income and Earnings Per Share
Net income increased 208% to $18.9 million or $1.01 per share (diluted) for the year ended December 31, 2005 as compared to $6.1 million or $0.35 per share (diluted) for the year ended December 31, 2004.
Year Ended December 31, 2004 Compared to Year Ended December 31, 2003
Sales
Sales for the year ended December 31, 2004 increased 31.7% or $81.6 million to $338.7 million from $257.1 million for the year ended December 31, 2003. The sales increase was due to a 12.4% increase in well completions, as well as an increase in market share from new customers and increased sales to existing customers. Sales revenues also increased due to an increase in prices to customers to reflect the increase in the price of steel, which is used in many of the products the Company distributes.
Gross Profit
Gross profit increased 38.3% to $60.2 million for the year ended December 31, 2004 from $43.6 million for the year ended December 31, 2003. Gross profit margins increased to 17.8% for the year ended December 31, 2004 from 16.9% for the year ended December 31, 2003.
The improvement in gross profit margins is a result of margin initiatives implemented by the Company in 2003, which include offshore procurement, standardization of certain product lines and a more disciplined procurement practice. The Company did not implement price increases to customers in 2004 over and above price increases by the Company’s suppliers as a result of the rise in steel prices described above.
| 26 CE FRANKLIN LTD. 2005 ANNUAL REPORT | |
Selling, General and Administrative Costs
SG&A costs increased $7.9 million or 21.6% to $44.3 million for the year ended December 31, 2004 from $36.4 million for the year ended December 31, 2003. The majority of the increase in SG&A relates to variable expenses such as performance pay incentives to employees and agents commissions that are a result of the 31.7% increase in sales for the year ended December 31, 2004. Excluding these variable expenses, which will fluctuate with sales and gross profit, fixed SG&A increased 6.7% due primarily to an increase in salaries and benefits and occupancy costs.
The total number of employees increased 12.7% as at December 31, 2004 to 328 employees compared to 291 employees at the end of 2003.
Revenue per employee based on the December 31, 2004 and 2003 employee counts increased 16.7% to $1.03 million per employee as compared to $884,000 per employee for 2003. The improvement reflects standardization of processes and procedures, whereby all critical processes are performed consistently throughout the Company’s operations resulting in process improvement efficiencies.
EBITDA(1)
EBITDA for the year ended December 31, 2004 increased $8.0 million or 102.1% to $15.9 million compared to $7.9 million for the year ended December 31, 2003. The $81.6 million increase in sales resulted in a 9.9% incremental flow through to EBITDA. EBITDA is a supplemental non-GAAP financial measure used by management, as well as industry analysts, to evaluate operations. For a reconciliation of net income to EBITDA, please see page 19.
EBITDA as a percentage of sales was 4.7% for the year ended December 31, 2004 versus 3.1% for the year ended 2003.
Income Before Income Taxes
Income before income taxes improved $7.4 million to $10.1 million for the year ended December 31, 2004 compared to $2.8 million for the year ended December 31, 2003. The improvement is a result of the $16.7 million increase in gross profit offset by the $7.9 million increase in SG&A and $1.4 million increase in other costs. Other costs include an increase in amortization of $198,000, an increase in interest expense of $496,000 from investments in accounts receivables and inventories with the increased activity levels resulting in an overall increase in the demand bank operating loan, a decrease in foreign exchange gains of $551,000 and a decrease in other income of $214,000. The decrease in foreign exchange gains is due to a relatively lower level of movement in the Canadian dollar in 2004 as compared to 2003, which saw significant improvement in the Canadian dollar over the same period.
The $81.6 million increase in sales resulted in a 9.0% incremental flow through to income before income taxes.
Income Taxes
The Company’s effective tax rate for the year ended December 31, 2004 was 39.5%, as compared to an effective tax rate of 53.5% for the year ended December 31, 2003. The Company’s combined federal and provincial statutory tax rate for the year ended December 31, 2004 was 34.6%, compared to 37.1% for the year ended December 31, 2003. The reduction in the effective tax rate in 2004 is due to non-deductible items and capital and other taxes totaling $493,000 (2003 - $457,000) that were a smaller component of the overall income tax charge in 2004 due to the increase in income before income taxes.
Income from Continuing Operations
Income from continuing operations increased to $6.1 million or $0.35 per share (diluted) compared to $1.3 million or $0.07 per share (diluted) for the year ended December 31, 2003.
| 2005 ANNUAL REPORT CE FRANKLIN LTD. 27 |
Loss from Discontinued Operations
On March 31, 2004, the Company sold its 50% interest in its small horsepower compression operations for cash proceeds of $961,000. No gain or loss on disposition resulted from this transaction.
Loss from discontinued operations for the year ended December 31, 2004 was $27,000 as compared to a loss of $879,000 for the year ended December 31, 2003.
Net Income and Earnings per Share
Net income for the year ended December 31, 2004 was $6.1 million or $0.35 per share (diluted) as compared to $421,000 or $0.02 per share (diluted) for the year ended December 31, 2003. This represents an income improvement of $5.7 million or $0.33 per share (diluted).
SUMMARY OF QUARTERLY FINANCIAL DATA
The selected quarterly financial data presented below is presented in Canadian dollars and in accordance with Canadian GAAP. There are no Statements of Operations differences between Canadian and U.S. GAAP.
| (in thousands of Cdn. dollars except per share data) | | | | | | |
| Unaudited | Q1 | Q2 | Q3 | Q4 | Q1 | Q2 | Q3 | Q4 |
| | 2004 | 2004 | 2004 | 2004 | 2005 | 2005 | 2005 | 2005 |
| Sales | 89,032 | 67,002 | 78,232 | 104,435 | 128,372 | 91,899 | 121,809 | 140,323 |
| Net income from | | | | | | | | |
| continuing operations | 1,587 | 518 | 1,198 | 2,839 | 5,804 | 2,543 | 4,214 | 6,303 |
| Loss from discontinued | | | | | | | | |
| operations | (27) | - | - | - | - | - | - | - |
| Net income | 1,560 | 518 | 1,198 | 2,839 | 5,804 | 2,543 | 4,214 | 6,303 |
| EBITDA(1) | 4,148 | 2,401 | 3,421 | 5,958 | 10,745 | 5,897 | 8,300 | 11,061 |
| EBITDA(1)as a % of sales | 4.7% | 3.6% | 4.4% | 5.7% | 8.4% | 6.4% | 6.8% | 7.9% |
| Net income as a % of sales | 1.8% | 0.8% | 1.5% | 2.7% | 4.5% | 2.8% | 3.5% | 4.5% |
| Net income per share | | | | | | | | |
| Basic | $ 0.09 | $ 0.03 | $ 0.07 | $ 0.17 | $ 0.34 | $ 0.14 | $ 0.25 | $ 0.36 |
| Diluted | $ 0.09 | $ 0.03 | $ 0.07 | $ 0.16 | $ 0.32 | $ 0.14 | $ 0.22 | $ 0.33 |
The Company’s sales levels are affected by weather conditions. As warm weather returns in the spring each year the winter’s frost comes out of the ground rendering many secondary roads incapable of supporting the weight of heavy equipment until they have dried out. In addition, many exploration and production areas in northern Canada are accessible only in the winter months when the ground is frozen. As a result, the first and fourth quarters typically represent the busiest time and highest sales activity for the Company. Sales levels drop dramatically during the second quarter until such time as the roads have dried and road bans have been lifted.
Sales for the quarter ended December 31, 2005 increased 34.4% to $140.3 million from $104.4 million for the quarter ended December 31, 2004 reflecting a general increase in activity levels coupled with an increase in market share. The $35.9 million increase in sales resulted in an incremental flow through to EBITDA of 14.2% and 9.7% to net income. Net income was $6.3 million or $0.33 per share (diluted) for the quarter ended December 31, 2005 compared to $2.8 million or $0.16 per share (diluted) for the quarter ended December 31, 2004.
As indicated above the first and fourth quarters typically represent the busiest time and highest sales activity for the Company. Sales for the quarter ended December 31, 2005 was $140.3 million as compared to sales for the quarter ended March 31, 2005 of $128.4 million. Net income for the quarter ended December 31, 2005 was $6.3 million or $0.33 per share (diluted) versus $5.8 million or $0.32 per share (diluted) for the quarter ended March 31, 2005. The $12.0 million increase in sales resulted in an incremental flow through of 4.2% to net income. This was due to a 74.5% increase in variable SG&A cost (agents commissions and employee performance pay incentives) and a 10.3% increase in fixed SG&A costs Q4 2005 versus Q1 2005, respectively.
| 28 CE FRANKLIN LTD. 2005 ANNUAL REPORT | |
B.
LIQUIDITY AND CAPITAL RESOURCES
In 2005, the Company generated $21.9 million in cash from cash flow from operating activities, before net change in non-cash working capital balances, and $2.5 million in the issuance of capital stock from the exercise of employee stock options. This was offset by a $26.5 million increase in working capital (including bank overdraft but excluding the bank operating loan), $587,000 in capital and other expenditures and $261,000 in repayments on capital leases. These activities resulted in a $2.9 million increase in the bank operating loan.
In 2004, the Company generated $11.4 million in cash from cash flow from operating activities, before net change in non-cash working capital balances, $50,000 from proceeds on the disposal of property and equipment, and $961,000 from proceeds on the sale of its 50% interest in its small horsepower compression operations. This was offset by a $14.1 million increase in working capital (including bank overdraft and cash but excluding the bank operating loan), $861,000 in capital and other expendituresand $327,000 in repayments on capital leases. These activities resulted in a $2.8 million increase in the bank operating loan.
In 2003, the Company generated $4.7 million in cash flow from operating activities, before net change in non-cash working capital balances, $247,000 from proceeds on disposal of property and equipment and $538,000 from the sale of a 50% interest in its small horsepower compression operations. This was offset by a $6.2 million increase in working capital (including bank overdraft and cash but excluding the bank operating loan), $881,000 in capital and other expenditures and $343,000 in repayments on capital leases. These activities resulted in a $1.9 million increase in the bank operating loan.
The Company’s primary internal source of liquidity is cash flow from operating activities, before net change in non-cash working capital balances, which increased to $21.9 million for the year ended December 31, 2005, an improvement of $10.5 million as compared to 2004. The improvement reflects improvement in profitability of the Company during 2005 due to the increase in the level of exploration and production activity in the western Canadian sedimentary basin, increased market share and gross profit margin improvement.
The $21.9 million in cash flow from operating activities in 2005 was reinvested into accounts receivable, inventories and other current assets, net of accounts payable and accrued liabilities and other current liabilities. The 42.4% increase in sales in 2005 required a reinvestment in accounts receivable and inventories in order to maintain activity levels.
As at December 31, 2005 accounts receivable increased $29.9 million or 45.0% to $96.5 million from $66.6 million as at December 31, 2004. The increase in accounts receivable reflects a 34.4% increase in sales to $140.3 million during the fourth quarter of 2005 as compared to $104.4 million for the fourth quarter of 2004. Average days sales outstanding (DSO) for the quarter ended December 31, 2005 was 56.2 days as compared to 50.9 days for the quarter ended December 31, 2004. The deterioration in DSO for the quarter reflects, in part, slower approval and processing of paper by both the Company and its customers due to the high volume of activity.
DSO was 53.4 days in 2005 as compared to 52.7 days in 2004. Accounts receivable greater than 90 days old was 3.3% of accounts receivable as at December 31, 2005 versus 1.5% as at December 31, 2004. Trade accounts receivables are tightly managed by the Company with daily calls to customers to solve payment issues. In addition, the Company’s accounts receivable team works closely with customers to help simplify payment and approval processes. Bad debt expense in 2005 was $459,000 (0.1% of sales) as compared to $244,000 (0.1% of sales) for the year ended December 31, 2004 and $266,000 (0.1% of sales) for the year ended December 31, 2003. Although accounts greater than 90 days old increased as compared to the previous year, bad debt expense remained within acceptable levels.
| 2005 ANNUAL REPORT CE FRANKLIN LTD. 29 |
Total inventory for the Company increased 25.2% to $80.5 million as at December 31, 2005 as compared to $64.3 million as at December 31, 2004. The increase in inventory levels reflects the 34.4% increase in sales during Q4 2005 as compared to the previous year. Also, the Company has increased its inventory of high turning items in anticipation of higher activity levels in the first quarter of 2006.
The Company measures inventory efficiency by using an inventory turns calculation, because the higher the inventory turns, the better the Company’s inventory is managed. Inventory turns are calculated by taking cost of sales for the year divided by average inventory. Inventory turned 5.3 times in 2005, compared to 4.9 times in 2004 and 5.0 times in 2003. CE Franklin targets inventory turns of 5.0 times. The Company monitors its inventory on a daily basis in order to reduce surplus, improve turns and reduce obsolescence. The Company’s inventory write-down expense declined substantially in 2005 to $280,000 (approximately 0.1% of sales) compared to $1.5 million (0.4% of sales) in 2004 and $1.5 million (0.6% of sales) in 2003.
Accounts payable, accrued liabilities and bank overdraft have increased $18.2 million to $79.0 million as at December 31, 2005 as compared to the previous year. The increase reflects increased inventory purchases due to higher activity levels during Q4 2005, as compared to the previous year, coupled with the increase in inventory levels at year-end in anticipation of high activity levels in the first quarter of 2006.
Property and equipment decreased 42.0% to $3.5 million from $6.1 million. This decrease reflects amortization expense of $4.4 million offset by capital expenditures of $587,000 and $1.2 million in additions to rental equipment assets, through transfers from inventory, and capital leases. As at December 31, 2005, approximately $388,000 in property and equipment (original cost of $16.0 million) relates to the Company’s investment in its enterprise software and electronic commerce systems. For the year-ended December 31, 2005, $2.3 million in amortization expense was incurred relating to these assets. This will decrease to $388,000 in 2006. The Company currently anticipates that its enterprise and electronic commerce systems will operate beyond 2006 without any significant costs for upgrades in the range of its initial investments. However, there can be no assurances in this regard.
As at December 31, 2005 the Company’s total capitalization (financed debt plus equity) was comprised of debt of 28.1% compared to 33.3% as at December 31, 2004 and equity of 71.9% compared to 66.7% as at December 31, 2004.
On July 29, 2005, the Company renewed its 364 day bank operating facility. The facility has been increased to $60.0 million, bears interest at rates between prime plus 0.5% and prime plus 0.875%. The Company’s borrowing capacity under its 364 day bank operating facility is dependent on maintaining compliance with certain financial covenants and a borrowing base formula applied to accounts receivable and inventories. As at December 31, 2005, the Company was well within the covenant compliance thresholds and was able to draw up to $60.0 million against its bank operating line based on the borrowing base formula.
The Company will fund capital expenditures from cash flow from operating activities and capital leases where available. The Company anticipates its capital expenditures in 2006 to be related to standard upgrades to its enterprise systems, purchase of new locations if leasing of these facilities prove to be uneconomical, as well as leasehold improvements to its 41 locations, and potential increases to its rental assets.
| 30 CE FRANKLIN LTD. 2005 ANNUAL REPORT | |
CONTRACTUAL OBLIGATIONS
| | Capital Lease | Operating Lease | |
| Period Due | Obligations | Commitments | Total |
| (thousands of Canadian dollars) | | |
| 2006 | 217 | 3,452 | 3,669 |
| 2007 | 186 | 3,084 | 3,270 |
| 2008 | 179 | 2,361 | 2,540 |
| 2009 | 73 | 2,046 | 2,119 |
| 2010 | – | 1,749 | 1,749 |
| thereafter | – | 5,250 | 5,250 |
| | 655 | 17,942 | 18,597 |
As at December 31, 2005 the Company had issued and outstanding letters of credit totaling $229,000 (2004 - $4.7 million) to secure offshore inventory purchases.
OFF-BALANCE SHEET ARRANGEMENTS
The Company has not engaged in off-balance sheet financing arrangements through special purpose entities.
RELATED PARTY TRANSACTIONS
Messrs. Douglas L. Rock and John L. Kennedy, directors of the Corporation, are directors or officers of, or otherwise interested in, Smith.
The Company is the exclusive distributor of bottom hole pump production equipment manufactured by Wilson, a wholly-owned subsidiary of its principal shareholder, Smith, which owns 53.3% of the Company’s outstanding common shares. The transactions are in the normal course of business and at commercial rates. Included in inventory at December 31, 2005 and December 31, 2004 was $3,166,000 and $3,185,000, respectively, of this bottom hole pump production equipment purchased from Wilson. For the years ended December 31, 2005, 2004 and 2003, cost of sales includes $7,830,000, $6,427,000 and $6,612,000, respectively, relating to the inventory purchased from Wilson. Accounts payable and accrued liabilities, which are non-interest bearing and are payable within commercial supplier payment terms, include $1,083,000 and $930,000 for the years ended December 31, 2005 and 2004, respectively, owing to Wilson. As at December 31, 2004 accounts receivable includes $1,840,000 owing from Smith which relates to acquisition costs incurred by the Company. In 2005 the proposed transaction was discontinued and the amounts owing were reimbursed.
QUANTITATIVE INFORMATION ABOUT MARKET RISK
Quantitative Information about Market Risk
| As at December 31, 2005 | | | | | | | |
| (thousands of Canadian dollars) | 2006 | 2007 | 2008 | 2009 | 2010 | Total | Fair Value |
| Liabilities | | | | | | | |
| Bank operating loan | $ 29,062 | $ - | $ - | $ - | $ - | $ 29,062 | $ 29,062 |
| Average interest rate | Cdn. Prime plus 0.5% to Cdn. prime plus 0.875% up to $60.0 million |
| Obligations under capital lease | $ 217 | $ 186 | $ 179 | $ 73 | - | $ 655 | $ 703 |
| Average fixed interest rate | 7% | 8% | 9% | 8% | - | 8% | 5.5% |
The Company finances its working capital requirements with a 364 day bank operating loan facility in the amount of $60.0 million (2004 – $50.0 million). Amounts drawn against this facility bear interest at rates between prime plus 0.5% and prime plus 0.875% (2004 – prime plus 0.875%). The prime rate as at December 31, 2005 was 5.00% (2004 – 4.25%). The weighted average interest rate as at December 31, 2005 was 5.55% (2004 – 5.15%).
Obligations under capital leases are payable in equal monthly installments of $26,000 including principal and interest at various rates up to 8%.
| 2005 ANNUAL REPORT CE FRANKLIN LTD. 31 |
Qualitative Information about Market Risk
The Company is exposed to market risks from changes in the Canadian prime interest rate and foreign exchange rates with respect to the Canadian dollar and the U.S. dollar. The Company will enter into foreign currency forward exchange contracts with financial institutions to fix the value of liabilities on future commitments. The Company entered into such contracts in 2005, the impact of which were not considered material. No contracts were outstanding as at December 31, 2005.
The Company has exposure to interest rate fluctuations on its demand operating loan. The Company has, in the past, entered into interest rate contracts to hedge its interest rate risk associated with the demand-operating loan. No such contracts were in place for 2005, 2004 or 2003. The Company does not use financial instruments for speculative purposes.
As at December 31, 2005 there were no unrecognized gains or losses associated with the above instruments.
RECENT ACCOUNTING PRONOUNCEMENTS
Canadian Pronouncements
The following changes in accounting policies are new standards by the Canadian Institute of Chartered Accountants (“CICA”), which the Company implemented in accordance with their terms.
Effective January 1, 2004, the Company adopted, prospectively, the new accounting guideline relating to hedging relationships. In the normal course of business, the Company enters into foreign currency forward exchange contracts with financial institutions to fix the value of liabilities or future commitments. These foreign currency exchange contracts are not designated as hedges for accounting purposes. The value of the contract is marked to market and the change in value is recognized in the Statements of Operations.
As of January 1, 2003 the Company adopted prospectively, the fair value method of accounting for common share options granted. Under this method, the Company recognizes a compensation expense based on the fair value of the options on the date of grant that is determined by using the Black-Scholes options pricing model. The fair value of the options is recognized over the vesting period of the options granted as compensation expense and contributed surplus. The contributed surplus balance is reduced as options are exercised and the amount initially recorded for the options in contributed surplus is credited to capital stock. Compensation expense of $552,000 was recorded in 2005, $256,000 was recorded in 2004 and $36,000 was recorded in 2003.
No compensation expense is recorded for stock options awarded prior to January 1, 2003 as the Company applied the intrinsic method of accounting for stock options granted. The consideration paid by option holders on the exercise of these options is and will be credited to capital stock. See Note 8b to the financial statements for the effect on the financial statements if the fair value method was adopted for these options.
From time to time, the CICA issues new accounting pronouncements. These accounting pronouncements are discussed in Note 17 to the financial statements. Management believes that these new pronouncements will not have a material impact on the financial statements.
U.S. Pronouncements
From time to time, the Financial Accounting Standards Board (“FASB”) issues new accounting pronouncements. New FASB accounting pronouncements are discussed Note 17 to the financial statements. As discussed in note 17 to the financial statements, management believes the impact of recently issued standards, which are not yet effective, will not have a material impact on the financial statements upon adoption.
| 32 CE FRANKLIN LTD. 2005 ANNUAL REPORT | |
OTHER ITEMS
The Company’s Form 20-F is available on SEDAR atwww.sedar.com.
CE Franklin has authorized an unlimited number of common shares with no par value. As at December 31, 2005 the Company had 17,804,554 common shares outstanding.
As at December 31, 2005 options to purchase 1,295,036 common shares were outstanding at an average exercise price of $3.65 per common share. Under the Company’s existing stock option plan the Board of Directors may grant an additional 299,419 options to purchase common shares.
FORWARD-LOOKING STATEMENTS
The information in this Form 20-F, including this Item 5, may contain “forward-looking statements” within the meaning of Section 27A of the Securities Act of 1933 and Section 21E of the Securities Exchange Act of 1934. All statements, other than statements of historical facts, that address activities, events, outcomes and other matters that CE Franklin plans, expects, intends, assumes, believes, budgets, predicts, forecasts, projects, estimates or anticipates (and other similar expressions) will, should or may occur in the future are forward-looking statements. These forward-looking statements are based on management’s current belief, based on currently available information, as to the outcome and timing of future events. When considering forward-looking statements, you should keep in mind the risk factors and other cautionary statements in this Form 20-F, including those in Item 3D under the caption “Risk factors”.
Forward-looking statements appear in a number of places and include statements with respect to, among other things:
·
the continued efficacy of the Company’s enterprise and electronic commerce systems;
·
the anticipated increase in drilling activity levels during the first quarter of 2006;
·
the planned decrease in amounts outstanding under the Company’s bank operating loan;
·
planned capital expenditures and working capital and availability of capital resources to fund capital expenditures and working capital;
·
the Company’s future financial condition or results of operations and future revenues and expenses;
·
the Company’s estimate of amortization savings in 2006;
·
the Company’s future gross profit and net profit margins;
·
the Company’s estimate of SOX404 compliance costs in 2006;
·
the Company’s business strategy and other plans and objectives for future operations;
·
fluctuations in worldwide prices and demand for oil and gas;
·
fluctuations in levels of gas and oil exploration and development activities; and
·
fluctuations in the demand for the Company’s products and services.
We caution you that these forward-looking statements are subject to risks and uncertainties, many of which are beyond CE Franklin’s control. These risks include, but are not limited to, economic conditions, seasonality of drilling activity, commodity price volatility for oil and gas, currency fluctuations, inflation, regulatory changes and the other risks described in Item 3D under the caption “Risk factors”.
Should one or more of the risks or uncertainties described above or elsewhere in this Form 20-F occur, or should underlying assumptions prove incorrect, the Company’s actual results and plans could differ materially from those expressed in any forward-looking statements.
| 2005 ANNUAL REPORT CE FRANKLIN LTD. 33 |
All forward-looking statements expressed or implied, included in this Form 20-F and attributable to CE Franklin are qualified in their entirety by this cautionary statement. This cautionary statement should also be considered in connection with any subsequent written or oral forward-looking statements that CE Franklin or persons acting on its behalf might issue. CE Franklin does not undertake any obligation to update any forward-looking statements to reflect events or circumstances after the date of filing this Form 20-F with the Securities and Exchange Commission, except as required by law.
RISK FACTORS
In addition to the information set forth elsewhere in this Form 20-F, the following factors should be carefully considered when evaluating CE Franklin.
Fluctuations in oil and gas prices could affect the demand for CE Franklin’s products and services and, therefore, CE Franklin’s sales, cash flows and profitability. CE Franklin’s operations are materially dependent upon the level of activity in oil and gas exploration, development and production. Both short-term and long-term trends in oil and gas prices affect the level of such activity. Oil and gas prices and, therefore, the level of drilling, exploration and production activity can be volatile. Factors that can cause price fluctuations include:
·
relatively minor changes in, or threats to, the worldwide supply of and demand for oil and natural gas;
·
the ability of the members of the Organization of Petroleum Exporting Countries (“OPEC”) to maintain price stability through voluntary production limits;
·
the level of production by non-OPEC countries;
·
North American demand for gas;
·
the movement of the Canadian dollar relative to its U.S. counterpart (crude oil and natural gas exports are traded in U.S. dollars);
·
general economic and political conditions in North America and worldwide; and
·
the presence or absence of drilling incentives such as Canadian provincial royalty holidays, fluctuation in the value of the Canadian dollar, availability of new leases and concessions and government regulations regarding, among other things, export controls, environmental protection, taxation, price controls and product allocation.
CE Franklin believes that any prolonged reduction in oil and gas prices would depress the level of exploration and production activity. This would likely result in a corresponding decline in the demand for CE Franklin’s products and services and could have a material adverse effect on CE Franklin’s sales, cash flows and profitability. There can be no assurances as to the future level of demand for CE Franklin’s products and services or future conditions in the oil and gas and oilfield supply industries.
Adverse weather conditions could temporarily decrease the demand for CE Franklin’s products and services. CE Franklin’s financial performance is tied closely to the seasonality of drilling activity. Higher drilling activity in Canada is generally experienced in the winter months. In the spring and early summer, drilling activity slows due to the difficulty in moving equipment during the spring thaws. To the extent that unseasonable weather conditions such as excessive rain or unusually warm winters affect the ability of CE Franklin’s customers to access their oil and gas wells, then the demand for CE Franklin’s products and services would temporarily decrease and the Company’s sales, cash flows and profitability would be adversely affected.
| 34 CE FRANKLIN LTD. 2005 ANNUAL REPORT | |
CE Franklin operates in a highly competitive industry, which may adversely affect CE Franklin’s sales, cash flows and profitability. The Canadian oilfield supply industry in which CE Franklin operates is very competitive. The Company believes that its future profitability is partially influenced by competitive factors beyond its control, including:
·
the ability of some customers to purchase pipe, valves, flanges, fittings, production equipment, tubular products and other general oilfield supplies directly from the manufacturer rather than from the Company;
·
the ability of new brokers and distributors to enter the market if the oil and gas industry were to experience significant growth;
·
price competition among major supply companies;
·
cost of goods being subject to rising or declining commodity prices, such as the price of steel, and the inability of CE Franklin to pass these price increases on to customers, or the risk CE Franklin may have higher-cost inventory during declining commodity prices resulting in a deterioration in gross profit margins.
CE Franklin and its largest competitors generally operate at low profit margins due to price competition. Price competition is due in part to customer price pressure, in addition to the major supply companies competing for the same business.
The loss of CE Franklin’s major supplier for tubular products could adversely affect the Company’s sales and gross profit. A portion of CE Franklin’s business is the sale of tubular products that are primarily obtained from one supplier. Although the Company believes that it has historically had and continues to have a good relationship with its supplier, there can be no assurance that such relationship will continue. In the event the Company is unable to source tubular products from its existing supplier, then CE Franklin would need to search for an alternate supplier of these goods. There can be no assurance that a suitable alternate supplier for such goods would be found.
Labour shortages could adversely affect the Company’s ability to service its customers. The Company faces the challenge of attracting and retaining workers to meet any increase in demand for its products and services. In a highly competitive market for employees, the Company may experience periods of high employee turnover that could result in higher training costs or reduced levels of service to customers. This could result in increased costs or the loss of customers and market share.
During periods of high demand for products and services, the Company may experience product shortages. The frequency and duration of the shortages may impact the financial performance of the Company. Product shortages may impact profit margins or could result in the loss of customers.
The Company is exposed to market risks from changes in the Canadian prime interest rate and foreign exchange rates with respect to the Canadian dollar and the U.S. dollar for products it purchases outside Canada. The Company may enter into foreign currency forward exchange contracts and interest rate contracts to hedge the risks associated with foreign currency and interest rate fluctuations. Gain or losses with respect to such hedge contracts may materially affect net income.
The majority of the Company’s sales are generated from customers in the energy sector. This includes major multinational and independent oil companies, pipeline companies and contract drilling companies operating in Canada. In addition, for the year ended December 31, 2005 11% of sales (2004 – 12%; 2003 – 14%) were derived from sales to one customer. No other customer accounted for more than 10% of the Company’s sales.
| 2005 ANNUAL REPORT CE FRANKLIN LTD. 35 |
The Company may experience a financial loss if its significant customers fail to pay CE Franklin for its products or services. The Company’s ability to collect the proceeds from the sale of its products and services from its customers depends on the payment ability of its customer base, which includes a significant customer who constitutes 11% of its annual sales. If this customer fails to pay CE Franklin for any reason, the Company could experience a material loss.
Significant downtime at the Company’s 100,000 square foot centralized distribution centre located in Edmonton, Alberta could materially impact net income and cash flow from operations. The Company operates a hub and spoke distribution model with the distribution centre strategically located within reasonable proximity to a majority of its vendors. In addition, the distribution centre acts as a hub for its 41 branches. Significant downtime at this facility would impact the Company’s gross profit margins net income and cash flow from operations.
A substantial portion of the Company’s sales to customers will depend on written contracts that are cancelable at any time, or will be based on verbal agreements. The key factors which will determine whether a customer will continue to use the Company are pricing, service quality and availability, strategically located service centers and technical knowledge and experience. There can be no assurance that the Company’s relationships with its customers will continue, and a significant reduction or total loss of business from these customers, if not offset by increased sales to new or existing customers, could have a material adverse effect on the Company’s net income or cash flow from operations.
If the Company is unable to successfully address potential material weakness in its internal controls, or any other control deficiencies, its ability to report its financial results on a timely and accurate basis and to comply with disclosure and other requirements may be adversely affected. The Company is not currently required to comply with Section 404 of the Sarbanes-Oxley Act of 2002, and are therefore not required to make an assessment of the effectiveness of its internal controls over financial reporting for that purpose. A material weakness is defined as a significant deficiency, or a combination of significant deficiencies, that results in more than a remote likelihood that a material misstatement of the annual or interim financial statements will not be prevented or detected.
CE Franklin will continue to monitor the effectiveness of these and other processes, procedures and controls and will make any further changes management determines appropriate, including to effect compliance with Section 404 of the Sarbanes-Oxley Act of 2002 when required to make an assessment of internal controls under Section 404 for fiscal 2006. The steps CE Franklin has taken and will take in the future may not remediate the material weakness. In addition, the Company may identify material weaknesses or other deficiencies in our internal controls in the future.
Any material weaknesses or other deficiencies in the Company’s control systems may affect its ability to comply with reporting requirements and listing standards or cause its financial statements to contain material misstatements, which could negatively affect the market price and trading liquidity of its common stock, cause investors to lose confidence in the Company’s reported financial information, as well as subject CE Franklin to civil or criminal investigations and penalties.
There are inherent limitations in all control systems, and misstatements due to error or fraud may occur and not be detected. While CE Franklin has taken actions designed to address compliance with the internal control, disclosure control and other requirements of the Sarbanes-Oxley Act of 2002 and the rules and regulations promulgated by the SEC implementing these requirements, there are inherent limitations in the Company’s ability to control all circumstances. Management, including the Chief Executive Officer and Chief Financial Officer, does not expect that the Company’s internal controls and disclosure controls will prevent all error and all fraud. A control system, no matter how well conceived and operated, can provide only reasonable, not absolute, assurance that the objectives of the control system are met. In addition, the design of a control system must reflect the fact that
| 36 CE FRANKLIN LTD. 2005 ANNUAL REPORT | |
there are resource constraints and the benefit of controls must be relative to their costs. Because of the inherent limitations in all control systems, no evaluation of controls can provide absolute assurance that all control issues and instances of fraud, if any, in the Company have been detected. These inherent limitations include the realities that judgments in decision-making can be faulty and that breakdowns can occur because of simple errors or mistakes. Further, controls can be circumvented by individual acts of some persons, by collusion of two or more persons, or by management override of the controls. The design of any system of controls also is based in part upon certain assumptions about the likelihood of future events, and there can be no assurance that any design will succeed in achieving its stated goals under all potential future conditions. Over time, a control may be inadequate because of changes i n conditions, such as growth of the Company or increased transaction volume, or the degree of compliance with the policies or procedures may deteriorate. Because of inherent limitations in a cost-effective control system, misstatements due to error or fraud may occur and not be detected.
If the Company loses key management and technical personnel, its business may suffer. CE Franklin relies upon a relatively small group of key management and technical personnel. Mr. West, in particular, has extensive experience in oilfield supply and distribution. The Company does not maintain any key man insurance and it cannot assure you that these individuals will remain with us in the future. An unexpected partial or total loss of their services may harm the Company’s business.
The Company’s share ownership is highly concentrated and, as a result, CE Franklin’s principal shareholder effectively controls the Company’s business. As at the date of this Form 20F, CE Franklin’s largest shareholder, Smith International, owned approximately 53.3% of the Company’s common outstanding shares. As a result, Smith International has the voting power to significantly influence the Company’s policies, business and affairs and the outcome of any corporate transaction or other matter, including mergers, consolidations and the sale of all, or substantially all, of the Company’s assets.
In addition, the concentration of the Company’s ownership may have the effect of delaying; deterring or preventing a change in control that otherwise could result in a premium in the price of the Company’s common shares.
The Company is at risk for certain operating hazards. CE Franklin’s operations are subject to hazards present in the oil and natural gas industry which can cause personal injury and damage to property or the environment. Litigation arising from an accident at a location where its products or services are used or provided may cause the Company to be named as a defendant in lawsuits asserting potentially large claims. CE Franklin has insurance coverage against operating hazards, which the Company believes is customary in the industry. This insurance has deductibles and contains certain coverage exclusions and limitations. The Company’s insurance premiums can be increased or decreased based on the claims it makes on its insurance policies. Results of operations could be adversely affected by unexpected claims not covered by insurance.
| 2005 ANNUAL REPORT CE FRANKLIN LTD. 37 |
Management's Report
The preparation and presentation of the accompanying financial statements are the responsibility of the management of the Company. The statements have been prepared in accordance with Canadian generally accepted accounting principles as described in note 1 to the financial statements. The financial information elsewhere in the annual report has been reviewed to ensure consistency with that in the financial statements.
Management acknowledges responsibility for the integrity of its financial information. Where appropriate, management has made informed judgments and estimates in accounting for transactions, which were not complete at the balance sheet date. The Company maintains disclosure controls and procedures and internal controls designed to ensure that information required to be disclosed in the financial statements and annual report is recorded, processed, summarized and reported properly. CE Franklin’s Chief Executive Officer and Chief Financial Officer evaluated the Company’s disclosure controls and procedures as at December 31, 2005 to ensure that such disclosure controls and procedures are effective. There were no significant changes in the Company’s internal controls or in other factors that could significantly affect those controls subsequent to the evaluation date.
The Board of Directors has appointed an Audit Committee that consists of three directors who are not officers or employees of the Company and have no direct or indirect material relationship with the Company. The committee meets with management and the Company’s external auditors to discuss internal control, accounting policies and financial reporting matters. The Audit Committee has reviewed the financial statements. The Board of Directors has approved the financial statements on the recommendation of the Audit Committee.
 |  |
Michael West | Salvatore Secreti |
Chairman, President and CEO | Vice President and Chief Financial Officer |
February 2, 2006 | February 2, 2006 |
| 38 CE FRANKLIN LTD. 2005 ANNUAL REPORT | |
AUDITORS’ REPORT
To the Shareholders of CE Franklin Ltd.
We have audited the balance sheets of CE Franklin Ltd. as at December 31, 2005 and 2004 and the statements of operations, changes in shareholders’ equity and cash flows for each of the years in the three-year period ended December 31, 2005. These financial statements are the responsibility of the Company’s management. Our responsibility is to express an opinion on these financial statements based on our audits.
We conducted our audits in accordance with Canadian generally accepted auditing standards and the standards of the Public Company Accounting Oversight Board (United States). Those standards require that we plan and perform an audit to obtain reasonable assurance whether the financial statements are free of material misstatement. An audit includes examining, on a test basis, evidence supporting the amounts and disclosures in the financial statements. An audit also includes assessing the accounting principles used and significant estimates made by management, as well as evaluating the overall financial statement presentation.
In our opinion, these financial statements present fairly, in all material respects, the financial position of the Company as at December 31, 2005 and 2004 and the results of its operations and its cash flows for each of the years in the three-year period ended December 31, 2005 in accordance with Canadian generally accepted accounting principles.

Calgary, Alberta, Canada
PricewaterhouseCoopers LLP
February 2, 2006
Chartered Accountants
| 2005 ANNUAL REPORT CE FRANKLIN LTD. 39 |
Balance Sheets
As at December 31
(in thousands of Canadian dollars)
| | 2005 | 2004 |
| Assets | | |
| Current assets | | |
| Accounts receivable (note 2 and 12) | 96,508 | 66,573 |
| Inventories (note 12) | 80,482 | 64,282 |
| Other | 2,998 | 552 |
| | 179,988 | 131,407 |
| Property and equipment(note 3) | 3,537 | 6,097 |
| Goodwill | 7,765 | 7,765 |
| Future income taxes(note 7) | 1,038 | - |
| Other | 180 | 240 |
| | 192,508 | 145,509 |
| Liabilities | | |
| Current liabilities | | |
| Bank overdraft | 14,090 | 5,270 |
| Bank operating loan (note 4) | 29,062 | 26,140 |
| Accounts payable (note 12) | 29,575 | 29,381 |
| Accrued liabilities (note 5 and 12) | 35,354 | 26,136 |
| Income taxes payable | 7,840 | 3,074 |
| Current portion of obligations under capital lease (note 6) | 217 | 204 |
| | 116,138 | 90,205 |
| Obligations under capital lease(note 6) | 438 | 626 |
| Future income taxes(note 7) | - | 612 |
| | 116,576 | 91,443 |
| Commitments and contingencies(note 13) | | |
| Shareholders’ equity | | |
| Capital stock (note 8) | 21,914 | 19,335 |
| Contributed surplus | 14,281 | 13,858 |
| Retained earnings | 39,737 | 20,873 |
| | 75,932 | 54,066 |
| | 192,508 | 145,509 |
The accompanying notes are an integral part of these financial statements.
| |
Approved by the Board: | |

Victor J. Stobbe |
Director |

David A. Dyck |
Director |
| 40 CE FRANKLIN LTD. 2005 ANNUAL REPORT | |
Statements of Changes in Shareholders' Equity
(in thousands of Canadian dollars, except number of shares)
| | Capital Stock | | | |
| | Number of | | Contributed | Retained | Shareholders' |
| | Shares | $ | Surplus | Earnings | Equity |
| December 31, 2002 | 17,178,696 | 19,268 | 13,566 | 14,337 | 47,171 |
| Stock options granted(note 8) | - | - | 36 | - | 36 |
| Net income | - | - | - | 421 | 421 |
| December 31, 2003 | 17,178,696 | 19,268 | 13,602 | 14,758 | 47,628 |
| Stock options excercised(note 8) | 16,238 | 67 | - | - | 67 |
| Stock options granted(note 8) | - | - | 256 | - | 256 |
| Net income | - | - | - | 6,115 | 6,115 |
| December 31, 2004 | 17,194,934 | 19,335 | 13,858 | 20,873 | 54,066 |
| Stock options exercised(note 8) | 609,620 | 2,579 | (129) | - | 2,450 |
| Stock options granted(note 8) | - | - | 552 | - | 552 |
| Net income | - | - | - | 18,864 | 18,864 |
| December 31, 2005 | 17,804,554 | 21,914 | 14,281 | 39,737 | 75,932 |
The accompanying notes are an integral part of these financial statements.
| 2005 ANNUAL REPORT CE FRANKLIN LTD. 41 |
Statements of Operations
For the years ended December 31
(in thousands of Canadian dollars, except shares and per share amounts)
| | 2005 | 2004 | 2003 |
| Sales | 482,403 | 338,701 | 257,125 |
| Cost of sales | 391,089 | 278,458 | 213,575 |
| Gross Profit | 91,314 | 60,243 | 43,550 |
| Other expenses (income) | | | |
| Selling, general and administrative expenses (note 9) | 55,303 | 44,299 | 36,416 |
| Amortization | 4,393 | 4,328 | 4,130 |
| Interest expense | 1,945 | 1,455 | 959 |
| Foreign exchange loss (gain) | 18 | 28 | (523) |
| Other income | (10) | (12) | (226) |
| | 61,649 | 50,098 | 40,756 |
| Income before income taxes | 29,665 | 10,145 | 2,794 |
| Income tax expense (recovery)(note 7) | | | |
| Current | 12,451 | 4,804 | 2,462 |
| Future | (1,650) | (801) | (968) |
| | 10,801 | 4,003 | 1,494 |
| Income from continuing operations | 18,864 | 6,142 | 1,300 |
| Loss from discontinued operations(note 10) | - | (27) | (879) |
| Net income for the year | 18,864 | 6,115 | 421 |
| Net income per share | | | |
| Continuing operations | | | |
| Basic | 1.09 | 0.36 | 0.07 |
| Diluted | 1.01 | 0.35 | 0.07 |
| Discontinued operations | | | |
| Basic | - | 0.00 | (0.05) |
| Diluted | - | 0.00 | (0.05) |
| Net income per share | | | |
| Basic | 1.09 | 0.36 | 0.02 |
| Diluted | 1.01 | 0.35 | 0.02 |
| Weighted average number of shares outstanding | | | |
| Basic | 17,326,637 | 17,187,720 | 17,178,696 |
| Diluted | 18,680,002 | 17,605,599 | 17,233,326 |
The accompanying notes are an integral part of these financial statements.
| 42 CE FRANKLIN LTD. 2005 ANNUAL REPORT | |
Statements of Cash Flows
For the years ended December 31
| (in thousands of Canadian dollars) | 2005 | 2004 | 2003 |
| Cash flows from operating activities | | | |
| Income from continuing operations | 18,864 | 6,142 | 1,300 |
| Items not affecting cash | | | |
| Amortization | 4,393 | 4,328 | 4,130 |
| Gain on disposal of property and equipment | (9) | (6) | (223) |
| Future income tax recovery | (1,650) | (801) | (968) |
| Increase (decrease) in inventory write-downs | (207) | 1,528 | 450 |
| Stock options granted (note 8) | 552 | 256 | 36 |
| | 21,943 | 11,447 | 4,725 |
| Net change in non-cash working capital balances related to | | | |
| operations(note 11) | (35,317) | (24,232) | (676) |
| Net cash flow from continuing operations | (13,374) | (12,785) | 4,049 |
| Net cash flow from discontinued operations (note 10) | - | (26) | 560 |
| | (13,374) | (12,811) | 4,609 |
| Cash flows from financing activities | | | |
| Issuance of capital stock | 2,450 | 67 | - |
| Increase in bank operating loan | 2,922 | 2,772 | 1,868 |
| Increase (decrease) in bank overdraft | 8,820 | 5,270 | (1,166) |
| Decrease in obligations under capital lease | (261) | (327) | (343) |
| Net cash flow from continuing operations | 13,931 | 7,782 | 359 |
| Net cash flow from discontinued operations (note 10) | - | - | 18 |
| | 13,931 | 7,782 | 377 |
| Cash flows from investing activities | | | |
| Purchase of property and equipment | (587) | (861) | (581) |
| Proceeds on disposal of property and equipment | 30 | 50 | 247 |
| Proceeds on sale of compression operations (note 10) | - | 961 | 538 |
| Other | - | - | (300) |
| Net cash flow from continuing operations | (557) | 150 | (96) |
| Net cash flow from discontinued operations (note 10) | - | (2) | (9) |
| | (557) | 148 | (105) |
| Change in cash and cash equivalents during the year | - | (4,881) | 4,881 |
| Cash and cash equivalents – beginning of year | - | 4,881 | - |
| Cash and cash equivalents – end of year | - | - | 4,881 |
| Cash paid during the year | | | |
| Interest on bank operating loan | 1,899 | 1,419 | 1,077 |
| Interest on obligations under capital lease | 46 | 50 | 36 |
| Income taxes | 7,685 | 3,249 | 356 |
The accompanying notes are an integral part of these financial statements.
| 2005 ANNUAL REPORT CE FRANKLIN LTD. 43 |
Notes to Financial Statements
December 31, 2005, 2004 and 2003
(tabular amounts in thousands of Canadian dollars except share and per share amounts)
1.
Accounting Policies
Generally accepted accounting principles
The financial statements of the Company have been prepared in accordance with accounting principles generally accepted in Canada. These principles differ in certain respects from accounting principles generally accepted in the United States (“U.S.”). The material differences that affect the Company’s financial statements are described in note 17.
Certain comparative figures have been reclassified to conform with the current year’s presentation.
Use of estimates
The preparation of the financial statements in conformity with generally accepted accounting principles requires management to make estimates and assumptions that affect the reported amounts of assets and liabilities and disclosure of contingent assets and liabilities at the dates of the financial statements and the reported amounts of sales and expenses during the reporting periods.
Management believes the most significant estimates and assumptions are associated with the valuation of accounts receivable, inventories, future tax assets (liability), stock based compensation and goodwill. If the underlying estimates and assumptions, upon which the financial statements are based, change in future periods, actual amounts may differ from those included in the accompanying financial statements.
Basis of presentation
On March 31, 2004, the Company sold its remaining 50% interest in its small horsepower compression operations to its joint venture partner for cash proceeds of $961,000 (see note 10).
On January 31, 2003 the Company transferred the property and equipment and operations of its small horsepower compression operations into a wholly owned subsidiary. Subsequently, a 50% interest in this subsidiary was sold for cash proceeds of $538,000.
Allowance for doubtful accounts
The Company maintains an allowance for doubtful accounts to provide for receivables which may ultimately be uncollectible. Reserves are determined in light of a number of factors including customer specific conditions, economic events and the Company’s historical loss experience.
Inventories
Inventories, consisting primarily of goods purchased and held for resale, are valued at the lower of average cost or net realizable value.
Foreign currency translation
Monetary assets and liabilities are translated into Canadian dollars at year-end exchange rates and gains or losses from translation are recognized in the Statements of Operations. Sales and expenses are translated at the exchange rate prevailing on the date the transaction occurs.
Hedging relationships
Effective January 1, 2004, the Company adopted, prospectively, the new accounting guideline relating to hedging relationships. In the normal course of business, the Company enters into foreign currency forward exchange contracts with financial institutions to fix the value of liabilities or future commitments. These foreign currency exchange contracts are not designated as hedges for accounting purposes. The value of the contract is marked to market and the change in value is recognized in the Statements of Operations.
| 44 CE FRANKLIN LTD. 2005 ANNUAL REPORT | |
Property and equipment
Property and equipment are recorded at cost less related accumulated amortization. The Company provides for amortization of property and equipment using rates as follows:
| | |
Buildings | 5% to 10% | straight line |
Leasehold improvements | over the term of the lease | straight line |
Computer equipment and software | 15% to 33% | straight line |
Equipment and machinery | 10% to 100% | straight line |
Furniture and office equipment | 15% to 20% | straight line |
Automotive equipment | 30% | straight line |
Assets held under capital lease are amortized by the straight-line method over the term of the lease or the estimated useful life of the assets; whichever is shorter.
The Company reviews property and equipment for impairment, whenever events or changes in circumstances indicate that the carrying value may not be recoverable. If an evaluation is required, the estimated undiscounted future cash flows associated with the asset will be compared to the asset’s carrying amount to determine if an impairment exists.
Goodwill and other intangibles
Goodwill represents the excess of the cost over the fair value of net assets acquired related to an acquisition. In accordance with generally accepted accounting principles goodwill is not amortized but instead evaluated annually for a permanent impairment, or when events and circumstances indicate that there might be an impairment. The goodwill valuation is prepared during the second quarter of each calendar year, and is valued using a multiple of cash flow and earnings.
Intangible assets are amortized on a straight line basis over the periods expected to be beneficial from the intangible asset. The intangible asset recorded under other assets in the Balance Sheets is comprised of a five-year exclusive distribution agreement to sell certain products.
Revenue recognition
The Company’s revenue, which is comprised of product sales, is generally subject to contractual arrangements, which specify price and general terms and conditions. The Company recognizes product sales when title and the related risk of loss transfers to the customers.
Vendor rebates
Vendor rebates consist of volume discount incentives earned in the purchase of selected products during the year from specified vendors. These discounts are based on contractual agreements with the vendors which outline price, volume and general terms and conditions. The Company recognizes vendor rebates as a reduction of cost of sales.
Freight
The Company incurs freight expenses related to purchasing its inventory from vendors and shipping its product to its customers. All freight expenses, net of reimbursements from customers, are included as a component of cost of goods sold in the statements of operations.
Earnings per share
Earnings per share is computed based on the weighted average basic number of shares outstanding for the period. Diluted earnings per share have been calculated using the treasury stock method, whereby diluted earnings per share are calculated as if options were exercised at the beginning of the year and funds received were used to purchase the Company’s common shares on the open market.
Income taxes
The Company uses the liability method of accounting for income taxes under which future tax assets and liabilities are recognized when there are differences between the financial statement carrying amounts of existing assets and liabilities and their respective tax basis. Future tax assets and liabilities are measured using substantively enacted tax rates in effect in the period in which those temporary differences are expected to be recovered or settled. The effect on future tax assets and liabilities of a change in tax rates is recognized as part of the provision for income taxes in the period that includes the enactment date.
| 2005 ANNUAL REPORT CE FRANKLIN LTD. 45 |
Cash and cash equivalents
Cash and cash equivalents are defined as cash and short-term, highly liquid investments, which have a maturity of less than 90 days at the time of purchase.
Stock options
The Company operates a stock option plan that is described in note 8b. As of January 1, 2003 the Company adopted prospectively, the fair value method of accounting for common share options granted. Under this method, the Company recognizes a compensation expense based on the fair value of the options on the date of grant which is determined by using the Black-Scholes options pricing model. The fair value of the options is recognized over the vesting period of the options granted as compensation expense and contributed surplus. The contributed surplus balance is reduced as options are exercised and the amount initially recorded for the options in contributed surplus is credited to capital stock.
In accordance with thetransitionary provisions of this new accounting pronouncement, no compensation expense is recorded for stock options awarded prior to January 1, 2003 and the Company has continued to apply the intrinsic method of accounting for stock options granted (see note 8b). The consideration paid by option holders on the exercise of these options is and will be credited to capital stock.
2.
Accounts Receivable
| As at December 31 | 2005 | 2004 |
| Trade | 92,136 | 63,017 |
| Allowance for doubtful accounts | (625) | (544) |
| | 91,511 | 62,473 |
| Due from related party(note 12) | - | 1,840 |
| Other | 4,997 | 2,260 |
| | 96,508 | 66,573 |
Concentration of credit risk
The majority of the Company’s sales are generated from customers in the energy sector, which includes major multi-national and independent oil companies, pipeline companies and contract drilling companies operating in Canada.
The Company’s sales are derived from uncollateralized customer sales. The significant energy industry concentration in Canada has the potential to impact the Company’s exposure to credit risk, either positively or negatively, because customers may be similarly affected by changes in economic or other conditions. The Company has experienced limited credit losses on such accounts receivable.
3.
Property and Equipment
| | | Accumulated | |
| As at December 31, 2005 | Cost | Amortization | Net |
| Land, buildings and leasehold improvements | 4,112 | 2,985 | 1,127 |
| Computer equipment and software | 22,135 | 20,685 | 1,450 |
| Equipment and machinery | 4,207 | 3,526 | 681 |
| Furniture and office equipment | 1,735 | 1,456 | 279 |
| Automotive equipment | 40 | 40 | - |
| | 32,229 | 28,692 | 3,537 |
| 46 CE FRANKLIN LTD. 2005 ANNUAL REPORT | |
| | | Accumulated | |
| As at December 31, 2004 | Cost | Amortization | Net |
| Land, buildings and leasehold improvements | 4,195 | 2,872 | 1,323 |
| Computer equipment and software | 21,779 | 17,890 | 3,889 |
| Equipment and machinery | 3,401 | 2,708 | 693 |
| Furniture and office equipment | 1,575 | 1,383 | 192 |
| Automotive equipment | 40 | 40 | - |
| | 30,990 | 24,893 | 6,097 |
Included in computer equipment and software at December 31, 2005 is leased computer equipment with a cost of $1,048,000 (2004 – $962,000) and related accumulated amortization of $439,000 (2004 – $193,000).
4.
Bank Operating Loan
The Company finances its working capital requirements with a 364 day bank operating loan facility in the amount of $60.0 million (2004 – $50.0 million). Amounts drawn against this facility bear interest at rates between prime plus 0.5% and prime plus 0.875% (2004 – prime plus 0.875%). The prime rate as at December 31, 2005 was 5.00% (2004 – 4.25%). The weighted average interest rate as at December 31, 2005 was 5.55% (2004 – 5.15%). The maximum amount available under this facility is subject to a borrowing base formula applied to accounts receivable and inventories. As at December 31, 2005, the maximum available under this facility, based on the borrowing base formula, was $60.0 million (2004 – $50.0 million).
The facility is collateralized by general security agreement covering all present and after-acquired property of the Company including accounts receivable, inventories and property and equipment.
This facility contains certain restrictive covenants which include, among others, maintenance of certain financial ratios and to obtain approval prior to payment of dividends, repurchase or redemption of shares. As at December 31, 2005 the Company is in compliance with its bank covenants.
5.
Accrued Liabilities
| As at December 31 | 2005 | 2004 |
| Trade payables not yet invoiced | 25,028 | 16,560 |
| Employee performance incentives | 5,738 | 3,343 |
| Other | 4,588 | 6,233 |
| | 35,354 | 26,136 |
6.
Obligations Under Capital Lease
| As at December 31 | 2005 | 2004 |
| Obligations under capital lease | 655 | 830 |
| Less: Current portion | (217) | (204) |
| | 438 | 626 |
The capital leases are payable in equal monthly installments of $26,000 including principal and interest and bear interest at various rates of up to 8% (2004 – 8%). The leases are collateralized by the underlying assets and expire between May 2006 and June 2009.
| 2005 ANNUAL REPORT CE FRANKLIN LTD. 47 |
Principal repayments of obligations under capital lease are as follows:
| Year ending December 31 | |
| 2006 | 217 |
| 2007 | 186 |
| 2008 | 179 |
| 2009 | 73 |
| | 655 |
7.
Income Taxes
a)
Reconciliation of the income tax provision
The difference between the income tax provision recorded and the provision obtained by applying the combined federal and provincial statutory rates is as follows:
| For the Years Ended December 31 | 2005 | % | 2004 | % | 2003 | % |
| Income before income taxes | 29,665 | | 10,145 | | 2,794 | |
| Income taxes calculated at expected | | | | | | |
| rates | 10,193 | 34.4 | 3,510 | 34.6 | 1,037 | 37.1 |
| Non-deductible items | 634 | 2.1 | 290 | 2.9 | 168 | 6.0 |
| Difference in tax rates | - | - | (19) | (0.2) | 22 | 0.8 |
| Capital and large corporations taxes | 66 | 0.2 | 61 | 0.6 | 145 | 5.2 |
| Other | (92) | (0.3) | 161 | 1.6 | 122 | 4.4 |
| | 10,801 | 36.4 | 4,003 | 39.5 | 1,494 | 53.5 |
b)
Significant components of future income tax assets and liabilities are as follows:
| As at December 31 | 2005 | 2004 |
| Assets | | |
| Financing charges | 909 | 109 |
| Property and equipment | 479 | - |
| Other | 199 | 135 |
| | 1,587 | 244 |
| Liabilities | | |
| Property and equipment | - | 303 |
| Goodwill and other | 549 | 553 |
| | 549 | 856 |
| Net future income tax liability (asset) | (1,038) | 612 |
The Company believes it is more likely than not that all future income tax assets will be realized.
8.
Capital Stock
a)
The Company has authorized an unlimited number of common shares with no par value.
b)
The Board of Directors may grant options to purchase common shares to substantially all employees, officers and directors and to persons or corporations who provide management or consulting services to the Company. The exercise period and the vesting schedule after the grant date are not to exceed 10 years and are to be established by the Compensation Committee of the Board of Directors. As at December 31, 2005 the Board of Directors may grant an additional 299,419 options to purchase common shares.
| 48 CE FRANKLIN LTD. 2005 ANNUAL REPORT | |
Option activity for each of the years ended December 31 was as follows:
| | 2005 | 2004 | 2003 |
| | | | | Weighted | | Weighted |
| | | Weighted | | average | | average |
| | | average | | exercise | | exercise |
| | Number of | exercise price | Number of | price per | Number of | price per |
| | Options | per share | Options | share | Options | share |
| Outstanding – beginning of year | 1,626,701 | 3.63 | 1,750,439 | 3.95 | 1,494,917 | 4.83 |
| Granted | 413,745 | 4.61 | - | - | 540,235 | 2.74 |
| Exercised | (609,620) | 4.02 | (16,238) | 4.09 | - | - |
| Cancelled or expired | (135,790) | 7.62 | (107,500) | 4.73 | (284,713) | 6.32 |
| Outstanding – end of year | 1,295,036 | 3.65 | 1,626,701 | 3.88 | 1,750,439 | 3.95 |
| Exercisable – end of year | 729,878 | 3.31 | 1,021,169 | 4.38 | 639,987 | 5.13 |
A summary of stock options outstanding at December 31, 2005 is set out below:
| Outstanding stock options |
| | | Weighted average remaining | Exercisable |
| Exercise price | Number | contractual life | stock options |
| $2.70 | 429,010 | 7.95 years | 286,006 |
| $3.28 | 4,200 | 5.63 years | 4,200 |
| $3.30 | 26,728 | 7.13 years | 17,819 |
| $3.49 | 284,516 | 6.95 years | 284,516 |
| $3.50 | 99,845 | 6.00 years | 99,845 |
| $4.60 | 409,745 | 9.03 years | - |
| $4.90 | 3,000 | 9.07 years | - |
| $6.05 | 37,492 | 0.13 years | 37,492 |
| $7.20 | 500 | 9.09 years | - |
| | 1,295,036 | 7.67 years | 729,878 |
The fair value of common share options granted in 2005 was $898,372. This amount will be amortized over three years which is the current vesting period for these options. The compensation expense recorded in 2005 was $552,000 (2004 – $256,000; 2003 – $36,000). The fair value of common share options granted is estimated as at the grant date using the Black-Scholes option-pricing model, using the following assumptions:
| | | |
| | 2005 | 2004 | 2003 |
Dividend yield | nil | nil | nil |
Risk-free interest rate | 4.08% | 4.50% | 4.50% |
Expected life | 5 years | 5 years | 5 years |
Expected volatility | 56% | 65% | 65% |
| 2005 ANNUAL REPORT CE FRANKLIN LTD. 49 |
For all stock options issued prior to January 1, 2003 the Company applied the intrinsic method of accounting for common share options granted to employees, officers and directors. Accordingly, no compensation expense has been recognized in the Statements of Operations. Had the Company adopted the fair value based method of accounting, the amount expensed in each period would be the fair value of the options, calculated using the Black-Scholes options-pricing model and net of options forfeited in the period, amortized over the expected life of the options. The proforma net income (loss) and proforma net income (loss) per share attributable to common shareholders of the Company would be as follows:
| | 2005 | 2004 | 2003 |
| Net income (loss) | | | |
| As reported | 18,864 | 6,115 | 421 |
| Compensation expense | 551 | 798 | 843 |
| Proforma | 18,313 | 5,317 | (422) |
| Net income (loss) per share | | | |
| Basic | | | |
| As reported | 1.09 | 0.36 | 0.02 |
| Proforma | 1.06 | 0.31 | (0.02) |
| Diluted | | | |
| As reported | 1.01 | 0.35 | 0.02 |
| Proforma | 0.98 | 0.30 | (0.02) |
9.
Selling, General and Administrative Expenses
Selling, general and administrative expenses include the following amounts:
| For the years ended December 31 | 2005 | 2004 | 2003 |
| Bad debt expense | 459 | 244 | 266 |
| Rental expense | 4,050 | 3,746 | 3,646 |
10.
Discontinued Operations
On March 31, 2004, the Company sold its 50% interest in its small horsepower compression operations to its joint venture partner for cash proceeds of $961,000. No gain or loss on disposition resulted from the transaction. The proceeds from this transaction were used to reduce the Company’s bank operating loan. The results of discontinued operations for the years ended December 31 were as follows:
| For the years ended December 31 | 2004 | 2003 |
| Sales | 444 | 2,432 |
| Loss before interest and taxes | (49) | (1,173) |
| Interest expense | (14) | (158) |
| Income tax recovery | 36 | 452 |
| Loss for the year | (27) | (879) |
| Total assets | - | 1,623 |
| Total liabilities | - | 663 |
| 50 CE FRANKLIN LTD. 2005 ANNUAL REPORT | |
11.
Net Change in Non-cash Working Capital Balances Related to Operations
| For the years ended December 31 | 2005 | 2004 | 2003 |
| Accounts receivable | (29,935) | (20,730) | (8,462) |
| Inventories | (17,114) | (18,364) | (10,152) |
| Other current assets | (2,446) | 335 | 449 |
| Accounts payable | 194 | 1,385 | 11,467 |
| Accrued liabilities | 9,218 | 11,623 | 4,467 |
| Income taxes payable | 4,766 | 1,519 | 1,555 |
| | (35,317) | (24,232) | (676) |
12.
Related Parties
During the year, the Company purchased inventory from Wilson, a wholly-owned subsidiary of its principal shareholder, who owns 53.2% of the outstanding common shares as at December 31, 2005. Included in inventory at December 31, 2005 is $3,166,000 (2004 – $3,185,000) of inventory purchased from Wilson. Cost of sales includes $7,830,000 (2004 – $6,427,000; 2003 – $6,612,000) of inventory purchased from its principal shareholder. Accounts payable and accrued liabilities include $1,083,000 (2004 – $930,000) owing to Wilson. Transactions with related parties are in the normal course of business and are recorded at the exchange amount. Accounts payable and accrued liabilities are non-interest bearing and are payable within commercial supplier payment terms. As at December 31, 2004 account receivables include $1,840,000 owing from its principal shareholder, which relates to acquisition costs incurred by the Company. In 2005 the proposed transaction was discontinued and the amounts owing were reimbursed.
13.
Commitments and Contingencies
a)
The Company leases certain office, warehouse and store facilities and automobiles under long-term operating leases. Commitments for such non-cancellable operating leases for the next five years are as follows:
| Year ending December 31, | 2006 | 3,452 |
| | 2007 | 3,084 |
| | 2008 | 2,361 |
| | 2009 | 2,046 |
| | 2010 | 1,749 |
| | Thereafter | 5,250 |
| | | 17,942 |
b)
As at December 31, 2005 the Company had issued letters of credit to procure inventory, in the normal course of business, in the amount of $229,000 (2004 - $4,683,000).
c)
The Company is involved in various lawsuits, the losses from which, if any, are not anticipated to be material to the financial statements.
| 2005 ANNUAL REPORT CE FRANKLIN LTD. 51 |
14.
Financial Instruments
The Company’s financial instruments recognized in the Balance Sheets consist of cash, accounts receivable, bank overdraft, accounts payable, accrued liabilities, bank operating loan and obligations under capital lease. The fair values of these recognized financial instruments, excluding the bank operating loan and obligations under capital lease, approximate their carrying amounts due to the short-term maturity of these instruments. At December 31, 2005 the fair value of the bank operating loan and obligations under capital lease approximated their carrying values since the cost of the Company’s borrowing approximated the current market rate of such borrowings.
The Company is exposed to market risks from changes in the Canadian prime interest rate and foreign exchange rates with respect to the Canadian dollar and the U.S. dollar. From time to time the Company enters into foreign exchange forward contracts to fix the value of its liabilities and future commitments. No contracts were outstanding as of December 31, 2005. The Company has, in the past, entered into interest rate contracts to hedge its interest rate risk associated with the bank operating loan. No contracts were outstanding as of December 31, 2005.
15.
Economic Dependency
In respect of the Company’s sales, 11% (2004 – 12%; 2003 – 14%) is derived from sales to one customer.
In respect of the Company’s suppliers, 20% (2004 – 22%; 2003 – 20%) of the Company’s sales is derived from the sale of oilfield tubular goods, where the majority of these products are purchased from one supplier.
16.
Defined Contribution Pension Plan
The Company has a defined contribution pension plan for eligible employees and contributes amounts based on employee salaries to a maximum of 6% (5% in 2004; 3% in 2003) and the amount deductible under the Income Tax Act, to the individuals’ registered retirement savings plans. Contributions in respect of this plan incurred during the year were $557,000 (2004 – $322,000; 2003 – $216,000).
17.
Reconciliation of Canadian and United States Generally Accepted Accounting Principles (GAAP)
These financial statements have been prepared in accordance with Canadian GAAP. The Company’s accounting policies are consistent with U.S. GAAP with the following exceptions:
a)
Statements of Changes in Shareholders’ Equity
| As at December 31 | 2005 | 2004 | 2003 |
| Shareholders’ equity under Canadian GAAP | 75,932 | 54,066 | 47,628 |
| Restructuring provision adjustment (i) | (324) | (324) | (324) |
| Benefit of deferred tax assets applied to goodwill (ii) | (1,058) | (1,058) | (1,058) |
| Shareholders’ equity under U.S. GAAP | 74,550 | 52,684 | 46,246 |
i)
The restructuring provision adjustment relates to a 1995 transaction where $379,386 in restructuring expenditures were recorded in the purchase equation as goodwill under Canadian GAAP but were recorded in the statement of operations for U.S. GAAP.
ii)
In 1996, the Company realized the benefit of certain deferred tax assets on which a 100% valuation provision had been recorded in 1995. This benefit was recorded as a reduction of goodwill for U.S. GAAP.
b)
Balance Sheets
The following table indicates the restated amounts for the items in the Balance Sheets of the company that would be affected had the financial statements been prepared in accordance with U.S. GAAP.
| As at December 31 | 2005 | 2004 |
| Goodwill (a)(i) and (a)(ii) | 6,383 | 6,383 |
| Retained earnings (a)(i) and (a)(ii) | 38,355 | 19,491 |
| 52 CE FRANKLIN LTD. 2005 ANNUAL REPORT | |
c)
Statements Of Cash Flows
Under U.S. GAAP, the disclosure of total cash flows from operating activities prior to changes in non-cash working capital balances related to operations is not permitted.
d)
Recent Accounting Pronouncements
Under the Securities and Exchange Commission’s (SEC) Staff Accounting Bulletin No. 74 (SAB 74), the Company is required to disclose certain information related to recently issued accounting standards. SAB 74 requires that when a new accounting standard has been issued but has not yet been adopted, the registrant should discuss the effect that the new standard will have on the registrant’s financial statements when adopted. The SAB 74 disclosure requirement applies not only to the U. S. GAAP information presented by foreign registrants, but also to the GAAP used to prepare the primary financial statements included in SEC filings.
US GAAP pronouncements
(i)
FAS 123R – Share-based payment
Under FAS 123R, all forms of share-based payment to employees result in compensation cost recognized in financial statements. FAS 123R is effective for annual reporting periods beginning after June 15, 2005. The Company does not expect that the adoption of this pronouncement will have an impact on its financial statements.
(ii)
FAS 151 – Inventory Costs
This pronouncement clarifies the accounting for abnormal idle facility expense, freight, handling costs and waste material (spoilage) and fixed production overhead. Effective for inventory costs incurred during fiscal years beginning after June 15, 2005. The Company does not expect that the adoption of this pronouncement will have an impact on its financial statements.
(iii)
FAS 153 – Exchanges of non-monetary assets
Requires exchanges of certain non-monetary assets to be measured at fair value unless the exchange lacks commercial substance. Effective for exchanges occurring in fiscal periods beginning after June 15, 2005. The Company does not expect that the adoption of this pronouncement will have an impact on its financial statements.
(iv)
FAS 154 – Accounting changes and error corrections
Establishes, unless impracticable, retrospective application as the required method for reporting a change in accounting principle. Effective for accounting changes and corrections of errors made in fiscal years beginning after December 15, 2005. The Company does not expect that the adoption of this pronouncement will have an impact on its financial statements.
Canadian GAAP pronouncements
(i)
CICA 3831 – Non-monetary transactions
Revises existing CICA 3830 on non-monetary transactions, replacing the current exception from measurement of a non-monetary transaction at fair value with an exception based on whether the transaction has commercial substance. Applies to all non-monetary transactions initiated in periods beginning on or after January 1, 2006. The Company does not expect that the adoption of this pronouncement will have an impact on its financial statements.
(ii)
CICA 3855 – Financial Instruments – recognition and measurement
This new CICA section addresses the recognition and measurement of financial instruments at fair market value whereby financial assets and financial liabilities are accounted for at fair value when an entity becomes a party to the contractual provisions of the financial instrument. This section applies to fiscal years starting on or after October 1, 2006. The Company does not expect that the adoption of this section will have an impact on its financial statements.
(iii)
CICA 3861 – Financial Instruments – disclosure and presentation
This section replaces old CICA Section 3860 and it applies to interim and annual financial statements for fiscal years beginning on or after October 1, 2006. CICA 3861 revises the requirements for accounting policy disclosures, and specifies new requirements for disclosures about fair value. The Company does not expect that the adoption of this pronouncement will have an impact on its financial statements.
| 2005 ANNUAL REPORT CE FRANKLIN LTD. 53 |
Five Year Review
(in thousands of Canadian dollars, except number of shares)
| | 2005 | 2004 | 2003 | 2002 | 2001 |
| Sales | 482.4 | 338.7 | 257.1 | 255.1 | 371.1 |
| Gross Profit | 91.3 | 60.2 | 43.6 | 35.0 | 42.0 |
| % of Sales | 18.9% | 17.8% | 16.9% | 13.7% | 11.3% |
| Other Expenses (Income) | | | | | |
| Selling, General & | 55.3 | 44.3 | 36.4 | 33.5 | 37.5 |
| Amortization | 4.4 | 4.3 | 4.1 | 3.9 | 3.6 |
| Interest expense | 1.9 | 1.5 | 1.0 | 0.9 | 1.8 |
| Other | 0.0 | 0.0 | (0.7) | (0.2) | 0.3 |
| Total Other Expenses | 61.6 | 50.1 | 40.8 | 38.1 | 43.2 |
| Income (loss) before | 29.7 | 10.1 | 2.8 | (3.1) | (1.2) |
| Income tax expense | 10.8 | 4.0 | 1.5 | (1.1) | (0.1) |
| Income (loss) from | 18.9 | 6.1 | 1.3 | (2.0) | (1.1) |
| Income (loss) from | – | (0.0) | (0.9) | (0.5) | 1.7 |
| Net income (loss) | 18.9 | 6.1 | 0.4 | (2.5) | 0.6 |
| % of Sales | 3.9% | 1.8% | 0.2% | (1.0%) | 0.2% |
| Earnings per share | | | | | |
| Basic | 1.09 | 0.36 | 0.02 | (0.15) | 0.04 |
| Diluted | 1.01 | 0.35 | 0.02 | (0.15) | 0.04 |
| EBITDA(1) | 36.0 | 15.9 | 7.9 | 1.7 | 4.2 |
| % of Sales | 7.5% | 4.7% | 3.1% | 0.7% | 1.1% |
Net income (loss), total assets and shareholders'equity as determined in accordance with Canadian GAAP differ from those determined in accordance with U.S. GAAP. For a discussion of the principle differences between the Company's financial results as calculated under U.S. GAAP, see Note 17 to the Company's Financial Statements.
(1) EBITDA represents income from continuing operations before interest, taxes, depreciation and amortization. EBITDA is a supplemental non-GAAP financial measure used by management, as well as industry analysts, to evaluate operations. Management believes that EBITDA, as presented, represents a useful means of assessing the performance of the Company's ongoing operating activities, as it reflects the Company's earnings trends without showing the impact of certain charges. The Company is also presenting EBITDA, incremental f low through to EBITDA and EBITDA as a percentage of sales because it is used by management as a supplemental measure of profitability. EBITDA is not used by management as an alternative to net income as an indicator of the Company's operating performance, as an alternative to any other measure of performance in conformity with generally accepted accounting principles or as an alternative to cash f low from operating activities as a measure of liquidity. Not all companies calculate EBITDA in the same manner and EBITDA does not have a standardized meaning prescribed by GAAP. Accordingly, EBITDA, as the term is used herein, is unlikely to be comparable to EBITDA as reported by other entities. See page 25 for a reconciliation of income from continuing operations to EBITDA.
| 54 CE FRANKLIN LTD. 2005 ANNUAL REPORT | |
Five Year Review
(in thousands of Canadian dollars, except number of shares)
| | 2005 | 2004 | 2003 | 2002 | 2001 |
| Total Assets | 192.5 | 145.5 | 117.6 | 99.5 | 112.9 |
| Total Debt (2) | 29.7 | 27.0 | 23.9 | 22.1 | 17.2 |
| Total Capitalization (Average) | | | |
| Average Financed Debt | 35.0 | 28.1 | 19.7 | 21.9 | 39.0 |
| % to Total | 35.2% | 35.8% | 29.6% | 31.2% | 43.5% |
| Average Equity | 64.5 | 50.5 | 46.9 | 48.4 | 50.6 |
| % to Total | 64.8% | 64.2% | 70.4% | 68.8% | 56.5% |
| Total Capitalization | 99.5 | 78.6 | 66.6 | 70.3 | 89.6 |
| Current Assets % of Total Assets (Average) | | |
| Average Current Assets | 155.9 | 112.6 | 85.0 | 86.0 | 118.4 |
| Average Total Assets | 168.9 | 127.8 | 103.2 | 107.4 | 147.8 |
| % | 92.3% | 88.1% | 82.4% | 80.1% | 80.1% |
| Days Sales Outstanding (DSO) (3) | | | | | |
| Average Accounts | 75.5 | - 52.3 | 39.3 | 38.1 | 49.0 |
| DSO - Days | 53.4 | 52.7 | 51.8 | 49.8 | 46.1 |
| Bad Debt % to Accounts Receivable | | | |
| Bad Debt | 0.4 | 0.2 | 0.3 | 0.7 | 1.0 |
| Average Accounts | 75.5 | - 52.3 | 39.3 | 38.1 | 49.0 |
| % | 0.5% | 0.4% | 0.8% | 1.8% | 2.0% |
| Inventory Turns (4) | | | | | |
| Average Inventory | 73.6 | 56.5 | 42.9 | 45.6 | 62.6 |
| Inventory Turns | 5.3 | 4.9 | 5.0 | 4.9 | 5.4 |
| Inventory Writeoff % (5) | | | | | |
| Inventory Writeoffs | 0.3 | 1.5 | 1.5 | 1.2 | 1.7 |
| Average Inventory | 73.6 | 56.5 | 42.9 | 45.6 | 62.6 |
| % | 0.4% | 2.7% | 3.5% | 2.6% | 2.7% |
| ROI (after tax) = Return on Investment (6) | | |
| Interest after tax | 1.2 | 0.9 | 0.8 | 0.7 | 1.4 |
| ROI (after tax) | 20.2% | 8.9% | 1.8% | (2.6%) | 2.2% |
| ROE (after tax) = Return on Equity (7) | 29.3% | 12.0% | 0.9% | (5.2%) | 1.2% |
(2) Bank operating loan +Long-term debt
(3) (Average A/R/Sales)*365 days
(4) Cost of Sales /Average Inventory
(5) Inventory Writeoffs/Average Inventory
(6) Net Income +Interest Af ter Tax
Average (Equity +Financed Debt)
(7) Net Income/Average Equity
| 2005 ANNUAL REPORT CE FRANKLIN LTD. 55 |
Quarterly Financial Data (unaudited)
(in thousands of Canadian dollars, except number of shares)
| | Q1 | Q2 | Q3 | Q4 | 2005 |
| Sales | 128.4 | 91.9 | 121.8 | 140.3 | 482.4 |
| Gross Profit | 23.7 | 18.1 | 22.0 | 27.5 | 91.3 |
| % of Sales | 18.5% | 19.7% | 18.1% | 19.6% | 18.9% |
| Other Expenses (Income) | | | | | |
| Selling, General & | 12.9 | 12.2 | 13.9 | 16.3 | 55.3 |
| Amortization | 1.2 | 1.2 | 1.2 | 0.8 | 4.4 |
| Interest expense | 0.5 | 0.5 | 0.4 | 0.5 | 1.9 |
| Other | 0.0 | 0.0 | (0.2) | 0.2 | 0.0 |
| Total Other Expenses | 14.6 | 13.9 | 15.3 | 17.8 | 61.6 |
| Income before income | 9.1 | 4.2 | 6.7 | 9.7 | 29.7 |
| Income tax expense | 3.3 | 1.7 | 2.4 | 3.4 | 10.8 |
| Net income | 5.8 | 2.5 | 4.3 | 6.3 | 18.9 |
| % of Sales | 4.5% | 2.8% | 3.5% | 4.5% | 3.9% |
| Earnings per share | | | | | |
| Basic | 0.34 | 0.14 | 0.25 | 0.36 | 1.09 |
| Diluted | 0.32 | 0.14 | 0.22 | 0.33 | 1.01 |
| EBITDA (1) | 10.7 | 5.9 | 8.3 | 11.1 | 36.0 |
| % of Sales | 8.4% | 6.4% | 6.8% | 7.9% | 7.5% |
Net income (loss), total assets and shareholders'equity as determined in accordance with Canadian GAAP differ from those determined in accordance with U.S. GAAP. For a discussion of the principle differences between the Company's financial results as calculated under U.S. GAAP, see Note 17 to the Company's Financial Statements.
(1) EBITDA represents income from continuing operations before interest, taxes, depreciation and amortization. EBITDA is a supplemental non-GAAP financial measure used by management, as well as industry analysts, to evaluate operations. Management believes that EBITDA, as presented, represents a useful means of assessing the performance of the Company's ongoing operating activities, as it reflects the Company's earnings trends without showing the impact of certain charges. The Company is also presenting EBITDA, incremental f low through to EBITDA and EBITDA as a percentage of sales because it is used by management as a supplemental measure of profitability. EBITDA is not used by management as an alternative to net income as an indicator of the Company's operating performance, as an alternative to any other measure of performance in conformity with generally accepted accounting principles or as an alternative to cash f low from operating activities as a measure of liquidity. Not all companies calculate EBITDA in the same manner and EBITDA does not have a standardized meaning prescribed by GAAP. Accordingly, EBITDA, as the term is used herein, is unlikely to be comparable to EBITDA as reported by other entities. See page 25 for a reconciliation of income from continuing operations to EBITDA.
| 56 CE FRANKLIN LTD. 2005 ANNUAL REPORT | |
Quarterly Financial Data (unaudited)
(in thousands of Canadian dollars, except number of shares)
| Q1 | Q2 | Q3 | Q4 | 2005 |
| Total Assets | 170.9 | 152.3 | 175.0 | 192.5 | 192.5 |
| Total | 37.9 | 28.2 | 29.8 | 29.7 | 29.7 |
| Total Capitalization (Average) | | | |
| Average Financed Debt | 38.6 | 32.9 | 31.2 | 37.1 | 35.0 |
| % to Total Capitalization | 40.0% | 34.8% | 32.1% | 33.8% | 35.2% |
| Average Equity | 57.8 | 61.7 | 65.9 | 72.7 | 64.5 |
| % to Total Capitalization | 60.0% | 65.2% | 67.9% | 66.2% | 64.8% |
| Total Capitalization | 96.4 | 94.6 | 97.1 | 109.8 | 99.5 |
| Current Assets % of Total Assets (Average) | | |
| Average Current Assets | 148.8 | 142.4 | 153.8 | 178.7 | 155.9 |
| Average Total Assets | 162.5 | 155.4 | 166.5 | 191.2 | 168.9 |
| % | 91.6% | 91.6% | 92.4% | 93.5% | 92.3% |
| Days Sales Outstanding (DSO) (3) | | | | | |
| Average Accounts | 77.1 | 62.9 | 70.0 | 91.8 | 75.5 |
| DSO - Days | 51.2 | 58.4 | 49.0 | 55.8 | 53.4 |
| Bad Debt % to Accounts Receivable | | | |
| Bad Debt | 0.0 | 0.1 | 0.0 | 0.3 | 0.4 |
| Average Accounts | 77.1 | 62.9 | 70.0 | 91.8 | 75.5 |
| % | 0.0% | 0.2% | 0.0% | 0.3% | 0.5% |
| Inventory Turns (4) | | | | | |
| Average Inventory | 66.5 | 72.9 | 77.7 | 77.5 | 73.6 |
| Inventory Turns | 6.3 | 4.1 | 5.1 | 5.8 | 5.3 |
| Inventory Writeoff % (5) | | | | | |
| Inventory Writeoffs | 0.2 | (0.0) | 0.2 | (0.1) | 0.3 |
| Average Inventory | 66.5 | 72.9 | 77.7 | 77.5 | 73.6 |
| % | 0.3% | (0.0%) | 0.2% | (0.1%) | 0.4% |
| ROI (after tax) = Return on Investment (6) | | |
| Interest after tax | 0.3 | 0.3 | 0.3 | 0.3 | 1.2 |
| ROI (after tax) | 25.4% | 11.7% | 18.8% | 24.3% | 20.2% |
| ROE (after tax) = Return on Equity (7) | 40.1% | 16.1% | 26.0% | 34.9% | 29.3% |
(2) Bank operating loan +Long-term debt
(3) (Average A/R/Sales)*365 days
(4) Cost of Sales /Average Inventory
(5) Inventory Writeoffs/Average Inventory
(6) Net Income +Interest Af ter Tax
Average (Equity +Financed Debt)
(7) Net Income/Average Equity
| 2005 ANNUAL REPORT CE FRANKLIN LTD. 57 |
Leadership Team
Michael S. West
Mr. West is Chairman, President and Chief Executive Officer of CE Franklin Ltd. He was appointed President and Chief Executive Officer and to CE Franklin's Board of Directors in January 2002 and was appointed Chairman in December 2003. Mr. West has held executive positions in the oilfield supply and distribution business for nine (9) years. Prior to joining the oil and gas sector in 1996, he worked for 11 years in various capacities in the automotive aftermarkets industry.
James E. Baumgartner
Mr. Baumgartner is Vice President, Operations and has been with the Company since 2001. Prior to joining CE Franklin Mr. Baumgartner was the General Manager for a competitor in the oilfield and industrial project supply distribution business. He has over 25 years experience in distribution of pipe, valves and fittings to the energy industry in Canada as well as internationally.
Maurice (Ron) Brown
Mr. Brown is Vice President, Sales. He joined the company in 2002 bringing with him over 22 years of experience in the oilfield distribution business. Prior to joining CE Franklin Mr. Brown worked with Nutron/Flow Control as the Vice President and General Manager. Mr. Brown also served with the RCMP in British Columbia for eight years.
Brent W. Greenwood
Mr. Greenwood is Vice President, Marketing and Supply. He started his career with Franklin Supply in 1980 and has held various positions with the Company over the past 25 years. Mr. Greenwood graduated from the University of Saskatchewan with a Masters of Arts in History and from the University of Calgary in 1999 with a Masters of Business Administration (MBA).
Ronald L. Koper
Mr. Koperis Vice President, Business Effectiveness and joined the Company in 2000. He has worked with a variety of large and mid-sized corporations in the human resources and organizational development profession. Mr. Koper graduated from the University of Calgary in 1984 with a Bachelor of Commerce degree.
Timothy M. Ritchie
Mr. Ritchie is Vice President, Strategic Initiatives. He began his career with Franklin Supply in the field over 11 years ago and has progressively taken on roles that are more senior for the Company. Mr. Ritchie graduated from the University of Lethbridge with a Bachelor of Arts in 1993 and in 2000 earned his Masters of Business Administration (MBA) from the University of Calgary.
Salvatore Secreti
Mr. Secreti is Vice President and Chief Financial Officer and joined the Company in January 2001. Since leaving public practice in 1985, he has been the Controller or Chief Financial Officer at various public and private companies in a variety of industries. Mr. Secreti graduated from the University of Calgary with a Bachelor of Commerce degree in 1981 and earned his Chartered Accountant (CA) designation in 1985. On January 16, 2006, Mr. Secreti announced that he would be resigning as Vice President and Chief Financial Officer of the Company effective May 31, 2006.
Roderick H. Tatham
Mr. Tatham is Director of Customer Service and Quality. He is responsible and accountable for the redesign and implementation of all business processes related to customer service and operational performance. Prior to joining CE Franklin in May 2002, he worked in various capacities as Manager of Business Process & Quality, Branch Manager, Quality Assurance Manager and Materials Coordinator.
| 58 CE FRANKLIN LTD. 2005 ANNUAL REPORT | |
Board of Directors
Michael S. West
Mr. West is Chairman, President and Chief Executive Officer of CE Franklin Ltd. He was appointed President and Chief Executive Officer and to CE Franklin's Board of Directors in January 2002 and was appointed Chairman in December 2003. Mr. West has held executive positions in the oilfield supply and distribution business for nine (9) years. Prior to joining the oil and gas sector in 1996, he worked for 11 years in various capacities in the automotive aftermarkets industry.
David A. Dyck
Mr. Dyck was appointed to the Board in May 2004. Mr. Dyck, a resident of Calgary, Alberta, is the Senior Vice President, Finance and Chief Financial Officer of Western Oil Sands. Prior to joining Western Oilsands in April 2000, Mr. Dyck spent 12 years with Summit Resources Limited where he served in successively senior roles, finally as Senior Vice-President Finance & Administration and Chief Financial Officer. He is a member of the Alberta and Canadian Institutes of Chartered Accountants, the Financial Executives Institute, and is a Mentor with The Haskayne School of Business in Calgary.
John J. Kennedy
Mr. Kennedy was appointed to the Board of Directors of CE Franklin in May 1999. He is currently President and Chief Executive Officer of Wilson, the distribution unit of Smith. Previously, Mr. Kennedy was Senior Vice President and Chief Financial Officer of Smith. Mr. Kennedy has worked in the energy industry for over 27 years in various executive and management positions. Mr. Kennedy is a member of several professional bodies in both the United Kingdom and United States, including the Energy Institute and the Association of Corporate Treasurers.
S. Douglas Martin
Mr. Martin became a Director of Franklin Supply in 1993 and a Director of CE Franklin in 1995 and was Chairman of CE Franklin from October 2001 to December 2003. Mr. Martin has over 48 years of experience in the energy industry in both the United States and Canada. His broad range of experience has been with energy supply and distribution companies as well as exploration and production companies. Mr. Martin graduated from the University of Oklahoma with a Bachelor of Business Administration.
Douglas L. Rock
Mr. Rock has been a Director of CE Franklin since 1999. He began his career with Smith in 1974 and since then has held numerous positions. He has been Chairman and Chief Executive Officer of Smith since 1991.
Gordon R. Schnell
Mr. Schnell has been a Director of CE Franklin since 1995. Mr. Schnell is the President of Monashee Spring Water (Calgary). Prior to this, he was the President and Chief Operating Officer of CE Franklin from 1995 to 1998. He started his career with Continental Supply Company in 1956 where he took on increasingly senior roles and eventually became the President and Chief Operating Officer of Continental Emsco Company Limited in 1988.
Victor J. Stobbe
Mr. Stobbe has been a Director of CE Franklin since May 2003. Mr. Stobbe is the Chief Financial Officer of Wave Energy Ltd., a private oil and gas company, and a Director of Trican Well Service Ltd. where he serves as Chairman of the Audit Committee. Formerly he was President of American Leduc Petroleums Ltd. from October 1997 to October 2003. Mr. Stobbe, a chartered accountant, has served as a senior officer and/or a director of a number of public companies.
| 2005 ANNUAL REPORT CE FRANKLIN LTD. 59 |
Corporate Information
DIRECTORS
David A. Dyck (1)(2)(3)
Western Oil Sands Inc.John J. Kennedy (4)
Wilson International, Inc. S. Douglas Martin (4)
Director Douglas L. Rock (1)(2)
Smith International, Inc.
Gordon R. Schnell (1)(3)(4)
Monashee Spring Water
Victor J. Stobbe (2)(3)
Wave Energy Ltd.
Michael S. West
Chairman, President and Chief Executive Officer
(1) Member of the Corporate Governance and Nominating Committee
(2) Member of the Compensation Committee
(3) Member of the Audit Committee
(4) Member of the Environment, Health and Safety Committee
LEADERSHIP TEAM
James E. Baumgartner
Vice President, Operations
Maurice (Ron) Brown
Vice President, Sales
Brent W. Greenwood
Vice President, Marketing and Supply
Ronald L. Koper
Vice President, Business Effectiveness
Timothy M. Ritchie
Vice President, Strategic Initiatives
Salvatore Secreti
Vice President and Chief Financial Officer
Roderick H. Tatham
Director of Customer Service and Quality
Michael S. West
Chairman, President and Chief Executive Officer
| HEAD OFFICE
1900, 300 -5th Avenue S. W.
Calgary, Alberta, Canada T2P 3C4
tel.:(403)531-5600
toll free:(800)345-2858
www.cefranklin.com
AUDITORS
PricewaterhouseCoopers LLP
Calgary, Alberta
LEGAL COUNSEL
Canada -Macleod Dixon LLP
Calgary, Alberta
U.S.-Paul, Weiss, Rifkind,
Wharton &Garrison LLP
New York, New York
BANKERS
RBC Royal Bank
Calgary, Alberta
STOCK EXCHANGE LISTINGS
CE Franklin is listed on the American Stock Exchange,
under the trading symbol CFK and the Toronto Stock
Exchange, under the trading symbol CFT.
TRANSFER AGENT
Computershare Trust Company of Canada
600, 530 -8th Avenue S. W. ,
Calgary, Alberta, T2P 3S8
Computershare Trust Company of New York
New York, New York
SHAREHOLDER INQUIRIES
Computershare Trust Company of Canada
600, 530 -8th Avenue S. W. ,
Calgary, Alberta, T2P 3S8
1-800-332-0095
INVESTOR RELATIONS
Investors seeking information about CE Franklin,
including copies of our annual and interim reports
or recent news releases contact:
INVESTOR RELATIONS
Cheryl Bourget
tel. :(403)531-5604
toll free:(800)345-2858
email: investor@cefranklin.com |
| 60 CE FRANKLIN LTD. 2005 ANNUAL REPORT | |
Our Dedicated Employees Adam Gramlich, Agnes Mi in, Alan Bridal, Alanna Giraudier, Alayne Gibson, Alex Rodriguez, Alex Toth, Alicia McColl, Allan Kuntz, Allan Long, Allan Mohart, Andre Arlain, Andre Schakel, Andrew Harnish, Andrew Kolisnyk, Andrew Logan, Angele Mak, Ariel Chen, Arlen McCutcheon, Barb Croft, Barb Kennedy, Barbara Evetts, Barrie Westerhaug, Barry Glenn, Barry McAnulty, Barry Jr Stymiest, Bernice Bruneski, Beryl Lobdell, Bev Farough, Bill Eccles, Bill Reddick, Billy Lester,Blaine Michalchuk,Blair Bast,Blake Pedersen ,Bob Armstrong, Bob Salmon,Bonnie Forster,Brad Kuicnskas,Braden Beaudry,Brandon Lupaschuk,Breckh Tilden,Brenda Shaw,Brenda Zinger,Brent Desouza,Brent Greenwood,Brent Pacholok,Brett Medway,Brian Isleifson,Brian Pavka, Brian Ressler, Bryan McLeod, Burnis Taylor,Cam Norman,Cameron Ritchie,Candace Dionne,Cara Titford,Carey Herner,Carmen Felzien,Carol Yee,Caroline Conley,Celine Soucy,Chad Kaiser,Chad Nielsen,Charles McLennan,Charley Jacobson,Chelice Fendelet,Chelsi Dzurka,Cheryl Bourget,Chris Blais,Chris Falkenberg, Chris Hemphill,Chris Johanson,Chris Murphy,Chris Weinkauf,Chris Young,Chris Zatelny,Cindy Taylor,Clay McDonald,Clayton Cassidy, Cliff Blais,Clint Gardipy,Coby Salmon,Cody Stewart,Colin Nouta,Condor Torres,Connie Lester,Corey Bachand,Cory Bucknell,Cory Hull,Cory Kallis,Cory Smith,Cory Studer,Crystal Lauzon,Curtis Buchan,Curtis Haubrich,Dale Jenson,Dale Rawson,Dale Slaughter, Dale Stankey, Dalma Czipott, Daniel Solvey, Danielle Hogg,Danny Thomas, Darcy Tunke,D'Arcy Macdonald,Darcy-Lee Spreen,Darren Hall,Darryl Puetz,Darryl Ritchie,Darwin McCord,Daryl Fuller ,Dave Curran,Dave Murphy,Dave Painter,Dave Wallace,David Bentley, David Holt,David Law,David Lucyk,David Sopracolle,Dawna Simon,Dean Bokenfohr,Dean Chambers,Dean Collins,Dean Murney,Dean Parenteau, Debbie Hopkins,Della Tardif,Denise Jones,Derek Hehr,Diane Fischer,Diane Rode,Diane Stack,Dianna Gra ,Don Gonty,Don Inkster,Don McIvor, Don McMaster, Don Widdifield, Donna Green, Donna James,Donna Stubbs,Doug Bukowski,Doug Schaner,Doug Smears,Dustin Goodheart,Dwayne Felzien,Elliott McCargar,Eric Evenson,Eric Shaheen,Ernie Greig,Ervine Rebman,Felix Appiah,Frank Reinhart,Fred Anderson,Garrett Turta,Garry Rosenau,Gary Falardeau,Gary Holtet,Gary Roberts,Gary Van De Spiegle,Gary Warchola, Gerald Harvey,Geraldine Tait,Gerard Burton,Gerry Drebit,Gisele Nisbet,Glen Ludlow,Glenn Mendoza,Glenn Procter,Graeme Monteith, Graham Shone,Grant Lyons,Grant Moyes,Grayson Gould,Greg Farrer,Greg Peterkin,Greg Smith,Greg Wheeler,Gregg Holden,Gregg Wilson,Harry Langford,Herman Vold,Hilary Nordin,Howard Bjelke,Ian Brick,Ian Cameron,Ines Moore,Irvin Szoke,Ivan Kronlund,James Gordon,James Pidscalny,James Procter,James Stade,Jamie MacDougall,Jamie Stone,Janel Matvichuk,Jared Jenner,Jason Appleby, Jason Courtright,Jason Hansen,Jason Lajeunesse,Jason Wooldridge,Jeff Thompson,Jen Hagan,Jennifer Shaw,Jennifer Siebert,Jerri Lenius,Jesse Hutchinson,Jessica Jones,Jessie Walker,Jim Baumgartner,Jim Tetzla, Jim Urness,Joanne Groeneveld,Joe Hemphill, Joe Wallace,John Brownlee,John Kohlman,John Lacey,John Law,John Morrow,John Whelan,Jonathan Chan,Jonathan Tondu,Jordan Den Ouden, Josh Wiebe, Josie Gaudet, Joyce Parsons,Judy Peters,Justin Robertson,Karen Dobruk,Karen Falkenberg,Karen Hagg, Karen Pong, Karl Pinske,Katherine Smith,Katrina Felzien,Keith Bjornstad,Keith Stewart,Kelly Lauritsen,Kelsey Noland,Ken Crawford,Ken Deans, Ken Ross,Kent Dixon,Kerry Curran,Kerry Noel,Kevin Burton,Kevin Himmelspach,Kory Tizzard,Kristen Lewendon,Kristian Lang,Kyle Marchand,Kyle Reinhart,Kyuin Shim,Larry Gould,Larry Wyman,Leanne Hough,Leanne Ika-Heimonen,Lee Bauer,Lee Buchanan,Lee Hartman,Leevi Clamp,Leona Avon,Leona Kehl,Les Vandervlugt,Leslie Fialkowski,Leslie Ganshirt,Linda Cabana,Linda Li,Linda Rudd, Lori Locken,Lori Scantlebury,Lorna Dawson,Lorne Schlemko,Lydon Hurst,Lyndon Hubbard,Marc Bachand,Marcus Friess,Mark Ball, Mark Blessman,Mark Day,Mark Dobson,Mark Johnston,Mark O'Flaherty,Mark Selinger,Mark Sewell, Mark Stoddart, Marvin Brown, Marvin Hodgson, Matt Garagan,Matthew Simmons,Melissa Bast,Michael Black,Michael Diehl,Michael Schmidt,Michael Wilcox,Michael-Jon Hilmoe,Mike Connell,Mike Gunderman,Mike Krawetz, Mike Muhle, Mike Philpott,Mike Ramsey,Mike Spears,Mike West,Morley Collins,Murray Moonie,Nacole Galloway,Nancy Anderson,Neil Russell, Nick Dele ,Nick Ennett,Nicole Doan,Nicole Pacholok,Noelle Hloko, Orval Brown,Pat Greany,Paul Selinger,Peter Dzus,Peter Lebbi,Peter Maros,Raelynn Sinclair,Randy Lui,Randy Tucker,Ray Trudel, Richard Blanes,Richard Dyck,Richard Heil,Richard Welch,Rick Gannon,Rick Sharron,Rob Bell,Rob Forwick, Rob Kaechler,Rob Thompson, Rob Turner,Robert Kent,Robert Wolfe,Rod Aasen,Rod Tatham,Roger Lacoursiere,Ron Baker,Ron Brown,Ron Koper,Ron Lundgard, Rose Roste,Roxann Schaffner,Roy MacDonald,Ruben Katigbak,Rupi Sandhu,Russ Frey,Ryan Eggen,Ryan Grue,Ryan Ormandy,Sabrena Jakubec,Sam Secreti,Samuel McCulloch,Sandra Terryberry,Scott Ritchie,Scott Simms,Scott Wilson,Sean Duthie,Sean Kaminski,Sergio Perla,Shane Pitre,Shane Soum,Shannon Mayer,Sharla Hagan,Sharon Lewis,Sharry Wegenast,Shawn Osborne,Sheldon Dyer,Sheldon Major,Shelly Marshall,Stacy McCarthy,Stacy Peterson,Stephen Olney,Steve Kemp,Steven Rollins,Sukhi Dhaliwal,Susan Kemp,Susan Rutter,Tamaryn Maisey,Tammy Barnes,Tanya Kercher,Tara Brock,Tarra Keller,Ted Jober,Ted Scott,Terry Ferguson,Terry House,Terry Konowalyk,Tim Beatty,Tim Ritchie,Tim Walker,Todd Oxford,Tom Bigney,Tom Duggan,Tom Tullikopf,Tony Logan,Tony Mischanchuk, Tony Parsons,Tracy Fitzgerald,Tracy Lewis,Travis Rasmussen,Trent Herner,Trevor Kary,Trevor Schmiess,Troy Armstrong,Troy Hagan, Tyler Bosch,Tyler Frantz,Tyler Gibbons,Tyler Plamondon,Tyson Loader,Tyson Rowley,Vance Osbak,Vanessa Schmidt,Vern Jenson,Vince Pfannmuller,Vince Trudgeon,Violet Parsons,Wade McCarthy,Wade Smith,Wade Wickham,Wain Rose,Wally Madsen,Wanda Fleury, Wayne Eggen,Wayne Harris,Wayne Nelson,Wayne Wheeler,Wayne Wilson,Wendy Davies,Wendy Wittchen,Will Rowley,William Alde |