Click here for a printer-friendly version of this document


OUR PURSUIT OF EXCELLENCE
For more than half a century, CE Franklin has been a leading supplier of products and services to the energy industry.CE Franklin distributes pipe, valves, flanges, fittings, production equipment, tubular products and other general oilfield supplies and field services to oil and gas producers. In addition, the Company distributes pipe, valves, flanges and fittings to the oil sands, refining and petrochemical industries and non-oilfield related industries such as forestry and mining.
The Company’s distribution network services over 3,000 customers by providing the right materials where and when they are needed, for the best value. Our industry leading Edmonton Distribution Centre stocks over 25,000 products from over 2,000 suppliers and is the hub for the Company’s 44 branches, situated in towns and cities serving oil and gas fields of the Western Canada Sedimentary Basin.
Shares of CE Franklin trade on the TSX (CFT) and AMEX (CFK) stock exchanges. At December 31, 2008, there were 18.1 million common shares outstanding. Smith International, Inc. (“Smith International” or “Smith”), a major oilfield service company based in the United States, owns approximately 54% of the Company’s shares. CE Franklin leverages its relationship with Wilson Supply, a leading oilfield equipment distributor operating in the United States and a wholly owned subsidiary of Smith, to offer North American solutions to its customer base.

SOLID RESULTS IN 2008
CE Franklin achieved solid results in 2008 – the second most profitable year in the Company’s history – despite economic uncertainty in the oil and gas industry and in the broader marketplace. We are entering a challenging business environment in 2009 with a strong balance sheet, a proven track record of profitability, and clear strategies to increase market share in both the conventional oilfield and oil sands markets.
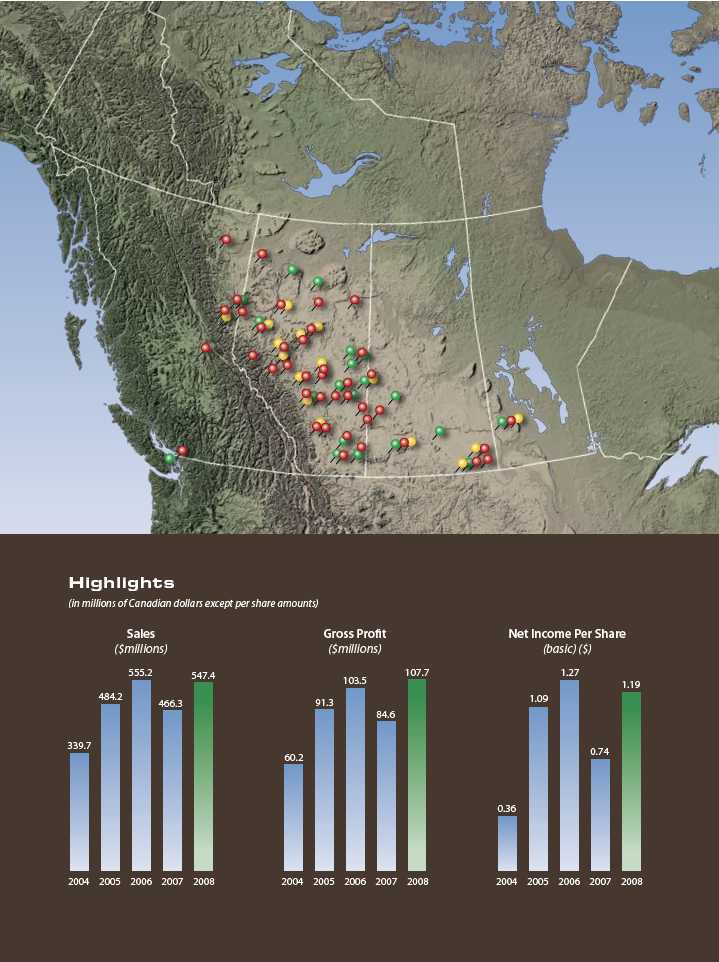
Net income improved 60% to $21.7 million. Sales improved 17% to $547.4 million. Sales growth has come mainly from acquisitions and our oil sands initiatives. Gross profit rose 27% to $107.7 million while the gross profit margin improved to 19.7% from 18.1% in 2007. Importantly, we achieved incremental revenue flow-through to EBITDA of 12%, and EBITDA as a percentage of sales growing year over year from 5.5% to 6.5%. It was also the second best earnings year in CE Franklin’s history. Net income per share (basic) was $1.19 in 2008, up from $0.74 in 2007.
These results reflect significant investments in infrastructure to facilitate growth:
n
Our new Edmonton Distribution Centre is the largest in the Canadian energy industry and gives us 76% more functional capacity than our previous facility. We completed the move in four days without customer or business interruption – and with a perfect safety record, accentuating our planning capability.
n
We expanded the capacity at two branches and opened our 44th branch in Red Earth, Alberta. Over the past five years, we have upgraded or expanded 12 of our branches.
n
Our oil sands strategy, which is a natural expansion of our general supplies business, is becoming a significant contributor to our growth. Our market penetration in the oil sands sector is increasing, with $39 million in sales in 2008 (ahead of plan) and the award of our first MRO (maintenance, repair, and operating) supplies contract. Our major projects team, formed in late 2005 to market our services to engineering and procurement companies and the oil sands producers, is developing a strong competitive position. We have expanded our customer base, brought on new product lines to support our oil sands initiative, and established relationships with mills to support our product requirements.
n
The successful integration of JEN Supply, acquired in December 2007, has strengthened our presence in southeastern Alberta and benefited our customer base in the area. With this acquisition, we gained valuable experience in effectively integrating a tuck-in acquisition, expertise that we can apply in future transactions.
n
The acquisition of Full Tilt Field Services in July 2007 has enhanced our visibility in the Lloydminster marketplace by differentiating our service offering. Adding service capability, to participate in the full life cycle of the products we sell, is key to our growth strategy. The services business is a natural fit and extension to our current logistics and distribution expertise and sets us up to continue our plan of expansion. We have now expanded this service capability to the Grande Prairie marketplace, and we will continue to expand to other markets where we have strong oilfield production equipment sales.
n
The international component of our strategy continues to evolve, with sales increasing modestly in 2008. We remain focused on leveraging our domestic supply chain logistics capability to service international customers from our Edmonton Distribution Centre.
n
Revenue per employee, a key productivity benchmark, was up 11% year over year, to $1.2 million. In 2008, we focused our employees on process and operational improvements, using this opportunity to work through some capacity constraints incurred during our rapid growth over the last few years.
Our results demonstrate that we have built a solid business that is profitable in all cycles of the industry. CE Franklin is able to weather economic downturns and is well positioned to take advantage of growth opportunities.
IMPROVING OUR ASSET VELOCITY
At CE Franklin, we continuously work on streamlining processes and creating operational efficiencies to improve our asset velocity. As a distribution company, our business is not capital-intensive. Our primary balance sheet assets are inventory and accounts receivable and our profitability hinges on our margins. Our margin improvement over the last five years has been achieved by gaining operational efficiencies and leveraging the supply chain – it has not been at the expense of our customers.
Improving asset velocity is an internal focus to efficiently turn inventory and collect receivables freeing up cash for other strategic investments.
We measure our inventory performance in terms of customer fill rates and inventory turns, targeting five or more inventory turns annually. While we improved our inventory turns by 20% in 2008 over the prior year, declining market activity at year-end, combined with long-lead time products arriving into stock, resulted in a year over year increase in inventory of $33 million. Over the next five years, our goal is to see our inventory turns improve as we continue to work on standardizing primary and secondary vendors to improve our process efficiencies, enhance margins, and mitigate our inventory management costs.
We measure our collections performance in terms of days sales outstanding, or DSO. To gain improvements, we look at the entire billing process as a service. We work with our customers to meet their paperwork requirements while minimizing the administrative impact on our supply chain costs. In February 2008, we introduced new document management software to support our invoicing and improve efficiency. The software is now doing what it was designed to do, but issues with the initial installation caused our DSO to bulge to 74 days at its peak in mid-year. Despite the temporary disruption, our average fourth quarter DSO improved 18% in 2008 to 51 days , from 62 days in 2007.
With our new Distribution Centre, we have increased our efficiency in the hub – critical in a hub and spoke model. We plan to shift more of our business direct from the Distribution Centre to our customers and avoid double handling in our branches. This will help make the supply chain more efficient, increasing our revenue per employee and alleviating the difficulty of recruiting employees in remote locations.
COPING WITH AN UNCERTAIN BUSINESS ENVIRONMENT
The Canadian oil and gas sector competes in a global market, where capital allocation decisions are made based on relative economics and investment returns. In 2008, oil and gas activity indictors were up slightly from 2007 despite the economic environment.
As the global economy contracted and the price of oil and natural gas collapsed in the fourth quarter, activity levels in western Canada remained relatively strong. The average rig count in 2008 rose 8% while well completions were up 2%, indicating a lag time between drilling and well tie-ins. In part, this was due to shortages of crews and materials, especially tubular steel and other steel-based products.
With extremely tight global supply conditions during 2008, steel mills operated at capacity and were unable to keep pace with demand. This supply-demand imbalance caused steel prices to rise dramatically. With prices in some cases more than doubling, steel became a driver of industry activity, affecting customers’ buying patterns and decision-making. Steel prices have now started to decline, although specialty products, such as large diameter pipe and specialized alloys, continue to command premium prices.
Despite the weakening economy, the oil and gas sector in western Canada continued to be challenged by labour shortages and ongoing cost pressures for wages, materials, and real estate in 2008. Operating and capital costs have started to improve, but that is now being offset by declining industry cash flows, due to lower commodity prices, and capital constraints.
The recent upheaval in global credit markets has resulted in deleveraging, repricing of risk and, ultimately, retrenchment of consumption. Energy markets have experienced similar upheaval, and the impact of lower cash flows on industry activity levels will be clearly visible in 2009.
Our customers continue to assess the impact of these changes on their businesses and capital expenditure plans in 2009. We expect oil and gas well completions will decline sharply in 2009 to levels not seen since 2002. These conditions will likely result in deflation of product costs and improved labour availability, along with increased mergers and acquisitions of oil and gas customers.
DRIVING OUR STRATEGIES FORWARD
Disciplined execution of strategies, operational efficiency and prudent management will be critical to withstand the downturn. CE Franklin has shown the ability to perform well in all cycles of the industry.
We enter 2009 with a strong balance sheet and are positioned to pursue our strategies to increase market share in both the conventional oilfield and oil sands markets. Over the medium to longer term, we are confident in our ability to improve the profitability of our distribution network by expanding product lines, strengthening supplier relationships and enhancing our capability to service additional oil and gas and industrial end use markets.
Our strategy of expanding our capabilities to leverage our existing infrastructure and scope is more relevant today than ever. From a competitive standpoint, we are well positioned – no matter which direction the economy goes.
We view the current business environment as an opportunity to increase the value of CE Franklin by driving our strategies forward to achieve greater profitability. We will focus on growth and that potential will be realized by diversifying our products and services. For example, in the first quarter of 2009, we will open our valve actuation centre, a new source of revenue that complements our existing valve sales. Executing diversification initiatives will improve our long term results and help us weather the storm in the short term.
One of the advantages of weaker economic times is that it creates the potential for partnerships and consolidation. We see this as a time of opportunity. With a ratio of debt to total capitalization of 20% and unused borrowing capacity of $25 million, we are in a strong position to enhance or accelerate our strategies through opportunistic acquisitions, without being reliant on them to achieve our growth and diversification objectives. We will look at acquisitions that will extend our capabilities and products, adding new revenue streams. We will also look at selected tuck-in acquisitions to strengthen our existing capabilities.
OUR SOLID TRACK RECORD FORMS THE BASIS FOR OUR NEW FIVE-YEAR PLAN
In 2002, CE Franklin’s executive team made a commitment to build a long-term, sustainable company. We committed to continually gain market share, outperform market activity in revenue, and manage our margins and expenses prudently. We have established a solid track record of creating a plan and then delivering the results. Our vision is to become the best run distribution business. Period.
We continue to evolve our strategies, looking for ways to continue to improve, diversify and leverage the capabilities we have built.
We will pursue this goal by:
n
leveraging our existing supply chain infrastructure to expand the scope of products we sell;
n
adding products that have more engineering and skill based applications supported by our current logistics capabilities;
n
growing our customer base within the mining, power generation, forestry and infrastructure industries;
n
expanding our distribution capability to eastern Canada;
n
pursuing market share gains through industry consolidation;
n
improving our asset velocity by maximizing our investment in working capital and continually improving inventory turns and DSO performance; and
n
continuing to encourage employee input and influence into our strategy.
We are strongly positioned for growth with a solid balance sheet, a proven track record of profitability, and a clear strategy.
LEADERSHIP CHANGES
In 2008, we enhanced the governance of our Board by separating the roles of Chair and CEO. Robert McClinton, an independent director, was unanimously elected as Chairman.
Doug Rock stepped down from our Board of Directors in 2008, due to time constraints associated with his responsibilities at Smith International. Doug had significant input into CE Franklin’s strategies and was a role model for me, personally. On behalf of the Board, I would like to thank Doug for his commitment and contribution to CE Franklin over the last nine years.
We were pleased to welcome Don McKenzie, an advisor to the CEO of Smith International, as the new Smith representative on our Board. Don recently retired as President and CEO of M-I SWACO, a Houston-based energy services company jointly owned by Smith and Schlumberger Limited. CE Franklin is fortunate to have the benefit of Don’s many years of service industry experience.
In September, Merv Day joined CE Franklin in the newly created position of Senior Vice President, Business Development. Merv will help us leverage and expand our product and service capability as we embark on our new five year plan.
CONTRIBUTING TO OUR SUCCESS
In closing, I would like to thank all of our stakeholders for supporting us and contributing to our success.
To our customers, thank you for your business. More importantly, thank you for your ongoing feedback: this is essential to our continuous improvement efforts. Because of your feedback, we have made investments to support your needs. We have helped you through product and supply shortages so you have not had to slow down work or production and we have worked deliberately on operational improvements to help offset cost inflation. We look forward to continuing to add value to your business.
To our suppliers, we view you as our partners and we will continue to rely on you to work with us to improve supply chain efficiencies.
To our employees, you are CE Franklin. This is your company and it is exciting that you treat it like your own. I am proud that you are passionate and loyal, vocal with your input and influence and continually helping to improve our performance.
To our communities, we are serious about our commitment to you. Financially healthy companies make better corporate citizens and as our success has grown, so has our investment in the 44 communities where our branches are located.
And to our shareholders, I am grateful for your ongoing support. In particular, I would like to acknowledge the support of our major shareholder, Smith International, who understands that operating in a cyclical business environment requires balancing the desire for short-term results with expanding and diversifying our business to ensure long-term sustainable growth.
Michael S. West
President and Chief Executive Officer
January 29, 2009

2008 was a year of change, growth, innovation and opportunity at CE Franklin. We continue to pursue growth by expanding our core business, increasing our major projects capability and presence, and diversifying our service capabilities.
CHANGE & GROWTH
On April 22, 2008, we moved into our new Distribution Centre in Edmonton, Alberta. The move, requiring over 230 semi trailer loads, was completed in 96 hours with no interruption to customer service and no injuries.
Located on 20 acres, our new location is the largest distribution centre in the Canadian energy industry. It acts as a supply hub for our 44 branches, providing overnight access to products our customers require, and allows us to focus on industry-leading purchasing and logistics practices.
The 76% increase in capacity of our new Distribution Centre will afford future growth opportunities.
Full Tilt, Powered by CE Franklin
The acquisition of Full Tilt Field Services on July 1, 2007, gave us the capability to support the production equipment we sell while strengthening our presence in the Lloydminster marketplace. In early 2009, we will complete construction of a new 53,000 square foot facility in Lloydminster, bringing the CE Franklin and Full Tilt operations together under one roof to create additional operational synergies, alleviate capacity constraints and facilitate growth. We have expanded our Full Tilt services into the Grande Prairie marketplace and plan to expand this service into other markets.
Strengthening our Market Presence and Reach
Changes to Alberta’s royalty framework have resulted in a shift in activity into neighbouring British Columbia and Saskatchewan, provinces with more favourable royalty regimes. Conventional oil exploration has shifted to southeastern Saskatchewan, where horizontal drilling and multi-stage fracturing techniques are being used to develop the Bakken light oil play. In northeastern British Columbia, drilling activity is centered on deeper gas targets in the Montney formation, where similar drilling and completion techniques are proving successful. We have a well-established presence in Saskatchewan and British Columbia and our branches are benefitting from increased activity in these areas.
Our hub and spoke distribution model allows us to be flexible and fluid in serving our existing customers while gaining new customers, improving operational efficiency, and shifting resources to active markets. We continue to increase the amount of goods supplied direct from our Distribution Centre to our customers’ sites.
n
The December 2007 acquisition of JEN Supply strengthened our presence in east-central Alberta, enhancing existing field locations in Stettler and Consort and creating a new presence for CE Franklin in Drumheller and Vermilion.
n
In 2008, we opened a new branch in Red Earth, Alberta, and expanded our locations in Prince George, British Columbia and Drumheller, Alberta.
n
In 2009, we will complete the expansion of our branches in Fort St John, British Columbia; Redcliff, Alberta; Estevan, Saskatchewan; and Virden, Manitoba.
Advancing our Oil Sands Strategy
With our strong logistics expertise, we are gaining a reputation as a solid partner to supply products to large energy projects, including oil sands, refineries, and pipelines.
Our major projects team, formed in late 2005 to pursue oil sands and major projects business, continued to gain momentum in 2008. Along with other project work, CE Franklin was awarded a major MRO contract in Fort McMurray.
Since moving into our new facility in Edmonton, we have been able to offer a superior project management solution, including marshalling services for large diameter product from our two pipe yards. We have also brought on new product lines to support our oil sands strategy, and vendors are partnering with us to deliver their products.
INNOVATION
To be a market leader, we must constantly challenge existing systems and processes, looking to increase the knowledge and productivity of our people. Our new five-year plan is aggressive and will require our people to commit to learning and continuous improvement – delivering the best performance possible through teamwork and collaboration.
As part of our corporate culture, our employees are expected to influence and effect change. We conduct regular employee surveys and involve employees in communication workshops designed to help identify goals, purpose and opportunities to achieve results. We have adapted key human resources systems and processes to give line managers better information and support to focus on career development. We have invested in dedicated training resources to provide a focus on design, development and delivery of training.
We have developed a road map for learning, designed by our employees. In 2008, we launched an online Learning Management System that will extend our training capabilities to all locations and improve delivery and retention of material. We implemented product training and introduced new field sales training and safety representative training courses. We invested more money on training in 2008 than we had in any other year.
We will continue to give our people tools to help them become superb communicators, technical experts, and respected business people. Our people turn possibilities into performance.
Helping our Customers Succeed
Over several decades, CE Franklin has built long-term relationships with its customers. We add value by aligning our goals with those of our customers and effectively managing the cost drivers of the supply chain. Our sales team has undergone a realignment that allows them to coordinate better with our customers to eliminate obstacles. Effective internal coordination has helped to standardize service delivery while fostering stronger feedback links with our customers. In turn, customer feedback has led to ongoing process alignment initiatives that have enabled our customers to realize process cost savings and efficient quality control in the supply chain.
Working with customers to better understand their needs and requirements produced some key system changes in 2008. We introduced a new document management system and developed substantial billing interface improvements to serve the needs of our customers. We also invested in a significant upgrade of our computing infrastructure to increase system speed at all locations and facilitate future growth.
Our goal is to continue to drive value into the supply chain and reduce waste. Greater integration within the Edmonton Distribution Centre to coordinate purchases will help us leverage our relationships efficiently and ensure the ongoing success of our long-term customer partnerships.
OPPORTUNITIES
Changes, growth and innovation in 2008 have led to increased capabilities and new opportunities.
The new Distribution Centre significantly increases our capacity to execute projects. The staging area and inventory capacity will support our unique service offerings such as the direct to customer program, in which we work with customers to better plan and execute projects. This service eliminates redundancies and streamlines process, helps standardize products and services at a cost benefit to both the customer and CE Franklin.
The Distribution Centre has also paved the way for CE Franklin to develop new sources of revenue. For example, we are developing a new valve actuation centre. By assembling valves and actuators as a complete package, we can enhance the value of our product offering to our customers while incrementally growing our top line revenue. The new business will take advantage of our existing valve inventory and shorten the supply chain.
SAFETY AND ENVIRONMENTAL MANAGEMENT
CE Franklin is committed to a safety and environmental management program that protects our people, our partners, our communities, and the environment while meeting government regulations.
Safety is a part of our culture and we are focused on continuously improving our performance. To promote this culture, we ensure that all employees receive the necessary training and information to make the right choices. We raised awareness and strengthened our safety program with a number of training initiatives in 2008.
We also integrated the Full Tilt operations into our Certificate of Recognition (COR). Participation in this program is the fundamental building block to create employee interest and involvement. The COR is a formal acknowledgement by Alberta Human Resources and Employment that a company has a health and safety program that meets approved standards.
We continued to focus on environmental management by improving our operating efficiency, purchasing fuel-efficient vehicles and energy efficient electronics, recycling paper and plastics, and helping our customers reduce waste through surplus utilization programs.
SUPPORTING OUR COMMUNITIES
CE Franklin and its employees are proud of their involvement in all 44 communities where we operate.
Our commitment to our communities is two-fold:
n
First, we strive to ensure that we have healthy employees who have the time and energy to contribute to local organizations. CE Franklin allocates 3% of employees’ time to volunteer activities. In 2008, our employees donated hundreds of hours to various causes in the 44 communities where our branches are located.
n
Second, we lend financial support to community projects – from helping to raise the roof on the local arena to ensuring children have lunch at school. CE Franklin also donated over $170,000 to more than 100 charities, including United Way, Canadian Diabetes Association, Alberta Lung Association, Canadian Cancer Society, MS Society of Canada, and Alberta Children’s Hospital Foundation. Proudly, we are a platinum sponsor of the Starlight Starbright Children’s Foundation and every year we sponsor the wishes of several critically ill children.
SUPPORTING HOME-TOWN HEROES
In 2008, CE Franklin helped these home-town heroes reach their goals.
Denny Morrison
Speedskater
n 2008 World Champion
n 2008 Canadian Speedskater of the Year
n 2006 Olympic Silver Medalist
n 1500 metres World Record Holder
n World Cup Gold Medalist
n Hometown: Fort St. John, BC
Codey McCurrach
Professional Chuckwagon Driver
n 2007 WPCA Rookie of the Year, placing 19th in the World
n 3rd Generation Wagon Driver with 17 years wagon driving experience
n CE Franklin Tarp at the Drumheller Wagon Races
n Hometown: Eckville, AB
Christine Nesbitt
Speedskater
n 2008 World Champion Silver Medalist
n 2006 Olympic Silver Medalist
n Member of Canada’s National Team since 2005
n World Cup Gold Medalist
n Hometown: London, ON
Jessica Zelinka
Heptathlon(100-m Hurdles, Shot Put, High Jump, Long Jump, Javelin Throw and 200m and 800m runs.)
n Fifth at 2008 Olympic Games in Beijing
n Pan American Games Gold Medalist
n Canadian University Track & Field Athlete of the Year, 2004 & 2005
n Currently Ranked 4th in the World
n Hometown: London, ON

LEADERSHIP TEAM
Michael S. West
Mike West joined CE Franklin as President and Chief Executive Officer in January 2002. He also served as Chairman of the Board from December 2003 to April 2008. Mike has held executive positions in the oilfield supply and distribution business for the past 12 years. Prior to 1996, he worked for 11 years in various capacities in the automotive aftermarkets industry.
W. Mark Schweitzer
Mark Schweitzer joined CE Franklin as Vice President and Chief Financial Officer in August 2007. Previously, he was the Executive Vice President and Chief Financial Officer of a large diversified business income fund. Mark has extensive financial experience in oil and gas, mining and other industry sectors.
Merv Day
Merv Day joined CE Franklin as Senior Vice President, Business Development in September 2008. Previously, he was President of a major valve manufacturer in Canada. Merv has over 30 years experience in the manufacturing and distribution of pipe, valves and fittings in the energy industry in Canada and internationally.
James E. Baumgartner
Jim Baumgartner is Vice President, Commercial Strategies. Prior to joining CE Franklin in 2001, Jim was the General Manager for a competitor in the oilfield and industrial project supply distribution business. He has over 27 years experience in distribution of pipe, valves and fittings to the energy industry in Canada and internationally.
Michael A. Boyles
Mike Boyles is Vice President, Brand Development, Marketing and Communications. Prior to joining CE Franklin in 2007, he was a Partner and Vice President of Sales and Marketing with a sporting goods manufacturer. A graduate of business administration from Grant McEwan College, Mike has extensive experience in building companies and brands.
Brent W. Greenwood
Brent Greenwood is Vice President, Supply Chain Management. He began his career with Franklin Supply in 1980 and has held various positions with the Company over the past 28 years. Brent graduated from the University of Saskatchewan with a Masters of Arts degree in History and earned his MBA from the University of Calgary in 1999.
Ronald L. Koper
Ron Koper is Vice President, Business Effectiveness. Prior to joining CE Franklin in 2000, Ron worked with a variety of large and mid-sized corporations in the human resources and organizational development profession. He graduated from the University of Calgary in 1984 with a Bachelor of Commerce degree.
Timothy M. Ritchie
Tim Ritchie is Vice President, Sales. He began his career with Franklin Supply in the field over 15 years ago and has progressively taken on more senior roles. Tim graduated from the University of Lethbridge with a Bachelor of Arts degree in 1993 and earned his MBA from the University of Calgary in 2000.
Roderick H. Tatham
Rod Tatham is Vice President, Operations. He is responsible and accountable for overall operational performance. Prior to joining CE Franklin in May 2002, Rod worked in various management capacities including Business Process & Design, Quality, Branch Management and Materials Management.
Management’s Discussion and Analysis
As at January 29, 2009
The following Management’s Discussion and Analysis (“MD&A”) is provided to assist readers in understanding CE Franklin Ltd.’s (“CE Franklin” or the “Company”)) financial performance and position during the periods presented and significant trends that may impact future performance of CE Franklin. This discussion should be read in conjunction with the audited consolidated financial statements of CE Franklin and the related notes thereto.
All amounts are expressed in Canadian dollars and in accordance with Canadian generally accepted accounting principles (“Canadian GAAP”), except where otherwise noted. For a discussion of the principle differences between CE Franklin’s financial results as calculated under U.S. GAAP, see note 16 to the consolidated financial statements of CE Franklin.
OVERVIEW
CE Franklin is a leading distributor of pipe, valves, flanges, fittings, production equipment, tubular products and other general industrial supplies primarily to the oil and gas industry through its 44 branches situated in towns and cities that serve oil and gas fields of the western Canadian sedimentary basin. In addition, the Company distributes similar products to the oil sands, refining, and petrochemical industries and non-oilfield related industries such as forestry and mining.
The Company’s branch operations service over 3,000 customers by providing the right materials where and when they are needed, and for the best value. Our branches, supported by our centralized Distribution Centre in Edmonton, Alberta, stock over 25,000 stock keeping units. This infrastructure enables us to provide our customers with the products they need on a same day or over night basis. Our centralized inventory and procurement capabilities allow us to leverage our scale to enable industry leading hub and spoke purchasing and logistics capabilities. The branches are also supported by services provided by the Company’s corporate office in Calgary, Alberta including sales, marketing, product expertise, logistics, invoicing, credit and collection and other business services.
The Company’s shares trade on the TSX (“CFT”) and AMEX (“CFK”) stock exchanges. Smith International Inc. (“Smith”), a major oilfield service company based in the United States, owns 54% of the Company’s shares.
BUSINESS AND OPERATING STRATEGY
The Canadian oilfield equipment supply industry is highly competitive and fragmented. There are approximately 250 oilfield supply stores in Canada which generate annual estimated sales of $2 to $3 billion. CE Franklin competes with four other large oilfield equipment distributors and with numerous local and regional distributors as well as specialty equipment distributors and manufacturers. The oilfield equipment market is part of the larger industrial equipment supply market, which is also serviced by numerous competitors. The oil sands and niche industrial product markets are more specialized and solutions oriented and require more in-depth product knowledge and supplier relationships to service specific customer requirements.
Oilfield equipment distributors compete based on price and level of service. Service includes the ability to consistently provide required products to a customer’s operating site when needed, project management services, product expertise and support, billing and expenditure management services, and related equipment services.
Demand for oilfield equipment is driven by the level of oil and gas industry capital expenditures as well as by production related maintenance, repair and operating (“MRO”) requirements. MRO demand tends to be relatively stable over time and predictable in terms of product and service requirements. Capital project demand fluctuates over time with oil and gas commodity prices.
The mix of products sold and customers served will affect profitability. Local walk in relationship business will typically generate higher profit margins compared to project bids, which are typically larger orders where the Company can take advantage of volume discounts and longer lead times. Larger oil and gas customers typically have a broader geographic operating reach requiring multi-site service capability, conduct larger capital projects, and require more sophisticated billing and project management services than do smaller customers. The Company has entered into a number of formal alliances with larger customers where the scale and repeat nature of business enables efficiencies which are shared with the customer through lower profit margins.
Barriers to entry in the oilfield supply business are low with start up operations typically focused on servicing local relationship based MRO customers. To compete effectively on capital project business and to service larger customers requires multi-location branch operations, increased financial, procurement, product expertise and breadth of product lines, information systems and process capability.
The Company’s 44 branch operations provide substantial geographic coverage across the oil and gas producing regions in western Canada. Each branch competes for local business supported by centralized support services provided by the Company’s Distribution Centre and corporate office in Calgary. The Company’s large branch network, coupled with its centralized capabilities enables it to develop strong supply chain relationships with suppliers and provide it with a competitive advantage over local independent oilfield and specialty equipment distributors for larger customers who are seeking one stop shopping and more comprehensive service. The Company’s relationship with Wilson Supply, a leading oilfield equipment distributor operating in the United States, and a wholly owned subsidiary of Smith, enables it to provide North American solutions to its customer base and provides increased purchasing scale with equipment suppliers.
The Company is pursuing the following strategies to grow its business profitably:
n
Expand the reach and market share serviced by our distribution network. We are focusing our sales efforts and product offering on servicing complex, multi-site needs of large and emerging customers in the energy sector. In 2008, we continued to invest in our distribution network by opening a new branch operation in Red Earth, Alberta and by expanding our facilities at five existing branch operations. Last spring, we successfully completed the move to our new 153,000 square foot Distribution Centre and nine acre pipe yard located in Edmonton, Alberta, which positions us to service our growing distribution network. Organic growth is expected to be complemented by selected acquisitions such as the December 2007 acquisition of JEN Supply Inc. (“JEN Supply”) which increased our market share in two existing markets and expanded our pr esence in two additional markets.
n
Expand our production equipment service capability to capture more of the product life cycle requirements for the equipment we sell such as down hole pump repair, oilfield engine maintenance, well optimization and on site project management. This will differentiate our service offering from our competitors and deepen our relationship with customers. In the first quarter of 2009, we plan to open a valve actuation centre at our Edmonton Distribution Centre, to service our customers’ valve automation requirements. The acquisition of Full Tilt Field Services Limited (“Full Tilt”) in July 2007 provided us with the capability to service oilfield engines and parts that we were previously selling, and, by doing so, position us to attract new customers to our core oilfield equipment distribution business.
n
Focus on the oil sands and industrial project and MRO business by leveraging our existing supply chain infrastructure, product and project expertise. The Company is expanding its product line, supplier relationships and expertise to provide the automation, instrumentation and other specialty products that these customers require.
BUSINESS OUTLOOK
The recent upheaval in global credit markets has contributed to significant capital market volatility, resulting in deleveraging, repricing of risk and ultimately the retrenchment of consumption. Oil and gas markets have experienced similar upheaval. Our customers continue to assess the impact of these changes on their businesses and capital expenditure plans in 2009. We expect oil and gas well completions will decline sharply in 2009 to levels not seen since 2002. Approximately 60% of the Company’s sales are driven by our customers’ capital project expenditures.
The Company expects these conditions will contribute to increased consolidation of oil and gas customers, stable to deflationary product costs and improved labour availability. We enter 2009 with a strong balance sheet and are positioned to pursue our strategies to increase market share in both the conventional oilfield and oil sands markets.
Over the medium to longer term, the Company is confident that it can continue to strengthen and improve the profitability of its distribution network by expanding its product lines, supplier relationships and capability to service additional oil and gas and industrial end use markets.
OPERATING RESULTS
The following table summarizes the consolidated results of operations of the Company for the last three years:
| | | | | | |
(in millions of Cdn. dollars except per share data) |
Years Ended December 31, | 2008 | 2007 | 2006 |
| Amount | % | Amount | % | Amount | % |
Sales | $547.4 | 100.0 | $466.3 | 100.0 | $555.2 | 100.0 |
Cost of sales | (439.7) | (80.3) | (381.7) | (81.9) | (451.7) | (81.4) |
Gross profit | 107.7 | 19.7 | 84.6 | 18.1 | 103.5 | 18.6 |
Selling, general and administrative expenses | (71.6) | (13.1) | (58.1) | (12.4) | (63.3) | (11.4) |
Foreign exchange loss and other | (0.2) | (0.0) | (0.8) | (0.2) | (0.1) | 0.0 |
EBITDA(1) | 35.8 | 6.5 | 25.7 | 5.5 | 40.1 | 7.2 |
Amortization | (2.4) | (0.4) | (2.8) | (0.6) | (2.8) | (0.5) |
Interest | (1.0) | (0.2) | (2.0) | (0.4) | (2.7) | (0.5) |
Income before taxes | 32.4 | 6.0 | 20.9 | 4.5 | 34.6 | 6.2 |
Income tax expense | (10.7) | (2.0) | (7.3) | (1.6) | (11.7) | (2.1) |
Net income | 21.7 | 4.0 | 13.6 | 2.9 | 22.9 | 4.1 |
Net income per share | | | | | | |
Basic (Cdn. $) | $ 1.19 | | $ 0.74 | | $ 1.27 | |
Diluted (Cdn. $) | $ 1.17 | | $ 0.72 | | $ 1.22 | |
Weighted average number of shares
outstanding (000’s) | | | | | | |
Basic | 18,255 | | 18,337 | | 18,099 | |
Diluted | 18,561 | | 18,807 | | 18,724 | |
(1) EBITDA represents net income before interest, taxes, depreciation and amortization. EBITDA is a supplemental non-GAAP financial measure used by management, as well as industry analysts, to evaluate operations. Management believes that EBITDA, as presented, represents a useful means of assessing the performance of the Company’s ongoing operating activities, as it reflects the Company’s earnings trends without showing the impact of certain charges. The Company is also presenting EBITDA, incremental flow through to EBITDA and EBITDA as a percentage of sales because it is used by management as a supplemental measure of profitability. The use of EBITDA by the Company has certain material limitations because it excludes the recurring expenditures of interest, income tax, and amortization expenses. Interest expense is a necessary component of the Company� 46;s expenses because the Company borrows money to finance its working capital and capital expenditures. Income tax expense is a necessary component of the Company’s expenses because the Company is required to pay cash income taxes. Amortization expense is a necessary component of the Company’s expenses because the Company uses property and equipment to generate sales. Management compensates for these limitations to the use of EBITDA by using EBITDA as only a supplementary measure of profitability. EBITDA is not used by management as an alternative to net income as an indicator of the Company’s operating performance, as an alternative to any other measure of performance in conformity with generally accepted accounting principles or as an alternative to cash flow from operating activities as a measure of liquidity. A reconciliation of EBITDA to Net income is provided within the table above. Not all companies calculate EBITDA in the same manner and EBITDA does not have a standardized meaning prescribed by Canadian GAAP. Accordingly, EBITDA, as the term is used herein, is unlikely to be comparable to EBITDA as reported by other entities.
2008 COMPARED TO 2007
Net income for the year ended December 31, 2008 was $21.7 million, up $8.1 million (60%) from the year ended December 31, 2007. Sales reached $547.4 million, up $81.2 million (17%) compared to the prior year. The increase in sales was attributable to increased tubular product prices, the acquisitions of JEN Supply and Full Tilt and increased oil sands and conventional oilfield market share and industry activity. Average rig count increased by 8% and well completions increased by 2% from prior year levels. Gross profit increased by $23.1 million (27%) over the prior year to a record $107.7 million, due to increased sales and gross profit margins. Increased supplier rebates associated with higher purchasing levels, and increased tubular margins were the principal reasons for the improvement in margins. Selling, general and administrative expenses increased by $13.5 mill ion (23%) in 2008 to $71.6 million due to the addition of operating expenses associated with the JEN Supply and Full Tilt acquisitions, increased variable compensation expense driven by the increase in earnings, and increased facility costs associated with the opening of the new Distribution Centre in the second quarter of 2008. Interest expense declined due to reduced average debt levels and floating interest rates in 2008. Income taxes increased by $3.4 million in 2008 due to higher pre-tax earnings offset slightly by a reduction in income tax rates. The weighted average number of shares outstanding during the year was down slightly compared to the prior year. Net income per share (basic) was $1.19 for the year, an increase of 61%, consistent with the increase in net income.
2007 COMPARED TO 2006
Net income for 2007 was $13.6 million, down $9.3 million (41%) from 2006 levels. Sales declined by 16% due to reduced oil and gas industry capital expenditures in 2007 and gross profit margins declined by 3% due to reduced supplier rebates, resulting in an $18.9 million (18%) decline in gross profit. Selling, general and administrative expenses declined by $5.2 million (8%) due to lower incentive compensation costs, reduced Sarbanes Oxley compliance costs, and lower selling costs resulting from the acquisition of two agent operated branches during the first half of 2007. Lower interest expense associated with reduced average debt levels in 2007 was offset by foreign exchange losses driven by the rapid appreciation in the Canadian dollar during 2007. Income taxes declined by $4.4 million in 2007 due to the reduced level of pre-tax earnings. Net income per share (basic) was $0.74 in 2007, down 42% due principally to the decline in net income combined with a 1% increase in the weighted average number of shares outstanding.
FOURTH QUARTER RESULTS
Net income for the fourth quarter of 2008 was a record at $8.8 million, up $6.4 million from the fourth quarter of 2007. Sales reached $161.2 million, an increase of $48.9 million (44%) from the fourth quarter of 2007. Capital project business comprised 60% of sales, and increased $34.6 million (55%) over the prior year period, driven by a 39% increase in well completions over the comparable period. Continued growth of oil sands revenues and increased tubular steel sales also contributed to increased capital project sales. Extremely tight tubular steel supply conditions during 2008 have resulted in product cost increases in excess of 50%, and contributed to the increase in sales. The acquisition of JEN Supply in the fourth quarter of 2007 contributed to the increase in MRO sales. Gross profit increased by $13.5 million (66%) over the prior year perio d due to the increase in sales and gross profit margins. Gross profit margins for the fourth quarter were 21.0% up from the prior year period at 18.2%. Selling, general and administrative expenses increased by $4.1 million to $19.4 million for the quarter due to increased variable compensation driven by the increase in earnings, increased facility costs with the opening of the new Edmonton Distribution Centre during the second quarter, and the addition of the JEN Supply operating costs. Lower interest expense was associated with reduced average debt levels and lower floating interest rates in the fourth quarter of 2008 as compared to the same period in 2007. Income taxes increased by $3.2 million in the fourth quarter compared to the prior year period due to higher pre-tax earnings offset slightly by a reduction in income tax rates. The weighted average number of shares outstanding during the fourth quarter was down slightly from the prior year period. Net income per share (basic) was $0.48 in the fourth quarter of 2008, an increase of 269% over the $0.13 earned in the fourth quarter of 2007, consistent with the increase in net earnings.
A more detailed discussion of the Company’s annual results from operations is provided below:
Sales
Sales for 2008 were $547.4 million, up $81.1 million (17%) from 2007 levels, due to increased tubular product prices, the acquisitions of JEN Supply and Full Tilt and increased oil sands and conventional oilfield market share and industry activity. In 2007, sales decreased to $466.3 million (16%) from 2006 levels, due to a decline in oil and gas industry capital expenditures.
| | | | | | |
(in millions of Cdn. $) | 2008 | 2007 | 2006 |
End use sales demand | $ | % | $ | % | $ | % |
Capital projects | 314.0 | 57 | 269.6 | 58 | 338.8 | 61 |
Maintenance, repair and operating supplies (MRO) | 233.4 | 43 | 196.7 | 42 | 216.4 | 39 |
Total sales | 547.4 | 100 | 466.3 | 100 | 555.2 | 100 |
Note: Capital project end use sales are defined by the Company as consisting of tubulars and 80% of pipe, flanges and fittings; and valves and accessories product sales respectively. MRO Sales are defined by the Company as consisting of pumps and production equipment, production services; general product and 20% of pipes, flanges and fittings; and valves and accessory product sales respectively.
The relative level of oil and gas commodity prices is a key driver of industry capital project activity as product prices directly impact the economic returns realized by oil and gas companies. The Company uses oil and gas well completions and average rig counts as industry activity measures to assess demand for oilfield equipment used in capital projects. Oil and gas well completions require the products sold by the Company to complete a well and bring production on stream and are a good general indicator of energy industry activity levels. Average drilling rig counts are also used by management to assess industry activity levels as the number of rigs in use ultimately drives well completion requirements.
The table below provides well completion, rig count and commodity price information for the last 3 years.
| | | | |
| As at December 31, 2008 | Average for the years ended December 31 |
| 2008 | 2007 | 2006 |
Gas - Cdn. $/gj (AECO spot) | $6.63 | $8.18 | $6.47 | $6.55 |
Oil - Cdn. $/bbl (Synthetic Crude) | $34.61 | $103.03 | $76.48 | $72.96 |
Average rig count | 313 | 398 | 367 | 498 |
Well completions: | | | | |
Oil | n/a | 6,223 | 5,443 | 5,609 |
Gas | n/a | 12,342 | 12,717 | 15,317 |
Total well completions | n/a | 18,565 | 18,160 | 20,926 |
Average statistics are shown except for well completions.
Sources: Oil and Gas prices – First Energy Capital Corp.; Rig count data – Hughes Christensen; Well completion data – Daily Oil Bulletin
Sales of capital project related products were $314.0 million in 2008, up $44.4 million (16%) from 2007. Increased capital project sales in 2008 reflected higher tubular sales due to significant product cost increases experienced during the year, and increased industry activity and market share. Total well completions increased 2% to 18,565 for 2008 while the average working rig count was up 8% to 398 rigs compared to 2007. Gas wells comprised 66% of the total wells completed in western Canada in 2008 compared to 70% in 2007 and 73% in 2006. Oil and gas capital expenditure activity began to recover in the second and third quarters of 2008 and continued through the fourth quarter resulting in part from emerging gas exploration plays in northeast British Columbia and oil pool development in southeast Saskatchewan combined with strong oil and gas prices earlier in the ye ar. Spot gas and oil prices ended the year at $6.63 per GJ (AECO spot) and $34.61 per bbl (Synthetic Crude), a decrease of 19% and 66%, respectively, from 2008 average prices. This, in combination with the volatility experienced across global capital markets, is expected to result in reduced industry cash flow, access to capital and capital expenditure economics, which in turn is expected to decrease demand for the Company’s products in 2009. Sales of capital project related products were $269.6 million in 2007, down $69.2 million (20%) from 2006 levels. Total well completions declined by 13% to 18,160 in 2007 and the average working rig count declined by 26% to 367 in 2007, contributing to lower demand for the Company’s capital project related products. Lower oil and gas capital expenditure activity in 2007 and early 2008 reflected the continuation of soft gas prices in 2007, compounded by increased industry capital and operating costs and uncertainty and lower returns resulting from t he Alberta government’s royalty study and subsequent decision announced in the fourth quarter of 2007 to increase royalty rates.
MRO product sales are related to overall oil and gas industry production levels and tend to be more stable than capital project sales. MRO product sales for 2008 increased by $36.7 million (19%) to $233.4 million compared to 2007 and comprised 43% of the Company’s total sales (2007 – 42%). The acquisition of JEN Supply in December 2007 and Full Tilt in July 2007 contributed incremental sales of $20.1 million in 2008. MRO product sales for 2007 were down $19.7 million (9%) from 2006 MRO product sales levels due to reduced industry activity levels.
The Company services over 3,000 customers of which the top ten customers comprised 42% of total sales in 2008 (2007 – 43%, 2006 - 38%). The Company’s largest customer comprised 10% of total sales in 2008 (2007 – 11%, 2006 - 11%). The increased concentration of sales in 2008 and 2007 was due to the Company’s focus on alliance customer programs coupled with lower capital program activity experienced by smaller oil and gas companies due to reduced access to capital markets resulting from increasingly challenging industry and capital market conditions. This trend is expected to continue in 2009.
The Company distributes approximately 25,000 stock keeping units sourced from over 2,000 suppliers. In 2008, the top 10 suppliers comprised 59% of total cost of goods sold (2007 – 43%, 2006 - 50%) of which two suppliers comprised 31% of total cost of goods sold (2007 – two suppliers comprised 28%, 2006 – two suppliers comprised 30%). Reduced supplier concentration in 2007 was principally due to the decline in capital project related product sales which tend to be more focused across fewer products than MRO product sales.
The Company’s strategy is to grow profitability by focusing on its core western Canadian oilfield equipment service business, complemented by an increase in the product life cycle services provided to its customers, and the focus on emerging oil sands capital project and MRO sales opportunities. Revenue results of these initiatives to date are provided below:
| | | | | | |
| 2008 | 2007 | 2006 |
Sales ($millions) | $ | % | $ | % | $ | % |
Oilfield | 491.3 | 90 | 431.4 | 93 | 529.2 | 96 |
Oil sands | 39.4 | 7 | 23.7 | 5 | 19.1 | 3 |
Production services | 16.7 | 3 | 11.2 | 2 | 6.9 | 1 |
Total sales | 547.4 | 100 | 466.3 | 100 | 555.2 | 100 |
Sales of oilfield products to conventional western Canada oil and gas end use applications were $491.3 million for 2008, up $59.9 million (14%) from 2007. This increase was comprised of incremental sales from the acquisition of JEN Supply, the increased sale of tubular products, and increased industry activity and market share. International oilfield sales, at $5.8 million in 2008, improved over prior year sales levels.
Sales to oil sands end use applications increased to $39.4 million up $15.7 million in 2008, a 66% increase compared to $23.7 million for 2007. The Company continues to position its sales focus, Distribution Centre and Fort McMurray branch to penetrate this emerging market for capital project and MRO products. Sales growth is expected to continue in 2009.
Production service sales were $16.7 million in 2008, up $5.5 million (49%) compared to $11.2 million in 2007. Full Tilt was acquired at the end of the second quarter of 2007, which provides oilfield engine maintenance and crane equipment services based in Lloydminster.
| | | |
Gross Profit | 2008 | 2007 | 2006 |
Gross profit (millions) | $107.7 | $84.6 | $103.5 |
Gross profit as a % of sales | 19.7% | 18.1% | 18.6% |
Gross profit composition by product sales category: | | | |
Tubulars | 13% | 8% | 8% |
Pipe, flanges and fittings | 31% | 32% | 35% |
Valves and accessories | 17% | 18% | 20% |
Pumps, production equipment and services | 15% | 17% | 13% |
General | 24% | 25% | 24% |
Total gross profit | 100% | 100% | 100% |
Gross profit reached a record $107.7 million in 2008, up $23.1 million (27%) from 2007, due to a 17% increase in sales and increased gross profit margins from 18.1% in 2007 to 19.7% in 2008. Gross profit margins improved in 2008 due to increased supplier rebates associated with higher purchasing levels and improved tubular margins reflecting tight product supply conditions. Gross profit was $84.6 million in 2007, down $18.9 million (18%) from 2006, due to a 16% decline in sales and a 3% decline in gross margin. Gross profit composition by product sales remained quite stable over the three year period with the exception of tubulars, where sales and gross profit increased due in part to the product cost inflation of steel and tight product supply conditions experienced in 2008.
Selling, General and Administrative (“SG&A”) Costs
| | | | | | |
| 2008 | 2007 | 2006 |
($millions) | $ | % | $ | % | $ | % |
People costs | 41.3 | 58 | 32.8 | 57 | 33.9 | 54 |
Selling costs | 10.2 | 14 | 7.8 | 13 | 13.4 | 21 |
Facility and office costs | 12.8 | 18 | 9.7 | 17 | 8.6 | 14 |
Other | 7.3 | 10 | 7.8 | 13 | 7.4 | 11 |
SG&A costs | 71.6 | 100 | 58.1 | 100 | 63.3 | 100 |
SG&A costs as % of sales | 13% | | 12% | | 11% | |
SG&A costs increased $13.5 million (23%) in 2008 from the prior year and represented 13% of sales compared to 12% in 2007. The increase in people costs of $8.5 million reflects increased variable compensation due to the increase in earnings and a 13% increase in the number of employees. Sales productivity reached $1.2 million per employee in 2008, up 9% from 2007 and down 8% from 2006 levels. Selling costs were up $2.4 million compared to the prior year due to increased sales commissions and accounts receivable bad debt allowances. Selling costs declined significantly in 2007 due to the acquisition of two agent operations in 2006 and early 2007 which reduced commission costs. Facility and office costs have increased in 2008 as the Company moved into a new, larger Distribution Centre in Edmonton in the second quarter. The addition of the JEN Supply facilities and c ontinued occupancy cost pressure in western Canada contributed the remaining increase in cost. The Company leases 34 of its 44 branch locations as well as its corporate office in Calgary and Distribution Centre. Five branch locations are owned and five are operated by agents. The Company mitigates the cyclical nature of industry activity levels by adjusting its variable and fixed (primarily salaries and benefits) SG&A costs as activity levels change.
Amortization Expense
Amortization expense was $2.4 million in 2008, down from $2.8 million in 2007 and 2006.
Interest Expense
Interest expense was $1.0 million in 2008, down $1.0 million from 2007 due to a 21% decline in average borrowing levels and a 42% decline in average floating interest rates. Interest expense decreased in 2007 by $0.6 million over 2006 due principally to lower borrowing levels and average floating interest rates.
Foreign Exchange Loss and Other
Foreign exchange losses were $0.2 million in 2008 (2007 - $0.8 million, 2006 – $0.1) despite significantly increased exchange rate volatility in 2008. Losses reflect the impact of the weakening Canadian dollar on United States dollar denominated product purchases and net working capital liabilities.
Income Tax Expense
The Company’s effective tax rate for 2008 was 33.0%, compared to 35.0% and 33.7% in 2007 and 2006, respectively, due principally to a reduction in statutory tax rates. Substantially all of the Company’s tax provision is currently payable.
Summary of Quarterly Financial Data
The selected quarterly financial data presented below is presented in Canadian dollars and in accordance with Canadian GAAP. This information is derived from the Company’s unaudited quarterly financial statements.
| | | | | | | | |
(in millions of Cdn. dollars except per share data) |
(Unaudited) | Q1 | Q2 | Q3 | Q4 | Q1 | Q2 | Q3 | Q4 |
| 2007 | 2007 | 2007 | 2007 | 2008 | 2008 | 2008 | 2008 |
Sales | $154.3 | $82.9 | $116.8 | $112.3 | $140.6 | $96.4 | $149.3 | $161.2 |
Gross profit | 26.3 | 16.8 | 21.0 | 20.4 | 27.1 | 19.0 | 27.8 | 33.9 |
Gross profit % | 17.0% | 20.3% | 18.0% | 18.2% | 19.3% | 19.7% | 18.6% | 21.0% |
EBITDA | 11.0 | 2.2 | 7.4 | 5.1 | 10.2 | 2.3 | 9.1 | 14.3 |
EBITDA as a % of sales | 7.1% | 2.7% | 6.4% | 4.5% | 7.2% | 2.4% | 6.1% | 8.9% |
Net income | 6.4 | 0.6 | 4.1 | 2.4 | 6.3 | 1.0 | 5.7 | 8.8 |
Net income as a % of sales | 4.1% | 0.7% | 3.6% | 2.1% | 4.5% | 1.0% | 3.8% | 5.5% |
Net income per share | | | | | | | | |
Basic | $ 0.35 | $ 0.03 | $ 0.22 | $ 0.13 | $ 0.34 | $ 0.05 | $ 0.31 | $ 0.48 |
Diluted | $ 0.34 | $ 0.03 | $ 0.22 | $ 0.13 | $ 0.34 | $ 0.05 | $ 0.31 | $ 0.47 |
Net working capital(1) | 124.0 | 127.0 | 128.7 | 134.7 | 117.4 | 114.9 | 123.1 | 142.8 |
Bank operating loan(1) | 33.6 | 36.0 | 35.4 | 44.3 | 21.8 | 18.4 | 20.9 | 34.9 |
Total well completions | 6,200 | 3,057 | 3,877 | 5,026 | 4,595 | 2,607 | 4,392 | 6,971 |
(1)Net working capital and bank operating loan amounts are as at quarter end. |
The Company’s sales levels are affected by weather conditions. As warm weather returns in the spring each year, the winter’s frost comes out of the ground rendering many secondary roads incapable of supporting the weight of heavy equipment until they have dried out. In addition, many exploration and production areas in northern Canada are accessible only in the winter months when the ground is frozen. As a result, the first and fourth quarters typically represent the busiest time for oil and gas industry activity and the highest sales activity for the Company. Sales levels drop dramatically during the second quarter until such time as the roads have dried and road bans have been lifted. This typically results in a significant reduction in earnings during the second quarter as the Company does not reduce its SG&A expenses during the second qua rter to offset the reduction in sales. Net working capital (defined as current assets less accounts payable and accrued liabilities, income taxes payable and other current liabilities) and bank operating loan borrowing levels follow similar seasonal patterns as sales.
LIQUIDITY AND CAPITAL RESOURCES
The Company’s primary internal source of liquidity is cash flow from operating activities before net changes in non-cash working capital balances. Cash flow from operating activities and the Company’s 364-day bank operating facility are used to finance the Company’s net working capital, capital expenditures and acquisitions.
As at December 31, 2008, borrowings under the Company’s bank operating loan were $34.9 million, a decrease of $9.4 million from December 31, 2007. Borrowing levels have decreased due to the Company generating $25.8 million in cash flow from operating activities, before net changes in non-cash working capital balances. This was offset by an $8.3 million increase in net working capital, $5.2 million in capital and other expenditures, $0.9 million in repayments of long term debt and capital lease obligations and $2.0 million for the purchase of shares to resource stock compensation obligations.
As at December 31, 2007, borrowings under the Company’s bank operating loan were $44.3 million, an increase of $10.3 million from December 31, 2006. Borrowing levels increased as business acquisitions of $18.0 million and net investments of $2.0 million to maintain property and equipment were funded principally by bank borrowings and cash flow from operations of $9.8 million.
In 2006, the Company generated $27.8 million in cash from cash flow from operating activities, before net change in non-cash working capital balances, and $1.7 million in the issuance of capital stock from the exercise of employee stock options. This was offset by a $14.2 million increase in working capital, $2.6 million to purchase a two branch distribution operation, $3.1 million in capital and other expenditures, $0.2 million in repayments on capital leases and $0.3 million in purchase of shares held in trust. These activities resulted in a $9.1 million decrease in the bank operating loan.
Net working capital was $142.8 million at December 31, 2008, an increase of $8.1 million from December 31, 2007. Accounts receivable increased by $11.2 million (13%) to $100.5 million at December 31, 2008 from December 31, 2007, due to increased sales in the fourth quarter offset by a 18% improvement in days sales outstanding in accounts receivable (“DSO”) in the fourth quarter of 2008 to 51 days compared to 62 days in the fourth quarter of 2007. The improvement in DSO performance during the fourth quarter of 2008 was due in part to a more efficient invoicing process implemented in the first quarter of 2008 and a general improvement in collections performance. DSO is calculated using average sales per day for the quarter compared to the period end accounts receivable balance. Inventory increased by $33.0 million (38%) at December 31, 2008 from December 31, 2 007 in order to resource a similar increase in sales levels. Inventory turns for the fourth quarter of 2008 remained consistent at 4.2 times compared to 4.3 times in the fourth quarter of 2007. Inventory turns are calculated using cost of goods sold for the quarter on an annualized basis compared to the period end inventory balance. The company will adjust its investment in inventory to align with anticipated lower industry activity levels and compressed supplier lead times in 2009 in order to improve inventory turnover efficiency. Accounts payable and accrued liabilities increased by $38.4 million (86%) to $83.2 million at December 31, 2008 from December 31, 2007 due mainly to an increase in purchasing to resource higher sales levels.
Capital expenditures in 2008 were $5.6 million, an increase of $3.6 million and $2.5 million over 2007 and 2006 expenditures, respectively. Increased expenditures were directed towards the new Distribution Centre which increased capacity by approximately 75% over the previous facility and the purchase of a new Fort St. John branch location which will more than double the Company’s capacity in the growing north east British Columbia market.
No acquisitions were completed in 2008. In 2007, the acquisition of JEN Supply, Full Tilt, and two agent operations were completed at a combined cost of $18.0 million. In 2006, two agent operations were acquired at a cost of $3.1 million.
The Company has a 364 day bank operating loan facility in the amount of $60.0 million (2007 - $75 million) arranged with a syndicate of three banks that matures in July 2009. The loan facility bears interest based on floating interest rates and is secured by a general security agreement covering all assets of the Company. The maximum amount available under the facility is subject to a borrowing base formula applied to accounts receivable and inventories, and a covenant restricting the Company’s average debt to 2.25 times trailing twelve month EBITDA. As at December 31, 2008, the Company’s average debt to EBITDA ratio was 0.7 times (December 31, 2007 – 1.7 times) which provides a maximum borrowing ability of $60 million under the facility. As at December 31, 2008, the ratio of the Company’s debt to total capitalization (debt plus equity) was 20% (December 31, 2007 – 28%).
Contractual Obligations
The following table outlines the Company’s contractual obligations for debt, lease and related obligations having initial terms in excess of one year.
| | | | | |
Period Due (millions of Canadian dollars) | Bank operating loan | Long term debt and capital lease obligations | Operating lease commitments | U.S.$ forward purchase contracts | Total |
2009 | 34.9 | – | 7.3 | 2.0 | 44.2 |
2010 | – | – | 7.1 | – | 7.1 |
2011 | – | – | 6.2 | – | 6.2 |
2012 | – | 0.5 | 5.7 | – | 6.2 |
2013 | – | – | 5.2 | – | 5.2 |
thereafter | – | – | 29.9 | – | 29.9 |
| 34.9 | 0.5 | 61.4 | 2.0 | 98.8 |
Approximately 95% of operating lease obligations related to office, warehouse, and store facility leases (2007 - 93%). Automobile and warehouse equipment leases comprised the remaining lease obligations. Future operating lease commitments at December 31, 2008 were $61.4 million, an $8.0 million increase from 2007 commitments. Capital expenditures in 2009 are anticipated to be in the $4 million to $6 million range. Approximately half of 2009 expenditures will be directed towards expanding distribution network capacity and service capability. In management’s opinion, the Company’s existing working capital position combined with available borrowing capacity under its bank operating loan facility and ongoing cash flow from operations, are sufficient to resource its anticipated contractual commitments. The Company anticipates its 364 day bank operating loan to be exten ded in 2009 in the normal course.
The Company’s bank operating loan bears interest based on floating Canadian interest rates. As at December 31, 2008, the Company’s average borrowing cost was 3.2% (2007 - 6%). Based on the Company’s borrowings levels as at December 31, 2008, an increase or decrease of one percent in interest rates would be expected to decrease or increase the Company’s annual net income by $0.3 million.
The Company purchases certain products priced in U.S. dollars and sells such products to its customers typically priced in Canadian dollars. As a result, fluctuations in the value of the Canadian dollar relative to the U.S. dollar can result in foreign exchange gains and losses. As at December 31, 2008, the Company had entered into a contract to purchase in 2009, U.S. $2.0 million at a fixed exchange rate for the purpose of mitigating its foreign exchange exposure. The Company does not use financial instruments for speculative purposes.
CAPITAL STOCK
The weighted average number of shares outstanding during 2008 was 18.3 million, a decrease of 0.1 million shares from 2007 due principally to the purchase of common shares to resource restricted share unit obligations. The diluted weighted average number of shares outstanding was 18.6 million, a decrease of 0.2 million shares from 2007, due to a reduction in the dilutive impact of stock options and restricted share units resulting from the decrease in the Company’s stock price in 2008.
As at December 31, 2008 and 2007, the following shares and securities convertible into shares were outstanding:
| | |
| Dec. 31, 2008 | Dec. 31, 2007 |
(millions) | Shares | Shares |
Shares outstanding | 18.1 | 18.4 |
Stock options | 1.3 | 1.3 |
Restricted share units | 0.2 | 0.2 |
Shares outstanding and issuable | 19.6 | 19.9 |
The Company has established an independent trust to purchase common shares of the Company on the open market to resource restricted share unit obligations. In 2008, the trust acquired 300,095 common shares at an average cost per share of $6.86 (2007 – 40,200 common shares at an average cost per share of $8.08). As at December 31, 2008, the trust held 343,892 shares (2007 – 54,551 shares).
On January 6, 2009, the Company announced a normal course issuer bid to purchase for cancellation, up to 900,000 common shares representing approximately 5% of its outstanding common shares.
Critical Accounting Estimates
The preparation of the consolidated financial statements requires the Company to make estimates and judgments that affect the reported amounts of assets, liabilities, revenues and expenses, and related disclosure of contingent assets and liabilities. The Company evaluates its estimates on an ongoing basis, based on historical experience and other assumptions that are believed to be reasonable under the circumstances. Actual results may differ from these estimates under different assumptions and conditions.
The Company believes the following describes the significant judgments and estimates used in the preparation of its consolidated financial statements.
Allowance for Doubtful Accounts
The Company extends credit to customers and other parties in the normal course of business. Management regularly reviews outstanding accounts receivable and provides for estimated losses through an allowance for doubtful accounts. In evaluating the level of the established allowance, management makes judgments regarding a party’s ability to make required payments, economic events and other factors. As the financial condition of a party changes, circumstances develop or additional information becomes available, adjustments to the allowance for doubtful accounts may be required. As at December 31, 2008 and 2007, the allowance for doubtful accounts was $2.8 million and $1.5 million, respectively.
Inventory Reserves
The Company has made significant investments in inventory to service its customers. On a routine basis, the Company uses judgments in determining the level of write-downs required to record inventory at the lower of average cost or net realizable value. Management’s estimates are primarily influenced by technological innovations, market activity levels and the physical condition of products. Changes in these or other factors may result in a write-down in the carrying value of inventory. As at December 31, 2008 and December 31, 2007, the Company had recorded reserves for inventory obsolescence of $2.8 million and $1.8 million, respectively.
Goodwill
The Company has acquired certain operations which have resulted in the recording of $20.6 million of goodwill on the balance sheet as at December 31, 2008. In accordance with Canadian GAAP, the Company is required to perform an annual goodwill impairment evaluation. The Company evaluates goodwill impairment at the consolidated level as it operates through a single operating segment. The impairment evaluation involves comparing the estimated fair value of the Company’s business to its carrying amount to determine if a write down to fair value is required. Fair value is estimated using future cash flow projections, discounted to their present value and earnings and cash flow multiples for comparable public energy service and distribution companies. The required valuation methodology and underlying financial information that is used to determine fair value require significant j udgments to be made by management. These judgments include, but are not limited to, long term projections of future financial performance and the selection of appropriate discount rates used to determine the present value of future cash flow and may be impacted by changes in oil and gas industry conditions. See “Business Outlook” for discussion of industry conditions. Changes in such estimates or the application of alternative assumptions could produce significantly different results.
Future Tax Assets and Liabilities
Future tax assets and liabilities are recognized for differences between the book value and tax value of the net assets of the Company. In providing for future taxes, management considers current tax regulations, estimates of future taxable income and available tax planning strategies. If tax regulations, operating results or the ability to implement tax planning strategies vary, adjustments to the carrying value of future tax assets and liabilities may be required. See Note 10 to the consolidated financial statements for the significant components of the future income tax assets and liabilities, and a reconciliation of the Company’s income tax provision.
RISK FACTORS
In addition to the information set forth elsewhere in this MD&A, the following factors should be carefully considered when evaluating CE Franklin.
Fluctuations in the overall profitability of the oil and gas industry can affect the demand for CE Franklin’s products and services and, therefore, CE Franklin’s sales, cash flows and profitability. CE Franklin’s operations are materially dependent upon the level of activity in oil and gas exploration, development and production. Both short-term and long-term trends in oil and gas prices affect the level of such activity. Other factors that can impact the level of drilling, exploration and production and oil sands project activity and the overall profitability of the oil and gas industry include:
n
relatively minor changes in, or threats to, the worldwide supply of and demand for oil and natural gas;
n
the ability of the members of the Organization of Petroleum Exporting Countries (“OPEC”) to maintain price stability through voluntary production limits;
n
the level of production by non-OPEC countries;
n
North American demand for gas;
n
the movement of the Canadian dollar relative to its U.S. counterpart (crude oil and natural gas exports are generally traded in U.S. dollars);
n
general economic and political conditions in North America and worldwide; and
n
the presence or absence of drilling incentives such as Canadian provincial royalty holidays, availability of new leases and concessions and government regulations regarding, among other things, export controls, carbon taxes, regulatory emissions reduction targets and other environmental protection measures, changes in royalty rates, taxation, price controls and availability of product transportation and refining capacity.
CE Franklin believes that any prolonged reduction in oil and gas prices or other factors that may impact the profitability of the oil and gas industry, would depress the level of exploration and production activity. This would likely result in a corresponding decline in the demand for CE Franklin’s products and services and could have a material adverse effect on CE Franklin’s sales, cash flows and profitability. There can be no assurance as to the future level of demand for CE Franklin’s products and services or future conditions in the oil and gas and oilfield supply industries.
Unusual weather conditions could decrease the demand for CE Franklin’s products and services. CE Franklin’s financial performance is tied closely to the seasonality of drilling activity. Higher drilling activity in Canada is generally experienced in the winter months. In the spring and early summer, drilling activity slows due to the difficulty in moving equipment during the spring thaws. To the extent that unseasonable weather conditions such as excessive rain or unusually warm winters affect the ability of CE Franklin’s customers to access their oil and gas sites, then the demand for CE Franklin’s products and services would temporarily decrease and the Company’s sales, cash flows and profitability would be adversely affected.
CE Franklin operates in a highly competitive industry, which may adversely affect CE Franklin’s sales, cash flows and profitability. The Canadian oilfield supply industry in which CE Franklin operates is very competitive. The Company believes that its future profitability is partially influenced by competitive factors beyond its control, including:
n
the ability of some customers to purchase pipe, valves, flanges, fittings, production equipment, tubular products and other general oilfield supplies directly from the manufacturer rather than from the Company;
n
the ability of new brokers and distributors to enter the market if the oil and gas industry were to experience significant growth;
n
price competition among major supply companies;
n
cost of goods being subject to rising or declining commodity prices, such as the price of steel, and the inability of CE Franklin to pass these price increases on to customers, or the risk CE Franklin may have higher-cost inventory during declining commodity prices resulting in a deterioration in gross profit margins.
CE Franklin and its largest competitors generally operate at low profit margins due to price competition. Price competition is due in part to customer price pressure, in addition to the major supply companies competing for the same business.
The loss of CE Franklin’s major suppliers could adversely affect the Company’s sales and gross profit. A portion of CE Franklin’s business are sales where product is primarily obtained from two suppliers. Although the Company believes that it has historically had and continues to have a good relationship with these suppliers, there can be no assurance that such relationships will continue. In the event the Company is unable to source products from its existing suppliers, then CE Franklin would need to search for alternative suppliers of these goods. There can be no assurance that suitable alternate suppliers for such goods would be found.
Labour shortages could adversely affect the Company’s ability to service its customers. The Company faces the challenge of attracting and retaining workers to meet any increase in demand for its products and services. In a highly competitive market for employees, the Company may experience periods of high employee turnover that could result in higher training costs or reduced levels of service to customers. The Company may also experience wage inflation. These could result in increased costs or the loss of customers and market share.
During periods of high demand for products and services, the Company may experience product shortages. The frequency and duration of the shortages may impact the financial performance of the Company. Product shortages may impact profit margins or could result in the loss of customers.
The Company may experience a financial loss if inventory becomes obsolete or otherwise unsaleable. The rate of product technical innovation and the company’s ability to return unsaleable inventory to suppliers may impact financial performance.
The majority of the Company’s sales are generated from customers in the energy sector. This includes major multinational and independent oil companies, pipeline companies and contract drilling companies operating in Canada. In addition, for the year ended December 31, 2008, 10% of sales (2007 – 11%; 2006 – 11%) were derived from sales to one customer.
The Company may experience a financial loss if its significant customers fail to pay CE Franklin for its products or services. The Company’s ability to collect the proceeds from the sale of its products and services from its customers depends on the payment ability of its oil and gas customer base. The recent upheaval in global credit markets and decline in oil and gas prices may increase the payment risk associated with the Company’s customers.
Significant downtime at the Company’s centralized Distribution Centre located in Edmonton, Alberta could materially impact net income and cash flow from operations. The Company operates a hub and spoke distribution model with the Distribution Centre strategically located within reasonable proximity to a majority of its vendors. In addition, the Distribution Centre acts as a hub for its 44 branches. Significant downtime at this facility could impact the Company’s gross profit margins net income and cash flow from operations.
A substantial portion of the Company’s sales to customers depend on written contracts that are cancelable at any time, or are based on verbal agreements. The key factors which will determine whether a customer will continue to use the Company are pricing, service quality and availability, strategically located service centres and technical knowledge and experience. There can be no assurance that the Company’s relationships with its customers will continue, and a significant reduction or total loss of business from these customers, if not offset by increased sales to new or existing customers, could have a material adverse effect on the Company’s net income or cash flow from operations.
The Company relies on its bank operating loan to finance its ongoing net working capital and other funding requirements. CE Franklin has a $60 million borrowing facility provided by a syndicate of three banks that matures in July 2009. While management believes that this facility will be adequate to fund its working capital requirements, there can be no assurance that additional credit will become available if required, or that an appropriate amount of credit with comparable terms and conditions will become available when the facility matures. The bank operating loan contains restrictive covenants which, amongst other things, limits the amount of borrowing available under the facility to a maximum of 2.25 times average borrowing levels compared to EBITDA for the trailing 12 month period. Accordingly, declining pro fitability could limit the amount the Company may borrow under the facility.
If the Company is unable to successfully address potential material weakness in its internal controls, or any other control deficiencies, its ability to report its financial results on a timely and accurate basis and to comply with disclosure and other requirements may be adversely affected. The Company has complied with Section 404 of the Sarbanes-Oxley Act of 2002, and is therefore required to make an assessment of the effectiveness of its internal controls over financial reporting for that purpose. A material weakness is defined as a significant deficiency, or a combination of significant deficiencies, that results in more than a remote likelihood that a material misstatement of the annual or interim financial statements will not be prevented or detected.
CE Franklin will continue to monitor the effectiveness of these and other processes, procedures and controls and will make any further changes management determines appropriate, including to effect compliance with Section 404 of the Sarbanes-Oxley Act of 2002. The steps CE Franklin has taken and will take in the future may not remediate any potential material weakness. In addition, the Company may identify material weaknesses or other deficiencies in our internal controls in the future.
Any material weaknesses or other deficiencies in the Company’s control systems may affect its ability to comply with reporting requirements and stock exchange listing standards or cause its financial statements to contain material misstatements, which could negatively affect the market price and trading liquidity of its common stock, cause investors to lose confidence in the Company’s reported financial information, as well as subject CE Franklin to civil or criminal investigations and penalties.
The Company’s major shareholder may influence the Company’s affairs. The Company’s share ownership is highly concentrated and, as a result, CE Franklin’s principal shareholder effectively controls the Company’s business. As at the date of this Form 20-F, CE Franklin’s largest shareholder, Smith, owned approximately 54% of the Company’s common shares outstanding. As a result, Smith has the voting power to significantly influence the Company’s policies, business and affairs and the outcome of any corporate transaction or other matter, including mergers, consolidations and the sale of all, or substantially all, of the Company’s assets.
In addition, the concentration of the Company’s ownership may have the effect of delaying; deterring or preventing a change in control that otherwise could result in a premium in the price of the Company’s common shares.
FORWARD LOOKING STATEMENTS
The information in this MD&A may contain “forward-looking statements” within the meaning of Section 27A of the Securities Act of 1933 and Section 21E of the Securities Exchange Act of 1934. All statements, other than statements of historical facts, that address activities, events, outcomes and other matters that CE Franklin plans, expects, intends, assumes, believes, budgets, predicts, forecasts, projects, estimates or anticipates (and other similar expressions) will, should or may occur in the future are forward-looking statements. These forward-looking statements are based on management’s current belief, based on currently available information, as to the outcome and timing of future events. When considering forward-looking statements, you should keep in mind the risk factors and other cautionary statements in this MD&A, including those under the caption “Risk factors”.
Forward-looking statements appear in a number of places and include statements with respect to, among other things:
n
forecasted oil and gas industry activity levels in 2009;
n
planned capital expenditures and working capital and availability of capital resources to fund capital expenditures and working capital;
n
the Company’s future financial condition or results of operations and future revenues and expenses;
n
the Company’s business strategy and other plans and objectives for future operations;
n
fluctuations in worldwide prices and demand for oil and gas;
n
fluctuations in the demand for the Company’s products and services.
Should one or more of the risks or uncertainties described above or elsewhere in this MD&A occur, or should underlying assumptions prove incorrect, the Company’s actual results and plans could differ materially from those expressed in any forward-looking statements.
All forward-looking statements expressed or implied, included in this MD&A and attributable to CE Franklin are qualified in their entirety by this cautionary statement. This cautionary statement should also be considered in connection with any subsequent written or oral forward-looking statements that CE Franklin or persons acting on its behalf might issue. CE Franklin does not undertake any obligation to update any forward-looking statements to reflect events or circumstances after the date of filing this MD&A, except as required by law.
TRANSITION TO INTERNATIONAL FINANCIAL REPORTING STANDARDS (IFRS)
In February 2008, the Canadian Accounting Standards Board (“AcSB”) confirmed that the basis for financial reporting by Canadian publicly accountable enterprises will change from Canadian GAAP to IFRS effective for January 1, 2011, including the preparation and reporting of one year of comparative figures. This change is part of a global shift to provide consistency in financial reporting in the global marketplace. CE Franklin has developed a high level project plan, a detailed project charter including resources required and timelines, and has commenced assessing the differences between IFRS and Canadian GAAP.
RECENT ACCOUNTING PRONOUNCEMENTS
Under revised CICA section 1506, “Accounting Changes” and the U.S. Securities and Exchange Commission’s (SEC) Staff Bulletin No. 74 (SAB 74), the Company is required to disclose certain information related to recently issued accounting standards. This guidance requires that when a new accounting standard has been issued but has not yet been adopted, the Company should discuss the effect that the new standard will have on the Company’s financial statements when adopted.
Canadian GAAP pronouncements
(i)
CICA 1400 – Assessing Going Concern
Effective January 1, 2008, the Company adopted Section 1400 – Assessing Going Concern. The standard was amended to include requirements for management to assess and disclose an entity’s ability to continue as a going concern. Management has reviewed the guidance in section 1400 and determined that no material uncertainties exist with respect to the Company’s ability to continue as a going concern.
(ii)
CICA 3064 – Goodwill and Intangible Assets
This standard addresses the accounting treatment of internally developed intangibles and the recognition of such assets. The company believes that the adoption of this standard will not have a material impact on its financial statements. This section applies to interim and annual financial statements relating to fiscal years beginning on or after January 1, 2009.
(iii)
CICA 3031 – Inventories
Effective January 1, 2008, the Company adopted Section 3031 – Inventories. The standard establishes the accounting treatment for inventories and provides guidance on the determination of cost and subsequent recognition of expenses. The adoption of Section 3031 did not impact the determination of inventory costs and expense recorded by the Company. Inventories consisting primarily of goods purchased for resale are valued at the lower of average cost or net realizable value.
(iv)
CICA 1535 – Capital Disclosures, CICA 3862 – Financial Instruments - Disclosure and CICA 3863 – Financial Instruments - Presentation
Effective January 1, 2008, the Company adopted Section 1535 – Capital Disclosures, Section 3862 – Financial Instruments – Disclosures and Section 3863 – Financial Instruments – Presentation. The standards establish presentation guidelines for financial instruments and deal with their classification, as well as providing readers of the financial statements with information pertinent to the Company’s objectives, policies and processes for managing capital.
Recent U.S. GAAP pronouncements
(i)
FAS141(A) – Business Combinations
This statement sets out to improve the relevance, representational faithfulness, and comparability of the information that a reporting entity provides in its financial reports about a business combination and its effects. This statement applies prospectively to business combinations for which the acquisition date is on or after the beginning of the first annual reporting period beginning on or after December 15, 2008. The Company believes that this will have minimal effect on the financial statements of the Company, but will reassess if and when future business combinations occur.
(ii)
FAS 160 – Non controlling interests in consolidated financial statements
The objective of this statement is to improve the relevance, comparability and transparency of the financial information that a reporting entity provides in its consolidated financial statements by establishing accounting and reporting standards. This statement will be applied prospectively as of the beginning of the fiscal year in which the statement is initially applied. This statement is effective for fiscal years, beginning on or after December 15, 2008. Earlier adoption is prohibited. The Company believes that this will have minimal effect on its financial statements.
(iii)
FAS 161 – Disclosures about derivative instruments and hedging activities
The objective of this statement is to revise disclosure requirements for derivative instruments and hedging activities. This statement is effective for fiscal years, beginning after November 15, 2008 and interim periods within those years. The Company believes that this statement will have minimal effect on its financial statements.
Controls and Procedures
CE Franklin’s Chief Executive Officer and Chief Financial Officer, after evaluating the effectiveness of the Company’s disclosure controls and procedures (as defined in Exchange Act Rule 13a-15(e)) as at January 29, 2009, have concluded that, as of such date, the Company’s disclosure controls and procedures were effective.
Report of CE Franklin Management on Internal Control Over Financial Reporting: CE Franklin’s Board of Directors and management are responsible for establishing and maintaining adequate internal control over financial reporting. The Company’s internal control system was designed to provide reasonable assurance to management and Board of Directors regarding the reliability of financial reporting and the preparation and fair presentation of its published consolidated financial statements.
All internal control systems, no matter how well designed, have inherent limitations. Therefore, even those systems determined to be effective may not prevent or detect misstatements and can provide only reasonable assurance with respect to financial statement preparation and presentation. Also, projections of any evaluation of effectiveness to future periods are subject to the risk that controls may become inadequate because of changes in conditions, or that the degree of compliance with the policies or procedures may deteriorate.
Management assessed the effectiveness of the Company’s internal control over financial reporting as of December 31, 2008. In making this assessment, it used the criteria established in Internal Control—Integrated Framework issued by the Committee of Sponsoring Organizations of the Treadway Commission (COSO). Based on the Company’s assessment, management has concluded that as of December 31, 2008, CE Franklin’s internal control over financial reporting is effective based on those criteria.
See report of PricewaterhouseCoopers LLP, an independent public accounting firm, on page 46.
There were no changes to the Company’s internal control over financial reporting that occurred during the period that have materially affected, or are reasonably likely to materially affect, the Company’s our internal control over financial reporting.
OTHER ITEMS
Additional information relating to the Company, including its Form 20-F, is available under the Company’s profile on SEDAR at www.sedar.com and at www.cefranklin.com.
Management’s Report on Internal Control
Over Financial Reporting
Management of the Company is responsible for establishing and maintaining adequate internal control over financial reporting as defined in Rule 13a – 15(f) under the Securities Exchange Act of 1934. The Company’s internal control over financial reporting is designed to provide reasonable assurance regarding the reliability of financial reporting and the preparation of financials statements for external purposes in accordance with generally accepted accounting principles. A company’s internal control over financial reporting includes those policies and procedures that (1) pertain to the maintenance of records that, in reasonable detail, accurately and fairly reflect the transactions and dispositions of the assets of the company; (2) provide reasonable assurance that transactions are recorded as necessary to permit preparation of financial statements in accorda nce with generally accepted accounting principles, and that receipts and expenditures of the company are being made only in accordance with authorizations of management and directors of the company; and (3) provide reasonable assurance regarding prevention or timely detection of unauthorized acquisition, use, or disposition of the company’s assets that could have a material effect on the financial statements.
Because of its inherent limitations, internal control over financial reporting may not prevent or detect misstatements. Also, projections of any evaluation of effectiveness to future periods are subject to the risk that controls may become inadequate because of changes in conditions, or that the degree of compliance with the policies or procedures may deteriorate.
The Company’s management assessed the effectiveness of the Company’s internal control over financial reporting based on criteria established in Internal Control-Integrated Framework issued by the Committee of Sponsoring Organizations of the Treadway Commission. Based on this assessment, management concluded that the Company’s internal control over financial reporting was effective as of December 31, 2008.
The effectiveness of the Company’s internal control over financial reporting as of December 31, 2008 has been audited by PricewaterhouseCoopers LLP, the independent auditors, as stated in their report which appears on page 46.
Michael West
Mark Schweitzer
President and Chief Executive Officer
Vice President and Chief Financial Officer
January 29, 2009
January 29, 2009
Management’s Report
The preparation and presentation of the accompanying consolidated financial statements are the responsibility of the management of the Company. The statements have been prepared in accordance with Canadian generally accepted accounting principles as described in note 1 to the consolidated financial statements. The financial information elsewhere in the annual report has been reviewed to ensure consistency with that in the consolidated financial statements.
Management acknowledges responsibility for the integrity of its financial information. Where appropriate, management has made informed judgments and estimates in accounting for transactions, which were not complete at the balance sheet date. The Company maintains disclosure controls and procedures and internal controls designed to ensure that information required to be disclosed in the consolidated financial statements and annual report is recorded, processed, summarized and reported properly. CE Franklin’s Chief Executive Officer and Chief Financial Officer evaluated the Company’s disclosure controls and procedures as at December 31, 2008 to ensure that such disclosure controls and procedures are effective. There were no significant changes in the Company’s internal controls or in other factors that could significantly affect those controls subse quent to the evaluation date.
The Board of Directors has appointed an Audit Committee that consists of three directors who are not officers or employees of the Company and have no direct or indirect material relationship with the Company. The committee meets with management and the Company’s external auditors to discuss internal control, accounting policies and financial reporting matters. The Audit Committee has reviewed the consolidated financial statements. The Board of Directors has approved the consolidated financial statements on the recommendation of the Audit Committee.
Michael West
Mark Schweitzer
President and Chief Executive Officer
Vice President and Chief Financial Officer
January 29, 2009
January 29, 2009
Independent Auditors’ Report
To the Shareholders of CE Franklin Ltd.
We have completed integrated audits of the consolidated financial statements and internal control over financial reporting of CE Franklin Ltd. (the “Company”) as of December 31, 2008, 2007 and 2006. Our opinions, based on our audits, are presented below.
CONSOLIDATED FINANCIAL STATEMENTS
We have audited the accompanying consolidated balance sheets of CE Franklin Ltd. as at December 31, 2008 and December 31, 2007, and the related consolidated statements of operations, changes in shareholders’ equity and cash flows for each of the years in the three year period ended December 31, 2008. These consolidated financial statements are the responsibility of the Company’s management. Our responsibility is to express an opinion on these consolidated financial statements based on our audits.
We conducted our audits of the Company’s consolidated financial statements in accordance with Canadian generally accepted auditing standards and the standards of the Public Company Accounting Oversight Board (United States). Those standards require that we plan and perform an audit to obtain reasonable assurance about whether the financial statements are free of material misstatement. An audit of financial statements includes examining, on a test basis, evidence supporting the amounts and disclosures in the financial statements. A financial statement audit also includes assessing the accounting principles used and significant estimates made by management, and evaluating the overall financial statement presentation. We believe that our audits provide a reasonable basis for our opinion.
In our opinion, the consolidated financial statements referred to above present fairly, in all material respects, the financial position of the Company as at December 31, 2008 and December 31, 2007 and the results of its operations and its cash flows for each of the years in the three year period ended December 31, 2008 in accordance with Canadian generally accepted accounting principles.
INTERNAL CONTROL OVER FINANCIAL REPORTING
We have also audited CE Franklin Ltd.’s internal control over financial reporting as at December 31, 2008, based on criteria established in Internal Control - Integrated Framework issued by the Committee of Sponsoring Organizations of the Treadway Commission (COSO). The Company’s management is responsible for maintaining effective internal control over financial reporting and for its assessment of the effectiveness of internal control over financial reporting. Our responsibility is to express an opinion on the Company’s internal control over financial reporting based on our audit.
We conducted our audit of internal control over financial reporting in accordance with the standards of the Public Company Accounting Oversight Board (United States). Those standards require that we plan and perform the audit to obtain reasonable assurance about whether effective internal control over financial reporting was maintained in all material respects. An audit of internal control over financial reporting includes obtaining an understanding of internal control over financial reporting, assessing the risk that a material weakness exists, testing and evaluating the design and operating effectiveness of internal control based on the assessed risk, and performing such other procedures as we consider necessary in the circumstances. We believe that our audit provides a reasonable basis for our opinion.
A company’s internal control over financial reporting is a process designed to provide reasonable assurance regarding the reliability of financial reporting and the preparation of financial statements for external purposes in accordance with generally accepted accounting principles. A company’s internal control over financial reporting includes those policies and procedures that (i) pertain to the maintenance of records that, in reasonable detail, accurately and fairly reflect the transactions and dispositions of the assets of the company; (ii) provide reasonable assurance that transactions are recorded as necessary to permit preparation of financial statements in accordance with generally accepted accounting principles, and that receipts and expenditures of the company are being made only in accordance with authorizations of management and directors of the company; and (iii) provide reasonable assurance regarding prevention or timely detection of unauthorized acquisition, use, or disposition of the company’s assets that could have a material effect on the financial statements.
Because of its inherent limitations, internal control over financial reporting may not prevent or detect misstatements. Also, projections of any evaluation of effectiveness to future periods are subject to the risk that controls may become inadequate because of changes in conditions, or that the degree of compliance with the policies or procedures may deteriorate.
In our opinion, the Company maintained, in all material respects, effective internal control over financial reporting as at December 31, 2008 based on criteria established in Internal Control — Integrated Framework issued by the COSO.
PricewaterhouseCoopers LLP
Chartered Accountants
Calgary, Alberta
January 29, 2009
Consolidated Balance Sheets
| | |
(in thousands of Canadian dollars) | 2008 | 2007 |
Assets | | |
Current assets | | |
Accounts receivable | 100,513 | 89,305 |
Inventories | 119,459 | 86,414 |
Other | 9,529 | 3,781 |
| 229,501 | 179,500 |
Property and equipment(note 3) | 9,528 | 6,398 |
Goodwill | 20,570 | 20,523 |
Future income taxes(note 10) | 1,186 | 1,403 |
Other | 649 | 891 |
| 261,434 | 208,715 |
Liabilities | | |
Current liabilities | | |
Bank operating loan (note 5) | 34,948 | 44,301 |
Accounts payable and accrued liabilities | 83,249 | 44,807 |
Income taxes payable | 3,405 | – |
Current portion of long term debt and obligations under
capital lease (note 6) | 9 | 805 |
| 121,611 | 89,913 |
Long term debt and obligations under capital lease (note 6) | 500 | 582 |
| 122,111 | 90,495 |
Commitments and contingencies (note 7) | | |
Shareholders’ equity | | |
Capital stock (note 8) | 22,498 | 24,306 |
Contributed surplus | 18,835 | 17,671 |
Retained earnings | 97,990 | 76,243 |
| 139,323 | 118,220 |
| 261,434 | 208,715 |
See accompanying notes to these consolidated financial statements.
Approved by the Board:
Victor Stobbe
David Dyck
Director
Director
Consolidated Statements of Changes in Shareholders’ Equity
| | | | | |
| Capital Stock | | | |
(in thousands of Canadian dollars and number of shares) | Number of Shares | $ | Contributed Surplus | Retained Earnings | Shareholders’ Equity |
December 31, 2005 | 17,805 | 21,914 | 14,281 | 39,737 | 75,932 |
Stock options exercised (note 8) | 443 | 1,963 | (300) | – | 1,663 |
Stock based compensation expense(note 8) | – | – | 2,232 | – | 2,232 |
Purchase of shares in trust for RSU Plans(note 8) | (25) | (291) | – | – | (291) |
Net income | – | – | – | 22,939 | 22,939 |
December 31, 2006 | 18,223 | 23,586 | 16,213 | 62,676 | 102,475 |
Stock options exercised (note 8) | 177 | 838 | (259) | – | 579 |
Restricted share units (RSU) exercised | 10 | 207 | (207) | – | – |
Stock based compensation expense(note 8) | – | – | 1,924 | – | 1,924 |
Purchase of shares in trust for RSU Plans(note 8) | (40) | (325) | – | – | (325) |
Net income | – | – | – | 13,567 | 13,567 |
December 31, 2007 | 18,370 | 24,306 | 17,671 | 76,243 | 118,220 |
Stock options exercised (note 8) | 13 | 69 | (20) | – | 49 |
Restricted share units (RSU) exercised | 11 | 181 | (181) | – | – |
Stock based compensation expense(note 8) | – | – | 1,365 | – | 1,365 |
Purchase of shares in trust for RSU Plans (note 8) | (300) | (2,058) | – | – | (2,058) |
Net income | – | – | – | 21,747 | 21,747 |
December 31, 2008 | 18,094 | 22,498 | 18,835 | 97,990 | 139,323 |
See accompanying notes to these consolidated financial statements.
Consolidated Statements of Operations
| | | |
(in thousands of Canadian dollars except shares and per share amounts) | 2008 | 2007 | 2006 |
Sales | 547,429 | 466,275 | 555,227 |
Cost of sales | 439,760 | 381,694 | 451,733 |
Gross profit | 107,669 | 84,581 | 103,494 |
Other expenses | | | |
Selling, general and administrative expenses | 71,587 | 58,053 | 63,287 |
Amortization | 2,367 | 2,795 | 2,819 |
Interest expense | 1,031 | 2,031 | 2,661 |
Foreign exchange loss and other | 242 | 837 | 130 |
| 75,227 | 63,716 | 68,897 |
Income before income taxes | 32,442 | 20,865 | 34,597 |
Income tax expense (recovery)(note 10) | | | |
Current | 10,474 | 7,541 | 11,783 |
Future | 221 | (243) | (125) |
| 10,695 | 7,298 | 11,658 |
Net and comprehensive income for the year | 21,747 | 13,567 | 22,939 |
Net income per share | | | |
Basic | 1.19 | 0.74 | 1.27 |
Diluted | 1.17 | 0.72 | 1.22 |
Weighted average number of shares outstanding (000’s) | | | |
Basic | 18,255 | 18,337 | 18,099 |
Diluted(Note 8(e)) | 18,561 | 18,807 | 18,724 |
See accompanying notes to these consolidated financial statements.
Consolidated Statements of Cash Flows
| | | |
(in thousands of Canadian dollars) | 2008 | 2007 | 2006 |
Cash flows from operating activities | | | |
Net income | 21,747 | 13,567 | 22,939 |
Items not affecting cash | | | |
Amortization | 2,367 | 2,795 | 2,819 |
Future income tax expense (recovery) | 221 | (243) | (125) |
Stock based compensation expense | 1,365 | 1,924 | 2,232 |
Other expense (recovery) | 74 | – | (36) |
| 25,774 | 18,043 | 27,829 |
Net change in non-cash operating working capital balances(note 9) | (8,373) | (8,195) | (14,214) |
| 17,401 | 9,848 | 13,615 |
Cash flows from financing activities | | | |
Issuance of capital stock | 49 | 579 | 1,663 |
Purchase of capital stock in trust for RSU Plans (note 8(d)) | (2,058) | (325) | (291) |
Increase (decrease) in bank operating loan | (9,353) | 10,293 | (9,144) |
Decrease in long term debt and obligations under
capital lease | (878) | (476) | (177) |
| (12,240) | 10,071 | (7,949) |
Cash flows from investing activities | | | |
Purchase of property and equipment | (5,602) | (1,956) | (3,053) |
Business acquisitions(note 2) | 441 | (17,963) | (2,613) |
| (5,161) | (19,919) | (5,666) |
Change in cash and cash equivalents during the year | – | – | – |
Cash and cash equivalents – beginning and end of year | – | – | – |
Cash paid during the year | | | |
Interest on bank operating loan | 1,001 | 1,999 | 2,632 |
Interest on obligations under capital lease | 30 | 32 | 29 |
Income taxes | 6,594 | 9,375 | 18,804 |
See accompanying notes to these consolidated financial statements.
Notes to Consolidated Financial Statements
December 31, 2008, 2007 and 2006
(tabular amounts in thousands of Canadian dollars, except share and per share amounts)
1.
ACCOUNTING POLICIES
Generally accepted accounting principles
The consolidated financial statements of the Company have been prepared in accordance with accounting principles generally accepted in Canada. These principles differ in certain respects from accounting principles generally accepted in the United States (“U.S.”). The material differences that affect the Company’s consolidated financial statements are described in note 16.
Use of estimates
The preparation of the consolidated financial statements in conformity with generally accepted accounting principles requires management to make estimates and assumptions that affect the reported amounts of assets and liabilities and disclosure of contingent assets and liabilities at the dates of the consolidated financial statements and the reported amounts of sales and expenses during the reporting periods.
Management believes the most significant estimates and assumptions are associated with the valuation of accounts receivable, inventories, future tax assets (liability), and goodwill. If the underlying estimates and assumptions, upon which the consolidated financial statements are based, change in future periods, actual amounts may differ from those included in the accompanying consolidated financial statements.
Basis of presentation
The consolidated financial statements include the accounts of the Company and its wholly owned subsidiaries. The accounting principles applied are consistent with those set out in the Company’s annual consolidated financial statements for the year ended December 31, 2007 except as noted below. All significant transactions and balances between the Company and its subsidiaries have been eliminated on consolidation.
Change in accounting policies
Effective January 1, 2008 the Company adopted Section 1400 – Assessing Going Concern. The Standard was amended to include requirements for management to assess and disclose an entity’s ability to continue as a going concern. Management has reviewed the guidance in section 1400 and determined that no material uncertainties exist with respect to the Company’s ability to continue as a going concern.
Effective January 1, 2008, the Company adopted Section 1535 – Capital Disclosures, Section 3862 – Financial Instruments – Disclosures and Section 3863 – Financial Instruments – Presentation. The standards establish presentation guidelines for financial instruments and deal with their classification, as well as providing readers of the financial statements with information pertinent to the Company’s objectives, policies and processes for managing capital.
Effective January 1, 2008, the Company adopted Section 3031 – Inventories. The standard establishes the accounting treatment for inventories and provides guidance on the determination of cost and subsequent recognition of expenses. The adoption of Section 3031 did not impact the determination of inventory costs and expense recorded by the Company. Inventories consisting primarily of goods purchased for resale are valued at the lower of average cost or net realizable value. Inventory obsolescence expense was charged to cost of sales in the year ending December 31, 2008 of $1,366,000 (2007 - $575,000; 2006 - $312,000). As at December 31, 2008 and December 31, 2007, the Company had recorded reserves for inventory obsolescence of $2.8 million and $1.8 million respectively.
Cash and cash equivalents
Cash and cash equivalents consists of cash on hand and investments in highly liquid instruments with maturities of 90 days or less on the date acquired.
Allowance for doubtful accounts
The Company maintains an allowance for doubtful accounts to provide for receivables which may ultimately be uncollectible. Reserves are determined in light of a number of factors including customer specific conditions, economic events and the Company’s historical loss experience. As at December 31, 2008 and 2007, the allowance for doubtful accounts was $2.8 million and $1.5 million, respectively.
Inventories
Inventories, consisting primarily of goods purchased and held for resale, are valued at the lower of average cost or net realizable value. The reversal of any write down of inventory arising from an increase in net realizable value, shall be recognized as a reduction in obsolescence expense in the period in which the reversal occurred.
Property and equipment
Property and equipment are recorded at cost less related accumulated amortization. The Company provides for amortization of property and equipment using rates as follows:
| | |
Buildings | 5% to 10% | straight line |
Leasehold improvements | over the term of the lease | straight line |
Computer equipment and software | 15% to 33% | straight line |
Equipment and machinery | 10% to 100% | straight line |
Furniture and office equipment | 15% to 20% | straight line |
Automotive equipment | 30% | straight line |
Assets held under capital lease are amortized by the straight-line method over the term of the lease or the estimated useful life of the assets; whichever is shorter.
Goodwill
In accordance with Canadian GAAP, the Company is required to perform an annual goodwill impairment evaluation. The Company evaluates goodwill impairment at the consolidated level as it operates through a single operating segment. The impairment evaluation involves comparing the estimated fair value of the Company’s business to its carrying amount to determine if a write down to fair value is required. Fair value is estimated using future cash flow projections, discounted to their present value and earnings and cash flow multiples for comparable public energy service and distribution companies. The required valuation methodology and underlying financial information that is used to determine fair value require significant judgments to be made by management. These judgments include, but are not limited to, long term projections of future financial performance and the selection of ap propriate discount rates used to determine the present value of future cash flow and may be impacted by changes in oil and gas industry conditions. Changes in such estimates or the application of alternative assumptions could produce significantly different results.
Revenue recognition
The Company’s revenue, which is comprised of product sales, is generally subject to contractual arrangements, which specify price and general terms and conditions. The Company recognizes product sales when title and the related risk of loss transfers to its customers.
Vendor rebates
Vendor rebates consist of volume discount incentives earned from the purchase of selected products during the year from specified vendors. These discounts are based on contractual agreements with the vendors which outline price, volume and general terms and conditions. The Company recognizes vendor rebates as a reduction to inventory and related cost of sales when earned.
Stock options
The Company operates a stock option plan that is described in Note 8(b). As of January 1, 2003, the Company adopted prospectively, the fair value method of accounting for common share options granted. Under this method, the Company recognizes a compensation expense based on the fair value of the options on the date of grant which is determined by using the Black-Scholes options pricing model. The fair value of the options is recognized over the vesting period of the options granted as compensation expense and contributed surplus. The contributed surplus balance is reduced as options are exercised and the amount initially recorded for the options in contributed surplus is credited to capital stock.
Other stock-based compensation
Restricted share units (“RSU”) and Deferred share units (“DSU”) are granted which entitle the participant, at the Company’s option, to receive either a common share or cash equivalent in exchange for a vested unit. The vesting period for RSU’s is one third per year over the three year period from the grant date. There are no additional performance based conditions associated with the vesting of the units. DSU’s vest on the date of grant. Compensation expense related to the units granted is recognized over the vesting period based on the fair value of the units, calculated using a 10 day weighted average stock price, at the date of the grant and is recorded to contributed surplus. The contributed surplus balance is reduced as the vested units are settled.
Foreign currency translation
Monetary assets and liabilities are translated into Canadian dollars at year-end exchange rates and gains or losses from translation are recognized in the Consolidated Statements of Operations. Sales and expenses are translated at the exchange rate prevailing on the date the transaction occurs.
Financial instruments
The Company measures financial instruments at estimated fair value. Financial assets and liabilities are categorized as “loans and receivables”, consisting of accounts receivable, and “other financial liabilities” consisting of accounts payable and accrued liabilities, bank operating loan, long term debt and obligations under capital leases.
Derivative instruments
In the normal course of business, the Company enters into foreign currency forward exchange contracts with financial institutions to fix the value of liabilities or future commitments. These foreign currency exchange contracts are not designated as hedges for accounting purposes. The values of contracts are marked to market and the change in value is recognized in the Consolidated Statements of Operations.
Income taxes
The Company uses the liability method of accounting for income taxes under which future tax assets and liabilities are recognized when there are differences between the financial statement carrying amounts of existing assets and liabilities and their respective tax basis. Future tax assets and liabilities are measured using substantively enacted tax rates in effect in the period in which those temporary differences are expected to be recovered or settled. The effect on future tax assets and liabilities of a change in tax rates is recognized as part of the provision for income taxes in the period that includes the enactment date.
Earnings per share
Earnings per share are computed based on the weighted average basic number of shares outstanding for the period. Diluted earnings per share have been calculated using the treasury stock method, whereby diluted earnings per share are calculated as if options, RSU’s and DSU’s were exercised at the beginning of the year and funds received were used to purchase the Company’s common shares on the open market at the average price for the year.
Recent Canadian GAAP pronouncements
(i)
CICA 3064 – Goodwill and intangible assets
This standard addresses the accounting treatment of internally developed intangibles and the recognition of such assets. The Company believes that the adoption of this standard will not have a material impact on its financial statements. This section applies to interim and annual financial statements relating to fiscal years beginning on or after January 1, 2009.
Recent US GAAP pronouncements
(i)
FAS141(A) – Business combinations
This statement sets out to improve the relevance, representational faithfulness, and comparability of the information that a reporting entity provides in its financial reports about a business combination and its effects. This statement applies prospectively to business combinations for which the acquisition date is on or after the beginning of the first annual reporting period beginning on or after December 15, 2008. The Company believes that this will have minimal effect on its financial statements, but will reassess if and when future business combinations occur.
(ii)
FAS 160 – Non controlling interests in consolidated financial statements
The objective of this statement is to improve the relevance, comparability and transparency of the financial information that a reporting entity provides in its consolidated financial statements by establishing accounting and reporting standards. This statement will be applied prospectively as of the beginning of the fiscal year in which the statement is initially applied. This statement is effective for fiscal years, beginning on or after December 15, 2008. The Company believes that this will have minimal effect on its financial statements.
(iii)
FAS 161 – Disclosures about derivative instruments and hedging activities
The objective of this statement is to revise disclosure requirements for derivative instruments and hedging activities. This statement is effective for fiscal years, beginning after November 15, 2008 and interim periods within those years. The Company believes that this statement will have minimal effect on financial statements, as it does not enter into hedging relationships.
2.
BUSINESS ACQUISITIONS
During 2008, post closing adjustments were concluded for both the purchase of Full Tilt Field Services Ltd (“Full Tilt”) and JEN Supply Ltd. (“JEN Supply”), resulting in a net cash inflow of $441,000.
On December 3, 2007, the Company acquired the outstanding shares of JEN Supply, an oilfield equipment distributor operating in east-central Alberta, for total consideration of $12.6 million of which $12.0 million was paid in cash, subject to post closing adjustments. The remaining consideration of $0.5 million is repayable in five years and bears interest at the bank prime rate. Additional consideration of up to $2.5 million is contingently payable over a two year period to the extent that revenues from existing JEN Supply customers exceed specified annual amounts. There were no additional payments owing at December 31, 2008. Any future contingent payments will be accounted for as additional consideration as the amount become payable with a corresponding increase to goodwill.
On July 1, 2007, the Company purchased the outstanding shares of Full Tilt, for total consideration of $3.4 million, subject to post closing adjustments.
On January 31, 2007, the Company purchased the assets of an agent that operated two of the Company’s branch locations, for total consideration of $2.2 million.
Using the purchase method of accounting for acquisitions, the Company consolidated the assets and liabilities from the acquisitions and included earnings as of the closing dates. The consideration paid for acquisitions closed in 2007 has been allocated as follows:
| | | | | |
| 2007 |
| Acquisition of JEN Supply | Acquisition of Full Tilt | Acquisition of Agent | Contingent consideration | Total 2007 |
Cash consideration paid | 12,000 | 3,400 | 2,167 | 210 | 17,777 |
Transaction costs | 139 | 47 | – | – | 186 |
Total cash consideration | 12,139 | 3,447 | 2,167 | 210 | 17,963 |
Long term debt issued | 500 | – | – | – | 500 |
Total consideration | 12,639 | 3,447 | 2,167 | 210 | 18,463 |
Net assets acquired | | | | | |
Accounts receivable | 5,438 | 1,970 | – | – | 7,408 |
Inventory | 2,596 | 371 | – | – | 2,967 |
Other current assets | 46 | 14 | – | – | 60 |
Property, equipment and other | 805 | 292 | 167 | – | 1,264 |
Goodwill | 5,724 | 2,110 | 2,000 | 210 | 10,044 |
Accounts payable | (1,970) | (1,310) | – | – | (3,280) |
| 12,639 | 3,447 | 2,167 | 210 | 18,463 |
3.
PROPERTY AND EQUIPMENT
| | | | | | |
| 2008 | 2007 |
As at December 31 | Cost | Accumulated Amortization | Net | Cost | Accumulated Amortization | Net |
Land, buildings and leasehold improvements | 9,958 | 4,280 | 5,678 | 6,234 | 3,690 | 2,544 |
Computer equipment and software | 20,488 | 19,059 | 1,429 | 21,444 | 20,084 | 1,360 |
Equipment and machinery | 5,733 | 4,987 | 746 | 6,050 | 4,868 | 1,182 |
Furniture and office equipment | 3,173 | 1,937 | 1,236 | 2,273 | 1,580 | 693 |
Automotive equipment | 689 | 250 | 439 | 693 | 74 | 619 |
| 40,041 | 30,513 | 9,528 | 36,694 | 30,296 | 6,398 |
Included in computer equipment and software at December 31, 2008 are leased assets with a cost of $0.2 million (2007 – $1.1 million) and related amortization of $0.2 million (2007-$0.9 million).
4.
CAPITAL MANAGEMENT
The Company’s primary source of capital is its shareholders equity and cash flow from operating activities before net changes in non-cash working capital balances. The Company augments these capital sources with a $60 million, 364 day bank operating loan facility which is used to finance its net working capital and general corporate requirements. The bank operating facility is arranged through a syndicate of three banks and matures in July 2009.
5.
BANK OPERATING LOAN
The maximum amount available under this facility is subject to a borrowing base formula applied to accounts receivable and inventories, and a covenant restricting the Company’s average debt to 2.25 times trailing 12 months earnings before interest, amortization and taxes. As at December 31, 2008, this ratio was 0.7 times (December 31, 2007 - 1.7 times) and the maximum available under this facility, was $60.0 million (2007 – $60.0 million). A decline in profitability could limit the amount the company may borrow under the facility. While management believes the facility will be adequate to fund its anticipated contractual commitments, there can be no assurance that additional credit will become available if required, that an appropriate amount of credit with comparable terms and conditions will become available when the facility matures.
The facility is collateralized by a general security agreement covering all present and after-acquired property of the Company including accounts receivable, inventories and property and equipment.
This facility contains certain other restrictive covenants. As at December 31, 2008, the Company was in compliance with all covenants under its loan facility agreement.
6.
LONG-TERM DEBT AND OBLIGATIONS UNDER CAPITAL LEASES
| | |
| 2008 | 2007 |
Agent Acquisition (a) | – | 599 |
Obligations under Capital Lease (b) | 9 | 288 |
JEN Supply debt (c) | 500 | 500 |
Total long-term obligation | 509 | 1,387 |
Less current portion | (9) | (805) |
Long-term debt and obligation under capital leases | 500 | 582 |
(a)
The loan was unsecured and bore no interest and was repaid in 2008. The effective interest rate on the loan was 5.65% due to the discount applied on the initial recording of the loan.
(b)
Capital leases bear interest at various rates of up to 8% (2007 – 8%) and are collateralized by the underlying assets.
(c)
The JEN Supply debt was issued as part of the acquisition consideration (see note 2). The deferred consideration is unsecured and bears interest based on the floating Canadian bank prime rate and is repayable in 2012.
7.
COMMITMENTS AND CONTINGENCIES
a)
The following table outlines the Company’s contractual obligations for debt, lease and related obligations, having initial terms in excess of one year. Obligations due over the next five years and thereafter are as follows:
| | | | | |
Period Due | Bank operating loan(note 5) | Long term debt and capital lease obligations (note 6) | Operating lease commitments (b) | U.S.$ forward purchase contracts | Total |
(000’s) | | | | | |
2009 | 34,948 | – | 7,338 | 2,000 | 44,286 |
2010 | – | – | 7,176 | – | 7,176 |
2011 | – | – | 6,234 | – | 6,234 |
2012 | – | 500 | 5,681 | – | 6,181 |
2013 | – | – | 5,178 | | 5,178 |
thereafter | – | – | 29,872 | – | 29,872 |
| 34,948 | 500 | 61,479 | 2,000 | 98,927 |
b)
The Company leases certain office, warehouse and store facilities and automobiles under long-term operating leases. Future operating lease commitments include commitments aggregating $6.6 million over a 10 year period commencing in 2009 related to the lease of a branch location from an employee. Rental terms under the lease commitment are at market rates.
c)
The Company is involved in various lawsuits, the losses from which, if any, are not anticipated to be material to the consolidated financial statements.
8.
CAPITAL STOCK
a)
The Company has authorized an unlimited number of common shares with no par value.
b)
The Board of Directors may grant options to purchase common shares to substantially all employees, officers and directors and to persons or corporations who provide management or consulting services to the Company. The exercise period and the vesting schedule after the grant date are not to exceed 10 years.
Option activity for each of the years ended December 31 was as follows:
| | | | | | |
| 2008 | 2007 | 2006 |
| Number of Options (000’s) | Weighted average exercise price per share | Number of Options (000’s) | Weighted average exercise price per share | Number of Options (000’s) | Weighted average exercise price per share |
Outstanding – beginning of year | 1,262 | 5.78 | 804 | 3.59 | 1,295 | 3.65 |
Granted | 75 | 6.26 | 646 | 7.90 | – | 0.00 |
Exercised | (13) | 3.85 | (177) | 3.24 | (443) | 3.75 |
Forfeited | (30) | 7.28 | (12) | 10.18 | (48) | 3.78 |
Outstanding – end of year | 1,294 | 5.80 | 1,262 | 5.78 | 804 | 3.59 |
Exercisable – end of year | 822 | 4.88 | 590 | 4.11 | 596 | 3.24 |
A summary of stock options outstanding at December 31, 2008 is set out below:
| | | | | |
Outstanding stock options (000’s) | Exercisable stock options |
Range of Exercise price | Number | Weighted average remaining contractual life | Weighted average exercise price | Number | Weighted average exercise price |
$2.70 to $3.50 | 356 | 1.5 years | 3.02 | 356 | 3.02 |
$4.60 to $6.50 | 735 | 5.0 years | 5.82 | 371 | 5.20 |
$10.30 to $10.90 | 203 | 8.4 years | 10.58 | 95 | 10.67 |
| 1,294 | 4.5 years | 5.80 | 822 | 4.88 |
The non cash stock option compensation expense recorded in 2008 was $843,000 (2007 – $528,000; 2006 – $529,000). The fair value of common share options granted during year ended December 31, 2008 was $274,000 (December 31, 2007 - $2,242,000) and was estimated as at the grant date using the Black-Scholes option-pricing model, using the following assumptions: Options vest one third or one fourth per year from the date of grant.
| | | |
| 2008 | 2007 | 2006 |
Dividend yield | Nil | Nil | Nil |
Risk-free interest rate | 3.88% | 3.93% | 4.08% |
Expected life | 5 years | 5 years | 5 years |
Expected volatility | 50% | 50% | 56% |
c)
For stock options issued prior to January 1, 2003 the Company applied the intrinsic method of accounting for common share options. Accordingly, no compensation expense has been recognized in the Statements of Operations. Had the Company adopted the fair value based method of accounting, the amount expensed in each period would be the fair value of the options, calculated using the Black-Scholes options-pricing model and net of options forfeited in the period, amortized over the expected life of the options. The proforma net income and proforma net income per share attributable to common shareholders of the Company would be as follows:
| | | |
| 2008 | 2007 | 2006 |
Net and comprehensive income | | | |
As reported | 21,747 | 13,567 | 22,939 |
Compensation expense related to stock options
issued prior to 2003 | – | – | 196 |
Proforma | 21,747 | 13,567 | 22,743 |
Net income per share | | | |
Basic | | | |
As reported | 1.19 | 0.74 | 1.27 |
Proforma | 1.19 | 0.74 | 1.26 |
Diluted | | | |
As reported | 1.17 | 0.72 | 1.22 |
Proforma | 1.17 | 0.72 | 1.21 |
d)
Effective May 2, 2006, the Company adopted the Restricted Share Unit (“RSU”) and Deferred Share Unit (“DSU”) plans approved by shareholders on that date (collectively the “RSU Plans”). Under the RSU plans, RSU’s and DSU’s are granted which entitle the participant, at the Company’s option, to receive either a common share or cash equivalent in exchange for a vested unit. RSU’s are granted to the Company’s officers and employees and vest one third per year over the three year period from the date of grant. DSU’s, are granted to the independent members of the Company’s Board of Directors (“Board”), vest on the date of grant, and can only be redeemed when the Director resigns from the Board. Compensation expense related to the units granted is recognized over the vesting pe riod based on the fair value of the units at the date of the grant and is recorded to contributed surplus. The contributed surplus balance is reduced as the vested units are settled. For 2008, the fair value of the RSU and DSU units granted was $279,000 (2007 - $802,000; 2006 - $2,394,000) and $521,000 of compensation expense was recorded (2007 - $1,396,000; 2006 - $1,703,000).
RSU Plan activity for the years ended December 31, 2008, 2007 and 2006 were as follows:
| | | | | | |
| 2008 | 2007 | 2006 |
| Number of Units | Number of Units | Number of Units |
(in 000’s) | RSU | DSU | RSU | DSU | RSU | DSU |
Outstanding at January 1 | 178 | 37 | 120 | 12 | – | – |
Granted | 1 | 33 | 78 | 25 | 120 | 12 |
Exercised | (11) | – | (10) | – | – | – |
Forfeited | (7) | – | (10) | – | – | – |
Outstanding at December 31 | 161 | 70 | 178 | 37 | 120 | 12 |
The Company has established an independent trust to purchase common shares of the Company on the open-market to satisfy performance share unit obligations. The trust is considered to be a variable interest entity and is consolidated in the Company’s financial statements with the cost of the shares held in trust reported as a reduction to capital stock. During 2008, 300,095 common shares were purchased by the trust (2007 – 40,200 common shares; 2006 - Nil) at an average cost of $6.86 per share (2007 - $8.08 per share). As at December 31, 2008, the trust held 343,892 shares (2007 – 54,551).
e)
Reconciliation of Weighted Average Number of Diluted Common Shares Outstanding (000’s)
| | | |
As at December 31 | 2008 | 2007 | 2006 |
Weighted average common shares outstanding - basic | 18,255 | 18,337 | 18,099 |
Effect of Stock options and RSU Plans | 306 | 470 | 625 |
Weighted average common shares outstanding - diluted | 18,561 | 18,807 | 18,724 |
f)
On January 6, 2009, the Company announced a normal course issuer bid to purchase for cancellation, up to 900,000 common shares representing approximately 5% of its outstanding common shares.
9.
NET CHANGE IN NON-CASH WORKING CAPITAL BALANCES RELATED TO OPERATIONS
| | | |
For the years ended December 31 | 2008 | 2007 | 2006 |
Accounts receivable | (10,997) | 5,633 | 8,978 |
Inventories | (33,138) | 12,974 | (18,019) |
Other current assets | (6,619) | 79 | 33 |
Accounts payable and accrued liabilities | 38,128 | (25,214) | 1,815 |
Income taxes payable | 4,253 | (1,667) | (7,021) |
| (8,373) | (8,195) | (14,214) |
10.
INCOME TAXES
a)
Reconciliation of the income tax provision.
The difference between the income tax provision recorded and the provision obtained by applying the combined federal and provincial statutory rates is as follows:
| | | | | | |
For the Years Ended December 31 | 2008 | % | 2007 | % | 2006 | % |
Income before income taxes | 32,442 | | 20,865 | | 34,597 | |
Income taxes calculated at statutory rates | 9,700 | 29.9 | 6,807 | 32.6 | 11,459 | 33.1 |
Non-deductible items | 899 | 2.8 | 434 | 2.1 | 410 | 1.2 |
Effect of reduction in tax rates on future tax asset (liability) | 158 | 0.5 | 82 | 0.4 | 120 | 0.3 |
Adjustments of filing prior year returns | (97) | (0.3) | (67) | (0.3) | (343) | (1.0) |
Capital and large corporations taxes | 56 | 0.2 | 44 | 0.2 | 59 | 0.2 |
Other | (21) | (0.1) | (2) | 0.0 | (47) | (0.1) |
| 10,695 | 33.0 | 7,298 | 35.0 | 11,658 | 33.7 |
As at December 31, 2007, included in other current assets are income taxes receivable of $848,000.
b)
Significant components of future income tax assets and liabilities are as follows:
| | |
As at December 31 | 2008 | 2007 |
Assets | | |
Property and equipment | 855 | 874 |
Restricted Stock Unit expense | 289 | 648 |
Other | 395 | 241 |
| 1,539 | 1,763 |
Liabilities | | |
Goodwill and other | 353 | 360 |
Net future income tax asset | 1,186 | 1,403 |
The Company believes it is more likely than not that all future income tax assets will be realized.
11.
RELATED PARTIES
Smith owns approximately 54% of the Company’s outstanding shares. The Company is the exclusive distributor in Canada of down hole pump production equipment manufactured by Wilson Supply, a division of Smith. Purchase of such equipment conducted in the normal course on commercial terms were as follows:
| | | |
(in thousands of Canadian dollars) | | | |
For the years ended December 31 | 2008 | 2007 | 2006 |
Cost of sales | 10,680 | 9,253 | 8,943 |
Inventory | 4,549 | 4,295 | 3,767 |
Accounts payable and accrued liabilities | 759 | 313 | 1,076 |
12.
FINANCIAL INSTRUMENTS
a)
Fair values
The Company’s financial instruments recognized on the consolidated balance sheet consist of accounts receivable, accounts payable and accrued liabilities, bank operating loan, long term debt and obligations under capital leases. The fair values of these financial instruments, excluding the bank operating loan, long term debt and obligations under capital leases, approximate their carrying amounts due to their short- term maturity. At December 31, 2008, the fair value of the bank operating loan, long term debt and obligations under capital leases approximated their carrying values due to their floating interest rate nature and short term maturity
b)
Credit risk
A substantial portion of the Company’s accounts receivable balance is with customers within the oil and gas industry and is subject to normal industry credit risks. The Company follows a program of credit evaluations of customers and limits the amount of credit extended when deemed necessary. The aging of the trade receivable is a follows:
| | |
| Dec. 31, 2008 | Dec. 31, 2007 |
Current | 42,279 | 43,723 |
Less than 60 days overdue | 44,760 | 29,065 |
Greater than 60 days overdue | 8,892 | 6,268 |
Trade accounts receivable | 95,931 | 79,056 |
Other accounts receivable | 7,358 | 11,703 |
Less allowance for credit losses | (2,776) | (1,454) |
Total accounts receivable | 100,513 | 89,305 |
The Company maintains provisions for possible credit losses that are charged to selling, general and administrative expenses by performing an analysis of specific accounts. Movement of the allowance for credit losses is as follows:
| | |
| Dec. 31, 2008 | Dec. 31, 2007 |
Opening balance | 1,454 | 682 |
Write offs | (984) | – |
Increase during period | 2,306 | 772 |
Closing balance | 2,776 | 1,454 |
c)
Market Risk
The company is exposed to market risk from changes in the Canadian prime interest rate which can impact its borrowing costs. The Company purchases certain products in US dollars and sells such products to its customers typically priced in Canadian dollars. As a result, fluctuations in the value of the Canadian dollar relative to the US dollar can result in foreign exchange gains and losses.
d)
Risk management
From time to time the Company enters into foreign exchange forward contracts to manage its foreign exchange market risk by fixing the value of its liabilities and future commitments. The Company’s foreign exchange risk arises principally from the settlement of United States dollar dominated net working capital balances as a result of product purchases denominated in United States dollars. As at December 31, 2008 the Company had contracted to purchase US$2 Million at fixed exchange rates with terms not exceeding six months. The fair market values of the contract is nominal
13.
ECONOMIC DEPENDENCY
In respect of the Company’s sales, 10% (2007 – 11%; 2006 – 11%) is derived from sales to one customer.
In respect of the Company’s purchases, 27% (2007 – 28%; 2006 – 30%) are derived from product purchased from two suppliers.
14.
DEFINED CONTRIBUTION PENSION PLAN
The Company contributes amounts based on employee salaries to a maximum of 6% (6% in 2007; 6% in 2006) and the amount deductible under the Income Tax Act, to employees registered retirement savings plans. Contributions in respect of this plan incurred and paid during the year were $683,000 (2007 – $737,000; 2006 – $673,000).
15.
SEGMENT REPORTING
The Company distributes oilfield equipment products principally through its network of 44 branches located in western Canada to oil and gas industry customers. Accordingly, the Company has determined that it operates through a single operating segment and geographic jurisdiction.
16.
RECONCILIATION OF CANADIAN AND UNITED STATES GENERALLY ACCEPTED ACCOUNTING PRINCIPLES (GAAP)
These consolidated financial statements have been prepared in accordance with Canadian GAAP. The Company’s accounting policies are consistent with U.S. GAAP with the following exceptions:
a)
Statement of Operations
| | | |
For the years ended December 31 | 2008 | 2007 | 2006 |
Net income for the year under Canadian GAAP | 21,747 | 13,567 | 22,939 |
Share based compensation expense (b)(iii) | – | – | (196) |
Net income for the year under U.S. GAAP | 21,747 | 13,567 | 22,743 |
Net income per share under US GAAP | | | |
Basic | 1.19 | 0.74 | 1.26 |
Diluted | 1.17 | 0.72 | 1.21 |
b)
Statements of Changes in Shareholders’ Equity
| | | |
As at December 31 | 2008 | 2007 | 2006 |
Shareholders’ equity under Canadian GAAP | 139,323 | 118,220 | 102,475 |
Restructuring provision adjustment (i) | (324) | (324) | (324) |
Benefit of deferred tax assets applied to goodwill (ii) | (1,058) | (1,058) | (1,058) |
Share based compensation expense (iii) | – | – | – |
Shareholders’ equity under U.S. GAAP | 137,941 | 116,838 | 101,093 |
i)
The restructuring provision adjustment relates to a 1995 transaction where restructuring expenditures were recorded in the purchase equation as goodwill under Canadian GAAP but were expensed in the statement of operations for U.S. GAAP.
ii)
In 1996, the Company realized the benefit of certain deferred tax assets on which a 100% valuation provision had been recorded in 1995. This benefit was recorded as a reduction of goodwill for U.S. GAAP.
iii)
Under Canadian GAAP, it is permissible to use the intrinsic method to account for stock options issued prior to January 1, 2003. As a result, no compensation expense was recorded in the statement of operations for stock options issued prior to January 1, 2003. Commencing in 2006 U.S. GAAP compensation expense must be recognized in the current year earnings for all stock options issued and the restatement of prior year earnings is not required. The fair value of the stock options issued prior to January 1, 2003 was calculated using the Black-Scholes options-pricing model. As at December 31, 2008, all stock options issued prior to January 1, 2003 were fully vested and recognized under the modified prospective application of U.S. GAAP.
c)
Balance Sheets
The following table indicates the restated amounts for the items in the Balance Sheets of the Company that would be affected had the consolidated financial statements been prepared in accordance with U.S. GAAP.
| | |
As at December 31 | 2008 | 2007 |
Goodwill (b)(i) and (b)(ii) | 19,188 | 19,141 |
Contributed surplus (b)(iii) | 19,031 | 17,867 |
Retained earnings (b)(i), (b)(ii) and (b)(iii) | 96,412 | 74,665 |
The following table indicates additional disclosure required had the consolidated financial statements been prepared in accordance with U.S. GAAP.
| | |
As at December 31 | 2008 | 2007 |
Trade payables | 27,522 | 9,571 |
Accrued liabilities | 49,505 | 33,832 |
Accrued compensation expense | 6,222 | 1,404 |
Total accounts payable and accrued liabilities | 83,249 | 44,807 |
d)
Statements Of Cash Flows
Under U.S. GAAP, the disclosure of total cash flows from operating activities prior to changes in non-cash working capital balances related to operations is not permitted.
Five Years of Financial Data
| | | | | |
(in millions of Cdn dollars, except statistics and per share amounts) | 2008 | 2007 | 2006 | 2005 | 2004 |
Sales | 547.4 | 466.3 | 555.2 | 484.2 | 339.7 |
Gross Profit | 107.7 | 84.6 | 103.5 | 91.3 | 60.2 |
% of Sales | 19.7 | 18.1% | 18.6% | 18.9% | 17.8% |
Other Expenses (Income) | | | | | |
Selling, General & Administrative | 71.6 | 58.1 | 63.3 | 55.3 | 44.3 |
Amortization | 2.4 | 2.8 | 2.8 | 4.4 | 4.3 |
Interest expense | 1.0 | 2.0 | 2.7 | 1.9 | 1.5 |
Foreign exchange loss and other | 0.2 | 0.8 | 0.1 | 0.0 | 0.0 |
Total Other Expenses | 75.2 | 63.7 | 68.9 | 61.6 | 50.1 |
Income before income taxes | 32.4 | 20.9 | 34.6 | 29.7 | 10.1 |
Income tax expense | 10.7 | 7.3 | 11.7 | 10.8 | 4.0 |
Net income | 21.7 | 13.6 | 22.9 | 18.9 | 6.1 |
% of Sales | 4.0% | 2.9% | 4.1% | 3.9% | 1.8% |
Earnings per share | | | | | |
Basic | 1.19 | 0.74 | 1.27 | 1.09 | 0.36 |
Diluted | 1.17 | 0.72 | 1.22 | 1.01 | 0.35 |
EBITDA(1) | 35.8 | 25.7 | 40.1 | 36.0 | 15.9 |
% of Sales | 6.5% | 5.5% | 7.2% | 7.4% | 4.7% |
Current Assets | 229.5 | 179.5 | 187.8 | 180.0 | 131.4 |
Total Assets | 261.4 | 208.7 | 205.4 | 192.5 | 145.5 |
Net Working Capital Current assets less trade accounts payable and other accrued liabilities | 142.8 | 134.7 | 120.2 | 115.1 | 72.8 |
Total Debt
Bank operating loan + long term debt + obligations under capital leases
| 35.5 | 45.7 | 35.4 | 43.8 | 32.2 |
Shareholders’ Equity | 139.3 | 118.2 | 102.5 | 75.9 | 54.1 |
Total Debt to Equity Total debt / total debt plus equity | 20.3% | 27.9% | 25.7% | 36.6% | 37.3% |
Return on Equity Net income / average equity | 16.9% | 12.3% | 25.6% | 29.1% | 12.0% |
(1)See Management’s Discussion and Analysis on page 27 for a detailed description of EBITDA, a non GAAP measure