Exhibit (e)(2)
Excerpts from Cubist Pharmaceutical Inc.’s Definitive Proxy Statement on Schedule 14A related to the 2014 Annual Meeting of Stockholders as filed with the Securities and Exchange Commission on April 21, 2014.
Management Stockholders
The following table sets forth information as of April 8, 2014, as reported to us, with respect to the beneficial ownership of our common stock by our directors and each Named Executive Officer, or NEO, and by all of our current directors and Executive Officers as a group. The term “Executive Officers” means all of our executive officers who are subject to the reporting requirements under Section 16 of the Securities and Exchange Act of 1934, or Securities Exchange Act. Beneficial ownership is determined in accordance with the rules and regulations of the SEC. Except as indicated below and pursuant to applicable community property laws, each stockholder named in the table has sole voting and investment power with respect to the shares set forth opposite such stockholder’s name.
| Amount and Nature of Beneficial Ownership | Total Number | Percentage of Shares Beneficially Owned(2) | ||||||||||||||
Name | Shares Owned | Shares—Right to Acquire(1) | ||||||||||||||
Michael Bonney | 175,901 | 1,064,297 | 1,240,198 | 1.6 | % | |||||||||||
Robert Perez | 46,674 | 425,965 | 472,639 | * | ||||||||||||
Steven Gilman | 27,237 | 237,455 | 264,692 | * | ||||||||||||
David McGirr | 26,810 | 125,618 | 152,428 | * | ||||||||||||
Kenneth Bate | 7,914 | 157,169 | 165,083 | * | ||||||||||||
Michael Wood | 8,310 | 127,332 | 135,642 | * | ||||||||||||
Martin Soeters | 9,293 | 103,832 | 113,125 | * | ||||||||||||
Matthew Singleton | 4,972 | 93,832 | 98,804 | * | ||||||||||||
Leon Moulder, Jr. | 9,098 | 61,665 | 70,763 | * | ||||||||||||
Michael Tomsicek | 4,424 | 58,079 | 62,503 | * | ||||||||||||
Nancy Hutson | 4,847 | 53,832 | 58,679 | * | ||||||||||||
Martin Rosenberg | 6,005 | 50,360 | 56,365 | * | ||||||||||||
Mark Corrigan | 5,498 | 44,832 | 50,330 | * | ||||||||||||
Alison Lawton | 2,714 | 26,972 | 29,686 | * | ||||||||||||
Jane Henney | 2,641 | 25,624 | 28,265 | * | ||||||||||||
Thomas DesRosier | 342 | 22,017 | 22,359 | * | ||||||||||||
Kenneth Martin | 0 | 3,671 | 3,671 | * | ||||||||||||
All directors and Executive Officers as a group (18 persons) | 335,951 | 2,624,977 | 2,960,928 | 3.8 | % | |||||||||||
| * | Less than 1% of the issued and outstanding shares of our common stock. |
| (1) | Represents shares of common stock underlying outstanding stock options that are currently exercisable or exercisable within 60 days of April 8, 2014 and restricted stock units, or RSUs, that will lapse within 60 days of April 8, 2014. |
| (2) | On April 8, 2014, we had 75,298,978 shares of common stock outstanding. In computing percentage ownership of a person, shares of common stock underlying stock options that are currently exercisable or which will become exercisable within 60 days of April 8, 2014 and RSUs that will lapse within 60 days of April 8, 2014 are deemed outstanding. These shares, however, are not deemed outstanding for the purposes of computing the percentage ownership of any other person. |
Director Compensation
Overview
Mr. Bonney and Mr. Perez are each a director and an Executive Officer. Mr. Bonney and Mr. Perez receive no additional compensation for serving on the Board. No other director is an employee of the company.
We compensate our non-employee directors with a combination of cash payments, in the form of annual retainers and Board committee meeting fees, and equity awards in the form of stock options and RSUs. These equity awards align director compensation with the equity compensation we provide to our NEOs. Stock options and RSUs represent a significant portion of director compensation, which aligns director compensation directly with our long-term performance. Stock options are granted to non-employee directors upon election or appointment, as the case may be, and on an annual basis. RSUs are granted on an annual basis. Our Board regularly reviews its performance and the performance of its committees.
The Compensation Committee is responsible for reviewing the compensation of our non-employee directors and making recommendations to the Board about any changes to such compensation. Approximately every two years PM&P provides the Compensation Committee with a competitive assessment of compensation for our non-employee directors by comparing our director compensation programs and the amount of compensation that we pay our non-employee directors to the same peer group companies that we use to benchmark our executive compensation, as described in the CD&A section of this Proxy Statement. The assessment compares the total compensation paid to our non-employee directors by position—Chair, Lead Director (if any), director, committee chairs and committee members—and the components of compensation—retainers, meeting fees and equity compensation—to the compensation paid to directors at our peer group companies. The Compensation Committee evaluates this information and recommends any changes to director compensation to the Board for approval. This process typically results in the total compensation of our non-employee directors approximating the median total compensation paid to non-employee directors at our peer group companies during the first year after the evaluation of director compensation and the total compensation of our non-employee directors being lower than the median total compensation paid to non-employee directors at our peer group companies during the second year after the evaluation of director compensation.
In September 2013, as a result of the review and analysis described above, the Board approved changes to the compensation to be paid to our non-employee directors, as described in this section, in order to align our directors’ compensation more closely with the compensation paid to directors at our peer group companies.
Retainers
We pay our non-employee directors an annual retainer on the date of our Annual Meeting of Stockholders for their service on the Board for the period since the previous Annual Meeting of Stockholders. The annual retainer is payable in arrears on a pro-rata basis based on the number of months that the director was a director or non-executive Chair during this period. Retainers are paid in cash or our common stock, at the director’s election. The retainer for the period from our 2012 Annual Meeting of Stockholders to the 2013 Annual Meeting was paid on the date of the 2013 Annual Meeting. The retainer for the period from the 2013 Annual Meeting to the 2014 Annual Meeting will be paid on the date of the 2014 Annual Meeting. These annual retainers are paid in lieu of Board meeting fees.
The annual retainer payable to our non-executive Chair is $70,000. The Board increased the annual retainer that will be payable to our other non-employee directors at the 2014 Annual Meeting from $50,000 to $60,000. Mr. Bate, who served as our non-executive Chair, was paid a $70,000 retainer on the date of the 2013 Annual Meeting. Our other then-serving non-employee directors were each paid a $50,000 retainer at the 2013 Annual Meeting.
Meeting Fees
We do not compensate our non-employee directors for attending individual meetings of the Board on a per-meeting basis. Non-chair members of the Audit Committee are paid $2,000 for each Audit Committee meeting attended, whether in person or by phone, and the chair of the Audit Committee is paid $4,000 for each Audit Committee meeting led. Non-chair members of each other Board committee are paid $1,500 for each Board committee meeting attended, whether in person or by phone, and the chairs of such Board committees are paid $3,500 for each Board committee meeting led.
Equity Awards
Equity awards to our non-employee directors are made under our 2012 Plan. If the 2014 Plan is approved by our stockholders at the 2014 Annual Meeting, future equity awards to our non-employee directors will be made under that plan and no more equity awards will be made under the 2012 Plan. All options granted to non-employee directors have an exercise price equal to the closing price of our common stock on the grant date.
In September 2013, the Board increased the fair value of the initial stock option award that we grant to our newly-elected or appointed non-employee directors upon first joining the Board from $150,000 to $250,000. As a result, each non-employee director is entitled to an automatic grant of a stock option award with a fair value on the grant date of $250,000, calculated using the Black-Scholes option-pricing model in accordance with ASC Topic 718, which vests quarterly in equal installments over a three-year period beginning on the grant date. In accordance with this practice, upon appointment to the Board in September 2013, we granted Mr. Martin a stock option to purchase 14,686 shares of common stock with an exercise price of $64.34, the closing price of our common stock on the grant date.
On the date of our 2013 Annual Meeting, our then-serving non-employee directors (other than the non-executive Chair) automatically received an annual long-term equity award with a target value of $185,000 comprised of (i) a stock option with a fair value on the date of our Annual Meeting, calculated using the Black-Scholes option-pricing model in accordance with ASC Topic 718, of $129,500 and (ii) RSUs with a fair value on the date of our Annual Meeting of $55,500. As of our 2013 Annual Meeting, Mr. Bate, our non-executive Chair, automatically received an annual long-term equity award with a target value of $285,000, comprised of (i) a stock option with a fair value on the date of the Annual Meeting of $199,500 and (ii) RSUs with a fair value on the date of our Annual Meeting of $85,500. These equity awards vest 100% on the earlier of the first anniversary of the grant date and the date of our 2014 Annual Meeting.
As a result, on June 12, 2013, the day of the 2013 Annual Meeting, we made the following annual stock option and RSU awards to our non-employee directors:
Director | Number of Shares Subject to Option Awards (#) | Exercise Price of Option Awards ($) | Number of Shares Subject to Stock Awards (#) | Grant Date Fair Value of Shares Underlying Stock Awards ($) | ||||||||||||
Kenneth Bate | 12,895 | 50.24 | 1,701 | 50.24 | ||||||||||||
Mark Corrigan | 8,370 | 50.24 | 1,104 | 50.24 | ||||||||||||
Jane Henney | 8,370 | 50.24 | 1,104 | 50.24 | ||||||||||||
Nancy Hutson | 8,370 | 50.24 | 1,104 | 50.24 | ||||||||||||
Alison Lawton | 8,370 | 50.24 | 1,104 | 50.24 | ||||||||||||
Leon Moulder, Jr. | 8,370 | 50.24 | 1,104 | 50.24 | ||||||||||||
Martin Rosenberg | 8,370 | 50.24 | 1,104 | 50.24 | ||||||||||||
Matthew Singleton | 8,370 | 50.24 | 1,104 | 50.24 | ||||||||||||
Martin Soeters | 8,370 | 50.24 | 1,104 | 50.24 | ||||||||||||
Michael Wood | 8,370 | 50.24 | 1,104 | 50.24 | ||||||||||||
In September 2013, the Board increased the target value of the annual long-term equity awards that we grant to our then-serving non-employee directors, other than our non-executive Chair, to $225,000 and changed the composition of value of the annual long-term equity awards that we grant to all our then-serving non-employee
directors, including our non-executive Chair, to 50% stock options and 50% RSUs. As a result, as of the date of our 2014 Annual Meeting, provided that he or she is still serving as a director on the close of business on that date, each of our non-employee directors, other than our non-executive Chair, will each automatically receive an annual long-term equity award with a target value of $225,000, comprised of (i) a stock option with a fair value on the date of our Annual Meeting, calculated using the Black-Scholes option-pricing model in accordance with ASC Topic 718, of $112,500 and (ii) RSUs with a fair value on the date of our Annual Meeting of $112,500. Because Dr. Rosenberg, Mr. Singleton and Dr. Wood have decided not to stand for re-election to the Board and each intends to resign effective as of immediately prior to the 2014 Annual Meeting, they will not receive an annual long-term equity award as of our 2014 Annual Meeting date. As of the date of our 2014 Annual Meeting, provided that he is still serving as a director on the close of business on such date, Mr. Bate, our non-executive Chair, will automatically receive an annual long-term equity award with a target value of $285,000, comprised of (i) a stock option with a fair value on the date of the Annual Meeting of $142,500 and (ii) RSUs with a fair value on the date of our Annual Meeting of $142,500. These equity awards vest 100% on the earlier of the first anniversary of the grant date and the date of our Annual Meeting for the next year.
Stock Ownership Guidelines
Our non-employee directors are subject to stock ownership guidelines that require each director to own company stock, which includes 60% of the value of vested in-the-money stock options, worth three times his or her annual retainer amount. This amount is recalculated whenever there is a change in the annual retainers for our non-employee directors. The guidelines are designed to align the interests of our non-employee directors with those of our stockholders by ensuring that non-employee directors have a meaningful financial stake in our long-term success. The ownership guidelines were established by the Compensation Committee after reviewing market practices of our then current peer group companies and determining what would constitute meaningful ownership to align directors and stockholders.
Non-employee directors serving as of the original adoption date were required to be in compliance with the guidelines by January 1, 2009. Non-employee directors who joined the Board after January 2006 are required to be in compliance with the guidelines within three years of joining the Board.
The guidelines require that any non-employee director who has not met the ownership requirement after the start of the period during which he or she is required to do so, may only sell vested in-the-money stock options and vested RSUs or PRSUs, provided that he or she retains shares of common stock with a market value at least equal to the net proceeds received as a result of such sale until such time as the non-employee director meets the requirements of the guidelines. To the extent any non-employee director is not in compliance with the guidelines as of January 1st of any year after which the director is required to be in compliance, the director will be required to once again be in compliance by January 1st of the immediately succeeding year.
As of January 1, 2014, all non-employee directors who were required to have met the ownership requirement as of that date had met the requirement.
Other
We reimburse all of our directors for expenses incurred in connection with their attendance at Board or committee meetings and for participation in director education programs. We also provide director and officer insurance for all directors.
Director Compensation Table
The following table provides information concerning the compensation of our non-employee directors in 2013.
Name | Fees Earned or Paid in Cash ($) | Stock Awards ($)(1)(2) | Option Awards ($)(2)(3) | Total ($) | ||||||||||||
Kenneth Bate | 117,000 | 85,500 | 199,500 | 402,000 | ||||||||||||
Mark Corrigan | 27,000 | 105,500 | 129,500 | 262,000 | ||||||||||||
Jane Henney | 15,000 | 105,500 | 129,500 | 250,000 | ||||||||||||
Nancy Hutson | 79,000 | 55,500 | 129,500 | 264,000 | ||||||||||||
Alison Lawton | 21,000 | 105,500 | 129,500 | 256,000 | ||||||||||||
Kenneth Martin | 42,000 | — | 250,000 | 292,000 | ||||||||||||
Leon Moulder, Jr. | 25,500 | 105,500 | 129,500 | 260,500 | ||||||||||||
Martin Rosenberg(4) | 66,500 | 55,500 | 129,500 | 251,500 | ||||||||||||
Matthew Singleton(4) | 84,500 | 55,500 | 129,500 | 269,500 | ||||||||||||
Martin Soeters | 9,000 | 105,500 | 129,500 | 244,000 | ||||||||||||
Michael Wood(4) | 63,500 | 55,500 | 129,500 | 248,500 | ||||||||||||
| (1) | Reflects the fair value of the annual RSU awards as of the grant date, June 12, 2013. The grant date fair value of each share of common stock underlying the awards of RSUs was $50.24, the closing price of our common stock on the grant date. |
| (2) | The aggregate number of options and RSUs outstanding as of December 31, 2013 held by each non-employee director is as follows: |
Name | Outstanding Options (#) | Outstanding Stock Awards (#) | ||||||
Kenneth Bate | 171,718 | 1,701 | ||||||
Mark Corrigan | 48,728 | 1,104 | ||||||
Jane Henney | 27,913 | 1,104 | ||||||
Nancy Hutson | 52,728 | 1,104 | ||||||
Alison Lawton | 28,579 | 1,104 | ||||||
Kenneth Martin | 14,686 | — | ||||||
Leon Moulder, Jr. | 60,561 | 1,104 | ||||||
Martin Rosenberg | 49,256 | 1,104 | ||||||
Matthew Singleton | 92,728 | 1,104 | ||||||
Martin Soeters | 102,728 | 1,104 | ||||||
Michael Wood | 126,228 | 1,104 | ||||||
| (3) | All of the annual option awards were granted on June 12, 2013, the day of the 2013 Annual Meeting. In connection with his appointment to the Board in 2013, Mr. Martin received an initial option award on September 24, 2013. The number of shares of common stock that were the subject of the annual option awards and initial option awards are set forth in the “Equity Awards” section above. The dollar amounts set forth in this column represent the grant date fair value using the Black-Scholes option-pricing model, in accordance with ASC Topic 718. The June 12, 2013 grant date fair value of the annual option awards listed in the table was $15.47 per share. The grant date fair value of the initial option award was $17.02. In calculating the grant date fair value, we used the assumptions described in the notes to the consolidated financial statements in our Annual Report onForm 10-K as of the grant date. |
| (4) | In anticipation of their potential retirement from the Board immediately prior to the 2014 Annual Meeting, the Compensation Committee and the Board approved an extension to the post-termination of service exercise period of certain outstanding options granted to Dr. Rosenberg, Mr. Singleton and Dr. Wood under the Amended and Restated 2002 Directors’ Equity Incentive Plan, or Directors’ Plan, 2010 Plan, and 2012 Plan, from 90 days to one year to provide adequate time to exercise the options. |
Director Independence
In March 2014, the Board determined that all of our directors, other than Mr. Bonney, our CEO, and Mr. Perez, our President and COO, satisfied the independence requirements of Nasdaq, and the independence requirements of our Amended and Restated Corporate Governance Guidelines, which is available on our website, www.cubist.com. In making this determination, the Board took into consideration the following relationships:
| • | Jane Henney, one of our directors, was a director of AstraZeneca until April 2011. We were a party to a commercial services agreement, or CSA, dated as of July 1, 2008 with AstraZeneca Pharmaceuticals LP, an indirect wholly-owned subsidiary of AstraZeneca, pursuant to which we promoted and provided other support for MERREM® I.V. in the U.S. The CSA terminated in accordance with its terms in June 2010. In addition, we are a party to an exclusive licensing agreement dated December 1, 2006 with AstraZeneca AB, an indirect wholly-owned subsidiary of AstraZeneca, pursuant to which AstraZeneca AB is responsible for developing and commercializing CUBICIN in China and certain other countries in Asia, the Middle East and Africa that were not covered by previously-existing CUBICIN international partnering agreements. We also have an exclusive licensing agreement with AstraZeneca UK Limited, an indirect wholly-owned subsidiary of AstraZeneca, for the distribution of fidaxomicin, the active pharmaceutical ingredient in DIFICID, in Latin America, Central America, Mexico and the Caribbean. Dr. Henney has been a director of AmerisourceBergen since January 2002. AmerisourceBergen is a large wholesaler of CUBICIN. In addition, Integrated Commercialization Solutions, or ICS, a wholly-owned subsidiary of AmerisourceBergen, is a third party logistics provider for CUBICIN, DIFICID and ENTEREG. |
| • | Martin Rosenberg, one of our directors, is the Chief Scientific Officer and a director of Promega. We purchased a de minimis amount of laboratory supplies from Promega in 2013. |
Our Audit Committee, Compensation Committee and Corporate Governance and Nominating Committee consist solely of independent directors, as defined by Nasdaq. The members of our Audit Committee also meet the additional SEC and Nasdaq independence and experience requirements applicable specifically to members of the Audit Committee. In addition, all of the members of our Compensation Committee are “non-employee directors” within the meaning of the rules of Section 16 of the Securities Exchange Act and “outside directors” for purposes of Section 162(m) of the Internal Revenue Code.
Compensation Discussion & Analysis
This Compensation Discussion & Analysis, or CD&A, describes the company’s executive compensation program, philosophy and objectives as they relate to our 2013 NEOs. Our NEOs for 2013 were the following:
Name | Position | |
| Michael Bonney | Chief Executive Officer, or CEO | |
| David McGirr | Senior Advisor to the CEO(1) | |
| Michael Tomsicek | Senior Vice President, or SVP, and Chief Financial Officer, or CFO(2) | |
| Robert Perez | President and Chief Operating Officer, or COO | |
| Thomas DesRosier | Executive Vice President, or EVP, Chief Legal and Administrative Officer and Secretary(3) | |
| Steven Gilman | EVP, Research & Development and Chief Scientific Officer, or CSO |
| (1) | Mr. McGirr resigned as CFO and transitioned to the position of Senior Advisor to the CEO in March 2013. |
| (2) | Mr. Tomsicek was promoted from SVP and Deputy CFO to SVP and CFO in March 2013. |
| (3) | Mr. DesRosier was hired in March 2013 as SVP, Chief Legal Officer and Secretary and promoted in February 2014 to EVP, Chief Legal and Administrative Officer and Secretary. |
CEO Compensation and Company Performance
The total compensation of Mr. Bonney, our CEO, increased by 14% in 2013 over 2012. We believe that our 2013 CEO compensation correlates to the company’s very strong performance in 2012 and 2013, which is reflected in the following:
| • | Our total net revenues were $1.1 billion in 2013, $926 million in 2012, and $754 million in 2011, an average annual increase of 18% since 2011. |
| • | Our strong total stockholder return, or TSR, as reflected in our stock price increasing from $39.62 to $68.87, an increase of 74% from December 31, 2011 to December 31, 2013. |
| • | Our successful acquisitions in 2013 of Optimer Pharmaceuticals, Inc., or Optimer, and Trius Therapeutics Inc., or Trius, which provided us with an existing marketed product and a late-stage product candidate and represent substantial progress toward our Building Blocks of Growth—our five-year strategic goals that we announced in 2012 related to our 2017 expectations for our annual revenues, annual adjusted operating income and development activities. |
| • | Our completion of enrollment and achieving positive results in 2013 in our ceftolozane/tazobactam pivotal Phase 3 clinical trials in both complicated urinary tract infections and complicated intra-abdominal infections. |
| • | Our execution of an $800 million debt financing that provides us with a capital structure to support our Building Blocks of Growth strategic goals. |
| • | Our submission and U.S. Food and Drug Administration, or FDA, acceptance of our New Drug Application, or NDA, for our investigational antibiotic tedizolid phosphate. |
| • | Numerous other accomplishments in 2013, including the substantial progress we made in our efforts to integrate Optimer and Trius and expand our international operations, and receiving an expanded label from the FDA for ENTEREG. |
Pay for Performance
Aligning NEO compensation with high levels of company performance is at the core of our compensation philosophy. Compensation paid to our CEO is one example of how we adhere to this philosophy. Mr. Bonney’s compensation is competitive when compared to the CEOs in our 2013 peer group established by our Compensation Committee, particularly when taking into account our TSR relative to our peer group. More information about our 2013 peer group is provided below under the heading “Information Used to Make Compensation Determinations—Compensation Peer Group and Survey Data.”
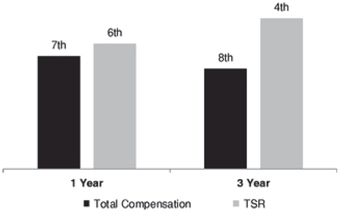
The following chart shows how Mr. Bonney’s total compensation, as reported below in the Summary Compensation Table of this Proxy Statement, and our TSR ranked among the 15 companies in our peer group for 2013 and over the three-year period from 2011-2013. For these one- and three-year periods, our TSR was ranked higher among the 2013 peer group companies than Mr. Bonney’s total compensation.
Rank Among Peers
Mr. Bonney’s total compensation also aligns favorably with our TSR over the past five fiscal years, as represented in the table below, which compares Mr. Bonney’s total compensation, as reported in the Summary Compensation Table, to our indexed TSR over the past five fiscal years. Indexed TSR was calculated based on an assumed $100 investment in our common stock on December 31, 2008 and then adjusted for each year based on the return that would have been made on that investment as of December 31 of each year.
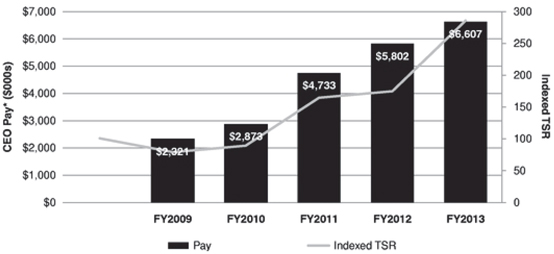
| * | Rounded to the nearest thousand dollars |
Say-on-Pay Feedback from Stockholders
We pay careful attention to any feedback we receive from our stockholders about our executive compensation program, which includes the 94% support we received from our stockholders on the advisory say-on-pay vote at our 2013 Annual Meeting of Stockholders, or the 2013 Annual Meeting. While our Compensation Committee did not find the need to change any of our compensation programs based on the support we received, it did and will continue to consider carefully our stockholders’ feedback on our executive compensation programs and practices. We hold an annual advisory vote of our stockholders on our executive compensation program.
Corporate Governance
Our pay practices emphasize good governance and market practice. To this end:
| • | Pay for Performance: A significant percentage of our NEO compensation is at-risk and may not be realized if corporate and individual goals are not achieved. We do not provide our NEOs with guaranteed annual salary increases or guaranteed bonuses. |
| • | Perquisites: We generally do not provide any perquisites to our NEOs that are not also offered to all employees of the company. |
| • | Risk Assessment: We conduct an annual risk assessment of our compensation programs and believe that our programs are structured in a manner to motivate strong performance with appropriate risk taking while discouraging excessive risk taking. The details of this risk assessment can be found below in a separate section of this Proxy Statement entitled “Corporate Governance.” |
| • | Performance-Based Long-Term Incentive Awards: For 2013, approximately 50% of the value of our CEO’s annual equity awards and 25% of the value of our NEOs other than Mr. Bonney, or Other NEOs, annual equity awards were delivered in the form of performance-based restricted stock unit, or PRSU, awards that vest based on achievement of pre-specified development and financial performance targets and upon completion of a requisite three-year service period that runs from February 2013 until February 2016. |
| • | Stock Ownership Guidelines: We have stock ownership guidelines that require our CEO to own stock valued at five times his base salary, EVPs to own stock valued at three times each of their base salaries, and our other Executive Officers to own stock valued at one and one half times each of their base salaries. The guidelines are designed to align the interests of our NEOs with those of our stockholders by ensuring that our NEOs have a meaningful financial stake in the company. As of January 1, 2014, all of our NEOs who are required to be in compliance based on their years of employment with the company were in compliance with our stock ownership guidelines. A more detailed description of our stock ownership guidelines is described below under the heading “Stock Ownership.” |
| • | Clawback/Recoupment Policy: We have a recoupment policy that covers our CEO and CFO. The policy provides that the independent directors of our Board may take any action they deem necessary or appropriate to remedy fraud, gross negligence or intentional misconduct by our CEO or CFO, including seeking reimbursement of bonus or incentive compensation payments or the cancellation of equity awards. A more detailed description of our recoupment policy is described below under the heading “Recoupment Policy.” |
| • | No Hedging or Pledging: We do not allow any of our employees, including our NEOs, to enter into any hedging-type transactions in our stock or to pledge our stock. |
| • | Independent Compensation Consultant: Our Compensation Committee engages an independent consultant to advise it on topics related to Board and executive compensation. |
| • | Retention Letters/Double Trigger: We have retention letters with all of our NEOs, other than Mr. McGirr, and a transition agreement with Mr. McGirr, providing each of our NEOs with severance payments in connection with their departure from the company in certain circumstances. In the case of a change-in-control of our company, severance is only paid in the event of a related involuntary termination, which is a “double trigger” arrangement. |
| • | No Gross-Ups: We do not provide parachute payment tax gross-ups or any other tax gross-ups to our NEOs. |
Compensation Philosophy and Objectives
Our compensation programs are designed to align compensation paid to our NEOs with company and individual performance and our stockholder’s interests in long-term returns. We provide cash compensation, in the form of salary and annual cash bonuses, to our NEOs based on performance in prior periods. We reserve a majority of NEO pay as long-term equity-based incentives, which reward our NEOs for their contribution to successful company performance over time, as reflected in our stock price.
All three of our compensation elements (base salary, annual cash bonus and long-term incentives, or LTIs) support our main compensation objectives, which include aligning pay with performance, providing competitive compensation that differentiates and rewards overall contribution, attracting and retaining high-quality executive officers and motivating high performance. Our annual cash bonuses and long-term compensation that is tied to our stock price performance promote the additional key objectives of furthering our short- and long-term strategic goals, promoting the creation and protection of long-term stockholder value and aligning our executives with our stockholders’ interests in long-term results.
We set our NEOs’ pay to be competitive as compared to the median pay of comparable executive officers based on data from our 2013 peer group and additional data from a broad survey of similarly sized life science companies. The details and selection of our 2013 peer group and the marketplace survey data used by our Compensation Committee are described in more detail below under the heading “Compensation Peer Group and Survey Data.”
Compensation Mix
We weight a significant portion of our NEOs’ total compensation in LTIs. This weighting aligns our executives’ compensation with long-term stockholder return, as well as the long-term development and business cycle in the biopharmaceutical industry.
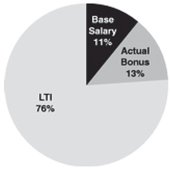
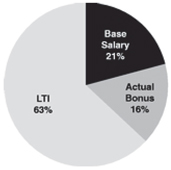
For 2013, the total compensation of our NEOs, other than Mr. McGirr, was distributed among the three main elements of our compensation, as follows:
| CEO | Average of Other NEOs | |
|
| |
For 2013, Mr. Bonney’s compensation and the average compensation of our Other NEOs, other than Mr. McGirr, broken down into these three elements, compared to our peer group, were as follows:
|
|
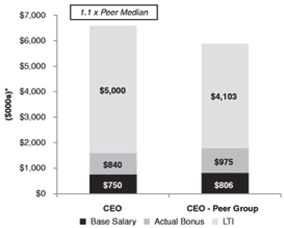
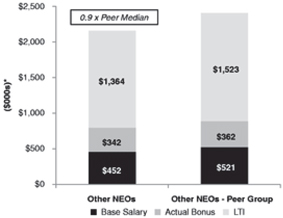
| * | Rounded to the nearest thousand dollars; excludes “All Other Compensation” as set forth on the Summary Compensation Table of this Proxy Statement. |
Compensation Determinations and Use of Compensation Consultant
In 2013, the independent members of the Board, based upon the determination of the Compensation Committee, approved the compensation with respect to Mr. Bonney. In February 2014, we amended the charter of the Compensation Committee to clarify the authority of the Compensation Committee to approve Mr. Bonney’s compensation for subsequent ratification by the independent members of the Board. The Compensation Committee also makes all of the compensation determinations with respect to our Other NEOs. In making its determinations relating to the Other NEOs, the Compensation Committee takes into account the recommendations of Mr. Bonney.
Pursuant to its charter, the Compensation Committee has the authority to select and retain independent advisors and counsel to assist it with carrying out its duties and responsibilities, and we have provided appropriate funding to the Committee to do so. The Compensation Committee has exercised this authority to engage PM&P as its independent compensation consultant. PM&P serves as an advisor to the Compensation Committee on topics primarily related to Board and executive compensation. PM&P reports directly to the Compensation Committee Chair, takes direction from the Compensation Committee, and does not provide us with any services other than the services provided at the request of the Compensation Committee.
The Compensation Committee regularly reviews the services provided by its outside consultants and believes that PM&P is independent in providing executive compensation consulting services. The Compensation Committee conducted a specific review of its relationship with PM&P in 2013 and determined that PM&P’s work for the Compensation Committee did not raise any conflicts of interest, consistent with the guidance provided under the Dodd-Frank Wall Street Reform and Consumer Protection Act, or the Dodd-Frank Act, and by the SEC and the NASDAQ Global Market, or Nasdaq. The Compensation Committee continues to monitor the independence of its compensation consultant on a periodic basis.
Information Used to Make Compensation Determinations
Compensation Peer Group and Survey Data
In September 2012, the Compensation Committee, after considering the recommendation of PM&P, approved our 2013 peer group based on the pre-defined selection criteria set forth below:
| • | industry and product similarity; |
| • | annual revenues of between $270 million and $2.4 billion, which is approximately one-third to three times what our revenues were for the prior four quarters of data available at the time the analysis was conducted on March 31, 2012; and |
| • | market capitalization of between $900 million and $8.2 billion, which is approximately one-third to three times what our market capitalization was on March 31, 2012. |
The median revenues and market capitalization for our 2013 peer group was $565 million and $2.5 billion, respectively. Our revenues and market capitalization for the same period were $803 million and $2.7 billion, representing the 80th and 53rd percentiles, respectively.
In selecting this peer group, the Compensation Committee also sought to have a group that included enough companies so that the data would not be skewed if there were one or two outliers on any of the items for which the
peer group was used. The 2013 peer group size remained at 15 companies, as we removed one company and added another. The compensation paid by peer group companies to their respective executive officers did not factor into the Compensation Committee’s determination of the 2013 peer group.
The peer groups that were approved by the Compensation Committee for each of 2012 and 2013 and the explanations of any changes are detailed in the following table:
2012 Peer Companies | 2013 Peer Companies | Reason for Change | ||
| Alexion Pharmaceuticals, Inc. | Alexion Pharmaceuticals, Inc. | |||
| Alkermes, Inc. | Alkermes, plc(1) | Corporate name change | ||
| Amylin Pharmaceuticals, Inc. | Amylin Pharmaceuticals, Inc.(2) | |||
| Auxilium Pharmaceuticals, Inc. | Auxilium Pharmaceuticals, Inc. | |||
| BioMarin Pharmaceutical, Inc. | BioMarin Pharmaceutical, Inc. | |||
| Endo Pharmaceuticals, Inc. | Endo Health Solutions, Inc. | Corporate name change | ||
| Impax Laboratories Inc. | Impax Laboratories Inc. | |||
| Medicis Pharmaceuticals Company | Medicis Pharmaceuticals Company(2) | |||
| Onyx Pharmaceuticals, Inc. | Onyx Pharmaceuticals, Inc.(2) | |||
| PDL BioPharma, Inc. | — | No longer met selection criteria | ||
| Regeneron Pharmaceuticals, Inc. | Regeneron Pharmaceuticals, Inc. | |||
| Salix Pharmaceuticals, Ltd. | Salix Pharmaceuticals, Ltd. | |||
| The Medicines Company | The Medicines Company | |||
| United Therapeutics Corporation | United Therapeutics Corporation | |||
| — | Vertex Pharmaceuticals | Additional company that met criteria | ||
| ViroPharma, Incorporated | ViroPharma, Incorporated(2) | |||
| (1) | Alkermes, Inc. became Alkermes, plc as a result of a merger between Alkermes, Inc. and Elan Drug Technologies in September 2011. |
| (2) | Although Amylin Pharmaceuticals, Inc. was acquired in August 2012, Medicis Pharmaceuticals Company was acquired in December 2012, Onyx Pharmaceuticals, Inc. was acquired in September 2013 and ViroPharma, Incorporated was acquired in January 2014, they all remained part of our peer group for 2013 because they met our peer group criteria and we had 2012 proxy statement data for all of these companies at the time that we compiled data for our 2013 peer group. |
The Compensation Committee utilized the 2013 peer group to provide context for its compensation decision-making for 2013. After the peer group companies were selected, PM&P prepared and presented a report to the Compensation Committee comparing the compensation of our NEOs to the compensation of executive officers at the peer group companies with similar jobs as our NEOs utilizing publicly available data from the peer companies, and to the compensation of other executive officers utilizing broad survey data from the Radford Global Life Sciences Survey, or Radford Survey. The Radford Survey data presented reflected approximately 80 similarly sized life science companies with over 500 full-time employees. Data from the Radford Survey and the 2013 peer companies was combined to develop a market composite based on an average of the Radford Survey data and 2013 peer company data and we refer to the composite data as “marketplace” data. The Compensation Committee does not rely upon data from any individual company participating in the Radford Survey in making compensation decisions. Each element of our NEO’s compensation was reviewed separately and each NEO’s aggregate compensation was reviewed as part of this analysis and evaluation.
Compensation Targets
In making our compensation decisions for our NEOs, we aim for the following targets:
| • | Base Salaries. We generally target the median of the marketplace. In certain circumstances, we offer starting base salaries higher than the median for positions that require more complex work, have critical value to the company, are in high demand in the marketplace or have fewer qualified candidates, or in situations where candidates enter the position with extraordinary relevant experience. Higher base salaries may also be paid over time to reflect superior individual performance. In certain circumstances, we offer starting base salaries below the median if the NEO is new to the position and/or is at the lower end of the experience range for the position. |
| • | Annual Cash Performance Awards. We target potential annual cash performance awards that would allow total cash compensation for our NEOs to exceed the median of the marketplace, depending on company and, for our Other NEOs, individual NEO performance. |
| • | LTIs. We generally target at or above the median of the marketplace. We target overall equity awards to account for a significant portion, typically more than 50%, of each NEO’s total annual compensation. As further discussed in this CD&A, we believe this allocation provides the appropriate incentive to our NEOs to increase stockholder value while encouraging retention and performance with the appropriate level of risk-taking. |
Other Evaluation Criteria and Factors
Aggregate individual NEO compensation can be above or below the compensation target due to a number of factors, including retention considerations, individual and corporate performance, relative value of the position within the company as compared to peer companies, length of experience in the role, and internal equity considerations.
As part of making its decisions with respect to Mr. Bonney’s compensation, the independent members of the Board and the Compensation Committee also utilized the following data and other information:
| • | Quantitative evaluations of our performance against our annual corporate goals and objectives; |
| • | Qualitative input on Mr. Bonney’s performance from all directors and many of our Executive Officers; |
| • | Our and Mr. Bonney’s historical performance; |
| • | Retention considerations; and |
| • | Mr. Bonney’s total cash compensation as compared to Mr. Perez, our second highest paid NEO based on total cash compensation, in order to determine whether Mr. Bonney’s relative cash compensation is fair and reasonable in the context of internal equity. |
As part of making its compensation decisions with respect to Other NEOs, the Compensation Committee took into account:
| • | Quantitative evaluations of our performance against annual corporate goals and each Other NEO’s performance against individual goals; |
| • | Qualitative evaluations, conducted by Mr. Bonney of each Other NEO’s contribution to our corporate goals and objectives, performance against individual goals and potential future contributions to our success; |
| • | Retention considerations; and |
| • | Mr. Bonney’s recommendations. |
Compensation Determinations
Overview of 2013 NEO Compensation
Our NEO compensation is comprised of the following elements:
| • | Base salary. Decisions on 2013 NEO base salary levels were made early in 2013 and, other than for Mr. DesRosier, who was not an employee of the company in 2012, were based on our NEOs’ performance in 2012. The base salary level for Mr. DesRosier was based on an arm’s length negotiation and his substantial experience, skills and qualifications. |
| • | Annual cash performance awards. Decisions on 2013 NEO annual cash performance awards were made after the end of 2013. Mr. Bonney’s award was based entirely, and our Other NEOs’ awards were based primarily, on the company’s performance in 2013 against objectives approved by the Compensation Committee and the Board early in 2013. Our Other NEOs’ awards were also based on achievement of individual performance as further described below under the heading “Annual cash performance award—Other NEOs.” |
| • | LTIs. Our NEO LTI awards are comprised of stock option and RSU awards and PRSU awards. Grant decisions on NEO LTI awards, other than for Mr. DesRosier, were made in early 2013 and were based on company and individual performance in 2012, expected future individual performance, and retention considerations. The LTI award granted to Mr. DesRosier was based on an arm’s length negotiation and his substantial experience, skills and qualifications. Our CEO’s and, other than Mr. DesRosier and Mr. McGirr, our Other NEO’s compensation for 2013 included PRSUs. Approximately 50% of the total value of our CEO’s 2013 equity grants and approximately 25% of the total value of such Other NEOs 2013 equity grants were comprised of PRSUs. LTIs align the interests of our NEOs with those of our stockholders and reward our NEOs for the long-term performance of the company because their value is tied to our stock price and they vest over time and in some cases, based on the achievement of company performance targets. Our stock option awards vest ratably on a quarterly basis over four years and our RSU awards vest ratably on an annual basis over four years. The PRSU awards will be earned if the company achieves certain pre-specified development and financial performance targets and upon completion of a requisite three-year service period that runs from February 2013 until February 2016. Regardless of when the company achieves performance targets, no PRSU awards will vest until the end of the three-year performance period and the Compensation Committee certifies achievement of the performance targets. |
Base Salary—CEO: The Compensation Committee seeks to maintain Mr. Bonney’s base salary approximately at the median of the marketplace, based on our 2013 peer group and broader survey market data, in order to emphasize pay for performance and to keep Mr. Bonney’s base salary reasonable and consistent with CEOs in our 2013 peer group and Mr. Perez, our second highest paid NEO. Mr. Bonney’s 2013 base salary was set at $750,000, which represented a 7% increase from his 2012 base salary of $700,000. Mr. Bonney’s 2013 base salary was at the 45th percentile as compared to the marketplace data used by the Compensation Committee and his 2012 base salary was at the 35th percentile as compared to such data. In recommending this salary to the Board, the Compensation Committee also considered that Mr. Bonney performed at a very high level in 2012, as evidenced by our strong 2012 performance (89% achievement against corporate goals), the overall strength of his leadership, his past and potential future contributions to the company, and the marketplace data described above. The Compensation Committee sought to align Mr. Bonney’s 2013 base salary more closely with the marketplace median. Although Mr. Bonney’s 2013 base salary was still below the marketplace median, his total target cash compensation (base salary and target annual cash performance award) was approximately at the median of the marketplace.
Base salary—Other NEOs: The Compensation Committee set our Other NEOs’ salaries based upon the marketplace data and evaluation criteria described above. The 2013 base salaries of these NEOs, other than Mr. McGirr, were, on average, at approximately the 45th percentile, as compared to the marketplace data used by the Compensation Committee.
The following table details the increases from 2012 to 2013 in the annual base salary of each of our Other NEOs:
Other NEOs | 2012 Base Salary($) | 2013 Base Salary($) | Year Over Year % Change | |||||||||
David McGirr(1) | 414,000 | 425,000 | 2.7 | % | ||||||||
Michael Tomsicek(2) | 312,500 | 365,000 | 16.8 | % | ||||||||
Robert Perez(3) | 600,000 | 600,000 | 0.0 | % | ||||||||
Thomas DesRosier(4) | — | 475,000 | N/A | |||||||||
Steven Gilman | 460,000 | 475,000 | 3.3 | % | ||||||||
| (1) | The annual base salary of Mr. McGirr was decreased to $212,500 in March 2013 when he resigned from the position of SVP and CFO and transitioned to the position of Senior Advisor to the CEO. The actual amount of base salary that Mr. McGirr was paid in 2013 was $265,625, which is a blend of his two salary levels. |
| (2) | The annual base salary of Mr. Tomsicek was increased to $365,000 in March 2013 when he was promoted from SVP and Deputy CFO to the position of SVP and CFO. The actual amount of base salary that Mr. Tomsicek was paid in 2013 was $358,734, which is a blend of his two salary levels. |
| (3) | The annual base salary of Mr. Perez was increased to $600,000 when he was promoted from EVP and COO to the new position of President and COO in July 2012. The actual amount of base salary that Mr. Perez was paid in 2012 was $552,625, which is a blend of his two salary levels. |
| (4) | Mr. DesRosier was hired in March 2013 with a base salary of $475,000. The actual amount of base salary that Mr. DesRosier was paid in 2013 was $376,042. Because Mr. DesRosier was not employed by us in 2012, there is no calculation for his year over year base salary change. |
The Compensation Committee, based in part on Mr. Bonney’s input, determined that these base salary increases were justified based on each individual’s performance and the level of each NEO’s base salary as compared to that of similar officers based on the marketplace data used by the Compensation Committee. Mr. Tomsicek’s percentage increase in base salary from 2012 to 2013 is higher than the base salary increases for Mr. McGirr, Mr. Perez and Dr. Gilman as a result of Mr. Tomsicek’s promotion to SVP and CFO in March 2013.
Annual cash performance awards
Description of plans: Our CEO and next three most highly compensated Other NEOs, other than our CFO, are subject to our Performance-Based Management Incentive Plan, or Management Incentive Plan. Our CFO is subject to our Short-Term Incentive Plan, or STIP. In 2013, both the Management Incentive Plan and the STIP conditioned the payment of any annual cash performance award on the company achieving at least 90% of our 2013 U.S. CUBICIN net revenue goal. In addition, the STIP required us to achieve at least 70% of our corporate goals for any annual performance awards to be paid. If the foregoing thresholds were achieved, which they were in 2013, the annual cash performance award pool under each of the Management Incentive Plan and the STIP was funded at the maximum 200% level. The actual 2013 annual cash performance awards for the NEOs were then determined based on a combination of the achievement of our 2013 corporate goals and each individual NEO’s objectives for the year.
Target awards for our NEOs are expressed as a percentage of base salary as follows:
NEO | 2013 Target Percentage (as a percent of base salary) | |||
Michael Bonney | 100 | % | ||
Robert Perez | 75 | % | ||
Michael Tomsicek | 60 | % | ||
Steven Gilman | 60 | % | ||
Thomas DesRosier | 50 | % | ||
Pursuant to the terms of his transition letter agreement, the 2013 target percentage for Mr. McGirr, our prior CFO until March 2013, was 60% of the amount of salary he received from January 2013 through March 2013 and 50% of the salary he received from April 2013 through December 2013.
The relative weighting of corporate and individual goals for our NEOs are expressed as percentages of the total target award percentage, with a higher percentage tied to corporate goals the more senior a position the individual holds at the company, as follows:
NEO | Portion of Award Tied to Corporate Results | Portion of Award Tied to Individual Results | ||||||
Michael Bonney | 100 | % | 0 | % | ||||
Robert Perez | 80 | % | 20 | % | ||||
Michael Tomsicek | 80 | % | 20 | % | ||||
Steven Gilman | 80 | % | 20 | % | ||||
Thomas DesRosier | 65 | % | 35 | % | ||||
David McGirr | 65 | % | 35 | % | ||||
Corporate goals/achievement against goals: The independent members of the Board, based upon the determination of the Compensation Committee and after discussion with the Compensation Committee and Mr. Bonney, approved the company’s 2013 corporate goals in early 2013. The corporate goals for 2013 were set at a reasonable level of difficulty that could be met if our NEOs and the company as a whole performed at the high level that we expect but were sufficiently challenging such that the likelihood of attaining these goals was not assured. Our historical level of achievement against corporate goals for the past five years is 112% in 2013, 89% in 2012, 135% in 2011, 92% in 2010, and 95% in 2009.
For 2013, our corporate goals and our detailed achievement against such goals were as follows:
Corporate Goal | Weight | Achievement Against Goal | Credit Received | |||||||||
1. Manage the Business | 35 | % | Underachieved | 33.9 | % | |||||||
A. Total revenues of $1.053 billion, including: | 20 | % | $1.054 billion | 20 | % | |||||||
$933 million in U.S. CUBICIN net revenues | $908 million | |||||||||||
B. Achieve inventory targets for CUBICIN and ENTEREG and cost of goods sold levels | 10 | % | Achieved | 10 | % | |||||||
C. Non-GAAP adjusted net operating income* of $245 million | 5 | % | $190 million | 3.9 | % | |||||||
2. Grow the Business | 50 | % | Underachieved | 46 | % | |||||||
A. Progress ceftolozane/tazobactam development by meeting clinical trial enrollment and NDA targets | 20 | % | Underachieved | 19.5 | % | |||||||
B. Progress surotomycin development by meeting clinical trial enrollment targets | 7.5 | % | Achieved | 7.5 | % | |||||||
C. Progress bevenopran development by meeting clinical trial enrollment targets | 5 | % | Underachieved | 3 | % | |||||||
D. Progress CUBICIN pediatric trials by meeting enrollment targets | 5 | % | Underachieved | 2.5 | % | |||||||
E. Discovery—File Investigational New Drug Application by 12/31/13 | 5 | % | Overachieved | 6 | % | |||||||
F. License high-quality clinical stage compound | 7.5 | % | Achieved | 7.5 | % | |||||||
3. Strategic Imperatives | 15 | % | Underachieved | 13 | % | |||||||
A. EU launch plan on track and budget by 12/31/13 | 5 | % | Achieved | 5 | % | |||||||
B. Increase engagement survey interdepartmental communication scores by 10% | 2.5 | % | Underachieved | 0 | % | |||||||||
C. Retain top performers | 2.5 | % | Overachieved | 3 | % | |||||||||
D. Establish key leadership succession plans by 12/31/13 | 5 | % | Achieved | 5 | % | |||||||||
SUBTOTAL | 92.9 | % | ||||||||||||
4.Kicker—Achieve at least 80% of Corporate Goals and deliver a projected $50 million increase in non-GAAP adjusted net operating income through acquisitions and business development activities |
| 1.2x achievement of the above |
| Achieved | 1.2x | |||||||||
TOTAL ACHIEVEMENT |
| 112 | % | |||||||||||
| * | To derive non-GAAP adjusted net operating income, the company excluded the impact of certain contingent consideration, amortization of acquired intangible assets, fair value step-up of acquired inventory, and acquisition-related expenses related to its completed acquisitions, including restructuring charges, from GAAP net operating income. |
Annual cash performance award—CEO: Mr. Bonney’s annual cash performance award is determined solely by reference to our achievement against our corporate goals, with discretion retained by the Compensation Committee to adjust Mr. Bonney’s annual cash performance award down, based on other considerations. Mr. Bonney was awarded a 2013 annual cash performance award of 112% of his target award, resulting in a bonus payment of $840,000. This performance award was determined based on our achievement of 112% of our 2013 corporate goals. Mr. Bonney’s 2013 actual annual cash performance award was at the 40th percentile as compared to the marketplace data used by our Compensation Committee. Taken together, the 2013 base salary and actual annual cash performance award paid to Mr. Bonney were at about the 35th percentile as compared to such marketplace data.
Annual cash performance award—Other NEOs: Our Other NEOs have individual goals, and a combination of their level of achievement against such goals and the company’s level of achievement against the company goals determine their annual cash performance award. The individual goals for these Other NEOs are presented to the Compensation Committee for approval by Mr. Bonney and are designed to focus them on individual behaviors that support our overall performance and success. These goals generally consist of both objective and subjective goals that are relevant to each Other NEO’s responsibilities. Each Other NEO’s level of achievement against his individual goals was initially evaluated by Mr. Bonney. Mr. Bonney then recommended a final level of achievement against individual goals of each Other NEO to the Compensation Committee, which then can approve or adjust the proposed levels of achievement up or down. The 2013 annual cash performance awards for our Other NEOs were calculated based on individual Other NEO performance against 2013 individual goals and company performance against 2013 company goals using the relative weighting set forth above. Details of the amounts of the 2013 annual cash performance awards for our Other NEOs can be found in the Summary Compensation Table in this Proxy Statement. On average, our Other NEOs’ 2013 actual annual cash performance awards were at approximately the 60th percentile as compared to the marketplace data used by our Compensation Committee. Taken together, the 2013 base salary and actual annual cash performance awards paid to these NEOs were at approximately the 55th percentile as compared to such marketplace data.
The following is a summary of the 2013 individual goals of our Other NEOs and their aggregate performance against these goals, as approved by the Compensation Committee:
Other NEO | Summary of 2013 Individual Goals | Weight | Achievement | |||||
David McGirr | 1. Ensure successful transition to new CFO | 50 | % | Achieved | ||||
2. Support CEO, CFO and other senior executives, including on various financial and investor relations matters | 50 | % | Achieved | |||||
Total Achievement | 100% | |||||||
| ||||||||
Michael Tomsicek | 1. Build out strategic sourcing organization and achieve $20 million in savings | 25 | % | Partially Achieved | ||||
2. Provide finance infrastructure to support international expansion plan | 25 | % | Achieved | |||||
3. Further integrate investor relations and public affairs functions | 15 | % | Achieved | |||||
4. Appropriately streamline financial reporting processes | 15 | % | Over Achieved | |||||
5. Improve accuracy of internal business operating forecast | 10 | % | Achieved | |||||
6. Appropriately allocate responsibility for finance operational and strategic functions | 10 | % | Achieved | |||||
Total Achievement | 105% | |||||||
| ||||||||
Robert Perez | 1. Total revenues of $1.053 billion | 30 | % | Achieved | ||||
2. Achieve inventory targets for CUBICIN and ENTEREG by 12/31/13 and on time clinical supplies | 20 | % | Over Achieved | |||||
3. Improve accuracy of internal business operating forecast | 10 | % | Achieved | |||||
4. Develop EU launch plan for ceftolozane/tazobactam that is on plan and budget by 12/13/13 | 20 | % | Over Achieved | |||||
5. Complete two business development deals consistent with the company’s Building Blocks of Growth goals, one of which must either provide an accretive product in 2014 or increase potential profitability of the ceftolozane/tazobactam planned EU launch | 20 | % | Over Achieved | |||||
Total Achievement | 150% | |||||||
| ||||||||
Thomas DesRosier | 1. Increased support of international expansion | 25 | % | Over Achieved | ||||
2. Support business development activities | 30 | % | Over Achieved | |||||
3. Advise senior management committees on appropriate levels of business risk | 15 | % | Over Achieved | |||||
4. Manage all litigation and non-FDA government investigations | 15 | % | Achieved | |||||
5. Recommend to CEO and Board of Directors improvements to Board operations and governance | 15 | % | Achieved | |||||
Total Achievement | 120% | |||||||
| ||||||||
| Other NEO | Summary of 2013 Individual Goals | Weight | Achievement | |||||
Steven Gilman | 1. Progress ceftolozane/tazobactam development by meeting clinical trial enrollment and NDA targets | 35 | % | Over Achieved | ||||
2. Progress surotomycin, bevenopran and CUBICIN clinical trials, based on achieving goals B, C and D of the company’s “Grow the Business” corporate goal, and receive FDA approval for ENTEREG Supplemental NDA | 20 | % | Over Achieved | |||||
3. Support Building Blocks of Growth strategic goals through effective Research and Development perspective on business development opportunities | 10 | % | Achieved | |||||
4. Hire Chief Medical Officer by 09/30/13 | 10 | % | Achieved | |||||
5. File Investigational New Drug/Clinical Trial Application | 10 | % | Over Achieved | |||||
6. R&D leadership development | 15 | % | Achieved | |||||
Total Achievement | 110% | |||||||
| ||||||||
Long-term incentive awards
Our LTI program is a broad-based employee retention program that is intended to attract, retain, and motivate our NEOs and align their long-term interests with those of our stockholders. We use stock options and PRSUs to reward long-term value creation and RSUs as a retention tool and as a way to enable our executives to accumulate stock ownership in the company. We believe that stock options align the incentives of our executives with the interests of our stockholders and our long-term performance by directly tying a large portion of the value that may be realized from our equity compensation to an increase in our stock price. In a volatile stock market,
RSUs and PRSUs continue to provide value when stock options may not, which our Compensation Committee and Board believe is useful in retaining talented executives in uncertain economic times. We believe that our equity program is critical to our efforts to hire and retain the best talent in the extremely competitive biopharmaceutical industry.
For 2013, the mix of equity awards granted to our NEOs, other than Mr. McGirr and Mr. DesRosier, were targeted such that approximately 50% of the value came from stock options (based on Black-Scholes value calculations) and approximately 50% from RSUs and/or PRSUs (based on grant date fair values). We believe this mix of stock options, RSUs and PRSUs provided an appropriate balance of incentive and retention for our NEOs in light of our company’s stage of growth. The Compensation Committee, with the assistance of PM&P, reviews this mix each year to ensure that appropriate balance is given to our retention and incentive objectives and that we remain aligned with the practices of our peer group. Starting in 2013, the independent members of our Board, following the determination of the Compensation Committee, awarded our CEO equity grants divided approximately equally in value between stock options and PRSUs and the Compensation Committee awarded our Other NEOs, other than Mr. McGirr and Mr. DesRosier, equity grants approximately as follows: 50% stock options, 25% RSUs with time-based vesting and 25% PRSUs with time- and performance-based vesting.
In 2012 and 2013, the Compensation Committee and the independent members of the Board authorized grants of stock options, RSUs and PRSUs (for 2013 only) to our NEOs, as follows:
| 2012 Awards | 2013 Awards | |||||||||||||||||||||||||||||||
NEO | Stock Options (#) | RSUs (#) | Total Grant Value* ($) | Stock Options (#) | RSUs (#) | PRSUs (#) | Total Grant Value* ($) | Year Over Year TGV % Change | ||||||||||||||||||||||||
Michael Bonney | 200,000 | 38,000 | 4,466,000 | 184,044 | — | 60,096 | 5,000,000 | 12 | % | |||||||||||||||||||||||
David McGirr(1) | 37,500 | 6,000 | 798,000 | — | 4,807 | — | 200,000 | -75 | % | |||||||||||||||||||||||
Michael Tomsicek(2) | 25,000 | 8,333 | 719,000 | 35,637 | 8,450 | 3,004 | 1,000,000 | 39 | % | |||||||||||||||||||||||
Robert Perez(3) | 125,000 | 28,500 | 3,025,000 | 62,575 | 10,216 | 10,216 | 1,700,000 | -44 | % | |||||||||||||||||||||||
Thomas DesRosier(4) | N/A | N/A | N/A | 70,207 | 9,509 | — | 1,455,000 | N/A | ||||||||||||||||||||||||
Steven Gilman(5) | 75,000 | 15,000 | 1,722,000 | 47,851 | 7,812 | 7,812 | 1,300,000 | -25 | % | |||||||||||||||||||||||
| * | Rounded to the nearest thousand dollars; amounts based on grant date fair values. |
| (1) | In March 2013, Mr. McGirr resigned from the position of SVP and CFO and transitioned to the position of Senior Advisor to the CEO. |
| (2) | In February 2013, Mr. Tomsicek received an annual grant of 18,404 stock options, 3,004 RSUs and 3,004 PRSUs in his non-NEO role of SVP and Deputy CFO. In connection with his promotion to SVP and CFO in March 2013, Mr. Tomsicek received an additional grant of 17,233 stock options and 5,446 RSUs. |
| (3) | In February 2012, Mr. Perez received an annual grant of 100,000 stock options and 20,000 RSUs in his role as EVP and COO. In connection with his promotion to President and COO in July 2012, Mr. Perez received an additional grant of 25,000 stock options and 8,500 RSUs in August 2012. These special promotion grants increased the size of Mr. Perez’s 2012 compensation relative to the regular annual grants made in 2013. |
| (4) | Mr. DesRosier was hired in March 2013 and, therefore, did not receive an LTI award from the company in 2012. In connection with his hiring, Mr. DesRosier received a grant of 70,207 stock options and 9,509 RSUs, which were negotiated at arm’s length. |
| (5) | The value of Dr. Gilman’s 2013 LTI award decreased compared to 2012 reflecting his particularly strong performance in 2011 and correspondingly high 2012 LTI award. |
In determining the size of the 2013 annual LTI awards to our NEOs in February 2013, the Compensation Committee and the independent members of the Board considered the equity compensation levels of comparable executives using the marketplace data compiled by PM&P, stockholder dilution, the company’s performance, the NEO’s individual responsibilities and performance relative to company annual and long-term objectives, the importance of his role to our company and expected future contributions to our performance. The Compensation Committee and the Board increased the value of the annual awards in 2013 relative to the prior year’s award values, largely in consideration of the company and individual NEO achievements in 2012 and to align our NEOs total compensation at or above the median of the marketplace.
With a grant date fair value of approximately $5 million, Mr. Bonney’s 2013 LTI compensation approximated the 65th percentile compared to the marketplace data used by the Compensation Committee. The independent members of the Board determined this level to be appropriate given Mr. Bonney’s significant contributions to the company during 2012, his expected future performance, the desire to retain his services into the future, and that a significant percentage of Mr. Bonney’s total compensation is at-risk and may not be realized if certain pre-specified company performance goals are not achieved.
On average, the grant date fair value of the 2013 LTI awards to our Other NEOs, other than Mr. McGirr, was approximately $1.4 million, putting their 2013 long-term incentive compensation at about the 65th percentile compared to the marketplace data used by the Compensation Committee. The Compensation Committee determined this level to be appropriate given the significant contributions of our Other NEOs during 2012, their respective expected future performance, the desire to retain their respective services into the future, and that a significant percentage of our Other NEOs total compensation is at-risk and may not be realized if certain pre-specified company and individual performance goals are not achieved.
Overall Relative Compensation
The following table shows how our NEOs’ base salary, annual cash-performance awards, LTI awards, and total compensation in 2012 and 2013 compare to our peers, as demonstrated by the percentiles at which our NEOs rank in these categories based on the marketplace data used by the Compensation Committee.
| 2012 | 2013 | |||||||||||||||||||||||||||||||
NEO | Base Salary | Annual Cash Performance Awards | Long-Term Incentive Awards | Total Compensation | Base Salary | Annual Cash Performance Awards | Long-Term Incentive Awards | Total Compensation | ||||||||||||||||||||||||
Michael Bonney | 50th | 40th | >75th | 60th | 45th | 60th | 65th | 60th | ||||||||||||||||||||||||
David McGirr(1) | 45th | 35th | 35th | 40th | — | — | — | — | ||||||||||||||||||||||||
Michael Tomsicek(2) | — | — | — | — | <25th | 45th | 40th | 35th | ||||||||||||||||||||||||
Robert Perez | <25th | <25th | 35th | 35th | 25th | >75th | >75th | 75th | ||||||||||||||||||||||||
Thomas DesRosier(2) | — | — | — | — | 75th | 60th | 75th | 70th | ||||||||||||||||||||||||
Steven Gilman | 55th | 35th | >75th | 70th | 55th | 60th | 60th | 60th | ||||||||||||||||||||||||
| (1) | Mr. McGirr resigned as our SVP and CFO in March 2013. |
| (2) | Mr. Tomsicek and Mr. DesRosier were not NEOs in 2013. |
Retention Letters and Transition Agreement
In August 2013, we entered into retention letters with all of our NEOs, other than Mr. McGirr, with a fixed term of three years and which provide for severance payments, consisting of 24 months of salary continuation for Mr. Bonney and 18 months of salary continuation for Mr. Tomsicek, Mr. Perez, Mr. DesRosier and Dr. Gilman, and other benefits if each NEO is terminated without cause or if the NEO is terminated without cause or resigns for good reason within 24 months after a change-in-control of the company. Termination benefits under the retention letters are not triggered solely by a change-in-control and are therefore considered “double trigger.”
When Mr. McGirr transitioned to Senior Advisor to the CEO in March 2013, he entered into a transition agreement with the company that superseded the terms of his then-existing retention letter. The transition agreement, which has a fixed term until June 1, 2014, provides for severance payments and other benefits if Mr. McGirr is terminated without cause or if he is terminated without cause following a change-in-control of the company.
Among the other benefits included in the retention letters and transition agreement is that the equity incentives held by each NEO will fully vest in the event the NEO is entitled to severance payments in connection with a change-in-control of the company. The retention letters and transition agreement do not provide for any tax gross-up payments or other perquisites. The retention letters and transition agreement contain “best after-tax provisions,” which provide for reduced payments and other benefits to our NEOs if the reduced amount would result in an NEO receiving a higher aggregate amount net of all applicable taxes. Full details of the terms of the retention letters and the transition agreement and the value of the payments to be received thereunder pursuant to various termination scenarios can be found in the section of this Proxy Statement entitled “Termination of Employment and Change-in-Control Agreements.” We believe that the benefits of the retention letters and the transition agreement outweigh the potential costs in that they, among other things: assist us in attracting and retaining top executive talent by providing our executives with competitive severance arrangements; encourage frank discourse by our NEOs with Mr. Bonney and the Board, and between Mr. Bonney and the Board, by providing a financial safety net in order to limit the NEOs’ fear of adverse consequences in response to their opinions; and better enable our NEOs to act in the best interest of our stockholders in a situation involving a potential change-in-control of the company. To ensure that these agreements remain reasonable and competitive, the Compensation Committee periodically reviews competitive data provided by PM&P, as well as potential costs to the company of the retention letters under various potential termination scenarios.
Perquisites and Personal Benefits
Our NEOs are eligible to participate in the benefit programs that we provide to all employees at the same level as all other employees. We generally do not provide any perquisites to our NEOs that are not also offered to all employees of the company.
Stock Ownership
Our Executive Officers, including our NEOs, are subject to the stock ownership guidelines described in the table below. The guidelines are designed to align the interests of our Executive Officers with those of our stockholders by ensuring that our Executive Officers have a meaningful financial stake in our success. The guidelines were first adopted in January 2006 and updated most recently in March 2014. The amount of stock required to be held to satisfy ownership requirements, which includes sixty percent of the value of vested in-the-money stock options, was established by the Board upon the recommendation of the Compensation Committee. In making its recommendation, the Compensation Committee reviewed market practices of our current peer group companies and determined the level of ownership that would best align the interests of our executives with those of our stockholders. The independent members of the Board are also subject to stock ownership guidelines, which can be found below in the section of this Proxy Statement entitled “Director Compensation.”
Group/Name | Ownership Requirement (Market Value of Stock Held) | Deadline to Meet Requirement | ||
Mr. Bonney | 5 x Base Salary | By March 2020 | ||
EVPs | 3 x Base Salary | By March 2020 | ||
Other Executive Officers | 1.5 x Base Salary | By 6 years after becoming an Executive Officer |
The guidelines require that any Executive Officer who has not met the ownership requirement after the start of the period during which he or she is required to do so, may only sell vested in-the-money stock options and vested RSUs or PRSUs, provided that he or she retains shares of common stock with a market value at least equal to the net proceeds received as a result of such sale until such time as the Executive Officer meets the requirements of the guidelines. To the extent any Executive Officer is not in compliance with the guidelines as of January 1st of any year after which the Executive Officer is required to be in compliance, the Executive Officer will be required to once again be in compliance by January 1st of the immediately succeeding year.
As of January 1, 2014, Mr. Bonney and our Other NEOs who are required to meet the ownership requirement by January 1, 2014 had achieved the ownership requirement.
Anti-Hedging and Pledging Policy
As part of our Policy on Insider Trading and Confidentiality, all of our employees, including our NEOs, as well as our directors and consultants, are prohibited from engaging in speculative transactions in our stock, including short sales, puts/calls, hedging transactions and margin accounts or pledges.
Recoupment Policy
The Board has adopted a policy providing that, if the independent members of the Board determine, in their reasonable and sole discretion, that any fraud, gross negligence or intentional misconduct by our CEO or CFO caused or contributed to us having to restate all or a portion of our financial statements, then the independent directors may take any action they deem necessary or appropriate to remedy the misconduct and prevent its recurrence. The policy further provides that the independent directors, to the fullest extent permitted by law in cases they deem appropriate, will require reimbursement to us by our CEO or CFO of any bonus or incentive compensation awarded to him, effect the cancellation of outstanding equity awards to him and seek reimbursement of any gains realized by him on the exercise or sale of any equity-based awards if and to the extent that: (a) the amount of the bonus or equity compensation was calculated based upon the achievement of certain financial results that were subsequently reduced due to a restatement, (b) our CEO or CFO engaged in any fraud, gross negligence or intentional misconduct that caused or contributed to the need for the restatement, and (c) the amount of the bonus or equity compensation that would have been awarded to our CEO or CFO had the results been properly reported would have been lower than the amount actually awarded. When final regulations regarding recoupment are available under the Dodd-Frank Act, we will revisit this policy and revise as necessary in accordance with then-existing law.
Impact of Accounting and Tax
The Compensation Committee has considered the impact of accounting and tax treatments on our use of equity incentives as a key retention tool. The Compensation Committee has determined that the current estimated costs of continuing to use equity incentives, including stock options, RSUs and PRSUs, relative to the benefits we believe these programs provide does not warrant any change to our current equity incentive framework.
Section 162(m) of the Internal Revenue Code of 1986, as amended, or Internal Revenue Code, limits the tax deduction for compensation paid to NEOs (with the exception of CFOs) to $1,000,000. This deduction limitation does not apply to compensation that constitutes “qualified performance-based compensation” within the meaning of Section 162(m) of the Internal Revenue Code and regulations promulgated thereunder, including certain performance-based compensation that has been approved by stockholders. While the Compensation Committee is
mindful of the benefit to our performance of full deductibility of compensation, the Compensation Committee believes that it should not be constrained by the requirements of Section 162(m) of the Internal Revenue Code where those requirements would impair flexibility in compensating our executive officers in a manner that can best promote our corporate objectives. Therefore, the Compensation Committee has not adopted a policy that requires that all compensation be deductible and approval of compensation, including the grant of stock options or other “performance-based compensation” to our executive officers, by the Compensation Committee is not a guarantee of deductibility under the Internal Revenue Code. The Compensation Committee intends to continue to compensate our executive officers in a manner consistent with the best interests of the company and our stockholders. We have in the past, and may in the future, award compensation that is not fully deductible under the Internal Revenue Code when we view such compensation as consistent with our compensation policies and in the best interests of the company and our stockholders.
Under our retention letters with our NEOs and transition agreement with Mr. McGirr, we do not compensate executives for any excise tax liability they may incur by reason of payments and benefits received pursuant to the letters. As a result, if an NEO is assessed any excise tax liability under Section 280G of the Internal Revenue Code as a result of payments and benefits received under a retention letter in connection with a change-in-control, that NEO is responsible for the payment of such excise tax.
Equity Granting Practices
We have never had a program or policy in place to coordinate equity grants with the release of material, non-public information. Throughout the year, we issue stock option and RSU awards to our employees and, beginning in 2013, PRSU awards to our NEOs, in connection with hiring, promotion and our annual performance cycle. In addition, the Compensation Committee has authorized a pool of shares of our common stock from which Mr. Bonney may issue equity awards to certain employees, which does not include our Executive Officers, from time to time during the year in recognition of extraordinary results. All options are priced no lower than the closing market price of our common stock on the grant date. The Compensation Committee approves guidelines for equity awards issued in connection with hiring, promotion and our annual performance cycle. Mr. Bonney is required to further approve or delegate authority to approve all individual awards issued in accordance with the foregoing pools and guidelines. In 2013, the Compensation Committee approved all awards of stock options, RSUs and PRSUs to Executive Officers other than Mr. Bonney and all awards to non-Executive Officers that are made outside of pre-approved guidelines, and the independent members of the Board approved all awards of stock options, RSUs and PRSUs to Mr. Bonney. Effective as of February 2014, the Compensation Committee approves all awards of stock options, RSUs and PRSUs for all of our Executive Officers, including Mr. Bonney, and all awards to non-Executive Officers that are made outside of pre-approved guidelines, and the independent members of the Board ratify all awards of stock options, RSUs and PRSUs to Mr. Bonney.
Summary Compensation Table
The following table provides information concerning the compensation of our NEOs for the years covered in the table.
Name and Principal Position | Year (b) | Salary ($) (c) | Bonus ($) (d) | Stock Awards ($)(1) (e) | Option Awards ($)(2) (f) | Non-Equity Incentive Plan Compensation ($)(3) (g) | Change in Pension Value and Non-Qualified Deferred Compensation Earnings ($)(4) (h) | All Other Compensation ($)(5) (i) | Total ($) (j) | |||||||||||||||||||||||||||
Michael Bonney | 2013 | 750,000 | — | 2,499,994 | 2,499,998 | 840,000 | — | 16,953 | 6,606,945 | |||||||||||||||||||||||||||
CEO | 2012 | 700,000 | — | 1,590,300 | 2,875,340 | 623,000 | — | 12,887 | 5,801,527 | |||||||||||||||||||||||||||
| 2011 | 600,000 | — | 1,113,440 | 2,197,563 | 810,000 | — | 12,429 | 4,733,432 | ||||||||||||||||||||||||||||
David McGirr(6) | 2013 | 265,625 | — | 199,971 | — | 155,208 | — | 16,396 | 637,200 | |||||||||||||||||||||||||||
Former SVP & CFO | 2012 | 414,000 | — | 252,540 | 545,261 | 226,541 | — | 12,887 | 1,451,229 | |||||||||||||||||||||||||||
| 2011 | 400,000 | — | 194,852 | 439,513 | 329,832 | — | 12,429 | 1,376,626 | ||||||||||||||||||||||||||||
Michael Tomsicek(7) | 2013 | 358,734 | — | 499,904 | 499,994 | 237,421 | — | 16,779 | 1,612,832 | |||||||||||||||||||||||||||
SVP & CFO | 2012 | — | — | — | — | — | — | — | — | |||||||||||||||||||||||||||
| 2011 | — | — | — | — | — | — | — | — | ||||||||||||||||||||||||||||
Robert Perez | 2013 | 600,000 | — | 849,971 | 850,000 | 538,200 | — | 16,953 | 2,855,124 | |||||||||||||||||||||||||||
President & COO | 2012 | 552,625 | — | 1,214,185 | 1,810,543 | 374,875 | — | 12,887 | 3,965,115 | |||||||||||||||||||||||||||
| 2011 | 470,000 | — | 695,900 | 1,255,750 | 395,928 | — | 12,429 | 2,830,007 | ||||||||||||||||||||||||||||
Thomas DesRosier(8) | 2013 | 376,042 | — | 436,463 | 1,018,493 | 272,650 | — | 16,595 | 2,120,243 | |||||||||||||||||||||||||||
EVP, Chief Legal and Administrative Officer | 2012 | — | — | — | — | — | — | — | — | |||||||||||||||||||||||||||
| 2011 | — | — | — | — | — | — | — | — | ||||||||||||||||||||||||||||
Steven Gilman | 2013 | 475,000 | — | 649,958 | 649,994 | 318,060 | — | 16,946 | 2,109,958 | |||||||||||||||||||||||||||
EVP, R&D & CSO | 2012 | 460,000 | — | 631,350 | 1,090,523 | 248,952 | — | 12,986 | 2,443,811 | |||||||||||||||||||||||||||
| 2011 | 430,000 | — | 487,130 | 879,025 | 354,569 | — | 12,404 | 2,163,128 | ||||||||||||||||||||||||||||
| (1) | Represents the grant date fair value of each NEO’s 2013 RSU and PRSU awards as of February 15, 2013 for Mr. Bonney, Mr. Tomsicek, Mr. McGirr, Mr. Perez and Dr. Gilman and as of April 15, 2013 for Mr. Tomsicek in connection with his promotion to CFO in March 2013 and Mr. DesRosier in connection with his hiring in March 2013. The grant date fair value of each share of common stock underlying the awards of RSUs and PRSUs in 2013 was: (i) $41.60, the closing price of our common stock on the grant date on February 15, 2013; and (ii) $45.90, the closing price of our common stock on April 15, 2013. |
| (2) | Represents the grant date fair value of each NEO’s 2013 stock option award using the Black-Scholes option-pricing model in accordance with the Financial Accounting Standards Board Accounting Standards Codification, or ASC, Topic 718. In determining the Black-Scholes value, we used the assumptions described in the notes to the consolidated audited financial statements in our Annual Report on Form 10-K for each of the covered fiscal years as of the grant date. Mr. DesRosier’s stock options were awarded in April 2013, and an additional grant to Mr. Tomsicek in connection with his promotion to CFO was awarded in April 2013. All other stock options included in this column for 2013 were awarded in February 2013 during our annual performance cycle. |
| (3) | Reflects the cash bonus awards earned in the covered year under our STIP or Management Incentive Plan, as applicable, in effect for such year. Payments for awards earned in each covered year were made in the first quarter of the immediately succeeding year. |
| (4) | We do not have either a pension plan or a non-qualified deferred compensation plan for any of our U.S. employees. In 2012, we adopted a Swiss retirement plan, or Swiss Retirement Plan, that is similar to a non-qualified defined contribution plan and under which certain employees of our Swiss subsidiary, Cubist Pharmaceuticals GmbH, are eligible to participate. None of our 2013 NEOs were eligible to participate under the Swiss Retirement Plan. |
| (5) | All Other Compensation for 2013 for each NEO consists primarily of 401(k) matching contributions of approximately $15,200. |
| (6) | In March 2013, Mr. McGirr resigned as our CFO and became Senior Advisor to the CEO. |
| (7) | Mr. Tomsicek was promoted to CFO in March 2013 and was not an NEO in 2011 and 2012. |
| (8) | Mr. DesRosier was hired in March 2013 and was not an NEO in 2011 and 2012. |
Grants of Plan-Based Awards in 2013
The following table provides information concerning grants of plan-based awards made to our NEOs during 2013.
| Estimated Future Payouts Under Non-Equity Incentive Plan Awards(1) | Estimated Future Payouts Under Equity Incentive Plan Awards | All Other Stock Awards: Number of Shares of Stock or Units (#)(2) (i) | All Other Option Awards: Number of Securities Underlying Options (#)(3) (j) | Exercise or Base Price of Option Awards ($/Sh)(4) (k) | Grant Date Fair Value of Stock and Option Awards ($)(5) (l) | |||||||||||||||||||||||||||||||||||||||||||
Name (a) | Grant Date (b) | Date of Board or Committee Action (b-1) | Threshold ($) (c) | Target ($) (d) | Maximum ($) (e) | Threshold (#) (f) | Target (#) (g) | Maximum (#) (h) | ||||||||||||||||||||||||||||||||||||||||
Michael Bonney | ||||||||||||||||||||||||||||||||||||||||||||||||
Annual Cash | ||||||||||||||||||||||||||||||||||||||||||||||||
Performance Award | — | — | 600,000 | 750,000 | 1,500,000 | — | — | — | — | — | — | — | ||||||||||||||||||||||||||||||||||||
Stock Option Award | 2/15/2013 | 2/5/2013 | — | — | — | — | — | — | — | 184,044 | 41.60 | 2,499,998 | ||||||||||||||||||||||||||||||||||||
PRSU Award | 2/15/2013 | 2/5/2013 | — | — | — | — | — | — | 60,096 | — | — | 2,499,994 | ||||||||||||||||||||||||||||||||||||
David McGirr | ||||||||||||||||||||||||||||||||||||||||||||||||
Annual Cash | ||||||||||||||||||||||||||||||||||||||||||||||||
Performance Award | — | — | 114,750 | 143,438 | 286,876 | — | — | — | — | — | — | — | ||||||||||||||||||||||||||||||||||||
RSU Award | 2/15/2013 | 2/4/2013 | — | — | — | — | — | — | 4,807 | — | — | 199,971 | ||||||||||||||||||||||||||||||||||||
Michael Tomsicek | ||||||||||||||||||||||||||||||||||||||||||||||||
Annual Cash | ||||||||||||||||||||||||||||||||||||||||||||||||
Performance Award | — | — | 167,398 | 209,248 | 418,496 | — | — | — | — | — | — | — | ||||||||||||||||||||||||||||||||||||
Stock Option Award | 2/15/2013 | 2/4/2013 | — | — | — | — | — | — | — | 18,404 | 41.60 | 249,995 | ||||||||||||||||||||||||||||||||||||
Stock Option Award | 4/15/2013 | 2/26/2013 | — | — | — | — | — | — | — | 17,233 | 45.90 | 249,999 | ||||||||||||||||||||||||||||||||||||
RSU Award | 2/15/2013 | 2/4/2013 | — | — | — | — | — | — | 3,004 | — | — | 124,967 | ||||||||||||||||||||||||||||||||||||
RSU Award | 4/15/2013 | 2/26/2013 | — | — | — | — | — | — | 5,446 | — | — | 249,971 | ||||||||||||||||||||||||||||||||||||
PRSU Award | 2/15/2013 | 2/4/2013 | — | — | — | — | — | — | 3,004 | — | — | 124,966 | ||||||||||||||||||||||||||||||||||||
Robert Perez | ||||||||||||||||||||||||||||||||||||||||||||||||
Annual Cash | ||||||||||||||||||||||||||||||||||||||||||||||||
Performance Award | — | — | 360,000 | 450,000 | 900,000 | — | — | — | — | — | — | — | ||||||||||||||||||||||||||||||||||||
Stock Option Award | 2/15/2013 | 2/4/2013 | — | — | — | — | — | — | — | 62,575 | 41.60 | 850,000 | ||||||||||||||||||||||||||||||||||||
RSU Award | 2/15/2013 | 2/4/2013 | — | — | — | — | — | — | 10,216 | — | — | 424,985 | ||||||||||||||||||||||||||||||||||||
PRSU Award | 2/15/2013 | 2/4/2013 | — | — | — | — | — | — | 10,216 | — | — | 424,986 | ||||||||||||||||||||||||||||||||||||
Thomas DesRosier | ||||||||||||||||||||||||||||||||||||||||||||||||
Annual Cash | ||||||||||||||||||||||||||||||||||||||||||||||||
Performance Award | — | — | 190,000 | 237,500 | 475,000 | — | — | — | — | — | — | — | ||||||||||||||||||||||||||||||||||||
Stock Option Award | 4/15/2013 | 1/3/2103 | — | — | — | — | — | — | — | 70,207 | 45.90 | 1,018,493 | ||||||||||||||||||||||||||||||||||||
RSU Award | 4/15/2013 | 1/3/2103 | — | — | — | — | — | — | 9,509 | — | — | 436,463 | ||||||||||||||||||||||||||||||||||||
Steven Gilman | ||||||||||||||||||||||||||||||||||||||||||||||||
Annual Cash | ||||||||||||||||||||||||||||||||||||||||||||||||
Performance Award | — | — | 228,000 | 285,000 | 570,000 | — | — | — | — | — | — | — | ||||||||||||||||||||||||||||||||||||
Stock Option Award | 2/15/2013 | 2/4/2013 | — | — | — | — | — | — | — | 47,851 | 41.60 | 649,994 | ||||||||||||||||||||||||||||||||||||
RSU Award | 2/15/2013 | 2/4/2013 | — | — | — | — | — | — | 7,812 | — | — | 324,979 | ||||||||||||||||||||||||||||||||||||
PRSU Award | 2/15/2013 | 2/4/2013 | — | — | — | — | — | — | 7,812 | — | — | 324,979 | ||||||||||||||||||||||||||||||||||||
| (1) | The dollar amounts set forth in the threshold, target and maximum columns are calculated in accordance with the 2013 Management Incentive Plan or STIP, as applicable. The actual awards paid in February 2014 to the NEOs are set forth in the Summary Compensation Table of this Proxy Statement. |
| (2) | Represents an award of RSUs for all our NEOs and an award of PRSUs for Mr. Bonney, Mr. Tomsicek, Mr. Perez, and Dr. Gilman. All RSU awards, other than Mr. McGirr’s, vest in equal annual installments over a four-year period and all PRSU awards vest at the end of a three-year performance period and are subject to the company’s achievement of certain pre-specified performance targets. Mr. McGirr’s RSU award, which was issued in connection with his transition from the position of CFO to Senior Advisor to the CEO, vests 100% at the end of one year. |
| (3) | All stock option awards have a four-year vesting schedule, vesting equally over 16 quarters, and have a 10-year term. |
| (4) | The exercise prices reflect the closing price of our common stock on the grant date. |
| (5) | The fair value of stock option awards represents the grant date fair value of the award using the Black-Scholes option-pricing model. The grant date fair value of stock options for Mr. Bonney, Mr. Tomsicek, Mr. Perez and Dr. Gilman, granted on February 15, 2013 was $13.58 per share and the grant date fair value of stock options for Mr. Tomsicek and Mr. DesRosier, granted on April 15, 2013 was $14.51 per share. The grant date fair value of each award of RSUs and PRSUs granted in February was $41.60 for Mr. Bonney, Mr. Tomsicek, Mr. McGirr, Mr. Perez and Dr. Gilman. The grant date fair value of each award of RSUs granted in April for Mr. Tomsicek and Mr. DesRosier was $45.90. |
Outstanding Equity Awards at 2013 Fiscal Year End(1)
The following tables provide information concerning outstanding equity awards held by each NEO as of December 31, 2013.
| Option Awards | Stock Awards | |||||||||||||||||||||||||||||||||||
| Equity | Equity Incentive Plan | |||||||||||||||||||||||||||||||||||
| Incentive | Awards: | |||||||||||||||||||||||||||||||||||
| Equity | Plan | Market or | ||||||||||||||||||||||||||||||||||
| Incentive | Awards: | Payout | ||||||||||||||||||||||||||||||||||
| Plan | Number of | Value of | ||||||||||||||||||||||||||||||||||
| Awards: | Market | Unearned | Unearned | |||||||||||||||||||||||||||||||||
Name (a) | Number of Securities Underlying Unexercised Options (#) Exercisable (b) | Number of Securities Underlying Unexercised Options (#) Unexercisable(1) (c) | Number of Securities Underlying Unexercised, Unearned Options (#) (d) | Option Exercise Price ($) (e) | Option Expiration Date(2) (f) | Number of Shares or Units of Stock That Have Not Vested (#)(3) (g) | Value of Shares or Units of Stock That Have Not Vested ($)(4) (h) | Shares, Units or Other Rights That Have Not Vested (#) (i) | Shares, Units or Other Rights That Have Not Vested ($) (j) | |||||||||||||||||||||||||||
Michael Bonney | 100,000 | — | — | 10.84 | 7/1/2014 | — | — | — | — | |||||||||||||||||||||||||||
| 100,000 | — | — | 10.87 | 2/14/2015 | — | — | — | — | ||||||||||||||||||||||||||||
| 80,000 | — | — | 21.61 | 1/31/2016 | — | — | — | — | ||||||||||||||||||||||||||||
| 125,000 | — | — | 19.51 | 2/15/2017 | — | — | — | — | ||||||||||||||||||||||||||||
| 150,000 | — | — | 18.10 | 2/15/2018 | — | — | — | — | ||||||||||||||||||||||||||||
| 150,000 | — | — | 16.76 | 5/15/2019 | — | — | — | — | ||||||||||||||||||||||||||||
| 118,125 | 16,875 | — | 21.56 | 5/14/2020 | — | — | — | — | ||||||||||||||||||||||||||||
| 109,375 | 65,625 | — | 34.80 | 5/13/2021 | — | — | — | — | ||||||||||||||||||||||||||||
| 87,500 | 112,500 | — | 42.09 | 2/19/2022 | — | — | — | — | ||||||||||||||||||||||||||||
| 34,508 | 149,536 | — | 41.60 | 2/15/2023 | — | — | — | — | ||||||||||||||||||||||||||||
| — | — | — | — | — | 110,846 | 7,633,964 | — | — | ||||||||||||||||||||||||||||
David McGirr | 20,000 | — | — | 23.12 | 8/15/2017 | — | — | — | — | |||||||||||||||||||||||||||
| 30,000 | — | — | 18.10 | 2/15/2018 | — | — | — | — | ||||||||||||||||||||||||||||
| 40,000 | — | — | 16.76 | 5/15/2019 | — | — | — | — | ||||||||||||||||||||||||||||
| 30,625 | 4,375 | — | 21.56 | 5/14/2020 | — | — | — | — | ||||||||||||||||||||||||||||
| 21,875 | 13,125 | — | 34.80 | 5/13/2021 | — | — | — | — | ||||||||||||||||||||||||||||
| 16,406 | 21,094 | — | 42.09 | 2/16/2022 | — | — | — | — | ||||||||||||||||||||||||||||
| — | — | — | — | — | 13,982 | 962,940 | — | — | ||||||||||||||||||||||||||||
Michael Tomsicek | 16,250 | 3,750 | — | 23.50 | 9/15/2020 | — | — | — | — | |||||||||||||||||||||||||||
| 11,250 | 6,750 | — | 34.80 | 5/13/2021 | — | — | — | — | ||||||||||||||||||||||||||||
| 4,375 | 5,625 | — | 42.09 | 2/16/2022 | — | — | — | — | ||||||||||||||||||||||||||||
| 4,687 | 10,313 | — | 43.81 | 8/15/2022 | — | — | — | — | ||||||||||||||||||||||||||||
| 3,450 | 14,954 | — | 41.60 | 2/15/2023 | — | — | — | — | ||||||||||||||||||||||||||||
| 2,154 | 15,079 | — | 45.90 | 4/15/2023 | — | — | — | — | ||||||||||||||||||||||||||||
| — | — | — | — | — | 20,704 | 1,425,884 | — | — | ||||||||||||||||||||||||||||
| (1) | Under some circumstances, the vesting of equity awards may be accelerated in accordance with the terms of the NEO’s retention letter, or in the case of Mr. McGirr, the transition agreement, and the terms of our Amended and Restated 2000 Equity Incentive Plan, or 2000 Plan, the 2010 Equity Incentive Plan, or 2010 Plan, and the 2012 Plan, which are the plans under which these awards were granted. |
| (2) | All stock option grants have a four-year vesting schedule, vest equally over 16 quarters and have a 10-year term. |
| (3) | Represents awards of RSUs and PRSUs. All RSU awards vest in equal annual installments over a four-year period, with the exception of the RSU award granted to Mr. McGirr in February 2013, which vests 100% at the end of one year. All PRSU awards vest at the end of three years if certain pre-specified performance criteria are met. |
| (4) | Calculated using a per share price of $68.87, the closing price of our common stock on December 31, 2013. |
| Option Awards | Stock Awards | |||||||||||||||||||||||||||||||||||
| Equity | Equity Incentive Plan | |||||||||||||||||||||||||||||||||||
| Incentive | Awards: | |||||||||||||||||||||||||||||||||||
| Equity | Plan | Market or | ||||||||||||||||||||||||||||||||||
| Incentive | Awards: | Payout | ||||||||||||||||||||||||||||||||||
| Plan | Number of | Value of | ||||||||||||||||||||||||||||||||||
| Awards: | Market | Unearned | Unearned | |||||||||||||||||||||||||||||||||
Name (a) | Number of Securities Underlying Unexercised Options (#) Exercisable (b) | Number of Securities Underlying Unexercised Options (#) Unexercisable(1) (c) | Number of Securities Underlying Unexercised, Unearned Options (#) (d) | Option Exercise Price ($) (e) | Option Expiration Date(2) (f) | Number of Shares or Units of Stock That Have Not Vested (#)(3) (g) | Value of Shares or Units of Stock That Have Not Vested ($)(4) (h) | Shares, Units or Other Rights That Have Not Vested (#) (i) | Shares, Units or Other Rights That Have Not Vested ($) (j) | |||||||||||||||||||||||||||
Robert Perez | 20,000 | — | — | 22.14 | 6/16/2016 | — | — | — | — | |||||||||||||||||||||||||||
| 30,000 | — | — | 19.51 | 2/15/2017 | — | — | — | — | ||||||||||||||||||||||||||||
| 25,000 | — | — | 23.12 | 8/15/2017 | — | — | — | — | ||||||||||||||||||||||||||||
| 50,000 | — | — | 21.91 | 9/14/2017 | — | — | — | — | ||||||||||||||||||||||||||||
| 40,000 | — | — | 18.10 | 2/15/2018 | — | — | — | — | ||||||||||||||||||||||||||||
| 62,500 | — | — | 16.76 | 5/15/2019 | — | — | — | — | ||||||||||||||||||||||||||||
| 65,625 | 9,375 | — | 21.56 | 5/14/2020 | — | — | — | — | ||||||||||||||||||||||||||||
| 62,500 | 37,500 | — | 34.80 | 5/13/2021 | — | — | — | — | ||||||||||||||||||||||||||||
| 43,750 | 56,250 | — | 42.09 | 2/16/2022 | — | — | — | — | ||||||||||||||||||||||||||||
| 7,812 | 17,188 | — | 43.81 | 8/15/2022 | — | — | — | — | ||||||||||||||||||||||||||||
| 11,732 | 50,843 | — | 41.60 | 2/15/2023 | — | — | — | — | ||||||||||||||||||||||||||||
| — | — | — | — | — | 54,932 | 3,783,167 | — | — | ||||||||||||||||||||||||||||
Thomas DesRosier | 8,775 | 61,432 | — | 45.90 | 4/15/2023 | 9,509 | 654,885 | — | — | |||||||||||||||||||||||||||
Steven Gilman | 25,000 | — | — | 18.69 | 3/14/2018 | — | — | — | — | |||||||||||||||||||||||||||
| 16,125 | — | — | 16.76 | 5/15/2019 | — | — | — | — | ||||||||||||||||||||||||||||
| 52,500 | 7,500 | — | 21.56 | 5/14/2020 | — | — | — | — | ||||||||||||||||||||||||||||
| 37,500 | 12,500 | — | 25.23 | 10/15/2020 | — | — | — | — | ||||||||||||||||||||||||||||
| 43,750 | 26,250 | — | 34.80 | 5/13/2021 | — | — | — | — | ||||||||||||||||||||||||||||
| 32,812 | 42,188 | — | 42.09 | 2/16/2022 | — | — | — | — | ||||||||||||||||||||||||||||
| 8,972 | 38,879 | — | 41.60 | 2/15/2023 | — | — | — | — | ||||||||||||||||||||||||||||
| — | — | — | — | — | 36,374 | 2,505,077 | — | — | ||||||||||||||||||||||||||||
| (1) | Under some circumstances, the vesting of equity awards may be accelerated in accordance with the terms of the NEO’s retention letter and the terms of the 2000 Plan, the 2010 Plan, and the 2012 Plan, which are the plans under which these awards were granted. |
| (2) | All stock option grants have a four-year vesting schedule, vest equally over 16 quarters and have a 10-year term. |
| (3) | Represents awards of RSUs and PRSUs. All RSU awards vest in equal annual installments over a four-year period. All PRSU awards vest at the end of three years if certain pre-specified performance criteria are met. |
| (4) | Calculated using a per share price of $68.87, the closing price of our common stock on December 31, 2013. |
Option Exercises and Stock Vested in 2013
The following table provides information concerning the exercise of stock options and the vesting of RSUs held by each NEO in 2013.
| Option Awards | Stock Awards(1) | |||||||||||||||
Name (a) | Number of Shares Acquired on Exercise (#) (b) | Value Realized on Exercise ($)(2) (c) | Number of Shares Acquired on Vesting (#) (d) | Value Realized on Vesting ($)(3) (e) | ||||||||||||
Michael Bonney | 165,452 | 5,903,821 | 28,750 | 1,337,933 | ||||||||||||
David McGirr | 85,500 | 3,721,661 | 6,375 | 299,794 | ||||||||||||
Michael Tomsicek | — | — | 3,583 | 184,833 | ||||||||||||
Robert Perez | 70,000 | 3,068,012 | 18,375 | 886,902 | ||||||||||||
Thomas DesRosier | — | — | — | — | ||||||||||||
Steven Gilman | 30,125 | 935,104 | 12,250 | 569,983 | ||||||||||||
| (1) | Consists of awards of RSUs, which vest in equal annual installments over a four-year period. |
| (2) | Computed by multiplying the number of options that were exercised by the difference between the market prices of our common stock upon exercise and the exercise prices of the exercised stock options. |
| (3) | Computed by multiplying the number of shares that vested by the closing fair market value of our common stock on the date of vesting. |
Termination of Employment and Change-in-Control Agreements
Our retention letters with our NEOs provide certain protections to our NEOs in the event their employment is terminated as summarized in the following table.
Key Retention Letter Elements(1) | CEO | Other NEOs(2) | ||
Retention Letter Term | Expires in August 2016, except in the case of a change-in-control prior to the expiration date in which case the term extends for two years following the change-in-control. | Expires in August 2016, except in the case of a change-in-control prior to the expiration date in which case the term becomes the later of: (a) three years from the date of the retention letter; and (b) two years following the change-in-control. | ||
Severance | 24 months of base salary, if terminated without cause at any time, payable over six months starting 60 days after termination.
24 months of base salary and one year’s annual performance award (higher of previous year award or current target award), payable in one lump sum payment, if, within 24 months following achange-in-control, the CEO is terminated without cause or resigns for good reason. | 18 months of base salary, if terminated without cause at any time, payable over six months starting 60 days after termination.
18 months of base salary and one year’s annual performance award (higher of previous year award or current target award), payable in one lump sum payment, if, within 24 months following a change-in control, the NEO is terminated without cause or resigns for good reason. | ||
| Key Retention Letter Elements(1) | CEO | Other NEOs(2) | ||
Benefit Continuation (medical and dental insurance only) | The reimbursement, on a monthly basis, for the company portion of medical and dental coverage for 24 months after the CEO becomes entitled to severance payments, as long as the CEO pays the full monthly premium for such coverage in each such month. | The reimbursement, on a monthly basis, for the company portion of medical and dental coverage for 18 months after he or she becomes entitled to severance payments, as long as the NEO pays the full monthly premium for such coverage in each such month. | ||
Equity Vesting Acceleration | Vesting of equity is accelerated only if, within 24 months following achange-in-control, the CEO is terminated without cause or resigns for good reason. | Vesting of equity is accelerated only if, within 24 months following a change-in-control, the NEO is terminated without cause or resigns for good reason. | ||
| (1) | Additional details and definitions can be found in the actual retention letters. Mr. Bonney’s retention letter and a form of the retention letter with our Other NEOs are on file with the SEC. |
| (2) | Mr. McGirr had a retention letter until March 2013 with the same terms as described in the table above, but when he transitioned to Senior Advisor to the CEO on March 4, 2013, he entered into a transition agreement with a fixed term expiring June 1, 2014. Pursuant to his transition agreement he is entitled to severance payments in the event of his termination in an amount equal to $637,500, less the amount of his reduced-time base salary received since March 31, 2013, payable over six months starting 60 days after his termination. Mr. McGirr is also entitled to severance in the event of the termination of his employment, other than for cause, following a change-in-control, in an amount equal to $637,500 plus the target annual bonus amount for the year in which the change-in-control occurs, payable in a lump sum payment 60 days after his termination. The company will continue to pay, on a monthly basis, an amount equal to the company portion of medical and dental coverage for Mr. McGirr for 18 months after he becomes entitled to severance payments, as long as Mr. McGirr pays the full monthly premiums for such coverage in each such month. Vesting of equity is accelerated if Mr. McGirr becomes entitled to severance payments in the event of the termination of his employment, other than for cause, following a change-in-control. |
Receipt of any severance and benefits is conditioned on the NEO signing and not revoking a release of claims within 50 days of his or her last date of employment with the company. In addition, NEOs will continue to be bound by the obligations set forth in our Employee Confidentiality Agreement. None of our NEOs are entitled to a gross-up associated with taxes, including but not limited to, any taxes owed on change-in-control payments or parachute payment taxes. The retention letters with our NEOs and the transition agreement with Mr. McGirr do contain “best after-tax provisions,” which provide for reduced payments or other benefits to our NEOs if doing so would result in the NEO receiving a higher aggregate amount net of all applicable taxes.
The remainder of this section summarizes quantitative disclosures for each NEO regarding estimated payments and other benefits that would have been received by the NEO or his or her estate if his or her employment terminated as of the last business day of the year, December 31, 2013, under the following circumstances:
| • | Termination by us for cause. |
| • | Termination by us without cause not following a change-in-control. |
| • | Termination by us without cause or by the NEO for good reason following a change-in-control. |
Payments to Michael Bonney Assuming a December 31, 2013 Termination
| Cash Severance | Benefits on Continuation ($)(3) | 401(k) Plan Balance ($)(4) | Total ($) | |||||||||||||||||||||||||||||||||
| Base Salary | Performance Award | Value of Vested | Value of Accelerated Unvested | |||||||||||||||||||||||||||||||||
Circumstances of Termination: | Multiple | $ | Multiple | $ | Equity ($)(1) | Equity ($)(2) | ||||||||||||||||||||||||||||||
Termination for cause | N/A | N/A | N/A | N/A | 49,585,530 | N/A | 34,887 | 940,174 | 50,560,591 | |||||||||||||||||||||||||||
Termination without cause not following a change-in-control | 2.0 | 1,500,000 | N/A | N/A | 49,585,530 | N/A | 34,887 | 940,174 | 52,060,591 | |||||||||||||||||||||||||||
Termination without cause or resignation for good reason following a change-in-control | 2.0 | 1,500,000 | 1.0 | 750,000 | (5) | 49,585,530 | 17,759,089 | 34,887 | 940,174 | 70,569,680 | ||||||||||||||||||||||||||
| (1) | The per share value for vested option awards is equal to the difference between the option exercise price and $68.87, our closing stock price on December 31, 2013. The per share value for vested RSU awards is based on our December 31, 2013 closing stock price of $68.87. See the Outstanding Equity Awards at 2013 Fiscal Year End table for the vesting status of Mr. Bonney’s equity awards as of December 31, 2013. |
| (2) | For the situation where unvested equity would be accelerated (termination without cause or resignation for good reason following a change-in-control), all unvested equity is assumed to have accelerated vesting as of December 31, 2013. The amount shown in this column represents the difference between $68.87, our closing stock price on December 31, 2013, and the exercise price for each tranche of options multiplied by the number of shares of common stock underlying options with accelerated vesting in each such tranche plus the value of each share of common stock underlying each unvested RSU award, which was valued using a stock price of $68.87, our closing stock price on December 31, 2013. |
| (3) | Mr. Bonney’s benefits are continued for 24 months, subject to certain conditions. The cost of benefits includes the employer cost of health and dental insurance only. Mr. Bonney’s monthly cost of benefits for months 19-24 of the benefit continuation period are assumed to be equal to the cost for months 1-18. In an actual termination situation, the cost of benefits may change in months 19-24 due to the potential expiration of COBRA benefits coverage as full group insurance rates may apply. |
| (4) | Represents the entire balance of Mr. Bonney’s 401(k) account. We match 100% of each U.S. employee’s 401(k) contributions up to 6% of the employee’s cash compensation, subject to a statutory cap, in the form of common stock. All of our U.S. employees are eligible for this match, not just our NEOs. |
| (5) | The amount shown here is 100% of Mr. Bonney’s annual target award opportunity for fiscal year 2013 because that amount is higher than Mr. Bonney’s 2012 award. |
Payments to David McGirr Assuming a December 31, 2013 Termination(1)
| Cash Severance | Equity | Benefits Continuation ($)(4) | 401(k) Plan Balance ($)(5) | Total ($) | ||||||||||||||||||||||||||||||||
| Base Salary | Performance Award | Value of Vested | Value of Accelerated Unvested | |||||||||||||||||||||||||||||||||
| Circumstances of Termination: | Multiple | $ | Multiple | $ | Equity ($)(2) | Equity ($)(3) | ||||||||||||||||||||||||||||||
Termination for cause | N/A | N/A | N/A | N/A | 7,156,112 | N/A | 22,962 | 752,340 | 7,931,414 | |||||||||||||||||||||||||||
Termination without cause not following a change-in-control | N/A | 478,125 | N/A | N/A | 7,156,112 | N/A | 22,962 | 752,340 | 8,409,539 | |||||||||||||||||||||||||||
Termination without cause or resignation with good reason following a change-in-control | N/A | 637,500 | 1.0 | 143,438 | 7,156,112 | 2,182,053 | 22,962 | 752,340 | 10,894,405 | |||||||||||||||||||||||||||
| (1) | The table above sets forth payments to Mr. McGirr pursuant to his transition agreement described above. |
| (2) | The per share value for vested option awards is equal to the difference between the option exercise price and $68.87, our closing stock price on December 31, 2013. The per share value for vested RSU awards is based on our December 31, 2013 closing stock price of $68.87. See the Outstanding Equity Awards at 2013 Fiscal Year End table for the vesting status of Mr. McGirr’s equity awards as of December 31, 2013. |
| (3) | For the situation where unvested equity would be accelerated (termination without cause or resignation for good reason following a change-in-control), all unvested equity is assumed to have accelerated vesting as of December 31, 2013. The amount shown in this column represents the difference between $68.87, our closing stock price on December 31, 2013, and the exercise price for each tranche of options multiplied by the number of shares of common stock underlying options with accelerated vesting in each such tranche plus the value of each share of common stock underlying each unvested RSU award, which was valued using a stock price of $68.87, our closing stock price on December 31, 2013. |
| (4) | Mr. McGirr’s benefits are continued for 18 months. The cost of benefits includes our cost of health and dental insurance only. |
| (5) | Represents the entire balance of Mr. McGirr’s 401(k) account. We match 100% of each U.S. employee’s 401(k) contributions up to 6% of the employee’s cash compensation, subject to a statutory cap, in the form of common stock. All of our U.S. employees are eligible for this match, not just our NEOs. |
Payments to Michael Tomsicek Assuming a December 31, 2013 Termination
| Cash Severance | Equity | Benefits Continuation ($)(3) | 401(k) Plan Balance ($)(4) | Total ($) | ||||||||||||||||||||||||||||||||
| Base Salary | Performance Award | Value of Vested | Value of Accelerated Unvested | |||||||||||||||||||||||||||||||||
Circumstances of Termination: | Multiple | $ | Multiple | $ | Equity ($)(1) | Equity ($)(2) | ||||||||||||||||||||||||||||||
Termination for cause | N/A | N/A | N/A | N/A | 1,498,784 | N/A | 26,096 | 98,136 | 1,623,016 | |||||||||||||||||||||||||||
Termination without cause not following a change-in-control | 1.5 | 538,101 | N/A | N/A | 1,498,784 | N/A | 26,096 | 98,136 | 2,161,117 | |||||||||||||||||||||||||||
Termination without cause or resignation with good reason following a change-in-control | 1.5 | 538,101 | 1.0 | 209,248 | (5) | 1,498,784 | 2,989,269 | 26,096 | 98,136 | 5,359,634 | ||||||||||||||||||||||||||
| (1) | The per share value for vested option awards is equal to the difference between the option exercise price and $68.87, our closing stock price on December 31, 2013. The per share value for vested RSU awards is based on our December 31, 2013 closing stock price of $68.87. See the Outstanding Equity Awards at 2013 Fiscal Year End table for the vesting status of Mr. Tomsicek’s equity awards as of December 31, 2013. |
| (2) | For the situation where unvested equity would be accelerated (termination without cause or resignation for good reason following a change-in-control), all unvested equity is assumed to have accelerated vesting as of December 31, 2013. The amount shown in this column represents the difference between $68.87, our closing stock price on December 31, 2013, and the exercise price for each tranche of options multiplied by the number of shares of common stock underlying options with accelerated vesting in each such tranche plus the value of each share of common stock underlying each unvested RSU award, which was valued using a stock price of $68.87, our closing stock price on December 31, 2013. |
| (3) | Mr. Tomsicek’s benefits are continued for 18 months. The cost of benefits includes our cost of health and dental insurance only. |
| (4) | Represents the entire balance of Mr. Tomsicek’s 401(k) account. We match 100% of each U.S. employee’s 401(k) contributions up to 6% of the employee’s cash compensation, subject to a statutory cap, in the form of common stock. All of our U.S. employees are eligible for this match, not just our NEOs. |
| (5) | The amount shown here is 100% of Mr. Tomsicek’s annual target award opportunity for fiscal year 2013 because that amount is higher than Mr. Tomsicek’s 2012 award. |
Payments to Robert Perez Assuming a December 31, 2013 Termination
| Cash Severance | Equity | Benefits Continuation ($)(3) | 401(k) Plan Balance ($)(4) | Total ($) | ||||||||||||||||||||||||||||||||
| Base Salary | Performance Award | Value of Vested | Value of Accelerated Unvested | |||||||||||||||||||||||||||||||||
Circumstances of Termination: | Multiple | $ | Multiple | $ | Equity ($)(1) | Equity ($)(2) | ||||||||||||||||||||||||||||||
Termination for cause | N/A | N/A | N/A | N/A | 18,116,557 | N/A | 26,096 | 578,519 | 18,721,172 | |||||||||||||||||||||||||||
Termination without cause not following a change-in-control | 1.5 | 900,000 | N/A | N/A | 18,116,557 | N/A | 26,096 | 578,519 | 19,621,172 | |||||||||||||||||||||||||||
Termination without cause or resignation with good reason following a change-in-control | 1.5 | 900,000 | 1.0 | 450,000 | (5) | 18,116,557 | 8,828,106 | 26,096 | 578,519 | 28,899,278 | ||||||||||||||||||||||||||
| (1) | The per share value for vested option awards is equal to the difference between the option exercise price and $68.87, our closing stock price on December 31, 2013. The per share value for vested RSU awards is based on our December 31, 2013 closing stock price of $68.87. See the Outstanding Equity Awards at 2013 Fiscal Year End table for the vesting status of Mr. Perez’s equity awards as of December 31, 2013. |
| (2) | For the situation where unvested equity would be accelerated (termination without cause or resignation for good reason following a change-in-control), all unvested equity is assumed to have accelerated vesting as of December 31, 2013. The amount shown in this column represents the difference between $68.87, our closing stock price on December 31, 2013, and the exercise price for each tranche of options multiplied by the number of shares of common stock underlying options with accelerated vesting in each such tranche plus the value of each share of common stock underlying each unvested RSU award, which was valued using a stock price of $68.87, our closing stock price on December 31, 2013. |
| (3) | Mr. Perez’s benefits are continued for 18 months. The cost of benefits includes our cost of health and dental insurance only. |
| (4) | Represents the entire balance of Mr. Perez’s 401(k) account. We match 100% of each U.S. employee’s 401(k) contributions up to 6% of the employee’s cash compensation, subject to a statutory cap, in the form of common stock. All of our U.S. employees are eligible for this match, not just our NEOs. |
| (5) | The amount shown here is 100% of Mr. Perez’s annual target award opportunity for fiscal year 2013 because that amount is higher than Mr. Perez’s 2012 award. |
Payments to Thomas DesRosier Assuming a December 31, 2013 Termination
| Cash Severance | Equity | Benefits Continuation ($)(3) | 401(k) Plan Balance ($)(4) | Total ($) | ||||||||||||||||||||||||||||||||
| Base Salary | Performance Award | Value of Vested | Value of Accelerated Unvested | |||||||||||||||||||||||||||||||||
Circumstances of Termination: | Multiple | $ | Multiple | $ | Equity ($)(1) | Equity ($)(2) | ||||||||||||||||||||||||||||||
Termination for cause | N/A | N/A | N/A | N/A | 201,562 | N/A | 0 | 30,958 | 232,520 | |||||||||||||||||||||||||||
Termination without cause not following a change-in-control | 1.5 | 712,500 | N/A | N/A | 201,562 | N/A | 0 | 30,958 | 945,020 | |||||||||||||||||||||||||||
Termination without cause or resignation with good reason following a change-in-control | 1.5 | 712,500 | 1.0 | 237,500 | (5) | 201,562 | 2,065,978 | 0 | 30,958 | 3,248,498 | ||||||||||||||||||||||||||
| (1) | The per share value for vested option awards is equal to the difference between the option exercise price and $68.87, our closing stock price on December 31, 2013. The per share value for vested RSU awards is based on our December 31, 2013 closing stock price of $68.87. See the Outstanding Equity Awards at 2013 Fiscal Year End table for the vesting status of Mr. DesRosier’s equity awards as of December 31, 2013. |
| (2) | For the situation where unvested equity would be accelerated (termination without cause or resignation for good reason following a change-in-control), all unvested equity is assumed to have accelerated vesting as of December 31, 2013. The amount shown in this column represents the difference between $68.87, our closing stock price on December 31, 2013, and the exercise price for each tranche of options multiplied by the number of shares of common stock underlying options with accelerated vesting in each such tranche plus the value of each share of common stock underlying each unvested RSU award, which was valued using a stock price of $68.87, our closing stock price on December 31, 2013. |
| (3) | Mr. DesRosier waived health and dental insurance from the company. |
| (4) | Represents the entire balance of Mr. DesRosier’s 401(k) account. We match 100% of each U.S. employee’s 401(k) contributions up to 6% of the employee’s cash compensation, subject to a statutory cap, in the form of common stock. All of our U.S. employees are eligible for this match, not just our NEOs. |
| (5) | The amount shown here is 100% of Mr. DesRosier’s annual target award opportunity for fiscal year 2013 because Mr. DesRosier was not employed by the company in 2012 and therefore did not receive an award in 2012. |
Payments to Steven Gilman Assuming a December 31, 2013 Termination
| Cash Severance | Equity | Benefits Continuation ($)(3) | 401(k) Plan Balance ($)(4) | Total ($) | ||||||||||||||||||||||||||||||||
| Base Salary | Performance Award | Value of Vested | Value of Accelerated Unvested | |||||||||||||||||||||||||||||||||
| Circumstances of Termination: | Multiple | $ | Multiple | $ | Equity ($)(1) | Equity ($)(2) | ||||||||||||||||||||||||||||||
Termination for cause | N/A | N/A | N/A | N/A | 8,829,202 | N/A | 17,396 | 356,617 | 9,203,215 | |||||||||||||||||||||||||||
Termination without cause not following a change-in-control | 1.5 | 712,500 | N/A | N/A | 8,829,202 | N/A | 17,396 | 356,617 | 9,915,715 | |||||||||||||||||||||||||||
Termination without cause or resignation with good reason following a change-in-control | 1.5 | 712,500 | 1.0 | 285,000 | (5) | 8,829,202 | 6,489,896 | 17,396 | 356,617 | 16,690,611 | ||||||||||||||||||||||||||
| (1) | The per share value for vested option awards is equal to the difference between the option exercise price and $68.87, our closing stock price on December 31, 2013. The per share value for vested RSU awards is based on our December 31, 2013 closing stock price of $68.87. See the Outstanding Equity Awards at 2013 Fiscal Year End table for the vesting status of Dr. Gilman’s equity awards as of December 31, 2013. |
| (2) | For the situation where unvested equity would be accelerated (termination without cause or resignation for good reason following a change-in-control), all unvested equity is assumed to have accelerated vesting as of December 31, 2013. The amount shown in this column represents the difference between $68.87, our closing stock price on December 31, 2013, and the exercise price for each tranche of options multiplied by the number of shares of common stock underlying options with accelerated vesting in each such tranche plus the value of each share of common stock underlying each unvested RSU award, which was valued using a stock price of $68.87, our closing stock price on December 31, 2013. |
| (3) | Dr. Gilman’s benefits are continued for 18 months. The cost of benefits includes our cost of health and dental insurance only. |
| (4) | Represents the entire balance of Dr. Gilman’s 401(k) account. We match 100% of each U.S. employee’s 401(k) contributions up to 6% of the employee’s cash compensation, subject to a statutory cap, in the form of common stock. All of our U.S. employees are eligible for this match, not just our NEOs. |
| (5) | The amount shown here is 100% of Dr. Gilman’s annual target award opportunity for fiscal year 2013 because that amount is higher than Dr. Gilman’s 2012 award. |