Filed by MAF Bancorp, Inc. pursuant to
Rule 425 under the Securities Act of 1933.
Subject Company: Fidelity Bancorp, Inc.
(Securities Act File No. 333-104655)
On May 21, 2003, MAF Bancorp, Inc. (“MAF”) announced that it has agreed to acquire St. Francis Capital Corporation (“St. Francis”) in an all-stock transaction with a fixed exchange ratio. Based on the closing price of MAF’s common stock on May 20, 2003, the transaction is valued at approximately $264 million. Pursuant to a definitive agreement between the two companies, St. Francis will merge into MAF, with MAF to be the surviving corporation. As a result of the merger, each issued and outstanding share of St. Francis common stock will be converted into the right to receive 0.79 shares of MAF common stock. The transaction is subject to regulatory approvals and approval by the holders of a majority of MAF’s common stock and the holders of a majority of St. Francis’ common stock. Set forth below are copies of the joint press release issued by MAF and St. Francis and the presentation materials for a conference call relating to the merger.
THE FOLLOWING NEWS RELEASE WAS ISSUED ON MAY 21, 2003:
FOR IMMEDIATE RELEASE
FOR: | MAF Bancorp, Inc. | St. Francis Capital Corporation. | ||
55th Street & Holmes Avenue | 13400 Bishops Lane, Suite 350 | |||
Clarendon Hills, IL 60514 | Brookfield, WI 53005 | |||
CONTACTS: | Allen H. Koranda, | Thomas R. Perz, | ||
Chairman and CEO | Chairman and CEO | |||
(630) 887-5800 | (262) 787-8786 | |||
Jerry A. Weberling, | Jon D. Sorenson | |||
EVP and Chief Financial Officer | EVP and Chief Financial Officer | |||
(630) 887-5999 | (262) 787-8716 |
MAF BANCORP, INC. TO ACQUIRE ST. FRANCIS CAPITAL CORPORATION
Market Expansion Transaction Projected to Add to Earnings per Share in First Year
Clarendon Hills, Illinois, May 21, 2003 – MAF Bancorp, Inc. (NASDAQ: MAFB) and St. Francis Capital Corporation (NASDAQ: STFR) jointly announced today that Chicago-based MAF has agreed to acquire St. Francis in an all-stock, strategic alliance that will expand MAF’s market presence into the Milwaukee area. St. Francis, with assets of approximately $2.3 billion at March 31, 2003, is the holding company for St. Francis Bank, which has 22 branch offices in Milwaukee and its surrounding areas. Allen Koranda, Chairman and CEO of MAF and Thomas Perz, Chairman and CEO of St. Francis announced that their respective boards of directors have approved a definitive agreement under which St. Francis will be merged into MAF.
Pursuant to the merger agreement, each share of St. Francis common stock will be converted into 0.79 shares of MAF common stock. Based on the closing price of MAF common stock on May 20, 2003, the transaction has a current value of approximately $264 million in the aggregate and $26.57 per St. Francis share. Following the completion of the St. Francis acquisition and the previously announced acquisition of Chicago-based Fidelity Bancorp, MAF will have total assets of more than $9 billion and a market capitalization of approximately $1.1 billion.
The transaction, which is subject to approval by the Office of Thrift Supervision and the FDIC, and the approval of MAF and St. Francis stockholders, is structured to be tax-free to the stockholders of St. Francis. The companies currently expect the transaction to close in the fourth quarter of 2003. In connection with the merger, St. Francis Bank will be merged with Mid America Bank, the banking subsidiary of MAF Bancorp. MAF’s current plans are to operate in the Milwaukee area under the St. Francis name following the merger.
Allen Koranda, Chairman of the Board and Chief Executive Officer of MAF Bancorp, said, “This is an excellent opportunity to acquire a quality company that gives us a significant entry into an attractive, adjacent new market. Milwaukee is the largest major metropolitan market nearest to Chicago, and the two cities are separated by only 80 miles. St. Francis is a strong competitor, holding the # 5 deposit market share in the Milwaukee area. We believe the franchise is well positioned to take advantage of opportunities in the city’s many attractive markets, offering us a great deal of potential for future growth.”
“St. Francis Bank is an ideal partner for us, being a high quality organization with a successful community banking model similar to our own. Both companies have strong core deposit levels. Their focus on commercial, multifamily and consumer lending will be an excellent complement to our strengths in residential lending and provide good asset diversification to our overall loan portfolio. We appreciate the confidence that Tom and his Board have shown in us in choosing to enter into this transaction.” Koranda indicated that no St. Francis branch offices would be closed following the merger.
Thomas Perz, Chairman and Chief Executive Officer of St. Francis Capital, stated, “The idea of linking up with one of Chicago’s top financial institutions had strong appeal to us. MAF has demonstrated an ability to compete effectively in the highly desirable and competitive banking market in Chicago, consistently reporting strong earnings results and excellent returns to shareholders. Our shareholders will benefit from the increased liquidity and broader following by the investment community that the larger combined company should offer.” Mr. Perz added, “We also believe this transaction will benefit the communities of Milwaukee. Our loyal customers are the reason St. Francis has enjoyed success over the years. They will find that MAF is a company that shares our commitment to serving the local residents of the communities it serves.”
MAF currently estimates that cost savings from the merger will be equal to approximately 18% of St. Francis’ total non-interest expenses, with approximately 55% of those savings reflected in 2004 operations and 95% achieved for 2005. MAF currently expects to complete the data processing conversion in the spring of 2004. Based on these cost savings estimates and the current estimate of the purchase accounting mark-to-market adjustments, MAF expects the transaction will add approximately $.29 to 2004 diluted EPS, representing accretion of approximately 8%. On a diluted cash EPS basis, which adjusts GAAP EPS to eliminate the accretion or amortization of purchase accounting adjustments, the Company expects the transaction to be approximately 1% accretive in 2004. MAF currently expects after-tax merger-related costs will equal approximately 5% of the transaction value.
Koranda added, “While expansion to a large new market had significant appeal to us, it was also important that we structure a transaction that was financially beneficial to our existing shareholders as well as our new shareholders from St. Francis. We think we have accomplished this.” Koranda also announced that Tom Perz will join MAF for a period of two years following the closing of the merger, assisting in the transition and integration of the two companies. He will also be appointed to the Board of Directors of MAF Bancorp and Mid America Bank. Two other St. Francis board members will also serve on the Mid America Bank board.
2
To underscore its commitment to the Milwaukee area communities it will be serving, MAF also announced a new community lending commitment. Mid America Bank will provide $500 million in loans over the next 5 years to Milwaukee area communities and neighborhoods with predominantly minority populations, to residents of low-to moderate-income census tracts, and to people whose income is below 80% of median income. The $500 million loan commitment will target 1-4 family and multi-family residential lending initiatives. The program will begin following the closing of the St. Francis transaction. The combined bank will preserve and add to the community lending programs and home buying counseling which St. Francis presently offers. Additionally, Mid America Bank will continue the support of local housing groups.
The Company also announced today that it was expanding its stock repurchase program. The Company had previously announced in December 2002 plans to repurchase additional shares in connection with its pending merger with Fidelity Bancorp. Under the new stock repurchase program, which incorporates all previously announced plans, the Company plans to repurchase up to a total of 1.6 million shares in the open market or in privately negotiated transactions.
MAF will host a conference call at 10:00 a.m. Eastern, 9:00 a.m. Central, on Wednesday, May 21, 2003 to discuss the transaction. To participate in the conference call, please call 1-(888) 566-7609 using the pass code 052003. A replay of the call will be available for 10 days by calling 1-(888) 554-3830. A copy of the investor presentation materials relating to the conference call is available on MAF’s website atwww.mafbancorp.com and will also be filed as an exhibit to MAF’s Current Report on Form 8-K, filed today with the SEC and available through the SEC’s website at www.sec.gov.
MAF is the parent company of Mid America Bank, a federally chartered stock savings bank headquartered in Clarendon Hills, IL. At March 31, 2003 the company had assets of $6.0 billion, deposits of $3.8 billion and stockholders’ equity of $517 million. The Bank operates a network of 34 retail banking offices primarily in Chicago and its western suburbs. MAF’s common stock trades on the Nasdaq National Market under the symbol MAFB. On December 17, 2002, MAF announced it had reached an agreement to acquire Fidelity Bancorp in an all-stock transaction valued at approximately $101 million on the date of announcement. As previously disclosed, MAF expects this transaction to close in mid-2003. At March 31, 2003, Fidelity had assets of $723 million, deposits of $458 million and five branch offices in the Chicago area.
St. Francis is the holding company for St. Francis Bank, a federally chartered stock savings bank headquartered in Brookfield, WI. At March 31, 2003, St. Francis had assets of $2.3 billion, deposits of $1.4 billion, and stockholders’ equity of $187 million. St. Francis’s common stock trades on the Nasdaq National Market under the symbol STFR.
3
Forward-Looking Information
Statements contained in this news release that are not historical facts constitute forward-looking statements (within the meaning of Section 21E of the Securities Exchange Act of 1934, as amended), which involve significant risks and uncertainties. MAF and St. Francis intend such forward-looking statements to be covered by the safe harbor provisions for forward-looking statements contained in the Private Securities Litigation Reform Act of 1995, and are including this statement for purposes of invoking the safe harbor provisions. These forward-looking statements include, but are not limited to, statements relating to: (1) the benefits of the proposed merger of MAF and St. Francis, including projected future financial and operating results, estimated cost savings and accretion to MAF’s projected earnings per share that may be realized from the merger and (2) MAF’s and St. Francis’ plans, objectives, and expectations. Forward-looking statements are generally identifiable by the use of words such as “believe,” “expect,” “anticipate,” “estimate,” “project,” “plan,” or similar expressions. The ability of MAF to predict results or the actual effect of future plans and strategies is uncertain and actual results may differ from those predicted. MAF undertakes no obligation to update these forward-looking statements in the future.
Factors which could cause actual results to differ materially from the anticipated results or other expectations expressed in the forward-looking statements include, but are not limited to, difficulties or delays in completing the acquisition of St. Francis, difficulties in the integration or delays in the data processing conversion which may affect MAF’s ability to achieve anticipated cost savings related to the operation of the acquired banking offices of St. Francis, higher than expected costs related to the St. Francis transaction, unanticipated changes in interest rates, deteriorating economic conditions which could result in increased delinquencies in MAF’s or St. Francis’ loan portfolio, changes in purchase accounting adjustments and/or amortization periods, legislative or regulatory developments, monetary and fiscal policies of the U.S. Government, including policies of the U.S. Treasury and the Federal Reserve Board, the quality or composition of MAF’s or St. Francis’ loan or investment portfolios, demand for loan products, secondary mortgage market conditions, deposit flows, competition, demand for financial services and residential real estate in MAF’s and St. Francis’ market area, unanticipated slowdowns in real estate lot sales or problems in closing pending real estate contracts, delays in real estate development projects, higher than expected costs or unanticipated difficulties in connection with MAF’s pending acquisition of Fidelity Bancorp, the possible short-term dilutive effect of other potential acquisitions, if any, and changes in accounting principles, policies and guidelines. These risks and uncertainties should be considered in evaluating forward-looking statements and undue reliance should not be placed on such statements.
NOTE: The following notices are included to meet certain legal requirements.
MAF will be filing a registration statement containing a joint proxy statement/prospectus and other documents regarding the proposed transaction with the Securities and Exchange Commission. MAF and St. Francis shareholders are urged to read the proxy statement/prospectus when it becomes available, because it will contain important information about MAF and St. Francis, and the proposed transaction. When available, copies of this joint proxy statement/prospectus will be mailed to MAF and St. Francis shareholders, and it and other documents filed by MAF or St. Francis with the SEC may be obtained free of charge at the SEC’s web site at http://www.sec.gov, or by directing a request to MAF at 55th Street & Holmes Avenue, Clarendon Hills, IL 60514 or St. Francis at 13400 Bishops Lane, Suite 350, Brookfield, Wisconsin 53005-6203.
4
MAF and St. Francis and their respective directors, executive officers and certain other members of management and employees may be deemed to be participants in the solicitation of proxies from the shareholders of MAF and St. Francis in favor of the proposed merger. Information regarding such persons can be found in MAF’s and St. Francis’ respective proxy statements, annual reports on Form 10-K and quarterly reports on Form 10-Q filed with the SEC. Additional information regarding the interests of such persons will also be set forth in the joint proxy statement/prospectus when it is filed with the SEC.
MAF has filed a registration statement containing a proxy statement/prospectus and other documents regarding the proposed transaction with Fidelity Bancorp, Inc. with the Securities and Exchange Commission. Fidelity shareholders are urged to read the proxy statement/prospectus when it becomes available, because it will contain important information about MAF and Fidelity, and the proposed transaction. When available, copies of the proxy statement/prospectus will be mailed to Fidelity shareholders, and it and other documents filed by MAF or Fidelity with the SEC may be obtained free of charge at the SEC’s web site at http://www.sec.gov, or by directing a request to MAF at 55th Street & Holmes Avenue, Clarendon Hills, IL 60514 or Fidelity at 5455 West Belmont Avenue, Chicago, Illinois 60641.
5
MAF Bancorp / St. Francis Capital / Fidelity Bancorp1
Summary Historical Financial and Other Information
At or for the Three Months Ended 3/31/03 ($ in millions, except share data)
MAFB | STFR | FBCI | |||||||
Assets | $5,984.9 |
| $2,293.4 |
| $723.2 |
| |||
Loans | 4,395.6 |
| 1,279.6 |
| 381.0 |
| |||
Deposits | 3,814.7 |
| 1,363.9 |
| 458.3 |
| |||
Equity | 517.0 |
| 186.9 |
| 61.6 |
| |||
Net income (3 months ended) | 19.3 |
| 6.3 |
| 4.6 |
| |||
Return on assets2 | 1.30 | % | 1.15 | % | 2.53 | %3 | |||
Return on equity2 | 15.10 |
| 13.70 |
| 29.43 |
| |||
Nonperforming assets/assets | 0.62 |
| 0.20 |
| 0.37 |
| |||
Loan loss reserves | $19.5 |
| $14.3 |
| $2.0 |
| |||
Loan loss reserves/nonperforming loans | 77.13 | % | 492.24 | % | 97.34 | % | |||
Shareholders’ equity/assets | 8.64 |
| 8.15 |
| 8.52 |
| |||
Book value per share | $22.18 |
| $19.88 |
| $19.50 |
| |||
Outstanding shares | 23,310,396 |
| 9,398,531 |
| 3,159,553 |
| |||
Market capitalization4 | $783.9 |
| $233.1 |
| $93.4 |
| |||
Retail banking locations | 34 |
| 22 |
| 5 |
| |||
Households served | 183,900 |
| 74,900 |
| 14,800 |
| |||
Employees (FTE) | 1,431 |
| 493 |
| 115 |
|
| 1 | The acquisition of Fidelity Bancorp by MAF Bancorp was announced on December 17, 2002 and is expected to close in the third quarter of 2003. |
| 2 | Certain ratios are annualized. |
| 3 | Includes the effect of a $2.7 million after-tax recovery on an investment previously charged-off. |
| 4 | Based on closing stock prices as of May 20, 2003. |
6
CONFERENCE CALL PRESENTATION MATERIALS DATED MAY 21, 2003:
MAF Bancorp, Inc.
strategic alliance with
St. Francis
Capital Corporation
Investor Presentation
May 21, 2003
Forward-Looking Statements
Information and data contained in this presentation that are not historical facts constitute forward-looking statements (within the meaning of Section 21E of the Securities Exchange Act of 1934, as amended), which involve significant risks and uncertainties. MAF and St. Francis intend such forward-looking statements to be covered by the safe harbor provisions for forward-looking statements contained in the Private Securities Litigation Reform Act of 1995, and are including this statement for purposes of invoking the safe harbor provisions. These forward-looking statements include, but are not limited to, statements relating to: (1) the benefits of the proposed merger of MAF and St. Francis, including projected future financial and operating results, estimated cost savings and accretion to MAF’s projected earnings per share that may be realized from the merger and (2) MAF’s and St. Francis’ plans, objectives, and expectations. Forward-looking statements are generally identifiable by the use of words such as “believe,” “expect,” “anticipate,” “estimate,” “project,” “plan,” or similar expressions. The ability of MAF to predict results or the actual effect of future plans and strategies is uncertain and actual results may differ from those predicted. MAF undertakes no obligation to update these forward-looking statements in the future.
Factors which could cause actual results to differ materially from the anticipated results or other expectations expressed in the forward-looking statements include, but are not limited to, difficulties or delays in completing the acquisition of St. Francis, difficulties in the integration or delays in the data processing conversion which may affect MAF’s ability to achieve anticipated cost savings related to the operation of the acquired banking offices of St. Francis, higher than expected costs related to the St. Francis transaction, unanticipated changes in interest rates, deteriorating economic conditions which could result in increased delinquencies in MAF’s or St. Francis’ loan portfolio, changes in purchase accounting adjustments and/or amortization periods, legislative or regulatory developments, monetary and fiscal policies of the U.S. Government, including policies of the U.S. Treasury and the Federal Reserve Board, the quality or composition of MAF’s or St. Francis’ loan or investment portfolios, demand for loan products, secondary mortgage market conditions, deposit flows, competition, demand for financial services and residential real estate in MAF’s and St. Francis’ market area, unanticipated slowdowns in real estate lot sales or problems in closing pending real estate contracts, delays in real estate development projects, higher than expected costs or unanticipated difficulties in connection with MAF’s pending acquisition of Fidelity Bancorp, the possible short-term dilutive effect of other potential acquisitions, if any, and changes in accounting principles, policies and guidelines. These risks and uncertainties should be considered in evaluating forward-looking statements and undue reliance should not be placed on such statements.
Additional Information
MAF will be filing a registration statement containing a joint proxy statement/prospectus and other documents regarding the proposed transaction with the Securities and Exchange Commission. MAF and St. Francis shareholders are urged to read the proxy statement/prospectus when it becomes available, because it will contain important information about MAF and St. Francis, and the proposed transaction.When available, copies of this joint proxy statement/prospectus will be mailed to MAF and St. Francis shareholders, and it and other documents filed by MAF or St. Francis with the SEC may be obtained free of charge at the SEC’s web site at http://www.sec.gov, or by directing a request to MAF at 55th Street & Holmes Avenue, Clarendon Hills, IL 60514 or St. Francis at 13400 Bishops Lane, Suite 350, Brookfield, Wisconsin 53005-6203.
MAF and St. Francis and their respective directors, executive officers and certain other members of management and employees may be deemed to be participants in the solicitation of proxies from the shareholders of MAF and St. Francis in favor of the proposed merger. Information regarding such persons can be found in MAF’s and St. Francis’ respective proxy statements, annual reports on Form 10-K and quarterly reports on Form 10-Q filed with the SEC. Additional information regarding the interests of such persons will also be set forth in the joint proxy statement/prospectus when it is filed with the SEC.
MAF has filed a registration statement containing a proxy statement/prospectus and other documents regarding the proposed transaction with Fidelity Bancorp, Inc. with the Securities and Exchange Commission. Fidelity shareholders are urged to read the proxy statement/prospectus when it becomes available, because it will contain important information about MAF and Fidelity, and the proposed transaction. When available, copies of the proxy statement/prospectus will be mailed to Fidelity shareholders, and it and other documents filed by MAF or Fidelity with the SEC may be obtained free of charge at the SEC’s web site at http://www.sec.gov, or by directing a request to MAF at 55th Street & Holmes Avenue, Clarendon Hills, IL 60514 or Fidelity at 5455 West Belmont Avenue, Chicago, Illinois 60641.
Discussion Points
¨ Strategic Rationale & Transaction Overview |
¨ Transaction Terms & Pricing |
¨ Pro Forma Financial Impact |
¨ Summary |
¨ Appendix |
Strategic Rationale & Transaction Overview
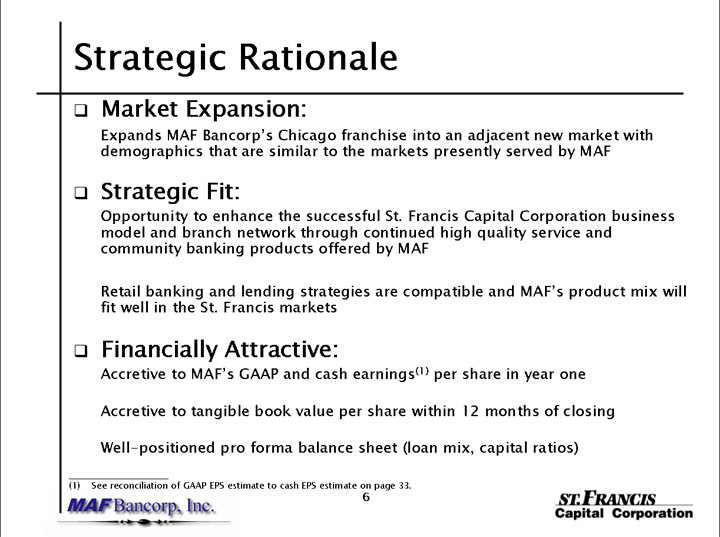
Strategic Rationale
¨ Market Expansion:
Expands MAF Bancorp’s Chicago franchise into an adjacent new market with demographics that are similar to the markets presently served by MAF
¨ Strategic Fit:
Opportunity to enhance the successful St. Francis Capital Corporation business model and branch network through continued high quality service and community banking products offered by MAF
Retail banking and lending strategies are compatible and MAF’s product mix will fit well in the St. Francis markets
¨ Financially Attractive:
Accretive to MAF’s GAAP and cash earnings(1)per share in year one
Accretive to tangible book value per share within 12 months of closing
Well-positioned pro forma balance sheet (loan mix, capital ratios)
(1) See reconciliation of GAAP EPS estimate to cash EPS estimate on page 33.
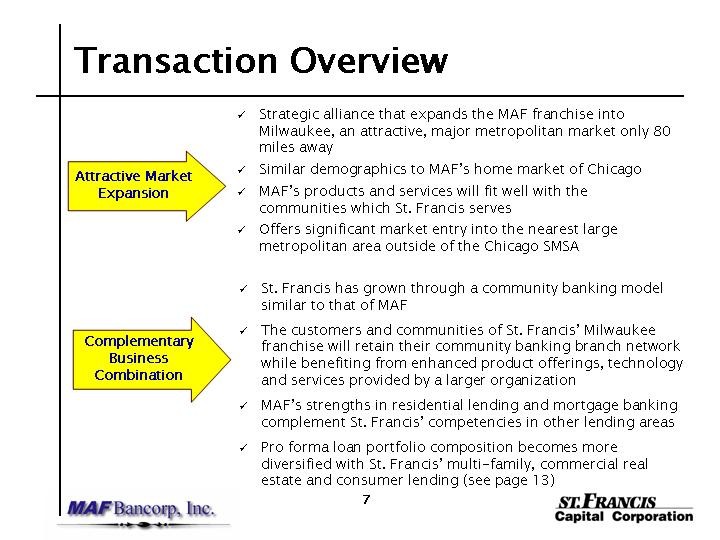
Transaction Overview
Attractive Market Expansion
Strategic alliance that expands the MAF franchise into Milwaukee, an attractive, major metropolitan market only 80 miles away
Similar demographics to MAF’s home market of Chicago
MAF’s products and services will fit well with the communities which St. Francis serves
Offers significant market entry into the nearest large metropolitan area outside of the Chicago SMSA
Complementary Business Combination
St. Francis has grown through a community banking model similar to that of MAF
The customers and communities of St. Francis’ Milwaukee franchise will retain their community banking branch network while benefiting from enhanced product offerings, technology and services provided by a larger organization
MAF’s strengths in residential lending and mortgage banking complement St. Francis’ competencies in other lending areas
Pro forma loan portfolio composition becomes more diversified with St. Francis’ multi-family, commercial real estate and consumer lending (see page 13)
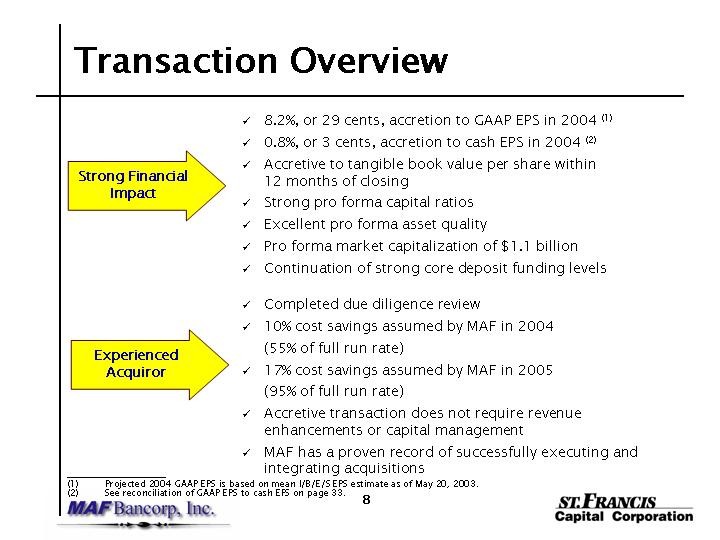
Transaction Overview
Strong Financial Impact
8.2%, or 29 cents, accretion to GAAP EPS in 2004(1)
0.8%, or 3 cents, accretion to cash EPS in 2004(2)
Accretive to tangible book value per share within 12 months of closing
Strong pro forma capital ratios
Excellent pro forma asset quality
Pro forma market capitalization of $1.1 billion
Continuation of strong core deposit funding levels
Experienced Acquiror
Completed due diligence review
10% cost savings assumed by MAF in 2004 (55% of full run rate)
17% cost savings assumed by MAF in 2005 (95% of full run rate)
Accretive transaction does not require revenue enhancements or capital management
MAF has a proven record of successfully executing and integrating acquisitions
(1) Projected 2004 GAAP EPS is based on mean I/B/E/S EPS estimate as of May 20, 2003.
(2) See reconciliation of GAAP EPS to cash EPS on page 33.
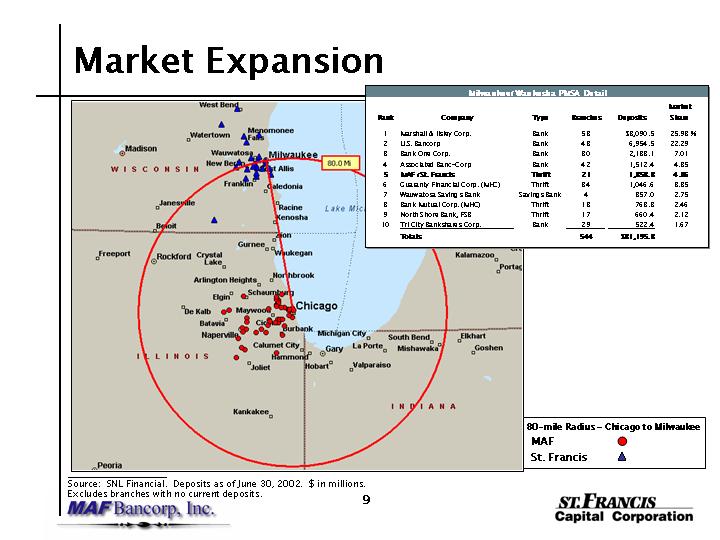
Market Expansion
[MAP]
Milwaukee/Waukesha PMSA Detail
Rank | Company | Type | Branches | Deposits | Market Share | |||||||
1 | Marshall & Ilsley Corp. | Bank | 53 | $ | 8,090.5 | 25.93 | % | |||||
2 | U.S. Bancorp | Bank | 43 |
| 6,954.5 | 22.29 |
| |||||
3 | Bank One Corp. | Bank | 30 |
| 2,188.1 | 7.01 |
| |||||
4 | Associated Banc-Corp | Bank | 42 |
| 1,512.4 | 4.85 |
| |||||
5 | MAF /St. Francis | Thrift | 21 |
| 1,358.8 | 4.36 |
| |||||
6 | Guaranty Financial Corp. (MHC) | Thrift | 34 |
| 1,046.6 | 3.35 |
| |||||
7 | Wauwatosa Savings Bank | Savings Bank | 4 |
| 857.0 | 2.75 |
| |||||
8 | Bank Mutual Corp. (MHC) | Thrift | 18 |
| 768.3 | 2.46 |
| |||||
9 | North Shore Bank, FSB | Thrift | 17 |
| 660.4 | 2.12 |
| |||||
10 | Tri City Bankshares Corp. | Bank | 29 |
| 522.4 | 1.67 |
| |||||
Totals | 544 | $ | 31,195.8 | |||||||||
Source: SNL Financial. Deposits as of June 30, 2002. $ in millions.
Excludes branches with no current deposits.
9
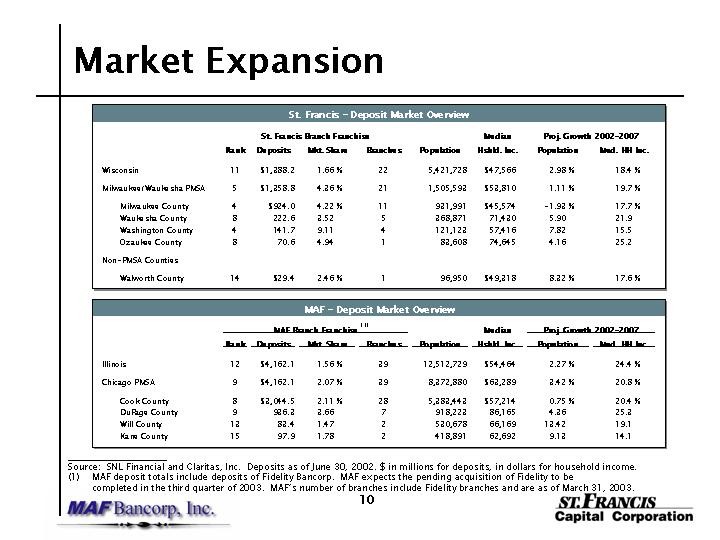
Market Expansion
St. Francis—Deposit Market Overview
St. Francis Branch Franchise | Median | Proj. Growth 2002-2007 | |||||||||||||||||||
Rank | Deposits | Mkt. Share | Branches | Population | Hshld. Inc. | Population | Med. HH Inc. | ||||||||||||||
Wisconsin | 11 | $ | 1,388.2 | 1.66 | % | 22 | 5,421,728 | $ | 47,566 | 2.98 | % | 18.4 | % | ||||||||
Milwaukee/Waukesha PMSA | 5 | $ | 1,358.8 | 4.36 | % | 21 | 1,505,593 | $ | 53,810 | 1.11 | % | 19.7 | % | ||||||||
Milwaukee County | 4 | $ | 924.0 | 4.22 | % | 11 | 931,991 | $ | 45,574 | -1.93 | % | 17.7 | % | ||||||||
Waukesha County | 8 |
| 222.6 | 3.52 |
| 5 | 368,871 |
| 71,430 | 5.90 |
| 21.9 |
| ||||||||
Washington County | 4 |
| 141.7 | 9.11 |
| 4 | 121,123 |
| 57,416 | 7.82 |
| 15.5 |
| ||||||||
Ozaukee County | 8 |
| 70.6 | 4.94 |
| 1 | 83,608 |
| 74,645 | 4.16 |
| 25.2 |
| ||||||||
Non-PMSA Counties | |||||||||||||||||||||
Walworth County | 14 | $ | 29.4 | 2.46 | % | 1 | 96,950 | $ | 49,318 | 8.32 | % | 17.6 | % | ||||||||
MAF—Deposit Market Overview
MAF Branch Franchise (1) | Median | Proj. Growth 2002-2007 | |||||||||||||||||||
Rank | Deposits | Mkt. Share | Branches | Population | Hshld. Inc. | Population | Med. HH Inc. | ||||||||||||||
Illinois | 12 | $ | 4,162.1 | 1.56 | % | 39 | 12,512,729 | $ | 54,464 | 2.27 | % | 24.4 | % | ||||||||
Chicago PMSA | 9 | $ | 4,162.1 | 2.07 | % | 39 | 8,372,880 | $ | 63,289 | 3.42 | % | 20.8 | % | ||||||||
Cook County | 8 | $ | 3,044.5 | 2.11 | % | 28 | 5,383,443 | $ | 57,214 | 0.75 | % | 20.4 | % | ||||||||
DuPage County | 9 |
| 936.3 | 3.66 |
| 7 | 918,223 |
| 86,165 | 4.36 |
| 25.3 |
| ||||||||
Will County | 13 |
| 83.4 | 1.47 |
| 2 | 530,678 |
| 66,169 | 13.42 |
| 19.1 |
| ||||||||
Kane County | 15 |
| 97.9 | 1.78 |
| 2 | 418,891 |
| 62,692 | 9.13 |
| 14.1 |
| ||||||||
Source: SNL Financial and Claritas, Inc. Deposits as of June 30, 2002. $ in millions for deposits, in dollars for household income.
(1) MAF deposit totals include deposits of Fidelity Bancorp. MAF expects the pending acquisition of Fidelity to be completed in the third quarter of 2003. MAF’s number of branches include Fidelity branches and are as of March 31, 2003.
10
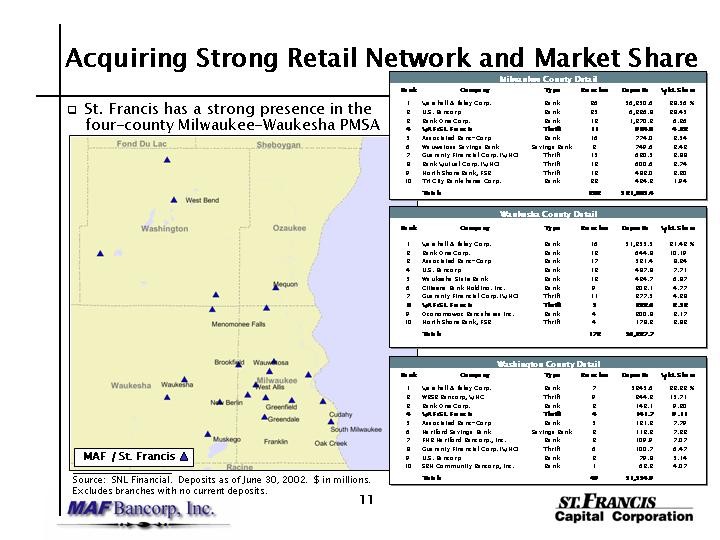
Acquiring Strong Retail Network and Market Share
| q | St. Francis has a strong presence in the four-county Milwaukee-Waukesha PMSA |
[MAP]
Milwaukee County Detail
Rank | Company | Type | Branches | Deposits | Mkt. Share | |||||||
1 | Marshall & Ilsley Corp. | Bank | 26 | $ | 6,250.6 | 28.56 | % | |||||
2 | U.S. Bancorp | Bank | 25 |
| 6,226.8 | 28.45 |
| |||||
3 | Bank One Corp. | Bank | 13 |
| 1,370.3 | 6.26 |
| |||||
4 | MAF/St. Francis | Thrift | 11 |
| 924.0 | 4.22 |
| |||||
5 | Associated Banc-Corp | Bank | 16 |
| 774.0 | 3.54 |
| |||||
6 | Wauwatosa Savings Bank | Savings Bank | 2 |
| 749.6 | 3.43 |
| |||||
7 | Guaranty Financial Corp. (MHC) | Thrift | 15 |
| 630.5 | 2.88 |
| |||||
8 | Bank Mutual Corp. (MHC) | Thrift | 12 |
| 600.6 | 2.74 |
| |||||
9 | North Shore Bank, FSB | Thrift | 13 |
| 482.0 | 2.20 |
| |||||
10 | Tri City Bankshares Corp. | Bank | 22 |
| 424.3 | 1.94 |
| |||||
Totals | 283 | $ | 21,885.4 | |||||||||
Waukesha County Detail
Rank | Company | Type | Branches | Deposits | Mkt. Share | |||||||
1 | Marshall & Ilsley Corp. | Bank | 16 | $ | 1,355.5 | 21.42 | % | |||||
2 | Bank One Corp. | Bank | 13 |
| 644.8 | 10.19 |
| |||||
3 | Associated Banc-Corp | Bank | 17 |
| 521.4 | 8.24 |
| |||||
4 | U.S. Bancorp | Bank | 13 |
| 487.8 | 7.71 |
| |||||
5 | Waukesha State Bank | Bank | 13 |
| 434.7 | 6.87 |
| |||||
6 | Citizens Bank Holding, Inc. | Bank | 9 |
| 302.1 | 4.77 |
| |||||
7 | Guaranty Financial Corp. (MHC) | Thrift | 11 |
| 277.5 | 4.38 |
| |||||
8 | MAF/St. Francis | Thrift | 5 |
| 222.6 | 3.52 |
| |||||
9 | Oconomowoc Bancshares Inc. | Bank | 4 |
| 200.8 | 3.17 |
| |||||
10 | North Shore Bank, FSB | Thrift | 4 |
| 178.3 | 2.82 |
| |||||
Totals | 172 | $ | 6,327.7 | |||||||||
Washington County Detail
Rank | Company | Type | Branches | Deposits | Mkt. Share | |||||||
1 | Marshall & Ilsley Corp. | Bank | 7 | $ | 345.6 | 22.23 | % | |||||
2 | WBSB Bancorp, MHC | Thrift | 9 |
| 244.3 | 15.71 |
| |||||
3 | Bank One Corp. | Bank | 3 |
| 143.1 | 9.20 |
| |||||
4 | MAF/St. Francis | Thrift | 4 |
| 141.7 | 9.11 |
| |||||
5 | Associated Banc-Corp | Bank | 5 |
| 121.2 | 7.79 |
| |||||
6 | Hartford Savings Bank | Savings Bank | 3 |
| 112.3 | 7.22 |
| |||||
7 | FNB Hartford Bancorp., Inc. | Bank | 2 |
| 109.9 | 7.07 |
| |||||
8 | Guaranty Financial Corp. (MHC) | Thrift | 6 |
| 100.7 | 6.47 |
| |||||
9 | U.S. Bancorp | Bank | 3 |
| 79.8 | 5.14 |
| |||||
10 | SBN Community Bancorp, Inc. | Bank | 1 |
| 63.2 | 4.07 |
| |||||
Totals | 49 | $ | 1,554.9 | |||||||||
Source: SNL Financial. Deposits as of June 30, 2002. $ in millions.
Excludes branches with no current deposits.
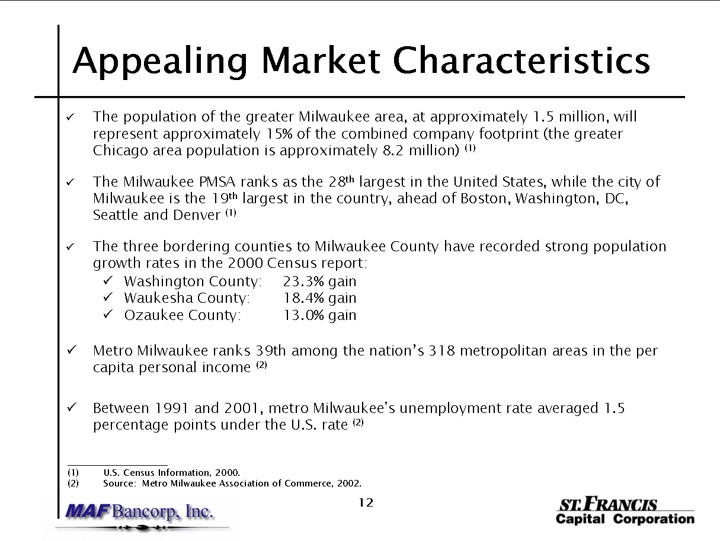
Appealing Market Characteristics
The population of the greater Milwaukee area, at approximately 1.5 million, will represent approximately 15% of the combined company footprint (the greater Chicago area population is approximately 8.2 million)(1)
The Milwaukee PMSA ranks as the 28thlargest in the United States, while the city of Milwaukee is the 19thlargest in the country, ahead of Boston, Washington, DC, Seattle and Denver(1)
The three bordering counties to Milwaukee County have recorded strong population growth rates in the 2000 Census report:
Washington County: 23.3% gain
Waukesha County: 18.4% gain
Ozaukee County: 13.0% gain
Metro Milwaukee ranks 39th among the nation’s 318 metropolitan areas in the per capita personal income(2)
Between 1991 and 2001, metro Milwaukee’s unemployment rate averaged 1.5 percentage points under the U.S. rate(2)
(1) U.S. Census Information, 2000.
(2) Source: Metro Milwaukee Association of Commerce, 2002.
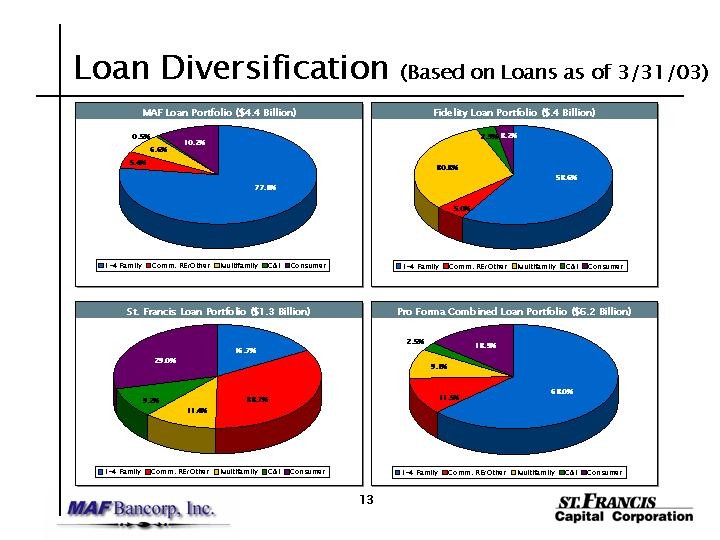
Loan Diversification (Based on Loans as of 3/31/03)
MAF Loan Portfolio ($4.4 Billion)[PIE CHART 1-4 family 77.3%, Comm.RE/other 5.4%, Multifamily 6.6%, C&I 0.5%, Consumer 10.2%]
Fidelity Loan Portfolio ($.4 Billion)[PIE CHART 1-4 family 58.6%, Comm.RE/other 5.0%, Multifamily 30.3%, C&I 2.9%, Consumer 3.2%]
St. Francis Loan Portfolio ($1.3 Billion)[PIE CHART 1-4 family 16.7%, Comm.RE/other 33.7%, Multifamily 11.4%, C&I 9.2%, Consumer 29.0%]
Pro Forma Combined Loan Portfolio ($6.2 Billion)[PIE CHART 1-4 family 63.0%, Comm.RE/other 11.5%, Multifamily 9.1%, C&I 2.5%, Consumer 13.9%]

Transaction Terms & Pricing
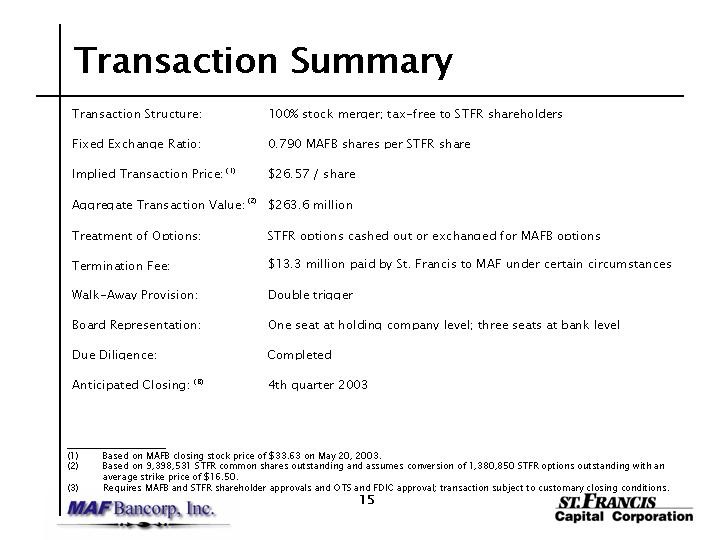
Transaction Summary
Transaction Structure: | 100% stock merger; tax-free to STFR shareholders | |
Fixed Exchange Ratio: | 0.790 MAFB shares per STFR share | |
Implied Transaction Price:(1) | $26.57 / share | |
Aggregate Transaction Value:(2) | $263.6 million | |
Treatment of Options: | STFR options cashed out or exchanged for MAFB options | |
Termination Fee: | $13.3 million paid by St. Francis to MAF under certain circumstances | |
Walk-Away Provision: | Double trigger | |
Board Representation: | One seat at holding company level; three seats at bank level | |
Due Diligence: | Completed | |
Anticipated Closing:(3) | 4th quarter 2003 |
| (1) | Based on MAFB closing stock price of $33.63 on May 20, 2003. |
| (2) | Based on 9,398,531 STFR common shares outstanding and assumes conversion of 1,380,850 STFR options outstanding with an average strike price of $16.50. |
| (3) | Requires MAFB and STFR shareholder approvals and OTS and FDIC approval; transaction subject to customary closing conditions. |
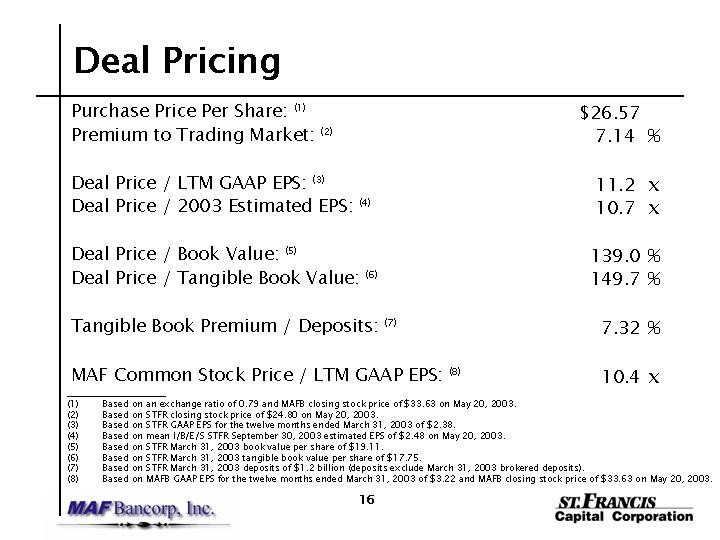
Deal Pricing
Purchase Price Per Share:(1) | $ | 26.57 |
| |
Premium to Trading Market:(2) |
| 7.14 | % | |
Deal Price / LTM GAAP EPS:(3) |
| 11.2 | x | |
Deal Price / 2003 Estimated EPS:(4) |
| 10.7 | x | |
Deal Price / Book Value:(5) |
| 139.0 | % | |
Deal Price / Tangible Book Value:(6) |
| 149.7 | % | |
Tangible Book Premium / Deposits:(7) |
| 7.32 | % | |
MAF Common Stock Price / LTM GAAP EPS:(8) |
| 10.4 | x |
| (1) | Based on an exchange ratio of 0.79 and MAFB closing stock price of $33.63 on May 20, 2003. |
| (2) | Based on STFR closing stock price of $24.80 on May 20, 2003. |
| (3) | Based on STFR GAAP EPS for the twelve months ended March 31, 2003 of $2.38. |
| (4) | Based on mean I/B/E/S STFR September 30, 2003 estimated EPS of $2.48 on May 20, 2003. |
| (5) | Based on STFR March 31, 2003 book value per share of $19.11. |
| (6) | Based on STFR March 31, 2003 tangible book value per share of $17.75. |
| (7) | Based on STFR March 31, 2003 deposits of $1.2 billion (deposits exclude March 31, 2003 brokered deposits). |
| (8) | Based on MAFB GAAP EPS for the twelve months ended March 31, 2003 of $3.22 and MAFB closing stock price of $33.63 on May 20, 2003. |
Pro Forma Financial Impact
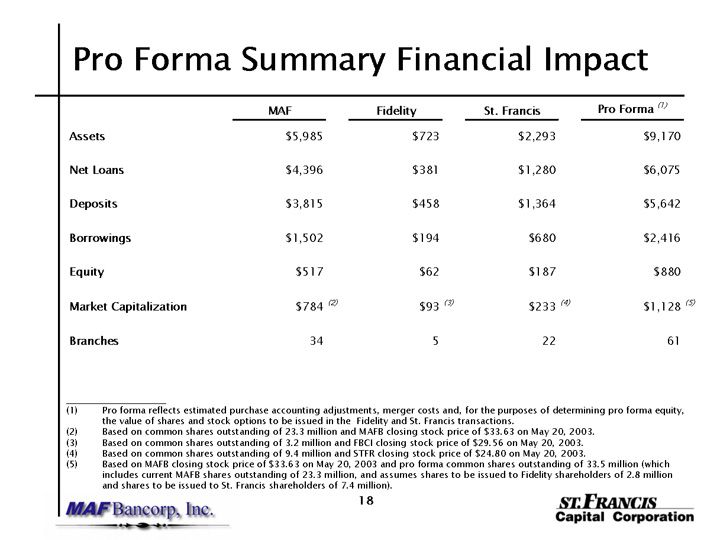
Pro Forma Summary Financial Impact
MAF | Fidelity | St. Francis | Pro Forma (1) | |||||||||||||
Assets | $ | 5,985 |
| $ | 723 |
| $ | 2,293 |
| $ | 9,170 |
| ||||
Net Loans | $ | 4,396 |
| $ | 381 |
| $ | 1,280 |
| $ | 6,075 |
| ||||
Deposits | $ | 3,815 |
| $ | 458 |
| $ | 1,364 |
| $ | 5,642 |
| ||||
Borrowings | $ | 1,502 |
| $ | 194 |
| $ | 680 |
| $ | 2,416 |
| ||||
Equity | $ | 517 |
| $ | 62 |
| $ | 187 |
| $ | 880 |
| ||||
Market Capitalization | $ | 784 | (2) | $ | 93 | (3) | $ | 233 | (4) | $ | 1,128 | (5) | ||||
Branches |
| 34 |
|
| 5 |
|
| 22 |
|
| 61 |
| ||||
| (1) | Pro forma reflects estimated purchase accounting adjustments, merger costs and, for the purposes of determining pro forma equity, the value of shares and stock options to be issued in the Fidelity and St. Francis transactions. |
| (2) | Based on common shares outstanding of 23.3 million and MAFB closing stock price of $33.63 on May 20, 2003. |
| (3) | Based on common shares outstanding of 3.2 million and FBCI closing stock price of $29.56 on May 20, 2003. |
| (4) | Based on common shares outstanding of 9.4 million and STFR closing stock price of $24.80 on May 20, 2003. |
| (5) | Based on MAFB closing stock price of $33.63 on May 20, 2003 and pro forma common shares outstanding of 33.5 million (which includes current MAFB shares outstanding of 23.3 million, and assumes shares to be issued to Fidelity shareholders of 2.8 million and shares to be issued to St. Francis shareholders of 7.4 million). |
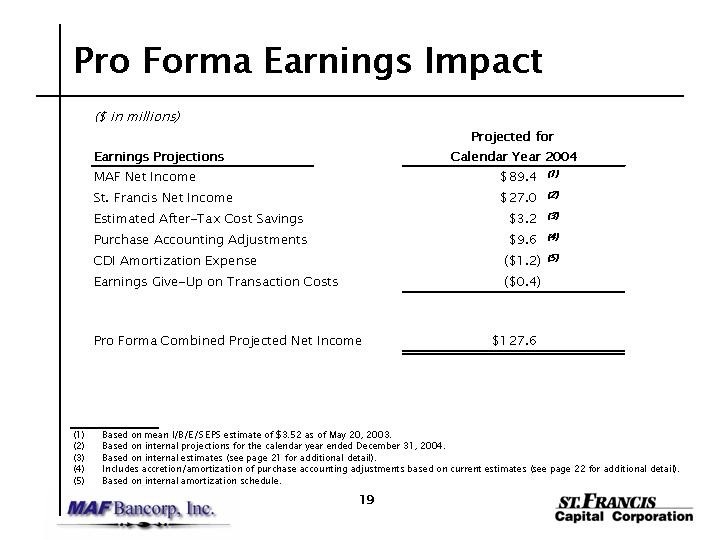
Pro Forma Earnings Impact
($ in millions) | ||||
Earnings Projections | Projected for Calendar Year 2004 | |||
MAF Net Income | $ | 89.4 | (1) | |
St. Francis Net Income | $ | 27.0 | (2) | |
Estimated After-Tax Cost Savings | $ | 3.2 | (3) | |
Purchase Accounting Adjustments | $ | 9.6 | (4) | |
CDI Amortization Expense | $ | (1.2 | )(5) | |
Earnings Give-Up on Transaction Costs | $ | (0.4 | ) | |
Pro Forma Combined Projected Net Income | $ | 127.6 |
| |
| (1) | Based on mean I/B/E/S EPS estimate of $3.52 as of May 20, 2003. |
| (2) | Based on internal projections for the calendar year ended December 31, 2004. |
| (3) | Based on internal estimates (see page 21 for additional detail). |
| (4) | Includes accretion/amortization of purchase accounting adjustments based on current estimates (see page 22 for additional detail). |
| (5) | Based on internal amortization schedule. |
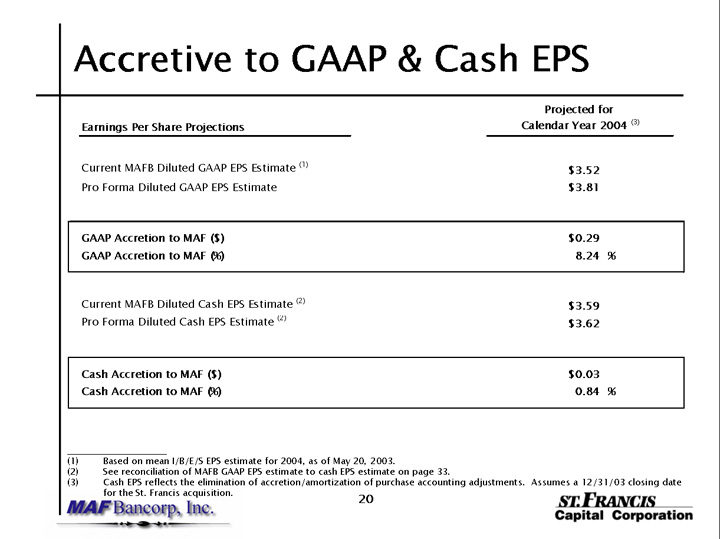
Accretive to GAAP & Cash EPS
Earnings Per Share Projections | Projected for Calendar Year 2004 (3) | |||
Current MAFB Diluted GAAP EPS Estimate(1) | $ | 3.52 |
| |
Pro Forma Diluted GAAP EPS Estimate | $ | 3.81 |
| |
GAAP Accretion to MAF ($) | $ | 0.29 |
| |
GAAP Accretion to MAF (%) |
| 8.24 | % | |
Current MAFB Diluted Cash EPS Estimate(2) | $ | 3.59 |
| |
Pro Forma Diluted Cash EPS Estimate (2) | $ | 3.62 |
| |
Cash Accretion to MAF ($) | $ | 0.03 |
| |
Cash Accretion to MAF (%) |
| 0.84 | % | |
| (1) | Based on mean I/B/E/S EPS estimate for 2004, as of May 20, 2003. |
| (2) | See reconciliation of MAFB GAAP EPS estimate to cash EPS estimate on page 33. |
| (3) | Cash EPS reflects the elimination of accretion/amortization of purchase accounting adjustments. Assumes a 12/31/03 closing date for the St. Francis acquisition. |
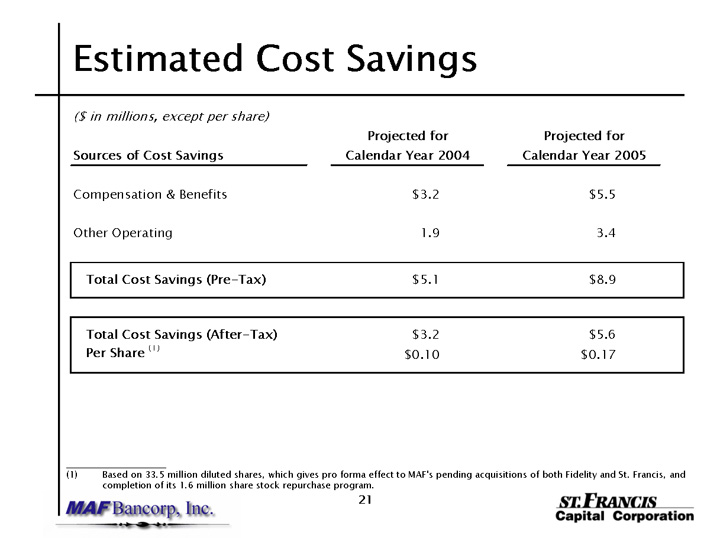
Estimated Cost Savings
($ in millions, except per share) |
Sources of Cost Savings | Projected for Calendar Year 2004 | Projected for Calendar Year 2005 | ||||
Compensation & Benefits | $ | 3.2 | $ | 5.5 | ||
Other Operating |
| 1.9 |
| 3.4 | ||
Total Cost Savings (Pre-Tax) | $ | 5.1 | $ | 8.9 | ||
Total Cost Savings (After-Tax) | $ | 3.2 | $ | 5.6 | ||
Per Share(1) | $ | 0.10 | $ | 0.17 | ||
(1) Based on 33.5 million diluted shares, which gives pro forma effect to MAF’s pending acquisitions of both Fidelity and St. Francis, and completion of its 1.6 million share stock repurchase program.
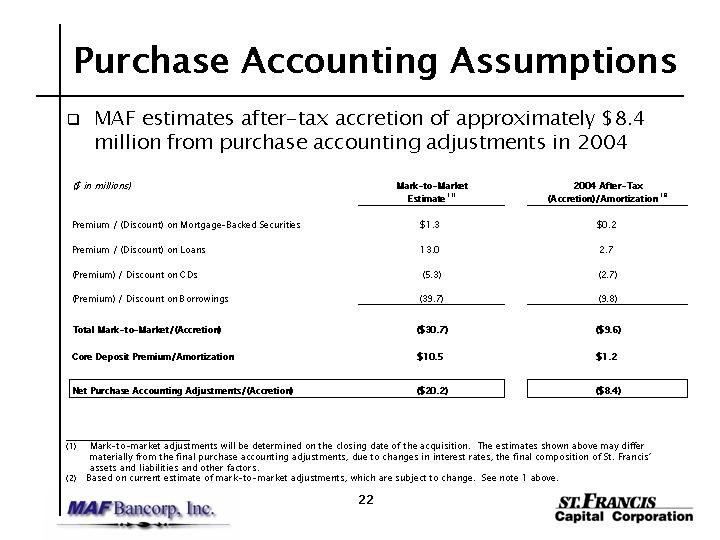
Purchase Accounting Assumptions
| q | MAF estimates after-tax accretion of approximately $8.4 million from purchase accounting adjustments in 2004 |
($ in millions) | Mark- to-Market Estimate (1) | 2004 After-Tax (Accretion)/Amortization (2) | ||||||
Premium / (Discount) on Mortgage-Backed Securities | $ | 1.3 |
| $ | 0.2 |
| ||
Premium / (Discount) on Loans |
| 13.0 |
|
| 2.7 |
| ||
(Premium) / Discount on CDs |
| (5.3 | ) |
| (2.7 | ) | ||
(Premium) / Discount on Borrowings |
| (39.7 | ) |
| (9.8 | ) | ||
Total Mark-to-Market/(Accretion) | $ | (30.7 | ) | $ | (9.6 | ) | ||
Core Deposit Premium/Amortization | $ | 10.5 |
| $ | 1.2 |
| ||
Net Purchase Accounting Adjustments/(Accretion) | $ | (20.2 | ) | $ | (8.4 | ) | ||
| (1) | Mark-to-market adjustments will be determined on the closing date of the acquisition. The estimates shown above may differ materially from the final purchase accounting adjustments, due to changes in interest rates, the final composition of St. Francis’ assets and liabilities and other factors. |
| (2) | Based on current estimate of mark-to-market adjustments, which are subject to change. See note 1 above. |
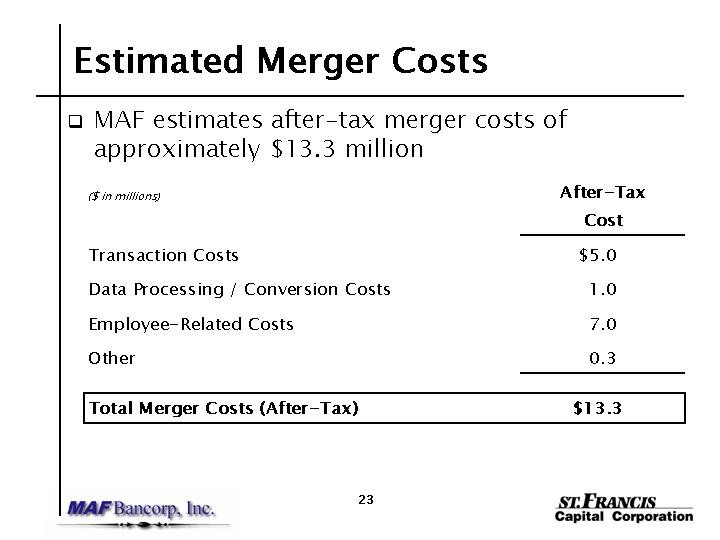
Estimated Merger Costs
| q | MAF estimates after-tax merger costs of approximately $13.3 million |
($ in millions) | After-Tax Cost | ||
Transaction Costs | $ | 5.0 | |
Data Processing / Conversion Costs |
| 1.0 | |
Employee-Related Costs |
| 7.0 | |
Other |
| 0.3 | |
Total Merger Costs (After-Tax) | $ | 13.3 | |
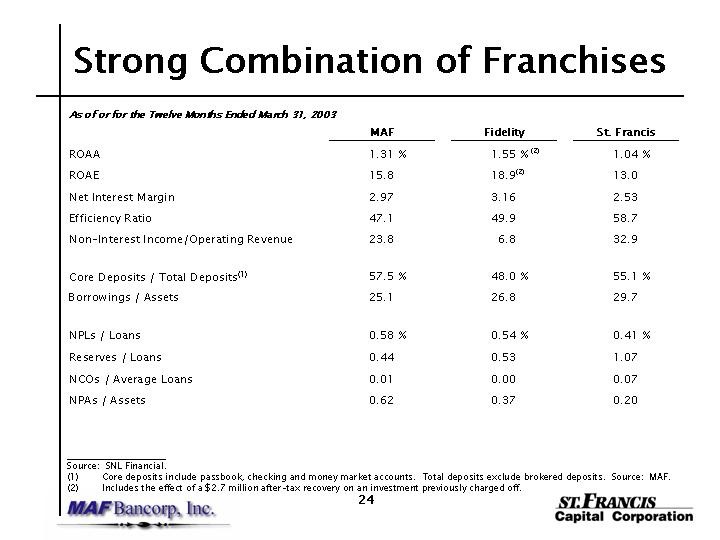
Strong Combination of Franchises
As of or for the Twelve Months Ended March 31, 2003 | |||||||||
MAF | Fidelity | St. Francis | |||||||
ROAA | 1.31 | % | 1.55 | %(2) | 1.04 | % | |||
ROAE | 15.8 |
| 18.9 | (2) | 13.0 |
| |||
Net Interest Margin | 2.97 |
| 3.16 |
| 2.53 |
| |||
Efficiency Ratio | 47.1 |
| 49.9 |
| 58.7 |
| |||
Non-Interest Income/Operating Revenue | 23.8 |
| 6.8 |
| 32.9 |
| |||
Core Deposits / Total Deposits(1) | 57.5 | % | 48.0 | % | 55.1 | % | |||
Borrowings / Assets | 25.1 |
| 26.8 |
| 29.7 |
| |||
NPLs / Loans | 0.58 | % | 0.54 | % | 0.41 | % | |||
Reserves / Loans | 0.44 |
| 0.53 |
| 1.07 |
| |||
NCOs / Average Loans | 0.01 |
| 0.00 |
| 0.07 |
| |||
NPAs / Assets | 0.62 |
| 0.37 |
| 0.20 |
|
Source: SNL Financial.
| (1) | Core deposits include passbook, checking and money market accounts. Total deposits exclude brokered deposits. Source: MAF. |
| (2) | Includes the effect of a $2.7 million after-tax recovery on an investment previously charged off. |

Summary
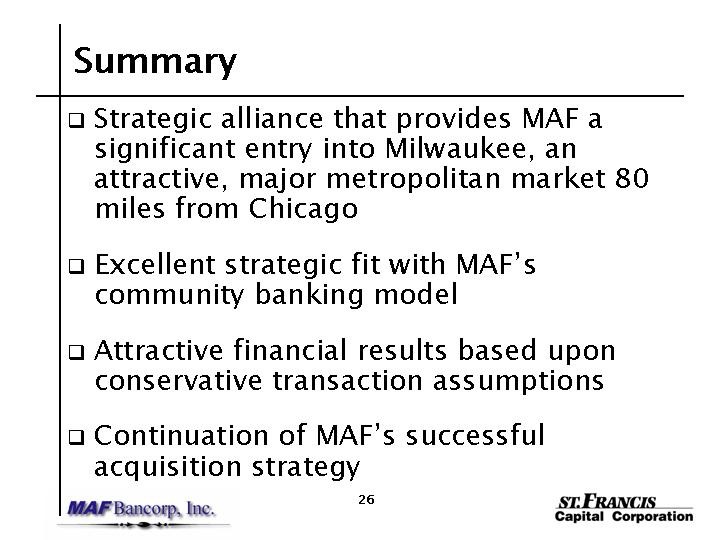
Summary
| q | Strategic alliance that provides MAF a significant entry into Milwaukee, an attractive, major metropolitan market 80 miles from Chicago |
| q | Excellent strategic fit with MAF’s community banking model |
| q | Attractive financial results based upon conservative transaction assumptions |
q Continuation of MAF’s successful acquisition strategy
Appendix
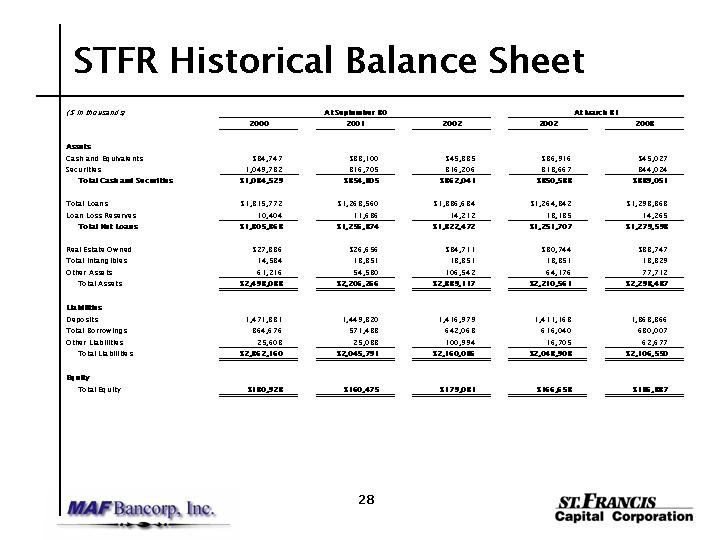
STFR Historical Balance Sheet
($ in thousands) | At September 30 | At March 31 | |||||||||||||
2000 | 2001 | 2002 | 2002 | 2003 | |||||||||||
Assets | |||||||||||||||
Cash and Equivalents | $ | 34,747 | $ | 38,100 | $ | 45,835 | $ | 36,916 | $ | 45,027 | |||||
Securities |
| 1,049,782 |
| 816,705 |
| 816,206 |
| 813,667 |
| 844,024 | |||||
Total Cash and Securities | $ | 1,084,529 | $ | 854,805 | $ | 862,041 | $ | 850,583 | $ | 889,051 | |||||
Total Loans | $ | 1,315,772 | $ | 1,268,560 | $ | 1,336,684 | $ | 1,264,842 | $ | 1,293,863 | |||||
Loan Loss Reserves |
| 10,404 |
| 11,686 |
| 14,212 |
| 13,135 |
| 14,265 | |||||
Total Net Loans | $ | 1,305,368 | $ | 1,256,874 | $ | 1,322,472 | $ | 1,251,707 | $ | 1,279,598 | |||||
Real Estate Owned | $ | 27,386 | $ | 26,656 | $ | 34,711 | $ | 30,744 | $ | 33,747 | |||||
Total Intangibles |
| 14,584 |
| 13,351 |
| 13,351 |
| 13,351 |
| 13,329 | |||||
Other Assets |
| 61,216 |
| 54,580 |
| 106,542 |
| 64,176 |
| 77,712 | |||||
Total Assets | $ | 2,493,083 | $ | 2,206,266 | $ | 2,339,117 | $ | 2,210,561 | $ | 2,293,437 | |||||
Liabilities | |||||||||||||||
Deposits |
| 1,471,881 |
| 1,449,320 |
| 1,416,979 |
| 1,411,163 |
| 1,363,866 | |||||
Total Borrowings |
| 864,676 |
| 571,433 |
| 642,063 |
| 616,040 |
| 680,007 | |||||
Other Liabilities |
| 25,603 |
| 25,038 |
| 100,994 |
| 16,705 |
| 62,677 | |||||
Total Liabilities | $ | 2,362,160 | $ | 2,045,791 | $ | 2,160,036 | $ | 2,043,908 | $ | 2,106,550 | |||||
Equity | |||||||||||||||
Total Equity | $ | 130,923 | $ | 160,475 | $ | 179,081 | $ | 166,653 | $ | 186,887 | |||||
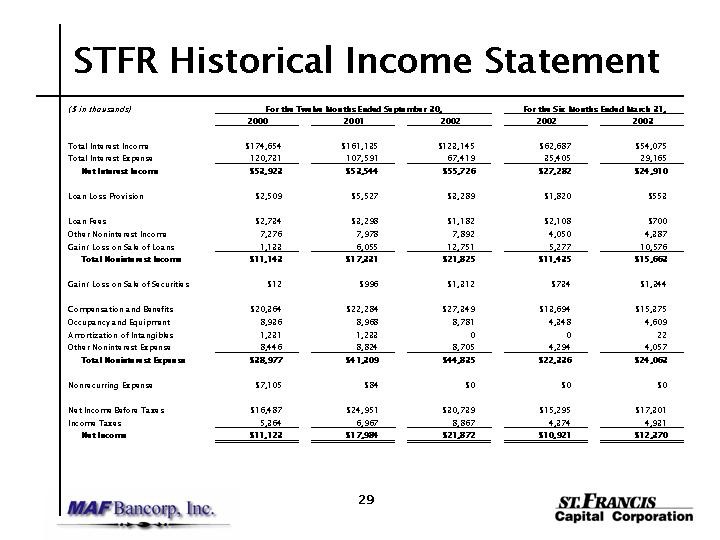
STFR Historical Income Statement
($ in thousands) | For the Twelve Months Ended September 30, | For the Six Months Ended March 31, | |||||||||||||
2000 | 2001 | 2002 | 2002 | 2003 | |||||||||||
Total Interest Income | $ | 174,654 | $ | 161,135 | $ | 123,145 | $ | 62,687 | $ | 54,075 | |||||
Total Interest Expense |
| 120,731 |
| 107,591 |
| 67,419 |
| 35,405 |
| 29,165 | |||||
Net Interest Income | $ | 53,923 | $ | 53,544 | $ | 55,726 | $ | 27,282 | $ | 24,910 | |||||
Loan Loss Provision | $ | 2,509 | $ | 5,527 | $ | 3,289 | $ | 1,820 | $ | 553 | |||||
Loan Fees | $ | 2,734 | $ | 3,298 | $ | 1,182 | $ | 2,108 | $ | 700 | |||||
Other Noninterest Income |
| 7,276 |
| 7,978 |
| 7,892 |
| 4,050 |
| 4,387 | |||||
Gain/ Loss on Sale of Loans |
| 1,133 |
| 6,055 |
| 12,751 |
| 5,277 |
| 10,576 | |||||
Total Noninterest Income | $ | 11,143 | $ | 17,331 | $ | 21,825 | $ | 11,435 | $ | 15,663 | |||||
Gain/ Loss on Sale of Securities | $ | 12 | $ | 996 | $ | 1,312 | $ | 734 | $ | 1,344 | |||||
Compensation and Benefits | $ | 20,364 | $ | 22,284 | $ | 27,349 | $ | 13,694 | $ | 15,375 | |||||
Occupancy and Equipment |
| 8,936 |
| 8,968 |
| 8,781 |
| 4,348 |
| 4,609 | |||||
Amortization of lntangibles |
| 1,231 |
| 1,233 |
| 0 |
| 0 |
| 22 | |||||
Other Noninterest Expense |
| 8,446 |
| 8,824 |
| 8,705 |
| 4,294 |
| 4,057 | |||||
Total Noninterest Expense | $ | 38,977 | $ | 41,309 | $ | 44,835 | $ | 22,336 | $ | 24,063 | |||||
Nonrecurring Expense | $ | 7,105 | $ | 84 | $ | 0 | $ | 0 | $ | 0 | |||||
Net Income Before Taxes | $ | 16,487 | $ | 24,951 | $ | 30,739 | $ | 15,295 | $ | 17,301 | |||||
Income Taxes |
| 5,364 |
| 6,967 |
| 8,867 |
| 4,374 |
| 4,931 | |||||
Net Income | $ | 11,123 | $ | 17,984 | $ | 21,872 | $ | 10,921 | $ | 12,370 | |||||
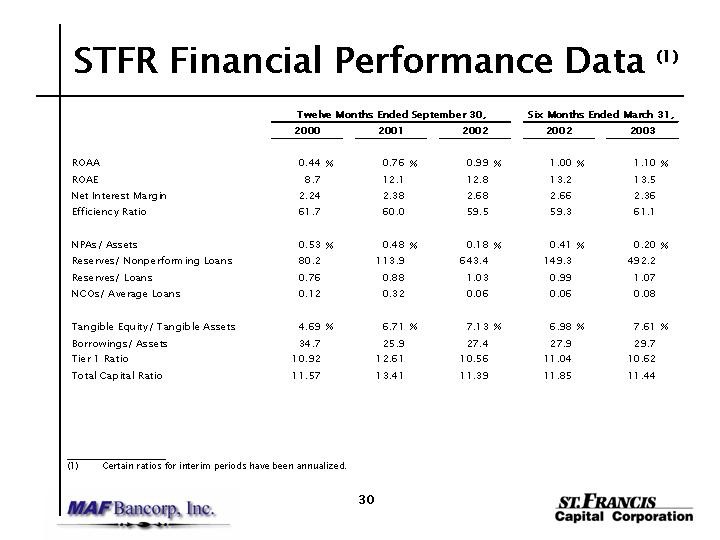
STFR Financial Performance Data(1)
Twelve Months Ended September 30, | Six Months Ended March 31, | ||||||||||||||
2000 | 2001 | 2002 | 2002 | 2003 | |||||||||||
ROAA | 0.44 | % | 0.76 | % | 0.99 | % | 1.00 | % | 1.10 | % | |||||
ROAE | 8.7 |
| 12.1 |
| 12.8 |
| 13.2 |
| 13.5 |
| |||||
Net Interest Margin | 2.24 |
| 2.38 |
| 2.68 |
| 2.66 |
| 2.36 |
| |||||
Efficiency Ratio | 61.7 |
| 60.0 |
| 59.5 |
| 59.3 |
| 61.1 |
| |||||
NPAs/ Assets | 0.53 | % | 0.48 | % | 0.18 | % | 0.41 | % | 0.20 | % | |||||
Reserves/ Nonperforming Loans | 80.2 |
| 113.9 |
| 643.4 |
| 149.3 |
| 492.2 |
| |||||
Reserves/ Loans | 0.76 |
| 0.88 |
| 1.03 |
| 0.99 |
| 1.07 |
| |||||
NCOs/ Average Loans | 0.12 |
| 0.32 |
| 0.06 |
| 0.06 |
| 0.08 |
| |||||
Tangible Equity/ Tangible Assets | 4.69 | % | 6.71 | % | 7.13 | % | 6.98 | % | 7.61 | % | |||||
Borrowings/ Assets | 34.7 |
| 25.9 |
| 27.4 |
| 27.9 |
| 29.7 |
| |||||
Tier 1 Ratio | 10.92 |
| 12.61 |
| 10.56 |
| 11.04 |
| 10.62 |
| |||||
Total Capital Ratio | 11.57 |
| 13.41 |
| 11.39 |
| 11.85 |
| 11.44 |
| |||||
| (1) | Certain ratios for interim periods have been annualized. |
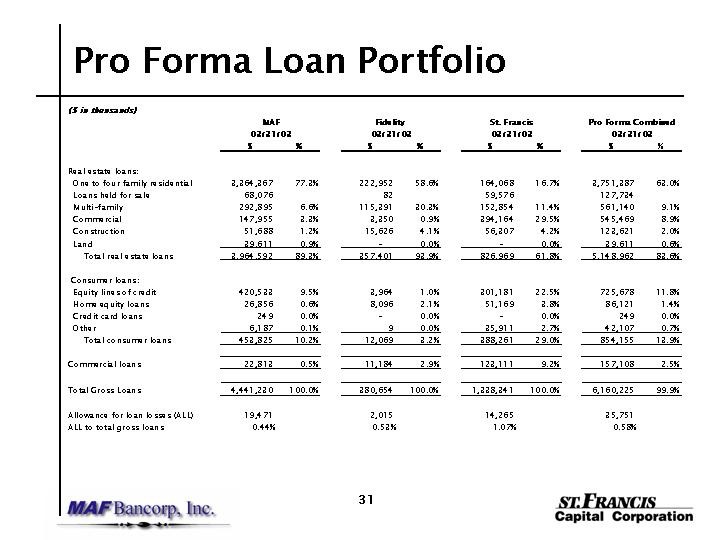
Pro Forma Loan Portfolio
($ in thousands) | �� | |||||||||||||||||||||||
MAF | Fidelity | St. Francis | Pro Forma Combined | |||||||||||||||||||||
03/31/03 | 03/31/03 | 03/31/03 | 03/31/03 | |||||||||||||||||||||
$ | % | $ | % | $ | % | $ | % | |||||||||||||||||
Real estate loans: | ||||||||||||||||||||||||
One to four family residential | 3,364,367 |
| 77.3 | % | 222,952 |
| 58.6 | % | 164,068 |
| 16.7 | % | 3,751,387 |
| 63.0 | % | ||||||||
Loans held for sale | 68,076 |
| 82 |
| 59,576 |
| 127,734 |
| ||||||||||||||||
Multi-family | 292,895 |
| 6.6 | % | 115,391 |
| 30.3 | % | 152,854 |
| 11.4 | % | 561,140 |
| 9.1 | % | ||||||||
Commercial | 147,955 |
| 3.3 | % | 3,350 |
| 0.9 | % | 394,164 |
| 29.5 | % | 545,469 |
| 8.9 | % | ||||||||
Construction | 51,688 |
| 1.2 | % | 15,626 |
| 4.1 | % | 56,307 |
| 4.2 | % | 123,621 |
| 2.0 | % | ||||||||
Land | 39,611 |
| 0.9 | % | — |
| 0.0 | % | — |
| 0.0 | % | 39,611 |
| 0.6 | % | ||||||||
Total real estate loans | 3,964,592 |
| 89.3 | % | 357,401 |
| 93.9 | % | 826,969 |
| 61.8 | % | 5,148,962 |
| 83.6 | % | ||||||||
Consumer loans: | ||||||||||||||||||||||||
Equity lines of credit | 420,533 |
| 9.5 | % | 3,964 |
| 1.0 | % | 301,181 |
| 22.5 | % | 725,678 |
| 11.8 | % | ||||||||
Home equity loans | 26,856 |
| 0.6 | % | 8,096 |
| 2.1 | % | 51,169 |
| 3.8 | % | 86,121 |
| 1.4 | % | ||||||||
Credit card loans | 249 |
| 0.0 | % | — |
| 0.0 | % | — |
| 0.0 | % | 249 |
| 0.0 | % | ||||||||
Other | 6,187 |
| 0.1 | % | 9 |
| 0.0 | % | 35,911 |
| 2.7 | % | 42,107 |
| 0.7 | % | ||||||||
Total consumer loans | 453,825 |
| 10.2 | % | 12,069 |
| 3.2 | % | 388,261 |
| 29.0 | % | 854,155 |
| 13.9 | % | ||||||||
Commercial loans | 22,813 |
| 0.5 | % | 11,184 |
| 2.9 | % | 123,111 |
| 9.2 | % | 157,108 |
| 2.5 | % | ||||||||
Total Gross Loans | 4,441,230 |
| 100.0 | % | 380,654 |
| 100.0 | % | 1,338,341 |
| 100.0 | % | 6,160,225 |
| 99.9 | % | ||||||||
Allowance for loan losses (ALL) | 19,471 |
| 2,015 |
| 14,265 |
| 35,751 |
| ||||||||||||||||
ALL to total gross loans | 0.44 | % | 0.53 | % | 1.07 | % | 0.58 | % | ||||||||||||||||

Pro Forma Funding Composition
($ in thousands) | ||||||||||||||||||||
MAF 03/31/03 | Fidelity 03/31/03 | St. Francis 03/31/03 | Pro Forma Combined 03/31/03 | |||||||||||||||||
$ | % | $ | % | $ | % | $ | % | |||||||||||||
Deposits: | ||||||||||||||||||||
Passbooks | 1,044,983 | 27.4 | % | 129,276 | 30.3 | % | 85,827 | 7.0 | % | 1,260,086 | 23.0 | % | ||||||||
Commercial checking | 158,947 | 4.2 | % | 1,903 | 0.4 | % | — | 0.0 | % | 160,850 | 2.9 | % | ||||||||
Non-interest bearing checking | 148,679 | 3.9 | % | 10,897 | 2.6 | % | 125,736 | 10.2 | % | 285,312 | 5.2 | % | ||||||||
Interest bearing checking | 377,407 | 9.9 | % | 40,858 | 9.6 | % | 90,265 | 7.3 | % | 508,530 | 9.3 | % | ||||||||
Money market accounts | 464,869 | 12.2 | % | 21,472 | 5.0 | % | 375,660 | 30.5 | % | 862,001 | 15.8 | % | ||||||||
Total core deposits | 2,194,885 | 57.5 | % | 204,406 | 48.0 | % | 677,488 | 55.1 | % | 3,076,779 | 56.2 | % | ||||||||
Retail certificates of deposits | 1,619,859 | 42.5 | % | 221,573 | 52.0 | % | 552,716 | 44.9 | % | 2,394,148 | 43.8 | % | ||||||||
Total deposits | 3,814,744 | 100.0 | % | 425,979 | 100.0 | % | 1,230,204 | 100.0 | % | 5,470,927 | 100.0 | % | ||||||||
Wholesale borrowings: | ||||||||||||||||||||
FHLB Advances | 1,450,000 | 96.6 | % | 194,000 | 85.7 | % | 509,063 | 62.6 | % | 2,153,063 | 84.7 | % | ||||||||
Other borrowings | — | 0.0 | % | — | 0.0 | % | 161,944 | 19.9 | % | 161,944 | 6.4 | % | ||||||||
Brokered certificates | — | 0.0 | % | 32,346 | 14.3 | % | 133,662 | 16.4 | % | 166,008 | 6.5 | % | ||||||||
Holding company debt | 51,000 | 3.4 | % | — | 0.0 | % | 9,000 | 1.1 | % | 60,000 | 2.4 | % | ||||||||
Total wholesale borrowings | 1,501,000 | 100.0 | % | 226,346 | 100.0 | % | 813,669 | 100.0 | % | 2,541,015 | 100.0 | % | ||||||||
Total funding | 5,315,744 | 652,325 | 2,043,873 | 8,011,942 | ||||||||||||||||
Deposits to total funding | 71.8 | % | 65.3 | % | 60.2 | % | 68.3 | % | ||||||||||||
Wholesale borrowings to total funding | 28.2 | % | 34.7 | % | 39.8 | % | 31.7 | % | ||||||||||||
100.0 | % | 100.0 | % | 100.0 | % | 100.0 | % | |||||||||||||
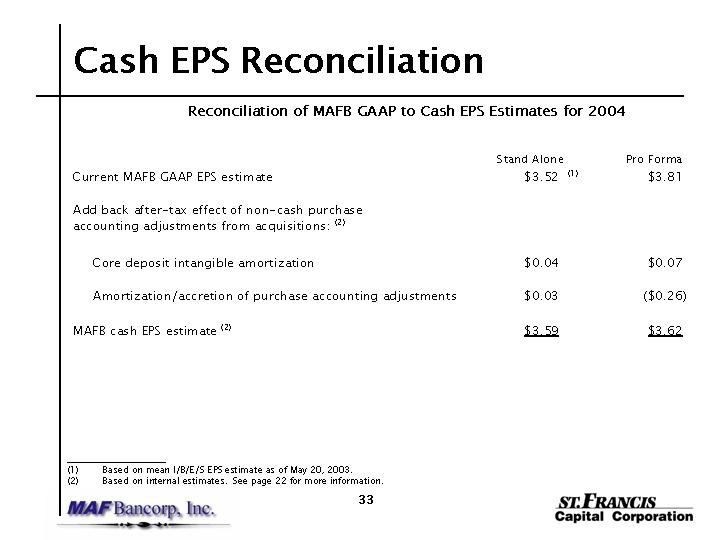
Cash EPS Reconciliation
Reconciliation of MAFB GAAP to Cash EPS Estimates for 2004
Stand Alone | Pro Forma | |||||||
Current MAFB GAAP EPS estimate | $ | 3.52 | (1) | $ | 3.81 |
| ||
Add back after-tax effect of non-cash purchase | ||||||||
accounting adjustments from acquisitions:(2) | ||||||||
Core deposit intangible amortization | $ | 0.04 |
| $ | 0.07 |
| ||
Amortization/accretion of purchase accounting adjustments | $ | 0.03 |
| ($ | 0.26 | ) | ||
MAFB cash EPS estimate(2) | $ | 3.59 |
| $ | 3.62 |
| ||
| (1) | Based on mean I/B/E/S EPS estimate as of May 20, 2003. |
| (2) | Based on internal estimates. See page 22 for more information. |