EXHIBIT 99.2

| TABLE OF | ||||||||
¢¢ | CONTENTS | |||||||
| About CMHC | 7 | |||||||
| ¡ | Message from the Chairperson | 8 | ||||||
| ¡ | Message from the President | 11 | ||||||
| Corporate Governance | 17 | |||||||
| ¡ | Corporate Structure | 18 | ||||||
| ¡ | Board of Directors and its Committees | 18 | ||||||
| ¡ | Corporate Planning and Reporting | 20 | ||||||
| ¡ | Special Examinations and Annual Reviews | 21 | ||||||
| ¡ | Assessing Board Performance | 21 | ||||||
| ¡ | Board Compensation and Attendance | 22 | ||||||
| ¡ | CMHC Pension Fund | 22 | ||||||
| Corporate Responsibility | 23 | |||||||
| Management’s Discussion and Analysis | 37 | |||||||
| ¡ | The Operating Environment in 2012 and Outlook for 2013 | 38 | ||||||
| ¡ | Summary of Financial Results | 42 | ||||||
| ¡ | Performance by Objective | 51 | ||||||
| ¡ | Risk Management | 85 | ||||||
| ¡ | Human Resources and Internal Services | 94 | ||||||
| ¡ | 2008 to 2013 Financial Highlights | 98 | ||||||
| Consolidated Financial Statements | 99 | |||||||
| Other Information | 157 | |||||||
| ¡ | CMHC Board of Directors | 158 | ||||||
| ¡ | CMHC Management | 161 | ||||||
| ¡ | Use of Appropriations | 163 | ||||||
| ¡ | Glossary | 164 | ||||||
| ¡ | Definition of Select Performance Measures | 168 | ||||||
| ¡ | Expected Outcomes and Indicators | 170 | ||||||
| ¡ | CMHC Offices | 174 | ||||||
| For a list of acronyms used in this Annual Report, see Glossary. | ||||||||
| Performance by Objective |  | |||||||||
|
Corporate Plan Framework |
|
52
|
| |||||||
| Objective 1: | ||||||||||
| Help Canadians in need | 53 | |||||||||
Strategic Priority 1.1: | ||||||||||
Help Canadians in need access affordable, sound and suitable housing | ||||||||||
Strategic Priority 1.2: | ||||||||||
Support Aboriginal Canadians to improve their living conditions | ||||||||||
Objective 2: | ||||||||||
| Facilitate access to more affordable, better quality housing for all Canadians |
|
63 |
| |||||||
| Strategic Priority 2.1: | ||||||||||
Ensure Canadians have access to mortgage loan insurance products and tools that meet their needs | ||||||||||
| Strategic Priority 2.2: | ||||||||||
Ensure an adequate supply of low-cost funds for mortgage lending through mortgage securitization | ||||||||||
| Strategic Priority 2.3: | ||||||||||
Provide comprehensive, timely and relevant market analysis information | ||||||||||
| Objective 3: | ||||||||||
Ensure the Canadian housing system remains one of the best in the world | 81 | |||||||||
| Strategic Priority 3.1: | ||||||||||
Undertake comprehensive, timely and relevant research and information transfer activities to enable Canadian consumers and the housing sector to make informed decisions | ||||||||||
| Strategic Priority 3.2: | ||||||||||
Support and promote Canada’s world-class housing products, services and system internationally
| ||||||||||


CORPORATE STRUCTURE | 18 | |||
BOARD OF DIRECTORS AND ITS COMMITTEES | 18 | |||
CORPORATE PLANNING AND REPORTING | 20 | |||
SPECIAL EXAMINATIONS AND ANNUAL REVIEWS | 21 | |||
BOARD PERFORMANCE | 21 | |||
BOARD COMPENSATION AND ATTENDANCE | 22 | |||
CMHC PENSION FUND | 22 | |||
17

CORPORATE STRUCTURE
CMHC is governed by a Board of Directors appointed by the Government of Canada and currently reports to Parliament through the Minister of Human Resources and Skills Development. CMHC Management is comprised of the President and Chief Executive Officer, heads of business areas and support functions and General Managers of regional business centres. (See Other Information section for a list of CMHC Management members.) We have a workforce of approximately 1,900 employees. Our national office is located in Ottawa and our regional business centres are in Halifax, Montréal, Toronto, Calgary and Vancouver. Several smaller communities are served by CMHC employees who reside in these communities.
CMHC provides management, advisory and other services to the Canada Housing Trust (CHT) and to the First Nations Market Housing Fund (FNMHF). It also manages and administers Granville Island on behalf of the Government of Canada. (See Glossary for further information on these organizations.)
BOARD OF DIRECTORS AND ITS COMMITTEES
Pursuant to the CMHC Act, the stewardship of the Corporation is the responsibility of the Board of Directors which is comprised of the Chairperson, the President and Chief Executive Officer (CEO), the Deputy Minister of the Minister for CMHC, the Deputy Minister of Finance, and eight other directors.
The Chairperson and the President and CEO are appointed by the Governor in Council. The Deputy Minister of the Minister of CMHC and the Deputy Minister of Finance are members of the Board of Directors by reason of the office they each hold. The eight other directors are appointed by the Minister designated for the purposes of the CMHC Act and the NHA with the approval of the Governor in Council. With the exception of the President and CEO, all CMHC Board members are independent of CMHC Management.
The Board meets a minimum of five times per year. In order to gain regional perspective, the Board holds two of its regularly scheduled meetings outside

18 C A N A D A M O R T G A G E A N D H O U S I N G C O R P O R A T I O N
the National Capital Region. These meetings are opportunities for Board members to visit housing projects and to discuss issues with local stakeholders.
The Corporate Governance and Nominating Committee, the Audit Committee, the Risk Management Committee, and the Human Resources
Committee support the Board in carrying out its stewardship of CMHC. These committees examine matters in their respective areas that come before the Board for consideration. Their respective charters are posted on CMHC’s website and are reviewed on a regular basis by the Board to ensure these committees continue to carry out their responsibilities effectively.

MEETING WITH CANADIANS
Regional Board Meetings
This year, while in Toronto in May, the Board met with local representatives of the real estate development and construction sectors, municipal housing agencies, non-profit housing providers, mortgage lenders and First Nations. Among the housing projects visited by the Board was the historic downtown Toronto neighbourhood of Regent Park which received federal and provincial funding under the Affordable Housing Initiative and is in the midst of a remarkable rejuvenation.
While in Quebec City in August, the Board visited a number of housing developments serving diverse community needs, including a co-operative that receives subsidies from CMHC. The Board also visited a housing development which incorporated sustainable practices. In addition, the Board discussed local housing issues at a roundtable meeting with representatives from provincial and municipal housing agencies, the lending industry and First Nations communities.
The Annual Public Meeting
In conjunction with the Board of Directors meeting in Toronto, CMHC held its fourth Annual Public Meeting on May 24, 2012. CMHC’s Annual Public Meeting provides an opportunity for the general public to learn about CMHC’s achievements and to raise questions or concerns. Presentations by the Chairperson and the President and Chief Executive Officer provided an overview of CMHC’s mandate and highlighted the Corporation’s results and accomplishments.


19
CORPORATE PLANNING
AND REPORTING
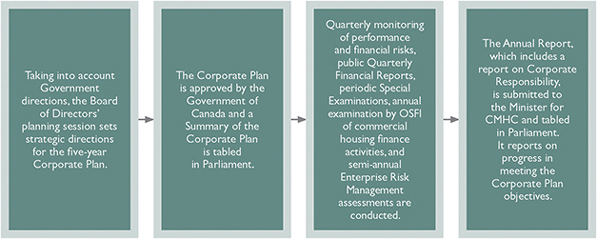
Each year, as required by the Financial Administration Act (FAA), CMHC submits a five-year plan to its Minister for approval by the Government of Canada. The corporate plan is the centrepiece of the accountability regime for Crown corporations and encompasses all of CMHC’s activities, budgets and resource requirements.
Taking into account Government of Canada objectives and priorities, the development of the corporate plan begins with a thorough examination of both the internal and external operating environments of the Corporation. In the development of the 2013-2017 Corporate Plan, the Board of Directors’ planning session in March 2012 examined global and national trends in order to assess their potential impact on CMHC’s operations. The Board determined key directions for the upcoming year and submitted to the Minister for CMHC, the Corporation’s proposed 2013-2017 Corporate Plan, which was subsequently
approved by the Government on December 13, 2012. A Summary of the Plan was tabled in Parliament on March 22, 2013.
Through the year, the Board reviews Quarterly Performance Reports and adjusts priorities and resources accordingly. Quarterly Financial Reports are published sixty days after the end of each of the first three quarters of the year pursuant to the FAA. The Board, with the support of the Risk Management Committee of the Board, reviews significant risks and mitigating strategies through a variety of mechanisms, including through semi-annual Enterprise Risk Management reports and Quarterly Risk Management Reports. (Also see section on Risk Management in the MD&A.)
An annual report is prepared and submitted to the Minister for CMHC three months following the close of the financial year (December 31) and is tabled in Parliament 15 sitting days after the Minister’s receipt.
20 C A N A D A M O R T G A G E A N D H O U S I N G C O R P O R A T I O N
SPECIAL EXAMINATIONS AND ANNUAL REVIEWS
The Financial Administration Act (FAA) requires that a special examination be carried out at least once every ten years and at any additional time that the Governor in Council, the appropriate Minister, the Board of Directors, or the Auditor General may require. In its last special examination report dated August 25, 2008, CMHC received an unqualified opinion, meaning that the examiners found no significant deficiencies in the systems and practices of the Corporation.
Under amendments to the NHA passed in June 2012, the Office of the Superintendent of Financial Institutions is required, at least once in each calendar year, to “make or cause to be made any examination or inquiry that the Superintendent considers to be necessary or expedient to determine if the Corporation is carrying on any or all of its commercial activities in a safe and sound manner with due regard to its exposure to loss”.
BOARD PERFORMANCE
The skills profile of the Board describes the core attributes, competencies, skills, knowledge and experience required of Board members, individually and collectively, and was updated in 2012. This profile assists the Corporate Governance and Nominating Committee of the Board to identify potential new Board members as well as candidates for the positions of Chairperson and President and CEO to be recommended to the Minister for appointment.
Conducting regular assessments of the Board’s performance is integral to best governance practices. Two types of assessments are undertaken on alternate years – a peer assessment, which involves Board members assessing and providing feedback on each other’s contributions, and an overall Board assessment, which examines the effectiveness of the Board in comparison to the boards of other Crown corporations.
In 2012, CMHC completed an overall Board assessment with external professional assistance. The assessment evaluated the performance of CMHC’s Board over the past year. The Board received an overall strong and positive assessment and was slightly higher than the average assessment of CMHC’s peer organizations. The areas where the Board rated the highest were its comprehensive monitoring of the Corporation’s financial results and its effective working relationships with the President and CEO and with senior management.

21
BOARD COMPENSATION AND ATTENDANCE RECORD
CMHC follows federal guidelines for the remuneration of Board members.
The Chairperson and other non-government employee Board members receive an annual retainer for their services to CMHC plus fixed per diems for travel time, for their attendance at committee and Board meetings, and for carrying out other CMHC-related responsibilities as they arise.
Full-time employees of the federal government are not eligible to receive additional remuneration when appointed to a part-time position by Governor in Council. As such, the President and CEO, the Deputy Minister of the Minister for CMHC, and the Deputy Minister of Finance, as members of the Board, do not receive additional remunerations. (See Other Information for Compensation and Attendance Record for Board members.)
CMHC PENSION FUND
The CMHC Pension Fund was established by the Board of Directors pursuant to the CMHC Act. The Board has delegated general management and administrative responsibilities for the Fund to the Pension Fund Trustees. The Board appoints to the Pension Fund Trustees a member of the Board of Directors, the President and CEO, and two other members of CMHC Management. Three other Trustees are elected by the Pension Council (two representing employees and one representing pensioners). The President and CEO is Chair of the Pension Fund Trustees.
Within the framework of the enterprise risk management policies specific to the Pension Fund approved by the Board, the Trustees are responsible for setting investment objectives and policies, periodically reviewing strategic asset allocations and monitoring investment results. The outcomes of Trustees meetings and the performance of the Fund are regularly reported to the Board. The Board also receives an annual report on the Fund’s investment activities.

22 C A N A D A M O R T G A G E A N D H O U S I N G C O R P O R A T I O N

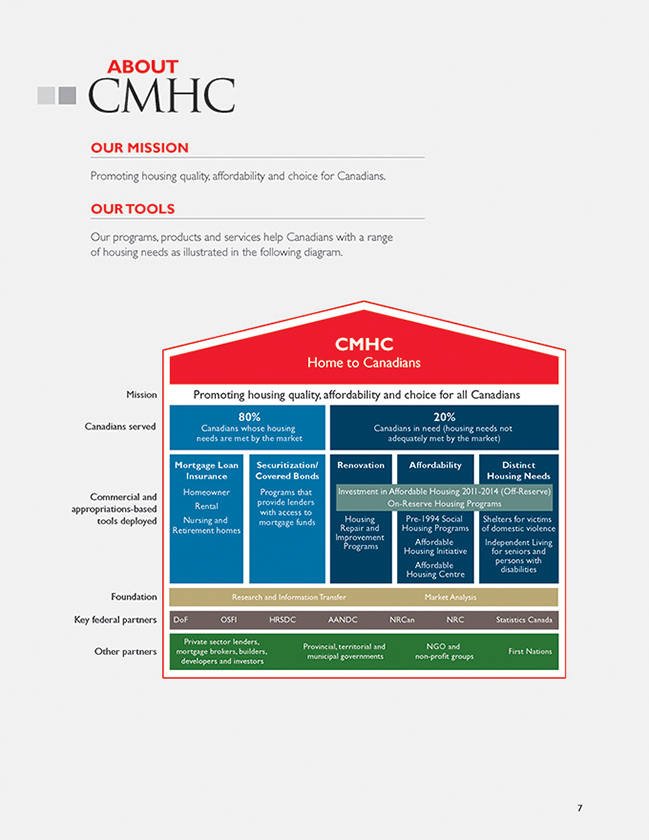
Making a difference in the lives of Canadians is what we do every day in every part of the country and housing has been our focus for more than 66 years.
Our employees are the foundation of our organization. We create a respectful, inclusive and supportive work environment where our employees are valued and encouraged to reach their full potential.
Our activities, including assisted housing programs, mortgage loan insurance, securitization, and research and information transfer, are our building blocks. We strive to perform these activities in a manner that maximizes our economic and social contributions and minimizes our environmental impacts.
Our governance structure provides the roof and ensures that we perform in a responsible, ethical and efficient manner.
23

Corporate responsibility is generally defined and recognized as a corporation’s commitment to take social, environmental and economic considerations into account in its decision-making process and activities. As Canada’s national housing agency, social and economic considerations are at the core of CMHC’s mandate and activities. These activities support and contribute to the well-being of Canadians and the stability of Canada’s economy.
In carrying out its mandate, CMHC strives to conduct its business in a manner that maximizes social and economic contributions and minimizes environmental impacts. CMHC is committed to the highest standards of competence, trustworthiness and prudence in managing the financial, physical and human resources entrusted to its care.
In 2012, CMHC implemented a number of measures to enhance the framework for tracking and reporting its corporate responsibility efforts, including the establishment of a formal Corporate Responsibility Advisory Committee to champion these efforts.
The following is a summary of key accomplishments for 2012:
¡ Responsible Governance:
In addition to enhancements to CMHC’s governance framework described in the Corporate Governance section, CMHC enacted an updated CMHC Code of Conduct.
¡ Social Contributions:
In addition to providing federal assistance to help address the housing needs of low-income Canadians, our employees give personally to their communities through the Government of Canada Workplace Charitable Campaign and other charitable causes.
¡ Environmental Contributions:
Ongoing efforts were made in 2012 to reduce CMHC’s environmental footprint, including the integration of environmental performance considerations into the procurement process.
¡ Economic Contributions:
CMHC was given an enhanced mandate to ensure that its commercial mortgage loan insurance and securitization activities contribute to financial system stability which is important to long-term growth and prosperity.
¡ Employees and Workplace Community:
CMHC has a strong diverse workplace community built on mutual respect, employee wellness and development opportunities. The Corporation was recognized as one of Canada’s 10 Most Admired Corporate CulturesTM in the broader public sector category by Waterstone Human Capital.

25
RESPONSIBLE GOVERNANCE
CMHC promotes a culture of ethical business conduct that is reinforced by a number of policies and guidelines.
CMHC’s updated Code of Conduct, enacted on April 2, 2012, integrates the Values and Ethics Code for the Public Service with CMHC’s longstanding corporate values. CMHC was able to enact its updated code the very same day the federal code was enacted. The Code of Conduct has two components:
| ¡ | Code of Values and Ethical Conduct – |
| This code outlines the principles and standards that guide employees and Board members in all CMHC duties, highlighting CMHC’s three corporate values: |
| ¡ | Serving the Public Interest |
| As stewards of the public trust, we serve with fairness, impartiality and objectivity. All of our activities, including those that are commercial in nature, are carried out in support of our public policy objectives. Our actions are inspired by a respect for human dignity and the value of every person. |
| ¡ | Achieving Business Excellence |
| We exercise the highest standards of competence, trustworthiness and prudence in conducting our business relationships and in managing the financial, physical and human resources entrusted to our care. We encourage learning, innovation and personal initiative to continuously improve the way we do business and achieve the best possible results for the Canadian public. |
| ¡ | Building a Workplace Community |
| We practice mutual respect and honesty in our working relationships. We help each other to achieve the goals of the team and the organization, and to maintain a healthy balance between our CMHC work and the other parts of our lives. We willingly explain our actions so that we may hold ourselves, and each other, accountable for living these values in the workplace. |
| ¡ | Conflict of Interest Policy – This policy serves to outline requirements with respect to the avoidance and, where necessary, disclosure of real, apparent or potential conflicts of interest, together with a process for discussing and disclosing such conflicts of interest. This policy applies to Board members and all employees. CMHC Board members are also subject to federal conflict of interest legislation. Certain CMHC employees are also subject to personal trading guidelines which impose trading restrictions on those who acquire, in the course of their official duties, information that is generally not available to the public. |
The Code of Conduct is also supported by the Disclosure of Wrongdoing in the Workplace Policy, which defines wrongdoing, articulates the role and responsibilities of CMHC’s Senior Officer for Disclosure, and establishes a process for reporting wrongdoing in the workplace.
26 C A N A D A M O R T G A G E A N D H O U S I N G C O R P O R A T I O N
SOCIAL CONTRIBUTIONS
Strengthening communities
CMHC contributes to the development of communities through investments in programs and initiatives that improve the quality of life for families and individuals.

27

28 C A N A D A M O R T G A G E A N D H O U S I N G C O R P O R A T I O N

29
2012 Charitable Campaigns
CMHC employees have a longstanding reputation of supporting charities and volunteering in the community, demonstrating their spirit of generosity and desire to reach out to those in need. In 2012, CMHC raised a total of $350,000 in contributions to the Government of Canada Workplace Charitable Campaign. The National Capital Regional team surpassed its goal for the 10th year and received the Michael Nurse Award for its creativity, dedication and enthusiasm that were instrumental to the campaign’s success.
In addition to the Government of Canada Workplace Charitable Campaign, CMHC employees continue to be actively engaged in the communities in which they live and work. During the past year, over 70 charitable activities organized by CMHC or by CMHC employees on their own raised over $180,000 in support of a wide range of organizations all across the country.
Financial Literacy: Helping Canadians make informed and responsible home-buying decisions
Buying a house is one of the most important financial decisions that most Canadians will make. In 2012, CMHC introduced two new tools to help Canadian home buyers make informed decisions. Ready, Set, Home is a mobile app which provides information and helps home buyers keep track of details throughout the process. An easy-to-use debt service calculator allows home buyers to understand how much they can comfortably afford to spend on a mortgage.

30 C A N A D A M O R T G A G E A N D H O U S I N G C O R P O R A T I O N
Habitat for Humanity Canada
CMHC and Habitat for Humanity have a long history of working together. The reason is simple – both organizations are motivated by the same basic belief that housing is fundamental to a good quality of life. CMHC is a Gold partner and the founding national
sponsor of the Habitat for Humanity Aboriginal Housing Program which helps make the Habitat homeownership model available to more Aboriginal people. To date, 50 Aboriginal families have moved into their Habitat homes and it is envisioned that many more will benefit from this program in the coming years.
 |
FIRST HOUSE PROJECT
First House Project in Takhini River, located 50 kilometres west of Whitehorse, will make homeownership possible for three low-income First Nation families. The project was developed through a partnership between Habitat for Humanity Yukon and the Champagne and Aishihik First Nations (CAFN).
“First House is a milestone project under Habitat Canada’s Aboriginal Housing Program, which promotes homeownership within Aboriginal communities across Canada. This is the first build on First Nations settlement land and we are hoping that many more First Nations will follow suit.”
Jay Thakar, National Manager of the Aboriginal Housing Program, Habitat for Humanity Canada, which developed First House through local partnerships. The project received assistance from the federal government through Seed Funding. CMHC is the lead and founding national partner for the Aboriginal Housing Program. |
31
ENVIRONMENTAL CONTRIBUTIONS
Ongoing research and information transfer related to sustainable housing
CMHC has a long history of providing both the housing industry and individual Canadians with information on how to improve the energy efficiency of housing. CMHC publishes Research Highlights and other information products on a regular basis and shares the knowledge gained from its EQuilibrium™ sustainable housing demonstration initiatives. CMHC also undertakes research, demonstration and information product development to promote the creation of culturally appropriate and energy-efficient housing in Canada’s North.

CMHC Green Home mortgage loan insurance product
The CMHC Green Home mortgage loan insurance product offers borrowers affordable options when purchasing an energy-efficient home or making energy-efficient improvements. Since its inception in 2004, CMHC Green Home has provided $8.2 million in premium rebates to more than 6,000 households choosing to purchase an environmentally friendly home or make energy-efficient renovations.

Reducing CMHC’s environmental footprint
 | CMHC Green Team
Following the adoption of a comprehensive corporate-wide sustainable operations strategy in 2011, the focus for 2012 was to implement a five-year energy management program. The program aims to further reduce | |
| CMHC’s environmental footprint and continue to promote environmentally responsible behaviour in day to day business activities. A network of green teams collaborates on initiatives to promote more environmentally friendly practices. CMHC’s environmental footprint is reflected in the following table. | ||
32 C A N A D A M O R T G A G E A N D H O U S I N G C O R P O R A T I O N
CMHC’s Environmental Footprint
| 2010 | 2011 | 2012 | % Improvement | |||||
Paper consumption1 (total sheets) | 19,209,019 | 17,621,500 | 14,319,170 | 18.74 | ||||
Paper recycled (metric tonnes) | 109.18 | 110.77 | 111.21 | 0.40 | ||||
Electricity consumption (kWh) | 10,095,491 | 10,006,514 | 9,444,729 | 5.61 | ||||
Natural gas consumption (m3) | 380,586 | 433,339 | 410,959 | 5.16 | ||||
Building water consumption (m3) | 32,093 | 38,443 | 35,399 | 7.92 | ||||
Reduction in CO2emissions from energy management program (kg) | N/A | N/A | 135,888 | N/A |
| 1 | The figures for paper consumption are Corporate-wide. The figures for recycled paper, electricity, natural gas and water consumption are for the National Office complex only. |
As part of the National Office waste management program, audits are carried out by an independent environmental consulting firm throughout the year. Through recommendation from these audits and other initiatives, CMHC continues to show improvements in the amount of waste diverted from local landfill sites as shown in the following table:
| 2010 | 2011 | 2012 | ||||
Waste generated (tonnes) | 221 | 233 | 197 | |||
Total waste reused and recycled (tonnes) | 119 | 133 | 123 | |||
Estimated waste diversion rate | 54% | 59% | 62% |
Green procurement
CMHC modified its procurement policy in 2012 by integrating environmental performance considerations into the procurement process. Where procurement involves products with high levels of residual waste, vendors are required to submit a waste management plan.
Granville Island environmental program
Granville Island, which is managed by CMHC on behalf of the Government of Canada, continues to actively promote environmentally sustainable practices in support of the City of Vancouver’s plan to become the greenest city in the world. Granville Island continues to work towards the 70% municipally mandated rate for waste diversion. Zero-waste stations have been installed in the public market and other exterior locations to increase waste diversion. As a result of these initiatives, the overall waste diversion rate increased by 5% to 45% for organics, mixed paper, glass, metal, plastics, and cardboard in 2012.

33
ECONOMIC CONTRIBUTIONS
Housing-related spending in 2012 of $314.9 billion, which includes consumption-related spending in housing and residential investment1 represented approximately 17.3% of the GDP in Canada. This accounts for 1.2 million jobs in the residential construction, real estate, and leasing industries.
CMHC mortgage loan insurance has helped shape the housing finance system by enabling lenders throughout the country to provide financing to qualified borrowers at competitive interest rates for both homeowners and rental housing. CMHC manages its capital to ensure that the Corporation is able to withstand adverse economic conditions and maintain its financial strength.
CMHC’s securitization activities also contribute to the health and stability of Canada’s housing finance system by ensuring that lenders have access to an adequate supply of funds for residential mortgages. By encouraging competition amongst lenders, the marketplace and all Canadians benefit.
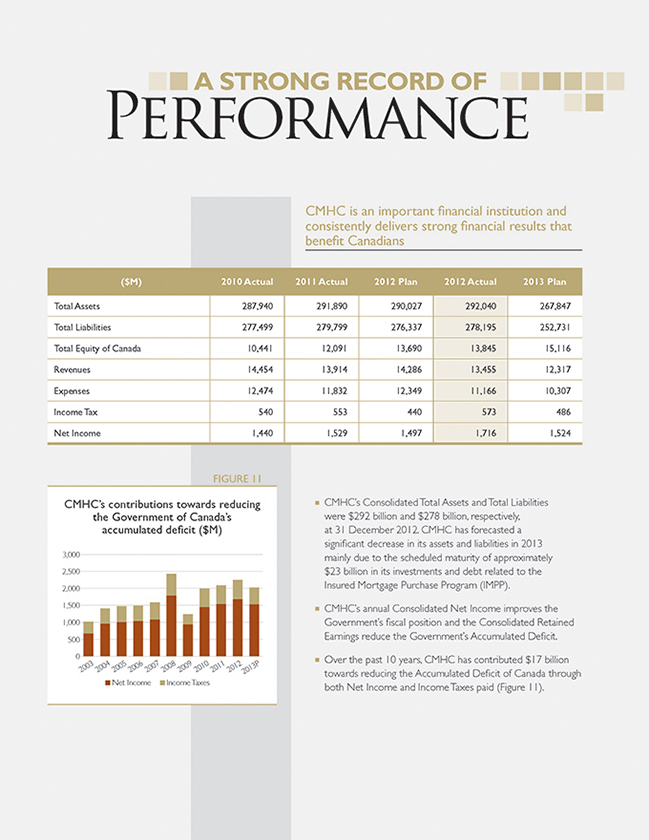
CMHC mortgage loan insurance and securitization businesses adhere to business practices that ensure commercial viability without having to rely on the Government of Canada for support, even in less favourable economic times. In fact, over the past decade, CMHC has contributed over $17 billion towards improving Canada’s fiscal position. This included $2 billion in 2012 alone.
| 1 | Consumption-related spending is the amount that households spend on shelter and includes imputed-rent spending but excludes spending related to water, electricity and heating consumption. Residential investment includes construction of new and changes to existing dwellings including transfer costs such as real estate commissions, land transfer and legal fees. It also includes maintenance and renovation spending. |
34 C A N A D A M O R T G A G E A N D H O U S I N G C O R P O R A T I O N
EMPLOYEES AND WORKPLACE COMMUNITY
CMHC has a number of initiatives to ensure respect, diversity and open communication in the workplace. The Corporation provides a comprehensive benefit plan, wellness programs and flexible working arrangements to support employee well-being. Learning and development programs, with a strong emphasis on on-the-job training, support the personal and professional growth of employees. Communication tools, such as the annual President’s tour, help keep CMHC’s values front and centre and provide employees with the opportunity to hear about CMHC’s objectives and challenges.
CMHC monitors the health of its culture and workplace community through a range of indicators. In 2012, CMHC sustained high employee engagement (at 94%) as well as strong retention and commitment, as evidenced by the low 2.4% voluntary turnover rate and the low sick leave usage.
2011
|
2012
| |||
Corporate Culture
| ||||
| Rate of employee engagement1 | 95% | 94% | ||
Percentage of CMHC employees who fully support the values for which CMHC stands | 92% | 90% | ||
Percentage of employees who believe that CMHC has a reputation as a good employer | 89% | 86% | ||
Voluntary turnover rate | 2.8% | 2.4% | ||
Diversity
| ||||
Percentage of employees who believe that CMHC supports diversity in the workplace | 87% | 84% | ||
Learning and Development
| ||||
| Percentage of employees with 2012 development plans in place | 97% | 96% | ||
Percentage of employees who believe they have improved their skills and capabilities over the past year | 78% | 76% | ||
Employee Well-Being
| ||||
Average number of sick days taken | 7.6 | 7.8 | ||
Percentage of employees participating in the Compressed Work Week Program | 30.1% | 28.4% | ||
| 1 | See Definition of Select Performance Measures in Other Information section. |
Since 2006, CMHC has had a talent management framework which brings together policies on multiple fronts to manage the renewal of the workforce and develop strategies to attract, motivate and retain employees with the diverse skills and backgrounds needed.
Learning and development opportunities make CMHC an appealing place to work. In 2012, 76% of CMHC employees indicated that they had improved their skills and capabilities over the past year. To help employees balance their commitments at home and at work, CMHC offers a variety of alternate work arrangements, family-related leave and parental benefits. CMHC also maintains an employee relations office to help employees, managers and human resources professionals build and maintain strong working relationships. When dealing with difficult personal or professional situations, our employees and their families also have access to a voluntary, confidential short-term counselling service to assist them in finding the help they need. In 2012, CMHC developed a new flexible group insurance plan that can be customized to better meet the unique needs of CMHC employees. The new benefits plans will be fully implemented in 2013.
CMHC places significant focus on ensuring that managers are able to effectively manage their employees. As part of managers’ yearly performance evaluations, their contributions to supporting workplace diversity and wellness, and to the growth and development of employees are assessed.
In 2012, CMHC was recognized as one of Canada’s 10 Most Admired Corporate CulturesTM in the broader public sector category by Waterstone Human Capital. This award recognizes CMHC for having a culture that has helped the Corporation enhance performance and sustain a competitive advantage, evidenced through the annual achievements outlined in this report.
35
 | CMHC employees come to work knowing that they are contributing to increased affordability and quality of housing for Canadians
Krissy MacDonald Senior Risk Management Officer, National Office
“What inspired me to do my best? Both the expectation and the desire to perform beyond expectations I was part of a team that was committed to professionalism and excellence. And I knew that our contribution was important to CMHC.”
Tom McCarthy Advisor, Aboriginal Housing, Prairie and Territories Region
“I get the opportunity to see the effect of my job one-on-one with my Aboriginal clients. Each new house means so much to the people living in them. . . The reminder on a regular basis of why we do what we do is inspiration enough to work towards success.”
Tomo Brank Senior Representative, Business Development, Ontario Region
“The culture at CMHC is in line with my own personal values because we are always looking to do the right thing for the client and working with business partners that will truly help Canadians make better housing choices. Like no other organization I have worked with in the past, I am proud of the work we do every day.” |
36 C A N A D A M O R T G A G E A N D H O U S I N G C O R P O R A T I O N

THE OPERATING ENVIRONMENT IN 2012 AND OUTLOOK FOR 2013 | 38 | |||
SUMMARY OF FINANCIAL RESULTS | 42 | |||
PERFORMANCE BY OBJECTIVE | 51 | |||
RISK MANAGEMENT | 85 | |||
HUMAN RESOURCES AND OTHER INTERNAL SERVICES | 94 | |||
FINANCIAL HIGHLIGHTS FROM 2008 TO 2013 | 98 | |||
FORWARD-LOOKING STATEMENTS
CMHC’s Annual Report contains forward-looking statements regarding objectives, strategies and expected financial results. There are risks and uncertainties beyond the control of CMHC that include, but are not limited to, economic, financial and regulatory conditions, nationally and internationally. These factors, among others, may cause actual results to differ substantially from the expectations stated or implied in forward-looking statements.
37

THE OPERATING
ENVIRONMENT IN 2012
AND OUTLOOK FOR 2013
This section discusses deficit reduction measures, changes in CMHC’s legislative framework, socio-economic factors, and housing indicators that impact CMHC’s operating environment and influence the attainment of its objectives and financial results. More discussion on factors that impact specific activities can be found further on in this MD&A.

GOVERNMENT REVIEW OF SPENDING
CMHC receives Parliamentary appropriations to fund assisted housing and research and information transfer activities. In Budget 2012, the Government announced the results of its review of spending undertaken by all federal departments and agencies. It indicated that CMHC will contribute $102.4 million in ongoing savings by 2014-15. The majority of these savings ($79 million) will result from lower costs in administering CMHC’s social housing portfolio and other corporate operating efficiencies.
The remaining $23.4 million will result from administrative efficiencies related to certain portfolio management activities for some existing social housing projects ($3.1 million); the rationalization of research and information dissemination priorities ($9.8 million); and the discontinuation of export promotion activities ($10.5 million). These savings will have no impact on low-income Canadians receiving federal housing assistance. (Also see Budget 2012 Implementation in the Summary of Financial Results section of the MD&A)
LEGISLATIVE AMENDMENTS
The legislative framework governing CMHC consists primarily of the Canada Mortgage and Housing Corporation Act (CMHC Act), the National Housing Act (NHA), and the Financial Administration Act (FAA).
Amendments to the CMHC Act and the NHA were made pursuant to Budget 2011 (the Supporting Vulnerable Seniors and Strengthening Canada’s Economy Act) and Budget 2012 (the Jobs, Growth and Long-term Prosperity Act).
In Budget 2011, the Government committed to introducing a legislative framework that would formalize existing mortgage loan insurance arrangements with private mortgage insurers and CMHC. The new legislative framework for mortgage loan insurance included the Protection of Residential Mortgage or Hypothecary Insurance Act (PRMHIA), which applies to private mortgage insurers, as well as consequential amendments to the National Housing Act. The PRMHIA and consequential amendments to the NHA have now come into force.
38 C A N A D A M O R T G A G E A N D H O U S I N G C O R P O R A T I O N
In addition, regulations necessary to fully implement the new legislative framework also came into force on January 1, 2013. These include regulations outlining minimum criteria for the designation of approved/ qualified lenders for CMHC and the private sector insurers, and regulations specifying the types of loans eligible for insurance underwritten by CMHC and private sector insurers.
With respect to Budget 2012, the Jobs, Growth and Long-term Prosperity Act received Royal Assent on June 29, 2012. Among other things, the Act enhances the governance and oversight framework for CMHC’s commercial activities and includes the following provisions:
| ¡ | the addition of a new objective for CMHC to ensure its commercial activities (mortgage loan insurance and securitization) and its activities with respect to administering the legal framework for Canadian covered bonds, promote and contribute to the stability of the financial system, including the housing market; |
| ¡ | legislative and regulatory authorities for the Minister of Finance regarding CMHC’s securitization activities and any new commercial programs; |
| ¡ | authorities for the Superintendent of Financial Institutions to review, at least annually, whether CMHC is carrying out its commercial activities in a safe and sound manner with due regard to its exposure to loss, and report the results to CMHC’s Board of Directors, the Minister of Finance and the Minister for CMHC, currently, the Minister of Human Resources and Skills Development; |
| ¡ | the addition of the Deputy Minister of the Minister for CMHC and the Deputy Minister of Finance to CMHC’s Board of Directors as ex-officio members; and |
| ¡ | a legal framework, administered by CMHC, for Canadian covered bonds. |
SOCIO-ECONOMIC FACTORS
Housing demand is subject to a range of demographic, social and economic influences. The growth in the housing stock is largely driven by household formation which in turn is closely linked to changes in population size, composition and employment rates. The following influence housing markets and CMHC’s operating environment:
Population growth and
international migration
Between 2006 and 2011, Canada’s population grew by 5.9%, up slightly from the previous five-year period (2001 to 2006) when it grew by 5.4%. However, the number of households increased by 5.5% between 2006 and 2011, down from 5.9% between 2001 and 2006.
The Canadian economy continues to relatively outperform many others in the Organisation for Economic Co-operation and Development. Canada’s attractive labour market has led to an estimated year-to-year increase of 23,000 persons in net migration to a total of 267,129 persons in 2012. Looking ahead, 2013 is expected to see net migration of 254,400 with a rebound to 268,900 in 2014. These increases will help support Canada’s housing sector.
Economic growth
Economic growth has slowed to 1.9% in 2012 compared to 2.7% in 2011. Given both global and domestic conditions, the Canadian economy is expected to grow by 1.8% in 2013. In accordance with the consensus among prominent Canadian economic forecasters, growth in gross domestic product is expected to rebound to 2.6% in 2014.

39
Interest rates and mortgage rates
The Bank of Canada has kept its target for the overnight interest rate at 1.0% since 2010. The five-year mortgage interest rate reached 5.24% in December 20121. According to CMHC’s base case scenario, the five-year mortgage rate is forecast to be within 5.00% to 5.75% in 2013 and will be within 5.50% to 6.25% in 2014.
Employment and income
In the 12 months to December 2012, employment grew by 1.8% (+310,300), leading to a decline in the unemployment rate to 7.1% from 7.5% in December 2011. Over this period, full-time employment rose 2.2% (+308,600), and part-time employment rose 0.1% (+1,700). In accordance with the consensus of prominent economists, employment is forecast to grow 1.3% in 2013 and 1.6% in 2014. The unemployment rate is expected to remain stable at 7.3% for 2013 and 2014.
Income grew in 2012 compared to 2011 and is expected to grow moderately in 2013 and 2014.
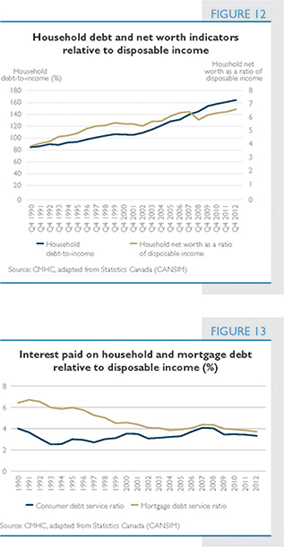
Household debt
There has been considerable attention paid to the household debt-to-income ratio. However, other ways to look at a household’s financial health include the household net worth-to-disposable income ratio which stood at 6.8, above the historical average of 5.6 since 1990 (Figure 12). In addition, indicators relating to Canadians’ ability to service their debt are also healthy by historical standards. Interest paid on mortgage debt as a share of monthly household disposable income in the fourth quarter of 2012 was 3.7%, well below the historical average of 4.8% (Figure 13).
HOUSING INDICATORS
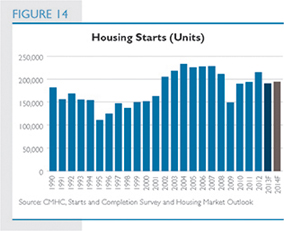
Housing starts
In 2012, housing starts increased to 214,827 as a result of strong gains in multiple starts, reflecting a high level of pre-sales in late 2010 and early 2011. CMHC expects a decline in both the singles and multiples segment which will result in a decline in
| 1 | This represents the conventional mortgage rate collected by CANNEX and calculated by CMHC. Actual mortgage rates offered by major Canadian lenders are often lower. |
40 C A N A D A M O R T G A G E A N D H O U S I N G C O R P O R A T I O N
total annual starts to 190,300 units in 2013. Growth in employment and economic activity will be tempered by increases in mortgage interest rates leading to a modest gain of 194,100 units in 2014.
Sales of existing homes
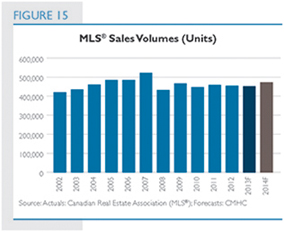
In 2012, Multiple Listing Service®1 (MLS®) sales were 453,372 units, down from 458,636 units in 2011. CMHC forecasts that sales of existing homes through the MLS® will hold steady in 2013, and increase in 2014 due to economic and employment growth. CMHC’s point forecast is 451,100 MLS® sales for 2013 and 472,300 for 2014.
House prices
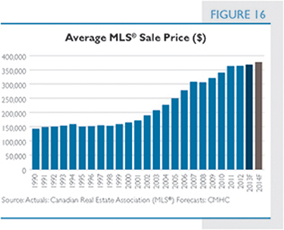
In 2012, house prices increased by 0.3% compared to 2011, reaching $363,740, up from $362,716 in 2011. Balanced market conditions are expected to prevail in most local housing markets and the average MLS® price should grow at a rate close to inflation, or slightly below, for 2013 and 2014. According to CMHC’s forecast, the average MLS® price is expected to be $367,500 in 2013 and $377,300 in 2014, representing increases of 1.0% and 2.7%, respectively.
Vacancy rates
The rental vacancy rate (all bedroom types in structures with three or more units) for Canada was 2.6% in October 2012, up from 2.2% in October 2011. Looking ahead, CMHC expects the vacancy rate to remain relatively unchanged at 2.5% in 2013.
| 1 | Multiple Listing Service® is a registered trademark owned by the Canadian Real Estate Association. |
41

SUMMARY
OF FINANCIAL RESULTS
CMHC reports on the following principal business activities and consolidates the accounts of the Canada Housing Trust, a separate legal entity:
| ¡ | Housing Programs: Expenditures and operating expenses are funded by Parliamentary appropriations. |
| ¡ | Lending: Revenues are earned from interest income on the loan portfolio which is funded through borrowings. |
Housing Programs and the Lending Activity provide support for Canadians in need and are operated on a planned breakeven basis.
| ¡ | Mortgage Loan Insurance: Revenues are earned from premiums, fees and investment income. Expenses consist of operating expenses and net claim expenses. The Corporation’s Net Income is primarily derived from this Activity. |
| ¡ | Securitization: Securitization revenues are earned from guarantee fees and interest income. Expenses consist primarily of interest expenses. Operating expenses and issuer fees under the new legal framework for covered bonds to be administered by CMHC are accounted for under this Activity. |
Mortgage Loan Insurance and Securitization Activities are operated on a commercial basis and are expected to generate reasonable returns. CMHC is expected to recover the costs of administering the legal framework for covered bonds from participating issuers.
| ¡ | Canada Housing Trust (CHT): CHT revenue is earned primarily from investment income. Revenue derived from investment income is used to cover operating expenditures and Canada Mortgage Bonds (CMB) interest expenses. |

42 C A N A D A M O R T G A G E A N D H O U S I N G C O R P O R A T I O N
CONSOLIDATED
FINANCIAL RESULTS
BALANCE SHEET HIGHLIGHTS
| 2012 | ||||||||||||||||||||
| ($M) | 2011 Actual | Plan | Actual | Variance to Plan | 2013 Plan | |||||||||||||||
Total Assets | 291,890 | 290,027 | 292,040 | 2,013 | 267,847 | |||||||||||||||
Total Liabilities | 279,799 | 276,337 | 278,195 | 1,858 | 252,731 | |||||||||||||||
Contributed Capital | 25 | 25 | 25 | - | 25 | |||||||||||||||
Accumulated Other Comprehensive Income (AOCI) | 902 | 499 | 1,038 | 539 | 731 | |||||||||||||||
Retained Earnings Set Aside for Capitalization | 9,727 | 9,884 | 10,764 | 880 | 11,481 | |||||||||||||||
Retained Earnings (Other)1 | 1,437 | 3,282 | 2,018 | (1,264) | 2,879 | |||||||||||||||
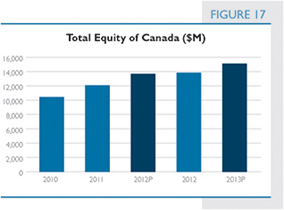
Total Equity of Canada | 12,091 | 13,690 | 13,845 | 155 | 15,116 | |||||||||||||||
| 1 | Includes Unappropriated Retained Earnings and Reserve Fund |
Total Assets and Total Liabilities
Total Assets were $292 billion and Total Liabilities were $278 billion as of 31 December 2012, of which $204 billion is related to CHT’s Canada Mortgage Bonds (CMB) program.
| ¡ | Compared to Plan |
Assets and liabilities both exceed plan by $2 billion. These variances result from lower than planned inter-company investments in Canada Mortgage Bonds, which are eliminated upon consolidation. The Corporation held less investments in CMBs than planned which resulted in lower inter-company elimination amounts and therefore increased the Investment Securities (Assets) and Canada Mortgage Bonds (Liabilities) balances in comparison to plan.
| ¡ | Compared to 2011 |
When compared to 2011, Total Assets have remained relatively stable with a $150 million (0.05%) increase.
Total Liabilities decreased by approximately $1.6 billion (0.6%) from 31 December 2011, mainly caused by $3.7 billion in net repayments of IMPP and the Lending Activity debt. This was partially offset by $2.3 billion in net issuances of CMB.
Equity of Canada
The Equity of Canada is made up of three components:
| ¡ | Contributed Capital |
The contributed capital of CMHC is determined by the Governor in Council. It is currently set at $25 million.
| ¡ | Accumulated Other Comprehensive Income (AOCI) |
AOCI is the accumulated unrealized gains or losses caused by the change in fair valuation of Available for Sale (AFS) investments in the Mortgage Loan Insurance and Securitization Activities. As at 31 December 2012, total AOCI was $1,038 million, $539 million higher than planned and $136 million higher than 2011. The variance to plan was mainly caused by a higher than planned increase in bond prices in 2011 and equity prices in 2012.
| ¡ | Retained Earnings |
Total Retained Earnings were $12,782 million of which $10,764 million was set aside for the capitalization of both the Mortgage Loan Insurance and Securitization Activities in accordance with CMHC’s Capital Management Framework. The residual $2,018 million in Retained Earnings is
43
comprised of Unappropriated Retained Earnings from the Mortgage Loan Insurance and Securitization Activities as well as the Reserve Fund in the Lending Activity. Total Retained Earnings variances are mainly driven by fluctuations in Net Income whereas component variances mainly arise as a result of the amounts that have been set aside for capitalization purposes. Further explanation is provided below as well as in the financial analysis sections of the strategic priorities.
Within the Public Accounts of Canada, CMHC’s annual Consolidated Net Income reduces the Government’s annual deficit, and the consolidated Retained Earnings and Accumulated Other Comprehensive Income reduces the Government’s accumulated deficit. Over the last decade, CMHC has contributed over $17 billion towards reducing the Government’s accumulated deficit through both its Net Income and Income Taxes.
The CMHC Act and National Housing Act (NHA) govern the use of the Corporation’s Retained Earnings.
Retained Earnings related to the Mortgage Loan Insurance Activity are appropriated in accordance with the Capital Management Framework which is based on guidelines developed by OSFI. For its Mortgage Loan Insurance Activity, CMHC has Appropriated Retained Earnings as well as AOCI representing its capital holding target of 200% Minimum Capital Test (MCT). Mortgage Loan Insurance Capital Available resulted in a 231% MCT as at 31 December 2012. In accordance with regulatory guidance issued by OSFI in 2012 for private mortgage insurers, the % MCT is now audited by CMHC’s external auditors annually.
Retained Earnings related to the Securitization Activity are also appropriated based on regulatory and economic capital principles. For its Securitization Activity, CMHC has Appropriated Retained Earnings as well as AOCI representing 100% of its target capital. Securitization Capital Available represented 156% of its target capital.
Earnings in relation to CMHC’s Lending Activity are retained to address interest rate risk exposures on pre-payable loans as well as credit risk exposure on the Municipal Infrastructure Lending Program loans. These Retained Earnings, referred to as the Reserve Fund, also include amounts representing unrealized fair market valuation changes of the Lending Activity as well as its portion of actuarial gains and losses from CMHC’s defined post-employment benefits.
The Reserve Fund for Lending is subject to a statutory limit of $240 million. Should the limit be exceeded, CMHC would be required to pay any excess to the Government of Canada. As at 31 December 2012, the Reserve Fund balance was negative $16 million. In the Reserve Fund, $102 million has been set aside to address interest rate risk and credit risk exposure. This is offset by $118 million in cumulative net unrealized losses resulting from fair market valuations, the majority of which was caused by Net Actuarial Losses on Post-Employment Benefits. A negative amount within the reserve has no implications on the statutory limit. For further information, see Lending Activity under strategic priority 1.1 of Objective 1.
As at year-end 2012, the Corporation’s Total Equity of Canada was relatively consistent with plan and $1,754 million (15%) higher than 2011. The year over year increase represents the Comprehensive Income recognized by CMHC during 2012.
44 C A N A D A M O R T G A G E A N D H O U S I N G C O R P O R A T I O N
STATEMENT OF INCOME AND
COMPREHENSIVE INCOME HIGHLIGHTS
| ($M) | 2011 Actual |
2012 | Variance to Plan | 2013 Plan | ||||||||||||||||
| Plan | Actual | |||||||||||||||||||
Revenues | 13,914 | 14,286 | 13,455 | (831) | 12,317 | |||||||||||||||
Expenses | 11,832 | 12,349 | 11,166 | (1,183) | 10,307 | |||||||||||||||
Income before Income Taxes | 2,082 | 1,937 | 2,289 | 352 | 2,010 | |||||||||||||||
Income Taxes | 553 | 440 | 573 | 133 | 486 | |||||||||||||||
Net Income | 1,529 | 1,497 | 1,716 | 219 | 1,524 | |||||||||||||||
Other Comprehensive Income (Loss) | 120 | - | 38 | 38 | (66) | |||||||||||||||
Comprehensive Income | 1,649 | 1,497 | 1,754 | 257 | 1,458 | |||||||||||||||
Revenues and Expenses
Total Revenues were $13,455 million and Total Expenses were $11,166 million for the year ended 31 December 2012 of which approximately $6,000 million was related to interest income and interest expenses from CHT’s CMB program.
| ¡ | Compared to Plan |
Revenues were $831 million (6%) lower than expected mainly due to $1 billion in lower interest income relating from the CHT CMB program caused by lower than forecasted interest rates. This variance was partially offset by higher than planned earned guarantee fees as NHA MBS issuances exceeded expectations and higher than planned Net Unrealized Gains from Financial Instruments mainly due to the unplanned consolidation of a foreign equity mutual fund in late 2011.
Similarly, the lower than expected interest rates for the CHT CMB program discussed above contributed to the $1 billion (10%) lower than planned Expenses.
| ¡ | Compared to 2011 |
Revenues and Expenses were $459 million and $666 million lower than 2011 mainly due to lower Interest Income and Interest Expense on the CMB Program as a result of a decrease in interest rates. The decrease in revenues was partially offset by $183 million in higher Net Unrealized Gains from Financial Instruments, primarily in the Mortgage Loan Insurance Activity, that were caused by favourable price movements on the consolidated foreign equity mutual fund.
Net Income
As a result of the above variances, Net Income of $1,716 million exceeded plan by $219 million (15%) and prior year results by $187 million (12%).
Other Comprehensive Income (Loss)
CMHC’s Other Comprehensive Income (OCI) consists of unrealized gains or losses caused by changes in the fair value of Available for Sale (AFS) investments in the Mortgage Loan Insurance and Securitization Activities. As these investments are classified as AFS, their unrealized gains/losses on fair valuation are recorded in OCI. Also included in OCI are net actuarial gains/losses from CMHC’s post-employment benefits.
| ¡ | Compared to Plan |
In 2012, total OCI was $38 million higher than expected mainly due to $208 million in higher than planned unrealized fair value fluctuations caused by market appreciation on investments securities. This variance was partially offset by higher than planned Reclassifications of Prior Years’ Net Unrealized Gains in Net Income of $61 million as a result of the sale of investments due to the implementation of a new Securitization asset allocation policy. Further offsetting the fair value gains, were $109 million in higher than planned Net Actuarial Losses from Post-employment Benefits caused by an unexpected decrease in the discount rate assumptions used in the calculation of the pension fund defined benefit obligation.

45
| ¡ | Compared to 2011 |
OCI decreased by $82 million in comparison to 2011 primarily as a result of lower Net Unrealized Gains on Available for Sale Financial Instruments and a higher Reclassification of Prior Years’ Net Unrealized Gains Realized in Net Income that were partially offset by lower Actuarial Losses from Post-employment Benefits.
Net Unrealized Gains on Available for Sale Financial Instruments were $144 million lower in 2012 mostly due to the stabilization of bond yields during the year, that were partially offset by an increase in equity prices in 2012.
Reclassifications of Prior Years’ Net Unrealized Gains were $21 million higher than last year. The increase resulted from the implementation of the new asset allocation policy within the Securitization Activity, as previously discussed.
These decreases to OCI were partially offset by an $83 million decrease in Net Actuarial Losses from Post-employment Benefits primarily due to an increase in the actual rate of return on pension fund assets.
Resource Management
Total Operating Expenses for the year ended 31 December 2012 were in line with the plan and $7 million higher than 2011. The year over year increase was largely due to a higher pension expense that resulted primarily from a decline in the assumption for the discount rate. This increase was slightly offset by cost saving measures as explained in the Budget 2012 Implementation section.
Staff-years of 1,900 were consistent with plan (98%) and 2011 figures (96%).
BUDGET 2012 IMPLEMENTATION
This section provides an overview of the savings measures announced in Budget 2012 in order to refocus government and programs; make it easier for Canadians and businesses to deal with their government; and modernize and reduce the back office.
Efforts to reduce the federal deficit were undertaken by all federal departments and agencies, including CMHC. The focus was on decreased spending, requiring a review of CMHC’s operations and government appropriation-based programs.
The global results of the spending review exercise were announced in Budget 2012. As noted in the Budget, CMHC will contribute $102.4 million in ongoing annual savings by 2014-2015. These savings will have no impact on low-income Canadians receiving federal housing assistance delivered through federal or provincial/territorial agreements. They will be achieved through lower program administration costs, operating efficiencies, rationalizing research and information dissemination priorities, and discontinuing CMHC’s housing export program. CMHC is on track to implement and realize all of its savings measures for 2012-2013.
Lower program administration costs
CMHC administers and funds social housing projects in Prince Edward Island, Quebec and Alberta, on-reserve housing across Canada as well as other social housing projects funded by previous programs, mostly co-operative housing projects in Ontario and British Columbia.
| ($M) | 2011 Actual | 2012 | Variance to Plan | 2013 Plan | ||||||||||||||||
| Plan | Actual | |||||||||||||||||||
Total Operating Expenses (included in Expenses in table on previous page) | 420 | 427 | 427 | - | 463 | |||||||||||||||
Staff FTEs (Full-time Equivalents) | 1,975 | 1,947 | 1,900 | (47) | 1,878 | |||||||||||||||
46 C A N A D A M O R T G A G E A N D H O U S I N G C O R P O R A T I O N
Lower than anticipated program administration costs will result in savings in administering CMHC’s social housing portfolio. These savings will have no impact on low-income Canadians receiving housing assistance through the federal or provincial/territorial government.
Program administration efficiencies
CMHC is responsible for the existing social housing portfolio off reserve where this portfolio has not been transferred to provinces and territories under Social Housing Agreements and for the existing CMHC-delivered social housing portfolio on reserve. CMHC undertakes portfolio management activities such as client visits and physical project inspections to ensure that this portfolio is well managed. With a significant number of projects to manage, CMHC is introducing a new approach for administering its programs and managing risk to be more effective and efficient.
CMHC has identified ways to streamline its processes and activities by reducing or eliminating certain portfolio management activities for some existing social housing projects.
These savings will have no impact on low-income Canadians receiving housing assistance.
Corporate operating efficiencies
CMHC has identified a number of operating efficiencies that will achieve savings while still maintaining services and providing tools and resources necessary for efficient operations. For example, travel, training and recruiting costs will be reduced. Equipment such as printers/photocopiers and devices will also be rationalized.
Rationalizing research and information dissemination priorities
CMHC will adjust its approach to research and survey expenditures to focus on fewer and higher priority research areas.
CMHC will continue to conduct and disseminate housing research aimed at improving market effectiveness, strengthening community well-being, addressing distinct housing needs, analyzing and reporting on housing need and improving housing performance.
Discontinuing CMHC’s housing export program
CMHC’s housing export program was created fifteen years ago to open doors and to provide technical assistance to help Canadian companies export their housing products and services abroad. As evidenced by the number of Canadian housing companies now operating in foreign markets, the program, which complements existing government export programs, has been successful in demonstrating how housing exporters can access foreign markets.
With this experience, supported by existing government export programs, housing exporters will continue to benefit from the opportunities that have been created over the last decade.

47
SAVINGS MEASURES
List By Program Alignment Architecture (in thousands $) | 2012-13 | 2013-14 | 2014-15 | Ongoing | ||||||||||||
Assisted Housing Programs | ||||||||||||||||
Resulting from Corporate operating efficiencies, lower program administration costs in administering CMHC’s social housing portfolio and program administration efficiencies | 658 | 3,045 | 79,457 | 79,457 | ||||||||||||
On-Reserve Housing Programs | ||||||||||||||||
Resulting from Corporate operating efficiencies and program administration efficiencies | 716 | 990 | 1,038 | 1,038 | ||||||||||||
Affordable Housing Initiative | 134 | 134 | 134 | 134 | ||||||||||||
Resulting from Corporate operating efficiencies | ||||||||||||||||
Housing Repair and Improvement Programs | 132 | 132 | 132 | 132 | ||||||||||||
Resulting from Corporate operating efficiencies | ||||||||||||||||
Research and Information Transfer | ||||||||||||||||
Resulting from Corporate operating efficiencies and rationalization of research and information dissemination priorities | 720 | 9,168 | 10,475 | 10,475 | ||||||||||||
International Activities | 1,349 | 10,120 | 10,494 | 10,494 | ||||||||||||
Resulting from the discontinuation of CMHC’s housing export program | ||||||||||||||||
Emergency Planning | 8 | 8 | 8 | 8 | ||||||||||||
Resulting from Corporate operating efficiencies | ||||||||||||||||
Canadian Housing Market Research and Analysis | 632 | 632 | 632 | 632 | ||||||||||||
Resulting from Corporate operating efficiencies | ||||||||||||||||
Total for Canada Mortgage and Housing Corporation | 4,349 | 24,229 | 102,370 | 102,370 | ||||||||||||
DISCLOSURE OF CHANGES IN ACCOUNTING POLICIES
CMHC’s significant accounting policies and changes in accounting policies are described in Note 2 (significant accounting policies) of CMHC’s 2012 Consolidated Financial Statements.
CMHC’s financial statements for 2012 have been prepared in accordance with International Financial Reporting Standards (IFRS) effective as at 31 December 2012, with the exception of the amendments to IAS 1 Presentation of Financial Statements which have been adopted in advance of the date they become effective for CMHC (1 January 2013).
CRITICAL ACCOUNTING POLICIES AND ESTIMATES
Judgments in Applying
Accounting Policies
In the process of applying CMHC’s accounting policies, CMHC Management is required to make various judgments that can significantly affect the amounts recognized in the financial statements. The judgments having the most significant effects on the financial statements are:
| ¡ | Derecognition: in assessing whether transfers of NHA MBS from Issuers to the Corporation under the CMB program (CHT) and IMPP (CMHC) qualify for derecognition, significant judgment is applied in determining whether substantially all the risks and rewards of ownership of the NHA MBS have been transferred. Per IAS 39: Financial Instruments – Recognition and Measurement requirements, CMHC has determined that the sellers of NHA MBS to the Corporation failed the derecognition criteria as they retain the risk and rewards of the NHA MBS through swap agreements. |
48 C A N A D A M O R T G A G E A N D H O U S I N G C O R P O R A T I O N
| ¡ | Consolidation: significant judgments are applied in the assessment of whether the substance of the relationship between CMHC and Canada Housing Trust (a special purpose entity) indicates that, as per Standing Interpretation Committee Interpretation 12: Consolidation – Special Purpose Entities, CMHC controls that special purpose entity. CMHC guarantees the timely payment of principal and interest on the Canada Mortgage Bonds, which exposes it to the majority of risks of Canada Housing Trust and as a result, CMHC consolidates the Canada Housing Trust. Significant judgments are also applied in the assessment of whether the substance of the relationship between CMHC and Nordea International Equity Fund (Nordea) indicates that CMHC controls it. As CMHC is the principal investor in the fund, Nordea is reliant on CMHC’s continued investment and CMHC, in effect, has the power to govern Nordea’s policies so as to obtain benefits from its activities. As a result, CMHC consolidates Nordea International Equity Fund. |
| ¡ | Impairment of Available for Sale Financial Instruments: significant judgment is applied in assessing if there is objective evidence of impairment, including whether declines in the fair value of AFS equity instruments below cost are significant and/or prolonged. |
Critical Accounting Estimates
The preparation of the Consolidated Financial Statements requires CMHC Management to make estimates and assumptions. These estimates and assumptions affect the reported amounts of assets, liabilities, comprehensive income and related disclosure. These estimates and underlying assumptions are reviewed on an ongoing basis. Where actual results differ from these estimates and assumptions, the impact will be recorded in future periods.
| ¡ | Provision for Claims: The Provision for Claims represents an estimate for expected claims and the related settlement expenses, net of the related expected property sale proceeds, for defaults from the mortgage loan insurance business that have occurred on or before the Consolidated Balance |
Sheet date. In calculating the estimated liability, an estimate of losses on defaults that have been incurred but not reported is made using historical experience and the time value of money, which considers prevailing legal, economic, social and regulatory trends. See Note 14 for further details. |
| ¡ | Unearned Premiums: Mortgage loan insurance premiums are deferred and recognized as revenue over the period covered by the insurance contracts using actuarially determined factors that are reviewed annually as part of the Actuarial Valuation. The premium earning factors are derived from claim occurrence patterns based on the principle that premiums will be earned at the same rate as claims are incurred. See Note 14 for further details. |
| ¡ | Financial Instruments: Financial instruments carried at fair value are measured based on quoted market prices observable in the market or amounts derived from cash flow models or other valuation methodologies. The fair value measurement hierarchy described in Note 17 reflects the significance of the inputs used in making these measurements. |
| ¡ | Post-employment Benefits: The annual cost of pension and other post-employment benefits earned by employees is actuarially determined using the projected unit credit method prorated on service and CMHC Management’s best estimate of expected long-term pension plan investment performance, compensation increases, retirement ages of employees, mortality of members and expected health care costs. These assumptions are of a long-term nature, which is consistent with the nature of post-employment benefits. See Note 21 for further details. |
FUTURE ACCOUNTING CHANGES
The International Accounting Standards Board (IASB) continues to develop and publish accounting standards in order to achieve high quality financial reporting. CMHC actively monitors the new standards and amendments to existing standards that have been issued by the IASB but are not yet effective on the date of issuance of these Consolidated Financial Statements. The following pronouncements, listed by
49
applicable annual accounting period effective date, have been identified as potentially having an impact on the Corporation’s results and Consolidated Financial Statements in the future.
| New Standards | Effective for or after | |||
| IFRS 10 | Consolidated Financial Statements | 1 January 2013 | ||
| IFRS 11 | Joint Arrangements | 1 January 2013 | ||
| IFRS 12 | Disclosure of Interests in Other Entities | 1 January 2013 | ||
| IFRS 13 | Fair Value Measurement | 1 January 2013 | ||
| IFRS 9 | Financial Instruments | 1 January 2015 | ||
| Amended Standards | ||||
| IFRS 10 | Consolidated Financial Statements | 1 January 2013 | ||
| IFRS 11 | Joint Arrangements | 1 January 2013 | ||
| IFRS 12 | Disclosure of Interests in Other Entities | 1 January 2013 | ||
| IFRS 7 | Financial Instruments: Disclosures | 1 January 2013 | ||
| IAS 19 | Employee Benefits | 1 January 2013 | ||
| IAS 32 | Financial Instruments: Presentation | 1 January 2014 | ||
IFRS 10 Consolidated Financial Statements provides a single consolidation model that identifies control as the basis for consolidation. As CMHC’s current accounting and consolidation practices are compliant under IFRS 10 consolidation guidelines, it does not expect that the new and amended standard will have a material impact on its Consolidated Financial Statements.
IFRS 11 Joint Arrangements establishes principles for financial reporting of joint arrangements. CMHC does not expect that the new and amended standard will have a material impact on its Consolidated Financial Statements.
IFRS 12 Disclosure of Interests in Other Entities enhances and replaces the disclosure requirements for subsidiaries, joint arrangements, associates and unconsolidated structured entities. CMHC has determined that this new standard and amendments will require adjustments to its current note disclosure.
IFRS 13 Fair Value Measurement defines fair value, sets out a single framework for measuring fair value and requires disclosures about fair value measurements.
While IFRS 13 does not introduce any new requirements, it reduces complexity and improves consistency by clarifying the definition of fair value and requiring its application to all fair value measurements. CMHC currently follows the IFRS 13 principles for determining fair value on most of its financial instruments, except for certain rent-producing real estate properties under the Lending Activity. These properties are fair valued based on the present value of expected future cash flows using a discount rate reflective of the characteristics of the property. Upon adoption of this new standard, all of CMHC’s real estate properties will be required to be valued at their highest and best use values, resulting in a potential increase in fair value of the properties as well as an increase to CMHC’s Net Income. CMHC also anticipates enhanced disclosure requirements relating to fair value measurement information.
Amendments to IFRS 7 Financial Instruments: Disclosures provide new disclosure requirements in netting arrangements to enable users of financial statements to better compare financial statements prepared in accordance with IFRS and U.S. GAAP. CMHC has determined that these amendments will require adjustments to its current note disclosure.
Amendments to IAS 19 Employee Benefits update the existing standard by eliminating the “corridor method” and improve the recognition, presentation and disclosure requirements for defined benefit plans. As CMHC has adopted the change from the corridor method upon implementation of IFRS, this component of the amendment will not affect the Consolidated Financial Statements. CMHC’s analysis of the other changes indicates that the amendments will result in an overall change in pension expenses reflected in Net Income with a corresponding offset in actuarial gains and losses recognized in Other Comprehensive Income. This change is due to the discount rate being applied to the plan assets to calculate the estimated return by the plan rather than the expected rate of return that was previously allowed. These amendments also include enhanced disclosure requirements.
In 2013, CMHC will determine the impact of the amendments to IAS 32 Financial Instruments: Presentation on its Consolidated Financial Statements.
50 C A N A D A M O R T G A G E A N D H O U S I N G C O R P O R A T I O N

PERFORMANCE BY OBJECTIVE
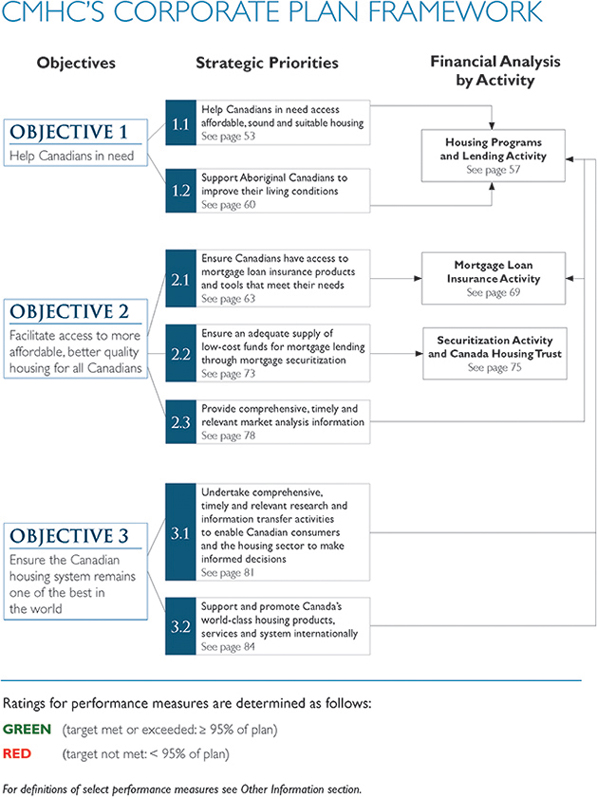
CORPORATE PLAN FRAMEWORK
At the beginning of 2012, CMHC’s 2012-2016 Corporate Plan comprised three objectives and seven strategic priorities. As part of the deficit reduction measures announced in Budget 2012, strategic priority 3.2 on CMHC’s export promotion activities was removed from the Framework as these activities were discontinued. (See discussion in the Summary of Financial Results section.) No other changes were made to the 2012-2016 Framework which guided CMHC’s planning and reporting of activities in 2012.
Amendments to the National Housing Act in June of 2012 led to further revisions to the Framework for the 2013-2017 planning period. Additional details are found in the 2013-2017 Summary of the Corporate Plan which was tabled in Parliament on March 22, 2013.This Summary is available on CMHC’s website.
Activities under strategic priorities 1.1, 1.2, 2.3, 3.1, and 3.2 in this year’s framework are funded by the Government of Canada through Parliamentary appropriations. Mortgage loan insurance and securitization activities under strategic priorities 2.1 and 2.2 are operated on a commercial basis at no cost to Canadian taxpayers.
Analysis of performance and financial results is provided for the seven strategic priorities as depicted by the following diagram. |

51
52 C A N A D A M O R T G A G E A N D H O U S I N G C O R P O R A T I O N
OBJECTIVE 1 HELP CANADIANS IN NEED
Under this objective, CMHC pursues two strategic priorities which help address the housing needs of Canadians, including Aboriginal Canadians living both on and off reserve.
Access to affordable, sound and suitable housing provides individuals and families with a stable foundation from which to pursue educational and employment opportunities and contributes to improved health and overall quality of life. While the majority of Canadians are able to meet their housing needs without direct public assistance, many low-income individuals and families living on and off reserve require assistance. The federal government, through CMHC, provides significant investments in support of the existing social housing stock as well as new funding toward affordable housing programs to address housing need.
STRATEGIC PRIORITY | 1.1 | HELP CANADIANS IN NEED ACCESS AFFORDABLE, SOUND AND SUITABLE HOUSING |
RESOURCES
| OPERATING EXPENSES $55 MILLION | STAFF-YEARS 346 | ||
| Performance Measures |
2011 Actual | 2012 | 2013 Plan | |||||||||||||
| Plan | Actual | |||||||||||||||
Housing Programs expenses1 excluding operating expenses ($M) | 2,044 | 2,023 | 2,074 | 1,988 | ||||||||||||
Affordable housing expenditures2 ($M) | 127.1 | 411.5 | 367.0 | 257.8 | ||||||||||||
Direct Lending ($M) | 1,392.1 | 830.0 | 1,012.6 | 1,117.5 | ||||||||||||
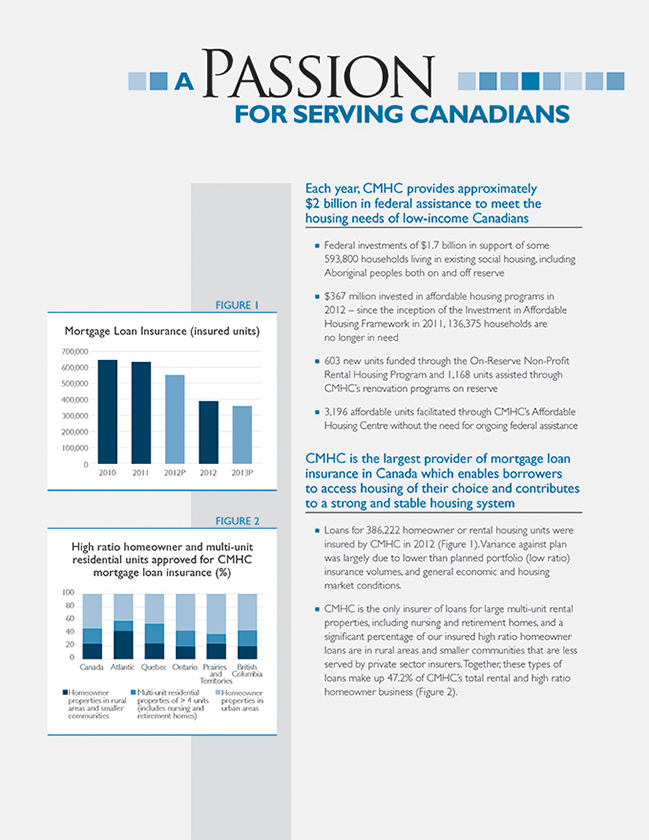
Estimated number of households assisted through long-term social housing commitments | 604,200 | 597,800 | 593,800 | 585,800 | ||||||||||||
Affordable housing units facilitated by CMHC’s Affordable Housing Centre | 2,838 | 2,715 | 3,196 | 2,940 | ||||||||||||
| 1 | Includes Housing Programs expenses under 1.1, 1.2, 2.3, 3.1, and 3.2. |
| 2 | Includes expenditures under the IAH, AHI and renovation programs and are part of overall Housing Programs expenses; full take-up of the fiscal year budget is expected. |
PERFORMANCE ANALYSIS
CMHC provides federal investments in affordable, suitable and sound housing for low-income Canadians. These investments include ongoing subsidies for the existing social housing stock as well as new funding for affordable housing programs under the Investment in Affordable Housing (IAH) 2011-2014 Framework. CMHC also provides advice, information and financial assistance to groups wishing to develop affordable housing without the need for long-term federal subsidies through its Affordable Housing Centre.
CMHC substantially succeeded in meeting its performance targets. The affordable housing expenditure budget is provided on a fiscal year basis (April – March). As at 31 December 2012, spending of $367 million from this budget was lower than initially planned for two provinces, but full take-up of the budget by fiscal year-end is expected.

53
HOUSING NEED IN CANADA
According to Census-based estimates, 12.7% or 1.5 million Canadian households in 2006 were unable to find adequate and suitable housing without spending 30% or more of their income. This represents a 7.3% decrease in the incidence of core housing need since 2001. Although experiencing a decline in their respective core need incidences between 2001 and 2006, renters, lone parents, non-family households, Aboriginal Canadians and seniors continue to have a higher incidence of core housing need than the average Canadian household. Recent immigrants also experience a much higher incidence of core housing need.
CMHC also studies trends in urban housing conditions based on data from the Survey of Labour and Income Dynamics (SLID). Based on the most recent SLID data, the incidence of core housing need for urban households in 2009 was 13.5%, an increase from 12.3% in 2007 (before the beginning of the 2008-09 economic downturn).This is consistent with economic conditions in Canada during this time period. In 2009, about 1.4 million urban households lived in core housing need, an increase of about 164,000 households over 2007.
The dynamics of core housing need – the movement of individuals into or out of core need – is also studied by CMHC through SLID. Based on SLID, estimates revealed that only one-quarter to one-third of Canadians in an urban household lived persistently (three years) in core housing need, while the remaining two-thirds to three-quarters did so occasionally (one or two years).
Federal investments in the existing social housing stock
Housing Programs expenses of $2,074 million were on target. These expenses primarily cover federal investments associated with ongoing subsidies of social housing projects developed under a range of programs between 1946 and 1993. In 2012, approximately $1.7 billion in federal funding supported this housing which is home to 593,8001 households across Canada both off and on reserve. Most of this funding is administered by provinces and territories under Social Housing Agreements and tied to project operating agreements that generally expire as their 25- to 50-year mortgages are paid off. Once the operating agreements expire (most will expire by 2038), the legal obligations of public funding agencies, under these operating agreements, will have been fulfilled.
In 2012, CMHC completed an analysis of the impact of CEAP investments on the social housing stock2 that receives ongoing subsidies and is administered by the Corporation. The analysis concluded that these investments were successful in improving the condition of the stock and addressed capital repairs that otherwise would have depleted the projects’ replacement reserve funds. These reserves can now be used by the project sponsors for future capital repairs. As a condition of receiving this CEAP funding, project sponsors were required to continue the not-for-profit status of their units providing affordable housing to low and moderate-income households for a period of at least ten years.
| 1 | Under Social Housing Agreements, most provinces/territories administer federal funding for social housing projects. However, CMHC administers funding for some 95,800 units (excluding units on reserve). |
| 2 | Under Canada’s Economic Action Plan, federal funding of $1 billion over two years was provided to renovate or provide energy retrofits to the existing social housing stock. Funding under project operating agreements for this stock is either administered by the provinces/territories or by CMHC. |
54 C A N A D A M O R T G A G E A N D H O U S I N G C O R P O R A T I O N
New investments in affordable housing
The Investment in Affordable Housing (IAH) 2011-2014 Framework provides a combined total of $1.4 billion over three fiscal years from the federal, provincial and territorial governments toward improving access to affordable housing that is sound, suitable and sustainable.
The Framework outlines the key principles and approach being implemented through IAH agreements between CMHC and most provinces and territories. Provinces and territories cost match the federal investment and design and deliver programs to meet their local housing needs and priorities. Programs funded under the IAH can support new construction, renovation, homeownership, rent supplements, shelter allowances and accommodations for victims of family violence. Prince Edward Island and the Yukon decided to continue the delivery arrangements for the Affordable Housing Initiative (AHI) and renovation programs.
The performance measure related to affordable housing expenditures is largely made up of spending by provinces and territories related to the new IAH agreements. Each year, provinces and territories have until the end of the fiscal year (March) to fully claim their annual allocation under the agreements. The pace of provincial and territorial claims received within the 2012 calendar year differed from CMHC’s assumptions when the performance target was set for 2012. Some provincial/territorial spending that CMHC expected to take place in 2012 actually occurred in 2011, while in other cases spending will occur by the end of the fiscal year in early 2013. All provinces and territories have claimed their full federal funding allocation for 2011-12 and are expected to fully claim their 2012-13 allocation. As a result, Canadians in housing need will benefit from the full federal investment.
Since the IAH Framework was announced, funding has been provided for 136,375 units. These units relate to funding delivered under agreements with provinces and territories for the IAH as well as under extensions to the AHI and renovation programs in Prince Edward Island and Yukon, where these jurisdictions decided to extend previous delivery arrangements. In Ontario, the Province requested that CMHC continue to make new funding commitments under the existing renovation programs until March 31, 2012.
Supporting affordable housing groups
Throughout Canada, local organizations, individuals and businesses are at the heart of efforts to create more affordable housing in their communities. CMHC’s Affordable Housing Centre is there to help with a team of experts who have first-hand knowledge of approaches that have been implemented by private companies, the not-for-profit sector and municipalities to develop affordable housing in communities across Canada. In addition to offering project-specific expertise, the Affordable Housing Centre can help determine if a housing project is financially viable, identify resources and other potential partners, and share information on what has worked in other communities. The Centre has a comprehensive suite of research products, including market information and housing research. The Centre also provides financial assistance through Seed Funding and Proposal Development Funding. (See Glossary for a description of these programs.) Over the years, the Affordable Housing Centre has had many successes. In 2012, the Centre facilitated 3,196 units. Since the Centre’s inception in 1991, it has facilitated, across the country, 62,465 affordable housing units that do not require ongoing federal assistance.
55

56 C A N A D A M O R T G A G E A N D H O U S I N G C O R P O R A T I O N
FINANCIAL ANALYSIS
The following provides financial information and analysis on CMHC’s Housing Programs Activity and Lending Activity. These activities are primarily in support of strategic priorities 1.1 and 1.2, but also support market analysis and research on information initiatives under strategic priorities 2.3 and 3.1.
Housing Programs Activity
CMHC’s authority to spend public funds under the Housing Programs is provided by the Government of Canada on a fiscal year basis through annual Parliamentary appropriations. The majority of this funding supports programs to address the housing needs of low-income Canadians including First Nations people living on reserve. In addition, other housing-related activities supported by this funding include market analysis, research and information transfer. Additional details of CMHC’s Housing Programs expenses in 2012 are provided below as well as the analysis of CMHC’s Lending Activities.
Annually, the Corporation spends approximately $2 billion in support of housing programs. Approximately $1.7 billion of the $2 billion relates to ongoing, long-term social housing commitments of which $1 billion is paid to provinces and territories that administer the housing portfolio pursuant to Social Housing Agreements with CMHC.
CEAP, a temporary two-year initiative which terminated 31 March 2011, increased Housing Programs expenses from 2009 to 2011. Under CEAP, CMHC fully delivered $1.925 billion in social housing for the creation of new affordable housing and the renovation and retrofit of existing social housing.
Effective April 2011, expenditures relating to the Investment in Affordable Housing (2011-2014) Framework (IAH) began to flow under the Housing Programs appropriations. The objective of this Framework is to improve the living conditions of Canadians in need by improving access to affordable, sound, suitable and sustainable housing.
| ($M) |
2011 Actual | 2012 | Variance to Plan | 2013 Plan | ||||||||||||||||
| Plan | Actual | |||||||||||||||||||
Housing Programs Expenses | 2,044 | 2,023 | 2,074 | 51 | 1,988 | |||||||||||||||
Operating Expenses | 119 | 115 | 123 | 8 | 113 | |||||||||||||||
Total Appropriations | 2,163 | 2,138 | 2,197 | 59 | 2,101 | |||||||||||||||
| ¡ | Compared to Plan |
Total appropriations spending in 2012 was $2,197 million, consisting of $2,074 million in Housing Programs Expenses and $123 million in Operating Expenses. Program expenditures were above the 2012 Plan by $51 million due to revised spending patterns for various programs and initiatives funded under the Housing Programs, including the existing social housing portfolio.
Related Housing Programs Operating Expenses were $8 million over the 2012 Plan mainly due to higher than planned pension expenses caused by the decline in the discount rate assumption. This was slightly offset by cost savings measures as explained in the Budget 2012 Implementation section.
| ¡ | Compared to 2011 |
When compared to prior period expenditures, overall Housing Programs Expenses have remained relatively stable with a 1% ($30 million) increase. The increase resulted from higher spending under the Investment in Affordable Housing (2011-2014) Framework in 2012 which is largely offset by lower spending due to the termination of CEAP funding as at 31 March 2011.
Compared to the prior year, Housing Programs Operating Expenses remained relatively consistent, with a 3% ($4 million) increase.
57
Reporting on Use of Appropriations
Housing Programs Parliamentary appropriations and related expenses are recorded in CMHC’s Consolidated Statement of Income and Comprehensive Income on an accrual basis and cannot exceed the maximum authorized by Parliament. Those expenses incurred, but not yet reimbursed, are recorded on the Consolidated Balance Sheet as Due from the Government of Canada. CMHC manages the Housing Programs financial authority on a fiscal year basis (31 March year-end).
For additional information see Other Information.
Lending Activity
CMHC makes loans under the National Housing Act (NHA) to federally-subsidized social housing sponsors, First Nations, provinces, territories and municipalities. CMHC’s loan portfolio is comprised of a mix of renewable and non-renewable loans for the purposes of both market and social housing. Where a loan is for social housing, it may be on reserve or off reserve. The majority of Lending Activity revenue is earned from interest income on the loan portfolio.
Through Direct Lending, CMHC is able to lower government costs of subsidizing social housing projects as loans can be offered at below market interest rates due to CMHC’s use of the Crown Borrowing Program1 to obtain funds. Direct Lending is operated on a planned breakeven basis. In 2012, CMHC exceeded the plan, providing $1,012.6 million in Direct Lending loans.
CMHC loan agreements generally do not permit prepayments to minimize interest rate risk and provide the lowest interest rate possible to clients. Where prepayment is permitted through the loan contract or by policy, certain terms and conditions, including prepayment charges, apply.
| ($M) | 2011 Actual | 2012 | Variance to Plan | 2013 Plan | ||||||||||||||||
| Plan | Actual | |||||||||||||||||||
Interest Income | 695 | 667 | 617 | (50) | 591 | |||||||||||||||
Net Unrealized Gains (Losses) from Financial Instruments | (23) | (11) | (8) | 3 | (16) | |||||||||||||||
Other Income (Expenses) | 21 | 14 | 31 | 17 | 26 | |||||||||||||||
Total Revenues | 693 | �� | 670 | 640 | (30) | 601 | ||||||||||||||
Interest Expense | 650 | 635 | 599 | (36) | 568 | |||||||||||||||
Operating Expenses | 19 | 26 | 19 | (7) | 26 | |||||||||||||||
Total Expenses | 669 | 661 | 618 | (43) | 594 | |||||||||||||||
Income before Income Taxes | 24 | 9 | 22 | 13 | 7 | |||||||||||||||
Income Taxes | 11 | - | 3 | 3 | (3) | |||||||||||||||
Net Income | 13 | 9 | 19 | 10 | 10 | |||||||||||||||
The majority of the Lending Activity operates on a breakeven basis as the Interest Income on the loans and investments is offset by the Interest Expense on the borrowings used to fund the loans and the Operating Expenses incurred to administer the program.
| ¡ | Compared to Plan |
For the year ended 31 December 2012, Net Income from the Lending Activity was $19 million, $10 million over plan. The majority of this variance was due to $17 million in higher than planned Other Income resulting primarily from a higher than planned recovery of Housing Program Post-employment Benefits of $8 million as the plan had not anticipated the significant actuarial losses incurred in 2011. The reimbursement of these expenses is recovered from the Government of Canada through Housing Programs Appropriations. The remaining main contributors to the Other Income variance were a $4 million increase in the fair value of real estate caused by the addition of a property to the Lending Activity’s real estate portfolio in 2012 and $3 million in interest collected on a prior year tax refund.
| 1 | Most Crown corporations who have statutory authority to borrow funds, do so through the Crown Borrowing Program. This Program enables these entities to borrow funds at favourable interest rates. |
58 C A N A D A M O R T G A G E A N D H O U S I N G C O R P O R A T I O N
| ¡ | Compared to 2011 |
Net Income for 2012 was $6 million higher than 2011. This increase is mainly the result of $15 million in lower unrealized losses on the fair valuation of loans, debt and investments caused by a decline in their outstanding balances as they are approaching and reaching maturity and an increase in interest rates during 2012 in comparison to a decrease in rates in 2011. Also, Income Taxes for 2012 were $8 million lower than last year as the tax rates and taxable income decreased between both years. These increases to Net Income were partially offset by a $20 million interest loss recovery that occurred in 2011, but did not repeat itself in 2012.
Capital Management
Earnings from the Lending Activity are retained by the Corporation in a Reserve Fund which is subject to a statutory limit of $240 million. The components of this Reserve Fund are shown in the table below.
| ($M) | 2011 Actual | 2012 | Variance to Plan | 2013 Plan | ||||||||||||||||
| Plan | Actual | |||||||||||||||||||
Reserve for All Other Lending- Related Items | 105 | 112 | 102 | (10) | 117 | |||||||||||||||
Reserve for Unrealized Gains (Losses) | (101) | 52 | (118) | (170) | (25) | |||||||||||||||
Reserve Fund for | 4 | 164 | (16) | (180) | 92 | |||||||||||||||
The Reserve for All Other Lending-Related Items is kept by the Corporation as part of its strategy to address interest rate risk exposure on prepayable loans as well as credit risk exposure on the MILP loans. This Reserve balance was $10 million below plan mainly due to lower than anticipated net interest margin on the Lending loan portfolio. The variance was mainly caused by lower than planned interest rates on loans that were partially offset by unplanned interest income on derivatives. Derivatives are used in the Lending portfolio to mitigate the interest rate risk associated with the Lending Activity.
The Reserve for Unrealized Gains (Losses) was instituted to absorb unrealized fair market fluctuations incurred by the Lending Activity as
these amounts are unrealized and are subject to changes due to market conditions. A negative amount within the reserve has no implications on the limit. When compared to plan, the Reserve for Unrealized Gains and Losses was $170 million lower than expected mainly due to higher than planned Net Actuarial Losses on Post-employment Benefits that resulted from lower than planned discount rate assumptions. This was partially offset by higher than anticipated returns on plan assets.
This reserve has also decreased over the last 12 months largely as a result of these net actuarial losses.
LOOKING AHEAD
As Canada’s national housing agency, CMHC will continue to administer federal investments of almost $2 billion for social and affordable housing. These investments consist primarily of ongoing subsidies in support of the existing social housing stock under project operating agreements, and new investments for affordable housing programs under the IAH.
CMHC will continue to provide loans under the NHA to federally subsidized social housing sponsors, First Nations, provinces, territories and municipalities thereby lowering government costs of subsidized social housing projects through its Direct Lending initiative.
CMHC will continue its work with the provincial-territorial working group examining the viability of the existing social housing stock when project operating agreements and associated subsidies end.
New investments under the IAH, which are part of the federal commitment to affordable housing and homelessness, have been renewed until 2018-19 as announced in Economic Action Plan 2013.
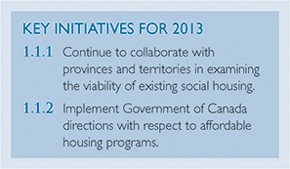
59
STRATEGIC PRIORITY | 1.2 | SUPPORT ABORIGINAL CANADIANS TO IMPROVE THEIR LIVING CONDITIONS |
RESOURCES
|
OPERATING EXPENSES $18 MILLION
|
STAFF-YEARS 128
|
| Performance Measures |
2011 Actual | 2012 | 2013 Plan | |||||||||||||
| Plan | Actual | |||||||||||||||
New units committed under the On-Reserve Non-Profit Rental Housing Program | 604 | 548 | 603 | 465 | 1 | |||||||||||
Renovation program expenditures (value of loans that are forgiven over time) ($M) | 12.6 | 15.5 | 17.1 | 14.5 | ||||||||||||
Per cent of housing programs and services delivered through First Nations or Aboriginal organizations | 90 | 85 | 88 | 85 | ||||||||||||
| 1 | The decrease in the number of new units planned is primarily a result of forecasted higher interest rates going forward. |
PERFORMANCE ANALYSIS
CMHC works in partnership with Aboriginal Affairs and Northern Development Canada (AANDC) in assisting First Nations to help meet the housing needs of their members. Our role includes providing federal funding for the construction, purchase and rehabilitation of suitable, adequate and affordable rental housing on reserve and improving the capacity of Aboriginal peoples in managing and maintaining their housing.
In 2012, CMHC provided much needed new housing on reserve by committing funding for 603 new units under the On-Reserve Non-profit Rental Housing Program, exceeding our plan of 548. Savings as a result of lower than anticipated interest rates allowed CMHC to commit funding for more units than planned. There are now some 29,300 units being subsidized under the program. CMHC also provided funding through its renovation programs to repair 1,168 homes on reserve.
A SNAPSHOT OF ABORIGINAL HOUSING CONDITIONS
Aboriginal Canadians, in particular those living on reserve, experience poorer housing conditions than the general Canadian population. Based on the 2006 Census, 53% of on-reserve Aboriginal households live below adequacy and suitability standards compared to 13% of Canadian households generally. Of the 53% of on-reserve households who live below standards, 33% would not have had the income to access acceptable housing while 19% would have the income to cover the expenses of an unsubsidized newly constructed home on their reserve.
60 C A N A D A M O R T G A G E A N D H O U S I N G C O R P O R A T I O N
Through various capacity development initiatives, CMHC helps First Nations to acquire the skills, training and resources needed to support their goal of becoming more self-sufficient in housing. In 2012, 88% of CMHC’s Aboriginal housing programs were delivered through First Nations or Aboriginal organizations.
During the year, CMHC held approximately 231 training sessions on housing quality and housing management for First Nations housing and financial managers, and building inspectors. The participant satisfaction rate was 99%. Topics included indoor air quality and the prevention and remediation of mold, a problem for many reserves. Over 13,500 copies of CMHC’s new series on Mold in First Nations Housing and case studies were distributed or downloaded. CMHC is also developing an electronic version of the community mold self-assessment tool.
 |
HOUSING INTERNSHIP INITIATIVE FOR FIRST NATIONS AND INUIT YOUTH
CMHC’s Housing Internship Initiative for First Nations and Inuit Youth (HIIFNIY), is an employment program that helps First Nations and Inuit youth between the ages 15 and 30 gain work experience and on-the-job training in preparation for permanent employment in the housing industry. After graduating from university, and obtaining training through HIIFNY, Helen Ward-Wakelin is now the first female Native Inspection Services Initiative (NISI) inspector in Atlantic Canada.
“There is an incredible network of housing professionals across this country who I’ve had the great pleasure to get to know and work with. To me, they are the unsung heroes of First Nations housing, and their strength has kept me in this job through anything,”
Helen Ward-Wakelin, NISI Inspector, North Shore Micmac District Council (NSMDC), New Brunswick. |

61
First Nations Market Housing Fund (FNMHF)
Under the Indian Act, it is difficult to use reserve lands as collateral to secure loans. Given this, the development of a private housing market often requires alternative forms of security in order for members to borrow to finance their homes. The First Nations Market Housing Fund was created in 2007 with a $300 million investment by the federal government. The Fund is a self-sustaining, independent not-for-profit trust which backstops private financing of housing on reserve. CMHC has been engaged for a period of five years by the Fund to provide operational services under the supervision of the Fund’s Trustees.
The results of an evaluation of the FNMHF carried out by CMHC in 2012 found the Fund’s design and strategy to be aligned with its mandate and objective to support market-based housing in First Nations by improving available housing finance options. The evaluation also showed that the Fund has had a positive impact on attitudes towards market-based housing in those First Nation communities which qualified for backstopping by the Fund. However, the demand for loans backstopped by the Fund was lower than the initial estimates which were developed based on the proportion of members who would have the income to cover the costs of homeownership. Other preconditions required for market housing have to be considered. These include members’ interests towards homeownership (although this is growing), the inability of members to qualify for a mortgage based on factors other than income, the availability of suitable sites for home construction, and limited Band loan guarantees to support market-based housing.
LOOKING AHEAD
CMHC will continue to implement measures to enhance the operational effectiveness of its on-reserve housing programs.
The Corporation will also continue to coordinate efforts with AANDC and Health Canada to help First Nations address mold problems.
CMHC will implement any changes, as approved by the Government of Canada, to the First Nations Market Housing Fund.
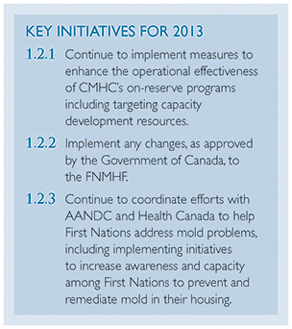
62 C A N A D A M O R T G A G E A N D H O U S I N G C O R P O R A T I O N
| OBJECTIVE 2 | FACILITATE ACCESS TO MORE AFFORDABLE, BETTER QUALITY HOUSING FOR ALL CANADIANS |
A sound and stable housing finance system is essential to an efficient housing market that provides Canadians with a range of housing choices while also creating jobs and economic growth for the country. CMHC mortgage loan insurance has helped shape the housing finance system in Canada by enabling lenders to provide financing to qualified borrowers at competitive interest rates for both homeowner and rental housing. The Corporation’s securitization guarantee programs also contribute to a strong and stable housing finance system by providing both large and small lenders and, in turn, borrowers with access to an adequate supply of funds for residential mortgages during good and adverse market conditions.
| STRATEGIC PRIORITY | 2.1 | ENSURE CANADIANS HAVE ACCESS TO MORTGAGE LOAN INSURANCE PRODUCTS AND TOOLS TO MEET THEIR NEEDS |
| RESOURCES | OPERATING EXPENSES1 $187 MILLION | STAFF-YEARS 937 |
| Performance Measures | 2011 | 2012 | 2013 | |||||||||||||
| Actual | Plan | Actual | Plan | |||||||||||||
Total insured volumes (units) | 630,957 | 550,335 | 386,222 | 355,597 | ||||||||||||
Total insured volumes ($M) | 105,953 | 94,501 | 66,029 | 61,183 | ||||||||||||
Per cent of the total of rental and high ratio homeowner units approved to address less-served markets and/or to support specific government priorities | 46.5 | 33.0 | 47.2 | 33.0 | ||||||||||||
Operating expense ratio (per cent) | 10.8 | 11.2 | 11.0 | 13.8 | ||||||||||||
PERFORMANCE ANALYSIS
In Canada, federally regulated lenders and most provincially regulated financial institutions are required by law to insure residential mortgages when borrowers have less than a 20% down payment. These mortgages are referred to as high ratio loans. Mortgage loan insurance is available from CMHC and from private mortgage loan insurers and is backed by the Government of Canada.
The requirement for mortgage loan insurance on high ratio loans protects lenders in the event of borrower default, allowing qualified borrowers to obtain mortgage financing at rates comparable to other
borrowers with higher down payments. This enables qualified borrowers to access a range of housing options and contributes to a strong and stable housing system.
CMHC’s portfolio insurance on low ratio mortgage loans with down payments of 20% or more is not mandatory but supports mortgage funding in Canada by providing lenders with securitization-ready assets.
CMHC operates its mortgage loan insurance business on a commercial basis. The premiums and fees collected and interest earned cover related claims and other expenses, as well as provide a reasonable return to the Government of Canada. Over the past
| 1 | Includes issuance costs from the Mortgage Loan Insurance Activity which are deferred and amortized for financial statement purposes. |

63
decade, CMHC’s insurance business has contributed more than $15 billion of the $17 billion contributed in total by CMHC towards improving the Government’s fiscal position.
Volumes
CMHC’s insured loan volumes are influenced by the economy, housing markets, competitive pressures and the regulatory environment. Total insured volumes for 2012 of 386,222 units were approximately 30% below planned volumes of 550,335 units. The variance was largely due to lower portfolio insurance volumes and to the reduced size of the high ratio homeowner mortgage loan insurance market as a result of changes to the rules governing insured mortgages.
Portfolio insured volumes were down approximately 71% compared to plan and 78% year-over-year as a result of CMHC reducing access to its portfolio insurance product. In 2012, a portfolio insurance allocation process was established which helped volumes return to levels experienced prior to the liquidity crisis. CMHC mortgage loan insurance will remain available for qualified home buyers or for the purchase, construction or refinance of multi-unit residential properties.
The Government of Canada mortgage loan insurance parameters first implemented in October 2008, and subsequently adjusted in 2010, 2011 and 2012 specifying the types of mortgages eligible for Government-backed insurance, have reduced the size of the high ratio homeowner mortgage loan insurance market. The latest adjustments to the parameters, which came into effect on July 9, 2012, included the following changes applicable to high ratio (1-4 units) mortgages:
| ¡ | a reduction in the maximum amortization period from 30 to 25 years; |
| ¡ | a reduction in the loan-to-value ratio limit for mortgage refinancing from 85% to 80%; |
| ¡ | fixing the maximum Total Debt Service ratio at 44% and the maximum Gross Debt Service ratio at 39%; and |
| ¡ | a limit to the purchase price of a home of less than $1 million. |
The specific impacts of the 2012 parameter changes are difficult to isolate from more general economic and housing market trends. Homeowner insured volumes were expected to be lower than originally forecasted at the beginning of the year. Compared to plan, high ratio Homeowner insured volumes are, in fact, approximately 7% below plan, and down 9.8% year-over-year.
In 2012, multi-unit residential insured units were 8.8% below plan mainly due to lower than expected Refinance volumes. Year-over-year, multi-unit residential insured units are down 18.5%, due primarily to smaller average project sizes and lower Refinance volumes.
Going forward, total homeowner mortgage loan insurance volumes are expected to decline further in 2013 before levelling off thereafter. Multi-unit residential volumes achieved in 2012 are expected to be maintained in 2013 before rebounding somewhat in subsequent years. The allocation of CMHC’s Portfolio insurance will continue at historical levels experienced prior to the liquidity crisis.
Serving gaps in the marketplace
CMHC contributes to the stability of Canada’s housing finance system, including housing markets, by providing qualified Canadians in all parts of the country with access to a range of housing finance options in both good and bad economic times. This sets CMHC apart from private sector competitors who have the ability to select the markets in which they operate. The 10% difference in the government guarantee between CMHC and private insurers compensates CMHC for this difference.
CMHC continues to be the only mortgage loan insurer for large multi-unit residential properties including nursing and retirement homes. Our exclusive support for these forms of housing is vital to the supply and maintenance of a range of housing options in Canada.
CMHC is also the primary insurer for housing in rural areas and smaller Canadian markets. Annually, we target 33% of our total multi-unit residential and high ratio homeowner insurance volumes to be in
64 C A N A D A M O R T G A G E A N D H O U S I N G C O R P O R A T I O N
areas or for housing options that are underserved or not served at all by the private sector. CMHC has consistently exceeded this target in previous years and did so again in 2012 with 47.2% of total multi-unit residential and high ratio homeowner business addressing gaps in the marketplace left by our private sector competitors.
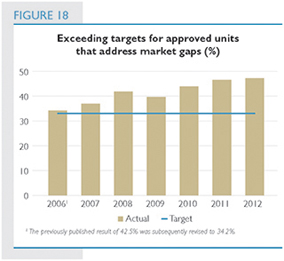
In 2012, the regional breakdown of our total multi-unit residential and high ratio homeowner business was as follows:
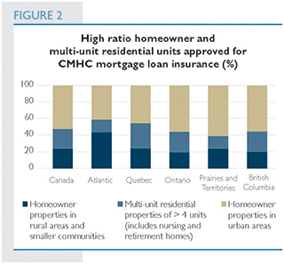
Managing within the total outstanding insured loans limit
Under Section 11 of the NHA, CMHC’s total outstanding insured loan amounts may not exceed $600 billion.
At the end of 2012, CMHC’s total insurance-in-force was $566.1 billion essentially unchanged over 2011, and 2% higher than plan.
| Insurance-in-force ($B) | 2011 | 2012 | 2013 | |||||||||||||
| Actual | Plan | Actual | Plan | |||||||||||||
Total Insurance-in-Force | 566.5 | 557 | 566.1 | 572.9 | ||||||||||||
High Ratio Homeowner | 285.5 | 291 | 290.3 | 302.4 | ||||||||||||
Low Ratio Portfolio | 242.8 | 230 | 229.5 | 233.7 | ||||||||||||
Multi-unit Residential | 38.2 | 36 | 46.3 | 36.8 | ||||||||||||
Approximately 41% of CMHC’s current insurance-in-force is comprised of low ratio loans (loans with original loan-to-value ratios of 80% or less), a slight decrease from 43% as at year-end 2011. Portfolio insurance provides lenders with the ability to purchase insurance on pools of previously uninsured low loan-to-value ratio mortgages. Once insured, these mortgages can be securitized, providing lenders with access to funding for mortgage assets which supports competition in the mortgage market for lenders of all sizes.
CMHC expects mortgage repayments to continue in the range of approximately $60 to $65 billion per year. These repayments offset future increases to CMHC’s insurance-in-force.
Ensuring overall portfolio quality
The profile of CMHC’s insurance-in-force demonstrates the nature and level of risk associated with the Corporation’s mortgage loan insurance business. CMHC carries out rigorous due diligence in assessing applications for mortgage loan insurance. All applications for insurance are initially reviewed and assessed by lenders prior to submission to CMHC. Upon receipt of an application for mortgage loan insurance, CMHC then assesses the risk presented by the borrower, the property, the market in which the
65
property is located, and the application as a whole. Key borrower risk factors include the level and source of down payment and stringent credit requirements demonstrating the borrower’s ability to manage financial obligations.
The following provides a profile of CMHC’s insurance-in-force as at December 31, 2012.
Average borrower equity in CMHC’s insured portfolio was 45%
As shown in the following table, based on updated property values, the majority of CMHC-insured mortgages currently have loan-to-value ratios of 80% or less. The average equity in CMHC’s insured high and low ratio homeowner loan portfolios has increased by 1 percentage point to 45% as at year-end 2012.
Distribution of homeowner insurance-in-force by loan-to-value (LTV) ratio based on updated property values1 (%) | ||||||||||||||||
| 2011 | 2012 | |||||||||||||||
| High and Low Ratio Homeowner | High and Low Ratio Homeowner | High Ratio Homeowner | Low Ratio Portfolio | |||||||||||||
£ 50% | 22 | 22 | 9 | 39 | ||||||||||||
> 50.01 £ 60% | 12 | 12 | 6 | 19 | ||||||||||||
> 60.01 £ 70% | 16 | 18 | 14 | 23 | ||||||||||||
> 70.01 £ 80% | 25 | 24 | 28 | 18 | ||||||||||||
> 80.01 £ 90% | 17 | 17 | 30 | 1 | ||||||||||||
> 90.01 £ 95% | 7 | 6 | 11 | 0 | ||||||||||||
> 95% | 1 | 1 | 2 | 0 | ||||||||||||
Average updated loan-to- value | 56 | 55 | 67 | 43 | ||||||||||||
Average updated equity | 44 | 45 | 33 | 57 | ||||||||||||
| 1 | LTV calculated on the basis of updated property values reflecting changes in local resale prices. |
Average amortization period at time of approval is 25 years
While homeowners could choose an amortization period of up to 30 years prior to July 9, 2012, the average amortization period at the time of mortgage approval for all CMHC insured-homeowner and multi-unit residential loans has remained stable at 25 years as at year-end 2012.
CMHC analysis shows that more than a third of CMHC-insured high ratio borrowers with fixed-rate mortgages are consistently ahead of their scheduled amortization by at least one mortgage payment per year. The proportion rises to about three quarters for those who are ahead of their payment schedule by any amount. Accelerated payments shorten the overall amortization period, reduce interest costs, increase equity in the home at a faster rate, and lower risk over time.
| Distribution of insurance-in-force by amortization (years) | ||||||||
| 2011 | 2012 | |||||||
High and Low Ratio | Multi-unit | |||||||
| Overall | Overall | Homeowner | Residential | |||||
| Average amortization period at origination | 25 | 25 | 25 | 25 | ||||
Overall average outstanding loan amount of $140,587
As at year-end 2012, the average outstanding loan amount for homeowners who took out high ratio loans above 80% loan-to-value at origination was $177,227. This is approximately 16% higher than the average outstanding loan amount remaining on portfolio low ratio insured loans. The figures in the following table include the regular amortization of loan balances as well as accelerated payments by borrowers.
66 C A N A D A M O R T G A G E A N D H O U S I N G C O R P O R A T I O N
| Distribution of insurance-in-force by loan amount (%) | ||||||||||||||||||||
| 2011 | 2012 | |||||||||||||||||||
| Overall | Overall | High ratio home- | Low ratio | Multi-unit residential | ||||||||||||||||
Over | 5 | 5 | 4 | 7 | 0 | |||||||||||||||
Over | 8 | 8 | 9 | 8 | 0 | |||||||||||||||
Over | 26 | 27 | 32 | 25 | 1 | |||||||||||||||
Over | 45 | 44 | 46 | 46 | 21 | |||||||||||||||
Over | 9 | 9 | 6 | 9 | 35 | |||||||||||||||
Under | 7 | 7 | 3 | 5 | 43 | |||||||||||||||
Average outstanding loan amount ($) | 141,290 | 140,587 | 177,227 | 153,210 | 51,870 | |||||||||||||||
Managing risk through geographic diversification
Consistent with its mandate, CMHC provides mortgage loan insurance in all Canadian markets. This spreads the Corporation’s insurance-in-force nationwide across all provinces and territories, diversifying risk in different regions, each with a distinct economic outlook.
Managing risks through prudent underwriting
CMHC carries out rigorous due diligence in assessing applications for mortgage loan insurance. As indicated, all applications for mortgage loan insurance are reviewed and assessed by lenders prior to submission to CMHC, then assessed again by CMHC subsequent to receipt. CMHC’s assessment is done through its proprietary online automated mortgage insurance risk assessment and approval system, emili, used by CMHC underwriters across the country. emili assesses an application’s overall risk by looking at borrower risk, the property risk, the market in which the property is situated and the characteristics of the loan. The results of these risk assessments are synthesized to determine the overall risk of default. emili includes the most comprehensive database in Canada, having assessed millions of applications for mortgage loan insurance since its inception in 1996. The emili database and statistical models are continually updated and independently reviewed by a third party.
If an application for a high ratio loan, as submitted by the lender, does not meet the pre-determined risk parameters of emili, it is referred to a CMHC residential underwriter located in offices across the country for more detailed review, adjudication and possible risk mitigation as appropriate with the lender.
| Distribution of insurance-in-force by province/territory (%) | ||||||||||||||||||||
| 2011 | 2012 | |||||||||||||||||||
| Overall | Overall | High Ratio Homeowner | Low Ratio Portfolio | Multi-unit Residential | ||||||||||||||||
Ontario | 41.9 | 40.8 | 37.1 | 46.2 | 37.0 | |||||||||||||||
British Columbia | 16.0 | 15.8 | 12.5 | 20.4 | 13.1 | |||||||||||||||
Alberta | 15.6 | 15.6 | 17.1 | 14.6 | 11.5 | |||||||||||||||
Quebec | 16.5 | 17.3 | 20.2 | 11.5 | 27.6 | |||||||||||||||
Nova Scotia | 2.3 | 2.4 | 2.7 | 1.7 | 3.9 | |||||||||||||||
Saskatchewan | 2.2 | 2.3 | 2.8 | 1.9 | 1.6 | |||||||||||||||
Manitoba | 2.4 | 2.5 | 3.1 | 1.7 | 2.9 | |||||||||||||||
New Brunswick | 1.5 | 1.5 | 2.2 | 0.8 | 1.0 | |||||||||||||||
Newfoundland | 1.1 | 1.2 | 1.5 | 0.9 | 0.4 | |||||||||||||||
Prince Edward Island | 0.2 | 0.3 | 0.3 | 0.2 | 0.3 | |||||||||||||||
Territories | 0.3 | 0.3 | 0.5 | 0.1 | 0.7 | |||||||||||||||
67
CMHC has been able to maintain its position in the market and manage its risks while applying prudent underwriting practices. This is demonstrated by an average borrower credit score of 726 for CMHC high ratio homeowner insurance-in-force at year-end 2012. Canadian credit scores generally range from 300 to 900. The higher the borrower credit score, the lower the risk of borrower default. In order to qualify for a CMHC-insured mortgage loan, the borrower or co-borrower must have a minimum credit score of 600, consistent with the government guarantee parameters introduced in 2008.
| Distribution of insurance-in-force by credit score at origination | ||||||||||||||||
| (%) | ||||||||||||||||
2011 | 2012 | |||||||||||||||
High Ratio | Low Ratio Portfolio | High Ratio Homeowner | Low Ratio Portfolio | |||||||||||||
| No score | 1 | 1 | 1 | 1 | ||||||||||||
| = 0 < 600 | 1 | 1 | 1 | 1 | ||||||||||||
| >600 < 660 | 9 | 5 | 9 | 4 | ||||||||||||
| > 660 < 700 | 16 | 10 | 15 | 9 | ||||||||||||
| > 700 | 73 | 83 | 74 | 85 | ||||||||||||
Average credit score at origination | 724 | 752 | 726 | 755 | ||||||||||||
| Distribution of approved loans by credit score at origination | ||||||||||||||||
| (%) | ||||||||||||||||
2011 | 2012 | |||||||||||||||
High Ratio | Low Ratio Portfolio | High Ratio Homeowner | Low Ratio Portfolio | |||||||||||||
| No score | 0 | 0 | 0 | 0 | ||||||||||||
| = 0 < 600 | 0 | 1 | 0 | 1 | ||||||||||||
| > 600 < 660 | 8 | 3 | 7 | 3 | ||||||||||||
| > 660 < 700 | 16 | 8 | 14 | 7 | ||||||||||||
| > 700 | 76 | 88 | 79 | 89 | ||||||||||||
Average credit score at origination | 734 | 757 | 738 | 762 | ||||||||||||
The overall arrears rate for CMHC-insured loans is also indicative of the overall strength of CMHC’s loan portfolio. CMHC calculates its arrears rate on the basis of all loans that are more than 90 days past due over the number of outstanding loans. The ratio includes all loans in arrears whether or not legal action has been initiated by the lender and whether or not work-outs have been approved by CMHC. CMHC’s method of calculating the arrears rate is the same used by the Canadian Bankers Association.
CMHC’s arrears rate at the end of 2012 was 0.35%, an improvement over 0.41% at year-end 2011.
The trend in CMHC’s arrears rate in recent years is generally consistent with the number of CMHC claims paid which has been trending down after the increase experienced in 2010 as a result of the recession and ensuing slow recovery.
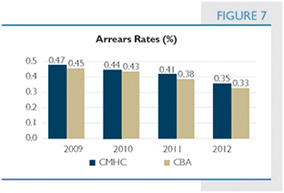
68 C A N A D A M O R T G A G E A N D H O U S I N G C O R P O R A T I O N
FINANCIAL ANALYSIS
Revenues from the Mortgage Loan Insurance Activity are comprised of insurance premiums, application fees for insuring loans for multi-unit residential properties and income earned on its investment portfolio. Premiums and fees are received at the inception of the mortgage loan insurance policy and are recognized as revenue over the period covered by the policy using actuarially determined factors that reflect the long-term pattern for default risk. These factors are reviewed annually by CMHC’s appointed external actuary.
As CMHC is mandated to operate its mortgage loan insurance business on a commercial basis, the premiums and fees it collects and the interest it earns must cover related claims and other expenses and also provide a reasonable return to the Government of Canada. CMHC’s Mortgage Loan Insurance Activity is operated at no cost to Canadian taxpayers.
Revenues
Total Revenues for the year ended 31 December 2012 were $2,577 million, $33 million higher than plan and $7 million higher than 2011.
| ¡ | Compared to Plan |
The variance to plan was mainly due to higher than expected Net Unrealized Gains from Financial Instruments that were partially offset by lower than anticipated Net Realized Gains on Financial Instruments.
Net Unrealized Gains from Financial Instruments were $66 million higher than plan as a result of the consolidation of a foreign equity mutual fund in late 2011. The consolidation resulted in a reclassification of Unrealized Gains from Other Comprehensive Income to Net Income in order to be consistent with the accounting policy of the underlying consolidated securities.
| ($M) | 2011 | 2012 | Variance | 2013 Plan | ||||||||||||||||
| Actual | Plan | Actual | to Plan | |||||||||||||||||
Premiums and Fees Earned | 1,791 | 1,796 | 1,807 | 11 | 1,742 | |||||||||||||||
Investment Income | 602 | 615 | 605 | (10) | 587 | |||||||||||||||
Net Unrealized Gains (Losses) from Financial Instruments | (81) | - | 66 | 66 | 20 | |||||||||||||||
Net Realized Gains (Losses) from Financial Instruments | 251 | 133 | 92 | (41) | 207 | |||||||||||||||
Other Income | 7 | - | 7 | 7 | - | |||||||||||||||
Total Revenues | 2,570 | 2,544 | 2,577 | 33 | 2,556 | |||||||||||||||
Interest Expense | 3 | - | 5 | 5 | 7 | |||||||||||||||
Operating Expenses | 193 | 201 | 199 | (2) | 241 | |||||||||||||||
Net Claims Expenses comprised of: | ||||||||||||||||||||
Losses on Claims | 617 | 658 | 532 | (126) | 641 | |||||||||||||||
Change in Provision for Claims | (55) | (33) | (45) | (12) | (80) | |||||||||||||||
Total Expenses | 758 | 826 | 691 | (135) | 809 | |||||||||||||||
Income before Income Taxes | 1,812 | 1,718 | 1,886 | 168 | 1,747 | |||||||||||||||
Income Taxes | 476 | 387 | 472 | 85 | 425 | |||||||||||||||
Net Income | 1,336 | 1,331 | 1,414 | 83 | 1,322 | |||||||||||||||
69
Net Realized Gains from Financial Instruments were $92 million, $41 million below plan. The decline in realized gains was caused by the classification of several equity securities as “impaired”. An equity security is identified as impaired if it is determined that significant or prolonged losses have been experienced and CMHC is not expected to recover its cost. Once an equity security has been identified as impaired, the change or decrease of its fair value compared to its book value is recorded as a realized loss.
| ¡ | Compared to 2011 |
Total revenues were stable year-over-year as higher Net Unrealized Gains were offset by lower Net Realized Gains from Financial Instruments.
Net Unrealized Gains from Financial Instruments were $147 million higher in 2012 due to improved overall equity performance compared to 2011.
Net Realized Gains from Financial Instruments were $159 million lower in 2012 than in 2011. As stated above, the decline in realized gains was caused by the classification of several equity securities as “impaired”. In addition, while overall equity performance was relatively better in 2012 compared to 2011, losses were realized on the sale of equity securities in the first half of 2012. Realized gains were also lower in 2012 as a result of bond yields which did not decline as sharply as they did in 2011, resulting in more stable bond prices.
Expenses
Total Expenses for the year ended 31 December 2012 were $691 million, $135 million lower than plan and $67 million lower than last year.
| ¡ | Compared to Plan |
The variance to plan was mainly due to lower Net Claims Expenses of $138 million.
Net Claims Expense consists of two components:
| ¡ | Losses on Claims; and |
| ¡ | Change in Provision for Claims. |
Losses on Claims cover losses on actual claims that have been reported by lenders and paid by CMHC. Losses on Claims were $532 million in 2012, $126 million lower than plan. The lower losses are the result of declining claim volumes (4% lower than expected) due to improving economic conditions and higher than planned Net Estimated Borrower Recoveries. Lower average claims paid as a result of rebounding house prices in key markets, and higher than expected levels of recoveries in 2012 also contributed to lower Losses on Claims and reduced CMHC’s claims severity for the year (see Severity Ratio under Other Financial Measures).
The Provision for Claims is an estimate of possible future losses on mortgages in arrears. The estimate is the result of actuarial forecasts based on a number of economic assumptions. It is an estimate because many of these mortgages will benefit from CMHC-supported default management activities that enable borrowers to work through their financial difficulties and remain in their homes. The decline in the Provision for Claims experienced in 2012 exceeded plan by $12 million, thus reducing the Net Claims Expense. This Change in Provision for Claims was consistent with declining claims volumes and favourable economic conditions.
| ¡ | Compared to 2011 |
Net Claims Expense was $75 million lower in 2012 compared to 2011. The decline was mainly due to lower Losses on Claims resulting from the declining claim volumes, as explained above.
Net Income
| ¡ | Compared to Plan |
Net Income of $1,414 million for the year ended 31 December 2012 exceeded plan by $83 million. The variances identified above contributed to this increase, but were partially offset by $85 million higher than planned Income Taxes due to higher income before taxes, as well as an effective tax rate of 25% in 2012 which was 2.5 percentage points higher than plan.
70 C A N A D A M O R T G A G E A N D H O U S I N G C O R P O R A T I O N
| ¡ | Compared to 2011 |
Mortgage Loan Insurance Net Income increased by $78 million in 2012 compared to 2011 as a result of lower total expenses, as described above, and lower Income Taxes.
The income tax expense was $4 million lower in 2012, primarily due to a decrease in the effective corporate tax rate from 26.5% in 2011 to 25.0% in 2012.
Other Financial Measures
2011 Actual |
2012 | Variance to Plan | 2013 Plan | |||||||||||||||||
| Plan | Actual | |||||||||||||||||||
| Premiums and Fees Received (total $M) | 1,653 | 1,671 | 1,475 | (196) | 1,294 | |||||||||||||||
Homeowner | 86% | 87% | 86% | (1 pts) | 85% | |||||||||||||||
Multi-unit residential | 14% | 13% | 14% | 1pts | 15% | |||||||||||||||
| Operating Expense Ratio | 10.8% | 11.2% | 11.0% | (0.2 pts) | 13.8% | |||||||||||||||
| Severity Ratio | 32.4% | 33% | 31.3% | (1.7 pts) | 32% | |||||||||||||||
Premiums and Fees received in 2012 were $1,475 million, $196 million lower than plan and $178 million lower than in 2011. This was the result of lower Portfolio volumes and an overall reduction in the size of the high ratio homeowner mortgage loan insurance market.
The Severity Ratio is the ratio of the Losses on Claims compared to the original insured loan amount for the claims paid in the period. In 2012, the reduction in claim costs led to a decline in CMHC’s Severity Ratio. Claims costs declined as a result of rebounding house prices in key markets and higher than expected levels of recoveries in 2012.
Capital Management
2011 Actual | 2012 | Variance to Plan | 2013 Plan | |||||||||||||||||
($M) unless otherwise indicated | Plan | Actual | ||||||||||||||||||
Mortgage Loan Insurance Retained Earnings | 10,299 | 11,921 | 11,658 | (263) | 12,978 | |||||||||||||||
Mortgage Loan Insurance Appropriated Capital: | ||||||||||||||||||||
Appropriated Retained Earnings | 9,028 | 9,154 | 9,983 | 829 | 10,666 | |||||||||||||||
Accumulated Other Comprehensive Income | 884 | 491 | 1,047 | 556 | 717 | |||||||||||||||
Total Appropriated Capital | 9,912 | 9,645 | 11,030 | 1,385 | 11,383 | |||||||||||||||
Unappropriated Retained Earnings | 1,271 | 2,767 | 1,675 | (1,092) | 2,312 | |||||||||||||||
Total Equity | 11,183 | 12,412 | 12,705 | 293 | 13,695 | |||||||||||||||
Capital Available to Minimum Capital Required (100% MCT) | 226% | 257% | 231% | (26 pts) | 244% | |||||||||||||||
CMHC’s Internal Capital Target (% MCT) | 150% | 150% | 175% | 25 pts | 175% | |||||||||||||||
CMHC’s Capital Holding Target (% MCT) | 200% | 200% | 200% | - | 200% | |||||||||||||||
CMHC manages its mortgage loan insurance business in a financially prudent manner. Under its Capital Management Framework, the Corporation follows regulations as set out by OSFI to protect the Canadian taxpayer from potential future costs arising from mortgage insurance. CMHC follows OSFI guidelines in setting capital levels and targets holding twice the minimum capital required by OSFI.
The percentage MCT is the ratio of capital available to capital required. Capital required is calculated by applying OSFI risk factors to the Mortgage Loan Insurance Activity’s assets and liabilities.
71
In the first quarter of 2012, CMHC’s Board of Directors reviewed CMHC’s capital targets and determined that while the capital holding target of 200% MCT remained a prudent and appropriate level for the insurance business, the internal capital target would be increased from 150% MCT to 175% MCT.
Total Mortgage Loan Insurance Available Capital, consisting of Total Equity adjusted for Deferred Acquisition Costs and Positive Deferred Tax Assets, resulted in a 231% MCT at year-end, well over twice the minimum capital required by OSFI.
Effective 1 January 2012, new elements were introduced by OSFI to the capital management guidelines related to mortgage loan insurance companies. These elements included refining the asset risk factors applied to balance sheet assets and adding a new capital factor for interest rate risk related to interest rate-sensitive assets and liabilities. The new elements are estimated to have otherwise reduced the 31 December 2011 MCT level of 226% MCT to 211 % MCT as at 1 January 2012. The difference in timing between CMHC’s 2012 corporate planning process and the issuance of OSFI’s final guidance on the application of the risk factors resulted in the majority of the variance between CMHC’s planned 257% MCT for 2012 and the actual 231% MCT at year end.
Effective 1 January 2013, OSFI has implemented further changes to capital factors for interest rate risk in its capital management guidelines related to mortgage loan insurance companies. The change in the capital factor for interest rate sensitive assets and liabilities is estimated to have the effect of reducing the 31 December 2012 MCT level of 231% to 220% as at 1 January 2013. These most recent changes to the capital factors for interest rate risk were taken into account in setting CMHC’s 2013 planned MCT level of 244%.
CMHC’s Mortgage Loan Insurance Activity is fully capitalized with Appropriated Retained Earnings of $9,983 million and AOCI of $1,047 million.
Appropriated Retained Earnings were $829 million higher than plan mainly due to the application of capital factors identified above, as well as the capital addition for Deferred Acquisition Costs ($115 million) and the Deferred Tax Asset ($167 million). Partially offsetting these increases was the higher than planned AOCI which reduced the amount of capital required to be appropriated.
Unappropriated Retained Earnings were $1,092 million lower than plan due to the higher capital appropriations and higher than planned Net Actuarial Losses on Post-employment Benefits that are accumulated in Retained Earnings.
LOOKING AHEAD
In 2013, CMHC will continue to contribute to the stability of the housing finance system by providing mortgage loan insurance across the country, including in those markets that are less served by the private sector. We will continue to strengthen our relationships with lenders to help them improve their quality assurance frameworks, and support the Government of Canada through the provision of information and analysis to ensure the continued stability of Canada’s housing finance system.
72 C A N A D A M O R T G A G E A N D H O U S I N G C O R P O R A T I O N
| STRATEGIC PRIORITY | 2.2 | ENSURE AN ADEQUATE SUPPLY OF LOW-COST FUNDS FOR MORTGAGE LENDING THROUGH MORTGAGE SECURITIZATION |
| RESOURCES | OPERATING EXPENSES1 $14 MILLION | STAFF-YEARS 70 |
| Performance Measures | 2011 | 2012 | 2013 | |||||||||||||
| Actual | Plan | Actual | Plan | |||||||||||||
Annual securities guaranteed ($M) | 116,725 | 64,000 | 119,531 | 90,000 | ||||||||||||
¡ Market NHA MBS | 75,475 | 24,000 | 79,631 | 55,000 | ||||||||||||
¡ CMB | 41,250 | 40,000 | 39,900 | 35,000 | ||||||||||||
Operating expense ratio (excl. IMPP) (per cent) | 4.4 | <9 | 4.5 | <9 | ||||||||||||
Per cent of outstanding residential mortgages securitized* | 27 | 21 | 28.5 | 21 | ||||||||||||
| * | As at October 2012 |
PERFORMANCE ANALYSIS
CMHC’s securitization programs contribute to a strong and stable Canadian housing finance system by helping ensure lenders and, in turn, borrowers have access to an adequate supply of funding for residential mortgages throughout changing economic cycles and market conditions.
CMHC’s securitization programs guarantee the timely payment of interest and principal of National Housing Act Mortgage-Backed Securities (NHA MBS) issued by financial institutions and of Canada Mortgage Bonds (CMB) issued by the Canada Housing Trust (CHT). These activities are commercial in nature and do not receive Parliamentary appropriations.
Under the NHA MBS program, Approved Issuers pool insured residential mortgages into marketable NHA MBS which provide investors with the opportunity to hold high quality, secure investments in Canadian residential mortgages. This enhances the efficiency and increases competition in the mortgage market. Through the CMB program, Canada Housing Trust (CHT) sells CMB to domestic and international investors with the proceeds used to purchase NHA MBS, which further enhances the supply of mortgage funds for Canadians.
For the year ended 31 December 2012, a total of $119.5 billion securities were guaranteed by CMHC. This exceeds the 2012 plan of $64 billion by $55.5 billion.
Under the NHA MBS program, Approved Issuers issued and CMHC guaranteed $79.6 billion against a plan of $24 billion in market NHA MBS. In addition to NHA MBS market transactions sold to investors, Issuers are increasingly using market NHA MBS for liquidity, collateral and balance sheet purposes.
Through the CMB program, $39.9 billion against a plan of $40 billion in bonds were issued and guaranteed. As CMBs are issued in the global marketplace, the CMB program is not immune to market volatility. Prudence is required to “right-size” CMB issuances, balancing funding demand with investor expectations and preserving the cost-effectiveness of the program.
With the $119.5 billion in securities guaranteed in 2012, CMHC’s total outstanding guarantees-in-force is $382 billion as at 31 December 2012 compared to $362 billion for the same period last year. CMHC’s total outstanding guarantees limit is $600 billion.
In 2012, the percentage of outstanding residential mortgages securitized through CMHC’s securitization programs was 28.5% of the outstanding residential mortgage credit.
| 1 | Includes issuance costs from the Securitization Activity which are deferred and amortized for financial statement purposes. |

73
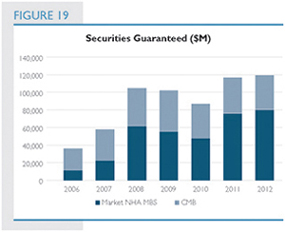
The reliability and cost-effectiveness of CMHC’s securitization programs were clearly demonstrated during the global financial crisis. This is reflected in the volume of insured residential mortgages securitized and the relative spread differential between the cost of these funds and the major wholesale funding source of large financial institutions compared to the Government of Canada five-year yield (Figure 20).
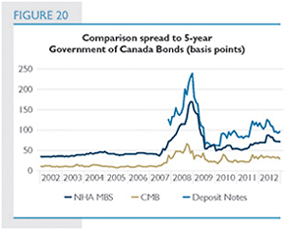
Support for smaller lenders and competition in the mortgage market
Smaller lenders are important in maintaining a competitive Canadian mortgage market as they compete with the established larger lenders on the
basis of costs, products and terms. During the global financial crisis, smaller lenders found it more difficult to access liquidity and funding as their traditional sources were frozen. CMHC’s securitization programs in general and the CMB program in particular played an important role in supporting smaller lenders during these challenging times.
The CMB funding allocation methodology was revised in 2008 to help foster competition in the mortgage market by ensuring that smaller lenders have access to CMB funding. Under this methodology, all approved CMB Sellers are entitled to receive an equal share of available CMB funding. Currently, there are 63 approved CMB Sellers and 76 Approved NHA MBS Issuers under CMHC’s securitization programs.
Prior to the global financial crisis, smaller lenders accounted for approximately 14% of insured residential mortgages securitized though CMHC’s securitization programs. With the increase in the number of smaller lenders who sought access to CMHC’s programs, the participation rate increased from 14% to approximately 23% as at December 2012. Under the CMB program, the increase in the participation of smaller lenders is even more pronounced, moving from 19% in 2006 to 47% as at December 2012.
The reliability of CMHC’s securitization programs ensure that smaller lenders continue to play an important role in maintaining the competitiveness of the Canadian residential mortgage market.
Managing the mortgage needs of Canadians
The Government of Canada through CMHC has responded to the wider range of mortgage choices sought by Canadians through the introduction of NHA MBS pool types that allowed lenders to offer and securitize new mortgage products. Expanding CMB terms and offerings (e.g., three-year re-openings, 10-year fixed rate, and Floating Rate Notes) ensured the availability of funding that enables mortgage lenders to address the current and emerging mortgage choices of Canadians.
74 C A N A D A M O R T G A G E A N D H O U S I N G C O R P O R A T I O N
Prudent risk management
Risk exposures under the timely payment guarantee are managed through robust risk mitigating practices including stringent approval criteria for program participants. To date, CMHC’s securitization programs have not experienced any losses. Moreover, the commercial nature of CMHC’s securitization programs contributes to CMHC’s Net Income and, as such, helps to improve the Government’s fiscal position. Over the past decade, $2 billion of CMHC’s total contribution of $17 billion is attributable to securitization programs. (Also see section on Risk Management of the MD&A)
FINANCIAL ANALYSIS
Net Income – Securitization
| ($M) | 2012 | |||||||||||||||||||
2011 Actual | Plan | Actual | Variance to Plan | 2013 Plan | ||||||||||||||||
Interest Income from NHA MBS – Loans and Receivables | 1,747 | 1,685 | 1,682 | (3) | 1,474 | |||||||||||||||
Fees | 211 | 169 | 242 | 73 | 244 | |||||||||||||||
Income from Investment Securities | 41 | 46 | 33 | (13) | 33 | |||||||||||||||
Net Unrealized Gains (Losses) from Financial Instruments | (4) | - | 5 | 5 | 4 | |||||||||||||||
Net Realized Gains (Losses) from Financial Instruments | 31 | (1) | 84 | 85 | 2 | |||||||||||||||
Other Income | 18 | 10 | 15 | 5 | 8 | |||||||||||||||
Total Revenue | 2,044 | 1,909 | 2,061 | 152 | 1,765 | |||||||||||||||
Interest Expense | 1,747 | 1,685 | 1,682 | (3) | 1,474 | |||||||||||||||
Operating Expenses | 10 | 12 | 11 | (1) | 15 | |||||||||||||||
Total Expenses | 1,757 | 1,697 | 1,693 | (4) | 1,489 | |||||||||||||||
Income before Income Taxes | 287 | 212 | 368 | 156 | 276 | |||||||||||||||
Income Taxes | 76 | 53 | 95 | 42 | 69 | |||||||||||||||
Net Income | 211 | 159 | 273 | 114 | 207 | |||||||||||||||
While consistent with the 2012 plan, Securitization interest income and interest expense were both $65 million lower than last year largely due to the maturity of Insured Mortgage Purchase Program (IMPP) assets and liabilities.
Securitization Net Income of $273 million was $114 million above plan and $62 million higher than 2011 mainly due to higher Net Realized Gains from Financial Instruments as a result of the sale of investments due to the implementation of a new Securitization asset allocation policy. Further contributing to the variance to plan were $73 million in higher fees earned as result of greater MBS issuances over the last few years.
Capital Management
| ($M) | 2012 | |||||||||||||||||||
(unless otherwise indicated) | 2011 Actual | Plan | Actual | Variance to Plan | 2013 Plan | |||||||||||||||
Securitization Appropriated Capital: | ||||||||||||||||||||
Appropriated Retained Earnings | 699 | 730 | 781 | 51 | 815 | |||||||||||||||
Accumulated Other Comprehensive Income | 57 | 15 | 8 | (7) | 16 | |||||||||||||||
Total Appropriated Capital | 756 | 745 | 789 | 44 | 831 | |||||||||||||||
Unappropriated Retained Earnings | 252 | 367 | 439 | 72 | 619 | |||||||||||||||
Securitization Retained Earnings | 951 | 1,097 | 1,220 | 123 | 1,434 | |||||||||||||||
Total Equity | 1,008 | 1,112 | 1,228 | 116 | 1,450 | |||||||||||||||
% of Equity against Target Capital | 133% | 149% | 156% | 7 pts | 174% | |||||||||||||||
CMHC’s Securitization capitalization methodology is based on regulatory and economic capital principles. Total Securitization Retained Earnings at 31 December 2012 were $1,220 million of which $781 million was appropriated for capitalization. Target Capital increased from $756 million in 2011 to $789 million in 2012
75
and was $44 million greater than plan. This increase resulted from the new capital factor for interest rate risk introduced by OSFI effective 1 January 2012. As at 31 December 2012, the Securitization Activity had Appropriated Retained Earnings and AOCI representing 100% of its Target Capital. Securitization Capital Available represented 156% of its target capital.
Net Income – Canada Housing Trust (CHT)
CHT’s functions are limited to the acquisition of interests in eligible housing loans such as NHA MBS and the issuance of CMB. The CMB are guaranteed by CMHC under its Securitization Activity.
CHT revenue is earned primarily from investment income. Although CHT’s assets represent 70% of CMHC’s total assets, they contribute no Net Income to the Corporation as the revenue derived from this investment income is used to cover all operating expenditures and CMB interest expense. The beneficiaries of the Trust, after payment of all obligations, are one or more charitable organizations.
| ($M) | 2011 Actual | 2012 | Variance to Plan | 2013 Plan | ||||||||||||||||
| Plan | Actual | |||||||||||||||||||
Interest Income from NHA MBS – Loans and Receivables | 6,527 | 7,053 | 5,999 | (1,054) | 5,385 | |||||||||||||||
Other Income | 175 | 168 | 168 | - | 152 | |||||||||||||||
Total Revenues | 6,702 | 7,221 | 6,167 | (1,054) | 5,537 | |||||||||||||||
Interest Expense | 6,518 | 7,046 | 5,990 | (1,056) | 5,377 | |||||||||||||||
Operating Expenses | 184 | 175 | 177 | 2 | 160 | |||||||||||||||
Total Expenses | 6,702 | 7,221 | 6,167 | (1,054) | 5,537 | |||||||||||||||
Net Income | - | - | - | - | - | |||||||||||||||
Interest Income and Interest Expense from CHT’s NHA MBS and CMB were $1,054 million and $1,056 million below plan, respectively. These variances, which largely offset each other, were due to lower than planned interest rates on CMB issuances.
The foregoing lower interest rates were also the main contributing factors for the $528 million decrease in interest income and expenses between 2011 and 2012.
LOOKING AHEAD
CMHC will continue to provide guarantees for NHA MBS and CMBs which form part of lenders diversified funding sources and enhance the market for NHA MBS by making them more investor friendly through increased transparency, disclosure and standard valuation tools.
Changes to the regulatory environment impacting lenders as a result of IFRS, the phasing in of Basel III standards on capital and liquidity beginning in 2013 and the reform of regulations regarding derivatives require examination. The Corporation will analyze emerging regulatory issues and propose program modifications, as appropriate.
Ongoing oversight will also be conducted by OSFI pursuant to amendments to the NHA.
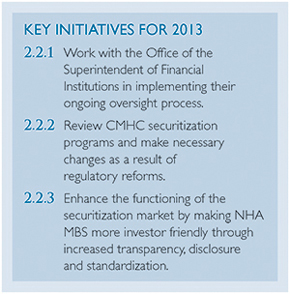
76 C A N A D A M O R T G A G E A N D H O U S I N G C O R P O R A T I O N
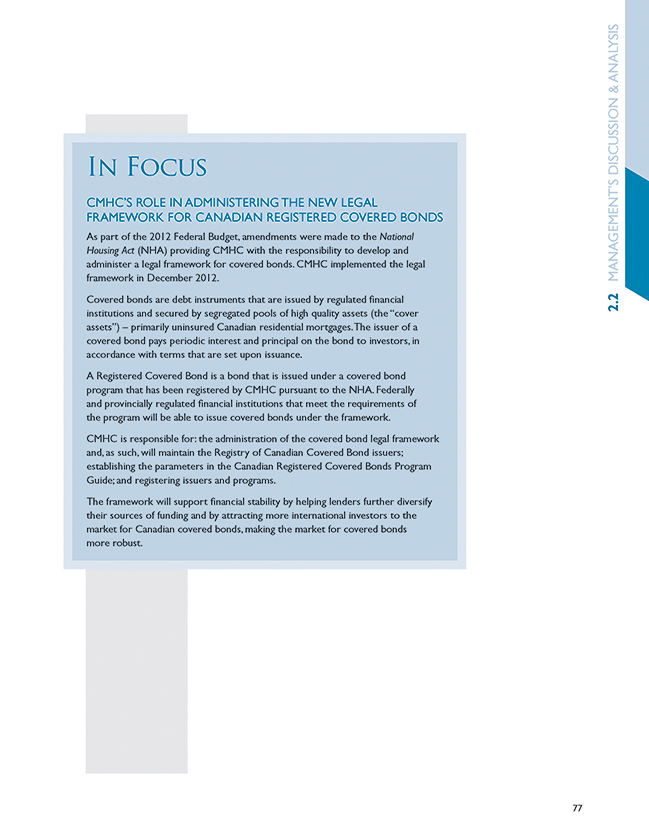
| STRATEGIC PRIORITY | 2.3 | PROVIDE COMPREHENSIVE, TIMELY AND RELEVANT MARKET ANALYSIS INFORMATION | ||
| RESOURCES | OPERATING EXPENSES $32 MILLION | STAFF-YEARS 253 |
| Performance Measures | 2011 |
2012 | 2013 | |||||
| Actual | Plan | Actual | Plan | |||||
Per cent of subscribers to market analysis publications who found them useful | 93 | 93 | 94 | 93 | ||||
Per cent of attendees at Housing Outlook Conferences who found them useful | 99.1 | 95 | 99.6 | 95 | ||||
Forecast accuracy of housing starts (per cent) | -9.9 |
Within 10% of actual | -13.1 |
Within 10% | ||||
Ranking of housing starts forecast accuracy among forecasters | 10th among 15 |
Rank within top quartile | 1st among 17 | Rank within top quartile | ||||
PERFORMANCE ANALYSIS
CMHC provides reliable, impartial and up-to-date housing market analysis and information to enable the housing industry to make better informed decisions. Tracking housing market activity, house prices and other indicators provides insights on issues and challenges affecting Canadian households and the economy in general. Canadians looking to buy, sell or rent housing can also find information on housing markets to help make decisions.
A wide range of market analysis publications (see text box) can be downloaded from CMHC’s website or subscribed to. Presentations held across the country each year also provide an opportunity for the housing industry and others to obtain the latest forecast information.
In 2012, there were over 40,000 e-subscribers to market analysis publications representing an increase of 9% over 2011. The vast majority of these subscribers consistently find these publications useful. Market analysis presentations reached a total audience of 31,500 housing industry members, including 5,000 who attended 19 Housing Outlook Conferences.
KEY CMHC MARKET ANALYSIS PUBLICATIONS
Housing Market Outlook
National, provincial and local forecasts of housing starts, existing home sales, house prices and outlook for key economic indicators
Housing Now
Housing and mortgage-related articles and recent housing market data
Rental Market Reports
Statistical highlights and rental market information
Seniors’ Housing Report and Supplementary Tables
Description and analysis of the seniors’ housing market
For more information, visit
www.cmhc.ca/housingmarketinformation
78 C A N A D A M O R T G A G E A N D H O U S I N G C O R P O R A T I O N
Housing starts forecasts
CMHC strives to provide accurate forecasts. However, in 2012, the housing starts which were forecast to be 186,750 were not within 10% of the actual starts of 214,827, largely due to forecasts being too low in Ontario and the Prairies. Despite the global economic uncertainty, slower than expected recovery in the U.S. and a decrease in oil prices, Ontario’s and the Prairies’ housing markets remained resilient and housing starts in these regions were higher than expected. However, of the 17 forecasters that CMHC compares itself to, none were within 10% of actual with CMHC’s forecast closest to actual.
House price conditions
Recent increases in house prices, from just below $305,000 in 2008 to about $364,000 in 2012, have led to concerns over the potential for problematic housing conditions. CMHC has a long history of continuously monitoring housing conditions, including house prices. CMHC monitors a large number of indicators of housing market conditions, including supply and demand, accelerating trends in house prices, house price valuations and inventories of completed and unoccupied units. Overall demographic and economic factors, such as growth in employment and net migration, continue to support the Canadian housing market.
Canadian housing markets are also less exposed to some of the risks that shaped the U.S. experience. The sub-prime market, in particular, has never been a major factor in Canada and Canadian credit lending standards remain more rigorous than in the United States. Furthermore, the arrears rate in Canada remains historically low. Nevertheless, there are some centres that CMHC is more closely.
CMHC is examining the condominium market by conducting a Condominium Owner Survey in Toronto and Vancouver to better understand the motivations of condominium buyers and the prevalence of condominium investors in the market.


79
Household debt levels remain a concern
In recent years, there has been increased concern about the levels of Canadian household debt and the vulnerability of households to potential adverse economic shocks.
The following factors have contributed to the increase in household debt:
| ¡ | a low interest rate environment, which allowed Canadian households to increase their borrowing capacity; and |
| ¡ | rising household income and net worth, which have allowed Canadian household to borrow larger amounts. |
Household debt consists mainly of residential mortgages but also includes consumer debt, such as personal loans and lines of credit. In the fourth quarter of 2012, residential mortgages represented about 64% of total household debt.
Since households typically amortize the purchase of a home over several years, the debt-to-income ratio provides only one measure of the financial health of households. Another measure is the debt service ratio, which is defined as the annual total debt service costs as a percentage of annual personal disposable income. This measure considers a household’s ability to make payments towards its mortgage and consumer loans given movement in interest rates. Interest paid on mortgage debt as a share of monthly household disposable income in the fourth quarter of 2012 was 3.7%, well below the historical average of 4.8%
Most Canadian households have the capacity to deal with adverse economic conditions due to a variety of factors. These include the high quality of mortgage credit in Canada, the fact that many Canadian homeowners with a mortgage have substantial equity in their homes, and the ability of households to adapt their spending habits.
In 2012, CMHC continued to monitor indicators of Canadian household financial health to better understand the financial vulnerability of Canadian households.
LOOKING AHEAD1
As part of its ongoing activities, CMHC will monitor house prices and other factors that play a role in market stability. Enhancements to the analytical framework on house prices will help reinforce the assessment of local housing market conditions. CMHC will continue to study the condominium market.
It will further improve its online housing data portal to provide increased accessibility and functionality for retrieving housing market information, especially at detailed geographic levels.
In the coming year, CMHC will keep monitoring the financial health of Canadian households, with a focus on the more financially vulnerable segments of the population, by tracking a wide variety of indicators.
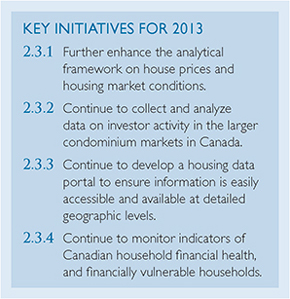
| 1 | CMHC’s market analysis activities will fall under strategic priority 3.2 in the upcoming 2013-2017 planning period. (See the 2013-2017 Summary of the Corporate Plan available on CMHC’s website). |
80 C A N A D A M O R T G A G E A N D H O U S I N G C O R P O R A T I O N
| OBJECTIVE 3 | ENSURE THE CANADIAN HOUSING SYSTEM REMAINS ONE OF THE BEST IN THE WORLD |
The objective encompasses CMHC’s research and information transfer activities which contribute to the efficiency and stability of housing markets and to increasing the supply of affordable, sound and suitable housing. Research also supports the development of housing-related public policy.
CMHC’s housing export program, discontinued in 2012, has helped open doors for hundreds of Canadian housing exporters in key markets abroad and has facilitated over $1 billion in export sales.
| STRATEGIC PRIORITY | 3.1 | UNDERTAKE COMPREHENSIVE, TIMELY AND RELEVANT RESEARCH AND INFORMATION TRANSFER ACTIVITIES TO ENABLE CANADIAN CONSUMERS AND THE HOUSING SECTOR TO MAKE INFORMED DECISIONS | ||
| RESOURCES | OPERATING EXPENSES $23 MILLION | STAFF-YEARS 129 |
| Performance Measures | 2011 | 2012 | 2013 | |||||
| Actual | Plan | Actual | Plan | |||||
Per cent of attendees at information transfer seminars who found them useful | 92 | 90 | 93 | 92 | ||||
Per cent of recipients of newly published Research Highlights who found them useful | 70 | 70 | 70 | 70 | ||||
Per cent of recipients of newly published About Your House fact sheets who found them useful | 86 | 80 | 88 | 80 | ||||
PERFORMANCE ANALYSIS
CMHC undertakes housing research and develops information products that are relied upon by the housing industry and consumers, and that inform the development of housing-related public policy.
Published regularly are Research Highlights and a range of supplementary information products targeted at industry and consumer audiences. Research Highlights are summaries of reports that have been commissioned by CMHC profiling research undertaken on best practices, technologies, cases studies, knowledge gaps, housing design and performance, as well as housing quality, affordability and suitability. Ten Research Highlights were added this year on topics related to housing conditions, condominiums, Northern housing and sustainability.
Other information products such as the EQuilibriumTM InSights and Profiles continue to be developed to inform architects, builders, and engineers about the lessons learned from this initiative. Energy Efficiency Building Envelope Retrofit and About Your House fact sheets were also published to inform homeowners of appropriate measures that can be implemented to improve the performance of their homes. In total, there were 17 new information products in these series published in 2012. The web-based Guidelines for Rainwater Harvesting Systems Handbook was also produced.
CMHC’s Research Highlights and the About Your House publications continue to be rated favourably by industry and consumers.
In 2012, nearly 2.2 million copies of housing information products (excluding market analysis products) were distributed or downloaded from CMHC’s website.

81
Gaining a better understanding of housing need
CMHC examines, on an ongoing basis, changes in the incidence and distribution of core housing need (see Glossary) in Canada based on the Census as well as annual trends in urban housing need based on Statistics Canada’s annual Survey of Labour and Income Dynamics (SLID). SLID also enables CMHC to examine the dynamics of core housing need or, in other words, the length of time individuals stayed in core housing need. An analysis of panel data from SLID for urban individuals for the three-year periods 2002 to 2004 and 2005 to 2007, revealed that between two-thirds and three-quarters of individuals in households in core housing need were in need only one or two years of the three-year period. (For more information, see strategic priority 1.1.)
Housing for seniors
Statistics Canada reports that persons over 65 represent one of the fastest growing segments of the population and are expected to account for about a quarter of the population by 2036. The 2011 Census counted nearly five million seniors aged 65 and over in Canada and, of these individuals, just over 92% lived in private households or dwellings. The desire to age-in-place is expected to continue as the baby boom generation ages.
In order for seniors to continue to live comfortably and safely in private dwellings, home adaptations are likely to become necessary as will the availability of both medical as well as non-medical supportive services. In 2012, CMHC continued to conduct research into this area, examining the needs of seniors and the ability of the market to fulfill those needs.
In 2012, a five-volume series called Housing for Older Canadians – The Definitive Guide to the Over-55 Market was published. The series addresses the housing needs
of Canadians aged 55 and older and is intended for those developing seniors housing, such as for-profit developers and organizations interested in sponsoring housing projects for seniors.
Also, annual trends in one-person senior urban households’ housing conditions from 2002 to 2009 based on data from the Survey of Labour and Income Dynamics were analyzed and published in the 2012 Canadian Housing Observer.
Housing in the North
Canada’s North faces numerous and unique housing challenges which impact the supply, durability and affordability of homes in this region. Housing in the North is more difficult and expensive to build given the remote location and the severity of the climate. It is also expensive to operate and maintain given extended supply chains and high fuel, electricity and water costs. Higher maintenance and operating costs makes it difficult for residents to afford housing without government subsidies. As a result, affordability is a major issue. Housing in the North should also take into account Aboriginal cultural and lifestyle considerations. These factors have contributed to a shortage of quality, affordable, sustainable and appropriate housing options in the North.
In 2012, the Northern Sustainable House initiative continued to demonstrate energy efficient, culturally appropriate housing in the North in collaboration with housing providers. Performance monitoring was initiated or underway in two Northern Sustainable Houses projects, one built in Dawson and the other in Inuvik. CMHC is also working with the Nunavut Housing Corporation to support the design and construction of another house in Arviat. With its completion expected in 2013, models for sustainable housing in the North will have been constructed in each territory.
82 C A N A D A M O R T G A G E A N D H O U S I N G C O R P O R A T I O N
Promoting sustainable housing
Building, renovating, operating and maintaining sustainable housing involves the use of technologies and practices that provide healthy indoor environments, reduce energy consumption, conserve resources, reduce environmental impact and address affordability. A challenge facing builders, renovators, developers and housing providers in delivering sustainable housing is integrating innovative features into their current practices in a way that is cost-efficient and does not result in unintended consequences. CMHC’s role is to support research and inform both industry and consumers of strategies they can adopt today to support the advancement of sustainable housing options more broadly in the housing sector.
Based on CMHC’s EQuilibriumTM Sustainable Housing Demonstration Initiative (see Glossary), significant progress has been made on demonstrating the design and construction of highly innovative housing projects across Canada. CMHC is sharing the knowledge gained and lessons learned from the EQuilibriumTM initiative, and related research, through the development, publication and dissemination of information products for both industry and consumers.
LOOKING AHEAD
Improving the understanding of housing need remains a key part of CMHC’s research mandate. In the coming year, CMHC will examine the existing rental housing stock occupied by moderate-income households and carry out research on supportive living environments for seniors. Existing seniors housing publications will be updated.
CMHC will continue to help address the housing challenges in Canada’s North and work to advance sustainable technologies and practices through a variety of research, demonstration, and information product development activities. CMHC will seek opportunities to engage and collaborate with other stakeholders to achieve objectives.
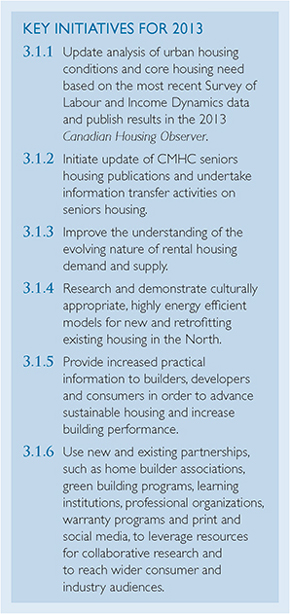
83
| STRATEGIC PRIORITY | 3.2 | SUPPORT AND PROMOTE CANADA’S WORLD-CLASS HOUSING PRODUCTS, SERVICES AND SYSTEM INTERNATIONALLY |
| RESOURCES | OPERATING EXPENSES $8 MILLION | STAFF-YEARS 37 |
| Performance Measures1 | 2012 | |||||||||||
| 2011 Actual | Plan | Actual | ||||||||||
Achieve an overall satisfaction rate of key clients of at least 85% | 86% | 86% | N/A | |||||||||
Achieve a value of CMHC-facilitated sales reported by key export clients of at least $120 million | $138.8 | $120 | N/A | |||||||||
| 1 | Monitoring of performance for this strategic priority was discontinued in 2012 |
PERFORMANCE ANALYSIS
As a result of the Government’s review of spending, CMHC’s housing export program was discontinued. Consequently, activities and staff related to the delivery of this strategic priority were terminated on December 31, 2012.
CMHC, however, continues to represent Canada internationally on matters relating to housing. For example, CMHC will host and provide information to incoming foreign delegations wishing to learn about Canadian housing.

84 C A N A D A M O R T G A G E A N D H O U S I N G C O R P O R A T I O N
RISK MANAGEMENT
This section describes CMHC’s overall Enterprise Risk Management (ERM) framework, and the management of specific financial risks related to Lending Activity, Mortgage Loan Insurance Activity, Securitization Activity, and related investment portfolios. |
ENTERPRISE RISK
MANAGEMENT (ERM)
CMHC is exposed to a variety of risks in its operating environment that could have an impact on the achievement of its objectives. The ability to respond appropriately and effectively to expected and unanticipated change is critical to the organization’s success.
Within this context, CMHC has an enterprise risk management framework which helps to guide the organization in its risk management activities. This framework establishes a governance structure, specifies our appetite for risk and defines, assesses and categorizes the risks that the organization is exposed to. The enterprise risk management framework and governance structure encourages a risk-aware culture where risk management is an integral part of our strategic and operational decision-making; ensures that we are identifying the main risks and opportunities to the Corporation; and facilitates the understanding, discussion, evaluation and management of risks at all levels of the organization.
ERM Governance
The ultimate accountability and responsibility for the identification and management of risk resides with the Board of Directors. The following diagram and accompanying details highlight the key stakeholders and their major responsibilities in our enterprise risk management framework:
The Board of Directors is responsible for overseeing the Corporation’s enterprise risk management framework and approves an annual risk appetite statement designed to ensure a consistent understanding of risk exposures which are acceptable or unacceptable to the Corporation.
The Board is supported by the Risk Management Committee of the Board, the President and Chief Executive Officer (CEO) and the Chief Risk Officer (CRO). It is kept informed of significant risks and mitigating strategies through a variety of reporting mechanisms described in the Risk Monitoring and Reporting section.
The Risk Management Committee was established in 2012 to assist the Board in fulfilling its oversight responsibilities with respect to the identification and management of the Corporation’s principal risks. The Committee’s role includes ensuring that appropriate policies, procedures and controls are in place to identify, assess and manage the principal risks to which the Corporation is exposed.
All members of CMHC Management play an integral role in ERM activities through their responsibilities for identifying, monitoring and reporting potential risks that may put the organization outside the tolerances as expressed in its risk appetite statement.
The President and CEO is accountable for ensuring that all significant risks are appropriately identified and managed and provides the Board with assurance that these activities are
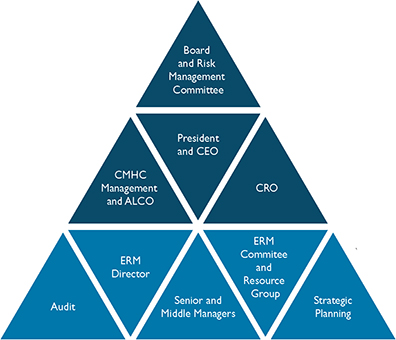
85
being completed in an annual ERM Letter of Representation. (See page 93 for this year’s Letter of Representation.)
The Chief Risk Officer (CRO) is accountable for developing and maintaining an effective risk management framework for the organization. The CRO assists the President and CEO in developing and communicating the organization’s risk management objectives, risk appetite and risk management framework.
ALCO (Asset/Liability Management Committee) is a senior level committee chaired by the President and CEO which draws on internal and external specialized expertise in financial management. ALCO is involved in reviewing and approving all ERM reports prior to their presentation to the Board.
The CRO and CMHC Management are assisted in their risk management efforts by the ERM Committee and the Directors of Enterprise Risk Management (ERM) and the Risk Management Division (RMD). The ERM Committee is comprised of senior level managers and is chaired by the Director, ERM. The committee members represent the major business and risk management units and have a strong technical understanding of risks in their business units. The ERM Committee also obtains advice and support from additional subject matter experts. The ERM Committee is actively involved in the process of identifying and assessing risks. The CRO provides detailed financial risk analysis, monitoring and reporting, including Quarterly Risk Management reports to ALCO and the Risk Management Committee of the Board.
The other groups and individuals shown in the ERM governance diagram all play a role in ensuring that risks are identified and assessed in a consistent manner and are mitigated as appropriate. Processes are also in place to ensure that risk identification and mitigation strategies are an integral part of the corporate planning and regular performance reporting processes.
Risk Appetite Statement
CMHC’s ERM framework includes a Risk Appetite Statement which is designed to ensure a consistent understanding of risk exposures which are acceptable or unacceptable to the Corporation. The Risk Appetite Statement begins with the following statement:
CMHC is exposed to a variety of risks as it strives to achieve the objectives set out in its corporate and business plans. This high level risk appetite statement describes the level at which risks should be avoided and where strategies must be implemented to manage risk.
The statement then indicates that during the organization’s five-year corporate planning horizon the organization wants a very high level of confidence that:
| ¡ | spending on government-funded programs will not vary from approved funding by more than a specified percentage |
| ¡ | exposures to financial risk expressed as a percentage of capital in the three primary business lines – mortgage insurance, securitization and lending – will not exceed specified risk levels |
| ¡ | variances of operating expenses to budget will not exceed a specified maximum variance. |
The Risk Appetite Statement also contains a risk tolerance statement for the five-year planning horizon which states that:
It is considered unacceptable that CMHC would experience a significant negative impact to the reputation of CMHC or to its ability to achieve key objectives in the business and corporate plans.
The statement concludes by specifying a minimum percentage of the annual priority corporate objectives should also be achieved.
86 C A N A D A M O R T G A G E A N D H O U S I N G C O R P O R A T I O N
ERM Framework
CMHC’s management team continually assesses internal and external risks through the ERM framework, which groups risks under three broad categories: strategic, operational and financial risks.

Risk monitoring and reporting
In addition to ongoing regular activities to identify and manage risks as part of our daily decision-making and risk management efforts, the Corporation has structured processes which ensure that regular risk management activities must occur. These are:
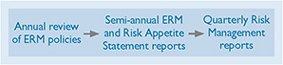
| 1. | The Board, supported by the Risk Management Committee, completes an annual review and approval of the ERM policies to ensure that they remain relevant and reflect appropriate best practices. |
| 2. | The Board receives an ERM report and a Risk Appetite Statement report on a semi-annual basis. These provide details on the individual tolerances expressed in the Risk Appetite Statement and a Risk Register which identifies the most significant risks in each of the 14 risk categories and potentially significant new and emerging risks and opportunities. ALCO reviews and approves these reports prior to presentation to the Risk Management Committee and Board. Other reports to the Board include details on actuarial valuations and stress testing results. |
| 3. | The CRO, working with other members of CMHC Management, assesses changes in the environment. Quarterly Risk Management reports provide CMHC Management, the Risk Management Committee and the Board with details on new and emerging risks, on significant financial and operational risks and compliance with operational and financial risk policies. |
RISK ANALYSIS BY ACTIVITY
Lending Activity
CMHC’s lending programs span some 60 years. For some of the earliest social housing programs, CMHC provided projects with non-renewable, fixed-term loans with amortization periods of up to 50 years.
The Direct Lending initiative was introduced in 1993 to provide loans to federally-assisted social housing projects developed under section 95 of the National Housing Act (NHA) as well as new projects developed under the On-Reserve Non-Profit Rental Housing Program. As a result of obtaining funds through the Crown Borrowing Program (CBP), and previously through direct capital market borrowings, lower interest costs for these mortgages result in lower ongoing federal subsidies.
87
The estimated fair value of loans arising from CMHC’s Lending Activity (excluding loans made under the Municipal Infrastructure Lending Program (MILP)) totalled $11.6 billion on an outstanding book value of $9.7 billion as at 31 December 2012.
Prepayment risk
For 2012, prepayments under the terms of the existing loan agreements totalled $18.27 million. These prepayments were $7.74 million lower than experienced in 2011 ($26.01 million).
On January 29, 2013, a change to CMHC’s prepayment policy was announced. For eligible existing social housing projects that require capital repairs and renovations, the Government of Canada indicated that it would accept prepayment of closed CMHC mortgages with a yield maintenance prepayment penalty consistent with private lending institutions.
CMHC monitors and reports these risks through quarterly scenario analyses modelled using average historical prepayment experience and on a worst case basis. Based on historical activity, CMHC could face an estimated impact on annual earnings of $1.37 million per year over a 13-year period.
Credit risk
Credit risk is defined as the risk of loss due to the failure of counterparties to meet their contractual obligations. CMHC’s loan portfolio includes loans for social housing projects administered by provinces/ territories as well as those administered by CMHC both on and off reserve. CMHC lends to a large number of non-profit entities which do not issue public debt and therefore do not have credit ratings established by independent credit rating agencies. However, this risk is offset by the fact that losses relating to defaults on these loans are largely recoverable from various levels of government.
Also to manage credit risk, project level annual reports, which include audited financial statements submitted by social housing sponsors, provide CMHC with a means to detect and to intervene, as appropriate, when a project faces financial difficulty. A feasibility analysis is performed to determine the value
of the property and any other collateral. Work-outs or restructuring, which may involve additional financing or assistance, are determined on a case-by-case basis.
The following shows the source of guarantee/ insurance on the total loan portfolio as applicable.
At 31 December 2012, CMHC is assured full collection of principal and accrued interest on 76% (2011 - 77%) of the loans. The guarantee or insurance on these loans is provided by:
| ¡ | Provinces and territories through provisions in the Social Housing Agreements (2012 - 42% and 2011 - 43%) |
| ¡ | Government of Canada through provisions in the NHA (2012 - 10% and 2011 - 11%) |
| ¡ | Aboriginal Affairs and Northern Development Canada through Ministerial Loan Guarantees (2012 - 12% and 2011 - 11%) |
| ¡ | CMHC’s Mortgage Loan Insurance Activity through provisions for losses on loans underwritten by CMHC’s Mortgage Loan Insurance Activity which is included in the determination of the Provision for Claims and Unearned Premiums (2012 - 12% and 2011 - 12%). |
The remainder of the loans representing 24% (2011 - 23%) are assessed on a regular basis to determine if a provision for loss is necessary. As at year-end 2012, there were no impaired loans identified and no provision for loss has been recorded (2011 - nil).
Interest rate risk
The Corporation is exposed to interest rate risk when asset and liability principal and interest cash flows have different interest payments or maturity dates. The severity of this risk is largely dependent upon the size and direction of interest rate changes and on the size and maturity schedules of mismatched positions. Interest rate risk is mitigated through the matching of assets and liabilities, including the repayment of the underlying debt in the event of loan prepayment, and through the use of derivatives. In the Direct Lending portfolio, 97.9% of these loans are hedged. Interest rate risk is monitored and managed
88 C A N A D A M O R T G A G E A N D H O U S I N G C O R P O R A T I O N
against internal risk tolerance limits. Interest rate sensitivity analyses are performed by calculating the magnitude of cash flow fluctuations caused by changes in interest rates. At a 95% confidence level, the negative change in the net interest margin for the next 12 months cannot exceed the limit of $1.5 million. This limit has never been exceeded.
Mortgage Loan Insurance Activity
The main risk of financial loss to the Corporation from its Mortgage Loan Insurance Activity is represented by the amount of future claims associated with insured mortgages relative to insurance premiums received. Economic conditions are the principal determinants that affect the incidence and magnitude of claim amounts. Changes in income, employment and, to a much lesser extent, changes in interest rates can impact a borrower’s ability to continue to make mortgage payments.
Homeowner mortgage loan insurance
Risks related to homeowner mortgage loan insurance are assessed through CMHC’s proprietary online automated mortgage loan insurance risk assessment and approval system, emili, used by CMHC underwriters across the country. emili assesses an application’s overall risk by looking at the borrower, the property, the market in which the property is situated and the characteristics of the loan. The results of these risk assessments are synthesized to determine the overall risk of default. If necessary, underwriters can take further steps to determine if risk-mitigating actions are required to effectively reduce the overall risk to a level that is acceptable and prudent. CMHC monitors and adjusts its risk assessment models based on actual claims experience and local market conditions.
Large rental properties (in excess of four units)
Risks associated with rental mortgage loan insurance are also assessed through detailed and thorough underwriting processes that include analysis and risk assessment of the borrower, market, property and loan characteristics. A standardized risk assessment tool is employed by underwriters to assign a risk rating to each of these major risk components.
Based on the risk rating and complexity of the application, the underwriters take risk mitigating actions that effectively ensure that the risk being assumed is at a level that is acceptable and prudent. The risk ratings, along with the size of the loan and policy considerations, determine the appropriate approval authority.
Portfolio
Risk assessment of loans submitted for portfolio insurance is similar to that of homeowner insurance. Low ratio homeowner loans (loans with LTVs of less than 80%) are bundled into pools by lenders and assessed by CMHC through an automated underwriting system similar to emili which is used for high ratio loans. The assessments include an analysis and risk assessment of the borrower, the property, the market in which the property is situated and characteristics of each individual loan. Individual pools are then priced accordingly.
Quality Assurance Framework
Through its Quality Assurance Framework, CMHC further manages risks by assessing lenders’ insured loan portfolios and working with lenders on a regular basis to maintain quality standards in the underwriting and servicing of their portfolios.
Capital management
CMHC follows prudential regulations as set out by OSFI. These regulations stipulate the use of the Minimum Capital Test (MCT) to measure the capital adequacy of an insurer. The MCT is the ratio of capital available to capital required. With respect to CMHC, capital available is equal to mortgage loan insurance retained earnings plus accumulated other comprehensive income. Capital required is calculated by applying risk factors to assets, policy liabilities and other exposures.
In March 2012, the Board of Directors approved changes to the Capital Management Framework as a result of changes in MCT factors implemented by OSFI for 2012.
89
Key CMHC capital targets:
| ¡ | Minimum Regulatory Capital: 100% MCT. Below this level, an insurance company would no longer be allowed to write new business. A level below 0% MCT indicates insolvency. |
| ¡ | Internal Capital Target: 175% MCT. The internal capital target provides adequate time for management to resolve financial problems that may arise, while minimizing the need for regulatory intervention. |
| ¡ | Capital Holding Target: 200% MCT. In line with general practice among insurance companies, CMHC holds additional capital to reduce the likelihood of falling behind its internal capital target. |
Stress testing
Using 10,000 consistent economic scenarios supplied by Towers Watson STAR Economic Scenario Generator, the stress testing model simulates the impact of each of these economic scenarios on the 2013-2017 Corporate Plan as well as other plausible adverse business scenarios. Each scenario includes ten years of new business which then runs off over the next 20 years. The economic scenarios include 30 years of outcomes for real GDP growth, the unemployment rate, the five-year mortgage rate, and investment returns for up to 40 asset classes.
The economic variables are used to generate outcomes for the volume of mortgage loan insurance written, short-term changes in claim frequencies, changes in house prices and the value of invested assets. Investment income and asset modelling is integrated with the modelling of Mortgage Loan Insurance Activity.
The results of the stress testing indicate that CMHC continues to be within the acceptable levels of risks set out in its Capital Management Framework and risk appetite statement. For all economic and adverse business scenarios tested, the probability that MCT drops below 100% is less than 1%. Tests have also validated CMHC’s internal target and capital holding target.
In summary, the Mortgage Loan Insurance Activity is well positioned to weather severe economic and plausible adverse business scenarios. Results of
economic and business stress tests remain within the Board risk and capital tolerance levels. Testing has also validated that CMHC’s internal target level of 175% MCT and the capital holding level of 200% MCT meet the Capital Management Framework requirements.
CMHC continues to focus on monitoring and proactively managing the performance of its insurance business.
Securitization Activity
CMHC guarantees the timely payment of interest and principal of National Housing Act Mortgage-Backed Securities (NHA MBS) issued by Approved Issuers and of Canada Mortgage Bonds (CMB) issued by the Canada Housing Trust (CHT). Timely payment guarantee, counterparty and liquidity risks are mitigated by requiring participants to meet minimum standards and robust legal and operational frameworks.
In exchange for CMHC’s guarantee, the Approved Issuer transfers all rights and security interest on the underlying pool of mortgage loans to CMHC, in trust for investors. A contractual legal agreement framework is in place to protect CMHC’s rights to and interests in the mortgages. An OSFI-regulated document/title custodian holds and maintains all documents related to the NHA MBS securities and underlying mortgage loans.
The major risk of financial loss to the Corporation arising from CMHC’s guarantee is making timely payments when an Approved Issuer is unable to honour its commitments and the assets backing the securities are insufficient.
For NHA MBS, the risk associated with the default of an Approved Issuer is mitigated by both quality assessment and monitoring of the Approved Issuers and by a minimum spread requirement between the security coupon and the lowest mortgage rate in the pool. In the event of an Approved Issuer default, the spread is made available to CMHC for the continued servicing of both underlying mortgages and the NHA MBS payments. All securitized mortgages have mortgage insurance coverage to protect against borrower default.
Under the CMB program, the Trustee maintains the trust property and ensures the Trust fulfills its obligations while the Trust Administrator is
90 C A N A D A M O R T G A G E A N D H O U S I N G C O R P O R A T I O N
responsible for the day-to-day management of CHT operations. CMHC is the financial services advisor to the Trust and guarantor of securities issued by the Trust. NHA MBS are sold to CHT by Approved Sellers.
The Trust is exposed to the credit risk of its counterparties through swap and repurchase (repo) agreements. The swap counterparties effectively absorb all prepayment and reinvestment risk associated with the assets held by the CHT. Using only highly rated counterparties and collateralization mitigates the risk of default. A drop in credit rating triggers monthly interest retention by the CHT. Repo counterparty credit risk is mitigated through rating requirements, transaction limits, and collateral.
The risk of default on investments held by the Trust is managed by limiting the eligible investments to NHA MBS, obligations issued by the Government of Canada and limited amounts of AAA asset-backed commercial paper supported by liquidity arrangements consistent with Global Liquidity Style standards. Swap counterparties are permitted to invest in reverse repurchase agreements with eligible counterparties using NHA MBS or Government of Canada securities as collateral. None of the investments are permitted to have a maturity date longer than that of the related CMB issue.
Since the introduction of the Crown Borrowing Program, short-term borrowings from the federal government may be required to fulfill CMHC’s timely payment guarantee with regard to the Corporation’s guarantee activities. CMHC pays the Government of Canada a risk premium for its backing in the event that it is unable to honour its timely payment guarantee.
INVESTMENT PORTFOLIOS
All investment-related activities are subject to CMHC’s Enterprise Risk Management policies, which are reviewed and approved annually by the Board of Directors. These include policies for investment objectives, asset allocation, credit risk, market risk, liquidity risk, derivatives activity, and performance measurement. In keeping with good governance practices, the investment positions, performance, and risk exposures are monitored daily by an independent risk management group and they are also reviewed
quarterly by both the Asset/Liability Management Committee (ALCO), and the Board of Directors. An Investment Committee with three external advisors provides technical support to ALCO with respect to the mortgage loan insurance and securitization investment portfolios.
Lending Activity Principal Repayments
Money available for investment is generated from the payment of principal on loans issued by CMHC. Investments are made in high credit quality short-term fixed-income instruments taking into consideration the Corporation’s risk appetite statements and business activities. Investments under management had a market value of $1.8 billion as at December 31, 2012.
The Lending Activity does not have an Asset Allocation Policy as it is constrained to high quality short-term fixed-income and money market instruments. The objective of the portfolio’s investment activities is to generate a target return of Canadian Dealer Offered Rate (CDOR) plus five basis points. This target has always been met and has often been exceeded.
As at December 31, 2012, year-to-date returns for the Lending Principal Repayment portfolio were 26 basis points over CDOR, which exceeded the target of CDOR plus 5 basis points. The return on the portfolio is expected to achieve and often exceed its target over the planning horizon.
Mortgage Loan Insurance Investment Portfolio
The investment portfolio for mortgage loan insurance consists of cash flow from premiums, application fees, and interest received, net of claims and expenses. CMHC uses its mortgage loan insurance portfolio to cover obligations associated with the provision of mortgage loan insurance to lenders.
The objective of the mortgage loan insurance investment portfolio is to maximize the total return on a pre-tax basis after related operating expenses. This is achieved through a strategic asset allocation policy that takes into account the time horizon and liquidity needs of the liabilities, as well as the regulatory environment, capital objectives, and risk appetite of the Corporation.
91
As at 31 December 2012, total investments under management had a market value $20.1 billion compared to $18.9 billion at the end of 2011. The allocation of investments in the portfolio as at 31 December 2012 is shown in the following graph:
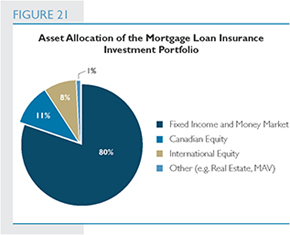
Approximately, 62.74% of the total fixed-income and money market assets at year-end were invested in securities issued or explicitly guaranteed by the Government of Canada or Canadian provinces.
Performance, including absolute and risk-adjusted measures relative to benchmarks, is tracked and monitored in aggregate and at individual asset class levels of the portfolio. In 2012, the total return for the mortgage loan insurance portfolio was 5.03%, which was 0.26% above the total return of the benchmark index.
Investment activity for the mortgage loan insurance portfolio in 2013 will include activities related to the ongoing management of investments in fixed-income, equities, and alternative investments. The strategic asset allocation policy is reviewed every five years or more frequently, as necessary.
Securitization Investment Portfolio
The securitization investment portfolio consists of cash flow from guarantee and application fees, and interest received, net of claims and expenses. This portfolio is intended to cover obligations associated
with CMHC’s securitization guarantee programs. The objective of the securitization investment portfolio is to maximize the capacity to meet liquidity needs of the timely payment guarantee and to preserve capital through investments in Government of Canada securities.
The Board of Directors approved a revised investment objective and strategic asset allocation (SAA) policy for this portfolio in the fall of 2012. The new SAA benchmark for the securitization investment portfolio, comprised of Canada Non-Agency Bonds (98%) and 91-day T-Bills (2%), was implemented effective January 1, 2013 and is shown in the following graph.
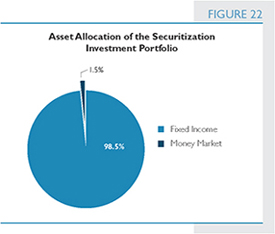
It should be noted that in October 2008, CMHC began investing in NHA MBS under IMPP. These investments, while recognized as part of the Securitization Activity, are excluded from the strategic asset allocation of the securitization investment portfolio as they were made with the explicit goal of assisting Canadian financial institutions to raise longer-term funds and therefore do not contribute to the overall return of the investment portfolio.
As at 31 December 2012, total investments under management had a market value $1.8 billion compared to $1.6 billion at the end of 2011.
In 2012, the total return was 3.17% which was 0.46% below the total return of the benchmark index.
92 C A N A D A M O R T G A G E A N D H O U S I N G C O R P O R A T I O N
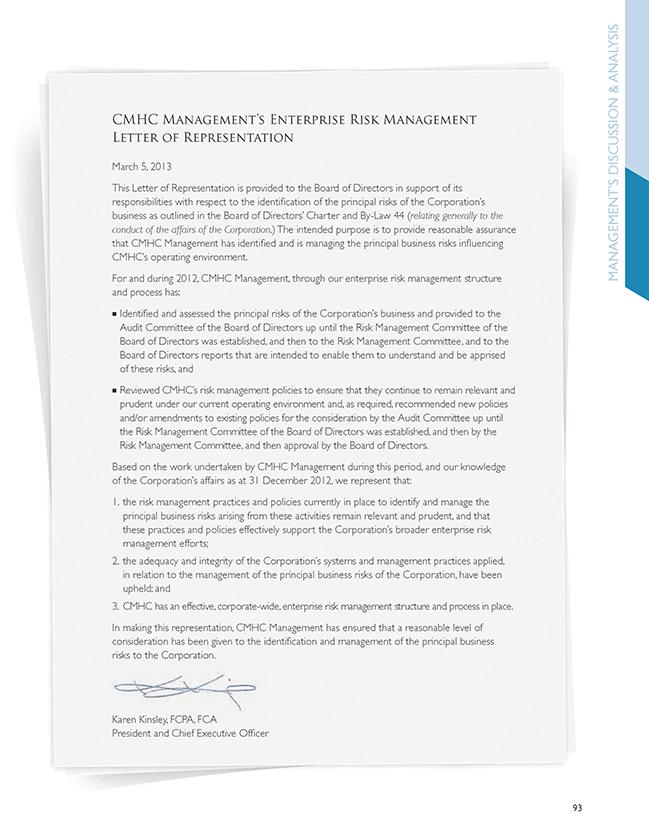
HUMAN RESOURCES AND
OTHER INTERNAL SERVICES
CMHC’s workforce of approximately 1,900 employees forms the bedrock of our organization. Progressive human resource strategies and practices, along with supportive internal services ranging from administrative to financial and information systems, are critical to their ability to carry out CMHC’s objectives. Planning and monitoring the performance of CMHC’s internal services form part of our overall performance management framework. |
HUMAN RESOURCES
| Performance Measures | 2012 | |||||||
| 2011 Actual | Plan | Actual | 2013 Plan | |||||
| Retention of regular employees recruited 3 to 5 years ago (per cent) | 94 | 93 | 97 | 93 | ||||
| Level of employee engagement (per cent)1 | 95 | 90 | 94 | TBD | ||||
| Critical and vulnerable positions with succession plans underway (per cent) | 100 | 100 | 100 | 100 | ||||
| Employees with development plans in place in CMHC’s online performance management system (per cent) | 97 | 95 | 96 | 95 | ||||
| Employees in bilingual positions meeting language requirements (per cent) | 92 | 90 | 91 | 90 | ||||
| Aboriginal people | ||||||||
Representation rates for Aboriginal people, visible minorities and persons with disabilities reflect or exceed the labour representation rates in the latest Census (per cent)2 | 3.0 | 3.1 | 2.7 | 3.1 | ||||
| Visible minorities | ||||||||
| 15.8 | 15.9 | 16.2 | 15.9 | |||||
| Persons with disabilities | ||||||||
| 4.3 | 4.7 | 4.2 | 4.7 | |||||
| 1 | In 2013, CMHC will be exploring the best approach and methodology to measure employee engagement. The target for 2013 will be established once this process is completed. |
| 2 | The 2013 Representation Rates targets will be adjusted, as appropriate, pending release of labour force participation rates based on the 2011 Census. |
CMHC’s culture is defined by the passion and professionalism of its employees who strive to meet and often exceed the performance objectives of the Corporation. That culture, along with CMHC’s talent management framework, has helped build and maintain an engaged workforce committed to the mandate and objectives of the Corporation.
CMHC’s talent management framework has helped to ensure that the Corporation attracts, motivates and retains employees with the skills it needs to fulfill its mandate and achieve its objectives. A key cornerstone of the framework is the focus on succession planning to mitigate the risks associated with critical and vulnerable positions. Other elements of the
94 C A N A D A M O R T G A G E A N D H O U S I N G C O R P O R A T I O N
framework include recruitment, retention, leadership and employee development, people and performance management, compensation policies as well as a commitment to achieving a multi-generational, diverse and bilingual workforce. Through continuous analysis of its workforce and external trends, CMHC strives to be at the forefront of human resources practices to ensure that employees remain highly engaged and that an appealing and inclusive workplace environment is maintained.
CMHC tracks a range of measures to gauge the success of its talent management framework. These measures relate to retention of recent recruits, level of employee engagement, succession and developmental planning as well as bilingualism and diversity. CMHC continues to sustain high employee engagement, strong retention rates and continues to meet its goals for succession planning and employee development. In 2012, the representation rates of visible minorities continued to rise and exceeded plan while the rates for Aboriginal persons and persons with disabilities decreased slightly.
CMHC maintained its commitment to Canada’s official languages. With over 90% of employees in bilingual positions meeting the language requirements, the Corporation retained its capacity to serve Canadians and its employees in the official language of their choice. Ongoing third party monitoring indicates that CMHC continued to improve upon its near perfect performance with respect to making the active bilingual offer and provision of services in both official languages in CMHC offices across the country.
CMHC’s strong corporate culture continued to evolve through frank and open communications. Orientation sessions on the updated Code of Conduct renewed the dialogue on values and ethics and will help ensure that all employees demonstrate leadership and act with integrity. Senior management also continued to solicit the views of employees and worked with the President’s Advisory Council on important topics shaping our workplace community, such as the exercise of managerial discretion.

95
Renewal of CMHC’s workforce
CMHC will see many of its baby boomer employees retire in the next few years. On average, 65 employees are expected to retire annually over the next five years. Succession planning will help ensure that the Corporation is able to manage the renewal of its workforce. CMHC has implemented specific strategies aimed at enhancing the Corporation’s ability to manage this renewal, to maximize the contributions of a multi-generational, diverse and bilingual workforce, and to respond quickly to human resources pressure points as they were identified. Enhancements were made in CMHC’s performance planning and evaluation process in order to ensure employees receive clear, objective performance feedback and career coaching.
Government’s review of spending
The results of the Government’s review of spending were announced in Budget 2012. CMHC is contributing just over $102 million towards reducing the federal deficit by 2014-2015. The Corporation has effectively managed the resulting reduction of positions in the areas of Assisted Housing, Research and Information Transfer, CMHC International and Corporate Marketing.
Staff reductions are always difficult, not just for the individuals impacted, but for the Corporation as a whole. A workforce transition process, led by a committee comprised of members of senior management, ensured that affected employees received the full range of support to help them find the best option going forward.
Employee compensation
The Corporation remains committed to offering its employees a compensation, benefits and pension plan package that is fair, competitive and sustainable in the long term. CMHC reviews its total compensation package on an annual basis and results of the 2012 review indicate the Corporation continues to be well positioned from a compensation perspective to achieve its talent management objectives.
In 2012, a comprehensive review of CMHC’s employee benefits plan was undertaken. As a result, a new more flexible benefits plan will be implemented in 2013 to maximize the value and competitiveness of the plan for employees, while ensuring that the long-term sustainability of the plan is protected and that the cost to provide the plan is reasonable.
Looking ahead, CMHC will continue its focus on succession planning for its critical positions and will continue to build leadership at all levels of the Corporation, providing opportunities for growth and career progression for our employees. CMHC will also focus on ensuring its total compensation remains competitive and at a reasonable cost.
96 C A N A D A M O R T G A G E A N D H O U S I N G C O R P O R A T I O N
OTHER INTERNAL SERVICES
Information Technology (IT)
Information technology (IT) continues to play a critical role in CMHC’s operations and key systems, including emili, CMHC’s electronic mortgage loan insurance underwriting system. These technologies have proven to be highly reliable. Other systems which impact the technology reliability index are CMHC’s financial information management systems, human resources management system and website.
In 2012, CMHC developed a multi-year strategy that encompasses all of its business application systems to ensure they continue to meet business requirements, and are able to respond to rapidly changing technologies and the increasing need for more effective and integrated business systems to support operational requirements. This multi-year strategy also addresses the maturity of the systems and their underlying technology to ensure viability, stability and reliability over the long term. CMHC’s core infrastructure systems strategy, which was updated in 2011, continues to evolve and progress to meet future needs and to support the business applications for years to come.
| Performance Measure |
2011 |
2012 | 2013 Plan | |||||
| Plan | Actual | |||||||
| Technology reliability index for key systems (per cent) | 99.9 | 99.8 | 99.9 | 99.9 | ||||
Communications and Corporate Marketing
CMHC’s communications and marketing strategies serve to enhance awareness of the Corporation’s mandate, activities, and product and service offerings.
CMHC’s website is a vital communications and marketing tool providing Canadians with access to CMHC products, services and online resources. In 2012, there were over 9.5 million visits to the CMHC website. CMHC’s website is instrumental in helping new home buyers make better informed mortgage and home-buying decisions. During the year, there were nearly 700,000 visits to web content related to mortgage literacy and online mortgage tools, and there were nearly a quarter of a million visits to the specially designed Newcomers micro site.
Also this year, CMHC expanded its use of social media. CMHC launched a Twitter account, building upon its social media presence on YouTube and Flickr. CMHC also continued to promote and monitor its presence on the web.

As part of its marketing efforts, CMHC conducted several marketing outreach campaigns targeting both industry and consumers. These campaigns effectively promoted CMHC’s role in the areas of mortgage literacy, sustainable housing, housing market information, assisted housing and housing finance. Marketing outreach activities also promoted CMHC’s information products designed to assist new immigrants with their housing-related decisions.
Enhancing relationships with other government agencies and stakeholders is an integral part of CMHC’s communication and marketing strategy. Through collaboration and content integration agreements, CMHC’s housing information was widely shared and made available to Canadians.
97
2008 TO 2013 FINANCIAL HIGHLIGHTS
Corporate Results1 |
2008 | 2009 | 2010 | 2011 | 2012 | 2013 | ||||||||||||||||||||||
| Actual | Actual | Actual | Actual | Plan | Actual | Plan | ||||||||||||||||||||||
Total Assets ($M) | 203,461 | 272,821 | 287,940 | 291,890 | 290,027 | 292,040 | 267,847 | |||||||||||||||||||||
Total Liabilities ($M) | 195,291 | 263,558 | 277,499 | 279,799 | 276,337 | 278,195 | 252,731 | |||||||||||||||||||||
Reserve Fund ($M) | 185 | 151 | 68 | (9) | 164 | (27) | 87 | |||||||||||||||||||||
Total Equity of Canada ($M) | 8,170 | 9,263 | 10,441 | 12,091 | 13,690 | 13,845 | 15,116 | |||||||||||||||||||||
Total Revenues ($M) | 11,738 | 13,164 | 14,454 | 13,914 | 14,286 | 13,455 | 12,317 | |||||||||||||||||||||
Total Operating Expenses ($M)2 | 385 | 416 | 406 | 420 | 427 | 427 | 463 | |||||||||||||||||||||
Total Expenses ($M) | 9,319 | 11,939 | 12,474 | 11,832 | 12,349 | 11,166 | 10,307 | |||||||||||||||||||||
Net Income ($M) | 1,778 | 931 | 1,440 | 1,529 | 1,497 | 1,716 | 1,524 | |||||||||||||||||||||
Other Comprehensive Income ($M) | (604) | 483 | 311 | 120 | - | 38 | (66) | |||||||||||||||||||||
Comprehensive Income ($M) | 1,174 | 1,414 | 1,751 | 1,649 | 1,497 | 1,754 | 1,458 | |||||||||||||||||||||
Staff-Years | 1,945 | 1,999 | 2,069 | 1,975 | 1,947 | 1,900 | 1,878 | |||||||||||||||||||||
Mortgage Loan Insurance |
| |||||||||||||||||||||||||||
Total insured volumes (units) | 798,309 | 1,048,736 | 643,991 | 630,957 | 550,335 | 386,222 | 355,597 | |||||||||||||||||||||
Insurance-in-force ($B) | 408 | 473 | 514 | 567 | 557 | 566 | 573 | |||||||||||||||||||||
High ratio homeowner | 232 | 246 | 271 | 286 | 291 | 290 | 302 | |||||||||||||||||||||
Low ratio portfolio | 148 | 196 | 209 | 243 | 230 | 230 | 234 | |||||||||||||||||||||
Multi-unit residential | 28 | 31 | 34 | 38 | 36 | 46 | 37 | |||||||||||||||||||||
Premiums and Fees Received ($M) | 2,132 | 2,464 | 1,941 | 1,653 | 1,671 | 1,475 | 1,294 | |||||||||||||||||||||
Investments (including cash) ($M) | 12,974 | 15,901 | 17,597 | 19,112 | 19,826 | 20,313 | 20,769 | |||||||||||||||||||||
Unappropriated Retained Earnings ($M) | 1,778 | 2,009 | 860 | 1,271 | 2,767 | 1,675 | 2,312 | |||||||||||||||||||||
Appropriated Retained Earnings ($M) | 5,423 | 5,937 | 8,201 | 9,028 | 9,154 | 9,983 | 10,666 | |||||||||||||||||||||
Net Insurance Claims Expense ($M) | 372 | 1,112 | 497 | 562 | 625 | 487 | 561 | |||||||||||||||||||||
Net Income ($M) | 999 | 742 | 1,275 | 1,336 | 1,331 | 1,414 | 1,322 | |||||||||||||||||||||
Other Comprehensive Income ($M) | (527) | 411 | 323 | 198 | (13) | 108 | (126) | |||||||||||||||||||||
Comprehensive Income ($M) | 472 | 1,153 | 1,598 | 1,534 | 1,318 | 1,522 | 1,196 | |||||||||||||||||||||
Securitization |
| |||||||||||||||||||||||||||
Annual Securities Guaranteed ($M) | 104,625 | 135,447 | 95,069 | 116,725 | 64,000 | 119,531 | 90,000 | |||||||||||||||||||||
Securitization Guarantees-in-force ($M) | 233,958 | 300,320 | 325,802 | 362,308 | 339,300 | 381,557 | 413,100 | |||||||||||||||||||||
Borrowings from the Government of Canada ($M) | 24,872 | 61,260 | 59,200 | 55,401 | 52,947 | 52,448 | 29,582 | |||||||||||||||||||||
Fees Received ($M) | 228 | 291 | 222 | 257 | 151 | 260 | 224 | |||||||||||||||||||||
Investments (including cash) ($M)3 | 25,559 | 62,260 | 60,440 | 57,012 | 54,518 | 54,275 | 31,587 | |||||||||||||||||||||
Unappropriated Retained Earnings ($M) | 938 | 409 | 38 | 252 | 367 | 439 | 619 | |||||||||||||||||||||
Appropriated Retained Earnings ($M) | N/A | 538 | 707 | 699 | 730 | 781 | 815 | |||||||||||||||||||||
Net Income ($M) | 633 | 69 | 175 | 211 | 159 | 273 | 207 | |||||||||||||||||||||
Other Comprehensive Income ($M) | (24) | 27 | 25 | 12 | 6 | (53) | 1 | |||||||||||||||||||||
Comprehensive Income ($M) | 609 | 96 | 200 | 223 | 165 | 220 | 208 | |||||||||||||||||||||
Housing Programs |
| |||||||||||||||||||||||||||
Housing Program Expenses ($M) (excluding operating expenses) | 2,288 | 2,505 | 3,040 | 2,044 | 2,023 | 2,074 | 1,988 | |||||||||||||||||||||
Affordable Housing Expenditures ($M)4 | 209.9 | 250.8 | 297 | 127.1 | 411.5 | 367.0 | 257.8 | |||||||||||||||||||||
Estimated Households Assisted through long-term Commitments | 623,700 | 620,000 | 613,500 | 604,200 | 597,800 | 593,800 | 585,800 | |||||||||||||||||||||
New Commitments (units) under Renovations Programs | 21,506 | 18,000 | 18,158 | 6,730 | 2,794 | 3,482 | 1,279 | |||||||||||||||||||||
On-reserve | 1,063 | 1,193 | 1,283 | 1,015 | 1,109 | 1,168 | 1,103 | |||||||||||||||||||||
Off-reserve | 20,443 | 16,807 | 16,875 | 5,715 | 1,685 | 2,314 | 176 | 5 | ||||||||||||||||||||
New commitments On-Reserve Non-Profit Units6 | 945 | 822 | 766 | 604 | 548 | 603 | 465 | |||||||||||||||||||||
Lending |
| |||||||||||||||||||||||||||
Loans and Investments in Housing Programs ($M) | 12,340 | 11,727 | 12,381 | 12,666 | 11,503 | 11,779 | 10,968 | |||||||||||||||||||||
Borrowings from Capital Markets ($M) | 5,979 | 4,448 | 3,054 | 2,218 | 1,775 | 1,862 | 1,436 | |||||||||||||||||||||
Borrowings from the Government of Canada ($M) | 7,746 | 8,593 | 10,756 | 12,146 | 11,390 | 11,806 | 11,383 | |||||||||||||||||||||
Net Income ($M) | 64 | (16) | 13 | 13 | 9 | 19 | 10 | |||||||||||||||||||||
Other Comprehensive Income ($M) | N/A | N/A | (44) | (77) | 5 | (39) | 44 | |||||||||||||||||||||
Comprehensive Income ($M) | 64 | (16) | (31) | (64) | 14 | (20) | 54 | |||||||||||||||||||||
CHT |
| |||||||||||||||||||||||||||
Assets ($M) | 150,669 | 182,206 | 196,638 | 201,795 | 204,221 | 204,060 | 203,848 | |||||||||||||||||||||
Liabilities ($M) | 150,669 | 182,240 | 196,638 | 201,795 | 204,221 | 204,060 | 203,848 | |||||||||||||||||||||
| 1 | 2009 Actual is accounted for under CGAAP; 2010 onward is accounted for under IFRS. |
| 2 | Total Operating Expenses are included in Total Expenses. |
| 3 | Includes investments in NHA MBS: Loans and Receivables. |
| 4 | Includes renovation programs off reserve, Affordable Housing Initiative and Investment in Affordable Housing; and are part of overall Housing Programs Expenses. |
| 5 | Funding for renovation programs off reserve has been combined under the Investment in Affordable Housing in all jurisdictions except P.E.I. and Yukon, where CMHC continues to deliver. |
| 6 | Excludes units under Canada’s Economic Action Plan. |
98 C A N A D A M O R T G A G E A N D H O U S I N G C O R P O R A T I O N

MANAGEMENT’S RESPONSIBILITY FOR FINANCIAL REPORTING | 100 | |||
INDEPENDENT AUDITOR’S REPORT | 101 | |||
CONSOLIDATED BALANCE SHEET | 102 | |||
CONSOLIDATED STATEMENT OF INCOME AND COMPREHENSIVE INCOME | 103 | |||
CONSOLIDATED STATEMENT OF EQUITY OF CANADA | 104 | |||
CONSOLIDATED STATEMENT OF CASH FLOWS | 105 | |||
NOTES TO CONSOLIDATED FINANCIAL STATEMENTS | 106 | |||
99
MANAGEMENT’S RESPONSIBILITY FOR FINANCIAL REPORTING
Year ended 31 December 2012
CMHC Management is responsible for the integrity and objectivity of the Consolidated Financial Statements and related financial information presented in this annual report. The Consolidated Financial Statements have been prepared in accordance with International Financial Reporting Standards and, consequently, include amounts which are based on the best estimates and judgment of Management. The financial information contained elsewhere in this annual report is consistent with that in the Consolidated Financial Statements.
In carrying out its responsibilities, Management maintains appropriate financial systems and related internal controls within CMHC and controls, as guarantor of Canada Housing Trust, to provide reasonable assurance that financial information is reliable, assets are safeguarded, transactions are properly authorized and are in accordance with the relevant legislation, by-laws of the Corporation and
government directives, resources are managed efficiently and economically, and operations are carried out effectively. The system of internal controls is supported by internal audit, which conducts periodic audits of different aspects of the operations.
The Board of Directors, acting through the Audit Committee whose members are not officers of the Corporation, oversees Management’s responsibilities for financial reporting, internal control systems, and the controls as guarantor of Canada Housing Trust. The Board of Directors, upon the recommendation of the Audit Committee, has approved the Consolidated Financial Statements.
Ernst & Young LLP, and Michael Ferguson, FCA, Auditor General of Canada, have audited the Consolidated Financial Statements. The auditors have full access to, and meet periodically with, the Audit Committee to discuss their audit and related matters.

Karen Kinsley, FCPA, FCA
President and Chief Executive Officer

Brian Naish, CPA, CA
Chief Financial Officer
22 March 2013
100 C A N A D A M O R T G A G E A N D H O U S I N G C O R P O R A T I O N

INDEPENDENT AUDITORS’ REPORT
To the Minister of Human Resources and Skills Development
Report on the Consolidated Financial Statements
We have audited the accompanying consolidated financial statements of Canada Mortgage and Housing Corporation, which comprise the consolidated balance sheet as at 31 December 2012, and the consolidated statement of income and comprehensive income, the consolidated statement of equity of Canada and the consolidated statement of cash flows for the year then ended, and a summary of significant accounting policies and other explanatory information.
Management’s Responsibility for the Consolidated Financial Statements
Management is responsible for the preparation and fair presentation of these consolidated financial statements in accordance with International Financial Reporting Standards, and for such internal control as management determines is necessary to enable the preparation of consolidated financial statements that are free from material misstatement, whether due to fraud or error.
Auditor’s Responsibility
Our responsibility is to express an opinion on these consolidated financial statements based on our audit. We conducted our audit in accordance with Canadian generally accepted auditing standards. Those standards require that we comply with ethical requirements and plan and perform the audit to obtain reasonable assurance about whether the consolidated financial statements are free from material misstatement.
An audit involves performing procedures to obtain audit evidence about the amounts and disclosures in the consolidated financial statements. The procedures selected depend on the auditor’s judgment, including the assessment of the risks of material misstatement of the consolidated financial statements, whether due to fraud or error. In making those risk assessments, the auditor considers internal control relevant to the entity’s preparation and fair presentation of the consolidated financial statements in order to design audit procedures that are appropriate in the circumstances, but not for the purpose of expressing an opinion on the effectiveness of the entity’s internal control. An audit also includes evaluating the appropriateness of accounting policies used and the reasonableness of accounting estimates made by management, as well as evaluating the overall presentation of the consolidated financial statements.
We believe that the audit evidence we have obtained is sufficient and appropriate to provide a basis for our audit opinion.
Opinion
In our opinion, the consolidated financial statements present fairly, in all material respects, the financial position of Canada Mortgage and Housing Corporation as at 31 December 2012, and its financial performance and its cash flows for the year then ended in accordance with International Financial Reporting Standards.
Report on Other Legal and Regulatory Requirements
As required by the Financial Administration Act, we report that, in our opinion, the accounting principles in International Financial Reporting Standards have been applied on a basis consistent with that of the preceding year.
Further, in our opinion, the transactions of Canada Mortgage and Housing Corporation that have come to our notice during our audit of the consolidated financial statements have, in all significant respects, been in accordance with Part X of the Financial Administration Act and regulations, the Canada Mortgage and Housing Corporation Act, the National Housing Act, the by-laws of the Canada Mortgage and Housing Corporation, and the directive issued pursuant to Section 89 of the Financial Administration Act.

Clyde M. MacLellan, CA
Assistant Auditor General
for the Auditor General of Canada

Ernst & Young LLP
Chartered Accountants
Licensed Public Accountants
22 March 2013
Ottawa, Canada


101
CONSOLIDATED BALANCE SHEET
As at 31 December
| (in millions of Canadian dollars) | Notes | 2012 | 2011 | |||||||||
ASSETS | ||||||||||||
Cash and Cash Equivalents | 1,220 | 1,401 | ||||||||||
Securities Purchased Under Resale Agreements | 63 | - | ||||||||||
Investment Securities: | 5 | |||||||||||
Designated at Fair Value through Profit or Loss | 928 | 903 | ||||||||||
Held for Trading | 415 | 397 | ||||||||||
Available for Sale | 19,304 | 17,549 | ||||||||||
Investment in NHA Mortgage-Backed Securities: | ||||||||||||
Loans and Receivables | 6 | 255,967 | 256,655 | |||||||||
Loans: | 7 | |||||||||||
Designated at Fair Value through Profit or Loss | 6,591 | 7,132 | ||||||||||
Other | 4,440 | 4,726 | ||||||||||
Investments in Housing Programs | 748 | 808 | ||||||||||
Accrued Interest Receivable | 959 | 983 | ||||||||||
Deferred Income Tax Assets | 15 | 58 | 78 | |||||||||
Derivatives | 8 | 131 | 169 | |||||||||
Due from the Government of Canada | 9 | 309 | 403 | |||||||||
Accounts Receivable and Other Assets | 10 | 907 | 686 | |||||||||
| 292,040 | 291,890 | |||||||||||
LIABILITIES | ||||||||||||
Securities Sold Under Repurchase Agreements | 5 | 425 | 272 | |||||||||
Borrowings: | ||||||||||||
Canada Mortgage Bonds | 11, 12 | 201,676 | 199,373 | |||||||||
Capital Market Borrowings | 12 | 1,848 | 2,203 | |||||||||
Borrowings from the Government of Canada: | 12 | |||||||||||
Designated at Fair Value through Profit or Loss | 6,659 | 6,584 | ||||||||||
Other | 57,595 | 60,963 | ||||||||||
Accrued Interest Payable | 753 | 860 | ||||||||||
Derivatives | 8 | 46 | 72 | |||||||||
Accounts Payable and Other Liabilities | 13 | 1,257 | 1,172 | |||||||||
Provision for Claims | 14 | 996 | 1,041 | |||||||||
Unearned Premiums and Fees | 11, 14 | 6,940 | 7,259 | |||||||||
| 278,195 | 279,799 | |||||||||||
Commitments and Contingent Liabilities | 25 | |||||||||||
EQUITY OF CANADA | ||||||||||||
Contributed Capital | 25 | 25 | ||||||||||
Accumulated Other Comprehensive Income | 1,038 | 902 | ||||||||||
Retained Earnings | 16 | 12,782 | 11,164 | |||||||||
| 13,845 | 12,091 | |||||||||||
| 292,040 | 291,890 | |||||||||||
The accompanying notes to these Consolidated Financial Statements are an integral part of these statements.
These Consolidated Financial Statements were approved by the Board of Directors on 22 March 2013.
Sophie Joncas, CPA, CA Chairperson, Audit Committee |
Karen Kinsley, FCPA, FCA President and Chief Executive Officer |


102 C A N A D A M O R T G A G E A N D H O U S I N G C O R P O R A T I O N
CONSOLIDATED STATEMENT OF INCOME AND COMPREHENSIVE INCOME
Year Ended 31 December
| (in millions of Canadian dollars) | Notes | 2012 | 2011 | |||||||||
REVENUES | ||||||||||||
Interest Income from NHA Mortgage-Backed Securities – Loans and Receivables | 7,681 | 8,274 | ||||||||||
Premiums and Fees | 11, 14 | 2,049 | 2,002 | |||||||||
Interest Earned on Loans | 580 | 658 | ||||||||||
Income from Investment Securities | 628 | 622 | ||||||||||
Net Realized Gains from Financial Instruments | 17 | 135 | 197 | |||||||||
Net Unrealized Gains (Losses) from Financial Instruments | 17 | 65 | (118) | |||||||||
Other Income | 120 | 116 | ||||||||||
| 11,258 | 11,751 | |||||||||||
Parliamentary Appropriations for: | 9 | |||||||||||
Housing Programs | 2,074 | 2,044 | ||||||||||
Operating Expenses | 123 | 119 | ||||||||||
| 2,197 | 2,163 | |||||||||||
| 13,455 | 13,914 | |||||||||||
EXPENSES | ||||||||||||
Interest Expense | 12, 17 | 8,178 | 8,806 | |||||||||
Housing Programs | 9 | 2,074 | 2,044 | |||||||||
Net Claims | 487 | 562 | ||||||||||
Operating Expenses | 26 | 427 | 420 | |||||||||
| 11,166 | 11,832 | |||||||||||
INCOME BEFORE INCOME TAXES | 2,289 | 2,082 | ||||||||||
INCOME TAXES | 15 | |||||||||||
Current | 534 | 595 | ||||||||||
Deferred | 39 | (42) | ||||||||||
| 573 | 553 | |||||||||||
NET INCOME | 1,716 | 1,529 | ||||||||||
OTHER COMPREHENSIVE INCOME (LOSS) | ||||||||||||
Items that will be subsequently reclassified to Net Income: | 15 | |||||||||||
Net Unrealized Gains from Available for Sale | ||||||||||||
Financial Instruments (net of tax) | 283 | 427 | ||||||||||
Reclassification of Prior Years’ Net Unrealized Gains Realized in the Period in Net Income (net of tax) | (147) | (126) | ||||||||||
Total items that will be subsequently reclassified to Net Income | 136 | 301 | ||||||||||
Items that will not be subsequently reclassified to Net Income: | ||||||||||||
Net Actuarial Losses on Post-employment Benefits (net of tax) | 21 | (98) | (181) | |||||||||
| 38 | 120 | |||||||||||
COMPREHENSIVE INCOME | 1,754 | 1,649 | ||||||||||
The accompanying notes to these Consolidated Financial Statements are an integral part of these statements.
103
CONSOLIDATED STATEMENT OF EQUITY OF CANADA
Year Ended 31 December
| Appropriated | ||||||||||||||||||||||||||||||||||||
(in millions of Canadian dollars) | Contributed Capital | Unappropriated | Mortgage Loan Insurance | Securitization | Reserve Fund for Lending | Total Retained Earnings | Accumulated (Loss) | Total Retained Earnings and Accumulated Other Comprehensive Income | Total Equity of Canada | |||||||||||||||||||||||||||
Balance at Beginning of Year 2012 | 25 | 1,446 | 9,028 | 699 | (9) | 11,164 | 902 | 12,066 | 12,091 | |||||||||||||||||||||||||||
Net Income | - | 1,695 | - | - | 21 | 1,716 | - | 1,716 | 1,716 | |||||||||||||||||||||||||||
Other Comprehensive Income (Loss) | - | (59) | - | - | (39) | (98) | 136 | 38 | 38 | |||||||||||||||||||||||||||
Set Aside for Capitalization | - | (1,037) | 955 | 82 | - | - | - | - | - | |||||||||||||||||||||||||||
| Balance at End of Year 2012 | 25 | 2,045 | 9,983 | 781 | (27) | 12,782 | 1,038 | 13,820 | 13,845 | |||||||||||||||||||||||||||
| Balance at Beginning of Year 2011 | 25 | 839 | 8,201 | 707 | 68 | 9,815 | 601 | 10,416 | 10,441 | |||||||||||||||||||||||||||
Income Tax Benefit on Earnings Set Aside for Capitalization | - | 1 | - | - | - | 1 | - | 1 | 1 | |||||||||||||||||||||||||||
Net Income | - | 1,529 | - | - | - | 1,529 | - | 1,529 | 1,529 | |||||||||||||||||||||||||||
Other Comprehensive Income (Loss) | - | (104) | - | - | (77) | (181) | 301 | 120 | 120 | |||||||||||||||||||||||||||
Set Aside for Capitalization | - | (819) | 827 | (8) | - | - | - | - | - | |||||||||||||||||||||||||||
| Balance at End of Year 2011 | 25 | 1,446 | 9,028 | 699 | (9) | 11,164 | 902 | 12,066 | 12,091 | |||||||||||||||||||||||||||
The accompanying notes to these Consolidated Financial Statements are an integral part of these statements.

104 C A N A D A M O R T G A G E A N D H O U S I N G C O R P O R A T I O N
CONSOLIDATED STATEMENT OF CASH FLOWS
Year Ended 31 December
| (in millions of Canadian dollars) | Notes | 2012 | 2011(1) | |||||||||
CASH FLOWS PROVIDED BY (USED IN) OPERATING ACTIVITIES | ||||||||||||
Net Income | 1,716 | 1,529 | ||||||||||
Items Not Affecting Cash or Cash Equivalents: | ||||||||||||
Amortization of Premiums and Discounts on Financial Instruments | 71 | 58 | ||||||||||
Deferred Income Taxes | 20 | (91) | ||||||||||
Change in Fair Value of Financial Instruments Carried at Fair Value | (65) | 118 | ||||||||||
Net Gain on Financial Instruments | 17 | (135) | (197) | |||||||||
Net Change in Non-cash Operating Assets and Liabilities: | ||||||||||||
Accounts Receivable and Other Assets | (221) | (102) | ||||||||||
Accrued Interest Receivable | 24 | 297 | ||||||||||
Due from the Government of Canada | 94 | 128 | ||||||||||
Unearned Premiums and Fees | (319) | (98) | ||||||||||
Provision for Claims | (45) | (54) | ||||||||||
Accounts Payable and Other Liabilities | 85 | (6) | ||||||||||
Accrued Interest Payable | (107) | (196) | ||||||||||
Derivatives | (9) | 18 | ||||||||||
Other | (175) | (259) | ||||||||||
Net Change from Loans and Investments in Housing Programs | 779 | (180) | ||||||||||
Net Change in NHA MBS Loans and Receivables | 710 | (1,691) | ||||||||||
Repayments of Capital Market Borrowings | 12 | (300) | (933) | |||||||||
Borrowings from the Government of Canada: | 12 | |||||||||||
Issuances | 2,591 | 3,928 | ||||||||||
Repayments | (5,820) | (6,494) | ||||||||||
Canada Mortgage Bonds: | 12 | |||||||||||
Issuances | 39,943 | 41,515 | ||||||||||
Repayments | (37,700) | (36,025) | ||||||||||
| 1,137 | 1,265 | |||||||||||
CASH FLOWS PROVIDED BY (USED IN) INVESTING ACTIVITIES | ||||||||||||
Investment Securities: | ||||||||||||
Sales and Maturities | 16,808 | 17,555 | ||||||||||
Purchases | (18,216) | (18,616) | ||||||||||
Change in Securities Purchased Under Resale Agreements | (63) | - | ||||||||||
| (1,471) | (1,061) | |||||||||||
CASH FLOWS PROVIDED BY (USED IN) FINANCING ACTIVITIES | ||||||||||||
Change in Securities Sold Under Repurchase Agreements | 153 | 212 | ||||||||||
| 153 | 212 | |||||||||||
Increase (Decrease) in Cash and Cash Equivalents | (181) | 416 | ||||||||||
Cash and Cash Equivalents | ||||||||||||
Beginning of Year | 1,401 | 985 | ||||||||||
End of Year | 1,220 | 1,401 | ||||||||||
Represented by: | ||||||||||||
Cash | (6) | (60) | ||||||||||
Cash Equivalents | 1,226 | 1,461 | ||||||||||
| 1,220 | 1,401 | |||||||||||
Supplementary Disclosure of Cash Flow from Operating Activities | ||||||||||||
Amount of Interest Received During the Year | 9,016 | 9,331 | ||||||||||
Amount of Interest Paid During the Year | 8,491 | 9,228 | ||||||||||
Amount of Dividends Received During the Year | 96 | 84 | ||||||||||
Amount of Income Taxes Paid During the Year | 698 | 696 | ||||||||||
The accompanying notes to these Consolidated Financial Statements are an integral part of these statements.
| (1) | Certain comparative figures have been reclassified to improve presentation of CMHC’s operating and investing activities. |
105
NOTES TO CONSOLIDATED FINANCIAL STATEMENTS
Year Ended 31 December 2012
| 1. | CORPORATE MANDATE |
These Consolidated Financial Statements include the accounts of Canada Mortgage and Housing Corporation (CMHC) and Canada Housing Trust (CHT), a special purpose entity. Within the Public Accounts of Canada, the annual Consolidated Net Income reduces the Government’s annual deficit; the Consolidated Retained Earnings and Accumulated Other Comprehensive Income reduce the Government’s accumulated deficit.
CMHC was established in Canada as a Crown Corporation in 1946 by the Canada Mortgage and Housing Corporation Act (the “CMHC Act”) to carry out the provisions of the National Housing Act (the “NHA”). It is also subject to Part X of the Financial Administration Act (the “FAA”) by virtue of being listed in Part 1 of Schedule III, is wholly owned by the Government of Canada, and is an agent Crown Corporation.
In September 2008, CMHC, together with a number of other Crown Corporations, was issued a directive (P.C. 2008-1598) pursuant to Section 89 of the FAA requiring due consideration by CMHC to the personal integrity of those to whom it lends or provides benefits. The Corporation continues to meet the requirements of Section 89(6) of the FAA.
CMHC’s mandate is to promote the construction, repair, and modernization of housing; to promote the improvement of housing and living conditions, housing affordability, and choice; to promote the availability of low-cost financing for housing: to promote the national well-being of the housing sector, and in addition and with respect to activities related to mortgage loan insurance and guarantee programs and in administering the Canadian covered bond legal framework, to promote the efficient functioning and competitiveness of the housing finance market, and to promote and contribute to the stability of the financial system, including the housing market, with due regard to the Corporation’s exposure to loss. The mandate is carried out through the following four activities:
Mortgage Loan Insurance: CMHC provides mortgage insurance against borrower default on residential mortgages.
Securitization: CMHC guarantees the timely payment of principal and interest for investors in securities based on insured mortgages. The CMHC guarantee is a direct and unconditional obligation of CMHC as an agent of Canada. It carries the full faith and credit of Canada, and constitutes a direct and unconditional obligation of and by the Government of Canada.
Housing Programs: CMHC receives Parliamentary appropriations to fund housing programs.
Lending: CMHC makes loans and investments in housing programs that are funded by borrowings from the Government of Canada and from the capital markets. A significant number of these loans and investments are supported with housing program payments.
Canada Housing Trust was established in 2001 as a special-purpose trust, separate from CMHC. The assets and liabilities of CHT are neither owned by nor held for the benefit of CMHC. CHT’s functions are limited to the acquisition of interests in eligible housing loans such as NHA Mortgage-Backed Securities (NHA MBS), the issuance of Canada Mortgage Bonds (CMB), as well as the purchase of highly rated investments and certain related financial hedging activities. The CMB are guaranteed by CMHC under its Securitization Activity. The beneficiaries of the Trust, after payment of all obligations, are one or more charitable organizations.
106 C A N A D A M O R T G A G E A N D H O U S I N G C O R P O R A T I O N
| 2. | SIGNIFICANT ACCOUNTING POLICIES |
These Consolidated Financial Statements have been prepared in accordance with International Financial Reporting Standards (IFRS) effective as at 31 December 2012 as issued by the International Accounting Standards Board, with the exception of the amendments to IAS 1 Presentation of Financial Statements.
The consolidated entity (Corporation) elected to early adopt the amendments to IAS 1 in advance of the effective date (annual period beginning on or after 1 July 2012). The amendments require the components of Other Comprehensive Income be presented in two categories: items being reclassified to Net Income in subsequent periods and items that will not be reclassified to Net Income. The new requirements have been applied retrospectively. Other than these presentation changes, the application of the amendments to IAS 1 does not result in any impact on Net Income or Other Comprehensive Income.
Functional Currency
These Consolidated Financial Statements are stated in millions of Canadian dollars, except where otherwise indicated, which is the Corporation’s functional currency.
The significant accounting policies used in the preparation of these Consolidated Financial Statements are summarized below:
Basis of Presentation
These Consolidated Financial Statements include the accounts of CMHC and, as required by Standing Interpretation Committee Interpretation 12: Consolidation - Special Purpose Entities (SIC-12), the accounts of CHT, a special purpose entity to which CMHC has exposure to its risks and rewards. The Nordea International Equity Fund (Nordea) is consolidated as required by IAS 27: Consolidated and separate financial statements on the basis that CMHC controls the fund and is included in the investment portfolio within the Mortgage Loan Insurance Activity.
Inter-entity balances and transactions have been eliminated in these Consolidated Financial Statements.
These Consolidated Financial Statements have been prepared on a going concern basis using a historical cost basis except for the following material items in the Consolidated Balance Sheet:
| ¡ | Fair Value through Profit or Loss (“FVTPL”) financial assets and liabilities are measured at fair value as are Available for Sale (“AFS”) financial assets; |
| ¡ | Investment Property is measured at fair value; and |
| ¡ | Defined benefit liabilities for post-employment benefit plans are recognized at the present value of the defined benefit obligations, offset by the fair value of plan assets. |
Financial Instruments
The Corporation classifies its financial assets in the following categories: Financial Assets at Fair Value through Profit or Loss, Available for Sale, Loans and Receivables, and Held to Maturity. Two classifications are used for financial liabilities: Financial Liabilities at Fair Value through Profit or Loss and Other Financial Liabilities.
The Corporation further categorizes financial instruments at Fair Value through Profit or Loss as either Held for Trading or Designated at Fair Value through Profit or Loss (refer to Note 17 for further information).
107
The classification is determined by Management at initial recognition based on its intent and the characteristics of the financial instrument.
| Classification | Accounting Treatment | |
Designated at Fair Value through Profit or Loss |
International Accounting Standards (IAS) 39 Financial Instruments: Recognition and Measurement provides an entity the option of classifying a financial instrument as Designated at Fair Value through Profit or Loss when doing so results in more relevant information because either:
a) it eliminates or significantly reduces a measurement or recognition inconsistency that would otherwise arise from measuring the assets or liabilities or recognizing the gains or losses on them on different bases; or
b) the financial instrument belongs to a group managed and evaluated on a fair value basis in accordance with documented risk management or investment strategies and information about the group is provided internally to Key Management Personnel.
This designation is irrevocable.
Financial Instruments Designated at Fair Value through Profit or Loss are initially recognized at fair value. They are subsequently measured at fair value. Unrealized gains and losses arising from changes in fair value are recorded in Net Unrealized Gains (Losses) from Financial Instruments. Gains and losses realized on disposition are recorded in Net Realized Gains (Losses) from Financial Instruments. Transaction costs are expensed as incurred.
| |
Held for Trading (HFT) |
HFT financial instruments are either derivatives or financial instruments acquired or incurred principally for the purpose of selling or repurchasing in the near term.
HFT financial instruments are initially recognized at fair value. They are subsequently measured at fair value. Unrealized gains and losses arising from changes in fair value are recorded in Net Unrealized Gains (Losses) from Financial Instruments. Gains and losses realized on disposition are recorded in Net Realized Gains (Losses) from Financial Instruments. Transaction costs are expensed as incurred.
| |
Available for Sale (AFS) |
AFS financial assets are non-derivative financial assets which are designated as such, or which have not been designated in any other classification.
AFS financial assets are initially recognized at fair value plus transaction costs. They are subsequently measured at fair value. Unrealized gains and losses arising from changes in fair value are recorded in Other Comprehensive Income (OCI) until the financial asset is sold, derecognized, or determined to be impaired at which time they are transferred to the Statement of Income and reported in Net Realized Gains (Losses) from Financial Instruments.
Accumulated Other Comprehensive Income (AOCI) consists only of unrealized gains and losses for AFS financial instruments.
| |
Loans and Receivables |
Loans and Receivables are non-derivative financial assets with fixed or determinable payments that are not quoted in an active market except for those that Management has classified as Designated at Fair Value through Profit or Loss. Loans and Receivables are initially recognized at fair value plus transaction costs. They are subsequently measured at amortized cost using the effective interest method. When Loans and Receivables are determined to be impaired, the changes in their estimated realizable value are recorded in Net Income.
| |
Held to Maturity (HTM) |
HTM financial assets are non-derivative financial assets with fixed or determinable payments and a fixed maturity, other than Loans and Receivables, that Management has the positive intention and ability to hold to maturity.
HTM financial assets are initially recognized at fair value plus transaction costs. They are subsequently measured at amortized cost using the effective interest method. Gains and losses arising from changes in fair value on HTM financial assets that are determined to be impaired are recorded in Net Realized Gains (Losses) from Financial Instruments with interest income recorded until they are determined to be impaired. Impairment charges and reversals of impairment charges are recorded in Net Realized Gains (Losses) from Financial Instruments.
| |
Other Financial Liabilities |
Other Financial Liabilities are non-derivative financial liabilities which have not been Designated at Fair Value.
Other Financial Liabilities are initially recognized at fair value plus transaction costs. They are subsequently measured at amortized cost using the effective interest method with interest expense recorded in Interest Expense.
|
Settlement date accounting is used for purchases and sales of financial assets and financial liabilities. Realized gains and losses on sales are recognized on a weighted average cost basis.
108 C A N A D A M O R T G A G E A N D H O U S I N G C O R P O R A T I O N
Impairment of Financial Instruments
Management assesses at each Consolidated Balance Sheet date whether there is objective evidence that financial assets are impaired. A financial asset is considered impaired and impairment losses are incurred if, and only if, there is objective evidence of impairment as a result of one or more events that occurred after the initial recognition of the asset and that loss event(s) has an impact on the estimated future cash flows of the asset that can be reliably estimated.
As part of its assessment, Management performs a review for any objective evidence of impairment, which includes observable data indicating significant financial difficulty of the issuer, defaults or delinquencies in the payment of interest or principal, the disappearance of an active market for the financial asset because of the issuer’s financial difficulties, and bankruptcy or other financial reorganization of the issuer. Credit rating downgrades are considered in the Corporation’s assessment, although they alone might not represent objective evidence of impairment.
AFS Equity Investment Securities: For equity Investment Securities classified as AFS, objective evidence of impairment also includes if there has been a significant or prolonged decline in fair value below cost, or if significant adverse changes have taken place in the technological, market, economic or legal environment in which the issuer operates. In determining whether a decline in fair value below cost is significant or prolonged, the Corporation applies certain quantitative tests to its total position in each equity security.
For equity Investment Securities classified as AFS that are identified as impaired, the cumulative unrealized loss previously recorded in OCI is reclassified from OCI and recognized as an impairment loss in Net Income for the period through Net Realized Gains (Losses) from Financial Instruments. Further declines in the fair value of impaired AFS equity instruments are recognized in Net Income, while increases in fair value are recorded in OCI.
AFS Debt Investment Securities: For debt Investment Securities classified as AFS that are identified as impaired, the cumulative unrealized loss previously recorded in OCI is reclassified from OCI and recognized as an impairment loss in Net Income for the period through Net Realized Gains (Losses) from Financial Instruments. If the fair value of an impaired debt instrument classified as AFS subsequently increases and the increase can be related objectively to an event occurring after the impairment loss was recognized, the impairment loss is reversed in Net Income, with the reversal limited in amount to the previously recognized impairment loss. Otherwise, subsequent increases in fair value are recorded in OCI.
Loans and Receivables and HTM Financial Assets: For financial assets classified as Loans and Receivables or HTM that are identified as impaired, the carrying amount is reduced to the present value of estimated future cash flows (excluding future credit losses not yet incurred) discounted at the original effective interest rate, with the impairment loss being recorded in Net Income through Net Realized Gains (Losses) from Financial Instruments. Previously recognized impairment losses can be reversed if the loss decreases and the decrease can be related objectively to an event occurring after the impairment was recognized. Impairment losses can be reversed to the extent that the carrying amount of the financial asset does not exceed what the amortized cost would have been had the impairment not occurred.
Cash and Cash Equivalents
Cash and Cash Equivalents are comprised of cash and short-term highly liquid investments with a term to maturity of 98 days or less from the date of acquisition that are readily convertible to known amounts of cash and which are subject to an insignificant risk of change in value. Cash Equivalents funded by Securities Sold Under Repurchase Agreements are classified as HTM. Otherwise, Cash Equivalents in the Lending Activity are Designated at Fair Value and those in the Mortgage Loan Insurance and Securitization Activities are classified as AFS. Cash Equivalents must have a minimum credit rating of R-1 (Low) or equivalent as determined by S&P, Moody’s or DBRS at the time they are purchased. Interest income on these investments is recorded in Income from Investment Securities.
109
Investment Securities
Investment Securities in the Lending Activity are comprised of fixed income securities and are Designated at Fair Value through Profit or Loss. Investment Securities in the Mortgage Loan Insurance Activity are comprised of fixed income and equity securities and are classified as AFS, HFT or Designated at Fair Value through Profit or Loss. The Securitization Activity holds fixed income Investment Securities classified as AFS or Designated at Fair value through Profit and Loss. Interest income on fixed income investments is recorded in Income from Investment Securities using the effective interest method. Dividend income on equity investments is recorded in Income from Investment Securities when the right to the dividend is established.
Securities Purchased Under Resale Agreements and Sold Under Repurchase Agreements
Securities Purchased Under Resale Agreements (Reverse Repurchase Agreements) consist of the purchase of securities, typically Government treasury bills or bonds, with the commitment to resell the securities to the original seller at a specified price and future date in the near term. They are treated as collateralized lending transactions and are classified as Loans and Receivables.
Securities Sold Under Repurchase Agreements (Repurchase Agreements) consist of the sale of securities with the commitment to repurchase the securities from the original buyer at a specified price and future date in the near term.
They are classified as Other Financial Liabilities. Proceeds received from Securities Sold Under Repurchase Agreements are generally invested in Securities Purchased Under Resale Agreements or Cash Equivalents for the purpose of generating additional income. These transactions are entered into simultaneously with matching terms to maturity.
The associated interest earned and interest expenses are recorded in Income from Investment Securities and Interest Expense, respectively.
Investment in NHA Mortgage-Backed Securities – Loans and Receivables
Investment in NHA Mortgage-Backed Securities – Loans and Receivables represents the transfer of NHA MBS securities issued by Canadian financial institutions (Issuers) to CMHC under the Insured Mortgage Purchase Program (IMPP) or to CHT, under the CMB program, where substantially all of the risks and rewards of the transferred NHA MBS are retained by the issuers through swap agreements with CMHC or CHT. Although these securities legally represent an undivided interest in a pool of residential mortgages insured under the NHA and are backed by a timely payment guarantee by CMHC, the transfer is accounted for as a financing transaction by the Corporation.
As a result, the Corporation accounts for the transfers as secured financing, Investment in NHA Mortgage-Backed Securities – Loans and Receivables, collateralized by the NHA MBS and associated high quality reinvestment securities. The NHA MBS, reinvestment assets, and swaps are not recognized on the Corporation’s Consolidated Balance Sheet. The collateral is, however, held in the name of CMHC or CHT and represents the sole source of principal repayments for the Investments in NHA Mortgage-Backed Securities – Loans and Receivables. The amounts due from the swap counterparties represent the interest earned on Investment in NHA Mortgage-Backed Securities – Loans and Receivables.
Loans
Designated at Fair Value through Profit or Loss: Loans that are part of portfolios which are economically hedged are Designated at Fair Value through Profit or Loss.
Other: Loans are classified as Loans and Receivables. Where loans contain forgiveness clauses, they are recorded net of the forgiveness that is reimbursed through Parliamentary appropriations when the loans are advanced.
110 C A N A D A M O R T G A G E A N D H O U S I N G C O R P O R A T I O N
Interest income is recognized using the effective interest method in Interest Earned on Loans and Investments in Housing Programs.
CMHC is reimbursed through Parliamentary appropriations for interest rate losses resulting from certain loans for housing programs containing interest rate clauses that are lower than the associated interest cost on the related borrowings. These loans were issued from 1946 to 1984 through provisions of the National Housing Act. Parliamentary appropriations are voted on an annual basis by Parliament and CMHC has over a 30 year history of past collection of interest losses through appropriations. CMHC measures these loans at amortized cost which assumes the continued receipt of appropriations going forward. If the appropriations are not received in a future year, the valuation of these loans would change.
Investments in Housing Programs:
The following categories are included in Investments in Housing Programs.
Loans: Loans under Investments in Housing Programs represent loans made under various pre-1996 housing programs that were transferred to the Provinces/Territories under the Social Housing Agreements (SHAs). For some housing programs, the Provinces/Territories are gradually acquiring CMHC’s interest in the housing portfolio by making payments to CMHC. Loans under Investments in Housing Programs are classified as Loans and Receivables. Interest income on these loans is recorded in Interest Earned on Loans and Investments in Housing Programs on an accrual basis using the effective interest method.
Investments: Investments under Investments in Housing Programs represent CMHC’s ownership interest in various housing projects, mostly made under Federal-Provincial Agreements, which are treated as Property, Plant and Equipment and carried at net book value. Amortization is calculated on a declining balance method over the life of the investment, which best represents the agreed term over which these projects will be used to render the program services. CMHC’s portion of the amortization, net operating losses and disposal losses are reimbursed through Parliamentary appropriations.
Derivatives
The Corporation enters into derivatives such as interest rate swaps, interest rate futures and equity index futures in order to manage its exposures to market risks. Derivatives are not used for speculative purposes.
Derivatives are classified as HFT as they have not been designated as eligible hedges for accounting purposes and are carried at fair value on the Consolidated Balance Sheet. Derivatives with a positive fair value are reported as assets, while derivatives with a negative fair value are reported as liabilities.
The Corporation does not have derivatives embedded in other financial instruments (host contracts) which require separation.
The net of interest income and expense is recorded in Interest Expense as earned and incurred.
Mortgage Loan Insurance
Product Classification: CMHC classifies its mortgage loan insurance as an insurance contract where the lender faces uncertainty with regard to potential borrower default on a mortgage and therefore pays a premium to transfer the risk to CMHC. If the borrower defaults, the claim is significantly larger than the actual premium. Such contracts remain insurance contracts until the underlying insured mortgages are fully repaid and are measured in accordance with IFRS 4, Insurance Contracts.
Premium Revenue: Mortgage loan insurance premiums are due at the inception of the mortgage being insured at which time they are deferred (unearned premiums) and recognized as income over the period covered by the insurance contract using factors determined by the Appointed Actuary. These factors reflect the long-term pattern for default risk of the underlying mortgages.
111
Unearned Premiums: Unearned Premiums represent the unexpired portion of the policy premiums at the Consolidated Balance Sheet date and therefore relate to claims that may occur from the Consolidated Balance Sheet date to the termination of the insurance policies. Annually, the Appointed Actuary compares the unearned premiums to an estimate of total future claims on a discounted basis to ensure the amount is sufficient. Should such amount not be sufficient, a provision for premium deficiency is recorded.
Provision for Claims: The Provision for Claims represents an estimate for expected claims and the related settlement expenses, net of the related expected property sale proceeds, for defaults from the mortgage insurance business that have occurred on or before the Consolidated Balance Sheet date. The provision takes into consideration the estimate of the expected ultimate cost of claims reported but not paid and claims Incurred But Not Reported (IBNR) at the Consolidated Balance Sheet date, the time value of money, and in accordance with accepted actuarial practice, includes an explicit provision for adverse deviation. The estimate of IBNR is generally subject to a greater degree of uncertainty than that for reported claims.
Insurance Policy Liability Adequacy: Liability adequacy tests are performed annually as part of the Actuarial Valuation to ensure the adequacy of insurance policy liabilities net of Deferred Acquisition Costs (DAC) assets with respect to the Provision for Claims and Unearned Premiums. Current best estimates of future contractual cash flows, claims handling and administration costs, and investment returns from the assets backing the liabilities are taken into account in the tests. Where a deficiency is highlighted by the test, DAC assets are written off first, and insurance liabilities are increased when the DAC assets are written off in full. Any premium deficiency is immediately recognized in Net Income. The liability adequacy test for the Corporation has identified that no provision for premium deficiency is required.
The process of determining the provision necessarily involves risks that the actual results will deviate, perhaps significantly, from the estimates made.
The loss on actual mortgage defaults and the change in the estimated Provision for Claims are recorded in Net Claims in the year in which they occur.
The provision for Social Housing Mortgages and Index Linked Mortgages (ILM) is based on the assumptions that the cumulative premiums received and related investment income will be sufficient to meet future claim payouts. Due to the uniqueness of these programs, their provision is established as the fund balance plus a margin for adverse deviation.
Fees: Application fees that are designed to recover part or all acquisition costs associated with issuing mortgage loan insurance policies are deferred and amortized on the same basis as the related premiums.
Deferred Acquisition Costs: A portion of acquisition costs relating to the Unearned Premiums is deferred and amortized over the estimated lives of the relevant contracts.
Net Estimated Borrower Recoveries: CMHC estimates the net borrower recoveries related to claims paid, based on historical data in accordance with Canadian accepted actuarial practice. Changes to the estimated borrower recovery balance are recorded in Net Claims in the year in which they are determined. Net Estimated Borrower Recoveries are included in Accounts Receivable and Other Assets.
Non-Current Assets Held for Sale
Real estate acquired by the Mortgage Loan Insurance Activity through loan default is classified as Non-Current Assets Held for Sale when its carrying amount will be recovered principally through a sale transaction rather than through continuing use. The criteria for Held for Sale classification includes Management’s commitment to a plan to sell the selected assets and the expectation that such a sale will be completed within a 12 month period. Events or circumstances beyond the entity’s control may extend the period to complete the sale beyond one year. Such assets continue to be classified as Held for Sale as Management remains committed to its plan to sell the asset. Non-Current Assets Held for Sale are measured at the lower of their carrying amount and their fair value less cost to sell. Impairment losses and any subsequent reversals are recognized in Net Claims in the period in which they occur. Non-Current Assets Held for Sale are not depreciated.
112 C A N A D A M O R T G A G E A N D H O U S I N G C O R P O R A T I O N
Timely Payment Guarantees
Classification: Financial guarantee contracts are defined as those that require the issuer to make specified payments to reimburse the holder for a loss it incurs because a specified debtor fails to make payment when due. CMHC classifies its timely payment guarantee for NHA MBS and CMB as a financial guarantee contract. Such contracts remain financial guarantee contracts until all rights and obligations are extinguished or expire and are measured in accordance with IAS 39 Financial Instruments: Recognition and Measurement.
Recognition and Measurement: Timely payment guarantee fees are initially recognized in Unearned Premiums and Fees at fair value (the premium received) plus transaction costs. Subsequently, they are measured at the amount initially recognized less the amortization of guarantee fee revenue. Should the estimated amount required to settle the timely payment guarantee obligations exceed this amount, a provision is recognized.
Application and Compensatory fees are recognized as revenues in the period where the related services are rendered. Direct costs associated with issuing timely payment guarantees are recognized in Operating Expenses as incurred.
Income Taxes
CMHC is a prescribed federal Crown Corporation under Reg. 7100 of the Income Tax Act (ITA) and is subject to federal income tax as a prescribed Corporation for purposes of subsection 27(2) of the ITA. It is not subject to provincial income tax. CHT is subject to federal and provincial income taxes on the amount of taxable income for the period and is permitted a deduction for all amounts paid or payable to CHT’s beneficiaries in determining income for tax purposes. As all taxable income was distributed to the beneficiaries, no provision for income taxes has been reflected for CHT in these Consolidated Financial Statements. Nordea is a mutual fund trust pursuant to subsection 132(6) of the ITA. Nordea is subject to income tax on Net Income and net realized capital gains that are not paid or payable to unitholders at the end of the taxation year. Nordea is required to distribute all net taxable income and sufficient realized capital gains to unitholders so that it is not subject to income tax. Accordingly, no provision for income taxes is included in the Consolidated Financial Statements in respect of Nordea.
The Corporation uses the liability method of accounting for income taxes. Under this method, Deferred Income Tax Assets and Liabilities are recognized based on the estimated tax effect of temporary differences between the carrying value of assets and liabilities on the financial statements and their respective tax bases. The Corporation uses substantively enacted income tax rates at the Consolidated Balance Sheet date that are expected to be in effect when the asset is realized or the liability is settled. The carrying amount of Deferred Income Tax Assets is reviewed at each reporting date and reduced to the extent that it is no longer probable that sufficient taxable profit will be available to allow all or part of the Deferred Income Tax Asset to be utilized.
Canada Mortgage Bonds
CMB, which are issued by CHT and guaranteed by CMHC, are interest-bearing bullet bonds. Coupon interest payments are made semi-annually for fixed rate CMB and quarterly for floating rate CMB. Principal repayments on the bonds are made at the end of the term. CMB are classified as Other Financial Liabilities. The Approved MBS Sellers reimburse CHT for the cost of arranging financing, including the fees paid to CMHC as Guarantor and Financial Services Advisor, underwriters and others for the distribution of CMB. These reimbursements are recognized in Other Income on the same basis as the related expenses.
CMHC may purchase and resell CMB in the market for investment purposes. These purchases are treated as retirements of debt, with the difference between the purchase price and the carrying value of the CMB being recognized as a gain or loss in income. Subsequent sales are treated as re-issuance of the debt, with gains and losses deferred and amortized over the remaining life of the CMB sold.
113
Capital Market Borrowings
Borrowings from the Capital Markets represent borrowings incurred between 1993 and April 2008. These borrowings are Designated at Fair Value through Profit or Loss.
Borrowings from the Government of Canada
Borrowings Designated at Fair Value through Profit or Loss: Since April 2008, the Lending Activity has been borrowing under terms of the Crown Borrowing Agreement. These borrowings, excluding those relating to the Municipal Infrastructure Lending Program (MILP), are Designated at Fair Value through Profit or Loss. Expenses related to these borrowings are recognized in Interest Expense in the year incurred.
Other Government of Canada Borrowings: Other Government of Canada Borrowings represent borrowings incurred prior to 1993 in the Lending Activity as well as those under the terms of the Crown Borrowing Agreement relating to the MILP and the IMPP which are included in the Lending Activity and Securitization Activity, respectively. They are classified as Other Financial Liabilities.
Housing Programs
Parliamentary appropriations for Housing Programs, and the related expenses, are recorded on an accrual basis. They are recognized in the year in which the related expenses are incurred. Appropriations and related expenses are presented in the Consolidated Statement of Income and Comprehensive Income as Housing Programs revenues and expenses, respectively. Those expenses incurred but not yet reimbursed are recorded in the Consolidated Balance Sheet as Due from the Government of Canada.
Post-employment Benefits
CMHC provides a defined benefit pension plan that is registered under federal legislation, supplemental pension plans, and other post-employment benefits consisting mainly of severance pay, life insurance and medical insurance.
Pension benefits are based on length of service and average earnings of the best five-year period as classified under defined benefit pension arrangements. The pension benefits are adjusted annually on 1 January by a percentage equivalent to the total average change in the Consumer Price Index over the 12-month period ending 30 September. The defined benefit plan asset or liability recognized is the present value of the obligations under the plans, less unamortized past service costs, and plan assets. Defined benefit plan assets are limited to the total of unamortized past service costs and the present value of any economic benefits available in the form of reductions in future contributions to the plan.
Net benefit plan costs are the current service cost, interest cost on the defined benefit obligation, the amortization of deferred past service costs, and the expected investment return on plan assets. These costs are recognized in Operating Expenses. Actuarial gains and losses are recognized in Other Comprehensive Income as incurred, and flow into Retained Earnings on the Consolidated Balance Sheet.
Past service costs are deferred and amortized on a straight-line basis over the average period until the benefits become vested. To the extent that the benefits are already vested following the introduction of, or changes to, a defined benefit plan, the past service costs are recognized immediately.
Investment Property
Investment properties, which are included in Accounts Receivable and Other Assets, are properties held to earn rental income or for capital appreciation, or both. Investment properties are initially recognized at cost plus transactions costs. Subsequent to initial recognition, they are measured at fair value. Fair value is determined based on valuations performed by independent and internal property appraisers who hold
114 C A N A D A M O R T G A G E A N D H O U S I N G C O R P O R A T I O N
recognized and relevant professional qualifications. Gains or losses arising from changes in fair value are recognized in Net Income in the period in which they arise. Investment property rental income and expenses are recorded in Other Income. For certain investment properties, expenses are recoverable from the Minister and these are recorded in Housing Programs appropriations.
Related Party Transactions
Related party transactions are recorded according to the relevant IFRS standard applicable to the transaction.
Foreign Currency Translations
Monetary assets and liabilities denominated in foreign currencies are translated into Canadian dollars at exchange rates prevailing at the Consolidated Balance Sheet date. Exchange gains and losses resulting from the translation of foreign denominated balances are included in Net Unrealized Gains (Losses). Purchases and sales of foreign securities and the related income are translated into Canadian dollars at the exchange rates prevailing on the respective dates of the transactions.
Contingent Liabilities
Contingent liabilities are possible obligations whose existence will be confirmed only by uncertain future events or present obligations where the transfer of economic benefit is uncertain or cannot be reliably measured. Contingent liabilities are not recognized but are disclosed in Note 25.
Lease Transactions
Leases are classified as either operating or finance, based on the substance of the transaction at inception of the lease. Classification is re-assessed if the terms of the lease are changed.
CMHC as Lessor: Leases whereby a significant portion of the risks and rewards of ownership are retained by CMHC are classified as operating leases. The leased assets are included within Property, Plant and Equipment or Investment Property (included in Accounts Receivable and Other Assets on the Consolidated Balance Sheet) and depreciation is provided on the depreciable amount of these assets on a systematic basis over their estimated useful lives. Lease income is recognized on a straight-line basis over the period of the lease unless another systematic basis is more appropriate.
CMHC as Lessee: Leases whereby substantially all the risks and rewards of ownership are transferred to CMHC are classified as finance leases. Assets meeting finance lease criteria are capitalized at the lower of the present value of the related lease payments or the fair value of the leased asset at the inception of the lease. Minimum lease payments are apportioned between the finance charge and the liability.
Leases which do not transfer substantially all the risks and rewards of ownership to CMHC are classified as operating leases. Payments under an operating lease are recognized in Net Income on a straight-line basis over the lease term.
| 3. | FUTURE ACCOUNTING CHANGES |
CMHC has identified the new standards and amendments to existing standards that have been issued by the IASB but are not yet effective on the date of issuance of these Consolidated Financial Statements. The following pronouncements have been determined to potentially have an impact on the Corporation’s results and Consolidated Financial Statements in the future. No additional standards have been issued that impact CMHC except for those disclosed in its Consolidated Financial Statements for the year ended 31 December 2012.
115
Effective Date of 1 January 2013
| ¡ | On 16 December 2011, the IASB issued amendments to IFRS 7 Financial Instruments: Disclosures that provide new disclosure requirements in netting arrangements to enable users of the financial statements to better compare financial statements prepared in accordance with IFRS and US GAAP. The Corporation has determined that these amendments will require adjustments to its Notes to the Consolidated Financial Statements in order to meet the new requirements under IFRS 7 for netting arrangements. |
| ¡ | On 13 May 2011, the IASB issued IFRS 10 Consolidated Financial Statements to replace IAS 27 Consolidated and Separate Financial Statements and SIC-12 Consolidation – Special Purpose Entities. IFRS 10 provides a single consolidation model that identifies control as the basis for consolidation. On 28 June 2012, the IASB issued amendments to IFRS 10 that clarify the transition guidance and also provide additional transition relief. As the Corporation’s current accounting and consolidation practices are compliant under IFRS 10 consolidation guidelines, it does not expect that the new or amended standard will have a material impact on its Consolidated Financial Statements. |
| ¡ | On 13 May 2011, the IASB issued IFRS 11 Joint Arrangements to replace IAS 31 Interests in Joint Ventures and SIC-13 Jointly Controlled Entities-Non-Monetary Contributions by Venturers. IFRS 11 establishes principles for the financial reporting of joint arrangements. On 28 June 2012, the IASB issued amendments to IFRS 11 that clarify the transition guidance and also provide additional transition relief. The Corporation does not expect that this new or amended standard will have a material impact on its Consolidated Financial Statements. |
| ¡ | On 13 May 2011, the IASB issued IFRS 12 Disclosure of Interests in Other Entities which combines, enhances and replaces the disclosure requirements for subsidiaries, joint arrangements, associates and unconsolidated structured entities. On 28 June 2012, the IASB issued amendments to IFRS 12 that clarify the transition guidance and also provide additional transition relief. The Corporation has determined that this new standard and amendments will require adjustments to its Notes to the Consolidated Financial Statements in order to meet the new requirements under IFRS 12 for unconsolidated structured entities. |
| ¡ | On 13 May 2011, the IASB issued IFRS 13 Fair Value Measurement. IFRS 13 defines fair value, sets out a single framework for measuring fair value, and requires disclosures about fair value measurements. While IFRS 13 does not introduce any new requirements, it reduces complexity and improves consistency by clarifying the definition of fair value and requiring its application to all fair value measurements. CMHC currently follows the IFRS 13 principles for determining fair value on most of its financial instruments, except for certain rent-producing real estate properties under the Lending Activity. These properties are fair valued based on the present value of expected future cash flows using a discount rate reflective of the characteristics of the property. Upon adoption of this new standard, all of CMHC’s real estate properties will be required to be valued at their highest and best use values resulting in a potential increase in fair value of the properties as well as an increase to CMHC’s Net Income. CMHC also anticipates enhanced disclosure requirements relating to fair value measurement information. |
116 C A N A D A M O R T G A G E A N D H O U S I N G C O R P O R A T I O N
| ¡ | On 16 June 2011, the IASB issued amendments to IAS 19 Employee Benefits. Amendments to IAS 19 eliminate the “corridor method” and improve the recognition, presentation and disclosure requirements for defined benefit plans. As the Corporation has adopted the change from the corridor method upon implementation of IFRS, this component of the amendment will not affect the Corporation’s Consolidated Financial Statements. The Corporation’s analysis of the other changes indicates that the amendments will result in an overall change in pension expenses reflected in Net Income with a corresponding offset in actuarial gains and losses recognized in Other Comprehensive Income. This change is due to the discount rate being applied to the plan assets to calculate the estimated return by the plan rather than the expected rate of return that was previously allowed. These amendments also include enhanced disclosure requirements. |
Effective Date of 1 January 2014
| ¡ | On 16 December 2011, the IASB issued amendments to IAS 32 Financial Instruments: Presentation to clarify the application of the offsetting requirements. Earlier application is permitted. The Corporation has not yet determined the impact of these amendments on its Consolidated Financial Statements. |
Effective Date of 1 January 2015
| ¡ | On 12 November 2009, the IASB issued IFRS 9 Financial Instruments with further revisions on 28 October 2010 to replace IAS 39 Financial Instruments: Recognition and Measurement. IFRS 9 uses a single approach to determine whether a financial instrument is measured at amortized cost or fair value, based on how an entity manages its financial instruments in the context of its business model and the contractual cash flow characteristics of the financial instrument. In December 2011, the IASB decided to delay the mandatory effective date of IFRS 9 to annual periods beginning on or after 1 January 2015. The Corporation has not yet determined the impact of this new standard on its Consolidated Financial Statements. |
| 4. | CRITICAL JUDGMENTS IN APPLYING ACCOUNTING POLICIES AND MAKING ESTIMATES |
Judgments in Applying Accounting Policies
In the process of applying the Corporation’s accounting policies, Management is required to make various judgments, apart from those involving estimations, that can significantly affect the amounts it recognizes in the Consolidated Financial Statements. The judgments having the most significant effect on the amounts recognized in the Consolidated Financial Statements are:
| ¡ | Consolidation – significant judgments are applied in the assessment of whether the substance of the relationship between CMHC and Canada Housing Trust (a special purpose entity) indicates that, as per SIC-12, CMHC controls that special purpose entity. CMHC guarantees the timely payment of principal and interest on the Canada Mortgage Bonds, which exposes it to the majority of risks of Canada Housing Trust and, as a result, CMHC consolidates the Canada Housing Trust. Significant judgments are also applied in the assessment of whether the substance of the relationship between CMHC and Nordea indicates that CMHC controls it. As CMHC is the principal investor in the fund, Nordea is reliant on CMHC’s continued investment and CMHC, in effect, has the power to govern Nordea’s policies so as to obtain benefits from its activities. As a result, CMHC consolidates Nordea International Equity fund; |
117
| ¡ | Derecognition – in assessing whether transfers of NHA MBS from Issuers to the Corporation under the CMB program (CHT) and IMPP (CMHC) qualify for derecognition, significant judgment is applied in determining whether substantially all the risks and rewards of ownership of the NHA MBS have been transferred. Per IAS 39: Financial Instruments – Recognition and Measurement requirements, CMHC has determined that the sellers of NHA MBS to the Corporation failed the derecognition criteria as they retain the risk and rewards of the NHA MBS through swap agreements; and, |
| ¡ | Impairment of Available for Sale Financial Instruments – significant judgment is applied in assessing if there is objective evidence of impairment, including whether declines in the fair value of AFS equity instruments below cost are significant and/or prolonged. |
Use of Estimates and Assumptions
The preparation of these Consolidated Financial Statements requires Management to make estimates and assumptions. These estimates and assumptions affect the reported amounts of assets, liabilities, comprehensive income and related disclosures. Key areas where Management has made estimates and assumptions include those related to Provision for Claims, Unearned Premiums, Fair Value of Financial Instruments, and Post-employment Benefits. Actual results could differ from these estimates and assumptions. Where these differ, the impact will be recorded in future periods.
Provision for Claims
The Provision for Claims represents an estimate for expected claims and the related settlement expenses, net of the related expected property sale proceeds, for defaults from the mortgage insurance business that have occurred on or before the Consolidated Balance Sheet date. In calculating the estimated liability, an estimate of losses on defaults that have been incurred but not reported is made using historical experience and the time value of money, which considers prevailing legal, economic, social and regulatory trends. See Note 14 for further details.
Unearned Premiums
Mortgage loan insurance premiums are deferred and recognized as revenue over the period covered by the insurance contracts using actuarially determined factors that are reviewed annually as part of the Actuarial Valuation. The premium earning factors are derived from claim occurrence patterns based on the principle that premiums will be earned at the same rate as claims are incurred. See Note 14 for further details.
Financial Instruments
Financial instruments carried at fair value are measured based on quoted market prices observable in the market or amounts derived from cash flow models or other valuation methodologies. The fair value measurement hierarchy described in Note 17 reflects the significance of the inputs used in making these measurements.
Post-employment Benefits
The annual cost of pension and other post-employment benefits earned by employees is actuarially determined using the projected unit credit method prorated on service and Management’s best estimate of expected long-term pension plan investment performance, compensation increases, retirement ages of employees, mortality of members and expected health care costs. These assumptions are of a long-term nature, which is consistent with the nature of post-employment benefits. See Note 21 for further details.
118 C A N A D A M O R T G A G E A N D H O U S I N G C O R P O R A T I O N
| 5. | SECURITIES |
The following table shows the maturity structure and average yield for Investment Securities.
| Remaining Term to Maturity | ||||||||||||||||||||||||
| Within | 1 to 3 | 3 to 5 | Over 5 | |||||||||||||||||||||
| (in millions) | 1Year | Years | Years | Years | 2012 | 2011 | ||||||||||||||||||
Designated at Fair Value | ||||||||||||||||||||||||
Fixed Income | ||||||||||||||||||||||||
Corporate/Other Entities | - | 111 | 152 | - | 263 | 300 | ||||||||||||||||||
Provinces/Municipalities | 55 | 297 | 263 | - | 615 | 603 | ||||||||||||||||||
Sovereign and Related Entities | - | 50 | - | - | 50 | - | ||||||||||||||||||
Total Designated at Fair Value | 55 | 458 | 415 | - | 928 | 903 | ||||||||||||||||||
Yield(1) | 2.28% | 2.60% | 1.86% | - | 2.23% | 2.74% | ||||||||||||||||||
Held for Trading | ||||||||||||||||||||||||
Foreign Equities | 415 | 397 | ||||||||||||||||||||||
Total Held for Trading | 415 | 397 | ||||||||||||||||||||||
Yield(2) | 2.14% | 1.26% | ||||||||||||||||||||||
Available for Sale | ||||||||||||||||||||||||
Fixed Income | ||||||||||||||||||||||||
Corporate/Other Entities | - | 1,006 | 1,268 | 2,707 | 4,981 | 4,896 | ||||||||||||||||||
Government of Canada | 145 | 2,316 | 869 | 1,910 | 5,240 | 3,604 | ||||||||||||||||||
Provinces/Municipalities | 80 | 271 | 453 | 4,767 | 5,571 | 5,469 | ||||||||||||||||||
Sovereign and Related Entities | - | 56 | 10 | 72 | 138 | 196 | ||||||||||||||||||
Total Fixed Income | 225 | 3,649 | 2,600 | 9,456 | 15,930 | 14,165 | ||||||||||||||||||
Yield(1) | 0.99% | 2.14% | 2.81% | 3.75% | 3.14% | 3.54% | ||||||||||||||||||
Equities | ||||||||||||||||||||||||
Canadian Equities | 2,108 | 2,121 | ||||||||||||||||||||||
U.S. Equities | 843 | 858 | ||||||||||||||||||||||
Foreign Equities | 423 | 405 | ||||||||||||||||||||||
Total Equities | 3,374 | 3,384 | ||||||||||||||||||||||
Yield(2) | 2.99% | 2.54% | ||||||||||||||||||||||
Total Available for Sale | 19,304 | 17,549 | ||||||||||||||||||||||
| (1) | Represents the weighted-average yield, which is determined by applying the weighted-average of the effective yields of individual securities. |
| (2) | Represents the average yield, which is determined by applying the earned dividend amount of equities to the average cost. |
The following table shows the unrealized gains (losses) on Investment Securities recorded at fair value.
| 2012 | 2011 | |||||||||||||||||||||||
| Gross | Gross | |||||||||||||||||||||||
| Amortized | Unrealized | Unrealized | Fair | Amortized | Fair | |||||||||||||||||||
| (in millions) | Cost(1) | Gains | Losses | Value | Cost(1) | Value | ||||||||||||||||||
Investment Securities: | ||||||||||||||||||||||||
Fixed Income | ||||||||||||||||||||||||
Designated at Fair Value | 872 | 56 | - | 928 | 861 | 903 | ||||||||||||||||||
Available for Sale | 14,969 | 966 | (5) | 15,930 | 13,061 | 14,165 | ||||||||||||||||||
Equities | ||||||||||||||||||||||||
Held for Trading | 444 | - | (29) | 415 | 486 | 397 | ||||||||||||||||||
Available for Sale | 2,930 | 473 | (29) | 3,374 | 3,232 | 3,384 | ||||||||||||||||||
| (1) | Amortized cost for Equities is acquisition cost less impairment losses, if any. |
119
CMHC has Investment Securities of $425 million (2011 – $272 million) that are part of Securities Sold Under Repurchase Agreements. The terms of these transactions do not exceed three months (93 days), the credit rating of the instruments must be at a minimum of R-1 (mid) and be issued by a financial institution. CMHC continues to earn interest income and recognizes in OCI changes in fair values on these Investment Securities during the period.
The cumulative unrealized loss from Available for Sale fixed income and equity investments of $34 million (2011 – $156 million) has been recorded in Accumulated Other Comprehensive Income and has not been recognized as an impairment loss in Net Income.
During 2012, $97 million (2011 – $30 million) of impairment losses on Equities was recognized in Net Income through Net Realized Gains (Losses) from Financial Instruments and no reversals of previously realized fixed income investment security impairments occurred during the year.
| 6. | INVESTMENT IN NHA MORTGAGE-BACKED SECURITIES – LOANS AND RECEIVABLES |
Under the IMPP, CMHC purchased insured NHA MBS, through reverse auction, from Canadian financial institutions (Issuers) using funds borrowed from the Government of Canada. With each auction, swap agreements were entered into where CMHC is to pay all interest received on NHA MBS and reinvestment securities, net of its expenses, to swap counterparties and CMHC is to receive payments equal to the interest due on its IMPP-related borrowings.
CHT purchases insured NHA MBS from approved MBS sellers using funds supplied from the issuance of CMB. In addition, interest rate swap agreements are entered into where CHT is to pay all interest received on NHA MBS and reinvestment securities, net of its expenses, to swap counterparties and CHT is to receive payments equal to the interest due on its CMB borrowings.
In order to meet the principal obligations of the associated Government of Canada and CMB borrowings, the principal payments and prepayments from the underlying NHA MBS are held in an account in the name of CMHC or CHT, managed and reinvested in eligible assets by the swap counterparties pursuant to contractual agreements. Eligible assets include Investment Securities, Cash Equivalents and Securities Purchased Under Resale Agreements. Under the terms of certain auctions under the IMPP, CMHC remits directly to the Government of Canada the monthly principal payments and prepayments on the underlying NHA MBS rather than to the swap counterparties for reinvestment.
120 C A N A D A M O R T G A G E A N D H O U S I N G C O R P O R A T I O N
The following table summarizes the maturity structure, based on undiscounted contractual maturities of principal and average yield, for Investment in NHA MBS – Loans and Receivables.
| Remaining Term to Maturity | ||||||||||||||||||||||||
| Within | 1 to 3 | 3 to 5 | Over 5 | |||||||||||||||||||||
| (in millions) | 1 Year | Years | Years | Years | 2012 | 2011 | ||||||||||||||||||
IMPP(1) | ||||||||||||||||||||||||
Investment in NHA MBS – Loans and Receivables | 22,997 | 29,451 | - | - | 52,448 | 55,401 | ||||||||||||||||||
Yield | 3.71% | 2.70% | - | - | 3.14% | 3.09% | ||||||||||||||||||
CHT | ||||||||||||||||||||||||
Investment in NHA MBS – Loans and Receivables | 35,500 | 67,300 | 61,900 | 38,255 | 202,955 | 200,755 | ||||||||||||||||||
Yield | 3.41% | 2.53% | 1.84% | 3.07% | 2.57% | 3.04% | ||||||||||||||||||
Total | 58,497 | 96,751 | 61,900 | 38,255 | 255,403 | 256,156 | ||||||||||||||||||
| (1) | For certain auctions under the IMPP, CMHC receives principal payments, both scheduled and unscheduled, as they occur in the underlying NHA MBS pool. The maturities for these loans are estimated based on assumptions regarding mortgage prepayments (1% annually), liquidations (4% annually) and conversion rates (10% annually) of the underlying MBS. Prepayments and liquidations are mortgage principal repayments that are received sooner than the stated amortization period of the mortgage. Conversion rates refer to the conversion of a variable rate mortgage to a fixed rate mortgage. These are percentage rate assumptions on principal amounts outstanding, determined by CMHC, and based on historical performance/trends. |
| 7. | LOANS |
Loans
CMHC provides loans either independently or jointly with provincial, territorial, and municipal authorities. Loans were issued for terms up to 50 years. The following table presents the contractual maturity profile of these loans.
| 2012 | 2011 | |||||||||||||
| Carrying | Weighted Average | Carrying | ||||||||||||
| (in millions) | Value | Mortgage Rate | Value | |||||||||||
2012 | - | - | 965 | |||||||||||
2013 | 1,149 | 3.35% | 1,200 | |||||||||||
2014 | 820 | 2.75% | 911 | |||||||||||
2015 | 1,325 | 3.36% | 1,471 | |||||||||||
2016 | 1,354 | 2.90% | 1,490 | |||||||||||
2017 | 1,144 | 2.44% | 332 | |||||||||||
2018 and Thereafter | 5,239 | 5.52% | 5,489 | |||||||||||
Total | 11,031 | 4.19% | 11,858 | |||||||||||
Approximately $8,858 million, representing 80% (2011 – $9,544 million, or 80%) of the loans, are supported with housing program payments outlined in Note 9.
A loan is considered past due when a counterparty has not made a payment by the contractual due date. The following table presents the amortized cost of loans that are past due.
| Within | 1 to 3 | Over 3 | ||||||||||||||||||
| (in millions) | 1 Year | Years | Years | 2012 | 2011 | |||||||||||||||
Loans past due | 46 | 11 | 14 | 71 | 77 | |||||||||||||||
121
At 31 December 2012, CMHC is assured full collection of principal and accrued interest on 76% (2011 – 77%) of the loans. The guarantee/insurance on these loans is provided by various sources such as:
| ¡ | Provinces and Territories through provisions in the Social Housing Agreements (2012 – 42% and 2011 – 43%) |
| ¡ | Government of Canada through provisions in the NHA (2012 – 10% and 2011 – 11%) |
| ¡ | Aboriginal Affairs and Northern Development Canada through Ministerial Loan Guarantees (2012 – 12% and 2011 – 11%) |
| ¡ | CMHC’s Mortgage Loan Insurance Activity through provisions for losses on loans underwritten by CMHC’s Mortgage Loan Insurance Activity which is included in the determination of the Provision for Claims and Unearned Premiums (2012 – 12% and 2011 – 12%) |
The remainder of the loans, representing 24% (2011 – 23%), are to Provincial entities and Municipalities and are assessed on a regular basis to determine if a provision for loss is necessary. As at 31 December 2012, no impaired loans have been identified and no provision for loss has been recorded (2011 – nil).
As described in Note 2, CMHC receives interest loss recoveries on certain loans containing interest rate clauses lower than the interest cost on the related borrowings. Of the future cash flows to be received on these loans, approximately 1% (with a fair value of $71 million) will be recovered from the Government of Canada and the remainder will be recovered directly from the borrowers. The following table presents the estimated recoveries on these loans from the Government for the next five years.
| (in millions) | 2013 | 2014 | 2015 | 2016 | 2017 | |||||||||||||||
Interest Loss Recoveries | 11 | 10 | 9 | 9 | 8 | |||||||||||||||
Investments in Housing Programs
The following table presents the contractual maturity profile of Investments in Housing Programs.
| 2012 | 2011 | |||||||||||||
| (in millions) | Carrying Value | Weighted Average Mortgage Rate | Carrying Value | |||||||||||
2012 | - | - | 7 | |||||||||||
2013 | 6 | 9.65% | 14 | |||||||||||
2014 | 14 | 10.76% | 22 | |||||||||||
2015 | 20 | 11.91% | 27 | |||||||||||
2016 | 33 | 12.14% | 41 | |||||||||||
2017 | 26 | 11.28% | 33 | |||||||||||
2018 and Thereafter | 649 | 11.86% | 664 | |||||||||||
Total | 748 | 11.82% | 808 | |||||||||||
All of CMHC’s (2011 – $808 million, or 100%) Investments in Housing Programs are supported with housing program payments outlined in Note 9.
122 C A N A D A M O R T G A G E A N D H O U S I N G C O R P O R A T I O N
At 31 December 2012, CMHC is assured full collection of its loan principal and accrued interest as well as the amortization of its investments. The following table presents the source of these guarantees.
| 2012 | 2011 | |||||||
Loans | ||||||||
Provinces and Territories (provisions in the Social Housing Agreements) | 96% | 96% | ||||||
Investments | ||||||||
Government of Canada (provisions in the NHA) | 4% | 4% | ||||||
| 8. | DERIVATIVES |
Derivatives are financial contracts whose value is derived from movements in one or more underlying securities, rates, indices or other instruments or derivatives. The Corporation uses derivatives (interest rate swaps, interest rate futures and equity index futures) in connection with its risk management activities.
Interest rate swaps are transactions in which two parties exchange interest cash flows on a specified notional amount for a predetermined period based on agreed-upon fixed and floating rates. Notional amounts are not exchanged. The value of these swaps is derived from movements in interest rates. They are used by the Corporation to manage reinvestment risk, refinancing risk, or mismatches in the timing of receipts from assets versus payments of liabilities.
Interest rate and equity index futures are contractual obligations to buy or sell a financial instrument on a future date at a specified price established by an organized financial market. The credit risk is reduced as changes in the futures’ contract value are settled daily. Futures are used to manage asset allocation over the short-term in the Mortgage Loan Insurance and Securitization Activities.
The table below provides the notional amounts of the Corporation’s derivative transactions recognized in the financial statements. Notional amounts, which are off-balance sheet, serve as a point of reference for calculating payments and do not represent the fair value, or the potential gain or loss associated with the credit or market risk of such instruments.
| 2012 | 2011 | |||||||||||||||||||||||||||||
| Fair Value | Fair Value | |||||||||||||||||||||||||||||
| Average | ||||||||||||||||||||||||||||||
| Term to | Notional | Notional | ||||||||||||||||||||||||||||
| (in millions) | Maturity | Amount | Asset | Liability | Amount | Asset | Liability | |||||||||||||||||||||||
Interest Rate Swaps | 3 years | 11,915 | 131 | 46 | 12,262 | 169 | 72 | |||||||||||||||||||||||
123
| 9. | HOUSING PROGRAMS |
CMHC receives Parliamentary appropriations to fund the following program expenditures, including operating expenses, in support of Housing Programs.
| (in millions) | 2012 | 2011 | ||||||
Assisted Housing Programs | 1,569 | 1,547 | ||||||
Housing Repair and Improvement Programs | 41 | 190 | ||||||
On-Reserve Housing Programs | 132 | 167 | ||||||
Affordable Housing Initiative | 328 | 135 | ||||||
Policy, Research and Information Transfer | 4 | 5 | ||||||
Total Housing Programs Expenses | 2,074 | 2,044 | ||||||
Operating Expenses | 123 | 119 | ||||||
Total Appropriations | 2,197 | 2,163 | ||||||
Of the total amount expensed on Housing Programs, $984 million (2011 – $1,006 million) was provided for programs transferred to Provinces/Territories under SHAs. The amount is included under Assisted Housing Programs in the table above. This funding to the Provinces/Territories may become repayable to CMHC if the amounts are not used in accordance with the terms and conditions of the SHAs.
Under the SHAs, the Province/Territory assumes CMHC’s financial and other obligations with respect to these programs in exchange for a pre-determined annual funding. The accountability framework requires the Province/Territory to provide an audited Annual Statement of Funding and Expenditures and an Annual Program Performance Report.
Housing Programs Expenses also include related party transactions between the Government of Canada and CMHC for the reimbursement of:
| ¡ | Interest rate losses resulting from certain loans containing interest rate clauses that are lower than the associated interest cost on the related borrowings; |
| ¡ | Net operating losses on certain investments in housing programs and real estate properties; and |
| ¡ | Net default losses on certain loans and net disposal losses on certain investments in housing programs and real estate properties. |
The following table summarizes the nature of these expenses reimbursed by the Government of Canada.
| (in millions) | 2012 | 2011 | ||||||
Interest Rate Losses | 35 | 59 | ||||||
Net Operating Losses | 1 | 2 | ||||||
Net Default and Disposal Losses | 1 | 1 | ||||||
Total | 37 | 62 | ||||||
There are no reimbursements at 31 December 2012 for interest losses relating to losses incurred by CMHC as a result of prepayment and re-pricing activity (2011 – $20 million).
The reimbursement for interest rate losses is included in Interest Earned on Loans and Investments in Housing Programs. Net operating, default and disposal losses are recorded as Due from the Government of Canada and Housing Program expenses on an accrual basis. The reimbursement of operating costs is shown in the Consolidated Statement of Income and Comprehensive Income as Parliamentary appropriations for Operating Expenses.
124 C A N A D A M O R T G A G E A N D H O U S I N G C O R P O R A T I O N
The following table presents the change in the Due from the Government of Canada account. The outstanding balance as of 31 December 2012 is mainly composed of housing program expenses incurred but not yet reimbursed.
| (in millions) | 2012 | 2011 | ||||||
Due from (to) the Government of Canada | ||||||||
Balance at Beginning of Year | 403 | 531 | ||||||
Total Appropriations | 2,197 | 2,163 | ||||||
Total Appropriations Received | (2,290) | (2,300) | ||||||
Reimbursements | (1) | 9 | ||||||
Balance at End of Year | 309 | 403 | ||||||
Of the total balance, $175 million is expected to be recovered within 12 months of the Consolidated Balance Sheet date.
| 10. | ACCOUNTS RECEIVABLE AND OTHER ASSETS |
The following table presents the composition of Accounts Receivable and Other Assets.
| (in millions) | 2012 | 2011 | ||||||
Accounts Receivable | 33 | 33 | ||||||
Income Taxes Receivable | 207 | 59 | ||||||
Investment Property (Note 22) | 204 | 191 | ||||||
Non-Current Assets Held for Sale | 92 | 80 | ||||||
Property, Plant and Equipment | 53 | 53 | ||||||
Deferred Acquisition Costs (Note 14) | 115 | 109 | ||||||
Other | 203 | 161 | ||||||
Total | 907 | 686 | ||||||
| 11. | SECURITIZATION |
CMHC guarantees the timely payment of principal and interest of NHA MBS for investors in securities issued by Approved Issuers on the basis of housing loans through the NHA MBS program and the CMB issued by CHT.
CMHC determined that, at the Consolidated Balance Sheet date, the best estimate of the amount required to settle the timely payment guarantee obligation is less than the balance of unearned timely payment guarantees included in Unearned Premiums and Fees. As such, no provision for claims is required. As at 31 December 2012, the carrying amount for timely payment guarantees is $546 million (2011 – $528 million), of which $187 million is expected to be recognized as revenues within 12 months of the Consolidated Balance Sheet date. Revenues recognized for timely payment guarantees were $242 million (2011 – $211 million).
Guarantees-in-force
The following table presents the total guarantees-in-force by program.
| (in billions) | 2012 | 2011 | ||||||
NHA MBS(1) | 179 | 161 | ||||||
CMB(2) | 203 | 201 | ||||||
Total Guarantees-in-Force | 382 | 362 | ||||||
| (1) | Includes $38 billion (2011 – $49 billion) in NHA MBS of which CMHC is entitled to payments for the timely payment guarantee. |
| (2) | Includes $2 billion (2011 – $2 billion) in investments held by CMHC in CMB issued by CHT. |
125
Based on the maturity profile of the $382 billion in guaranteed NHA MBS and CMB, CMHC’s related guarantees, stated in terms of the outstanding principal guaranteed, are scheduled to expire as follows:
| NHA MBS and | ||||
| (in millions) | CMB Guaranteed | |||
2013 | 62,900 | |||
2014 | 70,411 | |||
2015 | 70,103 | |||
2016 | 82,303 | |||
2017 | 54,312 | |||
2018 and Thereafter | 41,528 | |||
Total | 381,557 | |||
Under Section 15 of the NHA, the aggregate outstanding amount of principal guarantees may not exceed $600 billion (2011 – $600 billion).
| 12. | BORROWINGS |
Canada Mortgage Bonds
The following table summarizes the carrying value and yield for the CMHC-guaranteed CMB issued by CHT based on maturity date.
| 2012 | 2011 | |||||||||||||
| (in millions) | Carrying Value | Yield(1) | Carrying Value | |||||||||||
2012 | - | - | 37,737 | |||||||||||
2013 | 35,370 | 3.41% | 35,254 | |||||||||||
2014 | 36,036 | 2.53% | 35,918 | |||||||||||
2015 | 30,498 | 2.51% | 30,527 | |||||||||||
2016 | 31,908 | 1.98% | 32,059 | |||||||||||
2017 | 29,602 | 1.69% | 1,750 | |||||||||||
2018-2022 | 38,262 | 3.07% | 26,128 | |||||||||||
Total | 201,676 | 2.57% | 199,373 | |||||||||||
| (1) | Represents the weighted-average yield, determined by applying the weighted average effective yields of individual fixed rate bonds and the weighted-average yields-to-reset of floating rate bonds. |
The interest expense related to Canada Mortgage Bonds is $5,892 million (2011 – $6,406 million). During the year, CHT issued Canada Mortgage Bonds in the amount of $39,943 million (2011 – $41,515 million) and had maturities in the amount of $37,700 million (2011 – $36,025 million).
126 C A N A D A M O R T G A G E A N D H O U S I N G C O R P O R A T I O N
Borrowing Authorities
The Minister of Finance approves CMHC’s Borrowing Plan annually and establishes limits and parameters for borrowings. The Borrowing Authorities provide a maximum debt outstanding limit for 2012 of $71 billion. This limit includes Capital Market Borrowings and Borrowings from the Government of Canada that were incurred since April 2008 in the Lending and Securitization Activities. CMHC’s legislative authority, which does not apply to borrowings of CHT, requires that the total indebtedness of the Capital Market Borrowings outstanding at any time not exceed $20 billion.
Capital Market Borrowings
The following table summarizes the carrying value and yield for Capital Market Borrowings based on maturity date.
| 2012 | 2011 | |||||||||||||
| (in millions) | Carrying Value | Yield(1) | Carrying Value | |||||||||||
2012 | - | - | 305 | |||||||||||
2013 | 359 | 4.83% | 372 | |||||||||||
2014 | - | - | - | |||||||||||
2015 | 694 | 4.25% | 713 | |||||||||||
2016 | 493 | 4.45% | 505 | |||||||||||
2017 | 302 | 4.35% | 308 | |||||||||||
Total | 1,848 | 4.43% | 2,203 | |||||||||||
| (1) | Represents the weighted-average yield, determined by applying the weighted-average effective yields of individual fixed rate borrowings and the weighted-average yields-to-reset of floating rate notes. |
Included in Capital Market Borrowings is medium-term debt. Medium-term Capital Market Borrowings includes bonds, floating rate and fixed rate notes, with an original term to maturity ranging from two to ten years.
The interest expense related to Capital Market Borrowings is $84 million (2011 – $120 million). During the year, CMHC had Capital Market Borrowings maturities in the amount of $300 million (2011 – $933 million).
The carrying amount at 31 December 2012 of Capital Market Borrowings is $121 million higher (2011 – $176 million higher) than the contractual amount due at maturity. CMHC’s liabilities are backed by the full faith and credit of the Government of Canada and there is no significant change in value that can be attributed to changes in credit risk.

127
Borrowings from the Government of Canada
The following table summarizes the carrying value and yield for Borrowings from the Government of Canada based on contractual repayments for borrowings made prior to 1993 and based on maturity date for all other borrowings.
| 2012 | 2011 | |||||||||||||||||||||||||
| Designated | Designated | |||||||||||||||||||||||||
| at Fair Value | at Fair Value | |||||||||||||||||||||||||
| through Profit | through Profit | |||||||||||||||||||||||||
| (in millions) | or Loss | Yield(1) | Other(2) | Yield(1) | or Loss | Other | ||||||||||||||||||||
2012 | - | - | - | - | 912 | 2,214 | ||||||||||||||||||||
2013 | 1,379 | 2.84% | 23,302 | 3.75% | 1,282 | 24,157 | ||||||||||||||||||||
2014 | 845 | 2.12% | 27,647 | 2.72% | 833 | 27,929 | ||||||||||||||||||||
2015 | 959 | 2.55% | 2,430 | 3.57% | 971 | 2,446 | ||||||||||||||||||||
2016 | 1,208 | 2.12% | 268 | 6.26% | 1,186 | 268 | ||||||||||||||||||||
2017 | 954 | 1.52% | 329 | 6.65% | 172 | 329 | ||||||||||||||||||||
2018-2022 | 1,314 | 3.24% | 1,617 | 6.80% | 1,228 | 1,617 | ||||||||||||||||||||
Thereafter | - | - | 2,002 | 8.01% | - | 2,003 | ||||||||||||||||||||
Total | 6,659 | 2.46% | 57,595 | 3.51% | 6,584 | 60,963 | ||||||||||||||||||||
| (1) | Represents the weighted-average yield, determined by applying the weighted-average effective yields of individual fixed rate borrowings and the weighted-average yields-to-reset of floating rate notes. |
| (2) | CMHC repays certain IMPP-related Other Borrowings as it receives principal payments and prepayments on the associated NHA MBS. The maturities for these borrowings are estimated based on assumptions regarding mortgage prepayments, liquidations and conversions of the underlying MBS, which are described in Note 6. |
Included in Borrowings from the Government of Canada – Designated at Fair Value through Profit or Loss is short-term and medium-term debt. Short-term debt outstanding of $122 million (2011 – $94 million) has an original term to maturity less than 365 days and a yield of 0.91% (2011 – 0.83%). Medium-term debt includes fixed rate notes, with an original term to maturity ranging from two to ten years.
The interest expense related to Borrowings from the Government of Canada – Designated at Fair Value through Profit or Loss is $166 million (2011 – $166 million), and for Borrowings from the Government of Canada – Other is $2,066 million (2011 – $2,151 million). During the period, CMHC had new borrowings in the amount of $2,591 million (2011 – $3,928 million) and repayments in the amount of $5,820 million (2011 – $6,494 million) relating to its Borrowings from the Government of Canada.
The carrying amount at 31 December 2012 of Borrowings from the Government of Canada – Designated at Fair Value through Profit or Loss is $165 million (2011 – $231 million) higher than the contractual amount due at maturity. CMHC’s liabilities are backed by the full faith and credit of the Government of Canada and there is no significant change in value that can be attributed to changes in credit risk.
Borrowings from the Government of Canada include borrowings under the terms of the Crown Borrowing Agreement that are issued at the Government of Canada rate. On the day of exchange, these borrowings are adjusted to market value and the associated gains/losses are amortized through profit or loss on a straight-line basis over the term of the borrowings.
128 C A N A D A M O R T G A G E A N D H O U S I N G C O R P O R A T I O N
| 13. | ACCOUNTS PAYABLE AND OTHER LIABILITIES |
The following table presents the composition of Accounts Payable and Other Liabilities.
| (in millions) | 2012 | 2011 | ||||||
Accrued Housing Programs Expenses | 312 | 339 | ||||||
Defined Benefit Liability for Post-employment Benefits (Note 21) | 716 | 603 | ||||||
Deferred Gains | 59 | 60 | ||||||
Other Miscellaneous Liabilities | 170 | 170 | ||||||
Total | 1,257 | 1,172 | ||||||
| 14. | MORTGAGE LOAN INSURANCE |
Role of the Appointed Actuary
The actuary is appointed by CMHC’s Management to carry out a valuation of the policy liabilities (Provision for Claims and Unearned Premiums) of the Mortgage Loan Insurance Activity as at 30 September. The factors and techniques used in the valuation are in accordance with Canadian accepted actuarial practice, applicable legislation, and associated regulations. The Appointed Actuary also performs a roll-forward of the Provision for Claims from the date of the actuarial valuation to 31 December.
As a result of the most recent Actuarial Valuation, the earnings factors were changed to more closely reflect the emerging nature of the claim occurrence experience. Premiums and Fees revenue on the Consolidated Statement of Income and Comprehensive Income is $13 million higher in 2012 while Unearned Premiums and Fees on the Consolidated Balance Sheet as at 31 December 2012 is $13 million lower than it would have been had this change not been implemented.
Due to the change, Unearned Premiums and Fees is expected to be $15 million lower at 31 December 2013 and $12 million lower at 31 December 2014, resulting in Premiums and Fees revenue being $2 million higher in 2013 and $3 million lower in 2014.
Premiums and Fees
The following table presents the composition of Premiums and Fees:
| (in millions) | 2012 | 2011 | ||||||
Earned Premiums | 1,780 | 1,766 | ||||||
Earned Application Fees(1) | 27 | 25 | ||||||
Premiums and Fees | 1,807 | 1,791 | ||||||
| (1) | Includes previously unearned application fees recognized in the year, as well as other service fees which are earned as received. |
129
Unearned Premiums and Fees
The following table presents the changes in the Unearned Premiums and Fees balance:
| (in millions) | 2012 | 2011 | ||||||
Balance at Beginning of Year | 6,731 | 6,874 | ||||||
Premium Deferred on Contracts Written in the Year | 1,444 | 1,622 | ||||||
Premiums Earned in the Year | (1,780) | (1,766) | ||||||
Application Fees Deferred on Contracts Written in the Year | 14 | 14 | ||||||
Application Fees Earned in the Year | (15) | (13) | ||||||
Balance at End of Year | 6,394 | 6,731 | ||||||
Deferred Acquisition Costs
The following table presents the changes in the Deferred Acquisition Costs balance:
| (in millions) | 2012 | 2011 | ||||||
Balance at Beginning of Year | 109 | 103 | ||||||
Acquisition Costs Deferred | 37 | 34 | ||||||
Amortization of Deferred Acquisition Costs | (31) | (28) | ||||||
Balance at End of Year | 115 | 109 | ||||||
Provision for Claims
The Provision for Claims includes amounts set aside for Incurred But Not Reported (IBNR) claims, claims reported but not paid and for Social Housing Mortgage and Index Linked Mortgage claims. The following table presents the changes in the Provision for Claims balance:
| (in millions) | 2012 | 2011 | ||||||
Balance at Beginning of Year | 1,041 | 1,096 | ||||||
Losses on Claims During the Year | (532) | (617) | ||||||
Provision for Claims Incurred During the Year | 487 | 562 | ||||||
Balance at End of Year | 996 | 1,041 | ||||||
Of the $996 million in the Provision for Claims at 31 December 2012, $688 million is expected to be paid during the next 12 months and the remainder to be paid in 2014 and thereafter.
The Provision for Claims is based on known facts and interpretation of circumstances, and is influenced by a large variety of factors.
130 C A N A D A M O R T G A G E A N D H O U S I N G C O R P O R A T I O N
There is a limitation to the accuracy of policy liability estimates as provided in the valuation report prepared by CMHC’s Appointed Actuary. There is inherent uncertainty in any estimate of ultimate liabilities including for premium deficiency, IBNR, Claims in Process, Social Housing Mortgages and Index Linked Mortgages because CMHC’s ultimate liability for claims is subject to the outcome of events yet to occur.
In addition to a risk of underestimating or overestimating the total amount of claim liabilities, there is a risk that the timing of the future payment of liabilities or the return on investments will differ materially from the assumptions underlying the valuation of insurance policy liabilities.
The most significant factors affecting the frequency of claims as a result of borrower default are an increase of the incidence of unemployment, a decrease in house price inflation and increasing mortgage rates.
The key method used by CMHC for estimating insurance policy liabilities is the actuarial present value basis.
Significant Factors
The following factors affect the key actuarial assumptions.
Claim emergence: Claim emergence encompasses claim frequency and claim occurrence patterns. It is based on historical trends in claims and arrears reporting.
Claim severity: Claim severity, or average loss on claims, is dependent on the dollar value of claims, losses on sales of real estate properties, administrative expenses, payment delays and sale delays. These factors are generally based on historical experience.
Economic conditions: Recent past and projected economic factors, such as unemployment rates, mortgage interest rates, and changes in house prices, affect the forecast of future claim levels.
The Provision for Claims consists of estimates of incurred losses and related expenses. Actual incurred amounts may not develop exactly as projected and may in fact vary significantly from the projections. Provisions are reviewed and evaluated at the end of each quarter in light of emerging claim experience and changing circumstances. The resulting changes in the estimated Provision for Claims are recorded in Net Claims in the year in which they are determined.
CMHC determines Provisions for Claims and Unearned Premiums at 31 December using valuation factors from the 30 September valuation, taking into account changes in economic circumstances, premiums received and claims paid in the intervening period.
CMHC considers that the liability for Mortgage Loan Insurance Activity recognized in the Consolidated Balance Sheet is sufficient. However, actual experience may differ from the expected outcome.
131
Sensitivity Analysis
The following table presents the sensitivity of the level of insurance contract liabilities disclosed in this note to movements in the economic factors used to calculate them. The percentage change in variables is applied to a range of existing actuarial modelling assumptions to derive the possible impact on Income before Income Taxes. The disclosure is not intended to explain the impact of a percentage change in the insurance assets and liabilities disclosed above.
The results of sensitivity testing are set out below, showing the impact on Income before Income Taxes. For each scenario, the impact of a change in a single factor is shown, with other assumptions unchanged.
| (in millions) | 2012 | 2011 | ||||||
100 bps Increase in Unemployment Rate | (93) | (75) | ||||||
100 bps Decrease in Rate of House Price Inflation | (16) | (17) | ||||||
100 bps Increase in Mortgage Rates | (43) | (42) | ||||||
These sensitivities are hypothetical and should be viewed in that light. The relationship of a change in assumption to the change in value may not be linear. Changes in one factor may result in changes in another which might magnify or counteract the sensitivities.
CMHC’s method for sensitivity testing has not changed significantly from the prior year.
Claims Development
The following table shows the development of claims over a period of time and the estimated ultimate cost of claims for 2007 through 2012. In 2011, in the year of adoption of IFRS, only five years are required to be disclosed. This will be increased in each succeeding year, until ten years of information are presented. The table shows how the estimates of Incurred But Not Reported claims for each year develop over time.
| (in millions) | 2007 | 2008 | 2009 | 2010 | 2011 | 2012 | Total | |||||||||||||||||||||
Expected Losses on Claims in the year | 229 | 276 | 357 | 886 | 726 | 651 | 3,125 | |||||||||||||||||||||
Actual Losses on Claims in the year | 217 | 248 | 512 | 678 | 617 | 532 | 2,804 | |||||||||||||||||||||
Differences | (12) | (28) | 155 | (208) | (109) | (119) | (321) | |||||||||||||||||||||
Mortgage Loan Insurance Risk Management
CMHC assumes the risk of loss from borrower default through mortgage insurance contracts entered into with lenders, exposing CMHC to the uncertainty surrounding the timing, frequency and severity of claims. CMHC manages its exposure to this risk of loss through prudent product design, underwriting and default management practices, and the establishment of adequate capital reserves.
A concentration of risk may arise from insurance contracts issued in a particular geographical area where local economic conditions are significantly different from average. The relative impact of the outcome is mitigated as a result of CMHC’s distribution of business across different geographic areas.
132 C A N A D A M O R T G A G E A N D H O U S I N G C O R P O R A T I O N
Insurance-in-force
At 31 December 2012, insurance-in-force, which represents the risk exposure of the CMHC Mortgage Loan Insurance Activity, totalled $566 billion (2011 – $567 billion).
Under Section 11 of the NHA, the total of outstanding insured amounts of all insured loans may not exceed $600 billion (2011 – $600 billion).
| 15. | INCOME TAXES |
The following table presents the components of Income Taxes expense:
| (in millions) | 2012 | 2011 | ||||||
Current Income Taxes Expense | ||||||||
Tax Expense for Current Year | 527 | 595 | ||||||
Adjustment for Prior Years | 7 | - | ||||||
| 534 | 595 | |||||||
Deferred Income Tax Expense (Recovery) | 39 | (42) | ||||||
Total Income Tax Expense on Net Income | 573 | 553 | ||||||
Income Tax Expense (Recovery) on Other Comprehensive Income | ||||||||
Net Unrealized Gains on Available for Sale Financial Instruments | 94 | 152 | ||||||
Reclassification of Prior Years’ Net Unrealized Gains Realized in the Period | (68) | (57) | ||||||
Net Actuarial Losses on Employee Benefit Plans | (23) | (38) | ||||||
Total Income Tax Expense on Other Comprehensive Income | 3 | 57 | ||||||
Income Tax Recovery on Consolidated Statement of Equity of Canada | - | (1) | ||||||
Total Income Taxes | 576 | 609 | ||||||
The following is a reconciliation of the statutory tax rate of the Corporation to the effective tax rate.
|
| |||||||
| (in millions) | 2012 | 2011 | ||||||
Income before Income Taxes | 2,289 | 2,082 | ||||||
Statutory Tax Rate | 25% | 26.5% | ||||||
Income Taxes computed at Statutory Tax Rate | 572 | 552 | ||||||
Change in Tax Rates on Income Taxes | 14 | 11 | ||||||
Permanent Differences | (13) | (10) | ||||||
Income Tax Expense | 573 | 553 | ||||||
Effective Tax Rate | 25.04% | 26.58% | ||||||
CMHC’s statutory tax rate of 25% is comprised of the Federal Income Tax Rate of 38% plus a General Rate Reduction of 13%.
133
The following tables present the tax-effected temporary differences which result in deferred income tax assets and liabilities.
| Change through | ||||||||||||||||||||||||
| Statement of Income | Change | Change | ||||||||||||||||||||||
| and Comprehensive | through | through | ||||||||||||||||||||||
| (in millions) | 2011 | Income | OCI | Equity | Other | 2012 | ||||||||||||||||||
Deferred Income Tax Assets | ||||||||||||||||||||||||
Fair Value of Financial Instruments | 101 | (30) | 4 | - | - | 75 | ||||||||||||||||||
Post-employment Benefits | 104 | (1) | 23 | - | - | 126 | ||||||||||||||||||
Unamortized Premiums on Capital Market Borrowings | 2 | - | - | - | - | 2 | ||||||||||||||||||
Other | 4 | - | (2) | - | - | 2 | ||||||||||||||||||
Total Deferred Income Tax Assets | 211 | (31) | 25 | - | - | 205 | ||||||||||||||||||
Deferred Income Tax Liabilities | ||||||||||||||||||||||||
Fair Value of Investment Properties | (2) | (1) | - | - | - | (3) | ||||||||||||||||||
Fair Value of Real Estate (Lending) | (21) | (2) | - | - | - | (23) | ||||||||||||||||||
Deferred Gains on Disposal of Financial Instruments | (6) | - | - | - | 1 | (5) | ||||||||||||||||||
Deferred Issuance Costs | (5) | 1 | - | - | - | (4) | ||||||||||||||||||
Provision for Claims | (99) | (6) | - | (7) | - | (112) | ||||||||||||||||||
Total Deferred Income Tax Liabilities | (133) | (8) | - | (7) | 1 | (147) | ||||||||||||||||||
Net Deferred Income Tax Assets (Liabilities) | 78 | (39) | 25 | (7) | 1 | 58 | ||||||||||||||||||
| Change through | ||||||||||||||||||||||||
| Statement of Income | Change | Change | ||||||||||||||||||||||
| and Comprehensive | through | through | ||||||||||||||||||||||
| (in millions) | 2010 | Income | OCI | Equity | Other | 2011 | ||||||||||||||||||
Deferred Income Tax Assets | ||||||||||||||||||||||||
Fair Value of Financial Instruments | 53 | 45 | (11) | - | 14 | 101 | ||||||||||||||||||
Post-employment Benefits | 69 | (3) | 38 | - | - | 104 | ||||||||||||||||||
Unamortized Premiums on Capital Market Borrowings | 2 | - | - | - | - | 2 | ||||||||||||||||||
Other | 2 | 2 | - | - | - | 4 | ||||||||||||||||||
Total Deferred Income Tax Assets | 126 | 44 | 27 | - | 14 | 211 | ||||||||||||||||||
Deferred Income Tax Liabilities | ||||||||||||||||||||||||
Fair Value of Investment Properties | (1) | (1) | - | - | - | (2) | ||||||||||||||||||
Fair Value of Real Estate (Lending) | (20) | (1) | - | - | - | (21) | ||||||||||||||||||
Deferred Gains on Disposal of Financial Instruments | (8) | - | - | - | 2 | (6) | ||||||||||||||||||
Deferred Issuance Costs | (7) | 2 | - | - | - | (5) | ||||||||||||||||||
Deferred Application and Compensatory Fees | (14) | - | - | - | 14 | - | ||||||||||||||||||
Provision for Claims | (89) | (2) | - | (8) | - | (99) | ||||||||||||||||||
Total Deferred Income Tax Liabilities | (139) | (2) | - | (8) | 16 | (133) | ||||||||||||||||||
Net Deferred Income Tax Assets (Liabilities) | (13) | 42 | 27 | (8) | 30 | 78 | ||||||||||||||||||
The deferred income tax assets (liabilities) have been recognized in full as the Corporation believes it is probable that these items will be realized in the normal course of its operations.
134 C A N A D A M O R T G A G E A N D H O U S I N G C O R P O R A T I O N
| 16. | CAPITAL MANAGEMENT |
For capital management purposes and as provided for in the CMHC Act and the NHA, CMHC considers its capital to be Accumulated Other Comprehensive Income, Retained Earnings, comprised of Appropriated Retained Earnings, Unappropriated Retained Earnings and Reserve Fund for Lending, as well as Contributed Capital.
CMHC’s primary objective with respect to capital management is to ensure that it has adequate capital to deliver its mandate while remaining financially self-sustaining and also to follow prudent business practices and guidelines existing in the private sector as appropriate. CMHC capital management policy is included in its Corporate Plan which is approved annually by the Governor in Council.
There are no externally imposed minimal capital requirements on CMHC’s Appropriated Retained Earnings which represents the portion of cumulative Net Income from the Mortgage Loan Insurance and Securitization Activities that has been set aside for capitalization purposes. The Appropriated Retained Earnings of the Mortgage Loan Insurance Activity are based on CMHC’s Capital Management Framework which is based on guidelines developed by the Office of the Superintendent of Financial Institutions (OSFI) and the Appropriated Retained Earnings of the Securitization Activity are based on regulatory and economic capital principles.
OSFI’s minimum regulatory capital requirement is 100% of its Minimum Capital Test (MCT). The percentage MCT is the minimum ratio of the capital available to the capital required. OSFI expects regulated insurers to establish a target capital level and a capital holding level based on acceptable levels of risk. The Board has selected an internal capital target of 175% MCT (2011 – 150%) and a capital holding level of 200% MCT (2011 – 200%). The selection of the capital holding level is to ensure that the likelihood of falling below the internal capital target is minimized. As at 31 December 2012, total Mortgage Loan Insurance MCT was 231% (2011 – 226%). CMHC is currently meeting its capital holding level.
Unappropriated Retained Earnings represent the cumulative Net Income and Net Actuarial Gains (Losses) on Post-employment Benefits generated by the Mortgage Loan Insurance and Securitization Activities that has not been set aside for capitalization purposes.
CHT has no capital to manage as all income is distributed to the beneficiaries of the trust.
CMHC places all other retained earnings in its Reserve Fund for Lending. The components of this Reserve are outlined in the following table. There is an externally imposed limit on each of the components. Should the overall limit be exceeded, CMHC would be required to pay the excess to the Government of Canada.
| 2012 | 2011 | |||||||||||||||||
| Authorized | Authorized | |||||||||||||||||
| (in millions) | Limit | Balance | Limit | Balance | ||||||||||||||
Reserve for Unrealized Gains and Losses | 115 | (118) | 115 | (101) | ||||||||||||||
Reserve for All Other Lending-Related Items | 125 | 102 | 125 | 105 | ||||||||||||||
Eliminations | n/a | (11) | n/a | (13) | ||||||||||||||
Reserve Fund for Lending | 240 | (27) | 240 | (9) | ||||||||||||||
CMHC has managed its capital as approved in its 2012 Corporate Plan in accordance with the CMHC Act and the NHA. There have been no changes in what is considered to be capital or the objectives of managing capital during the year.
135
| 17. | FINANCIAL INSTRUMENTS |
Determination of Fair Value
All financial instruments are recognized initially at fair value. Fair value is the amount of the consideration that would be agreed upon in an arm’s length transaction between knowledgeable, willing parties who are under no compulsion to act. Accrued interest is separately recorded and disclosed for all financial instruments.
Fair values are estimated using the following fair value methods. The fair value measurement hierarchy reflects the observability of the most significant inputs used in making these measurements.
Fair Value Hierarchy:
Level 1:
Financial assets quoted in active markets that are measured based on the bid price of an identical asset. Financial liabilities quoted in active markets are measured based on the ask price of an identical liability.
Level 2:
Financial assets and liabilities not quoted in active markets that are measured by discounting expected future cash flows, making maximum use of directly or indirectly observable market data such as yield curves and implied forward curves constructed from benchmark interest rates and credit spreads of identical or similar instruments.
Level 3:
Financial assets and liabilities not quoted in active markets that are measured based on discounting expected future cash flows. Where possible, inputs are based on observable market data such as yield curves and implied forward curves constructed from benchmark interest rates and credit spreads of identical or similar instruments. Where observable inputs are not available, unobservable inputs are used, mainly including assumptions related to credit and liquidity risk premiums.

136 C A N A D A M O R T G A G E A N D H O U S I N G C O R P O R A T I O N
The following table represents the fair value hierarchy in which fair value measurements are categorized for assets and liabilities recorded on the Consolidated Balance Sheet.
| 2012 | ||||||||||||||||
| (in millions) | Level 1 | Level 2 | Level 3 | Total | ||||||||||||
Assets | ||||||||||||||||
Cash and Cash Equivalents | 177 | 619 | - | 796 | ||||||||||||
Investment Securities: | ||||||||||||||||
Designated at Fair Value through Profit or Loss | 726 | 65 | 137 | 928 | ||||||||||||
Held for Trading | 415 | - | - | 415 | ||||||||||||
Available for Sale | 19,290 | - | 14 | 19,304 | ||||||||||||
Loans: | ||||||||||||||||
Designated at Fair Value through Profit or Loss | - | 6,591 | - | 6,591 | ||||||||||||
Derivatives | - | 131 | - | 131 | ||||||||||||
Financial Assets not Recorded at Fair Value and Other Assets | 263,875 | |||||||||||||||
Total Assets | 20,608 | 7,406 | 151 | 292,040 | ||||||||||||
Liabilities and Equity of Canada | ||||||||||||||||
Borrowings: | ||||||||||||||||
Capital Market Borrowings | 1,848 | - | - | 1,848 | ||||||||||||
Borrowings from the Government of Canada: | ||||||||||||||||
Designated at Fair Value through Profit or Loss | - | 6,659 | - | 6,659 | ||||||||||||
Derivatives | - | 46 | - | 46 | ||||||||||||
Liabilities and Equity not Recorded at Fair Value | 283,487 | |||||||||||||||
Total Liabilities and Equity of Canada | 1,848 | 6,705 | - | 292,040 | ||||||||||||
| 2011 | ||||||||||||||||
| (in millions) | Level 1 | Level 2 | Level 3 | Total | ||||||||||||
Assets | ||||||||||||||||
Cash and Cash Equivalents | 617 | 512 | - | 1,129 | ||||||||||||
Investment Securities: | ||||||||||||||||
Designated at Fair Value through Profit or Loss | 584 | 200 | 119 | 903 | ||||||||||||
Held for Trading | 397 | - | - | 397 | ||||||||||||
Available for Sale | 17,353 | 188 | 8 | 17,549 | ||||||||||||
Loans: | ||||||||||||||||
Designated at Fair Value through Profit or Loss | - | 7,132 | - | 7,132 | ||||||||||||
Derivatives | - | 169 | - | 169 | ||||||||||||
Financial Assets not Recorded at Fair Value and Other Assets | 264,611 | |||||||||||||||
Total Assets | 18,951 | 8,201 | 127 | 291,890 | ||||||||||||
Liabilities and Equity of Canada | ||||||||||||||||
Borrowings: | ||||||||||||||||
Capital Market Borrowings | 2,203 | - | - | 2,203 | ||||||||||||
Borrowings from the Government of Canada: | ||||||||||||||||
Designated at Fair Value through Profit or Loss | - | 6,584 | - | 6,584 | ||||||||||||
Derivatives | - | 72 | - | 72 | ||||||||||||
Liabilities and Equity not Recorded at Fair Value | 283,031 | |||||||||||||||
Total Liabilities and Equity of Canada | 2,203 | 6,656 | - | 291,890 | ||||||||||||
137
During the year ended 31 December 2012, Investment Securities having a fair value of $179 million as at 31 December 2011 were transferred to Level 1 from Level 2 as directly observable market prices became available.
The following table presents the change in the fair value measurement of Level 3 Investment Securities.
| (in millions) | 2012 | 2011 | ||||||
Balance at Beginning of Year | 127 | 112 | ||||||
Purchases | 5 | 3 | ||||||
Transfers In | - | 4 | ||||||
Unrealized Gains in Net Income(1) | 20 | 8 | ||||||
Cash Receipts on Settlements | (1) | - | ||||||
Balance at End of Year | 151 | 127 | ||||||
Gains for Positions Held at 31 December(1) | 20 | 8 | ||||||
| (1) | Included in Net Unrealized Gains (Losses) from Financial Instruments. |
CMHC’s valuation for Level 3 Investment Securities was based on its assessment of the prevailing conditions at 31 December 2012, which may change materially in subsequent periods. The most significant factor which may have an impact on the future value of these assets is the discount rates. A 100 bps decrease (increase) in the discount factor would result in a $5 million increase (decrease) (2011 – $6 million) in Income before Income Taxes.

138 C A N A D A M O R T G A G E A N D H O U S I N G C O R P O R A T I O N
Comparison of Carrying and Fair Values
The following table compares the carrying and fair values of financial instruments. Carrying value is the amount at which an item is measured on the Consolidated Balance Sheet.
| 2012 | 2011 | |||||||||||||||||
| Fair | Carrying | Fair | Carrying | |||||||||||||||
| (in millions) | Value | Value | Value | Value | ||||||||||||||
Financial Assets | ||||||||||||||||||
Cash and Cash Equivalents | 1,220 | 1,220 | 1,401 | 1,401 | ||||||||||||||
Securities Purchased Under Resale Agreements | 63 | 63 | - | - | ||||||||||||||
Investment Securities: | ||||||||||||||||||
Designated at Fair Value through Profit or Loss | 928 | 928 | 903 | 903 | ||||||||||||||
Held for Trading | 415 | 415 | 397 | 397 | ||||||||||||||
Available for Sale | 19,304 | 19,304 | 17,549 | 17,549 | ||||||||||||||
Investment in NHA Mortgage-Backed Securities – Loans and Receivables | 262,576 | 255,967 | 266,477 | 256,655 | ||||||||||||||
Loans: | ||||||||||||||||||
Designated at Fair Value through Profit or Loss | 6,591 | 6,591 | 7,132 | 7,132 | ||||||||||||||
Other | 5,579 | 4,440 | 5,981 | 4,726 | ||||||||||||||
Investments in Housing Programs | 1,374 | 748 | 1,477 | 808 | ||||||||||||||
Derivatives | 131 | 131 | 169 | 169 | ||||||||||||||
Financial Liabilities | ||||||||||||||||||
Securities Sold Under Repurchase Agreements | 425 | 425 | 272 | 272 | ||||||||||||||
Borrowings: | ||||||||||||||||||
Canada Mortgage Bonds | 207,144 | 201,676 | 206,974 | 199,373 | ||||||||||||||
Capital Market Borrowings | 1,848 | 1,848 | 2,203 | 2,203 | ||||||||||||||
Borrowings from the Government of Canada: | ||||||||||||||||||
Designated at Fair Value through Profit or Loss | 6,659 | 6,659 | 6,584 | 6,584 | ||||||||||||||
Other | 60,702 | 57,595 | 65,317 | 60,963 | ||||||||||||||
Derivatives | 46 | 46 | 72 | 72 | ||||||||||||||
Classification of Cash and Cash Equivalents
The following table presents a breakdown of Cash and Cash Equivalents by Financial Instrument classification.
| (in millions) | 2012 | 2011 | ||||||
Designated at Fair Value through Profit or Loss | 434 | 347 | ||||||
Available for Sale | 362 | 782 | ||||||
Held to Maturity | 424 | 272 | ||||||
Total | 1,220 | 1,401 | ||||||
139
Gains and Losses from Financial Instruments
The unrealized gains and losses arising from changes in fair value related to financial instruments classified as HFT and those Designated at Fair Value through Profit or Loss are presented in the following table.
| (in millions) | 2012 | 2011 | ||||||
Held for Trading | ||||||||
Equities | 60 | (89) | ||||||
Derivatives | (20) | 5 | ||||||
Total Held for Trading | 40 | (84) | ||||||
Designated at Fair Value through Profit or Loss | ||||||||
Investment Securities – Designated at Fair Value through Profit or Loss | 12 | 28 | ||||||
Loans – Designated at Fair Value through Profit or Loss | (109) | 99 | ||||||
Capital Market Borrowings | 56 | 6 | ||||||
Borrowings from the Government of Canada – Designated at Fair Value through Profit or Loss | 68 | (180) | ||||||
Total Designated at Fair Value through Profit or Loss | 27 | (47) | ||||||
Gains (Losses) from Related Party Transactions | (2) | 13 | ||||||
Total Net Unrealized Gains (Losses) from Financial Instruments | 65 | (118) | ||||||
All items Designated at Fair Value through Profit and Loss, with the exception of certain Investment Securities held within the Mortgage Loan Insurance and Securitization Activities, relate to the Lending Activity. For certain portfolios of loans and associated borrowings, the Lending Activity uses Derivatives to manage refinancing and reinvestment, as well as mismatches between the timing of receipts from assets and payments of liabilities. Classifying the Loans, and associated Capital Market Borrowings and Borrowings from the Government of Canada, as Designated at Fair Value through Profit or Loss significantly reduces the measurement inconsistency that would otherwise arise from measuring them at amortized cost and measuring the Derivatives at fair value.
Certain Investment Securities within the Mortgage Loan Insurance and Securitization Activities are also classified as Designated at Fair Value as they are managed and reported to Management on a fair value basis.
There has been no change in the fair value of Loans – Designated at Fair Value through Profit or Loss as a result of changes in credit risk.
The realized gains and losses related to financial instruments are presented in the table below.
| (in millions) | 2012 | 2011 | ||||||
Held for Trading | (7) | 1 | ||||||
Available for Sale | 157 | 219 | ||||||
Retirement of Debt | (15) | (23) | ||||||
Total Net Realized Gains from Financial Instruments | 135 | 197 | ||||||
140 C A N A D A M O R T G A G E A N D H O U S I N G C O R P O R A T I O N
Interest Income and Interest Expense
The following table outlines the total interest income and expense calculated using the effective interest method for financial instruments.
| 2012 | 2011 | |||||||||||||||||
| (in millions) | Income | Expense | Income | Expense | ||||||||||||||
Available for Sale Financial Assets | 496 | - | 506 | - | ||||||||||||||
Held to Maturity Financial Assets | 5 | - | 3 | - | ||||||||||||||
Investment in NHA MBS - Loans and Receivables | 7,681 | - | 8,274 | - | ||||||||||||||
Securities Purchased Under Resale Agreements | - | - | 1 | - | ||||||||||||||
Loans – Other | 285 | - | 320 | - | ||||||||||||||
Loans – Investments in Housing Programs | 90 | - | 97 | - | ||||||||||||||
Securities Sold Under Repurchase Agreements | - | 5 | - | 3 | ||||||||||||||
Canada Mortgage Bonds | - | 5,892 | - | 6,406 | ||||||||||||||
Borrowings from the Government of Canada – Other | - | 2,066 | - | 2,151 | ||||||||||||||
Total Interest for Financial Instruments not at Fair Value through Profit or Loss | 8,557 | 7,963 | 9,201 | 8,560 | ||||||||||||||
Total Interest for Financial Instruments at Fair Value through Profit or Loss | 231 | 215 | 267 | 246 | ||||||||||||||
Total Dividends | 101 | - | 86 | - | ||||||||||||||
Total Interest | 8,889 | 8,178 | 9,554 | 8,806 | ||||||||||||||
| 18. | MARKET RISK |
Market risk is the risk of adverse financial impact arising from changes in underlying market factors, including interest rates, foreign exchange rates, and equity prices.
Interest Rate Risk
Interest rate risk is the risk that the fair value or future cash flows of a financial instrument will fluctuate because of changes in market interest rates.
The investment portfolios for the Mortgage Loan Insurance and Securitization Activities are managed in accordance with their Strategic Asset Allocation (SAA) policies, which are based upon an analysis and review process that assesses the risks and returns of alternative investment policies, and policies limiting price sensitivity to interest rate changes relative to benchmark indices and ensuring appropriate asset diversification. The Lending Activity is exposed to interest rate risk when asset and liability principal and interest cash flows have different payment, repricing or maturity dates. Some of CMHC’s Loans and Investments in Housing Programs contain prepayment and/ or repricing options. As CMHC does not have the right to prepay its Borrowings from the Government of Canada without penalty, it is exposed to interest rate risk. Interest rate risk associated with the Lending Activity is managed through asset and liability matching using derivatives, as necessary, and capital market strategies.
Currency Risk
Currency risk is the risk that the fair value or future cash flows of a financial instrument will fluctuate because of changes in foreign exchange rates.
141
As part of its SAA policies, the Corporation has assumed currency exposure to further its Mortgage Loan Insurance investment portfolio diversification. CMHC has currency exposure through foreign currency denominated equity pooled funds classified as Held for Trading. The table below indicates the currencies to which CMHC has significant exposure as at 31 December 2012 and the impact on Income before Income Taxes of a 10% shift in their value relative to the Canadian dollar:
| Currency | 10% Increase | 10% Decrease | ||||||||||
| Risk Exposed | in Foreign | in Foreign | ||||||||||
| (in millions) | Holdings | Currency | Currency | |||||||||
Euro Currency Unit | 153 | 17 | (14) | |||||||||
British Pound | 84 | 9 | (8) | |||||||||
Japanese Yen | 50 | 5 | (5) | |||||||||
Swiss Franc | 40 | 4 | (4) | |||||||||
As at 31 December 2012, had the Canadian dollar strengthened or weakened by 10% in relation to all currencies, with all other variables held constant, the fair value of assets classified as Held for Trading in the Mortgage Loan Insurance portfolio would have increased or decreased, respectively, by approximately $41 million.
Other Price Risk
This is the risk that the fair value of future cash flows of a financial instrument will fluctuate because of changes in market prices. CMHC is exposed to other price risk through fluctuations in prices of equity investments held by the Mortgage Loan Insurance Activity. The fair value of these investments as at 31 December 2012 is $3,789 million (2011 – $3,571 million). The majority of equity investment assets are actively managed against selected benchmarks derived from a SAA policy. CMHC limits its exposure by using tolerance ranges around the benchmarks for various diversification and exposure measures.
Sensitivity Analysis
Value at Risk: Market risk for investment securities in the Mortgage Loan Insurance and Securitization portfolios is evaluated through the use of appropriate Value at Risk (VaR) models. VaR is a statistical estimation that measures the maximum potential market loss of a portfolio over a specified holding period with a given level of confidence. The calculation of VaR is based on the Delta-normal method which may underestimate the occurrence of large losses because of its reliance on a normal distribution. The total VaR for the Mortgage Loan Insurance and Securitization investment portfolios with a 95% confidence level over a two-week holding period as at 31 December 2012 is $185 million (2011 – $174 million). The total VaR as at 31 December 2012 is comprised of $183 million for AFS investments and $18 million for HFT investments, net of $16 million in diversification effects. The diversification effects reflect the fact that, as risks are not perfectly correlated among individual portfolios, there is a benefit from diversification and total VaR, when viewed in aggregate, is less than the sum of individual portfolio VaRs. The analysis is based on one-year historical data of prices, volatilities and correlations of the various bond and equity markets. The 2011 VaR figures cannot be broken down by AFS and HFT as the tool used to compute the VaR cannot reconstruct historical data.
Interest Rate Sensitivity: The Lending Activity is exposed to interest rate risk. For Loans – Designated at Fair Value through Profit or Loss and Investment Securities, and related borrowings designated at fair value and swaps, the impacts of interest rate shifts are not symmetrical. The following interest rate sensitivities provide the net impact of interest rate shifts on the fair value of all interest-rate sensitive items, in the 2011 Consolidated Financial Statements, interest rate sensitivities were provided only for loan assets. A -200 bps interest rate shift would result in a Net Unrealized Gain from Financial Instruments of nil (2011 – $14 million) whereas a +200 bps interest rate shift would result in a Net Unrealized Loss from Financial Instruments of $1 million (2011 – $7 million Net
142 C A N A D A M O R T G A G E A N D H O U S I N G C O R P O R A T I O N
Unrealized Gain from Financial Instruments). For the remaining loans and borrowings not recorded at fair value in the financial statements, a -200 bps interest rate shift would cause the fair value of liabilities to increase by $91 million (2011 – $97 million) more than the fair value of assets, whereas a +200 bps interest rate shift would cause the fair value of liabilities to decrease by $70 million (2011 – $70 million) more than the fair value of assets. The maximum exposure of the Lending Activity portfolio’s net interest margin to interest rate movements with a 95% confidence over a one year period as at 31 December 2012 is $0.2 million (2011 – $1 million). The maximum exposure is limited by CMHC policy to $1.5 million.
Investment in NHA Mortgage-Backed Securities – Loans and Receivables
IMPP and CHT are exposed to both interest rate risk and prepayment/reinvestment risk. Prepayment/reinvestment risk is the risk that NHA MBS may experience varying degrees of prepayment throughout the term and these prepayments must be reinvested immediately.
To mitigate these risks, CMHC and CHT enter into swap agreements with approved financial institution counterparties. Under these agreements, both interest rate and prepayment/reinvestment risks are transferred to swap counterparties. These swap counterparties manage reinvestment assets in accordance with pre-established investment guidelines. CMHC and CHT pay all interest received from the underlying assets to the swap counterparties and the swap counterparties pay CMHC and CHT an amount equal to the coupon payments on the Borrowings from the Government of Canada and Canada Mortgage Bonds, respectively. As a result of these swap agreements, changes in interest rates or prepayments/ reinvestments have no impact on the Statement of Income and Comprehensive Income.
| 19. | CREDIT RISK |
Credit risk is the risk of loss arising from a counterparty’s inability to fulfill its contractual obligations. The Corporation is exposed to credit risk from various sources, including from its investment, lending, timely payment guarantee, derivatives, advances to mortgage-insured social housing projects in difficulty and mortgage receivable transactions.
Credit risk associated with the Corporation’s fixed income investments and derivatives is managed through the implementation of policies which include minimum counterparty credit ratings and investment portfolio diversification limits by issuer, credit rating, term and by industry sector, and through the use of appropriate legal agreements.
Concentration risk is the amount of credit risk the Corporation is exposed to in relation to specific counterparty and/or sectors. CMHC risk management policies address concentration risk from activities where the amount of potential loss can be measured (direct investments, lending and derivative transactions credit risk) at both the individual counterparty level and at the sector level and by credit rating. CMHC’s largest concentration of credit risk by individual counterparty is to the Government of Canada (2012 – $5,423 million, 2011 – $4,280 million), and the largest concentration of credit risk by sector is to the provincial sector (2012 – $6,260 million, 2011 – $5,952 million).
143
Credit risk associated with timely payment guarantees is managed through due diligence in approving NHA MBS Issuers, ongoing monitoring of Issuer credit quality and program compliance, and the requirement that all mortgages supporting the NHA MBS be insured against borrower default. CMHC has further mitigated this risk by having been assigned all rights, title and interest in the underlying mortgages so that it has access to principal and interest payments in the event of Issuer default.
Credit Quality
The following table presents the credit quality of the Corporation’s Cash Equivalents and Investment Securities based on an internal credit rating system.
| 2012 | 2011 | |||||||||||||||||||||||||||||||||
| AA- | A- to | Lower | AA- | A- to | Lower | |||||||||||||||||||||||||||||
| (in millions) | AAA | to AA+ | A+ | than A- | AAA | to AA+ | A+ | than A- | ||||||||||||||||||||||||||
Cash Equivalents | 724 | 302 | 200 | - | 1,410 | 50 | - | - | ||||||||||||||||||||||||||
Investment Securities(1) | ||||||||||||||||||||||||||||||||||
Designated at Fair Value | 164 | 456 | 171 | 137 | 168 | 441 | 175 | 119 | ||||||||||||||||||||||||||
Available for Sale | 6,616 | 3,573 | 5,171 | 570 | 5,290 | 3,312 | 4,932 | 631 | ||||||||||||||||||||||||||
| (1) | Includes fixed income investments only. |
Maximum Exposure to Credit Risk
Loans and Investments in Housing Programs: CMHC’s maximum exposure to credit risk is the carrying amount of Loans and Investments in Housing Programs.
Investment assets: CMHC’s maximum exposure to credit risk is the carrying amount of investment assets held on the Consolidated Balance Sheet.
Securities Purchased Under Resale Agreements: By their nature, these balances have a low credit risk given their short terms and as they are largely secured by obtaining collateral from counterparties. Collateral agreements provide for the posting of collateral by the counterparty when CMHC’s exposure to that entity exceeds a certain ratings-based threshold. Securities held as eligible collateral include debt obligations issued by or guaranteed by the Government of Canada, including Crown corporations and CHT. Collateral held to offset mark-to-market exposures from these transactions should not be used for any other purpose than to offset such exposure. In the event of counterparty default, CMHC has the right to liquidate collateral held. The fair value of collateral held by CMHC as at 31 December 2012 was nil (2011 – nil).
Derivatives: CMHC limits its credit risk associated with derivative transactions by dealing with swap counterparties whose credit ratings are in accordance with CMHC’s Enterprise Risk Management Policies, which are approved by the Board of Directors and are in accordance with Department of Finance Guidelines; through the use of International Swaps Derivatives Association (ISDA) master netting agreements for derivatives which have been entered into with all counterparties; and where appropriate, through the use of ratings-based collateral thresholds in the Credit Support Annexes. The master netting agreements give CMHC a legally enforceable right to reduce derivative exposure through the provision of a single net settlement of all financial instruments covered by the agreement with the same counterparty in the event of default. All derivative counterparties must have a minimum credit rating of A-, or its equivalent, from at least two rating agencies.
144 C A N A D A M O R T G A G E A N D H O U S I N G C O R P O R A T I O N
The following table presents the Corporation’s credit exposure of derivatives by term to maturity (excluding those related to NHA Mortgage-Backed Securities – Loans and Receivables).
| Replacement value(1) | Potential | Total Credit Exposure | ||||||||||||||||||||||||||||||
| Future | ||||||||||||||||||||||||||||||||
| Within | 1 to 3 | 3 to 5 | Over 5 | Credit | ||||||||||||||||||||||||||||
| (in millions) | 1 Year | Years | Years | Years | Exposure(2) | 2012 | 2011 | |||||||||||||||||||||||||
Interest Rate Swaps | 13 | 33 | 42 | 62 | 14 | 164 | 195 | |||||||||||||||||||||||||
| (1) | Represents the total current fair value including accrued interest of all outstanding contracts with a positive fair value, after factoring in the impact of master netting agreements. |
| (2) | Represents an add-on that is an estimate of the potential change in the market value of the transaction up to maturity which is calculated in relation to the notional principal of the contracts by applying factors consistent with guidelines issued by the Office of the Superintendent of Financial Institutions. |
The fair value of the collateral related to derivatives held by CMHC (including those related to NHA MBS Loans Receivable – IMPP) as at 31 December 2012 was $316 million (2011 – $739 million).
Timely Payment Guarantees: CMHC’s maximum exposure to credit risk is the total guarantees-in-force as disclosed in Note 11.
Allowance for Credit Losses
In the event of mortgage default, the Corporation may take an assignment of the insured mortgage and pay the insured lender the loan balance, rather than proceed with the acquisition of the property through title transfer claim. In addition, in an effort to minimize future insurance claims resulting from insured mortgages provided to market or assisted housing rental projects, the Corporation may make advances to the project in order to help it return to a state where the borrower can manage their mortgage obligations. The allowance for credit losses is established to provide for estimated amounts that may not be recovered. Factors that are considered in assessing the estimated realizable amount include, but are not limited to, underlying asset valuation, and any changes in market and economic outlook. The allowance for credit losses is included as a reduction to Accounts Receivable and Other Assets and any change in the allowance is included in Net Claims. At 31 December 2012, the allowance was $263 million (2011 – $230 million) relating to financial assets of $286 million (2011 – $271 million). The following table shows the changes in the allowance for credit losses.
| (in millions) | 2012 | 2011 | ||||||
Balance at Beginning of Year | 230 | 162 | ||||||
Recoveries | (10) | (4) | ||||||
Provision for Credit Losses | 43 | 72 | ||||||
Balance at End of Year | 263 | 230 | ||||||
Investment in NHA Mortgage-Backed Securities – Loans and Receivables
As described in Note 6, the Corporation holds collateral which serves as the sole source of repayment for the Investment in NHA MBS – Loans and Receivables. The fair value of this collateral is as follows:
| (in millions) | 2012 | 2011 | ||||||
NHA Mortgage-Backed Securities(2) – IMPP | 38,634 | 50,012 | ||||||
Reinvestment Securities(1) – IMPP | 14,081 | 6,156 | ||||||
NHA Mortgage-Backed Securities(2) – CHT | 179,337 | 178,313 | ||||||
Reinvestment Securities(1) – CHT | 26,838 | 26,567 | ||||||
Total | 258,890 | 261,048 | ||||||
| (1) | Fair value determined based on Level 1 Criteria as per fair value hierarchy. |
| (2) | Fair value determined based on Level 2 Criteria as per fair value hierarchy. |
145
IMPP reinvestment securities are limited to high quality assets, as follows: cash, Government of Canada obligations, Canada Mortgage Bonds, NHA MBS and eligible repurchase agreements of Government of Canada securities. CHT reinvestment securities are rated R-1 (high) or AAA by at least two rating agencies.
CHT is also exposed to credit-related risk in the event of default of swap counterparties. This risk is mitigated by transacting with highly rated swap counterparties and collateralization requirements based on credit ratings. The fair value of swap collateral held by CHT as at 31 December 2012 was $295 million (2011 – $363 million).
| 20. | LIQUIDITY RISK |
Liquidity risk is the risk that the Corporation will encounter difficulty in meeting obligations associated with financial liabilities. The Corporation’s liquidity risk comprises both funding liquidity risk, which is the risk that CMHC will be unable to meet its payment obligations when required due to an inability to borrow or realize on overdraft facilities, and market liquidity risk, which is the risk that CMHC is not able to unwind or offset a particular position without incurring losses, because of inadequate market depth or market disruption.
The principal financial obligations exposing the Corporation to liquidity risk include, but are not limited to:
| ¡ | the payment of claims incurred by the Mortgage Loan Insurance Activity; |
| ¡ | the need to fulfill the timely payment guarantees provided by the Corporation if sufficient funds are not available for the payment of principal or interest on NHA MBS or CMB by Approved Issuers or CHT, respectively; and |
| ¡ | payments required by the Corporation’s Borrowings and Derivatives. |
The Corporation has a liquidity risk policy which includes appropriate limits and other mitigants to ensure sufficient resources to meet current and projected cash requirements.
The Mortgage Loan Insurance and Securitization investment portfolios are managed to ensure that there is sufficient cash flow to meet projected claims. Sources of liquidity include: fees, premiums, investment income and proceeds from sales and maturities of investments.
Within the CMB Program, the Corporation’s liquidity risk refers to the risk that CMHC may not be able to provide the funding required, in a timely fashion, to satisfy a call on its timely payment guarantee obligation. Policies in place to mitigate this risk include ensuring high credit quality investments as permitted by the Trust Agreement and swap counterparties and the establishment of maturity monitoring guidelines. Liquidity sources in the event of an immediate need to fulfill the timely payment guarantee include overdraft facilities and cash and short-term investments in marketable securities as well as a $350 million line of credit with the Central Paying Agent.
146 C A N A D A M O R T G A G E A N D H O U S I N G C O R P O R A T I O N
The Lending Activity investment portfolio is managed to ensure that there is sufficient cash flow to meet funding needs in case of contingencies causing operational disruptions, unanticipated needs, and to facilitate use of the Crown Borrowing Program. The asset/liability management strategy ensures that the assets are maintained at the same level as the liabilities. Derivatives are used to hedge mismatches in the timing of cash flows. Further sources of liquidity associated with this portfolio include overdraft facilities and cash and short-term investments in marketable securities. For any additional liquidity requirements, CMHC can access the Crown Borrowing Program and lines of credit upon Department of Finance approval.
The Corporation’s commercial paper program remains available to meet cash requirements on a daily basis, subject to approval by the Minister of Finance on a transaction by transaction basis. The Corporation also mitigates liquidity risk through the use of ISDA master netting agreements reducing the amount of cash required to satisfy derivative obligations.
The following table presents the undiscounted contractual cash flows payable by the Corporation, including accrued interest, under financial liabilities by remaining contractual maturities.
| Within 1 | 1 to 3 | 3 to12 | 1 to 5 | Over 5 | ||||||||||||||||||||||||
| (in millions) | Month | Months | Months | Years | Years | 2012 | 2011 | |||||||||||||||||||||
Securities Sold Under Repurchase Agreements | 45 | 380 | - | - | - | 425 | 272 | |||||||||||||||||||||
Canada Mortgage Bonds | - | 720 | 39,740 | 140,079 | 41,497 | 222,036 | 220,869 | |||||||||||||||||||||
Capital Market Borrowings | - | 16 | 410 | 1,526 | - | 1,952 | 2,337 | |||||||||||||||||||||
Borrowings from the Government of Canada | 546 | 1,340 | 24,804 | 36,408 | 6,782 | 69,880 | 75,391 | |||||||||||||||||||||
Derivatives | 4 | 6 | 6 | 30 | (2) | 44 | 78 | |||||||||||||||||||||
Total | 595 | 2,462 | 64,960 | 178,043 | 48,277 | 294,337 | 298,947 | |||||||||||||||||||||
Commitments related to Loans and Investments in Housing Programs are outlined in Note 25. Financial guarantees are outlined in Note 11.
Lines of Credit
At 31 December 2012, CMHC had $300 million (2011 – $300 million) of overnight overdraft facility available with its banker that had not been drawn.
| 21. | POSTEMPLOYMENT BENEFITS |
CMHC provides a registered defined benefit Pension Plan (“the Plan”), supplemental pension plans and other post-employment benefits. The total defined benefit liability is included in Accounts Payable and Other Liabilities.
Total cash payments for post-employment benefits were $50 million (2011 – $54 million). They include contributions by CMHC to its defined benefit pension plan and payments under the unfunded supplemental pension plans. They also include disbursements for unfunded other post-employment benefits which consist of payments to a third-party service provider on behalf of retired employees and payments made directly to employees, their beneficiaries or estates.
147
The actuarial valuation on a going concern basis of CMHC’s registered Pension Plan reports a deficit as at 31 December 2012. As a result, the Corporation will be required to make going concern special payments of between $3.4 and $4.8 million annually for 15 years to amortize the going concern deficit. The valuation on a solvency basis has not been finalized as of 22 March 2013, however, the Corporation anticipates that the report will show a deficit position on a solvency basis. Should this be the case, the Corporation will be required to make special payments to reduce the solvency deficiency, the amounts of which can only be estimated at this time. Once the solvency deficiency has been finalized, as is permitted under the Pension Benefits Standards Act, 1985 (PBSA) and its related regulations, the Corporation will seek approval to reduce the amount of the solvency special payments. These provisions exist to make funding requirements less sensitive to financial market volatility. The reductions would decrease the solvency special payments in 2013 from between $115.1 million and $126.6 million to between $76.1 million to $87.5 million. As such, the total special payments are expected to be between $80.9 million and $92.3 million in 2013 (2012 – $23.5 million).
CMHC continues to make full normal contributions and to monitor the Pension Fund. The next actuarial valuation will be undertaken as at year-end 2013, with the results to be reported in the 2013 Annual Report Financial Statements.
Information about the defined benefit plans is as follows:
Pension Plans | Other Post-employment Benefits | |||||||||||||||||
| (in millions) | 2012 | 2011 | 2012 | 2011 | ||||||||||||||
Defined Benefit Obligation | ||||||||||||||||||
Balance at Beginning of Year | 1,599 | 1,414 | 183 | 170 | ||||||||||||||
Current Service Cost | 29 | 25 | 5 | 4 | ||||||||||||||
Employees’ Contributions | 13 | 12 | - | - | ||||||||||||||
Interest Cost | 72 | 72 | 8 | 9 | ||||||||||||||
Benefits Paid | (69) | (65) | (5) | (6) | ||||||||||||||
Actuarial Loss | 162 | 141 | 19 | 6 | ||||||||||||||
Balance at End of Year | 1,806 | 1,599 | 210 | 183 | ||||||||||||||
Fair Value of Plan Assets | ||||||||||||||||||
Balance at Beginning of Year | 1,178 | 1,178 | - | - | ||||||||||||||
Expected Return on Plan Assets | 72 | 76 | - | - | ||||||||||||||
Actuarial (Loss) Gain | 60 | (71) | - | - | ||||||||||||||
Employer’s Contributions | 45 | 48 | 5 | 6 | ||||||||||||||
Employees’ Contributions | 13 | 12 | - | - | ||||||||||||||
Benefits Paid | (69) | (65) | (5) | (6) | ||||||||||||||
Balance at End of Year | 1,299 | 1,178 | - | - | ||||||||||||||
Funded Status – Plan Deficit | (507) | (421) | (210) | (183) | ||||||||||||||
Unamortized Past Service Costs | - | - | 1 | 1 | ||||||||||||||
Defined Benefit Liability | (507) | (421) | (209) | (182) | ||||||||||||||
The Actuarial (Loss) Gain on plan assets is the difference between the actual and expected return on plan assets. The Actual Return on Plan Assets was $132 million (2011 – $5 million).
148 C A N A D A M O R T G A G E A N D H O U S I N G C O R P O R A T I O N
The Funded Status, as well as the experience adjustments arising on the defined benefit obligation and plan assets, are summarized as follows:
| (in millions) | 2012 | 2011 | 2010 | |||||||||
Pension Plans | ||||||||||||
Fair Value of Plan Assets | 1,299 | 1,178 | 1,178 | |||||||||
Defined Benefit Obligation | 1,806 | 1,599 | 1,414 | |||||||||
Funded Status – Plan Surplus (Deficit) | (507) | (421) | (236) | |||||||||
Experience Gains (Losses) on Defined Benefit Obligation | (8) | (14) | (1) | |||||||||
Experience Gains (Losses) on Plan Assets | 60 | (71) | 9 | |||||||||
Other Post-employment Benefits | ||||||||||||
Fair Value of Plan Assets | - | - | - | |||||||||
Defined Benefit Obligation | 210 | 183 | 170 | |||||||||
Funded Status – Plan Surplus (Deficit) | (210) | (183) | (170) | |||||||||
Experience Gains (Losses) on Defined Benefit Obligation | 3 | 12 | 7 | |||||||||
Experience Gains (Losses) on Plan Assets | - | - | - | |||||||||
The defined benefit obligation relating to plans which are wholly or partially funded and those which are wholly unfunded is as follows:
| Pension Plans | Other Post-employment Benefits | |||||||||||||||||
| (in millions) | 2012 | 2011 | 2012 | 2011 | ||||||||||||||
Wholly or Partially Funded | 1,747 | 1,547 | - | - | ||||||||||||||
Wholly Unfunded | 59 | 52 | 210 | 183 | ||||||||||||||
Defined Benefit Obligation | 1,806 | 1,599 | 210 | 183 | ||||||||||||||
The plan assets and the defined benefit obligation were measured for accounting purposes as at 31 December 2012. In performing this measurement, the following assumptions were adopted.
| 2012 | 2011 | |||||||
Defined Benefit Obligation | ||||||||
Discount Rate | 3.90% | 4.50% | ||||||
Rate of Compensation Increase | 3.00% | 3.00% | ||||||
Benefit Costs | ||||||||
Discount Rate | 4.50% | 5.10% | ||||||
Rate of Compensation Increase | 3.00% | 3.00% | ||||||
Expected Rate of Return on Plan Assets | 6.11% | 6.10% | ||||||
The Expected Rate of Return on plan assets was determined based on historical rates of return by asset class, current market indicators and the current and expected allocation of plan assets.
A 6.9% (2011 – 7.2%) increase in health care costs was assumed for 2012, with 0.2% (2011 – 0.2%) average decreases per year thereafter to an ultimate trend rate of 4.5% which is expected to be achieved by 2029.
149
The following table shows the impact of changes in the assumptions.
| (in millions) | Increase (Decrease) in Defined Benefit Obligation | Increase (Decrease) in Net Benefit Costs Recognized in Operating Expense | ||||||
50 bps Increase/Decrease in Discount Rate | (147)/160 | (3)/2 | ||||||
50 bps Increase/Decrease in Rate of Compensation Increase | 23/(22) | 3/(3) | ||||||
50 bps Increase/Decrease in Long-term Rate of Return on Plan Assets | - | (6)/6 | ||||||
100 bps Increase/Decrease in Health Care Cost Trend Rates | 28/(22) | 2/(2) | ||||||
CMHC’s annual net benefit plan costs recognized in Operating Expenses are as follows:
| Pension Plans | Other Post-employment Benefits | |||||||||||||||||
| (in millions) | 2012 | 2011 | 2012 | 2011 | ||||||||||||||
Current Service Cost, Net of Employees’ Contributions | 29 | 25 | 5 | 4 | ||||||||||||||
Interest Cost | 72 | 72 | 8 | 9 | ||||||||||||||
Expected Return on Plan Assets (Gain) Loss | (72) | (76) | - | - | ||||||||||||||
Defined Benefit Plan Expense | 29 | 21 | 13 | 13 | ||||||||||||||
The net benefit plan costs recognized as decreases to Other Comprehensive Income, relating to Net Actuarial Losses before tax, are $102 million (2011 – $212 million) for Pension Plans and $19 million (2011 – $6 million) for Other Post-employment Benefits.
The cumulative amount of Net Actuarial Losses, before tax, recognized in Other Comprehensive Income, is $453 million.
Information on defined benefit pension plan assets is as follows:
| Percentage of Fair Value | ||||||||
| of Total Plan Assets | ||||||||
| (in millions) | 2012 | 2011 | ||||||
Short-term Investments(1) | 2.19% | 1.35% | ||||||
Bonds and Debentures(2) | 21.21% | 22.55% | ||||||
Equities | 63.13% | 62.73% | ||||||
Real Return Securities(3) | 2.57% | 2.81% | ||||||
Real Estate | 10.90% | 10.56% | ||||||
Total | 100.00% | 100.00% | ||||||
| (1) | Includes $26 million or 2.04% (2011 – $12 million or 0.98%) of investments made in related parties. |
| (2) | Includes $25 million or 1.89% (2011 – $20 million or 1.67%) of investments made in the Corporation (Canada Mortgage Bonds) and $54 million or 4.18% (2011 – $57 million or 4.87%) of investments made in related parties. |
| (3) | Includes $30 million or 2.28% (2011 – $29 million or 2.48%) of investments made in related parties. |
The interest paid by CMHC to the pension plan amounted to $1 million in 2012 (2011 – $1 million). In 2012, there was a net charge in the amount of $4.9 million (2011 – $4.7 million) from CMHC to the pension plans for administrative services.
In 2013, CMHC expects to make post-employment benefits contributions of approximately $107.4 million to $118.9 million, depending upon the registered Pension Plan solvency valuation results.
150 C A N A D A M O R T G A G E A N D H O U S I N G C O R P O R A T I O N
| 22. | INVESTMENT PROPERTY |
The following table presents the changes in the fair value of investment properties included in Accounts Receivable and Other Assets:
| (in millions) | 2012 | 2011 | ||||||
Balance at Beginning of Year | 191 | 146 | ||||||
Capitalized Expenditures on Existing Investment Property | - | 1 | ||||||
Additions | - | 36 | ||||||
Disposals | (1) | - | ||||||
Unrealized Fair Value Gains | 14 | 8 | ||||||
Balance at End of Year | 204 | 191 | ||||||
Of the balance of Investment Property at 31 December 2012, $123 million is held by the Lending Activity and $81 million is held by the Mortgage Loan Insurance Activity.
Fair Value
Of the total fair value of Investment Properties, 9% (2011 – 80%) is based on valuations performed by independent valuators and 91% (2011 – 20%) is based on internal valuations.
The income approach is primarily applied in determining the fair value of rent-producing properties. Under the income approach, fair value is based upon the present value of expected future cash flows of each property using a discount rate reflective of the characteristics of the property. The market approach is applied primarily in determining the fair value of vacant land. Under the market approach, fair value is based upon market transactions involving comparable property.
The income approach was used to measure $99 million (2011 – $57 million) of the total fair value of Investment Property, while the market approach was used to measure $105 million (2011 – $134 million). Discount rates between 5.5% and 8.8% were used in applying the income approach.
Certain Lending Activity Investment Properties have been provided to lessees under long-term operating leases. The terms of these leases allow the lessees to develop and/or operate a rental property. The lessees are entitled to the property’s income and are responsible for its operating and capital costs. The fair value of these properties, $21 million (2011 – $19 million), is based on the present value of the lease payments CMHC will receive over the lease term plus the present value of the expected future cash flows commencing upon the property’s reversion to CMHC. The remaining terms of the associated operating leases are between 5 and 30 years. The valuations of properties leased out under long-term operating leases were reduced by $14 million (2011 – $16 million) to reflect the impact of those leases on the properties’ fair value.
151
| 23. | SEGMENTED INFORMATION |
As described in Note 1, the Consolidated Financial Statements include the accounts of CMHC’s four activities (Mortgage Loan Insurance, Securitization, Housing Programs and Lending Activity), each of which provides different programs in support of CMHC’s objectives, and the Canada Housing Trust. The financial results of each activity are determined using the accounting policies described in Note 2. The Lending Activity includes certain corporate items that are not allocated to each activity. The Housing Programs Activity includes reimbursements to the Lending Activity as described in Note 9. These reimbursements are not eliminated in the following table. Revenues are attributed to, and assets are located in, Canada.
| Mortgage Loan | Housing | Canada | ||||||||||||||||||||||||||||||||||||||||||||||||||||||
| Insurance | Securitization | Programs | Lending | Housing Trust | Eliminations | Total | ||||||||||||||||||||||||||||||||||||||||||||||||||
| (in millions) | 2012 | 2011 | 2012 | 2011 | 2012 | 2011 | 2012 | 2011 | 2012 | 2011 | 2012 | 2011 | 2012 | 2011 | ||||||||||||||||||||||||||||||||||||||||||
| REVENUES | ||||||||||||||||||||||||||||||||||||||||||||||||||||||||
| Interest Income from NHA MBS – Loans and Receivables | - | - | 1,682 | 1,747 | - | - | - | - | 5,999 | 6,527 | - | - | 7,681 | 8,274 | ||||||||||||||||||||||||||||||||||||||||||
| Premiums and Fees | 1,807 | 1,791 | 242 | 211 | - | - | - | - | - | - | - | - | 2,049 | 2,002 | ||||||||||||||||||||||||||||||||||||||||||
| Interest Earned on Loans | - | - | - | - | - | - | 580 | 658 | - | - | - | - | 580 | 658 | ||||||||||||||||||||||||||||||||||||||||||
| Income from Investment Securities | 605 | 602 | 33 | 41 | - | - | 37 | 37 | - | - | (47) | (58) | 628 | 622 | ||||||||||||||||||||||||||||||||||||||||||
| Net Realized Gains (Losses) from Financial Instruments | 92 | 251 | 84 | 31 | - | - | - | - | - | - | (41) | (85) | 135 | 197 | ||||||||||||||||||||||||||||||||||||||||||
| Net Unrealized Gains (Losses) from Financial Instruments | 66 | (81) | 5 | (4) | - | - | (8) | (23) | - | - | 2 | (10) | 65 | (118) | ||||||||||||||||||||||||||||||||||||||||||
| Parliamentary Appropriations and Other Income | 7 | 7 | 15 | 18 | 2,197 | 2,163 | 31 | 21 | 168 | 175 | (101) | (105) | 2,317 | 2,279 | ||||||||||||||||||||||||||||||||||||||||||
| 2,577 | 2,570 | 2,061 | 2,044 | 2,197 | 2,163 | 640 | 693 | 6,167 | 6,702 | (187) | (258) | 13,455 | 13,914 | |||||||||||||||||||||||||||||||||||||||||||
| EXPENSES | ||||||||||||||||||||||||||||||||||||||||||||||||||||||||
| Interest Expense | 5 | 3 | 1,682 | 1,747 | - | - | 599 | 650 | 5,990 | 6,518 | (98) | (112) | 8,178 | 8,806 | ||||||||||||||||||||||||||||||||||||||||||
| Operating Expenses | 199 | 193 | 11 | 10 | 123 | 119 | 19 | 19 | 177 | 184 | (102) | (105) | 427 | 420 | ||||||||||||||||||||||||||||||||||||||||||
| Housing Programs and Net Claims | 487 | 562 | - | - | 2,074 | 2,044 | - | - | - | - | - | - | 2,561 | 2,606 | ||||||||||||||||||||||||||||||||||||||||||
| 691 | 758 | 1,693 | 1,757 | 2,197 | 2,163 | 618 | 669 | 6,167 | 6,702 | (200) | (217) | 11,166 | 11,832 | |||||||||||||||||||||||||||||||||||||||||||
| Income Taxes | 472 | 476 | 95 | 76 | - | - | 3 | 11 | - | - | 3 | (10) | 573 | 553 | ||||||||||||||||||||||||||||||||||||||||||
| NET INCOME (LOSS) | 1,414 | 1,336 | 273 | 211 | - | - | 19 | 13 | - | - | 10 | (31) | 1,716 | 1,529 | ||||||||||||||||||||||||||||||||||||||||||
| Total Revenues | 2,577 | 2,570 | 2,061 | 2,044 | 2,197 | 2,163 | 640 | 693 | 6,167 | 6,702 | (187) | (258) | 13,455 | 13,914 | ||||||||||||||||||||||||||||||||||||||||||
| Inter-segment/entity Revenues(1) | (77) | (132) | - | - | - | - | (9) | (21) | (101) | (105) | 187 | 258 | - | - | ||||||||||||||||||||||||||||||||||||||||||
| External Revenues | 2,500 | 2,523 | 2,061 | 2,044 | 2,197 | 2,163 | 631 | 672 | 6,066 | 6,512 | - | - | 13,455 | 13,914 | ||||||||||||||||||||||||||||||||||||||||||
| (1) | Inter-segment/entity Revenues relate to the following: |
| ¡ | the Mortgage Loan Insurance Activity recognizes revenues from investing in holdings of Canada Mortgage Bonds (issued by the CHT) and Capital Market Borrowings (issued by the Lending Activity); |
| ¡ | the Lending Activity recognizes revenues from investing in holdings of Canada Mortgage Bonds; and |
| ¡ | the Securitization Activity receives CMB guarantee fees and advisory fees from CHT, and recognizes revenues from investing in holdings of Capital Market Borrowings. |
152 C A N A D A M O R T G A G E A N D H O U S I N G C O R P O R A T I O N
| Mortgage Loan | Housing | Canada | ||||||||||||||||||||||||||||||||||||||||||||||||||||||
| Insurance | Securitization | Programs | Lending | Housing Trust | Eliminations(1) | Total | ||||||||||||||||||||||||||||||||||||||||||||||||||
| (in millions) | 2012 | 2011 | 2012 | 2011 | 2012 | 2011 | 2012 | 2011 | 2012 | 2011 | 2012 | 2011 | 2012 | 2011 | ||||||||||||||||||||||||||||||||||||||||||
| ASSETS | ||||||||||||||||||||||||||||||||||||||||||||||||||||||||
| Cash and Cash Equivalents | 759 | 967 | 27 | 86 | - | - | 433 | 347 | 1 | 1 | - | - | 1,220 | 1,401 | ||||||||||||||||||||||||||||||||||||||||||
| Securities Purchased Under Resale Agreements | - | - | - | - | - | - | 63 | - | - | - | - | - | 63 | - | ||||||||||||||||||||||||||||||||||||||||||
| Investment Securities: | ||||||||||||||||||||||||||||||||||||||||||||||||||||||||
Designated at Fair Value through Profit or Loss | 75 | 66 | 1 | 1 | - | - | 1,282 | 1,325 | - | - | (430) | (489) | 928 | 903 | ||||||||||||||||||||||||||||||||||||||||||
Held for Trading | 415 | 375 | - | 22 | - | - | - | - | - | - | - | - | 415 | 397 | ||||||||||||||||||||||||||||||||||||||||||
Available for Sale | 19,064 | 17,629 | 1,799 | 1,502 | - | - | - | - | - | - | (1,559) | (1,582) | 19,304 | 17,549 | ||||||||||||||||||||||||||||||||||||||||||
| Investment in NHA MBS: | ||||||||||||||||||||||||||||||||||||||||||||||||||||||||
Loans and Receivables | - | - | 52,448 | 55,401 | - | - | - | - | 203,519 | 201,254 | - | - | 255,967 | 256,655 | ||||||||||||||||||||||||||||||||||||||||||
| Loans: | ||||||||||||||||||||||||||||||||||||||||||||||||||||||||
Designated at Fair Value through Profit or Loss | - | - | - | - | - | - | 6,591 | 7,132 | - | - | - | - | 6,591 | 7,132 | ||||||||||||||||||||||||||||||||||||||||||
Other | - | - | - | - | - | - | 4,440 | 4,726 | - | - | - | - | 4,440 | 4,726 | ||||||||||||||||||||||||||||||||||||||||||
Investments in Housing | ||||||||||||||||||||||||||||||||||||||||||||||||||||||||
Programs | - | - | - | - | - | - | 748 | 808 | - | - | - | - | 748 | 808 | ||||||||||||||||||||||||||||||||||||||||||
| Accrued Interest Receivable | 97 | 101 | 83 | 86 | - | - | 245 | 261 | 540 | 540 | (6) | (5) | 959 | 983 | ||||||||||||||||||||||||||||||||||||||||||
| Deferred Income Tax Assets | (20) | (34) | 1 | (1) | - | - | 42 | 67 | - | - | 35 | 46 | 58 | 78 | ||||||||||||||||||||||||||||||||||||||||||
| Derivatives | - | - | - | - | - | - | 131 | 169 | - | - | - | - | 131 | 169 | ||||||||||||||||||||||||||||||||||||||||||
| Due from the Government of Canada | - | - | - | - | - | - | 309 | 403 | - | - | - | - | 309 | 403 | ||||||||||||||||||||||||||||||||||||||||||
| Accounts Receivable and Other Assets | 617 | 523 | (25) | (49) | - | - | 315 | 212 | - | - | - | - | 907 | 686 | ||||||||||||||||||||||||||||||||||||||||||
| 21,007 | 19,627 | 54,334 | 57,048 | - | - | 14,599 | 15,450 | 204,060 | 201,795 | (1,960) | (2,030) | 292,040 | 291,890 | |||||||||||||||||||||||||||||||||||||||||||
| LIABILITIES | ||||||||||||||||||||||||||||||||||||||||||||||||||||||||
| Securities Sold Under | ||||||||||||||||||||||||||||||||||||||||||||||||||||||||
| Repurchase Agreements | 425 | 272 | - | - | - | - | - | - | - | - | - | - | 425 | 272 | ||||||||||||||||||||||||||||||||||||||||||
| Borrowings: | ||||||||||||||||||||||||||||||||||||||||||||||||||||||||
Canada Mortgage Bonds | - | - | - | - | - | - | - | - | 203,519 | 201,254 | (1,843) | (1,881) | 201,676 | 199,373 | ||||||||||||||||||||||||||||||||||||||||||
Capital Market Borrowings | - | - | - | - | - | - | 1,862 | 2,218 | - | - | (14) | (15) | 1,848 | 2,203 | ||||||||||||||||||||||||||||||||||||||||||
Borrowings from the Government of Canada | - | - | 52,448 | 55,401 | - | - | 11,806 | 12,146 | - | - | - | - | 64,254 | 67,547 | ||||||||||||||||||||||||||||||||||||||||||
| Accrued Interest Payable | - | - | 77 | 80 | - | - | 142 | 245 | 540 | 540 | (6) | (5) | 753 | 860 | ||||||||||||||||||||||||||||||||||||||||||
| Derivatives | - | - | - | - | - | - | 46 | 72 | - | - | - | - | 46 | 72 | ||||||||||||||||||||||||||||||||||||||||||
| Accounts Payable and Other Liabilities | 487 | 400 | 35 | 31 | - | - | 734 | 740 | 1 | 1 | - | - | 1,257 | 1,172 | ||||||||||||||||||||||||||||||||||||||||||
| Provision for Claims | 996 | 1,041 | - | - | - | - | - | - | - | - | - | - | 996 | 1,041 | ||||||||||||||||||||||||||||||||||||||||||
| Unearned Premiums and Fees | 6,394 | 6,731 | 546 | 528 | - | - | - | - | - | - | - | - | 6,940 | 7,259 | ||||||||||||||||||||||||||||||||||||||||||
| 8,302 | 8,444 | 53,106 | 56,040 | - | - | 14,590 | 15,421 | 204,060 | 201,795 | (1,863) | (1,901) | 278,195 | 279,799 | |||||||||||||||||||||||||||||||||||||||||||
| EQUITY OF CANADA | 12,705 | 11,183 | 1,228 | 1,008 | - | - | 9 | 29 | - | - | (97) | (129) | 13,845 | 12,091 | ||||||||||||||||||||||||||||||||||||||||||
| (1) | The Balance Sheet Eliminations remove inter-entity holdings of Canada Mortgage Bonds and Capital Market Borrowings, as well as inter-segment receivables/payables. |
153
| 24. | RELATED PARTY TRANSACTIONS |
The Corporation’s related parties include the Government of Canada and its departments; agencies and Crown corporations; CMHC’s Key Management Personnel and their close family members; CMHC’s defined benefit pension plan; CHT; and Nordea.
All material related party transactions and outstanding balances are either disclosed below or in relevant notes.
In accordance with IAS 24, transactions or balances between the entities that have been eliminated on consolidation are not reported.
Government of Canada and its Departments, Agencies and Crown Corporations
The Corporation is related in terms of common ownership to all Government of Canada departments, agencies and Crown corporations. The Corporation enters into transactions with certain of these entities in the normal course of business.
| a) | The following tables summarize income earned and receivable as well as the total amount invested in instruments issued or guaranteed by the Government of Canada. |
| (in millions) | 2012 | 2011 | ||||||
Investment Income – Cash Equivalents | 6 | 5 | ||||||
Investment Income – Investment Securities | 101 | 69 | ||||||
| (in millions) | 2012 | 2011 | ||||||
Cash Equivalents | 182 | 677 | ||||||
Investment Securities | 5,240 | 3,592 | ||||||
Interest Receivable – Investment Securities | 18 | 14 | ||||||
| b) | CMHC pays the Government of Canada fees in recognition of the Government’s financial backing of the Mortgage Loan Insurance and Securitization Activities. The fees, which are recorded as a reduction of Other Income, amount to $12 million (2011 – $11 million) for the Securitization Activity and nil (2011 – nil) for the Mortgage Loan Insurance Activity. The fee for the Mortgage Loan Insurance Activity is nil as CMHC’s Earnings Set Aside for Capitalization equals 100% of its target capital level calculated in accordance with guidelines set out by OSFI. |
Key Management Personnel
The following table presents the compensation of CMHC’s Key Management, defined as those persons having authority and responsibility for planning, directing and controlling its activities. This includes the Board of Directors and the following members of the Management Committee: the President and CEO, the Vice-Presidents, the General Counsel and the Corporate Secretary, the Chief Risk Officer and the Chief, Audit and Evaluation Services.
2012 | 2011 | |||||||||||||||||||||||||
| Management | Management | |||||||||||||||||||||||||
| Board of | Committee | Board of | Committee | |||||||||||||||||||||||
| (in thousands) | Directors | Members | Total | Directors | Members | Total | ||||||||||||||||||||
Short-term Benefits | 241 | 3,625 | 3,866 | 172 | 3,218 | 3,390 | ||||||||||||||||||||
Post-employment Benefits | - | 624 | 624 | - | 624 | 624 | ||||||||||||||||||||
Total | 241 | 4,249 | 4,490 | 172 | 3,842 | 4,014 | ||||||||||||||||||||
Receivable balances outstanding with members of CMHC’s Key Management Personnel as at 31 December 2012 are nil.
154 C A N A D A M O R T G A G E A N D H O U S I N G C O R P O R A T I O N
| 25. | COMMITMENTS AND CONTINGENT LIABILITIES |
| a) | Commitments outstanding for Loans and Investments in Housing Programs, net of forgiveness, amounted to $123 million at 31 December 2012 (2011 – $140 million) and are normally advanced within a two-year period. |
| b) | Commitments outstanding for advances to mortgage-insured assisted housing projects in financial difficulty amounted to $47 million at 31 December 2012 (2011 – $72 million) and are normally advanced within a ten-year period. Advances in the amount of $45 million are expected to be made over the next five years and the remainder to be advanced beyond five years. |
| c) | Total estimated remaining contractual financial obligations are as follows: |
| (in millions) | 2013 | 2014 | 2015 | 2016 | 2017 |
2018 and | ||||||||||||||||||
Housing Programs(1) | 1,671 | 1,566 | 1,505 | 1,458 | 1,403 | 10,336 | ||||||||||||||||||
Operating Leases | 20 | 14 | 12 | 12 | 12 | 38 | ||||||||||||||||||
Finance Leases | 4 | 4 | 3 | - | - | - | ||||||||||||||||||
Total | 1,695 | �� | 1,584 | 1,520 | 1,470 | 1,415 | 10,374 | |||||||||||||||||
| (1) | Total remaining contractual financial obligations for Housing Programs extend for periods up to 27 years (2011 – 28 years). |
| d) | In addition to the lines of credit disclosed in Note 20, CMHC has a $88 million (2011 – $88 million) letter of credit outstanding. |
| e) | There are legal claims of $43 million (2011 – $20 million) against CMHC. Due to the uncertainty of the outcome of these claims, no provision for loss has been recorded. CMHC does not expect the ultimate resolution of any of the proceedings to which CMHC is party to have a significant adverse effect on its financial position. |
| 26. | OPERATING EXPENSES |
The following table presents the composition of Operating Expenses.
| (in millions) |
2012 | 2011 | ||||||
Personnel Costs | 243 | 235 | ||||||
Depreciation of Premises and Equipment | 3 | 3 | ||||||
Other Administrative Goods and Services | 181 | 182 | ||||||
Total Operating Expenses | 427 | 420 | ||||||
155
| 27. | CURRENT AND NON-CURRENT ASSETS AND LIABILITIES |
| 2012 | 2011 | |||||||||||||||||||||||||
| Within | After | Within | After | |||||||||||||||||||||||
| (in millions) | 1 year | 1 year | Total | 1 year | 1 year | Total | ||||||||||||||||||||
ASSETS | ||||||||||||||||||||||||||
Cash and Cash Equivalents | 1,220 | - | 1,220 | 1,401 | - | 1,401 | ||||||||||||||||||||
Securities Purchased Under Resale Agreements | 63 | - | 63 | - | - | - | ||||||||||||||||||||
Investment Securities: | ||||||||||||||||||||||||||
Designated at Fair Value through Profit or Loss | 55 | 873 | 928 | - | 903 | 903 | ||||||||||||||||||||
Held for Trading | - | 415 | 415 | - | 397 | 397 | ||||||||||||||||||||
Available for Sale | 225 | 19,079 | 19,304 | 567 | 16,982 | 17,549 | ||||||||||||||||||||
Investment in NHA Mortgage-Backed Securities: | ||||||||||||||||||||||||||
Loans and Receivables | 58,368 | 197,599 | 255,967 | 39,534 | 217,121 | 256,655 | ||||||||||||||||||||
Loans | 1,155 | 10,624 | 11,779 | 972 | 11,694 | 12,666 | ||||||||||||||||||||
Accrued Interest Receivable | 959 | - | 959 | 983 | - | 983 | ||||||||||||||||||||
Deferred Income Tax Assets | - | 58 | 58 | - | 78 | 78 | ||||||||||||||||||||
Derivatives | 1 | 130 | 131 | 2 | 167 | 169 | ||||||||||||||||||||
Due from the Government of Canada | 175 | 134 | 309 | 269 | 134 | 403 | ||||||||||||||||||||
Accounts Receivable and Other Assets | 307 | 600 | 907 | 138 | 548 | 686 | ||||||||||||||||||||
| 62,528 | 229,512 | 292,040 | 43,866 | 248,024 | 291,890 | |||||||||||||||||||||
LIABILITIES | ||||||||||||||||||||||||||
Securities Sold Under Repurchase Agreements | 425 | - | 425 | 272 | - | 272 | ||||||||||||||||||||
Borrowings: | ||||||||||||||||||||||||||
Canada Mortgage Bonds | 35,370 | 166,306 | 201,676 | 37,737 | 161,636 | 199,373 | ||||||||||||||||||||
Capital Market Borrowings | 359 | 1,489 | 1,848 | 305 | 1,898 | 2,203 | ||||||||||||||||||||
Borrowings from the Government of Canada: | ||||||||||||||||||||||||||
Designated at Fair Value through Profit or Loss | 1,379 | 5,280 | 6,659 | 912 | 5,672 | 6,584 | ||||||||||||||||||||
Other | 23,302 | 34,293 | 57,595 | 2,214 | 58,749 | 60,963 | ||||||||||||||||||||
Accrued Interest Payable | 753 | - | 753 | 860 | - | 860 | ||||||||||||||||||||
Derivatives | 3 | 43 | 46 | 3 | 69 | 72 | ||||||||||||||||||||
Accounts Payable and Other Liabilities | 371 | 886 | 1,257 | 397 | 775 | 1,172 | ||||||||||||||||||||
Provision for Claims | 688 | 308 | 996 | 726 | 315 | 1,041 | ||||||||||||||||||||
Unearned Premiums and Fees | 1,792 | 5,148 | 6,940 | 1,814 | 5,445 | 7,259 | ||||||||||||||||||||
| 64,442 | 213,753 | 278,195 | 45,240 | 234,559 | 279,799 | |||||||||||||||||||||
NET | (1,914) | 15,759 | 13,845 | (1,374) | 13,465 | 12,091 | ||||||||||||||||||||
156 C A N A D A M O R T G A G E A N D H O U S I N G C O R P O R A T I O N

| CMHC BOARD OF DIRECTORS | 158 | |||
| CMHC MANAGEMENT | 161 | |||
| USE OF APPROPRIATIONS | 163 | |||
| GLOSSARY | 164 | |||
DEFINITION OF SELECT CMHC PERFORMANCE MEASURES | 168 | |||
| EXPECTED OUTCOMES AND INDICATORS | 170 | |||
| CMHC OFFICES | 174 | |||
157
CMHC BOARD OF DIRECTORS
COMPENSATION AND ATTENDANCE RECORD
| Attendance/Meetings | ||||||||||||||||
| Committee | ||||||||||||||||
| Member | Compensation1 ($) | Board of Directors | Governance and Nominating | Audit | Human Resources | Risk Management5 | Pension Fund Trustees | |||||||||
Dino Chiesa2 | 25,660 | 2/2 | 1/1 | - | - | - | - | |||||||||
Karen Kinsley3 | N/A | 6/6 | 5/5 | 4/4 | 5/5 | 1/1 | 4/4 | |||||||||
Michael Gendron | 30,200 | 5/6 | - | 4/4 | - | 0/1 | - | |||||||||
Michael Horgan4 | N/A | 3/3 | - | - | - | 1/1 | - | |||||||||
Brian Johnston | 27,200 | 5/6 | - | 4/4 | - | - | - | |||||||||
Sophie Joncas | 48,725 | 6/6 | 5/5 | 4/4 | - | - | - | |||||||||
E. Anne MacDonald | 29,700 | 6/6 | - | - | 5/5 | - | - | |||||||||
James A. Millar | 27,200 | 6/6 | 5/5 | - | 5/5 | - | - | |||||||||
Rennie Pieterman | 27,700 | 6/6 | - | - | 5/5 | - | - | |||||||||
André G. Plourde | 24,700 | 6/6 | - | - | - | 1/1 | 4/4 | |||||||||
Ian Shugart4 | N/A | 3/3 | 2/2 | - | - | - | - | |||||||||
| 1 | Board compensation is presented on a cash basis. |
| 2 | Term ended March 28, 2012 |
| 3 | Attendance at Audit, Risk and Human Resources committees as a non-member |
| 4 | Appointed in June 2012 |
| 5 | The Risk Management Committee held its first meeting in December 2012 |
BIOGRAPHIES
These are also available on CMHC’s website at www.cmhc.ca.
Karen Kinsley
President and Chief Executive Officer
Karen Kinsley was appointed President and Chief Executive Officer in June 2003. Ms. Kinsley joined CMHC in 1987. She was appointed Vice-President, Finance, in 1990 and Treasurer in 1995. In 1996, Ms. Kinsley became the Vice-President, Corporate Services and Chief Financial Officer and, in 2000, was appointed Vice-President, Insurance and Securitization.
Prior to joining CMHC, Ms. Kinsley held the position of Vice-President and Treasurer, over separate periods, with two real estate development companies. Ms. Kinsley holds a Bachelor of Commerce degree from the University of Ottawa and is a member of the Canadian Institute of Chartered Accountants. She has been elected a Fellow of the Institute of Chartered Accountants of Ontario (FCA). In 2010, Ms. Kinsley also received the Certified Director designation (ICD.D) from the Institute of Corporate Directors.
158 C A N A D A M O R T G A G E A N D H O U S I N G C O R P O R A T I O N
Michael Gendron
Michael Gendron was appointed to the Board of Directors in June 2010. A chartered accountant, Mr. Gendron is Chief Financial Officer and part owner of Mancap Ventures Inc., a privately-owned venture capital company with majority equity interest in a number of home building and support companies based in Edmonton, Alberta. Mr. Gendron was previously a partner in several local public accounting firms in Edmonton in which he served as external accountant and business advisor to businesses in a variety of industries, and operated a training organization primarily involved in preparing people to enter or re-enter the workplace. Mr. Gendron has served on a number of boards, including most recently as Chair of the Finance Committee for the Alberta New Home Warranty Program (2007-2009). In addition to his chartered professional accountant designation, Mr. Gendron holds a Bachelor of Education from the University of Western Ontario (Althouse College), a Bachelor of Commerce from the University of Windsor and a Bachelor of Arts from the University of Western Ontario.
Michael Horgan
Michael Horgan was appointed to the Board of Directors in June 2012. He became Deputy Minister of Finance on September 8, 2009. Mr. Horgan joined the Canadian federal public service in 1978 with the Department of Finance and has held various positions in this department as well as in the Department of Energy, Mines and Resources and Environment Canada. In 1993, he became the Assistant Secretary, Priorities and Planning, in the Privy Council Office and in 1996 he was appointed Deputy Secretary to the Cabinet, Intergovernmental Policy and Communications. Other positions held include President of the Atlantic Canada Opportunities Agency and Deputy Minister of Indian and Northern Affairs and Deputy Minister of Environment. In 2008, Mr. Horgan took up the position of Executive Director of the International Monetary Fund for the Canadian, Irish and Caribbean constituency. Mr. Horgan has also served in a number of other capacities including Chairman of the Enterprise Cape Breton Corporation, member of the Financial Institutions Supervisory Committee, Director
of the Bank of Canada, the Canada Deposit Insurance Corporation, and the Export Development Canada. Mr. Horgan has a B.A. in Economics from Concordia University: Loyola College (Montréal, Quebec) and Master’s Degrees in Economics from Queen’s University (Kingston, Ontario) and Princeton University (Princeton, New Jersey).
Brian Johnston
Brian Johnston was appointed to the Board of Directors in January 2008. A chartered accountant by profession, Mr. Johnston is the Chief Operating Officer of Mattamy Homes, Canada’s largest homebuilder with operations in the Greater Toronto Area, Ottawa, Calgary, and in five U.S. housing markets. In addition to his responsibilities at Mattamy Corporation, Mr. Johnston is an active member within the home-building industry. He is currently a Board Director of the EnerQuality Corporation and Tarion Warranty Corporation. He is a Past President of the Ontario Home Builders’ Association. Brian Johnston obtained a Bachelor of Commerce degree from the University of Toronto.
Sophie Joncas
Interim Chairperson
Sophie Joncas was appointed to the Board of Directors in August 2001. She was appointed interim Chairperson in March 2012. A chartered professional accountant, Ms. Joncas is an Administrator with Production Quarters, a television production company, and a professor in economics and finance at the Académie de l’entrepreneurship Québécois inc. Her professional experience in the public and private sectors, including construction and real estate firms, has enabled her to assist companies with their business and strategic planning needs. She has also worked in the private sector as Director of Finance and Administration and as a professional auditor. Ms. Joncas holds a Bachelor of Science in Accounting and a Master in Business Administration from the Université du Québec à Montréal. She is a member of the Ordre des comptables professionnels agréés du Québec, President of the Chartered Accountants of the Montérégie Region and was President of the Association des gens d’affaires de St-Hubert for 2001.

159
E. Anne MacDonald
Anne MacDonald was appointed to the Board of Directors in September 2007. Ms. MacDonald is a lawyer by profession. She was admitted to the Nova Scotia Bar Association in 1977, and has operated a general law practice in the Town of Pictou, Nova Scotia, since 1979. Ms. MacDonald has extensive knowledge of provincial and municipal law. Her primary areas of law practice include real estate, wills, probate, municipal law and family law. She was also the solicitor for the Town of Pictou for 25 years and assisted the town in acquiring and managing its real estate properties. A long-time resident of Pictou, Ms. MacDonald has been actively involved in her community, both as a volunteer and member of various associations. She was the first female President of the Pictou County Barristers’ Society. Ms. MacDonald is currently a member of the Nova Scotia Barristers’ Society, the Caribou Women’s Institute, and actively participates in and supports community organizations and charities. Anne MacDonald obtained a Bachelor of Arts from Acadia University and a Bachelor of Laws from Dalhousie University.
James A. Millar
Jim Millar was appointed to the Board of Directors in April 2007. Mr. Millar is an Associate with the Sussex Circle, an Ottawa-based consulting group providing advice on strategy, policy, organization and finance to senior clients in government, business and the voluntary sector. Mr. Millar joined CMHC in 1998 and, in October 2000, was appointed Vice-President, Human Resources and Pension Fund. In May 2002, he was named Vice-President, Strategic Planning, Risk Management and Communications, and appointed Vice-President, Risk Management and Communications, in February 2004. A career public servant, Mr. Millar worked in several government departments, including the Privy Council Office, Manpower and Immigration, the Public Service Commission, and Transport Canada. In 1989, he joined the Department of the Prime Minister and Cabinet, Government of Australia, as Assistant Secretary, Trade and Industry on an interchange assignment. Jim Millar obtained a Bachelor of Arts (Honours) in Economics and Political Science from Bishop’s University and a Master of Public Administration from Carleton University.
Rennie Pieterman
Rennie Pieterman was appointed to the Board of Directors in June 2010. A partner at Practical Plumbing Co. Ltd., Ms. Pieterman served eight years on the Board of Directors of the London Home Builders’ Association, including as President in 2003. She has been a member of the Association’s Renovators’ Council since 1994. Ms. Pieterman is also an active member of the Board of the Hyde Park Business Association.
André G. Plourde
André G. Plourde was appointed to the Board of Directors in April 2008. Mr. Plourde has been President of Montréal Real Estate Group Inc. since 2001, an important commercial real estate brokerage firm in Montréal. Mr. Plourde is active within the commercial real estate industry as a member of the Urban Development Institute of Québec and the Association des courtiers et agents immobiliers du Québec. André G. Plourde obtained a Bachelor of Business Administration degree from the Université du Québec à Montréal. Mr. Plourde is Vice-Chairman of the Board of the Children’s Diabetic Foundation.
Ian Shugart
Ian Shugart was appointed to the Board of Directors in June 2012. He was appointed to the position of Deputy Minister of Human Resources and Skills Development and Chairperson of the Canada Employment Insurance Commission, effective July 26, 2010. Prior to this, he served as Deputy Minister of the Environment, and Associate Deputy Minister of the Environment. Before joining Environment Canada, Mr. Shugart held several senior positions with the Department of Health and was the Executive Director of the former Medical Research Council (now Canadian Institutes of Health Research). Mr. Shugart has also been engaged extensively at the international level, serving as Chair of the Global Health Security Action Group, and of the Health Task Force of Asia-Pacific Economic Cooperation; and on the Board of the World Health Organization. He is a graduate in Political Economy from Trinity College at the University of Toronto.
160 C A N A D A M O R T G A G E A N D H O U S I N G C O R P O R A T I O N
CMHC MANAGEMENT
As at December 31, 2012
Karen Kinsley
President and Chief Executive Officer
NATIONAL OFFICE
Charles Chenard
Executive Director, Corporate Marketing
Sylvie Crispo
Vice-President, Insurance Product and Business Development
Peter De Barros
Executive Director, Communications
Serge Gaudet
Acting Vice-President, Corporate Services
and Chief Financial Officer
Sébastien Gignac
General Counsel and Corporate Secretary
Mark McInnis
Vice-President, Insurance Underwriting, Servicing and Policy
Steven Mennill
Vice-President, Policy, Research and Planning
Claude Noël
Acting Chief, Audit and Evaluation
Pierre Serré
Chief Risk Officer
Douglas Stewart
Vice-President, Regional Operations and Assisted Housing
Gail Tolley
Vice-President, Human Resources, Communications and Marketing
Wojo Zielonka
Vice-President, Capital Markets
REGIONAL BUSINESS CENTRES
Isabelle Bougie
General Manager, Quebec Business Centre
Peter Friedmann
General Manager, Ontario Business Centre and National Director, Leadership Development
Christina Haddad
General Manager, Atlantic Business Centre
Charles B. McArthur
General Manager, British Columbia Business Centre
Gordon R. McHugh
General Manager, Prairie and Territories Business Centre
161
CHANGES TO CMHC’S KEY MANAGEMENT PERSONNEL DURING 2012
CMHC defines Key Management Personnel as those persons having authority and responsibility for planning, directing and controlling its activities. This includes the Board of Directors and the following members of the CMHC Management: the President and CEO, Vice-Presidents, the General Counsel and Corporate Secretary, the Chief Risk Officer and Chief, Audit and Evaluation Services.
The following changes occurred to Key Management Personnel in 2012:
On 17 January 2012, a new management organization was established for CMHC in order to recognize changes in CMHC’s operating environment and continue CMHC’s strong focus on governance and risk management. Changes to the organization structure resulted in the following appointments:
| ¡ | Sylvie Crispo – Vice-President, Insurance Product and Business Development |
| ¡ | Steven Mennill – Vice-President, Policy, Research and Planning |
| ¡ | Pierre Serré – Chief Risk Officer |
| ¡ | Douglas Stewart – Vice-President, Regional Operations and Assisted Housing |
| ¡ | Gail Tolley – Vice-President, Human Resources, Communications and Marketing |
| ¡ | Wojo Zielonka – Vice-President, Capital Markets |
P. Marc Joyal, Vice-President Corporate Services and Chief Financial Officer left CMHC at the end of August 2012. Serge Gaudet, Chief, Audit and Evaluation assumed his responsibilities on an interim basis. Brian Naish, was appointed Chief Financial Officer effective February 4, 2013.
Also, during the second quarter of 2012 CMHC announced the following new positions which will report to the President. These positions are currently being staffed:
| ¡ | Senior Vice-President, Mortgage Loan Insurance |
| ¡ | Senior Vice-President, Corporate Services |
CHANGES TO OTHER CMHC MANAGEMENT POSITIONS DURING 2012
Gordon McHugh, General Manager, Prairie and Territories Business Centre, retired at the end of December. As a result, Charles MacArthur was appointed General Manager, Prairie and Territories Business Centre, and Janice Rice was appointed General Manager, British Columbia Business Centre, effective January 1, 2013.
Terrence Robinson, Director, CMHC International, retired in December.

162 C A N A D A M O R T G A G E A N D H O U S I N G C O R P O R A T I O N
USE OF APPROPRIATIONS
The following table reconciles the amount of appropriations authorized by Parliament as available to the Corporation during the Government of Canada fiscal year with the total amount recognized by the Corporation in its calendar year.
| Twelve months ended | ||||||||
| ($M) | 31 December | |||||||
| 2012 | 2011 | |||||||
Amounts provided for Housing Programs: | ||||||||
Amounts authorized in 2011/12 (2010/11) | ||||||||
Main Estimates | 1,907 | 3,131 | ||||||
Supplementary estimates A1,2 | 256 | - | ||||||
Supplementary estimates B1 | - | - | ||||||
Supplementary estimates C1 | - | 2 | ||||||
Unused Statutory Authorities | (1) | (1) | ||||||
| 2,162 | 3,132 | |||||||
Less: Portion recognized in calendar 2011 (2010) | (1,365) | (2,165) | ||||||
Less: Appropriations lapsed for 2011/12 (2010/11)3 | (114) | (169) | ||||||
2011/12 (2010/11) portions recognized in 2012 (2011) | 683 | 798 | ||||||
Amounts authorized in 2012/13 (2011/12) | ||||||||
Main Estimates | 2,140 | 1,907 | ||||||
Supplementary estimates A1,2 | - | 256 | ||||||
Supplementary estimates B1,4 | - | - | ||||||
Supplementary estimates C1 | - | - | ||||||
Total fiscal year appropriations | 2,140 | 2,163 | ||||||
Less: Portion to be recognized in subsequent quarters | (560) | (684) | ||||||
Forecasted lapse for 2012/13 (Actual lapse in 2011/12) | (66) | (114) | ||||||
2012/13 (2011/12) portions recognized in 2012 (2011) | 1,514 | 1,365 | ||||||
Total appropriations recognized – twelve months ended 31 December | 2,197 | 2,163 | ||||||
| 1 | Supplementary Estimates are additional appropriations voted on by Parliament during the government’s fiscal year. |
| 2 | In September 2008, a five-year investment, from 2009-2014, of more than $1.9 billion in housing and homelessness was made to address the needs of low-income Canadians, those at risk of homelessness and the homeless. Of this amount, $253.1 million per year was designated specifically for investments in affordable housing. The 2011/12 portion of this investment is included above. |
| 3 | Of the $169 million 2010/11lapse, $73 million represents a lapse against Housing Programs (includes $1 million in unused statutory authorities), and $97 million represents a reduction based on the results from the 2009 Strategic Review. The Strategic Review results were managed through a frozen allotment which does not reduce reference levels but “freezes” the funding so that it is not available for other purposes. |
| 4 | On 8 November 2012, Parliament voted on the 2012/13 Supplementary Estimates B, which included CMHC’s re-profiling request of $3.1 million. Total authorities were available within the vote due to savings identified as part of the Budget 2012 Spending Review (see “2012 Budget Implementation” section). The reprofiling was netted against these savings. As a result, there was no impact on CMHC’s reference levels. |
The lapse of $114 million in appropriations for fiscal year ended 2011/12 is primarily due to lower interest and inflation rates and revised spending patterns for various programs and initiatives funded under the Housing Programs.
Total appropriations approved by Parliament for fiscal year 2012/13 are $2,140 million. The total spending against this reference level as at 31 December 2012 was $1,514 million (71%). It is forecasted that, by the end of fiscal year 2012/13, $66 million will lapse as a result of lower interest and inflation rates and changes in spending patterns among the various program activities funded under the Housing Programs. Of the $66 million, $4.3 million represents a reduction based on the results of the Government’s review of spending. The results were managed through a frozen allotment which does not reduce reference levels but “freezes” the funding so that it is not available for other purposes. This lapse forecast of $66 million is subject to change as the Government of Canada’s fiscal year progresses.
163
GLOSSARY
ACRONYMS
| AANDC | Aboriginal Affairs and Northern | IC | Industry Canada | |||
| Development Canada |
IFRS |
International Financial Reporting | ||||
| AHI | Affordable Housing Initiative | Standards | ||||
| CBA | Canadian Bankers Association | IMPP | Insured Mortgage Purchase Program | |||
| CEAP | Canada’s Economic Action Plan | LTV | Loan-to-value | |||
| CGAAP | Canadian Generally Accepted | MAV | Master Asset Vehicle | |||
| Accounting Principles | MCT | Minimum Capital Test | ||||
| CHT | Canada Housing Trust | MILP | Municipal Infrastructure Lending Program | |||
| CMB | Canada Mortgage Bonds | NGO | Non-governmental organization | |||
| CPF | Corporate Plan Framework | NHA MBS | National Housing Act Mortgage-Backed Securities | |||
DFAIT |
Department of Foreign Affairs and | |||||
| International Trade | NRC | National Research Council | ||||
| DoF | Department of Finance | NRCan | Natural Resources Canada | |||
| ERP | Emergency Repair Program | OSFI | Office of the Superintendent | |||
FAA |
Financial Administration Act | of Financial Institutions | ||||
| FNMHF | First Nations Market Housing Fund | PAA | Program Alignment Architecture | |||
| HASI | Home Adaptations for Seniors’ | Proposal Development Funding | ||||
| Independence |
RRAP |
Residential Rehabilitation | ||||
| HRSDC | Human Resources and Skills | Assistance Program | ||||
| Development Canada |
SEP |
Shelter Enhancement Program | ||||
| IAH | Investment in Affordable Housing | |||||
Actuarial Gains/Losses on Post-Employment Benefits
These are the gains or losses/arising from the effects of changes in actuarial assumptions as well as the difference between estimates and actual experience in a company’s pension plan.
Affordable Housing Initiative (AHI)
Under the Affordable Housing Initiative, the federal government, through CMHC, provides funding to increase the supply of affordable housing, in partnership with provinces and territories. Provinces and territories design and deliver the housing programs. The existing AHI agreements have been extended in two jurisdictions (Yukon and Prince Edward Island).
Canada Housing Trust (CHT)
The CHT is a legal entity separate from CMHC. CHT acquires interests in eligible insured housing loans, such as National Housing Act Mortgage-Backed Securities and issues Canada Mortgage Bonds (CMBs). The CHT also purchases highly rated investments and undertakes certain related financial hedging activities for the purpose of managing business risks. CMBs are guaranteed by CMHC. CMHC also acts as the financial services advisor to the CHT, determining market demand for bond issuance, and engaging an underwriting syndicate to underwrite bond issues. CMHC receives a fee from CHT for its services as guarantor and financial services advisor. The day-to-day activities of the CHT are administered through a separate corporate entity serving as the trust
164 C A N A D A M O R T G A G E A N D H O U S I N G C O R P O R A T I O N
administrator. As required under IFRS, CHT’s financial results are consolidated with CMHC’s financial statements because CMHC is exposed to CHT’s risks and rewards.
Canada Mortgage Bonds (CMB)
Bullet maturity bonds that are fixed-rate with a semi-annual coupon and floating rate notes with a quarterly coupon that are issued by the Canada Housing Trust (CHT) and guaranteed by CMHC.
CMHC Affordable Housing Centre
This is CMHC’s centre of excellence for information, guidance and other tools to facilitate the production of affordable housing by non-profit organizations, private sector proponents and others.
Core Housing Need
A household is in core housing need if its housing does not meet one or more of the adequacy, suitability or affordability housing standards and it would have to spend 30% or more of its before-tax income to pay the median rent (including utility costs) of alternative local market housing that meets all three of these standards.
| ¡ | Adequate housing does not require any major repairs, according to residents. |
| ¡ | Suitable housing has enough bedrooms for the size and make-up of resident households, according to National Occupancy Standard (NOS) requirements. Enough bedrooms based on NOS requirements means one bedroom for each cohabiting adult couple; unattached household member 18 years of age and over; same-sex pair of children under age 18; and additional boy or girl in the family, unless there are two opposite sex children under 5 years of age, in which case they are expected to share a bedroom. A household of one individual can occupy a bachelor unit (i.e., a unit with no bedroom). |
| ¡ | Affordable housing costs less than 30% of before-tax household income. For renters, shelter costs include rent and any payments for electricity, fuel, water and other municipal services. For owners, shelter costs include mortgage payments (principal and interest), property taxes, and any condominium fees, along with payments for electricity, fuel, water and other municipal services. |
Covered bonds
A debt obligation in relation to which the principal and interest owing are guaranteed to be paid from the loans or other assets held by the guarantor entity. Under the Canadian covered bond legal framework, assets may not include insured mortgages. CMHC has been given the responsibility of administering the covered bond legal framework.
emili
A proprietary online automated mortgage insurance risk assessment and approval system developed by CMHC. It provides a comprehensive risk assessment of MLI applications.
EQuilibrium™ Sustainable Housing Demonstration Initiative
Goals of CMHC’s EQuilibrium™ Sustainable Housing Demonstration Initiative:
| ¡ | to promote environmentally friendly, healthy housing across Canada; |
| ¡ | to enhance the capacity of Canada’s home builders, developers, architects and engineers to design and build sustainable homes and communities across the country; |
| ¡ | to educate consumers on the benefits of owning sustainable housing and achieve market acceptance of sustainable housing and communities; and, |
| ¡ | to enhance Canada’s domestic and international leadership and business opportunities in sustainable housing design, construction services and technologies. |
First Nations Market Housing Fund (FNMHF)
The FNMHF, an independent trust, is overseen by nine trustees appointed by the Minister for CMHC and the Minister of Aboriginal Affairs and Northern Development. CMHC, on behalf of the Government of Canada, contributed $300 million to the Fund under a Funding Agreement with the Trustees of the FNMHF. In 2008, the FNMHF engaged CMHC to administer its operations for its initial five years. The FNMHF operates a credit enhancement facility for housing loans on First Nation reserves as well as supports First Nation capacity development. The financial results of the FNMHF are not consolidated with CMHC’s financial statements but are consolidated with the Government of Canada’s.
165
Granville Island
Granville Island is a cultural, recreational and commercial development in the heart of Vancouver owned by the Government of Canada. CMHC receives a fee to cover its costs to manage and administer Granville Island. Granville Island’s finances are not consolidated with CMHC’s.
Insured Mortgage Purchase Program (IMPP)
In October 2008, as a measure to maintain the availability of longer-term credit in Canada, the Government of Canada authorized CMHC to purchase $25 billion in National Housing Act Mortgage-Backed Securities (NHA MBS) from Canadian financial institutions through a competitive auction process. Since the initial announcement, the potential size of the program was increased to $125 billion. IMPP remained available until the end of March 2010.
Investment in Affordable Housing 2011-2014 (IAH)
A new framework for the Investment in Affordable Housing was announced on July 4, 2011 which provides for $1.4 billion in combined F/P/T funding towards reducing the number of Canadians in housing need. This became the basis for bilateral IAH agreements between CMHC, on behalf of the federal government, and provinces and territories. Where provinces and territories choose not to enter into an IAH arrangement, federal funding for housing will be provided through extensions of existing arrangements with respect to AHI and/or renovation programs.
Multi-unit residential properties
Properties consisting of more than 4 units, including rental buildings, retirement and long-term care facilities, affordable housing, student housing and condominium construction projects.
Municipal Infrastructure Lending Program (MILP)
Under Canada’s Economic Action Plan, CMHC delivered MILP which provided $2 billion in direct low-cost loans to municipalities over a two-year period ending March 31, 2011, to fund housing-related municipal infrastructure.
National Housing Act Mortgage-Backed Securities (NHA MBS)
A security which represents an undivided interest in a pool of residential mortgages insured under the NHA or by a licensed private sector insurer and which has the full timely payment guarantee of the Government of Canada through CMHC. The scheduled principal repayments by the borrower and agreed rate of interest on the mortgages in an NHA MBS pool are paid to investors monthly. In addition, depending on the particular issue of NHA MBS, these payments can vary from month to month if, for example, borrowers make unscheduled payments such as advance payments of principal on a mortgage. Securities under the NHA MBS program are issued by Approved Issuers (primarily lending institutions).
Proposal Development Funding (PDF)
An interest-free loan of up to $100,000 to support activities carried out during the early stages of developing an affordable housing project. PDF is available for projects that are expected to be developed without long-term federal government subsidies. Eligible costs include soil load-bearing tests, environmental site assessments, project drawings and specifications, development permits and certain professional and consulting fees. The loan is repayable upon the first advance of mortgage funding and a portion of the loan may be forgiven if it meets criteria for affordable housing as defined by CMHC.
166 C A N A D A M O R T G A G E A N D H O U S I N G C O R P O R A T I O N
Renovation programs
Renovation programs help low-income households, landlords, persons with disabilities, senior households, and Aboriginal people undertake much-needed repairs and/or accessibility modifications to their housing units. Renovation programs delivered by CMHC include:
| ¡ | Residential Rehabilitation Assistance Program (RRAP) |
A program which provides financial assistance to low-income households who live on and off reserve to enable them to repair their homes or to adapt them to accommodate the needs of residents with disabilities, as well as to assist landlords to repair or adapt rental dwellings, or to convert non-residential properties into affordable residential units.
| ¡ | Shelter Enhancement Program (SEP) |
A program which provides financial assistance to repair, rehabilitate and improve existing shelters for victims of family violence. The program also assists in the acquisition or construction of new shelters and second stage housing.
| ¡ | Emergency Repair Program (ERP) |
A program which provides financial assistance to low-income homeowners or occupants in rural areas off reserve to undertake emergency repairs required for the continued safe occupancy of their house.
| ¡ | Home Adaptations for Seniors’ Independence (HASI) |
A program which provides financial assistance to low-income seniors to carry out minor adaptations to assist them to live independently in their own homes.
Beginning April 1, 2011, in most jurisdictions, the federal investment in affordable housing, including funding for renovation programs, is being cost-matched and delivered by provinces and territories through agreements for the Investment in Affordable Housing 2011-2014. CMHC continues to deliver renovation programs where a province or territory has decided to renew existing arrangements (Yukon and Prince Edward Island). In Ontario, the Province asked CMHC to continue to make new commitments under the renovation programs until March 31, 2012.
CMHC also delivers the renovation programs on reserve.
Seed Funding
Seed Funding consists of a contribution and a loan up to a maximum of $20,000 when combined to support activities carried out in the early stages of developing affordable housing project proposals. Eligible expenses include costs for housing market studies, need and demand analyses, the preparation of business plans, preliminary financial viability analyses, preliminary project designs, as well as the costs to incorporate an entity. The loan portion of Seed Funding is repayable upon the first advance of mortgage funding.

167
DEFINITION OF SELECT
CMHC PERFORMANCE MEASURES
Strategic Priority 1.1 Help Canadians in need access affordable, sound and suitable housing
| ||
Housing Programs expenses
Expenses primarily related to existing social housing programs. These programs include: public housing programs, non-profit housing programs, rent supplement programs, the Rural and Native Housing Program, Urban Native Housing Program and co-operative housing programs. New commitments under these programs ceased in 1993, except for the On-Reserve Non-Profit Rental Housing Program under Strategic Priority 1.2. Also includes expenditures under the Investment in Affordable Housing (IAH) 2011-2014 Framework and expenses under strategic priorities 1.2, 2.3, 3.1 and 3.2.
Estimated number of households assisted through long-term social housing agreements Primarily households who live in social housing developed between 1946 and 1993. Also includes households living in units on reserve administered under the On-Reserve Non-Profit Rental Housing Program. New units continue to be committed under this program.
Affordable housing expenditures The sum of federal funding provided under the Investment in Affordable Housing (IAH) 2011-2014 Framework. Also includes expenditures in 2012 related to renovation program commitments made in prior years and previous AHI funding arrangements (2001-2011).
Affordable housing units facilitated by CMHC’s Affordable Housing Centre Affordable housing units for which project sponsors have received Seed Funding or Proposal Development Funding, and/or CMHC’s Affordable Housing Centre staff have provided advice in their development. Some of these units also qualified for CMHC mortgage loan insurance underwriting flexibilities which encourage affordable housing.
Direct Lending CMHC provides low-cost loans directly to federally-assisted social housing sponsors seeking to continue financing their housing projects and to First Nations to finance new housing production. This measure is the value of mortgages provided to groups whose projects receive federal assistance. | ||
Strategic Priority 1.2 Support Aboriginal Canadians to improve their living conditions
| ||
On-Reserve Non-Profit Rental Housing Program
This program is funded pursuant to Section 95 of the NHA and assists First Nations in the construction, purchase and rehabilitation, and administration of suitable, adequate and affordable rental housing on reserve. CMHC provides a subsidy to the project to assist with its financing and operation for a period of up to 25 years.
Renovation program expenditures Federal expenditures disbursed under CMHC’s renovation programs. The renovation programs provide financial assistance in the form of a fully forgivable loan provided the owner maintains continued ownership and occupancy of the dwelling, or the landlord in the case of a rental property, places a ceiling on the rents that may be charged after repair and limits increases during the term of an operating agreement.
Per cent of housing programs and services delivered through First Nations or Aboriginal organizations The average of the following:
¡ Per cent of RRAP accounts on reserve delivered by Aboriginal agents.
¡ Per cent of commitments made under the On-Reserve Non-Profit Rental Housing Program. This is based on the number of units for which inspections and physical condition reviews are carried out under the Native Inspection Services Initiative.
¡ Per cent of Aboriginal capacity development service contract dollars paid to Aboriginal service providers. |
168 C A N A D A M O R T G A G E A N D H O U S I N G C O R P O R A T I O N
Strategic Priority 2.1 Ensure Canadians have access to mortgage loan insurance products and tools that meet their needs
|
Total insured volume (units) and Total insured volume ($) Units and value of insured loans that were finalized for both homeownership and rental units as well as Portfolio insurance.
Per cent of the total of rental and high ratio homeowner units approved to address less-served markets and/ or to support specific government priorities The ratio of total public policy mortgage loan insurance volumes to total mortgage insurance volumes excluding Portfolio. Public policy insured volumes include those for large rental properties, nursing and retirement homes, units with chattel mortgage loan insurance, social housing units both on and off reserve, and units in rural areas.
(Public policy volumes) / (total volumes excluding Portfolio) *100
Operating expense ratio (per cent) The ratio of operating expenses to total premiums and fee revenue earned.
(Operating expenses) / (earned premiums + fees) *100
|
Strategic Priority 2.2 Ensure an adequate supply of low-cost funds for mortgage lending through mortgage securitization
|
Annual securities guaranteed NHA Mortgage-Backed Securities (NHA MBS) for which CMHC issued guarantees during the year. Once guaranteed, NHA MBS may be issued directly into capital market or purchased by the Canada Housing Trust under the Canada Mortgage Bonds Program.
Operating expense ratio (per cent) The ratio of operating expenses to revenue earned.
(Operating expenses + Canada Mortgage Bonds related expenses)/(guarantee fees earned + application and compensatory fees earned + Financial Services Advisors fees earned from Canada Housing Trust) *100
|
Strategic Priority 2.3 Provide comprehensive, timely and relevant market analysis information
|
Forecast accuracy of housing starts The difference expressed as a percentage between CMHC’s initial starts forecast for Canada and the actual annual starts for the same year. |
Human Resources
|
Level of employee engagement The overall level of engagement is based on the results of a survey of CMHC employees conducted by Towers Watson (formerly Towers Perrin ISR) in comparison to industry benchmarks. To be fully engaged, employees must have: rational understanding of the organization’s strategic goals, values, and how they fit; emotional attachment to their organization; the motivation and willingness to invest discretionary effort to go above and beyond to help the organization succeed.
|
Information Technology
| ||
Overall systems reliability index (per cent) Weighted average of monthly availability of key corporate systems.
| ||
169
EXPECTED OUTCOMES
AND INDICATORS
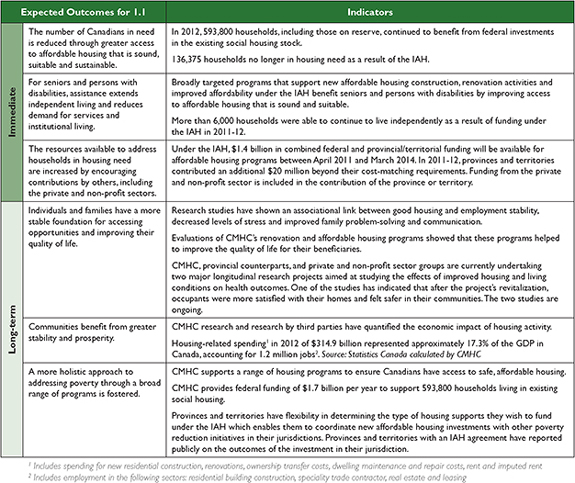

170 C A N A D A M O R T G A G E A N D H O U S I N G C O R P O R A T I O N
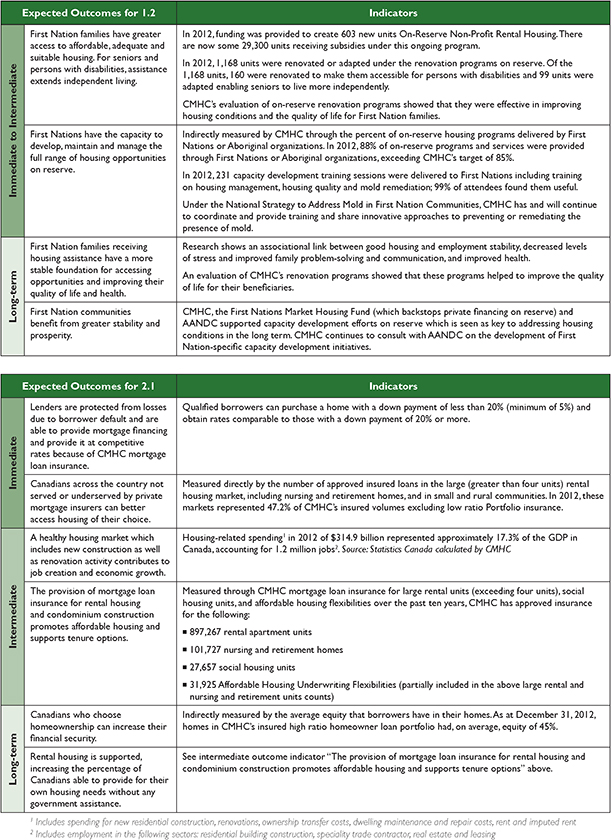
171
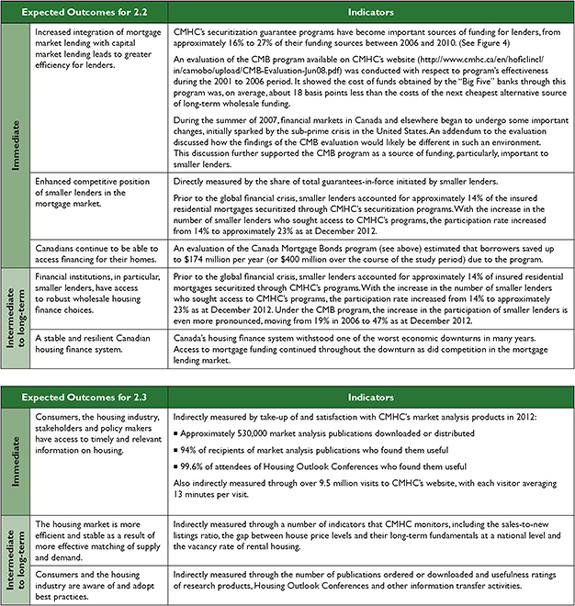
172 C A N A D A M O R T G A G E A N D H O U S I N G C O R P O R A T I O N
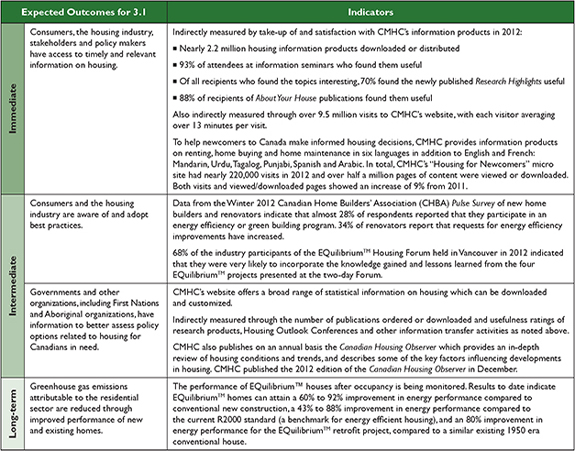

173
CMHC OFFICES
NATIONAL OFFICE
700 Montreal Road
Ottawa, Ontario K1A 0P7
613-748-2000
REGIONAL BUSINESS CENTRES
Atlantic
1894 Barrington Street, 9th Floor
Halifax, Nova Scotia B3J 2A8
902-426-3530
Quebec
1100 René-Lévesque Blvd. West, 1st Floor
Montréal, Quebec H3B 5J7
514-283-2222
Ontario
100 Sheppard Avenue East, Suite 300
Toronto, Ontario M2N 6Z1
416-221-2642
Prairie and Territories
1000 – 7th Avenue SW, Suite 200
Calgary, Alberta T2P 5L5
403-515-3000
British Columbia
1111 West Georgia Street, Suite 200
Vancouver, British Columbia V6E 4S4
604-731-5733
SECURITIZATION OPERATIONS
130 Adelaide Street W., Suite 200
Toronto, Ontario M5H 3P5
GRANVILLE ISLAND
PROJECT OFFICE
1661 Duranleau Street
Vancouver, British Columbia V6H 3S3
604-666-6655
174 C A N A D A M O R T G A G E A N D H O U S I N G C O R P O R A T I O N
www.cmhc.ca/annualreport
 |  |