Exhibit 99.2

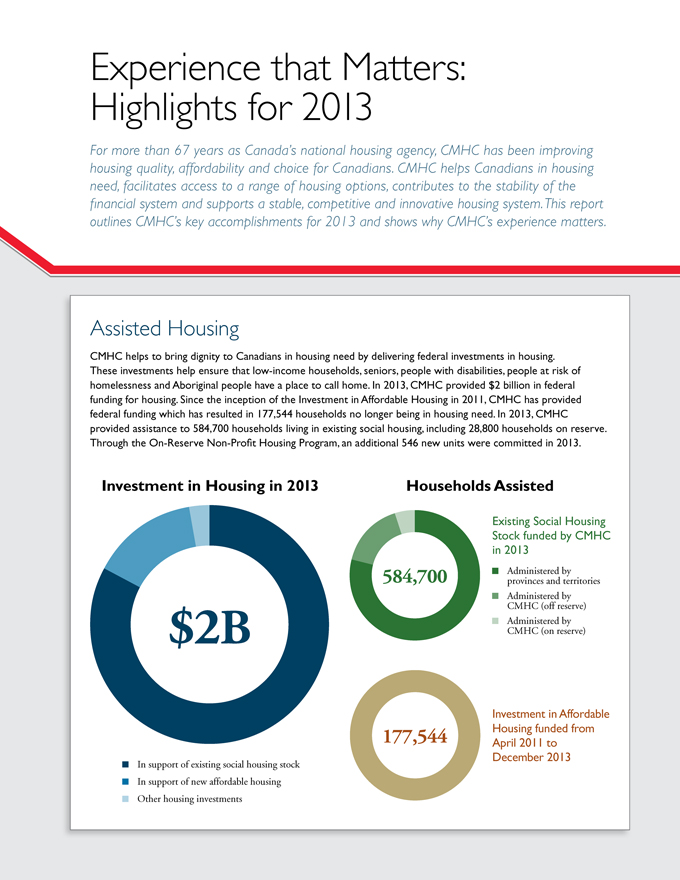
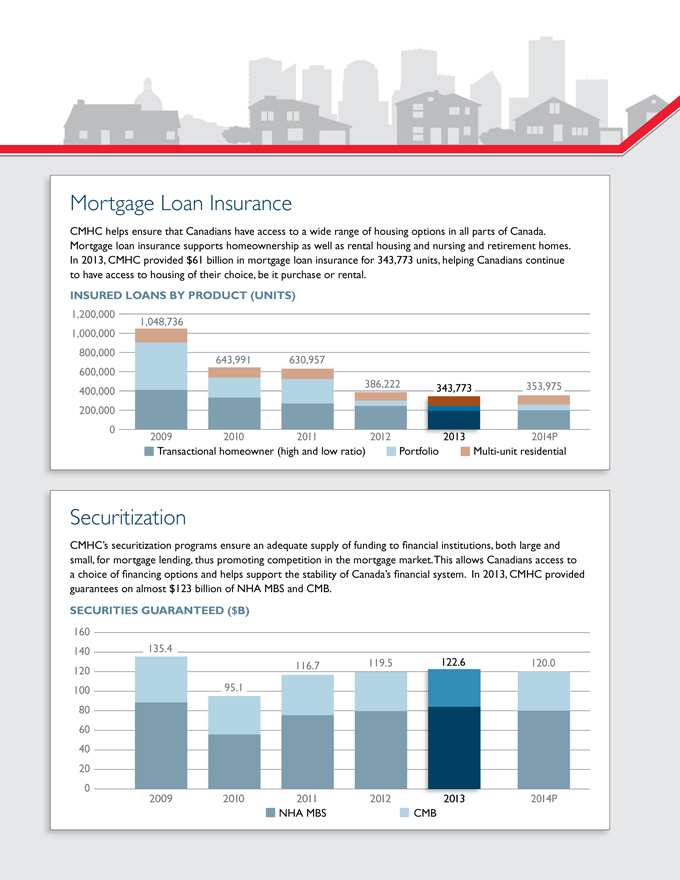
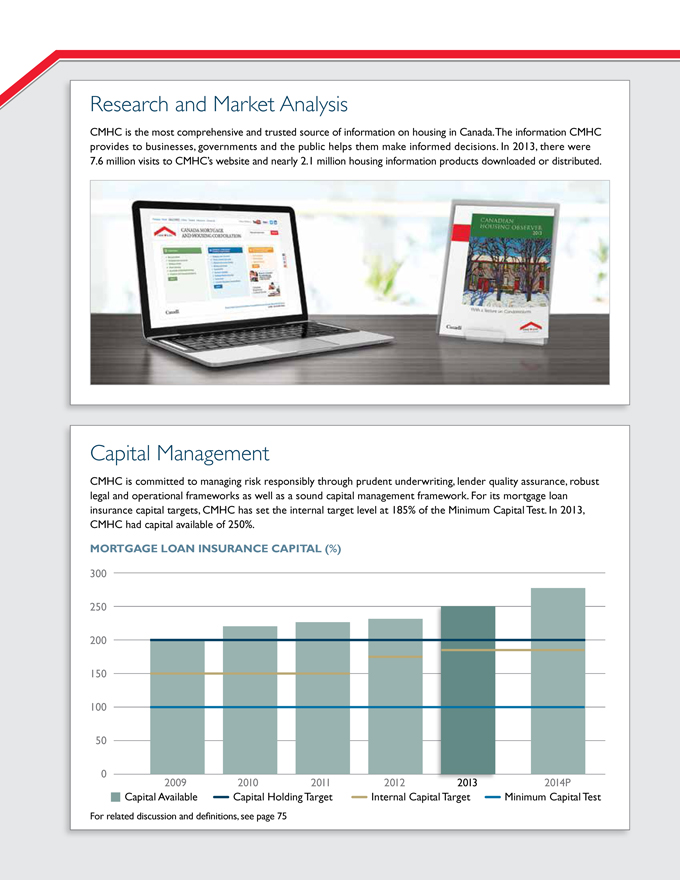
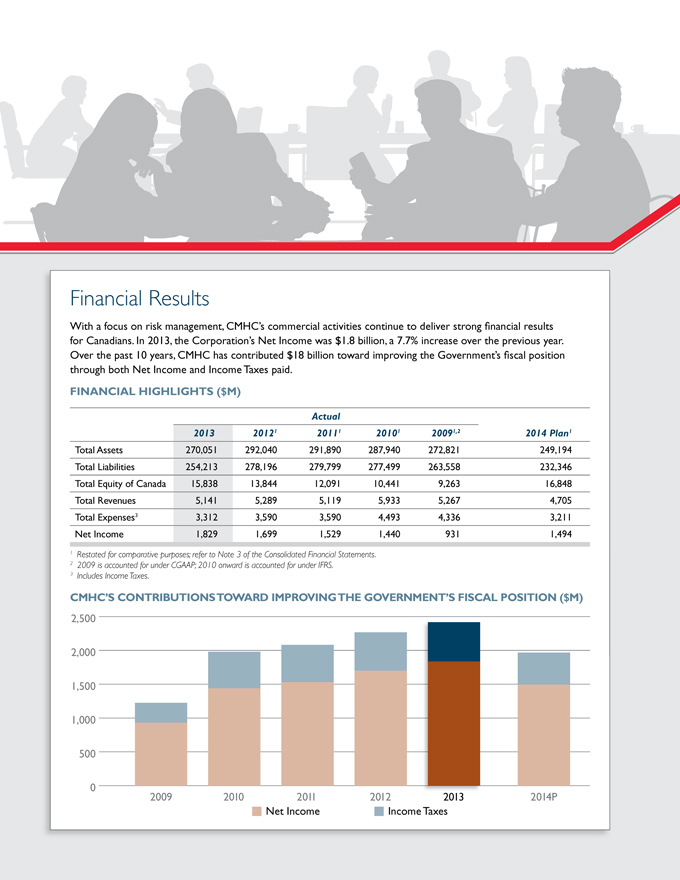
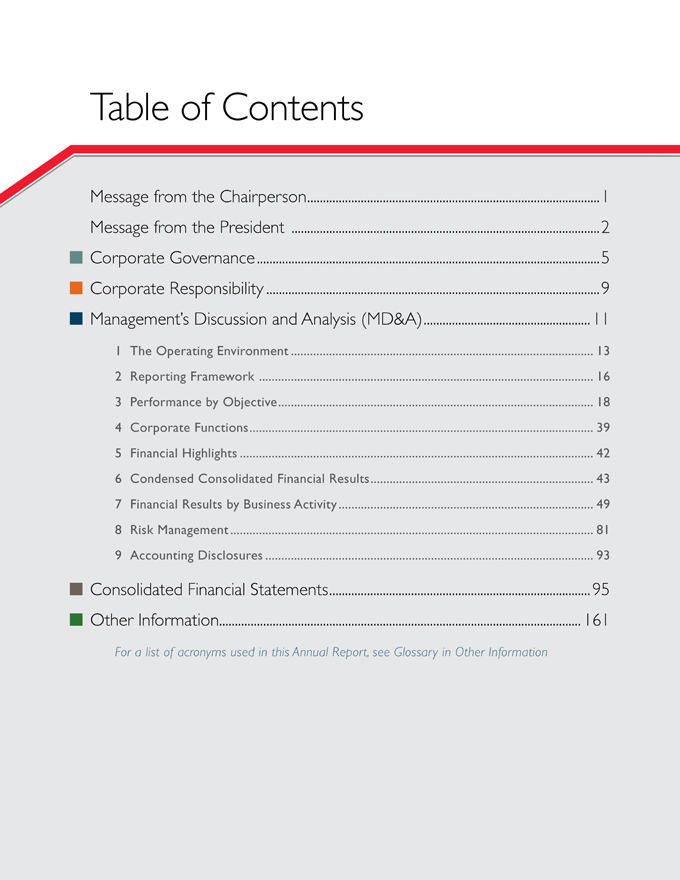
Table of ContentsMessage from the Chairperson 1Message from the President 2Corporate Governance 5Corporate Responsibility 9Management’s Discussion and Analysis (MD&A) 111 The Operating Environment 132 Reporting Framework 163 Performance by Objective184 Corporate Functions 395 Financial Highlights 426 Condensed Consolidated Financial Results437 Financial Results by Business Activity498 Risk Management819 Accounting Disclosures93Consolidated Financial Statements95Other Information161For a list of acronyms used in this Annual Report, see Glossary in Other Information


Message from the ChairpersonI was very proud to have been asked to serve as Chairperson of CMHC’s Board of Directors in April 2013. CMHC has played a key role in shaping Canada’s housing landscape for more than six decades. Over the past few months, I have been inspired by the calibre and unwavering dedication of the people who make up CMHC. I have confidence in their ability to continue to carry us forward. Members of the Board of Directors come from different regions of the country and from different walks of life. Their responsibility is to govern and oversee the affairs of the Corporation in support of Government of Canada objectives. Since my appointment, I have focused on gaining a better understanding of CMHC’s strategy, businesses, operations and particularly risks. A number of actions were taken in 2013 to improve the Board’s ability to assess and monitor performance and risks.The Board’s effectiveness is dependent on strong, engaged directors and an effective relationship with CMHC Management. In this regard, it has been a year of change. I would like to add my voice to the many who have thanked outgoing President Karen Kinsley, whose term expired in June of 2013 after leading CMHC for 10 years. Doug Stewart served as Interim President and Chief Executive Officer the last half of the year. His advice and responsiveness during this transition period were greatly appreciated. The Board assisted the Government with identifying candidates to succeed Ms. Kinsley and I am delighted that Mr. Evan W. Siddall was appointed President and Chief Executive Officer in December 2013. Evan brings a wealth of expertise, particularly in financial markets, and we look forward to working with him in the coming years. In early 2014, we welcomed new Board members Sandra Hanington, Louise Poirier-Landry and Bruce Shirreff, who all have strong financial services backgrounds. We congratulated Brian Johnston and André Plourde, whose terms were renewed. On behalf of the Board, I wish to thank retiring Board members Sophie Joncas, Anne E. MacDonald and James Millar for their dedication and excellent service to CMHC. This year was another successful one for CMHC and employees should be proud of their contributions. Housing is a vital part of the Canadian economy – contributing to jobs and economic growth. I look forward to helping to ensure that CMHC’s role in housing continues to contribute to the stability of the housing market and financial system. Robert P. Kelly Chairperson

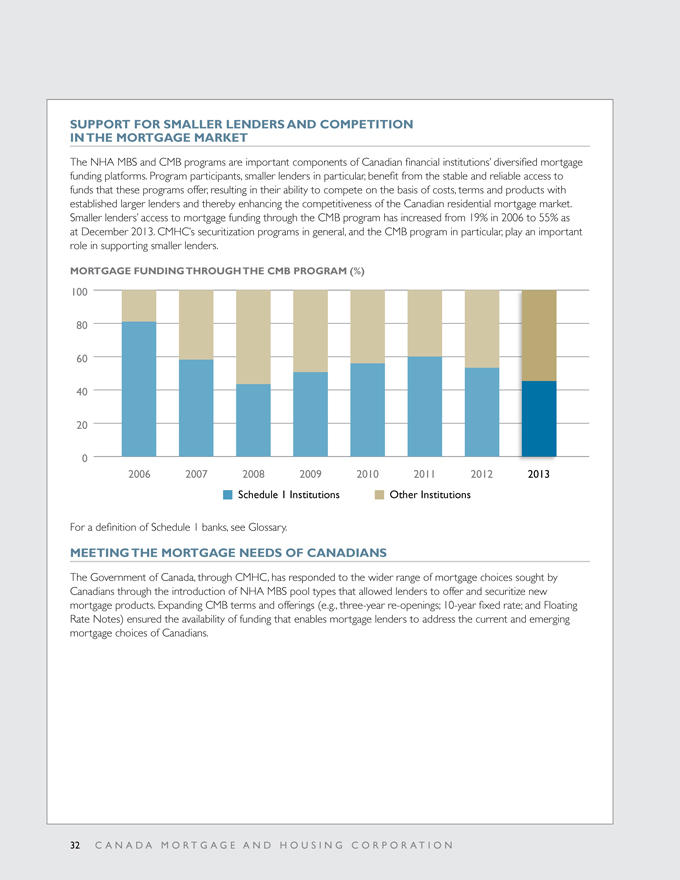
Message from the PresidentIn December 2013, I was honoured to be appointed President and Chief Executive Officer of CMHC, Canada’s national housing agency. For over 67 years, CMHC has earned a trusted reputation of helping Canadians meet their housing needs. CMHC plays a key role in helping Canadians find dignity through access to affordable housing while contributing to the stability of our financial system. That proud legacy of serving Canadians is one that is built upon years of experience– Experience that Matters. This experience matters to the approximately 600,000 households living in social housing located across the country. They benefit from approximately $1.7 billion in annual federal funding provided through CMHC. An additional 177,544 households have had their housing needs met through the Investment in Affordable Housing (IAH) since its inception. This federal/provincial/territorial cost shared initiative was renewed by the Government of Canada in 2013 and we are set to provide more than $1.25billion in federal funding between 2014 and 2019 through the IAH. Importantly, 546 new affordable units were created and 1,068 units were renovated or adapted in 2013 with funding provided under CMHC’s on-reserve housing programs. Private sector developers of affordable housing projects benefit from the advice and project development funding that CMHC provided to help create 3,692 new units in 2013. For the majority of Canadians whose housing needs are met in the private marketplace, CMHC’s mortgage loan insurance programs ensure Canadians continue to have access to housing tenure of their choice, be it homeownership or rental. In 2013, CMHC provided mortgage loan insurance for 343,773 units throughout Canada. This included providing insurance for 101,385 multi-unit residential units, a segment of the market served only by CMHC. CMHC’s experience also helps to support the Government’s efforts to build a strong and stable financial and housing system for Canada. CMHC’s securitization programs helped both small and large lenders access funds for residential mortgage lending through the almost $123 billion of National Housing Act Mortgage-Backed Securities (NHA MBS) and Canada Mortgage Bonds (CMB) guaranteed in 2013. Noteworthy is the increasing level of participation of small lenders where their access to the CMB program increased from 19% in 2006 to 55% in 2013. The availability of funding for lenders and the diversity of their funding sources, both of which are supported by CMHC, represent crucial foundations of a stable financial system. In 2012, CMHC was tasked with administering the legal framework for Canadian covered bonds. The covered bond market provides an additional source of funding for qualified lenders – without guarantees from the Government or from CMHC. I am pleased to report that four covered bond programs under the framework were registered in 2013. CMHC’s experience as Canada’s housing authority matters to consumers in general and to housing industry stakeholders. CMHC’s objective and reliable analysis and our research on housing matters contribute to sound policy and business decisions. In 2013, newly published Research Highlights and About Your House fact sheets received high usefulness ratings from consumers, as did our housing market analysis publications. There were over 42,000 subscribers to CMHC’s electronic releases of market analysis products and more than 5,000 participated at Housing Outlook Conferences this year.
Canadians look to CMHC for ideas and innovations in housing. In this regard, CMHC has been at the forefront of research on the sustainability of housing and housing in the North. Post-occupancy monitoring of the EQ™ demonstration projects continued in 2013 and information passed on to Canadians through various channels. CMHC also worked with northern housing providers on demonstration projects designed to showcase high levels of energy efficiency and cultural appropriateness. Our 67 years of experience provides a wealth of knowledge we will continue to share actively with Canadians.
A significant part of CMHC’s activities involve managing risk. Our mortgage loan insurance and securitization businesses are operated on a commercial basis. Since we strive to operate these businesses at no cost to Canadian taxpayers, we are committed to managing the underlying risk responsibly. CMHC manages risk in our mortgage loan insurance business through prudent underwriting, lender quality assurance, a sound capital management framework and stress testing. CMHC’s securitization programs are subject to robust legal and operational frameworks through which participants must meet minimum standards. We continue to strive to be best-in-class in managing our exposures in this area.
CMHC’s operating environment, including the framework which governs it, will continue to evolve in the coming years. In the same manner, CMHC must continue to evolve as it has throughout its history. I remain confident that the Corporation is well positioned to embrace such change, thanks to the dedication and commitment of its employees who make a difference to the lives of countless Canadians. I would like to acknowledge the support that my colleagues and our Board of Directors have provided to me as I take on my responsibilities as President and CEO. Together, we look forward to taking on the challenges of 2014 and beyond, building on the CMHC legacy of serving the housing needs of all Canadians. We will continue to gain more experience as a Corporation – Experience that Matters.
Evan W. Siddall
President and Chief Executive Officer


¢ Corporate Governance
Legislative Framework and Mandate
CMHC is a federal Crown corporation, incorporated under the Canada Mortgage and Housing Corporation Act (CMHC Act), and is accountable to Parliament through the Minister for CMHC, currently the Minister of Employment and Social Development and Minister for Multiculturalism. CMHC’s legislative framework consists of the CMHC Act, the National Housing Act (NHA) and the Financial Administration Act (FAA). Among other things, the CMHC Act specifies the role and membership of CMHC’s Board of Directors, and sets out the conduct of business, objects and powers of the Corporation.
CMHC is subject to the reporting and accountability requirements set out under Part X of the FAA. As required, CMHC submits a five-year Corporate Plan for approval by the Government. The Minister for CMHC is required to table a Summary of the Corporate Plan in both Houses of Parliament within 30 Parliamentary sitting days of the approval of the Corporate Plan.
CMHC’s mandate, as set out in the NHA, is to promote the construction of new houses, the repair and modernization of existing houses, and the improvement of housing and living conditions. In relation to financing for housing, the NHA’s purpose is to promote housing affordability and choice; to facilitate access to and competition and efficiency in the provision of housing finance; to protect the availability of adequate funding for housing; and, to contribute to the well-being of the housing sector.
The NHA provides additional “objects” in carrying out housing finance activities (mortgage loan insurance, securitization programs, and the administration of the legal framework for Canadian covered bonds.) These are: a) to promote the efficient functioning and competitiveness of the housing finance market; b) to promote and contribute to the stability of the financial system, including the housing market; and c) to have due regard to the Corporation’s exposure to loss.
Board of Directors
The Board of Directors is responsible for managing the affairs of the Corporation and the conduct of its business in accordance with applicable legislation as well as the governing by-laws of the Corporation. The Board consists of the Chairperson, the President and Chief Executive Officer (CEO), the Deputy Minister of the Minister for CMHC, the Deputy Minister of Finance, and eight other directors. The Chairperson and President and CEO are appointed by the Governor in Council. The Deputy Minister of the Minister for CMHC and the Deputy Minister of Finance are members of the Board by reason of the office they each hold. The eight other directors are appointed by the Minister for CMHC subject to approval by the Governor in Council. With the exception of the President and CEO, all Board members are independent of CMHC Management.

MEETINGS
The Board of Directors meets a minimum of five times a year. The Board also holds an annual public meeting which provides an opportunity for the general public to learn about CMHC’s achievements.
COMMITTEES
The Corporate Governance and Nominating Committee, the Audit Committee, the Risk Management Committee, and the Human Resources Committee advise and assist the Board on matters in their respective areas. Their charters are posted on CMHC’s website (www.cmhc.ca) and are reviewed on a regular basis.
BOARD REMUNERATION
AND ATTENDANCE
The remuneration of Board members is based on federal government guidelines. The Chairperson and other non-government employee Board members receive an annual retainer for their services to CMHC plus fixed per diems for travel time, for their attendance at committee and Board meetings and for carrying out other CMHC-related responsibilities as they arise. (See Other Information for Compensation and Attendance Record.)
BOARD EFFECTIVENESS
CMHC’s Board of Directors undergoes assessments on an annual basis, generally alternating between a peer assessment, which involves Board members assessing and providing feedback on each other’s contributions one year, and an overall Board assessment, the next which examines the functioning of the Board as a whole in comparison to the boards of other Crown corporations.
In 2013, an overall Board assessment was undertaken with the assistance of an international professional services firm experienced in evaluating boards of large, federally regulated financial institutions. The results indicated that the capacity of the Board to carry out its responsibilities compares favourably with other institutions of similar
size and scope. The areas where the Board rated the highest were its governance culture, its processes and information, and its understanding of its responsibilities and mandate.
Special Examinations by the Office of the Auditor General (OAG) and Annual Reviews by the Office of the Superintendent of Financial Institutions (OSFI)
The FAA requires that a special examination be carried out by the OAG at least once every 10 years and at any additional time that the Governor in Council, the Minister for CMHC, the Board of Directors, or the Auditor General may require. CMHC’s last special examination was completed in 2008.
Under the NHA, OSFI is required at least once each calendar year to make, or to cause to be made, any examination or inquiry that the Superintendent considers to be necessary or expedient to determine if the Corporation is carrying on any or all of its activities under Part I (housing loan insurance, guarantee and protection) and Part I.I (covered bonds) of the NHA in a safe and sound manner with due regard to exposure to loss.
CMHC Structure
Approximately 1,900 employees work at the Corporation’s National Office in Ottawa, and in regional business centres in Halifax, Montreal, Toronto, Calgary and Vancouver. Smaller communities are also served by CMHC employees who reside in these communities.
CMHC provides management, advisory and other services to the Canada Housing Trust (CHT) and the First Nations Market Housing Fund (FNMHF) (See Glossary for further information on these organizations). It also manages and administers Granville Island on behalf of the Government of Canada.
| | |
| 6 C A N A D A M O R T G A G E A N D H O U S I N G C O R P O R A T I O N | | |
The following chart shows CMHC’s Management structure as at 14 April 2014:
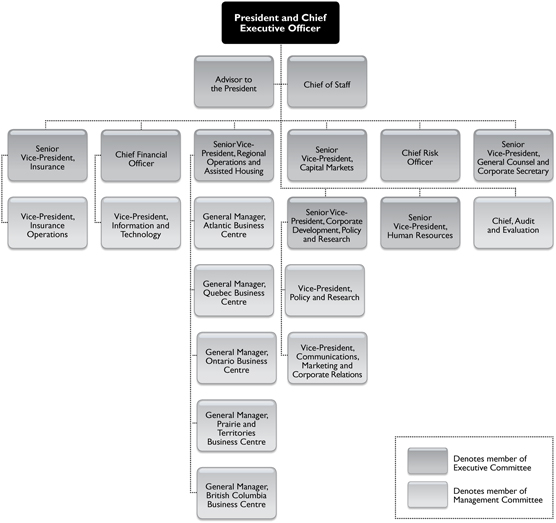
(See Other Information for a list of CMHC Management members as at 31 December 2013.)


¢ Corporate Responsibility
CMHC strives to conduct its activities in a way that maximizes social and economic contributions and minimizes environmental impacts. Our commitment to corporate responsibility is reflected in our corporate values and is integrated into our policies and practices. The following highlights some key activities in 2013 in this respect:
Reducing CMHC’s Environmental Footprint
In 2013, CMHC continued to implement a five-year comprehensive corporate-wide sustainable operations strategy aimed at reducing the Corporation’s environmental footprint and promoting environmentally responsible behaviour in day-to-day business activities. Recent investments in infrastructure have resulted in a 13% corporate-wide reduction in paper consumption and, at National Office, an 11% reduction in water consumption and a 9% reduction in electricity consumption as compared to 2012. In 2013, CMHC received the saveONenergy Retrofit Program Companies for Conservation Award from Hydro Ottawa.
Promoting Sustainable Housing and Energy Efficiency
CMHC’s activities support and contribute to the development of sustainable, energy-efficient housing, as part of a broader mandate to promote housing quality and choice. In 2013, for example, CMHC worked with northern housing providers on a number of demonstration projects designed to showcase high levels of energy efficiency and cultural appropriateness.
On the mortgage loan insurance side, transactional homeowner premium rebates under the CMHC Green Home product continue to encourage the purchase
of energy-efficient homes and/or energy-efficient renovations. Premium rebates are also available for CMHC-insured multi-unit residential property loans where owners have chosen to build energy-efficient rental properties or make energy-efficient renovations.
Employees and Workplace Community
CMHC has a strong and diverse workplace community built on mutual respect, employee wellness and development opportunities. For the fifth consecutive year, CMHC was designated as one of the National Capital Region’s Top Employers in 2013, an award that recognizes employers with progressive and forward-thinking programs in terms of employee benefits, work atmosphere, and employee engagement.
In 2013, CMHC and Habitat for Humanity continued a longstanding partnership. CMHC is a platinum partner of Habitat for Humanity, and the Lead and Founding National Partner of the Habitat for Humanity Aboriginal Housing Program, an initiative launched in 2007 to help address the housing affordability issues faced by Aboriginal families in Canada.
Also in 2013, CMHC employees continued their tradition of supporting charities and volunteerism, raising a total of $325,000 under the Government of Canada Workplace Charitable Campaign.


¢ Management’s Discussion & Analysis
| | | | | | | | | | |
| | 1 | | The Operating Environment | | | 13 | |
| | | |
| | 2 | | Reporting Framework | | | 16 | |
| | | |
| | 3 | | Performance by Objective | | | 18 | |
| | | | 3.1 | | Objective 1 – Support access to affordable housing for Canadians in need | | | 18 | |
| | | | 3.2 | | Objective 2 – Facilitate access to a range of housing options for Canadians, and promote and contribute to the stability of the financial system and the efficient functioning and competitiveness of the housing finance market, with due regard to the Corporation’s exposure to loss | | | 23 | |
| | | | 3.3 | | Objective 3 – Promote and contribute to informed housing decisions and to a stable, competitive and innovative housing system | | | 34 | |
| | | |
| | 4 | | Corporate Functions | | | 39 | |
| | | |
| | 5 | | Financial Highlights | | | 42 | |
| | | |
| | 6 | | Condensed Consolidated Financial Results | | | 43 | |
| | | | 6.1 | | Condensed Consolidated Balance Sheet | | | 43 | |
| | | | 6.2 | | Condensed Consolidated Statement of Income and Comprehensive Income | | | 44 | |
| | | | 6.3 | | Comparison Against Plan | | | 47 | |
| | | |
| | 7 | | Financial Results by Business Activity | | | 49 | |
| | | | 7.1 | | Housing Programs | | | 49 | |
| | | | 7.2 | | Lending | | | 52 | |
| | | | 7.3 | | Mortgage Loan Insurance | | | 58 | |
| | | | 7.4 | | Securitization | | | 70 | |
| | | | 7.5 | | Canada Housing Trust | | | 78 | |
| | | |
| | 8 | | Risk Management | | | 81 | |
| | | | 8.1 | | Overview | | | 81 | |
| | | | 8.2 | | Enterprise Risk Management | | | 81 | |
| | | | 8.3 | | Housing Programs and Lending Activity Risks | | | 84 | |
| | | | 8.4 | | Mortgage Loan Insurance Activity Risks | | | 86 | |
| | | | 8.5 | | Securitization Activity Risks | | | 89 | |
| | | | 8.6 | | Enterprise Risk Management Letter of Representation | | | 92 | |
| | | |
| | 9 | | Accounting Disclosures | | | 93 | |
| | | | 9.1 | | Changes in Accounting Policies | | | 93 | |
| | | | 9.2 | | Critical Accounting Policies and Estimates | | | 93 | |
| | | | 9.3 | | Glossary for Non-IFRS Financial Measures | | | 94 | |

The following Management’s Discussion and Analysis (MD&A) of the financial condition and results of operations of CMHC is prepared for the year ended 31 December 2013. The financial condition and performance were prepared by Management, and were approved by the Board of Directors on 19 March 2014. This MD&A should be read in conjunction with the audited Consolidated Financial Statements. Unless otherwise indicated, all financial information in this report has been prepared in accordance with International Financial Reporting Standards (IFRS) and all amounts are expressed in Canadian dollars.
CMHC is committed to communicating with our stakeholders clearly and transparently. As a result, we have made several changes to the presentation of both our MD&A and Consolidated Financial Statements. While Section 3 continues to report performance by objective, the new MD&A presentation discusses the financial results by business activity in Section 7. Each business activity has its own financial condition, capital, risk and liquidity requirements, and each contributes to CMHC’s mandate and financial results differently.
The presentation of the Consolidated Financial Statements has been improved as described in Note 3 to the statements. The most significant change is the presentation of interest income net of interest expense, which allows a reader to quickly ascertain the financial impact of CMHC’s borrowing and interest-generating activities. This change had no effect on Net Income.
FORWARD-LOOKING STATEMENTS
CMHC’s Annual Report contains forward-looking statements, including, but not limited to, statements made in the Operating Environment, Performance by Objective, Financial Results by Business Activity and Risk Management sections of the report. Specific forward-looking statements include, but are not limited to, statements with respect to CMHC’s outlook for the regulatory environment in which we operate, the outlook and priorities for each business segment and the risk environment.
By their nature, forward-looking statements require us to make assumptions and are subject to inherent risks and uncertainties. These risks and uncertainties, many of which are beyond the control of CMHC, include, but are not limited to, economic, financial and regulatory conditions, nationally and internationally and could cause actual results to differ materially from the expectations expressed in these forward-looking statements. Forward-looking statements are typically identified by words such as “may”, “should”, “could”, “would”, “will”, as well as expressions such as “believe”, “expect”, “forecast”, “anticipate”, “intend”, “plan”, “estimate” and other similar expressions.
The forward-looking information contained in the Annual Report is presented to assist readers in understanding our financial condition and performance. They may not be
suitable for other purposes and readers should not place undue reliance on them. The forward-looking statements are based on management’s current predictions, forecasts, projections, expectations and conclusions and the assumptions related to these predictions, forecasts, projections, expectations and conclusions may not prove to be correct. CMHC does not undertake to update any forward-looking statements made in this Annual Report.
NON-IFRS MEASURES
CMHC uses a number of financial measures to assess its performance. Some of these measures are not calculated in accordance with IFRS, are not defined by IFRS, and do not have standardized meanings that would ensure consistency and comparability with other institutions. These non-IFRS measures are presented to supplement the information disclosed in the Consolidated Financial Statements and Notes to the Consolidated Financial Statements which are prepared in accordance with IFRS and may be useful in analyzing performance and understanding the measures used by management in its financial and operational decision making. Where non-IFRS measures are used throughout the Annual Report, a definition of the term will be disclosed in the Glossary for Non-IFRS Financial Measures section at the end of this MD&A.
| | |
| 12 C A N A D A M O R T G A G E A N D H O U S I N G C O R P O R A T I O N | | |
| | |
| 1 | | The Operating Environment |
The following describes CMHC’s general operating environment.
1.1 Recent
Developments
On 28 February 2014, CMHC announced that it will increase its mortgage loan insurance premiums for homeowner and 1-4 unit rental properties effective 1 May 2014. This increase comes after CMHC’s annual review of its insurance products and capital requirements and reflects its higher capital targets. CMHC’s capital holdings reduce Canadian taxpayers’ exposure to the housing market and contribute to the long-term stability of the financial system.
1.2 Government of
Canada Directions
ECONOMIC ACTION PLAN 2014 (BUDGET 2014)
Economic Action Plan 2014, tabled in Parliament on 11 February, outlined measures taken to reinforce the housing finance framework. For 2014, these measures include:
| | n | | CMHC will pay guarantee fees to the Receiver General to compensate for mortgage insurance risks, aligning CMHC with guarantee fees paid by private mortgage insurers; |
| | n | | CMHC will reduce its annual limit of issuance of portfolio insurance from $11 billion to $9 billion; |
| | n | | CMHC has been authorized to provide new guarantees under the NHA MBS program to a limit of $80 billion and new issuance under the CMB program to a limit of $40 billion. |
ECONOMIC ACTION PLAN 2013 (BUDGET 2013)
Economic Action Plan 2013 announced the Government of Canada’s continued commitment to work with provinces and territories on improving access to affordable housing. The federal government will invest more than $1.25 billion over five years, beginning in April 2014, to extend the Investment in Affordable Housing (IAH) to 31 March 2019. Funds provided to provinces and territories through the five-year extension of the IAH will also help to support the use of apprenticeships. Under the IAH, provinces and territories cost-match the federal investment and are responsible for program design and delivery. In recognition of the distinctive needs of Nunavut, Economic Action Plan 2013 also announced $100 million over two years (2013-14 and 2014-15), to be provided through CMHC, to support new affordable housing in Nunavut.
Budget 2013 also announced steps to help ensure that Canada’s financial system remains strong. In order to increase market discipline in residential lending and reduce taxpayer exposure to the housing sector, the Government indicated that it would gradually limit the use of low ratio portfolio insurance to only those mortgages securitized under CMHC’s securitization programs. In addition, insured mortgages backed by the Government cannot be used as collateral in securitization vehicles that are not sponsored by CMHC.
ECONOMIC ACTION PLAN 2012 (BUDGET 2012)
In Budget 2012, the Government announced the results of its review of spending undertaken by all federal departments and agencies. It indicated that CMHC will contribute $102.4 million in ongoing annual savings as of 2014-15. These savings will have no impact on low-income Canadians receiving federal housing assistance delivered through federal or provincial/territorial agreements.
CROWN CORPORATION
PENSION PLANS
In Budget 2012 and Budget 2013, the Government of Canada indicated that it would work with Crown corporations to ensure that their pension plans were broadly aligned with those available to federal employees. Budget 2013 also indicated that the Government of Canada is moving to a 50/50 cost-sharing arrangement between employer and employee pension contributions by 2017. CMHC has taken steps to ensure the long-term sustainability of its pension plan and to manage costs. CMHC’s pension plan now has two components: a defined benefit component and a defined contribution component. For the defined benefit component, steps have been taken to achieve a 50/50 cost-sharing arrangement by 2017. The defined contribution component came into effect on 4 April 2013 for all new hires after this date.
PROTECTION OF RESIDENTIAL MORTGAGE OR HYPOTHECARY INSURANCE ACT (PRMHIA) AND AMENDMENTS TO THE NATIONAL HOUSING ACT (NHA)
The Government of Canada has put in place a legislative framework to formalize existing mortgage loan insurance requirements for private mortgage insurers and CMHC. The framework, which came into force on 1 January 2013, includes the PRMHIA and consequential amendments to the NHA, applicable to private mortgage insurers and to CMHC, respectively. The regulations stemming from these legislative changes outline minimum criteria for the designation of approved/qualified lenders for CMHC and private sector insurers and specify the types of loans eligible for government-backed mortgage loan insurance.
LIMIT ON NHA MBS AND CMB FOR 2013
The limit on new guarantees of NHA MBS and CMB is an important oversight mechanism to manage housing market risks and the Government’s exposure to the housing sector. Under section 14(1) of the NHA, the Minister of Finance has the authority to specify the terms or conditions under which CMHC may guarantee payment of any or all of the principal or interest, or both, in respect of securities issued on the basis of housing loans. For 2013, the Minister of Finance authorized
CMHC to provide up to $85 billion for new guarantees of NHA MBS and up to $50 billion for CMB. For 2014, the Minister of Finance authorized $80 billion for NHA MBS and $40 billion for CMB.
FEES PAYABLE TO THE GOVERNMENT OF CANADA
Pursuant to section 8.2 of the NHA, effective 1 January 2014, CMHC’s mortgage loan insurance business is subject to a risk fee payable to the Government of Canada of 3.25% of premiums written and 10 basis points on new portfolio insurance written. The CMHC fee of 3.25% takes into account the full government backing of CMHC’s insurance liabilities as opposed to the 90% guarantee of private mortgage insurers.
1.3 The Economic
Environment
Economic growth, as measured by real Gross Domestic Product (GDP), is estimated to be 1.8% in 2013 up from an estimated 1.7% in 2012. According to Statistics Canada, employment for those ages 15 and over increased 1.3% (+223,500) in 2013, with full-time employment up 1.2% (+167,300) and part-time employment up 1.7% (+56,200). The average unemployment rate for 2013 was 7.1%, down from an average of 7.2% in 2012.
Inflation, as measured by the Consumer Price Index (CPI), averaged 0.9% in 2013, compared to a 1.5% average in 2012. Consequently, the Bank of Canada’s Target for the Overnight Rate has remained at 1.0% since September 2010. The five-year mortgage interest rate was 5.34% in December 2013. For 2013 as a whole, the average five-year mortgage rate was 5.24%. The low interest rate environment is supportive of housing market activity.
Many variables can provide insight into the financial health of Canadian households. For example, while debt levels are high at 163.9% of personal disposable income as of the fourth quarter of 2013, the ability of Canadians to service their debt is healthy by historical standards, as measured by interest paid on residential mortgage debt as a share of monthly household disposable income. In the fourth quarter of 2013, this ratio was 3.7%, below the historical average of 4.9%. Total interest paid on all consumer debt as a percentage of monthly household disposable income was 7.2% as of the fourth quarter of 2013.
| | |
| 14 C A N A D A M O R T G A G E A N D H O U S I N G C O R P O R A T I O N | | |
1.4 Housing Markets
Housing markets are influenced by the general state of the economy as well as by demographic factors such as population growth and household formation. According to Statistics Canada’s population estimates for 2013, the echo generation (those born from the baby boomers during 1972-1992) has surpassed that of the baby boom generation (those born from 1946-1965) in size, its numbers reaching about 10.1 million, higher than the estimate of 9.6 million for the baby boomers. Total net migration was 273,411 in 2013, down slightly from 277,415 in 2012. Despite the reduction, net migration remains higher than the 2001-2013 average of 237,738.
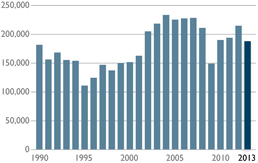
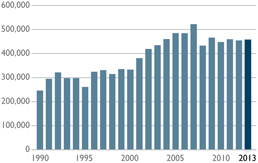
Despite modest improvements in economic conditions in the latter half of 2013, year-over-year housing starts slowed in 2013 to 187,923 units, down from 214,827 in 2012. Existing home sales, however, reached 457,804 units in 2013, up slightly from 454,362 in 2012.
According to CMHC’s 2013 Rental Market Survey, the average vacancy rate in the primary purpose-built apartment market in Canada’s 35 major centres increased slightly from 2.6% in October 2012 to 2.7% in October 2013. The October 2013 rate remains within the 2.2 to 2.8 per cent range, which has prevailed for the last decade.
HOUSING STARTS (UNITS)
HOUSE PRICES
In 2013, the resale market remained at or near balanced market conditions across most local housing markets in Canada. While the Multiple Listing Service®1 (MLS®) average price increased 5.3% to reach $382,568 in 2013, up from $363,469 in 2012, the Teranet - National Bank National Composite House Price Index™, which is designed to control for changes in the types and quality of homes sold over time, increased 2.6% in 2013. Additional information on CMHC’s housing market forecasts can be found at www.cmhc.ca.
MLS® SALES VOLUMES (UNITS)
| 1 | Multiple Listing Service® is a registered trademark owned by the Canadian Real Estate Association. |
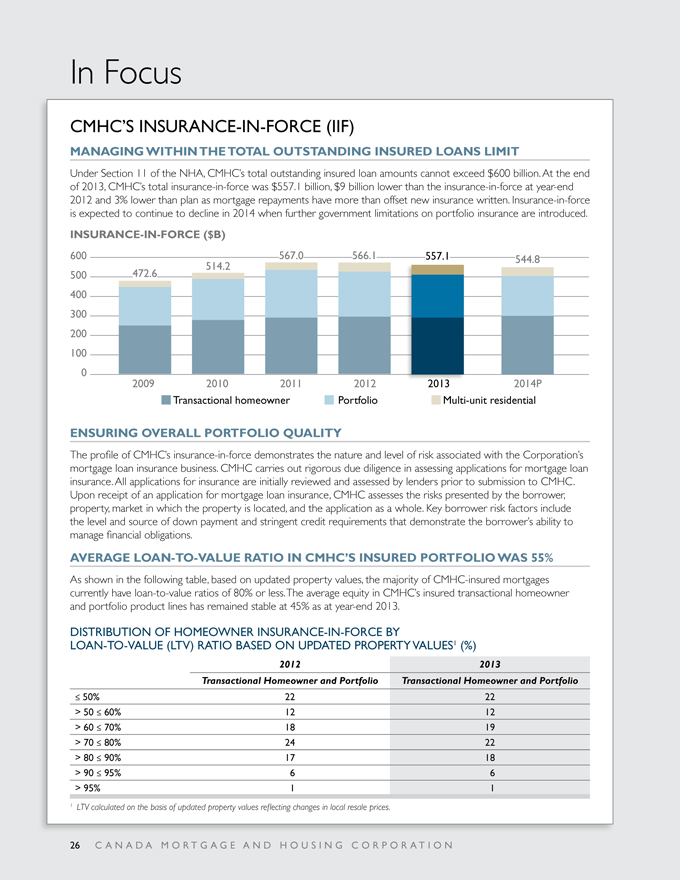
CMHC has three corporate objectives and seven strategic priorities against which it measures its performance. Housing programs, research, information transfer and market analysis activities under strategic priorities 1.1, 1.2, 3.1 and 3.2 are funded by the Government of Canada through Parliamentary Appropriations. Mortgage loan insurance and securitization programs under strategic priorities 2.1 and 2.2 are operated on a commercial basis and do not receive funding from the Government of Canada. Costs associated with administering the legal framework for covered bonds under strategic priority 2.3 are recovered from registered covered bond issuers.
CMHC’s business activities include:
| | n | | Housing Programs: CMHC provides federal grants, contributions and subsidies to support programs and initiatives to address the housing needs of low-income Canadians. CMHC’s authority to spend public funds is provided by the Government through annual Parliamentary Appropriations which are used to fund the Housing Programs Activity expenses. |
| | n | | Lending: CMHC makes loans and investments in support of housing programs that are funded by borrowings from the Government of Canada as well as capital markets borrowings issued prior to 2008. A significant number of these loans and investments support the Housing Programs Activity because they are provided at below market interest rates. The interest income earned on these loans is used to repay the interest expenses on the related borrowings. |
| n | | Mortgage Loan Insurance: CMHC provides insurance against losses in the event of borrower default on mortgages. Revenues are earned from premiums, fees and investment income. Expenses consist of operating expenses and insurance claim losses. The Corporation’s Net Income is primarily derived from this activity. |
| n | | Securitization: CMHC guarantees the timely payment of principal and interest for investors in securities backed by insured mortgages. Revenues are earned from guarantee fees, investment income and interest income on Insured Mortgage Purchase Program (IMPP) loans. Expenses consist primarily of interest expense on IMPP loans and operating expenses. Application fee revenue as well as administration costs related to the new legal framework for covered bonds administered by CMHC are also part of this segment. |
CMHC also consolidates the accounts of the Canada Housing Trust, a separate legal entity:
Canada Housing Trust is a special-purpose trust, whose functions are limited to the acquisition of interests in NHA MBS, the issuance of CMB, as well as the purchase of highly rated investments and certain related financial hedging activities. The CMBs are guaranteed by CMHC’s Securitization Activity. CHT revenue is earned primarily from interest income on the CMB loans, which is used to cover operating expenditures and interest expense.
| | |
| 16 C A N A D A M O R T G A G E A N D H O U S I N G C O R P O R A T I O N | | |
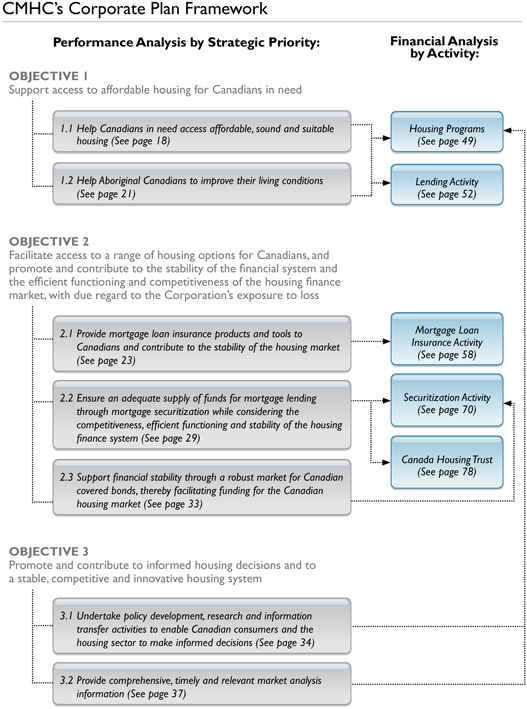
CMHC’s Corporate Plan Framework
Performance Analysis by Strategic Priority:
Financial Analysis
by Activity:
OBJECTIVE 1
Support access to affordable housing for Canadians in need
OBJECTIVE 2
Facilitate access to a range of housing options for Canadians, and promote and contribute to the stability of the financial system and the efficient functioning and competitiveness of the housing finance market, with due regard to the Corporation’s exposure to loss
OBJECTIVE 3
Promote and contribute to informed housing decisions and to a stable, competitive and innovative housing system
| | |
| 3 | | Performance by Objective |
| | | |
| | This section describes CMHC’s performance against its three corporate objectives and seven strategic priorities. For each strategic priority, there are a number of performance measures and immediate, intermediate and long-term outcomes that CMHC strives to attain. The performance measures are assessed based on the following:  Green (target met or exceeded): ³ 95% of plan Green (target met or exceeded): ³ 95% of plan
 Red (target not met): < 95% of plan Red (target not met): < 95% of plan
Additional information on the definition of performance measures can be found in the Other Information section of this Annual Report. Readers are encouraged to refer to the Summary of CMHC’s 2014-2018 Corporate Plan, which is available at www.cmhc.ca, for additional details on future directions and initiatives. |
3.1 OBJECTIVE 1
Support access to affordable housing for Canadians in need
| | | | | | | | |
STRATEGIC PRIORITY 1.1 – HELP CANADIANS IN NEED ACCESS
AFFORDABLE, SOUND AND SUITABLE HOUSING | |
| Performance Measures | | 2013 | |
| | | Plan | | | Actual | |
Housing programs expenses excluding operating expenses1 ($M) | | | 1,988 | | | | 1,955 | |
Affordable housing expenditures ($M) | | | 2582 | | | | 250 | |
Estimated number of households assisted through long-term social housing commitments | | | 585,800 | | | | 584,700 | |
Affordable housing units facilitated by CMHC’s Affordable Housing Centre | | | 2,940 | | | | 3,692 | |
Direct Lending3 ($M) | | | 1,118 | | | | 1,126 | |
| | | | | | | | |
RESOURCES | | | | | | | | |
Operating Expenses ($M) | | | 63.4 | | | | 58.9 | |
Staff Years | | | 350 | | | | 321 | |
| 1 | Includes expenses under Strategic Priorities 1.1, 1.2, 3.1 and 3.2 |
| 2 | The expenses related to this performance measure are also included in the Housing Programs expenses excluding operating expenses. This measure combines expenditures under the Investment in Affordable Housing (IAH), the Affordable Housing Initiative (AHI) and CMHC’s renovation programs off reserve. |
| | |
| 18 C A N A D A M O R T G A G E A N D H O U S I N G C O R P O R A T I O N | | |
PERFORMANCE ANALYSIS1
CMHC met or exceeded plan for all of its 2013 performance measures.
On behalf of the Government of Canada, CMHC provides investments of approximately $2 billion for housing. These investments include approximately $1.7 billion in support of Canadians living in existing social housing off and on reserve, and approximately $250 million for new affordable housing.
Nationally, 80% of the federal portfolio of existing social housing is administered by provinces and territories under either a Social Housing Agreement (SHA) or other long-term federal-provincial agreement. The remaining 20% is administered by CMHC and includes funding for on-reserve non-profit housing. Funding helped 584,700 households in 2013.
New federal investments towards improving access to affordable housing are delivered through the IAH. Under bilateral IAH agreements, provinces and territories match the federal investment and have the flexibility to design and deliver affordable housing programs, including renovation programs, to meet their local housing needs and priorities. Provinces and territories also report publicly on the outcomes of the IAH in their jurisdictions. In 2013, CMHC was successful in negotiating an IAH agreement with Prince Edward Island which, along with the Yukon, had chosen to remain under pre-existing arrangements for affordable housing and renovation programs when IAH was first introduced. The IAH agreement with PEI means it will have an enhanced role in delivering and matching federal investments in affordable housing, including renovation funding previously delivered by CMHC. Since its introduction in 2011, 177,544 households have benefited from funding under the IAH.
Budget 2013 announced that funding for the IAH would be extended for another five years beyond 31 March 2014 and also announced an additional $100 million for housing in Nunavut over two years. CMHC has begun working with provinces and territories to extend the IAH agreements as of 1 April 2014. In
2013, a supplementary agreement was concluded to provide for the first year of the two-year funding for affordable housing in Nunavut.
Affordable housing is also being created across the country through the efforts and resources contributed by thousands of individuals, private, public and non-profit organizations. CMHC’s Affordable Housing Centre, comprised of a national team of experts, works with them by providing information and advice gained through experiences across the country. The team also assists groups with applications for CMHC project development or seed funding assistance to get projects off the ground (see Glossary for description of these programs). In 2013, 3,692 units were created bringing the total number of units created to 66,157 since the Centre’s inception.
CMHC provides loans under the NHA to federally-subsidized social housing sponsors, First Nations, provinces, territories and municipalities. Through its Direct Lending initiative, the costs of government assistance provided to certain social housing projects can be reduced due to lower interest rates on loans that CMHC, as a federal Crown corporation, can provide. In 2013, CMHC provided loans of $1,126 million.
CMHC also manages assets transferred from the Federal Co-operative Housing Stabilization Fund (the Fund) since the termination of its Indenture of Trust in April 2010. The Fund was set up under the federal Co-operative Housing Program and provides assistance to co-operative housing projects in financial difficulty committed under this program. The assets transferred from the Stabilization Fund are available to assist co-ops with an Indexed Linked Mortgage (ILM) in financial difficulty. Transferred mortgage receivables under administration during the year decreased from $47.1 million to $45.8 million at year end. Other assets transferred from the Stabilization Fund to CMHC that are available to assist ILM Co-ops in financial difficulty were $14.5 million at year end, which included $2.8 million in restricted funds for loan commitments approved but not yet advanced.
| 1 | The financial results that support this Strategic Priority are discussed in sections 7.1 and 7.2. |
EXPECTED OUTCOMES
| | |
Outcomes | | Indicators |
Immediate |
| |
The number of Canadians in need is reduced through greater access to affordable housing that is sound, suitable and sustainable. | | In 2013, 584,700 households, including those on reserve, continued to benefit from federal investments in the existing social housing stock. 177,544 households were no longer in housing need as a result of the Investment in Affordable Housing from April 2011 to December 2013. |
| |
| For seniors and persons with disabilities, assistance extends independent living and reduces demand for services and institutional living. | | Broadly targeted programs that support new affordable housing construction, renovation activities and improved affordability under the IAH benefit seniors and persons with disabilities by improving access to affordable housing that is sound and suitable. From April 2011 to March 2013, more than 10,600 households were able to continue to live independently as a result of funding under the IAH. |
| |
The resources available to address households in housing need are increased by encouraging contributions by others, including the private and non-profit sectors. | | From April 2011 to the end of December 2013, federal funding delivered under the Investment in Affordable Housing totalled more than $635 million. Provincial and territorial contributions under the IAH, which include contributions from the private and non-profit sectors, have resulted in a further $663 million towards addressing housing need over the same period. |
|
Long-term |
| |
| Individuals and families have a more stable foundation for accessing opportunities and improving their quality of life. | | Research studies have shown an associational link between good housing and employment stability, decreased levels of stress and improved family problem-solving and communication. Evaluations of CMHC’s renovation and affordable housing programs showed that these programs helped to improve the quality of life for their beneficiaries. CMHC, provincial counterparts, and private and non-profit sector groups are currently undertaking two major longitudinal research projects aimed at studying the effects of improved housing and living conditions on health outcomes. One of the studies demonstrated that low-income participants that moved into subsidized housing in a mixed income and revitalized neighbourhood experienced greater satisfaction with their homes and lower levels of stress. The second study is examining the health impacts of rent-geared-to-income housing on adult mental health and on children’s development. |
| |
| Communities benefit from greater stability and prosperity. | | CMHC research and research by third parties have quantified the economic impact of housing activity. Housing-related spending, which includes spending for new residential construction, renovations, ownership transfer costs, dwelling maintenance and repair costs, rent and imputed rent, amounted to $196.7 billion as of the 4th quarter of 2013. This represents approximately 17.1% of the GDP in Canada. Source: Statistics Canada calculated by CMHC |
| |
| A more comprehensive approach to addressing poverty by supporting a broad range of programs is fostered. | | CMHC supports a range of housing programs to ensure Canadians have access to safe, affordable housing. CMHC provides federal funding of close to $1.7 billion per year to support 584,700 households living in existing social housing. Provinces and territories have flexibility in determining the type of housing supports they wish to fund under the IAH which enables them to coordinate new affordable housing investments with other poverty reduction initiatives in their jurisdictions. Provinces and territories with an IAH agreement have reported publicly on the outcomes of the investment in their jurisdiction. |
| | |
| 20 C A N A D A M O R T G A G E A N D H O U S I N G C O R P O R A T I O N | | |
| | | | | | | | |
STRATEGIC PRIORITY 1.2 – HELP ABORIGINAL CANADIANS TO IMPROVE
THEIR LIVING CONDITIONS | |
Performance Measures | | | 2013 | |
| | | Plan | | | Actual | |
New units committed under the On-Reserve Non-Profit Housing Program | | | 465 | | | | 546 | |
Renovation program expenditures (value of loans that are forgiven over time) ($M) | | | 14.5 | | | | 13.31 | |
Per cent of housing programs and services delivered through First Nations or Aboriginal organizations | | | 85 | | | | 90 | |
| | | | | | | | |
RESOURCES | | | | | | | | |
Operating Expenses ($M) | | | 21.3 | | | | 20.4 | |
Staff Years | | | 133 | | | | 131 | |
PERFORMANCE ANALYSIS2
In 2013, subsidies were provided for some 28,800 households on reserve. An additional 546 new units were committed under the On-Reserve Non-Profit Housing Program in 2013.
CMHC’s on-reserve renovation programs help First Nations people undertake repairs as well as modifications to improve the accessibility of housing units. Funding provided through these programs resulted in the renovation of 1,068 homes on reserve.
One of CMHC’s key objectives is to build greater capacity on reserve. This is achieved through engaging Aboriginal organizations to help deliver CMHC-funded housing programs. CMHC has consistently met or exceeded its target of 85% of its programs being delivered by Aboriginal organizations.
The ongoing National Strategy to Address Mould in First Nations Communities is a collaborative effort with CMHC, Aboriginal Affairs and Northern Development Canada, Health Canada and First Nations organizations to develop initiatives to help in the prevention and remediation of mould, and improve housing quality. As part of its activities, CMHC has developed and published two case
studies on its website, delivered mould-related training, and distributed thousands of information products on mould and case studies to First Nations. In addition, a software application was developed to help First Nations assess the mould situation in their communities.
Under the Indian Act, it is difficult to use reserve lands as collateral to secure loans. Given this, the development of a private housing market often requires alternative forms of security in order for members to be able to borrow to finance their homes. The First Nations Market Housing Fund (FNMHF) was created in 2007 with a $300 million investment by the federal government. The Fund is a self-sustaining, independent not-for-profit trust which backstops private financing of housing on reserve. The Minister responsible for CMHC provides oversight of the FNMHF. CMHC helped create the Fund in 2007, and in 2013 continued to provide operational services under the supervision of the Fund’s Trustees. As required, CMHC and AANDC have completed evaluations of the Fund and will work on next steps in response to the findings, as directed by the Government.
| 1 | Accelerated spending from 2013 into 2012 as well as loan cancellations and reductions have resulted in a reduced authority to spend. |
| 2 | The financial results that support this Strategic Priority are discussed in sections 7.1 and 7.2. |
EXPECTED OUTCOMES
| | |
Outcomes | | Indicators |
Immediate |
| |
First Nation members living on reserve have greater access to affordable, adequate and suitable housing that meets health and safety standards. For seniors and persons with disabilities, assistance extends independent living. | | In 2013, funding was provided to create 546 new units under the On-Reserve Non-Profit Housing Program. Some 28,800 existing units received subsidies under this ongoing program in 2013. In 2013, 1,068 units were renovated or adapted under the renovation programs on reserve. Of the 1,068, 138 were renovated to make them accessible for persons with disabilities and 89 units were adapted, enabling seniors to live more independently. |
Intermediate |
| |
First Nations have the capacity to develop, maintain and manage the full range of housing opportunities on reserve. | | Indirectly measured by CMHC through the percent of on-reserve housing programs delivered by First Nations or Aboriginal organizations. In 2013, 90% of on-reserve programs and services were provided through First Nations or Aboriginal organizations, exceeding CMHC’s target of 85%. In 2013, 183 capacity development training sessions were delivered to First Nations, including training on housing management, housing quality and mould remediation; 98% of attendees found them useful. Under the National Strategy to Address Mould in First Nation Communities, CMHC has and will continue to coordinate and provide training and share innovative approaches to preventing or remediating the presence of mould. |
Long-term |
| |
First Nations families receiving assistance have a more stable foundation for accessing opportunities and improving their quality of life and health. | | Research shows an associational link between good housing and employment stability, decreased levels of stress and improved family problem-solving and communication, and improved health. |
| |
First Nations communities benefit from greater stability and prosperity. | | CMHC, the First Nations Market Housing Fund (which backstops private financing on reserve) and AANDC supported capacity development efforts on reserve, which is seen as key to addressing housing conditions in the long term. CMHC continues to consult with AANDC on the development of First Nation-specific capacity development initiatives. |
| | |
| 22 C A N A D A M O R T G A G E A N D H O U S I N G C O R P O R A T I O N | | |
3.2 OBJECTIVE 2
Facilitate access to a range of housing options for Canadians, and promote and contribute to the stability of the financial system and the efficient functioning and competitiveness of the housing finance market, with due regard to the Corporation’s exposure to loss
| | | | | | | | |
STRATEGIC PRIORITY 2.1 – PROVIDE MORTGAGE LOAN INSURANCE PRODUCTS AND TOOLS TO CANADIANS AND CONTRIBUTE TO THE STABILITY OF THE HOUSING MARKET | |
| Performance Measures | | 2013 | |
| | | Plan | | | Actual | |
Total insured volumes (units) | | | 355,597 | | | | 343,773 | |
Transactional Homeowner | | | 202,606 | | | | 192,415 | |
Portfolio | | | 58,180 | | | | 49,973 | |
Multi-unit Residential | | | 94,812 | | | | 101,385 | |
Total insured volumes ($M) | | | 61,183 | | | | 61,053 | |
Transactional Homeowner | | | 44,532 | | | | 44,246 | |
Portfolio | | | 11,000 | | | | 10,406 | |
Multi-unit Residential | | | 5,651 | | | | 6,401 | |
Per cent of the total multi-unit and transactional homeowner units approved to address less-served markets and/or to support specific Government of Canada priorities | | | 33.0 | | | | 50.1 | |
Operating expense ratio1 (per cent) | | | < 13.8 | | | | 12.8 | |
| | | | | | | | |
RESOURCES | | | | | | | | |
Operating Expenses ($M) | | | 229.9 | | | | 213.0 | |
Staff Years | | | 949 | | | | 940 | |
PERFORMANCE ANALYSIS2
CMHC’s insured loan volumes are influenced by the economy, housing markets, competitive pressures and the regulatory environment. Successive changes by the Government of Canada to the guarantee parameters
specifying the types of mortgages that can be insured have reduced the size of the high ratio transactional homeowner mortgage loan insurance market while effectively eliminating the high ratio refinance market.
| 1 | For analysis, see section 7.3.2. |
| 2 | The financial results that support this Strategic Priority are discussed in section 7.3. |
Total insured units in 2013 of 343,773 units were within the planned target range.
Lower transactional homeowner and portfolio insurance volumes were off-set by higher multi-unit residential volumes.
CMHC aims to operate its insurance business at no cost to Canadian taxpayers. Over the past decade, CMHC’s insurance business has contributed more than $15 billion of the $18 billion contributed by CMHC towards improving the Government of Canada’s fiscal position.
In 2013, CMHC’s mortgage loan insurance achieved an operating expense ratio of 12.8%, 1% better than plan due to lower OSFI, credit bureau and investment management fees, and up slightly from 11.7% in 2012 (restated for comparative purposes).
MORTGAGE LOAN INSURANCE PRODUCTS
Transactional homeowner insurance – default insurance for loans secured by residential properties of 4 or less units issued at the time the loan is originated, the cost of which is usually passed on to the borrower. This is comprised of:
| | n | High ratio homeowner loans – the borrower has less than a 20 per cent down payment at origination. At least one of the units must be owner-occupied. Mortgage loan insurance on these loans is a legislative requirement for federally regulated as well as for most provincially regulated lenders. |
| | n | Low ratio homeowner loans – the borrower has a down payment of 20 per cent or more at origination. Mortgage loan insurance on these loans is not a legislative requirement; however, lenders may require mortgage loan insurance as a condition of approving the loan. Units can be owner-occupied or non-owner occupied (i.e., rental units). |
Portfolio insurance – default insurance for pools of low ratio loans secured by residential properties of 4 or less units, previously uninsured on a transactional basis and that must be under repayment. Insurance is purchased and paid for by the lender.
Multi-unit residential insurance – default insurance for loans for the construction, purchase and refinancing of multi-unit residential properties consisting of 5 or more units. These properties include rental buildings, licensed care facilities and retirement homes, affordable housing projects, condominium construction and purpose-built student housing.
| | |
| 24 C A N A D A M O R T G A G E A N D H O U S I N G C O R P O R A T I O N | | |
EXPECTED OUTCOMES
| | |
Outcomes | | Indicators |
Immediate |
| |
Lenders are protected from losses due to borrower default and are able to provide mortgage financing and provide it at competitive rates because of CMHC mortgage loan insurance. | | Qualified borrowers can purchase a home with a down payment of less than 20% (minimum of 5%) and obtain rates comparable to those with a down payment of 20% or more. |
| |
Canadians across the country not served or underserved by private mortgage insurers can better access housing of their choice. | | Measured directly by the number of approved insured loans in the large (greater than four units) multi-unit market, including nursing and retirement homes, and in small and rural communities. In 2013, these markets represented 50.1% of CMHC’s approved volumes excluding low ratio portfolio insurance. |
Intermediate |
| |
A healthy housing market, which includes new construction as well as renovation activity, contributes to job creation and economic growth. | | Housing-related spending, which includes spending for new residential construction, renovations, ownership transfer costs, dwelling maintenance and repair costs, rent and imputed rent, amounted to $196.7 billion as of the 4th quarter of 2013. This represents approximately 17.1% of the GDP in Canada. Source: Statistics Canada calculated by CMHC |
Long-term |
| |
Canadians who choose homeownership can increase their financial security. | | Indirectly measured by the average equity that borrowers have in their homes. As at 30 December 2013, homes in CMHC’s insured transactional homeowner and portfolio insurance loan portfolio had, on average, equity of 45%. |
| |
Rental housing is supported, increasing the percentage of Canadians able to provide for their own housing needs without any government assistance. The provision of mortgage loan insurance for rental housing and condominium construction promotes affordable housing and supports tenure options. | | Measured through CMHC mortgage loan insurance large rental units (exceeding four units), social housing units, and affordable housing through flexible underwriting policies. Over the past ten years, CMHC has approved insurance for the following: ¡ 963,068 rental apartment units ¡ 109,831 nursing and retirement home units ¡ 28,022 social housing units ¡ 30,333 affordable housing units with underwriting flexibilities (partially included in the above large rental and nursing and retirement units counts) |
| | | | | | | | |
STRATEGIC PRIORITY 2.2 – ENSURE AN ADEQUATE SUPPLY OF FUNDS FOR MORTGAGE LENDING THROUGH MORTGAGE SECURITIZATION WHILE CONSIDERING THE COMPETITIVENESS, EFFICIENT FUNCTIONING AND STABILITY OF THE HOUSING FINANCE SYSTEM | |
Performance Measures | | | 2013 | |
| | | Plan | | | Actual | |
Annual securities guaranteed ($M) | | | 90,000 | | | | 122,642 | |
¡ NHA MBS | | | 55,000 | | | | 83,992 | |
¡ CMB | | | 35,000 | | | | 38,650 | |
Per cent of total outstanding residential mortgages securitized under CMHC’s programs | | | 21 | | | | 31.1 | |
Operating expense ratio (per cent)1 | | | < 9 | | | | 5.7 | |
| | | | | | | | | | |
RESOURCES2 | | | | | | | | | | |
Operating Expenses ($M) | | | 15.1 | | | | 18.9 | | | |
Staff Years | | | 82 | | | | 78 | | | |
PERFORMANCE ANALYSIS3
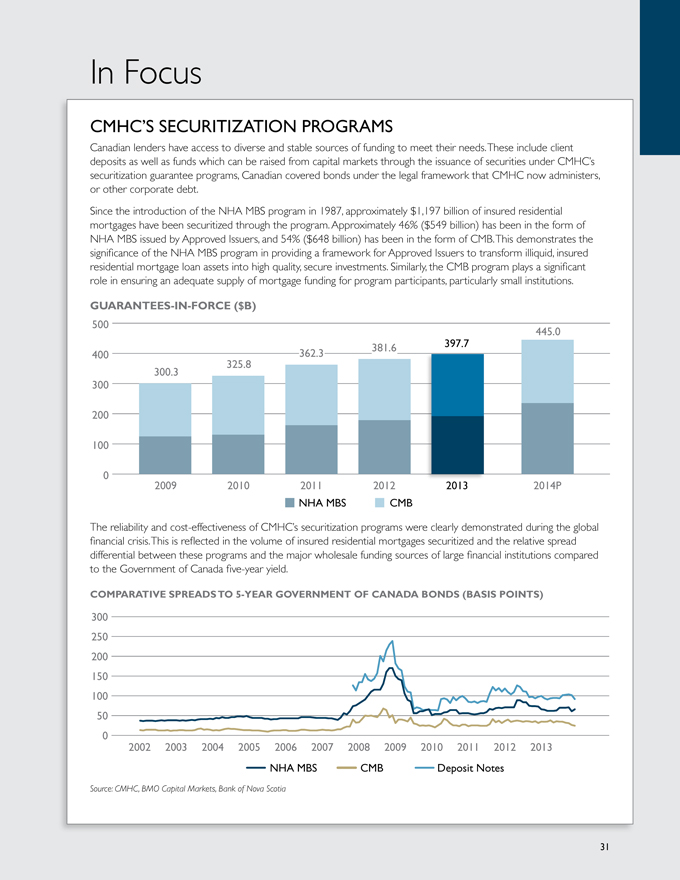
CMHC’s securitization programs are operated on a commercial basis and contribute to the stability of the Canadian financial system by helping both small and large lenders access funds for residential mortgage lending. These programs accounted for $3 billion of CMHC’s 10-year contribution of $18 billion towards improving the federal fiscal position. The importance of these programs to lenders seeking funding is demonstrated in the In Focus discussion box.
Under the NHA MBS program, lenders pool insured mortgages which are used to back NHA MBS sold to investors. CMHC guarantees the timely payment of interest and principal on NHA MBS. CMHC also guarantees timely payment of interest and principal on CMB issued by the Canada Housing Trust (CHT). The CHT is a legal entity separate from CMHC which sells CMB to domestic and international investors with the proceeds used to purchase NHA MBS.
Pursuant to the NHA, the Minister of Finance approves the terms and conditions of CMHC’s securitization programs, including the maximum guarantees available for the year. In 2013, the maximums were $85 billion and $50 billion for NHA MBS and CMB respectively.
In 2013, $122.6 billion in guarantees were granted by CMHC, which was 36% greater than the plan of $90 billion. This was mainly as a result of higher NHA MBS volumes of $84 billion, which exceeded the plan of $55 billion. As a result of unexpected growth in NHA MBS volumes in the first half of the year, CMHC implemented an allocation methodology for new guarantees of NHA MBS in August 2013. The allocation methodology ensures that CMHC’s securitization programs continue to provide both large and small lenders with access to a reasonable supply of mortgage funding on an ongoing basis. The $38.7 billion in CMB issued and guaranteed was 10% higher than the planned
| 1 | The operating expense ratio does not include the Government of Canada fee for securitization. |
| 2 | Includes operating expenses and staff years for Strategic Priority 2.3 |
| 3 | The financial results that support this Strategic Priority are discussed in section 7.4. |
target due to relatively improved investor demand. For 2014, the Minister of Finance has approved new guarantees under the NHA MBS program to a limit of $80 billion; and new issuance under the CMB program to a limit of $40 billion.
In 2013, CMHC took steps to improve transparency and standardize the NHA MBS in the areas of monthly reporting, indemnity payments and valuation tools.
Transparency will be enhanced by requiring Issuers to provide investors with additional prepayment information on a monthly basis. CMHC further standardized the NHA MBS indemnity calculation methodology for the most widely used fixed rate NHA MBS pool types. When these measures are fully implemented in 2014, they will allow investors to better assess cash flows and prepayment risks.
EXPECTED OUTCOMES
| | |
Outcomes | | Indicators |
Immediate |
| |
Increased integration of mortgage market lending with capital market lending leads to greater efficiency for lenders. | | For 2013, the cost of funds obtained by banks through the CMB program was approximately 30 basis points less than the costs of NHA MBS, which provides the next cheapest alternative source of term funding. |
| |
Enhanced competitive position of smaller lenders in the mortgage market. | | Small lenders’ access to mortgage funding through the CMB program has increased from 19% in 2006 to 55% as at December 2013. |
| |
Canadians continue to be able to access financing for their homes. | | An evaluation of the Canada Mortgage Bonds program completed in 2008 estimated that borrowers saved up to $174 million per year (or $400 million over the course of the study period) due to the program. |
Intermediate to Long-term |
| |
Financial institutions, in particular, smaller lenders, have access to robust wholesale housing finance choices. | | Small lenders’ access to mortgage funding through the CMB program has increased from 19% in 2006 to 55% as at December 2013. |
| |
A stable and resilient Canadian housing finance system. | | Canada’s housing finance system withstood one of the worst economic downturns in many years. Access to mortgage funding continued throughout the downturn as did competition in the mortgage lending market. |
| | |
| 30 C A N A D A M O R T G A G E A N D H O U S I N G C O R P O R A T I O N | | |
| | | | | | |
STRATEGIC PRIORITY 2.3 – SUPPORT FINANCIAL STABILITY THROUGH A ROBUST MARKET FOR CANADIAN COVERED BONDS, THEREBY FACILITATING FUNDING FOR THE CANADIAN HOUSING MARKET |
Performance Measures | | 2013 |
| | | Plan | | | | Actual |
Average approval times for Issuers/Programs upon submission of substantially complete applications | | 60 days | | | | 41 days |
To be monitored | | | | | | |
Value of covered bonds issued under the framework in comparison to value prior to the framework being in place (2012 C$ equivalent $17 billion) | | N/A | | | | $13.2 billion (C$ equivalent) |
PERFORMANCE ANALYSIS
Since 2012, CMHC has been administering the legal framework for Canadian covered bonds issued by federally and provincially regulated lenders. The framework ensures a high and consistent standard of disclosure designed to make Canadian covered bonds more attractive to institutional investors. Government-backed insured mortgages are not permitted to be used as collateral for covered bonds and covered bond issues are not guaranteed by CMHC or the Government of Canada. CMHC administers the framework on a cost-recovery basis.
CMHC issued the Canadian Registered Covered Bonds Program Guide (the Guide) in December 2012, which sets out the conditions or restrictions applicable to registered issuers and registered programs.
The first two covered bond programs under the framework were registered on 3 July 2013, the third on 23 July 2013 and the fourth on 1 November 2013. Additional issuer and program applications are expected to be approved by CMHC within the first half of 2014. The average approval time in 2013 was 41 days from the time complete documentation was received.
CMHC is monitoring the value of covered bonds issued under the framework in comparison to the value prior to the framework being in place. In 2013, issuances were $13.2 billion (Canadian dollar equivalent). This was a decline over the $17 billion (Canadian dollar equivalent) issued in 2012; however, there were no issuances for the first six months of 2013, as issuers modified their programs to meet the requirements of the Guide.
To date, the majority of registered issuers have been larger financial institutions. Smaller lenders face a number of challenges in issuing covered bonds. In order for covered bonds to be a cost-effective source of funds, bond issuers require a sizable portfolio of conventional mortgages and must have the ability to generate ongoing replacement assets. Legal, credit agency, administration and other costs require consideration by smaller lenders.
“We are pleased to see the approach taken in Canada with respect to covered bonds. We have already seen market acceptance and support of both the disclosure requirements and the standardization of issuer programs which have been implemented by CMHC.”
Luca Bertalot
Head of the European Covered Bond Council
EXPECTED OUTCOMES
| | |
Outcomes | | Indicators |
Intermediate to Long-term |
| |
Canada’s financial stability is supported through a more robust market for Canadian covered bonds. | | CMHC monitors the value of covered bonds issued under the framework in comparison to the value prior to the framework being in place. In 2013, the value of covered bonds issued under the framework was $13.2 billion (Canadian dollar equivalent) compared to $17 billion (Canadian dollar equivalent) in 2012 (the framework was put in place December 2012). There were, however, no issuances for the first six months of 2013, a period during which issuers modified their programs to meet the requirements of the Canadian Covered Bonds Program Guide. |
3.3 OBJECTIVE 3
Promote and contribute to informed housing decisions and a stable, competitive and innovative housing system
| | | | |
STRATEGIC PRIORITY 3.1 – UNDERTAKE POLICY DEVELOPMENT, RESEARCH AND INFORMATION TRANSFER ACTIVITIES TO ENABLE CANADIAN CONSUMERS AND THE HOUSING SECTOR TO MAKE INFORMED DECISIONS |
Performance Measures | | 2013 |
| | | Plan | | Actual |
Per cent of recipients of newly published Research Highlights who found them useful | | 70 | | 68 |
Per cent of recipients of newly published About Your House fact sheets who found them useful | | 80 | | 88 |
| | | | | | | | |
RESOURCES | | | | | | | | |
Operating Expenses ($M) | | | 16.9 | | | | 17.4 | |
Staff Years | | | 99 | | | | 97 | |
PERFORMANCE ANALYSIS1
For over six decades, CMHC has been a premier source of reliable and authoritative information on housing. Underpinning today’s research and information transfer activities is the continued need to understand Canadians’ changing housing needs and conditions, in particular those of lower income households and seniors, as well as finding and promoting practical ways of improving the quality and sustainability of housing, a cornerstone of community wellbeing. These activities are funded by the Government of Canada.
CMHC’s website is the primary distribution channel for its information products. Publications on a broad range of topics can be downloaded free of charge, and a diverse range of digital content, including data tables, interactive charts and maps, virtual tours and video clips can also be accessed on-line at our website.
In 2013, newly published Research Highlights and About Your House fact sheets received usefulness ratings of 68% and 88%, respectively. Ten new Research Highlights summarized research that CMHC commissioned on socio-economic or technical aspects of housing. About Your House fact sheets provide practical information to homeowners on a range of housing-related topics, including ways to increase energy efficiency. Newly published fact sheets on green renovations and the collection and re-use of rainwater were well received.
Among other key releases in 2013 were CMHC’s flagship publication, the Canadian Housing Observer, a new edition of Canadian Wood-Frame House Construction and Glossary of Housing Terms, the Renovators’ Green Guide and an enhanced Condominium Buyer’s Guide.
| 1 | The financial results that support this Strategic Priority are discussed in section 7.1. |
| | |
| 34 C A N A D A M O R T G A G E A N D H O U S I N G C O R P O R A T I O N | | |
CMHC examines core housing need (see Glossary) on an ongoing basis using data from the Census and other Statistics Canada surveys. Information on core housing need based on Statistics Canada’s Survey of Labour of Income Dynamics (SLID) can be found in the 2013 Canadian Housing Observer. In the second half of 2014, CMHC expects to publish core housing need estimates based on the 2011 National Household Survey.
It is estimated that, by 2036, almost a quarter of Canada’s population will be 65 years of age or over. The 2011 Census reported that just over 92% of seniors lived in private households. CMHC has a range of fact sheets, check lists and guides that provide practical information on designing and adapting housing to make it more safe and accessible. Examples include Maintaining Seniors Independence Through Home Adaptations, Accessible Housing by Design and About your House: Garden Suites.
In 2013, CMHC developed five webinars based on its five-volume series Housing for Older Canadians – The Definitive Guide to the Over-55 Market which was released in 2012. These webinars were promoted to over 27,000 contacts by the Canadian Green Building Council and the Canadian Institute of Planners in 2013, and they were viewed by nearly 1,000 people.
Eleven demonstration projects designed to showcase technologies that result in highly energy-efficient housing were constructed under the EQuilibrium™ Sustainable Housing Demonstration Initiative. In 2013, CMHC published research reports on 10 of these homes. Eight EQuilibrium™ Housing and Community Insights fact sheets were also released in 2013. Post-occupancy monitoring demonstrates that these homes are some of the most energy-efficient homes constructed in Canada.
REACHING CANADIANS
| | ¡ | 7.6 million visits to CMHC’s website |
| | ¡ | 1.9 million reached on Twitter |
| | ¡ | 2.1 million housing information products downloaded or distributed |
| | ¡ | 593,000 market analysis publications downloaded or distributed |
| | ¡ | 46,000 housing inquiries processed through CMHC’s call centres |
| | ¡ | 42,000 Canadians downloaded CMHC digital apps |
To address the unique and challenging housing needs in northern communities, CMHC works closely with northern housing providers through the Northern Sustainable Housing Initiative. Demonstration projects in Dawson, Yukon; Inuvik, Northwest Territories; and Arviat, Nunavut showcase four homes designed to demonstrate high levels of energy efficiency and cultural appropriateness. Some of the homes involve “flex” features that support accessibility for occupants and/or visitors, and adaptability to changing needs. Community members were highly engaged in the design of these demonstration projects.
EXPECTED OUTCOMES
| | |
Outcomes | | Indicators |
Immediate |
| |
Consumers, the housing industry, stakeholders and policy makers have access to timely and relevant information on housing. | | Indirectly measured by take-up of and satisfaction with CMHC’s information products in 2013: ¡ Nearly 2.1 million housing information products downloaded or distributed ¡ 68% of recipients of newly published Research Highlights found them useful ¡ 88% of recipients of About Your House publications found them useful Also indirectly measured through more than 7.6 million visits to CMHC’s website, with each visitor averaging more than 5 minutes per visit To help newcomers to Canada make informed housing decisions, CMHC provides information products on renting, home buying and planning and managing your mortgage in six languages in addition to English and French: Mandarin, Urdu, Tagalog, Punjabi, Spanish and Arabic. In total, CMHC’s “Housing for Newcomers” micro site (www.cmhc.ca/newcomers) generated 289,696 visits to the site in 2013, an increase of 32% compared to 2012. Furthermore, over 600,000 pages of content were consumed on the Newcomers micro site in 2013. |
Intermediate |
| |
Consumers and the housing industry are aware of and adopt best practices. | | 68% of the industry participants of the EQuilibriumTM Housing Forum held in Vancouver in 2012 indicated that they were very likely to incorporate the knowledge gained and lessons learned from the four EQuilibriumTM projects presented at the two-day forum. |
| |
Governments and other organizations, including First Nations and Aboriginal organizations, have information to better assess policy options related to housing for Canadians in need. | | CMHC’s website offers a broad range of statistical information on housing which can be downloaded and customized. Indirectly measured through the number of publications ordered or downloaded and usefulness ratings of research products, Housing Outlook Conferences and other information transfer activities as noted above. CMHC also publishes, on an annual basis, the Canadian Housing Observer which provides an in-depth review of housing conditions and trends, and describes some of the key factors influencing developments in housing. CMHC published the 2013 edition of the Canadian Housing Observer in December. |
Long-term |
| |
Greenhouse gas emissions attributable to the residential sector are reduced through improved performance of new and existing homes. | | The performance of EQuilibriumTM houses after occupancy is being monitored. Results to date indicate EQuilibriumTM homes can attain a 60% to 92% improvement in energy performance compared to conventional new construction, a 43% to 88% improvement in energy performance compared to the current R2000 standard (a benchmark for energy efficient housing), and an 80% improvement in energy performance for the EQuilibriumTM retrofit project, compared to a similar existing 1950 era conventional house. |
| | |
| 36 C A N A D A M O R T G A G E A N D H O U S I N G C O R P O R A T I O N | | |
| | | | |
STRATEGIC PRIORITY 3.2 – PROVIDE COMPREHENSIVE, TIMELY AND RELEVANT MARKET ANALYSIS INFORMATION |
Performance Measures | | 2013 |
| | | Plan | | Actual |
Per cent of subscribers to market analysis publications who found them useful | | 93 | | 94 |
Per cent of attendees at Housing Outlook Conferences who found them useful | | 95 | | 99 |
Forecast accuracy of housing starts (per cent) | | within 10%
of actual | | 3 |
Ranking of housing starts forecast accuracy among forecasters | | 1st quartile | | 3rd quartile (12th) |
| | | | | | | | |
RESOURCES | | | | | | | | |
Operating Expenses ($M) | | | 35.1 | | | | 31.6 | |
Staff Years | | | 265 | | | | 259 | |
PERFORMANCE ANALYSIS1
CMHC is Canada’s most comprehensive source of housing market information. A range of housing market surveys, housing market analysis and forecasts at the local, provincial/territorial, and national levels are released on a regular basis, and annual Housing Outlook Conferences (HOCs) are held in each region to share CMHC’s forecasts for the coming year with housing industry members and other public and private sector participants.
In 2013, CMHC attained a forecast accuracy of 3% within actual; however, it ranked 12th amongst 16 forecasters as most of the forecasts were within close proximity of
one another. Its market analysis publications and HOCs received high usefulness ratings. There were 42,869 subscribers to CMHC’s electronic releases of market analysis products and a total of 5,100 participated at HOCs during the year.
In addition to these activities, CMHC responds to requests for information from external clients. CMHC continued to develop a new web-based interface or portal to be launched in 2014 which will allow its housing market information to be more easily accessed and content selection to be customized by clients themselves.
| 1 | The financial results that support this Strategic Priority are discussed in section 7.1. |
EXPECTED OUTCOMES
| | |
Outcomes | | Indicators |
Immediate to intermediate |
| |
Consumers, the housing industry, stakeholders and policy makers have access to timely and relevant information on housing. | | Indirectly measured by take-up of and satisfaction with CMHC’s market analysis products in 2013: ¡ Approximately 593,000 market analysis publications downloaded or distributed. ¡ 94% of recipients of market analysis publications found them useful ¡ 99.4% of attendees of Housing Outlook Conferences found them useful Also indirectly measured through 7.6 million visits to CMHC’s website, with each visitor averaging more than 5 minutes per visit. |
Intermediate to long-term |
| |
The housing market is more efficient and stable as a result of more effective matching of supply and demand. | | Indirectly measured through a number of indicators that CMHC monitors, including: the sales-to-new listings ratio, house price growth and levels relative to their long-term fundamentals, and the vacancy rate of rental housing. |
| |
Consumers and the housing industry are aware of and adopt best practices. | | Indirectly measured through the number of publications ordered or downloaded and usefulness ratings of research products, Housing Outlook Conferences and other information transfer activities. |
| | |
| 38 C A N A D A M O R T G A G E A N D H O U S I N G C O R P O R A T I O N | | |
The following describes some of key corporate functions that support the achievement of CMHC’s objectives.
4.1 Human Resources
CMHC is comprised of 1,900 employees working at its National Office and in five regional business centres. While staff year volumes fluctuate based on commercial operations, CMHC expects that the total number of employees will not vary significantly for the planning period.
The Corporation has a strong history of being a sought-out employer given its mandate and career opportunities. As shown below, the retention rate of 97% for new recruits is very high. The average years of service is 12.8.
CMHC values its employees and strives to foster a motivating workplace. This year, the employee engagement level of 94% exceeded the target of 90% and the voluntary turnover rate remained low at 1.6%.
The Corporation embraces Canada’s commitment to official languages and meets or exceeds all of its obligations under the Official Languages Act. In 2013, CMHC launched its new employee publication Linguistic Duality at Work for You: Your Guide to Official Languages at CMHC. CMHC also maintained its linguistic capacity and met its target with 91% of employees in bilingual positions meeting their language requirements.
While the representation rates for Aboriginal persons and persons with disabilities fell short of CMHC’s 2013 targets, these results will be much closer to the representation rates in the broader labour force once CMHC aligns its targets with the methodology used for the federal public service in 2014.
| | | | | | | | | | |
Performance Measures | | | | | 2013 | |
| | | | | Plan | | | Actual | |
Retention of regular employees recruited 3 to 5 years ago (per cent) | | | 93 | | | | 97 | |
Level of employee engagement (per cent) | | | 90 | | | | 94 | |
Critical and senior management positions with succession ready
individual(s) (per cent) | | | 90 | | | | 94 | |
Employees with development plans in place in CMHC’s online performance management system (per cent) | | | 95 | | | | 98 | |
Employees in bilingual positions meeting language requirements (per cent) | | | 90 | | | | 91 | |
Retention rate of succession management participants (per cent) | | | 95 | | | | 100 | |
Representation rates for Aboriginal people, visible minorities and persons with disabilities1 reflect or exceed the labour representation
rates in the latest Census (per cent) | | Aboriginal people | | | 3.1 | | | | 2.8 | |
| | Visible minorities | | | 15.9 �� | | | | 16.9 | |
| | Persons with disabilities | | | 4.7 | | | | 4.1 | |
| | | | | | | | | | | |
| 1 | Starting in 2014, CMHC will align its methodology with that used by ESDC and the Canadian Human Rights Commission for the broader federal public service. Under this approach, CMHC’s 2013 representation rates are close enough to the labour force representation rates to meet its 2014 targets for each employment equity group: Aboriginal persons (2.9%), visible minorities (17.7%) and persons with disabilities (4.2%) |
SUCCESSION PLANNING
Separations remained stable in 2013 with an increase in retirements being offset by fewer departures. Succession-ready individuals have been identified for a number of critical and senior management positions and, in 2013, 94% of critical and senior management positions had an individual or individuals ready to be fully functional in these positions within six months. In addition, 100% of succession management participants remained employed with CMHC in 2013.
LEADERSHIP DEVELOPMENT
Significant resources and strategies are dedicated to the training and development of employees at all levels of the Corporation.
A leadership development framework was adopted in 2013 with five key components:
| n | | Creating leadership development opportunities |
| n | | Reinforcing leadership in performance planning and evaluation |
| n | | Updating CMHC’s leadership development curriculum |
| n | | Promoting the knowledge and awareness of self and others |
| n | | Promoting linguistic duality |
In 2013, leadership development efforts were well complemented with career development opportunities as the number of promotions increased by 45% in 2013 from the previous year.
TOTAL COMPENSATION
CMHC offers its employees a total compensation package that is competitive and sustainable in the long term. In 2013, CMHC implemented a new and more flexible benefit plan to maximize choice for employees. Also in 2013 steps were taken to align CMHC’s defined benefit pension plan with that of the federal public service. A new defined contribution pension plan component was established for new hires and eligible contract employees effective 4 April 2013.
| | |
| 4.2 | | Administrative Services and Information Technology (IT) |
| | | | | | | | |
| Performance Measure | | | 2013 | |
| | | Plan | | | Actual | |
Technology index for key systems (per cent)1 | | | 99.8 | | | | 99.9 | |
Administrative services and information technology play a critical role in enabling and supporting CMHC’s business lines. In 2013, CMHC continued to implement its multi-year strategy encompassing key business projects and core infrastructure initiatives. The objective of the multi-year strategy is to ensure that CMHC is able to continually improve, automate and streamline its business processes in order to fulfill its mandate and more effectively achieve its core objectives. As part of this strategy, CMHC updated and tested its business impact assessment, business continuity policy and disaster recovery plans.
Key projects in 2013 included the upgrade of core infrastructure related to server centralization, telecommunications and advances in mobile technologies. These projects addressed the maturity of systems and their underlying technology. In addition, CMHC assessed its security program and implemented measures to mitigate the increasing risks posed by cyber threats.
CMHC continues to use technology to assist in obtaining operational effectiveness and efficiencies. As a result, CMHC commenced a major initiative in 2013 to transform and improve its internal processes related to information and document management. This initiative will enable CMHC employees to work more efficiently, find documents more quickly and easily, and collaborate with colleagues.
| 1 | Calculated by comparing the actual availability of the mission critical business applications against their planned availability |
| | |
| 40 C A N A D A M O R T G A G E A N D H O U S I N G C O R P O R A T I O N | | |
| | |
| 4.3 | | Communications and Corporate Marketing |
CMHC’s communications and corporate marketing activities support the achievement of its objectives and strategic priorities by enhancing awareness of its programs, products and services so that Canadians can make better informed decisions on housing. CMHC offers a wide range of products to inform consumers in areas such as mortgage literacy, sustainable housing and seniors housing. The Corporation also targets new Canadians with information on housing to help them meet their needs at a time when it is most needed. Communications and marketing activities also inform Canadians of the federal investments in affordable housing that assist lower income families.
| | |
| 4.4 | | Sector of the Chief Financial Officer |
The Sector of the Chief Financial Officer is responsible for the integrity of the Corporation’s financial management, culture and capabilities. The sector is an independent Finance oversight function responsible for ensuring the timely and accurate reporting and in-depth analysis of the operational results of the Corporation in order to support decision-making by CMHC Management and the Board. In this capacity, the sector provides leadership, vision and direction in the disciplines of financial planning and analysis, tax risk assessment and financial risk management, financial policy development and deployment, problem resolution, the implementation of financial controls, reporting and accounting. The sector is responsible for maintaining appropriate financial systems and related internal controls; providing reasonable assurance that financial information is reliable, assets are safeguarded, transactions are properly authorized and are in accordance with the relevant legislation and by-laws of the Corporation; that applicable tax law and regulations are complied with; that resources are managed efficiently and economically; and that those operations are carried out effectively. The sector of the Chief Financial Officer is also responsible for the Corporation’s capital management and actuarial analysis activities.
| | |
| 4.5 | | Administration of Granville Island |
Granville Island is a cultural, recreational and commercial development in central Vancouver owned by the Government of Canada. It is home to approximately 275 businesses and enterprises which employ more than 3,000 people in full-time and part-time jobs and generates more than $215 million in economic activity annually. Responsibility for administration and management of the Island was transferred to CMHC in 1973 through an Order in Council. CMHC administers the ongoing operations and development of Granville Island on a self-sustaining basis at no cost to Canadian taxpayers. The Island has been maintained by reinvesting surplus operating funds in the repair and maintenance of infrastructure such as underground services, docks and seawalls, public spaces and building upgrades. In 2014, planning will continue for the 2016 departure of the Emily Carr University of Art + Design which will see close to 200,000 square feet of leasable space vacated.
| | |
| 4.6 | | Legal Services and Corporate Secretariat |
The General Counsel and Corporate Secretary is responsible for the strategic leadership and oversight of the Corporation’s legal services and corporate secretariat functions, and for advising on the overall good governance of the Corporation. CMHC’s Legal Services Division supports the Corporation’s activities and the management of its business through the identification and management of legal issues, requirements and risks. Corporate Secretariat provides a complete range of services to support the Corporation’s decision-making process, ensuring that the policies, procedures and infrastructure to support the corporate decision-making process function effectively.
| | |
| 4.7 | | Audit and Evaluation Services |
The internal audit function provides independent, objective assurance, and consulting services designed to improve CMHC’s operations and helps CMHC achieve its objectives by bringing a systematic, disciplined approach to evaluating and improving the effectiveness of risk management, control and governance practices. The program evaluation function provides evidence-based assessment of the relevance and effectiveness of CMHC’s policies and programs.
| | | | | | | | | | | | | | | | | | | | |
| | | Actual | |
| (in millions, unless otherwise indicated) | | 2013 | | | 20121 | | | 20111 | | | 20101 | | | 20091,2 | |
| CORPORATE RESULTS | | | | | | | | | | | | | | | | | | | | |
Total Assets | | | 270,051 | | | | 292,040 | | | | 291,890 | | | | 287,940 | | | | 272,821 | |
Total Liabilities | | | 254,213 | | | | 278,196 | | | | 279,799 | | | | 277,499 | | | | 263,558 | |
Total Equity of Canada | | | 15,838 | | | | 13,844 | | | | 12,091 | | | | 10,441 | | | | 9,263 | |
Total Revenues | | | 5,141 | | | | 5,289 | | | | 5,119 | | | | 5,933 | | | | 5,267 | |
Total Expenses3 | | | 3,312 | | | | 3,590 | | | | 3,590 | | | | 4,493 | | | | 4,336 | |
Net Income | | | 1,829 | | | | 1,699 | | | | 1,529 | | | | 1,440 | | | | 931 | |
| HOUSING PROGRAMS | | | | | | | | | | | | | | | | | | | | |
Parliamentary Appropriations for Housing Programs Expenses | | | 2,071 | | | | 2,197 | | | | 2,163 | | | | 3,155 | | | | 2,613 | |
Housing Programs Expenses | | | 2,071 | | | | 2,197 | | | | 2,163 | | | | 3,155 | | | | 2,613 | |
| LENDING | | | | | | | | | | | | | | | | | | | | |
Net Income | | | 91 | | | | 12 | | | | 13 | | | | 13 | | | | (16 | ) |
Total Equity | | | 192 | | | | 9 | | | | 29 | | | | 93 | | | | 176 | |
| MORTGAGE LOAN INSURANCE | | | | | | | | | | | | | | | | | | | | |
Insurance-in-Force ($B) | | | 557 | | | | 566 | | | | 567 | | | | 514 | | | | 473 | |
Total Insured Volumes | | | 61,053 | | | | 66,029 | | | | 105,953 | | | | 106,095 | | | | 152,040 | |
Premiums and Fees Received | | | 1,308 | | | | 1,475 | | | | 1,653 | | | | 1,941 | | | | 2,464 | |
Claims Paid | | | 436 | | | | 532 | | | | 617 | | | | 678 | | | | 512 | |
Premiums and Fees Earned | | | 1,754 | | | | 1,807 | | | | 1,791 | | | | 1,738 | | | | 1,643 | |
Insurance Claims losses | | | 309 | | | | 487 | | | | 562 | | | | 497 | | | | 1,112 | |
Net Income | | | 1,507 | | | | 1,405 | | | | 1,336 | | | | 1,275 | | | | 742 | |
Loss Ratio | | | 17.6% | | | | 27.0% | | | | 31.4% | | | | 28.6% | | | | 67.7% | |
Operating Expense Ratio | | | 12.8% | | | | 11.7% | | | | 10.8% | | | | 10.7% | | | | 11.9% | |
Combined Ratio | | | 30.4% | | | | 38.7% | | | | 42.2% | | | | 39.3% | | | | 79.6% | |
Severity Ratio | | | 30.9% | | | | 31.3% | | | | 32.4% | | | | 32.7% | | | | 32.3% | |
Return on Equity | | | 11.2% | | | | 11.8% | | | | 12.8% | | | | 14.3% | | | | 9.8% | |
Return on Capital Holding Target | | | 13.7% | | | | 13.7% | | | | 14.4% | | | | 15.0% | | | | 9.8% | |
Capital Available to Minimum Capital Required | | | 250% | | | | 231% | | | | 226% | | | | 220% | | | | 199% | |
% Estimated Outstanding Canadian Residential Mortgages with CMHC Insurance Coverage ($) | | | 45.6% | | | | 48.6% | | | | 51.1% | | | | 49.9% | | | | 49.2% | |
| SECURITIZATION | | | | | | | | | | | | | | | | | | | | |
Total Guarantees-in-Force ($B) | | | 398 | | | | 382 | | | | 362 | | | | 326 | | | | 300 | |
Annual Securities Guaranteed ($B) | | | 122,642 | | | | 119,531 | | | | 116,725 | | | | 95,069 | | | | 135,447 | |
Guarantee and Application Fees Received | | | 265 | | | | 260 | | | | 257 | | | | 222 | | | | 291 | |
Guarantee and Application Fees Earned | | | 247 | | | | 242 | | | | 211 | | | | 187 | | | | 161 | |
Net Income | | | 207 | | | | 272 | | | | 211 | | | | 175 | | | | 69 | |
Operating Expense Ratio | | | 10.6% | | | | 9.6% | | | | 9.4% | | | | 9.4% | | | | 9.0% | |
Return on Equity | | | 15.8% | | | | 24.3% | | | | 23.5% | | | | 25.5% | | | | 7.3% | |
Capital Available to Capital Required | | | 182% | | | | 156% | | | | 133% | | | | 105% | | | | 81% | |
% Estimated Outstanding Canadian Residential Mortgages with CMHC Securitization Guarantee ($) | | | 31.1% | | | | 28.5% | | | | 26.7% | | | | 27.0% | | | | 26.0% | |
| CHT | | | | | | | | | | | | | | | | | | | | |
Assets | | | 207,115 | | | | 204,060 | | | | 201,795 | | | | 196,638 | | | | 182,206 | |
Liabilities | | | 207,115 | | | | 204,060 | | | | 201,795 | | | | 196,638 | | | | 182,240 | |
| 1 | Restated for comparative purposes; refer to Note 3 of the Consolidated Financial Statements. |
| 2 | 2009 is accounted for under CGAAP; 2010 onward is accounted for under IFRS. |
| | |
| 42 C A N A D A M O R T G A G E A N D H O U S I N G C O R P O R A T I O N | | |
| | |
| 6 | | Condensed Consolidated Financial Results |
| | |
| 6.1 | | Condensed Consolidated Balance Sheet |
| | | | | | | | | | |
| (in millions) | | 2013 | | 20121 |
| Total Assets | | | | 270,051 | | | | | 292,040 | |
| Total Liabilities | | | | 254,213 | | | | | 278,196 | |
| Total Equity of Canada | | | | 15,838 | | | | | 13,844 | |
| | 1 | Restated for comparative purposes; refer to Note 3 of the Consolidated Financial Statements. |
TOTAL ASSETS
Total Assets were $270.1 billion as at 31 December 2013, of which $234.7 billion (86.9%) represented loans receivable arising from the IMPP and CMB programs.
Total Assets as at 31 December 2013 decreased by $22.0 billion (7.5%) from the prior period. This decline was primarily the result of lower loans receivable balances arising from IMPP and lending-related activity, partially offset by higher loans receivable balances arising from CMB related activity.
Loans receivable arising from IMPP and from the Lending Activity were $28.1 billion and $10.9 billion respectively. These balances decreased by $24.4 billion (46.5%) for the IMPP and $875 million (7.4%) for the Lending Activity from the prior period due to scheduled maturities of loans receivable.
Loans receivable arising from CMB activity were $206.6 billion, a $3.1 billion (1.5%) increase from the prior period due to the acquisition of beneficial interests in NHA MBS from Approved Issuers, net of scheduled maturities.
TOTAL LIABILITIES
Total Liabilities were $254.2 billion as at 31 December 2013, of which $234.7 billion (92.3%) represented borrowings incurred for the IMPP and CMB programs.
Total Liabilities as at 31 December 2013 decreased by $24.0 billion (8.6%) from the prior period. This decline was primarily the result of lower borrowings from IMPP and lending-related activity, lower Unearned Premiums and Fees and Pension Benefit Plans Liability, partially offset by higher borrowings from CMB related activity.
Borrowings from IMPP activity and from the Lending Activity were $28.1 billion and $12.7 billion respectively. These balances were a decrease from the prior period of $24.4 billion (46.5%) for the IMPP due to repayments of debt incurred by CMHC for the initial purchase of IMPP assets and $995 million (7.3%) for the Lending Activity due to repayments of debt incurred for purposes of issuing loans.
Unearned Premiums and Fees were $6,511 million, a $429 million (6.2%) decrease from the prior period. Changes in Unearned Premiums and Fees are comprised of Premiums and Fees Received for the period less premiums and fees recognized in income during the period. For the Mortgage Loan Insurance Activity, premiums and fees are recognized in income over the period covered by the policy. For the Securitization Activity, fees are recognized in income over the period of guarantee. For the period ending 31 December 2013, CMHC received $1.3 billion ($1.4 billion – 31 December 2012) in premiums and fees. This was offset by $1.7 billion ($1.8 billion – 31 December 2012) of Premiums and Fees Earned in the year. Together these account for the $429 million decrease in Unearned Premiums and Fees.
The Pension Benefit Plans Liability was $350 million, a $367 million (51.2%) decrease from the prior period as a result of cash contributions and actuarial gains.
Borrowings arising from CMB activity were $206.6 billion, a $3.1 billion (1.5%) increase from the prior period as a result of issuances of CMB by CHT.
TOTAL EQUITY OF CANADA
Total Equity of Canada was $15,838 million at 31 December 2013, a $1,994 million (14.4%) increase over the prior period. The year-over-year increase represents the Comprehensive Income recognized by CMHC during 2013.
TOTAL EQUITY OF CANADA ($M)
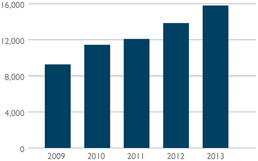
| | |
| 6.2 | | Condensed Consolidated Statement of Income and Comprehensive Income |
| | | | | | | | |
| (in millions) | | 2013 | | | 20121 | |
| Total Revenues | | | 5,141 | | | | 5,289 | |
| Total Expenses | | | 2,728 | | | | 3,021 | |
| Income Taxes | | | 584 | | | | 569 | |
| Net Income | | | 1,829 | | | | 1,699 | |
| Other Comprehensive Income | | | 165 | | | | 55 | |
| Comprehensive Income | | | 1,994 | | | | 1,754 | |
| 1 | Restated for comparative purposes; refer to Note 3 of the Consolidated Financial Statements. |
TOTAL REVENUES
Total Revenues were $5,141 million for the year ended 31 December 2013, a $148 million (2.8%) decrease from the prior period. This decline was primarily the result of lower Parliamentary Appropriations for Housing Programs and lower Premiums and Fees Earned, partially offset by higher Net Interest Income.
Parliamentary Appropriations for Housing Programs were $2,071 million, a $126 million (5.7%) decrease from the prior period due primarily to the revised timing of funding being claimed by the provinces and territories under the IAH.
Premiums and Fees Earned were $2,001 million, a $48 million (2.3%) decrease from the prior period due primarily to decreasing insured volumes in the Mortgage Loan Insurance Activity over the past several years.
Net Interest Income was $147 million, a $34 million (30.1%) increase over the prior period due primarily to the recording of an interest loss recovery during 2013 while no amount was recovered in 2012.
The interest loss recovery is a reimbursement for interest losses incurred by CMHC as a result of prepayment and re-pricing activities. This reimbursement is included in Interest Income and recovered from the Government through Housing Programs Appropriations.
| | |
| 44 C A N A D A M O R T G A G E A N D H O U S I N G C O R P O R A T I O N | | |
TOTAL EXPENSES
Total Expenses were $2,728 million for the year ended 31 December 2013, a $293 million (9.7%) decrease from the prior period. This decline was primarily the result of lower Housing Programs and Insurance Claims losses.
Housing Programs expenses were $2,071 million, a $126 million (5.7%) decrease from the prior period due primarily to the revised timing of funding being claimed by provinces and territories under the IAH.
Insurance Claims losses, which represents the losses incurred during the period as a result of the changes to the Provision for Claims, was $309 million, a $178 million (36.6%) decrease from the prior period. This decline is primarily the result of decreases in the long term frequency of claims driven by better economic conditions as follows:
| n | | decrease in the unemployment rate from 7.2% to 7.1%; |
| n | | decrease in the arrears rate from 0.35% to 0.34%; and |
| n | | increase in house price inflation from 0.28% to 5.26%. |
Refer to Operating Environment for more information.
INCOME TAXES
As a prescribed federal Crown corporation, CMHC is subject to federal income tax but not provincial income tax.
In addition to income taxes, CMHC is subject to Goods and Services Tax/Harmonized Sales Tax (GST/HST), provincial sales tax and payroll taxes. As a prescribed federal Crown Corporation, CMHC is exempt from paying property taxes but does make payments to municipalities in lieu of property taxes with respect to the properties that it owns.
| | | | | | | | | | |
| (in millions) | | 2013 | | 20121 |
| Income Tax Expense | | | | 584 | | | | | 569 | |
| Indirect Taxes | | | | | | | | | | |
GST/HST and provincial sales tax | | | | 14 | | | | | 13 | |
Payroll taxes | | | | 14 | | | | | 14 | |
Payment in lieu of property taxes | | | | 2 | | | | | 2 | |
| Total Indirect Taxes | | | | 30 | | | | | 29 | |
| Total Income and Indirect taxes | | | | 614 | | | | | 598 | |
| Effective income tax rate | | | | 24.2 | % | | | | 25.1 | % |
| Effective total tax rate2 | | | | 25.1 | % | | | | 26.1 | % |
| 1 | Restated for comparative purposes; refer to Note 3 of the Consolidated Financial Statements. |
| 2 | Total income and indirect taxes as a percentage of net income before income and indirect taxes. |
Income tax expense was $584 million for the period ending 31 December 2013, a $15 million (2.6%) increase over the prior period. The increased income tax expense associated with higher Net Income was slightly offset by the impact of historical tax rates (which were higher than the current statutory income tax rate) on the reclassification of the prior years’ net unrealized gains from Other Comprehensive Income (OCI) to Net Income.
The statutory income tax rate applicable to CMHC is 25%.
The effective tax rate was 24.2%, 0.9% lower than the prior period primarily due to the tax impact of the reclassification of the realized gains from OCI to Net Income and higher non-taxable amounts, for example non-taxable dividends, in the current year.
Indirect taxes increased by $1 million (3.4%) over the prior period primarily as a result of the net increase in GST/HST and provincial sales taxes paid due to the further harmonization of the QST with the GST/HST that took effect in 2013.
NET INCOME
Net Income was $1,829 million for the year ended 31 December 2013, an $130 million (7.7%) increase over the prior period primarily as a result of the aforementionned variances in Premiums and Fees Earned, Net Interest Income and Insurance Claims losses. The variances in Parliamentary Appropriations for Housing Programs and Housing Programs expenses offset one another and have no effect on Net Income.
OTHER COMPREHENSIVE INCOME
Other Comprehensive Income was $165 million for the year ended 31 December 2013, a $110 million (200.0%) increase over the prior period. This increase was the result of an increase in the Remeasurements of the Net Defined Benefit Plans and an increase in the Reclassification of Prior Years’ Net Unrealized (Gains) Losses. These increases were offset by a reduction in the Net Unrealized Gains (Losses) from Available for Sale Financial Instruments (net of tax).
The Remeasurements of the Net Defined Benefit Plans were $260 million, a $341 million (421.0%) increase over the prior period. This was primarily the result of increases in the discount rate used to calculate the present value of the defined benefit obligation and a higher actual rate of return on plan assets.
The Reclassification of Prior Years’ Net Unrealized Gains were $94 million, an increase of $53 million (36.1%) over the prior period. A reclassification from OCI to Net Income occurs when financial instruments are sold during the period.
The Net Unrealized Losses from Available for Sale Financial Instruments (net of tax) were $1 million compared to the net unrealized gains of $283 million in the prior period. This decrease of $284 million (100.35%) was primarily the result of lower fair values of fixed income investments due to increased bond yields during the period. This was partially offset by increased gains on equity investments in Canadian and international equity markets due to better market conditions.
POST-EMPLOYMENT BENEFITS
CMHC’s post-employment benefits include pension plans and other post-employment benefits. The pension plans consist of a regular pension plan and a supplemental pension plan, both of which contain a defined benefit and defined contribution component. Other post-employment benefits consist primarily of severance pay, life insurance and medical insurance.
The annual cost of the post-employment benefits is actuarially determined and is based on management’s best estimate of compensation levels, retirement ages, mortality and future health care costs.
For the period ended 31 December 2013, the amount included in Operating Expense for post-employment benefits was $68 million, a $5 million (7.9%) increase over the prior period.
With the exception of the Housing Programs Activity, the remeasurement of these benefits (the actuarial gains and losses and the return on plan assets) is recognized in Other Comprehensive Income within the business activities as incurred. To preserve the breakeven methodology of Housing
Programs, the pension obligation and the remeasurements related to this activity are recognized in the Lending Activity’s segmented financial statements until they are reimbursed over time by the Government through appropriations. Once reimbursed, they are recognized as Other Income in the Lending Activity such that, over time, there is no impact to the Lending Activity. The remeasurement occurs over ten years.
For the period ended 31 December 2013, Remeasurement Gains were $323 million, a $423 million (423.0%) increase over the prior period. These increases were primarily the result of a year over year increase in the discount rate from 3.9% to 4.8% and a higher actual rate of return on the plan assets in 2013 than that experienced in 2012.
Total cash payments made this year for post-employment benefits were $112 million (2012 - $50 million). These cash payments include contributions by CMHC to the defined benefit component of the Pension Plan, including going concern and solvency special payments (refer to Note 22 of the Consolidated Financial Statements).
| | |
| 46 C A N A D A M O R T G A G E A N D H O U S I N G C O R P O R A T I O N | | |
| | |
| 6.3 | | Comparison Against Plan |
| | | | | | | | |
| | | 2013 | |
| (in millions) | | Plan1 | | | Actual | |
| CONDENSED CONSOLIDATED STATEMENT OF INCOME AND COMPREHENSIVE INCOME | |
| Parliamentary Appropriations for Housing Programs | | | 2,101 | | | | 2,071 | |
| Premiums and Fees Earned | | | 1,986 | | | | 2,001 | |
| Net Interest Income | | | 152 | | | | 147 | |
| Investment Income | | | 564 | | | | 606 | |
| Other Income | | | 219 | | | | 316 | |
| Total Revenues | | | 5,022 | | | | 5,141 | |
| Housing Programs Expenses | | | 2,101 | | | | 2,071 | |
| Insurance Claims losses | | | 561 | | | | 309 | |
| Operating Expenses | | | 350 | | | | 348 | |
| Total Expenses | | | 3,012 | | | | 2,728 | |
| Income before Income Taxes | | | 2,010 | | | | 2,413 | |
| Income Taxes | | | 486 | | | | 584 | |
| Net Income | | | 1,524 | | | | 1,829 | |
| CONDENSED CONSOLIDATED BALANCE SHEET | |
| Total Assets | | | 267,847 | | | | 270,051 | |
| Total Liabilities | | | 252,731 | | | | 254,213 | |
| Total Equity of Canada | | | 15,116 | | | | 15,838 | |
| 1 | Restated for comparative purposes; refer to Note 3 of the Consolidated Financial Statements. |
TOTAL REVENUES
Total Revenues were $5,141 million, $119 million (2.4%) higher than plan.
Parliamentary Appropriations for Housing Programs
Parliamentary Appropriations for Housing Programs were $30 million (1.4%) below plan. This was primarily due to lower than planned interest and inflation rates under the Funding for Long-Term Commitments for Existing Social Housing.
Premiums and Fees Earned
Premiums and Fees Earned were relatively consistent to plan, with total Premiums and Fees Earned during the period being $15 million (0.8%) above plan.
Net Interest Income
Net Interest Income was $5 million (3.3%) below plan, relatively consistent with expectations.
Investment Income
Investment Income was $42 million (7.4%) above plan primarily due to higher investment related assets than planned.
Other Income
CMHC’s Other Income is comprised of Net Realized and Unrealized Gains (Losses) from financial instruments, fair value fluctuations from certain investment properties in the Lending Activity as well as recoveries of post-employment benefits relating to the Housing Program Activity.
Other Income was $316 million, $97 million (44.3%) higher than plan. This was primarily due to $101 million higher than planned unrealized gains on financial instruments due primarily to greater returns on foreign equity investments held as a result of fluctuations in market prices.
TOTAL EXPENSES
Total Expenses were $2,728 million; $284 million (9.4%) lower than plan.
Housing Programs Expenses
Housing Programs Expenses were $30 million (1.4%) below plan. This was primarily due to lower than planned interest and inflation rates under the Funding for Long-Term Commitments for Existing Social Housing.
Insurance Claims losses
Insurance Claim losses were $252 million (44.9%) below plan as a result of favourable changes in the provision for claims. Losses on claims, recognized as a result of the change in the Provision for Claims, were lower than plan due to better economic conditions underlying the assumptions used in estimating the provision, such as improvements in the arrears rate (0.34% vs. 0.35% in 2012) and higher than plan house price inflation (1.89% vs. 5.26%).
Operating Expenses
Operating Expenses were $348 million which is in line with plan.
INCOME TAXES
Income Taxes were $98 million (20.2%) higher than plan, primarily as a result of higher than planned Net Income.
NET INCOME
Net Income was $305 million (20.0%) higher than plan primarily due to lower than planned Insurance Claims losses as explained above.
TOTAL ASSETS
Total Assets were $2.2 billion (0.8%) higher than plan, primarily due to $3.5 billion higher than planned net loan issuances under the CMB program offset by $1.5 billion earlier than planned floating rate repayments of loans under the IMPP.
TOTAL LIABILITIES
Total Liabilities were $1.5 billion (0.6%) higher than plan, primarily as a result of $3.5 billion higher than planned CMB issuances. This was partially offset by $1.5 billion lower than planned borrowings under the IMPP due to unplanned floating rate repayments and $247 million lower than planned accrued interest payable from the CMB program due to lower interest rates.
TOTAL EQUITY OF CANADA
Total Equity of Canada was $722 million (4.8%) higher than plan primarily as a result of higher than planned net income earned during 2013 as well as higher Remeasurements of the Net Defined Benefit Plans.
| | |
| 48 C A N A D A M O R T G A G E A N D H O U S I N G C O R P O R A T I O N | | |
| | |
| 7 | | Financial Results By Business Activity |
CMHC reports on the Housing Programs Activity, the Lending Activity, the Mortgage Loan Insurance Activity and the Securitization Activity, and consolidates the accounts of the Canada Housing Trust, a separate legal entity.
7.1 Housing Programs
The Housing Programs Activity supports programs and initiatives to address the housing needs of low income Canadians as well as other housing-related activities such as market analysis, research and information transfer. CMHC receives Parliamentary Appropriations from the Government to offset the expenditures on the Housing Programs and to reimburse CMHC for operating expenses incurred in administering housing programs and initiatives.
The Housing Programs Activity operates on a breakeven basis as Parliamentary Appropriations equal Housing Programs expenditures each year. Parliamentary Appropriations received are used solely for Housing Programs expenditures and do not support any of CMHC’s commercial activities.
Revenues from Parliamentary Appropriations and Housing Programs expenditures are recorded in the Consolidated Statement of Income and Comprehensive Income on an accrual basis and cannot exceed the maximum authorized by Parliament.
Performance measures and analysis for this activity can be found under Strategic Priorities 1.1, 1.2, 3.1 and 3.2 of the Performance by Objective section.
| | |
| 7.1.1 | | 2013 KEY FINANCIAL HIGHLIGHTS |
| n | | For the period ending 31 December 2013, CMHC spent $2,071 million in support of housing programs and initiatives which included $1,720 million to fund existing long term commitments for social housing and $298 million for new commitments of Affordable Housing. |
HOUSING PROGRAMS EXPENSES ($M)
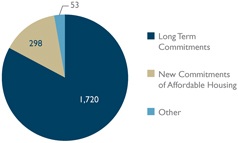
| n | | CMHC manages the Housing Programs Activity on a March 31 year-end basis. For the nine-months ended 31 December 2013, CMHC spent $1,498 million on Housing Programs which represents 70% of the total voted appropriations for the fiscal year ended 31 March 2014 (refer to “Reporting on Use of Appropriations” section on page 51). |
| | | | | | | | |
| (in millions) | | 2013 | | | 2012 | |
| Parliamentary Appropriations for Housing Programs Expenses | | | 2,071 | | | | 2,197 | |
| Housing Programs Expenses | | | 2,071 | | | | 2,197 | |
| Total | | | - | | | | - | |
Appropriation spending related to Housing Programs Expenses for the period ended 31 December 2013 was $2,071 million, a decrease of $126 million (5.7%) when compared to 2012. This decrease was primarily due to the revised timing of funding being claimed by provinces and territories under the Investment in Affordable Housing.
QUARTERLY FINANCIAL INFORMATION
| | | | | | | | | | | | | | | | |
| | | For the three months ended | |
| | | 2013 | |
| (in millions) | | Dec. 31 | | | Sep. 30 | | | Jun. 30 | | | Mar. 31 | |
| Parliamentary Appropriations for Housing Programs Expenses | | | 538 | | | | 501 | | | | 459 | | | | 573 | |
| Housing Programs Expenses | | | 538 | | | | 501 | | | | 459 | | | | 573 | |
| Total | | | - | | | | - | | | | - | | | | - | |
| |
| | | 2012 | |
| | | Dec. 31 | | | Sep. 30 | | | Jun. 30 | | | Mar. 31 | |
| Parliamentary Appropriations for Housing Programs Expenses | | | 516 | | | | 509 | | | | 489 | | | | 683 | |
| Housing Programs Expenses | | | 516 | | | | 509 | | | | 489 | | | | 683 | |
| Total | | | - | | | | - | | | | - | | | | - | |
Fourth Quarter Review
Q4 2013 vs. Q4 2012
Total Parliamentary Appropriations and related Housing Programs Expenses remained relatively consistent to the fourth quarter of 2012 with an increase of $22 million (4.3%).
Q4 2013 vs. Q3 2013
Total Parliamentary Appropriations and related Housing Programs Expenses remained relatively consistent with the previous quarter with an increase of $37 million (7.4%).
Quarterly Trend Analysis
Quarterly results for Housing Programs Expenses remain relatively consistent between quarters, with the exception of the first quarter. The first quarter is normally characterized by higher spending due to March 31 being the fiscal year-end in which the Appropriations are allocated. For Q1 2012, this was even more pronounced as claims submitted by provinces and territories for the majority of the 2011/12 portion of the Investment in Affordable Housing funding was recognized in this quarter.
| | |
| 7.1.3 | | FINANCIAL CONDITION |
BALANCE SHEET REVIEW
The Housing Programs Activity does not have a balance sheet as the activity operates on a breakeven basis. Total expenses incurred but not yet reimbursed through Appropriations are recorded in the Lending Activity Balance Sheet as Due from the Government of Canada. As Housing Programs expenses are recorded on an accrual basis and an offset is recognized in accrued liabilities there is no impact to the Lending Activity Balance Sheet.
LIQUIDITY
The Corporation’s source of liquidity to fund Housing Programs is derived from the Government through annual Parliamentary Appropriations.
The Housing Programs Activity could be subject to minimal liquidity risk as a result of timing differences in cash flows between the spending of Appropriations (i.e.: payments to third party) and the recoveries of Appropriations from the Government. CMHC maintains a source of short term liquid assets in order to mitigate timing mismatch. The Corporation also has daily access to the Consolidated Revenue Fund where the source of funding for Appropriations is provided by the Government.
| | |
| 50 C A N A D A M O R T G A G E A N D H O U S I N G C O R P O R A T I O N | | |
OFF-BALANCE SHEET ARRANGEMENTS AND CONTRACTUAL OBLIGATIONS
CMHC, on behalf of the Government, enters into long-term agreements for social housing with provinces, territories, municipalities, First Nations, non-profit housing providers and co-operative housing groups. As at 31 December 2013, total estimated contractual financial obligations related to these agreements were $16,693 million of which $9,310 million relates to 2019 and thereafter. These agreements extend for periods up to another 26 years at which time the public funding through Parliamentary Appropriations and the related obligation will have been fulfilled (Refer to Note 26 of the Consolidated Financial Statements).
Annually, the Corporation recovers and spends approximately $2 billion in support of housing programs. Appropriations and related housing expenditures are expected to remain relatively consistent over the next five years, at approximately $2 billion a year.
The Housing Programs Activity expenditure forecast includes:
| n | | $204.6 million in savings for 2014/15 and future years; $102.2 million identified through the Government’s 2009 Strategic Review and $102.4 identified as part of the Budget 2012 spending review. |
| n | | $253.1 million per fiscal year to renew the Investment in Affordable Housing to 2018/19. |
| n | | $70 million for 2014/15 to support new affordable housing in Nunavut. |
| | |
| 7.1.5 | | REPORTING ON USE OF APPROPRIATIONS |
The following table reconciles the amount of appropriations authorized by Parliament as available to the Corporation during the Government fiscal year (31 March) with the total amount recognized by the Corporation in its calendar year.
| | | | |
| | | Twelve months
ended
31 December |
| (in millions) | | 2013 | | 2012 |
AMOUNTS PROVIDED FOR HOUSING PROGRAMS: AMOUNTS AUTHORIZED IN 2012/13 (2011/12) |
| Main Estimates | | 2,140 | | 1,907 |
| Supplementary Estimates A1,2 | | - | | 256 |
| Supplementary Estimates B1, 3 | | - | | - |
| Supplementary Estimates C1 | | - | | - |
| Unused Statutory Authorities | | - | | (1) |
| | | 2,140 | | 2,162 |
| Less: Portion recognized in calendar 2012 (2011) | | (1,514) | | (1,365) |
| Less: Appropriations lapsed for 2012/2013 (2011/12) | | (53) | | (114) |
| 2012/13 (2011/12) portions recognized in 2013 (2012) | | 573 | | 683 |
| AMOUNTS AUTHORIZED IN 2013/2014 (2012/13) |
| Main Estimates | | 2,131 | | 2,140 |
| Supplementary Estimates A1,2 | | - | | - |
| Supplementary Estimates B1, 3 | | - | | - |
| Supplementary Estimates C1 | | - | | - |
| Total fiscal year appropriations | | 2,131 | | 2,140 |
| Less: Portion to be recognized in calendar 2014 | | (579) | | (573) |
| Forecasted lapse for 2013/14 (Actual lapse in 2012/13) | | (54) | | (53) |
| 2013/14 (2012/13) portions recognized in 2013 (2012) | | 1,498 | | 1,514 |
| Total appropriations recognized – twelve months ended 31 December | | 2,071 | | 2,197 |
| 1 | Supplementary Estimates are additional appropriations voted on by Parliament during the Government’s fiscal year. |
| 2 | In September 2008, a five-year investment, from 2009-2014, of approximately $1.9 billion in housing and homelessness was made to address the needs of low-income Canadians, those at risk of homelessness and the homeless. Of this amount, $253.1 million per year was designated specifically for investments in affordable housing. The 2012/2013 portion of this investment is included above in Supplementary Estimates A. The 2013/2014 portion of this investment is included in the 2013/2014 Main Estimates amounts in the table. |
| 3 | On 8 November 2012, Parliament voted on the 2012/13 Supplementary Estimates B, which included CMHC’s reprofiling request of $3.1 million. Total authorities were available within the Vote due to savings identified as part of the Budget 2012 Spending Review. The reprofiling was netted against these savings. As a result, there was no impact on CMHC’s Reference Levels. |
Total appropriations approved by Parliament for the year 2013/14 of $2,131 million include $30 million for new affordable housing in Nunavut, which was approved through Bill C-60, Economic Action Plan 2013 Act, No 1. The total spending recognized as at 31 December 2013 was $1,498 million (70%). It is forecasted that by the end of fiscal year 2013/14, $54 million will lapse as a result of lower interest and inflation rates and changes in spending patterns among the various programs and initiatives funded under the Housing Programs. This forecast is subject to change.
7.2 Lending
CMHC makes loans under the NHA to federally-subsidized social housing sponsors, First Nations, provinces, territories and municipalities. CMHC’s loan portfolio is comprised of a mix of renewable and non-renewable loans for the purposes of both market and social housing. The majority of these loans are subsidized by funds received from the Housing Programs Activity.
CMHC is able to borrow funds from the Government through the Crown Borrowing Program. Using these borrowed funds, CMHC can offer loans at below market interest rates, thereby lowering government costs of subsidizing social housing.
To the extent the timing of funding of loans and payment of borrowings are mismatched, CMHC invests the difference in investment securities. Mismatches in cash flows are also mitigated with a hedging structure which uses derivatives to hedge refinancing, reinvestment and foreign exchange risks.
The Lending Activity is operated on a breakeven basis over a period of years such that in any given year a profit or loss may be realized. Cumulative earnings are retained to address credit risk as well as interest rate risk on pre-payable loans.
Performance measures and analysis for this activity can be found under Strategic Priorities 1.1 and 1.2 of the Performance Analysis section.
| | |
| 7.2.1 | | 2013 KEY FINANCIAL HIGHLIGHTS |
| n | | Net Income increased by $79 million to $91 million compared to the prior period. This increase is primarily the result of the adoption of IFRS 13 – Fair Value Measurement on Lending investment properties as well as a reimbursement of interest losses resulting from prepayment and re-pricing activities (refer to section 7.2.2 for further detail). |
NET INCOME ($M)
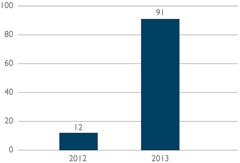
| n | | As at 31 December 2013, the Reserve Fund for Lending had increased by $183 million to $167 million due to Remeasurements of the Net Defined Benefit Plans and Net Income. |
| | | | | | | | |
| (in millions) | | 2013 | | | 20121 | |
| Net Interest Income | | | 66 | | | | 18 | |
| Other Income | | | 69 | | | | 23 | |
| Total Revenues | | | 135 | | | | 41 | |
| Operating Expenses | | | 22 | | | | 27 | |
| Total Expenses | | | 22 | | | | 27 | |
| Income before Income Taxes | | | 113 | | | | 14 | |
| Income Taxes | | | 22 | | | | 2 | |
| Net Income | | | 91 | | | | 12 | |
| 1 | Restated for comparative purposes; refer to Note 3 of the Consolidated Financial Statements. |
| | |
| 52 C A N A D A M O R T G A G E A N D H O U S I N G C O R P O R A T I O N | | |
TOTAL REVENUES
Total Revenues were $135 million for 2013, a $94 million (229.3%) increase over the prior period. This growth was primarily driven by an increase in Net Interest Income and Other Income.
Net Interest Income
Net Interest Income was $66 million, a $48 million (266.7%) increase from the prior period as CMHC recorded an interest loss recovery ($53 million) during 2013 while no amount was recovered in 2012.
The interest loss recovery is a reimbursement for interest losses incurred by CMHC as a result of prepayment and re-pricing activities. This reimbursement is included in Interest Income and recovered from the Government through Housing Programs Appropriations (refer to Note 8 of the Consolidated Financial Statements).
Other Income
Other Income for the Lending Activity is comprised of unrealized and realized gains/losses on financial instruments, fair value fluctuations on investment properties as well as recoveries of actuarial gains and losses from the Housing Programs Activity.
Other Income was $69 million, a $46 million (200.0%) increase over the prior period. This increase was mainly due to an adjustment of $19 million for a change in the fair value of swaps used to mitigate interest rate risk within the Lending Activity.
Other Income was also impacted by the adoption of IFRS 13 – Fair Value Measurement of real estate. Under IFRS 13, investment properties are measured using the highest and best use of the property. Prior to the adoption, certain rent-producing real estate properties were fair valued based on the present value of
expected future cash flows using a discount rate reflective of the characteristics of the property and adjusted for factors specific to the Corporation. Under IFRS 13, the standard requires making use of market assumptions and characteristics specific to the property in order to measure properties at fair value.
The application of IFRS 13 as well as normal fair value adjustments caused a $23 million fair value increase to investment properties.
TOTAL EXPENSES
Total Expenses were $22 million for 2013, a $5 million (18.5%) decrease from the prior period. The decrease was primarily the result of a decline in Operating Expenses.
Operating Expenses
Operating Expenses were $22 million, $5 million (18.5%) lower than in the prior period primarily due to the prior period restatement to reflect amendments to IAS 19 – Employee Benefits (refer to Note 3 of the Consolidated Financial Statements). This was partially offset by higher overhead costs such as pension expense, increased investment in information technology, and higher legal fees.
Income Taxes
Income Taxes were $22 million, a $20 million (1,000.0%) increase over the prior period primarily as a result of higher Net Income.
NET INCOME
Net Income for 2013 was $91 million, a $79 million (658.3%) increase over the prior period. This growth is primarily the result of the increase in Net Interest Income and Other Income as previously noted.
QUARTERLY FINANCIAL INFORMATION
| | | | | | | | |
| | | For the three months ended |
| | | 2013 |
| (in millions) | | Dec. 31 | | Sep. 30 | | Jun. 30 | | Mar. 31 |
| Net Interest Income | | 56 | | 4 | | 3 | | 3 |
| Other Income | | 31 | | 27 | | 12 | | (1) |
| Total Revenues | | 87 | | 31 | | 15 | | 2 |
| Operating Expense | | 6 | | 5 | | 5 | | 6 |
| Total Expenses | | 6 | | 5 | | 5 | | 6 |
| Income before Income Taxes | | 81 | | 26 | | 10 | | (4) |
| Income Taxes | | 18 | | 5 | | 2 | | (3) |
| Net Income | | 63 | | 21 | | 8 | | (1) |
| |
| | | 20121 |
| | | Dec. 31 | | Sep. 30 | | Jun. 30 | | Mar. 31 |
| Net Interest Income | | 2 | | 6 | | 5 | | 5 |
| Other Income | | 10 | | 3 | | 10 | | - |
| Total Revenues | | 12 | | 9 | | 15 | | 5 |
| Operating Expense | | 8 | | 6 | | 7 | | 6 |
| Total Expenses | | 8 | | 6 | | 7 | | 6 |
| Income before Income Taxes | | 4 | | 3 | | 8 | | (1) |
| Income Taxes | | 2 | | - | | 1 | | (1) |
| Net Income | | 2 | | 3 | | 7 | | - |
| 1 | Restated for comparative purposes; refer to Note 3 of the Consolidated Financial Statements. |
Fourth Quarter Review
Q4 2013 vs. Q4 2012
Net Income for the quarter was $63 million, up $61 million (3,050.0%) from the fourth quarter of 2012. This increase was primarily due to an interest loss recovery included in the Net Interest Income, an adjustment for a change in the fair value of swaps, as well as the adoption of IFRS 13 – Fair Value Measurement on investment properties.
Q4 2013 vs. Q3 2013
Net Income for the quarter was $63 million, up $42 million (200.0%) from the prior quarter. The increase was primarily due to the interest loss recovery adjustment ($40 million net of tax) as previously noted.
Quarterly Trend Analysis
The Lending Activity is operated on a breakeven basis but in any given period will realize profit or loss due to mismatches in the hedging structures used to hedge refinancing, reinvestment and foreign exchange risk. The quarterly results from the Lending Activity remain fairly consistent within the last eight quarters with the exception of the interest loss recovery, unrealized gains/losses on fair valuation of its financial instrument portfolio and the fair value measurement on the investment properties.
| | |
| 7.2.3 | | FINANCIAL CONDITION |
BALANCE SHEET REVIEW
| | | | | | | | |
| (in millions) | | 2013 | | | 20121 | |
Cash, Cash Equivalent and Investment Securities | | | 1,838 | | | | 1,778 | |
Loans and Accrued Interest Receivable | | | 11,102 | | | | 11,996 | |
| Due from the Government | | | 311 | | | | 309 | |
| Accounts Receivable and Other | | | 342 | | | | 516 | |
| Total Assets | | | 13,593 | | | | 14,599 | |
Borrowings and Accrued Interest Payable | | | 12,802 | | | | 13,810 | |
| Defined Benefit Plans Liability | | | 149 | | | | 262 | |
| Accounts Payable and Other | | | 450 | | | | 518 | |
| Total Liabilities | | | 13,401 | | | | 14,590 | |
| Total Equity2 | | | 192 | | | | 9 | |
| 1 | Restated for comparative purposes; refer to Note 3 of the Consolidated Financial Statements. |
| 2 | Total Equity for the Lending Activity includes the Reserve Fund of $167 million (($16 million) in 2012) and Contributed Surplus of $25 million ($25 million in 2012). |
| | |
| 54 C A N A D A M O R T G A G E A N D H O U S I N G C O R P O R A T I O N | | |
TOTAL ASSETS
Total Assets were $13,593 million at 31 December 2013, a $1,006 million (6.9%) decrease from the prior period.
Cash, Cash Equivalent
and Investment Securities
Cash, Cash Equivalents and Investment Securities were $1,838 million at 31 December 2013, a $60 million (3.4%) increase over the prior period. Cash, Cash Equivalents and Investments Securities in the Lending Activity are managed on a short-term basis and can fluctuate from one period to the other based on cash requirements as well as the timing of short term renewals of loans.
Loans and Accrued Interest Receivable
Loans and Accrued Interest Receivable were $11,102 million at 31 December 2013, an $894 million (7.5%) decrease from the prior period. This decrease was due to repayments net of issuances in the loan programs as they are approaching maturity.
Due from the Government
Due from the Government was $311 million at 31 December 2013 and remained fairly consistent to the prior period with an increase of $2 million (0.6%).
Accounts Receivable and Other
Accounts Receivable and Other were $342 million at 31 December 2013, a $174 million (33.7%) decrease from the prior period. This decrease was primarily the result of a decline in income tax receivable resulting from the receipt of a $73 million tax refund from prior years. Further contributing to the decrease was a $42 million decline in deferred tax assets due to fair value gains on borrowings as well as lower tax receivables from other CMHC business activities.
TOTAL LIABILITIES
Total Liabilities were $13,401 million at 31 December 2013, a $1,189 million (8.1%) decrease from the prior period.
Borrowings and Accrued Interest Payable
Borrowings and Accrued Interest Payable were $12,802 million at 31 December 2013, a $1,008 million (7.3%) decrease from the prior period. The decrease in borrowings was consistent with the decline noted in the loans receivable with the exception of a more significant decrease in fair value due to increases in interest rates. The Lending borrowings carried at fair value are more sensitive to rising interest rates than the fair value of the associated loans and investment assets. The sensitivity difference is a result of the cash flow discounting to arrive at fair value. Borrowings are more sensitive as principal payments are due at maturity. When they are discounted to arrive at fair value there is a larger time frame for exposure to interest rate increases than the loans, the majority of which have principal due monthly.
Defined Benefit Plans Liability
The Defined Benefit Plans Liability was $149 million at 31 December 2013, a $113 million (43.1%) decrease from the prior period primarily due to reductions in the pension obligation as a result of annual contributions to the pension plans and higher actuarial gains.
Accounts Payable and Other
Accounts Payable and Other were $450 million at 31 December 2013, relatively consistent at a $68 million (13.1%) decrease from the prior period.
TOTAL EQUITY
Total Equity was $192 million at 31 December 2013, a $183 million (2,033.3%) increase over the prior period. This increase is largely the result of fluctuations in Remeasurements of the Net Defined Benefit Plan as a result of actuarial gains. Also contributing to this increase was higher Net Income.
CAPITAL MANAGEMENT
The Lending Activity retained earnings is governed by provisions in the CMHC Act. In accordance with the Act, the Lending Activity’s earnings are retained by the Corporation in a Reserve Fund which is subject to a statutory limit of $240 million.
The Reserve Fund is kept by the Corporation as part of its strategy to address credit risk as well as interest rate risk exposure on pre-payable loans. The Reserve Fund also includes unrealized fair market fluctuations as well as Remeasurements of the Net Defined Benefit Plans for both the Lending Activity and Housing Programs. The Housing Program’s actuarial gains and losses are recorded in this reserve until they are reimbursed by the Government through Housing Programs Appropriations.
| | | | |
| (in millions) | | 2013 | | 2012 |
| Reserve Fund for Lending | | 167 | | (16) |
The Reserve Fund for Lending has increased by $183 million over 2012 largely as a result of Remeasurements of the Net Defined Benefit Plans and higher Net Income as explained above.
LIQUIDITY
CMHC manages the Lending Activity to ensure there is sufficient cash to meet requirements as they come due. The main cash requirements of the Lending Activity are the principal and interest payments due on its borrowings and interest payments due under its swap agreements. The Lending Activity’s main sources of liquidity are its cash and cash equivalents, the principal and interest received on its loans and its investment securities and an overnight overdraft facility. Ongoing issuance of loans is funded through the Crown Borrowing Program.
The Minister of Finance approves CMHC’s Borrowing Plan annually and establishes limits and parameters for borrowings. The overall maximum debt outstanding limit for 2014 is $43.5 billion (2013 - $68.5 billion), which includes borrowings not to exceed $1.8 billion (2013 - $1.8 billion) for MILP and $12.2 billion (2013 - $13.7 billion) for Direct Lending programs. The MILP program is in repayment mode and no new borrowings will be transacted. Further borrowings above the authorized amounts are subject to approval by the Minister of Finance. The legislative authority, which does not apply to borrowings of CHT, requires that the total indebtedness outstanding at any time, other than to the Government, not exceed $20 billion.
Liquidity risk is managed by matching the cash flows anticipated to be received from loans and investments with those to be paid on the related borrowings. The asset/liability management strategy aims to minimize the risk that asset levels differ from liability levels. The Lending Activity’s loans receive periodic payments of principal and interest that are invested in cash equivalents, reverse repurchase agreements and fixed income investment securities until they are required to repay the associated borrowings. Interest rate swaps are used to reduce mismatches that arise between the timing and rate of interest on assets and liabilities.
FINANCIAL RESOURCES
Investments are made in high credit quality fixed-income instruments taking into consideration the Corporation’s risk appetite and business activities. The objective of the Lending Activity investment portfolio is to generate a target return of the Canadian Dealer Offered Rate (CDOR) plus 5 basis points. Investments under management had a fair value of $1.8 billion as at 31 December 2013 and 31 December 2012.
For the Lending Activity, CMHC holds liquid assets equal to at least one week’s forecasted cash requirements to meet funding needs.
| | |
| 56 C A N A D A M O R T G A G E A N D H O U S I N G C O R P O R A T I O N | | |
The following table presents a maturity profile of the Lending Activity’s financial instruments:
| | | | | | | | | | | | | | | | | | | | | | | | | | | | |
| (carrying value in millions) | | 2014 | | | 2015 | | | 2016 | | | 2017 | | | 2018 | | | 2019 and
Thereafter | | | Total | |
| Assets1 | | | | | | | | | | | | | | | | | | | | | | | | | | | | |
Cash and Cash Equivalents | | | 585 | | | | - | | | | - | | | | - | | | | - | | | | - | | | | 585 | |
Loans | | | 1,154 | | | | 1,522 | | | | 1,538 | | | | 1,369 | | | | 1,263 | | | | 4,030 | | | | 10,876 | |
Investment Securities | | | 217 | | | | 560 | | | | 251 | | | | 108 | | | | 117 | | | | - | | | | 1,253 | |
Accrued Interest Receivable | | | 226 | | | | - | | | | - | | | | - | | | | - | | | | - | | | | 226 | |
Derivatives | | | 2 | | | | 23 | | | | 24 | | | | 12 | | | | 17 | | | | 18 | | | | 96 | |
| | | | 2,184 | | | | 2,105 | | | | 1,813 | | | | 1,490 | | | | 1,397 | | | | 4,048 | | | | 13,037 | |
| Liabilities | | | | | | | | | | | | | | | | | | | | | | | | | | | | |
Borrowings | | | 1,243 | | | | 1,945 | | | | 1,961 | | | | 1,588 | | | | 1,478 | | | | 4,458 | | | | 12,673 | |
Accrued Interest Payable | | | 129 | | | | - | | | | - | | | | - | | | | - | | | | - | | | | 129 | |
Derivatives | | | 3 | | | | 12 | | | | 13 | | | | 5 | | | | 5 | | | | 6 | | | | 44 | |
| | | | 1,375 | | | | 1,957 | | | | 1,974 | | | | 1,593 | | | | 1,483 | | | | 4,464 | | | | 12,846 | |
| 1 | The maturity profile excludes the Due from the Government of Canada as it is recognized in the Lending Activity on behalf of the Housing Programs Activity. |
OFF-BALANCE SHEET ARRANGEMENTS AND CONTRACTUAL OBLIGATIONS
The Lending Activity enters into lending agreements with federally-subsidized social housing sponsors, First Nations, provinces, territories and municipalities. As at 31 December 2013, the outstanding contractual obligation amount for these loans agreements, net of forgiveness, was $98.6 million. These loans are normally advanced within a two year period.
Loans under the Lending Activity are projected to decline from $10.9 billion at 31 December 2013 to $10.1billion in 2014, and to $9.1 billion in 2015 as repayments on loans will exceed new lending commitments. In subsequent years, they will continue to decline as a result of loan program maturities, reaching $6.7 billion as at 31 December 2018.
7.3 Mortgage Loan
Insurance
CMHC’s Mortgage Loan Insurance Activity is comprised of transactional homeowner insurance, portfolio insurance and multi-unit residential insurance. Transactional homeowner insurance includes high ratio and low ratio homeowner mortgage loans. Refer to section 3.2 for further detail on Mortgage Loan Insurance products.
Revenue from the Mortgage Loan Insurance Activity is comprised of insurance premiums, application fees for insuring loans for multi-unit residential properties and income earned on its investment portfolio. Premiums and fees are received at the inception of the mortgage loan insurance policy and are recognized as revenue over the period covered by the policy using actuarially determined factors that reflect the long-term pattern for default risk. These factors are reviewed quarterly by management and annually by CMHC’s appointed actuary.
Mortgage Loan Insurance Activity expenses are comprised of Insurance Claims losses and Operating Expenses. The Insurance Claims losses include the change in the estimated Provision for Claims, which represents an estimate of expected claims and the related settlement expenses. The assumptions used in estimating the Provision for Claims are based on historical experience and the time value of money, which considers prevailing legal, economic, social and regulatory trends and are reviewed quarterly by management.
The Mortgage Loan Insurance Activity is mandated to operate its activity on a commercial basis where the premiums and fees it collects and the interest it earns must cover related claims and other expenses and also provide a reasonable return to the Government.
This activity is self-sustaining and does not receive funding, in whole or in part, from Parliamentary Appropriations.
The mortgage loan insurance industry is seasonal. Premiums written vary each quarter and tend to peak in the second and third quarters in the spring and summer months. Insurance Claims losses are variable on a quarterly basis primarily as the result of economic conditions and tend to increase during the winter months. Premiums Earned, Investment Income and Operating Expenses tend to be relatively more constant from quarter to quarter.
Performance measures and analysis for this activity can be found under Strategic Priority 2.1 of the Performance by Objective section.
| | |
| 7.3.1 | | 2013 KEY FINANCIAL HIGHLIGHTS |
| n | | Net Income increased by $102 million (7.3%) to $1,507 million compared to the prior period, primarily as a result of lower Insurance Claims losses. |
MORTGAGE LOAN INSURANCE HIGHLIGHTS ($M)
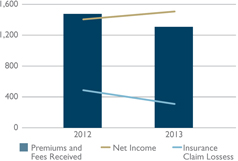
| n | | Key economic indicators such as the continuing downward trend in the unemployment rate, combined with increasing house price inflation, has resulted in a decrease in the Provision for Claims for the period ended 31 December 2013 and contributed to the overall decrease in the Insurance Claims losses. When compared to the prior period, the unemployment rate decreased from 7.2% to 7.1%, the arrears rate decreased from 0.35% to 0.34%, and house price inflation increased from 0.28% to 5.26%. CMHC’s decreasing market share over the period also had an impact on the decrease in the Provision for Claims and the Insurance Claims losses. |
| n | | Premiums and Fees Received decreased by $167 million (11.3%) to $1,308 million as a result of lower overall insured volumes due to lower lender take-up in 2013 of the portfolio insurance product and the combined effect of government guarantee parameters changes introduced in July 2012 which reduced the size of the high ratio transactional homeowner insured market. CMHC’s decreasing market share over the period also had an impact on the Premiums and Fees Received. |
| | |
| 58 C A N A D A M O R T G A G E A N D H O U S I N G C O R P O R A T I O N | | |
| n | | Capital Available of $14,085 million represented 250% of Minimum Capital Required, an increase from 231% over the prior period. The increase was primarily due to the Comprehensive Income recognized during the period. |
MORTGAGE LOAN INSURANCE
CAPITAL HOLDING TARGET (%)

| n | | The combined ratio is the sum of the loss ratio and the operating expense ratio. This ratio decreased by 8.3 pts from 38.7% to 30.4% mainly as a result of the decrease in the loss ratio. The loss ratio decreased from 27.0% in the prior period to 17.6% in 2013 primarily due to lower Insurance Claim losses of $178 million (36.6%), while Premiums and Fees Earned experienced a lesser decline; $53 million (2.9%). |
MORTGAGE LOAN INSURANCE
COMBINED RATIO (%)
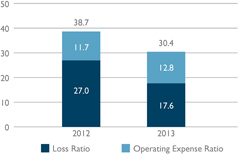
| | | | | | | | |
(in millions, unless otherwise indicated) | | 2013 | | | 20121 | |
| Insurance-in-force ($B)2 | | | 557 | | | | 566 | |
Transactional Homeowner | | | 288 | | | | 290 | |
Portfolio | | | 219 | | | | 230 | |
Multi-unit residential | | | 50 | | | | 46 | |
| Total Insured Volumes:2 | | | 61,053 | | | | 66,029 | |
Transactional Homeowner | | | 44,246 | | | | 49,763 | |
Portfolio | | | 10,406 | | | | 10,722 | |
Multi-unit residential | | | 6,401 | | | | 5,544 | |
| Premiums and Fees Received: | | | 1,308 | | | | 1,475 | |
Transactional Homeowner | | | 1,044 | | | | 1,232 | |
Portfolio | | | 26 | | | | 38 | |
Multi-unit residential | | | 238 | | | | 205 | |
| Claims Paid: | | | 436 | | | | 532 | |
Transactional Homeowner | | | 401 | | | | 493 | |
Portfolio | | | 31 | | | | 30 | |
Multi-unit residential | | | 4 | | | | 9 | |
| Premiums and Fees Earned | | | 1,754 | | | | 1,807 | |
| Investment Income | | | 612 | | | | 600 | |
| Other Income | | | 159 | | | | 165 | |
| Total Revenues | | | 2,525 | | | | 2,572 | |
| Insurance Claims losses | | | 309 | | | | 487 | |
| Operating Expenses | | | 225 | | | | 211 | |
| Total Expenses | | | 534 | | | | 698 | |
| Income before Income Taxes | | | 1,991 | | | | 1,874 | |
| Income Taxes | | | 484 | | | | 469 | |
| Net Income | | | 1,507 | | | | 1,405 | |
| Arrears Ratio | | | 0.34% | | | | 0.35% | |
| Severity Ratio | | | 30.9% | | | | 31.3% | |
| Loss Ratio | | | 17.6% | | | | 27.0% | |
| Operating Expense Ratio | | | 12.8% | | | | 11.7% | |
| Combined Ratio | | | 30.4% | | | | 38.7% | |
| Capital Available to Minimum Capital Required (%MCT) | | | 250% | | | | 231% | |
| Return on Equity | | | 11.2% | | | | 11.8% | |
| Return on Capital Holding Target | | | 13.7% | | | | 13.7% | |
| 1 | Restated for comparative purposes; refer to Note 3 of the Consolidated Financial Statements. |
| 2 | For further discussion refer to Strategic Priority 2.1. |
PREMIUMS AND FEES RECEIVED
Premiums and Fees Received were $1,308 million for 2013, a $167 million (11.3%) decrease from the prior period. The decrease was mainly due to lower volumes from the reduced size of the transactional homeowner mortgage loan insurance market and the elimination of the high ratio transactional homeowner refinance market. These markets were reduced as a result of the new mortgage insurance parameters that took effect in July 2012. This was partially offset by the increase in multi-unit residential volumes. Multi-unit residential volumes are highly variable on a standalone year over year basis. The increase in multi-unit residential volumes was largely driven by increases in multi-unit residential property refinancing.
TOTAL REVENUES
Total Revenues were $2,525 million for 2013, a $47 million (1.8%) decrease from the prior period. This decrease was mainly the result of lower Premiums and Fees Earned.
Premiums and Fees Earned
Premiums and Fees Earned were $1,754 million for 2013, a $53 million (2.9%) decrease from the prior period. Premiums and fees are received at the inception of the mortgage loan insurance policy and are recognized as revenue over the period covered by the policy using actuarially determined factors that reflect the long-term pattern for default risk. The current earning patterns peak in the 2nd and 3rd years after issuance of the policy, tapering off thereafter. By year 10, approximately 90% of the premium received has been recognized as revenue. The decrease in Premiums and Fees Earned was primarily a result of declining insured volumes over the past several years as a result of changes to the regulatory environment governing insured mortgages. Also contributing to the decrease in earned premiums this year is the change that was made to the earning curves in 2012 which accelerated the earnings when compared to 2013. There were no changes in earnings curves in 2013.
Investment Income
Investment Income was $612 million for 2013, a $12 million (2.0%) increase over the prior period, primarily due to the higher bond yields during 2013 compared to 2012 as well as a larger investment portfolio as a result of higher cash flows from operations.
Other Income
Other Income was $159 million for 2013, a $6 million (3.6%) decrease from the prior period. Other Income is comprised of Net Unrealized Gains (Losses), Net Realized Gains (Losses) and Other Income as described below.
Net Unrealized Gains (Losses) were $92 million for 2013, a $26 million (39.4%) increase over the prior period largely resulting from higher returns on international equity investments in 2013 due to better market conditions.
Net Realized Gains (Losses) were $53 million for 2013, a $39 million (42.4%) decrease over the prior period primarily due to a decrease in realized gains in the bond portfolio of $155 million over the prior period caused by market fluctuations in bond yields which depressed bond prices, partially offset by an increase in realized gains caused by sales in the equity portfolio of $118 million.
Other Income was $14 million for 2013, a $7 million (100.0%) increase over the prior period. This increase was primarily due to the expiration of a program that provided federal assistance to homeowners impacted by pyrite in their foundations. In 2001, on behalf of the Government of Canada, CMHC signed an agreement with the Province of Quebec to compensate homeowners that had problems with pyrite in their home foundations. The federal contribution was funded by CMHC through its Mortgage Loan Insurance Activity and covered 25% of the cost of the program to a maximum of $17.5 million over 10 years. With the expiration of the program, the $12 million in the unused accrued expenses were brought back into the Mortgage Loan Insurance revenue.
| | |
| 60 C A N A D A M O R T G A G E A N D H O U S I N G C O R P O R A T I O N | | |
CLAIMS PAID AND ARREARS
Claims paid during the year were $436 million, a $96 million (18.5%) decrease from the prior period. This decrease was primarily the result of lower transactional homeowner claims paid, which is in line with improving economic conditions including improvements in the arrears rate.
CMHC calculates its arrears rate on the basis of all loans that are more than 90 days past due over the number of outstanding insured loans.
CMHC’s arrears rate as at 31 December 2013 was 0.34% a 0.01 point decrease compared to the prior period. The improvement in the arrears rate was driven by improving arrears on transactional homeowner loans.
Transactional homeowner arrears represented 77% of the total arrears volumes, whereas portfolio represented 22% and multi-unit residential represented 1%. Portfolio arrears rates are lower than transactional homeowner arrears rates; accordingly, due to the recent limitations CMHC has imposed on portfolio insurance volumes, the CMHC arrears rate is expected to increase over time as the lower arrears rate seen with portfolio insurance becomes a smaller component of the total arrears volumes.
The total number of delinquent loans was 10,033 at 31 December 2013, a 673 (6.3%) decrease from the prior period which is attributable to improved economic conditions such as lower unemployment rates and improved resale markets. Close to half of CMHC’s delinquent loans are in the provinces of Ontario and Quebec. There was a decrease of 4 points to the arrears volumes in Alberta compared to the prior period due to the overall improved economy in Alberta as a result of sustained labour markets. The provincial distribution of delinquent loans has remained consistent with those in the prior period.
| | | | | | |
| | | 2013 |
| | | No. of
Delinquent Loans | | | Arrears Rate |
| Transactional Homeowner | | | 7,749 | | | 0.51% |
| Portfolio | | | 2,151 | | | 0.15% |
| Multi-unit residential | | | 133 | | | 0.64% |
| Total | | | 10,033 | | | 0.34% |
| |
| | | 2012 |
| | | No. of
Delinquent Loans | | | Arrears Rate |
| Transactional Homeowner | | | 8,398 | | | 0.54% |
| Portfolio | | | 2,175 | | | 0.15% |
| Multi-unit residential | | | 133 | | | 0.71% |
| Total | | | 10,706 | | | 0.35% |
TOTAL EXPENSES
Total Expenses were $534 million for 2013, a $164 million (23.5%) decrease from the prior period. This decrease was primarily due to lower Insurance Claims losses.
Insurance Claims losses
Insurance Claims losses, which represents the losses incurred during the period as a result of the changes to the Provision for Claims, were $309 million, a $178 million (36.6%) decrease from the prior period. This decline is primarily the result of decreases in long term frequency of claims driven by better economic conditions as follows:
| n | | decrease in the unemployment rate from 7.2% to 7.1%; |
| n | | decrease in the arrears rate from 0.35% to 0.34%; and |
| n | | increase in house price inflation from 0.28% to 5.26%. |
Refer to Operating Environment for more information.
Operating Expenses
Operating Expenses were $225 million for 2013, a $14 million (6.6%) increase over the prior period. The increase in Operating Expenses is primarily due to higher overhead costs such as pension expense and increased investment in information technology, as well as increased reimbursement costs to OSFI for expenditures related to its oversight.
Income Taxes
Income Taxes were $484 million, a $15 million (3.2%) increase over the prior period primarily as a result of higher Net Income.
NET INCOME
Net Income was $1,507 million for 2013, a $102 million (7.3%) increase over the prior period. This increase was primarily due to lower Insurance Claims losses as previously explained.
RATIOS
To supplement financial results of the Mortgage Loan Insurance Activity, CMHC also uses financial measures and ratios to analyze its financial performance. These measures include arrears rate, severity ratio, loss ratio, operating expense ratio, combined ratio and return on equity.
Overall, the ratios for the Mortgage Loan Insurance Activity, including the severity ratio, have remained fairly consistent when compared to the prior year with the exception of the combined ratio which is comprised of the loss and operating expense ratio. The return on equity ratio has also shown a decrease from the prior period.
The combined ratio at 31 December 2013 was 30.4%, a 8.3 point decrease compared to year-end 2012. This decrease is due to lower Insurance Claims losses and higher Operating Expenses as explained above.
The return on equity ratio at 31 December 2013 was 11.2%, a 0.6 point decrease compared to the prior period primarily as a result of a comparatively larger increase in average Equity than Net Income. Equity increased over the prior year due to Comprehensive Income recognized during the year.
Refer to Accounting Disclosures section 9.3 for ratio definitions.
| | |
| 62 C A N A D A M O R T G A G E A N D H O U S I N G C O R P O R A T I O N | | |
QUARTERLY FINANCIAL INFORMATION
| | | | | | | | | | | | | | | | | | | | | | | | | | | | | | | | |
| | | For the three months ended | |
| | | 2013 | | | 20121 | |
| (in millions, unless otherwise indicated) | | Dec. 31 | | | Sep. 30 | | | Jun. 30 | | | Mar. 31 | | | Dec. 31 | | | Sep. 30 | | | Jun. 30 | | | Mar. 31 | |
| INSURANCE-IN-FORCE ($B):2 | | | 557 | | | | 560 | | | | 562 | | | | 563 | | | | 566 | | | | 576 | | | | 576 | | | | 570 | |
Transactional Homeowner | | | 288 | | | | 289 | | | | 289 | | | | 287 | | | | 290 | | | | 291 | | | | 292 | | | | 283 | |
Portfolio | | | 219 | | | | 223 | | | | 226 | | | | 228 | | | | 230 | | | | 238 | | | | 245 | | | | 248 | |
Multi-unit residential | | | 50 | | | | 48 | | | | 47 | | | | 48 | | | | 46 | | | | 47 | | | | 39 | | | | 39 | |
| TOTAL INSURED VOLUMES:2 | | | 14,457 | | | | 17,646 | | | | 20,755 | | | | 8,195 | | | | 11,596 | | | | 15,937 | | | | 19,542 | | | | 18,954 | |
Transactional Homeowner | | | 10,761 | | | | 13,884 | | | | 12,947 | | | | 6,654 | | | | 10,030 | | | | 14,098 | | | | 16,162 | | | | 9,473 | |
Portfolio | | | 1,926 | | | | 2,145 | | | | 6,111 | | | | 224 | | | | 210 | | | | 217 | | | | 2,065 | | | | 8,230 | |
Multi-unit residential | | | 1,770 | | | | 1,617 | | | | 1,697 | | | | 1,317 | | | | 1,356 | | | | 1,622 | | | | 1,315 | | | | 1,251 | |
| PREMIUMS AND FEES RECEIVED: | | | 321 | | | | 401 | | | | 376 | | | | 210 | | | | 291 | | | | 409 | | | | 471 | | | | 304 | |
Transactional Homeowner | | | 254 | | | | 328 | | | | 302 | | | | 160 | | | | 239 | | | | 347 | | | | 408 | | | | 238 | |
Portfolio | | | 4 | | | | 8 | | | | 13 | | | | 1 | | | | 1 | | | | 4 | | | | 14 | | | | 19 | |
Multi-unit residential | | | 63 | | | | 65 | | | | 61 | | | | 49 | | | | 51 | | | | 58 | | | | 49 | | | | 47 | |
| Claims Paid: | | | 97 | | | | 89 | | | | 116 | | | | 134 | | | | 74 | | | | 136 | | | | 168 | | | | 154 | |
Transactional Homeowner | | | 91 | | | | 81 | | | | 110 | | | | 119 | | | | 61 | | | | 127 | | | | 161 | | | | 144 | |
Portfolio | | | 5 | | | | 7 | | | | 6 | | | | 13 | | | | 9 | | | | 8 | | | | 6 | | | | 7 | |
Multi-unit residential | | | 1 | | | | 1 | | | | - | | | | 2 | | | | 4 | | | | 1 | | | | 1 | | | | 3 | |
| Premiums and Fees Earned | | | 457 | | | | 444 | | | | 438 | | | | 415 | | | | 478 | | | | 456 | | | | 448 | | | | 425 | |
| Investment Income | | | 188 | | | | 144 | | | | 144 | | | | 136 | | | | 183 | | | | 139 | | | | 133 | | | | 145 | |
| Other Income | | | 54 | | | | 27 | | | | 31 | | | | 47 | | | | 76 | | | | 31 | | | | (55 | ) | | | 113 | |
| Total Revenues | | | 699 | | | | 615 | | | | 613 | | | | 598 | | | | 737 | | | | 626 | | | | 526 | | | | 683 | |
| Insurance Claims losses | | | 71 | | | | 70 | | | | 55 | | | | 113 | | | | 69 | | | | 157 | | | | 142 | | | | 119 | |
| Operating Expenses | | | 57 | | | | 55 | | | | 54 | | | | 59 | | | | 56 | | | | 46 | | | | 50 | | | | 59 | |
| Total Expenses | | | 128 | | | | 125 | | | | 109 | | | | 172 | | | | 125 | | | | 203 | | | | 192 | | | | 178 | |
| Income before Income Taxes | | | 571 | | | | 490 | | | | 504 | | | | 426 | | | | 612 | | | | 423 | | | | 334 | | | | 505 | |
| Income Taxes | | | 139 | | | | 121 | | | | 120 | | | | 104 | | | | 148 | | | | 115 | | | | 81 | | | | 125 | |
| Net Income | | | 432 | | | | 369 | | | | 384 | | | | 322 | | | | 464 | | | | 308 | | | | 253 | | | | 380 | |
| Arrears Rate | | | 0.34% | | | | 0.33% | | | | 0.32% | | | | 0.35% | | | | 0.35% | | | | 0.34% | | | | 0.35% | | | | 0.38% | |
| Severity Ratio | | | 28.9% | | | | 28.9% | | | | 29.0% | | | | 30.2% | | | | 28.5% | | | | 29.8% | | | | 29.4% | | | | 31.0% | |
| Loss Ratio | | | 15.5% | | | | 15.8% | | | | 12.6% | | | | 27.2% | | | | 14.4% | | | | 34.4% | | | | 31.7% | | | | 28.0% | |
| Operating Expense Ratio | | | 12.5% | | | | 12.4% | | | | 12.3% | | | | 14.2% | | | | 11.7% | | | | 10.1% | | | | 11.2% | | | | 13.9% | |
| Combined Ratio | | | 28.0% | | | | 28.2% | | | | 24.9% | | | | 41.4% | | | | 26.1% | | | | 44.5% | | | | 42.9% | | | | 41.9% | |
| Capital Available to Minimum Capital Required (% MCT) | | | 250% | | | | 243% | | | | 234% | | | | 231% | | | | 231% | | | | 222% | | | | 214% | | | | 215% | |
| Return on Equity | | | 12.3% | | | | 10.9% | | | | 11.6% | | | | 9.9% | | | | 14.9% | | | | 10.2% | | | | 8.7% | | | | 13.4% | |
| Return on Capital Holding Target | | | 15.4% | | | | 13.3% | | | | 13.7% | | | | 11.7% | | | | 17.1% | | | | 11.3% | | | | 9.4% | | | | 14.9% | |
| 1 | Restated for comparative purposes; refer to Note 3 of the Consolidated Financial Statements. |
| 2 | For further discussion refer to Strategic Priority 2.1. |
Fourth Quarter Review
Q4 2013 vs. Q4 2012
Premiums and Fees Received were $321 million for the fourth quarter of 2013, a $30 million (10.3%) increase compared to the prior period quarter. This increase is primarily attributed to the slight increase in the homeowner purchase product, those with loan-to-value ratios higher than 80%, which was the result of the dollar value of the loans written during the quarter being higher than the prior period quarter, although units remained stable.
Claims Paid were $97 million in the fourth quarter of 2013, a $23 million (31.1%) increase compared to the prior period quarter. Claim payments vary from quarter to quarter and can be impacted by changes in claim reporting patterns and payment delays.
Net Income for the quarter was $432 million, down by $32 million (6.9%) from the fourth quarter of 2012. This decrease was primarily due to a decline in Premiums and Fees Earned of $21 million as explained in the year over year analysis and a decrease in Other Income of $22 million as a result of lower unrealized gains in the bond portfolio due to higher interest rates in Q4 2013 versus the prior period.
The combined ratio for the quarter was 28.0%, a 1.8 point increase from the fourth quarter of the prior period as result of a higher loss ratio and operating expense ratio. Although operating expenses remained relatively consistent from the prior period, the operating expense ratio increased due to lower Premiums and Fees Earned. The loss ratio increased due to slightly higher Insurance Claims losses over lower Premiums and Fees Earned. Premiums and Fees Earned decreased as a result of a downward trend in insured volumes over the last few years.
Q4 2013 vs. Q3 2013
Premiums and Fees Received for quarter were $321 million, down by $80 million (20.0%) compared to third quarter in 2013. This decrease is primarily attributable to the decline in insured volumes in the fourth quarter which is in line with the seasonal trend.
Claims paid remained relatively consistent to the prior quarter with an increase of $8 million (9.0%).
Net Income for the quarter was $432 million, $63 million (17.1%) higher than the third quarter of 2013. This increase was primarily due to growth in Investment Income of $44 million due to higher bond yields and an increase in Other Income of $27 million caused by higher unrealized gains as a result of better market conditions.
Quarterly Trend Analysis
The Mortgage Loan Insurance Activity results are modestly affected by seasonal factors. The spring and summer months are characterized by elevated housing market activity volumes which increases mortgage activity and in turn has a direct impact on Premiums and Fees Received.
Financial results are also impacted by short and long term changes in economic, employment and housing market trends as well as government regulations. Over the past eight quarters, improvements in economic factors have had a positive impact on Claims Paid and Insurance Claims losses. CMHC’s combined ratio has also been trending downwards as a result of these improvements.
Premiums Earned, Investment Income and Operating Expenses tend to be relatively more constant from quarter to quarter. The trend in Premiums and Fees Earned over the past eight quarters has been driven by the ageing in the books of earned premiums from past years, which are being gradually offset by new quarterly business.
| | |
| 64 C A N A D A M O R T G A G E A N D H O U S I N G C O R P O R A T I O N | | |
| | |
| 7.3.3 | | FINANCIAL CONDITION |
BALANCE SHEET REVIEW
| | | | | | | | |
| (in millions) | | 2013 | | | 20121 | |
| Cash, Cash Equivalent and Investment Securities | | | 20,980 | | | | 20,313 | |
| Accrued Interest Receivable | | | 104 | | | | 97 | |
| Accounts Receivable and Other | | | 457 | | | | 597 | |
| Total Assets | | | 21,541 | | | | 21,007 | |
| Securities Sold Under Repurchase Agreements | | | 91 | | | | 425 | |
| Provision for Claims | | | 869 | | | | 996 | |
| Unearned Premiums and Fees | | | 5,947 | | | | 6,394 | |
| Defined Benefit Plans Liability | | | 201 | | | | 437 | |
| Accounts Payable and Other | | | 117 | | | | 51 | |
| Total Liabilities | | | 7,225 | | | | 8,303 | |
| Total Equity | | | 14,316 | | | | 12,704 | |
| 1 | Restated for comparative purposes; refer to Note 3 of the Consolidated Financial Statements. |
TOTAL ASSETS
Total Assets were $21,541 million at 31 December 2013, a $534 million (2.5%) increase over the prior period.
Cash, Cash Equivalent and
Investment Securities
Cash, Cash Equivalents and Investment Securities were $20,980 million at 31 December 2013, a $667 million (3.3%) increase over the prior period due to positive cash flows from operations and favourable overall investment returns of the portfolio.
Accrued Interest Receivable
Accrued Interest Receivable was $104 million at 31 December 2013, a $7 million (7.2%) increase over the prior period primarily due to an increase in interest rates as well as an increase in bond investments.
Accounts Receivable and Other
Accounts Receivable and Other were $457 million at 31 December 2013, a $140 million (23.5%) decrease from the prior period due to a decline in taxes receivable as a result of lower instalments paid year to date, current year income tax payables and prior year refunds.
TOTAL LIABILITIES
Total Liabilities were $7,225 million at 31 December 2013, a $1,078 million (13.0%) decrease from the prior period.
Securities Sold Under
Repurchase Agreements
Securities Sold Under Repurchase Agreements were $91 million at 31 December 2013, a $334 million (78.6%) decrease from the prior period as a result of a change in investment allocation during the year.
Provision for Claims
Provision for Claims was $869 million at 31 December 2013, a $127 million (12.8%) decrease from the prior period. Changes to the Provision for Claims are comprised of Claims Paid during the year and Insurance Claim losses incurred during the year. For the period ended 31 December 2013, Claims Paid were $436 million ($532 – 31 December 2012) which was offset by Insurance Claim losses incurred during the year of $309 million ($487 million – 31 December 2012).
Claims Paid decreased by $96 million (18.1%) as a result of lower transactional homeowner claims paid which is in line with improving economic conditions, which, among other factors, has led to improvements in the arrears rate.
Insurance Claim losses incurred during the period represents an estimate of future losses on mortgages that are in arrears but have not yet been reported as a claim by the lender. The estimate is an actuarial forecast based on a number of economic assumptions. The most significant assumptions used in estimating the Provision for Claims are claim frequency, the claim occurrence pattern, and claim severity.
The unemployment rate, arrears rate and house price inflation rate are typically the key drivers underlying claim frequency assumptions. Severity assumptions are averaged over the last 5 years of claim experience. Claim occurrence pattern assumptions are derived from historical experience.
Insurance Claim losses decreased by $178 million (36.6%) primarily as a result of decreases in long term frequency of claims driven by better economic conditions as explained above.
Unearned Premiums and Fees
Unearned Premiums and Fees were $5,947 million at 31 December 2013, a $447 million (7.0%) decrease from the prior period. Changes in Unearned Premiums and Fees are comprised of Premiums and Fees Received for the period less premiums and fees recognized in income during the period. For the period ending 31 December 2013, Premiums and Fees Received were $1.3 billion ($1.5 billion – 31 December 2012) which was offset by $1.8 billion ($1.8 billion – 31 December 2012) of Premiums and Fees Earned in the year. Together these account for the $434 million decrease in Unearned Premiums and Fees.
Defined Benefit Plans Liability
The Defined Benefit Plans Liability was $201 million at 31 December 2013, a $236 million (54.0%) decrease from the prior period primarily due to reductions in the pension obligation as a result of annual contributions to the pension plans and higher actuarial gains.
Accounts Payable and Other
Accounts Payable and Other were $117 million at 31 December 2013, a $66 million (129.4%) increase over the prior period primarily due an increase of $73 million in the deferred tax liability. This increase over the prior period is primarily due to the deferred tax liability recognized on actuarial gains.
TOTAL EQUITY
Total Equity of Canada was $14,316 million at 31 December 2013, a $1,612 million (12.7%) increase over the prior period due to Comprehensive Income recognized during the year
CAPITAL MANAGEMENT
CMHC’s Capital Management Framework follows regulations as set out by OSFI. Under capital guidelines applicable to mortgage insurers in Canada, CMHC calculates the ratio of capital available to the minimum capital required by OSFI. This is referred to as the Minimum Capital Test (MCT).
CMHC sets an Internal Target above the minimum capital required. The Internal Target is set at a level that covers all risks of the Mortgage Loan Insurance Activity. The Internal Target is calibrated using specified confidence intervals and is designed to provide
management with an early indication of the need to resolve financial problems. The Internal Target has been set at 185% (2012 – 175%) of the minimum capital required.
Under its Capital Management Framework, CMHC operates at available capital levels above the Internal Target on all but unusual and infrequent occasions. Accordingly, CMHC has established a Holding Target in excess of the Internal Target.
The Holding Target is calibrated using confidence intervals specified by CMHC’s Capital Management Framework and is designed to provide management with adequate time to resolve financial problems before available capital decreases below the Internal Target. The Holding Target has been set at 200% (2012 – 200%) of the minimum capital required.
CMHC appropriates Retained Earnings and Accumulated Other Comprehensive Income (Loss) from the Mortgage Loan Insurance Activity at the 200% Holding Target level. Appropriated Capital as at 31 December 2013 was $11,493 million (2012 - $11,030 million).
| | | | | | | | |
(in millions, unless otherwise indicated) | | 2013 | | | 20121 | |
Mortgage Loan Insurance Retained Earnings | | | 13,320 | | | | 11,657 | |
Mortgage Loan Insurance Appropriated Capital | | | | | | | | |
Appropriated Retained Earnings | | | 10,497 | | | | 9,983 | |
Accumulated Other Comprehensive Income (Loss) | | | 996 | | | | 1,047 | |
| Total Appropriated Capital | | | 11,493 | | | | 11,030 | |
| Unappropriated Retained Earnings | | | 2,823 | | | | 1,674 | |
| Total Equity | | | 14,316 | | | | 12,704 | |
Capital Available to Minimum Capital Required (100% MCT)2 | | | 250% | | | | 231% | |
| CMHC’s Internal Capital Target (% MCT) | | | 185% | | | | 175% | |
| CMHC’s Capital Holding Target (%MCT) | | | 200% | | | | 200% | |
| 1 | Restated for comparative purposes; refer to Note 3 of the Consolidated Financial Statements. |
| 2 | Effective January 2013, OSFI increased the margin for interest rate risk (MIRR) from 50 bps to 75 bps, which reduced the 31 December 2012 MCT level of 231% MCT to 220% MCT as at 1 January 2013. |
| | |
| 66 C A N A D A M O R T G A G E A N D H O U S I N G C O R P O R A T I O N | | |
Throughout the year, available capital was in excess of the Holding Target. Capital available of $14,085 million (2012 – $12,422 million) was 250% (2012 – 231%) of the minimum required. The Capital Available to Minimum Capital Required (%MCT) ratio increased by 19 points compared to the prior period as a result of increased earnings over the prior period.
LIQUIDITY
CMHC manages the Mortgage Loan Insurance Activity to ensure there is sufficient cash to meet its obligation as they come due. This is done through liquidity risk management policies, cash and liquidity management forecasting processes, investment in high quality assets, and access to stable funding sources. Given the long lead time between the occurrence of a loan default and the payment of the associated claim, and because insurance premiums and fees typically exceed claim payments, liquidity risk in the Mortgage Loan Insurance Activity is minimized.
The Mortgage Loan Insurance Activity’s main sources of liquidity are its Cash and Cash Equivalents, Investment Securities and the Premiums and Fees Received from operations. Claims payments represent the main cash requirements of the Mortgage Loan Insurance Activity. Liabilities under repurchase agreements also represent a cash requirement. Premiums and Fees Received are invested primarily in cash equivalents, reverse repurchase agreements and unencumbered investment securities which remain fully available for use in paying claims. On a daily basis, claims payments are netted against insurance premiums and fees received. Any excess claims are funded through the sale of investment assets.
FINANCIAL RESOURCES
The objective of the Mortgage Loan Insurance investment portfolio is to maximize the total return on a pre-tax basis after related operating expenses. This is achieved through a strategic asset allocation policy that takes into account the time horizon and liquidity needs of the liabilities, as well as the regulatory environment, capital objectives and risk appetite of the Corporation. The market liquidity of the various investments and asset classes in the mortgage loan insurance portfolio are regularly evaluated against projected cash requirements.
Performance, including absolute and risk-adjusted measures relative to Strategic Asset Allocation benchmarks, is tracked and monitored in aggregate and at individual asset class levels. The benchmarks by asset class are: Dex-UBI for fixed income; TSX Composite for Canadian equity; MSCI for foreign equity and the IPD Canadian Real Estate benchmark for Real Estate.
Investment activity for the mortgage loan insurance portfolio in 2014 will include activities related to the ongoing management of investments in fixed-income, equities, and alternative investments. The strategic asset allocation policy is reviewed every five years or more frequently, as necessary.
As at 31 December 2013, total investments under management had a fair value of $21.0 billion compared to $20.3 billion at the end of 2012.
The allocation of investments in the portfolio as at 31 December 2013 is shown in the following table:
| | | | | | | | | | | | | | | | | | | | | | | | | | | | | | | | |
| | | Remaining Term to Maturity | | | | | | | | | | | | | |
| (fair value, in millions) | | Within 1
Year | | | 1 to 3 Years | | | 3 to 5 Years | | | Over
5 Years | | | 2013 | | | % | | | 2012 | | | % | |
| Cash | | | - | | | | - | | | | - | | | | - | | | | - | | | | - | | | | - | | | | - | |
| Cash Equivalents | | | 749 | | | | - | | | | - | | | | - | | | | 749 | | | | 3.6% | | | | 759 | | | | 3.7% | |
| Investment Securities | | | | | | | | | | | | | | | | | | | | | | | | | | | | | | | | |
Fixed Income | | | | | | | | | | | | | | | | | | | | | | | | | | | | | | | | |
Corporate/Other Entities | | | 24 | | | | 1,310 | | | | 1,453 | | | | 2,683 | | | | 5,470 | | | | 26.0% | | | | 5,056 | | | | 24.9% | |
Government of Canada | | | 6 | | | | 2,129 | | | | 1,154 | | | | 1,513 | | | | 4,802 | | | | 22.9% | | | | 5,000 | | | | 24.6% | |
Provinces/Municipalities | | | 35 | | | | 354 | | | | 577 | | | | 4,931 | | | | 5,897 | | | | 28.1% | | | | 5,571 | | | | 27.4% | |
Sovereign and Related Entities | | | - | | | | - | | | | 10 | | | | 66 | | | | 76 | | | | 0.4% | | | | 138 | | | | 0.7% | |
| Total Fixed Income | | | 65 | | | | 3,793 | | | | 3,194 | | | | 9,193 | | | | 16,245 | | | | 77.4% | | | | 15,765 | | | | 77.6% | |
Equities | | | | | | | | | | | | | | | | | | | | | | | | | | | | | | | | |
Canadian Equities | | | | | | | | | | | | | | | | | | | 2,214 | | | | 10.6% | | | | 2,108 | | | | 10.4% | |
U.S. Equities | | | | | | | | | | | | | | | | | | | 888 | | | | 4.2% | | | | 843 | | | | 4.2% | |
Foreign Equities | | | | | | | | | | | | | | | | | | | 884 | | | | 4.2% | | | | 838 | | | | 4.1% | |
| Total Equities | | | | | | | | | | | | | | | | | | | 3,986 | | | | 19.0% | | | | 3,789 | | | | 18.7% | |
| Total Investment Securities | | | | | | | | | | | | | | | | | | | 20,231 | | | | 96.4% | | | | 19,554 | | | | 96.3% | |
| Total Investments Under Management | | | 814 | | | | 3,793 | | | | 3,194 | | | | 9,193 | | | | 20,980 | | | | 100% | | | | 20,313 | | | | 100% | |
The credit quality of the cash equivalents and fixed income investments, based on an internal credit rating system1, are summarized as follows:
| | | | | | | | | | | | | | | | | | | | | | | | | | | | | | | | |
| | | 2013 | | | 2012 | |
| (fair value, in millions) | | AAA | | | AA- to AA+ | | | A- to A+ | | | Lower
than A- | | | AAA | | | AA- to AA+ | | | A- to A+ | | | Lower
than A- | |
| Cash Equivalents | | | 698 | | | | 51 | | | | - | | | | - | | | | 674 | | | | 85 | | | | - | | | | - | |
| Investment Securities | | | 6,229 | | | | 4,152 | | | | 5,214 | | | | 650 | | | | 6,376 | | | | 3,573 | | | | 5,171 | | | | 645 | |
| % | | | 41% | | | | 25% | | | | 30% | | | | 4% | | | | 43% | | | | 22% | | | | 31% | | | | 4% | |
The Mortgage Loan Insurance Activity also has less liquid investment properties with a fair value of $84 million at 31 December 2013 (2012 - $81 million), which are available to fund insurance claims.
| 1 | The internal credit ratings are based on internal assessments of counterparty creditworthiness, which amongst other considerations incorporate external credit rating agency evaluations |
| | |
| 68 C A N A D A M O R T G A G E A N D H O U S I N G C O R P O R A T I O N | | |
OFF-BALANCE SHEET ARRANGEMENTS
AND CONTRACTUAL OBLIGATION
The Mortgage Loan Insurance Activity engages in some financial transactions that, under IFRS, are either not recorded on the Consolidated Balance Sheet or are recorded in amounts that differ from the full contract or notional amounts. These off-balance sheet arrangements include insurance contracts, contractual obligations and certain commitments.
Insurance-in-force
The Mortgage Loan Insurance Activity is exposed to insurance risk from underwriting of mortgage insurance contracts. Mortgage insurance contracts transfer risk to the Corporation by indemnifying lending institutions against credit losses arising from borrower default. Under a mortgage insurance policy, a lending institution is insured against risk of loss arising from borrower default for the entire unpaid principal balance of the loan plus interest for a predetermined length of time. Total Insurance-in-force represents the risk exposure of the Mortgage Loan Insurance Activity. At 31 December 2013 insurance-in-force was $557 billion, a $9 billion (1.6%) decrease over the prior period.
| | | | | | | | |
| (in billions) | | 2013 | | | 2012 | |
| Total Insurance-in-Force | | | 557 | | | | 566 | |
| Transactional Homeowner | | | 288 | | | | 290 | |
| Portfolio | | | 219 | | | | 230 | |
| Multi-unit Residential | | | 50 | | | | 46 | |
Under Section 11 of the NHA, the total of outstanding insured amounts of all insured loans may not exceed $600 billion (2012 – $600 billion).
Workouts
Workouts are mortgages or loans that benefit from the Mortgage Loan Insurance supported default management activities that enable borrowers to work through their financial difficulties.
Commitments outstanding for advances to insured assisted housing projects in financial difficulty amounted to $44 million at 31 December 2013 and are normally advanced within a ten year period. Advances in the amount of $43 million are expected to be made over the next five years and the remainder to be advanced beyond the five years. The advances made are generally 2nd or 3rd mortgages to assist insured assisted housing projects avoid defaulting on their mortgages.
The Mortgage Loan Insurance Activity has a high level of exposure to the Canadian housing market and is influenced by a number of factors including economic and interest rate trends, house price inflation, the unemployment rate, as well as government regulation.
| n | | The economic forecast and projected unemployment and interest rates are expected to continue to have a positive impact on insurance claims, while increasing house price inflation is expected to impact the magnitude of claims received. Premiums and Fees Earned are expected to continue to decline as a result of changes to the regulatory environment governing insured mortgages as well as a decreasing market share. As a result, the loss ratio is expected to trend upwards in 2014 towards levels consistent with 2012. |
| n | | Projected Net Income is expected to decline from $1,507 million in 2013 to $1,297 million in 2014 and, in subsequent years of the planning period, to range between $1,248 million and $1,280 million as a result of lower revenues due to lower volumes combined with a slightly upward trend in insurance claims. |
| n | | Insurance-in-force is expected to decrease to approximately $545 billion by the end of 2014 as mortgage repayments continue to offset new insurance written. |
| n | | Effective 1 January 2014, the Mortgage Loan Insurance Activity is subject to a risk fee payable to the Government of 3.25% of premiums written and 10 basis points on new portfolio insurance written payable on an annual basis. The risk fee is deferred and amortized over the period covered by the insurance contract using factors determined by the appointed actuary. |
7.4 Securitization
CMHC’s securitization programs guarantee the timely payment of interest and principal of NHA MBS issued by financial institutions and of CMB issued by the CHT. Under the NHA MBS program, issuers pool insured residential mortgages into marketable NHA MBS which provide investors with the opportunity to hold high quality, secure investments in Canadian residential mortgages. Through the CMB program, the CHT sells CMB to domestic and international investors with the proceeds used to purchase NHA MBS.
The Insured Mortgage Purchase Program (IMPP) is included within the Securitization Activity and was introduced in 2008 as a temporary measure to maintain the availability of longer-term credit in Canada. Under the IMPP, CMHC borrowed funds from the Government to purchase the beneficial interest in NHA MBS from Canadian financial institutions. The IMPP will reach maturity in 2015 after which all NHA MBS and borrowings from the Government will have been repaid.
The Securitization Activity also includes CMHC’s administrative responsibilities for the covered bond legal framework. CMHC’s costs relating to these responsibilities are recovered from covered bond issuers on a cost-recovery basis.
The Securitization Activity is self-sustaining and does not receive funding, in whole or in part, from Parliamentary Appropriations. Revenue from the Securitization Activity is comprised of guarantee fees, interest income on IMPP loans, income earned on its investment portfolio, and application fees from the Covered Bond Registry. Guarantee fees are received at the time of guarantee and are recognized as revenue over the period of guarantee, which is typically five years. Expenses from the Securitization Activity are comprised primarily of issuer fees related to the covered bond legal framework, interest expense on IMPP loans and operating expenses.
Performance measures and analysis for this activity can be found under Strategic Priority 2.2 of the Performance by Objective section.
| | |
| 7.4.1 | | 2013 KEY FINANCIAL HIGHLIGHTS |
| n | | Net Income decreased by $65 million (23.9%) to $207 million compared to the prior period, primarily as a result of lower realized gains from financial instruments. In 2012 a strategic asset allocation resulted in sales of certain assets and the resultant recognition of gains on those assets. The objective of the revised strategic asset allocation policy is to maximize the capacity to meet liquidity needs of the timely payment guarantee and to preserve capital through investments in Government of Canada securities. |
SECURITIZATION HIGHLIGHTS ($M)
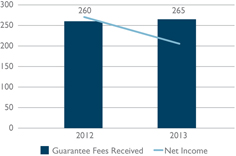
| n | | Guarantee Fees Received increased by $5 million (2.2%) to $265 million compared to the prior period due to higher volumes of NHA MBS securities being guaranteed as a result of higher demand from lenders. |
| n | | Capital available of $1,381 million represented 182% of the capital required, an increase from 156% in the prior period. This increase was primarily due to the annual Net Comprehensive Income. |
SECURITIZATION CAPITAL HOLDING TARGET (%)
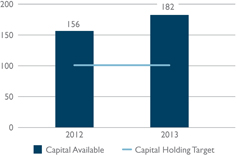
| | |
| 70 C A N A D A M O R T G A G E A N D H O U S I N G C O R P O R A T I O N | | |
| | | | |
(in millions, unless otherwise indicated) | | 2013 | | 20121 |
| Total Guarantees-in-force ($B):2 | | 398 | | 382 |
NHA MBS | | 192 | | 179 |
CMB | | 206 | | 203 |
Total Annual Securities Guaranteed:2 | | 122,642 | | 119,531 |
NHA MBS | | 83,992 | | 79,631 |
CMB | | 38,650 | | 39,900 |
Guarantee and Application Fees Received: | | 265 | | 260 |
Market NHA MBS | | 172 | | 162 |
CMB | | 93 | | 98 |
| Guarantee and Application Fees Earned | | 247 | | 242 |
| Net Interest Income | | - | | - |
| Investment Income | | 31 | | 33 |
| Other Income | | 27 | | 116 |
| Total Revenues | | 305 | | 391 |
| Operating Expenses | | 29 | | 24 |
| Total Expenses | | 29 | | 24 |
| Income before Income Taxes | | 276 | | 367 |
| Income Taxes | | 69 | | 95 |
| Net Income | | 207 | | 272 |
| Operating Expense Ratio1, 3 | | 10.6% | | 9.6% |
| Capital Required to Capital Available | | 182% | | 156% |
| Return on Equity | | 15.8% | | 24.3% |
| Return on Capital Holding Target | | 26.7% | | 35.2% |
| 1 | Restated for comparative purposes; refer to Note 3 of the Consolidated Financial Statements. |
| 2 | For further discussion refer to Strategic Priority 2.2. |
| 3 | The Operating Expense Ratio as calculated in the Financial Results by Business Activity Section includes the Government of Canada Fee. The Operating Expense Ratio for the twelve months ending 31 December 2013 excluding this fee is 5.7%. |
GUARANTEE FEES RECEIVED
Guarantee and application fees received were $265 million, a $5 million (2.2%) increase over the prior period. This was primarily due to higher volumes of market NHA MBS securities being guaranteed caused by higher demand from lenders.
TOTAL REVENUES
Total Revenues were $305 million, an $86 million (22.0%) decrease from the prior period primarily due to a decrease in net realized gains (losses).
Guarantee and Application Fees Earned
Guarantee and application fees earned were relatively consistent to the prior period, with an increase of $5 million (2.1%) to $247 million.
Net Interest Income
Interest Income received from loans under the IMPP is offset by the interest expense on the programs borrowings such that there is no Net Interest Income.
Investment Income
Investment Income was $31 million, a $2 million (6.1%) decrease from the prior period. The implementation of a strategic asset allocation in 2012 resulted in the liquidation of investments in that period, resulting in lower yielding investments under the new asset allocation for 2013.
Other Income
Other Income includes realized and unrealized gains and losses on investments, reimbursed CMB related expenses and fees earned from the administration of the Covered Bond Registry.
Other Income in 2013 was $27 million, an $89 million (76.7%) decrease from the prior year. This decrease is due primarily to a decrease in Net Realized Gains (Losses) from financial instruments as a result of the liquidation of investments that occurred in 2012 due to the implementation of a new strategic asset allocation. This resulted in higher gains realized in 2012.
TOTAL EXPENSES
Total Expenses were $29 million, a $5 million (20.8%) increase over the prior period as a result of the variance in Operating Expenses.
Operating Expenses
Operating Expenses include administrative costs, the fee paid to the Government for its guarantee of timely payment under the CMB program and expenses relating to the administration of the Covered Bond Registry.
Operating Expenses were $29 million, a $5 million (20.8%) increase over the prior period primarily due to higher legal fees related to the administration of the Covered Bond Registry and increased reimbursement costs to OSFI for expenditures related to its oversight.
INCOME TAXES
Income Taxes were $69 million, a $26 million (27.4%) decrease from the prior period primarily as a result of lower Net Income.
NET INCOME
Net Income was $207 million for 2013, a $65 million (23.9%) decrease from 2012. The decrease was primarily due to lower realized gains on sales (net of taxes) as explained above.
RATIOS
To supplement financial results of the Securitization Activity, CMHC also uses financial measures and ratios to analyze its financial performance. These measures include the operating expense ratio, the capital available to capital required ratio, the return on equity ratio, and the return on capital holding target.
The operating expense ratio shows a consistent trend over the periods, consistent with the business environment and mandate of the Securitization Activity.
The return on equity ratio is trending lower, primarily as a result of lower Net Income levels. In 2012 there was a strategic liquidation and reorganization of the investment holdings which crystallized capital gains in 2012 in comparison to 2013.
QUARTERLY FINANCIAL INFORMATION
Fourth Quarter Review
Q4 2013 vs. Q4 2012
The Q4 2013 financial results of the Securitization Activity are comparable to the Q4 2012 results except for a decrease in Other Income for the quarter as assets were liquidated in Q4 2012 to comply with the new strategic asset allocation strategy.
Q4 2013 vs. Q3 2013
The Q4 2013 results were fairly consistent to Q3 2013 with the exception of insured volumes. In the fourth quarter of 2013 NHA MBS volumes decreased by $9,335 million from the third quarter. This decrease resulted from the implementation of an allocation methodology for new guarantees of NHA MBS which was effective for the period September to December 2013. As guarantee fees received are recognized over the period of guarantee the decrease in volumes has no immediate impact on Net Income. Refer to section 4.2.2 for further detail on NHA MBS volumes.
Quarterly Trend Analysis
The Minister of Finance approves the annual limit on new NHA MBS and CMB issuance volumes. As a result, guarantees and large financial variances quarter over quarter are not expected. In the second quarter of 2013, annual guarantees and guarantee fees received increased over the first quarter. This trend is also noted in the 2012 fiscal year. Housing market activity volumes are elevated in the Spring and this increase in mortgage activity causes a similar increase in NHA MBS as Approved Issuers securitize this increased mortgage volume.
| | |
| 72 C A N A D A M O R T G A G E A N D H O U S I N G C O R P O R A T I O N | | |
| | | | | | | | | | | | | | | | | | | | | | | | | | | | | | | | |
| | | For the three months ended | |
| (in millions, unless | | 2013 | | | 20121 | |
| otherwise indicated) | | Dec. 31 | | | Sep. 30 | | | Jun. 30 | | | Mar. 31 | | | Dec. 31 | | | Sep. 30 | | | Jun. 30 | | | Mar. 31 | |
| Total Guarantees-in-force ($B):2 | | | 398 | | | | 399 | | | | 400 | | | | 393 | | | | 382 | | | | 384 | | | | 377 | | | | 373 | |
NHA MBS | | | 192 | | | | 195 | | | | 196 | | | | 180 | | | | 179 | | | | 172 | | | | 175 | | | | 162 | |
CMB | | | 206 | | | | 204 | | | | 204 | | | | 213 | | | | 203 | | | | 212 | | | | 202 | | | | 211 | |
| Total Securities Guaranteed:2 | | | 20,522 | | | | 29,007 | | | | 45,845 | | | | 27,268 | | | | 27,436 | | | | 25,667 | | | | 37,644 | | | | 28,784 | |
NHA MBS | | | 10,772 | | | | 20,107 | | | | 35,845 | | | | 17,268 | | | | 17,186 | | | | 16,017 | | | | 28,144 | | | | 18,284 | |
CMB | | | 9,750 | | | | 8,900 | | | | 10,000 | | | | 10,000 | | | | 10,250 | | | | 9,650 | | | | 9,500 | | | | 10,500 | |
Guarantee and Application Fees Received: | | | 49 | | | | 64 | | | | 91 | | | | 61 | | | | 60 | | | | 60 | | | | 76 | | | | 64 | |
MBS | | | 26 | | | | 42 | | | | 67 | | | | 37 | | | | 35 | | | | 36 | | | | 53 | | | | 38 | |
CMB | | | 23 | | | | 22 | | | | 24 | | | | 24 | | | | 25 | | | | 24 | | | | 23 | | | | 26 | |
Guarantee and Application Fees Earned | | | 59 | | | | 64 | | | | 64 | | | | 60 | | | | 60 | | | | 61 | | | | 63 | | | | 58 | |
| Net Interest Income | | | - | | | | - | | | | - | | | | - | | | | - | | | | - | | | | - | | | | - | |
| Investment Income | | | 8 | | | | 8 | | | | 8 | | | | 7 | | | | 8 | | | | 8 | | | | 8 | | | | 9 | |
| Other Income | | | 6 | | | | 7 | | | | 6 | | | | 8 | | | | 48 | | | | 9 | | | | 15 | | | | 44 | |
| Total Revenues | | | 73 | | | | 79 | | | | 78 | | | | 75 | | | | 116 | | | | 78 | | | | 86 | | | | 111 | |
| Operating Expenses | | | 8 | | | | 7 | | | | 7 | | | | 7 | | | | 6 | | | | 6 | | | | 6 | | | | 6 | |
| Total Expenses | | | 8 | | | | 7 | | | | 7 | | | | 7 | | | | 6 | | | | 6 | | | | 6 | | | | 6 | |
| Income before Income Taxes | | | 65 | | | | 72 | | | | 71 | | | | 68 | | | | 110 | | | | 72 | | | | 80 | | | | 105 | |
| Income Taxes | | | 16 | | | | 19 | | | | 17 | | | | 17 | | | | 31 | | | | 17 | | | | 20 | | | | 27 | |
| Net Income | | | 49 | | | | 53 | | | | 54 | | | | 51 | | | | 79 | | | | 55 | | | | 60 | | | | 78 | |
| Operating Expense Ratio1, 3 | | | 11.3% | | | | 10.9% | | | | 9.7% | | | | 10.6% | | | | 9.8% | | | | 9.2% | | | | 9.4% | | | | 9.9% | |
Capital Available to Capital Required | | | 182% | | | | 166% | | | | 162% | | | | 153% | | | | 156% | | | | 144% | | | | 142% | | | | 130% | |
| Return on Equity | | | 14.2% | | | | 15.9% | | | | 16.7% | | | | 16.3% | | | | 26.2% | | | | 19.1% | | | | 22.0% | | | | 30.2% | |
| Return on Capital Holding Target | | | 25.1% | | | | 26.4% | | | | 26.4% | | | | 25.1% | | | | 39.2% | | | | 27.2% | | | | 29.9% | | | | 39.8% | |
| 1 | Restated for comparative purposes; refer to Note 3 of the Consolidated Financial Statements. |
| 2 | For further discussion refer to Strategic Priority 2.2. |
| 3 | The Operating Expense Ratio as calculated in the Financial Results by Business Activity Section includes the Government of Canada Fee. |
| | |
| 7.4.3 | | FINANCIAL CONDITION |
BALANCE SHEET REVIEW
| | | | | | | | |
| (in millions) | | 2013 | | | 2012 | |
Cash, Cash Equivalent and Investment Securities | | | 1,896 | | | | 1,827 | |
Loans and Accrued Interest Receivable | | | 28,116 | | | | 52,531 | |
| Accounts Receivable and Other | | | 59 | | | | (24) | |
| Total Assets | | | 30,071 | | | | 54,334 | |
Borrowings and Accrued Interest Payable | | | 28,110 | | | | 52,525 | |
| Unearned Fees | | | 564 | | | | 546 | |
| Defined Benefit Plans Liability | | | - | | | | 18 | |
| Accounts Payable and Other | | | 1 | | | | 17 | |
| Total Liabilities | | | 28,675 | | | | 53,106 | |
| Total Equity | | | 1,396 | | | | 1,228 | |
TOTAL ASSETS
Total Assets were $30,071 million at 31 December 2013, a $24,263 million (44.6%) decrease over the prior period.
Cash, Cash Equivalent and
Investment Securities
Cash, Cash Equivalents and Investment Securities were $1,896 million at 31 December 2013, a $69 million (3.8%) increase over the prior period due primarily to positive cash flows from operations.
Loans and Accrued Interest Receivable
Loans and Accrued Interest Receivable was $28,116 million at 31 December 2013, a $24,415 million (46.5%) decrease as a result of principal loan repayments under the IMPP.
Accounts Receivable and Other
Accounts Receivable and Other were $59 million at 31 December 2013, an $83 million (345.8%) increase over the prior period. This increase is primarily due to intercompany amounts owing between business segments. At the end of the prior year, there was a significant amount due to the Lending Activity, grouped in Other assets, which was settled during 2013 as a result of a tax receivable balance allocated to the segment.
TOTAL LIABILITIES
Total Liabilities were $28,675 million at 31 December 2013, a $24,431 million (46.0%) decrease from the prior period.
Borrowings and Accrued
Interest Payable
Borrowings and Accrued Interest Payable were $28,110 million, a $24,415 million (46.5%) decrease from the prior period primarily as a result of principal loan repayments under the IMPP.
Unearned Fees
Unearned Fees were $564 million at 31 December 2013, an $18 million (3.3%) increase over the prior period. Unearned Fees are comprised of fees received for the period less fees recognized in income. This increase corresponds with the increase in Guarantee Fees Received (2%) which is a result of increased volumes.
Defined Benefit Plans Liability
The Defined Benefit Plans Liability was nil at 31 December 2013, an $18 million (100%) decrease from the prior period. This decrease is the result of annual contributions and the increase in actuarial gains.
Accounts Payable and Other
Accounts Payable and Other liabilities were $1 million at 31 December 2013, a $16 million (94.1%) decrease from the prior period due primarily to a $13.6 million reduction in the deferred tax liability. This is primarily due to deferred tax assets recorded on current year fair value incremental losses on bonds reported in OCI of $17 million offset by a decrease in the deferred tax assets on actuarial gains of $4 million.
TOTAL EQUITY
Total Equity was $1,396 million at 31 December 2013, a $168 million (13.7%) increase over the prior period. The increase is primarily caused by the annual Net Comprehensive Income.
| | |
| 74 C A N A D A M O R T G A G E A N D H O U S I N G C O R P O R A T I O N | | |
CAPITAL MANAGEMENT
CMHC’s Securitization capitalization methodology is based on regulatory and economic capital principles. Capital required is calculated by applying risk factors to Securitization investment assets and liabilities exposures.
CMHC appropriates Retained Earnings and Accumulated Other Comprehensive Income (Loss) from the Securitization Activity at 100% of the capital required. Appropriated capital as at 31 December 2013 was $773 million, a decrease of $16 million (2.0%) from the prior period primarily due to lower swap exposure positions on CMB and the IMPP resulting from IMPP repayments during the year. The capital required calculation is based on asset balances as defined by OFSI and as the IMPP loans and borrowing are repaid less capital is required to secure the remaining exposures.
| | | | | | | | |
(in millions, unless otherwise indicated) | | 2013 | | | 2012 | |
| Securitization Appropriated Capital: | | | | | | | | |
Appropriated Retained Earnings | | | 816 | | | | 781 | |
Accumulated Other Comprehensive Income (Loss) | | | (43) | | | | 8 | |
| Total Appropriated Capital | | | 773 | | | | 789 | |
| Unappropriated Retained Earnings | | | 623 | | | | 439 | |
| Securitization Retained Earnings | | | 1,439 | | | | 1,220 | |
| Total Equity | | | 1,396 | | | | 1,228 | |
Capital Available to Capital Required (per cent) | | | 182% | | | | 156% | |
Throughout the year, available capital was in excess of the capital required. Capital available of $1,381 million (2012 - $1,228 million) was 182% (2012 – 156%) of the capital required.
LIQUIDITY
CMHC manages the Securitization Activity to ensure there is sufficient cash to meet requirements under both the NHA MBS and CMB programs in the event of a call on the timely payment guarantee. Total Guarantees-in-Force at 31 December 2013 were $398 billion. Potential liquidity requirements under the timely payment guarantee are contingent
on the performance of participants and service providers in the Securitization programs to meet their obligations. The liquidity risk is mitigated with risk management policies, liquid assets and liquidity management processes, minimum standards for participants, the collection of collateral, legal and operational frameworks and the collection of guarantee fees.
All investment assets held by CMHC can be utilized to satisfy a call on the timely payment guarantee on an interim basis until funds can be sourced through the Government or otherwise recovered. While CMHC maintains internal sources of liquidity that are appropriate in relation to its risk appetite, funding can also be sourced through the Department of Finance and the Crown Borrowing Program for amounts beyond its available liquidity. The Minister of Finance approves CMHC’s Borrowing Plan annually and establishes limits and parameters for borrowings. The overall maximum debt outstanding limit for 2014 allocates $29.5 billion (2013 - $53 billion) for IMPP borrowings. The IMPP is in repayment mode and no new borrowings are expected to be transacted. Further borrowings above the authorized amounts are subject to approval by the Minister of Finance.
FINANCIAL RESOURCES
The Securitization investment portfolio is funded by cash flow from guarantee and application fees and interest received, net of claims and expenses. The portfolio is intended to cover obligations associated with CMHC’s securitization guarantee programs. The objective of the Securitization investment portfolio is to maximize the capacity to meet liquidity needs of the timely payment guarantee and to preserve capital through investments in Government of Canada securities. The strategic asset allocation policy benchmark for the Securitization investment portfolio is comprised of Canada Non-Agency Bonds (98%) and 91-day T-Bills (2%). The portfolio is managed passively against its benchmark index.
As at 31 December 2013, total investments under management had a fair value $1.9 billion compared to $1.8 billion at the end of 2012.
The allocation of investments in the portfolio as at 31 December 2013 is shown in the following table:
| | | | | | | | | | | | | | | | | | | | | | | | | | | | | | | | |
| | | Remaining Term to Maturity | | | | | | | | | | | | | |
| (fair value, in millions) | | Within 1 Year | | | 1 to 3 Years | | | 3 to 5 Years | | | Over 5 Years | | | 2013 | | | % | | | 2012 | | | % | |
| Cash | | | 1 | | | | - | | | | - | | | | - | | | | 1 | | | | 0.1% | | | | - | | | | - | |
| Cash Equivalents | | | - | | | | - | | | | - | | | | - | | | | - | | | | - | | | | 27 | | | | 1.5% | |
| Investment Securities | | | | | | | | | | | | | | | | | | | | | | | | | | | | | | | | |
Fixed Income | | | | | | | | | | | | | | | | | | | | | | | | | | | | | | | | |
Corporate/Other Entities | | | - | | | | 1 | | | | - | | | | - | | | | 1 | | | | 0.1% | | | | 1 | | | | 0.1% | |
Government of Canada | | | 127 | | | | 627 | | | | 305 | | | | 835 | | | | 1,894 | | | | 99.8% | | | | 1,799 | | | | 98.4% | |
| Total Investment Securities | | | 127 | | | | 628 | | | | 305 | | | | 835 | | | | 1,895 | | | | 99.9% | | | | 1,800 | | | | 98.5% | |
Total Investments Under Management | | | 128 | | | | 628 | | | | 305 | | | | 835 | | | | 1,896 | | | | 100% | | | | 1,827 | | | | 100% | |
The credit quality of the cash equivalents and fixed income investments, based on an internal credit rating system1, is summarized as follows:
| | | | | | | | | | | | | | | | | | | | | | | | | | | | | | | | |
| | | 2013 | | | 2012 | |
| (fair value, in millions) | | AAA | | | AA- to
AA+ | | | A- to
A+ | | | Lower
than A- | | | AAA | | | AA- to
AA+ | | | A- to
A+ | | | Lower
than A- | |
| Cash Equivalents | | | - | | | | - | | | | - | | | | - | | | | 27 | | | | - | | | | - | | | | - | |
| Investment Securities | | | 1,894 | | | | - | | | | - | | | | 1 | | | | 1,799 | | | | - | | | | - | | | | 1 | |
| % | | | 99.9% | | | | - | | | | - | | | | 0.1% | | | | 99.9% | | | | - | | | | - | | | | 0.1% | |
Insured Mortgage Purchase Program (IMPP)
The loans under the IMPP represent amounts due from Canadian financial institutions as a result of the sale of their beneficial interest in NHA MBS securities to CMHC. Loans arising from the IMPP have been funded by borrowings from the Government. Under this arrangement, substantially all of the risks and rewards of the NHA MBS are retained by the issuers through swap agreements with the Corporation.
Cash requirements for payments of principal and interest on the borrowings under the IMPP are exactly matched with the cash CMHC will receive under the IMPP loans, which are fully collateralized by NHA MBS and high-quality reinvestment securities.
At 31 December 2013, the expected maturity profile of the IMPP is as follows:
| | | | | | | | | | | | |
(carrying amount, in millions) | | 2014 | | | 2015 | | | Total | |
| Assets | | | | | | | | | | | | |
Loans under the IMPP | | | 26,051 | | | | 2,023 | | | | 28,074 | |
| Liabilities | | | | | | | | | | | | |
Borrowings from the Government of Canada | | | 26,051 | | | | 2,023 | | | | 28,074 | |
| 1 | The internal credit ratings are based on internal assessments of counterparty creditworthiness, which amongst other considerations incorporate external credit rating agency evaluations |
| | |
| 76 C A N A D A M O R T G A G E A N D H O U S I N G C O R P O R A T I O N | | |
OFF-BALANCE SHEET ARRANGEMENTS
AND CONTRACTUAL OBLIGATIONS
The Securitization Activity engages in some financial transactions that, under IFRS, are either not recorded on the Consolidated Balance Sheet or are recorded in amounts that differ from the full contract or notional amounts. These off-balance sheet arrangements include securitizations, contractual obligations and guarantees.
Guarantees-in-Force
CMHC guarantees the timely payment of principal and interest of CMB issued as well as NHA MBS for investors in securities issued by Approved Issuers on the basis of housing loans through the IMPP and CMB program. Total Guarantees-in-Force represents the risk exposure related to this timely payment guarantee.
| | | | | | | | |
| (in millions) | | 2013 | | | 2012 | |
| Guarantees-in-Force | | | 397,688 | | | | 381,557 | |
| Market NHA MBS | | | 191,583 | | | | 178,602 | |
| CMB | | | 206,105 | | | | 202,955 | |
Guarantees-in Force totalled $397.7 billion at 31 December 2013, a $16.1 billion (4.2%) increase over the prior period. In 2013, a total of $122.6 billion new guarantees were granted by CMHC a $3.1 billion (2.6%) increase over the prior period, primarily resulting from higher NHA MBS volumes. The increase in new guarantees was offset by repayments of $106.5 billion.
Under Section 51 of the National Housing Act, the aggregate outstanding amount of principal guarantees may not exceed $600 billion.
IMPP
From October 2008 until March 2010, CMHC purchased insured NHA MBS, through reverse auction, from Canadian financial institutions (Issuers) using funds borrowed from the Government. With each auction, swap agreements were entered into where CMHC is to pay all interest received on NHA MBS and reinvestment securities, net of its expenses, to swap counterparties and CMHC is to receive payments equal to the interest due on its IMPP-related borrowings.
In order to meet the principal obligations of the associated Government borrowings, the principal payments and prepayments from the underlying NHA MBS are held in an account in the name of CMHC, managed and reinvested in eligible assets by the swap counterparties pursuant to contractual agreements. Eligible assets include Investment Securities, Cash Equivalents and Securities Purchased Under Resale Agreements. Under the terms of certain auctions under the IMPP, CMHC remits directly to the Government the monthly principal payments and prepayments on the underlying NHA MBS rather than to the swap counterparties for reinvestment.
The NHA MBS, reinvestment assets, and swaps are not recognized on the balance sheet. These arrangements are discussed in further detail in notes 2, 4 and 20 of the Consolidated Financial Statements.
| n | | Projected repayments under the IMPP are $26.1 billion for 2014 and $2.1 billion for 2015, at which time the program will reach maturity and all loans and borrowings from the Government will have been repaid. Interest income and expense under the IMPP will show a corresponding decline and is estimated at $239 million in 2014 and $13 million in 2015; with no impact to Net Income. |
| n | | Guarantees-in-Force are expected to show a gradual increase as a result of annual NHA MBS projected volumes as a result of new issuances outweighing repayments. |
| n | | The NHA-MBS guarantee limit will decrease from $85 billion to $80 billion for 2014. The estimated impact of this change is a decrease in Total Revenue of approximately $2 million and a decrease in Net Income of approximately $1.5 million. |
| n | | Net Income is projected to decrease to $190 million and $197 million for 2014 and 2015 respectively as a result of the above change to the NHA-MBS guarantee limit combined with lower income on investments and net gains on financial instruments. |
7.5 Canada Housing Trust
CHT’s functions are limited to the acquisition of interests in eligible housing loans under the CMB program and the issuance of CMB. The CMB are guaranteed by CMHC under its Securitization Activity.
Although CHT’s assets represent approximately 77% of CMHC’s total assets, they contribute almost no Net Income as the interest income derived from loans receivable under the CMB program is used to cover interest expense on CMB borrowings and CHT’s operating expenditures.
CHT is self-sustaining and does not receive funding, in whole or in part, from Parliamentary Appropriations.
| | |
| 7.5.1 | | 2013 KEY FINANCIAL HIGHLIGHTS |
| n | | Loans and CMB issuances for 2013 were $38 billion. Outstanding CMB were $206,622 million, an increase of $3,103 million over the prior period due to annual net issuances of CMB. |
| | | | | | | | |
| (in millions) | | 2013 | | | 20121 | |
| Net Interest Income | | | 8 | | | | 9 | |
| Other Income | | | 161 | | | | 168 | |
| Total Revenues | | | 169 | | | | 177 | |
| Operating Expenses | | | 169 | | | | 177 | |
| Total Expenses | | | 169 | | | | 177 | |
| Net Income | | | - | | | | - | |
| 1 | Restated for comparative purposes; refer to Note 3 of the Consolidated Financial Statements. |
TOTAL REVENUES
Total Revenues were $169 million for the period ended 31 December, 2013, an $8 million (4.5%) decrease from the prior period.
Net Interest Income
Net Interest Income was $8 million at 31 December 2013, a $1 million (11.1%) decrease from the prior period due to lower CMB issuances.
Other Income
Other Income was $161 million at 31 December 2013, a $7 million (4.2%) decrease from the prior period. This is due to lower reimbursement of bond issuance fees resulting from lower CMB volumes.
TOTAL EXPENSES
Total Expenses were $169 million for the period ended 31 December 2013, an $8 million (4.5%) decrease from the prior period.
Operating Expenses
Operating Expenses, which include bond issuance fees and administrative costs, were $169 million at 31 December 2013, an $8 million (4.5%) decrease from the prior period. This is primarily due to lower bond issuance fees resulting from lower CMB volumes.
NET INCOME
Net Income is nil and is consistent with the prior period. This is in line with the nature of the Trust as income, after covering expenses, is distributed to the beneficiaries.
| | |
| 78 C A N A D A M O R T G A G E A N D H O U S I N G C O R P O R A T I O N | | |
QUARTERLY FINANCIAL INFORMATION
| | | | | | | | | | | | | | | | |
| | | For the three months ended | |
| | | 2013 | |
| (in millions) | | Dec. 31 | | | Sep. 30 | | | Jun. 30 | | | Mar. 31 | |
| Net Interest Income | | | 1 | | | | 2 | | | | 2 | | | | 3 | |
| Other Income | | | 40 | | | | 38 | | | | 42 | | | | 41 | |
| Total Revenues | | | 41 | | | | 40 | | | | 44 | | | | 44 | |
| Operating Expenses | | | 41 | | | | 40 | | | | 44 | | | | 44 | |
| Total Expenses | | | 41 | | | | 40 | | | | 44 | | | | 44 | |
| Net Income | | | - | | | | - | | | | - | | | | - | |
| |
| | | 20121 | |
| | | Dec. 31 | | | Sep. 30 | | | Jun. 30 | | | Mar. 31 | |
| Net Interest Income | | | 1 | | | | 3 | | | | 2 | | | | 3 | |
| Other Income | | | 42 | | | | 41 | | | | 40 | | | | 45 | |
| Total Revenues | | | 43 | | | | 44 | | | | 42 | | | | 48 | |
| Operating Expenses | | | 43 | | | | 44 | | | | 42 | | | | 48 | |
| Total Expenses | | | 43 | | | | 44 | | | | 42 | | | | 48 | |
| Net Income | | | - | | | | - | | | | - | | | | - | |
| 1 | Restated for comparative purposes; refer to Note 3 of the Consolidated Financial Statements. |
Overall, the financial results of CHT show a consistent trend on an annual and quarterly basis. Other Income and Operating Expenses have experienced a slight decrease over the quarters as a result of lower bond issuance fees resulting from lower CMB volumes.
| | |
| 7.5.3 | | FINANCIAL CONDITION |
BALANCE SHEET REVIEW
| | | | | | | | |
| (in millions) | | 2013 | | | 2012 | |
| Total Assets | | | 207,115 | | | | 204,060 | |
| Total Liabilities | | | 207,115 | | | | 204,060 | |
TOTAL ASSETS AND TOTAL LIABILITIES
Total Assets and Total Liabilities were both $207,115 million at 31 December 2013, a $3,055 million (1.5%) increase over the prior period. This increase is due to the annual net issuances of loans under the CMB programs.
CAPITAL MANAGEMENT
CHT is a special-purpose trust and does not retain any capital.
LIQUIDITY
CHT’s main source of liquidity are the loans due from Canadian financial institutions as a result of the sale of their beneficial interest in NHA MBS securities to the CMB Program. Loans arising from the CMB program are funded by the issuance of Canada Mortgage Bonds. Under this arrangement, substantially all of the risks and rewards of the NHA MBS are retained by the issuers through swap agreements with the Corporation.
CHT is exposed to liquidity risk should a problem arise with the timely maturities of the loans. This risk is mitigated by the collateral supporting the loans, which consists of NHA MBS and highly rated investments. Liquidity risk relating to the payment of interest on CMB is mitigated by the swap agreements entered into with approved financial institution counterparties, whereby the counterparties pay CMHC an amount equal to the coupon payments on the CMB. In addition, CHT is assured of the ability to pay principal and interest on CMB through the CMHC Securitization Activity’s timely payment guarantee.
FINANCIAL RESOURCES
The maturity of the loans cannot extend past the underlying CMB maturity date. At 31 December 2013, the maturity profile of the CMB program is as follows:
| | | | | | | | | | | | | | | | | | | | | | | | | | | | |
| | | | | | | | | | | | | | | | | | 2019 and | | | | |
| (carrying value in millions) | | 2014 | | | 2015 | | | 2016 | | | 2017 | | | 2018 | | | Thereafter | | | Total | |
| Assets | | | | | | | | | | | | | | | | | | | | | | | | | | | | |
| Loans under the CMB Program | | | 36,197 | | | | 31,086 | | | | 32,308 | | | | 29,706 | | | | 38,859 | | | | 38,466 | | | | 206,622 | |
| Liabilities | | | | | | | | | | | | | | | | | | | | | | | | | | | | |
| Canada Mortgage Bonds | | | 36,197 | | | | 31,086 | | | | 32,308 | | | | 29,706 | | | | 38,859 | | | | 38,466 | | | | 206,622 | |
OFF-BALANCE SHEET ARRANGEMENTS AND CONTRACTUAL OBLIGATIONS
CHT purchases insured NHA MBS from approved MBS sellers using funds supplied from the issuance of CMB. In addition, interest rate swap agreements are entered into where CHT is to pay all interest received on NHA MBS and reinvestment securities, net of its expenses, to swap counterparties and CHT is to receive payments equal to the interest due on its CMB borrowings.
In order to meet the principal obligations of the associated CMB borrowings, the principal payments and prepayments from the underlying NHA MBS are held in an account in the name of CHT, managed and reinvested in eligible assets by the swap counterparties pursuant to contractual agreements. Eligible assets include Investment Securities, Cash Equivalents and Securities Purchased Under Resale Agreements.
The NHA MBS, reinvestment assets, and swaps are not recognized on the Balance Sheet. These arrangements are discussed in further detail in notes 2, 4 and 20 of the Consolidated Financial Statements.
7.5.4 FINANCIAL OUTLOOK
The outlook for CHT is stable. In 2014, $40 billion of new CMB issuances has been approved for issuance by the Government of Canada. The size and timing of the issuances is dependent on originator volumes, investor demand and market conditions. Total CMB outstanding is expected to increase slightly as a result of planned issuances being greater than planned maturities.
| | |
| 80 C A N A D A M O R T G A G E A N D H O U S I N G C O R P O R A T I O N | | |
8.1 Overview
CMHC responsibly manages the public resources entrusted to its care and implements prudent risk management practices with due regard to loss in carrying out its activities. The Corporation is exposed to a variety of risks in its operating environment that could have an impact on the achievement of its objectives. The ability to respond appropriately and effectively to expected and unanticipated change is critical to the organization’s success.
8.2 Enterprise Risk
Management
CMHC has comprehensive Enterprise Risk Management (ERM) Policies and a governance structure that guides the Corporation in its risk management activities and encourages a risk-aware culture. CMHC’s ERM Policies ensure that risk management is an integral part of the Corporation’s strategic and operational decision-making and that principal risks and opportunities are appropriately identified and managed. They facilitate the understanding, discussion, evaluation and management of risks at all levels of the organization and across all business activities.
CMHC’s ERM Policies specify the Corporation’s appetite for risks, establish a governance structure and include an ERM framework that helps to define, assess and categorize the risks that the organization is exposed to.
8.2.1 CMHC RISK APPETITE STATEMENT
CMHC’s ERM Risk Appetite Statement (RAS) is designed to ensure a consistent understanding of risk exposures which are acceptable or unacceptable to the Corporation. The Risk Appetite Statement begins with the following statement:
“CMHC is exposed to a variety of risks as it strives to achieve the objectives set out in its corporate and business plans. This high level risk appetite statement describes the level at which risks should be avoided and where strategies must be implemented to manage risk.”
The Statement then indicates that, during the organization’s five-year corporate planning horizon, the organization wants a very high level of confidence that:
| n | | Spending on government-funded programs will not vary from approved funding by more than a specified percentage |
| n | | Exposures to financial risk expressed as a percentage of capital in three primary business lines – mortgage insurance, securitization and lending – will not exceed specified risk levels |
| n | | Variances of operating expenses to budget will not exceed a specified maximum variance |
The RAS also contains a risk tolerance statement for the five-year planning horizon which states that:
“It is considered unacceptable that CMHC would experience a significant negative impact to the reputation of CMHC or to its ability to achieve key objectives in the business and corporate plans.”
The statement concludes by specifying that a minimum percentage of the annual priority corporate objectives should also be achieved.
BUSINESS UNIT RISK APPETITE STATEMENTS
Risks are also managed at a more granular level for each of the three main business areas at CMHC, Insurance, Securitization, Housing Programs and Lending. RAS for each of these business units provide more detailed guidance and ensure alignment with the corporate RAS.
8.2.2 ERM GOVERNANCE
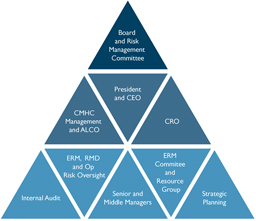
The Board of Directors has the ultimate accountability and responsibility for ensuring that the principal risks of the Corporation’s business are identified and appropriately managed. The Board is responsible for overseeing the Corporation’s ERM Policies and considers and approves, on an annual basis, the corporate risk appetite statement which is designed to ensure a consistent understanding of risk exposures that are acceptable or unacceptable to the Corporation. The Board is kept informed of significant risks and mitigating strategies through a variety of reporting mechanisms. In this context, the Board is supported by a Risk Management Committee which assists in fulfilling the Board’s oversight responsibilities with respect to the identification and management of the Corporation’s principal risks. The Committee ensures that appropriate policies, procedures and controls are in place to identify, assess, and manage the principal risks to the Corporation.
The President and CEO is accountable for ensuring that all significant risks are appropriately identified and managed, and provides the Board with assurance that these activities are being completed in an annual ERM Letter of Representation (see page 92 for this year’s ERM Letter of Representation).
The Chief Risk Officer (CRO) is responsible for the independent oversight of the management of risks inherent in CMHC’s activities, including establishing ERM policies and a framework to manage risk in alignment with the Corporation’s risk appetite and business
strategies. The CRO is accountable for the promotion of an effective risk culture, prudent ERM policies and processes, and in creating an organization capable of achieving its public policy mandate and objectives with due regard to its exposure to loss.
All members of CMHC Management play an integral role in ERM activities by identifying, monitoring and reporting potential risks within their areas of responsibilities.
The Asset/Liability Management Committee (ALCO) is a senior management committee which draws on internal and external specialized expertise in financial management. ALCO is involved in reviewing and approving all ERM reports prior to their presentation to the Board.
The CRO and CMHC Management are assisted in their risk management efforts by the ERM Committee, Director of ERM, Director of Risk Management Division (RMD) and Director of Insurance and Securitization Activity Oversight. The ERM Committee is comprised of senior level managers, representing the major business and risk management units, who have a strong technical understanding of risks in their business units. The ERM Committee is actively involved in the process of identifying, assessing, monitoring and reporting significant risks. RMD and the Insurance and Securitization Oversight Division provide specialized financial and operational risk services, analyses, reporting, oversight and reporting to senior management and the Board.
The other groups shown in the ERM governance diagram all play a role in ensuring that risks are identified and assessed in a consistent manner and are mitigated as appropriate. Processes are also in place to ensure that risk identification and mitigation strategies are an integral part of corporate planning and regular performance reporting.
8.2.3 RISK MONITORING AND REPORTING
In addition to ongoing regular activities to identify and manage risks as part of daily decision-making and risk management efforts, the Corporation has structured processes which ensure that regular risk management activities must occur as follows:
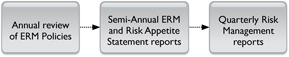
| | |
| 82 C A N A D A M O R T G A G E A N D H O U S I N G C O R P O R A T I O N | | |
These include:
| 1. | The Board, supported by the Risk Management Committee, completes an annual review and approval of the ERM policies to ensure that they remain relevant and reflect appropriate best practices. |
| 2. | The Board receives an ERM Risk Register and a Risk Appetite Statement report on a semi-annual basis. These reports provide details on the individual tolerances expressed in the RAS, identify the most significant risks in each of the 14 risk categories and highlight potentially significant new and emerging risks and opportunities. ALCO reviews and approves these reports prior to presentation to the Risk Management Committee and Board. Other reports to the Board include details on actuarial valuations and stress testing results, as well as Business Unit Risk Registers. |
| 3. | The CRO, working with other members of CMHC Management, assesses changes in the environment. Quarterly Risk Management reports provide CMHC Management, the Risk Management Committee and the Board with details on new and emerging risks, on significant financial and operational risks and compliance with ERM policies. |
8.2.4 ERM FRAMEWORK
CMHC’s ERM framework groups risks under three broad categories: strategic, operational and financial risks. The Corporation continually assesses internal and external risks based on this framework.
The following are definitions for each of our fourteen risks:
Mandate Risk is the ability to deliver the mandate in a timely manner.
Business Environment Risk is the ability to anticipate, understand and manage the impact of and changes in the business environment.
Relational and Reputational Risk is the ability to manage key relationships necessary to the achievement of corporate objectives
and ensure that the perceptions of the organization are effectively and proactively managed.
Organizational Risk is the ability to align corporate efforts to achieve mandate / corporate objectives in a responsible manner.
People Risk is the ability to attract, retain and motivate the pool of talented and diverse employees in order to achieve business objectives.
Process Risk is the ability to effectively and efficiently manage current processes and proposed changes, including the corporate ability to transact, communicate, educate, document, monitor, measure and plan.
Technology Risk is the ability to provide appropriate and reliable technology and information systems to support the business lines with needed enhancements in a timely manner.
Security and Catastrophic Risk is the ability to safeguard corporate assets and employees and to protect CMHC from significant loss as a result of external, man-made or natural events.
Legal and Regulatory Risk is the ability to appropriately manage exposures/liabilities relating to regulatory and legal environments.
Credit Risk is the ability to appropriately manage the risk of financial default or credit loss from a counterparty, borrower or investment.
Market Risk is the ability to appropriately manage financial consequences of fluctuations in market conditions.
Liquidity Risk is the ability to have sufficient funds to meet all financial obligations as they come due.
Capital Adequacy Risk is the ability to ensure that CMHC maintains appropriate levels of capital for each of its activities.
Pricing Risk is the ability to correctly price products, assets and liabilities.
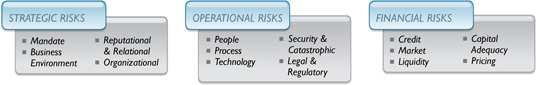
8.2.5 OWN RISK SOLVENCY
ASSESSMENT (ORSA)
The regulatory environment for insurers in Canada continues to evolve as governments and regulators enhance the frameworks for financial regulation to ensure that capital and risk management practices are appropriate and robust enough to withstand economic shifts. In 2012, OSFI published draft guidelines for Insurers: Guideline E-19: Own Risk and Solvency Assessment (ORSA) and a draft of revised Guideline A-4: Internal Target Capital Ratio for Insurance Companies. On 11 November 2013 OSFI released final versions of Guideline E-19 and Guideline A-4 (renamed Regulatory Capital and Internal Capital Targets). Both guidelines have an implementation date of 1 January 2014 with an expectation that an ORSA report will be available in 2014. Guideline E-19 sets out OSFI’s expectations with respect to the process and considerations of an insurer as it undertakes its ORSA. OSFI expects an insurer to have processes in place to conduct an ORSA that is proportionate to the nature, scale and complexity of its business and risk profile, and that the ORSA be tailored to include the consolidated operations of the insurer. CMHC will carry out its first ORSA in 2014.
8.3 Housing Programs And
Lending Activity Risks
On behalf of the Government of Canada, CMHC makes annual investments of approximately $2 billion for housing, through Parliamentary Appropriations for Housing Programs expenditures, including operating expenses. Funding is provided to provinces, territories, First Nations and project proponents through various agreements. These agreements outline the appropriate use of the funding and contain a clear accountability framework. CMHC monitors these agreements to ensure that there is compliance with respect to CMHC’s intended objectives for each housing program and the use of federal funding. CMHC does not pay claims and suspends the subsidy where there are material compliance issues. There is a risk that housing programs funding may not be used in accordance with approved program parameters leading to reputational issues.
LENDING ACTIVITY RISKS
CMHC holds and makes loans under the National Housing Act (NHA) to social housing sponsors, First Nations, provinces, territories and municipalities for federally-subsidized housing. The estimated fair value of loans arising from CMHC’s Lending Activity is $12.3 billion on an outstanding balance of $10.7 billion as at 31 December 2013. The principal risks associated with this activity include credit risk, market risk, including prepayment and interest rate risks, liquidity risk and pricing risk.
8.3.1 CREDIT RISK
Credit risk in the lending portfolio arises from the risk of loss due to the failure of counterparties to meet their contractual obligations. CMHC’s loan portfolio includes loans for social housing projects administered jointly or by provinces/territories as well as those administered by CMHC both on and off reserve. CMHC lends to a large number of non-profit entities that do not issue public debt, and therefore do not have credit ratings established by independent credit rating agencies. Losses due to default on these loans are largely recoverable from various levels of government.
Credit risk is also managed by examining annual project level reports, including audited financial statements submitted by social housing project sponsors. These reports enable CMHC to detect and intervene, as appropriate, should a project face financial difficulty. Workouts or restructuring, which may involve additional financing or assistance, are determined on a case-by-case basis.
CHMC’s Lending activity is assured full collection of principal and accrued interest on the majority of the loans. The source of guarantee/insurance as at 31 December 2013 on the total loan portfolio was:
| n | | 45% Provinces and Territories; |
| n | | 10% CMHC Mortgage Loan Insurance; |
| n | | 10% Government of Canada; and |
| n | | 12% Aboriginal Affairs and Northern Development Canada. |
| | |
| 84 C A N A D A M O R T G A G E A N D H O U S I N G C O R P O R A T I O N | | |
The remaining loans, totalling 23% (2012 – 22%), are assessed on a regular basis to determine if a provision for loss is necessary. As at 31 December 2013, there were no impaired loans identified and no provision for loss has been recorded (2012 – nil).
For investment and hedging activities related to lending, credit risk includes default risk, settlement risk and downgrade risk. Exposures associated with the Corporation’s financial transacting and financial instruments (money market and fixed income securities, repurchase and reverse repurchase transactions, derivatives and equities) are consolidated and measured on an aggregate basis by counterparty or approved issuer for all investing and hedging activities. Exposure limits are established by approved issuer/counterparty for the Lending Activity subject to rating, term and diversification limits.
8.3.2 MARKET RISK
PREPAYMENT RISK
CMHC operates its Lending Activity on a breakeven basis. The vast majority of the mortgages are closed to prepayment for the duration of the mortgage term selected by the housing group. The underlying debt (the monies that CMHC borrows to fund the mortgage) matches, to the extent possible, the term of the mortgage. As such, prepayment activity, including the restructuring of closed loans, has the potential to cause CMHC to incur losses.
CMHC mitigates its exposure to prepayment risk by applying the terms and conditions of its mortgages, including prepayment clauses. On an exception basis, CMHC allows the early payout of closed mortgages with the payment of all interest costs over the remaining term.
CMHC also accepts prepayment of some closed CMHC mortgages for eligible existing social housing projects that require capital repairs and renovations. In these cases, a yield maintenance prepayment penalty consistent with private lending institutions will apply. These options enable social and co-operative housing sponsor groups
to refinance and undertake the needed capital repairs and renovations to extend the life of their projects, while mitigating prepayment risk for CMHC. The yield maintenance prepayment penalty paid by sponsor groups generally allows CMHC to offset the prepayment penalty associated with its corresponding debt to the Government of Canada.
INTEREST RATE RISK
The Corporation is exposed to interest rate risk when asset and liability principal and interest cash flows have different interest payments or maturity dates. The severity of the risk is dependent on the size and direction of interest rate changes and the size of the mismatched positions. CMHC’s risk management policies specify that the maximum exposure, exclusive of prepayment risk, to interest rate movements with a 95% confidence be fixed at $1.5 million over a 12-month horizon. For the Lending Activity portfolio, this exposure was $0.04 million as at 31 December 2013 ($0.24 million as at 31 December 2012).
8.3.3 LIQUIDITY RISK
Lending Activity and Housing Programs which fund social housing loans and affordable housing programs have minimal liquidity risks. Any potential liquidity shortfall is mitigated through ongoing cash and liquidity management activities, and ultimate access to funding from the Department of Finance through the Crown Borrowing Program.
8.3.4 PRICING RISK
Pricing risk, as it relates to lending activities, refers to the determination of the interest rate charged to borrowers and the adequacy of the loan interest rates to cover costs. Direct Lending is priced on a planned breakeven basis. Rates are set based on operating costs, slippage, funding costs and related hedging costs. A review of Direct Lending costs is conducted periodically to determine if the rate charged to Direct Lending borrowers is sufficient to recover CMHC’s administrative costs in respect of this program.
8.4 Mortgage Loan
Insurance Activity Risks
The main risk of financial loss to the Corporation from its Mortgage Loan Insurance Activity is represented by the amount of future claims associated with insured mortgages relative to insurance premiums received. CMHC manages this risk through prudent underwriting, lender quality assurance, a sound capital management framework, a sensitivity and stress testing framework and product pricing. The principal risks associated with this activity include credit risk, market risk, liquidity risk and capital adequacy and pricing risk.
In 2014, it is anticipated that OSFI will issue a guideline for underwriting mortgage loan insurance. While CMHC expects that its current standards and practices will already be generally in compliance, it will align its underwriting practices as required with the new guideline.
8.4.1 CREDIT RISK
Credit risk, as it relates to Insurance activities, is managed through a number of processes including assessment of underwriting of mortgage loan insurance applications and continuous monitoring of Approved Lenders’ portfolios and underwriting practices.
ASSESSING MORTGAGE LOAN INSURANCE APPLICATIONS
CMHC prudently manages mortgage loan insurance risk for different types of residential properties through a rigorous underwriting process, as described below:
| n | | Transactional homeowner insurance (four units or less) – high ratio or low ratio loans |
Risks related to transactional homeowner mortgage loan insurance are assessed through CMHC’s proprietary automated mortgage loan insurance risk assessment and approval system, emili, which is used by Approved Lenders and by CMHC underwriters across the country. emili assesses an application’s overall risk by looking at the borrower, the property, the market in which the property is located, as well as the overall characteristics of the loan. The results of these risk assessments are synthesized to determine the overall risk of default.
If necessary, underwriters can take further steps to determine if risk-mitigating actions are required to effectively reduce the overall risk to a level that is acceptable and prudent or may indicate that the application for insurance is declined. CMHC monitors and adjusts its risk assessment models based on actual claims experience and local market conditions. The emili overall risk rating, along with the size of the loan and policy considerations, determines the required approval authority. CMHC continually monitors the quality of the results achieved by the emili system in order to ensure the highest levels of quality risk analysis and efficiency possible.
| n | | Multi-unit residential insurance (in excess of four units) |
Risks associated with multi-unit mortgage loan insurance are also assessed through detailed and thorough underwriting processes that include analysis and risk assessment of the borrower, the property, the market in which the property is located and the overall characteristics of the loan. A standardized risk assessment tool is employed by underwriters to assign a risk rating to each of these major risk components.
Based on the risk rating and complexity of the application, the underwriters take risk mitigating actions that effectively ensure that the risk being assumed is at a level that is acceptable and prudent. The risk ratings, along with the size of the loan and policy considerations, determine the required approval authority.
| n | | Portfolio insurance (homeowner - four units or less) |
Loans submitted for portfolio insurance are assessed through an automated underwriting system similar to emili. The assessments include an analysis and risk assessment of the borrower, the property, the market in which the property is located, and the overall characteristics of each individual loan. Individual pools are then priced accordingly.
MONITORING APPROVED LENDERS’ INSURED PORTFOLIOS
Through its Quality Assurance Framework and lender operational reviews, CMHC further manages risks by assessing lenders’ insured loan portfolios, compliance with CMHC’s underwriting requirements and by working with
| | |
| 86 C A N A D A M O R T G A G E A N D H O U S I N G C O R P O R A T I O N | | |
lenders on a regular basis to maintain quality standards in the underwriting and servicing of their portfolios. CMHC monitors the performance of individual lenders and helps ensure that any deficiencies are addressed in a systematic, comprehensive and timely manner.
MORTGAGE LOAN INSURANCE – INVESTMENT PORTFOLIO
In the context of CMHC’s insurance-related investment portfolio, credit risk is the risk of loss arising from a counterparty’s or an approved issuer’s inability to fulfil its contractual obligations. Credit risk includes default risk, settlement risk, and downgrade risk, and encompasses both the probability of loss and the probable size of the loss net of recoveries and collateral over appropriate time horizons. CMHC is exposed to credit risk from various sources directly and indirectly, including directly from its investment and hedging activities. Exposures associated with the Corporation’s financial transacting and financial instruments (including money market and fixed income securities, repurchase and reverse repurchase transactions, derivatives, and equities) are consolidated and measured on an aggregate basis by counterparty or approved issuer for all investing and hedging activities. Total exposure is calculated using estimated fair values plus an estimate for future replacement cost, as appropriate. Exposure limits are established by approved issuer/counterparty for the Insurance Activity subject to rating, term, and diversification limits.
8.4.2 MARKET RISK
Interest rate, currency and equity price risks for CMHC’s insurance activities derive from asset and liability mismatches inherent in the cash flow timing associated with the insurance assets and liabilities. The Corporation manages market risk through its strategic asset allocation process, which includes consideration of overall risk and return in selecting a specific asset allocation strategy, benchmarks and risk tolerances and controls.
Financial risks also arise from the investment portfolio associated with CMHC’s Mortgage Loan Insurance Activity. The investment portfolio for mortgage loan insurance consists of cash flows from premiums, application fees, and interest received, net of claims and expenses. CMHC uses its mortgage loan insurance portfolio to cover obligations associated with the provision of mortgage loan insurance to lenders.
The objective of the mortgage loan insurance investment portfolio is to maximize the total return on a pre-tax basis after related operating expenses. This is achieved through a strategic asset allocation policy that takes into account the time horizon and liquidity needs of the liabilities, as well as the regulatory environment, capital objectives, and risk appetite of the Corporation.
As at 31 December 2013, total investments under management had a market value $21.1 billion compared to $20.1 billion at the end of 2012. The allocation of investments in the portfolio as at 31 December 2013 is shown in the following graph:
ASSET ALLOCATION OF THE MORTGAGE LOAN INSURANCE INVESTMENT PORTFOLIO (%)

Approximately 61.49% of the total fixed-income and money market assets at year-end were invested in securities issued or explicitly guaranteed by the Government of Canada or Canadian provinces.
Performance, including absolute and risk-adjusted measures relative to Strategic Asset Allocation benchmarks, is tracked and monitored in aggregate and at individual asset class levels. The benchmarks by asset class are: Dex-UBI for fixed income; TSX Composite for Canadian equity; MSCI for foreign equity and the IPD Canadian Real Estate benchmark for Real Estate. In 2013, the total return for the mortgage loan insurance portfolio was 3.40%, which was 0.47% above the total return of the benchmark index.
Investment activity for the mortgage loan insurance portfolio in 2014 will include activities related to the ongoing management of investments in fixed-income, equities, and alternative investments. The strategic asset allocation policy is reviewed every five years or more frequently, as necessary.
8.4.3 LIQUIDITY RISK
The insurance program requires liquidity to fund claims payments as they occur. Insurance claims payments are generally funded from insurance premiums and fees received. Any excess claims are funded through the sale of insurance investment portfolio assets. Given the long lead time between the occurrence of a loan default and the payment of an insurance claim, and because insurance premiums and fees typically exceed claims payments, there is no significant liquidity risk in the insurance program.
8.4.4 CAPITAL ADEQUACY AND
PRICING RISKS
CMHC’s Capital Management Framework follows OSFI regulations with respect to the use of the Minimum Capital Test (MCT) for insurance companies. The MCT is the ratio of capital available to capital required. With respect to CMHC, capital available is equal to mortgage loan insurance retained earnings plus accumulated other comprehensive income minus assets with a capital requirement of 100%. Capital required is calculated by applying risk factors to assets, policy liabilities and other exposures.
PROPOSED CHANGES TO THE REGULATORY CAPITAL FRAMEWORK FOR FEDERALLY REGULATED PROPERTY AND CASUALTY INSURERS
CMHC follows OSFI guidelines applicable to Property and Casualty (P&C) insurers for determining regulatory capital. In May 2013, OSFI issued a discussion paper on Proposed Changes to the Regulatory Capital Framework for Federally Regulated Property and Casualty (P&C) Insurers. OSFI has also commenced a process aimed at developing a new capital framework for mortgage insurers. The timing and impact of this new capital framework are currently unknown.
The following represents CMHC’s capital management framework for its mortgage loan insurance activity:
| n | | Minimum Regulatory Capital: 100% MCT
Below 100% MCT, an insurance company would no longer be allowed to write new business. A level below 0% MCT indicates insolvency. |
| n | | Internal Capital Target: 185% MCT
The internal capital target provides adequate time for Management to resolve financial problems that may arise, while minimizing the need for regulatory intervention. In 2013, the Board reviewed the results of the stress testing for the 2014 Corporate Plan and approved an increase to 185% MCT for the internal target level. The increase reflects a more conservative assessment of the impact of adverse economic conditions. |
| n | | Capital Holding Target: 200% MCT
CMHC has selected a capital holding target of 200% MCT so that the likelihood of falling below the internal capital target is less than 5% over a five-year period. |
Using 10,000 consistent economic scenarios, CMHC’s sensitivity testing framework simulates the impact of each of these economic scenarios on the 2014-2018 Corporate Plan as well as other plausible adverse business scenarios. Each scenario includes 10 years of new business which then runs off over the next 20 years. The economic scenarios include 30 years of outcomes for real GDP growth, the unemployment rate, the five-year mortgage rate, and investment returns for up to 40 asset classes.
The economic variables are used to generate outcomes for the volume of mortgage loan insurance written, short-term changes in claim frequencies, changes in house prices and investment returns/yields.
Results of economic and business stress tests remain within the Corporation’s risk and capital tolerance levels. Testing has also validated that CMHC’s internal target level of 185% MCT and the capital holding level of 200% MCT meet the Capital Management Framework requirements.
CMHC continues to focus on monitoring and proactively managing the performance of its insurance business by enhancing its capital framework and taking steps to ensure that pricing remains appropriate for risk underwritten.
| | |
| 88 C A N A D A M O R T G A G E A N D H O U S I N G C O R P O R A T I O N | | |
8.5 Securitization Activity
Risks
CMHC guarantees the timely payment of interest and principal of National Housing Act Mortgage-Backed Securities (NHA MBS) issued by Approved Issuers and of Canada Mortgage Bonds (CMBs) issued by the Canada Housing Trust. The major risk of financial loss to the Corporation arising from CMHC’s guarantee is making timely payments when an issuer is unable to honour its commitments and the assets backing the securities are insufficient. Timely payment guarantee risk and counterparty and liquidity risks are mitigated by requiring participants to meet minimum standards and robust legal and operational frameworks. The principal risks associated with this activity include credit risk, market risk, liquidity risk, capital adequacy and pricing risk and reputational risk.
CMHC is responsible for administering the Canadian Covered Bond Legal Framework and registry, and for approving registered issuers and their covered bond guarantors. Covered bond issues are not guaranteed by CMHC or the Government of Canada. The principal risks associated with this activity are mandate risks and reputational risk.
8.5.1 CREDIT RISKS
NHA MBS
For NHA MBS, the risk associated with issuer default is mitigated by both quality assessment and monitoring of the issuers, and by a minimum spread requirement between the security coupon and the lowest mortgage rate in the pool. In the event of issuer default, the spread is available to CMHC to mitigate its guarantee risk and for retaining third-party issuers for the continued servicing of underlying mortgages and the NHA MBS payments. All securitized mortgages have full mortgage default insurance coverage. An upfront guarantee fee based on the term of the security is paid to CMHC by the approved issuers in exchange for the CMHC guarantee.
CMB
CMHC’s role with respect to the CMB program is to guarantee the timely payment of interest and principal associated with CMBs. The Issuer Trustee maintains the trust property and ensures that the Trust fulfills its obligations, while the Trust Administrator is responsible for the day-to-day management of CHT operations.
The Trust is exposed to the credit risk of its counterparties through swap and repurchase (repo) agreements. The swap counterparties effectively absorb all prepayment and reinvestment risk associated with the assets held by CHT. The use of highly rated counterparties and collateralization help mitigate the risk of default. A drop below an established credit rating triggers monthly interest retention by the CHT. Repo counterparty credit risk is mitigated through rating requirements, transaction limits, and collateral.
The risk of default on the investments held by the Trust is managed by limiting the eligible investments to highly rated securities including NHA MBS, obligations issued by the Government of Canada and limited amounts of AAA asset-backed commercial paper (ABCP). Additionally, none of the Trust-permitted investments, including the NHA MBS, are permitted to have a maturity date beyond that of the related CMB issue.
SECURITIZATION INVESTMENTS AND HEDGING
CMHC’s securitization investment portfolio is managed with the objective of identifying, diversifying and managing credit exposure and related risks associated with the Corporation‘s investing activities. The objective is to protect it from financial default or credit loss from exposures to a counterparty or issuer and to minimize expected losses within the context of expected returns. For investment purposes, credit risk is the risk of loss arising from a counterparty’s or an approved issuer’s inability to fulfil its contractual obligations. Credit risk includes default risk, settlement risk, and downgrade risk, and encompasses both the probability of loss and the probable size of the loss net of recoveries and collateral over appropriate time horizons.
In the context of the Securitization portfolio, there is limited credit risk associated with the portfolio‘s investments in Government of Canada securities; however, credit risk may arise in relation to repurchase transactions that may be undertaken to meet calls on the timely payment guarantee. Exposure limits are established by approved issuer/counterparty for the Securitization Activity.
8.5.2 MARKET RISK
CMHC’s Securitization Activity market risk is associated with the interest rate risk resulting from cash flow mismatches between the assets and liabilities in the CMB Program and the Insured Mortgage Purchase Program (IMPP).
NHA MBS
For the NHA MBS Program, the NHA MBS guarantees provided do not expose CMHC to market risk. The interest rate and prepayment risk (within eligible pools) from the underlying mortgages is passed through to investors. Only in a situation of issuer default is CMHC exposed to temporary funding risk until a replacement servicer is found.
CMB
For the CMB Program, CHT is exposed to interest rate risk stemming from the possibility that the rate of interest earned on NHA MBS and eligible Trust-permitted investments will not be sufficient to meet its interest obligations on the CMB issues. This risk is managed through interest rate swaps with approved swap counterparties. The swaps effectively transform the interest rate risk (i.e., prepayment and reinvestment risks) associated with the assets held by CHT into counterparty risk, which is managed in accordance with CMHC’s credit policies and controls. Thus, only in a situation of swap counterparty default and if CHT is unable to find a suitable swap replacement, would CHT be exposed to interest rate risk.
SECURITIZATION INVESTMENTS AND HEDGING
CMHC’s Securitization investment portfolio and hedging activities are managed to constrain the risk of loss to the Corporation from adverse movements in interest rates through policy controls and limits which establish appropriate risk/return tradeoffs.
Financial risks arise from the investment portfolio associated with CMHC’s securitization activity. The securitization investment portfolio consists of cash flow from guarantee and application fees, and interest received,
net of claims and expenses. This portfolio is intended to cover obligations associated with CMHC’s securitization guarantee programs. The objective of the securitization investment portfolio is to maximize the capacity to meet liquidity needs of the timely payment guarantee and to preserve capital through investments in Government of Canada securities.
The Board of Directors approved a revised investment objective and strategic asset allocation (SAA) policy for this portfolio in the fall of 2012. The new SAA benchmark for the securitization investment portfolio, comprised of Canada Non-Agency Bonds (98%) and 91-day T-Bills (2%) was implemented effective 1 January 2013 and is shown in the following graph.
ASSET ALLOCATION OF THE SECURITIZATION INVESTMENT PORTFOLIO (%)
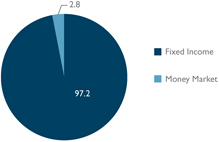
In October 2008, CMHC began investing in NHA MBS under IMPP. These investments, while recognized as part of the Securitization Activity, are excluded from the strategic asset allocation of the securitization investment portfolio as they were made with the explicit goal of assisting Canadian financial institutions to raise longer-term funds and therefore do not contribute to the overall return of the investment portfolio.
As at 31 December 2013, total investments under management had a market value of $1.9 billion compared to $1.8 billion at the end of 2012. In 2013, the total return was 2.06% which was 0.04% below the total return of the benchmark index.
| | |
| 90 C A N A D A M O R T G A G E A N D H O U S I N G C O R P O R A T I O N | | |
IMPP
Under the IMPP, CMHC does not provide timely payment guarantee since assets were purchased with borrowings from the Government of Canada.
CMHC is exposed to cash flow mismatches between assets and liabilities related to fixed rate IMPP auctions. This risk is managed through interest rate swaps with approved swap counterparties. Only in a situation of swap counterparty default and if CMHC is unable to find a suitable swap replacement, would the Corporation be exposed to interest rate risk.
8.5.3 LIQUIDITY RISK
Both the NHA MBS and CMB programs face liquidity risk in the event of a call on the timely payment guarantee. Potential liquidity requirements under the timely payment guarantee are contingent on the performance of participants and service providers in the Securitization programs to meet their obligations. The liquidity risk is mitigated with liquidity risk management policies, liquid assets and liquidity management processes, minimum standards for participants, the collection of collateral, robust legal and operational frameworks, and the collection of guarantee fees. All investment assets held by the Corporation (the majority of which are invested in high quality government instruments) for the purposes of its business lines can be utilized to satisfy a call on the timely payment guarantee on an interim basis until funds can be sourced through the Government or otherwise recovered. While CMHC maintains internal sources of liquidity that are appropriate in relation to its risk appetite, funding can be sourced through the Department of Finance and the Crown Borrowing Program (CBP) for amounts beyond its available liquidity.
8.5.4 CAPITAL ADEQUACY AND
PRICING RISKS
CMHC’s Capital Management Framework for its securitization activity incorporates elements from OSFI’s Minimum Capital Test (MCT) capital requirements for insurance companies for asset exposures and principles from the Basel Committee on Banking Supervision (BCBS) for counterparty credit risk and guarantee exposures as applicable. Capital available is equal to securitization retained earnings plus accumulated other comprehensive income minus assets with a capital requirement of 100%.
The following represents CMHC’s capital management framework for its securitization activity:
| n | | Internal Capital Target for Asset Exposures:
CMHC holds capital equivalent to 200% of the MCT requirements for risk exposures in investment assets. |
| n | | Internal Capital Target for Counterparty Credit Risk and Guarantee Exposures:
CMHC follows BCBS principles and, using a Credit Value-at-Risk (CVAR) approach, establishes the internal capital target at a level that covers the risk of unexpected losses at the 99.9% confidence level over a one-year time horizon. |
CMHC continues to focus on monitoring and proactively managing the performance of its securitization business to ensure that pricing remains appropriate for the risks undertaken.
8.5.5 REPUTATIONAL RISK
With CMHC’s role in administering the Canadian Covered Bond Legal Framework, there is the risk that CMHC may be perceived as providing a direct or indirect guarantee of regulated Covered Bond Programs. The regulatory Covered Bond framework has been structured to minimize the potential perception that CMHC, and the Government of Canada, provide any kind of guarantee to covered bond investors.
9.1 Disclosure of Changes
in Accounting Policies
CMHC’s significant accounting policies and changes in accounting policies are described in Note 2 and Note 3 of the 2013 Consolidated Financial Statements.
The Corporation’s financial statements for 2013 have been prepared in accordance with International Financial Reporting Standards (IFRS) as at 31 December 2013.
9.2 Critical Accounting
Policies and Estimates
JUDGMENTS IN APPLYING ACCOUNTING POLICIES
In the process of applying the accounting policies, Management is required to make various judgments, apart from those involving estimations, that can significantly affect the amounts recognized in the Consolidated Financial Statements. The judgments having the most significant effect on the amounts recognized in the Consolidated Financial Statements are consolidation, derecognition, and impairment of available for sale financial instruments. For further detail refer to Note 4 of the Consolidated Financial Statements.
CRITICAL ACCOUNTING ESTIMATES
The preparation of these Consolidated Financial Statements requires Management to make estimates and assumptions. These estimates and assumptions affect the reported amounts of assets, liabilities, comprehensive income and related disclosures. Key areas where Management has made estimates and assumptions include those related to Provision for Claims, Unearned Premiums, Fair Value of Financial Instruments, and Pension and Other
Post-employment Benefits. Actual results could differ from these estimates and assumptions. Where these differ, the impact will be recorded in future periods. For further detail refer to Note 4 of the Consolidated Financial Statements.
CHANGES IN ACCOUNTING POLICIES
Current Accounting Changes
The IASB issued certain pronouncements that are mandatory for periods beginning 1 January 2013.
The following new standards and amendments were adopted by the Corporation: IFRS 7 Financial Instruments: Disclosures, IFRS 10 Consolidated Financial Statements, IFRS 11 Joint Arrangements and IFRS 12 Disclosure of Interests in Other Entities. The adoption of these standards and amendments had minimal disclosure impact on the Consolidated Financial Statements.
The Corporation also adopted amendments to IAS 19 Employee Benefits and IFRS 13 Fair Value Measurements, which had an impact on amounts reported in the Consolidated Financial Statements, the presentation of these amounts, and the related disclosures. For further detail on the impact of these changes refer to Note 3 of the Consolidated Financial Statements.
Future Accounting Changes
The IASB continues to develop and publish accounting standards in order to achieve high quality financial reporting. CMHC actively monitors the new standards and amendments to existing standards that have been issued by the IASB. The following pronouncements, listed by applicable annual accounting period effective date, have been identified as potentially having an impact on the Corporation’s results and Consolidated Financial Statements in the future.
| | | | | | |
| New Standards | | Impact to CMHC’s Consolidated Financial Statements on adoption | | Effective for annual periods beginning on or after |
| IFRS 9 | | Financial Instruments | | To be determined | | To be determined |
| Amended Standards | | | | |
| IAS 32 | | Financial Instruments: Presentation | | No material impact | | 1 January 2014 |
| IAS 19 | | Employee Benefits | | To be determined | | 1 July 2014 |
For a more detailed description of future accounting changes and assessments made to date, see Note 3 of the Consolidated Financial Statements.
9.3 Glossary For Non-IFRS
Financial Measures
CMHC uses a number of financial measures to assess its performance, some of which are not calculated in accordance with IFRS, are not defined by IFRS, and do not have standardized meanings that would ensure consistency and comparability with other institutions.
arrears rate means the ratio (expressed as a percentage) of all loans that are more than 90 days past due to the number of outstanding insured loans.
capital available to capital required under the Securitization activity means the ratio (expressed as a percentage) of capital available to capital required where capital available is calculated as Total Equity adjusted for Assets with a Capital Requirement of 100% and capital required is calculated by applying risk factors to investment asset and liability exposures using a framework developed in accordance with both regulatory and economic capital principals.
capital available to minimum capital required under the Mortgage Loan Insurance Activity means the ratio (expressed as a percentage) of capital available to capital required where capital available is calculated as Total Equity adjusted for Assets with a Capital Requirement of 100% and capital required is calculated by applying risk factors to investment asset and liability exposures in accordance with guidelines established by OSFI.
combined ratio means the sum of the loss ratio and the operating expense ratio within the Mortgage Loan Insurance Activity, and provides a measure of CMHCs profitability from insurance underwriting activities.
guarantees-in-force means the total guarantees related to the timely payment of principal and interest of NHA MBS for investors in securities issued by Approved Issuers on the basis of housing loans through the NHA MBS program and the CMB issued by the CHT.
insurance in-force means the total amount of outstanding loan balances covered by mortgage insurance policies at a specific period in time.
loss ratio means the ratio (expressed as a percentage) of the Insurance Claims losses incurred during the period to the premiums and fees earned in the period in the Mortgage Loan Insurance Activity.
minimum capital test or MCT is the minimum capital required calculated by applying risk factors to the Mortgage Loan Insurance Activity’s assets and liabilities using a defined methodology prescribed by OSFI.
operating expense ratio is defined as follows under the Mortgage Loan Insurance Activity and Securitization Activity:
Mortgage Loan Insurance: the ratio (expressed as a percentage) of Operating Expenses during the period to Premiums and Fees Earned during the period for the Mortgage Loan Insurance Activity.
Securitization: the ratio (expressed as a percentage) of Operating Expenses during the period, exclusive of those related to the administration of the covered bond legal framework, to Guarantee Fees Earned during the period.
return on capital holding target means annualized Net Income divided by the average of the beginning and ending Capital Holding Target (200% MCT) for the period.
return on equity means the annualized Net Income divided by the average of the beginning and ending Equity for the period, and is used to highlight the operating performance.
severity ratio means the ratio (expressed as a percentage) of Insurance Claims Losses to the original insured loan amount for the claims paid in the period.
| | |
| 94 C A N A D A M O R T G A G E A N D H O U S I N G C O R P O R A T I O N | | |

| | | | |
| n | | Consolidated Financial Statements |
| |
| | Management’s Responsibility for Financial Reporting Year ended 31 December 2013 CMHC Management is responsible for the integrity and objectivity of the Consolidated Financial Statements and related financial information presented in this annual report. The Consolidated Financial Statements have been prepared in accordance with International Financial Reporting Standards and, consequently, include amounts which are based on the best estimates and judgment of Management. The financial information contained elsewhere in this annual report is consistent with that in the Consolidated Financial Statements. In carrying out its responsibilities, Management maintains appropriate financial systems and related internal controls within CMHC, as well as controls within Canada Housing Trust as guarantor, to provide reasonable assurance that financial information is reliable, assets are safeguarded, transactions are properly authorized and are in accordance with the relevant legislation, by-laws of the Corporation and government directives, resources are managed efficiently and economically, and operations are carried out effectively. The system of internal controls is supported by internal audit, which conducts periodic audits of different aspects of the operations. The Board of Directors, acting through the Audit Committee whose members are neither officers nor employees of the Corporation, oversees Management’s responsibilities for financial reporting, internal control systems, and the controls as guarantor of Canada Housing Trust. The Board of Directors, upon the recommendation of the Audit Committee, has approved the Consolidated Financial Statements. Ernst & Young LLP and the Office of the Auditor General of Canada have audited the Consolidated Financial Statements. The auditors have full access to, and meet periodically with, the Audit Committee to discuss their audit and related matters. |
| | |
| |  | |  |
| | Evan W. Siddall, BA, LL.B | | Brian Naish, CPA, CA |
| | President and Chief Executive Officer | | Chief Financial Officer |
| | |
| | 19 March 2014 | | |

Consolidated Balance Sheet
As at 31 December
| | | | | | | | | | | | |
| (in millions of Canadian dollars) | | Notes | | | 2013 | | | 2012 Restated Note 3 | |
| ASSETS | | | | | | | | | | | | |
| Cash and Cash Equivalents | | | | | | | 1,336 | | | | 1,220 | |
| Securities Purchased Under Resale Agreements | | | | | | | - | | | | 63 | |
| Investment Securities: | �� | | 5 | | | | | | | | | |
Designated at Fair Value through Profit or Loss | | | | | | | 1,012 | | | | 928 | |
Available for Sale | | | | | | | 19,659 | | | | 19,304 | |
Held for Trading | | | | | | | 444 | | | | 415 | |
| Loans: | | | 6 | | | | | | | | | |
Designated at Fair Value through Profit or Loss | | | | | | | 6,041 | | | | 6,591 | |
Loans and Receivables | | | | | | | 239,531 | | | | 261,127 | |
| Accrued Interest Receivable | | | | | | | 859 | | | | 959 | |
| Derivatives | | | 7 | | | | 96 | | | | 131 | |
| Due from the Government of Canada | | | 8 | | | | 311 | | | | 309 | |
| Accounts Receivable and Other Assets | | | 9 | | | | 762 | | | | 935 | |
| Deferred Income Tax Assets | | | 14 | | | | - | | | | 58 | |
| | | | | | | | 270,051 | | | | 292,040 | |
| LIABILITIES | | | | | | | | | | | | |
| Securities Sold Under Repurchase Agreements | | | | | | | 91 | | | | 425 | |
| Borrowings: | | | 11 | | | | | | | | | |
Designated at Fair Value through Profit or Loss | | | | | | | 7,818 | | | | 8,507 | |
Other Financial Liabilities | | | | | | | 237,378 | | | | 259,271 | |
| Accrued Interest Payable | | | | | | | 652 | | | | 753 | |
| Derivatives | | | 7 | | | | 44 | | | | 46 | |
| Accounts Payable and Other Liabilities | | | 12 | | | | 817 | | | | 1,258 | |
| Provision for Claims | | | 13 | | | | 869 | | | | 996 | |
| Unearned Premiums and Fees | | | 10, 13 | | | | 6,511 | | | | 6,940 | |
| Deferred Income Tax Liabilities | | | 14 | | | | 33 | | | | - | |
| | | | | | | | 254,213 | | | | 278,196 | |
| Commitments and Contingent Liabilities | | | 26 | | | | | | | | | |
| EQUITY OF CANADA | | | | | | | | | | | | |
| Contributed Capital | | | | | | | 25 | | | | 25 | |
| Accumulated Other Comprehensive Income | | | | | | | 943 | | | | 1,038 | |
| Retained Earnings | | | | | | | 14,870 | | | | 12,781 | |
| | | | | | | | 15,838 | | | | 13,844 | |
| | | | | | | | 270,051 | | | | 292,040 | |
The accompanying notes to these Consolidated Financial Statements are an integral part of these statements.
These Consolidated Financial Statements were approved by the Board of Directors on 19 March 2014.
| | |
 | |  |
| Brian Johnston, CPA, CA | | Evan W. Siddall, BA, LL.B |
| Chairperson, Audit Committee | | President and Chief Executive Officer |
Consolidated Statement of Income and Comprehensive Income
Year Ended 31 December
| | | | | | | | | | | | |
| (in millions of Canadian dollars) | | Notes | | | 2013 | | | 2012 Restated Note 3 | |
| Parliamentary Appropriations for Housing Programs | | | 8 | | | | 2,071 | | | | 2,197 | |
| Premiums and Fees Earned | | | 10, 13 | | | | 2,001 | | | | 2,049 | |
| Interest Income | | | 17 | | | | | | | | | |
Loans | | | | | | | 7,111 | | | | 8,261 | |
Other | | | | | | | 60 | | | | 60 | |
| | | | | | | 7,171 | | | | 8,321 | |
| Interest Expense | | | 11, 17 | | | | 7,024 | | | | 8,208 | |
| Net Interest Income | | | | | | | 147 | | | | 113 | |
| Investment Income | | | 17 | | | | 606 | | | | 598 | |
| Net Realized Gains (Losses) | | | 17 | | | | 46 | | | | 135 | |
| Net Unrealized Gains (Losses) | | | 17 | | | | 112 | | | | 65 | |
| Other Income | | | | | | | 158 | | | | 132 | |
| TOTAL REVENUES | | | | | | | 5,141 | | | | 5,289 | |
| EXPENSES | | | | | | | | | | | | |
| Housing Programs | | | 8 | | | | 2,071 | | | | 2,197 | |
| Insurance Claims | | | 13 | | | | 309 | | | | 487 | |
| Operating Expenses | | | 27 | | | | 348 | | | | 337 | |
| | | | | | | | 2,728 | | | | 3,021 | |
| INCOME BEFORE INCOME TAXES | | | | | | | 2,413 | | | | 2,268 | |
| Income Taxes | | | 14 | | | | 584 | | | | 569 | |
| NET INCOME | | | | | | | 1,829 | | | | 1,699 | |
| OTHER COMPREHENSIVE INCOME (LOSS), NET OF TAX | | | | | | | | | | | | |
| Items that Will Be Subsequently Reclassified to Net Income: | | | | | | | | | | | | |
Net Unrealized Gains (Losses) from Available for Sale Financial Instruments | | | | | | | (1) | | | | 283 | |
Reclassification of Prior Years’ Net Unrealized (Gains) Losses Realized in the Period in Net Income | | | | | | | (94) | | | | (147) | |
| Total Items that Will Be Subsequently Reclassified to Net Income | | | | | | | (95) | | | | 136 | |
| Items that Will Not Be Subsequently Reclassified to Net Income: | | | | | | | | | | | | |
| | | |
Remeasurements of the Net Defined Benefit Plans | | | 22 | | | | 260 | | | | (81) | |
| | | | | | | | 165 | | | | 55 | |
| COMPREHENSIVE INCOME | | | | | | | 1,994 | | | | 1,754 | |
The accompanying notes to these Consolidated Financial Statements are an integral part of these statements.
| | |
| 98 C A N A D A M O R T G A G E A N D H O U S I N G C O R P O R A T I O N | | |
Consolidated Statement of Equity of Canada
Year Ended 31 December
| | | | | | | | | | | | |
| (in millions of Canadian dollars) | | Notes | | | 2013 | | | 2012 Restated Note 3 | |
| CONTRIBUTED CAPITAL | | | | | | | 25 | | | | 25 | |
| ACCUMULATED OTHER COMPREHENSIVE INCOME (LOSS) | | | | | | | | | | | | |
| Balance at Beginning of Year | | | | | | | 1,038 | | | | 902 | |
| Other Comprehensive Income (Loss) | | | | | | | (95) | | | | 136 | |
| Balance at End of Year | | | | | | | 943 | | | | 1,038 | |
| RETAINED EARNINGS | | | | | | | | | | | | |
| Balance at Beginning of Year | | | | | | | 12,781 | | | | 11,163 | |
| Net Income | | | | | | | 1,829 | | | | 1,699 | |
| Other Comprehensive Income (Loss) | | | | | | | 260 | | | | (81) | |
| Balance at End of Year | | | | | | | 14,870 | | | | 12,781 | |
| EQUITY OF CANADA | | | 15 | | | | 15,838 | | | | 13,844 | |
The accompanying notes to these Consolidated Financial Statements are an integral part of these statements.
Consolidated Statement of Cash Flows
Year Ended 31 December
| | | | | | | | | | | | |
| (in millions of Canadian dollars) | | Notes | | | 2013 | | | 2012 Restated Note 3 | |
| CASH FLOWS PROVIDED BY (USED IN) OPERATING ACTIVITIES | | | | | | | | | | | | |
| Net Income | | | | | | | 1,829 | | | | 1,699 | |
| Items Not Affecting Cash or Cash Equivalents: | | | | | | | | | | | | |
Amortization of Premiums and Discounts on Financial Instruments | | | | | | | 88 | | | | 71 | |
Deferred Income Taxes | | | | | | | 91 | | | | 20 | |
Change in Fair Value of Financial Instruments Carried at Fair Value | | | | | | | (112) | | | | (65) | |
Net (Gain) Loss on Financial Instruments | | | 17 | | | | (46) | | | | (135) | |
| Net Change in Non-cash Operating Assets and Liabilities: | | | | | | | | | | | | |
Accrued Interest Receivable | | | | | | | 100 | | | | 24 | |
Accounts Receivable and Other Assets | | | | | | | 173 | | | | (217) | |
Due from the Government of Canada | | | 8 | | | | (2) | | | | 94 | |
Accrued Interest Payable | | | | | | | (101) | | | | (107) | |
Accounts Payable and Other Liabilities | | | | | | | (441) | | | | 85 | |
Derivatives | | | | | | | (2) | | | | (9) | |
Provision for Claims | | | 13 | | | | (127) | | | | (45) | |
Unearned Premiums and Fees | | | | | | | (429) | | | | (319) | |
Other | | | | | | | 258 | | | | (158) | |
| Loans: | | | | | | | | | | | | |
Repayments | | | | | | | 60,865 | | | | 41,589 | |
Disbursements | | | | | | | (38,820) | | | | (40,104) | |
| Borrowings: | | | 11 | | | | | | | | | |
Repayments | | | | | | | (63,508) | | | | (43,820) | |
Issuances | | | | | | | 41,399 | | | | 42,534 | |
| | | | | | | | 1,215 | | | | 1,137 | |
| CASH FLOWS PROVIDED BY (USED IN) INVESTING ACTIVITIES | | | | | | | | | | | | |
| Investment Securities: | | | | | | | | | | | | |
Sales and Maturities | | | | | | | 11,141 | | | | 16,808 | |
Purchases | | | | | | | (11,969) | | | | (18,216) | |
| Change in Securities Purchased Under Resale Agreements | | | | | | | 63 | | | | (63) | |
| Change in Securities Sold Under Repurchase Agreements | | | | | | | (334) | | | | 153 | |
| | | | | | | | (1,099) | | | | (1,318) | |
| Increase (Decrease) in Cash and Cash Equivalents | | | | | | | 116 | | | | (181) | |
| Cash and Cash Equivalents | | | | | | | | | | | | |
| Beginning of Year | | | | | | | 1,220 | | | | 1,401 | |
| End of Year | | | | | | | 1,336 | | | | 1,220 | |
| Represented by | | | | | | | | | | | | |
| Cash | | | | | | | (1) | | | | (6) | |
| Cash Equivalents | | | | | | | 1,337 | | | | 1,226 | |
| | | | | | | | 1,336 | | | | 1,220 | |
| Supplementary Disclosure of Cash Flows from Operating Activities | | | | | | | | | | | | |
| Amount of Interest Received During the Year | | | | | | | 7,888 | | | | 9,016 | |
| Amount of Interest Paid During the Year | | | | | | | 7,253 | | | | 8,491 | |
| Amount of Dividends Received During the Year | | | | | | | 99 | | | | 96 | |
| Amount of Income Taxes Paid During the Year | | | | | | | 331 | | | | 698 | |
The accompanying notes to these Consolidated Financial Statements are an integral part of these statements.
| | |
| 100 C A N A D A M O R T G A G E A N D H O U S I N G C O R P O R A T I O N | | |
Notes to Consolidated Financial Statements
Year Ended 31 December 2013
The Corporation’s Consolidated Financial Statements include the accounts of Canada Mortgage and Housing Corporation (CMHC) and Canada Housing Trust (CHT), a special purpose entity. Within the Public Accounts of Canada, the annual Consolidated Net Income reduces the Government’s annual deficit; the Consolidated Retained Earnings and Accumulated Other Comprehensive Income reduce the Government’s accumulated deficit.
CMHC was established in Canada as a Crown Corporation in 1946 by the Canada Mortgage and Housing Corporation Act (the “CMHC Act”) to carry out the provisions of the National Housing Act (the “NHA”). It is also subject to Part X of the Financial Administration Act (the “FAA”) by virtue of being listed in Part 1 of Schedule III, is wholly owned by the Government of Canada, and is an agent Crown Corporation.
In September 2008, CMHC, together with a number of other Crown Corporations, was issued a directive (P.C. 2008-1598) pursuant to Section 89 of the FAA requiring due consideration by CMHC to the personal integrity of those to whom it lends or provides benefits. CMHC continues to meet the requirements of the directive.
CMHC’s mandate, as set out in the NHA, is to promote the construction of new houses, the repair and modernization of existing houses, and the improvement of housing and living conditions. In relation to financing for housing, the NHA’s purpose is to promote housing affordability and choice, to facilitate access to, and competition and efficiency in the provision of, housing finance, to protect the availability of adequate funding for housing, and generally to contribute to the well-being of the housing sector. In addition, CMHC has the following objects in carrying out any activities related to mortgage loan insurance and guarantee programs and in administering the Canadian covered bond legal framework: (a) to promote the efficient functioning and competitiveness of the housing finance market; (b) to promote and contribute to the stability of the financial system, including the housing market; and (c) to have due regard to the Corporation’s exposure to loss. The mandate is carried out through the following four activities:
Mortgage Loan Insurance: CMHC provides insurance against losses in the event of borrower default under NHA-insured mortgages. Revenues are earned from premiums, fees and investment income. Expenses consist of operating expenses and insurance claim losses. The Corporation’s Net Income is primarily derived from this activity.
Securitization: CMHC guarantees the timely payment of principal and interest for investors in securities backed by insured mortgages. Revenues are earned from guarantee fees, investment income and interest income on Insured Mortgage Purchase Program (IMPP) loans. Expenses consist primarily of interest expense on IMPP loans and operating expenses. Application fee revenue, as well as administration costs related to the new legal framework for covered bonds administered by CMHC, are also part of this segment.
Housing Programs: CMHC provides federal grants, contributions and subsidies to support programs and initiatives to address the housing needs of low-income Canadians. CMHC’s authority to spend public funds is provided by the Government of Canada through annual Parliamentary Appropriations, which are used to fund the Housing Programs Activity expenses.
Lending: CMHC makes loans and investments in housing programs that are funded by borrowings from the Government of Canada as well as capital markets borrowings issued prior to 2008. A significant number of these loans and investments support the Housing Programs Activity because they are provided at below market interest rates. The interest income earned on these loans is used to repay the interest expenses on the related borrowings.
CMHC consolidates the account of CHT, a separate legal entity. CHT was established in 2001 as a special-purpose trust, separate from CMHC. While CMHC controls the activities of CHT, its assets and liabilities are neither owned by nor held for the benefit of CMHC. CHT’s functions are limited to the acquisition of interests in eligible housing loans such as NHA Mortgage-Backed Securities (NHA MBS), the issuance of Canada Mortgage Bonds (CMB), as well as the purchase of highly rated investments and certain related financial hedging activities. The CMB are guaranteed by CMHC under its Securitization Activity. The beneficiaries of the Trust, after payment of all obligations, are one or more charitable organizations.
From this point forward, ‘‘CMHC’’ and ‘‘the Corporation’’ will be used interchangeably and will represent the Consolidated Entity.
| | |
2. SIGNIFICANT ACCOUNTING POLICIES | | |
These Consolidated Financial Statements have been prepared in accordance with International Financial Reporting Standards (IFRS) effective as at 31 December 2013 as issued by the International Accounting Standards Board.
FUNCTIONAL CURRENCY
These Consolidated Financial Statements are stated in millions of Canadian dollars, except where otherwise indicated, which is the functional currency.
The significant accounting policies used in the preparation of these Consolidated Financial Statements are summarized below:
BASIS OF PRESENTATION
These Consolidated Financial Statements include the accounts of CMHC and, as required by IFRS 10: Consolidated Financial Statements (IFRS 10), the accounts of CHT and Nordea International Equity Fund (Nordea), an equity fund included in the investment portfolio within the Mortgage Loan Insurance Activity.
Inter-entity balances and transactions have been eliminated in these Consolidated Financial Statements.
These Consolidated Financial Statements have been prepared on a going concern basis using a historical cost basis except for the following material items in the Consolidated Balance Sheet:
| n | | Fair Value through Profit or Loss (“FVTPL”) financial assets and liabilities are measured at fair value as are Available for Sale (“AFS”) financial assets; |
| n | | Investment Property is measured at fair value; and |
| n | | Defined benefit liabilities for post-employment benefit plans are recognized at the present value of the defined benefit obligations, offset by the fair value of plan assets. |
FAIR VALUE MEASUREMENT
The Corporation measures certain financial instruments and non-financial assets at fair value at each balance sheet date. Fair values of financial instruments measured at amortized cost are disclosed in Note 17.
Fair value is the price that would be received to sell an asset or paid to transfer a liability in an orderly transaction between market participants at the measurement date under current market conditions. The fair value of an asset or a liability is measured using the assumptions that market participants would use when pricing the asset or liability, assuming that market participants act in their economic best interest.
| | |
| 102 C A N A D A M O R T G A G E A N D H O U S I N G C O R P O R A T I O N | | |
The fair value measurement of non-financial assets (i.e.: Non-current Assets Held for Sale and Investment Property) takes into account a market participant’s ability to generate economic benefits by using the asset in its highest and best use or by selling it to another market participant that would use the asset in its highest and best use.
Fair values are estimated using the following fair value methods which maximize the use of relevant observable inputs and minimizes the use of unobservable inputs. The fair value measurement hierarchy reflects the observability of the most significant inputs used in making these measurements.
FAIR VALUE HIERARCHY:
Level 1: Assets and liabilities quoted in active markets that are measured based on the quoted price of an identical asset or liability.
Level 2: Assets and liabilities not quoted in active markets that are measured by discounting expected future cash flows, making maximum use of directly or indirectly observable market data such as yield curves and implied forward curves constructed from benchmark interest rates and credit spreads of identical or similar assets or liabilities.
Level 3: Assets and liabilities not quoted in active markets that are measured based on discounting expected future cash flows. Where possible, inputs are based on observable market data such as yield curves and implied forward curves constructed from benchmark interest rates and credit spreads of similar assets or liabilities. Where observable inputs are not available, unobservable inputs are used, mainly including assumptions related to liquidity and risk premiums.
For assets and liabilities that are recognized at fair value in the Consolidated Financial Statements on a recurring basis, the Corporation determines whether transfers have occurred between Levels in the hierarchy by re-assessing categorization at the end of each reporting period.
For the purpose of fair value disclosures, the Corporation has determined classes of assets and liabilities on the basis of the nature, characteristics and risks of the asset or liability and the level of the fair value hierarchy as explained above.
FINANCIAL INSTRUMENTS
The Corporation classifies its financial assets in the following categories: Financial Assets at Fair Value through Profit or Loss, Available for Sale, Loans and Receivables, and Held to Maturity. Two classifications are used for financial liabilities: Financial Liabilities at Fair Value through Profit or Loss and Other Financial Liabilities.
The Corporation further categorizes financial instruments at Fair Value through Profit or Loss as either Held for Trading or Designated at Fair Value through Profit or Loss.
The classification is determined by Management at initial recognition based on its intent and the characteristics of the financial instrument.
| | | | |
| Classification | | Accounting Treatment |
| |
Designated at Fair Value through Profit or Loss | | International Accounting Standards (IAS) 39 Financial Instruments: Recognition and Measurement provides an entity the option of classifying a financial instrument as Designated at Fair Value through Profit or Loss when doing so results in more relevant information because either: |
| | |
| | a) | | it eliminates or significantly reduces a measurement or recognition inconsistency that would otherwise arise from measuring the assets or liabilities or recognizing the gains or losses on them on different bases; or |
| | |
| | b) | | the financial instrument belongs to a group managed and evaluated on a fair value basis in accordance with documented risk management or investment strategies and information about the group is provided internally to Key Management Personnel. |
| |
| | This designation is irrevocable. |
| |
| | | Financial Instruments Designated at Fair Value through Profit or Loss are initially recognized at fair value. They are subsequently measured at fair value. Unrealized gains and losses arising from changes in fair value are recorded in Net Unrealized Gains (Losses). Gains and losses realized on disposition are recorded in Net Realized Gains (Losses). Transaction costs are expensed as incurred. |
| |
Held for Trading (HFT) | | HFT financial instruments are either derivatives or financial instruments acquired or incurred principally for the purpose of selling or repurchasing in the near term. |
| |
| | | HFT financial instruments are initially recognized at fair value. They are subsequently measured at fair value. Unrealized gains and losses arising from changes in fair value are recorded in Net Unrealized Gains (Losses). Gains and losses realized on disposition are recorded in Net Realized Gains (Losses). Transaction costs are expensed as incurred. |
| |
Available for Sale (AFS) | | AFS financial assets are non-derivative financial assets which are neither classified as HFT, HTM or Loans and Receivables nor Designated at Fair Value through Profit or Loss. AFS financial assets are initially recognized at fair value plus transaction costs. They are subsequently measured at fair value. Unrealized gains and losses arising from changes in fair value are recorded in Other Comprehensive Income (OCI) until the financial asset is sold, derecognized, or determined to be impaired at which time they are transferred to the Statement of Income and reported in Net Realized Gains (Losses). |
| |
| | | Accumulated Other Comprehensive Income (AOCI) consists only of unrealized gains and losses for AFS financial instruments. |
| |
Loans and Receivables | | Loans and Receivables are non-derivative financial assets with fixed or determinable payments that are not quoted in an active market except for those that Management has classified as Designated at Fair Value through Profit or Loss. Loans and Receivables are initially recognized at fair value plus transaction costs. They are subsequently measured at amortized cost using the effective interest method. When Loans and Receivables are determined to be impaired, the changes in their estimated realizable value are recorded in Net Income. |
| |
Held to Maturity (HTM) | | HTM financial assets are non-derivative financial assets with fixed or determinable payments and a fixed maturity, other than Loans and Receivables, that Management has the positive intention and ability to hold to maturity. |
| |
| | | HTM financial assets are initially recognized at fair value plus transaction costs. They are subsequently measured at amortized cost using the effective interest method. Gains and losses arising from changes in fair value on HTM financial assets that are determined to be impaired are recorded in Net Realized Gains (Losses) with interest income recorded until they are determined to be impaired. Impairment charges and reversals of impairment charges are recorded in Net Realized Gains (Losses). |
| |
Other Financial Liabilities | | Other Financial Liabilities are non-derivative financial liabilities which have not been Designated at Fair Value. |
| |
| | | Other Financial Liabilities are initially recognized at fair value plus transaction costs. They are subsequently measured at amortized cost using the effective interest method with interest expense recorded in Interest Expense. |
Settlement date accounting is used for purchases and sales of financial assets and financial liabilities. Realized gains and losses on sales are recognized on a weighted average cost basis.
| | |
| 104 C A N A D A M O R T G A G E A N D H O U S I N G C O R P O R A T I O N | | |
IMPAIRMENT OF FINANCIAL INSTRUMENTS
Management assesses at each Consolidated Balance Sheet date whether there is objective evidence that financial assets are impaired. A financial asset is considered impaired and impairment losses are incurred if, and only if, there is objective evidence of impairment as a result of one or more events that occurred after the initial recognition of the asset and that loss event(s) has an impact on the estimated future cash flows of the asset that can be reliably estimated.
As part of its assessment, Management performs a review for any objective evidence of impairment, which includes observable data indicating significant financial difficulty of the issuer, defaults or delinquencies in the payment of interest or principal, the disappearance of an active market for the financial asset because of the issuer’s financial difficulties, and bankruptcy or other financial reorganization of the issuer. Credit rating downgrades are considered in the Corporation’s assessment, although they alone might not represent objective evidence of impairment.
AFS Equity Investment Securities: For equity Investment Securities classified as AFS, objective evidence of impairment also includes if there has been a significant or prolonged decline in fair value below cost, or if significant adverse changes have taken place in the technological, market, economic or legal environment in which the issuer operates. In determining whether a decline in fair value below cost is significant or prolonged, the Corporation applies certain quantitative tests to its total position in each equity security supplemented with a qualitative assessment of the financial condition of the issuer.
For equity Investment Securities classified as AFS that are identified as impaired, the cumulative unrealized loss previously recorded in OCI is reclassified from OCI and recognized as an impairment loss in Net Income for the period through Net Realized Gains (Losses). Further declines in the fair value of impaired AFS equity instruments are recognized in Net Income, while increases in fair value are recorded in OCI.
AFS Debt Investment Securities: For debt Investment Securities classified as AFS that are identified as impaired, the cumulative unrealized loss previously recorded in OCI is reclassified from OCI and recognized as an impairment loss in Net Income for the period through Net Realized Gains (Losses). If the fair value of an impaired debt instrument classified as AFS subsequently increases and the increase can be related objectively to an event occurring after the impairment loss was recognized, the impairment loss is reversed in Net Income, with the reversal limited in amount to the previously recognized impairment loss. Otherwise, subsequent increases in fair value are recorded in OCI.
Loans and Receivables and HTM Financial Assets: For financial assets classified as Loans and Receivables or HTM that are identified as impaired, the carrying amount is reduced to the present value of estimated future cash flows (excluding future credit losses not yet incurred) discounted at the original effective interest rate, with the impairment loss being recorded in Net Income through Net Realized Gains (Losses). Previously recognized impairment losses can be reversed if the loss decreases and the decrease can be related objectively to an event occurring after the impairment was recognized. Impairment losses can be reversed to the extent that the carrying amount of the financial asset does not exceed what the amortized cost would have been had the impairment not occurred.
Allowance for Credit Losses: The Corporation establishes an allowance for credit losses for certain loans and receivables recorded in Accounts Receivable and Other Assets. This allowance provides for estimated amounts that may not be recovered. Factors that are considered in assessing the estimated realizable amount include, but are not limited to, underlying asset valuation, and any changes in market and economic outlook. The allowance for credit losses is included as a reduction to Accounts Receivable and Other Assets and any change in the allowance is included in Insurance Claims expense.
In certain circumstances, CMHC may modify a loan for economic or legal reasons related to a borrower’s financial difficulties. This could include circumstances where CMHC may take an assignment of the insured mortgage and pay the insured lender the loan balance, rather than proceed with the acquisition or could include CMHC making advances to a project in order to help it return to a state where the borrower can manage their mortgage obligations.
Once a loan is modified, if Management still does not expect full collection of payment under the modified terms, the loan is classified as impaired. An impaired loan is measured at its estimated realizable value determined by discounting the expected future cash flows at the loan’s original effective interest rate. For some loans, interest is accrued only to the extent that there is an expectation of receipt.
A loan is no longer considered impaired when all past due amounts, including interest, have been recovered and it is determined that the principal and interest are fully collectable in accordance with the original contractual terms of the loan or revised terms.
Loans are written off, either partially or in full against the related allowance for credit losses when CMHC judges that there is no realistic prospect of future recovery.
CASH AND CASH EQUIVALENTS
Cash and Cash Equivalents are comprised of cash and short-term highly liquid investments with a term to maturity of 98 days or less from the date of acquisition that are readily convertible to known amounts of cash and which are subject to an insignificant risk of change in value. Cash Equivalents funded by Securities Sold Under Repurchase Agreements are classified as HTM. Otherwise, Cash Equivalents in the Lending Activity are Designated at Fair Value and those in the Mortgage Loan Insurance and Securitization Activities are classified as AFS. Cash Equivalents must have a minimum credit rating of R-1 (Low) or equivalent as determined by S&P, Moody’s or DBRS at the time they are purchased. Interest income on these investments is recorded in Interest Income for the Lending Activity and in Investment Income for the Mortgage Loan Insurance and Securitization Activities.
SECURITIES PURCHASED UNDER RESALE AGREEMENTS AND SOLD UNDER
REPURCHASE AGREEMENTS
Securities Purchased Under Resale Agreements (Reverse Repurchase Agreements) consist of the purchase of securities, typically government treasury bills or bonds, with the commitment to resell the securities to the original seller at a specified price and future date in the near term. They are treated as collateralized transactions and are classified as Loans and Receivables.
Securities Sold Under Repurchase Agreements (Repurchase Agreements) consist of the sale of securities with the commitment to repurchase the securities from the original buyer at a specified price and future date in the near term. They are classified as Other Financial Liabilities. Proceeds received from these agreements are generally invested in Securities Purchased Under Resale Agreements or Cash Equivalents for the purpose of generating additional income. These transactions are entered into simultaneously with matching terms to maturity.
The associated interest earned and interest expenses are recorded in Net Interest Income for the Lending Activity and in Investment Income for the Mortgage Loan Insurance and Securitization Activities.
INVESTMENT SECURITIES
Investment Securities in the Lending Activity are comprised of fixed income securities and are Designated at Fair Value through Profit or Loss. Investment Securities in the Mortgage Loan Insurance Activity are comprised of fixed income and equity securities and are classified as AFS, HFT or Designated at Fair Value through Profit or Loss. The Securitization Activity holds fixed income Investment Securities classified as AFS or Designated at Fair value through Profit and Loss. Interest income on fixed income investments is recorded in Interest Income for the Lending Activity and in Investment Income for the Mortgage Loan Insurance and Securitization Activities using the effective interest method. Dividend income on equity investments is recorded in Investment Income when the right to the dividend is established.
| | |
| 106 C A N A D A M O R T G A G E A N D H O U S I N G C O R P O R A T I O N | | |
LOANS
Designated at Fair Value through Profit or Loss
Included in this category are economically hedged loans made under the Lending Activity in support of housing programs and initiatives. These loans form part of the lending hedging structure which uses derivatives to hedge refinancing, reinvestment and foreign exchange risk and to hedge mismatches in cash flows.
Interest earned is recognized in Interest Income using the effective interest method.
Loans and Receivables
IMPP and the CMB Program
These loans represent amounts due from Canadian financial institutions as a result of the sale of their beneficial interest in NHA MBS securities to CMHC. Loans arising from the IMPP have been funded by Borrowings from the Government of Canada. Loans arising from the CMB program are funded by the issuance of Canada Mortgage Bonds. Under this arrangement, substantially all of the risks and rewards of the NHA MBS are retained by the issuers through swap agreements with the Corporation.
The NHA MBS, and investments arising from the reinvestment of principal proceeds distributed by the NHA MBS serve as collateral to the loans and are not recognized on the Consolidated Balance Sheet. This collateral is however held in the name of the Corporation and represents the sole source of principal repayments for the loans. The amount due from the swap counterparties represents the interest earned on the loans and is recognized in Interest Income.
Lending
Included in this category are loans made under the Lending Activity which are not economically hedged. Payments on these loans are fixed and do not have a quoted market price in an active market. Where loans contain forgiveness clauses, they are recorded net of the forgiveness, and that forgiveness is reimbursed through parliamentary appropriations when the loans are advanced.
CMHC is reimbursed through parliamentary appropriations for interest rate losses resulting from loans containing interest rate clauses that are lower than the interest cost on the related borrowings. These loans were issued from 1946 to 1984 through provisions of the National Housing Act. CMHC assumes the continued receipt of appropriations going forward. If the appropriations are not received in a future year, the valuation of these loans would change.
Interest earned is recognized in Interest Income using the effective interest method.
DERIVATIVES
The Corporation enters into derivatives such as interest rate swaps, interest rate futures and equity index futures in order to manage its exposures to market risks. Derivatives are not used for speculative purposes.
Derivatives are classified as HFT as they have not been designated as eligible hedges for accounting purposes and are carried at fair value on the Consolidated Balance Sheet. Derivatives with a positive fair value are reported as assets, while derivatives with a negative fair value are reported as liabilities.
The Corporation does not have derivatives embedded in other financial instruments (host contracts) which require separation.
The net of interest income and expense is recorded in Interest Income as earned and incurred.
PARLIAMENTARY APPROPRIATIONS AND HOUSING PROGRAMS EXPENSES
CMHC receives Parliamentary Appropriations to fund housing programs and initiatives.
Parliamentary Appropriations
Parliamentary Appropriations are recognized as revenue in the fiscal year for which the appropriations were approved and over the same period as the related Housing Programs Expenses.
Housing Programs Expenses
Housing Programs expenses, including operating costs incurred to administer the Housing Programs, are recorded on an accrual basis not exceeding the maximum Parliamentary Appropriations voted by Parliament.
Those expenses incurred but not yet reimbursed are recorded in the Consolidated Balance Sheet as Due from the Government of Canada.
NON-CURRENT ASSETS HELD FOR SALE
Real estate acquired by the Mortgage Loan Insurance Activity through loan default is classified as Non-Current Assets Held for Sale when its carrying amount will be recovered principally through a sale transaction rather than through continuing use. The criteria for Held for Sale classification includes Management’s commitment to a plan to sell the selected assets and the expectation that such a sale will be completed within a 12 month period. Events or circumstances beyond the entity’s control may extend the period to complete the sale beyond one year. Such assets continue to be classified as Held for Sale as Management remains committed to its plan to sell the asset. Non-Current Assets Held for Sale are measured at the lower of their carrying amount and their fair value less cost to sell and are included in Accounts Receivables and Other Assets. Impairment losses and any subsequent reversals are recognized in Insurance Claims expense in the period in which they occur. Non-Current Assets Held for Sale are not depreciated.
INVESTMENT PROPERTY
Investment properties, which are included in Accounts Receivable and Other Assets, are properties held to earn rental income or for capital appreciation, or both. Investment properties are initially recognized at cost plus transaction costs. Subsequent to initial recognition, they are measured at fair value. Fair value is determined based on valuations performed by independent and internal property appraisers who hold recognized and relevant professional qualifications. Gains or losses arising from changes in fair value are recognized in Other Income in the period in which they arise. Investment property rental income and expenses are recorded in Other Income. For certain investment properties, expenses are recoverable from the Minister and these are recorded in Housing Programs appropriations.
BORROWINGS
Designated at Fair Value through Profit or Loss
Capital Market Borrowings
Borrowings from the Capital Markets represent borrowings incurred between 1993 and April 2008 to fund loans from the Lending Activity that are Designated at Fair Value through Profit or Loss and form part of the lending hedging structure.
Borrowings from the Government of Canada
Since April 2008, the Lending Activity has been borrowing under terms of the Crown Borrowing Agreement. These borrowings are incurred to fund Loans from the Lending Activity that are Designated at Fair Value through Profit or Loss and forms part of the lending hedging structure.
| | |
| 108 C A N A D A M O R T G A G E A N D H O U S I N G C O R P O R A T I O N | | |
Other Financial Liabilities
Canada Mortgage Bonds (CMB)
CMB, which are issued and guaranteed by the Corporation, are interest-bearing bullet bonds. Coupon interest payments are made semi-annually for fixed rate CMB and quarterly for floating rate CMB. Principal repayments on the bonds are made at the end of the term. CMB are classified as Other Financial Liabilities. The Approved MBS Sellers reimburse CHT for the cost of arranging financing, including the fees paid to CMHC as Guarantor and Financial Services Advisor, underwriters and others for the distribution of CMB. These reimbursements are recognized in Other Income on the same basis as the related expenses.
CMHC may purchase and resell CMB in the market for investment purposes. These purchases are treated as retirements of debt, with the difference between the purchase price and the carrying value of the CMB being recognized as a gain or loss in Net Realized Gains (Losses). Subsequent sales are treated as re-issuance of the debt, with gains and losses deferred and amortized over the remaining life of the CMB sold.
Borrowings from the Government of Canada
Other Government of Canada Borrowings represents borrowings incurred to fund loans from the Lending Activity that are not economically hedged and that have been classified as Loans and Receivable. These borrowings also include borrowings to fund the loans made under IMPP.
For all borrowings, interest expenses are recognized in Interest Expense using the effective interest method.
PENSION AND OTHER POST-EMPLOYMENT BENEFITS
CMHC has a number of benefit arrangements which provide pension and other post-employment benefits to eligible employees. These include a federally regulated pension plan (the Pension Plan), an unregistered supplemental pension plan (the Supplemental Plan) and other non-pension post-employment defined benefits consisting mainly of severance pay and life and medical insurance. The Supplemental Plan offers benefits in excess of statutory limits as defined under the Income Tax Act.
Both the Pension Plan and the Supplemental Plan have two components: a defined benefit component and a defined contribution component. Employees who joined the Corporation prior to 4 April 2013 are eligible for the defined benefit component of both the Pension and the Supplemental Plan. Employees who joined the Corporation on or after that date are eligible for the defined contribution component of the Pension and Supplemental Plans.
The Pension Plan is subject to the federal Pension Benefits Standards Act, 1985 (PBSA) and its regulations and to the Income Tax Act (ITA). The Pension Plan is registered with the Office of the Superintendent of Financial Institutions (OSFI) and the Canada Revenue Agency (CRA).
Defined Benefit Plans
The defined benefit plans include the defined benefit component of the Pension Plan and the Supplemental Plan as well as the other non-pension post-employment defined benefits. The benefits available under both the defined benefit component of the Pension Plan and the Supplemental Plan are based on length of service and average earnings over the best five-year period.
The net defined benefit liability recognized is the present value of the obligations under the defined benefit plans less the assets of those plans. The defined benefit plan assets are limited to the present value of any economic benefits available in the form of reductions in future contributions to these plans.
The liability for pension and other post-employment obligations is included in Accounts Payable and Other Liabilities.
Net benefit costs of the plans are the current service costs and the net of the interest cost on the defined benefit obligation and the interest income on the plan assets. They are included in Operating Expenses on the Consolidated Statement of Income and Comprehensive Income.
Remeasurements of the defined benefit plans include actuarial gains and losses and changes in the return on plan assets (excluding net interest) and are recognized in Other Comprehensive Income as incurred and then flow into Retained Earnings on the Consolidated Balance Sheet. As such, they are not reclassified to profit or loss in subsequent periods.
Defined Contribution Plans
The defined contribution plans include the defined contribution component of the Pension Plan and the Supplemental Plan. Employer contributions to the plans are recognized as an expense as employees render service in exchange for such contributions.
MORTGAGE LOAN INSURANCE
Product Classification: CMHC classifies its mortgage loan insurance as an insurance contract where the lender faces uncertainty with regard to potential borrower default on a mortgage and therefore pays a premium to transfer the risk to CMHC. If the borrower defaults, the claim is significantly larger than the actual premium. Such contracts remain insurance contracts until the underlying insured mortgages are fully repaid and are measured in accordance with IFRS 4 Insurance Contracts.
Premium Revenue: Mortgage loan insurance premiums are due at the inception of the mortgage being insured at which time they are deferred (unearned premiums) and recognized as income over the period covered by the insurance contract using factors determined by the Appointed Actuary. These factors reflect the long-term pattern for default risk of the underlying mortgages.
Unearned Premiums: Unearned Premiums represent the unamortized portion of the policy premiums at the Consolidated Balance Sheet date and therefore relate to claims that may occur from the Consolidated Balance Sheet date to the termination of the insurance policies. Management and the Appointed Actuary, on a quarterly and annual basis, respectively, compare the unearned premiums to an estimate of total future claims on a discounted basis to ensure the amount is sufficient. Should such amount not be sufficient, a provision for premium deficiency is recorded.
Provision for Claims: The Provision for Claims represents an estimate for expected claims and the related settlement expenses, net of the related expected property sale proceeds, for defaults from the mortgage insurance business that have occurred on or before the Consolidated Balance Sheet date. The provision takes into consideration the estimate of the expected ultimate cost of claims reported but not paid and claims Incurred But Not Reported (IBNR) at the Consolidated Balance Sheet date, the time value of money, and in accordance with accepted actuarial practice, includes an explicit provision for adverse deviation. The estimate of IBNR is generally subject to a greater degree of uncertainty than that for reported claims.
The process of determining the provision necessarily involves risks that the actual results will deviate, perhaps significantly, from the estimates made.
The change in the estimated Provision for Claims is recorded in Insurance Claims expense in the year in which they occur.
The Provision for Claims also includes a provision amount relating to insurance on loans made under various social housing programs as well as loans financed by Index Linked Mortgages (ILM) under the Federal Co-operative Housing Program. This provision is based on the assumptions that the cumulative premiums received and related investment income will be sufficient to meet future claim payouts. Due to the uniqueness of these programs, their provision is established as the fund balance plus a margin for adverse deviation.
| | |
| 110 C A N A D A M O R T G A G E A N D H O U S I N G C O R P O R A T I O N | | |
Insurance Policy Liability Adequacy: Liability adequacy tests are performed quarterly by Management and are also performed on an annual basis as part of the Actuarial Valuation to ensure the adequacy of insurance policy liabilities net of Deferred Acquisition Costs (DAC) assets with respect to the Provision for Claims and Unearned Premiums. Current best estimates of future contractual cash flows, claims handling and administration costs, and investment returns from the assets backing the liabilities are taken into account in the tests. Where a deficiency is highlighted by the test, DAC assets are written off first, and insurance liabilities are increased when the DAC assets are written off in full. Any premium deficiency is immediately recognized in Net Income. The liability adequacy test for the Corporation has identified that no provision for premium deficiency is required.
Fees: Application fees that are designed to recover part or all acquisition costs associated with issuing mortgage loan insurance policies are deferred and amortized on the same basis as the related premiums.
Deferred Acquisition Costs: A portion of acquisition costs relating to the Unearned Premiums is deferred and amortized over the estimated lives of the relevant contracts. The deferred acquisition costs are included in Accounts Receivable and Other Assets.
Net Estimated Borrower Recoveries: CMHC estimates the net borrower recoveries related to claims paid, based on historical data in accordance with Canadian accepted actuarial practice. Changes to the estimated borrower recovery balance are recorded in Insurance Claims expense in the year in which they are determined. Net Estimated Borrower Recoveries are included in Accounts Receivable and Other Assets.
TIMELY PAYMENT GUARANTEES
Classification: Financial guarantee contracts are defined as those that require the issuer to make specified payments to reimburse the holder for a loss it incurs because a specified debtor fails to make payment when due. CMHC classifies its timely payment guarantee for NHA MBS and CMB as a financial guarantee contract. Such contracts remain financial guarantee contracts until all rights and obligations are extinguished or expire and are presented in accordance with IAS 39 Financial Instruments: Recognition and Measurement.
Recognition and Measurement: Timely payment guarantee fees are initially recognized in Unearned Premiums and Fees at fair value (the premium received) plus transaction costs. Subsequently, they are measured at the amount initially recognized less the amortization of guarantee fee revenue. Should the estimated amount required to settle the timely payment guarantee obligations exceed this amount, a provision is recognized.
Application and Compensatory fees are recognized as revenues in the period where the related services are rendered. Direct costs associated with issuing timely payment guarantees are recognized in Operating Expenses as incurred.
INCOME TAXES
CMHC is a prescribed federal Crown Corporation under Reg. 7100 of the Income Tax Act (ITA) and is subject to federal income tax as a prescribed Corporation for purposes of subsection 27(2) of the ITA. It is not subject to provincial income tax. CHT is subject to federal and provincial income taxes on the amount of taxable income for the period and is permitted a deduction for all amounts paid or payable to CHT’s beneficiaries in determining income for tax purposes. As all taxable income was distributed to the beneficiaries, no provision for income taxes has been reflected for CHT in these Consolidated Financial Statements. Nordea is a mutual fund trust pursuant to subsection 132(6) of the ITA. Nordea is subject to income tax on Net Income and net realized capital gains that are not paid or payable to unitholders at the end of the taxation year. Nordea is required to distribute all net taxable income and sufficient realized capital gains to unitholders so that it is not subject to income tax. Accordingly, no provision for income taxes is included in the Consolidated Financial Statements in respect of Nordea.
The Corporation uses the liability method of accounting for income taxes. Under this method, Deferred Income Tax Assets and Liabilities are recognized based on the estimated tax effect of temporary differences between the carrying value of assets and liabilities on the financial statements and their respective tax bases. The Corporation uses substantively enacted income tax rates at the Consolidated Balance Sheet date that are expected to be in effect when the asset is realized or the liability is settled. The carrying amount of Deferred Income Tax Assets is reviewed at each reporting date and reduced to the extent that it is no longer probable that sufficient taxable profit will be available to allow all or part of the Deferred Income Tax Asset to be utilized.
RELATED PARTY TRANSACTIONS
Related party transactions are recorded according to IAS 24. Related party transactions are made on terms equivalent to those that prevail in arm’s length transactions.
CONTINGENT LIABILITIES
Contingent liabilities are possible obligations whose existence will be confirmed only by uncertain future events or present obligations where the transfer of economic benefit is uncertain or cannot be reliably measured. No contingent liabilities have been recognized, but disclosure is made in Note 26.
FOREIGN CURRENCY TRANSLATION
Monetary assets and liabilities denominated in foreign currencies are translated into Canadian dollars at exchange rates prevailing at the Consolidated Balance Sheet date. Exchange gains and losses resulting from the translation of foreign denominated balances are included in Net Unrealized Gains (Losses). Purchases and sales of foreign securities and the related income are translated into Canadian dollars at the exchange rates prevailing on the respective dates of the transactions.
| | |
3. CURRENT AND FUTURE ACCOUNTING CHANGES | | |
CURRENT ACCOUNTING CHANGES
The IASB issued certain pronouncements that are mandatory for periods beginning 1 January 2013.
The following new standards and amendments were adopted by the Corporation: IFRS 7 Financial Instruments: Disclosures, IFRS 10 Consolidated Financial Statements, IFRS 11 Joint Arrangements and IFRS 12 Disclosure of Interests in Other Entities.
The adoption of these standards and amendments had minimal disclosure impact on the Consolidated Financial Statements.
The Corporation also adopted the following amended standard and change in presentation of the Consolidated Financial Statements, which had an impact on amounts reported in the Consolidated Financial Statements, the presentation of these amounts, and the related disclosures.
IFRS 13 FAIR VALUE MEASUREMENT
IFRS 13 Fair Value Measurement defines fair value, sets out a framework for measuring fair value, and requires disclosures about fair value measurements. While IFRS 13 does not introduce any new requirements, it reduces complexity and improves consistency by clarifying the definition of fair value and requiring its application to all fair value measurements. Application of IFRS 13 has not materially impacted the fair value measurements of the Corporation. Additional disclosures were required and are provided in the individual notes. The fair value hierarchy is provided in Note 16.
IFRS 13 was applied prospectively to the Consolidated Financial Statements for the year ended 31 December 2013 in accordance with the transitional provisions of IFRS 13 Fair Value Measurement and IAS 8 Accounting Policies, Changes in Accounting Estimates and Errors.
| | |
| 112 C A N A D A M O R T G A G E A N D H O U S I N G C O R P O R A T I O N | | |
AMENDMENTS TO IAS 19 EMPLOYEE BENEFITS
IAS 19 Employee Benefits amendments alter the accounting for termination benefits and improve the recognition, presentation and disclosure for defined benefit plans. The most significant impact to the Corporation is that the amendments require interest income on plan assets to be calculated by applying the same discount rate used to measure the pension obligation. Under the previous requirements of IAS 19, the Corporation calculated interest income on plan assets using an expected rate of return. In addition, the amendments to IAS 19 eliminate the “corridor method”, require immediate recognition of past service costs, and incorporate enhanced disclosure requirements. As the Corporation applied the change from the corridor method upon adoption of IFRS, this component of the amendment did not affect the Consolidated Financial Statements.
The impact of adopting the amendments to IAS 19 on the previously reported Consolidated Financial Statements as at 1 January 2012 is summarized as follows:
CONDENSED CONSOLIDATED BALANCE SHEET
As at 1 January 2012
| | | | | | | | | | | | |
| (in millions) | | Previously
Reported | | | IAS 19
Adjustments | | �� | Restated
Balance | |
| Accounts Payable and Other Liabilities | | | 1,172 | | | | 1 | | | | 1,173 | |
| Retained Earnings | | | 11,164 | | | | (1) | | | | 11,163 | |
| Equity of Canada | | | 12,091 | | | | (1) | | | | 12,090 | |
The amendments to IAS 19 were applied retrospectively to the Consolidated Financial Statements for the year ended 31 December 2013 in accordance with the transitional provisions of IAS 19 Employee Benefits and IAS 8 Accounting Policies, Changes in Accounting Estimates and Errors. Impact on 31 December 2012 figures are presented in the following table.
CHANGE IN PRESENTATION OF THE CONSOLIDATED FINANCIAL STATEMENTS
The Corporation performed a general review of its Consolidated Financial Statements and made several changes which, in Management’s opinion, provide enhanced information about the Corporation’s operating activities. Presentation changes were made to the Consolidated Balance Sheet, Consolidated Statement of Income and Comprehensive Income, Consolidated Statement of Equity and Consolidated Statement of Cash Flows and were applied consistently to comparative figures to ensure comparability.
In accordance with IAS 1, the impacts of the adoption of IAS 19 and the change in presentation of the Consolidated Financial Statements as at 31 December 2012 and for the year ended 31 December 2012 is summarized in the following tables.
CONDENSED CONSOLIDATED BALANCE SHEET
As at 31 December 2012
| | | | | | | | | | | | | | | | | | | | | | | | | | | | |
| | | | | | Adjustments | | | | |
| (in millions) | | Previously Reported | | | Loans and Receivable1 | | | Investments in Housing Programs2 | | | Borrowings Other Financial Liabilities3 | | | Borrowings DFVTPL4 | | | IAS 19 Adjustments | | | Restated Balance | |
| Investment in NHA Mortgage-Backed-Securities – Loans and Receivables | | | 255,967 | | | | (255,967) | | | | - | | | | - | | | | - | | | | - | | | | - | |
| Loans: | | | | | | | | | | | | | | | | | | | | | | | | | | | | |
Other | | | 4,440 | | | | (4,440) | | | | - | | | | - | | | | - | | | | - | | | | - | |
Investments in Housing Programs | | | 748 | | | | - | | | | (748) | | | | - | | | | - | | | | - | | | | - | |
Loans and Receivables | | | - | | | | 260,407 | | | | 720 | | | | - | | | | - | | | | - | | | | 261,127 | |
| Accounts Receivable and Other Assets | | | 907 | | | | - | | | | 28 | | | | - | | | | - | | | | - | | | | 935 | |
| Assets – Line Items Not Restated | | | 29,978 | | | | - | | | | - | | | | - | | | | - | | | | - | | | | 29,978 | |
| TOTAL ASSETS | | | 292,040 | | | | - | | | | - | | | | - | | | | - | | | | - | | | | 292,040 | |
| Borrowings: | | | | | | | | | | | | | | | | | | | | | | | | | | | | |
Canada Mortgage Bonds | | | 201,676 | | | | - | | | | - | | | | (201,676) | | | | - | | | | - | | | | - | |
Capital Market Borrowings | | | 1,848 | | | | - | | | | - | | | | - | | | | (1,848) | | | | - | | | | - | |
Borrowings from the Government of Canada: | | | | | | | | | | | | | | | | | | | | | | | | | | | | |
Designated at Fair Value through Profit or Loss | | | 6,659 | | | | - | | | | - | | | | - | | | | (6,659) | | | | - | | | | - | |
Other | | | 57,595 | | | | - | | | | - | | | | (57,595) | | | | - | | | | - | | | | - | |
Designated at Fair Value through Profit or Loss | | | - | | | | - | | | | - | | | | - | | | | 8,507 | | | | - | | | | 8,507 | |
Other Financial Liabilities | | | - | | | | - | | | | - | | | | 259,271 | | | | - | | | | - | | | | 259,271 | |
| Accounts Payable and Other Liabilities | | | 1,257 | | | | - | | | | - | | | | - | | | | - | | | | 1 | | | | 1,258 | |
| Liabilities – Line Items Not Restated | | | 9,160 | | | | - | | | | - | | | | - | | | | - | | | | - | | | | 9,160 | |
| TOTAL LIABILITIES | | | 278,195 | | | | - | | | | - | | | | - | | | | - | | | | 1 | | | | 278,196 | |
| Retained Earnings | | | 12,782 | | | | - | | | | - | | | | - | | | | - | | | | (1) | | | | 12,781 | |
| Equity of Canada – Line Items Not Restated | | | 1,063 | | | | - | | | | - | | | | - | | | | - | | | | - | | | | 1,063 | |
| TOTAL EQUITY OF CANADA | | | 13,845 | | | | - | | | | - | | | | - | | | | - | | | | (1) | | | | 13,844 | |
| TOTAL LIABILITIES AND EQUITY OF CANADA | | | 292,040 | | | | - | | | | - | | | | - | | | | - | | | | - | | | | 292,040 | |
| 1 | Loans made under the IMPP and CMB program as well as loans made under the Lending Activity that are not Designated at Fair Value through Profit or Loss were reclassified to the Loans – Loans and Receivables line item; |
| 2 | The Consolidated Balance Sheet previously presented a financial line item called ‘‘Investments in Housing Programs’’ which included both Housing Programs loans classified as Loans and Receivables and Housing Programs investments which were treated as Property, Plant and Equipment. For consistency purposes, under the new presentation structure, the loans from the Investments in Housing Programs were re-classified to ‘‘Loans – Loans and Receivable’’ while the investments were moved to ‘‘Accounts Receivable and Other Assets’’, where items of similar nature are currently being presented; |
| 3 | The financial line items Canada Mortgage Bonds and Borrowings from the Government of Canada – Other were reclassified to Borrowings – Other Financial Liabilities; and |
| 4 | The financial line items Capital Market Borrowings and Borrowings from the Government of Canada – Designated at Fair Value through Profit or Loss were reclassified to Borrowings – Designated at Fair Value through Profit or Loss. |
| | |
| 114 C A N A D A M O R T G A G E A N D H O U S I N G C O R P O R A T I O N | | |
CONDENSED CONSOLIDATED STATEMENT OF INCOME AND COMPREHENSIVE INCOME
Year ended 31 December 2012
| | | | | | | | | | | | | | | | | | | | | | | | | | | | | | | | |
| | | | | | Adjustments | | | | |
| (in millions) | | Previously Reported | | | Housing Programs1 | | | Interest Income on Loans2 | | | Investment Income3 | | | Interest Expense4 | | | GoC Fees5 | | | IAS 19 Adjustments | | | Restated Balance | |
| Parliamentary Appropriations for: | | | | | | | | | | | | | | | | | | | | | | | | | | | | | | | | |
Housing Programs | | | 2,074 | | | | 123 | | | | - | | | | - | | | | - | | | | - | | | | - | | | | 2,197 | |
Operating Expenses | | | 123 | | | | (123) | | | | - | | | | - | | | | - | | | | - | | | | - | | | | - | |
| Interest Income from NHA Mortgage-Backed-Securities – Loans and Receivables | | | 7,681 | | | | - | | | | (7,681) | | | | - | | | | - | | | | - | | | | - | | | | - | |
| Interest Earned on Loans | | | 580 | | | | - | | | | (580) | | | | - | | | | - | | | | - | | | | - | | | | - | |
| Income from Investment Securities | | | 628 | | | | - | | | | - | | | | (628) | | | | - | | | | - | | | | - | | | | - | |
| Interest Income | | | | | | | | | | | | | | | | | | | | | | | | | | | | | | | | |
Loans | | | - | | | | - | | | | 8,261 | | | | - | | | | - | | | | - | | | | - | | | | 8,261 | |
Other | | | - | | | | - | | | | - | | | | 30 | | | | 30 | | | | - | | | | - | | | | 60 | |
| Interest Expense | | | - | | | | - | | | | - | | | | - | | | | 8,208 | | | | - | | | | - | | | | 8,208 | |
| Net Interest Income | | | - | | | | - | | | | 8,261 | | | | 30 | | | | (8,178) | | | | - | | | | - | | | | 113 | |
| Investment Income | | | - | | | | - | | | | - | | | | 598 | | | | - | | | | - | | | | - | | | | 598 | |
| Other Income | | | 120 | | | | - | | | | - | | | | - | | | | - | | | | 12 | | | | - | | | | 132 | |
| Revenues – Line Items Not Restated | | | 2,249 | | | | - | | | | - | | | | - | | | | - | | | | - | | | | - | | | | 2,249 | |
| TOTAL REVENUES | | | 13,455 | | | | - | | | | - | | | | - | | | | (8,178) | | | | 12 | | | | - | | | | 5,289 | |
| Interest Expense | | | 8,178 | | | | - | | | | - | | | | - | | | | (8,178) | | | | - | | | | - | | | | - | |
| Housing Programs | | | 2,074 | | | | 123 | | | | - | | | | - | | | | - | | | | - | | | | - | | | | 2,197 | |
| Operating Expenses | | | 427 | | | | (123) | | | | - | | | | - | | | | - | | | | 12 | | | | 21 | | | | 337 | |
| Expenses – Line Items Not Restated | | | 487 | | | | - | | | | - | | | | - | | | | - | | | | - | | | | - | | | | 487 | |
| TOTAL EXPENSES | | | 11,166 | | | | - | | | | - | | | | - | | | | (8,178) | | | | 12 | | | | 21 | | | | 3,021 | |
| Income Taxes | | | 573 | | | | - | | | | - | | | | - | | | | - | | | | - | | | | (4) | | | | 569 | |
| NET INCOME | | | 1,716 | | | | - | | | | - | | | | - | | | | - | | | | - | | | | (17) | | | | 1,699 | |
| Remeasurements of the Net Defined Benefit Plans (net of taxes) | | | (98) | | | | - | | | | - | | | | - | | | | - | | | | - | | | | 17 | | | | (81) | |
| OCI – Line Items Not Restated | | | 136 | | | | - | | | | - | | | | - | | | | - | | | | - | | | | - | | | | 136 | |
| OTHER COMPREHENSIVE INCOME (NET OF TAXES) | | | 38 | | | | - | | | | - | | | | - | | | | - | | | | - | | | | 17 | | | | 55 | |
| COMPREHENSIVE INCOME | | | 1,754 | | | | - | | | | - | | | | - | | | | - | | | | - | | | | - | | | | 1,754 | |
| 1 | Operating Expenses incurred by CMHC to support and administer the Housing Programs were reclassified from Operating Expenses to Housing Programs (in both Revenues and Expenses); |
| 2 | Interest Income from NHA Mortgage-Backed-Securities – Loans and Receivables and Interest Earned on Loans were reclassified to Interest Income – Loans; |
| 3 | Income from Investment Securities was reclassified to Interest Income for the Lending Activity and to Investment Income for the Mortgage Loan Insurance and Securitization Activities; |
| 4 | Interest Expense was reclassified from Expenses to Revenues and is now included in Net Interest Income. In addition, interest income on Derivatives was reclassified from Interest Expense to Interest Income – Other; and |
| 5 | Government of Canada fees expenses were reclassified from Other Income to Operating Expenses. |
CONDENSED CONSOLIDATED STATEMENT OF EQUITY OF CANADA
The Consolidated Statement of Equity of Canada has been restated for the adoption of IAS 19 and has also been condensed to only show the line items disclosed on the Consolidated Balances Sheet. Detail of Equity can be found in Note 15.
Year ended 31 December 2012
| | | | | | | | | | | | |
| (in millions) | | Previously Reported | | | Adjustments | | | Restated Balance | |
| Balance at Beginning of Year 2012 | | | 12,091 | | | | (1) | | | | 12,090 | |
| Net Income | | | 1,716 | | | | (17) | | | | 1,699 | |
| Other Comprehensive Income (Loss) | | | 38 | | | | 17 | | | | 55 | |
| Balance at End of Year 2012 | | | 13,845 | | | | (1) | | | | 13,844 | |
CONDENSED CONSOLIDATED STATEMENT OF CASH FLOWS
To improve presentation of the Corporation’s operating activities, the Securities Sold Under Repurchase Agreements were re-classified from the Financing activities to the Investing activities. This change was made since the Corporation normally engages in these transactions as part of its daily investing activities within the Mortgage Loan Insurance and Lending Activities.
Presentation of the Consolidated Statement of Cash Flows also changed as a result of the adoption of IAS 19 and the improvements made to the Consolidated Balance Sheet. Impacts of these changes are as follows:
Year ended 31 December 2012
| | | | | | | | | | | | |
| (in millions) | | Previously Reported | | | Adjustments | | | Restated Balance | |
| CASH FLOWS PROVIDED BY (USED IN) OPERATING ACTIVITIES | | | | | | | | | | | | |
| Net Income | | | 1,716 | | | | (17) | | | | 1,699 | |
| Net Change in Non-cash Operating Assets and Liabilities: | | | | | | | | | | | | |
Accounts Receivable and Other Assets | | | (221) | | | | 4 | | | | (217) | |
Other | | | (175) | | | | 17 | | | | (158) | |
| Net Change from Loans and Investment in Housing Programs | | | 779 | | | | (779) | | | | - | |
| Net Change in NHA MBS Loans and Receivables | | | 710 | | | | (710) | | | | - | |
| Loans: | | | | | | | | | | | | |
Repayments | | | - | | | | 41,589 | | | | 41,589 | |
Disbursements | | | - | | | | (40,104) | | | | (40,104) | |
| Operating Activities – Line Items Not Restated | | | (1,672) | | | | - | | | | (1,672) | |
| CASH FLOWS PROVIDED BY (USED IN) OPERATING ACTIVITIES | | | 1,137 | | | | - | | | | 1,137 | |
| CASH FLOWS PROVIDED BY (USED IN) INVESTING ACTIVITIES | | | | | | | | | | | | |
| Change in Securities Sold Under Repurchase Agreements | | | - | | | | 153 | | | | 153 | |
| Investing Activities – Line Items Not Restated | | | (1,471) | | | | - | | | | (1,471) | |
| CASH FLOWS PROVIDED BY (USED IN) INVESTING ACTIVITIES | | | (1,471) | | | | 153 | | | | (1,318) | |
| CASH FLOWS PROVIDED BY (USED IN) FINANCING ACTIVITIES | | | | | | | | | | | | |
| Change in Securities Sold Under Repurchase Agreements | | | 153 | | | | (153) | | | | - | |
| CASH FLOWS PROVIDED BY (USED IN) FINANCING ACTIVITIES | | | 153 | | | | (153) | | | | - | |
| Decrease in Cash and Cash Equivalents | | | (181) | | | | - | | | | (181) | |
| | |
| 116 C A N A D A M O R T G A G E A N D H O U S I N G C O R P O R A T I O N | | |
FUTURE ACCOUNTING CHANGES
CMHC has identified new standards and amendments to existing standards that have been issued by the IASB but are not yet effective on the date of issuance of these Consolidated Financial Statements.
Effective Date of 1 January 2014
On 16 December 2011, the IASB issued amendments to IAS 32 Financial Instruments: Presentation to clarify the application of offsetting requirements for financial assets and financial liabilities. Earlier application is permitted. These amendments will have no material impact on the Consolidated Financial Statements.
Effective Date of 1 July 2014
On 21 November 2013, the IASB published narrow scope amendments to IAS 19 Employee Benefits entitled Defined Benefit Plans: Employee Contributions. The narrow scope amendments apply to contributions from employees or third parties to defined benefit plans. The objective of the amendments is to simplify the accounting for contributions that are independent of the number of years of employee service, for example, employee contributions that are calculated according to a fixed percentage of salary. The Corporation has not yet determined the impact of this new standard on its Consolidated Financial Statements.
Effective Date to be Determined
On 12 November 2009, the IASB issued IFRS 9 Financial Instruments with further revisions on 28 October 2010. This forms part of the first phase of the IASB’s three phase project to replace IAS 39 Financial Instruments: Recognition and Measurement. The first phase of this project addresses classification and measurement requirements for financial assets and financial liabilities. IFRS 9 uses a single approach to determine whether a financial instrument is measured at amortized cost or fair value, based on how an entity manages its financial instruments in the context of its business model and the contractual cash flow characteristics of the financial instrument. The second phase of this project is currently under development, and addresses impairment. On 19 November 2013, the IASB announced the completion of the third phase of this project, which addresses hedge accounting. In July 2013, the IASB decided to delay the mandatory effective date of IFRS 9 and noted that it will only be able to determine the mandatory effective date after re-deliberations on the impairment and classification and measurement requirements have been completed and the issue date of the final version of IFRS 9 Financial Instruments is known. However, to assist entities in their planning, the IASB tentatively decided that the mandatory effective date of IFRS 9 Financial Instruments will be no earlier than annual periods beginning on or after 1 January 2017. CMHC anticipates that the requirements of IFRS 9 may be further amended before the new standard becomes effective. As such, the Corporation has not yet determined the impact of this new standard on its Consolidated Financial Statements.
| | |
4. CRITICAL JUDGMENTS IN APPLYING ACCOUNTING POLICIES
AND MAKING ESTIMATES | | |
JUDGMENTS IN APPLYING ACCOUNTING POLICIES
In the process of applying the accounting policies, Management is required to make various judgments, apart from those involving estimations, that can significantly affect the amounts recognized in the Consolidated Financial Statements. The judgments having the most significant effect on the amounts recognized in the Consolidated Financial Statements are:
| n | | Consolidation – significant judgments are applied in the assessment of whether the substance of the relationship between CMHC and CHT indicates that, as per IFRS 10, CMHC controls CHT. CMHC guarantees the timely payment of principal and interest on the Canada Mortgage Bonds, and chooses when to provide that guarantee. CHT cannot undertake new business (i.e. issue new bonds) without the benefit of a guarantee, and its only available guarantor at present is CMHC. Within that context, CMHC has direct influence on the activities of CHT and can use this influence to manage its exposure to CHT; |
| n | | Consolidation – significant judgments are also applied in the assessment of whether the substance of the relationship between CMHC and Nordea indicates that CMHC controls it. As CMHC is the principal investor in the fund, Nordea is reliant on CMHC’s continued investment and CMHC, in effect, has the power to govern Nordea’s policies so as to obtain benefits from its activities. As a result, CMHC consolidates Nordea International Equity fund; |
| n | | Derecognition – in assessing whether transfers of NHA MBS from Issuers to the Corporation under the CMB program (CHT) and IMPP (CMHC) qualify for derecognition, significant judgment is applied in determining whether substantially all the risks and rewards of ownership of the NHA MBS have been transferred. Per IAS 39 Financial Instruments – Recognition and Measurement requirements, CMHC has determined that the sellers of NHA MBS to the Corporation failed the derecognition criteria as they retain the risk and rewards of the NHA MBS through swap agreements. As a result, the Corporation does not recognize the underlying NHA MBS on the Consolidated Balance Sheet but rather accounts for the transfer as a loan; and |
| n | | Impairment of Available for Sale Financial Instruments – significant judgment is applied in assessing if there is objective evidence of impairment, including whether declines in the fair value of AFS equity instruments below cost are significant and/or prolonged. |
USE OF ESTIMATES AND ASSUMPTIONS
The preparation of these Consolidated Financial Statements requires Management to make estimates and assumptions. These estimates and assumptions affect the reported amounts of assets, liabilities, comprehensive income and related disclosures. Key areas where Management has made estimates and assumptions include those related to Provision for Claims, Unearned Premiums, Fair Value of Financial Instruments, and Pension and Other Post-employment Benefits. Actual results could differ from these estimates and assumptions. Where these differ, the impact will be recorded in future periods.
Provision for Claims
The Provision for Claims represents an estimate for expected claims and the related settlement expenses, net of the related expected property sale proceeds, for defaults from the mortgage loan insurance business that have occurred on or before the Consolidated Balance Sheet date. In calculating the estimated liability, an estimate of losses on defaults that have been incurred but not reported is made using historical experience and the time value of money, which considers prevailing legal, economic, social and regulatory trends. See Note 13 for further details.
Unearned Premiums
Mortgage loan insurance premiums are deferred and recognized as revenue over the period covered by the insurance contracts using actuarially determined factors that are reviewed quarterly by Management and annually as part of the Actuarial Valuation. The premium earning factors are derived from claim occurrence patterns based on the principle that premiums will be earned at the same rate as claims are incurred. See Note 13 for further details.
Financial Instruments
Financial instruments carried at fair value are measured based on quoted market prices observable in the market or amounts derived from cash flow models or other valuation methodologies. The fair value measurement hierarchy described in Note 2 reflects the significance of the inputs used in making these measurements.
Pension and Other Post-employment Benefits
The annual cost of pension and other post-employment benefits earned by employees is actuarially determined using the projected unit credit method prorated on service and Management’s best estimate of compensation increases, retirement ages of employees, mortality of members and expected health care costs. These assumptions are of a long-term nature, which is consistent with the nature of post-employment benefits. See Note 22 for further details.
| | |
| 118 C A N A D A M O R T G A G E A N D H O U S I N G C O R P O R A T I O N | | |
The following table shows the maturity structure and average yield for Investment Securities.
| | | | | | | | | | | | | | | | | | | | | | | | | | |
| | | | | Remaining Term to Maturity | | | | | | | |
| (in millions) | | | | Within 1 Year | | | 1 to 3 Years | | | 3 to 5 Years | | | Over 5 Years | | | 2013 | | | 2012 | |
| Designated at Fair Value through Profit or Loss | | | | | | | | | | | | | | | | | | | | | | | | | | |
Fixed Income | | | | | | | | | | | | | | | | | | | | | | | | | | |
Corporate/Other Entities | | | | | 35 | | | | 238 | | | | - | | | | - | | | | 273 | | | | 263 | |
Provinces/Municipalities | | | | | 82 | | | | 449 | | | | 108 | | | | - | | | | 639 | | | | 615 | |
Sovereign and Related Entities | | | | | - | | | | 50 | | | | 50 | | | | - | | | | 100 | | | | 50 | |
| Total Designated at Fair Value through Profit or Loss | | | | | 117 | | | | 737 | | | | 158 | | | | - | | | | 1,012 | | | | 928 | |
| Yield1 | | | | | 2.4% | | | | 2.2% | | | | 2.1% | | | | - | | | | 2.2% | | | | 2.2% | |
| Available for Sale | | | | | | | | | | | | | | | | | | | | | | | | | | |
Fixed Income | | | | | | | | | | | | | | | | | | | | | | | | | | |
Corporate/Other Entities | | | | | 24 | | | | 1,227 | | | | 1,453 | | | | 2,683 | | | | 5,387 | | | | 4,981 | |
Government of Canada | | | | | 133 | | | | 1,907 | | | | 767 | | | | 1,950 | | | | 4,757 | | | | 5,240 | |
Provinces/Municipalities | | | | | 35 | | | | 354 | | | | 577 | | | | 4,931 | | | | 5,897 | | | | 5,571 | |
Sovereign and Related Entities | | | | | - | | | | - | | | | 10 | | | | 66 | | | | 76 | | | | 138 | |
Total Fixed Income | | | | | 192 | | | | 3,488 | | | | 2,807 | | | | 9,630 | | | | 16,117 | | | | 15,930 | |
Yield1 | | | | | 0.7% | | | | 2.2% | | | | 3.0% | | | | 3.7% | | | | 3.2% | | | | 3.1% | |
Equities | | | | | | | | | | | | | | | | | | | | | | | | | | |
Canadian | | | | | | | | | | | | | | | | | | | | | 2,214 | | | | 2,108 | |
U.S. | | | | | | | | | | | | | | | | | | | | | 888 | | | | 843 | |
Foreign | | | | | | | | | | | | | | | | | | | | | 440 | | | | 423 | |
Total Equities | | | | | | | | | | | | | | | | | | | | | 3,542 | | | | 3,374 | |
Yield2 | | | | | | | | | | | | | | | | | | | | | 3.5% | | | | 3.0% | |
| Total Available for Sale | | | | | | | | | | | | | | | | | | | | | 19,659 | | | | 19,304 | |
| Held for Trading | | | | | | | | | | | | | | | | | | | | | | | | | | |
Foreign Equities | | | | | | | | | | | | | | | | | | | | | 444 | | | | 415 | |
| Total Held for Trading | | | | | | | | | | | | | | | | | | | | | 444 | | | | 415 | |
Yield2 | | | | | | | | | | | | | | | | | | | | | 1.9% | | | | 2.1% | |
1 Represents the weighted-average yield, determined as the weighted-average of the effective yields of individual securities. 2 Represents the average yield, determined by dividing dividend income by average cost. The following table shows the unrealized gains (losses) on Investment Securities recorded at fair value. | |
| | | | | 2013 | | | 2012 | |
| (in millions) | | | | Amortized Cost1 | | | Gross Unrealized Gains | | | Gross Unrealized Losses | | | Fair Value | | | Amortized Cost1 | | | Fair Value | |
| Investment Securities: | | | | | | | | | | | | | | | | | | | | | | | | | | |
Fixed Income | | | | | | | | | | | | | | | | | | | | | | | | | | |
Designated at Fair Value through Profit or Loss | | | | | 947 | | | | 66 | | | | (1) | | | | 1,012 | | | | 872 | | | | 928 | |
Available for Sale | | | | | 15,862 | | | | 484 | | | | (229) | | | | 16,117 | | | | 14,969 | | | | 15,930 | |
Equities | | | | | | | | | | | | | | | | | | | | | | | | | | |
Available for Sale | | | | | 2,508 | | | | 1,039 | | | | (5) | | | | 3,542 | | | | 2,930 | | | | 3,374 | |
Held for Trading | | | | | 388 | | | | 56 | | | | - | | | | 444 | | | | 444 | | | | 415 | |
| 1 | Amortized cost for Equities is acquisition cost less impairment losses, if any. |
The Corporation has Investment Securities of $91 million (2012 – $425 million) that are part of Securities Sold Under Repurchase Agreements. The terms of these transactions do not exceed 93 days, the credit rating of the instruments must be at a minimum of R-1 (mid) and they must be issued by a financial institution. The Corporation continues to earn Investment Income and recognizes in OCI changes in fair values on these Investment Securities during the year.
The cumulative unrealized loss from Available for Sale fixed income and equity investments of $234 million (2012 – $34 million) has been recorded in Accumulated Other Comprehensive Income and has not been recognized as an impairment loss in Net Income.
During 2013, $81 million (2012 – $97 million) of impairment losses on equities was recognized in Net Income through Net Realized Gains (Losses) and no reversals of previously realized fixed income investment security impairments occurred during the year.
LEVEL 3 INVESTMENT SECURITIES
The following table presents the change in the fair value measurement of Level 3 Investment Securities, as defined in Note 2.
| | | | | | | | | | | | | | | | | | | | | | | | | | | | | | |
| | | | | 2013 | |
| | | | | | | | |
| (in millions) | | | | Balance at Beginning of Year | | | Purchases | | | Transfers In (Out) | | | Unrealized Gains in Net Income1 | | | Unrealized Gains in OCI2 | | | Cash Receipts on Settlements | | | Balance at End of Year | |
| Designated at Fair Value through Profit or Loss | | | | | | | | | | | | | | | | | | | | | | | | | | | | | | |
| Asset-Backed Securities | | | | | 137 | | | | - | | | | - | | | | 13 | | | | - | | | | - | | | | 150 | |
| Available for Sale | | | | | | | | | | | | | | | | | | | | | | | | | | | | | | |
| Limited Partnership Investment | | | | | 14 | | | | 2 | | | | - | | | | - | | | | 1 | | | | - | | | | 17 | |
| Total | | | | | 151 | | | | 2 | | | | - | | | | 13 | | | | 1 | | | | - | | | | 167 | |
| 1 | Included in Net Unrealized Gains (Losses). |
| 2 | Included in Net Unrealized Gains (Losses) from Available for Sale Financial Instruments. |
| | | | | | | | | | | | | | | | | | | | | | | | | | | | | | |
| | | | | 2012 | |
| | | | | | | | |
| (in millions) | | | | Balance at Beginning of Year | | | Purchases | | | Transfers In (Out) | | | Unrealized Gains in Net Income1 | | | Unrealized Gains in OCI2 | | | Cash Receipts on Settlements | | | Balance at End of Year | |
| Designated at Fair Value through Profit or Loss | | | | | | | | | | | | | | | | | | | | | | | | | | | | | | |
| Asset-Backed Securities | | | | | 119 | | | | - | | | | - | | | | 19 | | | | - | | | | (1) | | | | 137 | |
| Available for Sale | | | | | | | | | | | | | | | | | | | | | | | | | | | | | | |
| Limited Partnership Investment | | | | | 8 | | | | 5 | | | | - | | | | - | | | | 1 | | | | - | | | | 14 | |
| Total | | | | | 127 | | | | 5 | | | | - | | | | 19 | | | | 1 | | | | (1) | | | | 151 | |
| 1 | Included in Net Unrealized Gains (Losses). |
| 2 | Included in Net Unrealized Gains (Losses) from Available for Sale Financial Instruments. |
| | |
| 120 C A N A D A M O R T G A G E A N D H O U S I N G C O R P O R A T I O N | | |
SENSITIVITY ANALYSIS
The valuation of Level 3 Investment Securities is determined by the Risk Management Division (RMD). The RMD is independent of the investment functions and reports directly to the President and CEO through the Chief Risk Officer. RMD develops the models and methodologies to determine fair value which are reviewed and monitored on an ongoing basis. The validity of Level 3 valuations is verified against market transactions involving identical or similar instruments on an ongoing basis.
The valuation for Level 3 Investment Securities includes unobservable inputs which may significantly affect the measurement of fair value. The valuation was based on its assessment of the prevailing conditions at 31 December 2013, which may change materially in subsequent periods.
The fair value of Asset-Backed Securities is determined by discounting expected future cash flows using market observable discount rates and an unobservable risk premium which take into account the lack of market liquidity and inherent risk of the securities. Significant increases (decreases) in these premiums would result in a significant decrease (increase) in the fair value measurement.
The following tables present the significant unobservable inputs used in the valuation of Level 3 Asset-Backed Securities at period end and the impact to Income before Income taxes of a 100bps shock to the risk premium.
| | | | | | | | | | | | | | | | | | | | | | | | |
| | | 2013 | |
| | | Valuation | | | Unobservable | | | Fair | | | Weighted Average Risk | | | Impact on Income
before Income Taxes | |
| (in millions) | | Technique | | | Input | | | Value | | | Premium | | | +100 bps | | | -100 bps | |
Designated at Fair Value
through Profit or Loss | | | Discounted | | | | Risk | | | | | | | | | | | | | | | | | |
Asset-Backed Securities | | | Cash Flow | | | | Premium | | | | 150 | | | | 2.1% | | | | (4) | | | | 4 | |
| |
| | | 2012 | |
| | | Valuation | | | Unobservable | | | Fair | | | Weighted Average Risk | | | Impact on Income
before Income Taxes | |
| (in millions) | | Technique | | | Input | | | Value | | | Premium | | | +100 bps | | | -100 bps | |
Designated at Fair Value
through Profit or Loss | | | Discounted | | | | Risk | | | | | | | | | | | | | | | | | |
Asset-Backed Securities | | | Cash Flow | | | | Premium | | | | 137 | | | | 3.1% | | | | (5) | | | | 5 | |
The following table presents the contractual maturity profile of loans based on carrying value.
| | | | | | | | | | | | | | | | | | | | | | | | | | | | | | | | | | |
| (in millions) | | | | 2014 | | | 2015 | | | 2016 | | | 2017 | | | 2018 | | | 2019 and
Thereafter | | | Total 2013 | | | Total 2012 | |
| Designated at Fair Value through Profit or Loss | | | | | | | | | | | | | | | | | | | | | | | | | | | | | | | | | | |
| Lending | | | | | 715 | | | | 1,173 | | | | 1,185 | | | | 1,021 | | | | 913 | | | | 1,034 | | | | 6,041 | | | | 6,591 | |
| Total Designated at Fair Value through Profit or Loss | | | | | 715 | | | | 1,173 | | | | 1,185 | | | | 1,021 | | | | 913 | | | | 1,034 | | | | 6,041 | | | | 6,591 | |
| Yield | | | | | 2.7% | | | | 3.3% | | | | 2.8% | | | | 2.2% | | | | 2.4% | | | | 2.8% | | | | 2.7% | | | | 3.0% | |
| Loans and Receivables | | | | | | | | | | | | | | | | | | | | | | | | | | | | | | | | | | |
| Loans under the IMPP | | | | | 26,051 | | | | 2,023 | | | | - | | | | - | | | | - | | | | - | | | | 28,074 | | | | 52,448 | |
| Loans under the CMB Program | | | | | 36,197 | | | | 31,086 | | | | 32,308 | | | | 29,706 | | | | 38,859 | | | | 38,466 | | | | 206,622 | | | | 203,519 | |
| Lending | | | | | 119 | | | | 39 | | | | 66 | | | | 76 | | | | 102 | | | | 4,433 | | | | 4,835 | | | | 5,160 | |
| Total Loans and Receivables | | | | | 62,367 | | | | 33,148 | | | | 32,374 | | | | 29,782 | | | | 38,961 | | | | 42,899 | | | | 239,531 | | | | 261,127 | |
Yield | | | | | 2.6% | | | | 2.6% | | | | 2.0% | | | | 1.7% | | | | 2.2% | | | | 3.3% | | | | 2.5% | | | | 2.9% | |
| Total | | | | | 63,082 | | | | 34,321 | | | | 33,559 | | | | 30,803 | | | | 39,874 | | | | 43,933 | | | | 245,572 | | | | 267,718 | |
SOURCES OF GUARANTEE
As at 31 December 2013, no allowance for credit losses (2012 – nil) was determined as CMHC is assured collection of principal and accrued interest on 99% (2012 – 99%) of its loans. The sources of guarantee for these loans are provided below.
| | | | | | | | | | | | | | | | | | | | | | | | |
| | | 2013 | | | 2012 | |
| (in millions) | | Designated at Fair Value through Profit or Loss | | | Loans and Receivables | | | Total | | | Designated at Fair Value through Profit or Loss | | | Loans and Receivables | | | Total | |
| Provinces and Territories through Provisions in the Social Housing Agreements | | | 2,914 | | | | 1,922 | | | | 4,836 | | | | 3,305 | | | | 2,052 | | | | 5,357 | |
| Government of Canada through Provisions in the NHA | | | - | | | | 1,074 | | | | 1,074 | | | | - | | | | 1,157 | | | | 1,157 | |
| Aboriginal Affairs and Northern Development Canada through Ministerial Loan Guarantees | | | 1,284 | | | | 58 | | | | 1,342 | | | | 1,272 | | | | 64 | | | | 1,336 | |
| Loans Underwritten by CMHC’s Mortgage Loan Insurance Activity | | | 1,052 | | | | 63 | | | | 1,115 | | | | 1,237 | | | | 61 | | | | 1,298 | |
| Collateral1 | | | - | | | | 234,696 | | | | 234,696 | | | | - | | | | 255,967 | | | | 255,967 | |
| Total Guaranteed Loans | | | 5,250 | | | | 237,813 | | | | 243,063 | | | | 5,814 | | | | 259,301 | | | | 265,115 | |
| Unsecured Loans2 | | | 791 | | | | 1,718 | | | | 2,509 | | | | 777 | | | | 1,826 | | | | 2,603 | |
| Total | | | 6,041 | | | | 239,531 | | | | 245,572 | | | | 6,591 | | | | 261,127 | | | | 267,718 | |
| 1 | Represents collateral held for loans under the IMPP and CMB program which consists of NHA MBS securities and high quality reinvestment assets. |
| 2 | These loans are to Provincial entities and Municipalities and are assessed on a regular basis to determine if an allowance for credit losses is necessary. As at 31 December 2013, no impaired loans have been identified and no allowance has been recorded (2012 – nil). |
LOANS PAST DUE
A loan is considered past due but not impaired when a counterparty has not made a payment by the contractual due date. The following table presents the aging of loans that are past due.
| | | | | | | | | | | | | | | | | | | | |
| (in millions) | | Within 1 Year | | | 1 to 3 Years | | | Over 3 Years | | | 2013 | | | 2012 | |
| Designated at Fair Value through Profit or Loss | | | | | | | | | | | | | | | | | | | | |
| Lending | | | 58 | | | | 7 | | | | 2 | | | | 67 | | | | 53 | |
| Total Designated at Fair Value through Profit or Loss | | | 58 | | | | 7 | | | | 2 | | | | 67 | | | | 53 | |
| Loans and Receivables | | | | | | | | | | | | | | | | | | | | |
| Loans under the IMPP | | | - | | | | - | | | | - | | | | - | | | | - | |
| Loans under the CMB Program | | | - | | | | - | | | | - | | | | - | | | | - | |
| Lending | | | 3 | | | | 5 | | | | 10 | | | | 18 | | | | 18 | |
| Total Loans and Receivables | | | 3 | | | | 5 | | | | 10 | | | | 18 | | | | 18 | |
| Total Loans Past Due | | | 61 | | | | 12 | | | | 12 | | | | 85 | | | | 71 | |
| | |
| 122 C A N A D A M O R T G A G E A N D H O U S I N G C O R P O R A T I O N | | |
Derivatives are financial contracts whose value is derived from movements in one or more underlying securities, rates, indices or other instruments or derivatives. The Corporation uses derivatives in connection with its risk management activities.
Interest rate swaps are transactions in which two parties exchange interest cash flows on a specified notional amount for a predetermined period based on agreed-upon fixed and floating rates. Notional amounts are not exchanged. The value of these swaps is derived from movements in interest rates. They are used by the Corporation to manage reinvestment risk, refinancing risk, or mismatches in the timing of receipts from assets versus payments of liabilities.
The table below provides the notional amounts of the derivative transactions recognized in the Consolidated Financial Statements. Notional amounts, which are off-balance sheet, serve as a point of reference for calculating payments and do not represent the fair value, or the potential gain or loss associated with the credit or market risk of such instruments.
| | | | | | | | | | | | | | | | | | | | | | | | | | | | |
| | | | | | 2013 | | | | | | | | | | | | 2012 | | | | |
| | | Average | | | | | | Fair Value | | | | | | Fair Value | |
| (in millions) | | Term to
Maturity | | | Notional
Amount | | | Asset | | | Liability | | | Notional
Amount | | | Asset | | | Liability | |
| Interest Rate Swaps | | | 3 years | | | | 11,352 | | | | 96 | | | | 44 | | | | 11,915 | | | | 131 | | | | 46 | |
| | |
8. PARLIAMENTARY APPROPRIATIONS AND HOUSING PROGRAMS EXPENSES | | |
For the year ended 31 December 2013, the Corporation recognized $2,071 million (2012 – $2,197 million) in Revenues for Parliamentary Appropriations.
These appropriations were used to fund the following program expenditures, including Operating Expenses incurred to support these programs.
| | | | | | | | |
| (in millions) | | 2013 | | | 2012 | |
| Funding Under Long-term Commitments for Existing Social Housing | | | 1,720 | | | | 1,711 | |
| Funding for New Commitments of Affordable Housing | | | 298 | | | | 418 | |
| Housing Support | | | 7 | | | | 4 | |
| Housing Policy, Research and Information Transfer | | | 26 | | | | 47 | |
| Market Analysis Information | | | 20 | | | | 17 | |
| Total | | | 2,071 | | | | 2,197 | |
Of the total amount expensed on Housing Programs, $962 million (2012 – $984 million) was provided for programs transferred to provinces/territories under SHAs. Under the SHAs, the province/territory assumes CMHC’s financial and other obligations with respect to these programs in exchange for a pre-determined annual funding. The accountability framework requires the province/territory to provide an audited Annual Statement of Funding and Expenditures and an Annual Program Performance Report. This funding to the provinces/territories may become repayable to CMHC if the amounts are not used in accordance with the terms and conditions of the SHAs.
Housing program expenses also include related party transactions between the Government of Canada and CMHC for the reimbursement of:
| n | | Operating Expenses incurred by CMHC to support and administer the Housing Programs; |
| n | | Interest rate losses resulting from certain loans made under the Lending Activity containing interest rate clauses that are lower than the associated interest cost on the related borrowings; |
| n | | Operating losses on certain investments in housing programs and real estate properties held by the Lending Activity; and |
| n | | Default losses on certain loans made by the Lending Activity as well as net disposal losses on certain investments in housing programs and real estate properties held by the Lending Activity. |
The following table summarizes the nature of these expenses reimbursed by the Government of Canada.
| | | | | | | | |
| (in millions) | | 2013 | | | 2012 | |
| Operating Expenses | | | 116 | | | | 123 | |
| Interest Rate Losses | | | 94 | | | | 46 | |
| Operating Losses | | | - | | | | 1 | |
| Default and Disposal Losses | | | 1 | | | | 1 | |
| Total | | | 211 | | | | 171 | |
The total reimbursements for interest losses includes $53 million (2012 – nil), towards the losses incurred by CMHC as a result of the prepayment and repricing activity on loans made under the Lending Activity.
Reimbursements of losses and expenses are recorded as Due from the Government of Canada and housing program expenses on an accrual basis.
The following table presents the change in the Due from the Government of Canada account. The outstanding balance as at 31 December 2013 is mainly composed of housing program expenses incurred but not yet reimbursed.
| | | | | | | | |
| (in millions) | | 2013 | | | 2012 | |
| Balance at Beginning of Year | | | 309 | | | | 403 | |
| Total Appropriations Recognized in Revenues During the Year | | | 2,071 | | | | 2,197 | |
| Total Appropriations Received | | | (2,070) | | | | (2,290) | |
| Reimbursements | | | 1 | | | | (1) | |
| Balance at End of Year | | | 311 | | | | 309 | |
| | |
9. ACCOUNTS RECEIVABLE AND OTHER ASSETS | | |
The following table presents the composition of Accounts Receivable and Other Assets.
| | | | | | | | |
| (in millions) | | 2013 | | | 2012
Restated
Note 3 | |
| Accounts Receivable | | | 26 | | | | 33 | |
| Income Taxes Receivable | | | 24 | | | | 207 | |
| Investment Property (Note 23) | | | 234 | | | | 204 | |
| Non-Current Assets Held for Sale | | | 94 | | | | 92 | |
| Property, Plant and Equipment | | | 53 | | | | 53 | |
| Deferred Acquisition Costs (Note 13) | | | 116 | | | | 115 | |
| Workouts1 | | | 86 | | | | 101 | |
| Net Estimated Borrower Recoveries | | | 48 | | | | 51 | |
| Other | | | 81 | | | | 79 | |
| Total | | | 762 | | | | 935 | |
| 1 | Workouts are mortgages or loans that benefit from the Mortgage Loan Insurance supported default management activities that enable borrowers to work through their financial difficulties. An allowance for credit losses is established for these workouts. At 31 December 2013, the allowance was $163 million (2012 - $263 million) relating to workouts of $249 million (2012 - $364 million). |
| | |
| 124 C A N A D A M O R T G A G E A N D H O U S I N G C O R P O R A T I O N | | |
CMHC guarantees the timely payment of principal and interest of CMB issued as well as NHA MBS for investors in securities issued by Approved Issuers on the basis of housing loans.
CMHC determined that, at the Consolidated Balance Sheet date, the best estimate of the amount required to settle the timely payment guarantee obligation is less than the balance of the unearned timely payment guarantees fees. As such, no provision for claims is required.
The following table presents the changes in the unearned timely payment guarantee fees balance.
| | | | | | | | |
| (in millions) | | 2013 | | | 2012 | |
| Balance at Beginning of Year | | | 546 | | | | 528 | |
| Timely Payment Guarantee Fees Received in the Year | | | 265 | | | | 260 | |
| Timely Payment Guarantee Fees Earned in the Year1 | | | (247) | | | | (242) | |
| Balance at End of Year | | | 564 | | | | 546 | |
| 1 | Includes application and compensatory fees received and earned of $30 million (2012 – $30 million) |
GUARANTEES-IN-FORCE
The following table presents the total guarantees-in-force by program, which represents risk exposure related to the timely payment guarantee:
| | | | | | | | |
| (in billions) | | 2013 | | | 2012 | |
| NHA MBS1 | | | 192 | | | | 179 | |
| CMB2 | | | 206 | | | | 203 | |
| Total | | | 398 | | | | 382 | |
| 1 | Includes $7.2 billion (2012 – $38 billion) in NHA MBS held as collateral in the IMPP. |
| 2 | Includes $2.3 billion (2012 – $2 billion) in investments which are eliminated on the Consolidated Balance Sheet. |
The maturity profile of the guarantees-in-force is as follows:
| | | | | | |
| (in millions) | | | | NHA MBS
and CMB
Guaranteed1 | |
| 2014 | | | | | 58 | |
| 2015 | | | | | 70 | |
| 2016 | | | | | 88 | |
| 2017 | | | | | 68 | |
| 2018 | | | | | 72 | |
| 2019 and Thereafter | | | | | 42 | |
| Total | | | | | 398 | |
| 1 | Based on principal amount outstanding as at 31 December 2013. |
Under Section 15 of the NHA, the aggregate outstanding amount of principal guarantees may not exceed $600 billion (2012 – $600 billion).
The following table summarizes the carrying value and yield for borrowings based on maturity date.
| | | | | | | | | | | | | | | | | | | | | | | | | | | | | | | | |
| (in millions) | | 2014 | | | 2015 | | | 2016 | | | 2017 | | | 2018 | | | 2019 and Thereafter | | | Total 2013 | | | Total 2012 | |
| Designated at Fair Value through Profit or Loss | | | | | | | | | | | | | | | | | | | | | | | | | | | | | | | | |
| Capital Market Borrowings | | | - | | | | 677 | | | | 483 | | | | 295 | | | | - | | | | - | | | | 1,455 | | | | 1,848 | |
| Borrowings from the Government of Canada | | | 935 | | | | 950 | | | | 1,200 | | | | 960 | | | | 1,089 | | | | 1,229 | | | | 6,363 | | | | 6,659 | |
| Total Designated at Fair Value through Profit or Loss | | | 935 | | | | 1,627 | | | | 1,683 | | | | 1,255 | | | | 1,089 | | | | 1,229 | | | | 7,818 | | | | 8,507 | |
| Yield1 | | | 2.0% | | | | 3.3% | | | | 2.8% | | | | 2.1% | | | | 2.4% | | | | 2.7% | | | | 2.6% | | | | 2.9% | |
| Other Financial Liabilities | | | | | | | | | | | | | | | | | | | | | | | | | | | | | | | | |
| Canada Mortgage Bonds | | | 36,114 | | | | 30,618 | | | | 31,742 | | | | 29,396 | | | | 38,508 | | | | 38,085 | | | | 204,463 | | | | 201,676 | |
| Borrowings from the Government of Canada | | | 26,358 | | | | 2,341 | | | | 268 | | | | 329 | | | | 389 | | | | 3,230 | | | | 32,915 | | | | 57,595 | |
| Total Other Financial Liabilities | | | 62,472 | | | | 32,959 | | | | 32,010 | | | | 29,725 | | | | 38,897 | | | | 41,315 | | | | 237,378 | | | | 259,271 | |
| Yield1 | | | 2.6% | | | | 2.6% | | | | 2.0% | | | | 1.7% | | | | 2.2% | | | | 3.3% | | | | 2.5% | | | | 2.8% | |
| Total | | | 63,407 | | | | 34,586 | | | | 33,693 | | | | 30,980 | | | | 39,986 | | | | 42,544 | | | | 245,196 | | | | 267,778 | |
| 1 | Represents the weighted-average yield, determined by applying the weighted-average effective yields of individual fixed rate borrowings and the weighted-average yields-to-reset of floating rate notes. |
BORROWINGS – DESIGNATED AT FAIR VALUE THROUGH PROFIT OR LOSS
Included in this category are Capital Market Borrowings which consist of fixed rate notes with an original term to maturity ranging from two to ten years.
Also included in this category are Borrowings from the Government of Canada which are short-term and medium-term debt. Short-term debt outstanding of $98 million (2012 – $122 million) has an original term to maturity less than 365 days and a yield of 0.9% (2012 – 0.9%). Medium-term debt includes fixed rate notes, with an original term to maturity ranging from two to ten years.
The carrying amount at 31 December 2013 of Borrowings – Designated at Fair Value through Profit and Loss is $132 million higher (2012 – $286 million) than the contractual amount due at maturity. CMHC’s liabilities are backed by the full faith and credit of the Government of Canada and there is no significant change in value that can be attributed to changes in credit risk.
The following table presents issuances and repayments for Borrowings – Designated at Fair Value through Profit or Loss.
| | | | | | | | | | | | | | | | | | | | | | | | |
| | | | | | 2013 | | | | | | | | | 2012 | | | | |
| (in millions) | | Capital Market
Borrowings | | | Borrowings
from the
Government
of Canada | | | Total | | | Capital Market
Borrowings | | | Borrowings
from the
Government
of Canada | | | Total | |
| Issuances During the Year | | | - | | | | 2,790 | | | | 2,790 | | | | - | | | | 2,591 | | | | 2,591 | |
| Repayments During the Year | | | (350) | | | | (2,975) | | | | (3,325) | | | | (300) | | | | (2,450) | | | | (2,750) | |
The interest expense related to Borrowings – Designated at Fair Value through Profit or Loss is $223 million (2012 – $250 million).
| | |
| 126 C A N A D A M O R T G A G E A N D H O U S I N G C O R P O R A T I O N | | |
BORROWINGS – OTHER FINANCIAL LIABILITIES
This category includes borrowings issued by the Corporation for the IMPP and the CMB Program as well as Borrowings from the Government of Canada. The latter are borrowings under the terms of the Crown Borrowing Agreement that are issued at the Government of Canada rate. On the day of exchange, these borrowings are adjusted to market value and the associated gains/losses are amortized through profit or loss on a straight-line basis over the term of the borrowings.
The following table presents issuances and repayments for Borrowings – Other Financial Liabilities.
| | | | | | | | | | | | | | | | | | | | | | | | |
| | | | | | 2013 | | | | | | | | | 2012 | | | | |
| (in millions) | | Canada
Mortgage
Bonds | | | Borrowings
from the
Government
of Canada | | | Total | | | Canada
Mortgage
Bonds | | | Borrowings
from the
Government
of Canada | | | Total | |
| Issuances During the Year | | | 38,609 | | | | - | | | | 38,609 | | | | 39,943 | | | | - | | | | 39,943 | |
| Repayments During the Year | | | (35,500) | | | | (24,683) | | | | (60,183) | | | | (37,700) | | | | (3,370) | | | | (41,070) | |
The interest expense related to Borrowings – Other Financial Liabilities is $6,801 million (2012 – $7,958 million).
BORROWING AUTHORITIES
The Minister of Finance approves CMHC’s Borrowing Plan annually and establishes limits and parameters for borrowings. The Borrowing Authorities provide a maximum debt outstanding limit for 2013 of $68.5 billion. This limit includes Capital Market Borrowings and Borrowings from the Government of Canada that were incurred since April 2008 in the Lending and Securitization Activities, whose combined outstanding principal balance was $37.5 billion at 31 December 2013. The legislative authority, which does not apply to borrowings of CHT, requires that the total indebtedness outstanding at any time, other than to the Government of Canada, not exceed $20 billion. The outstanding principal balance of this indebtedness was $1.4 billion as at 31 December 2013.
| | |
12. ACCOUNTS PAYABLE AND OTHER LIABILITIES |
The following table presents the composition of Accounts Payable and Other Liabilities.
| | | | | | | | |
| (in millions) | | 2013 | | | 2012
Restated
Note 3 | |
| Accrued Housing Program Expenses | | | 263 | | | | 312 | |
| Defined Benefit Plans Liability (Note 22) | | | 350 | | | | 717 | |
| Deferred Gains on Related Party Transactions | | | 65 | | | | 59 | |
| Other Miscellaneous Liabilities | | | 139 | | | | 170 | |
| Total | | | 817 | | | | 1,258 | |
| | |
13. MORTGAGE LOAN INSURANCE | | |
ROLE OF THE APPOINTED ACTUARY
The actuary is appointed by Management to carry out a valuation of the policy liabilities (Provision for Claims and Unearned Premiums) of the Mortgage Loan Insurance Activity as at 30 September. The factors and techniques used in the valuation are in accordance with Canadian accepted actuarial practice, applicable legislation, and associated regulations. The Appointed Actuary also performs a roll-forward of the Provision for Claims from the date of the Actuarial Valuation to 31 December.
EARNED AND UNEARNED PREMIUMS AND FEES
The following table presents the composition of Premiums and Fees Earned.
| | | | | | | | |
| (in millions) | | 2013 | | | 2012 | |
| Earned Premiums | | | 1,728 | | | | 1,780 | |
| Earned Application Fees1 | | | 26 | | | | 27 | |
| Total | | | 1,754 | | | | 1,807 | |
| 1 | Includes previously unearned application fees recognized in the year, as well as other service fees which are earned as received. |
The following table presents the changes in the Unearned Premiums and Fees balance.
| | | | | | | | |
| (in millions) | | 2013 | | | 2012 | |
| Balance at Beginning of Year | | | 6,394 | | | | 6,731 | |
| Premium Deferred on Contracts Written in the Year | | | 1,280 | | | | 1,444 | |
| Premiums Earned in the Year | | | (1,728) | | | | (1,780) | |
| Application Fees Deferred on Contracts Written in the Year | | | 15 | | | | 14 | |
| Application Fees Earned in the Year | | | (14) | | | | (15) | |
| Balance at End of Year | | | 5,947 | | | | 6,394 | |
PROVISION FOR CLAIMS
The Provision for Claims includes amounts set aside for Incurred But Not Reported (IBNR) claims, Claims in Process (CIP) and for Social Housing Mortgage and Index Linked Mortgage claims (SH & ILM). The following table presents the changes in the Provision for Claims balance.
| | | | | | | | | | | | | | | | | | | | | | | | |
| | | 2013 | | | 2012 | |
| (in millions) | | IBNR & CIP | | | SH & ILM | | | Total | | | IBNR & CIP | | | SH & ILM | | | Total | |
| Balance at Beginning of Year | | | 780 | | | | 216 | | | | 996 | | | | 803 | | | | 238 | | | | 1,041 | |
| Claims paid During the Year | | | (436) | | | | - | | | | (436) | | | | (532) | | | | - | | | | (532) | |
| Insurance Claims losses During the Year | | | 306 | | | | 3 | | | | 309 | | | | 509 | | | | (22) | | | | 487 | |
| Balance at End of Year | | | 650 | | | | 219 | | | | 869 | | | | 780 | | | | 216 | | | | 996 | |
METHODOLOGY AND SIGNIFICANT FACTORS
The key method used by CMHC for estimating insurance policy liabilities is the actuarial present value basis. There is a limitation to the accuracy of policy liability estimates as provided in the valuation report prepared by the Appointed Actuary. There is inherent uncertainty in any estimate of ultimate liabilities including for premium deficiency, IBNR, Claims in Process, Social Housing Mortgages and Index Linked Mortgages because the ultimate liability for claims is subject to the outcome of events yet to occur.
| | |
| 128 C A N A D A M O R T G A G E A N D H O U S I N G C O R P O R A T I O N | | |
In addition to a risk of underestimating or overestimating the total amount of claim liabilities, there is a risk that the timing of the future payment of liabilities or the return on investments will differ materially from the assumptions underlying the valuation of insurance policy liabilities.
Provisions are reviewed and evaluated at the end of each quarter by Management and are also reviewed and evaluated on an annual basis as part of the Actuarial Valuation in light of emerging claim experience and changing circumstances. The resulting changes in the estimated Provision for Claims are recorded in Insurance Claims expense in the year in which they are determined.
CMHC determines Provisions for Claims and Unearned Premiums at 31 December using valuation factors from the 30 September valuation, taking into account changes in economic circumstances, premiums received and claims paid in the intervening period.
Premiums flow to income using factors derived from the patterns of past claims’ occurrence. Hence, premiums are earned at a pace similar to that at which claims are incurred. Earning patterns are determined by product type and by amortization period.
The following factors affect the key actuarial assumptions used in the determination of the Provision for Claims:
Claim emergence: Claim emergence encompasses claim frequency and claim occurrence patterns. It is based on historical trends in claims and arrears reporting.
Claim severity: Claim severity, or average loss on claims, is dependent on the dollar value of claims, losses on sales of real estate properties, administrative expenses, payment delays and sale delays. These factors are generally based on historical experience.
Economic conditions: Recent past and projected economic factors, such as unemployment rates, mortgage interest rates, and changes in house prices, affect the forecast of future claim levels.
SENSITIVITY ANALYSIS
The following table presents the sensitivity of the level of insurance contract liabilities to movements in the economic factors used to calculate them. The percentage change in variables is applied to a range of existing actuarial modelling assumptions to derive the possible impact on Income before Income Taxes. The disclosure is not intended to explain the impact of a percentage change in the insurance assets and liabilities disclosed above.
The results of sensitivity testing are set out below, showing the impact on Income before Income Taxes. For each scenario, the impact of a change in a single factor is shown, with other assumptions unchanged.
| | | | | | | | |
| (in millions) | | 2013 | | | 2012 | |
| 100 bps Increase in Unemployment Rate | | | (115) | | | | (93) | |
| 100 bps Decrease in Rate of House Price Inflation | | | (32) | | | | (16) | |
| 100 bps Increase in Mortgage Rates | | | (88) | | | | (43) | |
These sensitivities are hypothetical and should be viewed in that light. The relationship of a change in assumption to the change in value may not be linear. Changes in one factor may result in changes in another which might magnify or counteract the sensitivities.
The method for sensitivity testing has not changed significantly from the prior year.
CLAIMS DEVELOPMENT
The following table shows the development of claims over a period of time and the estimated ultimate cost of claims for 2007 through 2013. In 2011, in the year of adoption of IFRS, only five years are required to be disclosed. This will be increased in each succeeding year, until ten years of information are presented. The table shows how the expected losses on claims for each year develop over time.
| | | | | | | | | | | | | | | | | | | | | | | | | | | | | | | | |
| (in millions) | | 2007 | | | 2008 | | | 2009 | | | 2010 | | | 2011 | | | 2012 | | | 2013 | | | Total | |
| Expected Losses on Claims in the Year | | | 201 | | | | 270 | | | | 350 | | | | 865 | | | | 713 | | | | 704 | | | | 668 | | | | 3,771 | |
| Claims Paid During the Year | | | 217 | | | | 248 | | | | 512 | | | | 678 | | | | 617 | | | | 532 | | | | 436 | | | | 3,240 | |
| Differences | | | 16 | | | | (22) | | | | 162 | | | | (187) | | | | (96) | | | | (172) | | | | (232) | | | | (531) | |
DEFERRED ACQUISITION COSTS
The following table presents the changes in the Deferred Acquisition Costs balance.
| | | | | | | | |
| (in millions) | | 2013 | | | 2012 | |
| Balance at Beginning of Year | | | 115 | | | | 109 | |
| Acquisition Costs Deferred | | | 34 | | | | 37 | |
| Amortization of Deferred Acquisition Costs | | | (33) | | | | (31) | |
| Balance at End of Year | | | 116 | | | | 115 | |
MORTGAGE LOAN INSURANCE RISK MANAGEMENT
CMHC assumes the risk of loss from borrower default through mortgage insurance contracts entered into with lenders, exposing CMHC to the uncertainty surrounding the timing, frequency and severity of claims. CMHC manages its exposure to this risk of loss through prudent product design, underwriting and default management practices, and the establishment of adequate capital reserves.
A concentration of risk may arise from insurance contracts issued in a particular geographical area where local economic conditions are significantly different from average. The relative impact of the outcome is mitigated as a result of the distribution of business across different geographic areas.
INSURANCE-IN-FORCE
At 31 December 2013, insurance-in-force, which represents the risk exposure of the Mortgage Loan Insurance Activity, totalled $557 billion (2012 – $566 billion). This amount includes $1,115 million (2012 – $1,298 million) in outstanding loan balances from the Lending Activity (refer to Note 6).
Under Section 11 of the NHA, the total of outstanding insured amounts of all insured loans may not exceed $600 billion (2012 – $600 billion).
INSURANCE POLICY LIABILITY ADEQUACY
The Corporation’s external actuary performs a liability adequacy test on the Corporation’s premium liabilities and claim liabilities. Premium liabilities represent a provision for future claims and expenses which are expected to arise from the unearned portion of the policies in force. Thus, this provision is for claims that have not yet occurred and therefore covers the period from the date of the valuation to the date of default (the assumed claim occurrence date).
The liability adequacy test for the Corporation for the years ended 31 December 2013 and 2012 has identified that no provision for premium deficiency is required at these reporting dates.
| | |
| 130 C A N A D A M O R T G A G E A N D H O U S I N G C O R P O R A T I O N | | |
The following table presents the components of income tax.
| | | | | | | | |
| (in millions) | | 2013 | | | 2012 Restated Note 3 | |
| Current Income Tax Expense | | | | | | | | |
Tax Expense for Current Year | | | 530 | | | | 527 | |
Adjustment for Prior Years | | | 1 | | | | 7 | |
| | | | 531 | | | | 534 | |
| Deferred Income Tax Expense | | | | | | | | |
Origination and Reversal of Temporary Differences | | | 53 | | | | 35 | |
| Total Income Tax Expense Included in Net Income | | | 584 | | | | 569 | |
| Income Tax Expense (Recovery) on Other Comprehensive Income | | | | | | | | |
Net Unrealized Gains on Available for Sale Financial Instruments | | | - | | | | 94 | |
Reclassification of Prior Years’ Net Unrealized Gains Realized in the Year | | | (36) | | | | (68) | |
Remeasurements of the Net Defined Benefit Plans | | | 63 | | | | (19) | |
| Total Income Tax Expense Included in Other Comprehensive Income | | | 27 | | | | 7 | |
| Income Tax Recovery on Consolidated Statement of Equity of Canada | | | - | | | | - | |
| Total | | | 611 | | | | 576 | |
|
The following is a reconciliation of the statutory tax rate to the effective tax rate. | |
| (in millions) | | 2013 | | | 2012 Restated Note 3 | |
| Income before Income Taxes | | | 2,413 | | | | 2,268 | |
| Statutory Tax Rate | | | 25% | | | | 25% | |
| Income Taxes Computed at Statutory Tax Rate | | | 603 | | | | 567 | |
| Change in Tax Rates on Income Taxes | | | 3 | | | | 15 | |
| Permanent Differences | | | (22) | | | | (13) | |
| Income Tax Expense | | | 584 | | | | 569 | |
| Effective Tax Rate | | | 24.2% | | | | 25.1% | |
The statutory tax rate of 25% is comprised of the federal income tax rate of 38% less the general rate reduction of 13%.
The following tables present the tax-effected temporary differences which result in deferred income tax assets and liabilities.
| | | | | | | | | | | | | | | | | | | | | | |
| (in millions) | | | | 2012 | | | Change through
Consolidated
Net Income | | | Change through
Consolidated
OCI | | | Change through
Consolidated
Equity | | | 2013 | |
| Deferred Income Tax Assets | | | | | | | | | | | | | | | | | | | | | | |
| Fair Value of Financial Instruments | | | | | 79 | | | | (39) | | | | 29 | | | | - | | | | 69 | |
| Post-employment Benefits | | | | | 126 | | | | (8) | | | | (63) | | | | - | | | | 55 | |
| Total Deferred Income Tax Assets | | | | | 205 | | | | (47) | | | | (34) | | | | - | | | | 124 | |
| Deferred Income Tax Liabilities | | | | | | | | | | | | | | | | | | | | | | |
| Fair Value of Investment Properties | | | | | (26) | | | | (6) | | | | - | | | | - | | | | (32) | |
| Deferred Gains on Disposal of Financial Instruments | | | | | (5) | | | | - | | | | - | | | | - | | | | (5) | |
| Deferred Issuance Costs | | | | | (4) | | | | 1 | | | | - | | | | - | | | | (3) | |
| Provision for Claims | | | | | (112) | | | | (1) | | | | - | | | | (4) | | | | (117) | |
| Total Deferred Income Tax Liabilities | | | | | (147) | | | | (6) | | | | - | | | | (4) | | | | (157) | |
| Net Deferred Income Tax Assets (Liabilities) | | | | | 58 | | | | (53) | | | | (34) | | | | (4) | | | | (33) | |
| | | | | | |
| (in millions) | | | | 2011 | | | Change through
Consolidated
Net Income | | | Change through
Consolidated
OCI | | | Change through
Consolidated
Equity | | | 2012 | |
| Deferred Income Tax Assets | | | | | | | | | | | | | | | | | | | | | | |
| Fair Value of Financial Instruments | | | | | 107 | | | | (30) | | | | 2 | | | | - | | | | 79 | |
| Post-employment Benefits | | | | | 104 | | | | 3 | | | | 19 | | | | - | | | | 126 | |
| Total Deferred Income Tax Assets | | | | | 211 | | | | (27) | | | | 21 | | | | - | | | | 205 | |
| Deferred Income Tax Liabilities | | | | | | | | | | | | | | | | | | | | | | |
| Fair Value of Investment Properties | | | | | (23) | | | | (3) | | | | - | | | | - | | | | (26) | |
| Deferred Gains on Disposal of Financial Instruments | | | | | (6) | | | | - | | | | 1 | | | | - | | | | (5) | |
| Deferred Issuance Costs | | | | | (5) | | | | 1 | | | | - | | | | - | | | | (4) | |
| Provision for Claims | | | | | (99) | | | | (6) | | | | - | | | | (7) | | | | (112) | |
| Total Deferred Income Tax Liabilities | | | | | (133) | | | | (8) | | | | 1 | | | | (7) | | | | (147) | |
| Net Deferred Income Tax Assets (Liabilities) | | | | | 78 | | | | (35) | | | | 22 | | | | (7) | | | | 58 | |
The Deferred Income Tax Assets (Liabilities) have been recognized in full as the Corporation believes it is probable that these items will be realized in the normal course of its operations.
| | |
| 132 C A N A D A M O R T G A G E A N D H O U S I N G C O R P O R A T I O N | | |
For capital management purposes and as provided for in the CMHC Act and the NHA, CMHC considers its capital available to be equal to the total Equity of Canada less assets with a Capital Requirement of 100%. The components of capital available are presented below.
| | | | | | | | |
| (in millions) | | 2013 | | | 2012 | |
| Contributed Capital | | | 25 | | | | 25 | |
| AOCI | | | 943 | | | | 1,038 | |
| Appropriated Retained Earnings | | | 11,313 | | | | 10,764 | |
| Retained Earnings Other1 | | | 3,557 | | | | 2,017 | |
| Total Equity of Canada | | | 15,838 | | | | 13,844 | |
| Less: Assets with a Capital Requirement of 100% | | | (246) | | | | (282) | |
| Total Capital Available | | | 15,592 | | | | 13,562 | |
| 1 | Retained Earnings Other represents Retained Earnings not needed to support the capitalization framework of CMHC’s Mortgage Loan Insurance and Securitization Activities. It is comprised of Unappropriated Retained Earnings of $3,446 million (2012 – $2,113 million), the Reserve Fund for Lending of $167 million (2012 – $16 million) and eliminations of $56 million (2012 – $80 million). |
CMHC’s primary objective with respect to capital management is to ensure that its commercial operations have adequate capital to deliver their mandate while remaining financially self-sustaining and also to follow prudent business practices and guidelines existing in the private sector as appropriate. CMHC’s capital management policy is included in its Corporate Plan which is approved annually by the Governor in Council. There are no externally imposed minimal capital requirements for the Corporation; however, the Corporation follows OSFI’s guidelines in setting capital levels and targets for its mortgage loan insurance business.
CMHC has managed its capital as approved in its 2013 Corporate Plan in accordance with the CMHC Act and the NHA. There have been no changes in what is considered to be capital or the objectives of managing capital during the year.
MORTGAGE LOAN INSURANCE CAPITAL
The following table presents the components of capital available for the Mortgage Loan Insurance Activity.
| | | | | | | | |
| (in millions) | | 2013 | | | 2012 | |
| AOCI | | | 996 | | | | 1,047 | |
| Appropriated Retained Earnings | | | 10,497 | | | | 9,983 | |
| Appropriated Capital | | | 11,493 | | | | 11,030 | |
| Unappropriated Retained Earnings | | | 2,823 | | | | 1,674 | |
| Total Mortgage Loans Insurance Capital | | | 14,316 | | | | 12,704 | |
| Less: Assets with a Capital Requirement of 100% | | | (231) | | | | (282) | |
| Total Mortgage Loans Insurance Capital Available | | | 14,085 | | | | 12,422 | |
The Appropriated Capital of the Mortgage Loan Insurance Activity is based on CMHC’s Capital Management Framework which follows guidelines developed by OSFI. OSFI’s minimum regulatory capital requirement is 100% of its Minimum Capital Test (MCT). The test is to ensure that capital available is, at minimum, 100% of the capital required. OSFI expects regulated insurers to establish an internal capital target and a capital holding level based on acceptable levels of risk. The selection of the capital holding level is to ensure that the likelihood of falling below the internal capital target is minimized. The Board has selected an internal capital target of 185% MCT (2012 – 175%) and a capital holding level of 200% MCT (2012 – 200%).
Appropriated Capital is equal to capital holding level (200% MCT or $11,493 million) for the Mortgage Loan Insurance Activity (2012 – 200%). As at 31 December 2013, the Mortgage Loan Insurance Activity had capital available of 250% ($14,085 million) of the minimum capital required (2012 – 231%).
SECURITIZATION CAPITAL
The following table presents the components of the capital available for the Securitization Activity.
| | | | | | | | |
| (in millions) | | 2013 | | | 2012 | |
| AOCI | | | (43) | | | | 8 | |
| Appropriated Retained Earnings | | | 816 | | | | 781 | |
| Appropriated Capital | | | 773 | | | | 789 | |
| Unappropriated Retained Earnings | | | 623 | | | | 439 | |
| Total Securitization Capital | | | 1,396 | | | | 1,228 | |
| Less: Assets with a Capital Requirement of 100% | | | (15) | | | | - | |
| Total Securitization Capital Available | | | 1,381 | | | | 1,228 | |
Capital related to the Securitization Activity is appropriated for the guarantees provided under NHA MBS and CMB programs. The amount appropriated is based on regulatory and economic capital principles and has been established to be 100% ($773 million) of the minimum capital required under these principles (2012 – 100%). As at 31 December 2013, the Securitization Activity had capital available of 182% ($1,381 million) of the minimum capital required (2012 – 156%, or $1,228).
LENDING CAPITAL
The capital for the Lending Activity is comprised of Contributed Capital and Retained Earnings. In accordance with the CMHC Act, the Lending Activity’s earnings are retained by the Corporation in a Reserve Fund which is subject to a statutory limit of $240 million (2012 – $240 million). This Reserve Fund is kept by the Corporation as part of its strategy to address interest rate risk exposure on pre-payable loans as well as credit risk exposure on unsecured loans. As all of the Lending Activity’s earnings are retained in the Reserve Fund, the Reserve Fund also includes unrealized fair market fluctuations as well as Remeasurements of the Net Defined Benefit Plans. Should the statutory limit be exceeded, CMHC would be required to pay the excess to the Government of Canada. As at 31 December 2013, Lending’s capital was $192 million (2012 – $9 million).
HOUSING PROGRAMS CAPITAL
CMHC does not hold capital for its Housing Programs Activity as this activity is operated on a breakeven basis and is supported by Parliamentary Appropriations.
CHT CAPITAL
CMHC does not hold capital for CHT as it is operated on a breakeven basis and all income is distributed to the beneficiaries of the trust.
| | |
| 134 C A N A D A M O R T G A G E A N D H O U S I N G C O R P O R A T I O N | | |
The following table represents the fair value hierarchy in which fair value measurements are categorized for assets and liabilities recorded on the Consolidated Balance Sheet. For financial instruments, accrued interest is separately recorded and disclosed. The fair value of financial instruments not recorded at fair value is disclosed in Note 17.
| | | | | | | | | | | | | | | | | | | | | | | | | | |
| | | | | 2013 | |
| | | | | Total Items Recorded at Fair Value | | | Items not Recorded at | | | | |
| (in millions) | | | | Level 1 | | | Level 2 | | | Level 3 | | | Total | | | Fair Value | | | Total | |
| ASSETS | | | | | | | | | | | | | | | | | | | | | | | | | | |
| Cash and Cash Equivalents | | | | | | | | | | | | | | | | | | | | | | | | | | |
Cash | | | | | (1) | | | | - | | | | - | | | | (1) | | | | - | | | | (1) | |
Interest Bearing Deposits with Banks | | | | | - | | | | 512 | | | | - | | | | 512 | | | | - | | | | 512 | |
Corporate/Other Entities | | | | | - | | | | 95 | | | | - | | | | 95 | | | | 91 | | | | 186 | |
Government of Canada | | | | | 430 | | | | - | | | | - | | | | 430 | | | | - | | | | 430 | |
Provinces/Municipalities | | | | | - | | | | 209 | | | | - | | | | 209 | | | | - | | | | 209 | |
| Total Cash and Cash Equivalents | | | | | 429 | | | | 816 | | | | - | | | | 1,245 | | | | 91 | | | | 1,336 | |
| Investment Securities (Note 5): | | | | | | | | | | | | | | | | | | | | | | | | | | |
Designated at Fair Value through Profit or Loss | | | | | | | | | | | | | | | | | | | | | | | | | | |
Fixed Income | | | | | | | | | | | | | | | | | | | | | | | | | | |
Corporate/Other Entities | | | | | 111 | | | | 12 | | | | 150 | | | | 273 | | | | - | | | | 273 | |
Provinces/Municipalities | | | | | 639 | | | | - | | | | - | | | | 639 | | | | - | | | | 639 | |
Sovereign and Related Entities | | | | | 50 | | | | 50 | | | | - | | | | 100 | | | | - | | | | 100 | |
| Total Designated at Fair Value through Profit or Loss | | | | | 800 | | | | 62 | | | | 150 | | | | 1,012 | | | | - | | | | 1,012 | |
| Available for Sale | | | | | | | | | | | | | | | | | | | | | | | | | | |
Fixed Income | | | | | | | | | | | | | | | | | | | | | | | | | | |
Corporate/Other Entities | | | | | 5,387 | | | | - | | | | - | | | | 5,387 | | | | - | | | | 5,387 | |
Government of Canada | | | | | 4,757 | | | | - | | | | - | | | | 4,757 | | | | - | | | | 4,757 | |
Provinces/Municipalities | | | | | 5,897 | | | | - | | | | - | | | | 5,897 | | | | - | | | | 5,897 | |
Sovereign and Related Entities | | | | | 76 | | | | - | | | | - | | | | 76 | | | | - | | | | 76 | |
Equities | | | | | | | | | | | | | | | | | | | | | | | | | | |
Canadian | | | | | 2,197 | | | | - | | | | 17 | | | | 2,214 | | | | - | | | | 2,214 | |
U.S. | | | | | 888 | | | | - | | | | - | | | | 888 | | | | - | | | | 888 | |
Foreign | | | | | 440 | | | | - | | | | - | | | | 440 | | | | - | | | | 440 | |
Total Available for Sale | | | | | 19,642 | | | | - | | | | 17 | | | | 19,659 | | | | - | | | | 19,659 | |
Held for Trading | | | | | | | | | | | | | | | | | | | | | | | | | | |
Foreign Equities | | | | | 444 | | | | - | | | | - | | | | 444 | | | | - | | | | 444 | |
Total Held for Trading | | | | | 444 | | | | - | | | | - | | | | 444 | | | | - | | | | 444 | |
| Loans: | | | | | | | | | | | | | | | | | | | | | | | | | | |
Designated at Fair Value through Profit or Loss | | | | | - | | | | 6,041 | | | | - | | | | 6,041 | | | | - | | | | 6,041 | |
| Derivatives | | | | | - | | | | 96 | | | | - | | | | 96 | | | | - | | | | 96 | |
| Accounts Receivable and Other Assets | | | | | | | | | | | | | | | | | | | | | | | | | | |
Investment Property (Note 23) | | | | | - | | | | - | | | | 234 | | | | 234 | | | | - | | | | 234 | |
Other Accounts Receivable and Other Assets | | | | | - | | | | - | | | | - | | | | - | | | | 528 | | | | 528 | |
| Total Accounts Receivable and Other Assets | | | | | - | | | | - | | | | 234 | | | | 234 | | | | 528 | | | | 762 | |
| Assets not Recorded at Fair Value | | | | | - | | | | - | | | | - | | | | - | | | | 240,701 | | | | 240,701 | |
| TOTAL ASSETS | | | | | 21,315 | | | | 7,015 | | | | 401 | | | | 28,731 | | | | 241,320 | | | | 270,051 | |
| LIABILITIES AND EQUITY OF CANADA | | | | | | | | | | | | | | | | | | | | | | | | | | |
| Borrowings: | | | | | | | | | | | | | | | | | | | | | | | | | | |
Designated at Fair Value through Profit or Loss | | | | | 1,455 | | | | 6,363 | | | | - | | | | 7,818 | | | | - | | | | 7,818 | |
| Derivatives | | | | | - | | | | 44 | | | | - | | | | 44 | | | | - | | | | 44 | |
| Liabilities and Equity of Canada not Recorded at Fair Value | | | | | - | | | | - | | | | - | | | | - | | | | 262,189 | | | | 262,189 | |
| TOTAL LIABILITIES AND EQUITY OF CANADA | | | | | 1,455 | | | | 6,407 | | | | - | | | | 7,862 | | | | 262,189 | | | | 270,051 | |
| | | | | | | | | | | | | | | | | | | | | | | | | | |
| | | | | 2012 Restated Note 3 | |
| | | | | Total Items Recorded at Fair Value | | | Items not Recorded at | | | | |
| (in millions) | | | | Level 1 | | | Level 2 | | | Level 3 | | | Total | | | Fair Value | | | Total | |
| ASSETS | | | | | | | | | | | | | | | | | | | | | | | | | | |
| Cash and Cash Equivalents | | | | | | | | | | | | | | | | | | | | | | | | | | |
Cash | | | | | (6) | | | | - | | | | - | | | | (6) | | | | - | | | | (6) | |
Interest Bearing Deposits with Banks | | | | | - | | | | 417 | | | | - | | | | 417 | | | | 50 | | | | 467 | |
Corporate/Other Entities | | | | | - | | | | 77 | | | | - | | | | 77 | | | | 99 | | | | 176 | |
Government of Canada | | | | | 183 | | | | - | | | | - | | | | 183 | | | | - | | | | 183 | |
Provinces/Municipalities | | | | | - | | | | 125 | | | | - | | | | 125 | | | | 275 | | | | 400 | |
| Total Cash and Cash Equivalents | | | | | 177 | | | | 619 | | | | - | | | | 796 | | | | 424 | | | | 1,220 | |
| Investment Securities (Note 5): | | | | | | | | | | | | | | | | | | | | | | | | | | |
Designated at Fair Value through Profit or Loss | | | | | | | | | | | | | | | | | | | | | | | | | | |
Fixed Income | | | | | | | | | | | | | | | | | | | | | | | | | | |
Corporate/Other Entities | | | | | 111 | | | | 15 | | | | 137 | | | | 263 | | | | - | | | | 263 | |
Provinces/Municipalities | | | | | 615 | | | | - | | | | - | | | | 615 | | | | - | | | | 615 | |
Sovereign and Related Entities | | | | | - | | | | 50 | | | | - | | | | 50 | | | | - | | | | 50 | |
| Total Designated at Fair Value through Profit or Loss | | | | | 726 | | | | 65 | | | | 137 | | | | 928 | | | | - | | | | 928 | |
| Available for Sale | | | | | | | | | | | | | | | | | | | | | | | | | | |
Fixed Income | | | | | | | | | | | | | | | | | | | | | | | | | | |
Corporate/Other Entities | | | | | 4,981 | | | | - | | | | - | | | | 4,981 | | | | - | | | | 4,981 | |
Government of Canada | | | | | 5,240 | | | | - | | | | - | | | | 5,240 | | | | - | | | | 5,240 | |
Provinces/Municipalities | | | | | 5,571 | | | | - | | | | - | | | | 5,571 | | | | - | | | | 5,571 | |
Sovereign and Related Entities | | | | | 138 | | | | - | | | | - | | | | 138 | | | | - | | | | 138 | |
Equities | | | | | | | | | | | | | | | | | | | | | | | | | | |
Canadian | | | | | 2,094 | | | | - | | | | 14 | | | | 2,108 | | | | - | | | | 2,108 | |
U.S. | | | | | 843 | | | | - | | | | - | | | | 843 | | | | - | | | | 843 | |
Foreign | | | | | 423 | | | | - | | | | - | | | | 423 | | | | - | | | | 423 | |
Total Available for Sale | | | | | 19,290 | | | | - | | | | 14 | | | | 19,304 | | | | - | | | | 19,304 | |
Held for Trading | | | | | | | | | | | | | | | | | | | | | | | | | | |
Foreign Equities | | | | | 415 | | | | - | | | | - | | | | 415 | | | | - | | | | 415 | |
Total Held for Trading | | | | | 415 | | | | - | | | | - | | | | 415 | | | | - | | | | 415 | |
| Loans: | | | | | | | | | | | | | | | | | | | | | | | | | | |
Designated at Fair Value through Profit or Loss | | | | | - | | | | 6,591 | | | | - | | | | 6,591 | | | | - | | | | 6,591 | |
| Derivatives | | | | | - | | | | 131 | | | | - | | | | 131 | | | | - | | | | 131 | |
| Accounts Receivable and Other Assets | | | | | | | | | | | | | | | | | | | | | | | | | | |
Investment Property (Note 23) | | | | | - | | | | - | | | | 204 | | | | 204 | | | | - | | | | 204 | |
Other Accounts Receivable and Other Assets | | | | | - | | | | - | | | | - | | | | - | | | | 731 | | | | 731 | |
| Total Accounts Receivable and Other Assets | | | | | - | | | | - | | | | 204 | | | | 204 | | | | 731 | | | | 935 | |
| Assets not Recorded at Fair Value | | | | | - | | | | - | | | | - | | | | - | | | | 262,516 | | | | 262,516 | |
| TOTAL ASSETS | | | | | 20,608 | | | | 7,406 | | | | 355 | | | | 28,369 | | | | 263,671 | | | | 292,040 | |
| LIABILITIES AND EQUITY OF CANADA | | | | | | | | | | | | | | | | | | | | | | | | | | |
| Borrowings: | | | | | | | | | | | | | | | | | | | | | | | | | | |
Designated at Fair Value through Profit or Loss | | | | | 1,848 | | | | 6,659 | | | | - | | | | 8,507 | | | | - | | | | 8,507 | |
| Derivatives | | | | | - | | | | 46 | | | | - | | | | 46 | | | | - | | | | 46 | |
| Liabilities and Equity of Canada not Recorded at Fair Value | | | | | - | | | | - | | | | - | | | | - | | | | 283,487 | | | | 283,487 | |
| TOTAL LIABILITIES AND EQUITY OF CANADA | | | | | 1,848 | | | | 6,705 | | | | - | | | | 8,553 | | | | 283,487 | | | | 292,040 | |
Transfers may occur between levels of the fair value hierarchy as a result of changes in the availability of quoted market prices or observable market inputs. During the year ended 31 December 2013, there were no significant transfers between Level 1 and Level 2.
Level 3 Investment Securities and Investment Property are further discussed in Note 5 and Note 23, respectively.
| | |
| 136 C A N A D A M O R T G A G E A N D H O U S I N G C O R P O R A T I O N | | |
| | |
17. FINANCIAL INSTRUMENTS | | |
COMPARISON OF CARRYING AND FAIR VALUES
The following table compares the carrying and fair values of financial instruments, except where the carrying amount is a reasonable approximation of fair value. Carrying value is the amount at which an item is measured on the Consolidated Balance Sheet. Fair value is estimated using valuation methods as described in Note 2. All financial instruments are recognized initially at fair value. For items not carried at fair value on the Consolidated Balance Sheet, the hierarchy level for the disclosed fair value is provided below.
| | | | | | | | | | | | | | | | | | | | | | | | | | |
| | | | | Carrying Value | | | | | | | |
| (in millions) | | | | Amortized Cost | | | Fair Value through Net Income | | | Fair Value through OCI | | | Total | | | Fair Value | | | Fair Value Over (Under) Carrying Value | |
| | | | | 2013 | |
| Financial Assets | | | | | | | | | | | | | | | | | | | | | | | | | | |
| Cash and Cash Equivalents | | | | | 91 | | | | 587 | | | | 658 | | | | 1,336 | | | | 1,336 | | | | - | |
| Investment Securities: | | | | | | | | | | | | | | | | | | | | | | | | | | |
| Designated at Fair Value through Profit or Loss | | | | | - | | | | 1,012 | | | | - | | | | 1,012 | | | | 1,012 | | | | - | |
| Available for Sale | | | | | - | | | | - | | | | 19,659 | | | | 19,659 | | | | 19,659 | | | | - | |
| Held for Trading | | | | | - | | | | 444 | | | | - | | | | 444 | | | | 444 | | | | - | |
| Loans: | | | | | | | | | | | | | | | | | | | | | | | | | | |
| Designated at Fair Value through Profit or Loss | | | | | - | | | | 6,041 | | | | - | | | | 6,041 | | | | 6,041 | | | | - | |
| Loans and Receivables1 | | | | | 239,531 | | | | - | | | | - | | | | 239,531 | | | | 243,404 | | | | 3,873 | |
| Derivatives | | | | | - | | | | 96 | | | | - | | | | 96 | | | | 96 | | | | - | |
| Financial Liabilities | | | | | | | | | | | | | | | | | | | | | | | | | | |
| Securities Sold Under Repurchase Agreements1 | | | | | 91 | | | | - | | | | - | | | | 91 | | | | 91 | | | | - | |
| Borrowings: | | | | | | | | | | | | | | | | | | | | | | | | | | |
| Designated at Fair Value through Profit or Loss | | | | | - | | | | 7,818 | | | | - | | | | 7,818 | | | | 7,818 | | | | - | |
| Other Financial Liabilities2 | | | | | 237,378 | | | | - | | | | - | | | | 237,378 | | | | 241,402 | | | | 4,024 | |
| Derivatives | | | | | - | | | | 44 | | | | - | | | | 44 | | | | 44 | | | | - | |
| | | | | 2012 Restated Note 3 | |
| Financial Assets | | | | | | | | | | | | | | | | | | | | | | | | | | |
| Cash and Cash Equivalents | | | | | 424 | | | | 434 | | | | 362 | | | | 1,220 | | | | 1,220 | | | | - | |
| Securities Purchased Under Resale Agreements1 | | | | | 63 | | | | - | | | | - | | | | 63 | | | | 63 | | | | - | |
| Investment Securities: | | | | | | | | | | | | | | | | | | | | | | | | | | |
| Designated at Fair Value through Profit or Loss | | | | | - | | | | 928 | | | | - | | | | 928 | | | | 928 | | | | - | |
| Available for Sale | | | | | - | | | | - | | | | 19,304 | | | | 19,304 | | | | 19,304 | | | | - | |
| Held for Trading | | | | | - | | | | 415 | | | | - | | | | 415 | | | | 415 | | | | - | |
| Loans: | | | | | | | | | | | | | | | | | | | | | | | | | | |
| Designated at Fair Value through Profit or Loss | | | | | - | | | | 6,591 | | | | - | | | | 6,591 | | | | 6,591 | | | | - | |
| Loans and Receivables1 | | | | | 261,127 | | | | - | | | | - | | | | 261,127 | | | | 269,479 | | | | 8,352 | |
| Derivatives | | | | | - | | | | 131 | | | | - | | | | 131 | | | | 131 | | | | - | |
| Financial Liabilities | | | | | | | | | | | | | | | | | | | | | | | | | | |
| Securities Sold Under Repurchase Agreements1 | | | | | 425 | | | | - | | | | - | | | | 425 | | | | 425 | | | | - | |
| Borrowings: | | | | | | | | | | | | | | | | | | | | | | | | | | |
Designated at Fair Value through Profit or Loss | | | | | - | | | | 8,507 | | | | - | | | | 8,507 | | | | 8,507 | | | | - | |
Other Financial Liabilities2 | | | | | 259,271 | | | | - | | | | - | | | | 259,271 | | | | 267,846 | | | | 8,575 | |
| Derivatives | | | | | - | | | | 46 | | | | - | | | | 46 | | | | 46 | | | | - | |
| 1 | Fair value determined based on Level 2 Criteria. The Loans and Receivables fair value estimate is derived by discounting the assets’ cash flows. Inputs into the discount model are the Government of Canada yield curve and spreads derived from assets with comparable financial risks. |
| 2 | $206,812 million (2012 – $207,144 million) fair value determined based on Level 1 Criteria, $34,590 million (2012 – $60,702 million) fair value determined based on Level 2 Criteria. The Level 2 fair value estimate is derived by discounting the liability cash flows. Inputs into the discount model are the Government of Canada yield curve and spreads derived from instruments with comparable financial risks. |
The Corporation assessed that the fair value of Accrued Interest Receivable, Due from the Government of Canada, Accounts Receivable, Accrued Interest Payable and Accounts Payable approximates their carrying value largely due to the short-term maturities of these instruments.
CLASSIFICATION OF CASH AND CASH EQUIVALENTS
The following table presents a breakdown of Cash and Cash Equivalents by financial instrument classification.
| | | | | | | | |
| (in millions) | | 2013 | | | 2012 | |
| Designated at Fair Value through Profit or Loss | | | 587 | | | | 434 | |
| Available for Sale | | | 658 | | | | 362 | |
| Held to Maturity | | | 91 | | | | 424 | |
| Total Cash and Cash Equivalents | | | 1,336 | | | | 1,220 | |
GAINS AND LOSSES FROM FINANCIAL INSTRUMENTS
The unrealized gains and losses arising from changes in fair value related to financial instruments classified as HFT and those Designated at Fair Value through Profit or Loss are presented in the following table.
| | | | | | | | |
| (in millions) | | 2013 | | | 2012 | |
| Held for Trading | | | | | | | | |
| Equities | | | 85 | | | | 60 | |
| Derivatives | | | (34) | | | | (20) | |
| Total Held for Trading | | | 51 | | | | 40 | |
| Designated at Fair Value through Profit or Loss | | | | | | | | |
| Investment Securities – Designated at Fair Value through Profit or Loss | | | 10 | | | | 12 | |
| Loans – Designated at Fair Value through Profit or Loss | | | (102) | | | | (109) | |
| Borrowings – Designated at Fair Value through Profit or Loss | | | 153 | | | | 122 | |
| Total Designated at Fair Value through Profit or Loss | | | 61 | | | | 25 | |
| Total Net Unrealized Gains (Losses) | | | 112 | | | | 65 | |
All items Designated at Fair Value through Profit and Loss, with the exception of certain Investment Securities held within the Mortgage Loan Insurance and Securitization Activities, relate to the Lending Activity. For certain portfolios of loans and associated borrowings, the Lending Activity uses Derivatives to manage refinancing and reinvestment, as well as mismatches between the timing of receipts from assets and payments of liabilities. Classifying the Loans, and associated Borrowings, as Designated at Fair Value through Profit or Loss significantly reduces the measurement inconsistency that would otherwise arise from measuring them at amortized cost and measuring the Derivatives at fair value.
Certain Investment Securities within the Mortgage Loan Insurance and Securitization Activities are also classified as Designated at Fair Value as they are managed and reported to Management on a fair value basis.
There has been no change in the fair value of Loans – Designated at Fair Value through Profit or Loss as a result of changes in credit risk.
The realized gains and losses related to financial instruments are presented in the table below.
| | | | | | | | |
| (in millions) | | 2013 | | | 2012 | |
| Held for Trading | | | 2 | | | | (7) | |
| Available for Sale | | | 45 | | | | 157 | |
| Retirement of Debt | | | (1) | | | | (15) | |
| Total Net Realized Gains (Losses) | | | 46 | | | | 135 | |
| | |
| 138 C A N A D A M O R T G A G E A N D H O U S I N G C O R P O R A T I O N | | |
INTEREST INCOME, INVESTMENT INCOME AND INTEREST EXPENSE
The following table outlines the total interest income and expense calculated using the effective interest method for financial instruments.
| | | | | | | | | | | | | | | | | | | | | | | | | | |
| | | | | 2013 | | | 2012 | |
| (in millions) | | | | Interest Income | | | Investment Income | | | Interest Expense | | | Interest Income | | | Investment Income | | | Interest Expense | |
| Available for Sale Financial Assets | | | | | - | | | | 503 | | | | - | | | | - | | | | 496 | | | | - | |
| Held to Maturity Financial Assets | | | | | - | | | | 4 | | | | - | | | | - | | | | 5 | | | | - | |
| Securities Purchased Under Resale Agreements | | | | | 1 | | | | - | | | | - | | | | - | | | | - | | | | - | |
| Loans – Loans and Receivables | | | | | 6,938 | | | | - | | | | - | | | | 8,056 | | | | | | | | - | |
| Securities Sold Under Repurchase Agreements | | | | | - | | | | (4) | | | | - | | | | - | | | | (5) | | | | - | |
| Borrowings – Other Financial Liabilities | | | | | - | | | | - | | | | 6,801 | | | | - | | | | - | | | | 7,958 | |
| Total Interest for Financial Instruments not at Fair Value through Profit or Loss | | | | | 6,939 | | | | 503 | | | | 6,801 | | | | 8,056 | | | | 496 | | | | 7,958 | |
| Total Interest for Financial Instruments at Fair Value through Profit or Loss | | | | | 232 | | | | 1 | | | | 223 | | | | 265 | | | | 1 | | | | 250 | |
| Total Interest | | | | | 7,171 | | | | 504 | | | | 7,024 | | | | 8,321 | | | | 497 | | | | 8,208 | |
| Dividend Income | | | | | - | | | | 102 | | | | - | | | | - | | | | 101 | | | | - | |
| Total | | | | | 7,171 | | | | 606 | | | | 7,024 | | | | 8,321 | | | | 598 | | | | 8,208 | |
| | |
18. UNCONSOLIDATED STRUCTURED ENTITIES | | |
CMHC has interests in unconsolidated structured entities. These are summarized below:
| | | | | | | | |
| (in millions) | | 2013 | | | 2012 | |
| Investment Funds | | | 1,328 | | | | 1,266 | |
These investment funds are included in the Consolidated Balance Sheet in the line item ‘‘Investment Securities: Available for Sale’’. The maximum loss exposure represents the fair value at the reporting date. The gain from these investment funds included in Net Unrealized Gains from Financial Instruments in the Consolidated Statement of Income and Comprehensive Income is $300 million for the year ended 31 December 2013 (2012 – $159 million). CHMC receives distributions from these entities which are included in the Consolidated Statement of Income and Comprehensive Income.
Market risk is the risk of adverse financial impact arising from changes in underlying market factors, including interest rates, foreign exchange rates, and equity prices.
INTEREST RATE RISK
Interest rate risk is the risk that the fair value or future cash flows of a financial instrument will fluctuate because of changes in market interest rates.
The investment portfolios for the Mortgage Loan Insurance and Securitization Activities are managed in accordance with their Strategic Asset Allocation (SAA) policies, which limit interest rate risk relative to benchmark indices and ensure appropriate asset diversification. The Lending Activity is exposed to interest rate risk when asset and
liability principal and interest cash flows have different payment, repricing or maturity dates. Some of the Loans contain prepayment and/or repricing options. As CMHC does not have the right to prepay its Borrowings from the Government of Canada totalling $11,204 million (2012 – $11,806 million) without penalty, it is exposed to interest rate risk. Interest rate risk associated with the Lending Activity is managed through asset and liability matching using derivatives, as necessary, and capital market strategies.
CURRENCY RISK
Currency risk is the risk that the fair value or future cash flows of a financial instrument will fluctuate because of changes in foreign exchange rates.
The Corporation has assumed currency exposure to further its Mortgage Loan Insurance investment portfolio diversification. As at 31 December 2013, CMHC has $440 million in currency risk exposed holdings through its equity pooled funds classified as Held for Trading. The currencies to which CMHC has significant exposure at 31 December 2013 and the impact on Income before Income Taxes of a 10% shift in their value relative to the Canadian dollar are as follows:
| | | | | | | | | | | | |
| (in millions) | | Currency Risk Exposed Holdings | | | 10% Increase in Foreign Currency | | | 10% Decrease in Foreign Currency | |
| Euro Currency Unit | | | 166 | | | | 18 | | | | (15) | |
| Japanese Yen | | | 109 | | | | 12 | | | | (10) | |
| British Pound | | | 77 | | | | 9 | | | | (7) | |
| Swiss Franc | | | 36 | | | | 4 | | | | (3) | |
As at 31 December 2013, had the Canadian dollar strengthened or weakened by 10% in relation to all currencies, with all other variables held constant, the fair value of assets classified as Held for Trading in the Mortgage Loan Insurance portfolio would have increased or decreased, respectively, by approximately $44 million.
OTHER PRICE RISK
Other price risk is the risk that the fair value of future cash flows of a financial instrument will fluctuate because of changes in market prices. CMHC is exposed to other price risk through fluctuations in prices of equity investments held by the Mortgage Loan Insurance Activity. The fair value of these investments as at 31 December 2013 is $3,986 million (2012 – $3,789 million). The majority of equity investment assets are actively managed against selected benchmarks. CMHC limits its exposure by using tolerance ranges around the benchmarks for various diversification and exposure measures.
SENSITIVITY ANALYSES
Value at Risk (VaR): Market risk for investment securities in the Mortgage Loan Insurance and Securitization Activities is evaluated through the use of VaR models. VaR is a statistical technique used to measures the maximum potential loss of an investment portfolio over a specified holding period with a given level of confidence.
The total VaR for the Mortgage Loan Insurance and Securitization as at 31 December, calculated with 95% confidence over a 22 business day holding period is outlined in the table below. The effect of diversification reflects the fact that the risks are not perfectly correlated among individual portfolios and, as a result, total portfolio VaR is less than the sum of individual portfolio VaRs. The VaR figures are based on one-year of historical prices, volatilities and correlations of bond and equity markets.
To better reflect market risk, CMHC increased the holding period used in calculating VaR from two weeks to 22 business days. Accordingly, the VaR measurements for 31 December 2012 have been restated.
| | |
| 140 C A N A D A M O R T G A G E A N D H O U S I N G C O R P O R A T I O N | | |
| | | | | | | | |
| (in millions) | | 2013 | | | 2012 | |
| Investment Securities: | | | | | | | | |
Available for Sale | | | 339 | | | | 270 | |
Held for Trading | | | 26 | | | | 26 | |
| Effect of Diversification | | | (15) | | | | (23) | |
| Total VaR | | | 350 | | | | 273 | |
Interest Rate Sensitivity: Market risk for the Lending Activity portfolio of loans, investments, borrowings and swaps is evaluated by measuring their sensitivity to changes in interest rates.
Financial Instruments at Fair Value through Profit or Loss would react to a shift in interest rates as follows:
| | | | | | | | | | | | | | | | |
| | | 2013 | | | 2012 | |
| | | Interest Rate Shift | | | Interest Rate Shift | |
| (in millions) | | -200 bps | | | +200 bps | | | -200 bps | | | +200 bps | |
| Net Unrealized Gains (Losses) | | | 1 | | | | 4 | | | | - | | | | (1) | |
Loans and borrowings measured at amortized cost are also exposed to interest rate risk. The net impact of a shift in interest rates on their fair value would be as follows:
| | | | | | | | | | | | | | | | |
| | | 2013 | | | 2012 | |
| | | Interest Rate Shift | | | Interest Rate Shift | |
| (in millions) | | -200 bps | | | +200 bps | | | -200 bps | | | +200 bps | |
| Increase (Decrease) to Fair Value of Net Assets | | | (115) | | | | 69 | | | | (91) | | | | 70 | |
The Lending Activity’s net interest income is also sensitive to interest rate movements. The maximum negative exposure of net interest income, which is limited by CMHC policy to $1.5 million, is $0.1 million at 31 December 2013 (2012 – $0.2 million). This is calculated with 95% confidence over a one-year period.
LOANS AND RECEIVABLES – IMPP AND CMB PROGRAM
Loans under the IMPP and CMB program are exposed to both interest rate risk and prepayment/reinvestment risk. Prepayment/reinvestment risk is the risk that NHA MBS may experience varying degrees of prepayment throughout the term and these prepayments must be reinvested immediately.
To mitigate these risks, the Corporation enters into swap agreements with approved financial institution counterparties. Under these agreements, both interest rate and prepayment/reinvestment risks are transferred to swap counterparties. The Corporation will pay all interest received from the underlying NHA MBS and reinvestment assets to the swap counterparties and the swap counterparties pay an amount equal to the coupon payments on the Borrowings from the Government of Canada and Canada Mortgage Bonds, respectively. As a result of these swap agreements, changes in interest rates or prepayments/reinvestments have no impact on the Statement of Income and Comprehensive Income.
Credit risk is the risk of loss arising from a counterparty’s inability to fulfill its contractual obligations. The Corporation is exposed to credit risk from various sources. Detail of credit risk is presented below.
MAXIMUM EXPOSURE TO CREDIT RISK
| | | | | | | | |
| (in billions) | | 2013 | | | 2012 | |
| Timely Payment Guarantees: Guarantees-in-force (Note 10) | | | 398 | | | | 382 | |
| Mortgage Loan Insurance: Insurance-in-force (Note 13) | | | 557 | | | | 566 | |
| Loans (Note 6)1 | | | 246 | | | | 268 | |
| Investment Assets and Derivatives | | | 19 | | | | 18 | |
| Maximum Exposure to Credit Risk | | | 1,220 | | | | 1,234 | |
| 1 | The maximum exposure to credit risk for Loans – Designated at Fair Value through Profit or Loss is the carrying value of these loans, $6,041 million (2012 – $6,591 million). Credit risk associated with loans is mitigated through sources of guarantees as indicated in Note 6. |
Credit risk associated with timely payment guarantees is managed through due diligence in approving NHA MBS Issuers, ongoing monitoring of Issuer credit quality and program compliance, and the requirement that all mortgages supporting the NHA MBS be insured against borrower default. CMHC has further mitigated this risk by having been assigned all rights, title and interest in the underlying mortgages so that it has access to principal and interest payments in the event of Issuer default.
Credit risk associated with fixed income investments and derivatives is managed through the implementation of policies which include minimum counterparty credit ratings and investment portfolio diversification limits by issuer, credit rating, term and by industry sector, and through the use of appropriate legal agreements.
Concentration risk is the amount of credit risk the Corporation is exposed to in relation to specific counterparty and/or sectors. CMHC’s risk management policies address concentration risk from activities where the amount of potential loss can be measured (direct investments, lending and derivative transactions credit risk) at both the individual counterparty level and at the sector level and by credit rating. CMHC’s largest concentration of credit risk by individual counterparty is to the Government of Canada (2013 – $5,092 million, 2012 – $5,423 million), and the largest concentration of credit risk by sector is to the provincial sector (2013 – $6,475 million, 2012 – $6,260 million).
CREDIT QUALITY
The following table presents the credit quality of the Cash Equivalents and Investment Securities based on an internal credit rating system1.
| | | | | | | | | | | | | | | | | | | | | | | | | | | | | | | | |
| | | 2013 | | | 2012 | |
| (in millions) | | AAA | | | AA- to
AA+ | | | A- to
A+ | | | Lower
than A- | | | AAA | | | AA- to
AA+ | | | A- to
A+ | | | Lower
than A- | |
| Cash Equivalents | | | 774 | | | | 101 | | | | 462 | | | | - | | | | 724 | | | | 302 | | | | 200 | | | | - | |
| Investment Securities2 | | | | | | | | | | | | | | | | | | | | | | | | | | | | | | | | |
| Designated at Fair Value through Profit or Loss | | | 210 | | | | 436 | | | | 216 | | | | 150 | | | | 164 | | | | 456 | | | | 171 | | | | 137 | |
| Available for Sale | | | 6,183 | | | | 4,152 | | | | 5,214 | | | | 568 | | | | 6,616 | | | | 3,573 | | | | 5,171 | | | | 570 | |
| 1 | The internal credit ratings are based on internal assessments of counterparty creditworthiness, which amongst other considerations incorporate external credit rating agency evaluations. |
| 2 | Includes fixed income investments only. |
| | |
| 142 C A N A D A M O R T G A G E A N D H O U S I N G C O R P O R A T I O N | | |
Securities Purchased Under Resale Agreements
By their nature, these balances have a low credit risk given their short terms and are secured by the underlying securities purchased under the agreements and any incremental margin obtained from counterparties.
These transactions are subject to Global Master Repurchase Agreements which set out the standard terms of all repurchase agreements transacted with each counterparty. These agreements give CMHC a legally enforceable right to settle all repurchase transactions with the same counterparty on a net basis in the event of default. These agreements also provide for the posting of margin by the counterparty when CMHC’s exposure to that entity exceeds a certain ratings-based threshold. Securities held as eligible margin include debt obligations issued by or guaranteed by the Government of Canada, including Crown Corporations and CHT. Margin securities should not be used for any other purpose than to offset such exposure. In the event of counterparty default, CMHC has the right to liquidate these securities. The fair value of margin held by CMHC as at 31 December 2013 was nil (2012 – nil).
Derivatives
CMHC limits the credit risk associated with derivative transactions by dealing with swap counterparties whose credit ratings are in accordance with CMHC’s Enterprise Risk Management Policies; through the use of International Swaps Derivatives Association (ISDA) master agreements for derivatives; and where appropriate, through the use of ratings-based collateral thresholds in the Credit Support Annexes (CSA).
ISDA is a master agreement that sets out standard terms that apply to all transactions entered into between CMHC and the counterparty. The ISDA outlines procedures and calculations of termination costs in the event of default by either party. The ISDA master agreements give CMHC a legally enforceable right to settle all transactions, covered by the agreement, with the same counterparty on a net basis in the event of default. All derivative counterparties must have a minimum credit rating of A-, or its equivalent, from at least two rating agencies.
The CSA document, included in the ISDA master agreements, regulates the collateral requirements of swap transactions and the terms under which collateral is transferred to mitigate credit risk. The CSA gives CMHC the right, in the event of default, to liquidate collateral held and apply proceeds received from liquidation against amounts due from the counterparty. Collateral held to offset mark-to-market exposures is not used for any other purpose than to offset such exposure.
NETTING ARRANGEMENTS AND OFFSETTING OF FINANCIAL ASSETS AND FINANCIAL LIABILITIES
The following tables present the potential effects of the netting arrangements described above.
Financial assets
| | | | | | | | | | | | | | | | | | | | | | | | |
| | | | | | | | | | | | (iv) | | | | |
| | | (i) | | | (ii) | | | (iii) = (i) - (ii) | | | Gross Amount Not Offset in the Consolidated Balance Sheet | | | (v) = (iii) - (iv) | |
| (in millions) | | Gross Amount of Recognized Assets | | | Gross Amount Offset in the Consolidated Balance Sheet | | | Net Amount of Assets Presented in the Consolidated Balance Sheet1 | | | Financial Instruments2 | | | Financial Collateral Received3 | | | Net Amount | |
| | | | | | | | | 2013 | | | | | | | | | | |
| Derivatives1 | | | 138 | | | | - | | | | 138 | | | | (47) | | | | - | | | | 91 | |
| Securities Purchased Under Resale Agreements1 | | | - | | | | - | | | | - | | | | - | | | | - | | | | - | |
| Total | | | 138 | | | | - | | | | 138 | | | | (47) | | | | - | | | | 91 | |
| | | | | | | | | 2012 | | | | | | | | | | |
| Derivatives1 | | | 197 | | | | - | | | | 197 | | | | (50) | | | | (40) | | | | 107 | |
| Securities Purchased Under Resale Agreements1 | | | 63 | | | | - | | | | 63 | | | | - | | | | (63) | | | | - | |
| Total | | | 260 | | | | - | | | | 260 | | | | (50) | | | | (103) | | | | 107 | |
| 1 | Derivatives are carried at fair value. Securities Purchased Under Resale Agreements are carried at amortized cost. |
| 2 | Gross amounts of financial instruments not offset in the Consolidated Balance Sheet refers to amounts recorded to derivative liabilities and securities sold under repurchase agreements where CMHC has a legally enforceable right to offset against amounts recorded to derivative assets and securities purchased under resale agreements, on a counterparty-by-counterparty basis, in the event of default of the counterparty. |
| 3 | CMHC has the right, in the event of default, to liquidate and apply financial collateral held against amounts due from counterparties. For derivatives, these amounts represent the fair value of collateral posted by swap counterparties to CMHC. For securities purchased under resale agreements, these amounts represent fair value of margin posted by counterparties and of securities purchased by CMHC with the commitment to resell to the counterparty at a future date. |
Derivatives assets, as presented in the above table, are reconciled to the Consolidated Balance Sheet as follows:
| | | | | | | | |
| (in millions) | | 2013 | | | 2012 | |
| Derivatives Assets Presented in Offsetting Table | | | 138 | | | | 197 | |
| Less: Accrued Interest Receivable Presented Separately in Consolidated Balance Sheet | | | (42) | | | | (47) | |
| Less: Deferral of Swap Fees Received | | | - | | | | (19) | |
| Derivatives Asset Balance Presented in the Balance Sheet | | | 96 | | | | 131 | |
| | |
| 144 C A N A D A M O R T G A G E A N D H O U S I N G C O R P O R A T I O N | | |
Financial liabilities
| | | | | | | | | | | | | | | | | | | | | | | | |
| | | | | | | | | | | | (iv) | | | | |
| | | (i) | | | (ii) | | | (iii) = (i) - (ii) | | | Gross Amount Not Offset in the Consolidated Balance Sheet | | | (v) = (iii) - (iv) | |
| (in millions) | | Gross Amount of Recognized Liabilities | | | Gross Amount Offset in the Consolidated Balance Sheet | | | Net Amount of Liabilities Presented in the Consolidated Balance Sheet1 | | | Financial Instruments2 | | | Financial Collateral Received3 | | | Net Amount | |
| | | | | | | | | 2013 | | | | | | | | | | |
| Derivatives1 | | | 50 | | | | - | | | | 50 | | | | (47) | | | | - | | | | 3 | |
| Securities Sold Under Repurchase Agreements1 | | | 91 | | | | - | | | | 91 | | | | - | | | | (91) | | | | - | |
| Total | | | 141 | | | | - | | | | 141 | | | | (47) | | | | (91) | | | | 3 | |
| | | | | | | | | 2012 | | | | | | | | | | |
| Derivatives1 | | | 52 | | | | - | | | | 52 | | | | (50) | | | | - | | | | 2 | |
| Securities Sold Under Repurchase Agreements1 | | | 425 | | | | - | | | | 425 | | | | - | | | | (425) | | | | - | |
| Total | | | 477 | | | | - | | | | 477 | | | | (50) | | | | (425) | | | | 2 | |
| 1 | Derivatives are carried at Fair Value. Securities Sold Under Repurchase Agreements are carried at amortized cost. |
| 2 | Gross amounts of financial instruments not offset in the Consolidated Balance Sheet refers to amounts recorded to derivative assets and securities purchased under resale agreements where CMHC has a legally enforceable right to offset against amounts recorded to derivative liabilities and securities sold under repurchase agreements, on a counterparty-by-counterparty basis, in the event of default of the counterparty. |
| 3 | Represents the fair value of securities sold by CMHC to counterparties with the commitment by CMHC to repurchase from the counterparty at a future date. |
Derivatives liabilities, as presented in the above table, are reconciled to the Consolidated Balance Sheet as follows:
| | | | | | | | |
| (in millions) | | 2013 | | | 2012 | |
| Derivatives Liabilities Presented in Offsetting Table | | | 50 | | | | 52 | |
| Less: Accrued Interest Payable Presented Separately in Consolidated Balance Sheet | | | (6) | | | | (6) | |
| Derivative Liabilities Balance Presented in the Balance Sheet | | | 44 | | | | 46 | |
CREDIT EXPOSURE OF DERIVATIVES
The following table presents the credit exposure of derivatives by term to maturity. The replacement value is the total current fair value including accrued interest of all outstanding contracts with a positive fair value, after factoring in the impact of master netting agreements. The replacement value represents the Corporation’s maximum derivative credit exposure. Potential future credit exposure represents an estimate of the potential change in the market value of the transaction up to maturity which is calculated in relation to the notional principal of the contracts by applying factors consistent with guidelines issued by OSFI. Credit Equivalent is the total of the replacement value and the potential future credit exposure. The risk weighted equivalent is determined by applying a standard OSFI-defined measure of counterparty credit risk to the credit equivalent amount.
| | | | | | | | | | | | | | | | | | | | | | | | | | | | | | | | | | | | |
| | | Replacement value | | | | | | 2013 | | | 2012 | |
| (in millions) | | Within 1 Year | | | 1 to
3 Years | | | 3 to
5 Years | | | Over
5 Years | | | Potential
Future
Credit
Exposure | | | Credit Risk
Equivalent | | | Risk-
Weighted
Equivalent | | | Credit Risk
Equivalent | | | Risk-
Weighted
Equivalent | |
| Interest Rate Swaps | | | 3 | | | | 39 | | | | 36 | | | | 20 | | | | 12 | | | | 110 | | | | 22 | | | | 164 | | | | 33 | |
The fair value of the collateral related to derivatives held by CMHC as at 31 December 2013 was nil (2012 - $40 million).
LOANS AND RECEIVABLES – IMPP AND CMB PROGRAM
These loans represent amounts due from Canadian financial institutions as a result of the sale of their beneficial interest in NHA MBS securities to CMHC.
The Corporation has determined that substantially all of the risks and rewards of the NHA MBS have been retained by Issuers as a result of the swap agreements entered into between the Corporation and the Issuer. Accordingly, Issuers do not derecognize the NHA MBS from their balance sheets, and CMHC does not recognize the NHA MBS on its balance sheet. The Corporation accounts for the acquisition of its beneficial interest as a loan, collateralized by the NHA MBS and associated reinvestment securities. The collateral is held in the name of the Corporation and represents the sole source of principal repayments for the loan.
IMPP collateral held is limited to high quality assets as follows: cash, Government of Canada obligations, CMB, NHA MBS and eligible repurchase agreements of Government of Canada securities. CMB program collateral held is rated R-1 (high) or AAA by at least two rating agencies.
CMHC, under IMPP and the CMB program, is exposed to credit-related counterparty risk in the event of default of swap counterparties. This risk is mitigated by transacting with highly rated swap counterparties and collateralization requirements based on credit ratings. Under IMPP, all derivative counterparties must have a minimum credit rating of A-, or its equivalent, from at least two rating agencies. Under the CMB program, all swap counterparties must have a minimum credit rating of BBB (high), or its equivalent, by at least two rating agencies.
The fair value of the loan collateral is as follows:
| | | | | | | | |
| (in millions) | | 2013 | | | 2012 | |
| Loans under IMPP | | | 28,133 | | | | 52,992 | |
| Loans under the CMB program | | | 209,629 | | | | 206,470 | |
| Total | | | 237,762 | | | | 259,462 | |
Liquidity risk is the risk that the Corporation will encounter difficulty in meeting obligations associated with financial liabilities. Liquidity risk comprises both funding liquidity risk, which is the risk that CMHC will be unable to meet its payment obligations when required due to an inability to borrow or realize on overdraft facilities, and market liquidity risk, which is the risk that CMHC is not able to unwind or offset a particular position without incurring losses, because of inadequate market depth or market disruption.
The principal financial obligations exposing the Corporation to liquidity risk include, but are not limited to:
| n | | the payment of claims incurred by the Mortgage Loan Insurance Activity; |
| n | | the need to fulfill the timely payment guarantees provided by the Corporation if sufficient funds are not available for the payment of principal or interest on NHA MBS or CMB by Approved Issuers or CHT, respectively; and |
| n | | payments required by the Borrowings and Derivatives. |
The Corporation has a liquidity risk policy which includes appropriate limits and other mitigants to ensure sufficient resources to meet current and projected cash requirements.
The Mortgage Loan Insurance and Securitization investment portfolios are managed to ensure that there is sufficient cash flow to meet projected claims. Sources of liquidity include: fees, premiums, investment income and proceeds from sales and maturities of investments.
| | |
| 146 C A N A D A M O R T G A G E A N D H O U S I N G C O R P O R A T I O N | | |
Within the CMB Program, the liquidity risk refers to the risk that CMHC may not be able to provide the funding required, in a timely fashion, to satisfy a call on its timely payment guarantee obligation. As guarantor, CMHC is exposed to risk of Issuer default, repo and swap counterparty default, impairment of eligible collateral securities and system or other operational failures. Policies in place to mitigate this risk include ensuring high credit quality investments as permitted by the Trust Agreement and swap counterparties and the establishment of maturity monitoring guidelines. Liquidity sources in the event of an immediate need to fulfill the timely payment guarantee include overdraft facilities and cash and short-term investments in marketable securities as well as a $350 million line of credit with the Central Paying Agent. The Central Paying Agent acts on behalf of the Corporation to carry out certain payment functions including collection of monthly payments on NHA MBS purchased and administration and reporting of cash flows.
The Lending Activity investment portfolio is managed to ensure that there is sufficient cash flow to meet funding needs in case of contingencies causing operational disruptions, unanticipated needs, and to facilitate use of the Crown Borrowing Program. The asset/liability management strategy ensures that the assets are maintained at the same level as the liabilities. Derivatives are used to hedge mismatches in the timing of cash flows. Further sources of liquidity associated with this portfolio include overdraft facilities and cash and short-term investments in marketable securities. At 31 December 2013, CMHC had $300 million (2012 – $300 million) of overnight overdraft facility available with its banker that had not been drawn. For any additional liquidity requirements, CMHC can access the Crown Borrowing Program upon Department of Finance approval.
The Corporation also mitigates liquidity risk through the use of ISDA master netting agreements reducing the amount of cash required to satisfy derivative obligations.
The following table presents the undiscounted contractual cash flows payable by the Corporation, including accrued interest, under financial liabilities by remaining contractual maturities.
| | | | | | | | | | | | | | | | | | | | | | | | | | | | |
| (in millions) | | Within
1 Month | | | 1 to
3 Months | | | 3 to
12 Months | | | 1 to
5 Years | | | Over
5 Years | | | 2013 | | | 2012 | |
| Securities Sold Under Repurchase Agreements | | | - | | | | 91 | | | | - | | | | - | | | | - | | | | 91 | | | | 425 | |
| Borrowings – Designated at Fair Value through Profit and Loss | | | 100 | | | | 157 | | | | 868 | | | | 5,943 | | | | 1,296 | | | | 8,364 | | | | 9,014 | |
| Borrowings – Other Financial Liabilities | | | 8,161 | | | | 20,310 | | | | 39,302 | | | | 147,759 | | | | 45,976 | | | | 261,508 | | | | 284,854 | |
| Derivatives | | | 4 | | | | 6 | | | | 6 | | | | 21 | | | | 5 | | | | 42 | | | | 44 | |
| Total | | | 8,265 | | | | 20,564 | | | | 40,176 | | | | 153,723 | | | | 47,277 | | | | 270,005 | | | | 294,337 | |
Commitments related to Loans are outlined in Note 26. Financial guarantees are outlined in Note 10.
| | |
22. PENSION AND OTHER POST-EMPLOYMENT BENEFITS | | |
DEFINED BENEFIT PLANS
The defined benefit plans include the defined benefit component of the Pension Plan and the Supplemental Plan as well as the other non-pension post-employment defined benefit plans.
Effective 4 April 2013, the defined benefit component of the Pension Plan and the Supplemental Plan are closed to new entrants.
CMHC’s defined benefit component of the Pension Plan requires contributions to be made to a separately administered fund (the Pension Fund) whereas the defined benefit component of the Supplemental Plan and the other non-pension post-employment defined benefits are unfunded and the benefits are paid directly by the Corporation.
Pursuant to a trust agreement entered into between the Corporation and the Pension Fund Trustees (the Trustees), the Trustees are responsible for the management and administration of the Pension Fund. There are eight Trustees, including the President of CMHC, one member of the Board of Directors, three members of senior management and three Pension Council members (employee and retired members of the Pension Plan). The Trustees set investment policies and objectives within the context of the Enterprise Risk Management policies established by the Board of Directors, and periodically review the Pension Fund’s asset allocation policy. The Pension Fund’s Investment Committee assists the Trustees in the investment management of the defined benefit component of the Pension Plan.
The Pension Fund’s asset allocation policy is based upon the principle of diversification of investments among various asset classes relative to the liabilities of the defined benefit component of the Pension Plan. The current policy has been established at 57% public equity investments, 28% fixed income securities and 15% inflation sensitive investments. The policy includes permissible ranges around these percentage weights. The investments of the Pension Fund are subject to credit, liquidity and market risks. The most significant of these risks is asset volatility due to market conditions. The liabilities of the defined benefit component of the Pension Fund are adjusted to the Consumer Price Index and as such, they are subject to interest rate risks, inflation risk and changes in the life expectancy of the plan members. The most significant is interest rate risk as the present value of the liabilities is calculated using a discount rate set with reference to Canadian AA-Corporate bond yields. If the Pension Fund assets underperform this yield, the funded position of the defined benefit component of the Pension Plan decreases. Financial risks are managed primarily through the diversification of assets and prudent investment strategies.
The actuarial valuation on a going concern basis of CMHC’s defined benefit component of the Pension Plan is expected to report a deficit as at 31 December 2013. As a result, the Corporation is required to make going concern special payments of between $2 and $3 million annually for 14 years to amortize the going concern deficit. The valuation on a solvency basis, which assumes that the plan is wound up at the valuation date, is also expected to report a deficit as at 31 December 2013 and the Corporation is required to make special payments of $101 million in 2014 to reduce the solvency deficiency. As permitted under the Pension Benefits Standards Act, 1985 (PBSA) and its related regulations, the Corporation is seeking approval to reduce the amount of the solvency special payments. If the reduction is approved, it will decrease the solvency special payments in 2014 from $101 million to $51 million. As such, the total special payments are expected to be $54 million in 2014 (2013 – $81 million).
CMHC continues to make full normal contributions and to monitor the defined benefit component of the Pension Plan. The next actuarial valuation will be undertaken at year-end 2014, with the results reported in the 2014 Annual Report Financial Statements.
The defined benefit obligation relating to the defined benefit plans is funded as follows:
| | | | | | | | | | | | | | | | |
| | | Pension Benefit Plans | | | Other Post-employment Benefit Plans | |
| (in millions) | | 2013 | | | 2012 | | | 2013 | | | 2012 | |
| Wholly or Partially Funded | | | 1,667 | | | | 1,747 | | | | - | | | | - | |
| Wholly Unfunded | | | 52 | | | | 59 | | | | 175 | | | | 210 | |
| Defined Benefit Obligation | | | 1,719 | | | | 1,806 | | | | 175 | | | | 210 | |
| | |
| 148 C A N A D A M O R T G A G E A N D H O U S I N G C O R P O R A T I O N | | |
Obligation and Assets
Information about the defined benefit plans is as follows:
2013 changes in defined benefit liability
| | | | | | | | | | | | | | | | | | | | | | | | | | | | | | | | | | | | | | | | | | | | | | | | | | | | |
| | | | | | Pension Expense Included in Net Income | | | | | | Remeasurement Gains/Losses Included in OCI | | | | | | | | | | |
| (in millions) | | 1 January 2013 | | | Current Service Cost | | | Interest Cost/ Income | | | Sub-total Included in Net Income | | | Benefits Paid | | | Return of Plan Assets (Excluding Amounts Included in Interest Income) | | | Actuarial Changes Arising from Changes in Demographic Assumptions | | | Actuarial Changes Arising from Changes in Financial Assumptions | | | Actuarial Changes Arising from Plan Experience | | | Sub-total Included in OCI | | | Employees’ Contributions | | | CMHC’s Contributions1 | | | 31 December 2013 | |
| Pension Benefit Plans | | | | | | | | | | | | | | | | | | | | | | | | | | | | | | | | | | | | | | | | | | | | | | | | | | | | |
Defined Benefit Obligation | | | 1,806 | | | | 33 | | | | 70 | | | | 103 | | | | (77) | | | | - | | | | 107 | | | | (250) | | | | 15 | | | | (128) | | | | 15 | | | | - | | | | 1,719 | |
Fair Value of Plan Assets | | | 1,299 | | | | - | | | | 49 | | | | 49 | | | | (77) | | | | 153 | | | | - | | | | - | | | | - | | | | 153 | | | | 15 | | | | 105 | | | | 1,544 | |
| Pension Benefit Plans Liability | | | 507 | | | | 33 | | | | 21 | | | | 54 | | | | - | | | | (153) | | | | 107 | | | | (250) | | | | 15 | | | | (281) | | | | - | | | | (105) | | | | 175 | |
| Other Post-employment Benefit Plans | | | | | | | | | | | | | | | | | | | | | | | | | | | | | | | | | | | | | | | | | | | | | | | | | | | | |
Defined Benefit Obligation | | | 210 | | | | 6 | | | | 8 | | | | 14 | | | | (7) | | | | - | | | | 1 | | | | (39) | | | | (4) | | | | (42) | | | | - | | | | - | | | | 175 | |
Fair Value of Plan Assets | | | - | | | | - | | | | - | | | | - | | | | (7) | | | | - | | | | - | | | | - | | | | - | | | | - | | | | - | | | | 7 | | | | - | |
| Other Post-employment Benefit Plans Liability | | | 210 | | | | 6 | | | | 8 | | | | 14 | | | | - | | | | - | | | | 1 | | | | (39) | | | | (4) | | | | (42) | | | | - | | | | (7) | | | | 175 | |
| Defined Benefit Plans Liability | | | 717 | | | | 39 | | | | 29 | | | | 68 | | | | - | | | | (153) | | | | 108 | | | | (289) | | | | 11 | | | | (323) | | | | - | | | | (112) | | | | 350 | |
| 1 | The Pension Fund received interest income of $1 million from CMHC for its holdings of Canada Mortgage Bonds. |
2012 changes in defined benefit liability
| | | | | | | | | | | | | | | | | | | | | | | | | | | | | | | | | | | | | | | | | | | | | | | | | | | | |
| | | | | | Pension Expense Included in
Net Income | | | | | | Remeasurement Gains/Losses Included in OCI | | | | | | | | | | |
| (in millions) | | 1 January 2012 Restated Note 3 | | | Current Service Cost | | | Interest Cost/ Income | | | Sub-total Included in Net Income | | | Benefits Paid | | | Return of Plan Assets (Excluding Amounts Included in Interest Income) | | | Actuarial Changes Arising from Changes in Demographic Assumptions | | | Actuarial Changes Arising from Changes in Financial Assumptions | | | Actuarial Changes Arising from Plan Experience | | | Sub- total Included in OCI | | | Employees’ Contributions | | | CMHC’s Contributions1 | | | 31 December 2012 Restated Note 3 | |
| Pension Benefit Plans | | | | | | | | | | | | | | | | | | | | | | | | | | | | | | | | | | | | | | | | | | | | | | | | | | | | |
Defined Benefit Obligation | | | 1,599 | | | | 29 | | | | 72 | | | | 101 | | | | (69) | | | | - | | | | - | | | | 155 | | | | 7 | | | | 162 | | | | 13 | | | | - | | | | 1,806 | |
Fair Value of Plan Assets | | | 1,178 | | | | - | | | | 51 | | | | 51 | | | | (69) | | | | 81 | | | | - | | | | - | | | | - | | | | 81 | | | | 13 | | | | 45 | | | | 1,299 | |
| Pension Benefit Plans Liability | | | 421 | | | | 29 | | | | 21 | | | | 50 | | | | - | | | | (81) | | | | - | | | | 155 | | | | 7 | | | | 81 | | | | - | | | | (45) | | | | 507 | |
| Other Post-employment Benefit Plans | | | | | | | | | | | | | | | | | | | | | | | | | | | | | | | | | | | | | | | | | | | | | | | | | | | | |
Defined Benefit Obligation | | | 183 | | | | 5 | | | | 8 | | | | 13 | | | | (5) | | | | - | | | | - | | | | 22 | | | | (3) | | | | 19 | | | | - | | | | - | | | | 210 | |
Fair Value of Plan Assets | | | - | | | | - | | | | - | | | | - | | | | (5) | | | | - | | | | - | | | | - | | | | - | | | | - | | | | - | | | | 5 | | | | - | |
| Other Post-employment Benefit Plans Liability | | | 183 | | | | 5 | | | | 8 | | | | 13 | | | | - | | | | - | | | | - | | | | 22 | | | | (3) | | | | 19 | | | | - | | | | (5) | | | | 210 | |
| Defined Benefit Plans Liability | | | 604 | | | | 34 | | | | 29 | | | | 63 | | | | - | | | | (81) | | | | - | | | | 177 | | | | 4 | | | | 100 | | | | - | | | | (50) | | | | 717 | |
| 1 | The Pension Fund received interest income of $1 million from CMHC for its holdings of Canada Mortgage Bonds. |
| | |
| 150 C A N A D A M O R T G A G E A N D H O U S I N G C O R P O R A T I O N | | |
The Remeasurement of Plan Assets is the difference between the actual rate of return on the defined benefit pension plan assets and the discount rate used to measure the obligation. The actual return on plan assets was $202 million (2012 – $132 million).
Information on the fair value of the investments which are administered by the Trustees is as follows:
| | | | | | | | | | | | | | | | | | | | | | | | | | | | | | | | |
| | | | | | 2013 | | | | | | | | | | | | 2012 | | | | | | | |
(in millions unless
otherwise specified) | | Quoted | | | Unquoted | | | Total | | | In % | | | Quoted | | | Unquoted | | | Total | | | In % | |
| Cash and cash equivalents | | | 2 | | | | - | | | | 2 | | | | 0.1% | | | | 1 | | | | - | | | | 1 | | | | 0.1% | |
| Short-term Investments1 | | | 32 | | | | - | | | | 32 | | | | 2.1% | | | | 27 | | | | - | | | | 27 | | | | 2.1% | |
| Bonds and Debentures2 | | | | | | | | | | | | | | | | | | | | | | | | | | | | | | | | |
Securities Issued or Guaranteed by the Government of Canada | | | 96 | | | | - | | | | 96 | | | | 6.2% | | | | 79 | | | | - | | | | 79 | | | | 6.1% | |
Other Securities | | | 225 | | | | - | | | | 225 | | | | 14.6% | | | | 194 | | | | 1 | | | | 195 | | | | 15.1% | |
| Equities | | | | | | | | | | | | | | | | | | | | | | | | | | | | | | | | |
Canadian Equities | | | 475 | | | | - | | | | 475 | | | | 30.8% | | | | 393 | | | | - | | | | 393 | | | | 30.3% | |
Foreign Equities | | | 514 | | | | - | | | | 514 | | | | 33.3% | | | | 426 | | | | - | | | | 426 | | | | 32.9% | |
| Infrastructure | | | - | | | | 19 | | | | 19 | | | | 1.2% | | | | - | | | | - | | | | - | | | | - | |
| Real Return Securities3 | | | 29 | | | | - | | | | 29 | | | | 1.9% | | | | 33 | | | | - | | | | 33 | | | | 2.5% | |
| Real Estate | | | - | | | | 151 | | | | 151 | | | | 9.8% | | | | - | | | | 141 | | | | 141 | | | | 10.9% | |
| Total | | | 1,373 | | | | 170 | | | | 1,543 | | | | 100.0% | | | | 1,153 | | | | 142 | | | | 1,295 | | | | 100.0% | |
| 1 | Includes $32 million or 2.3% (2012 – $26 million or 2.0%) of investments made in securities issued or guaranteed by related parties. |
| 2 | Includes $33 million or 2.4% (2012 – $25 million or 1.9%) of investments made in securities guaranteed by the Corporation (Canada Mortgage Bonds) and $63 million or 4.6% (2012 – $54 million or 4.2%) of investments made in securities issued or guaranteed by related parties. |
| 3 | Includes $26 million or 1.9% (2012 – $30 million or 2.3%) of investments made in securities issued or guaranteed by related parties. |
Assumptions
The assets and defined benefit obligation of the defined benefits were measured for accounting purposes as at 31 December 2013. In performing this measurement, the following assumptions were adopted.
| | | | | | | | | | | | | | | | |
| | | Pension Benefit Plans | | | Other Post-employment Benefit Plans | |
| | | 2013 | | | 2012 | | | 2013 | | | 2012 | |
| Defined Benefit Obligation | | | | | | | | | | | | | | | | |
Discount Rate | | | 4.8% | | | | 3.9% | | | | 4.8% | | | | 3.9% | |
Rate of Compensation Increase | | | 3.0% | | | | 3.0% | | | | 3.0% | | | | 3.0% | |
| Benefit Costs | | | | | | | | | | | | | | | | |
Discount Rate | | | 3.9% | | | | 4.5% | | | | 3.9% | | | | 4.5% | |
Rate of Compensation Increase | | | 3.0% | | | | 3.0% | | | | 3.0% | | | | 3.0% | |
| Assumed Medical Cost Trend | | | | | | | | | | | | | | | | |
Initial Medical Cost Trend Rate | | | - | | | | - | | | | 6.7% | | | | 6.9% | |
Medical Cost Trend Rate Declines to1 | | | - | | | | - | | | | 4.5% | | | | 4.5% | |
Year that the Rate Reaches the Ultimate Trend Rate | | | - | | | | - | | | | 2029 | | | | 2029 | |
Life Expectancy of Plan Members
(reaching age 65 in 2013) | | | | | | | | | | | | | | | | |
Male | | | 22 years | | | | 19 years | | | | 22 years | | | | 19 years | |
Female | | | 24 years | | | | 22 years | | | | 24 years | | | | 22 years | |
| 1 | Average decrease per year 0.3% (2012 – 0.2%) |
The discount rates are determined by reference to Canadian AA-Corporate bonds with terms to maturity approximating the duration of the defined benefit obligation.
The mortality assumptions used are based on standard tables published by the Canadian Institute of Actuaries.
The Canadian Institute of Actuaries issued a revised Canadian Pensioners Mortality tables in July 2013. These tables were incorporated into the assumptions used to calculate the defined benefit obligation. As a result, the total defined benefit liability included in Accounts Payable and Other Liabilities on the Consolidated Balance Sheet as at 31 December 2013 is $119 million higher than it would have been had this change not been implemented.
Sensitivity
The following table shows the impact of changes in the assumptions.
| | | | | | | | |
| (in millions) | | Increase (Decrease) in Defined Benefit Obligation | | | Increase (Decrease) in Net Benefit Costs Recognized in Operating Expense | |
| 50 bps Increase/Decrease in Discount Rate | | | (139)/151 | | | | (9)/9 | |
| 50 bps Increase/Decrease in Rate of Compensation Increase | | | 23/(22) | | | | 3/(3) | |
| 100 bps Increase/Decrease in Health Care Cost Trend Rates | | | 22/(17) | | | | 3/(2) | |
| One year Increase in Life Expectancy of Plan Member | | | 51 | | | | 4 | |
The above sensitivity analyses are based on a change in one assumption while holding all other assumptions constant. In practice, this is unlikely to occur and changes in some of the assumptions might be correlated. The method and types of assumptions used in preparing the sensitivity analyses have not changed from the previous year, with the exception of the life expectancy assumption which changed as a result of the implementation of the new mortality tables, as discussed above.
Cash Flows
Cash payments for defined benefit plans were $112 million (2012 – $50 million).
In 2014, CMHC expects to make contributions to the defined benefit plans of approximately $79 million to $129 million, depending upon the actuarial valuation results of the defined benefit component of the Pension Plan, and ministerial approval of the reduction in solvency special payments.
The weighted average duration of the defined benefit obligation is 15 years. The distribution of the timing of benefit payments is shown in the table below:
| | | | | | | | | | | | | | | | | | | | |
| (in millions) | | Within 1 Year | | | 1 to
5 Years | | | 5 to
10 Years | | | 10 to
15 Years | | | Over
15 years | |
| Defined Benefit Plans Payments | | | 76 | | | | 326 | | | | 445 | | | | 480 | | | | 2,772 | |
In 2013, there was a net charge in the amount of $5 million (2012 - $5 million) from CMHC to the Pension Fund for administrative services related to the Pension Plan.
DEFINED CONTRIBUTION PLANS
The defined contribution plans include the defined contribution component of the Pension Plan and the Supplemental Plan.
Management approved the introduction of defined contribution plans for all new employees and for new eligible contract employees effective 4 April 2013. The defined contribution plans are administered by a third party.
| | |
| 152 C A N A D A M O R T G A G E A N D H O U S I N G C O R P O R A T I O N | | |
The Corporation determined that Investment Property consists of two categories based on the nature, characteristics and risks of each property. As at 31 December 2013, the total balance of Investment Property was $234 million (2012 – $204 million) of which $150 million was held by the Lending Activity and $84 million was held by the Mortgage Loan Insurance Activity. The properties included in Mortgage Loan Insurance Activity are rent producing properties and the properties included in Lending Activity are used to carry out CMHC’s social housing mandate.
The following table presents the changes in the Investment Property balance included in the Accounts Receivable and Other Assets financial line item.
| | | | | | | | | | | | | | | | | | | | | | | | |
| | | 2013 | | | 2012 | |
| (in millions) | | Mortgage
Loan Insurance | | | Lending | | | Total | | | Mortgage
Loan Insurance | | | Lending | | | Total | |
| Balance at Beginning of Year | | | 81 | | | | 123 | | | | 204 | | | | 75 | | | | 116 | | | | 191 | |
| Disposals | | | - | | | | - | | | | - | | | | (1) | | | | - | | | | (1) | |
| Unrealized Gains in Net Income1 | | | 3 | | | | 27 | | | | 30 | | | | 7 | | | | 7 | | | | 14 | |
| Balance at End of Year | | | 84 | | | | 150 | | | | 234 | | | | 81 | | | | 123 | | | | 204 | |
| 1 | Included in Other Income. |
FAIR VALUE
Investment properties are measured according to IFRS 13 Fair Value Measurement’s principles for non-financial assets which represent highest and best use of the property.
The highest and best use of Investment Property held by the Lending Activity differs from its current use as these investment properties are used to carry out CMHC’s social housing mandate.
Fair value hierarchy disclosures for these properties have been provided in Note 16.
Of the total fair value of investment properties, 32.9% (2012 – 9.1%) is based on valuations performed by independent valuators and 67.1% (2012 – 90.9%) is based on internal valuations.
The income approach is primarily applied in determining the fair value of rent-producing properties. Under the income approach, fair value is based upon the present value of expected future cash flows of each property using a discount rate reflective of the characteristics of the property. The income approach was used to measure $109 million (2012 – $99 million) of the total fair value of Investment Property.
The market approach is applied primarily in determining the fair value of vacant land. Under the market approach, fair value is based upon market transactions involving comparable property and this method was used to measure $125 million (2012 – $105 million).
Description of valuation techniques used and key inputs to valuation on Investment Property held by the Mortgage Loan Insurance and Lending Activities are as follows:
| | | | | | |
| | | Valuation Technique | | Unobservable Input | | Range (weighted average) |
| Mortgage Loan | | Discounted Cash Flow | | Estimated Rental Value per Square Feet | | $5 - $37 |
| Insurance | | | | Rent Growth | | 0.0% - 2.3% |
| | | | | Long-term Vacancy Rate | | 3.0% - 5.0% |
| | | | | Discount Rate | | 6.3% - 8.3% |
| Lending | | Discounted Cash Flow | | Estimated Rental Value per Square Feet | | $24 - $117 |
| | | | | Rent Growth | | 0.8% - 2.0% |
| | | | | Long-term Vacancy Rate | | 2.5% - 8.0% |
| | | | | Discount Rate | | 5.5% - 6.8% |
| | | Market Approach | | Value per Square Feet | | $0 - $222 |
SENSITIVITY INFORMATION
The valuation for Level 3 Investment Property includes unobservable inputs which may significantly affect the measurement of fair value. The valuation was based on its assessment of the prevailing conditions at 31 December 2013, which may change materially in subsequent periods.
Significant increases (decreases) in estimated rental value, rent growth and estimated price per square feet would result in a significantly higher (lower) fair value of the properties. Significant increases (decreases) in long-term vacancy rate and discount rate would result in a significantly lower (higher) fair value.
| | |
24. SEGMENTED INFORMATION | | |
As described in Note 1, the Consolidated Financial Statements include the accounts of CMHC’s four activities (Mortgage Loan Insurance, Securitization, Housing Programs and Lending Activity), each of which provides different programs in support of CMHC’s objectives, and the CHT. The financial results of each activity are determined using the accounting policies described in Note 2. The Lending Activity includes certain corporate items that are not allocated to each activity. The Housing Programs Activity includes reimbursements to the Lending Activity as described in Note 8. These reimbursements are not eliminated in the following table. Revenues are attributed to, and assets are located in, Canada.
| | |
| 154 C A N A D A M O R T G A G E A N D H O U S I N G C O R P O R A T I O N | | |
| | | | | | | | | | | | | | | | | | | | | | | | | | | | | | | | | | | | | | | | | | | | | | | | | | | | | | | | |
| | | Mortgage Loan Insurance | | | Securitization | | | Housing Programs | | | Lending | | | Canada Housing Trust | | | Eliminations | | | Total | |
| (in millions) | | 2013 | | | 2012 Restated Note 3 | | | 2013 | | | 2012 Restated Note 3 | | | 2013 | | | 2012 Restated Note 3 | | | 2013 | | | 2012 Restated Note 3 | | | 2013 | | | 2012 Restated Note 3 | | | 2013 | | | 2012 Restated Note 3 | | | 2013 | | | 2012 Restated Note 3 | |
| Parliamentary Appropriations for Housing Programs | | | - | | | | - | | | | - | | | | - | | | | 2,071 | | | | 2,197 | | | | - | | | | - | | | | - | | | | - | | | | - | | | | - | | | | 2,071 | | | | 2,197 | |
| Premiums and Fees Earned | | | 1,754 | | | | 1,807 | | | | 247 | | | | 242 | | | | - | | | | - | | | | - | | | | - | | | | - | | | | - | | | | - | | | | - | | | | 2,001 | | | | 2,049 | |
| Interest Income | | | | | | | | | | | | | | | | | | | | | | | | | | | | | | | | | | | | | | | | | | | | | | | | | | | | | | | | |
Loans | | | - | | | | - | | | | 1,453 | | | | 1,682 | | | | - | | | | - | | | | 577 | | | | 580 | | | | 5,081 | | | | 5,999 | | | | - | | | | - | | | | 7,111 | | | | 8,261 | |
Other | | | - | | | | - | | | | - | | | | - | | | | - | | | | - | | | | 69 | | | | 72 | | | | - | | | | - | | | | (9) | | | | (12) | | | | 60 | | | | 60 | |
| | | | - | | | | - | | | | 1,453 | | | | 1,682 | | | | - | | | | - | | | | 646 | | | | 652 | | | | 5,081 | | | | 5,999 | | | | (9) | | | | (12) | | | | 7,171 | | | | 8,321 | |
| Interest Expense | | | - | | | | - | | | | 1,453 | | | | 1,682 | | | | - | | | | - | | | | 580 | | | | 634 | | | | 5,073 | | | | 5,990 | | | | (82) | | | | (98) | | | | 7,024 | | | | 8,208 | |
| Net Interest Income | | | - | | | | - | | | | - | | | | - | | | | - | | | | - | | | | 66 | | | | 18 | | | | 8 | | | | 9 | | | | 73 | | | | 86 | | | | 147 | | | | 113 | |
| Investment Income | | | 612 | | | | 600 | | | | 31 | | | | 33 | | | | - | | | | - | | | | - | | | | - | | | | - | | | | - | | | | (37) | | | | (35) | | | | 606 | | | | 598 | |
| Net Realized Gains (Losses) | | | 53 | | | | 92 | | | | 1 | | | | 84 | | | | - | | | | - | | | | - | | | | - | | | | - | | | | - | | | | (8) | | | | (41) | | | | 46 | | | | 135 | |
| Net Unrealized Gains (Losses) | | | 92 | | | | 66 | | | | - | | | | 5 | | | | - | | | | - | | | | 15 | | | | (8) | | | | - | | | | - | | | | 5 | | | | 2 | | | | 112 | | | | 65 | |
| Other Income | | | 14 | | | | 7 | | | | 26 | | | | 27 | | | | - | | | | - | | | | 54 | | | | 31 | | | | 161 | | | | 168 | | | | (97) | | | | (101) | | | | 158 | | | | 132 | |
| TOTAL REVENUES | | | 2,525 | | | | 2,572 | | | | 305 | | | | 391 | | | | 2,071 | | | | 2,197 | | | | 135 | | | | 41 | | | | 169 | | | | 177 | | | | (64) | | | | (89) | | | | 5,141 | | | | 5,289 | |
| EXPENSES | | | | | | | | | | | | | | | | | | | | | | | | | | | | | | | | | | | | | | | | | | | | | | | | | | | | | | | | |
| Housing Programs | | | - | | | | - | | | | - | | | | - | | | | 2,071 | | | | 2,197 | | | | - | | | | - | | | | - | | | | - | | | | - | | | | - | | | | 2,071 | | | | 2,197 | |
| Insurance Claims | | | 309 | | | | 487 | | | | - | | | | - | | | | - | | | | - | | | | - | | | | - | | | | - | | | | - | | | | - | | | | - | | | | 309 | | | | 487 | |
| Operating Expenses | | | 225 | | | | 211 | | | | 29 | | | | 24 | | | | - | | | | - | | | | 22 | | | | 27 | | | | 169 | | | | 177 | | | | (97) | | | | (102) | | | | 348 | | | | 337 | |
| | | | 534 | | | | 698 | | | | 29 | | | | 24 | | | | 2,071 | | | | 2,197 | | | | 22 | | | | 27 | | | | 169 | | | | 177 | | | | (97) | | | | (102) | | | | 2,728 | | | | 3,021 | |
| INCOME BEFORE INCOME TAXES | | | 1,991 | | | | 1,874 | | | | 276 | | | | 367 | | | | - | | | | - | | | | 113 | | | | 14 | | | | - | | | | - | | | | 33 | | | | 13 | | | | 2,413 | | | | 2,268 | |
| Income Taxes | | | 484 | | | | 469 | | | | 69 | | | | 95 | | | | - | | | | - | | | | 22 | | | | 2 | | | | - | | | | - | | | | 9 | | | | 3 | | | | 584 | | | | 569 | |
| NET INCOME (LOSS) | | | 1,507 | | | | 1,405 | | | | 207 | | | | 272 | | | | - | | | | - | | | | 91 | | | | 12 | | | | - | | | | - | | | | 24 | | | | 10 | | | | 1,829 | | | | 1,699 | |
| Total Revenues | | | 2,525 | | | | 2,572 | | | | 305 | | | | 391 | | | | 2,071 | | | | 2,197 | | | | 135 | | | | 41 | | | | 169 | | | | 177 | | | | (64) | | | | (89) | | | | 5,141 | | | | 5,289 | |
| Inter-segment/entity Revenues1 | | | (45) | | | | (77) | | | | - | | | | - | | | | - | | | | - | | | | (4) | | | | (9) | | | | (15) | | | | (3) | | | | 64 | | | | 89 | | | | - | | | | - | |
| External Revenues | | | 2,480 | | | | 2,495 | | | | 305 | | | | 391 | | | | 2,071 | | | | 2,197 | | | | 131 | | | | 32 | | | | 154 | | | | 174 | | | | - | | | | - | | | | 5,141 | | | | 5,289 | |
| 1 | Inter-segment/entity Revenues relate to the following: |
| | ¡ | the Mortgage Loan Insurance Activity recognizes revenues from investing in holdings of Canada Mortgage Bonds; |
| | ¡ | the Lending Activity recognizes revenues from investing in holdings of Canada Mortgage Bonds; and |
| | ¡ | the Securitization Activity receives CMB guarantee fees and advisory fees from CHT, and recognizes revenues from investing in holdings of Capital Market Borrowings. |
| | | | | | | | | | | | | | | | | | | | | | | | | | | | | | | | | | | | | | | | | | | | | | | | | | | | | | | | |
| | | Mortgage Loan Insurance | | | Securitization | | | Housing Programs | | | Lending | | | Canada Housing
Trust | | | Eliminations1 | | | Total | |
| (in millions) | | 2013 | | | 2012
Restated
Note 3 | | | 2013 | | | 2012
Restated
Note 3 | | | 2013 | | | 2012
Restated
Note 3 | | | 2013 | | | 2012
Restated
Note 3 | | | 2013 | | | 2012
Restated
Note 3 | | | 2013 | | | 2012
Restated
Note 3 | | | 2013 | | | 2012
Restated
Note 3 | |
| ASSETS | | | | | | | | | | | | | | | | | | | | | | | | | | | | | | | | | | | | | | | | | | | | | | | | | | | | | | | | |
| Cash and Cash Equivalents | | | 749 | | | | 759 | | | | 1 | | | | 27 | | | | - | | | | - | | | | 585 | | | | 433 | | | | 1 | | | | 1 | | | | - | | | | - | | | | 1,336 | | | | 1,220 | |
| Securities Purchased Under Resale Agreements | | | - | | | | - | | | | - | | | | - | | | | - | | | | - | | | | - | | | | 63 | | | | - | | | | - | | | | - | | | | - | | | | - | | | | 63 | |
| Investment Securities: | | | | | | | | | | | | | | | | | | | | | | | | | | | | | | | | | | | | | | | | | | | | | | | | | | | | | | | | |
Designated at Fair Value through Profit or Loss | | | 83 | | | | 75 | | | | 1 | | | | 1 | | | | - | | | | - | | | | 1,253 | | | | 1,282 | | | | - | | | | - | | | | (325) | | | | (430) | | | | 1,012 | | | | 928 | |
Available for Sale | | | 19,704 | | | | 19,064 | | | | 1,894 | | | | 1,799 | | | | - | | | | - | | | | - | | | | - | | | | - | | | | - | | | | (1,939) | | | | (1,559) | | | | 19,659 | | | | 19,304 | |
Held for Trading | | | 444 | | | | 415 | | | | - | | | | - | | | | - | | | | - | | | | - | | | | - | | | | - | | | | - | | | | - | | | | - | | | | 444 | | | | 415 | |
| Loans: | | | | | | | | | | | | | | | | | | | | | | | | | | | | | | | | | | | | | | | | | | | | | | | | | | | | | | | | |
Designated at Fair Value through Profit or Loss | | | - | | | | - | | | | - | | | | - | | | | - | | | | - | | | | 6,041 | | | | 6,591 | | | | - | | | | - | | | | - | | | | - | | | | 6,041 | | | | 6,591 | |
Loans and Receivables | | | - | | | | - | | | | 28,074 | | | | 52,448 | | | | - | | | | - | | | | 4,835 | | | | 5,160 | | | | 206,622 | | | | 203,519 | | | | - | | | | - | | | | 239,531 | | | | 261,127 | |
| Accrued Interest Receivable | | | 104 | | | | 97 | | | | 42 | | | | 83 | | | | - | | | | - | | | | 226 | | | | 245 | | | | 492 | | | | 540 | | | | (5) | | | | (6) | | | | 859 | | | | 959 | |
| Derivatives | | | - | | | | - | | | | - | | | | - | | | | - | | | | - | | | | 96 | | | | 131 | | | | - | | | | - | | | | - | | | | - | | | | 96 | | | | 131 | |
| Due from the Government of Canada | | | - | | | | - | | | | - | | | | - | | | | - | | | | - | | | | 311 | | | | 309 | | | | - | | | | - | | | | - | | | | - | | | | 311 | | | | 309 | |
| Accounts Receivable and Other Assets | | | 457 | | | | 617 | | | | 59 | | | | (25) | | | | - | | | | - | | | | 246 | | | | 343 | | | | - | | | | - | | | | - | | | | - | | | | 762 | | | | 935 | |
| Deferred Income Tax Assets | | | - | | | | (20) | | | | - | | | | 1 | | | | - | | | | - | | | | - | | | | 42 | | | | - | | | | - | | | | - | | | | 35 | | | | - | | | | 58 | |
| | | | 21,541 | | | | 21,007 | | | | 30,071 | | | | 54,334 | | | | - | | | | - | | | | 13,593 | | | | 14,599 | | | | 207,115 | | | | 204,060 | | | | (2,269) | | | | (1,960) | | | | 270,051 | | | | 292,040 | |
| LIABILITIES | | | | | | | | | | | | | | | | | | | | | | | | | | | | | | | | | | | | | | | | | | | | | | | | | | | | | | | | |
| Securities Sold Under Repurchase Agreements | | | 91 | | | | 425 | | | | - | | | | - | | | | - | | | | - | | | | - | | | | - | | | | - | | | | - | | | | - | | | | - | | | | 91 | | | | 425 | |
| Borrowings: | | | | | | | | | | | | | | | | | | | | | | | | | | | | | | | | | | | | | | | | | | | | | | | | | | | | | | | | |
Designated at Fair Value through Profit or Loss | | | - | | | | - | | | | - | | | | - | | | | - | | | | - | | | | 7,832 | | | | 8,521 | | | | - | | | | - | | | | (14) | | | | (14) | | | | 7,818 | | | | 8,507 | |
Other Financial Liabilities | | | - | | | | - | | | | 28,074 | | | | 52,448 | | | | - | | | | - | | | | 4,841 | | | | 5,147 | | | | 206,622 | | | | 203,519 | | | | (2,159) | | | | (1,843) | | | | 237,378 | | | | 259,271 | |
| Accrued Interest Payable | | | - | | | | - | | | | 36 | | | | 77 | | | | - | | | | - | | | | 129 | | | | 142 | | | | 492 | | | | 540 | | | | (5) | | | | (6) | | | | 652 | | | | 753 | |
| Derivatives | | | - | | | | - | | | | - | | | | - | | | | - | | | | - | | | | 44 | | | | 46 | | | | - | | | | - | | | | - | | | | - | | | | 44 | | | | 46 | |
| Accounts Payable and Other Liabilities | | | 245 | | | | 488 | | | | 15 | | | | 35 | | | | - | | | | - | | | | 556 | | | | 734 | | | | 1 | | | | 1 | | | | - | | | | - | | | | 817 | | | | 1,258 | |
| Provision for Claims | | | 869 | | | | 996 | | | | - | | | | - | | | | - | | | | - | | | | - | | | | - | | | | - | | | | - | | | | - | | | | - | | | | 869 | | | | 996 | |
| Unearned Premiums and Fees | | | 5,947 | | | | 6,394 | | | | 564 | | | | 546 | | | | - | | | | - | | | | - | | | | - | | | | - | | | | - | | | | - | | | | - | | | | 6,511 | | | | 6,940 | |
| Deferred Income Tax Liabilities | | | 73 | | | | - | | | | (14) | | | | - | | | | - | | | | - | | | | (1) | | | | - | | | | - | | | | - | | | | (25) | | | | - | | | | 33 | | | | - | |
| | | | 7,225 | | | | 8,303 | | | | 28,675 | | | | 53,106 | | | | - | | | | - | | | | 13,401 | | | | 14,590 | | | | 207,115 | | | | 204,060 | | | | (2,203) | | | | (1,863) | | | | 254,213 | | | | 278,196 | |
| EQUITY OF CANADA | | | 14,316 | | | | 12,704 | | | | 1,396 | | | | 1,228 | | | | - | | | | - | | | | 192 | | | | 9 | | | | - | | | | - | | | | (66) | | | | (97) | | | | 15,838 | | | | 13,844 | |
| | | | 21,541 | | | | 21,007 | | | | 30,071 | | | | 54,334 | | | | - | | | | - | | | | 13,593 | | | | 14,599 | | | | 207,115 | | | | 204,060 | | | | (2,269) | | | | (1,960) | | | | 270,051 | | | | 292,040 | |
| 1 | The Balance Sheet Eliminations remove inter-entity holdings of Canada Mortgage Bonds and Capital Market Borrowings, as well as inter-segment receivables/payables. |
| | |
| 156 C A N A D A M O R T G A G E A N D H O U S I N G C O R P O R A T I O N | | |
| | |
25. RELATED PARTY TRANSACTIONS | | |
The related parties include the Government of Canada and its departments; agencies and Crown Corporations; Key Management Personnel and their close family members and the pension plan.
All material related party transactions and outstanding balances are either disclosed below or in relevant notes.
In accordance with IAS 24, transactions or balances between the entities that have been eliminated on consolidation are not reported.
GOVERNMENT OF CANADA AND ITS DEPARTMENTS, AGENCIES AND CROWN CORPORATIONS
The Corporation is related in terms of common ownership to all Government of Canada departments, agencies and Crown Corporations. The Corporation enters into transactions with certain of these entities in the normal course of business.
| a) | The following tables summarize income earned and receivable as well as the total amount invested in instruments issued or guaranteed by the Government of Canada. |
| | | | | | | | |
| (in millions) | | 2013 | | | �� 2012 | |
| Investment Income – Cash Equivalents | | | 4 | | | | 6 | |
| Investment Income – Investment Securities | | | 119 | | | | 101 | |
| | | | | | | | |
| (in millions) | | 2013 | | | 2012 | |
| Cash Equivalents | | | 392 | | | | 182 | |
| Investment Securities | | | 4,749 | | | | 5,240 | |
| Interest Receivable – Investment Securities | | | 17 | | | | 18 | |
| b) | CMHC pays the Government of Canada fees in recognition of the Government’s financial backing of the Mortgage Loan Insurance and Securitization Activities. The fees, which are recorded in Operating Expenses, amount to $12 million (2012 – $12 million) for the Securitization Activity and nil (2012 – nil) for the Mortgage Loan Insurance Activity. |
KEY MANAGEMENT PERSONNEL
The following table presents the compensation of Key Management, defined as those persons having authority and responsibility for planning, directing and controlling its activities. This includes the Board of Directors and the following members of the Management Committee: the President and CEO, the Senior Vice-President, Corporate Services, the Chief Financial Officer, the Chief Risk Officer, the Vice-Presidents, the General Counsel and the Corporate Secretary, and the Chief, Audit and Evaluation Services.
| | | | | | | | | | | | | | | | | | | | | | | | |
| | | | | | 2013 | | | | | | | | | 2012 | | | | |
| (in thousands) | | Board of Directors | | | Management Committee Members | | | Total | | | Board of Directors | | | Management Committee Members | | | Total | |
| Short-term Benefits | | | 212 | | | | 4,361 | | | | 4,573 | | | | 241 | | | | 3,625 | | | | 3,866 | |
| Post-employment Benefits | | | - | | | | 814 | | | | 814 | | | | - | | | | 624 | | | | 624 | |
| Total | | | 212 | | | | 5,175 | | | | 5,387 | | | | 241 | | | | 4,249 | | | | 4,490 | |
Receivable balances outstanding with members of Key Management Personnel as at 31 December 2013 are nil.
| | |
26. COMMITMENTS AND CONTINGENT LIABILITIES | | |
| a) | Commitments outstanding for Loans, net of forgiveness, amounted to $99 million at 31 December 2013 (2012 – $123 million) and are normally advanced within a two-year period. |
| b) | Commitments outstanding for advances to mortgage-insured assisted housing projects in financial difficulty amounted to $44 million at 31 December 2013 (2012 – $47 million) and are normally advanced within a ten-year period. Advances in the amount of $43 million are expected to be made over the next five years and the remainder to be advanced beyond five years. |
| c) | Total estimated remaining contractual financial obligations are as follows: |
| | | | | | | | | | | | | | | | | | | | | | | | |
| (in millions) | | 2014 | | | 2015 | | | 2016 | | | 2017 | | | 2018 | | | 2019 and
Thereafter | |
| Housing Programs1 | | | 1,631 | | | | 1,528 | | | | 1,456 | | | | 1,406 | | | | 1,362 | | | | 9,310 | |
| Operating Leases | | | 18 | | | | 14 | | | | 13 | | | | 11 | | | | 11 | | | | 39 | |
| Finance Leases | | | 4 | | | | 3 | | | | - | | | | - | | | | - | | | | - | |
| Total | | | 1,653 | | | | 1,545 | | | | 1,469 | | | | 1,417 | | | | 1,373 | | | | 9,349 | |
| | 1 | Total remaining contractual financial obligations for Housing Programs extend for periods up to 26 years (2012 – 27 years). |
| d) | In addition to the lines of credit disclosed in Note 21, CMHC has a $101 million (2012 – $88 million) letter of credit outstanding. This letter of credit can be accessed when required. |
| e) | There are legal claims of $24 million (2012 – $43 million) against CMHC. Due to the uncertainty of the outcome of these claims, no provision for loss has been recorded. CMHC does not expect the ultimate resolution of any of the proceedings to which CMHC is party to have a significant adverse effect on its financial position. |
| f) | Total guarantees-in-force represent $398 billion (2012 – $382 billion) as at 31 December 2013. No provision is required as CMHC determined that, at the Consolidated Balance Sheet date, the best estimate of the amount required to settle the timely payment guarantee obligation is less than the balance of the unearned timely payment guarantee fees (refer to note 10). |
| g) | Total insurance-in-force represents $557 billion (2012 – $566 billion) as at 31 December 2013. A Provision for Claims has been recorded (refer to note 13). |
The following table presents the composition of Operating Expenses.
| | | | | | | | |
| (in millions) | | 2013 | | | 2012
Restated
Note 3 | |
| Personnel Costs | | | 259 | | | | 264 | |
| Depreciation of Premises and Equipment | | | 3 | | | | 3 | |
| Other Administrative Goods and Services | | | 202 | | | | 193 | |
| | | | 464 | | | | 460 | |
| Less: Housing Programs Operating Expenses1 | | | (116) | | | | (123) | |
| Total Operating Expenses | | | 348 | | | | 337 | |
| 1 | These expenses represent operating costs incurred by CMHC to support and administer housing programs. These costs are reimbursed by the Government of Canada through parliamentary appropriations and are recognized in Housing Programs expenses (refer to Note 8). |
| | |
| 158 C A N A D A M O R T G A G E A N D H O U S I N G C O R P O R A T I O N | | |
| | |
28. CURRENT AND NON-CURRENT ASSETS AND LIABILITIES | | |
| | | | | | | | | | | | | | | | | | | | | | | | |
| | | 2013 | | | 2012 Restated Note 3 | |
| (in millions) | | Within
1 year | | | After 1 year | | | Total | | | Within
1 year | | | After
1 year | | | Total | |
| ASSETS | | | | | | | | | | | | | | | | | | | | | | | | |
| Cash and Cash Equivalents | | | 1,336 | | | | - | | | | 1,336 | | | | 1,220 | | | | - | | | | 1,220 | |
| Securities Purchased Under Resale Agreements | | | - | | | | - | | | | - | | | | 63 | | | | - | | | | 63 | |
| Investment Securities: | | | | | | | | | | | | | | | | | | | | | | | | |
Designated at Fair Value through Profit or Loss | | | 117 | | | | 895 | | | | 1,012 | | | | 55 | | | | 873 | | | | 928 | |
Available for Sale | | | 192 | | | | 19,467 | | | | 19,659 | | | | 225 | | | | 19,079 | | | | 19,304 | |
Held for Trading | | | - | | | | 444 | | | | 444 | | | | - | | | | 415 | | | | 415 | |
| Loans: | | | | | | | | | | | | | | | | | | | | | | | | |
Designated at Fair Value through Profit or Loss | | | 715 | | | | 5,326 | | | | 6,041 | | | | 1,052 | | | | 5,539 | | | | 6,591 | |
Loans and Receivables | | | 62,367 | | | | 177,164 | | | | 239,531 | | | | 58,471 | | | | 202,656 | | | | 261,127 | |
| Accrued Interest Receivable | | | 859 | | | | - | | | | 859 | | | | 959 | | | | - | | | | 959 | |
| Derivatives | | | 3 | | | | 93 | | | | 96 | | | | 1 | | | | 130 | | | | 131 | |
| Due from the Government of Canada | | | 214 | | | | 97 | | | | 311 | | | | 175 | | | | 134 | | | | 309 | |
| Accounts Receivable and Other Assets | | | 119 | | | | 643 | | | | 762 | | | | 307 | | | | 628 | | | | 935 | |
| Deferred Income Tax Assets | | | - | | | | - | | | | - | | | | - | | | | 58 | | | | 58 | |
| | | | 65,922 | | | | 204,129 | | | | 270,051 | | | | 62,528 | | | | 229,512 | | | | 292,040 | |
| LIABILITIES | | | | | | | | | | | | | | | | | | | | | | | | |
| Securities Sold Under Repurchase Agreements | | | 91 | | | | - | | | | 91 | | | | 425 | | | | - | | | | 425 | |
| Borrowings: | | | | | | | | | | | | | | | | | | | | | | | | |
Designated at Fair Value through Profit or Loss | | | 935 | | | | 6,883 | | | | 7,818 | | | | 1,738 | | | | 6,769 | | | | 8,507 | |
Other Financial Liabilities | | | 62,472 | | | | 174,906 | | | | 237,378 | | | | 58,672 | | | | 200,599 | | | | 259,271 | |
| Accrued Interest Payable | | | 652 | | | | - | | | | 652 | | | | 753 | | | | - | | | | 753 | |
| Derivatives | | | 3 | | | | 41 | | | | 44 | | | | 3 | | | | 43 | | | | 46 | |
| Accounts Payable and Other Liabilities | | | 296 | | | | 521 | | | | 817 | | | | 371 | | | | 887 | | | | 1,258 | |
| Provision for Claims | | | 522 | | | | 347 | | | | 869 | | | | 688 | | | | 308 | | | | 996 | |
| Unearned Premiums and Fees | | | 1,700 | | | | 4,811 | | | | 6,511 | | | | 1,792 | | | | 5,148 | | | | 6,940 | |
| Deferred Income Tax Liabilities | | | - | | | | 33 | | | | 33 | | | | - | | | | - | | | | - | |
| | | | 66,671 | | | | 187,542 | | | | 254,213 | | | | 64,442 | | | | 213,754 | | | | 278,196 | |
| NET | | | (749) | | | | 16,587 | | | | 15,838 | | | | (1,914) | | | | 15,758 | | | | 13,844 | |


| | | | | | |
| ¢ | | Other Information |
| |
| | CMHC Board of Directors |
| |
| | As at 31 December 2013 |
| | Robert P. Kelly Chairperson Chair of the Corporate Governance and Nominating Committee Douglas A. Stewart Interim President and Chief Executive Officer Sophie Joncas Vice-Chairperson Chair of the Audit Committee | | Ian Shugart Deputy Minister, Employment and Social Development Canada Michael Horgan Deputy Minister, Finance Canada Michael Gendron Chair of the Risk Management Committee | | E. Anne MacDonald Chair of the Human Resources Committee Brian Johnston James A. Millar Rennie Pieterman André G. Plourde |
| | | |
| | | |
| | | |
| | | |
| | | |
| | | |
| | Please refer to our website for full biographies: www.cmhc.ca |
| | Compensation and Attendance Record |
| | | | | | | | | | | | | | |
| | | | | Attendance/Meetings |
| | | | | | | Committee |
| Member | | Compensation ($) | | Board of Directors | | Governance and
Nominating | | Audit | | Human Resources | | Risk Management | | Pension Fund Trustees |
| Robert P. Kelly1 | | 27,771 | | 4/4 | | 4/4 | | 1* | | 3/3* | | 1* | | 1* |
| Karen Kinsley2 | | N/A | | 3/3 | | 3/3 | | 2/2* | | 3/3* | | 2/2* | | 2/2 |
| Douglas A. Stewart3 | | N/A | | 3/3 | | 3/3 | | 2/2* | | 2/2* | | 2/2* | | 2/2 |
| Michael Gendron | | 23,863 | | 6/6 | | - | | 4/4 | | - | | 4/4 | | - |
| Michael Horgan4 | | N/A | | 5/6 | | - | | - | | - | | 3/4 | | - |
| Brian Johnston | | 21,491 | | 4/6 | | - | | 4/4 | | - | | - | | - |
| Sophie Joncas | | 36,542 | | 6/6 | | 6/6 | | 4/4 | | - | | - | | - |
| E. Anne MacDonald | | 26,042 | | 6/6 | | - | | - | | 5/5 | | - | | - |
| James A. Millar | | 24,773 | | 6/6 | | 6/6 | | - | | 5/5 | | - | | - |
| Rennie Pieterman | | 25,700 | | 6/6 | | - | | - | | 5/5 | | - | | - |
| André G. Plourde | | 26,142 | | 6/6 | | - | | - | | - | | 4/4 | | 4/4 |
| Ian Shugart | | N/A | | 5/6 | | 5/6 | | - | | - | | - | | - |
| | 1 | Appointed 29 April 2013 |
| | 2 | Term ended 16 June 2013 |
| | 3 | Designated as Interim President effective 17 June 2013 |
| | 4 | Pursuant to subsection 6 (1.2) of the CMHC Act, the Deputy Minister designated Mr. Jean Boivin, Associate Deputy Minister, to attend Board meetings. Mr. Boivin attended the August Board of Directors and Risk Management Committee meetings, as well as the December Board of Directors meeting, on Mr. Horgan’s behalf. |
| | * | Attended as a non-member |

CMHC Management
As at 31 December 2013
Douglas A. Stewart
Interim President and Chief Executive Officer
NATIONAL OFFICE
Senior Vice-President:
Pierre Sabourin
Senior Vice-President, Corporate Services
Vice-Presidents:
| | |
Debra Darke Acting Vice-President, Regional Operations
and Assisted Housing Sébastien Gignac General Counsel and Corporate Secretary Michel Laurence Acting Vice-President, Policy, Research and Planning Charles MacArthur Vice-President, Insurance Business Strategy
and Development1 Steven Mennill Vice-President, Insurance Operations1 Brian Naish Chief Financial Officer | | Pierre Serré Chief Risk Officer Gail Tolley Vice-President, Human Resources,
Communications and Marketing Wojo Zielonka Vice-President, Capital Markets Executive Directors: Charles Chenard Executive Director, Corporate Marketing Peter De Barros Executive Director, Communications Serge Gaudet Chief, Audit and Evaluation |
| |
| |
| |
| |
| |
| |
| |
| |
| |
| |
| |
| |
| |
| |
| |
| |
REGIONAL BUSINESS CENTRES
General Managers:
| | |
Fatima Barros General Manager, Prairie and Territories Business Centre Isabelle Bougie General Manager, Quebec Business Centre Peter Friedmann General Manager, Ontario Business Centre and National Director, Leadership Development | | Christina Haddad General Manager, Atlantic Business Centre Janice Rice General Manager, British Columbia Business Centre |
| |
| |
| |
| |
| |
| |
| 1 | Titles revised effective 6 January 2014. |
| | |
| 162 C A N A D A M O R T G A G E A N D H O U S I N G C O R P O R A T I O N | | |
Glossary
ACRONYMS
| | |
| AANDC | | Aboriginal Affairs and Northern |
| | Development Canada |
| |
| CGAAP | | Canadian Generally Accepted |
| | Accounting Principles |
| |
| CHT | | Canada Housing Trust |
| |
| CMB | | Canada Mortgage Bonds |
| |
| ESDC | | Employment and Social |
| | Development Canada |
| |
| FAA | | Financial Administration Act |
| | |
| |
| FNMHF | | First Nations Market Housing Fund |
| |
| IAH | | Investment in Affordable Housing |
| |
| IFRS | | International Financial Reporting Standards |
| |
| IMPP | | Insured Mortgage Purchase Program |
| |
| LTV | | Loan-to-Value |
| |
| MCT | | Minimum Capital Test |
| |
| MILP | | Municipal Infrastructure Lending Program |
| |
| NHA MBS | | National Housing Act Mortgage-Backed |
| | Securities |
Affordable Housing Initiative 2001-2011 (AHI)
Under the AHI, the Government of Canada, in partnership with provinces and territories, provided funding to increase the supply of affordable housing. In 2011, a new framework for federal funding of affordable housing, the Framework for Investment in Affordable Housing (2011-2014), was introduced.
Canada Housing Trust (CHT)
The CHT is a special purpose trust that acquires interests in eligible insured housing loans, such as National Housing Act Mortgage-Backed Securities, and issues Canada Mortgage Bonds. The CHT also purchases highly rated investments and undertakes certain related financial hedging activities. CMHC acts as the financial services advisor to the CHT, determining market demand for bond issuance, and engaging an underwriting syndicate to underwrite bond issues. The day-to-day activities of the CHT are administered through a third-party trust administrator.
Canada Mortgage Bonds (CMB)
Bullet maturity bonds (face value payable at maturity of the bond) that are either fixed-rate with a semi-annual coupon or floating rate with a quarterly coupon. CMB are issued by the CHT.
Core Housing Need
A household is in core housing need if its housing does not meet one or more of the adequacy, suitability or affordability housing standards and it would have to spend 30% or more of its before-tax income to pay the median rent (including utility costs) of alternative local market housing that meets all three of these standards.
| n | | Adequate housing does not require any major repairs, according to residents. Major repairs include those to defective plumbing or electrical wiring, or structural repairs to walls, floors or ceilings. |
| n | | Suitable housing has enough bedrooms for the size and make-up of resident households, according to National Occupancy Standard (NOS) requirements. Enough bedrooms based on NOS requirements means one bedroom for each cohabiting adult couple; unattached household member 18 years of age and over; same-sex pair of children under age 18; and additional boy or girl in the family, unless there are two opposite sex children under 5 years of age, in which case they are expected to share a bedroom. A household of one individual can occupy a bachelor unit (i.e., a unit with no bedroom). |
| n | | Affordable housing costs less than 30% of before-tax household income. For renters, shelter costs include rent and any payments for electricity, fuel, water and other municipal services. For owners, shelter costs include mortgage payments (principal and interest), property taxes, and any condominium fees, along with payments for electricity, fuel, water and other municipal services. |
Covered bond
A debt obligation in relation to which the principal and interest owing are guaranteed to be paid from the loans or other assets held by the guarantor entity. Under the Canadian covered bond legal framework, assets may not include insured mortgages. CMHC is responsible for administering the covered bond legal framework.
emili
A proprietary online automated mortgage insurance risk assessment and approval system developed by CMHC.
EQuilibrium™ Sustainable Housing
Demonstration Initiative
Goals of CMHC’s EQuilibrium™ Sustainable Housing Demonstration Initiative:
| n | | to promote environmentally friendly, healthy housing across Canada; |
| n | | to enhance the capacity of Canada’s home builders, developers, architects and engineers to design and build sustainable homes and communities across the country; |
| n | | to educate consumers on the benefits of owning sustainable housing and achieve market acceptance of sustainable housing and communities; and, |
| n | | to enhance Canada’s domestic and international leadership and business opportunities in sustainable housing design, construction services and technologies. |
First Nations Market Housing Fund (FNMHF)
The FNMHF, an independent trust, is overseen by nine trustees appointed by the Minister for CMHC and the Minister of Aboriginal Affairs and Northern Development. CMHC, on behalf of the GoC, contributed $300 million to the Fund under a Funding Agreement with the Trustees of the FNMHF in 2007. The FNMHF operates a credit enhancement facility for housing loans on First Nation reserves and supports initiatives designed to enhance First Nations capabilities related to managing housing programs.
Index Linked Mortgage (ILM)
A mortgage loan with an interest rate set on the basis of a fixed real rate of return, combined with a variable rate adjusted annually according to the actual changes in inflation as measured by the Consumer Price Index.
Insured Mortgage Purchase Program (IMPP)
A program established by the Government of Canada which authorized CMHC to purchase up to $125 billion in NHA MBS from Canadian financial institutions between October 2008 and March 2010 as a temporary measure to maintain the availability of longer-term credit in Canada. A total of $69.3 billion in NHA MBS was purchased by CMHC through a competitive auction process.
Investment in Affordable Housing 2011-2019 (IAH)
A new Framework for the Investment in Affordable Housing was announced on 4 July 2011. The IAH provided for $1.4 billion over 3 years (2011-2014) in combined federal/ provincial/territorial funding towards reducing the number of Canadians in housing need. This became the basis for bilateral IAH agreements between CMHC, on behalf of the Government of Canada, and provinces and territories. Where provinces and territories chose not to enter into an IAH arrangement, federal funding for housing was provided through extensions of existing arrangements with respect to AHI and/or renovation programs. Economic Action Plan 2013 announced the Government of Canada’s continued commitment to working with provinces and territories to develop and implement solutions to housing by investing more than $1.25 billion over five years to renew the IAH from 2014 to 2019.
(Approved) Issuer
A business organization which, having met the criteria established by CMHC, is approved to issue and administer NHA MBS.
Lending Activity
CMHC makes loans under the National Housing Act (NHA) to federally-subsidized social housing sponsors, First Nations, provinces, territories and municipalities as well as non-subsidized housing support loans. CMHC’s loan portfolio is comprised of a mix of renewable and non-renewable loans which may be on reserve or off reserve.
Direct Lending is the current borrowing initiative used by CMHC to refinance its renewable loans as well as to finance new commitments on reserve. These loans can be financed at lower interest rates due to
| | |
| 164 C A N A D A M O R T G A G E A N D H O U S I N G C O R P O R A T I O N | | |
CMHC’s status as a federal Crown corporation. As such, CMHC is able to lower the cost of government assistance required for social housing projects. Direct Lending is operated on a planned break-even basis.
Mortgage loan insurance products
Transactional homeowner insurance – default insurance for loans secured by residential properties of 4 or less units issued at the time the loan is originated, the cost of which is usually passed on to the borrower. This is comprised of:
| | n | | High ratio homeowner loans – the borrower has less than a 20 per cent down payment at origination. At least one of the units must be owner-occupied. Mortgage loan insurance on these loans is a legislative requirement for federally regulated as well as for most provincially regulated lenders. |
| | n | | Low ratio homeowner loans – the borrower has a down payment of 20 per cent or more at origination. Mortgage loan insurance on these loans is not a legislative requirement; however, lenders may require mortgage loan insurance as a condition of approving the loan. Units can be owner-occupied or non-owner occupied (i.e., rental units). |
Portfolio insurance – default insurance for pools of low ratio loans secured by residential properties of 4 or less units, previously uninsured on a transactional basis and that must be under repayment. Insurance is purchased and paid for by the lender.
Multi-unit residential insurance – default insurance for loans for the construction, purchase and refinancing of multi-unit residential properties consisting of 5 or more units. These properties include rental buildings, licensed care facilities and retirement homes, affordable housing projects, condominium construction and purpose-built student housing.
Municipal Infrastructure Lending Program 2009-2011 (MILP)
Under Canada’s Economic Action Plan (Budget 2009), CMHC provided $2 billion in direct low-cost loans to municipalities over a two-year period ending 31 March 2011 to fund housing-related municipal infrastructure.
National Housing Act Mortgage-Backed Securities (NHA MBS)
A security which represents an undivided interest in a pool of residential mortgages insured by CMHC or by a licensed private sector insurer and which has the full timely payment guarantee of CMHC’s Securitization Activity. Scheduled principal repayments by the borrower and an agreed rate of interest on the mortgages in an NHA MBS pool are paid to investors monthly. In addition, depending on the particular issue of NHA MBS, these payments can vary from month to month if, for example, borrowers make unscheduled payments such as advance payments of principal on a mortgage. Securities under the NHA MBS program are issued by Approved Issuers (primarily lending institutions).
Percentage (estimated) of Outstanding Canadian Residential Mortgages with CMHC Insurance Coverage
The CMHC insured portion of the total Canadian mortgage population1.
Percentage (estimated) of Outstanding Canadian Residential Mortgages with CMHC Securitization Guarantee
The portion of the total Canadian mortgage population2 that are currently securitized through NHA MBS.
Proposal Development Funding (PDF)
An interest-free loan of up to $100,000 to support activities carried out during the early stages of developing an affordable housing project. PDF is available for projects that are expected to be developed without long-term Government of Canada subsidies. Eligible costs include soil load-bearing tests, environmental site assessments, project drawings and specifications, development permits and certain professional and consulting fees. The loan is repayable upon the first advance of mortgage funding and a portion of the loan may be forgiven if it meets criteria for affordable housing as defined by CMHC.
Reference Level
The amount of funding that the Treasury Board has approved for departments and agencies to carry out policies and programs for each year of the planning period.
| 1 | Total Canadian mortgage population as determined by the Bank of Canada. |
Renovation programs on reserve
| n | | Residential Rehabilitation Assistance Program (RRAP) |
A program which provides financial assistance to First Nations to enable them undertake repair of housing units or to adapt them to accommodate the needs of residents with disabilities as well as to convert non-residential properties into residential units.
| n | | Home Adaptations for Seniors’ Independence (HASI) |
A program which provides financial assistance to carry out minor adaptations to assist senior live independently in their own homes.
| n | | Shelter Enhancement Program (SEP) |
A program which provides financial assistance to repair, rehabilitate and improve existing shelters for victims of family violence. The program also assists in the acquisition or construction of new shelters and second stage housing.
Funding for renovation programs off reserve is provided by the Government of Canada through the Investment in Affordable Housing framework.
Schedule 1 Banks
Schedule I banks are domestic banks authorized under the Bank Act to accept deposits, which may be eligible for deposit insurance provided by the Canadian Deposit Insurance Corporation. Schedule I banks are banks that are not a subsidiary of a foreign bank authorized under the Bank Act to carry on business in Canada.
Seed Funding
Seed Funding consists of a contribution and a loan, totalling a maximum of $20,000 to support activities carried out in the early stages of developing affordable housing project proposals. Eligible expenses include costs for housing market studies, need and demand analyses, the preparation of business plans, preliminary financial viability analyses, preliminary project designs, as well as the costs to incorporate an entity. The loan portion of Seed Funding is repayable upon the first advance of mortgage funding.
��
| | |
| 166 C A N A D A M O R T G A G E A N D H O U S I N G C O R P O R A T I O N | | |
CMHC Performance Measures
STRATEGIC PRIORITY 1.1
Housing Program expenses
Expenses primarily related to existing social housing programs. These programs include: public housing programs, non-profit housing programs, rent supplement programs, the Rural and Native Housing Program, Urban Native Housing Program, and co-operative housing programs. New commitments under these programs ceased in 1993, except for the On-Reserve Non-Profit Housing Program under Strategic Priority 1.2.
Affordable housing expenditures
The sum of federal funding provided under the Investment in Affordable Housing (IAH) Framework.
Estimated households assisted through long-term social housing commitments
Includes households who live in social housing off reserve developed between 1946 and 1993 and households living in units on reserve committed under the On-Reserve Non-Profit Housing Program.
STRATEGIC PRIORITY 1.2
New units committed under the On-Reserve Non-Profit Housing Program
The total number of units committed on a fiscal year basis under this program, which assists First Nations in the construction, purchase and rehabilitation, and administration of suitable, adequate and affordable housing on reserve. CMHC provides a subsidy to projects to assist with its financing and operation for a period of up to 25 years.
Renovation program expenditures
Federal expenditures disbursed under CMHC’s renovation programs. The renovation programs provide financial assistance in the form of a fully forgivable loan to Band Councils and their members to repair substandard homes to a minimum level of health and safety, provided the owner maintains continued ownership and occupancy of the dwelling or the landlord, in the case of a rental property, places a ceiling on rents that may be charged after repair and limits increases during the term of an operating agreement.
Per cent of housing programs and services delivered through First Nations or Aboriginal organizations
The average of the following:
| n | | Per cent of RRAP accounts on reserve delivered by Aboriginal agents. |
| n | | Per cent of technical services provided under the On-Reserve Non-Profit Housing Program. This is based on the number of technical reviews completed on new units for the purpose of advancing funds and physical condition reviews which are carried out on existing units. |
| n | | Per cent of Aboriginal capacity development service contract dollars paid to Aboriginal service providers. |
STRATEGIC PRIORITY 2.1
Total insured volume (units) and Total insured volume ($)
The total number of units and value of insured loans that were finalized and for which premiums were received for homeowner and multi-unit properties, as well as for portfolio insurance.
Per cent of the total multi-unit and high ratio homeowner units approved to address less-served markets and/or to support specific Government of Canada priorities
The ratio of total public policy mortgage loan insurance volumes approved to total mortgage loan insurance volumes excluding portfolio insurance approved.
Public policy approved volumes include those in multi-unit properties (in excess of 4 units), including nursing and retirement homes, units with chattel mortgage loan insurance, social housing units both on and off reserve, and units in rural areas.
(Public policy approved volumes)/(Total approved volumes excluding portfolio) x 100
STRATEGIC PRIORITY 2.2
Annual securities guaranteed
NHA MBS for which CMHC issued guarantees during the year. Once guaranteed, NHA MBS may be issued directly into capital markets or purchased by the Canada Housing Trust under the Canada Mortgage Bond Program.
STRATEGIC PRIORITY 3.2
Forecast accuracy of housing starts
The difference expressed as a percentage between CMHC’s forecasted housing starts and actual starts.
HUMAN RESOURCES
Level of employee engagement
The level of employee engagement cited in this report is derived from a series of employee survey questions that examine three dimensions of engagement. To be fully engaged, employees must have a rational understanding of CMHC’s strategic goals, values and how they fit; an emotional attachment to CMHC; and, motivation and willingness to help CMHC succeed.
INFORMATION TECHNOLOGY
Technology index for key systems
Calculated by comparing the actual availability of the mission-critical business applications against their planned availability.
| | |
| 168 C A N A D A M O R T G A G E A N D H O U S I N G C O R P O R A T I O N | | |
CMHC Offices
NATIONAL OFFICE
700 Montreal Road
Ottawa, Ontario K1A 0P7
613-748-2000
REGIONAL BUSINESS CENTRES
ATLANTIC
1894 Barrington Street, 9th Floor
Halifax, Nova Scotia B3J 2A8
902-426-3530
QUEBEC
1100 René-Lévesque Blvd.West, 1st Floor
Montréal, Quebec H3B 5J7
514-283-2222
ONTARIO
100 Sheppard Avenue East, Suite 300
Toronto, Ontario M2N 6Z1
416-221-2642
PRAIRIES AND TERRITORIES
1000 – 7th Avenue SW, Suite 200
Calgary, Alberta T2P 5L5
403-515-3000
BRITISH COLUMBIA
1111 West Georgia Street, Suite 2000
Vancouver, British Columbia V6E 4S4
604-731-5733
SECURITIZATION OPERATIONS
130 Adelaide Street W., Suite 200
Toronto, Ontario M5H 3P5
GRANVILLE ISLAND OFFICE
1661 Duranleau Street, 2nd Floor
Vancouver, British Columbia V6H 3S3
604-666-6655