EXHIBIT 99.2
2015 ANNUAL REPORT
WHY
Housing Matters
Canada
CMHC SCHL
CMHC
Canada’s authority
on housing
Our Mandate
Facilitate access
to housing
Contribute to
financial stability
Our Mission
We help
Canadians meet
their housing needs
Our Vision
The heart of a
world-leading
housing system
CONTENTS
MESSAGES 4
MANAGEMENT’S DISCUSSION AND ANALYSIS 9
Condensed Consolidated Financial Results 10
Operating Environment 12
Corporate Performance Framework 16
Risk Management 18
Performance by Activity 24
Market Analysis and Research 24
Assisted Housing 27
Mortgage Loan Insurance 33
Securitization 41
People and Processes 46
Historical Information 51
EXPECTED OUTCOMES 53
CONSOLIDATED FINANCIAL STATEMENTS 57
OTHER INFORMATION 117
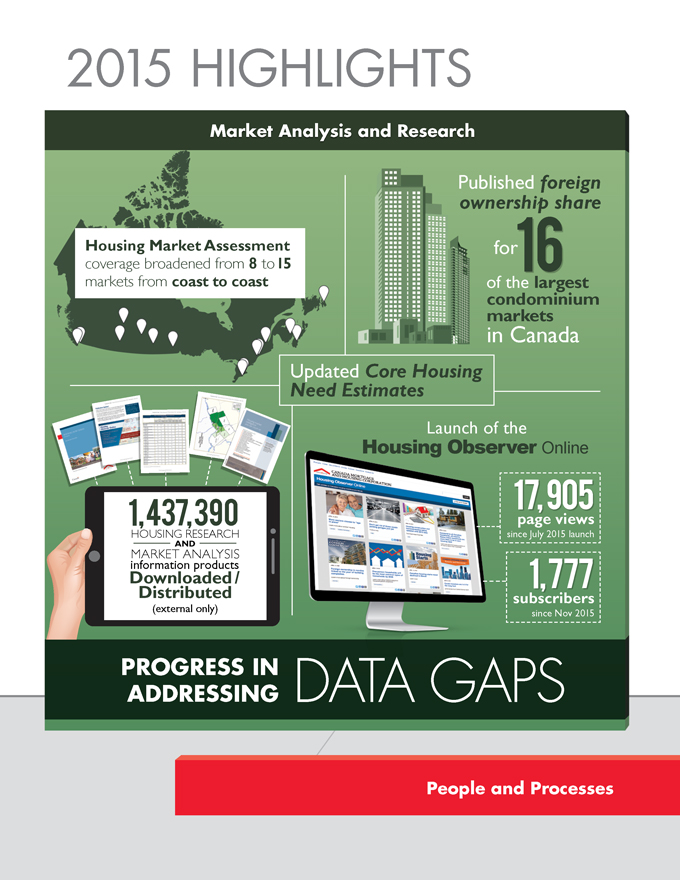
2015 HIGHLIGHTS
Market Analysis and Research
Housing Market Assessment
coverage broadened from 8 to 15 markets from coast to coast
Published foreign ownership share for 16 of the largest condominium markets in Canada
Updated Core Housing Need Estimates
1,437,390
HOUSING RESEARCH
AND
MARKET ANALYSIS
information products
Downloaded/Distributed
(external only)
Launch of the Housing Observer Online
17,905 page views since July 2015 launch
1,777 subscribers since Nov 2015
PROGRESS IN ADDRESSING
DATA GAPS
People and Processes
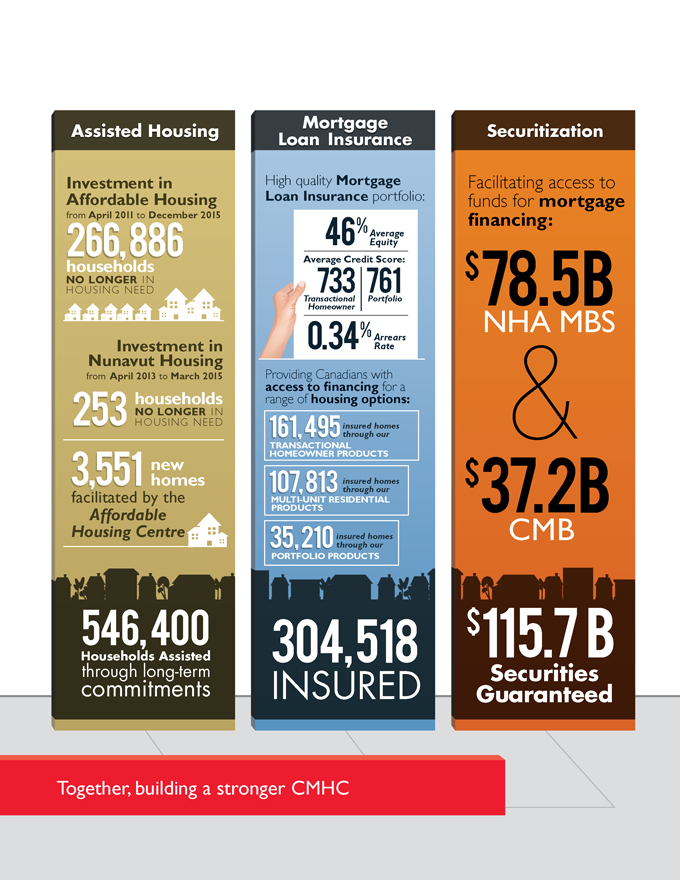
Assisted Housing
Investment in Affordable Housing from April 2011 to December 2015
266,886 households NO LONGER IN HOUSING NEED
Investment in Nunavut Housing from April 2013 to March 2015
253 households NO LONGER IN HOUSING NEED
3,551 new homes
facilitated by the Affordable Housing Centre
546,400 Households Assisted through long-term commitments
Mortgage Loan Insurance
High quality Mortgage Loan Insurance portfolio:
46% Average Equity
Average Credit Score:
733 Transactional Homeowner
761 Portfolio
0.34% Arrears Rate
Providing Canadians with access to financing for a range of housing options:
161,495 insured homes through our TRANSACTIONAL HOMEOWNER PRODUCTS
107,813 insured homes through our MULTI-UNIT RESIDENTIAL PRODUCTS
35,210 insured homes through our PORTFOLIO PRODUCTS
304,518 INSURED
Securitization
Facilitating access to funds for mortgage financing:
$78.5B NHA MBS & $37.2B CMB
$115,7B Securities Guaranteed
Together, building a stronger CMHC

MESSAGE FROM THE
CHAIRPERSON
On behalf of the Board of Directors, I am pleased to present CMHC’s 2015 Annual Report. During the year, the Board provided ongoing governance over CMHC’s activities on fulfilling its mandate.
Housing markets across Canada indicate increasing evidence of overvaluation with prices and household debt levels again rising faster than wages, most notably in Vancouver and Toronto. As a result, the Board was very supportive of the federal government’s announcement in December of an increase in the minimum down payment for mortgage loan insurance and OSFI’s intention to increase capital levels for mortgage assets held by lenders. Slowing global growth, deflation, debt levels and declining oil prices represent material risks to our national economy and to oil-producing provinces in particular.
We are pleased to note that residential mortgage arrears rates remained low and credit scores were good. CMHC’s profitability and capital levels remained strong. The Board supports CMHC’s ongoing efforts to enhance its financial disclosures, market analysis and commentary for Canadians. Strengthening risk management practices continues to be a priority, particularly in this environment.
By helping to facilitate access to mortgage financing for qualified Canadian borrowers, particularly first time homeowners, CMHC’s mortgage loan insurance and securitization guarantee programs contribute to the stability of the financial system. Further adjustments were made to these programs in 2015, with the goal of reducing taxpayer exposure to housing markets while ensuring that CMHC remains well-positioned to scale-up its housing finance activities if needed as a policy tool to address future economic disruptions.
Facilitating access to housing also means supporting Canadians in housing need.
In 2015, CMHC continued to work with a broad range of partners to deliver the federal investment in housing. Housing needs differ across the country, and the Board had the opportunity to learn about the unique housing challenges in Nunavut when we held our August meeting in Iqaluit. This experience deepened our understanding of housing needs in the North and our appreciation for the work CMHC is doing there. We are aware of the need for innovative new approaches to support Northerners and other Canadians whose housing needs are not being met in the market. In this regard, we were pleased to note the federal government’s related announcements in the recent budget.
I would like to thank the Corporation’s senior management team and employees across the country for their outstanding support to the Board again this year.
Robert P. Kelly Chairperson
4 Canada Mortgage and Housing Corporation 2015 ANNUAL REPORT

MESSAGE FROM THE
PRESIDENT
2015 was another year of changes for CMHC. Continuing with the CMHC in motion framework launched in 2014, we built an organization that Canadians can count on in good times and in bad.
Results
We generated profits of $1.5 billion on revenues of $4.6 billion in 2015. These results were lower than plan primarily as a result of a lower than planned interest rate environment, which reduced our returns on investments; coupled with timing differences on the implementation of the new strategic asset allocation in the Mortgage Loan Insurance Activity. In terms of controllable factors, however, we delivered operating budget expenses of 11.1% of revenue received compared to a plan of 12.8%. Most of these savings were as a result of reduced post-employment benefits and slower than planned recruiting for open positions.
Our Insurance Claims Paid were $353 million, a 9.5% improvement compared to 2014 due to healthy real estate markets and improved underwriting. Our Loss Ratio improved from 19.4% in 2014 to 18.2% in 2015. Credit quality continues to improve on our Mortgage Loan Insurance portfolio and at year-end our arrears stood at 0.34% compared to 0.35% in 2014. These factors contributed to strong Return on Capital Holding Target of 12.9%. Securitization benefitted from higher guarantee fee rates and returned 17.9% on Required Capital.
Our Assisted Housing business delivered $2 billion directly on-reserve and via provinces and territories off-reserve. This business unit met or exceeded all of its performance targets in 2015, creating more homes than planned for Canadians.
We ended the year with $19.4 billion in total capital available. At 354% of our minimum capital target for the Mortgage Loan Insurance Activity, we have significant excess capital. We plan to work with the Department of Finance on a dividend policy in 2016 to help ensure the Government’s financial resources are most efficiently managed.
Building a Stronger CMHC
In addition to managing for results in 2015, together we devoted a lot of energy to building a stronger company for the future:
Putting People First
We started the year with a fully re-imagined organizational structure, reflecting new operating models designed specifically to achieve our strategy. We flattened the organization to eliminate bureaucracy and speed up decision making, reducing layers in the company from nine to six in most areas and expanding the average span of control of managers from three to six. These changes, while crucial, took some time to absorb.
Canada Mortgage and Housing Corporation 2015 ANNUAL REPORT 5
Through the year, we welcomed 352 new full time colleagues, people who brought fresh energy. At the end of the year, our workforce consisted of 57% women (53% members of Management Committee) and close to 25% members of minority groups, and we were recognized as one of Canada’s Best Diversity Employers. Last, we engaged in a dialogue about what we wanted our culture to be, culminating in ten new organizational values which you will find on the back cover of this report. We were again recognized as having one of Canada’s Most Admired Corporate Cultures.
We deepened our succession planning during the year, providing clearer career paths for members of our 129-person National Leadership Team. And we continued to focus on building a healthier workplace. By year-end, 95% of our employees were trained in mental health awareness and 100% of our senior leaders were trained as mental health ambassadors.
In the end, however, we fell short on our goals related to employee engagement and enablement. That said, our overall engagement level of 74% was still consistent with high-performing organizations. Our people are still adapting to a new organizational model. This change, along with an office move and the exploration of a third-party information and technology partnership, has hurt morale. We are determined to hit our targets, since we need the employee commitment and motivation they measure. Prioritizing work and creating time to allow people to innovate will help.
Strategy
The Board and senior management built on our work in 2014 to more clearly express our Strategic Directions, as described below.
| 1. | Align Risk With Mandate: Focusing our risk management on those areas we are best equipped to manage is the key to how we operate. We want to be a best-in-class risk manager for household mortgage credit, our most significant financial risk. Improvements in our internal controls continued in 2015, and significant progress was made in addressing the recommendations stemming from the Office of the Superintendent of Financial Institutions and Internal Audit reviews of our operations. In addition, we implemented new economic capital management discipline with new tools and personnel in 2015. We also devoted energy to improving our risk culture corporate-wide during the year, via training on our “Three Lines of Defence” risk governance model, resulting in average improvements of 65% of risk awareness among our staff. Last, we published for Canadians the result of our expanded stress testing results, both to be accountable and to invite improvements to our risk management approach. |

| 2. | Lead Through Information and Insight: As Canada’s authority on housing, we reclaimed a leadership role in the Canadian housing sector in 2015. We expanded our Housing Market Assessment framework, spawning more informed discussions about the state of local housing markets; and, we expanded our quarterly disclosure to include Securitization and Covered Bond supplements, in addition to the Mortgage Loan Insurance supplement we commenced in 2014. Critically, we also highlighted data gaps in the housing sector and worked with industry participants and commentators in developing tactics to improve transparency of information in housing markets. Finally, our policy team worked hard during the year to prepare the new Government’s ambitious housing initiatives. |
| 3. | Be a High-Performing Organization: Our goal is to be one of the truly special companies in Canada. In addition to all that we did to put people first in 2015, we modified our employee offering to promote better alignment with our mission and strategy. This involved a new performance management framework with clearer links between pay and performance. In addition, we announced the combination of two existing components of our pension plan - the legacy defined benefit and the new employee defined contribution - into one defined benefit pension plan for all which we think will be a model for other companies. Last, we improved our reporting against objectives, making it clearer with our people how we measure success in our business. |
Outlook
Moving into 2016, our work continues. Our key priorities this year are to focus on consistent execution and opportunities to innovate, particularly in the following areas:
| ¡ | | Achieving our Corporate Plan priorities – which includes further progress on internal controls and risk management; |
| ¡ | | Implementing the new government housing policies; |
| ¡ | | Expanding our succession planning and talent management activities; and |
| ¡ | | Developing a strategy to overcome years of under investment in our information and technology platform and capabilities. |
There remains much work to be done in 2016. Our people at CMHC have assumed a significant responsibility: both to do our best work day-to-day for Canadians as well as to build a high-performing organization. I am incredibly grateful for our employees’ dedication to CMHC and to the changes underway. After 70 years, there is much to be proud of. Together, we are creating an even prouder future.
Evan Siddall
President and Chief Executive Officer


MANAGEMENT’S
DISCUSSION
AND ANALYSIS
The following Management’s Discussion and Analysis (MD&A) of the financial condition and results of operations as approved by the Board of Directors on 23 March 2016 is prepared for the year ended 31 December 2015. This MD&A should be read in conjunction with the audited Consolidated Financial Statements. Unless otherwise indicated, all financial information in this report has been prepared in accordance with International Financial Reporting Standards (IFRS) and all amounts are expressed in Canadian dollars.
Forward-Looking Statements
Our Annual Report contains forward-looking statements which include, but are not limited to, statements with respect to our outlook for the regulatory environment in which we operate, the outlook and priorities for each activity and the risk environment. By their nature, forward-looking statements require us to make assumptions and are subject to inherent risks and uncertainties which may cause actual results to differ materially from expectations expressed in the forward-looking statements.
Non-IFRS Measures
We use a number of financial measures to assess our performance. Some of these measures are not calculated in accordance with IFRS, are not defined by IFRS, and do not have standardized meanings that would ensure consistency and comparability with other institutions. These non-IFRS measures are presented to supplement the information disclosed in the Consolidated Financial Statements and Notes to the Consolidated Financial Statements which are prepared in accordance with IFRS and may be useful in analyzing performance and understanding the measures used by management in its financial and operational decision making. Where non-IFRS measures are used throughout the Annual Report, a definition of the term will be disclosed in the Glossary for Non-IFRS Financial Measures.
Canada Mortgage and Housing Corporation 2015 ANNUAL REPORT 9
Condensed Consolidated
Financial Results
Condensed Consolidated Balance Sheets
| | | | | | | | |
(in millions) | | | 2015 | | | | 2014 | |
Total Assets | | | 252,107 | | | | 248,490 | |
Total Liabilities | | | 232,468 | | | | 230,308 | |
Total Equity of Canada | | | 19,639 | | | | 18,182 | |
Total Assets increased by $3,617 million (1.5%) from 31 December 2014 primarily due to net purchases of National Housing Act Mortgage-Backed Securities (NHA MBS) in the Canada Mortgage Bonds (CMB) program, partially offset by the maturity of the Insured Mortgage Purchase Program (IMPP) in Q1 2015. Loan repayments in Assisted Housing outpaced new loans issued, also partially offsetting the increase in Loans.
Total Liabilities increased by $2,160 million (0.9%) from 31 December 2014 primarily due to net issuances of CMB, partially offset by the maturity of the IMPP in Q1 2015 as well as net repayments on the Assisted Housing borrowings.
Condensed Consolidated Statements of Income
and Comprehensive Income
| | | | | | | | |
(in millions) | | | 2015 | | | | 2014 | |
Total Revenues | | | 4,636 | | | | 6,199 | |
Total Expenses | | | 2,672 | | | | 2,712 | |
Income Taxes | | | 476 | | | | 862 | |
Net Income | | | 1,488 | | | | 2,625 | |
Other Comprehensive Loss | | | (31) | | | | (281) | |
Comprehensive Income | | | 1,457 | | | | 2,344 | |
Total Revenues were $4,636 million for the year ended 31 December 2015, a $1,563 million (25.2%) decrease from the prior year primarily due to lower Premium and Fees Earned and Net Realized Gains (Losses).
Premiums and Fees Earned decreased by $73 million (3.8%) primarily due to declining insured volumes in the Mortgage Loan Insurance Activity over the past several years, partially offset by the increases in premium and fee pricing implemented in both the Mortgage Loan Insurance and Securitization Activities.
Net Realized Gains (Losses) decreased by $1,489 million (102.4%) primarily due to the transition to the new investment asset mix in 2014 in the Mortgage Loan Insurance investment portfolio that resulted in a significant volume of investment security sales in that period.
Total Expenses decreased by $40 million (1.5%) from the prior year primarily due to Insurance Claims and Operating Expenses partially offset by an increase in Housing Programs Expenses.
Insurance Claims were $290 million in 2015, a $38 million (11.6%) decrease from prior year primarily due to improvements in underwriting practices implemented in 2012 where the parameters for eligible mortgages were changed; and as a result, the business written subsequent to 2012 has had improved risk characteristics compared to older business.
10 Canada Mortgage and Housing Corporation 2015 ANNUAL REPORT
Operating Expenses decreased by $41 million (11.0%) for the year ended 31 December 2015, primarily due to a reduction in costs from the recognition of a plan amendment gain resulting from the changes to the other post-employment benefit plans in 2015. In addition, employee related costs were lower in 2015 as there were no restructuring activities when compared to 2014.
Appropriations spending related to Housing Programs Expenses for the period ended 31 December 2015 was $2,049 million, an increase of $39 million (1.9%) when compared to 2014. The increase is primarily due to the timing of expenditures under the Investment in Affordable Housing (IAH), partially offset by the timing of expenditures for affordable housing in Nunavut.
Net Income was $1,488 million for the year ended 31 December 2015, a $1,137 million (43.3%) decrease from the prior year primarily due to lower Net Realized Gains (Losses), partially offset by the resulting decrease in Income Taxes.
Other Comprehensive Loss (OCL) was $31 million for the year ended 31 December 2015, a $250 million (89.0%) increase from the prior year primarily due to lower Reclassification of Prior Years’ Net Unrealized Gains Realized in the Period in Net Income from significantly lower trading activity in the Mortgage Loan Insurance investment portfolio and the impact of a constant discount rate in 2015 (compared to a decrease in the prior year) on Remeasurements of the Net Defined Benefit Plans. These increases to OCL were offset by the Net Unrealized Gains from Available for Sale Financial Instruments mainly due to modest declines in the yields compared to 2014 resulting in lower gains on the fixed income portfolio.
Performance against 2015 Plan
| | | | | | | | |
| | | | 2015 | |
(in millions) | | | Plan | | | | Actual | |
Total Revenues | | | 5,050 | | | | 4,636 | |
Total Expenses | | | 2,836 | | | | 2,672 | |
Income Taxes | | | 538 | | | | 476 | |
Net Income | | | 1,676 | | | | 1,488 | |
Total Assets | | | 253,611 | | | | 252,107 | |
Total Liabilities | | | 234,910 | | | | 232,468 | |
Total Equity of Canada | | | 18,701 | | | | 19,639 | |
Total Revenues were $414 million (8.2%) lower than plan primarily due to Investment Income and Net Realized Gains (Losses) which were lower than plan due to bond yields trending lower than expected, coupled with the timing of the implementation of the new investment asset mix. In addition, Parliamentary Appropriations for Housing Programs were lower than plan primarily due to timing of expenditures.
Total Expenses were $164 million (5.8%) lower than plan mainly due to timing of Housing Program Expenses as well as lower Operating Expenses due to the amendment gain resulting from the changes to the other post-employment benefit plans that was unplanned. In addition, there were fewer employees compared to plan resulting in reduced operating expenses.
Net Income was $188 million (11.2%) lower than plan primarily due to lower Investment Income and Net Realized Gains (Losses) offset by lower Operating Expenses as explained previously.
Canada Mortgage and Housing Corporation 2015 ANNUAL REPORT 11
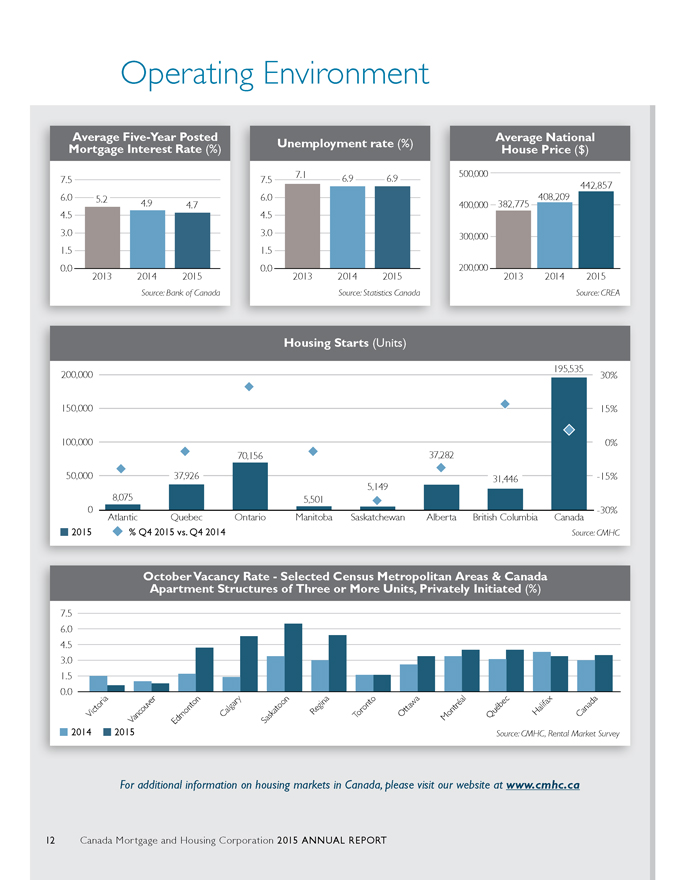
Operating Environment
Average Five-Year Posted Mortgage Interest Rate (%)
7.5 6.0 4.5 3.0 1.5 0.0 5.2 4.9 4.7
2013 2014 2015
Source: Bank of Canada
Unemployment rate (%)
7.5 6.0 4.5 3.0 1.5 0.0 7.1 6.9 6.9
2013 2014 2015
Source: Statistics Canada
Average National House Price ($)
500,000 400,000 300,000 200,000
382,775
408,209
442,857
2013 2014 2015
Source: CREA
Housing Starts (Units)
200,000
150,000
100,000
50,000
0
8,075
37,926
70,156
5,501
5,149
37,282
31,446
195,535
30% 15% 0% -15% -30%
Atlantic Quebec Ontario Manitoba Saskatchewan Alberta British Columbia Canada
2015 % Q4 2015 vs. Q4 2014
Source: CMHC
October Vacancy Rate - Selected Census Metropolitan Areas & Canada Apartment Structures of Three or More Units, Privately Initiated (%)
7.5 6.0 4.5 3.0 1.5 0.0
Victoria Vancouver Edmonton Calgary Saskatoon Regina Toronto Ottawa Montreal Quebec Halifax Canada
2014 2015
Source: CMHC, Rental Market Survey
For additional information on housing markets in Canada, please visit our website at www.cmhc.ca
12 Canada Mortgage and Housing Corporation 2015 ANNUAL REPORT
Economic Conditions And Housing Indicators
During 2015, the prolonged decline in oil prices triggered two consecutive quarters of contraction in the real gross domestic product (GDP). Nevertheless, overall housing activity continued to be supported by employment gains and low interest rates. Nationally, the average Multiple Listing Service® (MLS®)1 price increased by 8.5% relative to 2014 due in part to continued greater MLS® sales growth in more expensive markets in Ontario and British Columbia.
Total housing starts increased in 2015 compared to 2014, largely driven by the condominium market in Toronto; however, there were significant regional disparities in the pace of housing starts. For example, housing starts were higher in provinces less exposed to the energy sector, in particular British Columbia and Ontario improved as businesses benefitted from declining input costs as a result of lower oil prices, lower interest rates and a lower US dollar exchange rate. Strength in Ontario was particularly evident in Q4 2015 as housing starts rose 24.6% (versus Q4 2014) and finished up 18.6% in 2015 versus 2014. Meanwhile, in British Columbia, housing starts were also robust in Q4 2015 rising 16.8% (versus Q4 2014) and finished up 10.9% in 2015. On the other hand, housing starts activity slowed in oil-producing provinces, such as Newfoundland and Labrador, Saskatchewan and particularly in Alberta, where the decline in world oil prices had a particularly negative impact on economic conditions. In Alberta, housing starts were strong in Q1 2015 but weakened for the remainder of the year. In Q4 2015 housing starts in Alberta were down 11.8% compared to a year earlier and finished down 8.1% in 2015. In Saskatchewan, housing starts were weak throughout 2015, falling 26.6% in Q4 2015 (versus Q4 2014) and finished down 37.6% in 2015.
The rental vacancy rate increased in 2015, due to an increase in the supply of purpose-built homes available for rent, combined with reduced demand as a result of lower immigration to Canada and weaker employment prospects for younger Canadians. The largest increase in vacancy rates was registered in Alberta, followed by Saskatchewan. This reflects the fact that, among the provinces, Alberta and Saskatchewan generally saw the largest deterioration in net migration and employment conditions, due to the negative economic impact of oil prices, combined with increases in the supply of purpose-built homes available for rent in both provinces.
Draft Guideline E-21 Operational Risk Management
In August 2015, the Office of the Superintendent of Financial Institutions (OSFI) issued its draft Guideline E-21 Operational Risk Management for Federally Regulated Financial Institutions for which public comments were accepted until 9 October 2015. OSFI’s intent was to clarify its expectations for Federally Regulated Financial Institutions’ operational risk management and provide a comprehensive guideline. The draft guideline contains four principles: (i) fully integrated and appropriately documented operational risk management framework; (ii) supports the overall corporate governance structure, including an operational risk appetite statement; (iii) ensures effective accountability for operational risk management using a three lines of defence approach or other robust structure; and (iv) identification and assessment of operational risk through the use of appropriate management tools. Most of the practices and procedures in the draft guideline have already been adopted or are being deployed and we do not anticipate any significant changes to our operations upon the implementation of the final guideline.
1 Multiple Listing Service® (MLS®) is a registered trademark owned by the Canadian Real Estate Association.
Canada Mortgage and Housing Corporation 2015 ANNUAL REPORT 13
Mortgage Loan Insurance Developments
Minimum Capital Test for Mortgage Loan Insurers
OSFI is in the process of developing a new capital framework specific to mortgage insurers which will replace the current Minimum Capital Test (MCT). As a result, mortgage loan insurers are expected to use an interim capital framework, which is a modified version of the MCT for federally regulated property and casualty insurers that was released by OSFI on 24 September 2014. We implemented the new interim capital framework on 1 January 2015, which resulted in an increase in MCT required capital and a reduction in our MCT ratio.
Portfolio Insurance
For 2015, we continued to employ a lender allocation methodology and maintained our annual limit of issuance of portfolio insurance at $9 billion. This process helps to increase access to funding for small and medium-sized lenders while increasing market discipline in residential lending and reducing taxpayer exposure to the housing sector.
Substitution Feature on Portfolio Pools
In Budget 2015, the Government of Canada (Government) announced that it would implement regulatory measures that limit the extension of portfolio insurance through the substitution of mortgages in insured pools, tie the use of portfolio insurance to our securitization vehicles and prohibit the use of government-backed mortgages as collateral in securitization vehicles that are not sponsored by us.
We previously eliminated the substitution feature on new portfolio pools on 1 January 2014. The substitution feature continues to exist for portfolio pools insured on or before 31 December 2013.
Mortgage Loan Insurance Premiums
As a result of our annual review of insurance products and capital requirements, we increased homeowner mortgage loan insurance premiums for homebuyers with less than a 10% down payment. Effective 1 June 2015, mortgage loan insurance premiums for these homebuyers increased by approximately 15%. There were no changes to premiums for our portfolio insurance and multi-unit insurance products or to premiums for homebuyers who make down payments of 10% or more of the purchase price of their home.
Minimum Down Payment Rules
On 11 December 2015, the Government announced changes to the rules for government-backed mortgage insurance to contain risks in the housing market, reduce taxpayer exposure and support long-term stability. Effective 15 February 2016, the minimum down payment for new insured mortgages increased from 5% to 10% for the portion of the house price above $500,000. The 5% minimum down payment for properties up to $500,000 remains unchanged. Refer to the Mortgage Loan Insurance Activity section for further details.
Changes to Capital Requirements for Residential Mortgages
On 11 December 2015, OSFI announced its plans to update the regulatory capital requirements for loans secured by residential real estate properties (i.e. residential mortgages). The anticipated changes will impact the regulatory capital requirements for those deposit taking institutions using internal models for mortgage default risk and the standardized capital requirements for Canada’s private mortgage insurers.
14 Canada Mortgage and Housing Corporation 2015 ANNUAL REPORT
For federally regulated private mortgage insurers, OSFI will introduce a new standardized approach that updates the capital requirements for mortgage guarantee insurance risk and will require more capital when house prices are high relative to borrower incomes.
OSFI will consult with federally regulated financial institutions and other stakeholders before making any changes and expects final rules to be in place no later than 2017. The anticipated changes may impact our regulatory capital requirements.
Securitization Developments
Annual Limits on New Securities Guaranteed
Pursuant to the National Housing Act (NHA), the Minister of Finance approves the terms and conditions for our Securitization Programs, including the maximum guarantees for the year. The 2015 approved limits were the same as the 2014 limits: $80 billion in NHA MBS and $40 billion in CMB.
Insured Mortgage Purchase Program
The IMPP, included within the Securitization Activity, matured in March 2015, at which time all loans and borrowings from the Government were repaid.
Securitization Guarantee Fees
Guarantee fees charged to Issuers of NHA MBS and CMB increased on 1 April 2015. These changes were made in support of the Government’s effort to enhance the Canadian housing finance framework by encouraging the development of alternative funding options in the private market.
Fees Payable to the Government of Canada
Effective 1 April 2015, the fees we pay to the Government in recognition of its financial backing of the CMB increased.
Changes to NHA MBS Guarantee Fees
On 11 December 2015, CMHC announced an increase to the NHA MBS guarantee fees across all NHA MBS terms effective 1 July 2016. The revised fee structure is intended to encourage the development of alternative funding options in the private market.
Revised Allocation Methodology for New Guarantees
of Market NHA MBS
In conjunction with the changes to the NHA MBS Guarantee fees previously described, we also announced on 17 December 2015, the introduction of a revised allocation methodology for new guarantees of Market NHA MBS.
Under the current allocation methodology related Approved Issuers, where one is designated as an Aggregator that participates in the NHA MBS program, do not obtain a separate Market NHA MBS allocation. The new allocation methodology will allow Issuers to transfer a portion or all of their quarterly Market NHA MBS allocation to Aggregators. With the new allocation methodology, mortgage lenders will continue to have access to CMB funding through Aggregators after the new CMB guarantee fee structure becomes effective 1 July 2016.
Canada Mortgage and Housing Corporation 2015 ANNUAL REPORT 15

Corporate Performance Framework
OUR MANDATE
Facilitate Access • Contribute to Financial Stability
OUR MISSION
We help Canadians meet their housing needs
OUR VISION
The heart of a world-leading housing system
OUR STRATEGIC DIRECTIONS
Lead Through Information and Insight
OUR ACTIVITIES
Market Analysis and Research
Provide objective information and advice to inform decision making
Assisted Housing
Address housing needs, on and off reserve
Mortgage Loan Insurance
Support financing for a range of housing options
Securitization
Facilitate access to funds for mortgage financing
People and Processes
Facilitate the achievement of corporate objectives
Align Risk with Mandate
Be a High-Performing Organization
ULTIMATE OUTCOMES
Canada has a stable, competitive and innovative housing system Canadians in need have access to affordable and suitable housing
16 Canada Mortgage and Housing Corporation 2015 ANNUAL REPORT
Our corporate performance framework is organized around the needs of our clients and stakeholders. We deliver our mandate through four business activities – Market Analysis and Research, Assisted Housing, Mortgage Loan Insurance, and Securitization; all of which are supported by our infrastructure of people and processes. In support of our mission and vision, in 2015, we reviewed the drivers and risks affecting our business and developed strategic directions to guide decisions over the medium term.
Strategic Directions
In spring 2015, the Board of Directors approved three strategic directions to guide the Corporation over the next five years. These strategic directions will focus our efforts and activities to help Canadians meet their housing needs:
Align Risk with Mandate
Fulfilling its mandate to facilitate access to housing and contributing to financial stability means that we have a significant presence in the Canadian housing and financial system. By their very nature, our core business activities have the potential to expose taxpayers to a substantial amount of risk. Understanding and effectively managing these risks is critical to becoming a best-in-class risk manager and to the development of a consistent risk culture across the organization.
Lead Through Information and Insight
Given the importance of housing to the economy and to Canadians, we have responded to our stakeholders’ increasing request for more varied and comprehensive information on Canadian housing markets and the housing system. Being the heart of a world-leading housing system requires that we become Canada’s authority on housing. We will continue to improve outcomes through timely and relevant data analysis and knowledge.
Be a High-Performing Organization
Being a high-performing organization means continuously identifying and leveraging opportunities to improve. Four key traits of a high-performing organization are a focused role, an accountable culture, enabled people and efficient processes. Giving employees the tools to do their jobs through planned investments in financial and information and technology systems will move us toward a culture built around the principles of accountability.
Assessment of Performance Indicators
For each of our Activities, there are a number of performance indicators and immediate and longer-term outcomes that CMHC strives to attain. The performance indicators developed in the Summary of CMHC’s 2015-2019 Corporate Plan process are assessed based on the following:
| ¢ | Green to indicate target met or within 5% of plan. |
| ¢ | Red to indicate target was not met or achievement not within 5% of plan. |
Readers are encouraged to refer to the Summary of CMHC’s 2016-2020 Corporate Plan, which is available at www.cmhc.ca, for additional details on future directions and initiatives.
Canada Mortgage and Housing Corporation 2015 ANNUAL REPORT 17
Risk Management
To ensure that we continue to Align Risk with our Mandate, we have a structured risk management approach that ensures regular risk assessment and reporting, including an annual review and approval of the Enterprise Risk Management (ERM) policies, regular updates to the ERM Risk Register, Risk Appetite and Tolerance Statements and Quarterly Risk Management Reports.
We also conduct our Own Risk and Solvency Assessment (ORSA) to identify risks and assess the adequacy of our risk management and current and likely future capital needs and solvency positions. Stress testing is an important element of the ORSA process. Our stress testing framework specifies that we conduct our corporate-wide stress testing program in parallel with our annual corporate planning process.
ERM Framework
Our ERM framework includes the following components:
Risk Governance Model
We follow a “Three Lines of Defence” model to further enhance our risk governance structure and reinforce a strong risk management culture. This model promotes clear accountability for risk management, monitoring, independent oversight and independent assurance by delineating and defining roles and responsibilities across the Corporation. The graphic shown on the next page illustrates our Three Lines of Defence risk governance model.
The Board of Directors has the ultimate accountability and responsibility for risk management. The Board oversees the ERM framework and approves, on an annual basis, the corporate risk appetite statement. The Board is kept informed of key risks and mitigating strategies through a variety of reporting mechanisms and assistance from the Board Risk Management Committee. The Committee ensures that appropriate policies, procedures and controls are in place to identify, assess, and manage the key risks we face.
The President and CEO is accountable for ensuring that all key risks are appropriately identified and managed, and provides the Board with assurance that these activities are being completed in the annual ERM Letter of Representation.
The Chief Risk Officer (CRO) is responsible for the independent oversight of the management function of risks inherent in our activities, including establishing ERM policies and a framework to manage risk in alignment with our risk appetite and business strategies. The CRO is responsible for promoting an effective risk culture, implementing ERM policies and processes, and in helping the organization achieve its public policy mandate and objectives while paying due regard to its exposure to loss.
All members of Management play an integral role in ERM activities by identifying, monitoring and reporting potential risks within their areas of responsibilities and overseeing activities performed within and across the Three Lines of Defence.
The Risk Committee is a senior management committee which is involved in reviewing and approving all ERM reports prior to their presentation to the Board.
The CRO and Management are assisted in their risk management efforts by the ERM Committee which is comprised of senior level managers, representing all business activities and support functions. The ERM Committee is actively involved in the process of identifying, assessing, monitoring and reporting key risks including new and emerging risks.
18 Canada Mortgage and Housing Corporation 2015 ANNUAL REPORT
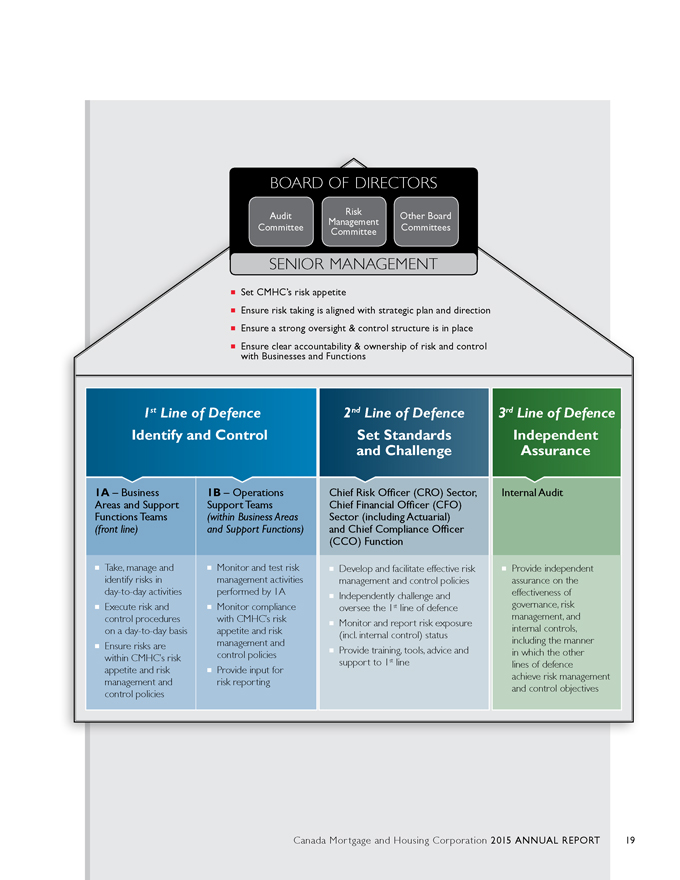
BOARD OF DIRECTORS
Audit Committee
Risk Management Committee
Other Board Committees
SENIOR MANAGEMENT
Set CMHC’s risk appetite
Ensure risk taking is aligned with strategic plan and direction
Ensure a strong oversight & control structure is in place
Ensure clear accountability & ownership of risk and control with Businesses and Functions
1st Line of Defence
Identify and Control
1A – Business Areas and Support Functions Teams
(front line)
Take, manage and identify risks in day-to-day activities
Execute risk and control procedures on a day-to-day basis
Ensure risks are within CMHC’s risk appetite and risk management and control policies
1B – Operations Support Teams
(within Business Areas and Support Functions)
Monitor and test risk management activities performed by 1A
Monitor compliance with CMHC’s risk appetite and risk management and control policies
Provide input for risk reporting
2nd Line of Defence
Set Standards and Challenge
Chief Risk Officer (CRO) Sector, Chief Financial Officer (CFO) Sector (including Actuarial) and Chief Compliance Officer (CCO) Function
Develop and facilitate effective risk management and control policies
Independently challenge and oversee the 1st line of defence
Monitor and report risk exposure (incl. internal control) status
Provide training, tools, advice and support to 1st line
3rd Line of Defence
Independent Assurance
Internal Audit
Provide independent assurance on the effectiveness of governance, risk management, and internal controls, including the manner in which the other lines of defence achieve risk management and control objectives
Canada Mortgage and Housing Corporation 2015 ANNUAL REPORT 19
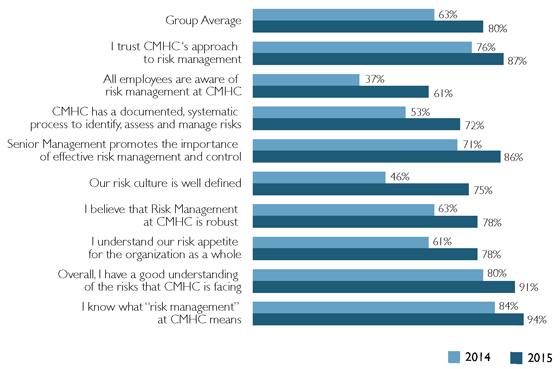
Risk Culture
We constantly cultivate a strong risk culture by promoting risk management knowledge, encouraging open communications and transparency on all aspects of risk, and providing regular risk management training across business lines.
We regularly assess risk culture among all employees through a comprehensive survey that allows the CRO sector to identify areas for improvement and to continue to empower employees with respect to their risk management responsibilities. The following table shows the results of our risk culture survey completed in 2014 and 2015. The results show the proportion of employees who agreed (strongly or somewhat) with the various statements.
Risk Management Policies
Comprehensive ERM policies guide our activities and encourage a risk-aware culture through discussion, evaluation and management of risks across our organization.
The ERM Policies are updated at least annually, with review and approval by senior management and the Board.
Risk Appetite Framework
CMHC has a Risk Appetite framework which is a key component of the organization’s risk management and governance structure. The objective of the Risk Appetite Framework is to establish, define and reinforce a prudent and common understanding of acceptable and unacceptable material risk leading to a robust risk culture throughout CMHC. The Framework is used to establish and understand the amounts and types of risks which the organization is able and willing to accept and those risks which should be avoided.
A Risk Capacity statement, Risk Appetite Principles, entity level and activity level Risk Appetite Statements and Risk Tolerance statements form the foundation of CMHC’s Risk Appetite Framework. These statements and principles are annually approved by senior management and the Board and regular semi-annual reporting against these statements ensures regular consideration and oversight of key risks for CMHC.
20 Canada Mortgage and Housing Corporation 2015 ANNUAL REPORT
ERM Risk Categories
Our seven key risks are identified in the diagram below. This categorization is used throughout our business activities to identify, assess, manage and report on risks.

Reporting on Risk
Our Risk Register provides an assessment of key risks on a corporate-wide basis. This assessment is done on a five-year horizon and includes short-term, medium-term and long-term risks to the Corporation. The table below outlines our key risks with risk rating as at 31 December 2015.
| | | | |
Risk Category | | Definition | | Risk Rating |
Strategic Risk | | Strategic Risk is the potential for loss or other undesirable outcomes resulting from insufficient or inappropriate responses to changes in the business environment, inappropriate strategies and/or poor execution of strategic decisions. | | * |
Reputation Risk | | Reputation Risk is the potential for loss or other undesirable outcomes resulting from negative perceptions and/or publicity. | | † |
Operational Risk | | Operational Risk is the potential for loss or other undesirable outcomes resulting from people actions, inadequate or failed internal processes and systems, or from external events. | | * |
Insurance and Guarantee Risk | | Insurance and Guarantee Risk is the potential for loss arising from actual experience varying from what was expected or predicted. | | † |
Credit Risk | | Credit Risk is the potential for loss if a counterparty fails to honour a transaction/financial obligation. | | † |
Market Risk | | Market Risk is the potential for loss arising from adverse changes in market prices and market rates. | | † |
Liquidity Risk | | Liquidity Risk is the potential for loss if we have insufficient funds to meet all financial obligations as they come due. | | † |
| * | Figure is shaded yellow to indicate Medium Cautionary - requiring ongoing management attention; action may be required. |
| † | Figure is shaded green to indicate Low Acceptable - risk is low or appropriately managed, no action required. |
Our Strategic Risk was assessed as medium cautionary to reflect the following aspects:
| ¡ | | The economic uncertainty and the impact on our financial position – The global and Canadian economic environments continue to be uncertain and potentially volatile. We will continue to enhance our scenario planning and analysis capacity to better prepare our business for potential economic shocks. |
| ¡ | | The Mortgage Loan Insurance Market Share – Revisions to our vision and our strategic directions, combined with changes in the business environment, have resulted in a decline in Mortgage Loan Insurance market share. If market share declines rapidly and materially there may be negative financial and operational impacts including lower volumes and premiums (which may require significant restructuring) as well as negative impacts on appropriations based activities (which share overhead costs with Mortgage Loan Insurance). Declining market share could also lead to adverse selection and claims performance, and an inability to provide service adequately in all markets. |
Canada Mortgage and Housing Corporation 2015 ANNUAL REPORT 21
Operational Risk was also assessed as medium cautionary given the following:
| ¡ | | Outdated Technology/Cybersecurity – The current aging technology platforms and need for significant modernization and transformation of existing systems represents significant risk and may contribute to inefficient business processes. In addition, technology and information security risks remain significant due to the constantly growing sophistication and volume of cyber attacks. Significant resources continue to be devoted to monitoring the security of our systems and additional investments in these capabilities will continue over the coming years. |
| ¡ | | Execution of the CMHC in motion change initiative – The significant execution risk involved in this broad change management exercise has contributed to our cautionary ratings for people and process risks. |
In order to manage our risks at a more granular level, our risk appetite statement is supplemented by business activity risk appetite statements which are described in the respective activity section. Our operational risks are pervasive across all business activities.
Stress Testing
Stress testing is a best practice risk management tool. It provides a formalized mechanism for companies to look at risks in a systematic and structured way and to assess the impact of extreme events.
The credit crisis underlined the need for institutions, like CMHC, to conduct stress tests to ensure they are able to handle emergencies and remain solvent through severe economic challenges. Since 2008, regulators have set strict requirements regarding the type and severity of risk scenarios that institutions must use annually.
We follow the guidance set by OSFI with respect to stress testing and, as such, use certain severe and extreme scenarios in our stress testing. We develop our own stress testing cases for business planning purposes.
Corporate-wide stress testing scenarios are developed early in the year, are vetted internally, and are approved by CMHC’s Board of Directors.
In 2015, CMHC tested its Mortgage Loan Insurance and Securitization businesses against several extreme scenarios, including the following stress events:
| 1. | Global economic deflation – severe house price declines and high unemployment over five years. |
| 2. | Vancouver earthquake – economic impact following a magnitude 9 earthquake event. |
| 3. | US-style housing crisis – 30% decline in house prices and 5 percentage points increase in unemployment. |
| 4. | Oil price shock – extreme fall in oil prices, sustained low prices over the next five years accompanied by a global recession. |
The underlying variables within each of the scenarios were developed based on a combination of hypothetical modeling and historical economic analysis. The final version of each scenario was independently reviewed by an internal model validation team and economists within CMHC’s Market Analysis Centre.
22 Canada Mortgage and Housing Corporation 2015 ANNUAL REPORT
Results
It is important to remember that stress testing is not predicting or forecasting – it involves searching out extreme “what-if” scenarios that have a very remote chance of happening, and planning for them.
| | | | | | | | | | |
| For the 2015-2020 period | | Base Case | | Global
Deflation | | Earthquake | | US-style
Housing Crisis | | Oil Price Shock |
Peak unemployment rate | | 6.6% | | 15.9% | | 6.8% | | 11.6% | | 12.6% |
Change in housing prices (Peak-to-Trough) | | 9.1% | | (43.7%) | | 9.9% | | (30%) | | (25.7%) |
Cumulative Net Income (Loss) | | $7.6B | | ($8.9B) | | $5.2B | | ($3.5B) | | $0.4B |
Lowest Mortgage Loan Insurance Capital (% MCT) | | 365% in 2015 | | 147% in 2020 | | 374% in 2015 | | 289% in 2018 | | 370% in 2015 |
Each hypothetical case stresses CMHC’s business differently and results indicate the global deflation scenario would have the most detrimental effect on CMHC’s financial position. High unemployment and large declines in house prices would potentially lead to a significant number of borrowers being unable to pay their mortgages, resulting in over $20 billion in mortgage loan insurance losses over the planning period, which is ten times greater than normal.
Impact on Capital
None of these scenarios would deplete CMHC’s capital below the minimum capital target of 100% MCT – on par with OSFI-mandated minimum levels for private competitors.
It would take a very severe housing downturn and a sustained high unemployment rate to start eroding CMHC’s capital in a significant manner or impact CMHC’s capacity to underwrite new mortgage loan insurance business.
Operational Risk
Stress testing also provides an opportunity to assess a firm’s operational resiliency to respond to a crisis; for example, how well will processes, systems and people handle unexpected events or emergencies.
CMHC conducted a tabletop exercise in 2015 to assess its readiness to respond to a cyberattack on a key business system. The scenario involved both the main operational site and backup site being down for a significant period of time. A number of lessons were learned from this exercise, including the need to better coordinate business resumption communications internally and externally.
2016 Stress Testing
The Office of the CRO works with different business areas across the Corporation, including an internal model validation team, to develop new or revised scenarios for CMHC’s annual stress testing exercise. The scenario themes being developed for 2016 are expected to be similar to the 2015 scenarios, with only minor changes to the economic assumptions and variables used in the models reflecting the current global economic environment.
Canada Mortgage and Housing Corporation 2015 ANNUAL REPORT 23
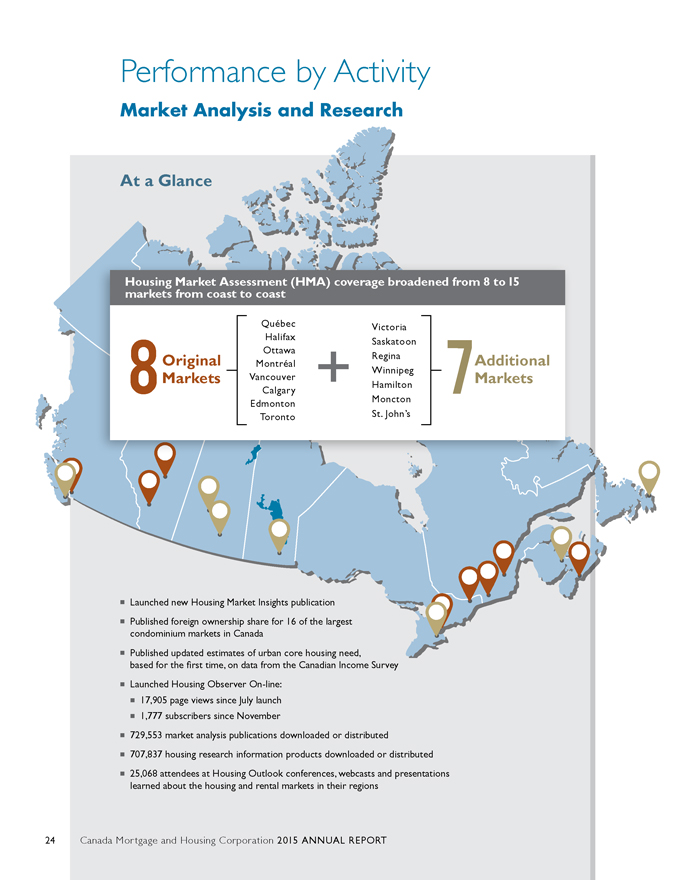
Performance by Activity
Market Analysis and Research
At a Glance
Housing Market Assessment (HMA) coverage broadened from 8 to 15 markets from coast to coast
8 Original Markets
Québec
Halifax
Ottawa
Montréal
Vancouver
Calgary
Edmonton
Toronto
+
Victoria
Saskatoon
Regina
Winnipeg
Hamilton
Moncton
St. John’s
7 Additional Markets
Launched new Housing Market Insights publication
Published foreign ownership share for 16 of the largest condominium markets in Canada
Published updated estimates of urban core housing need, based for the first time, on data from the Canadian Income Survey
Launched Housing Observer On-line:
17,905 page views since July launch
1,777 subscribers since November
729,553 market analysis publications downloaded or distributed
707,837 housing research information products downloaded or distributed
25,068 attendees at Housing Outlook conferences, webcasts and presentations learned about the housing and rental markets in their regions
24 Canada Mortgage and Housing Corporation 2015 ANNUAL REPORT
Description of Activity
Ultimately, our Market Analysis and Research Activities aim to facilitate access to housing and contribute to financial stability. We support informed decision making through the creation, interpretation and sharing of housing-related data and information. We conduct timely and relevant surveys at the local, provincial and national levels, analyse data, prepare scenario analyses, and undertake research on a range of issues that support a well-functioning housing system and promote housing affordability and choice.
We develop timely information and analysis that supports our business activities, informs corporate directions, fills critical housing-related information gaps that would not otherwise be filled, and, ultimately, supports informed decision making by housing policy makers and governments. We work with external partners, such as provinces and territories and housing stakeholders, to share information and consider issues from a range of perspectives. These efforts improve the understanding of current and future housing challenges in Canada and facilitate the development of housing-related policy.
Risk Arising from Market Analysis and Research Activity
In addition to Operational Risk, as described in the Risk Management section, the key risk associated with this activity is described below:
Reputation Risk
In order to meet client needs, the information and advice that we provide must be timely, relevant and accurate. A wide range of communications approaches and platforms are used to share information resulting from our market analysis and research. Communications and marketing, including stakeholder and media relations activities, promote CMHC’s knowledge creation and sharing role. Internal and external clients are consulted to ensure our priorities reflect information gaps and policy/research needs. In addition, surveys are conducted to measure the usefulness of our information products.
Financial Performance
| | | | | | | | |
| (in millions) | | 2015 | | | 2014 | |
Assisted Housing Recovery | | | 44 | | | | 50 | |
Mortgage Loan Insurance Recovery | | | 15 | | | | 17 | |
Total Revenues | | | 59 | | | | 67 | |
Market Analysis | | | 39 | | | | 45 | |
Research | | | 20 | | | | 22 | |
Total Expenses | | | 59 | | | | 67 | |
Net Income | | | - | | | | - | |
Market Analysis and Research Activities are cost-recovered from revenues from Assisted Housing’s Parliamentary Appropriations for Housing Programs and Lending Programs as well as under the Mortgage Loan Insurance Activity.
Canada Mortgage and Housing Corporation 2015 ANNUAL REPORT 25
Performance Analysis
The following key performance indicators represent how we have assessed the effectiveness of our Market Analysis and Research Activity in 2015.
| | | | | | | | |
| | | 2015 | |
| Performance Indicators (%) | | Plan | | | Actual | |
Full expenditure of grants and contribution budget for research and information transfer for 2015-16 (Target at 31 December 2015 – 60%1) | | | 100 | | | | 65 | † |
Usefulness of market analysis and research information | | | 85 | | | | 95 | † |
Forecast accuracy of housing starts | |
| Within 10%
of actual |
| | | 3.1†, | 2 |
| † | Figure is shaded green to indicate target met or within 5% of plan. |
| 1 | Plan figure is based on Government fiscal year – 100% by 31 March 2016. |
| 2 | CMHC Forecast was 189,500 starts and Actual was 195,535 starts resulting in a difference of 3.1%. |
Our refocused research activities in 2015 advanced our understanding of the housing needs of Canadians. This was accomplished through:
| ¡ | | Continued collaboration with territorial housing agencies and other stakeholders in research on energy-efficient and culturally-appropriate new housing and retrofits in the North; |
| ¡ | | Webinars posted online showing housing options for people living with dementia and strategies related to affordable sustainable housing; and |
| ¡ | | Research Highlights on topics such as: the design, construction and performance of the Northern Sustainable Houses; housing conditions and characteristics of Inuit households; understanding seniors’ housing intentions; the cost of including accessibility features in new housing; and the adequacy, suitability and affordability of Canadian housing. |
Outlook
In order to improve housing outcomes through timely, relevant data analysis and knowledge, the following medium-term initiatives, which support our strategic direction to Lead Through Information and Insight, will be pursued in 2016. We will:
| ¡ | | Increase public availability of quality housing information that can help facilitate access to affordable housing and contribute to stability of the financial system and housing markets including addressing data and information gaps; |
| ¡ | | Engage stakeholders and decision makers to obtain their insights on priority housing issues, including using the National Housing Research Committee as a hub and catalyst for housing research; and |
| ¡ | | Continue to provide high-quality policy advice to Government. |
26 Canada Mortgage and Housing Corporation 2015 ANNUAL REPORT
Assisted Housing
At a Glance
Households Assisted
600,000
584,700
570,950
546,400
521,500
500,000
400,000
300,000
200,000
100,000
0
2013
2014
2015
2016
Plan
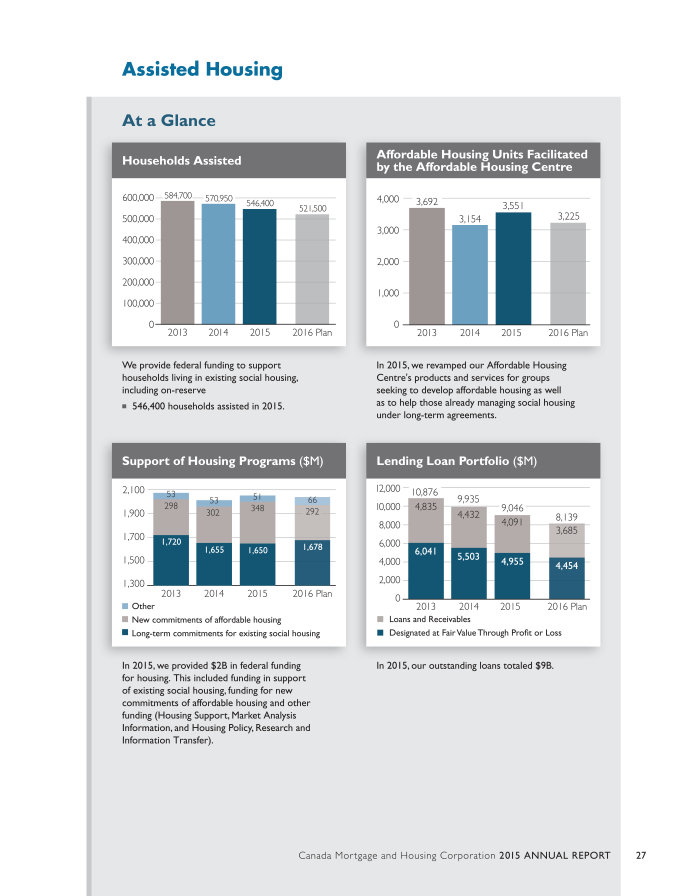
We provide federal funding to support households living in existing social housing, including on-reserve
546,400 households assisted in 2015.
Support of Housing Programs ($M)
2,100
53
53
51
66
298
348
1,900
302
292
1,700
1,720
1,655
1,650
1,678
1,500
1,300
2013
2014
2015
2016
Plan
Other
New commitments of affordable housing
Long-term commitments for existing social housing
In 2015, we provided $2B in federal funding for housing. This included funding in support of existing social housing, funding for new commitments of affordable housing and other funding (Housing Support, Market Analysis Information, and Housing Policy, Research and Information Transfer).
Affordable Housing Units Facilitated by the Affordable Housing Centre
4,000
3,692
3,551
3,154
3,225
3,000
2,000
1,000
0
2013
2014
2015
2016
Plan
In 2015, we revamped our Affordable Housing Centre’s products and services for groups seeking to develop affordable housing as well as to help those already managing social housing under long-term agreements.
Lending Loan Portfolio ($M)
12,000
10,876
9,935
10,000
4,835
9,046
4,432
8,139
8,000
4,091
3,685
6,000
6,041
5,503
4,000
4,955
4,454
2,000
0
2013
2014
2015
2016
Plan
Loans and Receivables
Designated at Fair Value Through Profit or Loss
In 2015, our outstanding loans totaled $9B.
Canada Mortgage and Housing Corporation 2015 ANNUAL REPORT 27
Description of Activity
We provide federal funding in support of housing programs for Canadians in need, including on-reserve. Our activities also include lending programs for social housing. The ultimate outcome of our activities is to help Canadians in need have access to affordable and suitable housing.
Lending Programs
We make loans to social housing sponsors, First Nations, provinces, territories and municipalities, as well as non-subsidized housing support. We can offer loans at below market interest rates due to our ability to obtain funding through the Crown Borrowing Program. We operate our Lending Programs on a long-term, breakeven basis in order to help reduce project operating costs, thereby lowering direct subsidies for social housing.
Housing Programs
We receive Parliamentary Appropriations to fund our Housing Programs. Housing Programs operate on a breakeven basis as appropriations equal expenditures each year. The majority of the funding in Housing Programs helps support low-income households living in existing social housing on and off-reserve.
Through the IAH, the federal government is working with provinces and territories to help reduce the number of Canadians in housing need by investing more than $1.9 billion over 8 years to March 2019. In recognition of the distinctive needs of Nunavut, $100 million was provided over two years (April 2013 to March 2015) to support new affordable housing. Since April 2011, 267,139 households have benefitted from this combined funding.
We also manage assets transferred from the Federal Co-operative Housing Stabilization Fund (Fund) since the termination of its Indenture of Trust in April 2010. The Fund was set up under the federal Co-operative Housing Program and provides assistance to co-operative housing projects (co-ops) in financial difficulty committed under this program. The assets transferred from the Fund are available to assist co-ops with an Indexed Linked Mortgage (ILM) in financial difficulty. Transferred mortgage receivables under administration during the year decreased from $45.0 million to $43.1 million at year-end. Other assets transferred from the Fund to us that are available to assist ILM co-ops in financial difficulty were $18.1 million at year-end, which included $3.1 million in restricted funds for loan commitments approved but not yet advanced.
Risk Arising from Assisted Housing Activity
In addition to Operational Risk, as described in the Risk Management section, the key risks associated with our Assisted Housing Activity are described below.
Reputation Risk
Changing economic conditions have resulted in increased scrutiny on the role that CMHC and the Government play in social housing and the housing market and the effectiveness of current policies. We undertake a number of proactive strategies and approaches to engage or inform our stakeholders including advising the Government on options for social housing.
28 Canada Mortgage and Housing Corporation 2015 ANNUAL REPORT
Credit Risk
We hold and make loans under the NHA to social housing sponsors, First Nations, provinces, territories and municipalities for federally-subsidized housing. The estimated fair value of loans arising from the Lending Programs is $10 billion on an outstanding balance of $9 billion as at 31 December 2015.
Credit risk in the Lending Programs’ portfolio arises from the risk of loss due to the failure of counterparties to meet their contractual obligations. Losses due to default are largely recoverable from various levels of government.
Our Lending Program is assured full collection of principal and accrued interest on the majority of the loans. As at 31 December 2015, we are assured full collection of principal and accrued interest on 77% of our loans (2014 – 77%). The remaining 23% of loans (largely under the Municipal Infrastructure Lending Program) are assessed on a regular basis to determine if provisions for loss are necessary. As at year-end 2015, there was one impaired loan identified and a $23 million provision for loss was recorded (2014 - $22 million).
Market Risk
Prepayment activity, including the restructuring of closed loans, has the potential to cause us to incur losses. We mitigate our exposure to prepayment risk by applying the terms and conditions of our loans, including prepayment clauses.
We are also exposed to interest rate risk when asset and liability principal and interest cash flows have different interest payments or maturity dates. The severity of the risk is dependent on the size and direction of interest rate changes and the size of the mismatched positions. Our risk management policies specify that the maximum exposure of the financing margin to interest rate movements with a confidence level of 95% be fixed at $1.5 million over a 12-month horizon.
Direct Lending interest rates are set based on operating costs, slippage, funding costs and related hedging costs. A review of Direct Lending costs is conducted periodically to determine if the rate charged to Direct Lending borrowers is sufficient to recover our administrative costs in respect of this program.
Financial Performance
| | | | | | | | |
| (in millions) | | 2015 | | | 2014 | |
Parliamentary Appropriations for Housing Programs | | | 2,049 | | | | 2,010 | |
Net Interest Income | | | 9 | | | | 19 | |
Other Income1 | | | 36 | | | | 66 | |
Total Revenues | | | 2,094 | | | | 2,095 | |
Housing Programs Expenses | | | 2,049 | | | | 2,010 | |
Operating Expenses | | | 18 | | | | 21 | |
Total Expenses | | | 2,067 | | | | 2,031 | |
Income before Income Taxes | | | 27 | | | | 64 | |
Income Taxes | | | 2 | | | | 12 | |
Net Income | | | 25 | | | | 52 | |
| 1 | Other Income includes Net Realized Gains (Losses), Net Unrealized Gains and Other Income. |
Canada Mortgage and Housing Corporation 2015 ANNUAL REPORT 29
Appropriations spending related to Housing Programs Expenses for the year ended 31 December 2015 was $2,049 million, an increase of $39 million (1.9%) when compared to 2014. The increase is primarily due to the timing of expenditures under the Investment in Affordable Housing, partially offset by the timing of expenditures for affordable housing in Nunavut.
Net Interest Income decreased by $10 million (52.6%) from the prior year primarily due to the reduced balance of loans.
Other Income decreased by $30 million (45.5%) from the prior year mainly due to the reversal of a deferred net gain on direct lending borrowings and loans recorded in the 2014 period, partially offset by higher unrealized gains on financial instruments caused by a smaller decline in medium term interest rates in 2015.
Total Expenses increased by $36 million (1.8%) primarily as a result of higher Housing Programs expenses of $39 million (1.9%) as explained in the Total Revenues section.
Net Income decreased by $27 million (51.9%) from the prior year due primarily to the decrease in Other Income and Net Interest Income and its corresponding tax impact as explained in the Total Revenues section.
Capital Management
We manage our capital to address risk exposures in our Lending portfolio due to declining business which affects our ability to maintain breakeven programs. We do not hold capital for Housing Programs as this activity does not present risks to the Corporation that would require capital to be set aside.
Refer to the Consolidated Financial Statements Note 18 - Capital Management for complete disclosure on Capital Management.
Reporting on Use of Appropriations
The following table reconciles the amount of appropriations authorized by Parliament as available to CMHC during the Government fiscal year (31 March) with the total amount recognized by us in our financial statements.
| | | | | | | | |
| For the year ended 31 December (in millions) | | 2015 | | | 2014 | |
AMOUNTS AUTHORIZED IN 2014/15 (2013/14) | | | | | | | | |
Main Estimates | | | 2,097 | | | | 2,131 | |
Less: Portion recognized in calendar 2014 (2013) | | | (1,423 | ) | | | (1,498 | ) |
Less: Appropriations lapsed for 2014/15 (2013/14) | | | (44 | ) | | | (46 | ) |
2014/15 (2013/14) portions recognized in 2015 (2014) | | | 630 | | | | 587 | |
AMOUNTS AUTHORIZED IN 2015/16 (2014/15) | | | | | | | | |
Main Estimates | | | 2,026 | | | | 2,097 | |
Less: Portion to be recognized in calendar 2016 (2015) | | | (576 | ) | | | (630 | ) |
Forecasted lapse for 2015/16 (Actual lapse in 2014/15) | | | (31 | ) | | | (44 | ) |
2015/16 (2014/15) portions recognized in 2015 (2014) | | | 1,419 | | | | 1,423 | |
Total appropriations recognized – twelve months ended 31 December | | | 2,049 | | | | 2,010 | |
30 Canada Mortgage and Housing Corporation 2015 ANNUAL REPORT
Performance Analysis
The following key performance indicators represent how we have assessed the effectiveness of our Assisted Housing Activity in 2015.
| | | | | | | | |
| | | 2015 | |
| Performance Indicators | | Plan | | | Actual | |
Affordable housing facilitated by CMHC’s Affordable Housing Centre (homes) | | | 3,100 | | | | 3,551 | † |
Direct Lending - subsequent renewals ($M) | | | 929 | | | | 925 | † |
Housing Programs Expenses excluding Operating Expenses for 2015-16 ($M) (Target at 31 December 2015 – 1,325)1 | | | 1,864 | | | | 1,320 | † |
New homes committed under the On-Reserve Non-Profit Housing Program (homes) (Target at 31 December 2015 – 292)1 | | | 529 | | | | 298 | † |
Initiative(s) created and implemented to maximize housing delivery on and off-reserve | | | 2 | | | | 2 | † |
Reduction in the higher risk projects in CMHC managed portfolio (%) | | | 2 | | | | 5.9 | † |
Working with INAC, measures are developed and implemented to improve the capacity of First Nations | |
| Capacity development
plans are in place;
Undertake 1 joint
initiative with INAC |
| | | Achieved | † |
Increase in Take-up of products and services (%) | | | 15 | | | | 17 | † |
| † | Figure is shaded green to indicate target met or within 5% of plan. |
| 1 | The Plan performance indicators are based on the Government fiscal year basis (1 April – 31 March). Actual results from 1 April 2015 to 31 December 2015 are shown. |
Overall, we met or exceeded our performance measures for 2015. Our core activities include both calendar year and fiscal year targets. In 2015, our Affordable Housing Centre facilitated the creation of 3,551 affordable homes. The Centre provides information and advice as well as funding for up-front costs to help get projects off the ground. Approximately 72,900 homes have been facilitated since the Centre’s inception.
Our Housing Programs expenditures are measured on a fiscal year basis and are on track to meet the 2015-16 plan. Through our On-Reserve Non-Profit Housing Program, we provide assistance for the construction, purchase and rehabilitation of rental housing on-reserve. We committed funding for 298 new homes made available for rent under our Social Housing Activity so far for the 2015-16 fiscal year (on track for plan of 529) and continued to subsidize 26,900 existing homes provided under our Social Housing Activity on-reserve in 2015.
In 2015, we created and implemented two initiatives to maximize housing delivery on and off-reserve. We made changes to align our expertise and tools in a more client-focused approach in support of social and affordable housing. We updated our Affordable Housing Centre’s products and services for groups seeking to develop affordable housing as well as to help those already managing social housing under long-term agreements. This included updating our Seed Funding Program to better meet the needs of affordable housing proponents, particularly in large markets. In addition, as a result of a review and update to our planning approach in 2015 to ensure that full take-up of allocated funding is achieved, new homes committed under the On-Reserve Non-Profit Housing Program are expected to increase over the coming years.
Additionally, we focused on aligning risk with our mandate by taking action to improve the risk rating for the higher risk projects in our managed portfolio; we exceeded our 2% reduction target and achieved a 5.9% reduction.
We also focused on leading through information and insight in 2015, achieving a 17% increase in the take-up of products and services over the 2014 actual, exceeding our target of a 15% increase.
Canada Mortgage and Housing Corporation 2015 ANNUAL REPORT 31
Outlook
As part of Budget 2016, Growing the Middle Class, the Government announced several initiatives that the Corporation will be delivering:
| ¡ | | Affordable Housing – A total of $1.4B over two years starting in 2016 broken down as follows: |
| | ¡ | | $504.4 million related to measures to support the construction of new affordable housing units, the renovation and repair of existing affordable housing, measures to support housing affordability such as rent supplements and measures to foster safe and independent living which are expected to benefit more than 100,000 Canadian households; |
| | ¡ | | $200.7 million to support the construction, repair and adaption of affordable housing for seniors which is expected to improve housing conditions for more than 5,000 low-income households; |
| | ¡ | | $89.9 million for the construction and renovation of over 3,000 shelter spaces for victims of family violence; |
| | ¡ | | $573.9 million for retrofits and renovations to existing homes provided under our Social Housing Activity to address the increasing demand for repairs, as well as improve efficiency and reduce energy use, lowering utility costs and making housing more affordable; and |
| | ¡ | | $30 million to help federally administered providers maintain rent-geared-to-income for low-income households living in social housing. |
| ¡ | | Up to $500 million per year for five years to provide low cost loans to municipalities and housing developers for the construction of new affordable housing projects. This initiative would encourage the construction of affordable rental housing by making low-cost capital available to developers during the earliest, most risky phases of development. |
| ¡ | | $208.3 million over five years to be invested in an Affordable Rental Housing Innovation Fund that would be used to test innovative business approaches – such as housing models with a mix of rental income and home ownership. |
| ¡ | | Northern & Inuit Housing - $177.7 million over two years starting in 2016 to address urgent housing needs in the North and Inuit communities. |
| ¡ | | On-Reserve - $137.7 million over two years starting in 2016 most of which would support the renovation and retrofit of existing housing and $10.4 million over three years starting in 2016 to support the renovation and construction of new shelters for victims of family violence in First Nations communities. |
| ¡ | | Up to $30 million over three years, starting in 2016-2017, to help homeowners dealing with costly structural problems in their homes as a result of the presence of the mineral pyrrhotite in their foundations. |
| ¡ | | $5 million for 2016-2017 to support internships for up to 625 Indigenous youth. The additional funding for CMHC’s Housing Internship Initiative for First Nations and Inuit Youth (HIIFNIY) comes from the $165.4 million investment to expand opportunities for young Canadians under the Youth Employment Strategy announced in Budget 2016. |
32 Canada Mortgage and Housing Corporation 2015 ANNUAL REPORT
Mortgage Loan Insurance
At a Glance
Insurance-in-force ($B)
600
500
400
300
200
100
0
557
50
219
288
2013
543
53
206
284
2014
526
58
193
275
2015
516
59
193
264
2016 Plan
Multi-unit Residential Limit
Portfolio
Transactional Homeowner (high and low ratio)
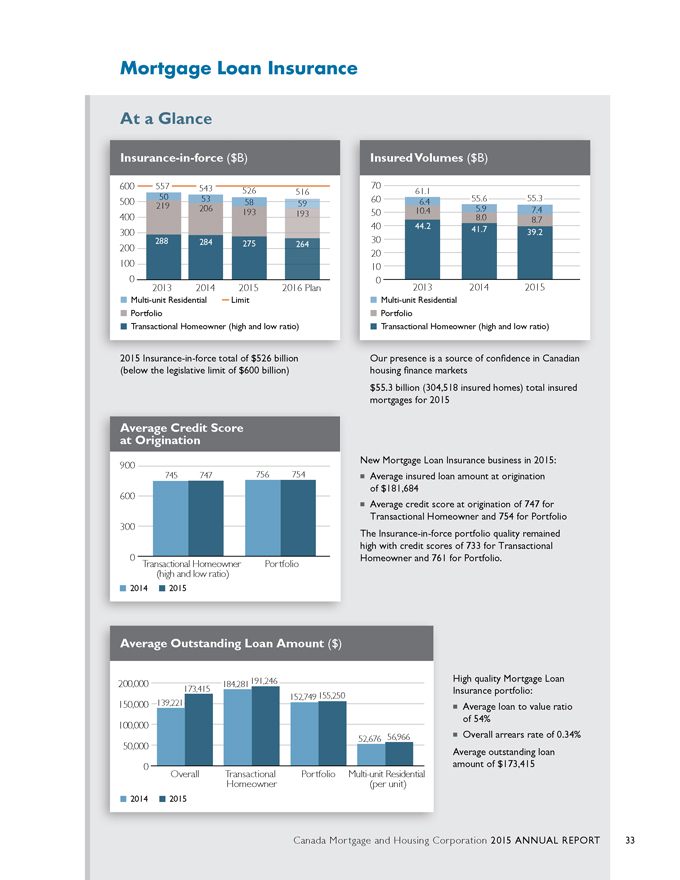
2015 Insurance-in-force total of $526 billion (below the legislative limit of $600 billion)
Insured Volumes ($B)
70
60
50
40
30
20
10
0
61.1
6.4
10.4
44.2
2013
55.6
5.9
8.0
41.7
2014
55.3
7.4
8.7
39.2
2015
Multi-unit Residential
Portfolio
Transactional Homeowner (high and low ratio)
Our presence is a source of confidence in Canadian housing finance markets $55.3 billion (304,518 insured homes) total insured mortgages for 2015
Average Credit Score at Origination
900
600
300
0
745 747 756 754
Transactional Homeowner (high and low ratio)
Portfolio
2014 2015
New Mortgage Loan Insurance business in 2015:
Average insured loan amount at origination of $181,684
Average credit score at origination of 747 for Transactional Homeowner and 754 for Portfolio
The Insurance-in-force portfolio quality remained high with credit scores of 733 for Transactional Homeowner and 761 for Portfolio.
Average Outstanding Loan Amount ($)
200,000
150,000
100,000
50,000
0
173,415 184,281191,246
152,749 155,250 139,221
52,676 56,966
Overall
Transactional Homeowner
Portfolio
Multi-unit Residential (per unit)
2014 2015
High quality Mortgage Loan Insurance portfolio:
Average loan to value ratio of 54%
Overall arrears rate of 0.34%
Average outstanding loan amount of $173,415
Canada Mortgage and Housing Corporation 2015 ANNUAL REPORT 33
Description of Activity
We facilitate access to housing through our Mortgage Loan Insurance Activity. We provide mortgage loan insurance for Transactional Homeowner, Portfolio and Multi-unit Residential loans in all parts of Canada. We operate these programs on a commercial basis with due regard for loss without the need for funding from the Government. Revenue from premiums, fees and investments cover all expenses, including insurance claims losses, and we are expected to generate a reasonable return for the Government.
Our Products
| ¡ | | Transactional Homeowner – insurance against borrower default for loans secured by residential properties of 4 or fewer homes at the time the loan is originated, the cost of which is paid to CMHC by lenders but usually passed on to the borrower, and includes: |
| | ¡ | | High ratio homeowner loans – the borrower has less than a 20% down payment at origination. Mortgage loan insurance on these loans is a legislative requirement for federally regulated lenders and for most provincially regulated lenders. |
| | ¡ | | Low ratio homeowner loans – the borrower has a down payment of 20% or more at origination. |
| ¡ | | Portfolio – insurance against borrower default for pools of low ratio mortgages that are under repayment and secured by residential properties of 4 or fewer homes. |
| ¡ | | Multi-unit Residential – insurance provided exclusively by CMHC in the marketplace against borrower default on loans for the construction, purchase and refinancing of multi-unit residential properties consisting of 5 or more homes. These properties include rental buildings, licensed care facilities, retirement homes, affordable housing projects and purpose-built student housing. |
Risk Arising From Mortgage Loan Insurance Activity
The primary risk of financial loss from the Mortgage Loan Insurance Activity is represented by the amount of future claims associated with insured mortgages relative to insurance premiums received. We manage this risk through prudent underwriting, lender quality assurance, a sound capital management framework, sensitivity and stress testing framework and product pricing. In addition to Operational Risk, as described in the Risk Management section, the key risks associated with this activity are described below.
Strategic Risk
Our market share is directly linked to the Canadian housing market and is influenced by a number of factors including interest rate trends, house price inflation, the unemployment rate, government regulation and competition within the Canadian housing finance market. Any change in the business environment, including actions by competitors and clients, could result in volatility in our market share. We are in the process of implementing an Insurance operating model to focus on managing within a targeted market share range while being flexible enough to scale up when required and protect financial stability.
Insurance Risk
We assume the risk of loss from borrower default through mortgage insurance contracts entered into with lenders, exposing us to the uncertainty surrounding the timing, frequency and severity of future claims. We assess risks related to insurance for different types of residential properties using either our proprietary automated mortgage loan insurance risk assessment and approval system or a rigorous underwriting and post approval due diligence process.
Canadian economic growth in 2015 was negatively impacted by steadily falling oil prices. These sustained lower oil prices posed a downside risk to housing market activity and prices in Alberta, Saskatchewan and Newfoundland and Labrador. CMHC continues to maintain a strong capital position that is sufficient to absorb unexpected losses in the event of an economic downturn.
34 Canada Mortgage and Housing Corporation 2015 ANNUAL REPORT
Credit Risk
In the context of our Mortgage Loan Insurance investment portfolio, credit risk is the risk of loss arising from a counterparty’s or an Approved Issuer’s inability to fulfill their contractual obligations. We use our Mortgage Loan Insurance portfolio to cover obligations associated with the provision of mortgage loan insurance to lenders.
Credit risk includes default risk, settlement risk, and downgrade risk, and encompasses both the probability of loss and the probable size of the loss net of recoveries and collateral over appropriate time horizons. We are exposed to credit risk from various sources directly and indirectly, including directly from investment and hedging activities. We have established exposure limits by Approved Issuer or counterparty for the Insurance activity subject to rating, term, and diversification limits.
Market Risk
Interest rate, currency and equity price risks derive from asset and liability mismatches inherent in the cash flow timing associated with the Mortgage Loan Insurance assets and liabilities. We manage market risk through our strategic asset allocation process, which includes consideration of overall risk and return in selecting a specific asset allocation strategy, benchmarks and risk tolerances and controls.
Financial Performance
Financial Metrics
| | | | | | | | |
(in millions, unless otherwise indicated) | | | 2015 | | | | 2014 | |
Insurance-in-force ($B) | | | 526 | | | | 543 | |
Transactional Homeowner | | | 275 | | | | 284 | |
Portfolio | | | 193 | | | | 206 | |
Multi-unit Residential | | | 58 | | | | 53 | |
Insured Volumes | | | 55,326 | | | | 55,597 | |
Transactional Homeowner | | | 39,236 | | | | 41,714 | |
Portfolio | | | 8,718 | | | | 7,954 | |
Multi-unit Residential | | | 7,372 | | | | 5,929 | |
Premiums and Fees Received | | | 1,438 | | | | 1,315 | |
Transactional Homeowner | | | 1,116 | | | | 1,058 | |
Portfolio | | | 41 | | | | 34 | |
Multi-unit Residential | | | 281 | | | | 223 | |
Claims Paid | | | 353 | | | | 390 | |
Transactional Homeowner | | | 313 | | | | 343 | |
Portfolio | | | 23 | | | | 26 | |
Multi-unit Residential | | | 17 | | | | 21 | |
At 31 December 2015, Insurance-in-force was $526 billion, a $17 billion (3.1%) decrease from the prior year. New loans insured were $55 billion, while estimated loan amortization and pay-downs were $72 billion.
Our insured loan volumes are influenced by the economy, housing markets, competitive pressures and the regulatory environment. Insured volumes were $55,326 million in 2015 a decline of $271 million (0.5%) from the prior year. Transactional Homeowner volumes of $39,236 million were $2,478 million (5.9%) lower than 2014 levels. Partially offsetting the decrease were Portfolio at $8,718 million and Multi-unit Residential at $7,372 million which were higher by $764 million (9.6%) and $1,443 million (24.3%) respectively.
Canada Mortgage and Housing Corporation 2015 ANNUAL REPORT 35
Lower Transactional Homeowner volumes were as a result of declining market share. Portfolio volumes increased due to higher average loan amounts and Multi-unit volume increases were attributable to a continued low interest rate environment making project refinancing generally more attractive.
Total Premiums and Fees Received were $1,438 million in 2015, an increase of $123 million (9.4%) over the prior year, primarily due to increased pricing for Transactional Homeowner premiums on high ratio mortgages.
Claims Paid were $353 million in 2015, a decrease of $37 million (9.5%) from the prior year. The decrease was a result of lower Transactional Homeowner claim payments and title transfer acquisitions, primarily due to economic conditions that continued to drive an active real estate market with strong resale prices throughout most of the year.
| | | | | | | | | | | | | | | | |
| | | 2015 | | | | | | 2014 | | | | |
| | | No. of | | | Arrears | | | No. of | | | Arrears | |
| | | Delinquent Loans | | | Rate | | | Delinquent Loans | | | Rate | |
Transactional Homeowner | | | 7,087 | | | | 0.50% | | | | 7,586 | | | | 0.52% | |
Portfolio | | | 1,808 | | | | 0.15% | | | | 1,988 | | | | 0.15% | |
Multi-unit Residential | | | 132 | | | | 0.60% | | | | 137 | | | | 0.62% | |
Total | | | 9,027 | | | | 0.34% | | | | 9,711 | | | | 0.35% | |
CMHC’s arrears rate at 31 December 2015 was 0.34%, a 0.01 point decrease compared to the prior year driven by a slight decrease in the arrears rate for Transactional Homeowner and Multi-unit Residential loans. The arrears rate includes all loans more than 90 days past due as a percentage of outstanding insured loans.
| | | | | | | | |
| (in millions) | | 2015 | | | 2014 | |
Premiums and Fees Earned | | | 1,592 | | | | 1,688 | |
Investment Income | | | 568 | | | | 618 | |
Other Income1 | | | 15 | | | | 1,429 | |
Total Revenues | | | 2,175 | | | | 3,735 | |
Insurance Claims | | | 290 | | | | 328 | |
Operating Expenses | | | 212 | | | | 249 | |
Total Expenses | | | 502 | | | | 577 | |
Income before Income Taxes | | | 1,673 | | | | 3,158 | |
Income Taxes | | | 409 | | | | 784 | |
Net Income | | | 1,264 | | | | 2,374 | |
| 1 | Other Income includes Net Realized Gains (Losses), Net Unrealized Gains and Other Income. |
Total Revenues were $2,175 million in 2015, a $1,560 million (41.8%) decrease from the prior year. The decrease was primarily due to lower Premiums and Fees Earned, Investment Income and Other Income.
Premiums and Fees Earned were $1,592 million in 2015, a $96 million (5.7%) decrease from the prior year primarily due to declining insured volumes over the past several years partially offset by the increase in premium pricing implemented on 1 May 2014 for Homeowner and 1-4 unit rental properties.
Investment Income was $568 million in 2015, a $50 million (8.1%) decrease from the prior year due to the new investment mix and lower bond yields. The investment portfolio was more heavily weighted in fixed income investments with shorter durations and lower yields resulting in a decrease in interest income earned in comparison to prior year partially offset by the growth in the investment base. Dividend income earned also declined as our equity investments decreased significantly.
36 Canada Mortgage and Housing Corporation 2015 ANNUAL REPORT
Other Income was $15 million in 2015, a $1,414 million (99.0%) decrease from the prior year, primarily due to a decrease in Net Realized Gains (Losses) of $1,474 million (99.4%), primarily due to the liquidation of investments from the implementation of the new investment asset mix in 2014.
Total Expenses were $502 million in 2015, a $75 million (13.0%) decrease due to lower Insurance Claims and Operating Expenses.
Insurance Claims were $290 million in 2015, a $38 million (11.6%) decrease from the prior year mainly attributable to the following factors outlined in the table below:
| | | | |
(in millions) | | | |
Insurance Claims as at 31 December 2014 | | | 328 | |
Changes due to: | | | | |
Improvements to Underwriting Practices | | | (46 | ) |
Unemployment Rate | | | 7 | |
Consumer/House Price Indices | | | 8 | |
Mortgage Rates | | | (7 | ) |
Insurance Claims as at 31 December 2015 | | | 290 | |
The improvements to underwriting practices contributed significantly to the decline in Insurance Claims. A significant portion of our book of business was in the 3rd and 4th year of the policy which typically has the highest claim occurrence. However, changes made in 2012 to the parameters for eligible mortgages caused the business written in recent years, having moved into the 3-4 year range, to have improved risk characteristics over older business, thereby reducing claims.
Operating Expenses were $212 million in 2015, a $37 million (14.9%) decrease from the prior year mainly due to the amendment gain resulting from the changes to the other post-employment benefit plans. In addition, employee related costs were lower in 2015 as there were no restructuring activities when compared to 2014.
Net Income was $1,264 million in 2015, a $1,110 million (46.8%) decrease from the prior year primarily due to significantly lower Net Realized Gains (Losses), partially offset by lower Operating Expenses and Insurance Claims.
Ratios
| | | | | | | | |
(in percentages) | | 2015 | | | 2014 | |
Loss Ratio | | | 18.2 | | | | 19.4 | |
Operating Expense Ratio | | | 13.3 | | | | 14.8 | |
Combined Ratio | | | 31.5 | | | | 34.2 | |
Severity Ratio | | | 32.0 | | | | 30.1 | |
Return on Equity | | | 7.4 | | | | 15.4 | |
Generally, our ratios improved from 2014 to 2015, which was consistent with the limits set for our key performance indicators. The exceptions are the severity ratio which increased by 1.9 percentage points due to fluctuations in the Corporation’s deficiency sales rates, housing prices and recovery levels; and the Return on Equity ratio which decreased by 8 percentage points over the prior year, mainly attributable to lower 2015 Net Income combined with a higher equity balance.
Canada Mortgage and Housing Corporation 2015 ANNUAL REPORT 37
Financial Condition
| | | | | | | | |
(in millions) | | 2015 | | | 2014 | |
Cash, Cash Equivalents and Investment Securities | | | 23,943 | | | | 23,216 | |
Accrued Interest Receivable | | | 143 | | | | 103 | |
Investment Properties, Accounts Receivable and Other Assets | | | 838 | | | | 446 | |
Total Assets | | | 24,924 | | | | 23,765 | |
Securities Sold Under Repurchase Agreements | | | 697 | | | | 325 | |
Accounts Payable and Other Liabilities | | | 96 | | | | 325 | |
Defined Benefit Plans Liability | | | 263 | | | | 284 | |
Provision for Claims | | | 708 | | | | 778 | |
Unearned Premiums and Fees | | | 5,432 | | | | 5,575 | |
Deferred Income Tax Liabilities | | | 69 | | | | 60 | |
Total Liabilities | | | 7,265 | | | | 7,347 | |
Total Equity of Canada | | | 17,659 | | | | 16,418 | |
Total Assets were $24,924 million at 31 December 2015, a $1,159 million (4.9%) increase over the prior year primarily due to increases in Cash, Cash Equivalents and Investment Securities and Accounts Receivable and Other Assets.
Cash, Cash Equivalents and Investment Securities were $23,943 million or $727 million (3.1%) higher than the prior year primarily due to positive cash flow from operations and an increase in Cash Equivalents funded by Securities Sold Under Repurchase Agreements.
Accounts Receivable and Other Assets were $736 million, or $388 million (111.5%) higher than the prior year primarily due to 2015 tax installments paid and deferral of the Government guarantee fees.
Total Liabilities were $7,265 million at 31 December 2015, an $82 million (1.1%) decrease from the prior year due to lower Provision for Claims, Unearned Premiums and Fees and Accounts Payable and Other Liabilities, partially offset by higher Securities Sold Under Repurchase Agreements.
Provision for Claims was $708 million at 31 December 2015, a $70 million (9.0%) decrease from the prior year, generally driven by declining volumes and lower risk on the aging book of business.
Unearned Premiums and Fees were $5,432 million at 31 December 2015, a $143 million (2.6%) decrease from the prior year primarily attributable to declining insured volumes over the past several years caused by the discontinuation of some insurance products as well as decreasing market share.
Accounts Payable and Other Liabilities were $96 million at 31 December 2015, a decrease of $229 million (70.5%) from the prior year. This was primarily due to lower taxes payable.
Securities Sold Under Repurchase Agreements were $697 million at 31 December 2015, a $372 million (114.5%) increase over the prior year as a result of an increase in repo market investment opportunities.
Total Equity of Canada was $17,659 million at 31 December 2015, an increase of $1,241 million (7.6%) over the prior year largely due to Net Income of $1,264 million recognized in 2015.
38 Canada Mortgage and Housing Corporation 2015 ANNUAL REPORT
Capital Management
Our Capital Management Framework follows OSFI regulations with respect to the use of the MCT for insurance companies. The MCT is the ratio of Capital Available to Minimum Capital Required. The following represents our capital management framework:
| ¡ | | Minimum Regulatory Capital 100% MCT: Below 100% MCT, an insurance company would no longer be allowed to write new business. A level below 0% MCT indicates insolvency; |
| ¡ | | Internal Capital Target 205% MCT: The Internal Capital Target provides adequate time for Management to resolve financial problems that may arise, while minimizing the need for regulatory intervention; and |
| ¡ | | Holding Capital Target 220% MCT: CMHC has selected a Holding Capital Target of 220% MCT so that the likelihood of falling below the Internal Capital Target is less than 5% over a five-year period. |
Refer to the Consolidated Financial Statements Note 18 – Capital Management for complete disclosure on Capital Management.
The table below presents our capital management ratios as at 31 December.
| | | | | | | | |
(in percentages) | | 2015 | | | 2014 | |
Capital Available to Minimum Capital Required (% MCT) | | | 354 | | | | 343 | |
Return on Capital Holding Target | | | 12.9 | | | | 23.6 | |
Performance Analysis
The following key performance indicators were designed to measure success in achieving CMHC’s overall goals for our Mortgage Loan Insurance Activity in 2015: reducing taxpayer exposure to the housing sector while promoting financial system stability and competition, and ensuring access to funds for mortgage financing covering a wide range of housing types and tenures, in all parts of the country.
| | | | | | | | |
| | | 2015 | | | | |
Performance Indicators | | Plan | | | Actual | |
Net Income ($M) | | | 1,458 | | | | 1,264 | * |
| | | Analysis and | | | | | |
Options developed for reducing taxpayer exposure | | | recommendations | | | | Achieved | † |
| | | | developed | | | | | |
Insurance Claims ($M) | | | < 312 | | | | 290 | † |
Combined Ratio (%) | | | < 34.9 | | | | 31.5 | † |
Severity Ratio (%) | | | < 32.6 | | | | 32.0 | † |
Insurance-in-Force ($B) | | | 533 | | | | 526 | † |
Operating Expense Ratio (%) | | | < 15.9 | | | | 13.3 | † |
| * | | Figure is shaded red to indicate target was not met or achievement not within 5% of plan. |
| † | | Figure is shaded green to indicate target met or within 5% of plan. |
We met all of the 2015 performance targets with the exception of Net Income. For the year ended 31 December 2015, Net Income was lower than expectations largely as a result of the implementation of our new investment asset mix policy for the Mortgage Loan Insurance investment portfolio introduced in third quarter of 2014. The change in policy resulted in more of a “hold-to-maturity” type portfolio which impacted Investment Income and expected gains on asset dispositions. Partially offsetting the decrease to Net Income were lower Operating and Insurance Claim expenses, which resulted in a favourable Operating Expense ratio of 13.3% and Combined Ratio of 31.5% against a plan of 15.9% and 34.9% respectively.
Canada Mortgage and Housing Corporation 2015 ANNUAL REPORT 39
In support of our key priority in reducing taxpayer exposure, we continue to work with the Department of Finance in assessing the feasibility of possible changes to the housing finance system. In 2015, we provided advice on market vulnerabilities and supported Government changes to increase the down payment required on insured mortgages over $500,000.
Outlook
The Mortgage Loan Insurance Activity has exposure to the Canadian housing market and is influenced by a number of factors including interest rate trends, house price inflation, the unemployment rate, government regulation and competition within the Canadian housing finance market.
| ¡ | | Insurance-in-force is expected to decrease to approximately $516 billion by the end of 2016 as mortgage repayments continue to outpace new insurance written. |
| ¡ | | Net Income is expected to decline from $1,264 million in 2015 to $1,061 million in 2016 primarily due to lower Investment Income in a low interest rate environment and higher Operating Expenses as staffing levels are expected to reach planned levels. |
| ¡ | | On 11 December 2015, the Government announced changes to the rules for government-backed mortgage insurance. Effective 15 February 2016, the minimum down payment for new insured mortgages increased from 5% to 10% for the portion of the house price above $500,000. The 5% minimum down payment for properties up to $500,000 remains unchanged. We do not anticipate that this change will have any significant impact to our projected volumes going forward. |
| ¡ | | Effective 1 July 2016, new insurability criteria require that low loan-to-value portfolio-insured mortgage loans be securitized in CMHC’s Securitization programs in order for the mortgage loan insurance to be maintained. Although demand could increase during the first half of the year, these new restrictions, once implemented, are expected to dampen the demand for Portfolio Insurance across the housing finance industry, with individual effects depending on an institution’s funding model. |
| ¡ | | In recent years and continuing in 2016, CMHC’s new business volumes for Portfolio Insurance have been capped at levels below the market demand for this product, so it is unlikely that the reduction in demand from the implementation of the new restrictions will cause CMHC’s volumes to be significantly below our Plan levels in 2016. |
40 Canada Mortgage and Housing Corporation 2015 ANNUAL REPORT
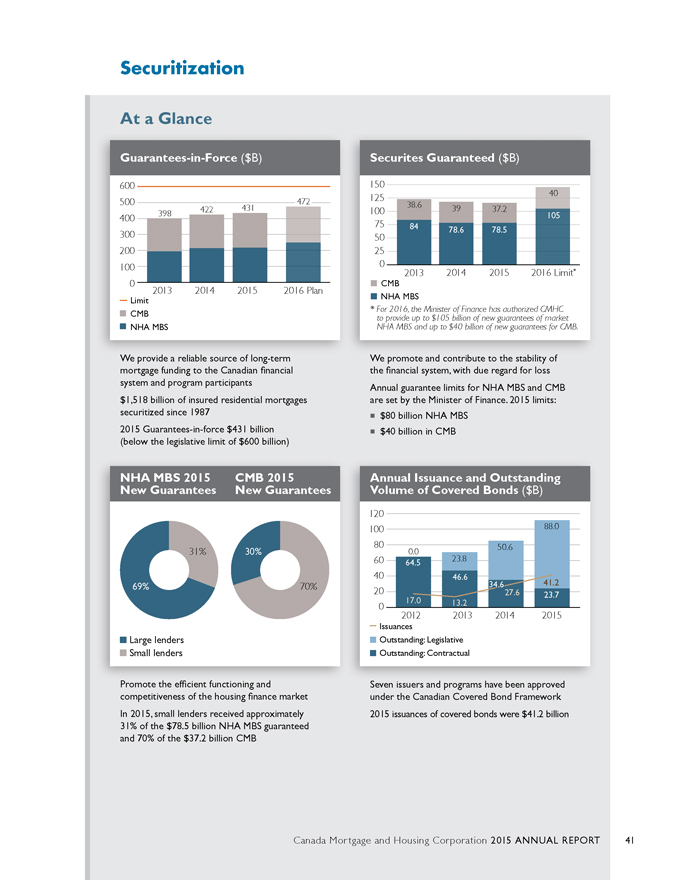
Securitization
At a Glance
Guarantees-in-Force ($B)
600 500 400 300 200 100 0
472 422 431 398
2013 2014 2015 2016 Plan Limit
CMB NHA MBS
We provide a reliable source of long-term mortgage funding to the Canadian financial system and program participants $1,518 billion of insured residential mortgages securitized since 1987 2015 Guarantees-in-force $431 billion (below the legislative limit of $600 billion)
NHA MBS 2015
CMB 2015
New Guarantees New Guarantees
69% 31% 30% 70% Large lenders Small lenders
Promote the efficient functioning and competitiveness of the housing finance market In 2015, small lenders received approximately 31% of the $78.5 billion NHA MBS guaranteed and 70% of the $37.2 billion CMB
Securites Guaranteed ($B)
150 125 100 75 50 25 0
38.6 84 2013 39 78.6 2014 37.2 78.5 2015 40 105 2016 Limit*
CMB NHA MBS
• For 2016, the Minister of Finance has authorized CMHC to provide up to $105 billion of new guarantees of market NHA MBS and up to $40 billion of new guarantees for CMB.
We promote and contribute to the stability of the financial system, with due regard for loss Annual guarantee limits for NHA MBS and CMB are set by the Minister of Finance. 2015 limits:
• $80 billion NHA MBS
• $40 billion in CMB
Annual Issuance and Outstanding Volume of Covered Bonds ($B)
120 100 80 60 40 20 0
0.0 64.5 17.0 2012 23.8 46.6 13.2 2013 50.6 34.6 27.6 2014 88.0 41.2 23.7 2015
Issuances
Outstanding: Legislative
Outstanding: Contractual
Seven issuers and programs have been approved under the Canadian Covered Bond Framework 2015 issuances of covered bonds were $41.2 billion
Canada Mortgage and Housing Corporation 2015 ANNUAL REPORT 41
Description of Activity
We facilitate access to funds for residential mortgage financing through securitization guarantee products and administration of the legal framework for Canadian covered bonds. Under the Securitization Activity, we guarantee the timely payment of interest and principal of securities issued on the basis of eligible housing loans. The guarantee of mortgage-backed securities is provided on a commercial basis. Revenues cover all expenses and we are expected to generate a reasonable return for the Government with due regard for loss.
Our Programs
| ¡ | | Mortgage-Backed Securities – The NHA MBS Program provides a framework for transforming insured residential mortgages into marketable amortizing securities issued by Approved Issuers. The residential mortgages are insured against borrower default by CMHC and therefore backed by the Government or the insurance is provided by private insurers and backed by the Government to the extent provided for in the Protection of Residential Mortgage or Hypothecary Insurance Act. The timely payment of interest and principal to investors in the securities is guaranteed by CMHC and therefore backed by the Government. |
| ¡ | | Canada Mortgage Bonds – Under the CMB Program, Canada Housing Trust (CHT), a special purpose trust consolidated with Securitization, issues non-amortizing CMB to investors and uses the proceeds to purchase NHA MBS issued under the NHA MBS program. Monthly cash flows from the amortizing NHA MBS are transformed via swaps into non-amortizing bond cash flows with fixed or floating rate interest payments and principal at maturity (a “bullet” payment). The timely payment of interest and principal on CMB to investors is guaranteed by CMHC and backed by the Government. |
| ¡ | | Legal Framework for Canadian Registered Covered Bond Programs – We are responsible for the administration of the Covered Bond legal framework. We operate the legal framework on a cost recovery basis. Neither the Government nor CMHC provide any guarantees or backing for covered bond issues. |
Risk Arising From Securitization Activity
In addition to Operational Risk, as described in the Risk Management section, the key risks associated with this activity are described below.
Reputation Risk
With our role in administering the Canadian Covered Bond Framework, there is the risk that we may be perceived as providing an indirect guarantee or support of Legislative Covered Bond Programs. The Legislative Covered Bond Framework has been structured to minimize the potential perception that CMHC, and the Government, provide any kind of guarantee to covered bond investors.
Guarantee Risk
We guarantee the timely payment of interest and principal of NHA MBS issued by Approved Issuers and of CMB issued by CHT. Our major risk of financial loss arising from the guarantee is making timely payments when an issuer is unable to honour its commitments and the assets backing the securities are insufficient to cover the payments CMHC may be required to make as part of the guarantees provided.
Guarantee risk is concentrated in a relatively small number of MBS issuers and swap counterparties. We have measures in place that include limits on volumes, eligibility requirements for participants/mortgages to be securitized, and triggers to affect additional mitigating actions should a participant’s credit quality deteriorate.
42 Canada Mortgage and Housing Corporation 2015 ANNUAL REPORT
Credit Risk
In the context of the Securitization investment portfolio, there is limited associated credit risk as investments are mostly held in Government securities; however, credit risk may arise in relation to repurchase transactions that may be undertaken to meet calls on the timely payment guarantee. Exposure limits are established by Approved Issuer or counterparty for the Securitization Activity.
Market Risk
For the CMB Program, CHT is exposed to interest rate risk stemming from the possibility that the rate of interest earned on NHA MBS and eligible investments will not be sufficient to meet its interest obligations on the CMB issues. This risk is managed through interest rate swaps with approved swap counterparties. The swaps effectively transform the interest rate risk (i.e. prepayment and reinvestment risk) associated with the assets held by CHT into counterparty risk, which is managed through our credit policies and controls. Thus, only in a situation of swap counterparty default and if CHT is unable to find a suitable swap replacement, would CHT be exposed to interest rate risk.
Liquidity Risk
As a result of the NHA MBS and CMB programs, CMHC faces liquidity risk in the event of a call on the timely payment guarantee. A potential liquidity call under the timely payment guarantee is contingent on the performance of participants and service providers in the Securitization programs to meet their obligations. The liquidity risk is mitigated with risk management policies, liquid assets and liquidity management processes, minimum standards for participants, the collection of collateral, legal and operational frameworks and the collection of guarantee fees.
Financial Performance
Financial Metrics
| | | | | | | | |
(in millions, unless otherwise indicated) | | 2015 | | | 2014 | |
Total Guarantees-in-force ($B) | | | 431 | | | | 422 | |
NHA MBS | | | 216 | | | | 213 | |
CMB | | | 215 | | | | 209 | |
Securities Guaranteed | | | 115,722 | | | | 117,643 | |
NHA MBS | | | 78,472 | | | | 78,643 | |
CMB | | | 37,250 | | | | 39,000 | |
Guarantee and Application Fees Received | | | 473 | | | | 273 | |
MBS Guarantee and Application Fees Received | | | 315 | | | | 179 | |
CMB Guarantee Fees Received | | | 158 | | | | 94 | |
Guarantees-in-force totaled $431 billion at 31 December 2015, a $9 billion (2.1%) increase over the prior year due to new guarantees granted during the year exceeding maturities.
Guarantee and Application Fees Received increased $200 million (73.3%) over the prior year due primarily to the higher guarantee fee pricing which came into effect on 1 April 2015.
Canada Mortgage and Housing Corporation 2015 ANNUAL REPORT 43
| | | | | | | | |
(in millions, unless otherwise indicated) | | 2015 | | | 2014 | |
Premiums and Fees Earned1 | | | 268 | | | | 245 | |
Net Interest Income | | | 8 | | | | 8 | |
Investment Income | | | 39 | | | | 36 | |
Other Income2 | | | 74 | | | | 77 | |
Total Revenues | | | 389 | | | | 366 | |
Operating Expenses | | | 103 | | | | 104 | |
Total Expenses | | | 103 | | | | 104 | |
Income Before Income Taxes | | | 286 | | | | 262 | |
Income Taxes | | | 71 | | | | 65 | |
Net Income | | | 215 | | | | 197 | |
Operating Expense Ratio3 | | | 11.1% | | | | 10.9% | |
Return on Equity | | | 12.0% | | | | 12.9% | |
| 1 | | Securitization Activity is comprised of Guarantee and Application Fees Earned. |
| 2 | | Other Income includes Net Realized Gains (Losses), Net Unrealized Gains and Other Income. |
| 3 | | Calculated based on Securitization results and excludes CHT and covered bond activities. |
Total Revenues were $389 million, a $23 million (6.3%) increase over the prior year primarily due to higher fees effective 1 April 2015.
Net Income was $215 million for 2015, an $18 million (9.1%) increase from 2014 mainly due to the revised fee structure, previously discussed.
Capital Management
Our Capital Management Framework for our Securitization Activity incorporates elements from OSFI’s MCT capital requirements for insurance companies for asset exposures and principles from the Basel Committee on Banking Supervision for counterparty credit risk and guarantee exposures as applicable.
Refer to the Consolidated Financial Statements Note 18 – Capital Management for complete disclosure on Capital Management.
The table below presents our capital management ratios as at 31 December.
| | | | | | | | |
| (in percentages) | | 2015 | | | 2014 | |
Capital Available to Capital Required | | | 159 | | | | 157 | |
Return on Required Capital | | | 17.9 | | | | 20.5 | |
Performance Analysis
The following key performance indicators represent how we have assessed the effectiveness of our Securitization Activity in 2015: reducing taxpayer exposure to the housing sector while promoting financial system stability and competition, and ensuring access to funds for mortgage financing covering a wide range of housing types and tenures, in all parts of the country.
44 Canada Mortgage and Housing Corporation 2015 ANNUAL REPORT
| | | | | | | | |
| | | 2015 | | | | |
Performance Indicators | | Plan | | | Actual | |
Maximum lapse beyond issuer demand in total amount of annual NHA MBS and CMB guaranteed ($B): | | | | | | | | |
NHA MBS | | | 2.0 | | | | 1.5 | † |
CMB | | | 2.0 | | | | 2.8 | * |
Total outstanding residential mortgages securitized through CMHC’s guarantee programs (%) | | | <35.0 | | | | 32.5 | †,1 |
Operating Expense Ratio (%) | | £ | £15.0 | | | | 11.1 | † |
Multi-insurer pools (%) | | | 10% in first year post-implementation | | | | Achieved | † |
Options developed for reducing taxpayer exposure | | | Analysis, options and recommendations developed | | | | Achieved | † |
Progress in reviewing guarantee pricing | |
| Analysis, options and
recommendations developed |
| | | Achieved | † |
Progress in reviewing risks posed to the financial system by unregulated securitization program participants and subsequently reviewing program participation criteria as appropriate | |
| Analysis, options and
recommendations developed |
| | | Achieved | † |
| † | | Figure is shaded green to indicate target met or within 5% of plan. |
| * | | Figure is shaded red to indicate target was not met or achievement not within 5% of plan. |
| 1 | | Actual data as at October 2015 based on Bank of Canada report. |
We met all of the 2015 performance targets, with the exception of the maximum lapse of annual CMB guaranteed. For the year ended 31 December 2015, a total of $115.7 billion in guarantees were granted, which was 96.4% of the $120 billion planned. The $78.5 billion NHA MBS guaranteed was 1.9% lower than the limit of $80 billion which reflects mortgage lenders’ business volumes and our efforts to ensure the annual limit was not exceeded. The $37.2 billion CMB issued and guaranteed were 7.0% lower than the $40 billion limit. The shortfall in CMB issues, $37.2 billion versus $38.0 billion target, is a result of the challenging global and domestic market dynamics and the resulting efforts to manage the program objectives and issuance sizes accordingly.
In line with Securitization’s 2015-2019 priorities, the pooling criteria were amended to allow Issuers to securitize loans insured by different mortgage insurers within the same pool (“Multi-insurer Pools”) and were implemented on 1 May 2015. This change has allowed Issuers to create larger and more marketable pools as well as benefit from administrative efficiencies. The majority of Approved Issuers are now issuing multi-insurer pools on a regular basis.
We reviewed guarantee products and pricing to ensure continued alignment with Government objectives and direction. In support of the Government’s efforts to enhance the Canadian housing finance framework, we announced on 11 December 2015 increases to guarantee fees. The revised guarantee fee structure, effective 1 July 2016, is intended to encourage the development of alternative funding options in the private market.
Outlook
| ¡ | | Effective 1 July 2016, fees charged to Issuers of NHA MBS and CMB will change. The changes will cause an increase in Guarantee Fees Received and a gradual increase to Guarantee Fees Earned as the fee is amortized over the life of the instrument. |
| ¡ | | In order to accommodate restructuring of the CMB program, the Minister of Finance increased the 2016 limit for new guarantees under the NHA MBS program. The new NHA MBS limit will be $105 billion and the limit for CMB will remain at $40 billion. The authorized limit for market NHA MBS was increased to reflect the changes under the CMB program where all NHA MBS sold to CHT for all CMB series issued after 1 July 2016, as original or reinvestment assets, will be subject to separate NHA MBS guarantee fees. These limits are separate and distinct from the $600 billion limit on mortgage insurance in force. |
Canada Mortgage and Housing Corporation 2015 ANNUAL REPORT 45
People and Processes
Description of Activity
Our support functions play a pivotal role in ensuring we can meet our corporate objectives and continue to move toward achieving our three strategic directions. We strive for a performance-driven culture with talent management and compensation strategies that help us attract, retain, develop and motivate our people. Our change and project management capabilities support constant corporate evolution, and we have established succession management for critical and vulnerable positions. Our information infrastructure, business systems and security processes enable efficiencies and productivity, and our risk management practices allow us to respond appropriately and effectively to both expected and unanticipated events.
Risk Arising from People and Processes Activity
The key risks associated with this activity are described below:
Model Risk
The use of models plays an important role in many of our business activities. We use a variety of models for many purposes. Model risk is the potential for adverse consequences from decisions based on incorrect or misused model outputs and reports. We manage this risk in accordance with our Model Risk Policy Guideline which clearly articulates roles and responsibilities regarding model development, testing, validation and use. One of the key factors in the mitigating model risk is independent validation.
Reporting Risk
Enterprise and business segment level risk monitoring and reporting are critical components of our enterprise risk management program and support the ability of senior management and the Board of Directors to effectively perform their risk management and oversight responsibilities. On a quarterly basis, we provide to senior management and the Board of Directors the Quarterly Risk Management Report which includes a comprehensive review of our risk profile and focuses on the range of risks we face along with an analysis of the related issues and trends. In addition to our regular risk monitoring, other specific presentations are provided to and discussed with senior management and the Board of Directors on significant new and emerging risk issues or significant changes in our level of risk.
46 Canada Mortgage and Housing Corporation 2015 ANNUAL REPORT
Performance Analysis
| | | | | | | | |
| | | 2015 | |
Performance Indicators (in %, unless otherwise indicated) | | Plan | | | Actual | |
Level of employee engagement: | | | | | | | | |
¡ Achievement of a level of overall engagement equal to or higher than the Hay Group Norm for High-Performing Organizations (73%) | | | 80 | | | | 74 | * |
¡ Corporate culture (% favourable) | |
| Increase from
63 to 66 |
| | | 63 | * |
¡ Employee autonomy and accountability (% favourable) | |
| Increase from
72 to 73 |
| | | 73 | † |
Employee development (% favourable) | |
| Increase from
62 to 66 |
| | | 58 | * |
Assessment as to whether the change management initiatives are delivering the benefits and value anticipated, as measured through success of individual projects | | | 85 | | | | 81 | † |
Complete implementation of an organizational redesign that operationalizes principles established in 2014, including with respect to increasing spans of control and de-layering | | | Achieved | | | | Achieved | † |
| * | | Figure is shaded red to indicate target was not met or achievement not within 5% of plan. |
| † | | Figure is shaded green to indicate target met or within 5% of plan. |
Human Resources
We continued in the second year of our CMHC in motion multi-year program of directed change to build a better, stronger CMHC to meet the changing future housing needs of Canadians.
In early 2015, new business line operating models and a new organizational structure were implemented to operationalize principles that had been established in the latter part of 2014. Over the course of the year, significant progress was made on numerous other change management initiatives that flowed from these organizational changes, with close to 80% of key milestones being achieved.
We also worked towards employee engagement targets that had been set above previous year results as stretch goals, however as we collectively adjusted to our new operating models and structure and employees transitioned into new roles, we fell short on three of four employee engagement targets. In spite of this, our level of overall engagement continues to compare favourably to industry high-performing norms and we will continue striving to achieve ambitious targets and equip employees to be the drivers of change and continuous improvement. In 2015, guided by our new mission, vision and strategic directions, and inspired by input from employees, we took steps to build on our strong culture by introducing ten new organizational values. These new values reinforce our commitment towards working together to achieve higher levels of performance, accountability, teamwork, innovation and appropriate risk taking.
Canada Mortgage and Housing Corporation 2015 ANNUAL REPORT 47
Employee wellness and mental health continue to be priorities for CMHC. In 2015, 95% of our employees participated in mental health training in order to improve mental health awareness, reduce the stigma associated with mental health issues and support a healthy workplace community.
We have a strong and diverse workforce made up of close to 1,900 employees working at our national office and in five regional business centres. In 2015, the representation rate for visible minorities was 19.2%, 2.1% for Aboriginal peoples, and 3.4% for persons with disabilities. In addition, women represented 30% of our Executive Committee, 53% of our Management Committee and 41% of the National Leadership Team.
Again in 2015, CMHC was honoured to be designated as one of the Top Employers in the National Capital Region, an award CMHC has received for seven years in a row. We also received the distinction as one of Canada’s Best Diversity Employers for 2015, an award that recognizes our efforts to create a diverse and inclusive work environment. CMHC was also named as one of Canada’s 10 Most-Admired Corporate Cultures for 2015 in the Broader Public Sector category, which is a distinction held for three years.

48 Canada Mortgage and Housing Corporation 2015 ANNUAL REPORT
Information & Technology
The state of our technology is a risk for CMHC and a barrier to achieving our strategic directions. We need to invest in our technology and bring it to high standards in order to be a high-performing organization.
Our technology must be properly aligned to our business vision and objectives; address our technology-related risks and offer the greatest rate of return on our investments. A multi-year strategy was underway to modernize business delivery functions, transform and automate program delivery, and mitigate operational and technology risk.
Transforming the technology landscape is a critical step in becoming a high-performance organization as the technology will not only support our business, it will help shape it. We decided to pause the implementation of our five year modernization plan to explore an alternative solution to doing everything in house, with a view to accelerating the entire modernization process. A decision on the way forward in terms of solution is expected by mid-year 2016. Any slow down resulting from the pause is expected to be made up quickly as staff will continue some preparatory and pilot work to ensure that we are ready to move ahead as soon as a decision is rendered. In addition, the important work of supporting the operations, completing minor enhancements and enhancing our security capabilities will continue during the pause.
As a result of the pause, we fell short of achieving a number of performance indicators.
| | | | | | | | |
| | | 2015 | |
Performance Indicators (in %, unless otherwise indicated) | | Plan | | | Actual | |
Status of projects as measured by green/yellow/red on scope, time, and financials (including benefits): | | | | | | | | |
Green – on track | | | 85 | | | | 68 | * |
Yellow – requires monitoring | | | 10 | | | | 0 | * |
Red – at risk | | | 5 | | | | 32 | * |
On-time and on-budget achievement of the Information and Technology Strategic Investments Roadmap, with demonstrated realization of intended benefits | | | 95 | | | | 68 | * |
Implement the capabilities and sophistication for cybersecurity and internal threat monitoring, defence, and response capabilities | | | End 2016 | | | | 40 | * |
Establish a data and information governance structure and an Information Management policy | | | Implemented by Q3 2015 | | | | 100 | † |
Increase the maturity level and capabilities of the project management and enterprise architecture disciplines | | | Implemented by Q1 2015 | | | | 100 | † |
| * | | Figure is shaded red to indicate target was not met or achievement not within 5% of plan. |
| † | | Figure is shaded green to indicate target met or within 5% of plan. |
Canada Mortgage and Housing Corporation 2015 ANNUAL REPORT 49
Other Internal Services
| | | | | | | | |
| | | 2015 | | | | |
Performance Indicators (in %, unless otherwise indicated) | | Plan | | | Actual | |
Issuance of audit report within 60 days of end of field work | | | 95 | | | | 100 | † |
Number of internal audits included in approved audit plan completed within expected time frame1 | | | 75 | | | | 95 | † |
Client Interest Index2 to assess CMHC’s communications and marketing outreach | | | 1052 | | | | 111 | † |
Realization of potential efficiency gains identified at the beginning of the planning period ($M) | | | 3.2 | | | | 12.4 | † |
Corporate overhead as a percentage of Direct Operating Expenses | | | <40.0 | | | | 35.6 | † |
Operating Budget Expense Ratio3 | | | 12.8 | | | | 11.1 | † |
| † | | Figure is shaded green to indicate target met or within 5% of plan. |
| 1 | | Represents a blended rate. |
| 2 | | The CMHC Client Interest Index is an indicator of client awareness and interest in CMHC’s programs and services and the performance of CMHC’s communications and marketing activities as measured through CMHC’s reach via four areas: website, social media, call centre and traditional media. The 2015 Client Interest Index target was developed using 2014 year-end estimates as a baseline (normalized to 100). |
| 3 | | This metric has been renamed from the Corporate Operating Expense Ratio. |
We achieved all of our 2015 performance targets. Other Internal Services encompasses a number of functions including Internal Audit, Offices of the Chief Financial Officer and Chief Risk Officer, as well as Legal Services, Corporate Secretariat, Administrative Services and Corporate Relations and Public Affairs.
Outlook
| ¡ | | Introduce new tools and training to enable innovation, and continue to develop corporate capacity in project management and change management. |
| ¡ | | Review our compensation philosophy to ensure it supports CMHC’s core business objectives and strategic directions; this includes reviewing the total compensation framework and reviewing the Human Resources policy framework. |
| ¡ | | Transform the way we operate by investing in technology that meets the evolving needs of our business and helps us work together. |
50 Canada Mortgage and Housing Corporation 2015 ANNUAL REPORT
Historical Information
| | | | | | | | | | | | | | | | | | | | |
| | | | | | | | | Actual | | | | | | | |
| (in millions, unless otherwise indicated) | | 2015 | | | 2014 | | | 2013 | | | 2012 | | | 2011 | |
CONSOLIDATED RESULTS | | | | | | | | | | | | | | | | | | | | |
Total Assets | | | 252,107 | | | | 248,490 | | | | 270,051 | | | | 292,040 | | | | 291,890 | |
Total Liabilities | | | 232,468 | | | | 230,308 | | | | 254,213 | | | | 278,196 | | | | 279,799 | |
Total Equity of Canada | | | 19,639 | | | | 18,182 | | | | 15,838 | | | | 13,844 | | | | 12,091 | |
Total Revenues | | | 4,636 | | | | 6,199 | | | | 5,141 | | | | 5,289 | | | | 5,119 | |
Total Expenses (including Income Taxes) | | | 3,148 | | | | 3,574 | | | | 3,312 | | | | 3,590 | | | | 3,590 | |
Net Income | | | 1,488 | | | | 2,625 | | | | 1,829 | | | | 1,699 | | | | 1,529 | |
Operating Budget Expense Ratio1 | | | 11.1% | | | | 15.1% | | | | 13.3% | | | | 12.3% | | | | 10.6% | |
ASSISTED HOUSING | | | | | | | | | | | | | | | | | | | | |
Parliamentary Appropriations for Housing Programs Expenses | | | 2,049 | | | | 2,010 | | | | 2,071 | | | | 2,197 | | | | 2,163 | |
Net Income | | | 25 | | | | 52 | | | | 91 | | | | 12 | | | | 13 | |
Total Equity of Canada | | | 202 | | | | 191 | | | | 192 | | | | 9 | | | | 29 | |
MORTGAGE LOAN INSURANCE | | | | | | | | | | | | | | | | | | | | |
Insurance-in-force ($B) | | | 526 | | | | 543 | | | | 557 | | | | 566 | | | | 567 | |
Total Insured Volumes | | | 55,326 | | | | 55,597 | | | | 61,053 | | | | 66,029 | | | | 105,953 | |
Premiums and Fees Received | | | 1,438 | | | | 1,315 | | | | 1,308 | | | | 1,475 | | | | 1,653 | |
Premiums and Fees Earned | | | 1,592 | | | | 1,688 | | | | 1,754 | | | | 1,807 | | | | 1,791 | |
Claims Paid | | | 353 | | | | 390 | | | | 423 | | | | 562 | | | | 569 | |
Insurance Claims | | | 290 | | | | 328 | | | | 309 | | | | 487 | | | | 562 | |
Net Income | | | 1,264 | | | | 2,374 | | | | 1,507 | | | | 1,405 | | | | 1,336 | |
Loss Ratio | | | 18.2% | | | | 19.4% | | | | 17.6% | | | | 27.0% | | | | 31.4% | |
Operating Expense Ratio | | | 13.3% | | | | 14.8% | | | | 12.8% | | | | 11.7% | | | | 10.8% | |
Combined Ratio | | | 31.5% | | | | 34.2% | | | | 30.4% | | | | 38.7% | | | | 42.2% | |
Severity Ratio | | | 32.0% | | | | 30.1% | | | | 30.9% | | | | 31.3% | | | | 32.4% | |
Return on Equity | | | 7.4% | | | | 15.4% | | | | 11.2% | | | | 11.8% | | | | 12.8% | |
Return on Capital Holding Target | | | 12.9% | | | | 23.6% | | | | 14.7% | | | | 15.0% | | | | 16.4% | |
Capital Available to Minimum Capital Required (% MCT) | | | 354% | | | | 343% | | | | 250% | | | | 231% | | | | 226% | |
% Estimated Outstanding Canadian Residential Mortgages with CMHC Insurance Coverage ($) | | | 39.1% | | | | 42.7% | | | | 45.6% | | | | 48.6% | | | | 51.1% | |
SECURITIZATION | | | | | | | | | | | | | | | | | | | | |
Guarantees-in-force ($B) | | | 431 | | | | 422 | | | | 398 | | | | 382 | | | | 362 | |
Annual Securities Guaranteed ($B) | | | 116 | | | | 118 | | | | 123 | | | | 120 | | | | 117 | |
Guarantee and Application Fees Received | | | 473 | | | | 273 | | | | 265 | | | | 260 | | | | 257 | |
Guarantee and Application Fees Earned | | | 268 | | | | 245 | | | | 247 | | | | 242 | | | | 211 | |
Net Income | | | 215 | | | | 197 | | | | 207 | | | | 272 | | | | 211 | |
Operating Expense Ratio | | | 11.1% | | | | 10.9% | | | | 10.6% | | | | 9.6% | | | | 9.4% | |
Return on Equity | | | 12.0% | | | | 12.9% | | | | 15.8% | | | | 24.3% | | | | 23.5% | |
Capital Available to Capital Required | | | 159% | | | | 157% | | | | 182% | | | | 156% | | | | 133% | |
Return on Required Capital | | | 17.9% | | | | 20.5% | | | | n/a | | | | n/a | | | | n/a | |
% Estimated Outstanding Canadian Residential Mortgages with CMHC Securitization Guarantee ($) | | | 32.5% | | | | 32.8% | | | | 31.1% | | | | 28.5% | | | | 26.7% | |
| 1 | | This metric has been renamed from the Corporate Operating Expense Ratio. |
Canada Mortgage and Housing Corporation 2015 ANNUAL REPORT 51

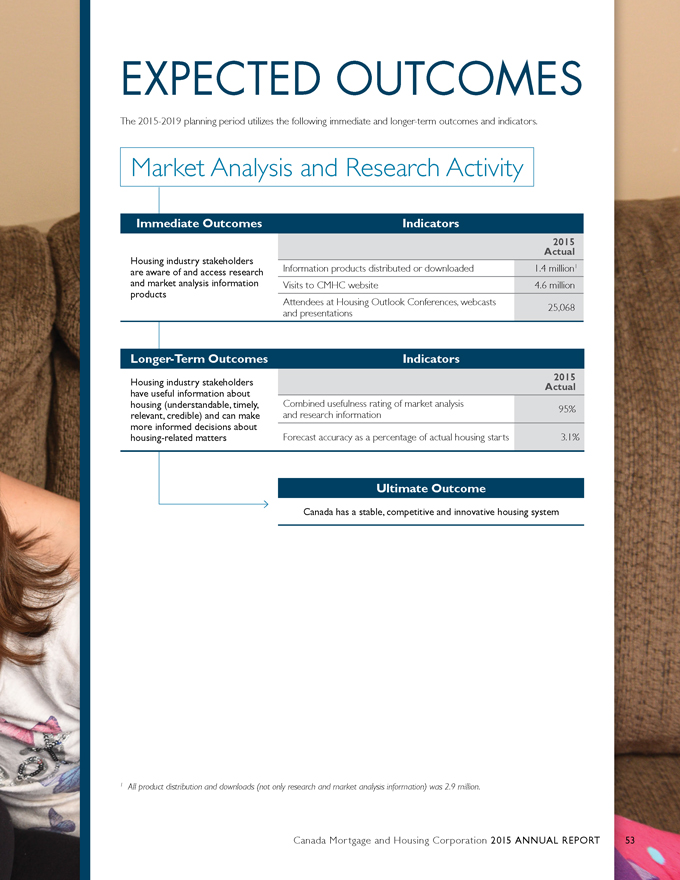
EXPECTED OUTCOMES
The 2015-2019 planning period utilizes the following immediate and longer-term outcomes and indicators.
Market Analysis and Research Activity
Immediate Outcomes
Housing industry stakeholders are aware of and access research and market analysis information products
Indicators
Information products distributed or downloaded Visits to CMHC website Attendees at Housing Outlook Conferences, webcasts and presentations
Actual 2015
1.4 million1
4.6 million
25,068
Longer-Term Outcomes
Housing industry stakeholders have useful information about housing (understandable, timely, relevant, credible) and can make more informed decisions about housing-related matters
Indicators
Combined usefulness rating of market analysis and research information
Forecast accuracy as a percentage of actual housing starts
Actual 2015
95%
3.1%
Ultimate Outcome
Canada has a stable, competitive and innovative housing system
1 All product distribution and downloads (not only research and market analysis information) was 2.9 million.
Canada Mortgage and Housing Corporation 2015 ANNUAL REPORT 53
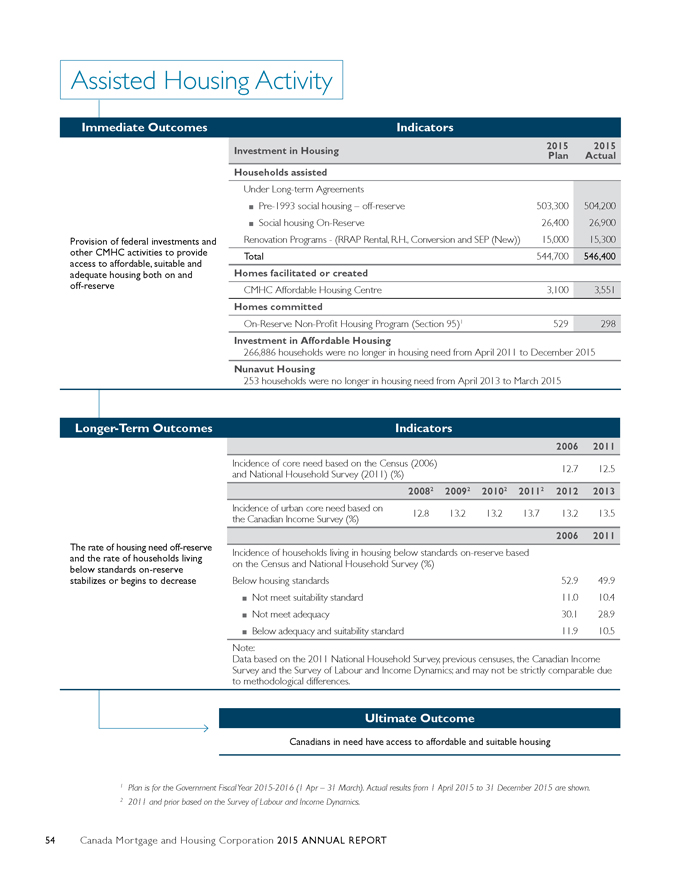
Assisted Housing Activity
Immediate Outcomes Indicators
2015 2015
Investment in Housing Plan Actual
Households assisted
Under Long-term Agreements
Pre-1993 social housing – off-reserve 503,300 504,200
Social housing On-Reserve 26,400 26,900
Provision of federal investments and Renovation Programs - (RRAP Rental, R.H., Conversion and SEP (New)) 15,000 15,300
other CMHC activities to provide Total 544,700 546,400
access to affordable, suitable and
adequate housing both on and Homes facilitated or created
off-reserve CMHC Affordable Housing Centre 3,100 3,551
Homes committed
On-Reserve Non-Profit Housing Program (Section 95)1 529 298
Investment in Affordable Housing
266,886 households were no longer in housing need from April 2011 to December 2015
Nunavut Housing
253 households were no longer in housing need from April 2013 to March 2015
Longer-Term Outcomes Indicators
2006 2011
Incidence of core need based on the Census (2006) 12.7 12.5
and National Household Survey (2011) (%)
20082 20092 20102 20112 2012 2013
Incidence of urban core need based on 12.8 13.2 13.2 13.7 13.2 13.5
the Canadian Income Survey (%)
2006 2011
The rate of housing need off-reserve
and the rate of households living Incidence of households living in housing below standards on-reserve based
below standards on-reserve on the Census and National Household Survey (%)
stabilizes or begins to decrease Below housing standards 52.9 49.9
Not meet suitability standard 11.0 10.4
Not meet adequacy 30.1 28.9
Below adequacy and suitability standard 11.9 10.5
Note:
Data based on the 2011 National Household Survey, previous censuses, the Canadian Income Survey and the Survey of Labour and Income Dynamics; and may not be strictly comparable due to methodological differences.
Ultimate Outcome
Canadians in need have access to affordable and suitable housing
1 Plan is for the Government Fiscal Year 2015-2016 (1 Apr – 31 March). Actual results from 1 April 2015 to 31 December 2015 are shown.
2 2011 and prior based on the Survey of Labour and Income Dynamics.
54 Canada Mortgage and Housing Corporation 2015 ANNUAL REPORT
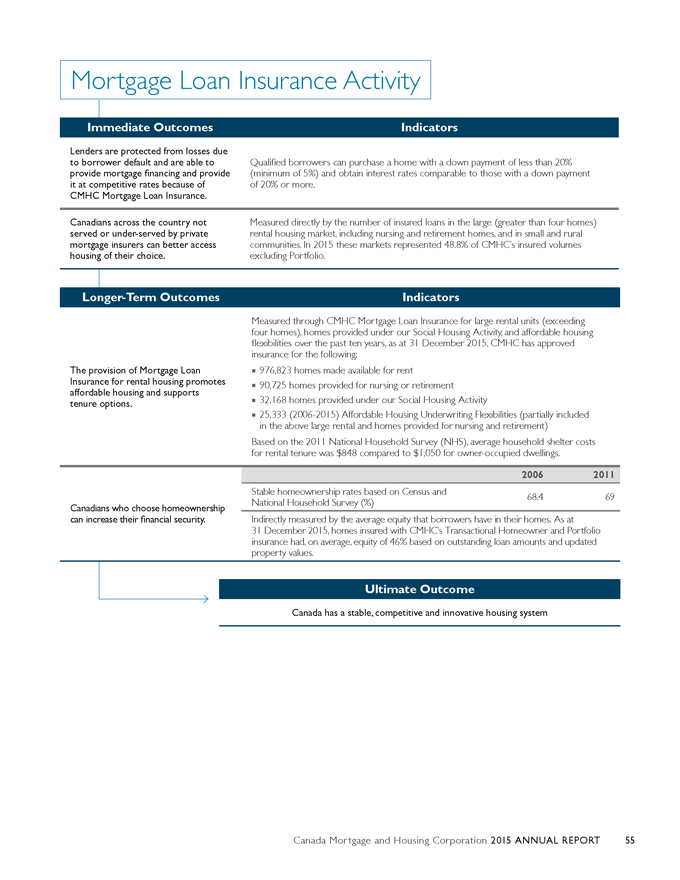
Mortgage Loan Insurance Activity
Immediate Outcomes Indicators
Lenders are protected from losses due
to borrower default and are able to Qualified borrowers can purchase a home with a down payment of less than 20%
provide mortgage financing and provide (minimum of 5%) and obtain interest rates comparable to those with a down payment
it at competitive rates because of of 20% or more.
CMHC Mortgage Loan Insurance.
Canadians across the country not Measured directly by the number of insured loans in the large (greater than four homes)
served or under-served by private rental housing market, including nursing and retirement homes, and in small and rural
mortgage insurers can better access communities. In 2015 these markets represented 48.8% of CMHC’s insured volumes
housing of their choice. excluding Portfolio.
Longer-Term Outcomes Indicators
Measured through CMHC Mortgage Loan Insurance for large rental units (exceeding
four homes), homes provided under our Social Housing Activity, and affordable housing
flexibilities over the past ten years, as at 31 December 2015, CMHC has approved
insurance for the following:
The provision of Mortgage Loan 976,823 homes made available for rent
Insurance for rental housing promotes 90,725 homes provided for nursing or retirement
affordable housing and supports
tenure options. 32,168 homes provided under our Social Housing Activity
25,333 (2006-2015) Affordable Housing Underwriting Flexibilities (partially included
in the above large rental and homes provided for nursing and retirement)
Based on the 2011 National Household Survey (NHS), average household shelter costs
for rental tenure was $848 compared to $1,050 for owner-occupied dwellings.
2006 2011
Stable homeownership rates based on Census and 68.4 69
Canadians who choose homeownership National Household Survey (%)
can increase their financial security. Indirectly measured by the average equity that borrowers have in their homes. As at
31 December 2015, homes insured with CMHC’s Transactional Homeowner and Portfolio
insurance had, on average, equity of 46% based on outstanding loan amounts and updated property values.
Ultimate Outcome
Canada has a stable, competitive and innovative housing system
Canada Mortgage and Housing Corporation 2015 ANNUAL REPORT 55
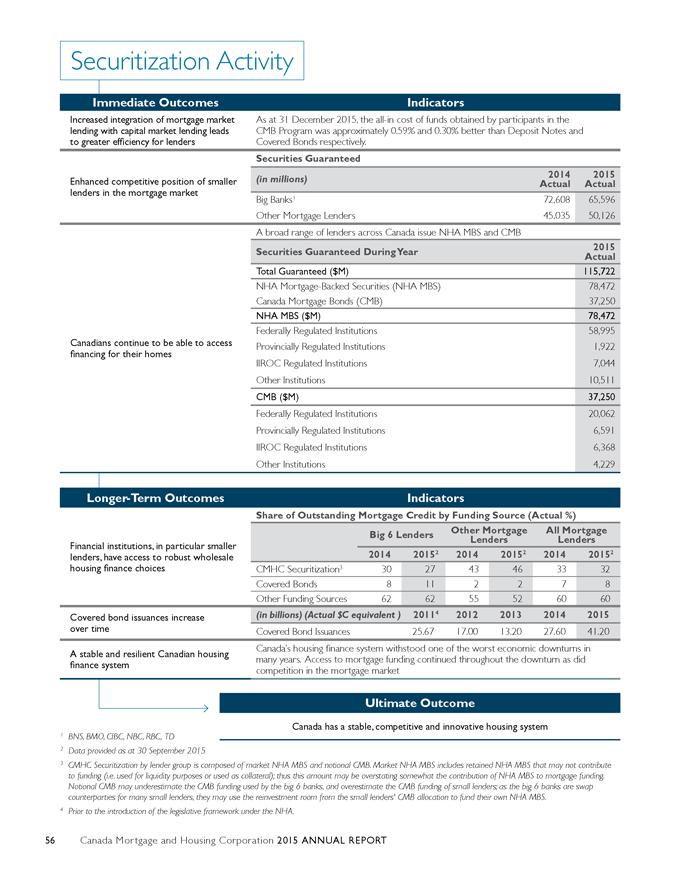
Securitization Activity
Immediate Outcomes Indicators
Increased integration of mortgage market As at 31 December 2015, the all-in cost of funds obtained by participants in the
lending with capital market lending leads CMB Program was approximately 0.59% and 0.30% better than Deposit Notes and
to greater efficiency for lenders Covered Bonds respectively.
Securities Guaranteed
2014 2015
Enhanced competitive position of smaller (in millions) Actual Actual
lenders in the mortgage market
Big Banks1 72,608 65,596
Other Mortgage Lenders 45,035 50,126
A broad range of lenders across Canada issue NHA MBS and CMB
Securities Guaranteed During Year 2015
Actual
Total Guaranteed ($M) 115,722
NHA Mortgage-Backed Securities (NHA MBS) 78,472
Canada Mortgage Bonds (CMB) 37,250
NHA MBS ($M) 78,472
Federally Regulated Institutions 58,995
Canadians continue to be able to access Provincially Regulated Institutions 1,922
financing for their homes
IIROC Regulated Institutions 7,044
Other Institutions 10,511
CMB ($M) 37,250
Federally Regulated Institutions 20,062
Provincially Regulated Institutions 6,591
IIROC Regulated Institutions 6,368
Other Institutions 4,229
Longer-Term Outcomes Indicators
Share of Outstanding Mortgage Credit by Funding Source (Actual%)
Other Mortgage All Mortgage
Financial institutions, in particular smaller Big 6 Lenders Lenders Lenders
lenders, have access to robust wholesale 2014 20152 2014 20152 2014 20152
housing finance choices CMHC Securitization3 30 27 43 46 33 32
Covered Bonds 8 11 2 2 7 8
Other Funding Sources 62 62 55 52 60 60
Covered bond issuances increase (in billions) (Actual $C equivalent) 20114 2012 2013 2014 2015
over time Covered Bond Issuances 25.67 17.00 13.20 27.60 41.20
A stable and resilient Canadian housing Canada’s housing finance system withstood one of the worst economic downturns in
finance system many years. Access to mortgage funding continued throughout the downturn as did
competition in the mortgage market
Ultimate Outcome
Canada has a stable, competitive and innovative housing system
1 BNS, BMO, CIBC, NBC, RBC, TD
2 Data provided as at 30 September 2015
3 CMHC Securitization by lender group is composed of market NHA MBS and notional CMB. Market NHA MBS includes retained NHA MBS that may not contribute to funding (i.e. used for liquidity purposes or used as collateral); thus this amount may be overstating somewhat the contribution of NHA MBS to mortgage funding.
Notional CMB may underestimate the CMB funding used by the big 6 banks, and overestimate the CMB funding of small lenders; as the big 6 banks are swap counterparties for many small lenders, they may use the reinvestment room from the small lenders’ CMB allocation to fund their own NHA MBS.
4 Prior to the introduction of the legislative framework under the NHA.
56 Canada Mortgage and Housing Corporation 2015 ANNUAL REPORT
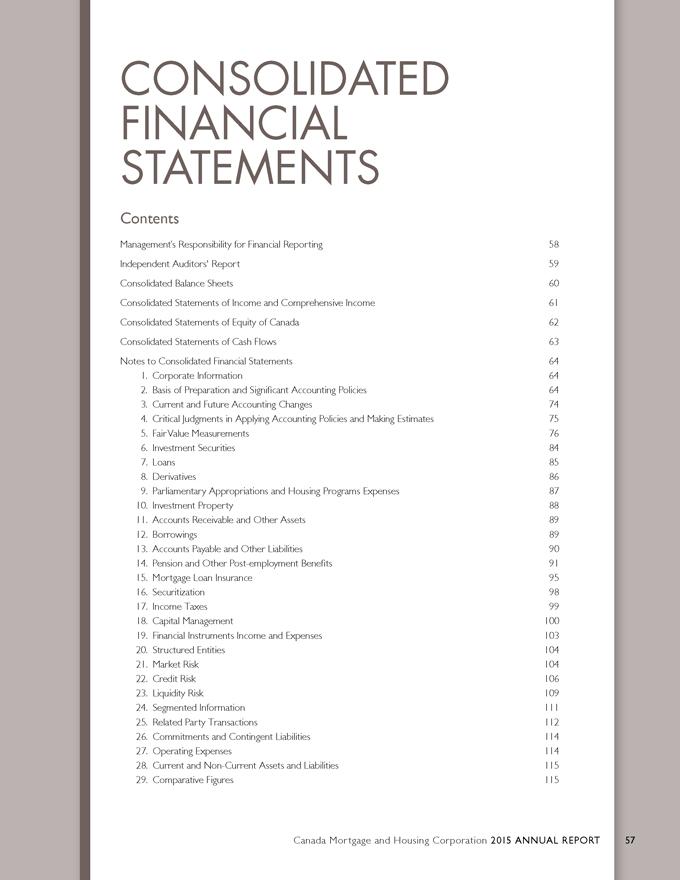
CONSOLIDATED
FINANCIAL
STATEMENTS
Contents
Management’s Responsibility for Financial Reporting 58
Independent Auditors’ Report 59
Consolidated Balance Sheets 60
Consolidated Statements of Income and Comprehensive Income 61
Consolidated Statements of Equity of Canada 62
Consolidated Statements of Cash Flows 63
Notes to Consolidated Financial Statements 64
1. Corporate Information 64
2. Basis of Preparation and Significant Accounting Policies 64
3. Current and Future Accounting Changes 74
4. Critical Judgments in Applying Accounting Policies and Making Estimates 75
5. Fair Value Measurements 76
6. Investment Securities 84
7. Loans 85
8. Derivatives 86
9. Parliamentary Appropriations and Housing Programs Expenses 87
10. Investment Property 88
11. Accounts Receivable and Other Assets 89
12. Borrowings 89
13. Accounts Payable and Other Liabilities 90
14. Pension and Other Post-employment Benefits 91
15. Mortgage Loan Insurance 95
16. Securitization 98
17. Income Taxes 99
18. Capital Management 100
19. Financial Instruments Income and Expenses 103
20. Structured Entities 104
21. Market Risk 104
22. Credit Risk 106
23. Liquidity Risk 109
24. Segmented Information 111
25. Related Party Transactions 112
26. Commitments and Contingent Liabilities 114
27. Operating Expenses 114
28. Current and Non-Current Assets and Liabilities 115
29. Comparative Figures 115
Canada Mortgage and Housing Corporation 2015 ANNUAL REPORT 57
Management’s Responsibility For Financial Reporting
Year ended 31 December 2015
Management is responsible for the integrity and objectivity of the Consolidated Financial Statements and related financial information presented in this annual report. The Consolidated Financial Statements have been prepared in accordance with International Financial Reporting Standards and, consequently, include amounts which are based on the best estimates and judgment of Management. The financial information contained elsewhere in this Annual Report is consistent with that in the Consolidated Financial Statements.
In carrying out its responsibilities, Management maintains appropriate financial systems and related internal controls to provide reasonable assurance that financial information is reliable, assets are safeguarded, transactions are properly authorized and are in accordance with the relevant legislation, by-laws of the Corporation and government directives, resources are managed efficiently and economically, and operations are carried out effectively. The system of internal controls is supported by internal audit, which conducts periodic audits of different aspects of the operations.
The Board of Directors, acting through the Audit Committee whose members are neither officers nor employees of the Corporation, oversees Management’s responsibilities for financial reporting and internal control systems. The Board of Directors, upon the recommendation of the Audit Committee, has approved the Consolidated Financial Statements.
Ernst & Young LLP and the Office of the Auditor General of Canada have audited the Consolidated Financial Statements. The auditors have full access to, and meet periodically with, the Audit Committee to discuss their audit and related matters.
| | | | |
 | | | |  |
| Evan Siddall, BA, LLB | | | | Brian Naish, CPA, CA |
| President and Chief Executive Officer | | | | Chief Financial Officer |
| | |
| 23 March 2016 | | | | |
58 Canada Mortgage and Housing Corporation 2015 ANNUAL REPORT
| | |

INDEPENDENT AUDITORS’ REPORT To the Minister of Families, Children and Social Development Report on the Consolidated Financial Statements We have audited the accompanying consolidated financial statements of Canada Mortgage and Housing Corporation, which comprise the consolidated balance sheets as at 31 December 2015, and the consolidated statements of income and comprehensive income, the consolidated statements of equity of Canada and the consolidated statements of cash flows for the year then ended, and a summary of significant accounting policies and other explanatory information. Management’s Responsibility for the Consolidated Financial Statements Management is responsible for the preparation and fair presentation of these consolidated financial statements in accordance with International Financial Reporting Standards, and for such internal control as management determines is necessary to enable the preparation of consolidated financial statements that are free from material misstatement, whether due to fraud or error. Auditor’s Responsibility Our responsibility is to express an opinion on these consolidated financial statements based on our audit. We conducted our audit in accordance with Canadian generally accepted auditing standards. Those standards require that we comply with ethical requirements and plan and perform the audit to obtain reasonable assurance about whether the consolidated financial statements are free from material misstatement. An audit involves performing procedures to obtain audit evidence about the amounts and disclosures in the consolidated financial statements. The procedures selected depend on the auditor’s judgment, including the assessment of the risks of material misstatement of the consolidated financial statements, whether due to fraud or error. In making those risk assessments, the auditor considers internal control relevant to the entity’s preparation and fair presentation of the consolidated financial statements in order to design audit procedures that are appropriate in the circumstances, but not for the purpose of expressing an opinion on the effectiveness of the entity’s internal control. An audit also includes evaluating the appropriateness of accounting policies used and the reasonableness of accounting estimates made by management, as well as evaluating the overall presentation of the consolidated financial statements. | | 
We believe that the audit evidence we have obtained is sufficient and appropriate to provide a basis for our audit opinion. Opinion In our opinion, the consolidated financial statements present fairly, in all material respects, the financial position of Canada Mortgage and Housing Corporation as at 31 December 2015, and its financial performance and its cash flows for the year then ended in accordance with International Financial Reporting Standards. Report on Other Legal and Regulatory Requirements As required by the Financial Administration Act, we report that, in our opinion, the accounting principles in International Financial Reporting Standards have been applied on a basis consistent with that of the preceding year. Further, in our opinion, the transactions of Canada Mortgage and Housing Corporation that have come to our notice during our audit of the consolidated financial statements have, in all significant respects, been in accordance with Part X of the Financial Administration Act and regulations, the Canada Mortgage and Housing Corporation Act, the National Housing Act, the by-laws of Canada Mortgage and Housing Corporation, and the directives issued pursuant to section 89 of the Financial Administration Act described in Note 1 to the consolidated financial statements. 
Robert Wilson, CPA, CA Principal for the Auditor General of Canada 
Chartered Professional Accountants Licensed Public Accountants 23 March 2016 Ottawa, Canada |
Canada Mortgage and Housing Corporation 2015 ANNUAL REPORT 59
Consolidated Balance Sheets
As at 31 December
| | | | | | | | | | | | |
(in millions of Canadian dollars) | | | Notes | | | | 2015 | | | | 2014 | |
ASSETS | | | | | | | | | | | | |
Cash and Cash Equivalents | | | | | | | 2,020 | | | | 2,169 | |
Securities Purchased Under Resale Agreements | | | | | | | 35 | | | | 126 | |
Investment Securities: | | | 6 | | | | | | | | | |
Designated at Fair Value through Profit or Loss | | | | | | | 1,147 | | | | 1,060 | |
Available for Sale | | | | | | | 22,168 | | | | 21,812 | |
Loans: | | | 7 | | | | | | | | | |
Designated at Fair Value through Profit or Loss | | | | | | | 4,955 | | | | 5,503 | |
Loans and Receivables | | | | | | | 219,713 | | | | 215,944 | |
Accrued Interest Receivable | | | | | | | 694 | | | | 719 | |
Derivatives | | | 8 | | | | 117 | | | | 105 | |
Due from the Government of Canada | | | 9 | | | | 161 | | | | 285 | |
Investment Property | | | 10 | | | | 258 | | | | 247 | |
Accounts Receivable and Other Assets | | | 11 | | | | 839 | | | | 520 | |
| | | | | | | | 252,107 | | | | 248,490 | |
LIABILITIES | | | | | | | | | | | | |
Securities Sold Under Repurchase Agreements | | | | | | | 697 | | | | 325 | |
Borrowings: | | | 12 | | | | | | | | | |
Designated at Fair Value through Profit or Loss | | | | | | | 7,078 | | | | 7,677 | |
Other Financial Liabilities | | | | | | | 216,274 | | | | 213,612 | |
Accrued Interest Payable | | | | | | | 461 | | | | 521 | |
Derivatives | | | 8 | | | | 31 | | | | 31 | |
Accounts Payable and Other Liabilities | | | 13 | | | | 487 | | | | 673 | |
Defined Benefit Plans Liability | | | 14 | | | | 445 | | | | 479 | |
Provision for Claims | | | 15 | | | | 708 | | | | 778 | |
Unearned Premiums and Fees | | | 15,16 | | | | 6,229 | | | | 6,167 | |
Deferred Income Tax Liabilities | | | 17 | | | | 58 | | | | 45 | |
| | | | | | | | 232,468 | | | | 230,308 | |
Commitments and Contingent Liabilities | | | 26 | | | | | | | | | |
EQUITY OF CANADA | | | 18 | | | | | | | | | |
Contributed Capital | | | | | | | 25 | | | | 25 | |
Accumulated Other Comprehensive Income | | | | | | | 807 | | | | 803 | |
Retained Earnings | | | | | | | 18,807 | | | | 17,354 | |
| | | | | | | | 19,639 | | | | 18,182 | |
| | | | | | | | 252,107 | | | | 248,490 | |
The accompanying notes to these Consolidated Financial Statements are an integral part of these statements.
| | | | |

| | | | 
|
| Robert P. Kelly | | | | Evan Siddall |
Chairperson | | | | President and Chief Executive Officer |
60 Canada Mortgage and Housing Corporation 2015 ANNUAL REPORT
Consolidated Statements of Income and Comprehensive Income
Year Ended 31 December
| | | | | | | | | | | | |
(in millions of Canadian dollars) | | | Notes | | | | 2015 | | | | 2014 | |
Parliamentary Appropriations for Housing Programs | | | 9 | | | | 2,049 | | | | 2,010 | |
Premiums and Fees Earned | | | 15,16 | | | | 1,860 | | | | 1,933 | |
Net Interest Income | | | | | | | | | | | | |
Interest Income | | | 19 | | | | | | | | | |
Loans | | | | | | | 4,834 | | | | 5,444 | |
Other | | | | | | | 68 | | | | 66 | |
| | | | | | | 4,902 | | | | 5,510 | |
Interest Expense | | | 19 | | | | 4,806 | | | | 5,408 | |
| | | | | | | 96 | | | | 102 | |
Investment Income | | | 19 | | | | 553 | | | | 608 | |
Net Realized Gains (Losses) | | | 19 | | | | (35 | ) | | | 1,454 | |
Net Unrealized Gains | | | 19 | | | | 15 | | | | 9 | |
Other Income | | | | | | | 98 | | | | 83 | |
TOTAL REVENUES AND PARLIAMENTARY APPROPRIATIONS EXPENSES | | | | | | | 4,636 | | | | 6,199 | |
Housing Programs | | | 9 | | | | 2,049 | | | | 2,010 | |
Insurance Claims | | | 15 | | | | 290 | | | | 328 | |
Operating Expenses | | | 27 | | | | 333 | | | | 374 | |
| | | | | | | | 2,672 | | | | 2,712 | |
INCOME BEFORE INCOME TAXES | | | | | | | 1,964 | | | | 3,487 | |
Income Taxes | | | 17 | | | | 476 | | | | 862 | |
NET INCOME | | | | | | | 1,488 | | | | 2,625 | |
OTHER COMPREHENSIVE LOSS, NET OF TAX | | | | | | | | | | | | |
Items that Will Be Subsequently Reclassified to Net Income: | | | | | | | | | | | | |
Net Unrealized Gains from Available for Sale Financial Instruments | | | | | | | 16 | | | | 469 | |
Reclassification of Prior Years’ Net Unrealized Gains Realized in the Period in Net Income | | | | | | | (12 | ) | | | (609 | ) |
Total Items that Will Be Subsequently Reclassified to Net Income | | | | | | | 4 | | | | (140 | ) |
Items that Will Not Be Subsequently Reclassified to Net Income: | | | | | | | | | | | | |
Remeasurements of the Net Defined Benefit Plans | | | 14,17 | | | | (35 | ) | | | (141 | ) |
| | | | | | | | (31 | ) | | | (281 | ) |
COMPREHENSIVE INCOME | | | | | | | 1,457 | | | | 2,344 | |
The accompanying notes to these Consolidated Financial Statements are an integral part of these statements.
Canada Mortgage and Housing Corporation 2015 ANNUAL REPORT 61
Consolidated Statements of Equity of Canada
Year Ended 31 December
| | | | | | | | | | | | |
(in millions of Canadian dollars) | | | Notes | | | | 2015 | | | | 2014 | |
CONTRIBUTED CAPITAL | | | | | | | 25 | | | | 25 | |
ACCUMULATED OTHER COMPREHENSIVE INCOME | | | | | | | | | | | | |
Balance at Beginning of Year | | | | | | | 803 | | | | 943 | |
Other Comprehensive Income (Loss) | | | | | | | 4 | | | | (140 | ) |
Balance at End of Year | | | | | | | 807 | | | | 803 | |
RETAINED EARNINGS | | | | | | | | | | | | |
Balance at Beginning of Year | | | | | | | 17,354 | | | | 14,870 | |
Net Income | | | | | | | 1,488 | | | | 2,625 | |
Other Comprehensive Loss | | | | | | | (35 | ) | | | (141 | ) |
Balance at End of Year | | | | | | | 18,807 | | | | 17,354 | |
EQUITY OF CANADA | | | 18 | | | | 19,639 | | | | 18,182 | |
The accompanying notes to these Consolidated Financial Statements are an integral part of these statements.
62 Canada Mortgage and Housing Corporation 2015 ANNUAL REPORT
Consolidated Statements of Cash Flows
Year Ended 31 December
| | | | | | | | | | | | |
| (in millions of Canadian dollars) | | | Notes | | | | 2015 | | | | 2014 | |
CASH FLOWS PROVIDED BY (USED IN) OPERATING ACTIVITIES | | | | | | | | | | | | |
Net Income | | | | | | | 1,488 | | | | 2,625 | |
Items Not Affecting Cash or Cash Equivalents: | | | | | | | | | | | | |
Amortization of Premiums and Discounts on Financial Instruments | | | | | | | 180 | | | | 86 | |
Deferred Income Taxes | | | | | | | 13 | | | | 12 | |
Change in Fair Value of Financial Instruments Carried at Fair Value | | | 19 | | | | (15 | ) | | | (9 | ) |
Change in Fair Value of Investment Property | | | | | | | (7 | ) | | | (2 | ) |
Net (Gain) Loss on Financial Instruments | | | 19 | | | | 35 | | | | (1,454 | ) |
Net Change in Non-cash Operating Assets and Liabilities: | | | | | | | | | | | | |
Accrued Interest Receivable | | | | | | | 25 | | | | 140 | |
Derivatives | | | | | | | (7 | ) | | | 4 | |
Due from the Government of Canada | | | 9 | | | | 124 | | | | 26 | |
Accounts Receivable and Other Assets | | | | | | | (319 | ) | | | 8 | |
Accrued Interest Payable | | | | | | | (60 | ) | | | (131 | ) |
Accounts Payable and Other Liabilities | | | | | | | (186 | ) | | | 206 | |
Defined Benefit Plans Liability | | | 14 | | | | (34 | ) | | | 129 | |
Provision for Claims | | | 15 | | | | (70 | ) | | | (91 | ) |
Unearned Premiums and Fees | | | 15,16 | | | | 62 | | | | (344 | ) |
Other | | | | | | | (59 | ) | | | (28 | ) |
Loans: | | | 7 | | | | | | | | | |
Repayments | | | | | | | 34,089 | | | | 63,261 | |
Disbursements | | | | | | | (37,329 | ) | | | (39,164 | ) |
Borrowings: | | | 12 | | | | | | | | | |
Repayments | | | | | | | (36,307 | ) | | | (65,689 | ) |
Issuances | | | | | | | 39,500 | | | | 42,025 | |
| | | | | | | | 1,123 | | | | 1,610 | |
CASH FLOWS PROVIDED BY (USED IN) INVESTING ACTIVITIES | | | | | | | | | | | | |
Investment Securities: | | | | | | | | | | | | |
Sales and Maturities | | | | | | | 9,394 | | | | 22,084 | |
Purchases | | | | | | | (11,125 | ) | | | (22,958 | ) |
Investment Property: | | | 10 | | | | | | | | | |
Disposals | | | | | | | - | | | | 8 | |
Additions | | | | | | | (4 | ) | | | (19 | ) |
Securities Purchased Under Resale Agreements | | | | | | | 91 | | | | (126 | ) |
Securities Sold Under Repurchase Agreements | | | | | | | 372 | | | | 234 | |
| | | | | | | | (1,272 | ) | | | (777 | ) |
Increase in Cash and Cash Equivalents | | | | | | | (149 | ) | | | 833 | |
Cash and Cash Equivalents | | | | | | | | | | | | |
Beginning of Year | | | | | | | 2,169 | | | | 1,336 | |
End of Year | | | | | | | 2,020 | | | | 2,169 | |
Represented by | | | | | | | | | | | | |
Cash | | | | | | | (1 | ) | | | 5 | |
Cash Equivalents | | | | | | | 2,021 | | | | 2,164 | |
| | | | | | | | 2,020 | | | | 2,169 | |
Supplementary Disclosure of Cash Flows from Operating Activities | | | | | | | | | | | | |
Amount of Interest Received During the Year | | | | | | | 5,761 | | | | 6,405 | |
Amount of Interest Paid During the Year | | | | | | | 5,027 | | | | 5,686 | |
Amount of Dividends Received During the Year | | | | | | | 39 | | | | 78 | |
Amount of Income Taxes Paid During the Year | | | | | | | 930 | | | | 503 | |
The accompanying notes to these Consolidated Financial Statements are an integral part of these statements.
Canada Mortgage and Housing Corporation 2015 ANNUAL REPORT 63
Notes to Consolidated Financial Statements
Year Ended 31 December 2015
1. Corporate Information
Canada Mortgage and Housing Corporation (CMHC) was established in Canada as a Crown corporation in 1946 by the Canada Mortgage and Housing Corporation Act (CMHC Act) to carry out the provisions of the National Housing Act (NHA). We are also subject to Part X of the Financial Administration Act (FAA) by virtue of being listed in Part 1 of Schedule III, wholly owned by the Government of Canada (Government), and an agent Crown corporation. Our National Office is located at 700 Montreal Road, Ottawa, Ontario, Canada, K1A 0P7.
Our mandate, as set out in the NHA, is to promote the construction of new houses, the repair and modernization of existing houses, and the improvement of housing and living conditions. In relation to financing for housing, the NHA’s purpose is to promote housing affordability and choice, to facilitate access to, and competition and efficiency in the provision of, housing finance, to protect the availability of adequate funding for housing, and generally to contribute to the well-being of the housing sector. In addition, we have the following objectives in carrying out any activities related to mortgage loan insurance and guarantee programs and in administering the Canadian covered bond legal framework: (a) to promote the efficient functioning and competitiveness of the housing finance market; (b) to promote and contribute to the stability of the financial system, including the housing market; and (c) to have due regard to the Corporation’s exposure to loss. We deliver on our mandate through four business activities: Market Analysis and Research, Assisted Housing, Mortgage Loan Insurance and Securitization. These activities are supported by our infrastructure of People and Processes.
Within the Public Accounts of Canada, the annual Consolidated Net Income reduces the Government’s annual deficit; the Consolidated Retained Earnings and Accumulated Other Comprehensive Income (AOCI) reduce the Government’s accumulated deficit.
In September 2008, CMHC, together with a number of other Crown corporations, was issued a directive (P.C. 2008-1598) pursuant to Section 89 of the FAA requiring due consideration to the personal integrity of those to whom it lends or provides benefits. We continue to meet the requirements of this directive.
In December 2014, CMHC was issued a directive (P.C. 2014-1380) pursuant to Section 89 of the FAA that is intended to ensure that pension plans of Crown corporations provide a 50:50 current service cost-sharing ratio between employees and employer for pension contributions to be phased in for all members by 31 December 2017. We continue to take steps to ensure the long-term sustainability of our pension plan and to manage costs. During 2015, the Corporation announced changes to the pension plan design which are described in Note 14.
In July 2015, CMHC was issued a directive (P.C. 2015-1106) pursuant to Section 89 of the FAA directing Crown corporations to align their travel, hospitality, conference and event expenditure policies, guidelines and practices with Treasury Board of Canada Secretariat (TBS) policies, directives and related instruments on travel, hospitality, conference and event expenditures in a manner consistent with their legal obligations and to report on the implementation of this directive in the Corporation’s next corporate plan. We have completed an analysis to compare our travel and hospitality policies with TBS policies, and results indicate that we are generally aligned. Gaps that were identified are not considered material, however, changes to our policies, procedures and authorities will be required to fully align them with TBS policies. We are in the process of updating our travel and hospitality policies, processes and procedures, and authorities. It is anticipated that the revised travel and hospitality policies will be implemented in 2016.
2. Basis of Preparation and Significant Accounting Policies
Basis of Preparation
Our Consolidated Financial Statements have been prepared in accordance with International Financial Reporting Standards (IFRS) effective as at 31 December 2015 as issued by the International Accounting Standards Board (IASB).
These Consolidated Financial Statements were approved by the Board of Directors on 23 March 2016.
For purposes of these Consolidated Financial Statements, our reportable segments are defined based on the programs that support our objectives: Assisted Housing, Mortgage Loan Insurance and Securitization. Market Analysis and Research and People and Processes activities are cost recovered and presented within the financial results of these three reportable segments.
64 Canada Mortgage and Housing Corporation 2015 ANNUAL REPORT
For the purposes of our segmented reporting, our Securitization Activity and Canada Housing Trust (CHT) are aggregated in the Securitization reportable segment and our Housing and Lending Programs are aggregated in the Assisted Housing reportable segment.
Aggregation of the Securitization Activity and CHT
The Securitization Activity and CHT both support our objective of ensuring adequate supply of funds for mortgage lending through mortgage securitization. Through the Canada Mortgage Bonds (CMB) program in its entirety (including the guarantee by Securitization), we contribute to the stability of the financial system by allowing lenders to access funds for residential mortgage lending.
Both segments’ business is generated by market demand for CMHC’s timely payment guarantee for mortgage funding through NHA Mortgage-Backed Securities (NHA MBS) and through CMB issued by CHT.
There are many similarities in the nature of the production processes, customers and methods of distribution. CMB are available to both institutional investors and retail investors and can be bought through investment dealers, banks, trust companies, and other types of financial institutions. The guarantee takes effect at issuance.
Aggregation of Housing and Lending Programs
The nature of services offered by the Housing and Lending Programs share many similarities and satisfy the same objective of supporting access to affordable housing for Canadians in need.
In addition, the nature of the production processes, customer and method of distribution are also similar. In the case of Housing Programs, investments are administered by provinces and territories under Social Housing Agreements (SHA), while Lending Program loans are made to federally-subsidized social housing sponsors, First Nations, provinces, territories and municipalities. In both segments, the financial support is going to the same parties and for the same purpose, under varying terms and conditions.
Measurement Basis
Our Consolidated Financial Statements have been prepared on a going concern basis using a historical cost basis except for the following items in the Consolidated Balance Sheets:
| ¡ | | Financial assets and liabilities designated at Fair Value through Profit or Loss are measured at fair value as are Held for Trading financial assets and liabilities and Available for Sale financial assets; |
| ¡ | | Investment Property is measured at fair value; and |
| ¡ | | Defined benefit liabilities for post-employment benefit plans are recognized at the present value of the defined benefit obligations, offset by the fair value of plan assets. |
Functional Currency
Our Consolidated Financial Statements are stated in millions of Canadian dollars, unless otherwise indicated, which is the functional currency.
Basis of Consolidation
These Consolidated Financial Statements include the accounts of CMHC and, as required by IFRS 10 Consolidated Financial Statements, the accounts of CHT within the Securitization Activity.
Inter-segment balances and transactions have been eliminated.
The following summarizes the significant accounting policies used in the preparation of our Consolidated Financial Statements.
Financial Instruments
We classify our financial assets in the following categories: Financial Assets designated at Fair Value through Profit or Loss (FVTPL), Held for Trading (HFT), Available for Sale (AFS), Loans and Receivables, and Held to Maturity (HTM). Two classifications are used for financial liabilities: Financial Liabilities designated at FVTPL and Other Financial Liabilities.
The classification is determined by Management at initial recognition based on its intent and the characteristics of the financial instrument.
Canada Mortgage and Housing Corporation 2015 ANNUAL REPORT 65
| | |
| |
| |
| Classification | | Accounting Treatment |
| |
Designated at Fair Value through Profit or Loss (FVTPL) | | International Accounting Standards (IAS) 39 Financial Instruments: Recognition and Measurement provides an entity the option of designating a financial instrument at FVTPL when doing so results in more relevant information because either: a) it eliminates or significantly reduces a measurement or recognition inconsistency that would otherwise arise from measuring the assets or liabilities or recognizing the gains or losses on them on different bases; or b) the financial instrument belongs to a group managed and evaluated on a fair value basis in accordance with documented risk management or investment strategies and information about the group is provided internally to key management personnel. This designation is irrevocable. Financial Instruments designated at FVTPL are initially recognized at fair value. They are subsequently measured at fair value. Unrealized gains and losses arising from changes in fair value are recorded in Net Unrealized Gains. Gains and losses realized on disposition are recorded in Net Realized Gains (Losses). Transaction costs are expensed as incurred. |
| Held for Trading (HFT) | | HFT financial instruments are either derivatives or financial instruments acquired or incurred principally for the purpose of selling or repurchasing in the near term. HFT financial instruments are initially recognized at fair value. They are subsequently measured at fair value. Unrealized gains and losses arising from changes in fair value are recorded in Net Unrealized Gains. Gains and losses realized on disposition are recorded in Net Realized Gains (Losses). Transaction costs are expensed as incurred. |
| Loans and Receivables | | Loans and Receivables are non-derivative financial assets with fixed or determinable payments that are not quoted in an active market except for those that Management has designated at FVTPL. Loans and Receivables are initially recognized at fair value plus transaction costs. They are subsequently measured at amortized cost using the effective interest method. When Loans and Receivables are determined to be impaired, the changes in their estimated realizable value are recorded in Net Income. |
| Held to Maturity (HTM) | | HTM financial assets are non-derivative financial assets with fixed or determinable payments and a fixed maturity, other than Loans and Receivables, that Management has the positive intention and ability to hold to maturity. HTM financial assets are initially recognized at fair value plus transaction costs. They are subsequently measured at amortized cost using the effective interest method. When HTM financial assets are determined to be impaired, their changes in fair value are recorded in Net Realized Gains (Losses). |
| Available for Sale (AFS) | | AFS financial assets are non-derivative financial assets which are neither classified as HFT, HTM, Loans and Receivables nor designated at FVTPL. AFS financial assets are initially recognized at fair value plus transaction costs. They are subsequently measured at fair value. Unrealized gains and losses arising from changes in fair value are recorded in Other Comprehensive Loss (OCL) until the financial asset is sold, derecognized, or determined to be impaired at which time they are transferred to Net Income and reported in Net Realized Gains (Losses). AOCI consists only of unrealized gains and losses for AFS financial instruments. |
| Other Financial Liabilities | | Other Financial Liabilities are non-derivative financial liabilities which have not been designated at FVTPL. Other Financial Liabilities are initially recognized at fair value plus transaction costs. They are subsequently measured at amortized cost using the effective interest method with interest expense recorded in Interest Expense. |
Settlement date accounting is used for purchases and sales of financial assets and financial liabilities. Realized gains and losses on sales are recognized on a weighted average cost basis.
66 Canada Mortgage and Housing Corporation 2015 ANNUAL REPORT
Financial Instruments Designated at Fair Value through Profit or Loss
We designate certain financial instruments at FVTPL. All items designated at FVTPL, with the exception of certain Investment Securities held within the Mortgage Loan Insurance and Securitization Activities relate to the Assisted Housing Activity. For certain portfolios of Loans and associated Borrowings, the Assisted Housing Activity uses Derivatives to manage refinancing and reinvestment risks as well as mismatches between the timing of receipts from assets and payments of liabilities. Designating the Loans and associated Borrowings at FVTPL significantly reduces the measurement inconsistency that would otherwise arise from measuring them at amortized cost and measuring the Derivatives at fair value. Certain Investment Securities within the Mortgage Loan Insurance and Securitization Activities are also designated at FVTPL as they are managed and reported to Management on a fair value basis.
Impairment of Financial Instruments
Management assesses at each balance sheet date whether there is objective evidence that financial assets not carried at FVTPL or HFT are impaired. A financial asset is considered impaired and impairment losses are incurred if, and only if, there is objective evidence of impairment as a result of one or more events that occurred after the initial recognition of the asset and that loss event(s) has an impact on the estimated future cash flows of the asset that can be reliably estimated.
As part of its assessment, Management performs a review for any objective evidence of impairment, which includes observable data indicating significant financial difficulty of the issuer, defaults or delinquencies in the payment of interest or principal, the disappearance of an active market for the financial asset because of the issuer’s financial difficulties, and bankruptcy or other financial reorganization of the issuer. Credit rating downgrades are considered in our assessment, although they alone might not represent objective evidence of impairment.
Available For Sale Equity Investment Securities
For equity Investment Securities classified as AFS, objective evidence of impairment also includes a significant or prolonged decline in fair value below cost, or if significant adverse changes have taken place in the technological, market, economic or legal environment in which the issuer operates. In determining whether a decline in fair value below cost is significant or prolonged, we apply certain quantitative tests to the total position in each equity security supplemented with a qualitative assessment of the financial condition of the issuer.
For equity Investment Securities classified as AFS that are identified as impaired, the cumulative unrealized loss previously recorded in OCL is reclassified from OCL and recognized as an impairment loss in Net Income for the period through Net Realized Gains (Losses). Further declines in the fair value of impaired AFS equity instruments are recognized in Net Income, while increases in fair value are recorded in OCL.
Available For Sale Debt Investment Securities
For debt Investment Securities classified as AFS that are identified as impaired, the cumulative unrealized loss previously recorded in OCL is reclassified from OCL and recognized as an impairment loss in Net Income for the period through Net Realized Gains (Losses). If the fair value of an impaired debt instrument classified as AFS subsequently increases and the increase can be related objectively to an event occurring after the impairment loss was recognized, the impairment loss is reversed in Net Income, with the reversal limited in amount to the previously recognized impairment loss. Otherwise, subsequent increases in fair value are recorded in OCL.
Loans and Receivables and Held to Maturity Financial Assets
For financial assets classified as Loans and Receivables or HTM that are identified as impaired, the carrying amount is reduced to the present value of estimated future cash flows (excluding future credit losses not yet incurred) discounted at the original effective interest rate, with the impairment loss being recorded in Net Income for the period through Net Realized Gains (Losses). Previously recognized impairment losses can be reversed if the loss decreases and the decrease can be related objectively to an event occurring after the impairment was recognized. Impairment losses can be reversed to the extent that the carrying amount of the financial asset does not exceed what the amortized cost would have been had the impairment not occurred.
Canada Mortgage and Housing Corporation 2015 ANNUAL REPORT 67
We establish an allowance for credit losses for certain loans and receivables recorded in Accounts Receivable and Other Assets from the Mortgage Loan Insurance Activity. This allowance provides for estimated amounts that may not be recovered. Factors that are considered in assessing the estimated realizable amount include, but are not limited to, underlying asset valuation, and any changes in market and economic outlook. The allowance for credit losses is included as a reduction to Accounts Receivable and Other Assets and any change in the allowance is included in Insurance Claims expense.
In certain circumstances, we may modify a loan for economic or legal reasons related to a borrower’s financial difficulties. This could include circumstances where we may take an assignment of the insured mortgage and pay the insured lender the loan balance rather than proceed with the acquisition or could include us making advances to a project in order to help it return to a state where the borrower can manage their mortgage obligations.
Once a loan is modified, if we still do not expect full collection of payment under the modified terms, the loan is classified as impaired. An impaired loan is measured at its estimated realizable value determined by discounting the expected future cash flows at the loan’s original effective interest rate. For some loans, interest is accrued only to the extent that there is an expectation of receipt.
A loan is no longer considered impaired when all past due amounts, including interest, have been recovered and it is determined that the principal and interest are fully collectable in accordance with the original contractual terms of the loan or revised terms.
Loans are written off, either partially or in full against the related allowance for credit losses when we judge that there is no realistic prospect of future recovery.
Cash and Cash Equivalents
Cash and Cash Equivalents are comprised of cash and short-term highly liquid investments with a term to maturity of 98 days or less from the date of acquisition that are readily convertible to known amounts of cash and which are subject to an insignificant risk of change in value. Cash Equivalents funded by Securities Sold Under Repurchase Agreements are classified as HTM. Otherwise, Cash Equivalents in the Assisted Housing Activity are designated at FVTPL and those in the Mortgage Loan Insurance and Securitization Activities are classified as AFS. Cash Equivalents must have a minimum credit rating of R-2 (Low) or equivalent as determined by Standard & Poor’s (S&P), Moody’s Investors Service (Moody’s) or DBRS at the time they are purchased. Interest income on these investments is recorded in Interest Income for the Assisted Housing Activity and in Investment Income for the Mortgage Loan Insurance and Securitization Activities.
Securities Purchased Under Resale Agreements and Sold Under Repurchase Agreements
Securities Purchased Under Resale Agreements (Reverse Repurchase Agreements) consist of the purchase of securities, typically Government treasury bills or bonds, with the commitment to resell the securities to the original seller at a specified price and future date in the near term. They are treated as collateralized transactions and are classified as Loans and Receivables.
Securities Sold Under Repurchase Agreements (Repurchase Agreements) consist of the sale of securities with the commitment to repurchase the securities from the original buyer at a specified price and future date in the near term. They are classified as Other Financial Liabilities. Proceeds received from these agreements are generally invested in Securities Purchased Under Resale Agreements or Cash Equivalents for the purpose of generating additional income. These transactions are entered into simultaneously with matching terms to maturity.
The associated interest earned and interest expenses are recorded in Net Interest Income for the Assisted Housing Activity and in Investment Income for the Mortgage Loan Insurance and Securitization Activities.
Investment Securities
Investment Securities in the Assisted Housing Activity are comprised of fixed income securities and are designated at FVTPL. Investment Securities in the Mortgage Loan Insurance Activity are comprised of fixed income and equity securities and are classified as AFS or designated at FVTPL. The Securitization Activity holds fixed income Investment Securities classified as AFS or designated at FVTPL. Interest income on fixed income investments is recorded in Interest Income for the Assisted Housing Activity and in Investment Income for the Mortgage Loan Insurance and Securitization Activities using the effective interest method. Dividend income on equity investments is recorded in Investment Income when the right to the dividend is established.
68 Canada Mortgage and Housing Corporation 2015 ANNUAL REPORT
Loans
Designated at Fair Value through Profit or Loss
Included in this category are economically hedged loans made under the Assisted Housing Activity, through the Lending Programs, in support of housing programs and initiatives. These loans form part of the lending hedging structure which uses derivatives to hedge refinancing and reinvestment risks and to hedge mismatches in cash flows.
Interest earned is recognized in Interest Income using the effective interest method.
Loans and Receivables
Insured Mortgage Purchase Program (IMPP) and the Canada Mortgage Bonds Program
These loans represent amounts due from Canadian financial institutions as a result of the sale of their beneficial interest in NHA MBS securities to CMHC. Loans arising from the IMPP have been funded by Borrowings from the Government. Loans arising from the CMB program are funded by the issuance of CMB. Under these arrangements, substantially all of the risks and rewards of the NHA MBS are retained by the issuers through swap agreements with the Corporation. The IMPP reached maturity in the first quarter of 2015, at which time all loans and borrowings from the Government had been repaid.
The NHA MBS and investments arising from the reinvestment of principal proceeds distributed by the NHA MBS serve as collateral to the loans and are not recognized in the Consolidated Balance Sheets. This collateral is however held in the name of the Corporation and represents the sole source of principal repayments for the loans. The amount due from the swap counterparties represents the interest earned on the loans and is recognized in Interest Income.
Lending Programs
Included in this category are loans made under the Assisted Housing Activity, through the Lending Programs which are not economically hedged. Payments on these loans are fixed and the loans do not have quoted prices in an active market. Where loans contain forgiveness clauses, they are recorded net of the forgiveness, and that forgiveness is reimbursed through parliamentary appropriations when the loans are advanced.
Interest rate losses resulting from loans containing interest rate clauses that are lower than the interest cost on the related borrowings are reimbursed through parliamentary appropriations. These loans were issued from 1946 to 1984 through provisions of the NHA. Continued receipt of appropriations going forward is assumed. If the appropriations are not received in a future year, the valuation of these loans would change.
Interest earned is recognized in Interest Income using the effective interest method.
Derivatives
We enter into derivatives, such as interest rate swaps, to manage our exposure to market risks. Derivatives are not used for speculative purposes.
Derivatives are classified as HFT as they have not been designated as eligible hedges for accounting purposes and are carried at fair value in the Consolidated Balance Sheets. Derivatives with a positive fair value are reported as assets, while derivatives with a negative fair value are reported as liabilities.
We do not have derivatives embedded in other financial instruments (host contracts) which require separation.
The net of interest income and expense is recorded in Interest Income as earned and incurred.
Parliamentary Appropriations and Housing Programs Expenses
Under the Assisted Housing Activity, we receive parliamentary appropriations to fund housing programs and initiatives.
Parliamentary Appropriations
Parliamentary appropriations are recognized as revenue in the fiscal year for which the appropriations were approved and over the same period as the related Housing Programs expenses.
Canada Mortgage and Housing Corporation 2015 ANNUAL REPORT 69
Housing Programs Expenses
Housing Programs expenses, including operating costs incurred to administer the Housing Programs, are recorded on an accrual basis not exceeding the maximum parliamentary appropriations voted by Parliament.
Those expenses incurred but not yet reimbursed are recorded in the Consolidated Balance Sheets as Due from the Government of Canada.
Investment Property
Investment properties are properties held to earn rental income or for capital appreciation, or both. Investment properties are initially recognized at cost plus transaction costs. Subsequent to initial recognition, they are measured at fair value. Gains or losses arising from changes in fair value are recognized in Other Income in the period in which they arise. Investment property rental income and expenses are recorded in Other Income. For certain investment properties under the Assisted Housing Activity, expenses are recoverable from the Minister and these are recorded in Housing Programs appropriations.
Non-current Assets Held for Sale
Real estate acquired by the Mortgage Loan Insurance Activity through loan default is classified as Non-current Assets Held for Sale when its carrying amount will be recovered principally through a sale transaction. The criteria for Held for Sale classification includes Management’s commitment to a plan to sell the selected assets and the expectation that such a sale will be completed within a 12 month period. Events or circumstances beyond our control may extend the period to complete the sale beyond one year. Such assets continue to be classified as Held for Sale as Management remains committed to its plan to sell the asset. Non-current Assets Held for Sale are measured at the lower of their carrying amount and their fair value less cost to sell and are included in Accounts Receivable and Other Assets. Impairment losses and any subsequent reversals are recognized in Insurance Claims expense in the period in which they occur. Non-current Assets Held for Sale are not depreciated.
Borrowings
Designated at Fair Value through Profit or Loss
Capital Market Borrowings
Borrowings from the Capital Markets represent borrowings incurred between 1993 and April 2008 to fund Loans in the Assisted Housing Activity. They are designated at FVTPL and form part of the lending hedging structure.
Borrowings from the Government of Canada
Since April 2008, the Assisted Housing Activity has been borrowing under the terms of the Crown Borrowing Agreement. These borrowings are incurred to fund Loans in the Lending Programs that are designated at FVTPL and form part of the lending hedging structure.
Other Financial Liabilities
Canada Mortgage Bonds
CMB are interest-bearing bullet bonds issued by CHT and guaranteed by CMHC. Coupon interest payments are made semi-annually for fixed rate CMB and quarterly for floating rate CMB. Principal repayments on the bonds are made at the end of the term. The Approved MBS Sellers reimburse CHT for the cost of arranging financing, including the fees paid to CMHC as Guarantor and Financial Services Advisor, underwriters and others for the distribution of CMB. These reimbursements are recognized in Other Income on the same basis as the related expenses. CMB are classified as Other Financial Liabilities.
We may purchase and resell CMB in the market for investment purposes. Purchases are treated as retirements of debt with the difference between the purchase price and the carrying value of the CMB being recognized as a gain or loss in Net Realized Gains (Losses). Subsequent sales are treated as re-issuance of the debt with gains and losses deferred and amortized over the remaining life of the CMB sold.
Borrowings from the Government of Canada
Other Government of Canada Borrowings represents borrowings incurred to fund loans in the Assisted Housing Activity that are not economically hedged and that have been classified as Loans and Receivables. These borrowings also include borrowings to fund the loans made under the IMPP in the Securitization Activity.
For all Borrowings, interest expenses are recognized in Interest Expense using the effective interest method.
70 Canada Mortgage and Housing Corporation 2015 ANNUAL REPORT
Pension and Other Post-employment Benefits
We have a number of benefit arrangements which provide pension and other post-employment benefits to eligible employees. These include a federally regulated pension plan (Pension Plan), an unregistered supplemental pension plan (Supplemental Plan) and other non-pension post-employment defined benefits consisting mainly of life and medical insurance. The Supplemental Plan offers benefits in excess of statutory limits as defined under the Income Tax Act (ITA).
Both the Pension Plan and the Supplemental Plan have two components: a defined benefit component and a defined contribution component. Employees who joined the Corporation prior to 4 April 2013 are eligible for the defined benefit component of both the Pension and the Supplemental Plan. Employees who joined the Corporation on or after that date are eligible for the defined contribution component of the Pension and Supplemental Plans. On 30 October 2015, the Corporation announced a new defined benefit pension plan design for all employees. The existing defined contribution plan will be closed to new entrants as of 31 December 2017 and all employees will be transferred to the new defined benefit pension plan. All pension plan modifications will apply only to service that follows the implementation date of 1 January 2018.
The Pension Plan is subject to the federal Pension Benefits Standards Act, 1985 (PBSA) and its regulations and to the ITA. The Pension Plan is registered with the Office of the Superintendent of Financial Institutions (OSFI) and the Canada Revenue Agency (CRA).
Defined Benefit Plans
The defined benefit plans include the defined benefit component of the Pension Plan and the Supplemental Plan as well as the other non-pension post-employment defined benefits. The benefits available under both the defined benefit component of the Pension Plan and the Supplemental Plan are based on length of service and average earnings over the best five-year period.
The net defined benefit liability recognized is the present value of the obligations under the defined benefit plans less the assets of those plans. The defined benefit plan assets are limited to the present value of any economic benefits available in the form of reductions in future contributions to these plans.
Net benefit costs of the plans are the current service costs, the net of the interest cost on the defined benefit obligation, the interest income on the plan assets and gain or loss on curtailment; and are included in Operating Expenses.
Remeasurements of the defined benefit plans include actuarial gains and losses and changes in the return on plan assets (excluding net interest) and are recognized in OCL as incurred and then flow into Retained Earnings in the Consolidated Balance Sheets. As such, they are not reclassified to profit or loss in subsequent periods.
Defined Contribution Plan
The defined contribution plan includes the defined contribution component of the Pension Plan and the Supplemental Plan. Employer contributions to the plan are recognized as an expense as employees render service in exchange for such contributions.
Mortgage Loan Insurance
Product Classification
We classify our mortgage loan insurance as an insurance contract as the lender faces uncertainty with regard to potential borrower default on a mortgage and therefore pays a premium to transfer the risk to us. If the borrower defaults, the claim is significantly larger than the actual premium. Such contracts remain insurance contracts until the underlying insured mortgages are fully repaid. They are measured in accordance with IFRS 4 Insurance Contracts.
Premium Revenue
Mortgage loan insurance premiums are due at the inception of the mortgage being insured at which time they are deferred (unearned premiums) and recognized as income over the period covered by the insurance contract using factors determined by the Appointed Actuary. These factors reflect the long-term pattern for default risk of the underlying mortgages. Mortgage loan insurance premiums related to insurance on loans made under various social housing programs as well as loans financed by Index Linked Mortgages (ILM) under the Federal Co-operative Housing Program are recognized immediately in the year in which they are received.
Canada Mortgage and Housing Corporation 2015 ANNUAL REPORT 71
Unearned Premiums
Unearned Premiums represent the unamortized portion of the policy premiums at the balance sheet date and therefore relate to claims that may occur from the balance sheet date to the termination of the insurance policies. Management and the Appointed Actuary on a quarterly and annual basis, compare the unearned premiums to an estimate of total future claims on a discounted basis to ensure the amount is sufficient. Should such amount not be sufficient, a provision for premium deficiency is recorded.
Provision for Claims
The Provision for Claims represents an estimate for expected claims and the related settlement expenses, net of the related expected property sale proceeds, for defaults from the mortgage insurance business that have occurred on or before the balance sheet date. The provision takes into consideration the estimate of the expected ultimate cost of claims reported but not paid and claims Incurred But Not Reported (IBNR) at the balance sheet date, the time value of money and, in accordance with accepted actuarial practice, includes an explicit provision for adverse deviation. The estimate of IBNR is generally subject to a greater degree of uncertainty than that for reported claims.
The process of determining the provision necessarily involves risks that the actual results will deviate, perhaps significantly, from the estimates made.
The change in the estimated Provision for Claims is recorded in Insurance Claims on the Consolidated Statements of Income and Comprehensive Income in the year in which they occur.
The Provision for Claims also includes a provision amount relating to insurance on loans made under various social housing programs as well as loans financed by ILM under the Federal Co-operative Housing Program. This provision is based on the assumptions that the cumulative premiums received and related investment income will be sufficient to meet future claim payouts. Due to the uniqueness of these programs, their provision is established as the fund balance plus a margin for adverse deviation.
Insurance Policy Liability Adequacy
Liability adequacy tests are performed quarterly by Management and annually as part of the Actuarial Valuation to ensure the adequacy of insurance policy liabilities net of Deferred Acquisition Costs (DAC) assets with respect to the Provision for Claims and Unearned Premiums. Current best estimates of future contractual cash flows, claims handling and administration costs, and investment returns from the assets backing the liabilities are taken into account in the tests. Where a deficiency is highlighted by the test, DAC assets are written off first, and insurance liabilities are increased once the DAC assets are written off in full. Any premium deficiency is immediately recognized in Net Income. The liability adequacy test for the Corporation has identified that no provision for premium deficiency is required.
Fees
Application fees designed to recover part or all acquisition costs associated with issuing mortgage loan insurance policies are deferred and amortized on the same basis as the related premiums.
Deferred Acquisition Costs
A portion of acquisition costs relating to the Unearned Premiums is deferred and amortized over the estimated lives of the relevant contracts. The deferred acquisition costs are included in Accounts Receivable and Other Assets.
Net Estimated Borrower Recoveries
We estimate the net borrower recoveries related to claims paid based on historical data in accordance with Canadian accepted actuarial practice. Changes to the estimated borrower recovery balance are recorded in Insurance Claims expense in the year in which they are determined. Net Estimated Borrower Recoveries are included in Accounts Receivable and Other Assets.
Guarantee Fees
We pay guarantee fees to the Department of Finance to compensate for mortgage insurance risks. These fees are deferred and recognized as expense over the period covered by the insurance contract.
72 Canada Mortgage and Housing Corporation 2015 ANNUAL REPORT
Timely Payment Guarantees
Classification
Financial guarantee contracts are defined as those that require the issuer to make specified payments to reimburse the holder for a loss it incurs because a specified debtor fails to make payment when due. We classify the timely payment guarantee for NHA MBS and CMB as a financial guarantee contract. Such contracts remain financial guarantee contracts until all rights and obligations are extinguished or expire and are presented in accordance with IAS 39 Financial Instruments: Recognition and Measurement.
Recognition and Measurement
Timely payment guarantee fees are initially recognized in Unearned Premiums and Fees at fair value (the premium received) plus transaction costs. Subsequently, they are measured at the amount initially recognized less the amortization of guarantee fee revenue. Guarantee fee revenue is recognized into income over the expected life of the related security. Should the estimated amount required to settle the timely payment guarantee obligations exceed this amount, a provision is recognized.
Application and Compensatory fees are recognized as revenues in the period where the related services are rendered. Direct costs associated with issuing timely payment guarantees are recognized in Operating Expenses as incurred.
Guarantee Fees
We pay guarantee fees to the Department of Finance to compensate for timely payment guarantee risks. These fees are deferred and recognized as expense over the period covered by the guarantee.
Income Taxes
CMHC is a prescribed federal Crown corporation under Reg. 7100 of the ITA and is subject to federal income tax as a prescribed corporation for purposes of subsection 27(2) of the ITA. We are not subject to provincial income tax. CHT is subject to federal and provincial income taxes on the amount of taxable income for the period and is permitted a deduction for all amounts paid or payable to CHT’s beneficiaries in determining income for tax purposes. As all taxable income was distributed to the beneficiaries, no provision for income taxes has been reflected for CHT in these Consolidated Financial Statements.
We use the liability method of accounting for income taxes. Under this method, Deferred Income Tax Assets and Liabilities are recognized based on the estimated tax effect of temporary differences between the carrying value of assets and liabilities on the financial statements and their respective tax bases. The Corporation uses substantively enacted income tax rates at the balance sheet date that are expected to be in effect when the asset is realized or the liability is settled. The carrying amount of Deferred Income Tax Assets is reviewed at each reporting date and reduced to the extent that it is no longer probable that sufficient taxable profit will be available to allow all or part of the Deferred Income Tax Asset to be utilized.
Related Party Transactions
Except for funds borrowed from the Government under the Crown Borrowing Program, related party transactions are made on terms equivalent to those that prevail in arm’s length transactions. Funds borrowed under the Crown Borrowing Program are at below market rates thereby allowing us to make loans at below market rates which lowers the Government’s cost to subsidize social housing.
Contingent Liabilities
Contingent liabilities are possible obligations whose existence will be confirmed only by uncertain future events or present obligations where the transfer of economic benefit is uncertain or cannot be reliably measured.
Foreign Currency Translation
Monetary assets and liabilities denominated in foreign currencies are translated into Canadian dollars at exchange rates prevailing at the balance sheet date. Exchange gains and losses resulting from the translation of foreign denominated balances are included in Net Unrealized Gains. Purchases and sales of foreign securities and the related income are translated into Canadian dollars at the exchange rates prevailing on the respective dates of the transactions.
Canada Mortgage and Housing Corporation 2015 ANNUAL REPORT 73
3. Current and Future Accounting Changes
Current Accounting Changes
We actively monitor the new standards and amendments to existing standards that have been issued by the IASB. There were no new or amended standards adopted by the Corporation during the year ended 31 December 2015 that had a material impact on our Consolidated Financial Statements.
Future Accounting Changes
The following new standards and amendments to existing standards issued by the IASB have been assessed as having a possible impact on the Corporation in the future. We are currently assessing the impact on our Consolidated Financial Statements.
IAS 1 Presentation of Financial Statements – Effective Date of 1 January 2016
On 18 December 2014, the IASB issued amendments to IAS 1 Presentation of Financial Statements that further encourage companies to apply professional judgment in determining what information to disclose in their financial statements and does not affect recognition and measurement. Earlier application is permitted. These amendments are not expected to have a material impact on our Consolidated Financial Statements.
IAS 7 Statement of Cash Flows – Effective Date of 1 January 2017
On 29 January 2016, the IASB issued amendments to IAS 7 Statement of Cash Flows. The amendments are part of the IASB’s Disclosure Initiative project intended to improve presentation and disclosure requirements in existing Standards. This amendment introduces additional disclosure requirements for liabilities arising from financing activities, including both changes arising from cash flows and non-cash changes. Early application is permitted. We have not yet determined the full impact of these amendments on our Consolidated Financial Statements.
IFRS 15 Revenue from Contracts with Customers – Effective Date of 1 January 2018
On 28 May 2014, the IASB issued IFRS 15 Revenue from Contracts with Customers that will replace IAS 18 Revenue, IAS 11 Construction Contracts and related Interpretations. This standard sets out the requirements for recognizing revenue that apply to all contracts with customers (except for contracts that are within the scope of the standards on leases, insurance contracts and financial instruments).
IFRS 15 establishes a comprehensive 5 step framework for determining when to recognize revenue and how much revenue to recognize. The core principle of the framework is that an entity should recognize revenue when a performance obligation is satisfied to transfer the promised goods or services to the customer in an amount that reflects the consideration to which the company expects to be entitled in exchange for those goods or services. This performance obligation may be satisfied at a point in time or over time.
On 11 September 2015, the IASB issued an amendment to defer the effective date of this standard by one year to 1 January 2018. Earlier application of IFRS 15 is permitted. We have not yet determined the full impact of this new standard on our Consolidated Financial Statements.
IFRS 9 Financial Instruments – Effective Date of 1 January 2018
On 24 July 2014, the IASB issued the final version of IFRS 9 Financial Instruments, bringing together the classification and measurement, impairment and hedge accounting phases of the IASB’s project to replace IAS 39 Financial Instruments: Recognition and Measurement.
IFRS 9 introduces a principle-based approach to classification and measurement of financial assets based on an entity’s business model for managing the financial assets and the contractual cash flow characteristics of those assets. Financial liability classification and measurement requirements of IAS 39 are carried forward to IFRS 9 with the exception of changes in fair value of financial liabilities designated at fair value through profit or loss. Changes in fair value of such liabilities due to an entity’s own credit risk are recognized in other comprehensive income unless doing so would create an accounting mismatch, in which case, the entire fair value change is presented in profit or loss.
74 Canada Mortgage and Housing Corporation 2015 ANNUAL REPORT
IFRS 9 introduces a new impairment model to replace the existing IAS 39 impairment requirements in order to provide more useful information about an entity’s expected credit losses on financial instruments.
IFRS 9 incorporates new hedge accounting requirements which better aligns an entity’s accounting treatment with risk management activities and improves disclosure requirements. Accounting for macro hedging activities is not included in the new model and will be addressed at a later date.
Earlier application of IFRS 9 is permitted. We have not yet determined the full impact of this new standard on our Consolidated Financial Statements but will review it in conjunction with any possible changes to IFRS 4 Insurance Contracts standard.
IFRS 16 Leases – Effective Date of 1 January 2019
On 13 January 2016, the IASB issued IFRS 16 Leases that will replace IAS 17 Leases and related Interpretations. This standard provides greater transparency about leverage, the assets an entity uses in its operations, and the risks to which it is exposed from entering into lease transactions.
Under IFRS 16, the core principle is that a lessee recognizes assets and liabilities for the rights and obligations created by all leases where the term of the lease is greater than 12 months, unless the underlying asset is of low value. A lessee would recognize a liability to make lease payments and a right-of-use asset representing its right to use the leased asset for the lease term. Depreciation of the leased assets is recognized separately from interest on lease liabilities in the statements of income. The accounting requirements for lessors are substantially unchanged.
Earlier application of IFRS 16 is permitted if IFRS 15 has also been applied. We have not yet determined the full impact of this new standard on our Consolidated Financial Statements.
4. Critical Judgments in Applying Accounting Policies and Making Estimates
Judgments in Applying Accounting Policies
In the process of applying the accounting policies, Management is required to make various judgments, apart from those involving estimations, that can significantly affect the amounts recognized in the Consolidated Financial Statements. The judgments having the most significant effect on the amounts recognized in our Consolidated Financial Statements are:
Consolidation
Significant judgments are applied in the assessment of whether the substance of the relationship between CMHC and CHT indicates that, as per IFRS 10, CMHC controls CHT. CMHC guarantees the timely payment of principal and interest on the CMB, and chooses when to provide that guarantee. CHT cannot undertake new business (i.e. issue new bonds) without the benefit of a guarantee, and its only available guarantor at present is CMHC. Within that context, CMHC has direct influence on the activities of CHT and can use this influence to manage its exposure to CHT.
Derecognition
In assessing whether transfers of NHA MBS from Issuers to the Corporation under the CMB program and IMPP qualify for derecognition, significant judgment is applied in determining whether substantially all the risks and rewards of ownership of the NHA MBS have been transferred. Per IAS 39 requirements, we have determined that the sellers of NHA MBS to the Corporation failed the derecognition criteria as they retain the risk and rewards of the NHA MBS through swap agreements. As a result, we do not recognize the underlying NHA MBS in the Consolidated Balance Sheets but rather account for the transfer as a loan.
Canada Mortgage and Housing Corporation 2015 ANNUAL REPORT 75
Impairment of AFS Financial Instruments
Significant judgment is applied in assessing if there is objective evidence of impairment, including whether declines in the fair value of AFS equity instruments below cost are significant and/or prolonged.
Use of Estimates and Assumptions
The preparation of our Consolidated Financial Statements requires Management to make estimates and assumptions. These estimates and assumptions affect the reported amounts of assets, liabilities, comprehensive income and related disclosures. Key areas where Management has made estimates and assumptions include those related to Provision for Claims, Unearned Premiums, Fair Value of Financial Instruments, and Pension and Other Post-employment Benefits. Actual results could differ from these estimates and assumptions. Where these differ, the impact will be recorded in future periods.
Provision for Claims
The Provision for Claims represents an estimate for expected claims and the related settlement expenses, net of the related expected property sale proceeds, for defaults from the mortgage loan insurance business that have occurred on or before the balance sheet date. In calculating the estimated liability, an estimate of losses on defaults that have been incurred but not reported is made using historical experience and the time value of money, which considers prevailing legal, economic, social and regulatory trends. See Note 15 for further details.
Unearned Premiums
Mortgage loan insurance premiums are deferred and recognized as revenue over the period covered by the insurance contracts using actuarially determined factors that are reviewed quarterly by Management and annually as part of the Actuarial Valuation. The premium earning factors are derived from claim occurrence patterns based on the principle that premiums will be earned at the same rate as claims are incurred. See Note 15 for further details.
Fair Value of Financial Instruments
Financial instruments carried at fair value are measured based on quoted market prices observable in the market or amounts derived from cash flow models or other valuation methodologies. The fair value measurement hierarchy described in Note 5 reflects the significance of the inputs used in making these measurements.
Pension and Other Post-employment Benefits
The annual cost of the defined benefit pension and other post-employment benefits earned by employees is actuarially determined using the projected unit credit method prorated on service and Management’s best estimate of compensation increases, retirement ages of employees, mortality of members and expected health care costs. These assumptions are of a long-term nature, which is consistent with the nature of post-employment benefits. See Note 14 for further details.
5. Fair Value Measurements
Fair Value Measurement
We measure certain financial instruments and non-financial assets at fair value in the Consolidated Balance Sheets and disclose the fair value of certain other items. Fair value is determined using a consistent measurement framework.
Fair value is the price that would be received to sell an asset or paid to transfer a liability in an orderly transaction between market participants at the measurement date under current market conditions. The fair value of an asset or a liability is measured using the assumptions that market participants would use when pricing the asset or liability, assuming that market participants act in their economic best interest. Fair value measurement of non-financial assets (e.g., Non-current Assets Held for Sale and Investment Property) takes into account a market participant’s ability to generate economic benefits by using the asset in its highest and best use or by selling it to another market participant that would use the asset in its highest and best use. For financial instruments, accrued interest is separately recorded and disclosed.
76 Canada Mortgage and Housing Corporation 2015 ANNUAL REPORT
Fair Value Hierarchy
The methods used to measure fair value make maximum use of relevant observable inputs and minimize the use of unobservable inputs. Fair value measurements are classified in a fair value hierarchy as Level 1, 2 or 3 according to the observability of the most significant inputs used in making the measurements.
Level 1
Assets and liabilities that are measured based on unadjusted quoted prices in active markets for identical assets or liabilities. An active market is one where transactions are occurring with sufficient frequency and volume to provide pricing information on an ongoing basis.
Level 2
Assets and liabilities that are measured based on observable inputs other than Level 1 prices such as observable market quotes obtained from independent dealers for identical assets or liabilities in markets that are not considered sufficiently active or by discounting expected future cash flows, making maximum use of directly or indirectly observable market data such as yield curves and implied forward curves constructed from benchmark interest rates and credit spreads of identical or similar assets or liabilities.
Level 3
Assets and liabilities not quoted in active markets that are measured using valuation techniques. Where possible, inputs to the valuation techniques are based on observable market data such as yield curves and implied forward curves constructed from benchmark interest rates and credit spreads of similar assets or liabilities. Where observable inputs are not available, unobservable inputs are used. For Level 3 assets and liabilities, unobservable inputs are significant to the overall measurement of fair value.
We have processes and controls in place to ensure fair value is appropriately measured. The valuation of financial instruments is performed by the Operations Support Division (OSD) which reports to the Senior Vice President, Capital Markets. OSD has developed models and methodologies to determine fair value of financial instruments not quoted in active markets which are reviewed and monitored on an ongoing basis. All valuations are subject to independent price verification (IPV) managed by the sector of the Chief Risk Officer. IPV is a process where valuations are independently verified against external market prices and other relevant market data on an ongoing basis.
For Investment Property, fair value is determined by independent external property appraisers who hold recognized and relevant professional qualifications and our internal appraisers on a rotating basis.
Methods and Assumptions
We measure fair value using the following methods and assumptions:
Cash Equivalents
Government treasury bills are valued using unadjusted closing bid price quotes from active markets. Other money market instruments such as bankers’ acceptances and commercial paper are valued by discounting future cash flows using observable discount rate curves.
Investment Securities
Fixed income and equity securities traded in active markets are valued using closing bid price quotes from those markets. For the Investment Securities for which quoted prices in active markets are not available, valuation techniques are used to measure fair value as described below.
For fixed income securities fair value is determined by discounted cash flow techniques, using spread differentials of similar actively traded securities or indicative quotes obtained by independent dealers. Discounted cash flow techniques use observable discount rate curves for instruments having similar characteristics. Future cash flows of certain floating rate bonds are estimated based on observable implied forward rate curves.
Canada Mortgage and Housing Corporation 2015 ANNUAL REPORT 77
The fair value of the variable rate asset-backed securities received in the restructuring of the Canadian asset-backed commercial paper market is determined by discounting expected future cash flows using observable market discount rates and an unobservable risk premium which takes into account the lack of market liquidity and inherent risk of the securities.
For our private limited partnership equity investment, fair value is measured as our share of the partnership’s net asset value. In measuring net asset value, the fair value of the partnership’s real estate assets is determined at least annually by independent appraisers using the income approach or the market approach, and the fair value of its long-term debt is measured by discounting expected future cash flows.
Loans
Loans are valued by discounting future cash flows using discount rate curves that reflect the collection guarantees provided by provincial, territorial or federal levels of government. Inputs into the discount model are the Government yield curve and spreads derived from assets with comparable financial risks.
Derivatives
Interest rate swaps are valued by discounting estimated future cash flows using observable discount rate curves. Future cash flows for floating rate legs are estimated based on observable implied forward rate curves. An adjustment is made to reflect the credit risk that either counterparty may not be able to fulfil its obligations. Inputs to this adjustment include market-implied default rates and estimated recovery rates, and the adjustment takes into account master netting and collateral arrangements in place.
Investment Property
The fair value of Investment Property is determined using either the income approach or the market approach, incorporating the highest and best use of the property. Of the total fair value of investment properties, 12.3% (2014 – 43.0%) was based on valuations performed by independent valuators and 87.7% (2014 – 57.0%) was based on internal valuations.
The income approach is primarily applied in determining the fair value of rent-producing properties. Under the income approach, fair value is based upon the present value of expected future cash flows of each property using an unobservable discount rate reflective of the characteristics of the property. Future cash flows are estimated using unobservable assumptions about future rental values and vacancy rates.
The market approach is primarily applied in determining the fair value of vacant land. Under the market approach, fair value is based upon market transactions involving comparable property, with adjustments made to reflect the unique aspects of the property being valued.
The highest and best use of the Investment Property held in the Assisted Housing Activity ($156 million as at 31 December 2015; $149 million as at 31 December 2014) differs from its current use as these investment properties are used to carry out CMHC’s social housing mandate rather than maximize its economic value.
Borrowings
The fair value of Capital Market Borrowings is measured using unadjusted closing ask price quotes from active markets. Borrowings from the Government of Canada are valued by discounting future cash flows using discount rate curves derived from the directly observable yields of our market-traded borrowings.
Financial Instruments with Fair Value Equal to Carrying Value
We have assessed that the fair value of Securities Purchased Under Resale Agreements, Accrued Interest Receivable, Due from the Government of Canada, Accounts Receivable, Securities Sold Under Repurchase Agreements, Accrued Interest Payable and Accounts Payable approximates their carrying value largely due to the short-term maturities of these instruments.
78 Canada Mortgage and Housing Corporation 2015 ANNUAL REPORT
Comparison of Carrying and Fair Values of Financial Instruments
The following table compares the carrying and fair values of financial instruments, except where the carrying value is a reasonable approximation of fair value. Carrying value is the amount at which an item is measured in the Consolidated Balance Sheets.
| | | | | | | | | | | | | | | | | | | | | | | | |
| | | | |
| | | Carrying Value | | | | | | | |
| | | | | | |
(in millions) | | Amortized
Cost | | | Fair Value
through Net
Income | | | Fair Value
through OCI | | | Total | | | Fair Value | | | Fair Value
Over (Under)
Carrying Value | |
| |
| | | 2015 | |
Financial Assets | | | | | | | | | | | | | | | | | | | | | | | | |
| | | | | | |
Cash and Cash Equivalents1 | | | 697 | | | | 1,186 | | | | 137 | | | | 2,020 | | | | 2,020 | | | | - | |
| | | | | | |
Investment Securities: | | | | | | | | | | | | | | | | | | | | | | | | |
| | | | | | |
Designated at Fair Value through Profit or Loss | | | - | | | | 1,147 | | | | - | | | | 1,147 | | | | 1,147 | | | | - | |
| | | | | | |
Available for Sale | | | - | | | | - | | | | 22,168 | | | | 22,168 | | | | 22,168 | | | | - | |
| | | | | | |
Loans: | | | | | | | | | | | | | | | | | | | | | | | | |
| | | | | | |
Designated at Fair Value through Profit or Loss | | | - | | | | 4,955 | | | | - | | | | 4,955 | | | | 4,955 | | | | - | |
| | | | | | |
Loans and Receivables2 | | | 219,713 | | | | - | | | | - | | | | 219,713 | | | | 227,168 | | | | 7,455 | |
| | | | | | |
Derivatives | | | - | | | | 117 | | | | - | | | | 117 | | | | 117 | | | | - | |
| | | | | | |
Financial Liabilities | | | | | | | | | | | | | | | | | | | | | | | | |
| | | | | | |
Borrowings: | | | | | | | | | | | | | | | | | | | | | | | | |
| | | | | | |
Designated at Fair Value through Profit or Loss | | | - | | | | 7,078 | | | | - | | | | 7,078 | | | | 7,078 | | | | - | |
| | | | | | |
Other Financial Liabilities3 | | | 216,274 | | | | - | | | | - | | | | 216,274 | | | | 223,829 | | | | 7,555 | |
| | | | | | |
Derivatives | | | - | | | | 31 | | | | - | | | | 31 | | | | 31 | | | | - | |
| | |
| | | 2014 | |
Financial Assets | | | | | | | | | | | | | | | | | | | | | | | | |
| | | | | | |
��Cash and Cash Equivalents1 | | | 325 | | | | 979 | | | | 865 | | | | 2,169 | | | | 2,169 | | | | - | |
| | | | | | |
Investment Securities: | | | | | | | | | | | | | | | | | | | | | | | | |
| | | | | | |
Designated at Fair Value through Profit or Loss | | | - | | | | 1,060 | | | | - | | | | 1,060 | | | | 1,060 | | | | - | |
| | | | | | |
Available for Sale | | | - | | | | - | | | | 21,812 | | | | 21,812 | | | | 21,812 | | | | - | |
| | | | | | |
Loans: | | | | | | | | | | | | | | | | | | | | | | | | |
| | | | | | |
Designated at Fair Value through Profit or Loss | | | - | | | | 5,503 | | | | - | | | | 5,503 | | | | 5,503 | | | | - | |
| | | | | | |
Loans and Receivables2 | | | 215,944 | | | | - | | | | - | | | | 215,944 | | | | 222,381 | | | | 6,437 | |
| | | | | | |
Derivatives | | | - | | | | 105 | | | | - | | | | 105 | | | | 105 | | | | - | |
| | | | | | |
Financial Liabilities | | | | | | | | | | | | | | | | | | | | | | | | |
| | | | | | |
Borrowings: | | | | | | | | | | | | | | | | | | | | | | | | |
| | | | | | |
Designated at Fair Value through Profit or Loss | | | - | | | | 7,677 | | | | - | | | | 7,677 | | | | 7,677 | | | | - | |
| | | | | | |
Other Financial Liabilities3 | | | 213,612 | | | | - | | | | - | | | | 213,612 | | | | 220,219 | | | | 6,607 | |
Derivatives | | | - | | | | 31 | | | | - | | | | 31 | | | | 31 | | | | - | |
| 1 | | Of the total Cash and Cash Equivalents, $1,186 million (2014 – $979 million) is classified as designated at FVTPL, $137 million (2014 – $865 million) is classified as AFS, and $697 million (2014 – $325 million) is classified as HTM. |
| 2 | | The fair value of Loans and Receivables is categorized as Level 2. |
| 3 | | $218,045 million (2014 – $211,967 million) fair value determined based on Level 1 Criteria, $5,784 million (2014 – $8,252 million) fair value determined based on Level 2 Criteria. |
Canada Mortgage and Housing Corporation 2015 ANNUAL REPORT 79
Fair Value Hierarchy for Items Carried at Fair Value
The following tables present the fair value hierarchy for assets and liabilities carried at fair value in the Consolidated Balance Sheets.
| | | | | | | | | | | | | | | | | | | | | | | | |
| | | | | |
| |
| | | 2015 | |
| | | |
| | | Items Carried at Fair Value | | | Items not | | | Total | |
(in millions) | | Level 1 | | | Level 2 | | | Level 3 | | | Total | | | Carried at Fair Value | | |
ASSETS | | | | | | | | | | | | | | | | | | | | | | | | |
| | | | | | |
Cash and Cash Equivalents | | | | | | | | | | | | | | | | | | | | | | | | |
| | | | | | |
Cash | | | (1 | ) | | | - | | | | - | | | | (1 | ) | | | - | | | | (1 | ) |
| | | | | | |
Interest Bearing Deposits with Banks | | | - | | | | 1,108 | | | | - | | | | 1,108 | | | | 55 | | | | 1,163 | |
| | | | | | |
Corporate/Other Entities | | | - | | | | 40 | | | | - | | | | 40 | | | | 65 | | | | 105 | |
| | | | | | |
Government of Canada | | | 97 | | | | - | | | | - | | | | 97 | | | | - | | | | 97 | |
| | | | | | |
Provinces/Municipalities | | | - | | | | 79 | | | | - | | | | 79 | | | | 577 | | | | 656 | |
Total Cash and Cash Equivalents | | | 96 | | | | 1,227 | | | | - | | | | 1,323 | | | | 697 | | | | 2,020 | |
| | | | | | |
Investment Securities: | | | | | | | | | | | | | | | | | | | | | | | | |
| | | | | | |
Designated at Fair Value through Profit or Loss | | | | | | | | | | | | | | | | | | | | | | | | |
| | | | | | |
Fixed Income | | | | | | | | | | | | | | | | | | | | | | | | |
| | | | | | |
Corporate/Other Entities | | | - | | | | 62 | | | | 164 | | | | 226 | | | | - | | | | 226 | |
| | | | | | |
Provinces/Municipalities | | | - | | | | 600 | | | | - | | | | 600 | | | | - | | | | 600 | |
| | | | | | |
Sovereign and Related Entities | | | - | | | | 321 | | | | - | | | | 321 | | | | - | | | | 321 | |
Total Designated at Fair Value through Profit or Loss | | | - | | | | 983 | | | | 164 | | | | 1,147 | | | | - | | | | 1,147 | |
| | | | | | |
Available for Sale | | | | | | | | | | | | | | | | | | | | | | | | |
| | | | | | |
Fixed Income | | | | | | | | | | | | | | | | | | | | | | | | |
| | | | | | |
Corporate/Other Entities | | | - | | | | 10,411 | | | | - | | | | 10,411 | | | | - | | | | 10,411 | |
| | | | | | |
Government of Canada | | | 3,717 | | | | 50 | | | | - | | | | 3,767 | | | | - | | | | 3,767 | |
| | | | | | |
Provinces/Municipalities | | | - | | | | 6,518 | | | | - | | | | 6,518 | | | | - | | | | 6,518 | |
| | | | | | |
Sovereign and Related Entities | | | - | | | | 354 | | | | - | | | | 354 | | | | - | | | | 354 | |
| | | | | | |
Equities | | | | | | | | | | | | | | | | | | | | | | | | |
| | | | | | |
Canadian | | | 1,084 | | | | - | | | | 34 | | | | 1,118 | | | | - | | | | 1,118 | |
Total Available for Sale | | | 4,801 | | | | 17,333 | | | | 34 | | | | 22,168 | | | | - | | | | 22,168 | |
| | | | | | |
Loans: | | | | | | | | | | | | | | | | | | | | | | | | |
| | | | | | |
Designated at Fair Value through Profit or Loss | | | - | | | | 4,955 | | | | - | | | | 4,955 | | | | - | | | | 4,955 | |
| | | | | | |
Derivatives | | | - | | | | 117 | | | | - | | | | 117 | | | | - | | | | 117 | |
| | | | | | |
Investment Property | | | - | | | | - | | | | 258 | | | | 258 | | | | - | | | | 258 | |
| | | | | | |
Assets not Recorded at Fair Value | | | - | | | | - | | | | - | | | | - | | | | 221,442 | | | | 221,442 | |
TOTAL ASSETS | | | 4,897 | | | | 24,615 | | | | 456 | | | | 29,968 | | | | 222,139 | | | | 252,107 | |
LIABILITIES AND EQUITY OF CANADA | | | | | | | | | | | | | | | | | | | | | | | | |
| | | | | | |
Borrowings: | | | | | | | | | | | | | | | | | | | | | | | | |
| | | | | | |
Designated at Fair Value through Profit or Loss | | | 739 | | | | 6,339 | | | | - | | | | 7,078 | | | | - | | | | 7,078 | |
| | | | | | |
Derivatives | | | - | | | | 31 | | | | - | | | | 31 | | | | - | | | | 31 | |
| | | | | | |
Liabilities and Equity of Canada not Recorded at Fair Value | | | - | | | | - | | | | - | | | | - | | | | 244,998 | | | | 244,998 | |
TOTAL LIABILITIES AND EQUITY OF CANADA | | | 739 | | | | 6,370 | | | | - | | | | 7,109 | | | | 244,998 | | | | 252,107 | |
| | |
80 Canada Mortgage and Housing Corporation 2015 ANNUAL REPORT
| | | | | | | | | | | | | | | | | | | | | | | | |
| | |
| |
| | | 2014 | |
| | | |
| | | Items Carried at Fair Value | | | Items not Carried at Fair Value | | | Total | |
(in millions) | | Level 1 | | | Level 2 | | | Level 3 | | | Total | | | |
| | |
ASSETS | | | | | | | | | | | | | | | | | | | | | | | | |
| | | | | | |
Cash and Cash Equivalents | | | | | | | | | | | | | | | | | | | | | | | | |
| | | | | | |
Cash | | | 6 | | | | - | | | | - | | | | 6 | | | | - | | | | 6 | |
| | | | | | |
Interest Bearing Deposits with Banks | | | - | | | | 933 | | | | - | | | | 933 | | | | 45 | | | | 978 | |
| | | | | | |
Corporate/Other Entities | | | - | | | | 90 | | | | - | | | | 90 | | | | 159 | | | | 249 | |
| | | | | | |
Government of Canada | | | 815 | | | | - | | | | - | | | | 815 | | | | - | | | | 815 | |
| | | | | | |
Provinces/Municipalities | | | - | | | | - | | | | - | | | | - | | | | 121 | | | | 121 | |
Total Cash and Cash Equivalents | | | 821 | | | | 1,023 | | | | - | | | | 1,844 | | | | 325 | | | | 2,169 | |
| | | | | | |
Investment Securities: | | | | | | | | | | | | | | | | | | | | | | | | |
| | | | | | |
Designated at Fair Value through Profit or Loss | | | | | | | | | | | | | | | | | | | | | | | | |
| | | | | | |
Fixed Income | | | | | | | | | | | | | | | | | | | | | | | | |
| | | | | | |
Corporate/Other Entities | | | - | | | | 83 | | | | 159 | | | | 242 | | | | - | | | | 242 | |
| | | | | | |
Provinces/Municipalities | | | - | | | | 661 | | | | - | | | | 661 | | | | - | | | | 661 | |
| | | | | | |
Sovereign and Related Entities | | | - | | | | 157 | | | | - | | | | 157 | | | | - | | | | 157 | |
Total Designated at Fair Value through Profit or Loss | | | - | | | | 901 | | | | 159 | | | | 1,060 | | | | - | | | | 1,060 | |
| | | | | | |
Available for Sale | | | | | | | | | | | | | | | | | | | | | | | | |
| | | | | | |
Fixed Income | | | | | | | | | | | | | | | | | | | | | | | | |
| | | | | | |
Corporate/Other Entities | | | - | | | | 6,734 | | | | - | | | | 6,734 | | | | - | | | | 6,734 | |
| | | | | | |
Government of Canada | | | 7,957 | | | | 49 | | | | - | | | | 8,006 | | | | - | | | | 8,006 | |
| | | | | | |
Provinces/Municipalities | | | - | | | | 5,560 | | | | - | | | | 5,560 | | | | - | | | | 5,560 | |
| | | | | | |
Sovereign and Related Entities | | | - | | | | 297 | | | | - | | | | 297 | | | | - | | | | 297 | |
| | | | | | |
Equities | | | | | | | | | | | | | | | | | | | | | | | | |
| | | | | | |
Canadian | | | 1,196 | | | | - | | | | 19 | | | | 1,215 | | | | - | | | | 1,215 | |
Total Available for Sale | | | 9,153 | | | | 12,640 | | | | 19 | | | | 21,812 | | | | - | | | | 21,812 | |
| | | | | | |
Loans: | | | | | | | | | | | | | | | | | | | | | | | | |
| | | | | | |
Designated at Fair Value through Profit or Loss | | | - | | | | 5,503 | | | | - | | | | 5,503 | | | | - | | | | 5,503 | |
| | | | | | |
Derivatives | | | - | | | | 105 | | | | - | | | | 105 | | | | - | | | | 105 | |
| | | | | | |
Investment Property | | | - | | | | - | | | | 247 | | | | 247 | | | | - | | | | 247 | |
| | | | | | |
Assets not Recorded at Fair Value | | | - | | | | - | | | | - | | | | - | | | | 217,594 | | | | 217,594 | |
TOTAL ASSETS | | | 9,974 | | | | 20,172 | | | | 425 | | | | 30,571 | | | | 217,919 | | | | 248,490 | |
LIABILITIES AND EQUITY OF CANADA | | | | | | | | | | | | | | | | | | | | | | | | |
| | | | | | |
Borrowings: | | | | | | | | | | | | | | | | | | | | | | | | |
| | | | | | |
Designated at Fair Value through Profit or Loss | | | 1,417 | | | | 6,260 | | | | - | | | | 7,677 | | | | - | | | | 7,677 | |
| | | | | | |
Derivatives | | | - | | | | 31 | | | | - | | | | 31 | | | | - | | | | 31 | |
| | | | | | |
Liabilities and Equity of Canada not Recorded at Fair Value | | | - | | | | - | | | | - | | | | - | | | | 240,782 | | | | 240,782 | |
TOTAL LIABILITIES AND EQUITY OF CANADA | | | 1,417 | | | | 6,291 | | | | - | | | | 7,708 | | | | 240,782 | | | | 248,490 | |
| | |
Transfers Between Fair Value Hierarchy Levels and Reclassification
For assets and liabilities measured at fair value in the Consolidated Financial Statements on a recurring basis, we determine whether transfers have occurred between levels in the hierarchy by re-assessing categorization at the end of each reporting period.
Transfers may occur between levels of the fair value hierarchy as a result of changes in the availability of quoted market prices or observable market inputs. Transfers between levels are deemed to occur at the beginning of the quarter in which the transfer occurs. There were no transfers during the year ended 31 December 2015 (2014 – nil). However, during the year, we reclassified certain fixed income securities from Level 1 to Level 2. As a result of the reclassification, the presentation of the fair values of these securities in the comparative figures as at 31 December 2014 was reviewed to conform to the current year presentation.
Canada Mortgage and Housing Corporation 2015 ANNUAL REPORT 81
Change in Fair Value Measurement for Items Classified as Level 3
The following tables present the change in fair value for items carried at fair value and classified as Level 3.
| | | | | | | | | | | | | | | | | | | | | | |
| |
| |
| | | 2015 |
| | | | | | |
(in millions) | | Balance at
Beginning
of Year | | | Purchases | | | Unrealized
Gains in Net
Income1, 2 | | | Unrealized
Gains in
OCI3 | | | Cash
Receipts on
Settlements/
Disposals | | | Balance
at End
of Year |
| |
Investment Securities | | | | | | | | | | | | | | | | | | | | | | |
| | | | | | |
Designated at Fair Value through Profit or Loss | | | | | | | | | | | | | | | | | | | | | | |
| | | | | | |
Asset-Backed Securities | | | 159 | | | | - | | | | 5 | | | | - | | | | - | | | 164 |
| | | | | | |
Available for Sale | | | | | | | | | | | | | | | | | | | | | | |
| | | | | | |
Limited Partnership Investment | | | 19 | | | | 10 | | | | - | | | | 7 | | | | (2 | ) | | 34 |
Total Investment Securities | | | 178 | | | | 10 | | | | 5 | | | | 7 | | | | (2 | ) | | 198 |
Investment Property | | | 247 | | | | 4 | | | | 7 | | | | - | | | | - | | | 258 |
Total | | | 425 | | | | 14 | | | | 12 | | | | 7 | | | | (2 | ) | | 456 |
| |
1 Included in Net Unrealized Gains for Investment Securities; Other Income for Investment Property. 2 Comprises unrealized gains relating to these assets held at 31 December 2015. 3 Included in Net Unrealized Gains. |
| |
| |
| | | 2014 |
| | | | | | |
(in millions) | | Balance at
Beginning
of Year | | | Purchases | | | Unrealized
Gains in Net
Income1, 2 | | | Unrealized
Gains in
OCI3 | | | Cash
Receipts on
Settlements/
Disposals | | | Balance
at End
of Year |
| |
Investment Securities | | | | | | | | | | | | | | | | | | | | | | |
| | | | | | |
Designated at Fair Value through Profit or Loss | | | | | | | | | | | | | | | | | | | | | | |
| | | | | | |
Asset-Backed Securities | | | 150 | | | | - | | | | 9 | | | | - | | | | - | | | 159 |
| | | | | | |
Available for Sale | | | | | | | | | | | | | | | | | | | | | | |
| | | | | | |
Limited Partnership Investment | | | 17 | | | | 1 | | | | - | | | | 1 | | | | - | | | 19 |
Total Investment Securities | | | 167 | | | | 1 | | | | 9 | | | | 1 | | | | - | | | 178 |
Investment Property | | | 234 | | | | 19 | | | | 2 | | | | - | | | | (8 | ) | | 247 |
Total | | | 401 | | | | 20 | | | | 11 | | | | 1 | | | | (8 | ) | | 425 |
| |
1 Included in Net Unrealized Gains for Investment Securities; Other Income for Investment Property. 2 Comprises unrealized gains relating to these assets held at 31 December 2014. 3 Included in Net Unrealized Gains. |
82 Canada Mortgage and Housing Corporation 2015 ANNUAL REPORT
Unobservable Inputs for Items Classified as Level 3
The valuation of items classified as Level 3 use unobservable inputs, changes in which may significantly affect the measurement of fair value. Valuations were based on assessments of the prevailing conditions at 31 December 2015, which may change materially in subsequent periods. The following table presents quantitative information about the significant unobservable inputs used in Level 3 fair value measurements for items carried at fair value.
| | | | | | | | | | | | | | | | |
| |
| | |
| | | 2015 | | 2014 |
| | | | | | |
(in millions) | | Asset Fair
Value | | | Valuation
Technique | | Unobservable
Inputs | | Weighted Average Input/ Range | | Asset Fair
Value | | | Weighted Average Input/ Range |
| |
Investment Securities | | | | | | | | | | | | | | | | |
| | | | | | |
Designated at Fair Value through Profit or Loss | | | | | | | | | | | | | | | | |
| | | | | | |
Asset-Backed Securities | | | 164 | | | Discounted Cash Flow | | Risk Premium | | 1.4% | | | 159 | | | 1.6% |
| | | | | | |
Available for Sale | | | | | | | | | | | | | | | | |
Limited Partnership Investment | | | 34 | | | Share of Partnership Equity | | Reported Partnership Equity | | n.a. | | | 19 | | | n.a. |
Total Investment Securities | | | 198 | | | | | | | | | | 178 | | | |
Investment Property | | | | | | | | | | | | | | | | |
| | | | | | |
Investment Property Held By Mortgage Loan Insurance Activity | | | 102 | | | Discounted Cash Flow | | Estimated Rental Value per Square Foot | | $4 - $37 | | | 98 | | | $3 - $40 |
| | | | | | | | Discount Rate | | 7.0% - 8.0% | | | | | | 6.8% - 8.5% |
| | | | | | |
Investment Property Held By Assisted Housing Activity | | | 17 | | | Discounted Cash Flow | | Estimated Rental Value per Square Foot | | $22 - $148 | | | 20 | | | $25 - $148 |
| | | | | | | | Discount Rate | | 4.0% - 5.8% | | | | | | 4.5% - 6.0% |
| | | 139 | | | Market Approach | | Value per Square Foot | | $0 - $325 | | | 129 | | | $0 - $237 |
Total Investment Property | | | 258 | | | | | | | | | | 247 | | | |
Total Level 3 Items Carried at Fair Value | | | 456 | | | | | | | | | | 425 | | | |
| |
Level 3 Sensitivity Analysis
Investment Securities
For the asset-backed securities classified as Level 3, significant increases (decreases) in the unobservable risk premiums included in the discount rates used to calculate fair value would result in a decrease (increase) in the fair value measurement. The following table presents the impact to Income before Income Taxes of a 100 bps shock to the risk premium.
| | | | | | | | |
| |
| | |
| | | 2015 | | 2014 |
| | |
| | | Risk Premium Change | | Risk Premium Change |
| | | | |
(in millions) | | -100 bps | | +100 bps | | -100 bps | | +100 bps |
| |
Net Unrealized Gains (Losses) | | 2 | | (2) | | 3 | | (3) |
| |
Investment Property
For Investment Property, significant increases (decreases) in estimated rental value per square foot would result in a significantly higher (lower) fair value of the properties. Significant increases (decreases) in discount rates would result in a significantly lower (higher) fair value.
Canada Mortgage and Housing Corporation 2015 ANNUAL REPORT 83
6. Investment Securities
The following table shows the maturity structure and average yield for Investment Securities.
| | | | | | | | | | | | | | | | | | | | | | |
| | | | |
| | | Remaining Term to Maturity | | | | | |
| | | | | | | | | |
(in millions) | | Within 1 Year | | | | | 1 to 3
Years | | | | 3 to 5
Years | | | | Over 5 Years | | Total 2015 | | | Total 2014 |
Designated at Fair Value through Profit or Loss | | | | | | | | | | | | | | | | | | | | | | |
| | | | | | | | | |
Fixed Income | | | | | | | | | | | | | | | | | | | | | | |
| | | | | | | | | |
Corporate/Other Entities | | | - | | | | | 164 | | | | 62 | | | | - | | | 226 | | | 242 |
| | | | | | | | | |
Provinces/Municipalities | | | 228 | | | | | 111 | | | | 261 | | | | - | | | 600 | | | 661 |
| | | | | | | | | |
Sovereign and Related Entities | | | - | | | | | 76 | | | | 245 | | | | - | | | 321 | | | 157 |
Total Designated at Fair Value through Profit or Loss | | | 228 | | | | | 351 | | | | 568 | | | | - | | | 1,147 | | | 1,060 |
| | | | | | | | | |
Yield1 | | | 2.8% | | | | | 1.2% | | | | 1.6% | | | | - | | | 1.7% | | | 2.2% |
| | | | | | | | | |
Available for Sale | | | | | | | | | | | | | | | | | | | | | | |
| | | | | | | | | |
Fixed Income | | | | | | | | | | | | | | | | | | | | | | |
| | | | | | | | | |
Corporate/Other Entities | | | 1,092 | | | | | 3,314 | | | | 2,492 | | | | 3,513 | | | 10,411 | | | 6,734 |
| | | | | | | | | |
Government of Canada | | | 441 | | | | | 922 | | | | 822 | | | | 1,582 | | | 3,767 | | | 8,006 |
| | | | | | | | | |
Provinces/Municipalities | | | 319 | | | | | 1,347 | | | | 1,320 | | | | 3,532 | | | 6,518 | | | 5,560 |
| | | | | | | | | |
Sovereign and Related Entities | | | - | | | | | 10 | | | | 204 | | | | 140 | | | 354 | | | 297 |
Total Fixed Income | | | 1,852 | | | | | 5,593 | | | | 4,838 | | | | 8,767 | | | 21,050 | | | 20,597 |
| | | | | | | | | |
Yield1 | | | 1.8% | | | | | 2.1% | | | | 2.4% | | | | 3.1% | | | 2.5% | | | 2.5% |
| | | | | | | | | |
Canadian Equities | | | | | | | | | | | | | | | | | | | 1,118 | | | 1,215 |
| | | | | | | | | |
Yield2 | | | | | | | | | | | | | | | | | | | 5.6% | | | 5.4% |
| | | | | | | | | |
Total Available for Sale | | | | | | | | | | | | | | | | | | | 22,168 | | | 21,812 |
| 1 | | Represents the weighted-average yield, determined as the weighted-average of the effective yields of individual securities. |
| 2 | | Represents the average yield, determined by dividing dividend income by average cost. |
The following table shows the cumulative unrealized gains (losses) on Investment Securities recorded at fair value.
| | | | | | | | | | | | | | | | | | | | | | | | |
| | | |
| | | 2015 | | | 2014 | |
| | | | | | |
(in millions) | | Amortized
Cost1 | | | Gross
Cumulative
Unrealized
Gains | | | Gross
Cumulative
Unrealized
Losses | | | Fair Value | | | Amortized
Cost1 | | | Fair Value | |
Investment Securities: | | | | | | | | | | | | | | | | | | | | | | | | |
| | | | | | |
Fixed Income | | | | | | | | | | | | | | | | | | | | | | | | |
| | | | | | |
Designated at Fair Value through Profit or Loss | | | 1,069 | | | | 79 | | | | (1) | | | | 1,147 | | | | 987 | | | | 1,060 | |
| | | | | | |
Available for Sale | | | 20,342 | | | | 726 | | | | (18) | | | | 21,050 | | | | 20,004 | | | | 20,597 | |
| | | | | | |
Equities | | | | | | | | | | | | | | | | | | | | | | | | |
| | | | | | |
Available for Sale | | | 726 | | | | 392 | | | | - | | | | 1,118 | | | | 714 | | | | 1,215 | |
| 1 | | Amortized cost for Equities is acquisition cost less impairment losses, if any. |
We have Investment Securities of $698 million (2014 – $325 million) that are part of Securities Sold Under Repurchase Agreements with terms that do not exceed 93 days. We continue to earn Investment Income and recognize in OCL changes in fair values on these Investment Securities during the year.
The cumulative unrealized loss from AFS fixed income and equity investments of $18 million (2014 – $1 million) has been recorded in AOCI and has not been recognized as an impairment loss in Net Income.
During 2015, $5 million (2014 – nil) of impairment losses on Equities was recognized in Net Realized Gains and no reversals of previously realized fixed income investment security impairments occurred during the year.
84 Canada Mortgage and Housing Corporation 2015 ANNUAL REPORT
7. Loans
The following table presents the contractual maturity profile of loans based on carrying value.
| | | | | | | | | | | | | | | | | | | | | | | | | | | | | | | | |
| | | | |
| | | Year of Maturity | | | | | | | |
| | | | | | | | |
(in millions) | | 2016 | | | 2017 | | | 2018 | | | 2019 | | | 2020 | | | 2021 and
Thereafter | | | Total
2015 | | | Total
2014 | |
Designated at Fair Value through Profit or Loss | | | | | | | | | | | | | | | | | | | | | | | | | | | | | | | | |
| | | | | | | | |
Lending Programs | | | 952 | | | | 823 | | | | 768 | | | | 870 | | | | 999 | | | | 543 | | | | 4,955 | | | | 5,503 | |
Total Designated at Fair Value through Profit or Loss | | | 952 | | | | 823 | | | | 768 | | | | 870 | | | | 999 | | | | 543 | | | | 4,955 | | | | 5,503 | |
| | | | | | | | |
Yield | | | 2.8% | | | | 2.1% | | | | 2.4% | | | | 2.2% | | | | 1.7% | | | | 2.3% | | | | 2.2% | | | | 2.6% | |
| | | | | | | | |
Loans and Receivables | | | | | | | | | | | | | | | | | | | | | | | | | | | | | | | | |
| | | | | | | | |
Loans under the IMPP | | | - | | | | - | | | | - | | | | - | | | | - | | | | - | | | | - | | | | 2,025 | |
| | | | | | | | |
Loans under the CMB Program | | | 32,266 | | | | 29,673 | | | | 38,779 | | | | 30,813 | | | | 39,955 | | | | 44,136 | | | | 215,622 | | | | 209,487 | |
| | | | | | | | |
Lending Programs | | | 69 | | | | 49 | | | | 78 | | | | 101 | | | | 242 | | | | 3,552 | | | | 4,091 | | | | 4,432 | |
Total Loans and Receivables | | | 32,335 | | | | 29,722 | | | | 38,857 | | | | 30,914 | | | | 40,197 | | | | 47,688 | | | | 219,713 | | | | 215,944 | |
| | | | | | | | |
Yield | | | 1.9% | | | | 1.6% | | | | 2.2% | | | | 1.6% | | | | 1.7% | | | | 3.0% | | | | 2.1% | | | | 2.4% | |
Total | | | 33,287 | | | | 30,545 | | | | 39,625 | | | | 31,784 | | | | 41,196 | | | | 48,231 | | | | 224,668 | | | | 221,447 | |
The following table presents repayments and disbursements for Loans.
| | | | | | | | | | | | | | | | |
| | |
| | |
| | | 2015 | | | 2014 | |
| | | | |
(in millions) | | Repayments | | | Disbursements | | | Repayments | | | Disbursements | |
Designated at Fair Value through Profit or Loss | | | | | | | | | | | | | | | | |
| | | | |
Lending Programs | | | 612 | | | | 79 | | | | 604 | | | | 80 | |
Total Designated at Fair Value through Profit or Loss | | | 612 | | | | 79 | | | | 604 | | | | 80 | |
| | | | |
Loans and Receivables | | | | | | | | | | | | | | | | |
| | | | |
Loans under the IMPP | | | 2,025 | | | | - | | | | 26,049 | | | | - | |
| | | | |
Loans under the CMB Program | | | 31,100 | | | | 37,244 | | | | 36,200 | | | | 39,071 | |
| | | | |
Lending Programs | | | 352 | | | | 6 | | | | 408 | | | | 13 | |
Total Loans and Receivables | | | 33,477 | | | | 37,250 | | | | 62,657 | | | | 39,084 | |
Total | | | 34,089 | | | | 37,329 | | | | 63,261 | | | | 39,164 | |
| | |
Loans Past Due
A loan is considered past due but not impaired when a counterparty has not made a payment by the contractual due date. The following table presents the aging of loans from contractual due date, that are past due but not impaired.
| | | | | | | | | | | | | | | | | | | | |
| | | | | | |
(in millions) | | Within 1 Year | | | 1 to 3 Years | | | Over 3 Years | | | Total 2015 | | | Total 2014 | |
Designated at Fair Value through Profit or Loss | | | | | | | | | | | | | | | | | | | | |
| | | | | |
Lending Programs | | | 83 | | | | 8 | | | | 15 | | | | 106 | | | | 74 | |
Total Designated at Fair Value through Profit or Loss | | | 83 | | | | 8 | | | | 15�� | | | | 106 | | | | 74 | |
Loans and Receivables | | | | | | | | | | | | | | | | | | | | |
| | | | | |
Loans under the IMPP | | | - | | | | - | | | | - | | | | - | | | | - | |
| | | | | |
Loans under the CMB Program | | | - | | | | - | | | | - | | | | - | | | | - | |
| | | | | |
Lending Programs | | | 4 | | | | - | | | | 2 | | | | 6 | | | | 31 | |
Total Loans and Receivables | | | 4 | | | | - | | | | 2 | | | | 6 | | | | 31 | |
Total Loans Past Due | | | 87 | | | | 8 | | | | 17 | | | | 112 | | | | 105 | |
| | |
Canada Mortgage and Housing Corporation 2015 ANNUAL REPORT 85
Sources of Guarantee
For Loans – Designated at Fair Value through Profit or Loss, no change in fair value is attributable to changes in credit risk. We are assured collection of principal and accrued interest on 99% (2014 – 99%) of our loans. The sources of guarantee for these loans are provided below.
| | | | | | | | | | | | | | | | | | | | | | | | |
| | |
| | |
| | | 2015 | | | 2014 | |
| | | | | | |
(in millions) | | Designated
at Fair Value
through Profit
or Loss | | | Loans and
Receivables | | | Total | | | Designated
at Fair Value
through Profit
or Loss | | | Loans and
Receivables | | | Total | |
| | | | | | |
Provinces and Territories through Provisions in the Social Housing Agreements | | | 2,327 | | | | 1,624 | | | | 3,951 | | | | 2,636 | | | | 1,773 | | | | 4,409 | |
| | | | | | |
Government of Canada through Provisions in the NHA | | | - | | | | 870 | | | | 870 | | | | - | | | | 947 | | | | 947 | |
| | | | | | |
Indigenous and Northern Affairs Canada through Ministerial Loan Guarantees | | | 1,277 | | | | 63 | | | | 1,340 | | | | 1,284 | | | | 51 | | | | 1,335 | |
| | | | | | |
Loans Underwritten by our Mortgage Loan Insurance Activity | | | 728 | | | | 60 | | | | 788 | | | | 867 | | | | 76 | | | | 943 | |
| | | | | | |
Collateral1 | | | - | | | | 215,622 | | | | 215,622 | | | | - | | | | 211,512 | | | | 211,512 | |
Total Guaranteed Loans | | | 4,332 | | | | 218,239 | | | | 222,571 | | | | 4,787 | | | | 214,359 | | | | 219,146 | |
Unsecured Loans2 | | | 623 | | | | 1,474 | | | | 2,097 | | | | 716 | | | | 1,585 | | | | 2,301 | |
Total | | | 4,955 | | | | 219,713 | | | | 224,668 | | | | 5,503 | | | | 215,944 | | | | 221,447 | |
| | |
| 1 | | Represents collateral held for loans under the IMPP and CMB program which consists of NHA MBS securities and high quality reinvestment assets. |
| 2 | | These loans are to Provincial entities and Municipalities and are assessed on a regular basis to determine if an allowance for credit losses is necessary. As at 31 December 2015, one impaired loan has been identified and an allowance of $23 million has been recorded (2014 – $22 million). |
8. Derivatives
Derivatives are financial contracts whose value is derived from movements in one or more underlying securities, rates, indices or other instruments or derivatives. We use derivatives in conjunction with our risk management activities.
Interest rate swaps are transactions in which two parties exchange interest cash flows on a specified notional amount for a predetermined period based on agreed-upon fixed and floating rates. Notional amounts are not exchanged. The value of these swaps is derived from movements in interest rates. We use them to manage reinvestment risk, refinancing risk, or mismatches in the timing of receipts from assets versus payments of liabilities.
The table below provides the notional amounts of the derivative transactions recognized in the Consolidated Financial Statements. Notional amounts, which are off-balance sheet, serve as a point of reference for calculating payments and do not represent the fair value, or the potential gain or loss associated with the credit or market risk of such instruments.
| | | | | | | | | | | | | | | | | | | | | | | | | | |
| | | |
| | | 2015 | | | 2014 | |
| | | | | |
| | | Average | | | | | Fair Value | | | | | | Fair Value | |
| | | Term to | | Notional | | | Asset | | | Liability | | | Notional | | | Asset | | | Liability | |
(in millions) | | Maturity | | Amount | | | | | Amount | | | |
Interest Rate Swaps | | 3 years | | | 10,514 | | | | 117 | | | | 31 | | | | 11,350 | | | | 105 | | | | 31 | |
86 Canada Mortgage and Housing Corporation 2015 ANNUAL REPORT
Credit Exposure of Derivatives
The following table presents the credit exposure of derivatives by term to maturity. The replacement value is the total current fair value including accrued interest of all outstanding contracts with a positive fair value, after factoring in the impact of master netting agreements. The replacement value represents our maximum derivative credit exposure. Potential future credit exposure represents an estimate of the potential change in the market value of the transaction up to maturity which is calculated in relation to the notional principal of the contracts by applying factors consistent with guidelines issued by OSFI.
Credit Risk Equivalent is the total of the replacement value and the potential future credit exposure. The risk weighted equivalent is determined by applying a standard OSFI defined measure of counterparty credit risk to the credit equivalent amount.
| | | | | | | | | | | | | | | | | | | | | | | | | | | | | | | | | | | | |
| | | | | |
| | | Replacement value | | | Potential
Future
Credit
Exposure | | | 2015 | | | 2014 | |
(in millions) | | Within 1
Year | | | 1 to 3
Years | | | 3 to 5
Years | | | Over 5
Years | | | | Credit Risk
Equivalent | | | Risk-
Weighted
Equivalent | | | Credit Risk
Equivalent | | | Risk-
Weighted
Equivalent | |
Interest Rate Swaps | | | 12 | | | | 42 | | | | 36 | | | | 29 | | | | 10 | | | | 129 | | | | 26 | | | | 128 | | | | 25 | |
The fair value of the collateral we hold related to our derivatives as at 31 December 2015 was nil (2014 – $1 million).
9. Parliamentary Appropriations and Housing Programs Expenses
For the year ended 31 December 2015, we recognized $2,049 million (2014 – $2,010 million) in the Assisted Housing Activity in Revenues for parliamentary appropriations.
These appropriations were used to fund the following Housing Programs expenses, including Operating Expenses incurred to support these programs.
| | | | | | | | |
| | | |
(in millions) | | 2015 | | | 2014 | |
| | |
Funding Under Long-term Commitments for Existing Social Housing | | | 1,650 | | | | 1,655 | |
| | |
Funding for New Commitments of Affordable Housing | | | 348 | | | | 302 | |
| | |
Housing Support | | | 10 | | | | 7 | |
| | |
Market Analysis Information | | | 22 | | | | 23 | |
| | |
Housing Policy, Research and Information Transfer | | | 19 | | | | 23 | |
Total | | | 2,049 | | | | 2,010 | |
Of the total amount expensed on Housing Programs, $913 million (2014 – $937 million) was provided for programs transferred to Provinces/Territories under SHA. Under the SHA, the Province/Territory assumes our financial and other obligations with respect to these programs in exchange for pre-determined annual funding. The accountability framework requires the Province/Territory to provide an audited Annual Statement of Funding and Expenditures and an Annual Program Performance Report. This funding may become repayable by the Provinces/Territories if the amounts are not used in accordance with the terms and conditions of the SHA.
Housing Programs expenses also include related party transactions between the Government and us for the reimbursement of:
| ¡ | | Our Operating Expenses incurred to support and administer the Housing Programs within the Assisted Housing Activity; |
| ¡ | | Interest rate losses resulting from certain loans made under the Assisted Housing Activity through the Lending Programs that contain interest rate clauses that are lower than the associated interest cost on the related borrowings; |
| ¡ | | Operating losses on certain investments in housing programs and real estate properties held by the Assisted Housing Activity through the Lending Programs; and |
| ¡ | | Default losses on certain loans under the Assisted Housing Activity through the Lending Programs as well as net disposal losses on certain investments in housing programs and real estate properties held by the Assisted Housing Activity through Lending Programs. |
Canada Mortgage and Housing Corporation 2015 ANNUAL REPORT 87
The following table summarizes the nature of these expenses reimbursed by the Government.
| | | | | | | | |
| | | |
(in millions) | | 2015 | | | 2014 | |
Operating Expenses | | | 112 | | | | 120 | |
| | |
Interest Rate Losses | | | 31 | | | | 37 | |
| | |
Operating Losses | | | 1 | | | | 1 | |
| | |
Default and Disposal Losses | | | 2 | | | | 1 | |
Total | | | 146 | | | | 159 | |
The total reimbursements for interest losses includes $9 million (2014 – $12 million), towards our losses incurred as a result of the prepayment and repricing activity on loans made under the Assisted Housing Activity through our Lending Programs.
Reimbursements of losses and expenses are recorded as Due from the Government of Canada and Housing Programs expenses on an accrual basis.
The following table presents the change in the Due from the Government of Canada account. The outstanding balance as at 31 December 2015 is mainly composed of Housing Programs expenses incurred but not yet reimbursed.
| | | | | | | | |
| | | |
(in millions) | | 2015 | | | 2014 | |
Balance at Beginning of Year | | | 285 | | | | 311 | |
| | |
Total Appropriations Recognized in Revenues During the Year | | | 2,049 | | | | 2,010 | |
| | |
Total Appropriations Received During the Year | | | (2,171) | | | | (2,035) | |
| | |
Third Party Reimbursements in Excess of Remittance to Government of Canada | | | (2) | | | | (1) | |
Balance at End of Year | | | 161 | | | | 285 | |
10. Investment Property
As at 31 December 2015, the total balance of Investment Property was $258 million (2014 – $247 million) of which $156 million was held by the Assisted Housing Activity and $102 million was held by the Mortgage Loan Insurance Activity. The properties included in Mortgage Loan Insurance Activity are rent producing properties and the properties included in Assisted Housing Activity are used to carry out our social housing mandate.
The following table presents the changes in the Investment Property balance. Disclosures related to the determination of fair value of Investment Property are included in Note 5.
| | | | | | | | | | | | | | | | | | | | | | | | |
| | | |
| | | 2015 | | | 2014 | |
| | | | | | |
(in millions) | | Mortgage
Loan
Insurance | | | Assisted
Housing | | | Total | | | Mortgage
Loan
Insurance | | | Assisted
Housing | | | Total | |
Balance at Beginning of Year | | | 98 | | | | 149 | | | | 247 | | | | 84 | | | | 150 | | | | 234 | |
| | | | | | |
Additions | | | 3 | | | | 1 | | | | 4 | | | | 17 | | | | 2 | | | | 19 | |
| | | | | | |
Disposals | | | - | | | | - | | | | - | | | | - | | | | (8) | | | | (8) | |
| | | | | | |
Unrealized Gains (Losses) in Net Income1 | | | 1 | | | | 6 | | | | 7 | | | | (3) | | | | 5 | | | | 2 | |
Balance at End of Year | | | 102 | | | | 156 | | | | 258 | | | | 98 | | | | 149 | | | | 247 | |
| 1 | Included in Other Income. |
88 Canada Mortgage and Housing Corporation 2015 ANNUAL REPORT
11. Accounts Receivable and Other Assets
The following table presents the composition of Accounts Receivable and Other Assets.
| | | | | | | | |
| | | |
(in millions) | | 2015 | | | 2014 | |
Accounts Receivable | | | 37 | | | | 18 | |
| | |
Income Taxes Receivable | | | 244 | | | | - | |
| | |
Non-current Assets Held for Sale | | | 69 | | | | 79 | |
| | |
Deferred Acquisition Costs (Note 15) | | | 127 | | | | 117 | |
| | |
Deferred Government of Canada Fees | | | 138 | | | | 89 | |
| | |
Net Estimated Borrower Recoveries | | | 54 | | | | 47 | |
| | |
Workouts1 | | | 87 | | | | 84 | |
| | |
Property, Plant and Equipment | | | 56 | | | | 54 | |
| | |
Other | | | 27 | | | | 32 | |
Total | | | 839 | | | | 520 | |
| 1 | Workouts are mortgages or loans that benefit from the Mortgage Loan Insurance supported default management activities that enable borrowers to work through their financial difficulties. An allowance for credit losses is established for these workouts. At 31 December 2015, the allowance was $167 million (2014 – $166 million) relating to workouts of $254 million (2014 – $250 million). |
12. Borrowings
The following table summarizes the carrying value and yield for borrowings based on maturity date.
| | | | | | | | | | | | | | | | | | | | | | | | | | | | | | | | |
| | |
| | | Year of Maturity | | | | | | | |
(in millions) | | | 2016 | | | | 2017 | | | | 2018 | | | | 2019 | | | | 2020 | | |
| 2021 and
Thereafter |
| |
| Total
2015 |
| |
| Total
2014 |
|
Designated at Fair Value through Profit or Loss | | | | | | | | | | | | | | | | | | | | | | | | | | | | | | | | |
| | | | | | | | |
Borrowings from the Government of Canada | | | 1,191 | | | | 996 | | | | 1,164 | | | | 1,097 | | | | 1,216 | | | | 675 | | | | 6,339 | | | | 6,260 | |
| | | | | | | | |
Capital Market Borrowings | | | 456 | | | | 283 | | | | - | | | | - | | | | - | | | | - | | | | 739 | | | | 1,417 | |
Total Designated at Fair Value through Profit or Loss | | | 1,647 | | | | 1,279 | | | | 1,164 | | | | 1,097 | | | | 1,216 | | | | 675 | | | | 7,078 | | | | 7,677 | |
| | | | | | | | |
Yield1 | | | 2.8% | | | | 2.1% | | | | 2.3% | | | | 2.0% | | | | 1.6% | | | | 2.3% | | | | 2.2% | | | | 2.6% | |
| | | | | | | | |
Other Financial Liabilities | | | | | | | | | | | | | | | | | | | | | | | | | | | | | | | | |
| | | | | | | | |
Canada Mortgage Bonds | | | 31,526 | | | | 29,364 | | | | 38,245 | | | | 30,814 | | | | 39,299 | | | | 42,832 | | | | 212,080 | | | | 207,055 | |
| | | | | | | | |
Borrowings from the Government of Canada | | | 266 | | | | 327 | | | | 388 | | | | 333 | | | | 332 | | | | 2,548 | | | | 4,194 | | | | 6,557 | |
Total Other Financial Liabilities | | | 31,792 | | | | 29,691 | | | | 38,633 | | | | 31,147 | | | | 39,631 | | | | 45,380 | | | | 216,274 | | | | 213,612 | |
| | | | | | | | |
Yield1 | | | 1.9% | | | | 1.6% | | | | 2.2% | | | | 1.6% | | | | 1.7% | | | | 3.0% | | | | 2.1% | | | | 2.4% | |
Total | | | 33,439 | | | | 30,970 | | | | 39,797 | | | | 32,244 | | | | 40,847 | | | | 46,055 | | | | 223,352 | | | | 221,289 | |
| | |
| 1 | Represents the weighted-average yield, determined by applying the weighted-average effective yields of individual fixed rate borrowings and the weighted-average yields-to-reset of floating rate notes. |
Canada Mortgage and Housing Corporation 2015 ANNUAL REPORT 89
Borrowings – Designated at Fair Value through Profit or Loss
Included in this category are Borrowings from the Government of Canada which are short-term and medium-term debt. Short-term debt, having an original term to maturity less than 365 days, was nil at 31 December 2015 (2014 – nil). Medium-term debt includes fixed rate notes, with an original term to maturity ranging from two to ten years.
Also included in this category are Capital Market Borrowings which consist of fixed rate notes with an original term to maturity ranging from two to ten years.
The carrying amount at 31 December 2015 of Borrowings – Designated at Fair Value through Profit and Loss is $151 million higher (2014 – $165 million) than the contractual amount due at maturity. Our liabilities are backed by the full faith and credit of the Government and there is no significant change in value that can be attributed to changes in credit risk.
The following table presents issuances and repayments for Borrowings – Designated at Fair Value through Profit or Loss.
| | | | | | | | | | | | | | | | |
| | |
| | | 2015 | | | 2014 | |
| | | | |
(in millions) | | Issuances | | | Repayments | | | Issuances | | | Repayments | |
Borrowings from the Government of Canada | | | 2,256 | | | | 2,191 | | | | 2,954 | | | | 3,129 | |
| | | | |
Capital Market Borrowings | | | - | | | | 650 | | | | - | | | | - | |
Total | | | 2,256 | | | | 2,841 | | | | 2,954 | | | | 3,129 | |
| | |
Borrowings – Other Financial Liabilities
This category includes borrowings we issued for the IMPP and the CMB Program as well as Borrowings from the Government of Canada for some of our Lending Programs.
The following table presents issuances and repayments for Borrowings – Other Financial Liabilities.
| | | | | | | | | | | | | | | | |
| | |
| | |
| | | 2015 | | | 2014 | |
| | | | |
(in millions) | | Issuances | | | Repayments | | | Issuances | | | Repayments | |
| | |
Canada Mortgage Bonds | | | 37,244 | | | | 31,100 | | | | 39,071 | | | | 36,200 | |
| | | | |
Borrowings from the Government of Canada | | | - | | | | 2,366 | | | | - | | | | 26,360 | |
Total | | | 37,244 | | | | 33,466 | | | | 39,071 | | | | 62,560 | |
| | |
Borrowing Authorities
The Minister of Finance approves CMHC’s Borrowing Plan annually and establishes limits and parameters for borrowings. The Borrowing Authorities provide a maximum debt outstanding limit for 2015 of $16 billion. This limit includes Capital Market Borrowings and Borrowings from the Government of Canada that were incurred since April 2008 in the Assisted Housing and Securitization Activities, whose combined outstanding principal balance was $8.4 billion at 31 December 2015. The legislative authority, which does not apply to borrowings of CHT, requires that the total indebtedness outstanding at any time, other than to the Government, not exceed $20 billion. The outstanding principal balance of this indebtedness was $740 million as at 31 December 2015.
13. Accounts Payable and Other Liabilities
The following table presents the composition of Accounts Payable and Other Liabilities.
| | | | | | | | |
| | | |
(in millions) | | 2015 | | | 2014 | |
Income Taxes Payable | | | - | | | | 231 | |
| | |
Accrued Housing Programs Expenses | | | 286 | | | | 234 | |
| | |
Other Miscellaneous Liabilities | | | 201 | | | | 208 | |
Total | | | 487 | | | | 673 | |
90 Canada Mortgage and Housing Corporation 2015 ANNUAL REPORT
14. Pension and Other Post-Employment Benefits
Defined Benefit Plans
The defined benefit plans include the defined benefit component of the Pension Plan and the Supplemental Plan as well as the other non-pension post-employment defined benefit plans.
Effective 4 April 2013, the defined benefit component of the Pension Plan and the Supplemental Plan was closed to new entrants. Eligible employees joining the Corporation after this date were enrolled in the defined contribution plan. On 30 October 2015, the Corporation announced a new defined benefit pension plan design for all employees. The existing defined contribution plan will be closed to new entrants as of 31 December 2017 and all employees will be transferred to the new modified defined benefit pension plan. All pension plan modifications will only apply to service that follows the implementation date of 1 January 2018. All benefits earned by employees under the existing plans prior to the implementation date will remain unchanged.
Our defined benefit component of the Pension Plan requires contributions to be made to a separately administered fund (the Pension Fund) whereas the defined benefit component of the Supplemental Plan and the other non-pension post-employment defined benefits are unfunded and the benefits are paid directly by the Corporation.
Pursuant to a trust agreement we entered into with the Pension Fund Trustees (the Trustees), they are responsible for the management and administration of the Pension Fund. There are eight Trustees, including our President, one member of the Board of Directors, three members of senior management and three Pension Council members (a combination of current and retired employees). The Trustees set investment policies and objectives within the context of the Enterprise Risk Management policies established by the Board of Directors, and periodically review the Pension Fund’s asset allocation policy. The Pension Fund’s Investment Committee assists the Trustees in the investment management of the defined benefit component of the Pension Plan.
The Pension Fund’s asset allocation policy is based upon the principle of diversification of investments among various asset classes relative to the liabilities of the defined benefit component of the Pension Plan. The current policy has been established at 57% public equity investments, 28% fixed income securities and 15% inflation sensitive assets. The policy includes permissible ranges around these percentage weights. The investments of the Pension Fund are subject to credit, liquidity and market risks. The most significant of these risks is asset volatility due to market conditions. The liabilities of the defined benefit component of the Pension Plan are adjusted to the Consumer Price Index and as such, they are subject to interest rate risks, inflation risk and changes in the life expectancy of the plan members. The most significant is interest rate risk as the present value of the liabilities is calculated using a discount rate set with reference to Canadian AA-Corporate bond yields. If the Pension Fund assets underperform this yield, the funded position of the defined benefit component of the Pension Plan decreases. Financial risks are managed primarily through the diversification of assets and prudent investment strategies.
The actuarial valuation on a going concern basis of our defined benefit component of the Pension Plan reports a surplus as at 31 December 2015. As a result, we are not required to make going concern special payments. The valuation on a solvency basis, which assumes that the plan is wound up at the valuation date, reports a deficit as at 31 December 2015 and we are required to make special payments of $70.7 million in 2016 to reduce the solvency deficiency.
We continue to make full normal contributions and to monitor the defined benefit component of the Pension Plan. The next actuarial valuation will be undertaken at year-end 2016, with the results reported in the 2016 Annual Report Consolidated Financial Statements.
The defined benefit obligation relating to the defined benefit plans is funded as follows:
| | | | | | | | | | | | | | | | |
| | | |
| | | Pension Benefit Plans | | | Other Post-employment Benefit Plans | |
| | | | |
(in millions) | | 2015 | | | 2014 | | | 2015 | | | 2014 | |
Wholly or Partially Funded | | | 1,992 | | | | 1,935 | | | | - | | | | - | |
| | | | |
Wholly Unfunded | | | 73 | | | | 67 | | | | 122 | | | | 196 | |
Defined Benefit Obligation | | | 2,065 | | | | 2,002 | | | | 122 | | | | 196 | |
Canada Mortgage and Housing Corporation 2015 ANNUAL REPORT 91
Obligation and Assets
The following tables present information about the defined benefit plans.
| | | | | | | | | | | | | | | | | | | | | | | | | | | | | | | | | | | | | | | | |
| | | | | | | | |
| | | | | | Pension Expense Included in Net Income | | | | | | | | | | | | | | | | |
| | | | | | | | | | |
Year ended 31 Dec. 2015 (in millions) | | 1 Jan.
2015 | | | Current
Service
Cost | | | Interest
Cost/
Income | | | Plan
Amendments/
Curtailment | | | Sub-
total
Included
in Net
Income | | | Benefits
Paid | | | Remeas.
of the
Net Def.
Benefit
Plans
Incl. in
OCL1 | | | Employees’
Contri-
butions | | | CMHC’s
Contri-
butions | | | 31 Dec. 2015 | |
Pension Benefit Plans | | | | | | | | | | | | | | | | | | | | | | | | | | | | | | | | | | | | | | | | |
| | | | | | | | | | |
Defined Benefit Obligation | | | 2,002 | | | | 32 | | | | 78 | | | | - | | | | 110 | | | | (95) | | | | 35 | | | | 13 | | | | - | | | | 2,065 | |
| | | | | | | | | | |
Fair Value of Plan Assets | | | 1,719 | | | | - | | | | 66 | | | | - | | | | 66 | | | | (95) | | | | (26) | | | | 13 | | | | 65 | | | | 1,742 | |
Pension Benefit Plans Liability | | | 283 | | | | 32 | | | | 12 | | | | - | | | | 44 | | | | - | | | | 61 | | | | - | | | | (65) | | | | 323 | |
Other Post-employment Benefit Plans | | | | | | | | | | | | | | | | | | | | | | | | | | | | | | | | | | | | | | | | |
| | | | | | | | | | |
Defined Benefit Obligation | | | 196 | | | | 4 | | | | 7 | | | | (32) | | | | (21) | | | | (33) | | | | (20) | | | | - | | | | - | | | | 122 | |
| | | | | | | | | | |
Fair Value of Plan Assets | | | - | | | | - | | | | - | | | | - | | | | - | | | | (33) | | | | - | | | | - | | | | 33 | | | | - | |
Other Post-employment Benefit Plans Liability | | | 196 | | | | 4 | | | | 7 | | | | (32) | | | | (21) | | | | - | | | | (20) | | | | - | | | | (33) | | | | 122 | |
Defined Benefit Plans Liability | | | 479 | | | | 36 | | | | 19 | | | | (32) | | | | 23 | | | | - | | | | 41 | | | | - | | | | (98) | | | | 445 | |
| 1 | | The detailed breakdown of Remeasurements of the Net Defined Benefit Plans Included in OCL is found in additional tables below. |
In 2015, the Corporation announced changes to the benefits to be provided under the other post-employment benefit plan to employees retiring on or after 1 January 2018. This resulted in plan amendment gains of $32 million. Effective September 2015, retirement severance benefits and the alternate pay death benefits were paid out at the time of cessation. This amounted to $30 million of settlement payments, included in benefits paid for Other Post-employment Benefit Plans above.
| | | | | | | | | | | | | | | | | | | | | | | | | | | | | | | | | | | | | | | | |
| | | | | | | | |
| | | | | | Pension Expense Included in Net Income | | | | | | | | | | | | | | | | |
| | | | | | | | | | |
Year ended 31 Dec. 2014 (in millions) | | 1 Jan.
2014 | | | Current
Service
Cost | | | Interest
Cost/
Income | | | Plan
Amendments/
Curtailment | | | Sub-
total
Included
in Net
Income | | | Benefits
Paid | | | Remeas.
of the
Net Def.
Benefit
Plans
Incl. in
OCL1 | | | Employees’
Contri-
butions | | | CMHC’s
Contri-
butions | | | 31 Dec.
2014 | |
Pension Benefit Plans | | | | | | | | | | | | | | | | | | | | | | | | | | | | | | | | | | | | | | | | |
| | | | | | | | | | |
Defined Benefit Obligation | | | 1,719 | | | | 31 | | | | 80 | | | | (3 | ) | | | 108 | | | | (85 | ) | | | 244 | | | | 16 | | | | - | | | | 2,002 | |
| | | | | | | | | | |
Fair Value of Plan Assets | | | 1,544 | | | | - | | | | 72 | | | | - | | | | 72 | | | | (85 | ) | | | 96 | | | | 16 | | | | 76 | | | | 1,719 | |
Pension Benefit Plans Liability | | | 175 | | | | 31 | | | | 8 | | | | (3 | ) | | | 36 | | | | - | | | | 148 | | | | - | | | | (76) | | | | 283 | |
Other Post-employment Benefit Plans | | | | | | | | | | | | | | | | | | | | | | | | | | | | | | | | | | | | | | | | |
| | | | | | | | | | |
Defined Benefit Obligation | | | 175 | | | | 4 | | | | 8 | | | | (9 | ) | | | 3 | | | | (7 | ) | | | 25 | | | | - | | | | - | | | | 196 | |
| | | | | | | | | | |
Fair Value of Plan Assets | | | - | | | | - | | | | - | | | | - | | | | - | | | | (7 | ) | | | - | | | | - | | | | 7 | | | | - | |
Other Post-employment Benefit Plans Liability | | | 175 | | | | 4 | | | | 8 | | | | (9 | ) | | | 3 | | | | - | | | | 25 | | | | - | | | | (7) | | | | 196 | |
Defined Benefit Plans Liability | | | 350 | | | | 35 | | | | 16 | | | | (12 | ) | | | 39 | | | | - | | | | 173 | | | | - | | | | (83) | | | | 479 | |
| 1 | | The detailed breakdown of Remeasurements of the Net Defined Benefit Plans Included in OCL is found in additional tables below. |
92 Canada Mortgage and Housing Corporation 2015 ANNUAL REPORT
In 2014, plan membership decreased by 193 members (approximately 12.9%) resulting in a curtailment gain of $12 million.
The following tables present further detailed information on the various sources of Remeasurement in OCL included in the prior table.
| | | | | | | | | | | | | | | | | | | | |
| | |
| | | Remeasurement (Gains)/Losses Included in OCL | |
| | | | | |
Year ended 31 December 2015 (in millions) | | Return of Plan
Assets (Excluding
Amounts Included in
Interest Income) | | | Actuarial
Changes Arising
from Changes
in Demographic
Assumptions | | | Actuarial
Changes Arising
from Changes
in Financial
Assumptions | | | Actuarial
Changes
Arising
from Plan
Experience | | | Total
Included
in OCL | |
Pension Benefit Plans | | | | | | | | | | | | | | | | | | | | |
| | | | | |
Defined Benefit Obligation | | | - | | | | 1 | | | | 13 | | | | 21 | | | | 35 | |
| | | | | |
Fair Value of Plan Assets | | | (26) | | | | - | | | | - | | | | - | | | | (26) | |
Pension Benefit Plans Liability | | | 26 | | | | 1 | | | | 13 | | | | 21 | | | | 61 | |
Other Post-employment Benefit Plans | | | | | | | | | | | | | | | | | | | | |
| | | | | |
Defined Benefit Obligation | | | - | | | | - | | | | (17 | ) | | | (3 | ) | | | (20) | |
| | | | | |
Fair Value of Plan Assets | | | - | | | | - | | | | - | | | | - | | | | - | |
Other Post-employment Benefit Plans Liability | | | - | | | | - | | | | (17 | ) | | | (3 | ) | | | (20) | |
Defined Benefit Plans Liability | | | 26 | | | | 1 | | | | (4 | ) | | | 18 | | | | 41 | |
| | | | | | | | | | | | | | | | | | | | |
| | |
| | | Remeasurement (Gains)/Losses Included in OCL | |
| | | | | |
Year ended 31 December 2014 (in millions) | | Return of Plan
Assets (Excluding
Amounts Included in
Interest Income) | | | Actuarial
Changes Arising
from Changes
in Demographic
Assumptions | | | Actuarial
Changes Arising
from Changes
in Financial
Assumptions | | | Actuarial
Changes
Arising
from Plan
Experience | | | Total
Included
in OCL | |
Pension Benefit Plans | | | | | | | | | | | | | | | | | | | | |
| | | | | |
Defined Benefit Obligation | | | - | | | | 30 | | | | 212 | | | | 2 | | | | 244 | |
| | | | | |
Fair Value of Plan Assets | | | 96 | | | | - | | | | - | | | | - | | | | 96 | |
Pension Benefit Plans Liability | | | (96) | | | | 30 | | | | 212 | | | | 2 | | | | 148 | |
Other Post-employment Benefit Plans | | | | | | | | | | | | | | | | | | | | |
| | | | | |
Defined Benefit Obligation | | | - | | | | - | | | | 25 | | | | - | | | | 25 | |
| | | | | |
Fair Value of Plan Assets | | | - | | | | - | | | | - | | | | - | | | | - | |
Other Post-employment Benefit Plans Liability | | | - | | | | - | | | | 25 | | | | - | | | | 25 | |
Defined Benefit Plans Liability | | | (96) | | | | 30 | | | | 237 | | | | 2 | | | | 173 | |
The Remeasurement of Plan Assets is the difference between the actual rate of return on the defined benefit pension plan assets and the discount rate used to measure the obligation. The actual return on plan assets was $40 million (2014 – $168 million).
Canada Mortgage and Housing Corporation 2015 ANNUAL REPORT 93
The following table presents information on the fair value of the investments which are administered by the Trustees.
| | | | | | | | | | | | | | | | | | | | | | | | | | | | | | | | |
| | | |
| | | 2015 | | | 2014 | |
| | | | | | | | |
(in millions, unless otherwise indicated) | | Quoted | | | Unquoted | | | Total | | | % | | | Quoted | | | Unquoted | | | Total | | | % | |
Cash and cash equivalents | | | 2 | | | | - | | | | 2 | | | | 0.1% | | | | 2 | | | | - | | | | 2 | | | | 0.1% | |
| | | | | | | | |
Short-term Investments1 | | | 23 | | | | - | | | | 23 | | | | 1.3% | | | | 66 | | | | - | | | | 66 | | | | 3.8% | |
| | | | | | | | |
Bonds and Debentures2 | | | | | | | | | | | | | | | | | | | | | | | | | | | | | | | | |
| | | | | | | | |
Securities Issued or Guaranteed by the Government of Canada | | | 116 | | | | - | | | | 116 | | | | 6.6% | | | | 98 | | | | - | | | | 98 | | | | 5.7% | |
| | | | | | | | |
Other Securities | | | 291 | | | | 1 | | | | 292 | | | | 16.8% | | | | 294 | | | | - | | | | 294 | | | | 17.1% | |
| | | | | | | | |
Equities | | | | | | | | | | | | | | | | | | | | | | | | | | | | | | | | |
| | | | | | | | |
Canadian Equities | | | 455 | | | | - | | | | 455 | | | | 26.1% | | | | 490 | | | | 2 | | | | 492 | | | | 28.6% | |
| | | | | | | | |
Foreign Equities | | | 607 | | | | 1 | | | | 608 | | | | 34.9% | | | | 563 | | | | - | | | | 563 | | | | 32.9% | |
| | | | | | | | |
Infrastructure | | | - | | | | 51 | | | | 51 | | | | 3.0% | | | | - | | | | 21 | | | | 21 | | | | 1.2% | |
| | | | | | | | |
Real Return Securities3 | | | 36 | | | | - | | | | 36 | | | | 2.1% | | | | 35 | | | | - | | | | 35 | | | | 2.0% | |
| | | | | | | | |
Real Estate | | | - | | | | 159 | | | | 159 | | | | 9.1% | | | | - | | | | 148 | | | | 148 | | | | 8.6% | |
Total | | | 1,530 | | | | 212 | | | | 1,742 | | | | 100.0% | | | | 1,548 | | | | 171 | | | | 1,719 | | | | 100.0% | |
| 1 | | Includes $22 million or 1.3% (2014 – $66 million or 3.8%) of investments made in securities issued or guaranteed by related parties. |
| 2 | | Includes $65 million or 3.7% (2014 – $48 million or 2.8%) of investments made in securities we guaranteed (CMB) and $51 million or 3.0% (2014 – $50 million or 2.9%) of investments made in securities issued or guaranteed by related parties. |
| 3 | | Includes $33 million or 1.9% (2014 – $31 million or 1.8%) of investments made in securities issued or guaranteed by related parties. |
Assumptions
The assets and obligation of the defined benefits were measured for accounting purposes as at 31 December 2015. In performing this measurement, the following assumptions were adopted.
| | | | | | | | | | | | | | | | |
| | | |
| | | Pension Benefit Plans | | | Other Post-employment Benefit Plans | |
| | | | |
| | | 2015 | | | 2014 | | | 2015 | | | 2014 | |
Defined Benefit Obligation | | | | | | | | | | | | | | | | |
| | | | |
Discount Rate | | | 4.0% | | | | 4.0% | | | | 4.1% | | | | 4.1% | |
| | | | |
Rate of Compensation Increase | | | 3.0% | | | | 3.0% | | | | 3.0% | | | | 3.0% | |
| | | | |
Benefit Costs | | | | | | | | | | | | | | | | |
| | | | |
Discount Rate | | | 4.0% | | | | 4.8% | | | | 4.1% | | | | 4.8% | |
| | | | |
Rate of Compensation Increase | | | 3.0% | | | | 3.0% | | | | 3.0% | | | | 3.0% | |
| | | | |
Assumed Medical Cost Trend | | | | | | | | | | | | | | | | |
| | | | |
Initial Medical Cost Trend Rate | | | - | | | | - | | | | 6.1% | | | | 6.5% | |
| | | | |
Medical Cost Trend Rate Declines to1 | | | - | | | | - | | | | 4.5% | | | | 4.5% | |
| | | | |
Year that the Rate Reaches the Ultimate Trend Rate | | | - | | | | - | | | | 2029 | | | | 2029 | |
| | | | |
Life Expectancy of Plan Members (reaching age 65 in 2014) | | | | | | | | | | | | | | | | |
| | | | |
Male | | | 23 years | | | | 23 years | | | | 23 years | | | | 23 years | |
| | | | |
Female | | | 25 years | | | | 25 years | | | | 25 years | | | | 25 years | |
| 1 | Average decrease per year 0.1% (2014 – 0.1%) |
The discount rates are determined by reference to Canadian AA-Corporate bonds with terms to maturity approximating the duration of the defined benefit obligation.
The mortality assumptions used are derived from standard tables published by the Canadian Institute of Actuaries. In 2014, the base mortality table applied was revised from the private sector to the public sector tables in order to better reflect our plan experience.
94 Canada Mortgage and Housing Corporation 2015 ANNUAL REPORT
Sensitivity
The following table shows the impact of changes in the assumptions.
| | | | | | | | |
| | | |
| (in millions) | | Increase (Decrease) in Defined Benefit Obligation | | | Increase (Decrease) in Net Benefit Costs
Recognized in Operating Expense | |
| | |
50 bps Increase/Decrease in Discount Rate | | | (159)/180 | | | | (8)/7 | |
| | |
50 bps Increase/Decrease in Rate of Compensation Increase | | | 23/(22) | | | | 3/(3) | |
| | |
100 bps Increase/Decrease in Health Care Cost Trend Rates | | | 10/(8) | | | | (1)/1 | |
| | |
One year Increase in Life Expectancy of Plan Member | | | 62 | | | | 3 | |
The above sensitivity analyses are based on a change in one assumption while holding all other assumptions constant. In practice, this is unlikely to occur and changes in some of the assumptions might be correlated. The method and types of assumptions used in preparing the sensitivity analyses have not changed from the previous year.
Cash Flows
Cash payments for defined benefit plans were $98 million (2014 – $83 million).
In 2016, we expect to make contributions to the defined benefit component of the Pension Plan of approximately $70.7 million.
The weighted average duration of the defined pension benefit obligation is 14.6 years (2014 – 15 years). The distribution of the timing of benefit payments is shown in the table below.
| | | | | | | | | | | | | | | | | | | | |
| | | | | | |
(in millions) | | Within 1 Year | | | 1 to 5 Years | | | 5 to 10 Years | | | 10 to 15 Years | | | Over 15 years | |
Defined Benefit Pension Plans Payments | | | 99 | | | | 327 | | | | 364 | | | | 321 | | | | 954 | |
Defined Contribution Plan
The defined contribution plan includes the defined contribution component of the Pension Plan and the Supplemental Plan.
Expenses for the defined contribution plan were $1.9 million (2014 – $0.5 million).
Management approved the introduction of the defined contribution plan for all new employees and for new eligible contract employees effective 4 April 2013. This plan will be closed to new entrants as of 1 January 2018. The defined contribution plan is administered by a third party.
15. Mortgage Loan Insurance
Mortgage Loan Insurance Risk Management
We assume the risk of loss from borrower default through mortgage insurance contracts entered into with lenders, exposing us to the uncertainty surrounding the timing, frequency and severity of claims. We manage our exposure to this risk of loss through prudent product design, underwriting and default management practices, and the establishment of adequate capital reserves.
A concentration of risk may arise from insurance contracts issued in a particular geographical area where local economic conditions are significantly different from average. The relative impact of the outcome is mitigated as a result of the distribution of business across different geographic areas.
Insurance-in-force
At 31 December 2015, Insurance-in-force, which represents the risk exposure of the Mortgage Loan Insurance Activity, totaled $526 billion (2014 – $543 billion). This amount includes $788 million (2014 – $943 million) in outstanding loan balances from the Lending Programs included in the Assisted Housing Activity (refer to Note 7).
Under Section 11 of the NHA, the total of outstanding insured amounts of all insured loans may not exceed $600 billion (2014 – $600 billion).
Canada Mortgage and Housing Corporation 2015 ANNUAL REPORT 95
Role of the Appointed Actuary
The Appointed Actuary is an external actuary appointed by Management, a Fellow of the Canadian Institute of Actuaries (FCIA), to carry out a valuation of the policy liabilities (Provision for Claims and Unearned Premiums) of the Mortgage Loan Insurance Activity as at 30 September. The factors and techniques used in the valuation are in accordance with Canadian accepted actuarial practice, applicable legislation, and associated regulations. The Appointed Actuary also performs a roll-forward of the Provision for Claims from the date of the Actuarial Valuation to 31 December.
Earned and Unearned Premiums and Fees
The following table presents the composition of Premiums and Fees Earned.
| | | | | | | | |
| | | |
(in millions) | | 2015 | | | 2014 | |
Earned Premiums | | | 1,568 | | | | 1,662 | |
| | |
Earned Application Fees1 | | | 24 | | | | 26 | |
Total | | | 1,592 | | | | 1,688 | |
| 1 | | Includes previously unearned application fees recognized in the year, as well as other service fees which are earned as received. |
The following table presents the changes in the Unearned Premiums and Fees balance.
| | | | |
| | | |
(in millions) | | 2015 | | 2014 |
Balance at Beginning of Year | | 5,575 | | 5,947 |
| | |
Premium Deferred on Contracts Written in the Year | | 1,421 | | 1,291 |
| | |
Premiums Earned in the Year | | (1,568) | | (1,662) |
| | |
Application Fees Deferred on Contracts Written in the Year | | 17 | | 12 |
| | |
Application Fees Earned in the Year | | (13) | | (13) |
Balance at End of Year | | 5,432 | | 5,575 |
| |
Provision for Claims
The Provision for Claims includes amounts set aside for IBNR claims, Claims in Process (CIP) and for Social Housing Mortgage and Index Linked Mortgage claims (SH and ILM). The following table presents the changes in the Provision for Claims balance.
| | | | | | | | | | | | | | | | | | | | |
| | | |
| | | 2015 | | 2014 |
| | | | | | |
(in millions) | | IBNR and CIP | | | SH and ILM | | | Total | | IBNR and CIP | | | SH and ILM | | | Total |
Balance at Beginning of Year | | | 551 | | | | 227 | | | 778 | | | 650 | | | | 219 | | | 869 |
| | | | | | |
Claims Paid and Related Expenses During the Year | | | (357 | ) | | | (3 | ) | | (360) | | | (415 | ) | | | (4 | ) | | (419) |
| | | | | | |
Insurance Claims Expense (Recovery) During the Year | | | 291 | | | | (1 | ) | | 290 | | | 316 | | | | 12 | | | 328 |
Balance at End of Year | | | 485 | | | | 223 | | | 708 | | | 551 | | | | 227 | | | 778 |
| |
Methodology and Significant Factors
The key method we used for estimating insurance policy liabilities is the actuarial present value basis. There is a limitation to the accuracy of policy liability estimates as provided in the valuation report prepared by the Appointed Actuary. There is inherent uncertainty in any estimate of ultimate liabilities including for premium deficiency, IBNR, CIP and SH and ILM because the ultimate liability for claims is subject to the outcome of events yet to occur.
In addition to a risk of underestimating or overestimating the total amount of claim liabilities, there is a risk that the timing of the future payment of liabilities or the return on investments will differ materially from the assumptions underlying the valuation of insurance policy liabilities.
Provisions are reviewed and evaluated at the end of each quarter by Management and are also reviewed and evaluated on an annual basis as part of the Actuarial Valuation in light of emerging claim experience and changing circumstances. The resulting changes in the estimated Provision for Claims are recorded in Insurance Claims expense in the year in which they are determined. Estimates of the timing of net cash outflows resulting from our recognized insurance liabilities are provided in Note 28.
96 Canada Mortgage and Housing Corporation 2015 ANNUAL REPORT
We determine Provisions for Claims and Unearned Premiums at 31 December using valuation factors from the 30 September valuation, taking into account changes in economic circumstances, premiums received and claims paid and related expenses in the intervening period.
Premiums flow to income using factors derived from the patterns of past claims’ occurrence. Hence, premiums are earned at a pace similar to that at which claims are incurred. An earning pattern is determined by product type and by amortization period.
The following factors affect the key actuarial assumptions used in the determination of the Provision for Claims:
| ¡ | | Claim emergence – Claim emergence encompasses claim frequency and claim occurrence patterns. It is based on historical trends in claims and arrears reporting; |
| ¡ | | Claim severity – Claim severity, or average loss on claims, is dependent on the dollar value of claims, losses on sales of real estate properties, administrative expenses, payment delays and sale delays. These factors are generally based on historical experience; and |
| ¡ | | Economic conditions – Recent past and projected economic factors, such as unemployment rates, mortgage interest rates, and changes in house prices, affect the forecast of future claim levels. |
Sensitivity Analysis
The following table presents the sensitivity of the level of insurance contract liabilities to movements in the economic factors used to calculate them. The percentage change in variables is applied to a range of existing actuarial modelling assumptions to derive the possible impact on Income before Income Taxes. The disclosure is not intended to explain the impact of a percentage change in the insurance assets and liabilities disclosed above.
The results of sensitivity testing are set out below, showing the impact on Income Before Income Taxes. For each scenario, the impact of a change in a single factor is shown, with other assumptions unchanged.
| | | | | | | | |
| | | |
(in millions) | | 2015 | | | 2014 | |
100 bps Increase in Unemployment Rate | | | (17) | | | | (47) | |
| | |
100 bps Decrease in Rate of House Price Inflation | | | (50) | | | | (45) | |
| | |
100 bps Increase in Mortgage Rates | | | (49) | | | | (31) | |
| | |
These sensitivities are hypothetical and should be viewed in that light. The relationship of a change in assumption to the change in value may not be linear. Changes in one factor may result in changes in another which might magnify or counteract the sensitivities.
The method for sensitivity testing has not changed significantly from the prior year.
Claims Development
Incurred But Not Reported and Claims in Process
The following table shows the development of the expected losses on IBNR and CIP claims and their related expenses over a period of time and the estimated ultimate cost of claims for 2009 through 2015 to present the earliest material claim that has arisen and for which there is still uncertainty about the amount and timing of claim payments. The information is presented on a default year basis where claims are related to the period in which the insured event occurred and not the period in which the policy was underwritten.
| | | | | | | | | | | | | | | | | | | | | | | | | | | | | | | | |
| | | | | | | | | |
(in millions) | | 2009 | | | 2010 | | | 2011 | | | 2012 | | | 2013 | | | 2014 | | | 2015 | | | Total | |
Expected Losses on Claims in the default year | | | 749 | | | | 598 | | | | 552 | | | | 523 | | | | 387 | | | | 345 | | | | 303 | | | | | |
| | | | | | | | |
One year later | | | 706 | | | | 573 | | | | 512 | | | | 427 | | | | 368 | | | | 327 | | | | - | | | | | |
| | | | | | | | |
Two years later | | | 730 | | | | 574 | | | | 490 | | | | 430 | | | | 369 | | | | - | | | | - | | | | | |
| | | | | | | | |
Three years later | | | 741 | | | | 584 | | | | 491 | | | | 437 | | | | - | | | | - | | | | - | | | | | |
| | | | | | | | |
Four years later | | | 755 | | | | 591 | | | | 494 | | | | - | | | | - | | | | - | | | | - | | | | | |
| | | | | | | | |
Five years later | | | 737 | | | | 596 | | | | - | | | | - | | | | - | | | | - | | | | - | | | | | |
Estimate of Cumulative Claims | | | 739 | | | | 596 | | | | 494 | | | | 437 | | | | 369 | | | | 327 | | | | 303 | | | | 3,265 | |
Cumulative Payments | | | (730 | ) | | | (595 | ) | | | (490 | ) | | | (424 | ) | | | (332 | ) | | | (193 | ) | | | (16 | ) | | | (2,780 | ) |
Provision for Claims | | | 9 | | | | 1 | | | | 4 | | | | 13 | | | | 37 | | | | 134 | | | | 287 | | | | 485 | |
Current Estimate of Surplus | | | 10 | | | | 2 | | | | 58 | | | | 86 | | | | 18 | | | | 18 | | | | - | | | | | |
Surplus of Initial Expected Loss on Claims | | | 1% | | | | - | | | | 11% | | | | 16% | | | | 5% | | | | 5% | | | | - | | | | | |
Canada Mortgage and Housing Corporation 2015 ANNUAL REPORT 97
Social Housing and Index Linked Mortgage Claims
As explained in Note 2, the SH and ILM programs are unique and as such, the claims development differs from that of the IBNR and CIP. For the SH and ILM programs, the expected losses that are provided for can occur on or before the balance sheet date and in the future; therefore information cannot be presented on a default year basis where claims are related to a retrospective period in which the incident of default occurred.
Deferred Acquisition Costs
The following table presents the changes in the DAC balance.
| | | | | | | | |
| | | |
(in millions) | | 2015 | | | 2014 | |
Balance at Beginning of Year | | | 117 | | | | 116 | |
| | |
Acquisition Costs Deferred | | | 49 | | | | 36 | |
| | |
Amortization of Deferred Acquisition Costs | | | (39) | | | | (35) | |
Balance at End of Year | | | 127 | | | | 117 | |
| | |
Insurance Policy Liability Adequacy
Our Appointed Actuary performs a liability adequacy test on our premium liabilities and claim liabilities. Premium liabilities represent a provision for future claims and expenses which are expected to arise from the unearned portion of the policies in-force. Thus, this provision is for claims that have not yet occurred and therefore, covers the period from the date of the valuation to the date of default (the assumed claim occurrence date).
The liability adequacy test for the Corporation for the years ended 31 December 2015 and 2014 has identified that no provision for premium deficiency is required at these reporting dates.
16. Securitization
We guarantee the timely payment of principal and interest of CMB issued by CHT under the CMB program and NHA MBS issued by Approved Issuers on the basis of housing loans under the NHA MBS program.
We determined that, at the balance sheet date, the best estimate of the amount required to settle the timely payment guarantee obligation is less than the balance of the unearned timely payment guarantee fees. As such, no provision for claims is required.
The following table presents the changes in the unearned timely payment guarantee fees balance.
| | | | | | | | |
| | |
(in millions) | | | 2015 | | | | 2014 | |
Balance at Beginning of Year | | | 592 | | | | 564 | |
| | |
Timely Payment Guarantee Fees Received in the Year1 | | | 473 | | | | 273 | |
| | |
Timely Payment Guarantee Fees Earned in the Year1 | | | (268) | | | | (245) | |
Balance at End of Year | | | 797 | | | | 592 | |
| 1 | | Includes application and compensatory fees received and earned of $33 million (2014 – $31 million). |
Guarantees-in-force
The following table presents the total Guarantees-in-force by program. Total Guarantees-in-force represents the maximum principal obligation related to this timely payment guarantee1.
| | | | | | | | |
| | |
(in billions) | | | 2015 | | | | 2014 | |
NHA MBS2 | | | 216 | | | | 213 | |
| | |
CMB3 | | | 215 | | | | 209 | |
Total | | | 431 | | | | 422 | |
| 1 | | Exposure excludes the realizable value of the related assets securing the NHA MBS and CMB guaranteed. |
| 2 | | Includes nil (2014 – $0.5 billion) in NHA MBS held as collateral in the IMPP. |
| 3 | | Includes $3.7 billion (2014 – $2.6 billion) in investments which are eliminated in the Consolidated Balance Sheets. |
98 Canada Mortgage and Housing Corporation 2015 ANNUAL REPORT
The following table presents the maturity profile of the Guarantees-in-force.
| | | | |
| | |
| | |
(in millions) | | NHA MBS and CMB Guaranteed1 | |
2016 | | | 58,044 | |
| |
2017 | | | 60,672 | |
| |
2018 | | | 82,718 | |
| |
2019 | | | 83,297 | |
| |
2020 | | | 98,892 | |
| |
2021 and Thereafter | | | 46,942 | |
Total | | | 430,565 | |
| 1 | | Based on principal amount outstanding as at 31 December 2015. |
Under Section 15 of the NHA, the aggregate outstanding amount of principal guarantees may not exceed $600 billion (2014 – $600 billion).
17. Income Taxes
The following table presents the components of income tax.
| | | | | | | | |
(in millions) | | 2015 | | | 2014 | |
Current Income Tax Expense | | | | | | | | |
| | |
Tax Expense for Current Year | | | 459 | | | | 845 | |
| | |
Deferred Income Tax Expense | | | | | | | | |
| | |
Origination and Reversal of Temporary Differences | | | 17 | | | | 17 | |
Total Income Tax Expense Included in Net Income | | | 476 | | | | 862 | |
| | |
Income Tax Expense (Recovery) on Other Comprehensive Loss | | | | | | | | |
| | |
Net Unrealized Gains from Available for Sale Financial Instruments | | | 3 | | | | 159 | |
| | |
Reclassification of Prior Years’ Net Unrealized Gains Realized in the Period in Net Income | | | (4) | | | | (213) | |
| | |
Remeasurements of the Net Defined Benefit Plans | | | (6) | | | | (32) | |
Total Income Tax Recovery Included in Other Comprehensive Loss | | | (7) | | | | (86) | |
Total | | | 469 | | | | 776 | |
The following is a reconciliation of the statutory tax rate to the effective tax rate.
| | | | | | | | |
(in millions) | | 2015 | | | 2014 | |
Income before Income Taxes | | | 1,964 | | | | 3,487 | |
| | |
Statutory Tax Rate | | | 25% | | | | 25% | |
| | |
Income Taxes Computed at Statutory Tax Rate | | | 491 | | | | 872 | |
| | |
Change in Tax Rates on Income Taxes | | | - | | | | 8 | |
| | |
Permanent Differences | | | (15) | | | | (18) | |
Income Tax Expense | | | 476 | | | | 862 | |
Effective Tax Rate | | | 24.2% | | | | 24.7% | |
The statutory tax rate of 25% is comprised of the federal income tax rate of 38% less the general rate reduction of 13%.
Canada Mortgage and Housing Corporation 2015 ANNUAL REPORT 99
The following tables present the tax-effected temporary differences which result in deferred income tax assets and liabilities.
| | | | | | | | | | | | | | | | | | | | |
| | | | | | |
(in millions) | | 2014 | | | Change through
Consolidated
Net Income | | | Change through
Consolidated
OCL | | | Change through
Consolidated
Equity | | | 2015 | |
Deferred Income Tax Assets | | | | | | | | | | | | | | | | | | | | |
| | | | | |
Fair Value of Financial Instruments | | | 30 | | | | - | | | | (6) | | | | - | | | | 24 | |
| | | | | |
Post-employment Benefits | | | 79 | | | | (14) | | | | 6 | | | | - | | | | 71 | |
Total Deferred Income Tax Assets | | | 109 | | | | (14) | | | | - | | | | - | | | | 95 | |
| | | | | |
Deferred Income Tax Liabilities | | | | | | | | | | | | | | | | | | | | |
| | | | | |
Fair Value of Investment Properties | | | (31) | | | | (2) | | | | - | | | | - | | | | (33) | |
| | | | | |
Deferred Gains on Disposal of Financial Instruments | | | (5) | | | | - | | | | - | | | | - | | | | (5) | |
| | | | | |
Deferred Issuance Costs | | | (2) | | | | 1 | | | | - | | | | - | | | | (1) | |
| | | | | |
Provision for Claims | | | (116) | | | | (2) | | | | - | | | | 4 | | | | (114) | |
Total Deferred Income Tax Liabilities | | | (154) | | | | (3) | | | | - | | | | 4 | | | | (153) | |
| Net Deferred Income Tax Assets (Liabilities) | | | (45) | | | | (17) | | | | - | | | | 4 | | | | (58) | |
| | | | | | | | | | | | | | | | | | | | |
| | | | | | |
(in millions) | | 2013 | | | Change through
Consolidated
Net Income | | | Change through
Consolidated
OCL | | | Change through
Consolidated
Equity | | | 2014 | |
Deferred Income Tax Assets | | | | | | | | | | | | | | | | | | | | |
| | | | | |
Fair Value of Financial Instruments | | | 69 | | | | (11 | ) | | | (28 | ) | | | - | | | | 30 | |
| | | | | |
Post-employment Benefits | | | 55 | | | | (8 | ) | | | 32 | | | | - | | | | 79 | |
Total Deferred Income Tax Assets | | | 124 | | | | (19 | ) | | | 4 | | | | - | | | | 109 | |
| | | | | |
Deferred Income Tax Liabilities | | | | | | | | | | | | | | | | | | | | |
| | | | | |
Fair Value of Investment Properties | | | (32 | ) | | | 1 | | | | - | | | | - | | | | (31) | |
| | | | | |
Deferred Gains on Disposal of Financial Instruments | | | (5 | ) | | | - | | | | - | | | | - | | | | (5) | |
| | | | | |
Deferred Issuance Costs | | | (3 | ) | | | 1 | | | | - | | | | - | | | | (2) | |
| | | | | |
Provision for Claims | | | (117 | ) | | | - | | | | - | | | | 1 | | | | (116) | |
Total Deferred Income Tax Liabilities | | | (157 | ) | | | 2 | | | | - | | | | 1 | | | | (154) | |
Net Deferred Income Tax Assets (Liabilities) | | | (33 | ) | | | (17 | ) | | | 4 | | | | 1 | | | | (45) | |
The Deferred Income Tax Assets have been recognized in full as we believe it is probable that these items will be realized in the normal course of operations.
18. Capital Management
For capital management purposes and as provided for in the CMHC Act and the NHA, we consider our capital available to be equal to the total Equity of Canada less assets with a Capital Requirement of 100%.
Our primary objective with respect to capital management is to ensure that our commercial operations have adequate capital to deliver their mandate while remaining financially self-sustaining and also to follow prudent business practices and guidelines existing in the private sector as appropriate. Our capital management policy is included in our Corporate Plan which is approved annually by the Governor in Council. We have no externally imposed minimal capital requirements; however, we follow OSFI’s guidelines in setting capital levels and targets for our Mortgage Loan Insurance Activity.
We have managed our capital as approved in our 2015 Corporate Plan in accordance with the CMHC Act and the NHA. There have been no changes to our internal guidelines in what is considered to be capital or the objectives of managing capital during the year.
100 Canada Mortgage and Housing Corporation 2015 ANNUAL REPORT
The components of consolidated capital available are presented below.
| | | | | | | | |
| | | |
(in millions) | | 2015 | | | 2014 | |
Contributed Capital | | | 25 | | | | 25 | |
| | |
Accumulated Other Comprehensive Income | | | 807 | | | | 803 | |
| | |
Appropriated Retained Earnings | | | 11,151 | | | | 10,857 | |
| | |
Retained Earnings Other1 | | | 7,656 | | | | 6,497 | |
Total Equity of Canada2 | | | 19,639 | | | | 18,182 | |
| | |
Less: Assets with a Capital Requirement of 100% | | | (264) | | | | (247) | |
Total Capital Available | | | 19,375 | | | | 17,935 | |
| 1 | | Retained Earnings Other represents retained earnings not needed to support our capitalization framework for the Mortgage Loan Insurance and Securitization. |
| 2 | | The AOCI and Retained Earnings Other components of Total Equity of Canada include the impact of eliminations. |
Mortgage Loan Insurance Capital
The Appropriated Capital of the Mortgage Loan Insurance Activity is based on our Capital Management Framework which follows guidelines developed by OSFI. OSFI’s minimum regulatory capital requirement is 100% of its Minimum Capital Test (MCT). The test is to ensure that capital available is, at minimum, 100% of the capital required.
We set an Internal Capital Target above the minimum capital required. The Internal Capital Target is set at a level that covers all material risks of the Mortgage Loan Insurance Activity. The Internal Capital Target is calibrated using specified confidence intervals and is designed to provide management with an early indication of the need to resolve financial problems. The Internal Capital Target has been set at 205% (205% in 2014) of the minimum capital required.
Under our Capital Management Framework, we operate at available capital levels above the Internal Capital Target on all but unusual and infrequent occasions. Accordingly, we have established a Holding Capital Target in excess of our Internal Capital Target. The Holding Capital Target is calibrated using confidence intervals specified by our Capital Management Framework and is designed to provide management with adequate time to resolve financial problems before available capital decreases below the Internal Capital Target. The Holding Capital Target has been set at 220% (2014 – 220%) of the minimum capital required.
We appropriate Retained Earnings and AOCI from the Mortgage Loan Insurance Activity at the 220% Holding Capital Target or $10,817 million for the Mortgage Loan Insurance Activity (2014 – 220% or $10,634 million). As at 31 December 2015, the Mortgage Loan Insurance Activity had capital available of $17,395 million or 354% of the minimum capital required (2014 – $16,173 million or 343%).
The following table presents the components of capital available for the Mortgage Loan Insurance Activity.
| | | | | | | | |
| | | |
(in millions) | | 2015 | | | 2014 | |
Accumulated Other Comprehensive Income | | | 803 | | | | 807 | |
| | |
Appropriated Retained Earnings | | | 10,014 | | | | 9,827 | |
Appropriated Capital | | | 10,817 | | | | 10,634 | |
| | |
Unappropriated Retained Earnings | | | 6,842 | | | | 5,784 | |
Total Mortgage Loan Insurance Capital | | | 17,659 | | | | 16,418 | |
| | |
Less: Assets with a Capital Requirement of 100% | | | (264) | | | | (245) | |
Total Mortgage Loan Insurance Capital Available | | | 17,395 | | | | 16,173 | |
Internal Capital Target | | | 205% | | | | 205% | |
Holding Capital Target | | | 220% | | | | 220% | |
Capital Available to Minimum Capital Required (% MCT) | | | 354% | | | | 343% | |
| | |
Canada Mortgage and Housing Corporation 2015 ANNUAL REPORT 101
Securitization Capital
Capital related to the Securitization Activity is appropriated for the guarantees provided under NHA MBS and CMB programs. The amount appropriated is based on regulatory and economic capital principles and has been established to be $1,200 million or 100% of the capital required under these principles (2014 – $1,064 million or 100%). Capital required is calculated by applying risk factors to Securitization investments assets and liabilities exposures as defined by OSFI. As at 31 December 2015, the Securitization Activity had capital available of $1,907 million or 159% of the capital required (2014 – $1,663 million or 157%).
We do not hold separate capital for CHT because our exposure is limited to mortgage insurance and timely payment guarantees which are covered by the Mortgage Loan Insurance capital and Securitization capital respectively.
The following table presents the components of the capital available for the Securitization Activity.
| | | | | | | | |
| | | |
(in millions) | | 2015 | | | 2014 | |
Accumulated Other Comprehensive Income | | | 63 | | | | 34 | |
| | |
Appropriated Retained Earnings | | | 1,137 | | | | 1,030 | |
Appropriated Capital | | | 1,200 | | | | 1,064 | |
| | |
Unappropriated Retained Earnings | | | 707 | | | | 601 | |
Total Securitization Capital | | | 1,907 | | | | 1,665 | |
| | |
Less: Assets with a Capital Requirement of 100% | | | - | | | | (2) | |
Total Securitization Capital Available | | | 1,907 | | | | 1,663 | |
Capital Available to Capital Required (%) | | | 159% | | | | 157% | |
| | |
Assisted Housing Capital
Lending Programs
We maintain a Reserve Fund pursuant to Section 29 of the CMHC Act. A portion of the Lending Programs’ earnings are retained in this Reserve Fund as part of our strategy to address interest rate risk exposure on pre-payable loans as well as credit risk exposure on unsecured loans. The Reserve Fund is subject to a statutory limit of $240 million (2014 – $240 million). Should the statutory limit be exceeded, we would be required to pay the excess to the Government.
Unrealized fair value market fluctuations incurred by the Lending Programs as well as Remeasurements of the Net Defined Benefit Plans for Assisted Housing are absorbed in Retained Earnings. The Housing Programs portion of Remeasurements is recorded in Retained Earnings until it is reimbursed by the Government through Housing Programs appropriations.
The following table presents the components of the capital available for the Lending Programs.
| | | | | | | | |
| | | |
(in millions) | | 2015 | | | 2014 | |
Reserve Fund | | | 136 | | | | 143 | |
| | |
Retained Earnings | | | 41 | | | | 23 | |
Total Lending Programs Capital Available | | | 177 | | | | 166 | |
Housing Programs
We do not hold capital for Housing Programs as this activity does not present risks to the Corporation that would require capital to be set aside.
102 Canada Mortgage and Housing Corporation 2015 ANNUAL REPORT
19. Financial Instruments Income and Expenses
Interest Income, Investment Income and Interest Expense
The following table outlines the total interest income and expense calculated using the effective interest method for financial instruments and the dividend income recognized in the Consolidated Statements of Income and Comprehensive Income.
| | | | | | | | | | | | | | | | | | | | | | | | |
| | |
| | | 2015 | | | 2014 | |
(in millions) | | Interest
Income | | | Investment
Income | | | Interest
Expense | | | Interest
Income | | | Investment
Income | | | Interest
Expense | |
Available for Sale Financial Assets | | | - | | | | 512 | | | | - | | | | - | | | | 527 | | | | - | |
| | | | | | |
Held to Maturity Financial Assets | | | - | | | | 2 | | | | - | | | | - | | | | 4 | | | | - | |
| | | | | | |
Securities Purchased Under Resale Agreements | | | 1 | | | | - | | | | - | | | | 1 | | | | - | | | | - | |
| | | | | | |
Loans – Loans and Receivables | | | 4,715 | | | | - | | | | - | | | | 5,296 | | | | - | | | | - | |
| | | | | | |
Securities Sold Under Repurchase Agreements | | | - | | | | (2 | ) | | | - | | | | - | | | | (3 | ) | | | - | |
| | | | | | |
Borrowings – Other Financial Liabilities | | | - | | | | - | | | | 4,638 | | | | - | | | | - | | | | 5,210 | |
Total Interest for Financial Instruments not at Fair Value through Profit or Loss | | | 4,716 | | | | 512 | | | | 4,638 | | | | 5,297 | | | | 528 | | | | 5,210 | |
Total Interest for Financial Instruments at Fair Value through Profit or Loss1 | | | 186 | | | | 1 | | | | 168 | | | | 213 | | | | 1 | | | | 198 | |
Total Interest | | | 4,902 | | | | 513 | | | | 4,806 | | | | 5,510 | | | | 529 | | | | 5,408 | |
Dividend Income | | | - | | | | 40 | | | | - | | | | - | | | | 79 | | | | - | |
Total | | | 4,902 | | | | 553 | | | | 4,806 | | | | 5,510 | | | | 608 | | | | 5,408 | |
| 1 | | Of the total Interest Income for financial instruments at FVTPL, $119 million (2014 – $148 million) relates to Loans – designated at FVTPL, $37 million (2014 – $32 million) relates to Derivatives and $30 million (2014 – $33 million) relates to Investment Securities – designated at FVTPL. |
Gains and Losses from Financial Instruments
The following table presents the realized gains and losses related to financial instruments.
| | | | | | | | |
| | | |
(in millions) | | 2015 | | | 2014 | |
Investment Securities – Held for Trading | | | - | | | | 69 | |
| | |
Investment Securities – Available for Sale | | | 13 | | | | 1,413 | |
| | |
Borrowings – Other Liabilities – Retirement of Debt | | | (48) | | | | (28) | |
Total | | | (35) | | | | 1,454 | |
The unrealized gains/(losses) arising from changes in fair value related to financial instruments classified as HFT and those designated at FVTPL are presented in the following table.
| | | | | | | | |
| | | |
(in millions) | | 2015 | | | 2014 | |
Held for Trading | | | | | | | | |
| | |
Equities | | | - | | | | (57) | |
| | |
Derivatives | | | 4 | | | | 25 | |
Total Held for Trading | | | 4 | | | | (32) | |
Designated at Fair Value through Profit or Loss | | | | | | | | |
| | |
Investment Securities | | | 6 | | | | 9 | |
| | |
Loans | | | (9) | | | | (6) | |
| | |
Borrowings | | | 14 | | | | 38 | |
Total Designated at Fair Value through Profit or Loss | | | 11 | | | | 41 | |
Total | | | 15 | | | | 9 | |
Canada Mortgage and Housing Corporation 2015 ANNUAL REPORT 103
20. Structured Entities
Consolidated Structured Entities
Canada Housing Trust
We consolidate the accounts of CHT, a separate legal entity, reported under the Securitization Activity. CHT was established in 2001 as a special-purpose trust, separate from CMHC. While we control the activities of CHT, its assets and liabilities are neither owned by nor held for our benefit. CHT’s functions are limited to the acquisition of interests in eligible housing loans such as NHA MBS, the issuance of CMB, as well as the purchase of highly rated investments and certain related financial hedging activities. We guarantee the CMB under the Securitization Activity. The beneficiaries of the Trust, after payment of all obligations, are one or more charitable organizations. Financial information for CHT is presented in the following tables.
Condensed Balance Sheets
| | | | | | | | |
| | | |
(in millions) | | 2015 | | | 2014 | |
Loans – Loans and Receivables | | | 215,622 | | | | 209,487 | |
| | |
Other Assets | | | 368 | | | | 402 | |
Total Assets | | | 215,990 | | | | 209,889 | |
Borrowings – Other Financial Liabilities | | | 215,622 | | | | 209,487 | |
| | |
Other Liabilities | | | 368 | | | | 402 | |
Total Liabilities | | | 215,990 | | | | 209,889 | |
Total Equity of Canada | | | - | | | | - | |
Condensed Statements of Income | | | | | | | | |
| | | |
(in millions) | | 2015 | | | 2014 | |
Interest Income - Loans | | | 4,394 | | | | 4,729 | |
| | |
Interest Expense | | | 4,386 | | | | 4,721 | |
Net Interest Income | | | 8 | | | | 8 | |
| | |
Other Income | | | 224 | | | | 162 | |
Total Revenues | | | 232 | | | | 170 | |
| | |
Operating Expenses | | | 232 | | | | 170 | |
Total Expenses | | | 232 | | | | 170 | |
Net Income | | | - | | | | - | |
Nordea International Equity Fund
We consolidated the accounts of Nordea until the fund was liquidated and terminated in 2014 at which time we received cash consideration of $463 million and recognized a gain of $69 million in Net Realized Gains.
Unconsolidated Structured Entities
We had interests in unconsolidated investment fund structured entities until they were sold in 2014. We recognized $12 million in Investment Income and $503 million in Net Realized Gains during 2014 from the investments.
21. Market Risk
Market risk is the risk of adverse financial impacts arising from changes in underlying market factors, including interest rates, foreign exchange rates, and equity prices.
Interest Rate Risk
Interest rate risk is the risk that the fair value or future cash flows of a financial instrument will fluctuate because of changes in market interest rates.
The investment portfolios for the Mortgage Loan Insurance and Securitization Activities are managed in accordance with their Asset Allocation (AA) policies, which limit interest rate risk relative to internal restraints and benchmarks. We implemented a new AA for the Mortgage Loan Insurance investment portfolio in 2014. This new allocation reduced our exposure to Canadian and foreign equities and shortened the duration of our fixed income investments. These measures reduced our exposure to other price risk and interest rate risk,
104 Canada Mortgage and Housing Corporation 2015 ANNUAL REPORT
respectively. The Assisted Housing Activity is exposed to interest rate risk when asset and liability principal and interest cash flows have different payment, repricing or maturity dates. Some of the Loans contain prepayment and/or repricing options. As we do not have the right to prepay our Borrowings from the Government of Canada totalling $10,533 million (2014 – $10,792 million) without penalty, we are exposed to interest rate risk. Interest rate risk associated with the Assisted Housing Activity is managed through asset and liability matching using derivatives, as necessary, and capital market strategies.
Loans under the CMB program are exposed to both interest rate risk and prepayment/reinvestment risk. Prepayment/reinvestment risk is the risk that NHA MBS may experience varying degrees of prepayment throughout the term and these prepayments must be reinvested immediately. To mitigate these risks, we enter into swap agreements with approved financial institution counterparties. Under these agreements, both interest rate and prepayment/reinvestment risks are transferred to swap counterparties. We will pay all interest received from the underlying NHA MBS and reinvestment assets to the swap counterparties and the swap counterparties pay an amount equal to the coupon payments on the CMB. As a result of these swap agreements, changes in interest rates or prepayments/reinvestments have no impact on the Consolidated Statements of Income and Comprehensive Income.
Currency Risk
Currency risk is the risk that the fair value or future cash flows of a financial instrument will fluctuate because of changes in foreign exchange rates. Currency risk arises on financial instruments denominated in a foreign currency. As at 31 December 2015, we have no currency exposure.
Other Price Risk
Other price risk is the risk that the fair value or future cash flows of a financial instrument will fluctuate because of changes in market prices, other than those giving rise to interest rate and currency risk. We are exposed to other price risk through fluctuations in prices of equity investments held by the Mortgage Loan Insurance Activity. The fair value of these investments as at 31 December 2015 is $1,118 million (2014 – $1,215 million). We limit our exposure to equity investments by using tolerance ranges and various diversification and exposure measures.
Sensitivity Analyses
Value at Risk (VaR)
Market risk for investment securities in the Mortgage Loan Insurance and Securitization Activities is evaluated through the use of VaR models. VaR is a statistical technique used to measure the maximum potential loss of an investment portfolio over a specified holding period with a given level of confidence. As at 1 January 2015, we changed our VaR methodology to better reflect the potential loss in the event there are extreme movements in our portfolio. Accordingly, the VaR for 31 December 2014 has been restated, however, the impact was not significant.
The VaR for the Mortgage Loan Insurance and Securitization Activities as at 31 December, calculated with 95% confidence over a 22 business day holding period, is outlined in the table below. VaR is presented separately for individual market risk factors and for the total portfolio. The effect of diversification results from the fact that market risks are not perfectly correlated and, consequently, there is a benefit from investment diversification. The VaR figures are based on one-year of historical prices and correlations of bond and equity markets and 26 weeks of volatility.
| | | | | | | | |
(in millions) | | 2015 | | | 2014 | |
Investment Securities: | | | | | | | | |
| | |
Available for Sale | | | | | | | | |
| | |
Interest Rate Risk | | | 267 | | | | 196 | |
| | |
Equity Risk | | | 69 | | | | 65 | |
| | |
Effect of Diversification | | | (77) | | | | (65) | |
Total VaR | | | 259 | | | | 196 | |
Canada Mortgage and Housing Corporation 2015 ANNUAL REPORT 105
Interest Rate Sensitivity
Market risk for the Assisted Housing Activity portfolio of loans, investments, borrowings and swaps is evaluated by measuring their sensitivity to changes in interest rates.
The net pre-tax impact to a 200 bps shift in interest rates on Financial Instruments designated at FVTPL and HFT is presented below.
| | | | | | | | |
| |
| | 2015 | | 2014 |
| | Interest Rate Shift | | Interest Rate Shift |
| | | | |
| (in millions) | | -200 bps | | +200 bps | | -200 bps | | +200 bps |
| Net Unrealized Losses | | - | | (4) | | - | | - |
Loans and borrowings measured at amortized cost are also exposed to interest rate risk. The net impact of a shift in interest rates on their fair value is presented below.
| | | | | | | | |
| |
| | 2015 | | 2014 |
| | Interest Rate Shift | | Interest Rate Shift |
| | | | |
| (in millions) | | -200 bps | | +200 bps | | -200 bps | | +200 bps |
| Increase (Decrease) to Fair Value of Net Assets | | (73) | | 65 | | (79) | | 72 |
The Assisted Housing Activity’s net interest income is also sensitive to interest rate movements. The maximum negative exposure of net interest income, which is limited by our policy to $1.5 million, is $0.8 million at 31 December 2015 (2014 – $0.1 million). This is calculated by scenario analysis using multiple simulations of interest rate volatility with 95% confidence over a one-year period.
22. Credit Risk
Credit risk is the potential for financial loss arising from failure of a borrower or an institutional counterparty to fulfill its contractual obligations. We are exposed to credit risk from various sources including borrower default through mortgage insurance contracts and institutional counterparty credit risk arising from financial guarantees under the NHA MBS and CMB programs, lending arrangements, fixed income investments and derivative transactions. A detailed breakdown of credit risk is presented below.
Maximum Exposure to Credit Risk
| | | | |
| | | |
(in billions) | | 2015 | | 2014 |
| Mortgage Loan Insurance: Insurance-in-force (Note 15) | | 526 | | 543 |
| | |
| Timely Payment Guarantees: Guarantees-in-force (Note 16)1 | | 431 | | 422 |
| 1 | | Exposure includes underlying instruments which may also be insured by CMHC or other mortgage insurers. |
For Loans (Note 7) and Investment Assets and Derivatives the maximum exposure to credit risk is the carrying amount.
Credit risk associated with mortgage loan insurance is managed through prudent product design, underwriting and default management practices, and the establishment of adequate capital reserves as described in Notes 15 and 18.
Credit risk associated with timely payment guarantees is managed through due diligence in approving NHA MBS Issuers, ongoing monitoring of Issuer credit quality and program compliance, and the requirement that all mortgages supporting the NHA MBS be insured against borrower default. We have further mitigated this risk by having been assigned all rights, title and interest in the underlying mortgages so that we have access to principal and interest payments in the event of Issuer default.
Credit risk associated with Loans in the Assisted Housing Activity is in part mitigated through measures that include loan guarantees from other government entities as described in Note 7. Losses due to default are largely recoverable from various levels of government.
Under the CMB program, Loans represent amounts due from Canadian financial institutions as a result of the sale of their beneficial interest in NHA MBS securities to us. The loans are collateralized by the NHA MBS and associated reinvestment securities acquired in the transactions. The collateral is held in our name and represents the sole source of principal repayments for the loans. CMB program collateral held is rated R-1 (high) or AAA by at least two rating agencies.
106 Canada Mortgage and Housing Corporation 2015 ANNUAL REPORT
Under the CMB program, we are exposed to credit-related counterparty risk in the event of default of swap counterparties. This risk is mitigated by transacting with highly rated swap counterparties and collateralization requirements based on credit ratings. All swap counterparties must have a minimum credit rating of BBB (high), or its equivalent, by at least two rating agencies.
The fair value of total loan collateral held under the CMB program was $221,641 million, 102.8% of loan carrying value, as at 31 December 2015 (2014 – $211,980 million, 101.2% of loan carrying value). There was no collateral held under the IMPP program as at 31 December 2015 (2014 – $2,026 million) as this program reached maturity on 15 March 2015.
Credit risk associated with fixed income investments and derivatives is managed through the implementation of policies which include minimum counterparty credit ratings and investment portfolio diversification limits by issuer, credit rating, term and by industry sector, and through the use of appropriate legal agreements and collateralization requirements for derivatives.
Concentration Risk
Concentration risk is the amount of credit risk we are exposed to in relation to specific counterparty and/or sectors. Our risk management policies address concentration risk from activities where the amount of potential loss can be measured (direct investments, lending and derivative transactions credit risk) at both the individual counterparty level and at the sector level and by credit rating. Our largest concentration of credit risk by individual counterparty is to the Government (2015 – $3,815 million; 2014 – $8,772 million), and our largest concentration of credit risk by sector is to the financial sector (2015 – $7,856 million; 2014 – largest concentration was to the Government sector, $8,821 million).
Credit Quality
The following table presents the credit quality of the Cash Equivalents and Investment Securities based on an internal credit rating system1.
| | | | | | | | | | | | | | | | | | | | | | | | | | | | | | | | |
| | | |
| | | 2015 | | | 2014 | |
| | | | | | | | |
| (in millions) | | AAA | | | AA- to
AA+ | | | A- to
A+ | | | Lower
than A- | | | AAA | | | AA- to
AA+ | | | A- to A+ | | | Lower
than A- | |
Cash Equivalents | | | 589 | | | | 556 | | | | 876 | | | | - | | | | 941 | | | | 533 | | | | 689 | | | | - | |
| | | | | | | | |
Investment Securities2 | | | | | | | | | | | | | | | | | | | | | | | | | | | | | | | | |
| | | | | | | | |
Designated at Fair Value through Profit or Loss | | | 353 | | | | 476 | | | | 302 | | | | 16 | | | | 172 | | | | 406 | | | | 467 | | | | 15 | |
| | | | | | | | |
Available for Sale | | | 5,723 | | | | 4,208 | | | | 8,889 | | | | 2,230 | | | | 9,636 | | | | 4,086 | | | | 5,691 | | | | 1,184 | |
| 1 | | The internal credit ratings are based upon internal assessments of the counterparty creditworthiness. These ratings correspond to those provided by the credit rating agencies except in cases where stand-alone ratings exist. A counterparty internal credit rating cannot be higher than the highest stand-alone rating from any of the agencies. A stand-alone rating removes the assumption of government support from the rating. |
| 2 | | Includes fixed income investments only. |
Derivatives
We limit the credit risk associated with derivative transactions by dealing with swap counterparties whose credit ratings are in accordance with our Enterprise Risk Management Policies; through the use of International Swaps Derivatives Association (ISDA) master agreements for derivatives; and where appropriate, through the use of ratings-based collateral thresholds in the Credit Support Annexes (CSA).
ISDA is a master agreement that sets out standard terms that apply to all transactions we entered into with the counterparty. The ISDA outlines procedures and calculations of termination costs in the event of default by either party. The ISDA master agreements give us a legally enforceable right to settle all transactions covered by the agreement with the same counterparty on a net basis in the event of default. All derivative counterparties must have a minimum credit rating of A-, or its equivalent, from at least two rating agencies.
The CSA document, included in the ISDA master agreements, regulates the collateral requirements of swap transactions and the terms under which collateral is transferred to mitigate credit risk. The CSA gives us the right, in the event of default, to liquidate collateral held and apply proceeds received from liquidation against amounts due from the counterparty. Collateral held to offset mark-to-market exposures is not used for any other purpose than to offset such exposure.
Canada Mortgage and Housing Corporation 2015 ANNUAL REPORT 107
Securities Purchased Under Resale Agreements
By their nature, these balances have low credit risk given their short terms and are secured by the underlying securities purchased under the agreements and any incremental margin obtained from counterparties.
These transactions are subject to Global Master Repurchase Agreements which set out the standard terms of all repurchase agreements transacted with each counterparty. These agreements give us a legally enforceable right to settle all repurchase transactions with the same counterparty on a net basis in the event of default. These agreements also provide for the posting of margin by the counterparty when our exposure to that entity exceeds a certain ratings-based threshold. Securities held as eligible margin include debt obligations issued by or guaranteed by the Government, including Crown corporations and CHT. Margin securities should not be used for any other purpose than to offset such exposure. In the event of counterparty default, we have the right to liquidate these securities. The fair value of margin we held as at 31 December 2015 was $1 million (2014 – $1 million).
Netting Arrangements and Offsetting of Financial Assets and Financial Liabilities
The following tables present the potential effects of the netting arrangements described above.
Financial Assets
| | | | | | | | | | | | | | | | | | | | | | | | |
| | | (i) | | | (ii) | | | (iii) = (i) - (ii) | | | (iv) | | | (v) = (iii) - (iv) | |
| | | Gross Amount of Recognized Assets | | | Gross Amount Offset in the Consolidated
Balance Sheets | | | Net Amount of
Assets Presented in
the Consolidated Balance Sheets1 | | | Gross Amount Not Offset in the Consolidated
Balance Sheets | | | Net Amount | |
| (in millions) | | | | | Financial Instruments2 | | | Financial Collateral Received3 | | |
| | |
| | | 2015 | |
Derivatives1 | | | 152 | | | | - | | | | 152 | | | | (35) | | | | - | | | | 117 | |
| | | | | | |
Securities Purchased Under Resale Agreements1 | | | 35 | | | | - | | | | 35 | | | | - | | | | (35) | | | | - | |
Total | | | 187 | | | | - | | | | 187 | | | | (35) | | | | (35) | | | | 117 | |
| | |
| | | 2014 | |
Derivatives1 | | | 147 | | | | - | | | | 147 | | | | (36) | | | | (1) | | | | 110 | |
| | | | | | |
Securities Purchased Under Resale Agreements1 | | | 126 | | | | - | | | | 126 | | | | - | | | | (126) | | | | - | |
Total | | | 273 | | | | - | | | | 273 | | | | (36) | | | | (127) | | | | 110 | |
| 1 | | Derivatives are carried at fair value. Securities Purchased Under Resale Agreements are carried at amortized cost. |
| 2 | | Gross amounts of financial instruments not offset in the Consolidated Balance Sheets refers to amounts recorded to derivative liabilities and securities sold under repurchase agreements where we have a legally enforceable right to offset against amounts recorded to derivative assets and securities purchased under resale agreements, on a counterparty-by-counterparty basis, in the event of default of the counterparty. |
| 3 | | We have the right, in the event of default, to liquidate and apply financial collateral held against amounts due from counterparties. For derivatives, these amounts represent the fair value of collateral posted by swap counterparties to us. For securities purchased under resale agreements, these amounts represent fair value of margin posted by counterparties and of securities we purchased with the commitment to resell to the counterparty at a future date. |
Derivatives assets, as presented in the above table, are reconciled to the Consolidated Balance Sheets below.
| | | | |
| | | |
| (in millions) | | 2015 | | 2014 |
Derivatives Assets Presented in Offsetting Table | | 152 | | 147 |
| | |
Less: Accrued Interest Receivable Presented Separately in Consolidated Balance Sheets | | (35) | | (42) |
Derivatives Asset Balance Presented in the Consolidated Balance Sheets | | 117 | | 105 |
108 Canada Mortgage and Housing Corporation 2015 ANNUAL REPORT
Financial Liabilities
| | | | | | | | | | | | | | | | | | | | | | | | |
| | | | | | |
| | | (i) | | | (ii) | | | (iii) = (i) - (ii) | | | (iv) | | | (v) = (iii) - (iv) | |
| (in millions) | | Gross Amount of Recognized Liabilities | | | Gross Amount Offset in the Consolidated Balance Sheets | | | Net Amount of
Liabilities Presented in the Consolidated Balance Sheets1 | | | Gross Amount Not Offset in the Consolidated Balance Sheet | | | Net Amount | |
| | | | | Financial
Instruments2 | | | Financial
Collateral
Pledged3 | | |
| | |
| | | 2015 | |
Derivatives1 | | | 35 | | | | - | | | | 35 | | | | (35) | | | | - | | | | - | |
| | | | | | |
Securities Sold Under Repurchase Agreements1 | | | 697 | | | | - | | | | 697 | | | | - | | | | (697) | | | | - | |
Total | | | 732 | | | | - | | | | 732 | | | | (35) | | | | (697) | | | | - | |
| | | 2014 | |
Derivatives1 | | | 36 | | | | - | | | | 36 | | | | (36) | | | | - | | | | - | |
| | | | | | |
Securities Sold Under Repurchase Agreements1 | | | 325 | | | | - | | | | 325 | | | | - | | | | (325) | | | | - | |
Total | | | 361 | | | | - | | | | 361 | | | | (36) | | | | (325) | | | | - | |
| 1 | | Derivatives are carried at fair value. Securities Sold Under Repurchase Agreements are carried at amortized cost. |
| 2 | | Gross amounts of financial instruments not offset in the Consolidated Balance Sheets refers to amounts recorded to derivative assets and securities purchased under resale agreements where we have a legally enforceable right to offset against amounts recorded to derivative liabilities and securities sold under repurchase agreements, on a counterparty-by-counterparty basis, in the event of default of the counterparty. |
| 3 | | Represents the fair value of securities we sold to counterparties with our commitment to repurchase from the counterparty at a future date. |
Derivatives liabilities, as presented in the above table, are reconciled to the Consolidated Balance Sheets below.
| | | | | | | | |
| | | |
| (in millions) | | 2015 | | | 2014 | |
Derivatives Liabilities Presented in Offsetting Table | | | 35 | | | | 36 | |
| | |
Less: Accrued Interest Payable Presented Separately in Consolidated Balance Sheets | | | (4) | | | | (5) | |
Derivative Liabilities Balance Presented in the Consolidated Balance Sheets | | | 31 | | | | 31 | |
23. Liquidity Risk
Liquidity risk is the risk that we will encounter difficulty in meeting obligations associated with financial liabilities. Liquidity risk comprises both funding liquidity risk, which is the risk that we will be unable to meet our payment obligations when required due to an inability to borrow or realize on overdraft facilities, and market liquidity risk, which is the risk that we are not able to unwind or offset a particular position without incurring losses because of inadequate market depth or market disruption.
The principal financial obligations exposing us to liquidity risk include, but are not limited to:
| ¡ | | the payment of claims incurred by the Mortgage Loan Insurance Activity; |
| ¡ | | the need to fulfill the timely payment guarantees we provided if sufficient funds are not available for the payment of principal or interest on NHA MBS or CMB by Approved Issuers or CHT, respectively; and |
| ¡ | | payments required by Borrowings and Derivatives. |
We have a liquidity risk policy which includes appropriate limits and other mitigants to ensure sufficient resources to meet current and projected cash requirements.
The Mortgage Loan Insurance and Securitization Activities’ investment portfolios are managed to ensure that there is sufficient cash flow to meet projected claims. Sources of liquidity include: fees, premiums, investment income and proceeds from sales and maturities of investments.
Canada Mortgage and Housing Corporation 2015 ANNUAL REPORT 109
Within the CMB Program, liquidity risk refers to the risk that we may not be able to provide the funding required, in a timely fashion, to satisfy a call on our timely payment guarantee obligation. As guarantor, we are exposed to risk of issuer default, repo and swap counterparty default, impairment of eligible collateral securities and system or other operational failures. Policies in place to mitigate this risk include ensuring high credit quality investments as permitted by the CHT trust agreements and swap counterparties and the establishment of maturity monitoring guidelines. Liquidity sources in the event of an immediate need to fulfill the timely payment guarantee include overdraft facilities and cash and short-term investments in marketable securities as well as a $350 million line of credit with the Central Paying Agent. The Central Paying Agent acts on CHT’s behalf to carry out certain payment functions including collection of monthly payments on NHA MBS purchased and administration and reporting of cash flows.
The Assisted Housing Activity investment portfolio is managed to ensure that there is sufficient cash flow to meet funding needs in case of contingencies causing operational disruptions, unanticipated needs, and to facilitate use of the Crown Borrowing Program. The asset/ liability management strategy ensures that the assets are maintained at the same level as the liabilities. Derivatives are used to hedge mismatches in the timing of cash flows. Further sources of liquidity associated with this portfolio include overdraft facilities and cash and short-term investments in marketable securities. For any additional liquidity requirements, we can access the Crown Borrowing Program upon Department of Finance approval.
At 31 December 2015, we had $300 million (2014 – $300 million) of overnight overdraft facilities available with our banker that had not been drawn upon.
We also mitigate liquidity risk through the use of ISDA master netting agreements reducing the amount of cash required to satisfy derivative obligations.
The following table presents our undiscounted contractual cash flows payable, including accrued interest, under financial liabilities by remaining contractual maturities; therefore cannot be reconciled to the Consolidated Balance Sheets.
| | | | | | | | | | | | | | | | | | | | | | | | | | | | |
| | | | | | | | |
| (in millions) | | Within 1
Month | | | 1 to 3
Months | | | 3 to 12
Months | | | 1 to 5
Years | | | Over 5
Years | | | Total
2015 | | | Total
20141 | |
Accounts Payable and Other Liabilities | | | 16 | | | | 84 | | | | 86 | | | | 217 | | | | 10 | | | | 413 | | | | 582 | |
| | | | | | | |
Securities Sold Under Repurchase Agreements | | | 318 | | | | 380 | | | | - | | | | - | | | | - | | | | 698 | | | | 325 | |
| | | | | | | |
Borrowings – Designated at Fair Value through Profit and Loss | | | - | | | | 874 | | | | 1,046 | | | | 4,757 | | | | 676 | | | | 7,353 | | | | 8,059 | |
| | | | | | | |
Borrowings – Other Financial Liabilities | | | - | | | | 5,124 | | | | 31,801 | | | | 152,079 | | | | 50,262 | | | | 239,266 | | | | 237,576 | |
| | | | | | | |
Derivatives | | | 2 | | | | 6 | | | | 5 | | | | 19 | | | | - | | | | 32 | | | | 28 | |
Total | | | 336 | | | | 6,468 | | | | 32,938 | | | | 157,072 | | | | 50,948 | | | | 247,762 | | | | 246,570 | |
| 1 | | To be consistent with current year presentation, 2014 amounts for Accounts Payable and Other Liabilities have been included. |
Commitments related to Loans and financial guarantees are disclosed in Note 26 and Note 16 respectively.
110 Canada Mortgage and Housing Corporation 2015 ANNUAL REPORT
24. Segmented Information
As described in Note 1, the Consolidated Financial Statements include the Assisted Housing, Mortgage Loan Insurance and Securitization Activities, each of which provides different programs in support of our objectives. The accounts for CHT, a separate legal entity, are included within the Securitization Activity. The financial results of each activity are determined using the accounting policies described in Note 2. The Assisted Housing Activity includes certain corporate items that are not allocated to each activity. Revenues are attributed to, and assets are located in, Canada.
Revenues for the reportable segments are generated as follows:
| ¡ | | Assisted Housing revenues are earned from parliamentary appropriations and interest income on loans; |
| ¡ | | Mortgage Loan Insurance revenues are earned from premiums, fees and investment income; and |
| ¡ | | Securitization revenues are earned from guarantee fees, investment income and interest income on loans. |
| | | | | | | | | | | | | | | | | | | | | | | | | | | | | | | | | | | | | | | | |
| | | | | | |
| | | Assisted Housing Activity | | | Mortgage Loan Insurance Activity | | | Securitization Activity | | | Eliminations | | | Total | |
| | | | | | | | | | |
(in millions) | | 2015 | | | 2014 | | | 2015 | | | 2014 | | | 2015 | | | 2014 | | | 2015 | | | 2014 | | | 2015 | | | 2014 | |
Parliamentary Appropriations for Housing Programs | | | 2,049 | | | | 2,010 | | | | - | | | | - | | | | - | | | | - | | | | - | | | | - | | | | 2,049 | | | | 2,010 | |
Premiums and Fees Earned | | | - | | | | - | | | | 1,592 | | | | 1,688 | | | | 268 | | | | 245 | | | | - | | | | - | | | | 1,860 | | | | 1,933 | |
Net Interest Income | | | | | | | | | | | | | | | | | | | | | | | | | | | | | | | | | | | | | | | | |
Interest Income | | | | | | | | | | | | | | | | | | | | | | | | | | | | | | | | | | | | | | | | |
Loans | | | 427 | | | | 486 | | | | - | | | | - | | | | 4,407 | | | | 4,958 | | | | - | | | | - | | | | 4,834 | | | | 5,444 | |
Other | | | 71 | | | | 73 | | | | - | | | | - | | | | - | | | | - | | | | (3 | ) | | | (7 | ) | | | 68 | | | | 66 | |
| | | 498 | | | | 559 | | | | - | | | | - | | | | 4,407 | | | | 4,958 | | | | (3 | ) | | | (7 | ) | | | 4,902 | | | | 5,510 | |
| | | | | | | | | | |
Interest Expense | | | 489 | | | | 540 | | | | - | | | | - | | | | 4,399 | | | | 4,950 | | | | (82 | ) | | | (82 | ) | | | 4,806 | | | | 5,408 | |
| | | 9 | | | | 19 | | | | - | | | | - | | | | 8 | | | | 8 | | | | 79 | | | | 75 | | | | 96 | | | | 102 | |
| | | | | | | | | | |
Investment Income | | | - | | | | - | | | | 568 | | | | 618 | | | | 39 | | | | 36 | | | | (54 | ) | | | (46 | ) | | | 553 | | | | 608 | |
Net Realized Gains (Losses) | | | - | | | | - | | | | 9 | | | | 1,483 | | | | 5 | | | | 1 | | | | (49 | ) | | | (30 | ) | | | (35 | ) | | | 1,454 | |
Net Unrealized Gains (Losses) | | | 10 | | | | 56 | | | | 3 | | | | (51 | ) | | | - | | | | - | | | | 2 | | | | 4 | | | | 15 | | | | 9 | |
Other Income | | | 26 | | | | 10 | | | | 3 | | | | (3 | ) | | | 69 | | | | 76 | | | | - | | | | - | | | | 98 | | | | 83 | |
TOTAL REVENUES AND PARLIAMENTARY APPROPRIATIONS | | | 2,094 | | | | 2,095 | | | | 2,175 | | | | 3,735 | | | | 389 | | | | 366 | | | | (22 | ) | | | 3 | | | | 4,636 | | | | 6,199 | |
EXPENSES | | | | | | | | | | | | | | | | | | | | | | | | | | | | | | | | | | | | | | | | |
Housing Programs | | | 2,049 | | | | 2,010 | | | | - | | | | - | | | | - | | | | - | | | | - | | | | - | | | | 2,049 | | | | 2,010 | |
Insurance Claims | | | - | | | | - | | | | 290 | | | | 328 | | | | - | | | | - | | | | - | | | | - | | | | 290 | | | | 328 | |
Operating Expenses | | | 18 | | | | 21 | | | | 212 | | | | 249 | | | | 103 | | | | 104 | | | | - | | | | - | | | | 333 | | | | 374 | |
| | | | 2,067 | | | | 2,031 | | | | 502 | | | | 577 | | | | 103 | | | | 104 | | | | - | | | | - | | | | 2,672 | | | | 2,712 | |
INCOME BEFORE INCOME TAXES | | | 27 | | | | 64 | | | | 1,673 | | | | 3,158 | | | | 286 | | | | 262 | | | | (22 | ) | | | 3 | | | | 1,964 | | | | 3,487 | |
Income Taxes | | | 2 | | | | 12 | | | | 409 | | | | 784 | | | | 71 | | | | 65 | | | | (6 | ) | | | 1 | | | | 476 | | | | 862 | |
NET INCOME (LOSS) | | | 25 | | | | 52 | | | | 1,264 | | | | 2,374 | | | | 215 | | | | 197 | | | | (16 | ) | | | 2 | | | | 1,488 | | | | 2,625 | |
Total Revenues and Parliamentary Appropriations | | | 2,094 | | | | 2,095 | | | | 2,175 | | | | 3,735 | | | | 389 | | | | 366 | | | | (22 | ) | | | 3 | | | | 4,636 | | | | 6,199 | |
Inter-segment Revenues1 | | | (1 | ) | | | (3 | ) | | | (103 | ) | | | (76 | ) | | | 82 | | | | 82 | | | | 22 | | | | (3 | ) | | | - | | | | - | |
External Revenues and Parliamentary Appropriations | | | 2,093 | | | | 2,092 | | | | 2,072 | | | | 3,659 | | | | 471 | | | | 448 | | | | - | | | | - | | | | 4,636 | | | | 6,199 | |
| 1 | | Inter-segment Revenues relate to the following: |
|
¡ the Mortgage Loan Insurance Activity recognizes revenues from investing in holdings of CMB, and recognizes revenues from investing in holdings of Capital Market Borrowings; and |
¡ the Assisted Housing Activity recognizes revenues from investing in holdings of CMB. |
Canada Mortgage and Housing Corporation 2015 ANNUAL REPORT 111
| | | | | | | | | | | | | | | | | | | | | | | | | | | | | | | | | | | | | | | | |
| | | | | | |
| | | Assisted
Housing Activity | | | Mortgage Loan Insurance Activity | | | Securitization Activity | | | Eliminations1 | | | Total | |
| | | | | | | | | | |
(in millions) | | 2015 | | | 2014 | | | 2015 | | | 2014 | | | 2015 | | | 2014 | | | 2015 | | | 2014 | | | 2015 | | | 2014 | |
ASSETS | | | | | | | | | | | | | | | | | | | | | | | | | | | | | | | | | | | | | | | | |
Cash and Cash Equivalents | | | 1,184 | | | | 978 | | | | 834 | | | | 1,190 | | | | 2 | | | | 1 | | | | - | | | | - | | | | 2,020 | | | | 2,169 | |
Securities Purchased Under | | | | | | | | | | | | | | | | | | | | | | | | | | | | | | | | | | | | | | | | |
Resale Agreements | | | 35 | | | | 126 | | | | - | | | | - | | | | - | | | | - | | | | - | | | | - | | | | 35 | | | | 126 | |
Investment Securities: | | | | | | | | | | | | | | | | | | | | | | | | | | | | | | | | | | | | | | | | |
Designated at Fair Value through Profit or Loss | | | 1,255 | | | | 1,194 | | | | 90 | | | | 87 | | | | 1 | | | | 1 | | | | (199) | | | | (222) | | | | 1,147 | | | | 1,060 | |
Available for Sale | | | - | | | | - | | | | 23,019 | | | | 21,939 | | | | 2,680 | | | | 2,223 | | | | (3,531) | | | | (2,350) | | | | 22,168 | | | | 21,812 | |
Loans: | | | | | | | | | | | | | | | | | | | | | | | | | | | | | | | | | | | | | | | | |
Designated at Fair Value through Profit or Loss | | | 4,955 | | | | 5,503 | | | | - | | | | - | | | | - | | | | - | | | | - | | | | - | | | | 4,955 | | | | 5,503 | |
Loans and Receivables | | | 4,091 | | | | 4,432 | | | | - | | | | - | | | | 215,622 | | | | 211,512 | | | | - | | | | - | | | | 219,713 | | | | 215,944 | |
Accrued Interest Receivable | | | 188 | | | | 211 | | | | 143 | | | | 103 | | | | 374 | | | | 411 | | | | (11) | | | | (6) | | | | 694 | | | | 719 | |
Derivatives | | | 117 | | | | 105 | | | | - | | | | - | | | | - | | | | - | | | | - | | | | - | | | | 117 | | | | 105 | |
Due from the Government of Canada | | | 161 | | | | 285 | | | | - | | | | - | | | | - | | | | - | | | | - | | | | - | | | | 161 | | | | 285 | |
Investment Property | | | 156 | | | | 149 | | | | 102 | | | | 98 | | | | - | | | | - | | | | - | | | | - | | | | 258 | | | | 247 | |
Accounts Receivable and Other Assets | | | 40 | | | | 124 | | | | 736 | | | | 348 | | | | 63 | | | | 48 | | | | - | | | | - | | | | 839 | | | | 520 | |
| | | | 12,182 | | | | 13,107 | | | | 24,924 | | | | 23,765 | | | | 218,742 | | | | 214,196 | | | | (3,741) | | | | (2,578) | | | | 252,107 | | | | 248,490 | |
LIABILITIES | | | | | | | | | | | | | | | | | | | | | | | | | | | | | | | | | | | | | | | | |
Securities Sold Under Repurchase Agreements | | | - | | | | - | | | | 697 | | | | 325 | | | | - | | | | - | | | | - | | | | - | | | | 697 | | | | 325 | |
Borrowings: | | | | | | | | | | | | | | | | | | | | | | | | | | | | | | | | | | | | | | | | |
Designated at Fair Value through Profit or Loss | | | 7,091 | | | | 7,691 | | | | - | | | | - | | | | - | | | | - | | | | (13) | | | | (14) | | | | 7,078 | | | | 7,677 | |
Other Financial Liabilities | | | 4,194 | | | | 4,533 | | | | - | | | | - | | | | 215,622 | | | | 211,512 | | | | (3,542) | | | | (2,433) | | | | 216,274 | | | | 213,612 | |
Accrued Interest Payable | | | 106 | | | | 123 | | | | - | | | | - | | | | 366 | | | | 404 | | | | (11) | | | | (6) | | | | 461 | | | | 521 | |
Derivatives | | | 31 | | | | 31 | | | | - | | | | - | | | | - | | | | - | | | | - | | | | - | | | | 31 | | | | 31 | |
Accounts Payable and Other Liabilities | | | 364 | | | | 340 | | | | 96 | | | | 325 | | | | 27 | | | | 8 | | | | - | | | | - | | | | 487 | | | | 673 | |
Defined Benefit Plans Liability | | | 179 | | | | 190 | | | | 263 | | | | 284 | | | | 3 | | | | 5 | | | | - | | | | - | | | | 445 | | | | 479 | |
Provision for Claims | | | - | | | | - | | | | 708 | | | | 778 | | | | - | | | | - | | | | - | | | | - | | | | 708 | | | | 778 | |
Unearned Premiums and Fees | | | - | | | | - | | | | 5,432 | | | | 5,575 | | | | 797 | | | | 592 | | | | - | | | | - | | | | 6,229 | | | | 6,167 | |
Deferred Income Tax Liabilities | | | 15 | | | | 8 | | | | 69 | | | | 60 | | | | 20 | | | | 10 | | | | (46) | | | | (33) | | | | 58 | | | | 45 | |
| | | | 11,980 | | | | 12,916 | | | | 7,265 | | | | 7,347 | | | | 216,835 | | | | 212,531 | | | | (3,612) | | | | (2,486) | | | | 232,468 | | | | 230,308 | |
EQUITY OF CANADA | | | 202 | | | | 191 | | | | 17,659 | | | | 16,418 | | | | 1,907 | | | | 1,665 | | | | (129) | | | | (92) | | | | 19,639 | | | | 18,182 | |
| | | | 12,182 | | | | 13,107 | | | | 24,924 | | | | 23,765 | | | | 218,742 | | | | 214,196 | | | | (3,741) | | | | (2,578) | | | | 252,107 | | | | 248,490 | |
| 1 | | The Balance Sheet Eliminations remove inter-segment holdings of CMB and Capital Market Borrowings, as well as inter-segment receivables/payables. |
25. Related Party Transactions
Our related parties include the Government and its departments; agencies and Crown corporations; key management personnel and their close family members and the Pension Plan.
All material related party transactions and outstanding balances not disclosed elsewhere are disclosed below.
Transactions or balances between the entities that have been eliminated on consolidation are not reported.
112 Canada Mortgage and Housing Corporation 2015 ANNUAL REPORT
Government of Canada and its Departments, Agencies and Crown Corporations
We are related in terms of common ownership to all Government departments, agencies and Crown corporations. We enter into transactions with some of these entities in the normal course of business.
The following tables summarize income earned and receivable as well as the total amount invested in instruments issued or guaranteed by the Government.
| | | | | | | | |
| | | |
(in millions) | | 2015 | | | 2014 | |
Investment Income – Cash Equivalents | | | 1 | | | | 8 | |
Investment Income – Investment Securities | | | 70 | | | | 90 | |
| | | |
| | | | | | | |
| | |
(in millions) | | 2015 | | | 2014 | |
Cash Equivalents | | | 97 | | | | 815 | |
| | |
Investment Securities | | | 3,766 | | | | 8,006 | |
| | |
| Interest Receivable – Investment Securities1 | | 13 | | | 15 | |
| 1 | | Included in Accrued Interest Receivable. |
We pay the Government fees in recognition of its financial backing of the Mortgage Loan Insurance and Securitization Activities. The fees, which are recorded in Operating Expenses, amount to $14 million (2014 – $13 million) for the Securitization Activity and $16 million (2014 – $6 million) for the Mortgage Loan Insurance Activity.
Key Management Personnel
The following table presents the compensation of key management personnel, defined as those persons having authority and responsibility for planning, directing and controlling our activities. This includes the Board of Directors and the following senior management members: the President and CEO, the Chief Financial Officer, the Chief Risk Officer and the Senior Vice-Presidents.
| | | | | | | | | | | | | | | | | | | | | | | | |
| | | | | | | |
| | | | | | 2015 | | | | | | | | | 2014 | | | | |
| | | | | | |
(in thousands) | | Board of Directors | | | Other Key Management Personnel | | | Total | | | Board of Directors | | | Other Key Management Personnel | | | Total | |
Short-term Benefits | | | 169 | | | | 4,143 | | | | 4,312 | | | | 189 | | | | 4,377 | | | | 4,566 | |
Post-employment Benefits | | | - | | | | 956 | | | | 956 | | | | - | | | | 560 | | | | 560 | |
Total | | | 169 | | | | 5,099 | | | | 5,268 | | | | 189 | | | | 4,937 | | | | 5,126 | |
Receivable balances outstanding with members of key management personnel as at 31 December 2015 are nil (2014 – nil).
Pension Plan
The following table summarizes interest expense we incurred and administrative services we recovered from the Pension Plan.
| | | | | | | | |
| | | |
| (in millions) | | 2015 | | | 2014 | |
Interest Expense – Paid to the Pension Plan for its holdings of Canada Mortgage Bonds1 | | | 2 | | | | 1 | |
Operating Expenses Recoveries – Paid by the Pension Plan for our Administration Services | | | 5 | | | | 5 | |
| 1 | | Refer to Note 14 for additional information on holdings of CMB by the Pension Plan. |
Receivable balances outstanding with the Pension Plan as at 31 December 2015 are $1.4 million (2014 – nil).
Canada Mortgage and Housing Corporation 2015 ANNUAL REPORT 113
26. Commitments and Contingent Liabilities
Loans
Commitments outstanding for Loans, net of forgiveness, amounted to $118 million at 31 December 2015 (2014 – $103 million) and are normally advanced within a two-year period.
Advances to Mortgage-insured Assisted Housing Projects
Commitments outstanding for advances to mortgage-insured assisted housing projects in financial difficulty amounted to $24 million at 31 December 2015 (2014 – $32 million) and are normally advanced within a ten-year period. Advances in the amount of $24 million are expected to be made over the next five years.
Letters of Credit
We have $103 million (2014 – $98 million) in letters of credit outstanding.
Legal Claims
There are legal claims of $21 million (2014 – $24 million) against CMHC. Due to the uncertainty of the outcome of these claims, no provision for loss has been recorded. We do not expect the ultimate resolution of any of the proceedings to which we are party to have a significant adverse effect on our financial position.
Other Financial Obligations
Total estimated remaining contractual financial obligations are as follows:
| | | | | | | | | | | | | | | | | | | | | | | | |
| | | | | | | |
| (in millions) | | 2016 | | | 2017 | | | 2018 | | | 2019 | | | 2020 | | | 2021 and Thereafter | |
Housing Programs1 | | | 1,583 | | | | 1,535 | | | | 1,475 | | | | 1,417 | | | | 1,361 | | | | 7,671 | |
Operating Leases | | | 20 | | | | 14 | | | | 14 | | | | 13 | | | | 13 | | | | 21 | |
Total | | | 1,603 | | | | 1,549 | | | | 1,489 | | | | 1,430 | | | | 1,374 | | | | 7,692 | |
| 1 | | Total remaining contractual financial obligations for Housing Programs extend for periods up to 25 years (2014 – 25 years). |
27. Operating Expenses
The following table presents the composition of Operating Expenses.
| | | | | | | | |
| | | |
(in millions) | | 2015 | | | 2014 | |
Personnel Costs | | | 225 | | | | 270 | |
| | |
Depreciation of Premises and Equipment | | | 3 | | | | 3 | |
| | |
Other Administrative Goods and Services | | | 217 | | | | 221 | |
| | | 445 | | | | 494 | |
| | |
Less: Housing Programs Operating Expenses1 | | | (112 | ) | | | (120 | ) |
Total Operating Expenses | | | 333 | | | | 374 | |
| 1 | | These expenses represent operating costs we incurred to support and administer housing programs within the Assisted Housing Activity. These costs are reimbursed by the Government through parliamentary appropriations and are recognized in Housing Programs expenses (refer to Note 9). |
114 Canada Mortgage and Housing Corporation 2015 ANNUAL REPORT
28. Current And Non-Current Assets and Liabilities
The following table presents assets and liabilities we expect to recover or settle after 12 months as at 31 December 2015 and 2014.
| | | | | | | | | | | | | | | | | | | | | | | | |
| | | | | | | |
| | | | | | 2015 | | | | | | | | | 2014 | | | | |
| | | | | | |
(in millions) | | Within 1 year | | | After 1 year | | | Total | | | Within 1 year | | | After 1 year | | | Total | |
ASSETS | | | | | | | | | | | | | | | | | | | | | | | | |
| | | | | | |
Cash and Cash Equivalents | | | 2,020 | | | | - | | | | 2,020 | | | | 2,169 | | | | - | | | | 2,169 | |
| | | | | | |
Securities Purchased Under Resale Agreements | | | 35 | | | | - | | | | 35 | | | | 126 | | | | - | | | | 126 | |
| | | | | | |
Investment Securities: | | | | | | | | | | | | | | | | | | | | | | | | |
| | | | | | |
Designated at Fair Value through Profit or Loss | | | 228 | | | | 919 | | | | 1,147 | | | | 329 | | | | 731 | | | | 1,060 | |
| | | | | | |
Available for Sale | | | 1,852 | | | | 20,316 | | | | 22,168 | | | | 5,006 | | | | 16,806 | | | | 21,812 | |
| | | | | | |
Loans: | | | | | | | | | | | | | | | | | | | | | | | | |
| | | | | | |
Designated at Fair Value through Profit or Loss | | | 952 | | | | 4,003 | | | | 4,955 | | | | 1,035 | | | | 4,468 | | | | 5,503 | |
| | | | | | |
Loans and Receivables | | | 32,335 | | | | 187,378 | | | | 219,713 | | | | 33,214 | | | | 182,730 | | | | 215,944 | |
| | | | | | |
Accrued Interest Receivable | | | 694 | | | | - | | | | 694 | | | | 719 | | | | - | | | | 719 | |
| | | | | | |
Derivatives | | | 6 | | | | 111 | | | | 117 | | | | 8 | | | | 97 | | | | 105 | |
| | | | | | |
Due from the Government of Canada | | | 43 | | | | 118 | | | | 161 | | | | 140 | | | | 145 | | | | 285 | |
| | | | | | |
Investment Property | | | - | | | | 258 | | | | 258 | | | | - | | | | 247 | | | | 247 | |
| | | | | | |
Accounts Receivable and Other Assets | | | 437 | | | | 402 | | | | 839 | | | | 130 | | | | 390 | | | | 520 | |
| | | | 38,602 | | | | 213,505 | | | | 252,107 | | | | 42,876 | | | | 205,614 | | | | 248,490 | |
LIABILITIES | | | | | | | | | | | | | | | | | | | | | | | | |
| | | | | | |
Securities Sold Under Repurchase Agreements | | | 697 | | | | - | | | | 697 | | | | 325 | | | | - | | | | 325 | |
| | | | | | |
Borrowings: | | | | | | | | | | | | | | | | | | | | | | | | |
| | | | | | |
Designated at Fair Value through Profit or Loss | | | 1,647 | | | | 5,431 | | | | 7,078 | | | | 1,592 | | | | 6,085 | | | | 7,677 | |
| | | | | | |
Other Financial Liabilities | | | 31,792 | | | | 184,482 | | | | 216,274 | | | | 33,039 | | | | 180,573 | | | | 213,612 | |
| | | | | | |
Accrued Interest Payable | | | 461 | | | | - | | | | 461 | | | | 521 | | | | - | | | | 521 | |
| | | | | | |
Derivatives | | | 4 | | | | 27 | | | | 31 | | | | 5 | | | | 26 | | | | 31 | |
| | | | | | |
Accounts Payable and Other Liabilities | | | 277 | | | | 210 | | | | 487 | | | | 525 | | | | 148 | | | | 673 | |
| | | | | | |
Defined Benefit Plans Liability | | | 99 | | | | 346 | | | | 445 | | | | 105 | | | | 374 | | | | 479 | |
| | | | | | |
Provision for Claims | | | 405 | | | | 303 | | | | 708 | | | | 467 | | | | 311 | | | | 778 | |
| | | | | | |
Unearned Premiums and Fees | | | 1,637 | | | | 4,592 | | | | 6,229 | | | | 1,602 | | | | 4,565 | | | | 6,167 | |
| | | | | | |
Deferred Income Tax Liabilities | | | - | | | | 58 | | | | 58 | | | | - | | | | 45 | | | | 45 | |
| | | | 37,019 | | | | 195,449 | | | | 232,468 | | | | 38,181 | | | | 192,127 | | | | 230,308 | |
NET | | | 1,583 | | | | 18,056 | | | | 19,639 | | | | 4,695 | | | | 13,487 | | | | 18,182 | |
29. Comparative Figures
Reclassifications were made to the Consolidated Balance Sheets and related Notes to the Consolidated Financial Statements to present separately Investment Property from the Accounts Receivable and Other Assets line. This also resulted in a change in the classification of its cash flows from operating activities to investing activities of non-material amounts.
Canada Mortgage and Housing Corporation 2015 ANNUAL REPORT 115


OTHER INFORMATION
Corporate Governance
Legislative Framework
Incorporated under the Canada Mortgage and Housing Corporation Act (CMHC Act), we are accountable to Parliament through the Minister responsible for CMHC, currently the Minister of Families, Children and Social Development. Our legislative framework includes the CMHC Act, the NHA and the Financial Administration Act (FAA).
Board of Directors
Our Board of Directors is responsible for managing our affairs and the conduct of our business in accordance with applicable legislation and the governing by-laws of the Corporation. As a steward of the Corporation, the Board of Directors sets strategic direction in support of government policies and priorities, ensures the integrity and adequacy of corporate policies, information systems and management practices, ensures the key risks are identified and managed, and evaluates and monitors performance and results.
The Board is made up of the Chairperson, the President and Chief Executive Officer (CEO), the Minister’s Deputy Minister, the Deputy Minister of Finance, and, eight other directors. Charters for the Board and its committees (Audit, Corporate Governance and Nominating, Human Resources, and Risk Management) are posted on our website. The Board meets a minimum of five times per year and holds an annual public meeting. In 2015, there were 7 Board meetings and 22 committee meetings.
In order to identify opportunities for enhanced Board performance and director development and education, the Board undergoes annual assessments, generally alternating between a peer assessment and an overall assessment, the latter of which examines the functioning of the Board as a whole in comparison to the boards of other Crown corporations and financial institutions. In 2015, CMHC with the assistance of consultants, evaluated the effectiveness and efficiency of the Board by conducting an overall Board assessment. The Board received a strong and positive assessment with an average “overall Board performance” assessment rating of 8.5 out of 10. This represents a significant increase over the 2013 performance rating of 7.5. Average performance and importance ratings increased for the majority of the governance assessment categories. Board members attributed the positive 2015 performance results to the significant changes that have taken place at the Board level over the last two years, including changes in Board practices and processes.
Corporate Social Responsibility
We strive to conduct our activities in a way that maximizes social and economic contributions and minimizes environmental impact. Our commitment to corporate responsibility is reflected in our corporate values and is integrated into our policies and practices. This is reflected in our strong governance framework, commitment to environmental responsibility, promotion of sustainable housing, and our strong and diverse workplace community.

Canada Mortgage and Housing Corporation 2015 ANNUAL REPORT 117
| | | | |
| | Board of Directors As at 31 December 2015 Robert P. Kelly Chairperson Chair of the Audit Committee Chair of the Corporate Governance and Nominating Committee André G. Plourde Chair of the Human Resources Committee Paul Rochon Deputy Minister of Finance Navjeet (Bob) Dhillon | | Evan Siddall President and Chief Executive Officer Chair of the Pension Fund Trustees Bruce Shirreff Chair of the Risk Management Committee Ian Shugart Deputy Minister, Employment and Social Development Canada Peter Sharpe Louise Poirier-Landry |
| | Please refer to our website for full biographies: www.cmhc.ca |
| | Compensation and Attendance Record |
| | | | | | | | | | | | | | |
| | | | | Attendance/Meetings |
| | | | | | | Committee | | |
Member | | Compensation
($) | | Board of
Directors | | Governance
and
Nominating | | Audit | | Human
Resources | | Risk
Management | | Pension Fund
Trustees |
Robert P. Kelly | | 43,160 | | 7/7 | | 6/6 | | 4/4 | | 5/5 | | 4/4 | | - |
Evan Siddall | | N/A | | 7/7 | | 6/6 | | 4/4 | | 5/5 | | 4/4 | | 3/3 |
Navjeet (Bob) Dhillon1 | | 21,014 | | 5/7 | | - | | 3/4 | | - | | - | | - |
Sandra Hanington2 | | 2,335 | | 1/1 | | 1/1 | | - | | - | | - | | - |
Brian Johnston3 | | 2,874 | | 0/1 | | - | | - | | - | | - | | - |
André G. Plourde | | 23,700 | | 7/7 | | 6/6 | | - | | - | | 1/4 | | 3/3 |
Louise Poirier-Landry | | 28,200 | | 7/7 | | - | | 4/4 | | - | | 2/4 | | 3/3 |
Paul Rochon | | N/A | | 6/7 | | - | | - | | - | | 4/4 | | - |
Peter Sharpe1 | | 20,014 | | 6/7 | | - | | 1/4 | | - | | 2/4 | | - |
Bruce Shirreff | | 27,200 | | 7/7 | | - | | - | | 5/5 | | 4/4 | | - |
Ian Shugart | | N/A | | 7/7 | | 5/6 | | - | | - | | 2/4 | | - |
| 1 | | Effective 6 February 2015, Navjeet (Bob) Dhillon and Peter Sharpe were appointed to our Board of Directors. |
| 2 | | Sandra Hanington departed effective 10 February 2015. |
| 3 | | Brian Johnston retired on 13 March 2015. |
118 Canada Mortgage and Housing Corporation 2015 ANNUAL REPORT
| | |
| Senior Management | | |
| As at 31 December 2015 | | |
Fatima Barros Regional Vice-President, Prairies and Territories Isabelle Bougie Regional Vice-President, Quebec Debra Darke1 Senior Vice-President, Corporate Development, Policy and Research Peter De Barros Vice-President, Public Affairs Romy Bowers1 Chief Risk Officer Sébastien Gignac1 Senior Vice-President, General Counsel and Corporate Secretary Christina Haddad Regional Vice-President, Ontario Nadine Leblanc Vice-President, Audit Charles MacArthur1 Senior Vice-President, Regional Operations and Assisted Housing Steven Mennill1 Senior Vice-President, Insurance | | Audrey Moritz Regional Vice-President, Atlantic Brian Naish1 Chief Financial Officer Helen Polatajko2 Vice-President, Information and Technology Caroline Sanfaçon Regional Vice-President, British Columbia Evan Siddall1 President and Chief Executive Officer Carla Staresina Vice-President, Affordable Housing Marie-Claude Tremblay1 Senior Vice-President, Human Resources Michel Tremblay1, 2 Chief of Staff Glen Trevisani Vice-President, Insurance Operations Wojo Zielonka1 Senior Vice-President, Capital Markets |
| 1 | | Member of Executive Committee |
| 2 | | Following the end of our fiscal year, Helen Polatajko left the Corporation and Michel Tremblay assumed the responsibility of Acting Vice-President, Information and Technology. |
Canada Mortgage and Housing Corporation 2015 ANNUAL REPORT 119
Glossary
Non-IFRS Financial Measures
We use a number of financial measures to assess our performance, some of which are not calculated in accordance with IFRS, are not defined by IFRS, and do not have standardized meaning that would ensure consistency and comparability with other institutions.
Arrears Rate
The ratio (expressed as a percentage) of all loans that are typically more than 90 days past due to the number of outstanding insured loans.
Capital Available To Capital Required
Under the Securitization Activity, this means the ratio (expressed as a percentage) of capital available to capital required where capital available is calculated as total equity adjusted for assets with a capital requirement of 100% and capital required is calculated by applying risk factors to investment asset and liability exposures using a framework developed in accordance with both regulatory and economic capital principles.
Capital Available To Minimum Capital Required
Under the Mortgage Loan Insurance Activity, this means the ratio (expressed as a percentage) of capital available to minimum capital required where capital available is calculated as total equity adjusted for assets with a capital requirement of 100% and minimum capital required is calculated by applying risk factors to investment asset and liability exposures in accordance with guidelines established by OSFI.
Operating Budget Expense Ratio
The ratio (expressed as a percentage) of operating budget expenses for all of CMHC’s activities (excluding CHT) during the period to premiums, fees, guarantee, and application fees received, net interest income from lending programs and normalized parliamentary appropriations.
Guarantees-in-force
The total guarantees related to the timely payment of principal and interest of NHA MBS for investors in securities issued by Approved Issuers on the basis of housing loans through the NHA MBS program and the CMB issued by the CHT.
Insurance-in-force
The total amount of outstanding loan balances covered by mortgage loan insurance policies at a specific period in time.
Loss Ratio
The ratio (expressed as a percentage) of the Insurance Claims incurred during the period to the Premiums and Fees Earned in the period in the Mortgage Loan Insurance Activity.
Minimum Capital Test (MCT)
The minimum capital required calculated by applying risk factors to the Mortgage Loan Insurance Activity’s assets and liabilities using a defined methodology prescribed by OSFI.
Operating Expense Ratio
Mortgage Loan Insurance Activity: the ratio (expressed as a percentage) of Operating Expenses during the period to Premiums and Fees Earned during the period for the Mortgage Loan Insurance Activity.
Securitization Activity: the ratio (expressed as a percentage) of Operating Expenses during the period, exclusive of those related to the administration of the covered bond legal framework, to guarantee fees earned during the period.
Return on Capital Holding Target (ROCHT)
Reflects annualized Net Income, adjusted to reflect earnings based on CMHC’s capital holding level of 220% MCT, divided by the weighted average capital holding target for the period.
Return on Equity
The annualized Net Income divided by the average of the beginning and ending Equity for the period, used to highlight the operating performance.
120 Canada Mortgage and Housing Corporation 2015 ANNUAL REPORT
Return on Required Capital (RoRC)
The annualized Net Income, adjusted to remove investment income earned on capital in excess of capital required, divided by the average required capital for the period.
Severity Ratio
The ratio (expressed as a percentage) of Insurance Claims to the original insured loan amount for the claims paid in the period.
Other Glossary Terms
Aggregators
Aggregators are CMHC securitization program participants whose ordinary course of business does not include operating as mortgage originators.
Approved Issuer
A business organization which, having met the criteria established by CMHC, is approved to issue and administer guaranteed NHA MBS.
Approved Lender
A lending institution designated as an approved lender by CMHC under the NHA. Only Approved Lenders may qualify for CMHC loan insurance.
Canada Housing Trust (CHT)
The CHT is a special purpose trust that acquires interests in eligible insured housing loans, such as NHA MBS, and issues CMB. The CHT also purchases highly rated investments and undertakes certain related financial hedging activities. We consolidate the accounts of CHT with Securitization. CHT’s assets and liabilities are neither owned by nor held for our benefit. The beneficiaries of the trust, after payment of all obligations, are one or more charitable organizations.
Crown Borrowing Program
The Crown Borrowing Program was introduced in Budget 2007 to provide cost effective, flexible, and timely funding to participating Crown corporations and to increase the operating efficiency and liquidity of the Government debt market. Under this program, Finance Canada extends loans directly to CMHC.
Housing Programs
All activities funded by parliamentary appropriations under assisted housing and market analysis and research.
Housing Support
Contractual commitments for housing and municipal infrastructure that help to reduce affordability problems for low and moderate-income households, to provide accommodation for students and to provide production of moderately priced rental housing. The program also provides ancillary services to support our mandate. This includes the Affordable Housing Centre, the housing-related infrastructure loans to municipalities and other long-term commitments such as the market housing programs and the community services program.
Insured Mortgage Purchase Program (IMPP)
A program established by the Government which authorized us to purchase up to $125 billion in NHA MBS from Canadian financial institutions between October 2008 and March 2010 as a temporary measure to maintain the availability of longer-term credit in Canada. A total of $69.3 billion in NHA MBS was purchased by CMHC through a competitive auction process. The IMPP matured in March 2015 at which time all loans and borrowings from the Government were repaid.
Investment in Affordable Housing 2011-2019 (IAH)
Since April 2011, new federal funding for affordable housing has been provided through the IAH. Originally announced as a three-year commitment (2011-2014), the IAH has been extended to 2019 for a total federal investment of more than $1.9 billion over eight years toward reducing the number of Canadians in housing need. Under the IAH, provinces and territories cost-match the federal investment and are responsible for program design and delivery.
Large Lenders
The five largest Canadian Financial Institutions who participate in the Canadian Registered Covered Bond Programs, unless otherwise specifically stated in the text.
Canada Mortgage and Housing Corporation 2015 ANNUAL REPORT 121
Lending Programs
We make loans under the NHA to federally-subsidized social housing sponsors, First Nations, provinces, territories and municipalities as well as non-subsidized housing support loans. Our loan portfolio is comprised of a mix of renewable and non-renewable loans which may be on or off-reserve. Direct Lending is the current borrowing initiative we use to refinance our renewable loans as well as to finance new commitments on-reserve. These loans can be financed at lower interest rates due to our status as a federal Crown corporation. As such, we are able to lower the cost of government assistance required for social housing projects. Direct lending is operated on a planned breakeven basis.
Municipal Infrastructure Lending Program
2009-2011 (MILP)
In Budget 2009, we provided $2 billion in direct low-cost loans to municipalities over a two-year period ending 31 March 2011 to fund housing-related municipal infrastructure.
Seed Funding Program
Seed funding consists of a contribution and a loan, to support activities carried out in the early stages of developing affordable housing project proposals.
Service Provider
Within the NHA MBS program, the service provider is responsible for the servicing of mortgages in the mortgage pool on behalf of an Approved Issuer.
Small Lenders
All financial institutions who participate in the Canadian Registered Covered Bond Programs, excluding those specifically defined as large lenders.
122 Canada Mortgage and Housing Corporation 2015 ANNUAL REPORT

Our Values
Because we care about what we do
Be an owner
Amaze our clients
Think “yes” first
Do the right thing
Believe in each other:
we are better together
Celebrate both wins and failures
Ask “why?”
Be fearless in the face of change
Make a difference
Have fun every day
cmhc.ca/annualreport