EXHIBIT 99.2

TABLE OF CONTENTS
| | | | |
| |
| Our Corporate Plan Framework for 2017 | | | 2 | |
| |
| The Year At-A-Glance | | | 3 | |
| |
| 2017 Performance Highlights | | | 4 | |
| |
| Message from the Outgoing Chairperson | | | 5 | |
| |
| Message from the Incoming Chairperson | | | 5 | |
| |
| Message from the President | | | 6 | |
| |
| Message from the Chief Financial Officer | | | 8 | |
| |
| Management’s Discussion and Analysis | | | 9 | |
| |
Operating Environment | | | 10 | |
| |
Outlook for 2018 | | | 12 | |
| |
The National Housing Strategy | | | 13 | |
| |
Risk Management | | | 15 | |
| |
Condensed Consolidated Financial Results | | | 18 | |
| |
Performance by Activity | | | 20 | |
| |
Future Changes to Accounting Standards | | | 45 | |
| |
| Historical Information | | | 46 | |
| |
| Consolidated Financial Statements | | | 47 | |
| |
| Corporate Governance | | | 104 | |
| |
| Board of Directors | | | 105 | |
| |
| Senior Management | | | 106 | |
| |
| Glossary | | | 108 | |
| | | | |
| 2017 ANNUAL REPORT | |  | | 1 |
OUR CORPORATE PLAN FRAMEWORK FOR 2017
| | | | |
| OUR MANDATE | | OUR MISSION | | OUR VISION |
| Facilitate access · Contribute to | | We help Canadians meet | | The heart of a world-leading |
| financial stability | | their housing needs | | housing system |

LONG-TERM OUTCOMES
Canada has a stable, competitive and innovative housing system
Canadians in need have access to affordable and suitable housing
| | | | |
| 2 | | | | CANADA MORTGAGE AND HOUSING CORPORATION |
THE YEAR AT-A-GLANCE
Our strategic directions guided our decision making and priority setting for 2017.
Here’s a look at some of this year’s achievements:
| | |
 | | LEAD THROUGH INNOVATION AND INSIGHT |
| | To drive housing solutions and support informed decision making, we |
| |
| | · through a partnership with Statistics Canada, strengthened the availability of housing-related data for Canadians |
| |
| | · produced new publications on mortgage and consumer trends |
| |
| | · held the first Pan-Canadian Voice for Women’s Housing Symposium |
| |
 | | BE A HIGH-PERFORMING ORGANIZATION |
| | To deliver results for Canadians and excellent service to our clients, we |
| |
| | · confirmed our technology and business transformation, becoming a modern, digitally-enabled organization |
| |
| | · created a talent acquisition framework to meet our evolving business needs |
| |
| | · developed a career framework to support employees’ growth and leadership development |
| |
 | | ACHIEVE BETTER OUTCOMES BY MANAGING RISK |
| |
| | To support housing affordability and financial stability, we |
| |
| | · developed policy and announced Canada’s first ever National Housing Strategy (NHS) |
| |
| | · strengthened our core risk management capabilities via an enhanced risk governance and refined risk appetite framework and modernized our economic capital and stress testing models |
| |
| | · increased the supply of rental housing by launching the Rental Construction Financing initiative and the Affordable Rental Housing Innovation Fund |
| |
| | · helped over 250,000 households across the country to meet their housing needs through Budget 2016 social infrastructure investments |
| | | | |
| 2017 ANNUAL REPORT | | | | 3 |
2017 PERFORMANCE HIGHLIGHTS
| | | | |
| 4 | | | | CANADA MORTGAGE AND HOUSING CORPORATION |
| | |
| |  |
MESSAGE FROM THE OUTGOING CHAIRPERSON | |
On behalf of the Board of Directors, I am pleased to present CMHC’s 2017 Annual Report, Envisioning a Place to Call Home. Throughout the year, our Board continued to provide operational oversight and direction in support of CMHC’s pursuit of its mandate. | |
CMHC has continued to manage its mortgage loan insurance and securitization businesses in a commercially viable manner. In June, it took an important step in preserving financial discipline by implementing a dividend framework, and subsequently declared $4.7 billion in dividends over the course of the year. | |
In 2017, the Government of Canada showed its confidence in CMHC by entrusting it with development and delivery of Canada’s first National Housing Strategy. Over the past year, CMHC successfully envisioned how it would bring to life this ambitious $40-billion, 10-year plan to ensure Canadians have a place to call home that meets their needs and that they can afford. | |
As my term as Chair comes to an end, I would like to recognize and sincerely thank my fellow Board members, the management team and the dedicated staff who so ably contributed to the evolution of CMHC during my tenure. We have taken many important steps together that have strengthened CMHC’s contributions to Canada’s financial stability and positioned the Corporation to deliver on the National Housing Strategy. It has truly been an honour and privilege to be a part of this great organization. | |
| |
 | | |
| Robert P. Kelly | | |
| Chairperson | | |
| |
| |  |
MESSAGE FROM THE INCOMING CHAIRPERSON | |
| |
Safe and affordable housing is the foundation upon which our country can build a better, more prosperous future for all Canadians. It was therefore a great honour to be appointed Chairperson of CMHC in December 2017. | |
The Government of Canada’s renewed commitment to housing will be realized through the National Housing Strategy with CMHC having been asked to reassume a federal leadership role in housing. CMHC and our partners across the country have a vital role in implementing and delivering the Strategy, and I look forward to working with my fellow Board members and CMHC management and employees in helping to shape the future of Canadian housing. | |
| |
 | | |
| Derek Ballantyne | | |
| Chairperson (effective April 2018) | | |
| | | | |
| 2017 ANNUAL REPORT | | | | 5 |
MESSAGE FROM THE PRESIDENT
Last September I had the chance to meet Miriam—a woman who spoke passionately about her journey to Canada as a refugee, and the “life-changing” moment when she found safe affordable housing for her and her daughter. For Miriam—and for all of us—housing is more than just a roof and four walls. Housing is hope. It’s the stable foundation for caring for our families, studying, and finding and maintaining a job. And for over 70 years, no single organization has been more fundamental to ensuring Canadians have a place to call home than Canada Mortgage and Housing Corporation.
Meeting people like Miriam inspires all of us at CMHC to ensure the organization can anticipate and meet the housing needs of Canadians for many years to come. That is why, in recent years, we’ve been working hard to transform the way we work to become a more agile, high performing organization. Journeys like this are uneven and we have approached setback only as an opportunity to learn, adjust and improve.
Initially, we focussed on our “hardware”—our mission, vision, values, strategy and performance management. We’ve continued by transforming our technology and business tools, strengthening our risk management capacity, and creating a new career framework to guide our employees’ ongoing development. We have plugged several gaps in our housing information base and we continue to invest in research—so that we can better understand and address the complex factors shaping Canada’s housing markets.
This work positioned us for an historic accomplishment in 2017: announcing Canada’s first-ever National Housing Strategy. The federal government has entrusted CMHC with the development and implementation of this strategy, announced in November by Prime Minister Justin Trudeau and our minister, the Honourable Jean-Yves Duclos. The impact of this unprecedented investment, $40 billion over 10 years, will be impressive. It will reduce chronic homelessness by 50% and remove 530,000 households from housing need.
Canadians also depend on CMHC to ensure the housing market remains stable. As this Annual Report shows, CMHC remains a systemically important financial institution in Canada. We continue to support both our clients and Canadians through our mortgage loan insurance and securitization operations. Notably, we recently reimagined our multi-unit residential mortgage loan insurance segment to better support the rental housing sector and the nearly 30% of Canadians who live in homes they rent.
Our responsible management of these businesses benefits all Canadians. In 2017, we navigated a changing regulatory environment that significantly impacted our mortgage loan insurance volumes. Nonetheless, we generated a net income of $1.8 billion primarily as a result of some one-time investment gains and lower insurance claims, which resulted from stronger than expected economic performance. During 2017, we declared $4.7 billion in dividends to our shareholder, the Government of Canada. And an additional $1 billion dividend was declared on March 22, 2018. This decision reflects our strong financial performance, and pushes us to continue to manage our resources efficiently and be rigorous in our decision-making.
“We are building a stronger, more agile company in the service of Canadians.”
| | | | |
| 6 | | | | CANADA MORTGAGE AND HOUSING CORPORATION |
| | | | |
| 8 | | | | CANADA MORTGAGE AND HOUSING CORPORATION |
MANAGEMENT’S DISCUSSION AND ANALYSIS
The following Management’s Discussion and Analysis (MD&A) of the financial condition and results of operations as approved by the Board of Directors on March 22, 2018 is prepared for the year ended December 31, 2017. This MD&A should be read in conjunction with the audited consolidated financial statements. Unless otherwise indicated, all financial information in this report has been prepared in accordance with International Financial Reporting Standards (IFRS) and all amounts are expressed in Canadian dollars.
FORWARD-LOOKING STATEMENTS
Our Annual Report contains forward-looking statements that include, but are not limited to, statements with respect to our outlook for the regulatory environment in which we operate, the outlook and priorities for each activity and the risk environment. By their nature, forward-looking statements require us to make assumptions and are subject to inherent risks and uncertainties that may cause actual results to differ materially from expectations expressed in the forward-looking statements.
NON-IFRS MEASURES
We use a number of financial measures to assess our performance. Some of these measures are not calculated in accordance with IFRS, are not defined by IFRS, and do not have standardized meanings that would ensure consistency and comparability with other institutions. These non-IFRS measures are presented to supplement the information disclosed in the consolidated financial statements and notes to the consolidated financial statements, which are prepared in accordance with IFRS and may be useful in analyzing performance and understanding the measures used by management in its financial and operational decision-making. Where non-IFRS measures are used throughout the Annual Report, a definition of the term will be disclosed in the glossary for non-IFRS financial measures.
| | | | |
| 2017 ANNUAL REPORT | | | | 9 |
| | | | |
| 10 | | | | CANADA MORTGAGE AND HOUSING CORPORATION |
| | | | |
| 2017 ANNUAL REPORT | | | | 11 |
| | | | |
| 12 | | | | CANADA MORTGAGE AND HOUSING CORPORATION |
THE NATIONAL
HOUSING STRATEGY
| | |
The NHS—Canada’s first ever—was announced on 22 November, 2017, with the goal of ensuring that Canadians across the country can access housing that meets their needs and that they can afford. Building on investments announced in Budgets 2016 and 2017, the NHS is a detailed 10-year, $40 billion plan that will deliver results and benefit Canadians—with more affordable, accessible, inclusive and sustainable homes. In 2016, CMHC led the national consultations on the vision, themes, principles and outcomes of the NHS. Important learnings emerged from the Let’s Talk Housing consultations, and the NHS is stronger for it. Moving forward, CMHC will continue to lead the implementation of the NHS and work to ensure more Canadians across the country find a place to call home. The primary focus will be on meeting the needs of vulnerable populations, such as women and children fleeing family violence, seniors, Indigenous peoples, persons with disabilities, those dealing with mental health and addiction issues, veterans and young adults. In addition, the NHS is grounded in, and supportive of, the Government’s commitment to Gender Based Analysis (GBA+) to ensure that programs will not negatively impact Canadians on the basis of gender and other identity factors. To be successful, the NHS requires the collaboration and commitment of more partners than ever before, in a coherent, integrated and whole-of-government approach. CMHC will track and report on successes, and adapt its approach and priorities as needed as the NHS unfolds. | |  |
A ONCE-IN-A-GENERATION INVESTMENT
A 10-year plan to give more Canadians a place to call home
| | | | | | |
| $15.9 billion | | $9.1 billion | | $2.5 billion | | $4.0 billion |
| for the National Housing | | for Community | | for Federal-Provincial/Territorial | | for Canadian Housing Benefit * |
| Co-Investment Fund | | Housing Initiatives * | | Housing Partnership, | | |
| | | | including the North * | | |
| | | |
| $9.8 billion | | $2.2 billion | | $241 million | | $200 million |
| through existing agreements | | for Homelessness | | for Research, Data | | for Federal Lands Initiative |
| | Partnering Strategy | | and Demonstrations | | |
* Includes cost matching by Provinces and Territories.
“In 2016, CMHC led the national consultations on the vision, themes, principles and outcomes of the NHS. Important learnings emerged from the Let’s Talk Housing consultations, and the NHS is stronger for it. Moving forward, CMHC will continue to lead the implementation of the NHS and work to ensure more Canadians across the country find a place to call home.”
| | | | |
| 2017 ANNUAL REPORT | | | | 13 |
| | | | |
| 14 | | | | CANADA MORTGAGE AND HOUSING CORPORATION |
RISK MANAGEMENT
WHAT WE DO
Through the course of our work promoting the stability of the Canadian housing system, we are exposed to a variety of risks. We go to great lengths to protect the public resources entrusted to us as well as our reputation, as we strive to be a global leader in the management of housing risks.
ENTERPRISE RISK MANAGEMENT
We follow a comprehensive Enterprise Risk Management (ERM) Framework to guide our activities and support a risk-aware culture characterized by robust evaluation and management of risks across the Corporation. The framework is structured around the following four key dimensions that, together, contribute to our strong risk management practices and culture:
RISK GOVERNANCE
This dimension comprises our risk governance structure, risk management policies and a “three lines of defence” risk governance model that define roles and responsibilities across the corporation.
It includes:
| · | | the Board of Directors (the Board) which is responsible for managing CMHC’s affairs and the conduct of its business, including ensuring that major risks are identified and managed; | |
| · | | the Risk Management Committee of the Board which is responsible for assisting the Board in fulfilling its risk oversight responsibilities including legislative and regulatory compliance; | |
| · | | all members of Senior Management who play an integral role in identifying, monitoring and reporting risks within their areas of responsibility and overseeing activities performed within and across the “three lines of defence”; and | |
| · | | all employees who form the foundation of the “Three Lines of Defence” as outlined in the diagram below. | |

| | | | |
| 2017 ANNUAL REPORT | | | | 15 |
RISK APPETITE
Our risk appetite defines the level and type of risks we are willing to accept to achieve our strategy, including in times of crisis. Our mandate requires us to manage strategic, operational and financial risks with strong risk management capabilities appropriate for our size, complexity and systemic importance.
In 2017, we reviewed our risk appetite framework to better align it with our mandate and strategic directions. This resulted in new risk appetite statements that addressed desired risk behaviours both in normal and stressed economic conditions.
RISK BEHAVIOUR
We continue to deliver training and education activities that foster desired risk behaviours and support risk management capabilities among all of our employees. Our risk culture is defined by aspirational risk culture statements that promote desired risk behaviours including innovation, risk-based decision-making, and understanding of risk management at all levels of the Corporation.
RISK MANAGEMENT PROGRAM
Our risk management programs are continuously being improved to enhance the identification, assessment, measurement and reporting of material risks across all of our activities. We also conduct an Own Risk and Solvency Assessment (ORSA) to identify risks and to assess our current and future capital needs and solvency positions.
Stress testing
Stress testing is an important part of our ORSA and is conducted annually on an enterprise-wide basis. We use stress testing to evaluate how various extreme economic and operational scenarios could affect our financial performance, capital adequacy and operational resiliency. Our annual corporate-wide stress testing program is developed through a structured, corporate-wide consultative process and, in all cases, confirms our ability to weather severe but extremely unlikely scenarios. In support of greater transparency, we have been publicly releasing our stress test results since 2015.
Risk Reporting & Monitoring
We identify, categorize and assess existing and emerging risks using seven risk categories; strategic, reputational, operational, insurance and guarantee, credit, market and liquidity. Our risk reporting and monitoring processes provide an enterprise-wide view of our risk profile, flags key and emerging risks and fosters a discussion about mitigating actions.
The table below outlines our seven risk categories and their assessment at 31 December, 2017:
| | | | | | | | | | | | | | | | | | | | | | | | |
STRATEGIC | | | | REPUTATIONAL | | | | OPERATIONAL | | | | INSURANCE & GUARANTEE | | | | CREDIT | | | | MARKET | | | | LIQUIDITY |
| MODERATE | | | | MODERATE | | | | HIGH | | | | LOW | | | | LOW | | | | LOW | | | | LOW |
As we continue on our transformation and movement away from legacy systems, operational risk was assessed as high and we are closely monitoring it, with cyber security and organizational change being identified as top concerns to the organization. Multiple concurrent business transformation and change initiatives are increasing the efficiency and effectiveness of our business processes and controls, improving our ageing information and technology infrastructure, and increasing our cyber security capabilities. Change fatigue is being closely monitored during the deployment of these various initiatives.
Our strategic and reputational risks were assessed as moderate given our rapidly changing internal and external environment. Economic uncertainties combined with regulatory changes related to mortgage lending, our technology and business transformation as well as heightened expectations from our many stakeholders following the launch of the NHS contribute to uncertainties in our environment and may impact our reputation and the way we execute our strategy.
Insurance and guarantee risk, credit, market and liquidity risk categories were assessed as low.

RISK CULTURE STATEMENTS
| · | | We follow best-in-class management standards |
| · | | We take the right type of risk to achieve our strategy and foster innovation |
| · | | We manage risks to drive better performance and outcomes |
| · | | We individually take ownership of risk and challenge each other |
| | | | |
| 16 | | | | CANADA MORTGAGE AND HOUSING CORPORATION |
Capital Management
Capital Framework
Under our capital management framework we validate and calibrate annually, if necessary, both our internal capital target and the operating capital holding target. Our capital targets ensure that a sufficient amount of capital is held for normal fluctuations in financial results and business needs. We set our capital at a level to promote market discipline, not to maximize our return on capital.
We conduct our ORSA to identify risks and assess our current and likely future capital needs and solvency positions.
Dividends
Over the course of the year, we declared $4.7 billion in dividends payable to our shareholder, the Government of Canada, including a one-time special dividend of $4 billion payable over a period not to exceed two years. As at year-end, $2.7 billion has been paid. An additional $1 billion was declared on March 22, 2018.
We intend to continue to return excess capital to the Government of Canada by assessing our capital needs on a long-term basis and following a stable dividend pattern to maintain our capital position approximately in line with our operating level of capital. By following this approach, we will effectively return profits that are not allocated to reserves or capitalization or used to meet the needs of the Corporation for the purposes of the National Housing Act (NHA), CMHC Act or any other purpose authorized by Parliament relating to housing. Payments are made in accordance with the NHA, CMHC Act, Financial Administration Act and our policies, which are consistent with the framework.
Dividend amounts are influenced by:
| · | | our internal view of capital needs in accordance with our specific risk profile and information from our models for economic capital and stress testing; |
| · | | the amount of capital to be set aside based on regulatory requirements; and |
| · | | a margin for uncertainty and provision for unknown risks informed by our risk appetite, stress testing and scenarios analysis. |
|
ENVISIONING a place to call home |
BUILDING A RESILIENT RISK CULTURE |
An earthquake, an oil price shock over a sustained period, or an extended period of global economic deflation—these are some of the extreme, but unlikely scenarios that we test our mortgage loan insurance and securitization business against. Our stress testing shows that we’re well positioned to withstand a major shock, which is great news. Last year, we chose to push this exercise further and take a risk. We decided to share not only the results, but also the methodology of our testing to help us improve our models and the reliability of our results. Our openness in releasing stress testing results was lauded by the financial services industry, and our transparency led to learning opportunities with our clients. This work is just one of the ways we have been transforming and strengthening our risk management and culture to help us deliver on our mandate. |
| | | | |
| 2017 ANNUAL REPORT | | | | 17 |
CONDENSED CONSOLIDATED
FINANCIAL RESULTS
CONDENSED CONSOLIDATED BALANCE SHEET
| | | | | | | | |
| (IN MILLIONS) | | 2017 | | | 2016 | |
Total assets | | | 267,115 | | | | 259,532 | |
Total liabilities | | | 249,374 | | | | 238,542 | |
Total equity of Canada | | | 17,741 | | | | 20,990 | |
Our total equity of Canada decreased by $3,249 million (15%) primarily as a result of the declaration of $4,675 million in dividends partially offset by comprehensive income of $1,426 during the year.
An increase in our total assets of $7,583 million (3%) was driven by the issuance of Canada Mortgage Bonds (CMB), resulting in a $10,634 million (5%) increase in loans—loans and receivables offset by a reduction of $3,317 million in other financial assets used primarily to fund dividend payments of $2,675 million and to repay maturing Government of Canada borrowings.
Our total liabilities increased by $10,832 million (5%) mainly due to a $10,436 million (5%) increase in borrowings—other finance liabilities in line with increases in our loans—loans and receivables due to the issuance of CMBs. Furthermore, $2,000 million of dividends remain to be paid to the Government. Offsetting these increases is a reduction of $1,341 million in Government borrowings.
CONDENSED CONSOLIDATED STATEMENTS OF INCOME
AND COMPREHENSIVE INCOME
| | | | | | | | |
| (IN MILLIONS) | | 2017 | | | 2016 | |
Total revenues | | | 6,152 | | | | 4,625 | |
Total expenses | | | 3,772 | | | | 2,806 | |
Income taxes | | | 577 | | | | 441 | |
Net income | | | 1,803 | | | | 1,378 | |
Other comprehensive income (loss) | | | (377) | | | | (27) | |
Comprehensive income | | | 1,426 | | | | 1,351 | |
REVENUES
Total revenues increased by $1,527 million (33%) primarily due to
| · | | Higher parliamentary appropriations for housing programs of $1,076 million (50%) mainly as a result of increased spending on new initiatives under Budget 2016. | |
| · | | net gains on financial instruments of $198 million (388%) as we realized gains on the sale of investment securities due to portfolio rebalancing in line with our investment policy. In addition, the cost to retire our CMBs decreased following increases in interest rates. | |
| · | | premiums and fees earned of $152 million (8%) mainly due to higher premiums and fees received in recent years within our Securitization and Mortgage Loan Insurance activities. | |
Other income increased by $85 million (224%) primarily from an $82 million increase in unrealized gains following the revaluation of investment properties.
| | | | |
| 18 | | | | CANADA MORTGAGE AND HOUSING CORPORATION |
EXPENSES
Total expenses increased by $966 million (34%) as a result of increases in housing programs expenses of $1,076 million (50%) in accordance with parliamentary appropriations for housing programs, and operating expenses of $77 million (24%) as we incurred higher costs from our technology and business transformation initiative, partially offset by a decrease in insurance claims.
Offsetting the increases in total expenses was a decrease in insurance claims of $187 million (56%) as a result of fewer policies in force, improvements in the unemployment rate throughout Canada and significant appreciation in housing prices especially in Ontario and British Columbia. These stronger economic conditions led to a decrease in incurred claims and a reduction in our incurred but not reported provision. In addition, we reduced our provision for social housing and index-linked mortgages due lower exposure as a result of a decrease in outstanding loan balances. Furthermore, we recognized a lower allowance on our workout loans to reflect expected future cash flows.
OTHER COMPREHENSIVE LOSS
We recognized a loss of $377 million—an increase of $350 million compared to our loss in 2016. Net unrealized losses from available for sale financial instruments and an increase in remeasurement losses on our defined benefit plans were the main contributors of the higher loss in 2017.
During the year we recognized additional net unrealized losses on our available for sale financial instruments of $126 million primarily on fixed income instruments as applicable interest rates increased throughout the year. Furthermore, as we rebalanced our investment portfolio during the year, $136 million in unrealized gains were reclassified from accumulated other comprehensive income to net gains on financial instruments, compared to $37 million in 2016.
Remeasurement losses on our defined benefits plans were primarily due to lower discount rate used to determine the benefit obligation in 2017, partially offset by an actual return on plan assets that was higher than expected. This had a net effect of increasing the defined benefit liability. By comparison, in 2016, there was a smaller decrease in the discount rate, which was more than offset by a higher than expected return on plan assets. This had a net effect of decreasing the defined benefit liability.
FINANCIAL PERFORMANCE AGAINST 2017 PLAN
| | | | | | | | |
| | | 2017 | |
| (IN MILLIONS) | | ACTUAL | | | PLAN | |
Total revenues | | | 6,152 | | | | 5,885 | |
Total expenses | | | 3,772 | | | | 4,013 | |
Income taxes | | | 577 | | | | 451 | |
Net income | | | 1,803 | | | | 1,421 | |
Total assets | | | 267,115 | | | | 269,234 | |
Total liabilities | | | 249,374 | | | | 247,222 | |
Total equity of Canada | | | 17,741 | | | | 22,012 | |
Total revenues were $267 million (5%) higher than Plan primarily a result of net gains on financial instruments following the sale of investment securities, in addition to a decrease in the cost to retire our CMBs following increases in interest rates.
Total expenses were $241 million (6%) lower than Plan primarily because of lower insurance claims as a result of favourable economic conditions and to the reduction of the allowance on our workout loans within our Mortgage Loan Insurance Activity.
During the year, we declared $4,675 million in dividends, $2,000 million of which remains to be paid at 31 December, 2017. This was not factored into our Plan and was the main reason for the $2,119 million (1%) decrease in our total assets, $2,152 million (1%) increase in our total liabilities and $4,271 million (19%) decrease in our total equity of Canada.
| | | | |
| 2017 ANNUAL REPORT | | | | 19 |
PERFORMANCE BY ACTIVITY
To ensure we achieve our outcomes, we establish performance indicators for our activities related to each of our strategic directions and our core activities.
Our 2017 corporate performance is evaluated based on actual results of the performance indicators from the Summary of CMHC’s 2017-2021 Corporate Plan compared to targets.
For 2017, we achieved two out of three strategic directions and our core activities. The strategic direction “Be a High-Performing Organization” was assessed as partially achieved mostly due to delays in technology and business transformation and under-representation in three out of four employment equity groups.
Within the activity chapters, performance rating is indicated by colour
based on the following:
🌑 Green to indicate that actual meets or is within 2% of target
¨ Yellow to indicate that actual is between 2% and 5% of target
∎ Red to indicate that actual does not meet or is not within 5% of target

| | | | |
| 20 | | | | CANADA MORTGAGE AND HOUSING CORPORATION |
ASSISTED HOUSING
WHAT WE DO
We help Canadians in need gain access to suitable housing they can afford.
HOW WE DO IT
| · | | We receive parliamentary appropriations to fund housing programs; our programs operate on a breakeven basis as appropriations equal expenditures each year | |
| · | | We make loans at below market interest rates and provide non-subsidized housing support to our diverse partners; our lending programs operate on a long-term, breakeven basis to help reduce project operating costs and, in turn, their need for direct subsidies | |
| · | | We collaborate and work with all levels of government, non-profit organizations, private sector companies and First Nation communities across the country | |
PERFORMANCE AGAINST PLAN
OUR GOALS
Canadians in need have access to affordable and suitable housing.
| | | | |
| SHORT TERM OUTCOME (12 MONTHS) | | ACTUAL * | | TARGET * |
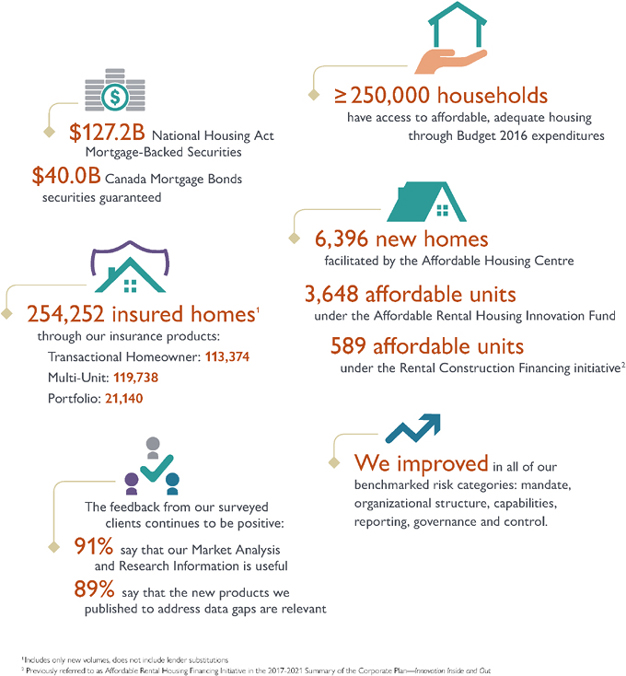
Canadians have improved access to affordable housing through existing programs and implementation of Budget 2016. | | 🌑 32% spending of Budget 2016 funds 1 | | = 100% or $647M for 2017-18 |
| | 🌑 62% spending of housing programs funds for Assisted Housing 1 | | = 100% or $2,476M for 2017-18 |
| | |
| | 🌑 377 new units committed under the On-Reserve Non-Profit Housing Program 1 | | > 852 for 2017-18 |
| | |
| | 🌑 6,396 affordable housing units facilitated by the Affordable Housing Centre | | > 4,300 |
| | |
MEDIUM TERM OUTCOME (2 TO 3 YEARS) | | ACTUAL * | | TARGET * |
Housing providers are able to provide more affordable, adequate housing. | | 🌑 252,367 increase in the number of households that will have access to affordable and adequate housing through 2016 Budget expenditures from April 2016 to December 2017. | | ³ 198,660 by 2017-18 (two year cumulative target) |
More Canadians in need are living in housing that they can afford and that meets their needs. | | | | |
* As of 31 Dec, 2017 (unless otherwise stated).
1 For 2017-18 targets that span our fiscal year end, the performance rating is based on expected results at March 31, 2018.
🌑 Figure is shaded green to indicate that actual meets or is within 2% of target.
| | | | |
| 2017 ANNUAL REPORT | | | | 21 |
PERFORMANCE SNAPSHOT
We worked with our partners to deliver on Budget 2016 measures to invest in housing, in addition to existing funding and programs, by:
| · | | delivering social infrastructure investments: | |
| | | | | | | | |
| HOUSING PROGRAM | | $ (MILLIONS) | | | HOUSEHOLDS ASSISTED | |
Investment in Affordable Housing | | | 314.2 | | | | 119,767 | |
Renovation and retrofit (off reserve) | | | 495.0 | | | | 98,635 | |
Affordable housing for seniors | | | 108.4 | | | | 3,611 | |
Shelters for victims of violence | | | 63.0 | | | | 4,720 | |
Northern housing | | | 44.5 | | | | 500 | |
On-reserve programs | | | 59.6 | | | | 2,779 | |
Skills and capacity development (on reserve) | | | 5.5 | | | | 39 | |
| · | | continuing delivery of the Affordable Rental Housing Innovation Fund, which encourages new funding models and innovative building techniques in the rental housing market. As of 31 December 2017, CMHC has committed $33 million under the Innovation Fund to support the creation of 3,700 units, of which 3,648 will be affordable; and | |
| · | | delivering on Budget 2016: we launched the Rental Construction Financing Initiative (RCFi) that provides low-cost insured loans to housing developers, non-profit organizations and municipalities during the earliest stage of rental development. As of 31 December, 2017, CMHC committed $142.6 million under the RCFi to support the creation of 627 units, of which 589 will be affordable. | |
OTHER DEVELOPMENTS
| · | | We took a closer look at the way programs are delivered to First Nation’s communities, including capacity and skills development training, to tailor them to better meet specific needs of those communities and improve upon existing social housing. | |
| · | | We continued to support the goal of Indigenous autonomy, control and self-determination for housing programs and outcomes with our First Nation partners. This has resulted in year-over-year improvements in overall satisfaction on our performance among on-reserve housing managers. | |
| · | | We developed a response and action plan to address recommendations stemming from the National Housing Act Section 95 Housing Program evaluation for on-reserve First Nation communities. | |
| · | | We also managed assets transferred from the Federal Co-operative Housing Stabilization Fund (Fund) since the termination of its Indenture of Trust in April 2010. The assets transferred from the Fund are available to assist co-ops with an index-linked mortgage (ILM) in financial difficulty. Transferred mortgage receivables under administration during the year decreased from $44.1 million to $44.0 million at year end. Other assets transferred from the Fund to us that are available to assist ILM co-ops in financial difficulty were $37.2 million at year end, which included $0.8 million in restricted funds for loan commitments approved but not yet advanced. | |
MANAGING OUR RISKS
REPUTATIONAL RISK
Changing economic conditions have resulted in increased scrutiny on the role that CMHC and the Government play in social housing and the housing market, and the effectiveness of current policies. We undertake a number of proactive strategies and approaches to engage or inform our stakeholders, including advising the Government on options for social housing.
CREDIT RISK
The estimated fair value of loans arising from the Lending programs is $7.9 billion on an outstanding balance of $7.1 billion as at 31 December 2017.
As part of our credit risk management process, we regularly examine annual project level reports, including audited financial statements submitted by social housing project sponsors. These reports enable us to detect potential problems
| | | | |
| 22 | | | | CANADA MORTGAGE AND HOUSING CORPORATION |
and intervene, as appropriate, should a project face financial difficulty. Workouts or restructurings, which may involve additional financing or assistance, are determined on a case-by-case basis.
As at 31 December 2017, we are assured full collection of principal and accrued interest on 76% of our loans (2016 – 77%). The remaining 24% of loans (largely under the Municipal Infrastructure Lending Program) are assessed on a regular basis to determine if provisions for loss are necessary.
MARKET RISK
Prepayment risk exists on approximately 6.52% of CMHC’s loans. To evaluate the Corporation’s exposure to this risk, an analysis is performed to estimate the financial impact of CMHC receiving principal ahead of schedule and having to re-invest the funds in today’s investment (interest rate) environment.
CMHC mitigates exposure to interest rate risk in the loan portfolios by hedging using interest rate swaps, and cash flow matching. As at 31 December 2017, 98% of CMHC’s loan portfolio is hedged or matched funded.
Our risk management policies specify that the maximum exposure of the financing margin to interest rate movements with a confidence level of 95% be fixed at $1.5 million over a 12-month horizon. At 31 December 2017, the sensitivity of net interest income to interest rate movements was $1.2 million.
FINANCIAL RESULTS
The following developments contributed to our financial results:
RENTAL CONSTRUCTION FINANCING
In April 2017, we launched the Rental Construction Financing Initiative (RCFi) that will provide $2.5 billion in low-cost loans to support the construction of new rental housing. The initiative was announced as part of Budget 2016 and is expected to fund the construction of 10,000 new rental housing units in Canada. It will provide up to $625 million in loans each year for four years to encourage the development of new rental housing by municipalities, private sector developers and builders and non-profit housing providers.
The Initiative is designed such that we will hold the loans for a period of 10 years, at which point the borrower will need to arrange financing with a CMHC-approved lender. The loans will not be prepayable and we will fund the loans with borrowings from the Government. The loans and the related borrowings, once issued, are reflected in Lending programs of our Assisted Housing activity.
The loans will carry CMHC insurance for the full duration of the amortization period, which could be up to 50 years. The insurance premiums will be received through housing appropriations while applicable provincial sales taxes will be payable by the borrower. Premiums received, earned, and insurance claims and related liabilities are reflected in the Mortgage Loan Insurance Activity.
CAPITAL MANAGEMENT
We maintain a reserve fund pursuant to Section 29 of the CMHC Act. A portion of the Lending program’s earnings are retained in this reserve fund as part of our strategy to address interest rate and credit risk exposure on our loans. Unrealized fair value market fluctuations as well as remeasurement losses on defined benefit plans are absorbed in retained earnings.
We do not hold capital for Housing programs, as this activity does not present risks to the Corporation that would require capital to be set aside.
Refer to the Consolidated Financial Statements note 10—Capital Management for complete disclosure on capital management.
|
ENVISIONING a place to call home |
SUPPORTING CANADIANS IN NEED |
Anca Sultana, director of the Centre Mechtilde, has had the opportunity to reflect proudly on her organization’s accomplishments. The Gatineau, Quebec, centre has been providing shelter and safety for women and their children since 1979. Supported in part by the Social Infrastructure Fund, the group is now breaking ground on a unique project. The centre will deliver 31 transitional housing units and the rejuvenated building will open in the spring of 2018. The affordable units will provide safe housing for women facing homelessness and single mothers experiencing family violence. “Transitional homes help women regain their autonomy and build their self-confidence to prepare them for what’s ahead,” says Anca. “There’s collaboration between residents supporting one another and staff offering knowledge and coaching.” Collaboration is at the heart of the Centre Mechtilde and will be key to further address the needs of women and girls across the country. The National Housing Strategy recognizes that women and girls are disproportionately impacted by housing need. At least one third of investments will go to projects for women, girls, and their families, in recognition of their unique needs. |
| | | | |
| 2017 ANNUAL REPORT | | | | 23 |
FINANCIAL ANALYSIS
| | | | | | | | |
| (IN MILLIONS) | | 2017 | | | 2016 | |
Net interest income | | | 13 | | | | 13 | |
Parliamentary appropriations for housing programs | | | 3,229 | | | | 2,153 | |
Other income 1 | | | 113 | | | | (22) | |
Total revenues | | | 3,355 | | | | 2,144 | |
Housing programs expenses | | | 3,229 | | | | 2,153 | |
Operating expenses | | | 27 | | | | 17 | |
Total expenses | | | 3,256 | | | | 2,170 | |
Income before income taxes | | | 99 | | | | (26) | |
Income taxes | | | 19 | | | | (12) | |
Net income (loss) | | | 80 | | | | (14) | |
1 Other income includes net gains (losses) on financial instruments.
Total revenues increased by $1,211 million (56%) while total expenses increased by $1,086 million (50%) mainly due to higher parliamentary appropriations for housing programs, $1,075 million of which was increased spending related to new initiatives under Budget 2016.
Other income increased by $135 million (614%) primarily from a $74 million increase in unrealized gains following the revaluation of investment properties. Furthermore, in 2016, we incurred a $51 million realized loss recognized on changes to estimated cash flows on borrowings—other financial liabilities, resulting from planned principal prepayment while net gains on financial instruments in 2017 were nil.
FINANCIAL CONDITION
| | | | | | | | |
| (IN MILLIONS) | | 2017 | | | 2016 | |
Total assets | | | 9,949 | | | | 11,172 | |
Total liabilities | | | 9,715 | | | | 10,976 | |
Total equity of Canada | | | 234 | | | | 196 | |
Total assets have decreased by $1,223 million (11%) primarily due to net repayments on current Lending programs but are expected to grow in future years under RCFi and NHS initiatives. Proceeds received from repayments and our investment activities were used primarily to repay matured Government Borrowings leading to a decrease of $1,261 million (11%) in liabilities.
| | | | |
| 24 | | | | CANADA MORTGAGE AND HOUSING CORPORATION |
REPORTING ON USE OF APPROPRIATIONS
The following table reconciles the amount of appropriations authorized by Parliament as available to us during the Government’s fiscal year (31 March) with the total amount recognized by us in our calendar year.
| | | | | | | | |
| (IN MILLIONS) | | 2017 | | | 2016 | |
Amounts provided for housing programs: | | | | | | | | |
Amounts authorized in 2016/17 (2015/16) | | | | | | | | |
Main estimates | | | 2,028 | | | | 2,026 | |
Supplementary estimates A 1,2 | | | 1,070 | | | | – | |
Supplementary estimates B 1,2 | | | 78 | | | | – | |
Less: Portion recognized in calendar 2016 (2015) | | | (1,563) | | | | (1,419) | |
Less: Appropriations lapsed for 2016/17 3 (2015/16) | | | (47) | | | | (17) | |
2016/17 (2015/16) portions recognized in 2017 (2016) | | | 1,566 | | | | 590 | |
Amounts authorized in 2017/18 (2016/17) | | | | | | | | |
Main estimates | | | 2,735 | | | | 2,028 | |
Supplementary estimates A 1,2,4 | | | 41 | | | | 1,070 | |
Supplementary estimates B 1,2,5 | | | 1 | | | | 78 | |
Supplementary estimates C 1,5 | | | 1 | | | | – | |
Total fiscal year appropriations | | | 2,778 | | | | 3,176 | |
Less: Portion to be recognized in subsequent quarters | | | (1,089) | | | | (1,566) | |
Forecasted lapse for 2017/2018 6 (Actual lapse in 2016/2017 3) | | | (26) | | | | (47) | |
2017/18 (2016/17) portions recognized in 2017 (2016) | | | 1,663 | | | | 1,563 | |
Total appropriations recognized—twelve months ended 31 December | | | 3,229 | | | | 2,153 | |
1 Supplementary estimates are additional appropriations voted on by Parliament during the Government‘s fiscal year.
2 Budget 2016 provided funding over two years for investments in social infrastructure, as well as funding over five years for a new Affordable Rental Housing Innovation Fund. Years one and two of these investments are reflected within the 2016-17 and 2017-18 appropriations.
3 Included in our lapse for fiscal year 2016/17 of $47 million was a frozen allotment in the amount of $35 million to reflect the transfer of delivery of the Inuit Housing Funding from CMHC to Indigenous and Northern Affairs Canada. When netted against this frozen allotment, CMHC’s actual lapse was $12 million.
4 Budget 2016 provided funding over four years to support the delivery of the RCFi, while Budget 2017 provided for three years of new funding in support of CMHC’s existing Housing Internship Initiative for First Nations and Inuit Youth program. Funding for year one for both of these programs is reflected in the 2017-18 appropriations ($37 million and $4 million, respectively).
5 Transfer received from other government departments as a result of in-year reallocation of resources related to the Youth Employment Strategy. This additional funding will be used to support the Housing Internship Initiative for First Nations and Inuit Youth program.
6 Included in our forecasted lapse of $26 million for fiscal year 2017/18 is a frozen allotment in the amount of $15 million to reflect the reduction in CMHC’s authorities due to the expiry of long-term operating agreements for existing social housing programs ($13 million) and the reprofiling of funding under the Investment in Affordable Housing program to fiscal year 2019/20 ($2 million). When netted against this frozen allotment, CMHC’s forecasted lapse is $11 million.
| | | | |
| 2017 ANNUAL REPORT | | | | 25 |
MARKET ANALYSIS AND RESEARCH
WHAT WE DO
We provide accurate and timely evidence-based analysis and insight to support informed decision-making on housing policy matters.
HOW WE DO IT
| · | | We create, interpret and share housing-related information to support informed decision-making by housing policy makers and housing sector stakeholders. | |
| · | | We partner and collaborate with external partners to create and share information. | |
| · | | We undertake research and policy analysis on a range of issues that support a well-functioning housing system, financial stability, and promote housing affordability and choice. | |
PERFORMANCE AGAINST PLAN
OUR GOALS
Canada has a stable, competitive and innovative housing system and Canadians in need have access to affordable and suitable housing.
| | | | | | |
SHORT TERM OUTCOME (12 MONTHS) | | | | ACTUAL * | | TARGET * |
Policy recommendations on the strategic approach and tools needed to fill data gaps are implemented. | | 🌑 | | Policy recommendations were implemented and timelines met including the enhanced partnership with Statistics Canada and the introduction of new quarterly publication on mortgage and credit trends, with two releases in 2017. |
| | |
Government has timely, evidence-based policy advice. | | 🌑 | | Results of evaluations of Investment in Affordable Housing and Section 95 on-reserve non-profit housing programs informed housing policy and program design, including the co-development of the Canada Community Housing Initiative, the Federal/Provincial/Territorial Multilateral Housing Framework and distinctions-based Indigenous strategies under the National Housing Strategy. |
| | | |
| | 🌑 | | 89% of Policy and Research projects and activities on track to meet key milestones | | ³ 85% |
| | | |
Industry and housing stakeholders have timely, relevant information to make informed decisions. | | 🌑 | | 91% of surveyed clients say CMHC information is useful | | ³ 85% |
| | | |
| | 🌑 | | 89% of surveyed clients say new products addressing data gaps are relevant | | ³ 85% |
* As of 31 Dec, 2017 (unless otherwise stated).
● Figure is shaded green to indicate that actual meets or is within 2% of target.
| | |
| MEDIUM TERM OUTCOME (2 TO 3 YEARS) | | INDICATOR |
Comprehensive housing data is available for research, analysis and decision-making. | | Increase in the percentage of surveyed clients saying CMHC information is useful to ³ 90% (from 85%) |
PERFORMANCE SNAPSHOT
We expanded our suite of housing analytics tools and publications by:
| · | | producing user friendly reports and conducting surveys on topics such as mortgage and consumer credit trends, house price spillover effects, and ownership structure in the purpose-built rental market. We also surveyed the motivations of recent home buyers in Vancouver, Toronto and Montreal and finalized a report on escalating house prices in large Canadian cities which was published early in 2018. | |
| | | | |
| 26 | | | | CANADA MORTGAGE AND HOUSING CORPORATION |
| | | | | | |
| | | | ENVISIONING a place to call home |
We increased the availability of reliable housing information and data, and advanced open data solutions by: · partnering with organizations including Statistics Canada and UrbanSim (University of California—Berkeley) to strengthen the availability of housing-related data for Canadians; · enhancing surveys and infrastructure such as the Starts and Completions Survey and the annual estimates of housing stock to release new information not previously reported at national and regional levels. OTHER DEVELOPMENTS · We led the implementation of the National Housing Strategy that culminated in the release of a public policy document Canada’s National Housing Strategy: A place to call home on National Housing Day. The document outlines the principles, individual elements and targets of the NHS. Additionally, the preparation of the NHS drew on a number of CMHC research projects specifically undertaken to inform its development. · We hosted a number of events with participation from national, regional, provincial and municipal organizations, universities, and international experts on topics such as women and housing (the first Pan-Canadian Voice for Women’s Housing Symposium in September 2017, in Toronto) and housing finance (Housing Finance Symposium in October, 2017 in Ottawa). These events position CMHC as an international leader in housing and mark important conversations on housing finance. MANAGING OUR RISKS REPUTATIONAL RISK In order to meet client needs, the information and advice that we provide must be timely, relevant and accurate. A wide range of communication approaches and platforms are used to share information resulting from our market analysis and research. Communications and marketing, including stakeholder and media relations activities, promote CMHC’s knowledge creation and sharing role. Internal and external clients are consulted to ensure our priorities reflect information gaps and policy and research needs. In addition, surveys are conducted to measure the usefulness of our information products. | | | | | | STRENGTHENING OUR PARTNERSHIPS |
| | | | | | As Canada’s authority on housing, we want to make sure that Canadians understand the factors that influence the housing market and help them make informed decisions when looking for a place to call home. We want to have the answers to their questions, and that means getting better data so that we have a complete picture of Canada’s housing markets. In 2017, we signed a memorandum of understanding with Statistics Canada to strengthen our partnership and bring together our expertise to help better identify and address data gaps. We’re also working with Statistics Canada to develop the Canadian Housing Statistics Program (CHSP), which aims to provide detailed, comprehensive data on housing for all of Canada. Together, through the CHSP, we’ve already released data on foreign ownership in Toronto and Vancouver. |
| | | | | | |
| | | | | | |
FINANCIAL RESULTS
| | | | | | | | |
| (IN MILLIONS) | | 2017 | | | 2016 | |
Assisted housing recovery | | | 62 | | | | 56 | |
Mortgage loan insurance recovery | | | 19 | | | | 17 | |
Total revenue | | | 81 | | | | 73 | |
Market analysis | | | 46 | | | | 41 | |
Research | | | 35 | | | | 32 | |
Total expenses | | | 81 | | | | 73 | |
Net income | | | – | | | | – | |
Market analysis and research activities are cost-recovered from revenues from Assisted Housing’s parliamentary appropriations for housing programs, as well as under the Mortgage Loan Insurance Activity.
Total expenses increased by $8 million (11%) in 2017 as we invested additional resources
to support the development of the National Housing Strategy. In addition, we experienced
an increase in operating expenses due to our technology and business transformation initiative.
| | | | |
| 2017 ANNUAL REPORT | | | | 27 |
MORTGAGE LOAN INSURANCE
WHAT WE DO
We provide competitive insurance products and industry-leading client service to support access to housing finance and stability in Canada’s housing and financial markets.
HOW WE DO IT
| · | | We work closely with partners throughout the mortgage industry to help Canadians make informed housing decisions. |
| · | | We offer exclusive support as Canada’s only mortgage loan insurer for multi-unit residential properties. |
OUR PRODUCTS
Transactional homeowner insurance is mandatory for federally regulated lenders in Canada when a homebuyer has less than a 20% down payment and is also available to homebuyers that have more than a 20% down payment. By protecting the lender against borrower default, we allow qualified borrowers to access homeownership at interest rates comparable to those available to buyers with larger down payments.
Portfolio insurance allows for low-ratio residential mortgages (1-4 unit properties) to be gathered into pools and insured for the purpose of creating mortgage-backed securities through CMHC’s securitization programs. Portfolio insurance supports competition in the mortgage lending industry, expanding choice for Canadian homebuyers.
Multi-unit residential insurance protects the lender against borrower default on loans for the construction, purchase and refinancing of multi-unit residential properties (5+ unit properties). We are Canada’s only mortgage loan insurer for multi-unit residential properties and our exclusive support helps ensure that Canadians have access to a range of housing options.

| | |
ENVISIONING a place to call home |
| | | EXPANDING OUR PRODUCTS TO INCREASE AFFORDABLE RENTAL OPTIONS FOR CANADIANS |
| | | Our products and services facilitate access to housing for all Canadians, not just homebuyers. The rental market is an important housing option for approximately 30% of Canadians. It is important for us to address these needs while supporting efforts to grow and preserve the supply of affordable housing. That’s why, in 2017, we launched a series of enhancements to our multi-unit mortgage loan insurance. This included policy changes designed to expand our participation in key rental market segments, including standard rental housing, single room occupancy projects, student housing, retirement homes and supportive housing projects. We also enhanced our flexibilities for affordable housing, introduced greater underwriting flexibilities and revised our premium schedule. These changes have resonated with multi-unit borrowers, who say our support is making a difference and contributing to the financial and social success of all types of residential properties. Additionally, we saw our total number of insured multi-unit volumes increase compared to 2016 and, for the first time in many years, eclipse our transactional homeowner volumes in terms of number of units insured. These changes have helped set the stage for our mortgage loan insurance products to further contribute to helping Canadians meet their rental housing needs. |
| | | | |
| 28 | | | | CANADA MORTGAGE AND HOUSING CORPORATION |
PERFORMANCE AGAINST PLAN
OUR GOALS
Canada has a stable, competitive and innovative housing system.
| | | | | | |
SHORT TERM OUTCOME (12 MONTHS) | | | | ACTUAL * | | TARGET * |
A range of mortgage insurance products and pricing is provided—spanning the spectrum of needs—and CMHC has a presence in all regions throughout the economic lifecycle. | | 254,252 insured homes through our products: 1 Transactional homeowner: 113,374 Multi-unit: 119,738 Portfolio: 21,140 | | For monitoring purposes, no target is set. |
| | | |
| | 🌑 | | 64.9% of applications insured were from first time buyers | | ³ 60% |
| | | |
| | 🌑 | | 13.6% of applications insured were from rural areas | | ³ 13.5% |
| | | |
MEDIUM TERM OUTCOME (2 TO 3 YEARS) | | | | ACTUAL * | | TARGET * |
Access to housing financing is facilitated through evolving services and products in a competitive and profitable mortgage insurance marketplace. | | 67.8% of Canadian households own their homes based on the 2016 Census of Population | | For monitoring purposes, no target is set. |
| | | |
| | 🌑 | | Operating expense ratio at 20.4% | | £ 23.8% (£ 21% by 2020) |
| | | |
| | 🌑 | | Percentage minimum capital required at 184% | | ³ 165% (³ 165% by 2020) |
| | | |
| | 🌑 | | Insurance-In-Force at $480B | | £ $512B |
| | | |
| | | | | | |
| | | |
Canadians have access to competitive mortgage insurance products that span the spectrum of their needs. | | 🌑 | | 64.9% of applications insured were from first time buyers | | ³ 60% (maintain the target in the medium term) |
| | | |
| | 🌑 | | 13.6% of applications insured were from rural areas | | ³ 13.5% (maintain the target in the medium term) |
| | | |
CMHC contributes to the stability of the housing finance system throughout the economic life cycle. | | 🌑 | | Return on capital holding target at 13.6% | | ³ 11% (Return on Required Equity ³ 10.7% by 2020) |
* As of 31 Dec, 2017 (unless otherwise stated).
1 Includes only new volumes, does not include lender substitutions
● Figure is shaded green to indicate that actual meets or is within 2% of target.
PERFORMANCE SNAPSHOT
We repositioned our multi-unit insurance business line and redeveloped our product offering by:
| · | | delivering the biggest package of multi-unit policy and product changes in nearly two decades, enhancing our definition of affordability, and introducing greater underwriting flexibilities and a revised premium schedule. | |
We evolved our mortgage loan insurance products to best serve Canadian borrowers and lenders by:
| · | | making changes to the Handbook for CMHC Approved Lenders to clarify the underwriting and administration of insured loans; | |
| · | | providing new Guaranteed Valuation Services for Lender property risk management through enhancements to the emili Low Ratio Assessment tool, improving available data used for mortgage risk analysis and model development required for future housing risk management solutions; and | |
| · | | adopting the Enhanced Claims Service as a permanent claim operating model, delivering efficiencies and costs savings to our clients. | |
| | | | |
| 2017 ANNUAL REPORT | | | | 29 |
We provided policy advice to the government on the appropriate evolution of our role in housing finance by:
| · | | investigating measures to reduce vulnerabilities associated with high debt levels and rising house prices; | |
| · | | developing an action plan to reduce mortgage fraud in housing finance; and | |
| · | | assessing options for lender risk sharing. | |
OTHER DEVELOPMENTS
| · | | Delivered on Budget 2016 – Launched the Rental Construction Financing Initiative (RCFi) that provides low-cost insured loans to housing developers, non-profit organizations and municipalities during the earliest stage of rental development. The loans and the related borrowings, once issued, are reflected in our Assisted Housing activity. The loans will carry CMHC insurance for the full duration of the amortization period, which could be up to 50 years. The insurance premiums will be received through housing appropriations while applicable provincial sales taxes will be payable by the borrower. Premiums received, earned, and insurance claims and related liabilities are reflected in the Mortgage Loan Insurance Activity. As of 31 December, 2017, CMHC committed $142.6 million under the RCFi to support the creation of 627 units, of which 589 will be affordable. The financial impact of the lending activities is reflected in the Assisted Housing chapter. | |
MANAGING OUR RISKS
STRATEGIC RISK
Our market share is directly linked to the Canadian housing market and is influenced by a number of factors including interest rate trends, house price inflation, the unemployment rate, government regulation and competition within the Canadian housing finance market. Any change in the business environment, including actions by competitors and clients, could result in a change in our market share.
INSURANCE RISK
We assume the risk of loss from borrower default through mortgage insurance contracts entered into with lenders, exposing us to the uncertainty surrounding the timing, frequency and severity of future claims. We assess risks related to insurance for different types of residential properties using either our proprietary automated mortgage loan insurance risk assessment and approval system or a rigorous underwriting process, including a fraud management framework.
CREDIT RISK
We are exposed to credit risk from various sources directly and indirectly, including directly from investment and hedging activities. We mitigate our credit risk exposure through a variety of means including minimum credit rating requirements, issuer/group exposure limits, diversification limits, term restrictions and collateral.
MARKET RISK
We manage market risk through our strategic asset allocation process, which includes consideration of overall risk and return in selecting a specific asset allocation strategy, benchmarks, risk tolerances and controls.
FINANCIAL RESULTS
The following developments contributed to our financial results.
MORTGAGE LOAN INSURANCE PREMIUMS
As part of our 2016 annual review of insurance products, we increased transactional homeowner as well as portfolio mortgage insurance premiums to reflect the higher regulatory capital requirements mandated by OSFI. For the average CMHC-insured homebuyer, the higher transactional premium will result in an increase of approximately $5 to their monthly mortgage payment.
We also revised our premium schedule for multi-unit properties effective 15 May, 2017 to continue to support government efforts to expand and preserve the supply of affordable rental housing in key market segments that address the rental needs of Canadians. These segments include standard rental housing, student housing, single room occupancy projects, retirement homes and supportive housing projects.
| | | | |
| 30 | | | | CANADA MORTGAGE AND HOUSING CORPORATION |
AFFORDABLE RENTAL HOUSING
In addition to the revised premium schedule noted above, we introduced other changes to our multi-unit residential mortgage loan insurance effective 15 May, 2017 to encourage increases in the construction, purchase and refinancing of affordable rental housing options. These changes include greater underwriting flexibilities, such as higher loan-to-value ratios and lower debt coverage ratios.
CAPITAL MANAGEMENT
Our capital management framework follows OSFI regulations with respect to the use of the MCT for insurance companies. Refer to the Consolidated Financial Statements note 10—Capital Management for complete disclosure on capital management.
The table below presents our capital management ratios as at 31 December.
| | | | | | | | |
| (IN PERCENTAGES) | | 2017 | | | 2016 | |
Capital available to minimum capital required (% MCT) | | | 184 | | | | 384 | |
The ratio of capital available to minimum capital required decreased by 200 percentage points due to:
| · | | OSFI’s revised capital advisory for mortgage insurers implemented on 1 January 2017 which resulted in an increase in minimum capital required; and | |
| · | | a decrease in capital available driven by the declaration of $4,675 million in dividends. | |
We remain adequately capitalized as at 31 December 2017.
FINANCIAL METRICS
| | | | | | | | |
| (IN MILLIONS, UNLESS OTHERWISE INDICATED) | | 2017 | | | 2016 | |
Insurance-in-force ($B) | | | 480 | | | | 512 | |
Transactional homeowner | | | 249 | | | | 264 | |
Portfolio | | | 162 | | | | 185 | |
Multi-unit residential | | | 69 | | | | 63 | |
Insured volumes (units) | | | 294,899 | | | | 452,321 | |
Transactional homeowner | | | 113,374 | | | | 156,414 | |
Portfolio 1 | | | 61,787 | | | | 187,200 | |
Multi-unit residential | | | 119,738 | | | | 108,707 | |
Insured volumes | | | 53,569 | | | | 84,275 | |
Transactional homeowner | | | 29,612 | | | | 38,601 | |
Portfolio 1 | | | 12,502 | | | | 37,047 | |
Multi-unit residential | | | 11,455 | | | | 8,627 | |
Premiums and fees received | | | 1,438 | | | | 1,558 | |
Transactional homeowner | | | 996 | | | | 1,166 | |
Portfolio | | | 60 | | | | 91 | |
Multi-unit residential | | | 382 | | | | 301 | |
Claims paid 2 | | | 329 | | | | 377 | |
Transactional homeowner | | | 268 | | | | 316 | |
Portfolio | | | 19 | | | | 23 | |
Multi-unit residential | | | 42 | | | | 38 | |
1 Portfolio volumes have been modified to include Lender substitutions along with new business volumes. Portfolio substitutions were 40,647 units and $7,337 million in 2017 (96,525 units and $12,920 million in 2016)
2 Claims paid does not include social housing mortgage and index-linked mortgage claims.
| | | | |
| 2017 ANNUAL REPORT | | | | 31 |
Insurance-in-force decreased by $32 billion (6%) due to lower volumes insured in the current year compared to recent years, and run-off of existing policies-in-force. New loans insured were $54 billion, while estimated loan amortization and pay-downs were $86 billion.
Lower transactional homeowner volumes were the result of a decrease in purchase and refinance volumes. This was largely as a consequence of the new regulations announced by the Government. In addition, portfolio volumes were down due to new pricing introduced January 1, 2017 as a result of the increased Capital requirements. In contrast, the increases in multi-unit residential volumes were attributable to more multi-unit residential purchase and refinance transactions mainly because of a continued low interest rate environment.
Total premiums and fees received decreased by $120 million (8%). Lower volumes in transactional and homeowner products were partially offset by higher multi-unit residential volumes as discussed above, resulting in an overall decrease in premiums and fees received. Partially offsetting this decrease was the price increases that took effect during the first quarter of 2017.
The decrease in claims paid of $48 million (13%) is primarily due to a reduction in the number of claims for transactional homeowner and portfolio in British Columbia, Ontario, Quebec and the Atlantic region resulting from stronger economic conditions.
| | | | | | | | | | | | | | | | |
| | | 2017 | | | 2016 | |
| | | NO. OF
DELINQUENT
LOANS | | | ARREARS RATE | | | NO. OF
DELINQUENT
LOANS | | | ARREARS RATE | |
Transactional homeowner | | | 5,376 | | | | 0.43% | | | | 6,456 | | | | 0.48% | |
Portfolio | | | 1,362 | | | | 0.13% | | | | 1,563 | | | | 0.13% | |
Multi-unit residential | | | 106 | | | | 0.48% | | | | 94 | | | | 0.43% | |
Total | | | 6,844 | | | | 0.29% | | | | 8,113 | | | | 0.32% | |
The arrears rate includes all loans more than 90 days past due as a percentage of outstanding insured loans. CMHC’s overall arrears rate decreased as a result of the lower delinquencies for the transactional homeowner and portfolio products. New reported delinquencies were lower because of decreases in all regions except Saskatchewan and the Territories which is consistent with the economic trends for these regions.
| | | | | | | | |
| (IN MILLIONS) | | 2017 | | | 2016 | |
Premiums and fees earned | | | 1,557 | | | | 1,505 | |
Investment income | | | 607 | | | | 594 | |
Other income 1 | | | 156 | | | | 58 | |
Total revenues | | | 2,320 | | | | 2,157 | |
Insurance claims | | | 147 | | | | 334 | |
Operating expenses | | | 318 | | | | 256 | |
Total expenses | | | 465 | | | | 590 | |
Income before income taxes | | | 1,855 | | | | 1,567 | |
Income taxes | | | 451 | | | | 384 | |
Net income | | | 1,404 | | | | 1,183 | |
1 Other income includes net gains (losses) on financial instruments and other income.
Premiums and fees earned increased by $52 million (3%) primarily due to higher premiums received in previous years being earned over time. This increase was partially offset by a revision to the earning patterns in the fourth quarter of 2017, which reflects emerging claim experience for transactional homeowner insurance over recent years.
Other income increased by $98 million (169%) mainly from net realized gains on the sale of investments securities as we rebalanced our portfolio to align with our investment policy.
| | | | |
| 32 | | | | CANADA MORTGAGE AND HOUSING CORPORATION |
Insurance claims dropped by $187 million (56%) due to a decrease in policies-in-force and improvements in the unemployment rate throughout Canada. A significant appreciation in house prices, especially in Ontario and British Columbia was also a contributing factor. These stronger economic conditions led to a decrease in incurred claims and a reduction in our incurred but not reported provision. In addition, we reduced our provision for social housing and index-linked mortgages because a decline in outstanding loan balances reduced our exposure. To reflect expected future cash flows, we reduced our allowance on our workout loans.
Operating expenses increased by $62 million (24%) mainly as a result of higher costs from our technology and business transformation initiative.
RATIOS
| | | | | | | | |
| (IN PERCENTAGES) | | 2017 | | | 2016 | |
Loss ratio | | | 9.4 | | | | 22.2 | |
Operating expense ratio | | | 20.4 | | | | 17.0 | |
Combined ratio | | | 29.8 | | | | 39.2 | |
Severity ratio | | | 32.2 | | | | 31.9 | |
Return on equity | | | 8.3 | | | | 6.5 | |
Return on capital holding target | | | 13.6 | | | | 11.6 | |
The loss ratio decreased by 12.8 percentage points primarily because of a decrease in insurance claims and higher premiums and fees earned, as explained above. The operating expense ratio increased by 3.4 percentage points due to higher operating expenses, partially offset by higher premiums and fees earned, as explained above. The combined ratio is the sum of the loss ratio and operating expense ratio and reflects the variation in each.
The return on equity increased by 1.8 percentage points due to higher net income and lower capital base as a result of the return of excess capital to the Government through our dividend payments.
The return on capital holding target increased by 2.0 percentage points mainly due to higher adjusted net income.
FINANCIAL CONDITION
| | | | | | | | |
| (IN MILLIONS) | | 2017 | | | 2016 | |
Cash, cash equivalents, investment securities and derivatives | | | 23,042 | | | | 25,300 | |
Accrued interest receivable | | | 140 | | | | 149 | |
Investment properties, accounts receivable and other assets | | | 667 | | | | 616 | |
Total assets | | | 23,849 | | | | 26,065 | |
Securities sold under repurchase agreements | | | 297 | | | | 704 | |
Accounts payable and other liabilities and derivatives | | | 114 | | | | 113 | |
Dividend payable | | | 2,000 | | | | – | |
Provision for claims | | | 555 | | | | 654 | |
Unearned premiums and fees | | | 5,352 | | | | 5,472 | |
Defined benefit plans liability | | | 266 | | | | 226 | |
Deferred income tax liabilities | | | 68 | | | | 80 | |
Total liabilities | | | 8,652 | | | | 7,249 | |
Total equity of Canada | | | 15,197 | | | | 18,816 | |
Cash, cash equivalents, investment securities and derivatives decreased by $2,258 million (9%) to fund our dividend payments. Investment properties, accounts receivable and other assets increased by $51 million (8%) primarily due to the reduction of the allowance on our workout loans.
| | | | |
| 2017 ANNUAL REPORT | | | | 33 |
During 2017, we started declaring dividends to return excess capital to the Government. At 31 December 2017, $2,000 million of the $4,000 million special dividend remains to be paid to the Government.
Securities Sold Under Repurchase Agreements decreased by $407 million (58%) as a result of a decrease in repo market investment opportunities. We enter into repo transactions to generate additional income.
Provision for claims decreased by $99 million (15%) because of a reduction in policies in force and stronger economic conditions, which led to an improvement in arrears and a decline in our incurred but not reported and social housing and index-linked mortgages provision. Unearned premiums and fees went down by $120 million (2%) primarily attributable to lower premiums and fees received in 2017.
Total equity of Canada decreased by $3,619 million (19%) following the declaration of $4,675 in dividends to the Government partially offset by net income of $1,404 million in 2017.
FINANCIAL OUTLOOK
On 19 October 2017, OSFI released a revised Minimum Capital Test (MCT) Guideline (the new MCT Guideline) for federally regulated property and casualty insurers with an effective date of 1 January 2018. The new MCT Guideline removes requirements that are no longer applicable. It also aligns the terminology and with examples to the quarterly statutory returns for consistency.
We do not expect a material impact to our capital position in the Mortgage Loan Insurance activity as a result of the new MCT Guideline.

| | | | |
| 34 | | | | CANADA MORTGAGE AND HOUSING CORPORATION |
SECURITIZATION
WHAT WE DO
We enable approved financial institutions to pool eligible mortgages into marketable securities that can be sold to investors to generate funds for residential mortgage financing. We also guarantee the timely payment of interest and principal of these securities.
We also administer the Canadian registered covered bond programs legal framework on behalf of the Government of Canada, which is another source of mortgage funding.
HOW WE DO IT
| · | | We deliver the National Housing Act Mortgage-Backed Securities (NHA MBS) program. | |
| · | | We provide lenders with a reliable source of mortgage financing through the Canada Housing Trust. | |
| · | | We oversee the Canadian registered covered bond programs legal framework and operate it on a cost recovery basis. | |
OUR PRODUCTS
| · | | National Housing Act Mortgage-Backed Securities—The NHA MBS program provides mortgage financing for approved financial institutions by transforming insured residential mortgages into marketable securities. Investors in these securities receive principal and interest payments that are guaranteed by CMHC and therefore backed by the Government. | |
| · | | Canada Mortgage Bonds (CMB)—The Canada Housing Trust (CHT) provides lenders with a reliable source of mortgage financing by selling CMB to investors and using the proceeds to purchase newly issued NHA MBS. The CHT collects the monthly cash flows of the underlying NHA MBS mortgages and converts these into fixed interest payments and principal at maturity. The timely payment of interest and principal is guaranteed by CMHC and therefore backed by the Government. | |
| · | | Legal framework for Canadian registered covered bond programs—Covered bonds contribute to a stable and well-functioning housing finance system by enabling lenders to access an additional, non-government backed, source of funding. We are responsible for the administration of the Canadian registered covered bond programs legal framework and operate it on a cost recovery basis. | |

| | | | |
| 2017 ANNUAL REPORT | | | | 35 |
PERFORMANCE AGAINST PLAN
OUR GOALS
Canada has a stable, competitive and innovative housing system.
| | | | | | | | | | | | |
SHORT TERM OUTCOME (12 MONTHS) | | ACTUAL * | | | | TARGET * | | | |
| Issuers and lenders have stable sources of funding for mortgage lending. | | 🌑 Return on Required Capital at 15.1% 🌑 Operating Expense Ratio at 10.8% | | | | ³ 14.0% 1 £ 12.3% | |
| | A broad range of lenders across Canada issue NHA MBS and CMB, highlighting the accessibility of our programs as a stable source of mortgage lending. | | | | | |
| | | |
| | | SECURITIES GUARANTEED DURING
YEAR | | | | SECURITIES GUARANTEED | |
Enhanced access to liquidity by
better aligning with other government agencies and
departments. | | (IN MILLIONS OF DOLLARS) | | 2017 ACTUAL | | | | SECURITIES GUARANTEED | | 2017 TARGET | |
| | Total guaranteed ($M) | | 167,231 | | | | Total guaranteed ($M) | | | 170,000 | |
| | NHA MBS | | 🌑 127,231 | | | | NHA MBS | | | ³ 95% of 130,000 | |
| | CMB | | 🌑 40,000 | | | | CMB | | | ³ 95% of 40,000 | |
| | NHA MBS ($M) | | 127,231 | | | | | | | | |
| | Federally regulated institutions | | 84,130 | | | | | | | | |
| | Provincially regulated institutions | | 13,202 | | | | | | | | |
| | Investment Industry Regulatory Organization of Canada (IIROC)regulated institutions | | 16,940 | | | | | | | | |
| | Other institutions | | 12,959 | | | | | | | | |
| | CMB ($M) | | 40,000 | | | | | | | | |
| | Federally regulated institutions | | 23,208 | | | | | | | | |
| | Provincially regulated institutions | | 6,939 | | | | | | | | |
| | IIROC regulated institutions | | 7,155 | | | | | | | | |
| | Other institutions | | 2,698 | | | | | | | | |
MEDIUM TERM OUTCOME (2 TO 3 YEARS) | | INDICATORS * | |
| Issuers and lenders rely less on government-backed sources of funding through the introduction of alternative product structures. | | See performance snapshot for further information. The following breakdown of funding sources further demonstrates the importance of our current programs in ensuring the supply of mortgage funding: | |
| | | | | | | | | | | | | | | | | | | | | | | | |
| | | LARGE BANKS | | | OTHER
MORTGAGE
LENDERS | | | ALL MORTGAGE
LENDERS | |
| (IN PERCENTAGES) | | 2016 | | | 2017 | | | 2016 | | | 2017 | | | 2016 | | | 2017 | |
CMHC Securitization | | | 24% | | | | 22% | | | | 47% | | | | 55% | | | | 30% | | | | 31% | |
| | | | | | |
Covered Bonds | | | 12% | | | | 12% | | | | 2% | | | | 1% | | | | 9% | | | | 9% | |
| | | | | | |
Other funding sources | | | 64% | | | | 66% | | | | 51% | | | | 44% | | | | 61% | | | | 60% | |
* As of 31 Dec, 2017 (unless otherwise stated).
1 Target was revised to reflect changes in capital requirements.
· Figure is shaded green to indicate that actual meets or is within 2% of target.
| | | | |
| 36 | | | | CANADA MORTGAGE AND HOUSING CORPORATION |
PERFORMANCE SNAPSHOT
We developed policy options to diversify financing sources for mortgage lending.
| · | | In 2017, we shifted our focus from developing policy options to reduce reliance on government-backed sources of funding. We focused instead on enhancing our risk management practices and monitoring the impacts of the Government’s guarantee parameters for insured mortgages on the eligibility of mortgages for CMHC’s Securitization program. This shift was made in consideration of recent market events and the legislative changes in the mortgage loan insurance eligibility criteria. |
Developed policy options for Securitization to reduce risk to catastrophic events.
| · | | CMHC is no longer leading this initiative and will provide support to the Government of Canada as needed. |
MANAGING OUR RISKS
REPUTATION RISK
With our role in administering the Canadian Covered Bond Legal Framework, there is the risk that we may be perceived as providing an indirect guarantee or support of Legal Covered Bond programs. The Covered Bond Legal Framework has been structured to minimize the potential perception that CMHC and the Government provide any kind of guarantee to covered bond investors.
GUARANTEE RISK
We guarantee the timely payment of interest and principal of NHA MBS issued by Approved Issuers and of CMB issued by CHT. Our major risk of financial loss arising from the guarantee is making timely payments when an issuer is unable to honour its commitments and the assets backing the securities are insufficient to cover the payments CMHC may be required to make as part of the guarantees provided.
Guarantee risk is concentrated in a relatively small number of MBS issuers and swap counterparties. We have measures in place that include limits on volumes, eligibility requirements for participants and mortgages to be securitized, and triggers to affect additional mitigating actions should a participant’s credit quality deteriorate.
CREDIT RISK
In the context of the Securitization investment portfolio, there is limited associated credit risk as investments are mostly held in Government securities. For CHT repos and swaps, credit risks are mitigated through a series of measures that include, but are not restricted to, exposure limits, use of internal and external credit ratings, collateral backing, recourse to assets, and program requirements.
MARKET RISK
For the CMB program, CHT is exposed to interest rate risk stemming from the possibility that the rate of interest earned on NHA MBS and eligible investments will not be sufficient to meet its interest obligations on the CMB issues. This risk is managed through interest rate swaps with approved swap counterparties. The swaps effectively transform the interest rate risk (i.e. prepayment and reinvestment risk) associated with the assets held by CHT into counterparty risk, which is managed through our credit policies and controls. Therefore, CHT would only be exposed to interest rate risk if a swap counterparty were to default and CHT was unable to find a suitable swap replacement.
LIQUIDITY RISK
As a result of the NHA MBS and CMB programs, CMHC faces liquidity risk in the event of a call on the timely payment guarantee. A potential liquidity call under the timely payment guarantee is contingent on the performance of participants and service providers in the Securitization programs to meet their obligations. The liquidity risk is mitigated with risk management policies, liquid assets and liquidity management processes, minimum standards for participants, the collection of collateral, and legal and operational frameworks.
ENVISIONING
a place to call home
|
MANAGING RISKS TO SUPPORT ACCESS TO AFFORDABLE FUNDING |
Our securitization programs and covered bond framework are responsible for approximately 40% of all outstanding residential mortgage credit in Canada. Our programs provide funding to financial institutions so that Canadians have more choice and mortgage options when it comes time to finding a place to call home. Our securitization programs are also key to the stability of Canada’s housing finance system. Managing these programs responsibly is something we take very seriously! In 2017, developments in certain areas of the market caused concern around the stability of Canada’s housing finance system. Important improvements we’ve made to our risk management processes in recent years ensure that we are ready and willing to support the ongoing stability of Canada’s financial system should it be needed. We have strengthened the monitoring of program participants to ensure they comply with our program requirements and we are implementing new systems that will enhance our analytics to better assess the performance of the institutions and the underlying mortgages guaranteed by CMHC. We understand the importance of our securitization programs in helping Canadians access mortgage financing which is what drives us to continuously seek improvements to our securitization processes. |
| | | | |
| 2017 ANNUAL REPORT | | | | 37 |
FINANCIAL RESULTS
The following developments contributed to our financial results.
INTRODUCTION OF CHANGES TO LOAN AND POOL PARAMETERS
UNDER THE NHA MORTGAGE-BACKED SECURITIES (MBS) PROGRAM
We introduced revised loan and pool parameters under the NHA MBS Program consisting of the removal of the following pooling requirements: (a) $2 million minimum pool size requirement, (b) the requirement that a single loan may not exceed 25% of total aggregate principal amount of the pool and (c) the restriction on the loans’ remaining amortization provided the pool principal at issuance does not exceed $15 million. The changes, effective 1 October 2017, were introduced to allow enhanced flexibility for the pooling of loans with less common terms.
EXPANDED ELIGIBILITY CRITERIA FOR APPROVED ISSUER STATUS
UNDER THE NHA MBS PROGRAM
We introduced changes to eligibility requirements applicable to entities seeking to obtain Approved Issuer status under the NHA MBS Program, including revised documentation requirements and removal of the Approved Lender requirement for non-regulated entities. The policy changes took effect on 1 September, 2017 and apply to Issuer applications approved after this date.
NEW ADMINISTRATION FEE APPLICABLE TO ISSUERS’ UNUSED ANNUAL
NHA MBS GUARANTEE ALLOCATION
We introduced a 0.01% administration fee that will be assessed against a portion of an issuer’s unused NHA MBS guarantee allocation beyond a specified threshold. The policy took effect on April 1, 2017 and applies to unused allocations. The new fee will better align requested guarantees with actual NHA MBS funding needs of issuers and smooth out the allocation of NHA MBS guarantees throughout the year.
CAPITAL MANAGEMENT
Our capital management framework for our Securitization activity follows industry best practices and incorporates regulatory principles from OSFI, including those set out in OSFI’s E19—Own Risk and Solvency Assessment (ORSA) guideline, and those of the Basel Committee on Banking Supervision.
Our capital adequacy assessment uses an integrated approach to evaluate our capital needs from both a regulatory and economic capital basis to establish capital targets that take into consideration our strategy and risk appetite. Refer to the Consolidated Financial Statements note 10—Capital Management for complete disclosure on capital management.
The table below presents our capital management ratios as at 31 December.
| | | | | | | | |
| | | 2017 | | | 2016 | |
Capital available to capital required | | | 135% | | | | 100% | |
Return on required capital | | | 15.1% | | | | 13.5% | |
Our capital available to capital required is 35% higher than in 2016 due to the combined effect of an increase in available capital and a decrease in our required capital. Our available capital increased as we reinvested our net income while our required capital decreased as we rebalanced our investment securities portfolio towards shorter durations following the implementation of our revised strategic asset allocation for the Securitization activity.
Our actual return on required capital of 15.1% was 1.6% higher than 2016 mainly due to the increase in adjusted net income for the year.
| | | | |
| 38 | | | | CANADA MORTGAGE AND HOUSING CORPORATION |
FINANCIAL METRICS
| | | | | | | | |
| (IN MILLIONS, UNLESS OTHERWISE INDICATED) | | 2017 | | | 2016 | |
Total guarantees-in-force ($B) | | | 477 | | | | 452 | |
NHA MBS | | | 244 | | | | 229 | |
CMB | | | 233 | | | | 223 | |
Securities guaranteed | | | 167,231 | | | | 144,433 | |
NHA MBS | | | 127,231 | | | | 104,433 | |
CMB | | | 40,000 | | | | 40,000 | |
Guarantee and application fees received | | | 627 | | | | 579 | |
MBS guarantee and application fees received | | | 479 | | | | 409 | |
CMB guarantee fees received | | | 148 | | | | 170 | |
Guarantees-in-force increased by $25 billion (6%) as a result of new guarantees issued during the year exceeding maturities. Guarantees-in-force are projected to continue increasing until the year 2019, as new guarantees exceed maturities, and decrease in the years 2020 and 2021 when maturities exceed new guarantees. Guarantees-in-force will remain under the $600 billion legislative limit.
Guarantee and application fees received increased by $48 million (8%) due to the introduction of fees on NHA MBS sold to CHT for all CMB series after 1 July 2016, which also resulted in an increase of the authorized limit for guaranteed NHA MBS to $130 billion from $105 billion. Partially offsetting the increase was the decrease in CMB guarantee fees effective on the same date.
| | | | | | | | |
| (IN MILLIONS, UNLESS OTHERWISE INDICATED) | | 2017 | | | 2016 | |
Net interest income | | | 8 | | | | 9 | |
Premiums and fees earned 1 | | | 384 | | | | 284 | |
Investment income | | | 48 | | | | 43 | |
Other income 2 | | | 5 | | | | 8 | |
Total revenues | | | 445 | | | | 344 | |
Operating expenses | | | 51 | | | | 46 | |
Total expenses | | | 51 | | | | 46 | |
Income before income taxes | | | 394 | | | | 298 | |
Income taxes | | | 99 | | | | 74 | |
Net income | | | 295 | | | | 224 | |
Operating expense ratio 3 | | | 10.8% | | | | 12.6% | |
Return on equity | | | 13.4% | | | | 11.3% | |
1 Securitization activity is comprised of guarantee and application fees earned.
2 Other income includes net gains (losses) on financial instruments.
3 Calculated based on Securitization results and excludes CHT and covered bond activities.
Total revenues increased by $101 million (29%) primarily due to the higher guarantee fees earned as a result of higher guarantee fees received in recent years. Guarantee fees received have increased since 1 July 2016, for the reasons noted above, as well as due to price increases which came into effect on 1 April 2015. Guarantee fees earned are expected to continue increasing in future years as fees received in recent years are recognized into revenue over the expected life of the NHA MBS or CMB. Net income increased by $71 million (32%) primarily due to the increase in premiums and fees earned.
FINANCIAL OUTLOOK
UPDATE TO THE NHA MBS GUARANTEE FEES AND THRESHOLD FOR THE
TIER 2 FEE SCHEDULE
Effective 1 January 2018, we will increase the threshold for the Tier 2 guarantee fees to $9 billion from $8.5 billion. Annual NHA MBS guaranteed above the threshold per lender will be subject to the higher, Tier 2 fees. In addition, we are also increasing the NHA MBS guarantee fees across all NHA MBS terms within the Tier 2 schedule. These changes are made in support of the Government’s efforts to encourage the development of alternative funding options in the private market.
| | | | |
| 2017 ANNUAL REPORT | | | | 39 |
PEOPLE AND PROCESSES
WHAT WE DO
We work together and tailor our processes to achieve our strategic directions and outcomes for Canadians.
Our people and processes support the achievement of results for Canadians.
HOW WE DO IT
| · | | We ensure that CMHC is a dynamic, forward-thinking organization that manages risk skillfully and embraces change. | |
| · | | Our people activities support an innovative and high-performing culture with talent management and compensation strategies that help us recruit, acquire and retain a diverse and talented workforce. | |
| · | | We empower our people to innovate and make decisions based on shared values. | |
| · | | We support employees’ growth and leadership development and align talent to meet business needs. | |
| · | | We manage our finances with the utmost responsibility and transparency on behalf of all Canadians. | |
| · | | We use technology to enable our work, reduce our overhead and increase efficiency. | |
WHERE WE ARE LOCATED
We have 1,900 employees, with offices in Vancouver, Calgary, Toronto, Ottawa, Montréal and Halifax.
HUMAN RESOURCES
PERFORMANCE AGAINST PLAN
| | | | | | | | |
| | | 2017 | |
| PERFORMANCE INDICATORS | | ACTUAL | | | TARGET | |
Employee Engagement score | | 🌑 | 79% | | | ³ | 80% | |
Accountability Index score | | ∎ | 62% | | | ³ | 70% | 2 |
Effectiveness index score | | ∎ | 60% | | | ³ | 80% | 2 |
Innovation Index score | | ∎ | 62% | | | ³ | 70% | 2 |
Representation rates of Indigenous People | | ∎ | 2.5% | | | ³ | 2.8% | |
Representation rates of visible minorities | | 🌑 | 22.7% | | | ³ | 22.1% | |
Representation rates of persons with disabilities | | ∎ | 3.4% | | | ³ | 3.7% | |
Representation rates of women in senior leadership 1 | | ∎ | 43.2% | | | ³ | 54.4% | |
1 Management Committee and National Leadership Team. The 2017 target is based on labour market availability of women for jobs that are comparable to jobs at CMHC.
2 Indexes are a composite of metrics; 2017 targets have been revised to reflect new metrics introduced to the indexes.
🌑 Figure is shaded green to indicate that actual meets or is within 2% of target.
∎ Figure is shaded red to indicate that actual does not meet or is not within 5% of target.
Over the past year we have made excellent progress in our journey towards creating an organization where all employees feel valued and included and, have a voice. However, there is still work to do.
Accountability index score: The employee engagement survey uses an “effectiveness profile” to assess the effectiveness of the overall employee population by plotting survey responses related to engagement and enablement. Employees who are highly engaged and highly enabled are categorized as most effective; they feel motivated to go the extra mile, often find meaning in their work and are able to accomplish objectives with few barriers. Those who reported low engagement and low enablement are categorized as least effective; they may feel disconnected, spending time doing work they don’t find meaningful and regularly encountering barriers to getting things done.
The results for 2017 were lower than expected and can be attributed to an increase in the “least effective employee” rates as well as lower than expected “immediate supervisor score” rates. A good supervisor-supervisee relationship is not only beneficial to the individuals but critical to the success of the organization. We are exploring how our engagement survey data can support the identification of the root causes impacting employee effectiveness, which we believe will lead to more structured and results-oriented action plans.
| | | | |
| 40 | | | | CANADA MORTGAGE AND HOUSING CORPORATION |
Effectiveness index score: Attrition, turnover, core engagement and organizational trust combined provide us with an effectiveness score. The results for 2017 are lower than target due to higher than anticipated employee departures. An increase in retirements in the fourth quarter resulting from changes to benefits and pension pushed attrition higher. This one-time event is not expected to continue and the rate is expected to fall back to target in 2018. New performance indicators have also been introduced to track succession planning.
Innovation index score: CMHC continues to encourage and instill innovation in more deliberate ways to build resiliency to external pressures and better meet the changing needs of our clients. Lower than expected results from the employee engagement survey, particularly related the technology and business transformation pulled this index below target for the year. This is likely due to the fact that we’re still in the early stages of our transformation. But as our technology projects continue to move from development to implementation where impacts are more visible to employees, we would expect the innovation index to improve. Similarly, we are investing additional effort in defining our innovation intention (i.e. innovating with purpose), which again should result in more tangible and visible impacts for employees. Work also continues on refining the innovation index to make it as relevant to measuring CMHC’s innovation endeavours as possible.
Representation rates of Indigenous people: The results for 2017 are lower than expected mainly as a result of contract terminations and retirements, particularly in the third and fourth quarters of the year. We actively engage in the recruitment of Indigenous persons including posting career opportunities to AboriginalLink.com, a website that focuses on reach and communications with Canada’s Indigenous community. We also actively encourage inclusivity in the workplace with recognition of Aboriginal Awareness Week through employee communications.
Representation rates of people with disabilities: Employees are encouraged to confidentially self-identify at any time as a member of an employment equity group which includes persons with disabilities. The results for 2017 are lower than expected and mainly due to retirements in the latter part of the year. We continue to raise awareness of, and reduce the stigma associated with disabilities.
Representation rate of women in senior leadership positions: At CMHC, 60% of our employees are women. However, the representation of women in our workforce declines as seniority levels increase, especially at our director level. We have conducted focus groups to examine the challenges our women are facing to identify tangible opportunities that we can implement in upcoming years to increase interest and facilitate transition to leadership, to ensure that representation of women in senior leadership increases. The results for 2017 are lower than expected as the target setting for this performance indicator took into account women in all leadership positions (manager and up) and not senior leadership positions. This performance indicator has been updated for 2018 to reflect all leadership positions.
PERFORMANCE SNAPSHOT
We engaged, empowered and inspired employees to innovate by:
| · | | conducting research and consulting with employees to create a shared vision for the Future of Work at CMHC; and | |
| · | | launching a dedicated Organizational Change Management function to increase enterprise change maturity, as well as successfully implementing individual change projects. | |
We recruited, acquired and retained a diverse and talented workforce by:
| · | | developing an outreach strategy and a talent acquisition framework to meet our evolving business needs; and | |
| · | | developing a new compensation philosophy to compensate employees at a competitive level. | |
We supported employees’ growth and leadership development and aligned talent to meet business needs by:
| · | | developing a career framework to support performance management, career development and succession planning; | |
| · | | launching a learning platform to support access to talent development opportunities and inspire a culture of continuous learning; and | |
| · | | launching the middle management community’s first leadership training conference to further develop our leadership capability. | |
| | | | |
| 2017 ANNUAL REPORT | | | | 41 |
INFORMATION AND TECHNOLOGY
PERFORMANCE AGAINST PLAN
| | | | | | | | |
| | | 2017 | |
| PERFORMANCE INDICATORS | | ACTUAL | | | TARGET | |
Achievement of the technology and business transformation integrated project plan milestones | | ¨ | 81.3% | | | | ³ 85% | |
Availability of systems for mission critical applications | | 🌑 | 99.9% | | | | ³ 99.8% | |
¨ Figure is shaded yellow to indicate that actual is between 2% and 5% of target.
🌑 Figure is shaded green to indicate that actual meets or is within 2% of target.
The technology and business transformation project (TBT) is CMHC’s plan to modernize our technology and improve the way we work. We want to take advantage of the opportunities technology offers us to ensure we are doing the right work in the right way. It will help us work smarter, so we can focus our efforts on activities that will benefit our clients.
TBT will equip CMHC with state-of-the-art technology, smarter processes, and real-time access to centralized, quality data. We have established four TBT objectives highlighting the ways these initiatives will benefit our business:
| · | | Simplify and Streamline |
| · | | Embrace Agility and Risk |
In 2017, many of our TBT projects were in the early stages of scoping and design. We have created an Experience Map to report on the technology solutions we will be implementing and the ways they will change our work. For this year, 91 TBT targets were achieved out of a planned 112 which includes the early achievement of one 2018 milestone.
The result of scoping and design stages for given projects enabled us to react and ensure the business is in a position to accommodate features and complexities that ultimately are of benefit to CMHC. Setting the right experience for our stakeholders to adapt to new processes, structures, and tools is paramount to our overall success. To ensure quality and business readiness, we shifted 22 TBT milestones by four months from 2017 to 2018.
PERFORMANCE SNAPSHOT
We transformed CMHC into a modern technology-enabled organization by:
| · | | implementing CMHC’s Data and Analytics program, which is transforming the way we use and store our data; and |
| · | | launching new, cloud-based client relationship management and enterprise resources planning tools to replace older back-end systems, help us operate more efficiently, store data more centrally, and inform business decisions. |
ENVISIONING
a place to call home
|
LEARNING FROM OUR CHALLENGES TO BETTER ENABLE OUR PEOPLE |
Like all high-performing organizations, we are continually improving our tools, work environment and structure, making sure our people have what they need to deliver on our mandate. Driven by a mission to satisfy housing “needs”—not wants, we initiated a multi-year program of change for CMHC in September 2014. Since that time, layers of management were removed, operational structures realigned and full technology and business transformation initiated. Our transformation has not been without challenges. For example, a failed software update caused an outage of an important business system this year. Through the tremendous efforts by our Information and Technology and Accenture colleagues, we restored the system. Realizing that we may have missed the mark on certain operating models, this year, we also worked to realign some of our sectors to make sure that our people were in the right places, doing the right job. We demonstrated an ability to revisit our choices and learn from our wrong turns. Importantly, in both cases we talked openly about the failure, shared the lessons learned and made changes where necessary to help us in the future. We will continue to seize on opportunities to learn from events such as these, and from each other. |
| | | | |
| 42 | | | | CANADA MORTGAGE AND HOUSING CORPORATION |
RISK
PERFORMANCE AGAINST PLAN
| | | | | | | | |
| | | 2017 | |
| PERFORMANCE INDICATORS | | ACTUAL | | | TARGET | |
Achievement of model vetting action plans | | 🌑 | 100% | | | | ³ 85% | |
Completion of annual risk management training plan | | 🌑 | Achieved | | | | = 100% | |
CRO sector benchmarking categories show improved results | | 🌑 | Achieved | | | | = 100% | |
CRO sector benchmarking categories match industry standards | | 🌑 | Achieved | | | | ³ 1 | |
🌑 Figure is shaded green to indicate that actual meets or is within 2% of target.
PERFORMANCE SNAPSHOT
We strengthened core risk management capabilities and achieved a pervasive culture of risk awareness/management by:
| · | | advancing our corporate-wide Three Lines of Defense risk governance model through a comprehensive communications and training campaign; | |
| · | | developing a model to define, measure and monitor improvements to our risk culture | |
| · | | enhancing the Corporation’s Risk Appetite Framework to better align with our revised risk strategy and corporate priorities; | |
| · | | integrating a new framework in quarterly risk management reporting and day-to-day business decision making; | |
| · | | enhancing our capabilities to be more agile and granular in risk analytics, including economic capital and stress testing models, model risk-management processes and technologies, and data governance; and | |
| · | | continuing to ensure that our commercial activities are managed in a way that adequately reflects risks to taxpayers and ensuring prudent capital management practices through implementation of a dividend framework. | |
OTHER INTERNAL SERVICES
Our support functions play a pivotal role in ensuring we meet our corporate objectives and strategic directions.
These functions include:
| | |
· Audit and Evaluation | | |
| |
· Regulatory Compliance | | · Public Affairs |
| |
· Finance | | · Corporate Relations |
| |
· Capital Management | | · Legal Services and Corporate Secretariat |
| |
· Actuarial | | · Administration |
PERFORMANCE AGAINST PLAN
| | | | | | | | |
| | | 2017 | |
| PERFORMANCE INDICATORS | | ACTUAL | | | TARGET | |
Achievement of Internal Audit action plans | | 🌑 | 91% | | | | ³ 85% | |
Operating budget expense ratio | | 🌑 | 11.3% | | | | £ 12.5% | |
Revenue per employee | | 🌑 | $2.5M | | | | ³ $2.3M | |
Net income ($M) | | 🌑 | $1,803M | | | | ³ $1,421M | |
Return on equity | | 🌑 | 9.3% | | | | ³ 6.6% | |
🌑 Figure is shaded green to indicate that actual meets or is within 2% of target.
| | | | |
| 2017 ANNUAL REPORT | | | | 43 |
MANAGING OUR RISKS
OPERATIONAL RISK
Operational risk is the risk of loss or other undesirable outcomes resulting from people, inadequate or failed internal processes or systems, or from external events. It includes risks such as cyber, information security, technology failure, outsourcing, fraud, business interruption, and compliance.
Existing and emerging internal and external operational risks are monitored and regularly assessed. CMHC’s resiliency to these risks is tested and controls are continuously improved as required. Currently, the major operational risks at CMHC includes cyber security and risks associated with technology and business transformations.
CMHC’s focus on innovation and business and technology improvements results in dynamic changes to our operating model as we position our businesses for the future. While changes are being implemented, we continue to maintain a proactive approach to risk management in order to anticipate potential issues and protect the integrity and security of our assets.
Also, external threats such as cyber risk and fraud are actively monitored and managed. CMHC continues to make investments in cybersecurity and business continuity management to enhance controls and resilience to threats. In addition to that, employee awareness and readiness programs continue to reinforce the idea that cybersecurity is everyone’s responsibility. Likewise, fraud risk management is an integral part of CMHC’s risk management framework.
To mitigate outsourcing and supplier risk, we apply high quality standards of compliance and risk management to third parties. In 2016, CMHC signed an agreement with Accenture for information technology service delivery and transformation. Business process and change management risks associated with the transformation are being actively managed.

| | | | |
| 44 | | | | CANADA MORTGAGE AND HOUSING CORPORATION |
FUTURE CHANGES TO
ACCOUNTING STANDARDS
The following new standards issued by the International Accounting Standards Board (IASB) and effective in the near future have been assessed as having a possible impact on the Corporation in the future. In addition to the standards discussed below, International Financial Reporting Standard (IFRS) 15—Revenue from contract with Customers, IFRS 16 Leases and International Financial Reporting Interpretations Committee (IFRIC) 23 Uncertainty over Income Tax Treatments are disclosed in the Consolidated Financial Statements note 3—Current and Future Accounting Changes.
IFRS 9, FINANCIAL INSTRUMENTS – EFFECTIVE DATE OF JANUARY 1, 2018
IFRS 9, Financial Instruments (IFRS 9,) replaces International Accounting Standard 39 Financial Instruments: Recognition and Measurement (IAS 39) and will be effective for CMHC beginning 1 January 2018. IFRS 9 addresses the recognition and derecognition, classification and measurement and impairment of financial instruments and hedge accounting. Consequential amendments to IFRS 7, Financial Instruments: Disclosures requiring additional financial instrument disclosures are also effective for CMHC beginning 1 January 2018.
Our transition to IFRS 9 is supported by a formal governance structure comprising a steering committee of senior stakeholders, with key decisions being presented to senior management. The cross-functional project team tasked with implementing IFRS 9 has analyzed our financial instruments and business models and acquired and developed the systems and processes required to report under the new standard.
We will adopt IFRS 9 on January 1, 2018. During 2018 we will not restate our comparative consolidated financial statements as permitted by IFRS 9; rather, a cumulative adjustment to reflect application of the new standard will be made to our consolidated balance sheet as at 1 January 2018. We currently estimate the adoption of IFRS 9 will have an immaterial impact on consolidated equity of Canada and capital levels as at 1 January, 2018.
Refer to the Consolidated Financial Statements note 3—Current and Future Accounting Changes for additional details on our transition to IFRS 9.
IFRS 17, INSURANCE CONTRACTS – EFFECTIVE DATE OF JANUARY 1, 2021
In May 2017, the IASB issued IFRS 17 Insurance Contracts, which will replace IFRS 4 Insurance Contracts. Under IFRS 17, insurance contract liabilities will be calculated as the present value of future insurance cash flows adjusted for risk. The discount rate will reflect current interest rates, which are delinked from the assets held. Contractual service margin will represent the difference between the present value of the risk adjusted cash flows and the premium received at inception and will be released over the coverage period. Should the difference between the premium received and the present value of future cash outflows be negative at inception, the insurance contract would be onerous and the difference would be recorded immediately in income. Furthermore, the unit of account is more granular than under current accounting practices. At a minimum, groups of contracts will need to be separated into annual cohorts, though further disaggregation is permitted and in certain cases required. There will also be a new income statement presentation for insurance contracts and additional disclosure requirements.
We have assembled a multi-disciplinary team dedicated to analyzing and implementing the new accounting standard, and a detailed project plan is in place. We are currently assessing the potential impact of this new standard on our consolidated financial statements.
| | | | |
| 2017 ANNUAL REPORT | | | | 45 |
HISTORICAL INFORMATION
| | | | | | | | | | | | | | | | | | | | |
| | | | | | | | | ACTUAL | | | | | | | |
| (IN MILLIONS) | | 2017 | | | 2016 | | | 2015 | | | 2014 | | | 2013 | |
Consolidated Results | | | | | | | | | | | | | | | | | | | | |
Total assets | | | 267,115 | | | | 259,532 | | | | 252,107 | | | | 248,490 | | | | 270,051 | |
Total liabilities | | | 249,374 | | | | 238,542 | | | | 232,468 | | | | 230,308 | | | | 254,213 | |
Total equity of Canada | | | 17,741 | | | | 20,990 | | | | 19,639 | | | | 18,182 | | | | 15,838 | |
Total revenues | | | 6,152 | | | | 4,625 | | | | 4,636 | | | | 6,199 | | | | 5,141 | |
Total expenses (including income taxes) | | | 4,349 | | | | 3,247 | | | | 3,148 | | | | 3,574 | | | | 3,312 | |
Net income | | | 1,803 | | | | 1,378 | | | | 1,488 | | | | 2,625 | | | | 1,829 | |
Operating budget expense ratio | | | 11.3% | | | | 12.3% | | | | 11.1% | | | | 15.1% | | | | 13.3% | |
Assisted Housing | | | | | | | | | | | | | | | | | | | | |
Parliamentary appropriations for Housing programs expenses | | | 3,229 | | | | 2,153 | | | | 2,049 | | | | 2,010 | | | | 2,071 | |
Net income | | | 80 | | | | (14) | | | | 25 | | | | 52 | | | | 91 | |
Total equity of Canada | | | 234 | | | | 196 | | | | 202 | | | | 191 | | | | 192 | |
Mortgage Loan Insurance | | | | | | | | | | | | | | | | | | | | |
Insurance-in-force ($B) | | | 480 | | | | 512 | | | | 526 | | | | 543 | | | | 557 | |
Total insured volumes 1 | | | 53,569 | | | | 84,275 | | | | 80,447 | | | | 75,376 | | | | 91,518 | |
Premiums and fees received | | | 1,438 | | | | 1,558 | | | | 1,438 | | | | 1,315 | | | | 1,308 | |
Premiums and fees earned | | | 1,557 | | | | 1,505 | | | | 1,592 | | | | 1,688 | | | | 1,754 | |
Claims paid | | | 329 | | | | 377 | | | | 353 | | | | 390 | | | | 423 | |
Insurance claims | | | 147 | | | | 334 | | | | 290 | | | | 328 | | | | 309 | |
Net income | | | 1,404 | | | | 1,183 | | | | 1,264 | | | | 2,374 | | | | 1,507 | |
Arrears rate | | | 0.29% | | | | 0.32% | | | | 0.34% | | | | 0.35% | | | | 0.34% | |
Loss ratio | | | 9.4% | | | | 22.2% | | | | 18.2% | | | | 19.4% | | | | 17.6% | |
Operating expense ratio | | | 20.4% | | | | 17.0% | | | | 13.3% | | | | 14.8% | | | | 12.8% | |
Combined ratio | | | 29.8% | | | | 39.2% | | | | 31.5% | | | | 34.2% | | | | 30.4% | |
Severity ratio | | | 32.2% | | | | 31.9% | | | | 32.0% | | | | 30.1% | | | | 30.9% | |
Return on equity | | | 8.3% | | | | 6.5% | | | | 7.4% | | | | 15.4% | | | | 11.2% | |
Return on capital holding target | | | 13.6% | | | | 11.6% | | | | 12.9% | | | | 23.6% | | | | 14.7% | |
Capital available to minimum capital required (% MCT) | | | 184% | | | | 384% | | | | 354% | | | | 343% | | | | 250% | |
% estimated outstanding Canadian residential mortgages with CMHC insurance coverage ($) | | | 31.9% | | | | 36.0% | | | | 39.1% | | | | 42.7% | | | | 45.6% | |
Securitization | | | | | | | | | | | | | | | | | | | | |
Guarantees-in-force ($B) | | | 477 | | | | 452 | | | | 431 | | | | 422 | | | | 398 | |
Annual securities guaranteed ($B) | | | 167 | | | | 144 | | | | 116 | | | | 118 | | | | 123 | |
Guarantee and application fees received | | | 627 | | | | 579 | | | | 473 | | | | 273 | | | | 265 | |
Guarantee and application fees earned | | | 384 | | | | 284 | | | | 268 | | | | 245 | | | | 247 | |
Net income | | | 295 | | | | 224 | | | | 215 | | | | 197 | | | | 207 | |
Operating expense ratio | | | 10.8% | | | | 12.6% | | | | 11.1% | | | | 10.9% | | | | 10.6% | |
Return on equity | | | 13.4% | | | | 11.3% | | | | 12.0% | | | | 12.9% | | | | 15.8% | |
Capital available to capital required | | | 135% | | | | 100% | | | | 159% | | | | 157% | | | | 182% | |
Return on required capital | | | 15.1% | | | | 13.5% | | | | 17.9% | | | | 20.5% | | | | n/a | |
% estimated outstanding Canadian residential mortgages with CMHC securitization guarantee ($) | | | 32.2% | | | | 32.6% | | | | 32.5% | | | | 32.8% | | | | 31.1% | |
1 Total insured volumes include portfolio substitutions.
| | | | |
| 46 | | | | CANADA MORTGAGE AND HOUSING CORPORATION |
CONSOLIDATED FINANCIAL STATEMENTS
| | | | |
| |
| Management’s Responsibility for Financial Reporting | | | 48 | |
| |
| Independent Auditors’ Report | | | 49 | |
| |
| Consolidated Balance Sheet | | | 50 | |
| |
| Consolidated Statement of Income and Comprehensive Income | | | 51 | |
| |
| Consolidated Statement of Equity of Canada | | | 52 | |
| |
| Consolidated Statement of Cash Flows | | | 53 | |
| |
| Notes to Consolidated Financial Statements | | | 54 | |
| |
1. Corporate Information | | | 54 | |
| |
2. Basis of Preparation and Significant Accounting Policies | | | 54 | |
| |
3. Current and Future Accounting Changes | | | 62 | |
| |
4. Critical Judgments in Applying Accounting Policies and Making Estimates | | | 65 | |
| |
5. Segmented Information | | | 66 | |
| |
6. Parliamentary Appropriations and Housing Programs Expenses | | | 69 | |
| |
7. Mortgage Loan Insurance | | | 70 | |
| |
8. Securitization | | | 75 | |
| |
9. Structured Entities | | | 76 | |
| |
10. Capital Management | | | 76 | |
| |
11. Fair Value Measurement | | | 79 | |
| |
12. Investment Securities | | | 83 | |
| |
13. Loans | | | 84 | |
| |
14. Borrowings | | | 86 | |
| |
15. Derivatives | | | 88 | |
| |
16. Financial Instruments Income and Expenses | | | 89 | |
| |
17. Market Risk | | | 89 | |
| |
18. Credit Risk | | | 91 | |
| |
19. Liquidity Risk | | | 94 | |
| |
20. Accounts Receivable And Other Assets | | | 95 | |
| |
21. Investment Property | | | 96 | |
| |
22. Accounts Payable and Other Liabilities | | | 96 | |
| |
23. Pension and Other Post-Employment Benefits | | | 96 | |
| |
24. Income Taxes | | | 100 | |
| |
25. Related Party Transactions | | | 101 | |
| |
26. Commitments and Contingent Liabilities | | | 102 | |
| |
27. Operating Expenses | | | 102 | |
| |
28. Current and Non-Current Assets and Liabilities | | | 103 | |
| |
29. Comparative Figures | | | 103 | |
| |
30. Subsequent Event | | | 103 | |
| | | | |
| 2017 ANNUAL REPORT | | | | 47 |
MANAGEMENT’S RESPONSIBILITY
FOR FINANCIAL REPORTING
Year ended 31 December 2017
Management is responsible for the integrity and objectivity of the consolidated financial statements and related financial information presented in this annual report. The consolidated financial statements have been prepared in accordance with International Financial Reporting Standards (IFRS) and, consequently, include amounts which are based on the best estimates and judgment of Management. The financial information contained elsewhere in this Annual Report is consistent with that in the consolidated financial statements.
In carrying out its responsibilities, Management maintains appropriate financial systems and related internal controls to provide reasonable assurance that financial information is reliable; assets are safeguarded; transactions are properly authorized and are in accordance with the relevant legislation, by-laws of the Corporation and Government directives; resources are managed efficiently and economically; and operations are carried out effectively. The system of internal controls is supported by internal audit, which conducts periodic audits of different aspects of the operations.
The Board of Directors, acting through the Audit Committee whose members are neither officers nor employees of the Corporation, oversees Management’s responsibilities for financial reporting and internal control systems. The Board of Directors, upon the recommendation of the Audit Committee, has approved the consolidated financial statements.
Ernst & Young LLP and the Auditor General of Canada have audited the consolidated financial statements. The auditors have full access to, and meet periodically with, the Audit Committee to discuss their audit and related matters.
| | | | |

| | 
| | |
| Evan Siddall, BA, LL.B | | Lisa Williams, CPA, CA | | |
| President and Chief Executive Officer | | Chief Financial Officer | | |
| | | | |
22 March 2018
| | | | |
| 48 | | | | CANADA MORTGAGE AND HOUSING CORPORATION |
| | | | | | | | | | |
 | | Office of the Auditor General of Canada | | Bureau du vérificateur général du Canada | | | | | | 
|
INDEPENDENT AUDITORS’ REPORT
To the Minister of Families, Children and Social Development
Report on the Consolidated Financial Statements
We have audited the accompanying consolidated financial statements of Canada Mortgage and Housing Corporation, which comprise the consolidated balance sheet as at 31 December 2017, and the consolidated statement of income and comprehensive income, consolidated statement of equity of Canada and consolidated statement of cash flows for the year then ended, and a summary of significant accounting policies and other explanatory information.
Management’s Responsibility for the Consolidated Financial Statements
Management is responsible for the preparation and fair presentation of these consolidated financial statements in accordance with International Financial Reporting Standards, and for such internal control as management determines is necessary to enable the preparation of consolidated financial statements that are free from material misstatement, whether due to fraud or error.
Auditor’s Responsibility
Our responsibility is to express an opinion on these consolidated financial statements based on our audit. We conducted our audit in accordance with Canadian generally accepted auditing standards. Those standards require that we comply with ethical requirements and plan and perform the audit to obtain reasonable assurance about whether the consolidated financial statements are free from material misstatement.
An audit involves performing procedures to obtain audit evidence about the amounts and disclosures in the consolidated financial statements. The procedures selected depend on the auditor’s judgment, including the assessment of the risks of material misstatement of the consolidated financial statements, whether due to fraud or error. In making those risk assessments, the auditor considers internal control relevant to the entity’s preparation and fair presentation of the consolidated financial statements in order to design audit procedures that are appropriate in the circumstances, but not for the purpose of expressing an opinion on the effectiveness of the entity’s internal control. An audit also includes evaluating the appropriateness of accounting policies used and the reasonableness of accounting estimates made by management, as well as evaluating the overall presentation of the consolidated financial statements.
We believe that the audit evidence we have obtained is sufficient and appropriate to provide a basis for our audit opinion.
Opinion
In our opinion, the consolidated financial statements present fairly, in all material respects, the financial position of Canada Mortgage and Housing Corporation as at 31 December 2017, and its financial performance and its cash flows for the year then ended in accordance with International Financial Reporting Standards.
Report on Other Legal and Regulatory Requirements
As required by the Financial Administration Act, we report that, in our opinion, the accounting principles in International Financial Reporting Standards have been applied on a basis consistent with that of the preceding year.
Further, in our opinion, the transactions of Canada Mortgage and Housing Corporation that have come to our notice during our audit of the consolidated financial statements have, in all significant respects, been in accordance with Part X of the Financial Administration Act and regulations, the Canada Mortgage and Housing Corporation Act, the National Housing Act, the by-laws of the Canada Mortgage and Housing Corporation, and the directives issued pursuant to section 89 of the Financial Administration Act.
|
 |
|
| Riowen Yves Abgrall, CPA, CA |
| Principal |
| for the Auditor General of Canada |
|
|
|
 |
|
Chartered Professional Accountants Licensed Public Accountants |
|
| 22 March 2018 |
| Ottawa, Canada |
| | | | |
| 2017 ANNUAL REPORT | | | | 49 |
CONSOLIDATED BALANCE SHEET
As at 31 December
| | | | | | | | | | | | |
| (IN MILLIONS OF CANADIAN DOLLARS) | | NOTES | | | 2017 | | | 2016 | |
| | | |
Assets | | | | | | | | | | | | |
Cash and cash equivalents | | | | | | | 887 | | | | 1,995 | |
Securities purchased under resale agreements | | | | | | | – | | | | 17 | |
Investment securities: | | | 12 | | | | | | | | | |
Designated at fair value through profit or loss | | | | | | | 1,234 | | | | 1,173 | |
Available for sale | | | | | | | 22,112 | | | | 23,226 | |
Derivatives | | | 15 | | | | 61 | | | | 86 | |
Loans: | | | 13 | | | | | | | | | |
Designated at fair value through profit or loss | | | | | | | 2,906 | | | | 4,020 | |
Loans and receivables | | | | | | | 237,944 | | | | 227,310 | |
Accrued interest receivable | | | | | | | 705 | | | | 705 | |
Due from the Government of Canada | | | 6 | | | | 126 | | | | 59 | |
Investment property | | | 21 | | | | 305 | | | | 267 | |
Accounts receivable and other assets | | | 20 | | | | 835 | | | | 674 | |
| | | | | | | | 267,115 | | | | 259,532 | |
| | | |
Liabilities | | | | | | | | | | | | |
Securities sold under repurchase agreements | | | | | | | 297 | | | | 704 | |
Derivatives | | | 15 | | | | 39 | | | | 32 | |
Borrowings: | | | 14 | | | | | | | | | |
Designated at fair value through profit or loss | | | | | | | 4,564 | | | | 5,905 | |
Other financial liabilities | | | | | | | 233,592 | | | | 223,156 | |
Accrued interest payable | | | | | | | 545 | | | | 542 | |
Dividend payable | | | 10 | | | | 2,000 | | | | – | |
Accounts payable and other liabilities | | | 22 | | | | 561 | | | | 548 | |
Provision for claims | | | 7 | | | | 555 | | | | 654 | |
Unearned premiums and fees | | | 7, 8 | | | | 6,687 | | | | 6,564 | |
Defined benefit plans liability | | | 23 | | | | 450 | | | | 384 | |
Deferred income tax liabilities | | | 24 | | | | 84 | | | | 53 | |
| | | | | | | | 249,374 | | | | 238,542 | |
Commitments and contingent liabilities | | | 26 | | | | | | | | | |
| | | |
Equity of Canada | | | 10 | | | | | | | | | |
Contributed capital | | | | | | | 25 | | | | 25 | |
Accumulated other comprehensive income | | | | | | | 490 | | | | 761 | |
Retained earnings | | | | | | | 17,226 | | | | 20,204 | |
| | | | | | | | 17,741 | | | | 20,990 | |
| | | | | | | | 267,115 | | | | 259,532 | |
The accompanying notes are an integral part of these consolidated financial statements.
| | | | |

| |  | | |
| Bruce Shirreff | | Evan Siddall | | |
| Vice-Chairperson | | President and Chief Executive Officer | | |
| | | | |
| 50 | | | | CANADA MORTGAGE AND HOUSING CORPORATION |
CONSOLIDATED STATEMENT OF INCOME AND COMPREHENSIVE INCOME
Year ended 31 December
| | | | | | | | | | | | |
| (IN MILLIONS OF CANADIAN DOLLARS) | | NOTES | | | 2017 | | | 2016 | |
| | | |
Interest income | | | 16 | | | | | | | | | |
Loans – designated at fair value through profit or loss | | | | | | | 55 | | | | 82 | |
Loans and receivables | | | | | | | 4,607 | | | | 4,463 | |
Other | | | | | | | 46 | | | | 53 | |
| | | | | | | | 4,708 | | | | 4,598 | |
| | | |
Interest expense | | | 16 | | | | | | | | | |
Borrowings – designated at fair value through profit or loss | | | | | | | 93 | | | | 123 | |
Borrowings – other financial liabilities | | | | | | | 4,476 | | | | 4,343 | |
| | | | | | | | 4,569 | | | | 4,466 | |
Net interest income | | | | | | | 139 | | | | 132 | |
| | | |
Parliamentary appropriations for housing programs | | | 6 | | | | 3,229 | | | | 2,153 | |
Premiums and fees earned | | | 7, 8 | | | | 1,941 | | | | 1,789 | |
Investment income | | | 16 | | | | 573 | | | | 564 | |
Net gains (losses) on financial instruments | | | 16 | | | | 147 | | | | (51) | |
Other income | | | | | | | 123 | | | | 38 | |
Total revenues and parliamentary appropriations | | | | | | | 6,152 | | | | 4,625 | |
| | | |
Non-interest expenses | | | | | | | | | | | | |
Housing programs | | | 6 | | | | 3,229 | | | | 2,153 | |
Insurance claims | | | 7 | | | | 147 | | | | 334 | |
Operating expenses | | | 27 | | | | 396 | | | | 319 | |
| | | | | | | | 3,772 | | | | 2,806 | |
| | | |
Income before income taxes | | | | | | | 2,380 | | | | 1,819 | |
Income taxes | | | 24 | | | | 577 | | | | 441 | |
Net income | | | | | | | 1,803 | | | | 1,378 | |
| | | |
Other comprehensive income (loss), net of tax | | | | | | | | | | | | |
Items that will be subsequently reclassified to net income | | | | | | | | | | | | |
Net unrealized losses from available for sale financial instruments | | | | | | | (135) | | | | (9) | |
Reclassification of prior years’ net unrealized gains realized in the period in net income | | | | | | | (136) | | | | (37) | |
Total items that will be subsequently reclassified to net income | | | | | | | (271) | | | | (46) | |
Items that will not be subsequently reclassified to net income | | | | | | | | | | | | |
Remeasurement gains (losses) on defined benefit plans | | | 23, 24 | | | | (106) | | | | 19 | |
| | | | | | | | (377) | | | | (27) | |
Comprehensive income | | | | | | | 1,426 | | | | 1,351 | |
The accompanying notes are in integral part of these consolidated financial statements.
| | | | |
| 2017 ANNUAL REPORT | | | | 51 |
CONSOLIDATED STATEMENT
OF EQUITY OF CANADA
Year ended 31 December
| | | | | | | | | | | | |
| (IN MILLIONS OF CANADIAN DOLLARS) | | NOTES | | | 2017 | | | 2016 | |
Contributed capital | | | | | | | 25 | | | | 25 | |
| | | |
Accumulated other comprehensive income | | | | | | | | | | | | |
Balance at beginning of year | | | | | | | 761 | | | | 807 | |
Other comprehensive loss | | | | | | | (271) | | | | (46) | |
Balance at end of year | | | | | | | 490 | | | | 761 | |
| | | |
Retained earnings | | | | | | | | | | | | |
Balance at beginning of year | | | | | | | 20,204 | | | | 18,807 | |
Net income | | | | | | | 1,803 | | | | 1,378 | |
Other comprehensive income (loss) | | | | | | | (106) | | | | 19 | |
Dividends | | | 10 | | | | (4,675) | | | | – | |
Balance at end of year | | | | | | | 17,226 | | | | 20,204 | |
Equity of Canada | | | 10 | | | | 17,741 | | | | 20,990 | |
The accompanying notes are an integral part of these consolidated financial statements.
| | | | |
| 52 | | | | CANADA MORTGAGE AND HOUSING CORPORATION |
CONSOLIDATED STATEMENT
OF CASH FLOWS
Year ended 31 December
| | | | | | | | | | | | |
| (IN MILLIONS OF CANADIAN DOLLARS) | | NOTES | | | 2017 | | | 2016 | |
| | | |
Cash flows from operating activities | | | | | | | | | | | | |
Net income | | | | | | | 1,803 | | | | 1,378 | |
Adjustments to determine net cash flows provided by (used in) operating activities | | | | | | | | | | | | |
Amortization of premiums and discounts on financial instruments | | | | | | | 144 | | | | 214 | |
Deferred income taxes | | | | | | | 57 | | | | 14 | |
Net (gains) losses on financial instruments | | | | | | | (116) | | | | 27 | |
Net unrealized gains on investment property | | | 21 | | | | (90) | | | | (8) | |
Accrued interest receivable | | | | | | | – | | | | (11) | |
Derivatives | | | | | | | 32 | | | | 32 | |
Due from the Government of Canada | | | | | | | (67) | | | | 102 | |
Accounts receivable and other assets | | | | | | | (68) | | | | 165 | |
Accrued interest payable | | | | | | | 3 | | | | 81 | |
Accounts payable and other liabilities | | | | | | | 13 | | | | 66 | |
Defined benefit plans liability | | | | | | | (63) | | | | (38) | |
Provision for claims | | | | | | | (99) | | | | (54) | |
Unearned premiums and fees | | | | | | | 123 | | | | 335 | |
Other | | | | | | | 20 | | | | 20 | |
Loans | | | 13 | | | | | | | | | |
Repayments | | | | | | | 30,836 | | | | 33,510 | |
Disbursements | | | | | | | (40,373) | | | | (40,192) | |
Borrowings | | | 14 | | | | | | | | | |
Repayments | | | | | | | (32,839) | | | | (35,558) | |
Issuances | | | | | | | 42,386 | | | | 42,308 | |
| | | | | | | | 1,702 | | | | 2,391 | |
| | | |
Cash flows from investing activities | | | | | | | | | | | | |
Investment securities | | | | | | | | | | | | |
Sales and maturities | | | | | | | 8,352 | | | | 5,317 | |
Purchases | | | | | | | (8,119) | | | | (7,757) | |
Investment property | | | 21 | | | | | | | | | |
Additions | | | | | | | – | | | | (1) | |
Disposals | | | | | | | 22 | | | | – | |
Securities purchased under resale agreements | | | | | | | 17 | | | | 18 | |
Securities sold under repurchase agreements | | | | | | | (407) | | | | 7 | |
| | | | | | | | (135) | | | | (2,416) | |
| | | |
Cash flows from financing activities | | | | | | | | | | | | |
Dividends paid | | | 10 | | | | (2,675) | | | | – | |
| | | | | | | | (2,675) | | | | – | |
Change in cash and cash equivalents | | | | | | | (1,108) | | | | (25) | |
| | | |
Cash and cash equivalents | | | | | | | | | | | | |
Beginning of year | | | | | | | 1,995 | | | | 2,020 | |
End of year | | | | | | | 887 | | | | 1,995 | |
| | | |
Represented by | | | | | | | | | | | | |
Cash | | | | | | | 3 | | | | 4 | |
Cash equivalents | | | | | | | 884 | | | | 1,991 | |
| | | | | | | | 887 | | | | 1,995 | |
| | | |
Supplementary disclosure of cash flows from operating activities | | | | | | | | | | | | |
Amount of interest received during the year | | | | | | | 5,592 | | | | 5,447 | |
Amount of interest paid during the year | | | | | | | 4,767 | | | | 4,572 | |
Amount of dividends received during the year | | | | | | | 46 | | | | 47 | |
Amount of income taxes paid during the year | | | | | | | 435 | | | | 184 | |
The accompanying notes are an integral part of these consolidated financial statements.
| | | | |
| 2017 ANNUAL REPORT | | | | 53 |
NOTES TO CONSOLIDATED
FINANCIAL STATEMENTS
Year ended 31 December 2017
1. CORPORATE INFORMATION
Canada Mortgage and Housing Corporation (CMHC or Corporation) was established in Canada as a Crown corporation in 1946 by the Canada Mortgage and Housing Corporation Act (CMHC Act) to carry out the provisions of the National Housing Act (NHA). We are also subject to Part X of the Financial Administration Act (FAA) by virtue of being listed in Part 1 of Schedule III, wholly owned by the Government of Canada (Government), and an agent Crown corporation. Our National Office is located at 700 Montreal Road, Ottawa, Ontario, Canada, K1A 0P7.
Our mandate, as set out in the NHA, is to promote the construction of new houses, the repair and modernization of existing houses, and the improvement of housing and living conditions. In relation to financing for housing, the NHA’s purpose is to promote housing affordability and choice; to facilitate access to, and competition and efficiency in the provision of, housing finance; to protect the availability of adequate funding for housing; and generally to contribute to the well-being of the housing sector. In addition, we have the following objectives in carrying out any activities related to mortgage loan insurance and guarantee programs and in administering the Canadian covered bond legal framework: (a) to promote the efficient functioning and competitiveness of the housing finance market; (b) to promote and contribute to the stability of the financial system, including the housing market; and (c) to have due regard to the Corporation’s exposure to loss. We deliver on our mandate through our reportable segments: Assisted Housing, Mortgage Loan Insurance and Securitization. These Activities are supported by our Market Analysis and Research Activity and by our infrastructure of People and Processes.
Within the Public Accounts of Canada, our annual consolidated net income reduces the Government’s annual deficit; our consolidated retained earnings and accumulated other comprehensive income (AOCI) reduce the Government’s accumulated deficit.
In September 2008, CMHC, together with a number of other Crown corporations, was issued a directive (P.C. 2008-1598) pursuant to Section 89 of the FAA requiring due consideration to the personal integrity of those to whom it lends or provides benefits. We continue to meet the requirements of this directive.
In December 2014, CMHC was issued a directive (P.C. 2014-1380) pursuant to Section 89 of the FAA that is intended to ensure that Crown corporations’ pension plans provide a 50:50 current service cost-sharing ratio between employees and employer for pension contributions to be phased in for all members by 31 December 2017. We have responded to the directive with a new design for our defined benefit pension plan, effective 1 January 2018, which reflects the criteria of uniformity, risk sharing, competitiveness and cost control. We continue to take steps to ensure the long-term sustainability of our pension plan and to manage costs.
In July 2015, CMHC was issued a directive (P.C. 2015-1106) pursuant to Section 89 of the FAA directing Crown corporations to align their travel, hospitality, conference and event expenditure policies, guidelines and practices with those of Treasury Board of Canada Secretariat (TBS) in a manner consistent with their legal obligations and to report on the implementation of this directive in the Corporation’s next corporate plan. Our analysis found that our policies were generally aligned with TBS policies and any gaps were not considered material. During 2017, further updates were made by TBS and as such, our policies will be updated in 2018 to ensure continued compliance.
2. BASIS OF PREPARATION AND SIGNIFICANT ACCOUNTING POLICIES
BASIS OF PREPARATION
Our consolidated financial statements have been prepared in accordance with IFRS in effect at 31 December 2017 as issued by the International Accounting Standards Board (IASB).
These consolidated financial statements were approved by the Board of Directors on 22 March 2018.
MEASUREMENT BASIS
Our consolidated financial statements have been prepared on a going concern basis using a historical cost basis except for the following items in the consolidated balance sheet:
| · | | Financial assets and liabilities designated at fair value through profit or loss are measured at fair value, as are held for trading financial assets and liabilities and available for sale financial assets; |
| · | | Investment property is measured at fair value; |
| · | | Defined benefit liabilities for post-employment benefit plans are recognized at the present value of the defined benefit obligations, net of the fair value of plan assets; and |
| · | | Provision for claims is recognized on an actuarial present value basis. |
| | | | |
| 54 | | | | CANADA MORTGAGE AND HOUSING CORPORATION |
FUNCTIONAL CURRENCY
Our consolidated financial statements are stated in millions of Canadian dollars, unless otherwise indicated, which is the Corporation’s functional currency.
BASIS OF CONSOLIDATION
These consolidated financial statements include the accounts of CMHC and, as required by IFRS 10 Consolidated Financial Statements, the accounts of Canada Housing Trust (CHT). We consolidate CHT as we control its activities.
Control is achieved when we are exposed, or have rights, to variable returns from our involvement with the investee and have the ability to affect those returns through our power over the investee. Specifically, we control an investee if, and only if, we have power over the investee (i.e. existing rights that give us the current ability to direct the relevant activities of the investee); exposure, or rights, to variable returns from our involvement; and the ability to use our power over the investee to affect our returns.
We re-assess whether or not we control an investee if facts and circumstances indicate that there are changes to one or more of the three elements of control.
Inter-segment balances and transactions have been eliminated.
The following summarizes the significant accounting policies used in the preparation of our consolidated financial statements.
PARLIAMENTARY APPROPRIATIONS AND HOUSING PROGRAMS EXPENSES
In the Assisted Housing Activity, we receive parliamentary appropriations to fund housing programs and initiatives.
Parliamentary appropriations
Parliamentary appropriations are recognized when there is reasonable assurance that they will be received and all attached conditions will be complied with. They are recognized in income in the fiscal year for which the appropriations were approved and over the same period as the related housing programs expenses.
Housing programs expenses
Housing programs expenses, including operating costs incurred to administer the housing programs, are recorded on an accrual basis.
Expenses incurred but not yet reimbursed are included in due from the Government of Canada.
MORTGAGE LOAN INSURANCE
Product classification
We classify our mortgage loan insurance as an insurance contract as the lender faces uncertainty with regard to potential borrower default on a mortgage and therefore pays a premium to transfer the risk to us. If the borrower defaults, the claim is significantly larger than the actual premium. Such contracts remain insurance contracts until the underlying insured mortgages are fully repaid or there is a claim.
Premium revenue earned
Mortgage loan insurance premiums are due at the inception of the mortgage being insured, at which time they are deferred as unearned premiums and included in unearned premiums and fees. The majority of mortgage loan insurance issued to date have amortizations of 25 years or less. Unearned premiums are recognized as income over the period covered by the insurance contract using earning factors which reflect claim occurrence patterns. The earning patterns are selected based on the principle that premiums would be earned at the same pace as claims are incurred. Mortgage loan insurance premiums related to insurance on loans made under various social housing programs as well as loans financed by index-linked mortgages (ILM) under the Federal Co-operative Housing Program are recognized immediately in the year in which they are received.
Unearned premiums
Unearned premiums represent the unamortized portion of the policy premiums at the balance sheet date and therefore relate to claims that may occur from the balance sheet date to the termination of the insurance contract. Management and the Appointed Actuary, on an annual basis, compare the unearned premiums to an estimate of total future claims on a discounted basis to ensure the amount is sufficient. Should such amount not be sufficient, a provision for premium deficiency is recorded.
Fees
Application fees are charged to the lender for low loan-to-value transactional homeowner assessments and multi-unit residential loan assessments.
We offer Approved Lenders a low loan-to-value assessment service for transactional homeowners whereby we assess an application using our loan assessment platform which provides Approved Lenders with an insurable or non-insurable result. There is no mortgage loan insurance coverage associated with this assessment. These low loan-to-value transactional homeowner assessment application fees are recognized immediately into income once the decision is rendered.
| | | | |
| 2017 ANNUAL REPORT | | | | 55 |
Application fees designed to recover part or all acquisition costs associated with issuing mortgage loan insurance policies related to multi-unit residential loans are deferred and amortized on the same basis as the related premiums.
Provision for claims
The provision for claims represents an estimate for expected claims and the related settlement expenses, net of the related expected property sale proceeds and borrower recoveries, for defaults from the mortgage insurance business that have occurred on or before the balance sheet date. This provision includes claims that are incurred but not reported (IBNR), claims that are incurred but not enough reported (IBNER), claims in process (CIP), and claims on loans made under various social housing programs as well as loans financed by ILM under the Federal Co-operative Housing Program (SH and ILM). The provision takes into consideration the time value of money and, in accordance with accepted actuarial practice, includes an explicit provision for adverse deviation.
A change in the estimated provision for claims is recorded in insurance claims expense in the year in which it occurs.
For further details on the estimates and assumptions used to calculate the provision, see Note 4.
Insurance policy liability adequacy
Liability adequacy tests are performed at each reporting period as part of the actuarial valuation to ensure the adequacy of insurance policy liabilities net of deferred acquisition costs (DAC) assets with respect to the provision for claims and unearned premiums. Current best estimates of future contractual cash flows, claims handling and administration costs, and investment returns from the assets backing the liabilities are taken into account in the tests. Where a deficiency is highlighted by the test, DAC assets are written off first, and insurance liabilities are increased once the DAC assets are written off in full. Any premium deficiency is immediately recognized in insurance claims expense.
Deferred acquisition costs
Deferred acquisition costs generally consist of policy issuance costs relating to the underwriting of insurance contracts. A portion of the acquisition costs relating to the unearned premiums is deferred and amortized over the estimated lives of the relevant contracts using the same earning factors as the unearned premiums. The DAC are included in accounts receivable and other assets.
Net estimated borrower recoveries
We estimate the net borrower recoveries related to claims paid based on historical data in accordance with Canadian accepted actuarial practice on an annual basis. Changes to the estimated borrower recovery balance are recorded in insurance claims expense in the year in which they are determined. Net estimated borrower recoveries are included in accounts receivable and other assets.
Government of Canada fees for risk exposure
We pay fees to the Department of Finance to compensate for mortgage insurance risks. These fees are deferred in accounts receivable and other assets and recognized in operating expenses over the period covered by the insurance contract using the same earning factors as the unearned premiums. The fees are payable at the rate of 3.25% of premiums written during the year and an additional 0.1% on new portfolio insurance written.
TIMELY PAYMENT GUARANTEES
Classification
Financial guarantee contracts are defined as those that require the issuer to make specified payments to reimburse the holder for a loss it incurs because a specified debtor fails to make payment when due. We classify the timely payment guarantee for National Housing Act Mortgage-Backed Securities (NHA MBS) and Canada Mortgage Bonds (CMB) as financial guarantee contracts. Such contracts remain financial guarantee contracts until all rights and obligations are extinguished or expire.
Recognition and measurement
Timely payment guarantee fees are initially recognized in unearned premiums and fees at fair value (the premium received). Subsequently, they are measured at the amount initially recognized less the amortization of guarantee fee revenue. Guarantee fee revenue is recognized into premiums and fees earned over the expected life of the related NHA MBS or CMB. Should the estimated amount required to settle the timely payment guarantee obligations exceed unearned premiums and fees, an additional provision is recognized.
Application fees are recognized as revenues in the period in which the related services are rendered. Direct costs associated with issuing timely payment guarantees are recognized in operating expenses as incurred.
Government of Canada guarantee fees
We pay guarantee fees to the Department of Finance to compensate for timely payment guarantee risks. These fees are deferred in accounts receivable and other assets and recognized in operating expenses over the period covered by the guarantee. These fees are payable at a rate of 0.075% of CMB issuances.
| | | | |
| 56 | | | | CANADA MORTGAGE AND HOUSING CORPORATION |
FINANCIAL INSTRUMENTS
We classify our financial assets in the following categories: financial assets designated at fair value through profit or loss (FVTPL), held for trading (HFT), available for sale (AFS), loans and receivables, and held to maturity (HTM). Financial liabilities are classified as either financial liabilities designated at FVTPL or other financial liabilities.
Classification is determined at initial recognition based on our intent and the characteristics of the financial instrument.
| | |
| CLASSIFICATION | | ACCOUNTING TREATMENT |
| |
Designated at fair value through profit or loss | | IAS 39 Financial Instruments: Recognition and Measurement provides an entity the option of designating a financial instrument at FVTPL when doing so results in more relevant information because either: a) it eliminates or significantly reduces a measurement or recognition inconsistency that would otherwise arise from measuring the assets or liabilities or recognizing the gains or losses on them on different bases; or b) the financial instrument belongs to a group managed and evaluated on a fair value basis in accordance with documented risk management or investment strategies and information about the group is provided internally on that basis to key management personnel. This designation is irrevocable. Financial instruments designated at FVTPL are initially recognized at fair value. They are subsequently measured at fair value. Unrealized gains and losses arising from changes in fair value and gains and losses realized on disposition are recorded in net gains (losses) on financial instruments. Transaction costs are expensed as incurred. |
| |
| Held for trading | | HFT financial instruments are either derivatives or financial instruments acquired or incurred principally for the purpose of selling or repurchasing in the near term. HFT financial instruments are initially recognized at fair value. They are subsequently measured at fair value. Unrealized gains and losses arising from changes in fair value and gains and losses realized on disposition are recorded in net gains (losses) on financial instruments. Transaction costs are expensed as incurred. |
| |
| Loans and receivables | | Loans and receivables are non-derivative financial assets with fixed or determinable payments that are not quoted in an active market except for those designated at FVTPL or classified as available for sale. Loans and receivables are initially recognized at fair value plus transaction costs. They are subsequently measured at amortized cost using the effective interest method. When loans and receivables are determined to be impaired, the changes in their estimated realizable value are recorded in net gains (losses) on financial instruments. |
| |
| Held to maturity | | HTM financial assets are non-derivative financial assets with fixed or determinable payments and a fixed maturity, other than loans and receivables and those designated at FVTPL or classified as available for sale, that we have positive intention and ability to hold to maturity. HTM financial assets are initially recognized at fair value plus transaction costs. They are subsequently measured at amortized cost using the effective interest method. When HTM financial assets are determined to be impaired, their changes in fair value are recorded in net gains (losses) on financial instruments. |
| |
Available for sale | | AFS financial assets are non-derivative financial assets which are neither classified as HFT, HTM, loans and receivables nor designated at FVTPL. AFS financial assets are initially recognized at fair value plus transaction costs. They are subsequently measured at fair value. Unrealized gains and losses arising from changes in fair value are recorded in other comprehensive income (OCI) until the financial asset is sold, derecognized, or determined to be impaired at which time they are transferred to net income and reported in net gains (losses) on financial instruments. Unrealized foreign exchange gains (losses) on AFS debt securities are recognized in net gains (losses) on financial instruments. |
| |
| Other financial liabilities | | Other financial liabilities are non-derivative financial liabilities which have not been designated at FVTPL. Other financial liabilities are initially recognized at fair value plus transaction costs. They are subsequently measured at amortized cost using the effective interest method with interest expense recorded in interest expense. |
Settlement date accounting is used for purchases and sales of financial assets and financial liabilities. Realized gains and losses on sales are recognized on a weighted average cost basis.
| | | | |
| 2017 ANNUAL REPORT | | | | 57 |
Financial instruments designated at fair value through profit or loss
We designate certain financial instruments at FVTPL. All items designated at FVTPL, with the exception of certain investment securities held within the Mortgage Loan Insurance Activity, relate to the Assisted Housing Activity. For certain portfolios of loans and associated borrowings originated prior to August 2016, the Assisted Housing Activity uses derivatives to manage refinancing and reinvestment risks, as well as mismatches between the timing of receipts from assets and payments of liabilities. Designating the loans, investment securities purchased with principal receipts and associated borrowings at FVTPL significantly reduces the measurement inconsistency that would otherwise arise from measuring them at amortized cost and measuring the derivatives at fair value. Certain investment securities within the Mortgage Loan Insurance Activity are also designated at FVTPL, as they are managed and reported to Management on a fair value basis.
IMPAIRMENT OF FINANCIAL INSTRUMENTS
Management assesses at each balance sheet date whether there is objective evidence that financial assets not carried at FVTPL or HFT are impaired. A financial asset is considered impaired and impairment losses are incurred if, and only if, there is objective evidence of impairment as a result of one or more events that occurred after the initial recognition of the asset and that loss event(s) has an impact on the estimated future cash flows of the asset that can be reliably estimated.
Objective evidence of impairment considered in Management’s review includes observable data indicating significant financial difficulty of the issuer; defaults or delinquencies in the payment of interest, principal or preferred equity dividends; the disappearance of an active market for the financial asset because of the issuer’s financial difficulties; and bankruptcy or other financial reorganization of the issuer. Credit and preferred equity rating downgrades are considered in our assessment, although they alone might not represent objective evidence of impairment.
Available for sale common equity investment securities
For common equity investment securities classified as AFS, objective evidence of impairment also includes a significant or prolonged decline in fair value below cost or significant adverse changes that have taken place in the technological, market, economic or legal environment in which the issuer operates. The determination whether a decline in fair value below cost is significant or prolonged requires judgment. In making this judgment, we apply certain quantitative tests to the total position in each common equity security supplemented with a qualitative assessment of the financial condition of the issuer.
For common equity investment securities classified as AFS that are identified as impaired, the cumulative unrealized loss previously recorded in OCI is reclassified from OCI and recognized as an impairment loss in net income for the period through net gains (losses) on financial instruments. Further declines in the fair value of impaired AFS common equity instruments are recognized in net income, while increases in fair value are recorded in OCI.
Available for sale debt and preferred equity investment securities
For debt and preferred equity investment securities classified as AFS that are identified as impaired, the cumulative unrealized loss previously recorded in OCI is reclassified from OCI and recognized as an impairment loss in net income for the period through net gains (losses) on financial instruments. If the fair value of an impaired debt or preferred equity instrument classified as AFS subsequently increases and the increase can be related objectively to an event occurring after the impairment loss was recognized, the impairment loss is reversed in net income, with the reversal limited in amount to the previously recognized impairment loss. Otherwise, subsequent increases in fair value are recorded in OCI.
Loans and receivables and held to maturity financial assets
For financial assets classified as loans and receivables or HTM that are identified as impaired, the carrying amount is reduced to the present value of estimated future cash flows (excluding future credit losses not yet incurred) discounted at the original effective interest rate, with the impairment loss being recorded in net income for the period through net gains (losses) on financial instruments. Interest is accrued only to the extent that there is an expectation of receipt.
Previously recognized impairment losses can be reversed if the loss decreases and the decrease can be related objectively to an event occurring after the impairment was recognized. Impairment losses can be reversed to the extent that the carrying amount of the financial asset does not exceed what the amortized cost would have been had the impairment not occurred.
For economic or legal reasons related to a borrower’s financial difficulties, we may take an assignment of an insured mortgage and pay the insured lender the loan balance rather than proceed with the acquisition. We may also make advances to a project in order to help it return to a state where the borrower can manage their mortgage obligations. These loans are held within the Mortgage Loan Insurance Activity and are recorded in accounts receivable and other assets.
We establish an allowance for credit losses for these loans that provides for estimated amounts that may not be recovered. Factors that are considered in assessing the estimated realizable amount include, but are not limited to, underlying asset valuation and any changes in market and economic outlook. The allowance for credit losses is included as a reduction to accounts receivable and other assets and any change in the allowance is included in insurance claims expense.
| | | | |
| 58 | | | | CANADA MORTGAGE AND HOUSING CORPORATION |
A loan is no longer considered impaired when all past due amounts, including interest, have been recovered and it is determined that the principal and interest are fully collectable in accordance with the original contractual terms of the loan or revised terms.
Loans are written off, either partially or in full, against the related allowance for credit losses when we judge that there is no realistic prospect of future recovery.
CASH AND CASH EQUIVALENTS
Cash and cash equivalents are comprised of cash and short-term highly liquid investments with a term to maturity of 98 days or less from the date of acquisition that are readily convertible to known amounts of cash and which are subject to an insignificant risk of change in value.
Cash equivalents funded by securities sold under repurchase agreements (repurchase agreements) are classified as HTM or loans and receivables. Otherwise, cash equivalents in the Assisted Housing Activity are classified as HTM or loans and receivables or, if held as part of a lending program that is economically hedged using derivatives, they are designated at FVTPL. Cash equivalents in the Mortgage Loan Insurance and Securitization Activities are classified as AFS. Interest income on these investments is recorded in interest income for the Assisted Housing Activity and in investment income for the Mortgage Loan Insurance and Securitization Activities.
SECURITIES PURCHASED UNDER RESALE AGREEMENTS AND SOLD UNDER REPURCHASE AGREEMENTS
Securities purchased under resale agreements (reverse repurchase agreements) consist of the purchase of securities, typically Government treasury bills or bonds, with the commitment to resell the securities to the original seller at a specified price and future date in the near term. They are treated as collateralized transactions and are classified as loans and receivables.
Repurchase agreements consist of the sale of securities with the commitment to repurchase the securities from the original buyer at a specified price and future date in the near term. They are classified as other financial liabilities. Proceeds received from these agreements are generally invested in reverse repurchase agreements or cash equivalents for the purpose of generating additional income. These transactions are entered into simultaneously with matching terms to maturity.
INVESTMENT SECURITIES
Investment securities in the Assisted Housing Activity are comprised of fixed income securities and are designated at FVTPL. Investment securities in the Mortgage Loan Insurance Activity are comprised of fixed income securities and common and preferred equity securities and are classified as AFS or designated at FVTPL. The Securitization Activity holds fixed income investment securities classified as AFS. Interest income on fixed income investments is recorded in interest income for the Assisted Housing Activity and in investment income for the Mortgage Loan Insurance and Securitization Activities using the effective interest method. Dividend income on equity investments is recorded in investment income when the right to the dividend is established.
DERIVATIVES
We enter into derivatives such as interest rate swaps and foreign currency forward contracts to manage our exposure to market risks. We do not use derivatives for speculative purposes.
Derivatives are classified as HFT as they have not been designated as eligible hedges for accounting purposes and are carried at fair value. Derivative contracts with a positive fair value are reported as assets, while derivative contracts with a negative fair value are reported as liabilities.
We do not have derivatives embedded in other financial instruments (host contracts) which require separation.
For our interest rate swaps, the net of interest income and expense is recognized as earned and incurred in interest income.
LOANS
Designated at fair value through profit or loss
We designate the Assisted Housing Activity loans that are part of Lending programs and that are economically hedged using derivatives at FVTPL. Interest earned is recognized in interest income using the effective interest method.
Loans and receivables
Lending programs
We classify the Assisted Housing Activity loans which are not economically hedged using derivatives as loans and receivables.
For certain loans originated from 1946 to 1984 through provisions of the NHA, interest rate losses from the loans having lower interest rates than the related borrowings are reimbursed through parliamentary appropriations. In assessing the fair value of these loans at initial recognition, the continued receipt of the appropriations in the future was assumed.
Interest earned is recognized in interest income using the effective interest method.
| | | | |
| 2017 ANNUAL REPORT | | | | 59 |
Canada Mortgage Bonds program
Loans in the CMB program represent amounts due from Canadian financial institutions as a result of the sale of their beneficial interest in NHA MBS securities to CMHC and are funded by the issuance of CMB. There are both fixed and floating rate loans in this category, with principal in all cases being due at maturity.
Under these arrangements, substantially all of the risks and rewards of the NHA MBS are retained by the issuers through swap agreements with the Corporation. Consequently, the NHA MBS and investments arising from the reinvestment of principal proceeds distributed by the NHA MBS serve as collateral to the loans and are not recognized in the consolidated balance sheet. This collateral is however held in the name of the Corporation and represents the sole source of principal repayments for the loans. The amount due from the swap counterparties represents the interest earned on the loans and is recognized in interest income.
INVESTMENT PROPERTY
Investment properties are properties held to earn rental income or for capital appreciation, or both. Investment properties are initially recognized at cost plus transaction costs. Subsequent to initial recognition, they are measured at fair value. Gains or losses arising from changes in fair value are recognized in other income in the period in which they arise. Investment property rental income and expenses are recorded in other income.
For certain investment properties held by the Assisted Housing Activity, expenses are recoverable from the Minister. These activities are recorded in housing programs expenses and parliamentary appropriations.
NON-CURRENT ASSETS HELD FOR SALE
Real estate acquired by the Mortgage Loan Insurance Activity through loan default is classified as non-current assets held for sale since its carrying amount will be recovered through a sale transaction. The criteria for held for sale classification includes our commitment to a plan to sell the selected assets and the expectation that such a sale will be completed within a 12 month period. Events or circumstances beyond our control may extend the period to complete the sale beyond one year. Such assets continue to be classified as held for sale as we remain committed to our plan to sell the asset. Non-current assets held for sale are measured at the lower of their carrying amount and their fair value less cost to sell and are included in accounts receivable and other assets. Impairment losses and any subsequent reversals are recognized in insurance claims expense in the period in which they occur. Non-current assets held for sale are not depreciated.
BORROWINGS
Designated at fair value through profit or loss
Capital market borrowings
Capital market borrowings represented borrowings incurred between 1993 and April 2008 to fund loans in the Assisted Housing Activity. The remaining outstanding borrowings matured in 2017. They were designated at FVTPL and formed part of the lending hedging structure.
Borrowings from the Government of Canada
Since April 2008, the Assisted Housing Activity has been borrowing under the terms of the Crown Borrowing Agreement. These borrowings fund the loans originated in the lending programs that are designated at FVTPL and form part of the lending hedging structure.
Other financial liabilities
Canada Mortgage Bonds
CMB are interest-bearing bullet bonds issued by CHT and guaranteed by CMHC. Coupon interest payments are made semi-annually for fixed rate CMB and quarterly for floating rate CMB. Principal repayments on the bonds are made at maturity. The Approved MBS Sellers reimburse CHT for the cost of arranging financing, including the fees paid to underwriters and others for the distribution of CMB. Transaction costs directly attributable to the issuance of CMB and reimbursements thereof are included in the amount initially recognized and amortized to income using the effective interest method.
We may purchase and resell CMB in the market for investment purposes. Purchases are treated as retirements of debt with the difference between the purchase price and the carrying value of the CMB being recognized as a gain or loss in net gains (losses) on financial instruments. Subsequent sales are treated as re-issuance of the debt with gains and losses deferred and amortized over the remaining life of the CMB sold. When CMHC holds a CMB to maturity or acquires CMB in the primary market, the related cash flows are excluded from the consolidated statement of cash flows as they are not considered external cash flows to the consolidated entity.
Borrowings from the Government of Canada
Other Government of Canada borrowings under the terms of the Crown Borrowing Agreement represent borrowings incurred to fund loans in the Assisted Housing Activity that are not economically hedged and that have been classified as loans and receivables.
For all borrowings, interest expense is recognized in interest expense using the effective interest method.
| | | | |
| 60 | | | | CANADA MORTGAGE AND HOUSING CORPORATION |
DIVIDEND DISTRIBUTIONS TO THE GOVERNMENT
Dividends to the Government are recognized as a liability in the period in which the dividends are authorized and are no longer at the discretion of the Corporation. A corresponding amount is recognized directly in equity. The Board of Directors holds the authority to declare dividends.
PENSION AND OTHER POST-EMPLOYMENT BENEFITS
We have a number of benefit arrangements which provide pension and other post-employment benefits to eligible employees. These include a federally regulated pension plan (Pension Plan), an unregistered supplemental pension plan (Supplemental Plan) and other non-pension post-employment defined benefits consisting mainly of life and medical insurance. The Supplemental Plan offers benefits in excess of statutory limits as defined under the Income Tax Act (ITA).
The Pension Plan and the Supplemental Plan are both a defined benefit pension plan. In 2016, the former defined contribution component of the Pension Plan was segregated from the Pension Plan to become a stand-alone defined contribution pension plan in addition to the existing Defined Contribution Supplemental Plan.
The Pension Plan and the Defined Contribution Pension Plan are subject to the federal Pension Benefits Standards Act, 1985 (PBSA) and its regulations and to the ITA. Both pension plans are registered with the Office of the Superintendent of Financial Institutions (OSFI) and the Canada Revenue Agency (CRA).
Defined benefit plans
The defined benefit plans include the defined benefit Pension Plan and the defined benefit Supplemental Plan as well as the other non-pension post-employment benefits. The benefits available under both the Pension Plan and the Supplemental Plan are based on length of service and average earnings over the best consecutive five-year period.
The net defined benefit liability recognized is the present value of the obligations under the defined benefit plans less the fair value of the assets of those plans. The defined benefit plan assets are limited to the present value of any economic benefits available in the form of reductions in future contributions to these plans.
Net benefit costs of the plans are the current service costs, the net of the interest cost on the defined benefit obligation, the interest income on the plan assets and gain or loss on curtailment, and are included in operating expenses.
Remeasurement gains and losses on defined benefit plans include actuarial gains and losses and changes in the return on plan assets (excluding net interest). They are recognized in OCI as incurred and then flow into retained earnings and are not reclassified to income in subsequent periods.
Defined contribution plan
The defined contribution plan includes the former defined contribution component of the Pension Plan, the new stand-alone defined contribution Pension Plan and the defined contribution Supplemental Plan. Employer contributions to those plans are recognized as an expense as employees render service in exchange for such contributions.
INCOME TAXES
CMHC is a prescribed federal Crown corporation under Reg. 7100 of the ITA and is subject to federal income tax as a prescribed corporation for purposes of subsection 27(2) of the ITA. We are not subject to provincial income tax. CHT is subject to federal and provincial income taxes on the amount of taxable income for the period and is permitted a deduction for all amounts paid or payable to CHT’s beneficiaries in determining income for tax purposes. As all taxable income was distributed to the beneficiaries, no provision for income taxes has been reflected for CHT.
We use the liability method of accounting for income taxes. Under this method, deferred income tax assets and liabilities are recognized based on the estimated tax effect of temporary differences between the carrying value of assets and liabilities on the financial statements and their respective tax bases. The Corporation uses substantively enacted income tax rates at the balance sheet date that are expected to be in effect when the asset is realized or the liability is settled. The carrying amount of deferred income tax assets is reviewed at each balance sheet date and reduced to the extent that it is no longer probable that sufficient taxable profit will be available to allow all or part of the deferred income tax asset to be utilized.
RELATED PARTY TRANSACTIONS
Except for funds borrowed from the Government under the Crown Borrowing Program, related party transactions are made on terms equivalent to those that prevail in arm’s length transactions. Funds borrowed under the Crown Borrowing Program included in borrowings designated at FVTPL are at below market rates thereby allowing us to make loans at below market rates which lowers the Government’s cost to subsidize social housing. This generates a gain which is recognized in net income at the borrowing date.
| | | | |
| 2017 ANNUAL REPORT | | | | 61 |
CONTINGENT LIABILITIES
Contingent liabilities are possible obligations whose existence will be confirmed only by uncertain future events or present obligations where the transfer of economic benefit is uncertain or cannot be reliably measured.
FOREIGN CURRENCY TRANSLATION
Monetary assets and liabilities denominated in foreign currencies are translated into Canadian dollars at exchange rates prevailing at the balance sheet date. Exchange gains and losses resulting from the translation of foreign denominated balances are included in net gains (losses) on financial instruments. Purchases and sales of foreign securities and the related income are translated into Canadian dollars at the exchange rates prevailing on the respective dates of the transactions.
3. CURRENT AND FUTURE ACCOUNTING CHANGES
CURRENT ACCOUNTING CHANGES
We actively monitor new standards and amendments to existing standards that have been issued by the IASB. There were no new or amended standards issued by the IASB that we adopted during the year ended 31 December 2017 that had a material impact on our consolidated financial statements.
FUTURE ACCOUNTING CHANGES
The following new standards and interpretation issued by the IASB have been assessed as having a possible impact on the Corporation in the future. We intend to adopt each of these standards and this interpretation, if applicable, as at the required effective dates indicated below and are currently assessing the impact on our consolidated financial statements.
IFRS 9 FINANCIAL INSTRUMENTS – EFFECTIVE DATE OF 1 JANUARY 2018
IFRS 9 Financial Instruments replaces International Accounting Standard (IAS) 39 Financial Instruments: Recognition and Measurement and will be effective for CMHC beginning 1 January 2018. IFRS 9 addresses the recognition and derecognition, classification and measurement and impairment of financial instruments and hedge accounting. Consequential amendments have been made to IFRS 7 Financial Instruments: Disclosures (IFRS 7) requiring additional disclosures effective for CMHC beginning 1 January 2018.
The following discussion broadly outlines IFRS 9 and the changes it will introduce to CMHC’s financial results. As the IFRS 9 requirements for recognition and derecognition are largely consistent with IAS 39, and CMHC does not apply hedge accounting, the discussion is focused on the classification and measurement and impairment requirements having the most impact on CMHC.
TRANSITION
We will adopt IFRS 9 on 1 January 2018. During 2018 we will not restate our comparative consolidated financial statements as permitted by IFRS 9; rather, a cumulative adjustment to reflect application of the new standard will be made to our consolidated balance sheet as at 1 January 2018. We currently estimate the adoption of IFRS 9 will have an immaterial impact on consolidated Equity of Canada and capital levels as at 1 January 2018. This estimate is subject to change as we refine, review and finalize our transition to the new standard.
CLASSIFICATION AND MEASUREMENT
IFRS 9 introduces a principles-based approach to financial asset classification. Upon initial recognition, each financial asset will be classified under IFRS 9 as either fair value through profit or loss (FVTPL), fair value through other comprehensive income (FVOCI) or amortized cost based on the asset’s contractual cash flow characteristics and the business model for managing the asset.
Debt instrument assets, such as fixed-income securities and loans, whose cash flows are not “solely payment of principal and interest” are classified as FVTPL. Debt instrument assets whose cash flows are SPPI are classified as follows: (i) amortized cost, if managed with the objective of collecting contractual cash flows; (ii) FVOCI, if managed with the objective of collecting contractual cash flows and selling assets; or (iii) FVTPL for all other debt-instrument assets. IFRS 9 includes an option for financial assets that would otherwise be classified as amortized cost or FVOCI to be irrevocably designated as FVTPL at initial recognition if doing so eliminates or significantly reduces an accounting mismatch.
Equity instrument assets are classified as FVTPL under IFRS 9 unless, for non-trading assets, an irrevocable election is made to present fair value changes in OCI, with no transfer of gains and losses from OCI to net income on sale.
Classification and measurement of financial liabilities under IFRS 9 is largely unchanged with the exception of liabilities designated at FVTPL. Changes in fair value of such liabilities which are attributed to changes in the entity’s own credit risk are presented in OCI. We have assessed this as immaterial on transition.
Derivatives will continue to be classified as FVTPL under IFRS 9.
| | | | |
| 62 | | | | CANADA MORTGAGE AND HOUSING CORPORATION |
The most significant reclassifications we expect on transition to IFRS 9 are:
| · | | equity investment securities of $1,105 million previously classified as AFS are expected to be reclassified as FVTPL. Accumulated unrealized gains of $371 million, net of tax, will be reclassified from accumulated OCI to retained earnings on transition. Only gains and losses subsequent to transition will be recognized in net income for these securities. |
| · | | debt investment securities of $97 million previously classified as AFS are expected to be reclassified as FVTPL due to their cash flows not being SPPI, with an immaterial reclassification within Equity of Canada; and |
| · | | loans of $61 million previously classified as loans and receivables are expected to be reclassified as FVTPL due to their cash flows not being SPPI, with an immaterial reclassification within Equity of Canada. |
IMPAIRMENT
IFRS 9 impairment requirements are applicable to debt instrument assets classified as amortized cost or FVOCI as well as loan commitments and financial guarantee contracts not measured at FVTPL. Impairment under IFRS 9 differs significantly from IAS 39 in that a credit event does not need to have occurred before credit losses are recognized. An allowance for expected credit losses (ECLs) is established at initial recognition and updated throughout the life of the instrument. For financial guarantees such as our timely payment guarantees a loss allowance is recognized if it exceeds the associated unearned guarantee fees. Changes in the allowance for ECLs are recognized as impairment gains or losses in net income.
The allowance for ECLs is to be either for 12-month ECLs (for stage 1 instruments) or lifetime ECLs (for stage 2 and 3 instruments) mainly depending on whether there has been a significant increase in credit risk (SICR) since initial recognition. We do not intend to rebut the presumption of a SICR since initial recognition when contractual payments are more than 30 days past due.
| · | | Stage 1 instruments are those which have not experienced a SICR since initial recognition |
| · | | Stage 2 instruments are those which have experienced a SICR since initial recognition. |
| · | | Stage 3 instruments are considered credit-impaired, with the occurrence of one or more events having a detrimental impact on estimated future cash flows. |
If a stage 2 or 3 instrument’s credit risk subsequently improves such that there is no longer a SICR since initial recognition or credit-impairment the instrument may be reclassified to an earlier stage.
Impairment models: Our allowance for ECLs is based on three main drivers: point-in-time probability of default, loss given default and exposure at default. We will calculate ECLs as the probability-weighted average ECL under a range of macroeconomic scenarios. Our impairment models make use of customized third-party specialized software, which apply our forward-looking macroeconomic scenarios to determine ECLs. We have tested and refined the models by performing parallel runs for 2017 periods. Our independent Model Risk Management and Validation group has assessed and reported on the models’ risk.
A governance structure has been implemented around our forward-looking macroeconomic scenarios. The scenarios will be regularly reviewed and scrutinized by representatives from our Finance, Risk, and Capital Markets sectors as well as our Market Analysis Centre. Our Finance and Risk Committee, which consists of key executive level stakeholders, will provide ongoing oversight over this process.
Expected impairment assessments and results on transition: We do not expect our allowances for ECLs to result in material adjustments on transition to IFRS 9. We expect to assess our financial instrument assets for SICR or credit impairment on transition as follows:
| · | | NHA MBS timely payment guarantees – assessment of SICR based on both the issuer of the NHA MBS and the pool of insured mortgages directly backing the NHA MBS |
| · | | Canada Mortgage Bond timely payment guarantees – assessment of SICR based on swap counterparties and reinvestment assets held in the CMB program that support the payments due on CMB |
| · | | fixed income investment securities – no SICR will be assessed for securities having low credit risk at the reporting date, as indicated by an investment-grade credit rating (low credit risk simplification). |
| · | | loans – assessment of SICR based on the low credit risk simplification for certain Assisted Housing Activity loans and solely past-due information for other Assisted Housing Activity loans and all Mortgage Loan Activity loans. Loans with contractual payments between 30 and 90 days past due will be considered to have a SICR since initial recognition (stage 2) and loans more than 90 days past due will be considered credit-impaired (stage 3). From time to time we may originate loans to borrowers in financial difficulty that are considered credit-impaired on initial recognition. |
For loans under the CMB program, we have assessed the allowance for ECLs to be covered by the loss allowance on our CMB guarantees. As CMBs are fully funded and matched by the loans, ECLs for our CMB guarantees – representing the cash shortfalls we would face should we be called to fulfil our guarantee – incorporate cash shortfalls on the loans supporting the CMB and serving as collateral for the guarantees.
| | | | |
| 2017 ANNUAL REPORT | | | | 63 |
IFRS 15 REVENUE FROM CONTRACTS WITH CUSTOMERS – EFFECTIVE DATE OF 1 JANUARY 2018
IFRS 15 Revenue from Contracts with Customers replaces IAS 18 Revenue, IAS 11 Construction Contracts and related interpretations. This standard sets out the requirements for recognizing revenue that apply to all contracts with customers (except for contracts that are within the scope of the standards on leases, insurance contracts and financial instruments).
IFRS 15 establishes a comprehensive five-step framework for determining when and how much revenue to recognize. The core principle of the framework is that an entity should recognize revenue when a performance obligation is satisfied to transfer promised goods or services to a customer in an amount that reflects the consideration to which the company expects to be entitled in exchange for those goods or services. This performance obligation may be satisfied at a point in time or over time.
The primary impact to the Corporation as a result of adopting IFRS 15 relates to the recognition of application fees revenue in our Securitization activity.
Currently, application fees for timely payment guarantees are recognized as revenue upon receipt (at the application date). Under IFRS 15, the application fee and the timely payment guarantee are considered as one performance obligation and the related revenue should be recognized only when the performance obligation is satisfied (over the life of the guaranteed CMB or NHA MBS).
We expect to apply IFRS 15 using the cumulative effect method. Consequently, the unearned timely payment guarantee balance on 1 January 2018 will be adjusted to include the unearned application fee revenue with a corresponding decrease to retained earnings. The amount of the adjustment is estimated to be approximately $71 million.
IFRS 16 LEASES – EFFECTIVE DATE OF 1 JANUARY 2019
IFRS 16 Leases replaces IAS 17 Leases and related interpretations and provides greater transparency about leverage, the assets an entity uses in its operations, and the risks to which it is exposed from entering into lease transactions.
Under IFRS 16, the core principle is that a lessee recognizes assets and liabilities for the rights and obligations created by all leases where the term of the lease is greater than 12 months, unless the underlying asset is of low value. A lessee would recognize a liability to make lease payments and a right-of-use asset representing its right to use the leased asset for the lease term. Depreciation of the leased assets is recognized separately from interest on lease liabilities in the statement of income. The accounting requirements for lessors are substantially unchanged.
We have not yet determined the full impact of this new standard on our consolidated financial statements.
IFRIC 23 UNCERTAINTY OVER INCOME TAX TREATMENTS – EFFECTIVE DATE OF 1 JANUARY 2019
International Financial Reporting Interpretations Committee Interpretation (IFRIC) 23 Uncertainty over Income Tax Treatments provides guidance on the accounting for income tax treatments that have yet to be accepted by tax authorities.
IFRIC 23 outlines the approach to follow in determining recognition and measurement of income taxes for accounting purposes in situations in which it is unclear whether a given tax treatment used by a reporting issuer in its tax return will be accepted by the relevant tax authority. In such instances, the key determining factor is whether it is probable that the tax authority will accept the chosen tax treatment. If this is determined to be probable, the income tax amount recognized in the financial statements should reflect the chosen treatment and be measured at the amount that reflects the best prediction of the resolution of the uncertainty, either the most likely amount or the expected value.
We do not expect this interpretation to have a material impact on our consolidated financial statements.
IFRS 17 INSURANCE CONTRACTS – EFFECTIVE DATE OF 1 JANUARY 2021
In May 2017, the IASB issued IFRS 17 Insurance Contracts, which will replace IFRS 4 Insurance Contracts. Under IFRS 17, insurance contract liabilities will be calculated as the present value of future insurance cash flows adjusted for risk. The discount rate will reflect current interest rates, which are delinked from the assets held. Contractual service margin will represent the difference between the present value of the risk adjusted cash flows and the premium received at inception and will be released over the coverage period. Should the difference between the premium received and the present value of future cash outflows be negative at inception, the insurance contract would be onerous and the difference would be recorded immediately in income. Furthermore, the unit of account is more granular than under current accounting practice. At a minimum, groups of contracts will need to be separated into annual cohorts, though further disaggregation is permitted and in certain cases required. There will also be a new income statement presentation for insurance contracts and additional disclosure requirements.
We have not yet determined the full impact of this new standard on our consolidated financial statements.
| | | | |
| 64 | | | | CANADA MORTGAGE AND HOUSING CORPORATION |
4. CRITICAL JUDGMENTS IN APPLYING ACCOUNTING POLICIES AND MAKING ESTIMATES
JUDGMENTS IN APPLYING ACCOUNTING POLICIES
In the process of applying the accounting policies, in addition to judgments regarding impairment of financial instruments discussed in Note 2, Management has made the following judgments, which have the most significant effect on the amounts recognized in our consolidated financial statements.
CONSOLIDATION
Significant judgments are applied in the assessment of whether the substance of the relationship between CMHC and CHT indicates that CMHC controls CHT. CMHC guarantees the timely payment of principal and interest on the CMB, and chooses when to provide that guarantee. CHT cannot undertake new business (e.g. issue new bonds) without the benefit of a guarantee, and its only available guarantor at present is CMHC. Within that context, CMHC has direct influence on the activities of CHT and can use this influence to manage its exposure to CHT.
DERECOGNITION
In assessing whether transfers of NHA MBS from Issuers to CHT under the CMB program qualify for derecognition, significant judgment is applied in determining whether substantially all the risks and rewards of ownership of the NHA MBS have been transferred. We have determined that the sellers of NHA MBS to CHT failed to meet the derecognition criteria as they retain the risk and rewards of the NHA MBS through swap agreements. As a result, we do not recognize the underlying NHA MBS in the consolidated balance sheet but rather account for the transfer as a loan.
USE OF ESTIMATES AND ASSUMPTIONS
The preparation of our consolidated financial statements requires Management to make estimates and assumptions that affect the reported amount of revenues, expenses, assets and liabilities, and the accompanying disclosures. The key assumptions concerning the future and other key sources of estimation uncertainty at the reporting date that have a significant risk of causing a material adjustment to the carrying amounts of assets and liabilities within the next financial year are discussed below. We based our assumptions and estimates on information available when the consolidated financial statements were prepared. Existing circumstances and assumptions about future developments, however, may change due to market changes or circumstances arising that are beyond the control of the Corporation. Such changes are reflected in the assumptions when they occur.
PROVISION FOR CLAIMS
The provision at 31 December is determined by the Appointed Actuary and the main actuarial assumptions are long-term assumptions for probability of default, loss given default and timing of the related cash flows, which are adjusted for the short-term impact of current economic conditions.
Historical experience, grouped by product and age of loans, adjusted for related changes to our insurance products and processes, is used throughout the Actuarial Valuation. The process of determining the provision necessarily involves risks that the actual results will deviate, and in certain cases significantly, from the estimates made. In addition, there is a risk that the timing of future liability payments or return on investments will differ materially from the assumptions underlying the valuation of insurance policy liabilities.
The estimate for claims that are IBNR is made using historical losses and defaults adjusted to consider prevailing legal, economic, and regulatory trends; this estimate is generally subject to a greater degree of uncertainty than that for reported claims. The provision for IBNER is estimated from the payment pattern of the supplementary amounts on open claims. The losses on CIP are estimated by multiplying the insured loan amount by the calculated average loss level.
Due to the uniqueness of the programs through which the SH and ILM loans are made, the provision for these loans is determined using the current outstanding balances of the insured loans and estimated loss factors based on the loans’ current standing and characteristics, and it reflects the estimated future costs of settling all the liabilities.
UNEARNED PREMIUMS
Mortgage loan insurance premiums are due at the inception of the mortgage being insured, at which time they are deferred and recognized as revenue over the period covered by the related insurance contracts using factors determined annually by the Appointed Actuary. The premium earnings factors are based on claim occurrence patterns under the assumption that premiums would be earned and hence recognized into revenue at the same rate as claims are incurred. Distinct earning patterns are applied to product types that exhibit substantially different claim occurrence patterns. Claim occurrence patterns are based on long-term historical claim data sorted by age of loans.
The earnings patterns are linked to claim occurrence patterns. As of the fourth quarter of 2016, we changed our estimate of earnings patterns to be directly based on incurred claim development.
| | | | |
| 2017 ANNUAL REPORT | | | | 65 |
FAIR VALUE MEASUREMENT OF FINANCIAL INSTRUMENTS
When the fair values of financial assets and financial liabilities recorded in the consolidated balance sheet cannot be measured based on quoted prices in active markets, their fair value is measured using valuation techniques such as discounted cash flow, spread differential or other valuation models. These models include a degree of judgment in consideration of inputs such as yield curves, market spreads and risk premiums with reference to financial instruments that have similar yields, market risk and maturity characteristics. Changes in assumptions relating to these factors could affect the reported fair value of financial instruments.
VALUATION OF PENSION BENEFIT OBLIGATION
The cost of the defined benefit pension plan and the present value of the pension obligation are determined using actuarial valuations. The actuarial valuation involves making various assumptions that may differ from actual developments in the future. These include the determination of the discount rate, rate of compensation increase, mortality rates and inflation. Due to the complexities involved in the valuation and its long-term nature, a defined benefit obligation is highly sensitive to changes in these assumptions. All assumptions are reviewed at each reporting date.
The assumption most sensitive to change is the discount rate. In determining the appropriate discount rate, Management considers the interest rates of Canadian dollar corporate bonds with an ‘AA’ rating and extrapolated as needed along the yield curve to correspond with the expected term of the defined benefit obligation. The mortality rate is based on publicly available Public Sector mortality tables for Canada.
5. SEGMENTED INFORMATION
CMHC’s operating segments include the Assisted Housing Activity, the Mortgage Loan Insurance Activity, the Securitization Activity and the activities of CHT. These operating segments are supported by the Market Analysis and Research and People and Processes Activities. As described in Note 1, we have determined our reportable segments as Assisted Housing, Mortgage Loan Insurance and Securitization.
Our Chief Operating Decision Maker (CODM) is the Corporation’s Executive Committee. Our CODM monitors the operating results of the activities separately for the purpose of making decisions about resource allocation and performance assessment. Segment performance is evaluated based on financial and non financial metrics that are tied to the objectives of each Activity and may differ by Activity.
The Assisted Housing Activity includes Housing and Lending programs which share many similarities and satisfy the same objective of supporting access to affordable housing for Canadians in need. Our CODM allocates resources and assess performance of the Housing and Lending programs as one. Housing programs are administered either directly by CMHC or by provinces and territories under Social Housing Agreements (SHA) and Investment in Affordable Housing, while Lending program loans are made to federally-subsidized social housing sponsors, First Nations, provinces, territories and municipalities. Assisted Housing revenues are earned from interest income on loans and also include parliamentary appropriations.
The Mortgage Loan Insurance Activity provides mortgage loan insurance for transactional homeowner, portfolio and multi-unit residential loans in all parts of Canada. We operate these programs on a commercial basis with due regard for loss without the need for funding from the Government. Mortgage loan insurance revenues are earned from premiums, fees and investment income.
The Securitization Activity provides timely payment guarantees of interest and principal of securities issued on the basis of eligible housing loans and on CMB. The guarantees are provided on a commercial basis.
CHT’s functions include the acquisition of interests in eligible housing loans such as NHA MBS, the issuance of CMB, as well as the purchase of highly rated investments and certain related financial hedging activities.
For the purposes of our segmented reporting, our Securitization Activity and CHT, a separate entity, are aggregated in the Securitization reportable segment. Accordingly, Securitization revenues are earned from guarantee and application fees, investment income and interest income on loans.
Market Analysis and Research and People and Processes are not separate segments but their costs are allocated to our operating segments. Market Analysis and Research activities are cost recovered and presented within the financial results of the Assisted Housing and Mortgage Loan Insurance segments. People and Processes activities expenses are presented within the financial results of the Assisted Housing, Mortgage Loan Insurance and Securitization segments.
For all segments, revenues are attributed to, and assets are located in, Canada.
AGGREGATION OF THE SECURITIZATION ACTIVITY AND CHT
The Securitization Activity and CHT both support our objective of ensuring adequate supply of funds for mortgage lending through mortgage securitization. Through the CMB program in its entirety (including the guarantee by Securitization), we contribute to the stability of the financial system by allowing lenders to access funds for residential mortgage lending.
| | | | |
| 66 | | | | CANADA MORTGAGE AND HOUSING CORPORATION |
Both segments’ business is generated by market demand for CMHC’s timely payment guarantee for mortgage funding through NHA MBS and through CMB issued by CHT. Revenue for the reportable segment is generated through timely payment guarantees, application fees and interest income.
There are many similarities in the nature of the production processes, customers and methods of distribution. CMB are available to both institutional investors and retail investors and can be bought through investment dealers, banks, trust companies, and other types of financial institutions. The guarantee takes effect at issuance.
| | | | | | | | | | | | | | | | | | | | | | | | | | | | | | | | | | | | | | | | |
| | | ASSISTED
HOUSING
ACTIVITY | | | MORTGAGE LOAN
INSURANCE
ACTIVITY | | | SECURITIZATION
ACTIVITY | | | ELIMINATIONS | | | TOTAL | |
| (IN MILLIONS) | | 2017 | | | 2016 | | | 2017 | | | 2016 | | | 2017 | | | 2016 | | | 2017 | | | 2016 | | | 2017 | | | 2016 | |
Interest income | | | 374 | | | | 435 | | | | – | | | | – | | | | 4,339 | | | | 4,167 | | | | (5) | | | | (4) | | | | 4,708 | | | | 4,598 | |
Interest expense | | | 361 | | | | 422 | | | | – | | | | – | | | | 4,331 | | | | 4,158 | | | | (123) | | | | (114) | | | | 4,569 | | | | 4,466 | |
Net interest income | | | 13 | | | | 13 | | | | – | | | | – | | | | 8 | | | | 9 | | | | 118 | | | | 110 | | | | 139 | | | | 132 | |
Parliamentary appropriations for housing programs | | | 3,229 | | | | 2,153 | | | | – | | | | – | | | | – | | | | – | | | | – | | | | – | | | | 3,229 | | | | 2,153 | |
Premiums and fees earned | | | – | | | | – | | | | 1,557 | | | | 1,505 | | | | 384 | | | | 284 | | | | – | | | | – | | | | 1,941 | | | | 1,789 | |
Investment income (losses) | | | – | | | | – | | | | 607 | | | | 594 | | | | 48 | | | | 43 | | | | (82) | | | | (73) | | | | 573 | | | | 564 | |
Net gains (losses) on financial instruments | | | – | | | | (56) | | | | 152 | | | | 60 | | | | (1) | | | | 2 | | | | (4) | | | | (57) | | | | 147 | | | | (51) | |
Other income | | | 113 | | | | 34 | | | | 4 | | | | (2) | | | | 6 | | | | 6 | | | | – | | | | – | | | | 123 | | | | 38 | |
Total revenues and parliamentary appropriations | | | 3,355 | | | | 2,144 | | | | 2,320 | | | | 2,157 | | | | 445 | | | | 344 | | | | 32 | | | | (20) | | | | 6,152 | | | | 4,625 | |
Non-interest expenses | | | | | | | | | | | | | | | | | | | | | | | | | | | | | | | | | | | | | | | | |
Housing programs | | | 3,229 | | | | 2,153 | | | | – | | | | – | | | | – | | | | – | | | | – | | | | – | | | | 3,229 | | | | 2,153 | |
Insurance claims | | | – | | | | – | | | | 147 | | | | 334 | | | | – | | | | – | | | | – | | | | – | | | | 147 | | | | 334 | |
Operating expenses | | | 27 | | | | 17 | | | | 318 | | | | 256 | | | | 51 | | | | 46 | | | | – | | | | – | | | | 396 | | | | 319 | |
Total expenses | | | 3,256 | | | | 2,170 | | | | 465 | | | | 590 | | | | 51 | | | | 46 | | | | – | | | | – | | | | 3,772 | | | | 2,806 | |
Income (loss) before income taxes | | | 99 | | | | (26) | | | | 1,855 | | | | 1,567 | | | | 394 | | | | 298 | | | | 32 | | | | (20) | | | | 2,380 | | | | 1,819 | |
Income taxes | | | 19 | | | | (12) | | | | 451 | | | | 384 | | | | 99 | | | | 74 | | | | 8 | | | | (5) | | | | 577 | | | | 441 | |
Net income (loss) | | | 80 | | | | (14) | | | | 1,404 | | | | 1,183 | | | | 295 | | | | 224 | | | | 24 | | | | (15) | | | | 1,803 | | | | 1,378 | |
Total revenues and parliamentary appropriations | | | 3,355 | | | | 2,144 | | | | 2,320 | | | | 2,157 | | | | 445 | | | | 344 | | | | 32 | | | | (20) | | | | 6,152 | | | | 4,625 | |
Inter-segment income (loss) 1 | | | (3) | | | | (5) | | | | (88) | | | | (129) | | | | 123 | | | | 114 | | | | (32) | | | | 20 | | | | – | | | | – | |
External revenues and parliamentary appropriations | | | 3,352 | | | | 2,139 | | | | 2,232 | | | | 2,028 | | | | 568 | | | | 458 | | | | – | | | | – | | | | 6,152 | | | | 4,625 | |
1 Inter-segment income relates to the following:
● The Assisted Housing Activity recognizes revenues from investing in holdings of CMB;
● The Mortgage Loan Insurance Activity recognizes revenues from investing in holdings of CMB and holdings of Capital Market Borrowings; and
● Within the Securitization Activity, CHT recognizes interest expense on CMBs held by the Assisted Housing and Mortgage Loan Insurance Activities
| | | | |
| 2017 ANNUAL REPORT | | | | 67 |
| | | | | | | | | | | | | | | | | | | | | | | | | | | | | | | | | | | | | | | | |
| | | ASSISTED
HOUSING
ACTIVITY | | | MORTGAGE LOAN
INSURANCE
ACTIVITY | | | SECURITIZATION
ACTIVITY | | | ELIMINATIONS 1 | | | TOTAL | |
| (IN MILLIONS) | | 2017 | | | 2016 | | | 2017 | | | 2016 | | | 2017 | | | 2016 | | | 2017 | | | 2016 | | | 2017 | | | 2016 | |
Assets | | | | | | | | | | | | | | | | | | | | | | | | | | | | | | | | | | | | | | | | |
Cash and cash equivalents | | | 519 | | | | 1,101 | | | | 342 | | | | 704 | | | | 26 | | | | 190 | | | | – | | | | – | | | | 887 | | | | 1,995 | |
Securities purchased under resale agreements | | | – | | | | 17 | | | | – | | | | – | | | | – | | | | – | | | | – | | | | – | | | | – | | | | 17 | |
Investment securities: | | | | | | | | | | | | | | | | | | | | | | | | | | | | | | | | | | | | | | | | |
Designated at fair value through profit or loss | | | 1,630 | | | | 1,499 | | | | 1 | | | | 73 | | | | – | | | | 1 | | | | (397) | | | | (400) | | | | 1,234 | | | | 1,173 | |
Available for sale | | | – | | | | – | | | | 22,689 | | | | 24,523 | | | | 3,608 | | | | 2,937 | | | | (4,185) | | | | (4,234) | | | | 22,112 | | | | 23,226 | |
Derivatives | | | 51 | | | | 86 | | | | 10 | | | | – | | | | – | | | | – | | | | – | | | | – | | | | 61 | | | | 86 | |
Loans: | | | | | | | | | | | | | | | | | | | | | | | | | | | | | | | | | | | | | | | | |
Designated at fair value through profit or loss | | | 2,906 | | | | 4,021 | | | | – | | | | – | | | | – | | | | – | | | | – | | | | (1) | | | | 2,906 | | | | 4,020 | |
Loans and receivables | | | 4,158 | | | | 3,995 | | | | – | | | | – | | | | 233,786 | | | | 223,315 | | | | – | | | | – | | | | 237,944 | | | | 227,310 | |
Accrued interest receivable | | | 140 | | | | 162 | | | | 140 | | | | 149 | | | | 439 | | | | 407 | | | | (14) | | | | (13) | | | | 705 | | | | 705 | |
Due from the Government of Canada | | | 126 | | | | 59 | | | | – | | | | – | | | | – | | | | – | | | | – | | | | – | | | | 126 | | | | 59 | |
Investment property | | | 256 | | | | 169 | | | | 49 | | | | 98 | | | | – | | | | – | | | | – | | | | – | | | | 305 | | | | 267 | |
Accounts receivable and other assets | | | 163 | | | | 63 | | | | 618 | | | | 518 | | | | 54 | | | | 92 | | | | – | | | | 1 | | | | 835 | | | | 674 | |
| | | | 9,949 | | | | 11,172 | | | | 23,849 | | | | 26,065 | | | | 237,913 | | | | 226,942 | | | | (4,596) | | | | (4,647) | | | | 267,115 | | | | 259,532 | |
Liabilities | | | | | | | | | | | | | | | | | | | | | | | | | | | | | | | | | | | | | | | | |
Securities sold under repurchase agreements | | | – | | | | – | | | | 297 | | | | 704 | | | | – | | | | – | | | | – | | | | – | | | | 297 | | | | 704 | |
Derivatives | | | 26 | | | | 32 | | | | 13 | | | | – | | | | – | | | | – | | | | – | | | | – | | | | 39 | | | | 32 | |
Borrowings: | | | | | | | | | | | | | | | | | | | | | | | | | | | | | | | | | | | | | | | | |
Designated at fair value through profit or loss | | | 4,564 | | | | 5,908 | | | | – | | | | – | | | | – | | | | – | | | | – | | | | (3) | | | | 4,564 | | | | 5,905 | |
Other financial liabilities | | | 4,350 | | | | 4,327 | | | | – | | | | – | | | | 233,786 | | | | 223,315 | | | | (4,544) | | | | (4,486) | | | | 233,592 | | | | 223,156 | |
Accrued interest payable | | | 129 | | | | 154 | | | | – | | | | – | | | | 430 | | | | 399 | | | | (14) | | | | (11) | | | | 545 | | | | 542 | |
Dividend payable | | | – | | | | – | | | | 2,000 | | | | – | | | | – | | | | – | | | | – | | | | – | | | | 2,000 | | | | – | |
Accounts payable and other liabilities | | | 429 | | | | 391 | | | | 101 | | | | 113 | | | | 31 | | | | 44 | | | | – | | | | – | | | | 561 | | | | 548 | |
Provision for claims | | | – | | | | – | | | | 555 | | | | 654 | | | | – | | | | – | | | | – | | | | – | | | | 555 | | | | 654 | |
Unearned premiums and fees | | | – | | | | – | | | | 5,352 | | | | 5,472 | | | | 1,335 | | | | 1,092 | | | | – | | | | – | | | | 6,687 | | | | 6,564 | |
Defined benefit plans liability | | | 181 | | | | 158 | | | | 266 | | | | 226 | | | | 3 | | | | – | | | | – | | | | – | | | | 450 | | | | 384 | |
Deferred income tax liabilities | | | 36 | | | | 6 | | | | 68 | | | | 80 | | | | (8) | | | | 6 | | | | (12) | | | | (39) | | | | 84 | | | | 53 | |
| | | | 9,715 | | | | 10,976 | | | | 8,652 | | | | 7,249 | | | | 235,577 | | | | 224,856 | | | | (4,570) | | | | (4,539) | | | | 249,374 | | | | 238,542 | |
Equity of Canada | | | 234 | | | | 196 | | | | 15,197 | | | | 18,816 | | | | 2,336 | | | | 2,086 | | | | (26) | | | | (108) | | | | 17,741 | | | | 20,990 | |
| | | | 9,949 | | | | 11,172 | | | | 23,849 | | | | 26,065 | | | | 237,913 | | | | 226,942 | | | | (4,596) | | | | (4,647) | | | | 267,115 | | | | 259,532 | |
| | 1 | The balance sheet eliminations remove inter-segment holdings of CMB and Capital Market Borrowings, as well as inter-segment receivables/payables. |
| | | | |
| 68 | | | | CANADA MORTGAGE AND HOUSING CORPORATION |
6. PARLIAMENTARY APPROPRIATIONS AND HOUSING PROGRAMS EXPENSES
Parliamentary appropriations were used to fund the following housing programs expenses, including operating expenses incurred to support these programs.
| | | | | | | | |
| (IN MILLIONS) | | 2017 | | | 2016 | |
Funding under long-term commitments for existing social housing | | | 1,630 | | | | 1,712 | |
Funding for new commitments of affordable housing | | | 1,447 | | | | 359 | |
Housing support | | | 90 | | | | 26 | |
Housing policy, research and information transfer | | | 35 | | | | 32 | |
Market analysis information | | | 27 | | | | 24 | |
Total | | | 3,229 | | | | 2,153 | |
Of the total amount expensed on Housing programs, $916 million (2016 – $878 million) was provided for programs transferred to provinces/ territories under SHA. Under the SHA, the province/territory assumes our financial and other obligations with respect to these programs in exchange for pre-determined annual funding. The accountability framework requires the province/territory to provide an audited Annual Statement of Funding and Expenditures and an Annual Program Performance Report. This funding may become repayable by the provinces/ territories if the amounts are not used in accordance with the terms and conditions of the SHA.
Housing programs expenses also include related party transactions between the Government and us for the reimbursement of:
| · | | Our operating expenses incurred to support and administer the Housing programs, not exceeding the maximum parliamentary appropriations voted by Parliament; |
| · | | Interest rate losses resulting from certain loans made that contain interest rate clauses that are lower than the associated interest cost on the related borrowings; |
| · | | Operating losses on certain investments in housing programs and real estate properties; and |
| · | | Default losses on certain loans as well as net disposal losses on certain investments in housing programs and real estate properties. |
The following table summarizes the nature of these expenses reimbursed by the Government.
| | | | | | | | |
| (IN MILLIONS) | | 2017 | | | 2016 | |
Operating expenses | | | 161 | | | | 146 | |
Interest rate losses | | | 104 | | | | 79 | |
Default and disposal losses | | | – | | | | 2 | |
Total | | | 265 | | | | 227 | |
The total reimbursement for interest losses includes $89 million (2016 – $54 million) towards our losses incurred as a result of the prepayment and repricing activity on loans.
The following table presents the change in the due from the Government of Canada account. The outstanding balance as at 31 December 2017 is mainly composed of Housing programs expenses incurred but not yet reimbursed.
| | | | | | | | |
| (IN MILLIONS) | | 2017 | | | 2016 | |
Balance at beginning of year | | | 59 | | | | 161 | |
Total appropriations recognized in revenues during the year | | | 3,229 | | | | 2,153 | |
Total appropriations received during the year | | | (3,162) | | | | (2,254) | |
Third party reimbursements in excess of remittance to Government of Canada | | | – | | | | (1) | |
Balance at end of year | | | 126 | | | | 59 | |
| | | | |
| 2017 ANNUAL REPORT | | | | 69 |
7. MORTGAGE LOAN INSURANCE
MORTGAGE LOAN INSURANCE RISK MANAGEMENT
We assume the risk of loss from borrower default through mortgage insurance contracts entered into with Approved Lenders, exposing us to uncertainty surrounding the timing, frequency and severity of claims. Insurance risk management policies are in place to identify, mitigate, report and monitor this risk to ensure activities are managed within our risk appetite, tolerances and risk limits to successfully deliver on our mandate and meet our strategic directions.
We manage our exposure to insurance risk of loss through prudent product design, pricing, insurance underwriting policies, claims payment and default management, reserving, fraud and misrepresentation risk management, market diversification and borrower review and monitoring for the multi-unit portfolio and homeowner portfolios.
PRODUCT DESIGN
The development of mortgage loan insurance products takes into account changing client needs, new legislation and regulations, the evolving economic environment and our mandate to serve Canadians across the country, particularly in those market segments not served or less well-served by the private sector. Product design is based on prudent underwriting practices combined with our goal to ensure that creditworthy borrowers have access to mortgage loan insurance products that meet their needs.
PRICING
Premiums are set based on projections of claim frequency, claim severity, return on investment, operating expenses, taxes, capital targets, profitability considerations and market demand. In addition, pricing decisions also take into account other considerations related to competition, strategic direction and CMHC’s public mandate. Pricing risk refers to the potential that these projections and considerations may substantively and persistently differ from actual developments and values in the long term, which could have significant implications for CMHC’s risk of loss, profitability and achievement of mandate.
At least annually, we conduct a pricing review of our products to: i) ensure they support Canadians in meeting their housing needs for a wide range of housing types and tenures; ii) support the profitability and long-term viability of the Mortgage Loan Insurance activities; iii) foster competition; iv) support financial stability; and v) be in line with our risk appetite and tolerances.
INSURANCE UNDERWRITING POLICIES
Risks related to underwriting could arise from: i) the lender; ii) the borrower; iii) the property; and/or iv) the market. As a result, we have developed prudent and disciplined underwriting policies and guidelines which set the contractual framework and general obligations with respect to underwriting, provides Approved Lenders with underwriting criteria for mortgage loan insurance and also includes policies to obtain the Approved Lender designation.
In addition, for transactional homeowner products, risks related to insurance for different types of residential properties are assessed using our mortgage loan insurance risk assessment methodology and a rigorous underwriting and post-approval due diligence process.
In the case of multi-unit underwriting, due to different risk characteristics, applications undergo additional individual in-depth assessments to evaluate borrower, property, market and loan characteristics by our underwriters.
CLAIMS PAYMENT AND DEFAULT MANAGEMENT
Our Claims Payment Centre supports Approved Lenders in managing default related to homeowner and small rental loans to reduce risk of default on payment.
Regional centers work with Approved Lenders for multi-unit residential rental, licensed care or retirement properties in resolving default situations, evaluating workout alternatives and other matters. We consider workouts through effective management of projects in difficulty by following established frameworks.
We actively pursue recoveries, which are amounts expected to be recovered from borrowers in order to mitigate our potential loss.
RESERVING
Reserving risk refers to the risk that insurance liabilities differ significantly from the actual claim payments. We estimate insurance policy liabilities to cover future losses and payments on claims arising from our insurance activity. These policy liabilities are established based on projections of claim frequency, severity and timing, within the context of the economic environment and recent performance indicators such as arrears rates.
FRAUD AND MISREPRESENTATION RISK MANAGEMENT
Fraud risk management comprises all activities aiming to detect and prevent fraud or misrepresentation and mitigating losses due to fraud or misrepresentation. We mitigate fraud using models to identify mortgage loan applications that have a high probability of containing misrepresentation and taking the appropriate measures upon identification. We maintain specialized underwriting staff to review these claims and, if appropriate, require enhanced due diligence by the lender.
| | | | |
| 70 | | | | CANADA MORTGAGE AND HOUSING CORPORATION |
MARKET DIVERSIFICATION
Concentration risk may arise from insurance contracts issued in a particular geographical area where local economic conditions are significantly different from the national average that could expose the Corporation to a greater risk of loss. The relative impact of the outcome is mitigated as a result of the distribution of business across different geographic areas. We monitor the conditions of the housing market and economy in each region of Canada against pre-determined risk tolerances.
The table below sets out the concentration of loan amount insured during the period:
| | | | | | | | | | | | | | | | |
| | | | | 2017 | | | | | | | | 2016 | | | | |
| (IN PERCENTAGES) | | TRANSACTIONAL
HOMEOWNER | | PORTFOLIO | | MULTI-UNIT
RESIDENTIAL | | OVERALL | | TRANSACTIONAL
HOMEOWNER | | PORTFOLIO | | MULTI-UNIT
RESIDENTIAL | | OVERALL |
Atlantic | | 5.4 | | 1.1 | | 3.2 | | 4.4 | | 5.2 | | 2.5 | | 7.8 | | 4.6 |
Quebec | | 26.4 | | 20.0 | | 33.4 | | 27.4 | | 23.1 | | 16.7 | | 27.9 | | 21.5 |
Ontario | | 31.0 | | 53.9 | | 39.6 | | 35.7 | | 32.8 | | 46.3 | | 38.7 | | 38.0 |
Prairies and territories | | 26.0 | | 11.9 | | 9.3 | | 20.3 | | 26.4 | | 14.3 | | 12.8 | | 20.7 |
British Columbia | | 11.2 | | 13.1 | | 14.5 | | 12.2 | | 12.5 | | 20.2 | | 12.8 | | 15.2 |
Canada | | 100 | | 100 | | 100 | | 100 | | 100 | | 100 | | 100 | | 100 |
MONITORING
A comprehensive monitoring and quality assurance framework also enables CMHC’s ongoing rigorous review of business trends, performance and lender compliance in order to make timely adjustments to underwriting and other risk management criteria and processes as needed.
INSURANCE-IN-FORCE
At 31 December 2017, insurance-in-force, which represents the maximum potential total risk exposure of the Mortgage Loan Insurance Activity, totaled $480 billion (2016 – $512 billion). This amount includes $458 million (2016 – $608 million) in outstanding loan balances from the Lending programs included in the Assisted Housing Activity (refer to Note 13).
Under Section 11 of the NHA, the total of outstanding insured amounts of all insured loans may not exceed $600 billion (2016 – $600 billion).
The following table presents the percentage distribution of insurance-in-force by region:
| | | | | | | | | | | | | | | | |
| | | | | 2017 | | | | | | | | 2016 | | | | |
| (IN PERCENTAGES) | | TRANSACTIONAL
HOMEOWNER | | PORTFOLIO | | MULTI-UNIT
RESIDENTIAL | | OVERALL | | TRANSACTIONAL
HOMEOWNER | | PORTFOLIO | | MULTI-UNIT
RESIDENTIAL | | OVERALL |
Atlantic | | 6.6 | | 3.8 | | 5.7 | | 5.5 | | 6.5 | | 3.7 | | 6.0 | | 5.4 |
Quebec | | 22.0 | | 13.1 | | 28.9 | | 20 | | 20.6 | | 12.9 | | 29.3 | | 18.9 |
Ontario | | 30.4 | | 47.0 | | 36.6 | | 36.9 | | 31.9 | | 47.2 | | 35.0 | | 37.8 |
Prairies and territories | | 29.6 | | 18.4 | | 15.8 | | 23.9 | | 28.6 | | 18.1 | | 17.4 | | 23.4 |
British Columbia | | 11.4 | | 17.7 | | 13 | | 13.7 | | 12.4 | | 18.1 | | 12.3 | | 14.5 |
Canada | | 100 | | 100 | | 100 | | 100 | | 100 | | 100 | | 100 | | 100 |
ROLE OF THE APPOINTED ACTUARY
The Appointed Actuary is an external actuary and a Fellow of the Canadian Institute of Actuaries (FCIA) appointed by the Corporation to carry out a valuation of the policy liabilities (provision for claims and unearned premiums) as at 30 September. The factors and techniques used in the valuation are in accordance with Canadian accepted actuarial practice, applicable legislation, and associated regulations. The Appointed Actuary also performs a roll-forward of the provision for claims from the date of the actuarial valuation to 31 December.
EARNED AND UNEARNED PREMIUMS AND FEES
The following table presents the composition of premiums and fees earned.
| | | | | | | | |
| (IN MILLIONS) | | 2017 | | | 2016 | |
Earned premiums | | | 1,530 | | | | 1,482 | |
Earned application fees 1 | | | 27 | | | | 23 | |
Total | | | 1,557 | | | | 1,505 | |
| | 1 | Includes previously unearned application fees on multi-unit residential loans recognized in the year, as well as low loan-to-value transactional homeowner application fees which are earned as received. |
| | | | |
| 2017 ANNUAL REPORT | | | | 71 |
The following table presents the changes in the unearned premiums and fees balance.
| | | | | | | | |
| (IN MILLIONS) | | 2017 | | | 2016 | |
Balance at beginning of year | | | 5,472 | | | | 5,432 | |
Premiums deferred on contracts written in the year | | | 1,407 | | | | 1,519 | |
Premiums earned in the year | | | (1,530) | | | | (1,482) | |
Application fees deferred on contracts written in the year | | | 16 | | | | 17 | |
Application fees earned in the year | | | (13) | | | | (14) | |
Balance at end of year | | | 5,352 | | | | 5,472 | |
DEFERRED ACQUISITION COSTS The following table presents the changes in the DAC balance. | | | | | | | | |
| (IN MILLIONS) | | 2017 | | | 2016 | |
Balance at beginning of year | | | 149 | | | | 127 | |
Acquisition costs deferred | | | 61 | | | | 60 | |
Amortization of deferred acquisition costs | | | (45) | | | | (38) | |
Balance at end of year 1 | | | 165 | | | | 149 | |
| | 1 | Balance is accounted for in accounts receivable and other assets (Note 20). |
PROVISION FOR CLAIMS
The provision for claims includes amounts set aside for IBNR claims, IBNER claims, CIP and SH and ILM.
Provision for claims comprises the following:
| | | | | | | | | | | | | | | | | | | | | | | | |
| | | | | | 2017 | | | | | | | | | 2016 | | | | |
| (IN MILLIONS) | | IBNR, IBNER
AND CIP | | | SH AND ILM | | | TOTAL | | | IBNR, IBNER
AND CIP | | | SH AND ILM | | | TOTAL | |
Undiscounted estimated losses | | | 364 | | | | 158 | | | | 522 | | | | 446 | | | | 154 | | | | 600 | |
Discounting | | | (6) | | | | (17) | | | | (23) | | | | (5) | | | | – | | | | (5) | |
Discounted provision for adverse deviation | | | 27 | | | | 29 | | | | 56 | | | | 34 | | | | 25 | | | | 59 | |
Total provision for claims | | | 385 | | | | 170 | | | | 555 | | | | 475 | | | | 179 | | | | 654 | |
The following table presents the changes in the provision for claims balance. | | | | | | | | | | | | | |
| | | | | | 2017 | | | | | | | | | 2016 | | | | |
| (IN MILLIONS) | | IBNR, IBNER
AND CIP | | | SH AND ILM | | | TOTAL | | | IBNR, IBNER
AND CIP | | | SH AND ILM | | | TOTAL | |
Provision for claims, beginning of year | | | 475 | | | | 179 | | | | 654 | | | | 485 | | | | 223 | | | | 708 | |
Net claims paid during the year | | | (329) | | | | (1) | | | | (330) | | | | (377) | | | | (4) | | | | (381) | |
Provision for claims provided for and losses incurred during the period 1 | | | 247 | | | | 4 | | | | 251 | | | | 306 | | | | 4 | | | | 310 | |
Unfavourable (favourable) development on prior period insurance claims | | | (8) | | | | (12) | | | | (20) | | | | 61 | | | | (44) | | | | 17 | |
Provision for claims, end of year | | | 385 | | | | 170 | | | | 555 | | | | 475 | | | | 179 | | | | 654 | |
| | 1 | Included as part of insurance claims on the consolidated statement of income and comprehensive income. Provision for claims provided for and losses may not equal insurance claims expense as certain expenses incurred do not impact the provision for claims. |
| | | | |
| 72 | | | | CANADA MORTGAGE AND HOUSING CORPORATION |
METHODOLOGY AND SIGNIFICANT FACTORS
The key method we use for estimating insurance policy liabilities is the actuarial present value basis. Policy liabilities are provided in the valuation report prepared by the Appointed Actuary and are based on assumptions and estimates as of the reporting date. There is inherent uncertainty in any estimate of ultimate liabilities including for premium deficiency, IBNR, IBNER, CIP and SH and ILM because the ultimate liability for claims is subject to the outcome of events yet to occur.
Provisions are reviewed and evaluated at each reporting period in light of emerging claim experience and changing circumstances. The resulting changes in the estimated provision for claims are recorded in insurance claims expense in the year in which they are determined. Estimates of the timing of net cash outflows resulting from our recognized insurance liabilities are provided in Note 28. As the SH and ILM programs are unique it is difficult to provide a more precise maturity profile beyond 12 months. The majority of mortgages for the SH and ILM loans have remaining amortization periods of 8 years or less.
Earning patterns are determined by product type and by amortization period. Approximately 75% of the premiums written are recognized as premiums earned within the first five years of the insurance contract.
The following factors affect the key actuarial assumptions used in the determination of the provision for claims:
| · | | Claim frequency – claim frequency, or probability of default, is dependent on the loan-to-value, the underwriting year and other characteristics of the loans insured. It reflects historical and current trends and arrears reporting; |
| · | | Claim severity – claim severity, or average loss on claims, is dependent on the dollar value of claims, losses on sales of real estate properties, administrative expenses, payment delays and sale delays. These factors are generally based on historical experience; and |
| · | | Economic conditions – recent past and projected economic factors, such as unemployment rates, house price inflation and consumer price index, affect the forecast of future claim levels. |
SENSITIVITY ANALYSIS
The following table presents the sensitivity in the significant assumptions that have the greatest effect on the measurement of the insurance contract liabilities. The percentage change in variables is applied to a range of existing actuarial modeling assumptions to derive the possible impact on income before income taxes and equity of Canada for reasonably possible movements in key loss assumptions with all other assumptions held constant. In practice, this is unlikely to occur and changes in some of the assumptions might be correlated, which might magnify or counteract the sensitivities. The relationship of a change in assumption to the change in value may not be linear. The methodology for sensitivity testing has not changed significantly from the prior year.
| | | | | | | | | | | | | | | | | | | | | | | | |
| | | | | | | | | IMPACT ON INCOME
BEFORE INCOME TAXES | | | IMPACT ON
EQUITY OF CANADA | |
(IN MILLIONS, UNLESS OTHERWISE INDICATED) | | CHANGE
INDICATOR | | | CHANGE IN
ASSUMPTIONS | | | 2017 | | | 2016 | | | 2017 | | | 2016 | |
Loss sensitivity factors | | | | | | | | | | | | | | | | | | | | | | | | |
Claim frequency | | | Relative | | | | +10% | | | | (51) | | | | (38) | | | | (38) | | | | (29) | |
| | | | Relative | | | | -10% | | | | 51 | | | | 35 | | | | 38 | | | | 26 | |
Claim severity | | | Relative | | | | +10% | | | | (51) | | | | (41) | | | | (38) | | | | (31) | |
| | | | Relative | | | | -10% | | | | 51 | | | | 37 | | | | 38 | | | | 28 | |
Economic sensitivity factor | | | | | | | | | | | | | | | | | | | | | | | | |
Unemployment rate | | | Absolute | | | | +100 bps | | | | (16) | | | | (48) | | | | (12) | | | | (36) | |
Gross domestic product 1 | | | Absolute | | | | -100 bps | | | | (10) | | | | – | | | | (8) | | | | | |
House price inflation 1 | | | Absolute | | | | -100 bps | | | | – | | | | (65) | | | | – | | | | (49) | |
Mortgage rates | | | Absolute | | | | +100 bps | | | | (8) | | | | (43) | | | | (6) | | | | (32) | |
| | 1 | In 2017, we recalibrated our model to use gross domestic product rather than house price inflation |
| | | | |
| 2017 ANNUAL REPORT | | | | 73 |
CLAIMS DEVELOPMENT
INCURRED BUT NOT REPORTED, INCURRED BUT NOT ENOUGH REPORTED AND CLAIMS IN PROCESS
The following table shows the development of the expected losses on IBNR, IBNER and CIP claims and their related expenses (excluding SH and ILM) over a period of time and the estimated ultimate cost of claims for 2009 through 2017 to present the earliest material claim that has arisen and for which there is still uncertainty about the amount and timing of claim payments. The information is presented on a default year basis where claims are related to the period in which the insured event occurred and not the period in which the policy was underwritten.
| | | | | | | | | | | | | | | | | | | | | | | | | | | | | | | | | | | | | | | | |
(IN MILLIONS, UNLESS OTHERWISE INDICATED) | | 2009 | | | 2010 | | | 2011 | | | 2012 | | | 2013 | | | 2014 | | | 2015 | | | 2016 | | | 2017 | | | TOTAL | |
Expected losses | | | | | | | | | | | | | | | | | | | | | | | | | | | | | | | | | | | | | | | | |
Default year | | | 745 | | | | 596 | | | | 551 | | | | 522 | | | | 388 | | | | 346 | | | | 303 | | | | 306 | | | | 247 | | | | | |
One year later | | | 691 | | | | 566 | | | | 499 | | | | 428 | | | | 370 | | | | 328 | | | | 324 | | | | 272 | | | | | | | | | |
Two years later | | | 711 | | | | 560 | | | | 479 | | | | 432 | | | | 372 | | | | 351 | | | | 319 | | | | | | | | | | | | | |
Three years later | | | 719 | | | | 571 | | | | 480 | | | | 439 | | | | 376 | | | | 345 | | | | | | | | | | | | | | | | | |
Four years later | | | 734 | | | | 577 | | | | 484 | | | | 440 | | | | 378 | | | | | | | | | | | | | | | | | | | | | |
Five years later | | | 716 | | | | 583 | | | | 484 | | | | 441 | | | | | | | | | | | | | | | | | | | | | | | | | |
Six years later | | | 712 | | | | 582 | | | | 488 | | | | | | | | | | | | | | | | | | | | | | | | | | | | | |
Seven years later | | | 731 | | | | 581 | | | | | | | | | | | | | | | | | | | | | | | | | | | | | | | | | |
Eight years later | | | 731 | | | | | | | | | | | | | | | | | | | | | | | | | | | | | | | | | | | | | |
Current estimate of cumulative claims | | | 731 | | | | 581 | | | | 488 | | | | 441 | | | | 378 | | | | 345 | | | | 319 | | | | 272 | | | | 247 | | | | 3,802 | |
Claims paid | | | | | | | | | | | | | | | | | | | | | | | | | | | | | | | | | | | | | | | | |
Default year | | | 56 | | | | 43 | | | | 37 | | | | 29 | | | | 22 | | | | 19 | | | | 16 | | | | 23 | | | | 19 | | | | | |
One year later | | | 391 | | | | 308 | | | | 257 | | | | 225 | | | | 194 | | | | 175 | | | | 175 | | | | 144 | | | | | | | | | |
Two years later | | | 200 | | | | 161 | | | | 135 | | | | 134 | | | | 119 | | | | 120 | | | | 95 | | | | | | | | | | | | | |
Three years later | | | 46 | | | | 43 | | | | 39 | | | | 37 | | | | 29 | | | | 23 | | | | | | | | | | | | | | | | | |
Four years later | | | 11 | | | | 20 | | | | 11 | | | | 12 | | | | 13 | | | | | | | | | | | | | | | | | | | | | |
Five years later | | | 10 | | | | 8 | | | | 3 | | | | 2 | | | | | | | | | | | | | | | | | | | | | | | | | |
Six years later | | | (5) | | | | (1) | | | | 4 | | | | | | | | | | | | | | | | | | | | | | | | | | | | | |
Seven years later | | | 20 | | | | (1) | | | | | | | | | | | | | | | | | | | | | | | | | | | | | | | | | |
Eight years later | | | 2 | | | | | | | | | | | | | | | | | | | | | | | | | | | | | | | | | | | | | |
Cumulative payments to date | | | 731 | | | | 581 | | | | 486 | | | | 439 | | | | 377 | | | | 337 | | | | 286 | | | | 167 | | | | 19 | | | | 3,423 | |
Provision for claims | | | 0 | | | | 0 | | | | 2 | | | | 2 | | | | 1 | | | | 8 | | | | 33 | | | | 105 | | | | 228 | | | | 379 | 1 |
Current estimate of surplus (deficit) | | | 14 | | | | 15 | | | | 63 | | | | 81 | | | | 10 | | | | 1 | | | | (16) | | | | 34 | | | | 0 | | | | | |
Surplus of initial expected loss on claims | | | 2% | | | | 3% | | | | 11% | | | | 16% | | | | 3% | | | | 0% | | | | (5%) | | | | 11% | | | | 0% | | | | | |
| | 1 | Excludes $6 million related to pending claims pre-2009 default years. |
INSURANCE POLICY LIABILITY ADEQUACY
Our Appointed Actuary performs a liability adequacy test on the premium liabilities and claim liabilities quarterly. Premium liabilities represent a provision for future claims and expenses which are expected to arise from the unearned portion of the policies in-force. Thus, this provision is for claims that have not yet occurred and, therefore, covers the period from the date of the valuation to the date of default (the assumed claim occurrence date).
The liability adequacy test for the Corporation for the year ended 31 December 2017 has identified that no premium deficiency reserve is required (2016 – nil).
| | | | |
| 74 | | | | CANADA MORTGAGE AND HOUSING CORPORATION |
8. SECURITIZATION
We guarantee the timely payment of principal and interest of CMB issued by CHT under the CMB program and NHA MBS issued by Approved Issuers on the basis of housing loans under the NHA MBS program in the event that an issuer is unable to satisfy its obligations under these programs. In that circumstance, we will mitigate our loss by realizing on the collateral securing the obligations under each of the programs.
At the balance sheet date, the Corporation has not received a claim on its timely payment guarantee. As such, no provision in addition to the remaining unearned premium is required.
The following table presents the changes in the unearned timely payment guarantee fees balance.
| | | | | | | | | | | | | | | | | | | | | | | | |
| | | | | | 2017 | | | | | | | | | 2016 | | | | |
| (IN MILLIONS) | | NHA MBS | | | CMB | | | TOTAL | | | NHA MBS | | | CMB | | | TOTAL | |
Balance at beginning of year | | | 648 | | | | 444 | | | | 1,092 | | | | 420 | | | | 377 | | | | 797 | |
Timely payment guarantee fees received in the year 1 | | | 479 | | | | 148 | | | | 627 | | | | 409 | | | | 170 | | | | 579 | |
Timely payment guarantee fees earned in the year 1 | | | (268) | | | | (116) | | | | (384) | | | | (181) | | | | (103) | | | | (284) | |
Balance at end of year | | | 859 | | | | 476 | | | | 1,335 | | | | 648 | | | | 444 | | | | 1,092 | |
| | 1 | Includes application and compensatory fees received and earned of $32 million (2016 – $35 million). |
GUARANTEES-IN-FORCE
The following table presents the total guarantees-in-force by program. Total guarantees-in-force represents the maximum principal obligation related to this timely payment guarantee.1
| | | | | | | | |
| (IN BILLIONS) | | 2017 | | | 2016 | |
NHA MBS | | | 244 | | | | 229 | |
CMB 2 | | | 233 | | | | 223 | |
Total | | | 477 | | | | 452 | |
| | 1 | Exposure excludes the realizable value of the related assets securing the NHA MBS and CMB guaranteed. |
| | 2 | Includes $4.6 billion (2016 – $4.6 billion) in investments which are eliminated in the consolidated balance sheet. |
The following table presents the maturity profile of the guarantees-in-force based on principal amount outstanding as at 31 December 2017.
| | | | | | | | | | | | |
| (IN MILLIONS) | | NHA MBS GUARANTEES | | | CMB GUARANTEES | | | TOTAL GUARANTEED | |
2018 | | | 23,403 | | | | 38,650 | | | | 62,053 | |
2019 | | | 39,902 | | | | 30,750 | | | | 70,652 | |
2020 | | | 63,190 | | | | 39,999 | | | | 103,189 | |
2021 | | | 71,642 | | | | 37,750 | | | | 109,392 | |
2022 | | | 43,354 | | | | 44,250 | | | | 87,604 | |
2023 and thereafter | | | 2,561 | | | | 41,750 | | | | 44,311 | |
Total | | | 244,052 | | | | 233,149 | | | | 477,201 | |
Under Section 15 of the NHA, the aggregate outstanding amount of principal guarantees may not exceed $600 billion (2016 – $600 billion). We do not expect future cash outflows from these guarantees-in-force.
| | | | |
| 2017 ANNUAL REPORT | | | | 75 |
9. STRUCTURED ENTITIES
CONSOLIDATED STRUCTURED ENTITIES
CANADA HOUSING TRUST
CHT was established in 2001 as a special-purpose trust, separate from CMHC. While we control the activities of CHT, its assets and liabilities are neither owned by nor held for our benefit. CHT’s functions are limited to the acquisition of interests in eligible housing loans such as NHA MBS, the issuance of CMB, as well as the purchase of highly rated investments and certain related financial hedging activities. The beneficiaries of the Trust, after payment of all obligations, are one or more charitable organizations. Financial information for CHT is presented in the following tables on an unconsolidated basis.
CONDENSED BALANCE SHEET
| | | | | | | | |
| (IN MILLIONS) | | 2017 | | | 2016 | |
Loans – loans and receivables | | | 233,786 | | | | 223,315 | |
Other assets | | | 431 | | | | 400 | |
Total assets | | | 234,217 | | | | 223,715 | |
Borrowings – other financial liabilities | | | 233,786 | | | | 223,315 | |
Other liabilities | | | 431 | | | | 400 | |
Total liabilities | | | 234,217 | | | | 223,715 | |
Total equity of Canada | | | – | | | | – | |
CONDENSED STATEMENT OF INCOME | | | | | | | | |
| (IN MILLIONS) | | 2017 | | | 2016 | |
Interest income – loans | | | 4,339 | | | | 4,167 | |
Interest expense | | | 4,331 | | | | 4,158 | |
Net interest income | | | 8 | | | | 9 | |
Total revenues | | | 8 | | | | 9 | |
Operating expenses | | | 8 | | | | 9 | |
Total expenses | | | 8 | | | | 9 | |
Net income | | | – | | | | – | |
During 2017 CHT incurred costs of $221 million (2016 – $243 million) on the issuance of CMB. These costs were fully reimbursed by the sellers of NHA MBS into the CMB program. Of the costs incurred in 2017, $152 million (2016 – $175 million) relates to guarantee and financial services advisor fees paid by CHT to CMHC and $69 million (2016 – $68 million) relates to other CMB issuance costs. To conform with this year’s presentation, other CMB issuance costs and the related reimbursements thereof are considered transaction costs and included in the borrowings amount at initial recognition.
10. CAPITAL MANAGEMENT
For capital management, we consider our capital available to be equal to the total equity of Canada less assets with a capital requirement of 100%.
Our primary objective with respect to capital management is to ensure that our commercial operations have adequate capital to deliver their mandate while remaining financially self-sustaining and also to follow prudent business practices and guidelines existing in the private sector as appropriate. Beyond the $25 million capital prescribed by the CMHC Act, we currently have no externally imposed minimal capital requirements; however, we voluntarily follow guidelines set out by OSFI.
We perform an Own Risk & Solvency Assessment, which is an integrated process that evaluates capital adequacy on both a regulatory and economic capital basis and is used to establish capital targets taking into consideration our strategy and risk appetite. Our ‘Own View’ of capital needs is determined by identifying our risks and evaluating whether or not an explicit amount of capital is necessary to absorb losses from each risk. With the above we have also met the requirements of the CMHC Act and the NHA.
We set an internal target for our Mortgage Loan Insurance Activity and our Securitization Activity at a level that is expected to cover all material risks. The internal target is calibrated using specified confidence intervals and is designed to provide Management with an early indication of the need to resolve financial problems. Under our Capital Management Policy, we operate at available capital levels above the internal target on all but unusual and infrequent occasions. Accordingly, we have established an operating level (holding target) for our Mortgage Loan Insurance Activity and our Securitization Activity in excess of our internal target. The operating level is calibrated using confidence intervals specified by
| | | | |
76 | | | | CANADA MORTGAGE AND HOUSING CORPORATION |
our Capital Management Policy and is designed to provide Management with adequate time to resolve financial problems before available capital decreases below the internal target.
Beginning in 2017, we started making dividend payments to the Government from our Mortgage Loan Insurance Activity to the extent there are profits and retained earnings not allocated to reserves, capitalization or to meet the needs of the Corporation for purposes of the NHA, CMHC Act or any other purpose authorized by Parliament relating to housing. However, our capital is not managed to issue a dividend. The following table presents the change in the dividend payable balance.
| | | | | | | | | | | | | | | | |
| | | DIVIDEND DECLARATIONS | | | | | | | |
| (IN MILLIONS) | | DATE | | | AMOUNT | | | AMOUNT PAID AS AT
31 DECEMBER 2017 | | | DIVIDEND PAYABLE AT 31
DECEMBER 2017 | |
2017 | | | | | | | | | | | | | | | | |
Quarter 1 dividend | | | 17 May | | | | 145 | | | | 145 | | | | – | |
Special dividend 1 | | | 29 June | | | | 4,000 | | | | 2,000 | | | | 2,000 | |
Quarter 2 dividend | | | 23 August | | | | 240 | | | | 240 | | | | – | |
Quarter 3 dividend | | | 20 November | | | | 290 | | | | 290 | | | | – | |
| | | | | | | | 4,675 | | | | 2,675 | | | | 2,000 | |
| | 1 | To be paid over a period not to exceed two years from the declaration date. |
There have been no changes to our internal guidelines in what is considered to be capital or the objectives of managing capital during the year. However, there has been a change in external guidelines that affects our Mortgage Loan Insurance Activity, as noted below.
The components of consolidated capital available are presented below.
| | | | | | | | |
| (IN MILLIONS) | | 2017 | | | 2016 | |
Contributed capital | | | 25 | | | | 25 | |
Accumulated other comprehensive income | | | 490 | | | | 761 | |
Appropriated retained earnings | | | 14,918 | | | | 11,956 | |
Unappropriated retained earnings 1 | | | 2,308 | | | | 8,248 | |
Total equity of Canada 2 | | | 17,741 | | | | 20,990 | |
Less: assets with a capital requirement of 100% | | | (10) | | | | (200) | |
Total capital available | | | 17,731 | | | | 20,790 | |
| | 1 | Unappropriated retained earnings represents retained earnings in excess of our operating level for the Mortgage Loan Insurance and Securitization Activities. |
| | 2 | Equity of Canada includes the impact of eliminations. |
MORTGAGE LOAN INSURANCE CAPITAL
The appropriated retained earnings of the Mortgage Loan Insurance Activity is based on our Board-approved Capital Management Policy, which follows guidelines developed by OSFI. OSFI’s minimum regulatory capital requirement is 100% of its Minimum Capital Test (MCT). The OSFI Supervisory target is 150% of the minimum capital required. We set an internal target above the Supervisory capital required under OSFI guidelines.
OSFI’s revised capital advisory for mortgage insurers, titled Capital Requirements for Federally Regulated Mortgage Insurers (Advisory), came into effect on 1 January 2017. The objective of the Advisory was to introduce a new standard approach that updates the capital requirements for mortgage insurance risk and increases the probability that mortgage insurance companies can absorb severe but plausible losses. The framework is more risk sensitive and incorporates additional risk attributes, including credit score, remaining amortization, and outstanding loan balance.
The Advisory includes transitional arrangements to allow for a smooth transition to the new framework. Although the Advisory requires us to make use of these transitional arrangements, they are not considered in how we manage capital.
The Board of Directors approved a change to the insurance internal target from 205% of minimum capital required under the old MCT framework to 155% under the new MCT framework, and a change to the operating level from 220% under the old MCT framework to 165% under the new MCT framework. The Corporation implemented the revised MCT capital requirements and targets on 1 January 2017.
At 31 December 2016, the operating level of 220% required that we appropriate $10,653 million under the old MCT framework, which resulted in a capital available to minimum capital required of 384%. Applying the new MCT framework excluding transitional arrangements at 31 December 2016 for purposes of comparison, the operating level of 165% would have required that we appropriate $14,865 million, which would have resulted in a capital available to minimum capital required of 209% as at 31 December 2016.
| | | | |
| 2017 ANNUAL REPORT | | | | 77 |
The following table presents the components of capital available.
| | | | | | | | |
| (IN MILLIONS, UNLESS OTHERWISE INDICATED) | | 2017 | | | 2016 | |
Accumulated other comprehensive income | | | 477 | | | | 766 | |
Appropriated retained earnings | | | 13,171 | | | | 9,887 | |
Appropriated capital 1 | | | 13,648 | | | | 10,653 | |
Unappropriated capital | | | 1,549 | | | | 8,163 | |
Total mortgage loan insurance capital | | | 15,197 | | | | 18,816 | |
Less: assets with a capital requirement of 100% | | | (10) | | | | (200) | |
Total mortgage loan insurance capital available | | | 15,187 | | | | 18,616 | |
Internal target | | | 155% | | | | 205% | |
Operating level | | | 165% | | | | 220% | |
Capital available to minimum capital required (% MCT) 2 | | | 184% | | | | 384% | |
| | 1 | We appropriate retained earnings and AOCI at the operating level of 165% of MCT. |
| | 2 | We have not made use of transitional arrangements as provided by the OSFI Advisory. Our MCT ratio as at 31 December 2017 would be 211% with transitional arrangements. |
SECURITIZATION CAPITAL
Capital related to the Securitization Activity is appropriated for the guarantees provided by our NHA MBS and CMB programs. There is no regulatory capital and the appropriated amount of capital is based on our ‘Own View’, as outlined above. As at 31 December 2017, the Securitization Activity had capital available of $2,336 million or 135% of the capital required (2016 – $2,086 million or 100%).
We do not have separate capital amounts for CHT because the timely payment guarantee exposure to CMB issued by CHT is covered by the Securitization capital. The amounts of Securitization capital held also recognize the risk mitigation provided by mortgage loan insurers, who are required to hold capital for the underlying mortgage default risk.
The following table presents the components of the capital available.
| | | | | | | | |
| (IN MILLIONS, UNLESS OTHERWISE INDICATED) | | 2017 | | | 2016 | |
Accumulated other comprehensive income | | | (23) | | | | 17 | |
Appropriated retained earnings | | | 1,747 | | | | 2,069 | |
Appropriated capital 1 | | | 1,724 | | | | 2,086 | |
Unappropriated capital | | | 612 | | | | – | |
Total securitization capital available | | | 2,336 | | | | 2,086 | |
Capital available to capital required (%) | | | 135% | | | | 100% | |
1 We appropriate retained earnings and AOCI at the operating level (capital required) which is set at 110% of economic capital. Our internal target is set at 105% of economic capital ASSISTED HOUSING CAPITAL LENDING PROGRAMS We maintain a reserve fund pursuant to Section 29 of the CMHC Act. A portion of the Lending programs’ earnings is retained in this reserve fund as part of our strategy to address interest rate risk exposure on pre-payable loans as well as credit risk exposure on unsecured loans. The reserve fund is subject to a statutory limit of $240 million (2016 – $240 million). Should the statutory limit be exceeded, we would be required to pay the excess to the Government. Unrealized fair value fluctuations as well as remeasurement gains and losses on defined benefit plans are absorbed in retained earnings. The Housing programs’ portion of remeasurements is recorded in retained earnings until it is reimbursed by the Government through housing programs appropriations. The following table presents the components of the capital available. | |
| (IN MILLIONS) | | 2017 | | | 2016 | |
Reserve fund | | | 116 | | | | 96 | |
Retained earnings | | | 93 | | | | 75 | |
Total Lending programs capital available | | | 209 | | | | 171 | |
HOUSING PROGRAMS
We do not hold capital for housing programs as this activity does not present risks to the Corporation that would require capital to be set aside.
| | | | |
| 78 | | | | CANADA MORTGAGE AND HOUSING CORPORATION |
11. FAIR VALUE MEASUREMENT
FAIR VALUE MEASUREMENT
We measure certain financial instruments and non-financial assets at fair value in the consolidated balance sheet and disclose the fair value of certain other items. Fair value is determined using a consistent measurement framework.
Fair value is the price that would be received to sell an asset or paid to transfer a liability in an orderly transaction between market participants at the measurement date under current market conditions. The fair value of an asset or a liability is measured using the assumptions that market participants would use when pricing the asset or liability, assuming that market participants act in their economic best interest. Fair value measurement of non-financial assets (i.e. investment property) takes into account a market participant’s ability to generate economic benefits by using the asset in its highest and best use or by selling it to another market participant that would use the asset in its highest and best use. For financial instruments, accrued interest is separately recorded and disclosed.
FAIR VALUE HIERARCHY
The methods used to measure fair value make maximum use of relevant observable inputs and minimize the use of unobservable inputs.
Fair value measurements are classified in a fair value hierarchy as level 1, 2 or 3 according to the observability of the most significant inputs used in making the measurements.
LEVEL 1
Assets and liabilities that are measured based on unadjusted quoted prices in active markets for identical assets or liabilities. An active market is one where transactions are occurring with sufficient frequency and volume to provide pricing information on an ongoing basis.
LEVEL 2
Assets and liabilities that are measured based on observable inputs other than level 1 prices. Level 2 inputs include prices obtained from third-party pricing services based on independent dealers’ quotes for identical assets or liabilities in markets that are not considered sufficiently active. Level 2 also includes fair values obtained by discounting expected future cash flows, making maximum use of directly or indirectly observable market data such as yield curves and implied forward curves constructed from foreign exchange rates, benchmark interest rates and credit spreads of identical or similar assets or liabilities.
LEVEL 3
Assets and liabilities not quoted in active markets that are measured using valuation techniques. Where possible, inputs to the valuation techniques are based on observable market data, such as yield curves and implied forward curves constructed from benchmark interest rates and credit spreads of similar assets or liabilities. Where observable inputs are not available, unobservable inputs are used. For level 3 assets and liabilities, unobservable inputs are significant to the overall measurement of fair value.
We have processes and controls in place to ensure fair value is appropriately measured. The valuation of financial instruments is performed by the Operations Support Division (OSD) of the Capital Markets sector. OSD has developed models and methodologies to determine fair value of financial instruments not quoted in active markets which are reviewed and monitored on an ongoing basis. All valuations are subject to independent price verification (IPV) managed by the sector of the Chief Risk Officer. IPV is a process where valuations are independently verified against external market prices and other relevant market data on an ongoing basis.
Generally, the unit of account for a financial instrument is the individual instrument, and valuation adjustments are applied at an individual instrument level, consistent with that unit of account.
For investment property, fair value is determined by independent external property appraisers who hold recognized and relevant professional qualifications and have recent relevant experience and our internal appraisers on a rotating basis.
METHODS AND ASSUMPTIONS
We measure fair value using the following methods and assumptions:
INVESTMENT SECURITIES
Equity securities are valued using closing bid price quotes from active markets.
Fixed income securities are valued primarily by indicative quotes obtained from multi-dealer consensus pricing services. Where observable quotes are not available, securities are valued using spread differentials of similar actively traded securities or discounted cash flow techniques using observable discount rate curves for instruments having similar characteristics. Future cash flows of certain floating rate bonds are estimated based on observable implied forward rate curves.
| | | | |
| 2017 ANNUAL REPORT | | | | 79 |
For our private limited partnership and real estate investment trust equity investments, fair value is measured as our share of the partnership’s or trust’s net asset value. In measuring net asset value, the fair value of the partnership’s or trust’s real estate assets is determined at least annually by independent appraisers using the income approach or the market approach, and the fair value of its long-term debt is measured by discounting expected future cash flows.
The fair value of the variable rate asset-backed securities received in the restructuring of the Canadian asset-backed commercial paper market, for which there was a balance only in 2016, was determined by discounting expected future cash flows using observable market discount rates and an unobservable risk premium which took into account the lack of market liquidity and inherent risk of the securities.
LOANS
Loans are valued by discounting future cash flows using discount rate curves that reflect the collection guarantees provided by provincial, territorial or federal levels of government. Inputs into the discounting model are the Government yield curve and spreads derived from assets with comparable financial risks.
DERIVATIVES
Derivatives consist of over-the-counter interest rate swaps and foreign currency forward contracts. These are valued by discounting estimated future cash flows using observable discount rate curves constructed using benchmark interest rates and foreign exchange rates. Future cash flows for floating rate legs are estimated based on observable implied forward rate curves. An adjustment is made to reflect the credit risk that either counterparty may not be able to fulfil its obligations. Inputs to this adjustment include market-implied default rates and estimated recovery rates, and the adjustment takes into account master netting and collateral arrangements in place.
INVESTMENT PROPERTY
The fair value of investment property is determined using either the income approach or the market approach, incorporating the highest and best use of the property. Of the total fair value of investment properties, 78% (2016 – 9%) was based on valuations performed by independent valuators and 22% (2016 – 91%) was based on internal valuations.
The income approach is primarily applied in determining the fair value of rent-producing properties. Under the income approach, fair value is based upon the present value of expected future cash flows of each property using an unobservable discount rate reflective of the characteristics of the property. Future cash flows are estimated using unobservable assumptions about future rental values and vacancy rates.
The market approach is primarily applied in determining the fair value of vacant land. Under the market approach, fair value is based upon market transactions involving comparable property, with adjustments made to reflect the unique aspects of the property being valued.
The highest and best use of the investment property held in the Assisted Housing Activity ($256 million as at 31 December 2017; $169 million as at 31 December 2016) differs from its current use as these investment properties are used to carry out CMHC’s social housing mandate rather than maximize its economic value.
BORROWINGS
Borrowings from the Government of Canada are valued by discounting future cash flows using discount rate curves derived from the directly observable yields of our market-traded borrowings. The fair value of capital market borrowings was measured using closing ask price quotes obtained from multi-dealer consensus pricing services.
COMPARISON OF CARRYING AND FAIR VALUES FOR FINANCIAL INSTRUMENTS NOT CARRIED AT FAIR VALUE
The following table compares the carrying and fair values of financial instruments not carried at fair value. Carrying value is the amount at which an item is measured in the consolidated balance sheet.
| | | | | | | | | | | | | | | | | | | | | | | | |
| | | | | | 2017 | | | | | | | | | 2016 | | | | |
| (IN MILLIONS) | | CARRYING
VALUE | | | FAIR
VALUE | | | FAIR VALUE
OVER
(UNDER)
CARRYING
VALUE | | | CARRYING
VALUE | | | FAIR
VALUE | | | FAIR VALUE
OVER
(UNDER)
CARRYING
VALUE | |
Financial assets | | | | | | | | | | | | | | | | | | | | | | | | |
Loans – loans and receivables 1 | | | 237,944 | | | | 239,137 | | | | 1,193 | | | | 227,310 | | | | 232,162 | | | | 4,852 | |
Financial liabilities | | | | | | | | | | | | | | | | | | | | | | | | |
Borrowings – other financial liabilities 2 | | | 233,592 | | | | 234,918 | | | | 1,326 | | | | 223,156 | | | | 228,124 | | | | 4,968 | |
| | 1 | Fair value of loans and receivables is categorized as level 2. |
| | 2 | $111,380 million (31 December 2016 – $47,000 million) fair value categorized as level 1, $123,538 million (31 December 2016 – $181,124 million) fair value categorized as level 2. |
| | | | |
| 80 | | | | CANADA MORTGAGE AND HOUSING CORPORATION |
FAIR VALUE HIERARCHY FOR ITEMS CARRIED AT FAIR VALUE
The following table presents the fair value hierarchy for assets and liabilities carried at fair value in the consolidated balance sheet.
| | | | | | | | | | | | | | | | | | | | | | | | | | | | | | | | |
| | | 2017 | | | 2016 | |
| (IN MILLIONS) | | LEVEL 1 | | | LEVEL 2 | | | LEVEL 3 | | | TOTAL | | | LEVEL 1 | | | LEVEL 2 | | | LEVEL 3 | | | TOTAL | |
Assets | | | | | | | | | | | | | | | | | | | | | | | | | | | | | | | | |
Cash and cash equivalents | | | | | | | | | | | | | | | | | | | | | | | | | | | | | | | | |
Cash | | | 3 | | | | – | | | | – | | | | 3 | | | | – | | | | – | | | | – | | | | – | |
Interest bearing deposits with banks | | | – | | | | 55 | | | | – | | | | 55 | | | | – | | | | 258 | | | | – | | | | 258 | |
Corporate/other entities | | | – | | | | – | | | | – | | | | – | | | | – | | | | 25 | | | | – | | | | 25 | |
Federal government issued | | | 67 | | | | – | | | | – | | | | 67 | | | | 189 | | | | – | | | | – | | | | 189 | |
Provinces/municipalities | | | – | | | | – | | | | – | | | | – | | | | – | | | | 65 | | | | – | | | | 65 | |
Total cash and cash equivalents1 | | | 70 | | | | 55 | | | | – | | | | 125 | | | | 189 | | | | 348 | | | | – | | | | 537 | |
Investment securities | | | | | | | | | | | | | | | | | | | | | | | | | | | | | | | | |
Designated at fair value through profit or loss | | | | | | | | | | | | | | | | | | | | | | | | | | | | | | | | |
Fixed income | | | | | | | | | | | | | | | | | | | | | | | | | | | | | | | | |
Corporate/other entities | | | – | | | | 373 | | | | – | | | | 373 | | | | – | | | | 193 | | | | 137 | | | | 330 | |
Provinces/municipalities | | | 78 | | | | 399 | | | | – | | | | 477 | | | | 138 | | | | 339 | | | | – | | | | 477 | |
Sovereign and related entities | | | – | | | | 384 | | | | – | | | | 384 | | | | – | | | | 366 | | | | – | | | | 366 | |
Total designated at fair value through profit or loss | | | 78 | | | | 1,156 | | | | – | | | | 1,234 | | | | 138 | | | | 898 | | | | 137 | | | | 1,173 | |
Available for sale | | | | | | | | | | | | | | | | | | | | | | | | | | | | | | | | |
Fixed income | | | | | | | | | | | | | | | | | | | | | | | | | | | | | | | | |
Corporate/other entities | | | 1,010 | | | | 9,663 | | | | – | | | | 10,673 | | | | – | | | | 10,384 | | | | – | | | | 10,384 | |
Federal government issued | | | 4,105 | | | | 86 | | | | – | | | | 4,191 | | | | 3,749 | | | | 58 | | | | – | | | | 3,807 | |
Provinces/municipalities | | | 2,054 | | | | 3,734 | | | | – | | | | 5,788 | | | | 3,274 | | | | 4,167 | | | | – | | | | 7,441 | |
Sovereign and related entities | | | – | | | | 287 | | | | – | | | | 287 | | | | – | | | | 352 | | | | – | | | | 352 | |
Equities – Canadian | | | 1,085 | | | | – | | | | 88 | | | | 1,173 | | | | 1,204 | | | | – | | | | 38 | | | | 1,242 | |
Total available for sale | | | 8,254 | | | | 13,770 | | | | 88 | | | | 22,112 | | | | 8,227 | | | | 14,961 | | | | 38 | | | | 23,226 | |
Loans | | | | | | | | | | | | | | | | | | | | | | | | | | | | | | | | |
Designated at fair value through profit or loss | | | – | | | | 2,906 | | | | – | | | | 2,906 | | | | – | | | | 4,020 | | | | – | | | | 4,020 | |
Derivatives | | | – | | | | 61 | | | | – | | | | 61 | | | | – | | | | 86 | | | | – | | | | 86 | |
Investment property | | | – | | | | – | | | | 305 | | | | 305 | | | | – | | | | – | | | | 267 | | | | 267 | |
Total assets carried at fair value | | | 8,402 | | | | 17,948 | | | | 393 | | | | 26,743 | | | | 8,554 | | | | 20,313 | | | | 442 | | | | 29,309 | |
Liabilities | | | | | | | | | | | | | | | | | | | | | | | | | | | | | | | | |
Borrowings | | | | | | | | | | | | | | | | | | | | | | | | | | | | | | | | |
Designated at fair value through profit or loss | | | – | | | | 4,564 | | | | – | | | | 4,564 | | | | – | | | | 5,905 | | | | – | | | | 5,905 | |
Derivatives | | | – | | | | 39 | | | | – | | | | 39 | | | | – | | | | 32 | | | | – | | | | 32 | |
Total liabilities carried at fair value | | | – | | | | 4,603 | | | | – | | | | 4,603 | | | | – | | | | 5,937 | | | | – | | | | 5,937 | |
1 Of the total cash and cash equivalents carried at fair value, $58 million (31 December 2016 – $348 million) is classified as designated at fair value through profit or loss and $67 million (31 December 2016 – $189 million) is classified as available for sale. Cash and cash equivalents on the consolidated balance sheet also includes $762 million (31 December 2016 – $1,458 million) of cash equivalents carried at amortized cost.
TRANSFERS BETWEEN FAIR VALUE HIERARCHY LEVELS
For assets and liabilities measured at fair value on a recurring basis, we determine if reclassifications have occurred between levels in the hierarchy by re-assessing categorization at the end of each reporting period. Transfers are dependent on our assessment of market trading activity of the last month of each reporting period using internal classification criteria. Transfers between levels are deemed to occur at the beginning of the quarter in which the transfer occurs. There were $2,709 million of transfers from level 2 to level 1 and $3,376 million of transfers from level 1 to level 2 during the year ended 31 December 2017 (31 December 2016 – $3,412 million and $307 million, respectively).
| | | | |
| 2017 ANNUAL REPORT | | | | 81 |
CHANGE IN FAIR VALUE MEASUREMENT FOR ITEMS CLASSIFIED AS LEVEL 3
The following table presents the change in fair value for items carried at fair value and classified as level 3.
| | | | | | | | | | | | | | | | | | | | |
| | | INVESTMENT SECURITIES | | | | | | | |
| (IN MILLIONS) | | DESIGNATED AT FAIR VALUE
THROUGH PROFIT OR LOSS –
ASSET BACKED SECURITIES | | | AVAILABLE FOR SALE –
LIMITED PARTNERSHIP AND
REAL ESTATE INVESTMENT
TRUST UNITS | | | TOTAL
INVESTMENT
SECURITIES | | | INVESTMENT
PROPERTY | | | TOTAL | |
2017 | | | | | | | | | | | | | | | | | | | | |
Fair value as at 1 January 2017 | | | 137 | | | | 38 | | | | 175 | | | | 267 | | | | 442 | |
Purchases | | | – | | | | 17 | | | | 17 | | | | – | | | | 17 | |
Net gains in net income 1,2 | | | – | | | | – | | | | – | | | | 90 | | | | 90 | |
Gains in OCI | | | – | | | | 6 | | | | 6 | | | | – | | | | 6 | |
Settlements/disposals | | | (137) | | | | (3) | | | | (140) | | | | (22) | | | | (162) | |
Other 3 | | | – | | | | 30 | | | | 30 | | | | (30) | | | | – | |
Fair value as at 31 December 2017 | | | – | | | | 88 | | | | 88 | | | | 305 | | | | 393 | |
2016 | | | | | | | | | | | | | | | | | | | | |
Fair value as at 1 January 2016 | | | 164 | | | | 34 | | | | 198 | | | | 258 | | | | 456 | |
Purchases | | | – | | | | 1 | | | | 1 | | | | 1 | | | | 2 | |
Net gains in net income 1,2 | | | 5 | | | | – | | | | 5 | | | | 8 | | | | 13 | |
Gains in OCI | | | – | | | | 3 | | | | 3 | | | | – | | | | 3 | |
Settlements/disposals | | | (32) | | | | – | | | | (32) | | | | – | | | | (32) | |
Fair value as at 31 December 2016 | | | 137 | | | | 38 | | | | 175 | | | | 267 | | | | 442 | |
| | 1 | Included in net gains (losses) on financial instruments for investment securities; other income for investment property. |
| | 2 | Of the net gains in net income for 2017, $89 million relates to assets held at 31 December 2017 (31 December 2016 – $8 million). |
| | 3 | During 2017, an investment property was sold to an unrelated real estate investment trust in exchange for equity instruments in the trust and other consideration. Following the transaction CMHC has neither control nor significant influence over the trust. |
UNOBSERVABLE INPUTS FOR ITEMS CLASSIFIED AS LEVEL 3
The valuations of items classified as level 3 use unobservable inputs, changes in which may significantly affect the measurement of fair value. Valuations were based on assessments of the prevailing conditions at 31 December 2017, which may change materially in subsequent periods. The following table presents quantitative information about the significant unobservable inputs used in level 3 fair value measurements for items carried at fair value.
| | | | | | | | | | | | | | | | | | | | |
| | | | | | | | | | 2017 | | | | | | 2016 | |
(IN MILLIONS, UNLESS OTHERWISE INDICATED) | | VALUATION TECHNIQUE | | UNOBSERVABLE INPUTS | | ASSET
FAIR
VALUE | | | WEIGHTED
AVERAGE INPUT/
RANGE | | | ASSET
FAIR
VALUE | | | WEIGHTED
AVERAGE
INPUT/
RANGE | |
Investment securities | | | | | | | | | | | | | | | | | | | | |
Designated at fair value through profit or loss | | | | | | | | | | | | | | | | | | | | |
Asset-backed securities | | Discounted cash flow | | Risk premium | | | – | | | | – | | | | 137 | | | | 1.4% | |
Available for sale | | | | | | | | | | | | | | | | | | | | |
Limited partnership and real estate trust investments | | Share of partnership equity | | Reported partnership equity | | | 88 | | | | n.a. | | | | 38 | | | | n.a. | |
Total investment securities | | | | | | | 88 | | | | | | | | 175 | | | | | |
Investment property | | | | | | | | | | | | | | | | | | | | |
Mortgage Loan Insurance Activity | | Discounted cash flow | | Estimated rental value per square foot | | | 49 | | | | $16 – $42 | | | | 98 | | | | $4 – $39 | |
| | | | Discount rate | | | | | | | 7% | | | | | | | | 6.5% – 7.3% | |
Assisted Housing Activity | | Discounted cash flow | | Estimated rental value per square foot | | | 21 | | | | $25 – $149 | | | | 20 | | | | $22 – $148 | |
| | | | Discount rate | | | | | | | 3.75% – 5.50% | | | | | | | | 4% – 6% | |
| | | Market approach | | Value per square foot | | | 235 | | | | $0 – $491 | | | | 149 | | | | $0 – $325 | |
Total investment property | | | | | | | 305 | | | | | | | | 267 | | | | | |
Total level 3 items carried at fair value | | | | | | | 393 | | | | | | | | 442 | | | | | |
| | | | |
| 82 | | | | CANADA MORTGAGE AND HOUSING CORPORATION |
LEVEL 3 SENSITIVITY ANALYSIS
INVESTMENT PROPERTY
For investment property, increases (decreases) in estimated rental value and price per square foot could result in a significantly higher (lower) fair value of the properties. Increases (decreases) in discount rates could result in a significantly lower (higher) fair value.
12. INVESTMENT SECURITIES
The following tables present the contractual maturity profile and average yield of investment securities.
| | | | | | | | | | | | | | | | | | | | |
| | | REMAINING TERM TO MATURITY | | | | |
(IN MILLIONS, UNLESS OTHERWISE INDICATED) | | WITHIN
1 YEAR | | | 1 TO 3
YEARS | | | 3 TO 5
YEARS | | | OVER 5
YEARS | | | TOTAL
2017 | |
Designated at fair value through profit or loss | | | | | | | | | | | | | | | | | | | | |
Fixed income | | | | | | | | | | | | | | | | | | | | |
Corporate/other entities | | | 181 | | | | 136 | | | | 56 | | | | – | | | | 373 | |
Provinces/municipalities | | | 66 | | | | 253 | | | | 158 | | | | – | | | | 477 | |
Sovereign and related entities | | | 75 | | | | 239 | | | | 70 | | | | – | | | | 384 | |
Total designated at fair value through profit or loss | | | 322 | | | | 628 | | | | 284 | | | | – | | | | 1,234 | |
Yield 1 | | | 1.7% | | | | 1.6% | | | | 1.5% | | | | – | | | | 1.6% | |
Available for sale | | | | | | | | | | | | | | | | | | | | |
Fixed income | | | | | | | | | | | | | | | | | | | | |
Corporate/other entities 3 | | | 1,776 | | | | 2,694 | | | | 2,396 | | | | 3,807 | | | | 10,673 | |
Federal government issued | | | 133 | | | | 2,134 | | | | 880 | | | | 1,044 | | | | 4,191 | |
Provinces/municipalities | | | 393 | | | | 1,357 | | | | 1,234 | | | | 2,804 | | | | 5,788 | |
Sovereign and related entities | | | – | | | | 152 | | | | 75 | | | | 60 | | | | 287 | |
Total fixed income | | | 2,302 | | | | 6,337 | | | | 4,585 | | | | 7,715 | | | | 20,939 | |
Yield 1 | | | 2.2% | | | | 2.0% | | | | 2.4% | | | | 2.9% | | | | 2.5% | |
Canadian equities | | | | | | | | | | | | | | | | | | | 1,173 | |
Yield 2 | | | | | | | | | | | | | | | | | | | 6.2% | |
Total available for sale | | | | | | | | | | | | | | | | | | | 22,112 | |
Total | | | | | | | | | | | | | | | | | | | 23,346 | |
| | 1 | Represents the weighted-average yield, determined as the weighted-average of the effective yields of individual securities. |
| | 2 | Represents the average yield, determined by dividing dividend income by average cost. |
| | 3 | Includes debt securities denominated in U.S. dollars with a carrying value of $1,792 million (2016 – nil). |
| | | | | | | | | | | | | | | | | | | | |
| | | REMAINING TERM TO MATURITY | | | | |
| (IN MILLIONS, UNLESS OTHERWISE INDICATED) | | WITHIN
1 YEAR | | | 1 TO 3
YEARS | | | 3 TO 5
YEARS | | | OVER 5
YEARS | | | TOTAL
2016 | |
Designated at fair value through profit or loss | | | | | | | | | | | | | | | | | | | | |
Fixed income | | | | | | | | | | | | | | | | | | | | |
Corporate/other entities | | | 136 | | | | 75 | | | | 119 | | | | – | | | | 330 | |
Provinces/municipalities | | | 41 | | | | 149 | | | | 287 | | | | – | | | | 477 | |
Sovereign and related entities | | | – | | | | 158 | | | | 208 | | | | – | | | | 366 | |
Total designated at fair value through profit or loss | | | 177 | | | | 382 | | | | 614 | | | | – | | | | 1,173 | |
Yield 1 | | | 0.7% | | | | 1.8% | | | | 1.5% | | | | – | | | | 1.5% | |
Available for sale | | | | | | | | | | | | | | | | | | | | |
Fixed income | | | | | | | | | | | | | | | | | | | | |
Corporate/other entities | | | 1,323 | | | | 3,378 | | | | 2,880 | | | | 2,803 | | | | 10,384 | |
Federal government issued | | | 238 | | | | 1,282 | | | | 625 | | | | 1,662 | | | | 3,807 | |
Provinces/municipalities | | | 786 | | | | 1,368 | | | | 1,453 | | | | 3,834 | | | | 7,441 | |
Sovereign and related entities | | | 9 | | | | 105 | | | | 177 | | | | 61 | | | | 352 | |
Total fixed income | | | 2,356 | | | | 6,133 | | | | 5,135 | | | | 8,360 | | | | 21,984 | |
Yield 1 | | | 2.0% | | | | 2.1% | | | | 2.5% | | | | 2.9% | | | | 2.5% | |
Canadian equities | | | | | | | | | | | | | | | | | | | 1,242 | |
Yield 2 | | | | | | | | | | | | | | | | | | | 6.5% | |
Total available for sale | | | | | | | | | | | | | | | | | | | 23,226 | |
Total | | | | | | | | | | | | | | | | | | | 24,399 | |
| | 1 | Represents the weighted-average yield, determined as the weighted-average of the effective yields of individual securities. |
| | 2 | Represents the average yield, determined by dividing dividend income by average cost. |
| | | | |
| 2017 ANNUAL REPORT | | | | 83 |
The following table shows the cumulative unrealized gains (losses) on investment securities recorded at fair value.
| | | | | | | | | | | | | | | | | | | | | | | | | | | | | | | | |
| | | | | | 2017 | | | | | | | | | | | | 2016 | | | | | | | |
(IN MILLIONS, UNLESS OTHERWISE INDICATED) | | AMORTIZED
COST1 | | | GROSS
CUMULATIVE
UNREALIZED
GAINS | | | GROSS
CUMULATIVE
UNREALIZED
LOSSES | | | FAIR
VALUE | | | AMORTIZED
COST1 | | | GROSS
CUMULATIVE
UNREALIZED
GAINS | | | GROSS CUMULATIVE UNREALIZED LOSSES | | | FAIR
VALUE | |
Investment securities | | | | | | | | | | | | | | | | | | | | | | | | | | | | | | | | |
Fixed income | | | | | | | | | | | | | | | | | | | | | | | | | | | | | | | | |
Designated at fair value through profit or loss | | | 1,242 | | | | 2 | | | | (10 | ) | | | 1,234 | | | | 1,112 | | | | 65 | | | | (4 | ) | | | 1,173 | |
Available for sale | | | 20,837 | | | | 264 | | | | (162 | ) | | | 20,939 | | | | 21,474 | | | | 551 | | | | (41 | ) | | | 21,984 | |
Equities | | | | | | | | | | | | | | | | | | | | | | | | | | | | | | | | |
Available for sale | | | 670 | | | | 504 | | | | (1 | ) | | | 1,173 | | | | 710 | | | | 535 | | | | (3 | ) | | | 1,242 | |
| | 1 | Amortized cost for equities is acquisition cost less impairment losses, if any. |
We have investment securities of $295 million (2016 – $696 million) that are part of securities sold under repurchase agreements with terms that do not exceed 93 days. We continue to earn investment income and recognize in OCI changes in fair value on these investment securities during the year, with the exception of investments in CHT-issued CMB, which are eliminated from the consolidated financial statements.
During 2017, there were no impairment losses (2016 – nil) on investment securities recognized in net gains (losses) on financial instruments and no reversals of previously realized fixed income investment security impairments (2016 – nil).
13. LOANS
The following tables present the contractual maturity profile and average yield of loans based on carrying value.
| | | | | | | | | | | | | | | | | | | | | | | | | | | | |
| | | | | | | | | YEAR OF MATURITY | | | | | | | |
| (IN MILLIONS, UNLESS OTHERWISE INDICATED) | | 2018 | | | 2019 | | | 2020 | | | 2021 | | | 2022 | | | 2023 AND
THEREAFTER | | | TOTAL
2017 | |
Designated at fair value through profit or loss | | | | | | | | | | | | | | | | | | | | | | | | | | | | |
Lending programs | | | 603 | | | | 674 | | | | 830 | | | | 462 | | | | 53 | | | | 284 | | | | 2,906 | |
Yield | | | 2.4% | | | | 2.1% | | | | 1.7% | | | | 1.5% | | | | 2.0% | | | | 2.1% | | | | 2.1% | |
Loans and receivables | | | | | | | | | | | | | | | | | | | | | | | | | | | | |
Loans under the CMB program | | | 38,695 | | | | 30,781 | | | | 39,969 | | | | 37,863 | | | | 44,464 | | | | 42,014 | | | | 233,786 | |
Lending programs | | | 122 | | | | 72 | | | | 178 | | | | 417 | | | | 637 | | | | 2,732 | | | | 4,158 | |
Total loans and receivables | | | 38,817 | | | | 30,853 | | | | 40,147 | | | | 38,280 | | | | 45,101 | | | | 44,746 | | | | 237,944 | |
Yield | | | 2.3% | | | | 1.8% | | | | 1.9% | | | | 1.9% | | | | 2.1% | | | | 2.6% | | | | 2.1% | |
Total | | | 39,420 | | | | 31,527 | | | | 40,977 | | | | 38,742 | | | | 45,154 | | | | 45,030 | | | | 240,850 | |
| | | | | |
| | | | | | | | | YEAR OF MATURITY | | | | | | | |
| (IN MILLIONS, UNLESS OTHERWISE INDICATED) | | 2017 | | | 2018 | | | 2019 | | | 2020 | | | 2021 | | | 2022 AND
THEREAFTER | | | TOTAL
2016 | |
Designated at fair value through profit or loss | | | | | | | | | | | | | | | | | | | | | | | | | | | | |
Lending programs | | | 702 | | | | 682 | | | | 784 | | | | 949 | | | | 523 | | | | 380 | | | | 4,020 | |
Yield | | | 2.1% | | | | 2.4% | | | | 2.1% | | | | 1.7% | | | | 1.5% | | | | 2.1% | | | | 2.0% | |
Loans and receivables | | | | | | | | | | | | | | | | | | | | | | | | | | | | |
Loans under the CMB program | | | 29,642 | | | | 38,738 | | | | 30,797 | | | | 39,965 | | | | 37,894 | | | | 46,279 | | | | 223,315 | |
Lending programs | | | 60 | | | | 65 | | | | 90 | | | | 208 | | | | 229 | | | | 3,343 | | | | 3,995 | |
Total loans and receivables | | | 29,702 | | | | 38,803 | | | | 30,887 | | | | 40,173 | | | | 38,123 | | | | 49,622 | | | | 227,310 | |
Yield | | | 1.6% | | | | 2.2% | | | | 1.6% | | | | 1.7% | | | | 1.7% | | | | 2.7% | | | | 2.0% | |
Total | | | 30,404 | | | | 39,485 | | | | 31,671 | | | | 41,122 | | | | 38,646 | | | | 50,002 | | | | 231,330 | |
| | | | |
| 84 | | | | CANADA MORTGAGE AND HOUSING CORPORATION |
The following table presents the cash flows and non-cash changes for loans.
| | | | | | | | | | | | | | | | | | | | | | | | | | | | |
| | | | | | CASH FLOWS | | | NON-CASH CHANGES | | | | |
| (IN MILLIONS) | | BALANCE AT
BEGINNING
OF YEAR | | | REPAYMENTS | | | DISBURSEMENTS | | | FAIR
VALUE CHANGES | | | ACCRETION | | | TRANSFERS1 | | | BALANCE
AT END
OF YEAR | |
2017 | | | | | | | | | | | | | | | | | | | | | | | | | | | | |
Designated at fair value through profit or loss | | | | | | | | | | | | | | | | | | | | | | | | | | | | |
Lending programs | | | 4,020 | | | | (457) | | | | – | | | | (57) | | | | – | | | | (600) | | | | 2,906 | |
Loans and receivables | | | | | | | | | | | | | | | | | | | | | | | | | | | | |
Loans under the CMB program | | | 223,315 | | | | (29,812) | | | | 40,243 | | | | – | | | | 40 | | | | – | | | | 233,786 | |
Lending programs | | | 3,995 | | | | (567) | | | | 130 | | | | – | | | | – | | | | 600 | | | | 4,158 | |
Total loans and receivables | | | 227,310 | | | | (30,379) | | | | 40,373 | | | | – | | | | 40 | | | | 600 | | | | 237,944 | |
Total | | | 231,330 | | | | (30,836) | | | | 40,373 | | | | (57) | | | | 40 | | | | 0 | | | | 240,850 | |
2016 | | | | | | | | | | | | | | | | | | | | | | | | | | | | |
Designated at fair value through profit or loss | | | | | | | | | | | | | | | | | | | | | | | | | | | | |
Lending programs | | | 4,955 | | | | (577) | | | | 8 | | | | (55) | | | | – | | | | (311) | | | | 4,020 | |
Loans and receivables | | | | | | | | | | | | | | | | | | | | | | | | | | | | |
Loans under the CMB program | | | 215,622 | | | | (32,438) | | | | 40,096 | | | | – | | | | 35 | | | | – | | | | 223,315 | |
Lending programs | | | 4,091 | | | | (495) | | | | 88 | | | | – | | | | – | | | | 311 | | | | 3,995 | |
Total loans and receivables | | | 219,713 | | | | (32,933) | | | | 40,184 | | | | – | | | | 35 | | | | 311 | | | | 227,310 | |
Total | | | 224,668 | | | | (33,510) | | | | 40,192 | | | | (55) | | | | 35 | | | | – | | | | 231,330 | |
| | 1 | Transfers from designated at fair value through profit or loss to loans and receivables are loans that, upon renewal, are no longer part of a portfolio of economically hedged loans and borrowings. |
LOANS PAST DUE
A loan is considered past due when a counterparty has not made a payment by the contractual due date. The following table presents the aging of loans from contractual due date that are past due but not impaired. These loans are not impaired as their collection is guaranteed.
| | | | | | | | | | | | | | | | |
| (IN MILLIONS) | | WITHIN
1 YEAR | | | 1 TO 3
YEARS | | | OVER 3
YEARS | | | TOTAL
2017 | |
Designated at fair value through profit or loss | | | | | | | | | | | | | | | | |
Lending programs | | | 12 | | | | – | | | | 1 | | | | 13 | |
Loans and receivables | | | | | | | | | | | | | | | | |
Lending programs | | | 9 | | | | 1 | | | | 11 | | | | 21 | |
Total loans past due | | | 21 | | | | 1 | | | | 12 | | | | 34 | |
| | | | |
| (IN MILLIONS) | | WITHIN
1 YEAR | | | 1 TO 3
YEARS | | | OVER 3
YEARS | | | TOTAL 2016 | |
Designated at fair value through profit or loss | | | | | | | | | | | | | | | | |
Lending programs | | | 20 | | | | 4 | | | | 2 | | | | 26 | |
Loans and receivables | | | | | | | | | | | | | | | | |
Lending programs | | | 14 | | | | 6 | | | | 17 | | | | 37 | |
Total loans past due | | | 34 | | | | 10 | | | | 19 | | | | 63 | |
| | | | |
| 2017 ANNUAL REPORT | | | | 85 |
SOURCES OF GUARANTEE
For loans designated at fair value through profit or loss, no change in fair value is attributable to changes in credit risk. We are assured collection of principal and accrued interest on 99% (2016 – 99%) of our loans. The sources of guarantee for these loans are provided below.
| | | | | | | | | | | | | | | | | | | | | | | | |
| | | | | | 2017 | | | | | | | | | 2016 | | | | |
| (IN MILLIONS) | | DESIGNATED
AT FAIR
VALUE
THROUGH
PROFIT OR LOSS | | | LOANS AND
RECEIVABLES | | | TOTAL | | | DESIGNATED
AT FAIR
VALUE
THROUGH
PROFIT OR
LOSS | | | LOANS AND
RECEIVABLES | | | TOTAL | |
Provinces and territories through provisions in the SHA | | | 1,488 | | | | 1,443 | | | | 2,931 | | | | 1,902 | | | | 1,532 | | | | 3,434 | |
Government of Canada through provisions in the NHA | | | – | | | | 661 | | | | 661 | | | | – | | | | 753 | | | | 753 | |
Indigenous and Northern Affairs Canada through Ministerial | | | | | | | | | | | | | | | | | | | | | | | | |
Loan Guarantees | | | 851 | | | | 479 | | | | 1,330 | | | | 1,163 | | | | 169 | | | | 1,332 | |
Loans underwritten by our Mortgage Loan Insurance Activity | | | 258 | | | | 200 | | | | 458 | | | | 450 | | | | 158 | | | | 608 | |
Collateral 1 | | | – | | | | 233,786 | | | | 233,786 | | | | – | | | | 223,315 | | | | 223,315 | |
Total guaranteed loans | | | 2,597 | | | | 236,569 | | | | 239,166 | | | | 3,515 | | | | 225,927 | | | | 229,442 | |
Unsecured loans 2 | | | 309 | | | | 1,375 | | | | 1,684 | | | | 505 | | | | 1,383 | | | | 1,888 | |
Total | | | 2,906 | | | | 237,944 | | | | 240,850 | | | | 4,020 | | | | 227,310 | | | | 231,330 | |
| | 1 | Represents collateral held for loans under the CMB program which consists of NHA MBS securities and high quality reinvestment assets. |
| | 2 | These loans are to provincial entities and municipalities and are assessed on a regular basis to determine if an allowance for credit losses is necessary. As at 31 December 2016, an allowance of $23 million was recorded. This balance was written off in its entirety in the current year as there is no realistic prospect of future recovery. As at 31 December 2017, there is no allowance recorded. |
14. BORROWINGS
The following tables present the contractual maturity profile and average yield of borrowings based on carrying value.
| | | | | | | | | | | | | | | | | | | | | | | | | | | | |
| | | | | | | | | YEAR OF MATURITY | | | | | | | |
(IN MILLIONS, UNLESS OTHERWISE INDICATED) | | 2018 | | | 2019 | | | 2020 | | | 2021 | | | 2022 | | | 2023 AND
THEREAFTER | | | TOTAL
2017 | |
Designated at fair value through profit or loss | | | | | | | | | | | | | | | | | | | | | | | | | | | | |
Borrowings from the Government of Canada | | | 1,135 | | | | 1,079 | | | | 1,239 | | | | 650 | | | | 79 | | | | 382 | | | | 4,564 | |
Yield 1 | | | 2.2% | | | | 2.0% | | | | 1.5% | | | | 1.3% | | | | 1.9% | | | | 2.0% | | | | 1.8% | |
Other financial liabilities | | | | | | | | | | | | | | | | | | | | | | | | | | | | |
Canada mortgage bonds | | | 38,060 | | | | 30,406 | | | | 39,012 | | | | 37,596 | | | | 43,920 | | | | 40,248 | | | | 229,242 | |
Borrowings from the Government of Canada | | | 504 | | | | 419 | | | | 409 | | | | 533 | | | | 570 | | | | 1,915 | | | | 4,350 | |
Total other financial liabilities | | | 38,564 | | | | 30,825 | | | | 39,421 | | | | 38,129 | | | | 44,490 | | | | 42,163 | | | | 233,592 | |
Yield 1 | | | 2.4% | | | | 1.8% | | | | 1.9% | | | | 1.9% | | | | 2.1% | | | | 2.6% | | | | 2.1% | |
Total | | | 39,699 | | | | 31,904 | | | | 40,660 | | | | 38,779 | | | | 44,569 | | | | 42,545 | | | | 238,156 | |
| | 1 | Represents the weighted-average yield, determined by applying the weighted-average effective yields of individual fixed rate borrowings and the weighted-average yields-to-reset of floating rate notes. |
| | | | | | | | | | | | | | | | | | | | | | | | | | | | |
| | | | | | | | | YEAR OF MATURITY | | | | | | | |
(IN MILLIONS, UNLESS OTHERWISE INDICATED) | | 2017 | | | 2018 | | | 2019 | | | 2020 | | | 2021 | | | 2022 AND
THEREAFTER | | | TOTAL
2016 | |
Designated at fair value through profit or loss | | | | | | | | | | | | | | | | | | | | | | | | | | | | |
Borrowings from the Government of Canada | | | 997 | | | | 1,159 | | | | 1,086 | | | | 1,260 | | | | 661 | | | | 469 | | | | 5,632 | |
Capital market borrowings | | | 273 | | | | – | | | | – | | | | – | | | | – | | | | – | | | | 273 | |
Total designated at fair value through profit or loss | | | 1,270 | | | | 1,159 | | | | 1,086 | | | | 1,260 | | | | 661 | | | | 469 | | | | 5,905 | |
Yield 1 | | | 2.1% | | | | 2.2% | | | | 2.0% | | | | 1.5% | | | | 1.3% | | | | 2.0% | | | | 1.9% | |
Other financial liabilities | | | | | | | | | | | | | | | | | | | | | | | | | | | | |
Canada mortgage bonds | | | 28,824 | | | | 38,205 | | | | 30,748 | | | | 39,033 | | | | 37,678 | | | | 44,341 | | | | 218,829 | |
Borrowings from the Government of Canada | | | 500 | | | | 368 | | | | 376 | | | | 368 | | | | 501 | | | | 2,214 | | | | 4,327 | |
Total other financial liabilities | | | 29,324 | | | | 38,573 | | | | 31,124 | | | | 39,401 | | | | 38,179 | | | | 46,555 | | | | 223,156 | |
Yield 1 | | | 1.7% | | | | 2.2% | | | | 1.7% | | | | 1.7% | | | | 1.7% | | | | 2.7% | | | | 2.0% | |
Total | | | 30,594 | | | | 39,732 | | | | 32,210 | | | | 40,661 | | | | 38,840 | | | | 47,024 | | | | 229,061 | |
| | 1 | Represents the weighted-average yield, determined by applying the weighted-average effective yields of individual fixed rate borrowings and the weighted-average yields-to-reset of floating rate notes. |
| | | | |
| 86 | | | | CANADA MORTGAGE AND HOUSING CORPORATION |
BORROWINGS – DESIGNATED AT FAIR VALUE THROUGH PROFIT OR LOSS
Included in this category are short- and medium-term borrowings from the Government taken to fund certain Assisted Housing Activity loans originated prior to August 2016. Short-term debt, having an original term to maturity less than 365 days, was nil at 31 December 2017 (2016 – nil). Medium-term debt includes fixed rate notes, with an original term to maturity ranging from two to ten years.
Also included in this category were capital market borrowings which consisted of fixed rate notes with an original term to maturity ranging from two to ten years. Capital market borrowings fully matured during 2017.
The carrying amount at 31 December 2017 of borrowings – designated at FVTPL is $15 million lower (2016 – $67 million higher) than the contractual amount due at maturity. Our liabilities are backed by the full faith and credit of the Government and there is no significant change in value that can be attributed to changes in credit risk.
BORROWINGS – OTHER FINANCIAL LIABILITIES
This category includes borrowings under the CMB program as well as the short- and medium-term borrowings from the Government taken
to fund certain Assisted Housing Activity loans, including all those originated after July 2016. Short-term debt, having an original term to maturity less than 365 days, was $50 million at 31 December 2017 (2016 – $45 million). Medium-term debt includes fixed rate notes, with an original term to maturity ranging from two to ten years. The following table presents the cash flows and non-cash changes for borrowings.
| | | | | | | | | | | | | | | | | | | | | | | | | | | | |
| | | | | | CASH FLOWS | | | NON-CASH CHANGES | | | | |
| (IN MILLIONS) | | BALANCE AT
BEGINNING
OF YEAR | | | ISSUANCES | | | REPAYMENTS | | | FAIR
VALUE CHANGES | | | ACCRETION | | | ELIMINATIONS | | | BALANCE
AT END
OF YEAR | |
2017 | | | | | | | | | | | | | | | | | | | | | | | | | | | | |
Designated at fair value through profit or loss | | | | | | | | | | | | | | | | | | | | | | | | | | | | |
Borrowings from the Government of Canada | | | 5,632 | | | | 1,083 | | | | (2,069) | | | | (82) | | | | – | | | | – | | | | 4,564 | |
Capital market borrowings | | | 273 | | | | – | | | | (273) | | | | – | | | | – | | | | – | | | | – | |
Total designated at fair value through profit or loss | | | 5,905 | | | | 1,083 | | | | (2,342) | | | | (82) | | | | – | | | | – | | | | 4,564 | |
Other financial liabilitiess | | | | | | | | | | | | | | | | | | | | | | | | | | | | |
Canada mortgage bonds | | | 218,829 | | | | 40,243 | | | | (29,467) | | | | – | | | | 40 | | | | (403) | | | | 229,242 | |
Borrowings from the Government of Canada | | | 4,327 | | | | 1,060 | | | | (1,030) | | | | (12) | | | | 5 | | | | – | | | | 4,350 | |
Total other financial liabilities | | | 223,156 | | | | 41,303 | | | | (30,497) | | | | (12) | | | | 45 | | | | (403) | | | | 233,592 | |
Total | | | 229,061 | | | | 42,386 | | | | (32,839) | | | | (94) | | | | 45 | | | | (403) | | | | 238,156 | |
2016 | | | | | | | | | | | | | | | | | | | | | | | | | | | | |
Designated at fair value through profit or loss | | | | | | | | | | | | | | | | | | | | | | | | | | | | |
Borrowings from the Government of Canada | | | 6,339 | | | | 1,764 | | | | (2,399) | | | | (72) | | | | – | | | | – | | | | 5,632 | |
Capital market borrowings | | | 739 | | | | – | | | | (465) | | | | (11) | | | | – | | | | 10 | | | | 273 | |
Total designated at fair value through profit or loss | | | 7,078 | | | | 1,764 | | | | (2,864) | | | | (83) | | | | – | | | | 10 | | | | 5,905 | |
Other financial liabilities | | | | | | | | | | | | | | | | | | | | | | | | | | | | |
Canada mortgage bonds | | | 212,080 | | | | 40,096 | | | | (32,330) | | | | – | | | | 35 | | | | (1,052) | | | | 218,829 | |
Borrowings from the Government of Canada | | | 4,194 | | | | 448 | | | | (364) | | | | – | | | | 49 | | | | – | | | | 4,327 | |
Total other financial liabilities | | | 216,274 | | | | 40,544 | | | | (32,694) | | | | – | | | | 84 | | | | (1,052) | | | | 223,156 | |
Total | | | 223,352 | | | | 42,308 | | | | (35,558) | | | | (83) | | | | 84 | | | | (1,042) | | | | 229,061 | |
When CMHC holds CMB to maturity or acquires CMB in the primary market, the related cash flows are excluded from the consolidated statement of cash flows. During the year ended 31 December 2017, there were $345 million (2016 – $108 million) of CMB maturities that have been excluded from repayments in the table above and from investment securities – sales and maturities in the consolidated statement of cash flows. There were no purchases in the primary market during the year ended 31 December 2017 (2016 – nil).
| | | | |
| 2017 ANNUAL REPORT | | | | 87 |
BORROWING AUTHORITIES
The Minister of Finance approves CMHC’s Borrowing Plan annually and establishes limits and parameters for borrowings. The limits and parameters pertain to capital market borrowings and borrowings from the Government of Canada that have been incurred since April 2008 in the Assisted Housing and Securitization Activities.
The Borrowing Authorities were revised in 2017 to apply limits separately to short-term borrowings outstanding and long-term borrowings issued for activities other than the Rental Construction Financing Initiative (RCFI), as well as total borrowings outstanding for the RCFI. These limits for 2017 were $2.4 billion, $775 million, and $625 million, respectively. Actual short-term borrowings outstanding as at 31 December 2017, long-term borrowings issued in 2017, and total RCFI borrowings outstanding as at 31 December 2017 were $50 million, $561 million, and $84 million, respectively. The Borrowing Authorities also require that CMHC receive Minister of Finance approval for any new capital market borrowings. There are no capital market borrowings outstanding as at 31 December 2017 (2016 – $273 million).
In 2016, the Borrowing Authorities provided a total debt outstanding limit of $14.5 billion. The actual outstanding principal balance as at 31 December 2016 was $7.6 billion.
The legislative authority, which is separate from the limits above and does not apply to borrowings of CHT, requires that the total indebtedness outstanding at any time, other than to the Government, not exceed $20 billion (2016 – $20 billion). The outstanding principal balance of this indebtedness was nil as at 31 December 2017 (2016 – $275 million).
15. DERIVATIVES
Derivatives are financial contracts whose value is derived from movements in one or more underlying securities, rates, indices or other instruments. We use derivatives in conjunction with our risk management activities.
Interest rate swaps are transactions in which two parties exchange interest cash flows on a specified notional amount for a predetermined period based on agreed-upon fixed and floating rates. Notional amounts are not exchanged. The value of these swaps is derived from movements in interest rates. We use them to manage reinvestment risk, refinancing risk, or mismatches in the timing of receipts from assets versus payments of liabilities.
Foreign currency forward contracts are over-the-counter contracts in which two parties agree to exchange one currency for another at a specified price for settlement at a future pre-determined date. The value of these contracts is derived from movements in foreign exchange and interest rates. We use them to manage currency risk associated with U.S. dollar-denominated debt securities.
The table below provides the notional amounts of the derivative transactions recognized in the consolidated financial statements. Notional amounts, which are off-balance sheet, serve as a point of reference for calculating payments and do not represent the fair value, or the potential gain or loss associated with the credit or market risk of such instruments.
| | | | | | | | | | | | | | | | | | | | | | | | | | | | | | | | |
| | | | | | 2017 | | | | | | | | | | | | 2016 | | | | | | | |
| | | | | | | | | FAIR VALUE | | | | | | | | | FAIR VALUE | |
| (IN MILLIONS) | | AVERAGE
TERM TO
MATURITY | | | NOTIONAL
AMOUNT | | | ASSET | | | LIABILITY | | | AVERAGE
TERM TO
MATURITY | | | NOTIONAL
AMOUNT | | | ASSET | | | LIABILITY | |
Interest rate swaps | | | 2 years | | | | 7,709 | | | | 51 | | | | 26 | | | | 3 years | | | | 9,218 | | | | 86 | | | | 32 | |
Foreign currency forward contracts | | | 1 year | | | | 1,824 | | | | 10 | | | | 13 | | | | – | | | | – | | | | – | | | | – | |
Total | | | | | | | 9,533 | | | | 61 | | | | 39 | | | | | | | | 9,218 | | | | 86 | | | | 32 | |
CREDIT EXPOSURE OF DERIVATIVES
The following table presents the credit exposure of derivatives by term to maturity. The replacement value is the total current fair value including accrued interest of all outstanding contracts with a positive fair value, after factoring in the impact of master netting agreements. The replacement value represents our maximum derivative credit exposure. Potential future credit exposure represents an estimate of the potential change in the market value of the transaction up to maturity which is calculated in relation to the notional principal of the contracts by applying factors consistent with guidelines issued by OSFI.
Credit risk equivalent is the total of the replacement value and the potential future credit exposure. The risk weighted equivalent is determined by applying a standard OSFI defined measure of counterparty credit risk to the credit equivalent amount.
| | | | | | | | | | | | | | | | | | | | | | | | | | | | | | | | |
| | | REPLACEMENT VALUE | | | | | | 2017 | | | 2016 | |
(IN MILLIONS) | | WITHIN
1 YEAR | | | 1 TO 5
YEARS | | | OVER 5
YEARS | | | POTENTIAL
FUTURE
CREDIT
EXPOSURE | | | CREDIT RISK
EQUIVALENT | | | RISK-WEIGHTED
EQUIVALENT | | | CREDIT RISK
EQUIVALENT | | | RISK-WEIGHTED
EQUIVALENT | |
Derivatives | | | 6 | | | | 26 | | | | 5 | | | | 18 | | | | 55 | | | | 11 | | | | 85 | | | | 17 | |
The fair value of the collateral we hold related to our derivatives as at 31 December 2017 was nil (2016 – nil).
| | | | |
| 88 | | | | CANADA MORTGAGE AND HOUSING CORPORATION |
16. FINANCIAL INSTRUMENTS INCOME AND EXPENSES
INTEREST INCOME, INVESTMENT INCOME AND INTEREST EXPENSE
The following table outlines the total interest income and expense calculated using the effective interest method for financial instruments and the dividend income recognized in the consolidated statement of income and comprehensive income.
| | | | | | | | | | | | | | | | | | | | | | | | |
| | | | | | 2017 | | | | | | | | | 2016 | | | | |
| (IN MILLIONS) | | INTEREST
INCOME | | | INVESTMENT
INCOME | | | INTEREST
EXPENSE | | | INTEREST
INCOME | | | INVESTMENT
INCOME | | | INTEREST
EXPENSE | |
Cash equivalents – loans and receivable | | | 1 | | | | 4 | | | | – | | | | 2 | | | | 3 | | | | – | |
Available for sale financial assets | | | – | | | | 529 | | | | – | | | | – | | | | 516 | | | | – | |
Loans – loans and receivables | | | 4,606 | | | | – | | | | – | | | | 4,461 | | | | – | | | | – | |
Securities sold under repurchase agreements | | | – | | | | (3) | | | | – | | | | – | | | | (3) | | | | – | |
Borrowings – other financial liabilities | | | – | | | | – | | | | 4,476 | | | | – | | | | – | | | | 4,343 | |
Total interest for financial instruments not at fair value through profit or loss | | | 4,607 | | | | 530 | | | | 4,476 | | | | 4,463 | | | | 516 | | | | 4,343 | |
Total interest for financial instruments at fair value through profit or loss 1 | | | 101 | | | | – | | | | 93 | | | | 135 | | | | 1 | | | | 123 | |
Total interest | | | 4,708 | | | | 530 | | | | 4,569 | | | | 4,598 | | | | 517 | | | | 4,466 | |
Dividend income | | | – | | | | 43 | | | | – | | | | – | | | | 47 | | | | – | |
Total | | | 4,708 | | | | 573 | | | | 4,569 | | | | 4,598 | | | | 564 | | | | 4,466 | |
| | 1 | Of the total interest income for financial instruments at FVTPL, $55 million (2016 – $82 million) relates to loans – designated at FVTPL, $25 million (2016 – $30 million) relates to derivatives and $21 million (2016 – $23 million) relates to investment securities – designated at FVTPL and cash equivalents. |
GAINS (LOSSES) FROM FINANCIAL INSTRUMENTS
The following table presents the gains (losses) related to financial instruments.
| | | | | | | | |
| (IN MILLIONS) | | 2017 | | | 2016 | |
Designated at fair value through profit or loss | | | | | | | | |
Investment securities | | | (10) | | | | (7) | |
Loans | | | (57) | | | | (54) | |
Borrowings | | | 82 | | | | 80 | |
Total designated at fair value through profit or loss | | | 15 | | | | 19 | |
Held for trading – derivatives | | | 20 | | | | (24) | |
Available for sale – investment securities 1 | | | 89 | | | | 56 | |
Loans and receivables – prepayments | | | 78 | | | | 42 | |
Borrowings – other financial liabilities 2 | | | (55) | | | | (144) | |
Total | | | 147 | | | | (51) | |
| | 1 | Includes foreign exchange losses of $54 million (2016 – nil) resulting from translation of U.S. dollar-denominated debt securities. |
| | 2 | Includes losses from the retirement of borrowings $67 million (2016 – $149 million), net of gains from the issuance of borrowings of $12 million (2016 – $5 million). |
17. MARKET RISK
Market risk is the risk of adverse financial impacts arising from changes in underlying market factors, including interest rates, foreign exchange rates, and equity prices.
INTEREST RATE RISK
Interest rate risk is the risk that the fair value or future cash flows of a financial instrument will fluctuate because of changes in market interest rates.
The investment portfolios for the Mortgage Loan Insurance and Securitization Activities are managed in accordance with their Asset Allocation (AA) policies, which limit interest rate risk relative to internal restraints and benchmarks.
The Assisted Housing Activity is exposed to interest rate risk when asset and liability principal and interest cash flows have different payment, repricing or maturity dates. Some of our loans contain prepayment and/or repricing options. As we do not have the right to prepay our borrowings from the Government of Canada totalling $8,914 million (2016 – $9,959 million) without penalty, we are exposed to interest rate risk. For certain Assisted Housing Activity loans originated prior to August 2016, we use derivatives to manage reinvestment and refinancing risks as well as mismatches in the timing of cash flows between the loans, reinvested principal receipts and borrowings. For the Assisted Housing Activity loans originated after July 2016, an asset/liability matching strategy is employed on a portfolio basis whereby we structure
| | | | |
| 2017 ANNUAL REPORT | | | | 89 |
our borrowings so that the associated future obligations match the future cash flows to be received on the loans. Under this matching strategy, derivatives are not used and the term over which principal receipts must be reinvested is significantly reduced.
Loans under the CMB program are exposed to both interest rate risk and prepayment/reinvestment risk. Prepayment/reinvestment risk is the risk that NHA MBS may experience varying degrees of prepayment throughout the term and these prepayments must be reinvested immediately. To mitigate these risks, we enter into swap agreements with approved financial institution counterparties. Under these agreements, both interest rate and prepayment/reinvestment risks are transferred to swap counterparties. We pay all interest received from the underlying NHA MBS and reinvestment assets to the swap counterparties and the swap counterparties pay an amount equal to the coupon payments on the CMB. As a result of these swap agreements, changes in interest rates or prepayments/reinvestments related to the CMB program have no impact on the consolidated statement of income and comprehensive income.
CURRENCY RISK
Currency risk is the risk that the fair value or future cash flows of a financial instrument will fluctuate because of changes in foreign exchange rates. We are exposed to currency risk from our holdings in foreign currency denominated investment securities. Our internal policies limit the amount of foreign currency investments and require full economic hedging of currency risk. We held $1,792 million in available for sale debt securities denominated in U.S. dollars as at 31 December 2017 (2016 – nil).
Our strategy to fully hedge currency risk is to continuously enter into a series of short-term foreign currency forward contracts. Under these contracts, most of which are settled net, we exchange U.S. dollars for Canadian dollars at an exchange rate fixed at the outset of the contract for settlement at a future pre-determined date. Given the short terms of the forward contracts, full hedging of currency risk over the life of the foreign-denominated debt securities will require continued application of our strategy in the future. The exposures presented in the Value at Risk table below reflect the offsetting effect of the hedging instruments. Currency risk was assessed as immaterial as at 31 December 2017 (2016 – nil).
OTHER PRICE RISK
Other price risk is the risk that the fair value or future cash flows of a financial instrument will fluctuate because of changes in market prices, other than those giving rise to interest rate and currency risk. We are exposed to other price risk through fluctuations in prices of equity investments held by the Mortgage Loan Insurance Activity. The fair value of these investments as at 31 December 2017 is $1,173 million (2016 – $1,242 million). We limit our exposure to equity investments by using tolerance ranges and various diversification and exposure measures.
SENSITIVITY ANALYSES
VALUE AT RISK (VaR)
Market risk for investment securities in the Mortgage Loan Insurance and Securitization Activities is evaluated through the use of VaR models. VaR is a statistical technique used to measure the maximum potential loss of an investment portfolio over a specified holding period with a given level of confidence. The VaR for the Mortgage Loan Insurance and Securitization Activities as at 31 December, calculated with 95% confidence over a 22 business day holding period, is outlined in the table below. VaR is presented separately for individual market risk factors and for the total portfolio. The effect of diversification results from the fact that market risks are not perfectly correlated and, consequently, there is a benefit from investment diversification. The VaR figures are based on one year of historical prices and correlations of bond and equity markets and 26 weeks of volatility.
| | | | | | | | |
| (IN MILLIONS) | | 2017 | | | 2016 | |
Investment securities: | | | | | | | | |
Available for sale | | | | | | | | |
Interest rate risk | | | 213 | | | | 271 | |
Equity risk | | | 43 | | | | 66 | |
Effect of diversification | | | (50) | | | | (78) | |
Total VaR | | | 206 | | | | 259 | |
INTEREST RATE SENSITIVITY
Market risk for the Assisted Housing Activity portfolios of loans, investments, borrowings and swaps is evaluated by measuring their sensitivity to changes in interest rates.
For the Assisted Housing Activity’s financial instruments designated at FVTPL and HFT, we assessed the impact of a 200 bps shift in interest rates as immaterial as at 31 December 2017.
The Assisted Housing Activity’s loans and borrowings measured at amortized cost are also exposed to interest rate risk. The net impact of a shift in interest rates on their fair value is presented below.
| | | | |
| 90 | | | | CANADA MORTGAGE AND HOUSING CORPORATION |
| | | | | | | | | | | | | | | | |
| | | 2017 | | | 2016 | |
| | | INTEREST RATE SHIFT | | | INTEREST RATE SHIFT | |
| (IN MILLIONS) | | -200 BPS | | | +200 BPS | | | -200 BPS | | | +200 BPS | |
Increase (decrease) in fair value of net assets 1 | | | (56) | | | | 49 | | | | (62) | | | | 61 | |
| | 1 | The changes in fair value of net assets resulting from interest rate shifts presented in this table would not be recognized in comprehensive income as the underlying financial instruments are measured at amortized cost. |
The Assisted Housing Activity’s net interest income is also sensitive to interest rate movements.
The maximum negative exposure of net interest income, which is limited by our policy to $1.5 million, is $1.2 million at 31 December 2017 (2016 – $1.4 million). This is calculated by scenario analysis using multiple simulations of interest rate volatility with 95% confidence over a one-year period.
18. CREDIT RISK
Credit risk is the potential for financial loss arising from failure of a borrower or an institutional counterparty to fulfill its contractual obligations. We are exposed to credit risk from various sources including borrower default through mortgage insurance contracts and institutional counterparty credit risk arising from financial guarantees under the NHA MBS and CMB programs, lending arrangements, fixed income and preferred share investments and derivative transactions. A detailed breakdown of credit risk is presented below.
MAXIMUM EXPOSURE TO CREDIT RISK
| | | | | | | | |
| (IN BILLIONS) | | 2017 | | | 2016 | |
Mortgage loan insurance: insurance-in-force (Note 7) | | | 480 | | | | 512 | |
Timely payment guarantees: guarantees-in-force (Note 8) 1 | | | 477 | | | | 452 | |
| | 1 | Exposure includes underlying instruments which may also be insured by CMHC or other mortgage insurers. |
For all financial assets other than derivatives, the maximum exposure to credit risk is the carrying amount. For derivatives, the maximum exposure to credit risk is indicated in Note 15.
Credit risk associated with mortgage loan insurance is managed through prudent product design, underwriting and default management practices, and the establishment of adequate capital reserves as described in Notes 7 and 10.
Credit risk associated with timely payment guarantees is managed through due diligence in approving NHA MBS Issuers, ongoing monitoring of Issuer credit quality and program compliance, and the requirement that all mortgages supporting the NHA MBS be insured against borrower default. We have further mitigated this risk by having been assigned all rights, title and interest in the underlying mortgages so that we have access to principal and interest payments in the event of Issuer default.
Credit risk associated with loans in the Assisted Housing Activity is in part mitigated through measures that include loan guarantees from other government entities as described in Note 13. Losses due to default are largely recoverable from various levels of government.
Under the CMB program, loans represent amounts due from Canadian financial institutions as a result of the sale of their beneficial interest in NHA MBS securities to us. The loans are collateralized by the NHA MBS and associated reinvestment securities acquired in the transactions. The collateral is held in our name and represents the sole source of principal repayments for the loans. CMB program collateral held is rated R-1 (high) or AAA by at least two rating agencies.
Under the CMB program, we are exposed to credit-related counterparty risk in the event of default of swap counterparties. This risk is mitigated by transacting with highly rated swap counterparties and collateralization requirements based on credit ratings. All swap counterparties must have a minimum credit rating of BBB (high), or its equivalent, by at least two rating agencies.
The fair value of total loan collateral held under the CMB program was $234,832 million, 100.4% of loan carrying value, as at 31 December 2017 (2016 – $226,947 million, 101.6% of loan carrying value).
Credit risk associated with fixed income investments, preferred equity and derivatives is managed through the implementation of policies which include minimum counterparty credit ratings and investment portfolio diversification limits by issuer, credit rating, term and by industry sector, and through the use of appropriate legal agreements and collateralization requirements for derivatives.
| | | | |
| 2017 ANNUAL REPORT | | | | 91 |
CONCENTRATION RISK
Concentration risk arises from holdings of financial instruments issued by entities that operate in the same sector or geographic area or engage in similar activities such that they may be affected similarly by changes in economic or other conditions.
The following table presents the concentration of credit risk by sector and geographic region of our investment securities and derivative transactions:
| | | | | | | | | | | | | | | | |
| (IN MILLIONS, UNLESS OTHERWISE INDICATED) | | 2017 | | | 2016 | |
By sector: | | | | | | | | | | | | | | | | |
Provincial | | | 6,336 | | | | 26.1 | % | | | 8,193 | | | | 30.9 | % |
Financial | | | 5,001 | | | | 20.6 | % | | | 6,130 | | | | 23.2 | % |
Federal | | | 4,544 | | | | 18.7 | % | | | 4,552 | | | | 17.2 | % |
Industrial | | | 3,432 | | | | 14.1 | % | | | 1,902 | | | | 7.2 | % |
Energy | | | 1,468 | | | | 6.0 | % | | | 1,587 | | | | 6.0 | % |
Other | | | 3,510 | | | | 14.5 | % | | | 4,112 | | | | 15.5 | % |
Total 1 | | | 24,291 | | | | 100 | % | | | 26,476 | | | | 100 | % |
By geographic region: | | | | | | | | | | | | | | | | |
Canada | | | 20,019 | | | | 82.4 | % | | | 23,837 | | | | 90.0 | % |
U.S. | | | 2,705 | | | | 11.1 | % | | | 1,110 | | | | 4.2 | % |
Other | | | 1,567 | | | | 6.5 | % | | | 1,529 | | | | 5.8 | % |
Total 1 | | | 24,291 | | | | 100 | % | | | 26,476 | | | | 100 | % |
| | 1 | Total comprised of cash equivalents of $884 million (31 December 2016 – $1,991 million), investment securities of $23,346 million (31 December 2016 – $24,399 million) and derivatives with a positive fair value, net of collateral, of $61 million (31 December 2016 – $86 million). |
CREDIT QUALITY
The following table presents the credit quality of the cash equivalents and investment securities based on an internal credit rating system.1
| | | | | | | | | | | | | | | | | | | | | | | | | | | | | | | | |
| | | 2017 | | | 2016 | |
| (IN MILLIONS) | | AAA | | | AA-TO AA+ | | | A-TO A+ | | | LOWER
THAN A- | | | AAA | | | AA-TO AA+ | | | A-TO A+ | | | LOWER
THAN A- | |
Cash equivalents | | | 335 | | | | 218 | | | | 331 | | | | – | | | | 586 | | | | 587 | | | | 818 | | | | – | |
Investment securities 2 | | | | | | | | | | | | | | | | | | | | | | | | | | | | | | | | |
Designated at fair value through profit or loss | | | 409 | | | | 541 | | | | 283 | | | | 1 | | | | 391 | | | | 490 | | | | 275 | | | | 17 | |
Available for sale | | | 5,420 | | | | 4,419 | | | | 9,199 | | | | 1,969 | | | | 5,434 | | | | 5,187 | | | | 9,065 | | | | 2,335 | |
| | 1 | The internal credit ratings are based upon internal assessments of the counterparty creditworthiness. These ratings correspond to those provided by the credit rating agencies except in cases where stand-alone ratings exist. A counterparty internal credit rating cannot be higher than the highest stand-alone rating from any of the agencies. A stand-alone rating removes the assumption of Government support from the rating. |
| | 2 | Includes fixed income investments and preferred equity only. |
DERIVATIVES
We limit the credit risk associated with derivative transactions by dealing with counterparties whose credit ratings are in accordance with our Enterprise Risk Management Policies; through the use of International Swaps Derivatives Association (ISDA) master agreements for derivatives; and, where appropriate, through the use of ratings-based collateral thresholds in the Credit Support Annexes (CSA).
ISDA is a master agreement that sets out standard terms that apply to all transactions we entered into with the counterparty. The ISDA outlines procedures and calculations of termination costs in the event of default by either party. The ISDA master agreements give us a legally enforceable right to settle all transactions covered by the agreement with the same counterparty on a net basis in the event of default. All derivative counterparties must have a minimum credit rating of A-, or its equivalent, from at least two rating agencies.
The CSA document, included in the ISDA master agreements, regulates the collateral requirements of derivative transactions and the terms under which collateral is transferred to mitigate credit risk. The CSA gives us the right, in the event of default, to liquidate collateral held and apply proceeds received from liquidation against amounts due from the counterparty. Collateral held to offset mark-to-market exposures is not used for any other purpose than to offset such exposure.
| | | | |
| 92 | | | | CANADA MORTGAGE AND HOUSING CORPORATION |
SECURITIES PURCHASED UNDER RESALE AGREEMENTS
By their nature, these balances have low credit risk given their short terms and are secured by the underlying securities purchased under the agreements and any incremental margin obtained from counterparties.
These transactions are subject to Global Master Repurchase Agreements which set out the standard terms of all repurchase agreements transacted with each counterparty. These agreements give us a legally enforceable right to settle all repurchase transactions with the same counterparty on a net basis in the event of default. These agreements also provide for the posting of margin by the counterparty when our exposure to that entity exceeds a certain ratings-based threshold. Securities held as eligible margin include debt obligations issued by or guaranteed by the Government, including Crown corporations and CHT. Margin securities should not be used for any other purpose than to offset such exposure. In the event of counterparty default, we have the right to liquidate these securities. We did not hold any margin securities at 31 December 2017 (2016 – $1 million).
NETTING ARRANGEMENTS AND OFFSETTING OF FINANCIAL ASSETS AND FINANCIAL LIABILITIES
The following tables present the potential effects of the netting arrangements described above.
FINANCIAL ASSETS
| | | | | | | | | | | | | | | | | | | | | | | | |
| | | (I) | | | (II) | | | (III) = (I) - (II) | | | (IV) | | | (V) = (III) - (IV) | |
| | | | | | | | | | | | GROSS AMOUNT NOT OFFSET IN THE
CONSOLIDATED BALANCE SHEET | | | | |
| (IN MILLIONS) | | GROSS AMOUNT
OF RECOGNIZED
ASSETS | | | GROSS AMOUNT
OFFSET IN THE
CONSOLIDATED
BALANCE SHEET | | | NET AMOUNT
OF ASSETS
PRESENTED
IN THE
CONSOLIDATED
BALANCE SHEET 1 | | | FINANCIAL
INSTRUMENTS 2 | | | FINANCIAL
COLLATERAL
RECEIVED 3 | | | NET AMOUNT | |
2017 | | | | | | | | | | | | | | | | | | | | | | | | |
Derivatives 1 | | | 78 | | | | – | | | | 78 | | | | (41) | | | | – | | | | 37 | |
Securities purchased under resale agreements 1 | | | – | | | | – | | | | – | | | | – | | | | – | | | | – | |
Total | | | 78 | | | | – | | | | 78 | | | | (41) | | | | – | | | | 37 | |
2016 | | | | | | | | | | | | | | | | | | | | | | | | |
Derivatives 1 | | | 110 | | | | – | | | | 110 | | | | (35) | | | | – | | | | 75 | |
Securities purchased under resale agreements 1 | | | 17 | | | | – | | | | 17 | | | | – | | | | (17) | | | | – | |
Total | | | 127 | | | | – | | | | 127 | | | | (35) | | | | (17) | | | | 75 | |
| | 1 | Derivatives are carried at fair value. Securities purchased under resale agreements are carried at amortized cost. |
| | 2 | Gross amounts of financial instruments not offset in the consolidated balance sheet refers to amounts recorded to derivative liabilities and securities sold under repurchase agreements where we have a legally enforceable right to offset against amounts recorded to derivative assets and securities purchased under resale agreements, on a counterparty-by-counterparty basis, in the event of default of the counterparty. |
| | 3 | We have the right, in the event of default, to liquidate and apply financial collateral held against amounts due from counterparties. For derivatives, these amounts represent the fair value of collateral posted by swap counterparties to us. For securities purchased under resale agreements, these amounts represent fair value of margin posted by counterparties and of securities we purchased with the commitment to resell to the counterparty at a future date. |
Derivative assets, as presented in the above table, are reconciled to the consolidated balance sheet as follows:
| | | | | | | | |
| (IN MILLIONS) | | 2017 | | | 2016 | |
Derivative assets presented in offsetting table | | | 78 | | | | 110 | |
Less: Accrued interest receivable presented separately in consolidated balance sheet | | | (17) | | | | (24) | |
Derivative asset balance presented in the consolidated balance sheet | | | 61 | | | | 86 | |
| | | | |
| 2017 ANNUAL REPORT | | | | 93 |
FINANCIAL LIABILITIES
| | | | | | | | | | | | | | | | | | | | | | | | |
| | | (I) | | | (II) | | | (III) = (I) - (II) | | | (IV) | | | (V) = (III) - (IV) | |
| | | | | | | | | | | | GROSS AMOUNT NOT OFFSET IN THE
CONSOLIDATED BALANCE SHEET | | | | |
| (IN MILLIONS) | | GROSS AMOUNT
OF RECOGNIZED
LIABILITIES | | | GROSS AMOUNT
OFFSET IN THE
CONSOLIDATED
BALANCE SHEET | | | NET AMOUNT
OF LIABILITIES
PRESENTED
IN THE
CONSOLIDATED
BALANCE SHEET 1 | | | FINANCIAL
INSTRUMENTS 2 | | | FINANCIAL
COLLATERAL
PLEDGED 3 | | | NET AMOUNT | |
2017 | | | | | | | | | | | | | | | | | | | | | | | | |
Derivatives 1 | | | 41 | | | | – | | | | 41 | | | | (41) | | | | – | | | | – | |
Securities sold under repurchase agreements 1 | | | 297 | | | | – | | | | 297 | | | | – | | | | (296) | | | | 1 | |
Total | | | 338 | | | | – | | | | 338 | | | | (41) | | | | (296) | | | | 1 | |
2016 | | | | | | | | | | | | | | | | | | | | | | | | |
Derivatives 1 | | | 35 | | | | – | | | | 35 | | | | (35) | | | | – | | | | – | |
Securities sold under repurchase agreements 1 | | | 704 | | | | – | | | | 704 | | | | – | | | | (695) | | | | 9 | |
Total | | | 739 | | | | – | | | | 739 | | | | (35) | | | | (695) | | | | 9 | |
| | 1 | Derivatives are carried at fair value. Securities sold under repurchase agreements are carried at amortized cost. |
| | 2 | Gross amounts of financial instruments not offset in the consolidated balance sheet refers to amounts recorded to derivative assets and securities purchased under resale agreements where we have a legally enforceable right to offset against amounts recorded to derivative liabilities and securities sold under repurchase agreements, on a counterparty-by-counterparty basis, in the event of default of the counterparty. |
| | 3 | Represents the fair value of securities we sold to counterparties with our commitment to repurchase from the counterparty at a future date. |
Derivative liabilities, as presented in the above table, are reconciled to the consolidated balance sheet as follows:
| | | | | | | | |
| (IN MILLIONS) | | 2017 | | | 2016 | |
Derivative liabilities presented in offsetting table | | | 41 | | | | 35 | |
Less: Accrued interest payable presented separately in consolidated balance sheet | | | (2) | | | | (3) | |
Derivative liabilities balance presented in the consolidated balance sheet | | | 39 | | | | 32 | |
19. LIQUIDITY RISK
Liquidity risk is the risk that we will encounter difficulty in meeting obligations associated with financial liabilities. Liquidity risk comprises both funding liquidity risk, which is the risk that we will be unable to meet our payment obligations when required due to an inability to borrow or realize on overdraft facilities, and market liquidity risk, which is the risk that we are not able to unwind or offset a particular position without incurring losses because of inadequate market depth or market disruption.
The principal financial obligations exposing us to liquidity risk include, but are not limited to:
| · | | the payment of claims incurred by the Mortgage Loan Insurance Activity; |
| · | | the need to fulfill the timely payment guarantees we have issued if sufficient funds are not available for the payment of principal or interest on NHA MBS or CMB by Approved Issuers or CHT, respectively; and |
| · | | payments required by borrowings and derivatives. |
We have a liquidity risk policy which includes appropriate limits and other mitigants to ensure sufficient resources to meet current and projected cash requirements.
The Mortgage Loan Insurance and Securitization Activities’ investment portfolios are managed to ensure that there is sufficient cash flow to meet projected claims. Sources of liquidity include: fees, premiums, investment income and proceeds from sales and maturities of investments.
Within the NHA MBS and CMB programs, liquidity risk refers to the risk that we may not be able to provide the funding required, in a timely fashion, to satisfy a call on our timely payment guarantee obligations. As guarantor, we are exposed to the risk of NHA MBS issuer default, CMB program repo and swap counterparty default, impairment of eligible CMB program collateral securities and system or other operational failures. With respect to our timely payment guarantees, our policy is to maintain sufficient liquidity to cover the largest exposure to a single counterparty on a given payment date. Cash, short-term investments and investment securities held in any of CMHC’s activities can be utilized to satisfy a call on the timely payment guarantees. Additional liquidity sources in the event of an immediate need to fulfill the timely payment guarantees include overdraft facilities and a $350 million line of credit with the Central Paying Agent. The Central Paying Agent acts on CHT’s
| | | | |
| 94 | | | | CANADA MORTGAGE AND HOUSING CORPORATION |
behalf to carry out certain payment functions in the CMB program, including collection of monthly payments on NHA MBS purchased and administration and reporting of cash flows. Other policies in place to mitigate liquidity risk include ensuring high credit quality investments as permitted by the CHT trust agreements and swap counterparties and the establishment of maturity monitoring guidelines.
The Assisted Housing Activity investment portfolio is managed to ensure that there is sufficient cash flow to meet funding needs in case of contingencies causing operational disruptions, unanticipated needs, and to facilitate use of the Crown Borrowing Program. The asset/liability management strategy ensures that the assets are maintained at the same level as the liabilities. Derivatives are used to hedge mismatches in the timing of cash flows. Further sources of liquidity associated with this portfolio include overdraft facilities and cash and short-term investments in marketable securities. For any additional liquidity requirements, we can access the Crown Borrowing Program upon Department of Finance approval.
At 31 December 2017, we had $300 million (2016 – $300 million) of overnight overdraft facilities available with our banker that had not been drawn upon.
We also mitigate liquidity risk through the use of ISDA master netting agreements reducing the amount of cash required to satisfy derivative obligations.
MATURITY ANALYSIS
The following table presents our undiscounted contractual cash flows payable, including accrued interest, under financial liabilities by remaining contractual maturities; this table therefore cannot be reconciled to the consolidated balance sheet.
| | | | | | | | | | | | | | | | | | | | | | | | |
| (IN MILLIONS) | | WITHIN 1
MONTH | | | 1 TO 3
MONTHS | | | 3 TO 12
MONTHS | | | 1 TO 5
YEARS | | | OVER 5
YEARS | | | TOTAL
2017 | |
Securities sold under repurchase agreements | | | 75 | | | | 223 | | | | – | | | | – | | | | – | | | | 298 | |
Derivatives | | | 2 | | | | (3 | ) | | | 19 | | | | 12 | | | | – | | | | 30 | |
Borrowings – designated at fair value through profit and loss | | | 11 | | | | 301 | | | | 894 | | | | 3,175 | | | | 400 | | | | 4,781 | |
Borrowings – other financial liabilities | | | 122 | | | | 6,724 | | | | 37,388 | | | | 167,092 | | | | 47,102 | | | | 258,428 | |
Dividends Payable | | | 500 | | | | 1,000 | | | | 500 | | | | – | | | | – | | | | 2,000 | |
Accounts payable and other liabilities | | | 28 | | | | 215 | | | | 19 | | | | 118 | | | | – | | | | 380 | |
Total | | | 738 | | | | 8,460 | | | | 38,820 | | | | 170,397 | | | | 47,502 | | | | 265,917 | |
| | | | | | |
| (IN MILLIONS) | | WITHIN 1
MONTH | | | 1 TO 3
MONTHS | | | 3 TO 12
MONTHS | | | 1 TO 5
YEARS | | | OVER 5
YEARS | | | TOTAL
2016 | |
Securities sold under repurchase agreements | | | 469 | | | | 235 | | | | – | | | | – | | | | – | | | | 704 | |
Derivatives | | | 2 | | | | – | | | | 8 | | | | 19 | | | | – | | | | 29 | |
Borrowings – designated at fair value through profit and loss | | | 138 | | | | 365 | | | | 855 | | | | 4,292 | | | | 489 | | | | 6,139 | |
Borrowings – other financial liabilities | | | 130 | | | | 5,461 | | | | 28,848 | | | | 160,465 | | | | 51,772 | | | | 246,676 | |
Accounts payable and other liabilities | | | 27 | | | | 235 | | | | 31 | | | | 158 | | | | 9 | | | | 460 | |
Total | | | 766 | | | | 6,296 | | | | 29,742 | | | | 164,934 | | | | 52,270 | | | | 254,008 | |
Commitments related to loans and financial guarantees are disclosed in Note 26 and Note 8 respectively.
20. ACCOUNTS RECEIVABLE AND OTHER ASSETS
The following table presents the composition of accounts receivable and other assets.
| | | | | | | | |
| (IN MILLIONS) | | 2017 | | | 2016 | |
Deferred Government of Canada fees | | | 224 | | | | 200 | |
Deferred acquisition costs (Note 7) | | | 165 | | | | 149 | |
Workouts 1 | | | 164 | | | | 87 | |
Fixed and intangible assets | | | 84 | | | | 58 | |
Net estimated borrower recoveries | | | 73 | | | | 53 | |
Non-current assets held for sale | | | 51 | | | | 58 | |
Accounts receivable | | | 46 | | | | 39 | |
Income taxes receivable | | | 4 | | | | – | |
Other | | | 24 | | | | 30 | |
Total | | | 835 | | | | 674 | |
| | 1 | Workouts are mortgages or loans that benefit from the Mortgage Loan Insurance supported default management activities that enable borrowers to work through their financial difficulties. An allowance for credit losses is established for these workouts. At 31 December 2017, the allowance was $113 million (2016 – $181 million) relating to workouts of $277 million (2016 – $268 million). |
| | | | |
| 2017 ANNUAL REPORT | | | | 95 |
21. INVESTMENT PROPERTY
The following table presents the changes in the investment property balance. Disclosures related to the determination of fair value of investment property are included in Note 11.
| | | | | | | | | | | | | | | | | | | | | | | | |
| | | 2017 | | | 2016 | |
| (IN MILLIONS) | | MORTGAGE LOAN
INSURANCE | | | ASSISTED
HOUSING | | | TOTAL | | | MORTGAGE LOAN
INSURANCE | | | ASSISTED
HOUSING | | | TOTAL | |
Balance at beginning of year | | | 98 | | | | 169 | | | | 267 | | | | 102 | | | | 156 | | | | 258 | |
Additions | | | – | | | | – | | | | – | | | | 1 | | | | – | | | | 1 | |
Disposals 1 | | | (52) | | | | – | | | | (52) | | | | – | | | | – | | | | – | |
Net unrealized gains (losses) in net income 2 | | | 3 | | | | 87 | | | | 90 | | | | (5) | | | | 13 | | | | 8 | |
Balance at end of year | | | 49 | | | | 256 | | | | 305 | | | | 98 | | | | 169 | | | | 267 | |
| | 1 | Includes $30 million disposal in exchange for non-cash consideration (2016 – nil); refer to Note 11. |
| | 2 | Included in other income. |
22. ACCOUNTS PAYABLE AND OTHER LIABILITIES
The following table presents the composition of accounts payable and other liabilities.
| | | | | | | | |
| (IN MILLIONS) | | 2017 | | | 2016 | |
Accrued housing programs expenses | | | 239 | | | | 281 | |
Government of Canada fees | | | 81 | | | | 104 | |
Affordable Rental Housing Innovation Fund deferred funding | | | 80 | | | | 13 | |
Income taxes payable | | | – | | | | 6 | |
Other miscellaneous liabilities | | | 161 | | | | 144 | |
Total | | | 561 | | | | 548 | |
23. PENSION AND OTHER POST-EMPLOYMENT BENEFITS
DEFINED BENEFIT PLANS
The defined benefit plans include the defined benefit Pension Plan and Supplemental Plan as well as the other non-pension post-employment defined benefit plans.
Effective 4 April 2013, the defined benefit components of the Pension Plan and the Supplemental Plan were closed to new entrants. Eligible employees joining the Corporation after this date were enrolled in the defined contribution component of the plans. In 2016, the Corporation segregated the defined contribution component of the Pension Plan and transferred the contributions into a new stand-alone defined contribution pension plan. The new stand-alone defined contribution plan was closed to new entrants as of 31 December 2017 and all employees have been transferred to a new modified defined benefit pension plan. All pension plan modifications will only apply to service that follows the implementation date of 1 January 2018. All benefits earned by employees under the existing plans prior to the implementation date will remain unchanged.
Our defined benefit Pension Plan requires contributions to be made to a separately administered fund (Pension Fund) whereas the defined benefit Supplemental Plan and the other non-pension post-employment defined benefits are unfunded and the benefits are paid directly by the Corporation.
Pursuant to a trust agreement we entered into with the Pension Fund Trustees (the Trustees), they are responsible for the management and administration of the Pension Fund. There are eight Trustees, including our President, one member of our Board of Directors, three members of Senior Management and three Pension Council members (a combination of current and retired employees). The Trustees set investment policies and objectives within the context of the investment philosophy and Risk Appetite Framework established by the Board of Directors and periodically review these policies. The Pension Fund’s Investment Committee assists the Trustees in the investment management of the defined benefit Pension Plan.
The Pension Fund’s asset allocation policy is based upon the principle of diversification of investments among various asset classes relative to the liabilities of the defined benefit Pension Plan. The current policy, which is based on liability-driven investment principles, has been established at 40% public equity investments, 41% fixed income securities and 19% real estate and infrastructure, on a net asset basis. The policy includes permissible ranges around these percentage weights. Additionally, the policy allows for the use of a modest level of leverage of 25% of net asset value to purchase fixed income assets to reduce the interest rate risk of the portfolio. The investments of the Pension Fund are subject to credit, liquidity and market risks. The most significant of these risks is asset volatility due to market conditions. The liabilities of the defined benefit component of the Pension Plan are adjusted to the Consumer Price Index and as such, they are subject to interest rate risks, inflation risk and changes in the life expectancy of the plan members. The most significant risk is interest rate risk as the present value of the liabilities
| | | | |
| 96 | | | | CANADA MORTGAGE AND HOUSING CORPORATION |
is calculated using a discount rate set with reference to Canadian AA-rated corporate bond yields. If the Pension Fund assets underperform this yield, the funded position of the defined benefit Pension Plan decreases. Financial risks are managed primarily through the diversification of assets and prudent investment strategies.
The actuarial valuation on a going concern basis of our defined benefit component of the Pension Plan reports a surplus as at 31 December 2017. As a result, we are not required to make going concern special payments. The valuation on a solvency basis, which assumes that the plan is wound up at the valuation date, reports a deficit as at 31 December 2017 and we expect to make special payments of $28 million in 2018 to reduce this deficiency.
We continue to make full normal contributions and to monitor the defined benefit Pension Plan. The next actuarial valuation will be undertaken at 31 December 2018, with the results reported in the 2018 consolidated financial statements.
The defined benefit obligation relating to the defined benefit plans is funded as follows:
| | | | | | | | | | | | | | | | |
| | | PENSION BENEFIT PLANS | | | OTHER POST-EMPLOYMENT BENEFIT PLANS | |
| (IN MILLIONS) | | 2017 | | | 2016 | | | 2017 | | | 2016 | |
Wholly or partially funded | | | 2,263 | | | | 2,046 | | | | – | | | | – | |
Wholly unfunded | | | 93 | | | | 80 | | | | 135 | | | | 125 | |
Defined benefit obligation | | | 2,356 | | | | 2,126 | | | | 135 | | | | 125 | |
DEFINED BENEFIT PENSION AND OTHER POST-EMPLOYMENT BENEFIT PLANS
The following tables present information about the defined benefit plans.
| | | | | | | | | | | | | | | | | | | | | | | | | | | | | | | | | | | | |
| | | | | | PENSION EXPENSE INCLUDED IN NET INCOME | | | | | | | | | | | | | | | | |
2017 (IN MILLIONS) | | 1 JAN.
2017 | | | CURRENT
SERVICE
COST | | | INTEREST
COST/
(INCOME) | | | SUB-TOTAL
INCLUDED
IN NET INCOME | | | BENEFITS
PAID | | | REMEASUREMENTS
OF THE NET
DEFINED BENEFIT
PLANS INCL.
IN OCI 1 | | | EMPLOYEES’
CONTRIBU-
TIONS | | | CMHC’S
CONTRIBU-
TIONS | | | 31 DEC.
2017 | |
Pension benefit plans | | | | | | | | | | | | | | | | | | | | | | | | | | | | | | | | | | | | |
Defined benefit obligation | | | 2,126 | | | | 29 | | | | 81 | | | | 110 | | | | (96) | | | | 205 | | | | 11 | | | | – | | | | 2,356 | |
Fair value of plan assets | | | (1,867) | | | | – | | | | (71) | | | | (71) | | | | 96 | | | | (85) | | | | (11) | | | | (103) | | | | (2,041) | |
Pension benefit plans liability | | | 259 | | | | 29 | | | | 10 | | | | 39 | | | | – | | | | 120 | | | | – | | | | (103) | | | | 315 | |
Other post-employment benefit plans | | | | | | | | | | | | | | | | | | | | | | | | | | | | | | | | | | | | |
Defined benefit obligation | | | 125 | | | | 1 | | | | 5 | | | | 6 | | | | (5) | | | | 9 | | | | – | | | | – | | | | 135 | |
Fair value of plan assets | | | – | | | | – | | | | – | | | | – | | | | 5 | | | | – | | | | – | | | | (5) | | | | – | |
Other post-employment benefit plans liability | | | 125 | | | | 1 | | | | 5 | | | | 6 | | | | – | | | | 9 | | | | – | | | | (5) | | | | 135 | |
Defined benefit plans liability | | | 384 | | | | 30 | | | | 15 | | | | 45 | | | | – | | | | 129 | | | | – | | | | (108) | | | | 450 | |
| | 1 | The detailed breakdown of remeasurement gains and losses on defined benefit plans included in OCI is found in additional tables below. |
| | | | | | | | | | | | | | | | | | | | | | | | | | | | |
| | | | | | PENSION EXPENSE INCLUDED IN NET INCOME | | | | | | | | | | | | |
2016 (IN MILLIONS) | | 1 JAN.
2016 | | | CURRENT
SERVICE
COST | | | INTEREST
COST/
(INCOME) | | | SUB-TOTAL
INCLUDED IN NET INCOME | | | BENEFITS
PAID | | | REMEASUREMENTS
OF THE NET
DEFINED BENEFIT
PLANS INCL. IN OCI 1 | | EMPLOYEES’ CONTRIBU-TIONS | | CMHC’S
CONTRIBU- TIONS | | 31 DEC. 2016 |
Pension benefit plans | | | | | | | | | | | | | | | | | | | | | | | | | | | | |
Defined benefit obligation | | | 2,065 | | | | 31 | | | | 81 | | | | 112 | | | | (88) | | | 25 | | 12 | | – | | 2,126 |
Fair value of plan assets | | | (1,742) | | | | – | | | | (67) | | | | (67) | | | | 88 | | | (51) | | (12) | | (83) | | (1,867) |
Pension benefit plans liability | | | 323 | | | | 31 | | | | 14 | | | | 45 | | | | – | | | (26) | | – | | (83) | | 259 |
Other post-employment benefit plans | | | | | | | | | | | | | | | | | | | | | | | | | | | | |
Defined benefit obligation | | | 122 | | | | 1 | | | | 5 | | | | 6 | | | | (5) | | | 2 | | – | | – | | 125 |
Fair value of plan assets | | | – | | | | – | | | | – | | | | – | | | | 5 | | | – | | – | | (5) | | – |
Other post-employment benefit plans liability | | | 122 | | | | 1 | | | | 5 | | | | 6 | | | | – | | | 2 | | – | | (5) | | 125 |
Defined benefit plans liability | | | 445 | | | | 32 | | | | 19 | | | | 51 | | | | – | | | (24) | | – | | (88) | | 384 |
| | 1 | The detailed breakdown of remeasurement gains and losses on defined benefit plans included in OCI is found in additional tables below. |
| | | | |
| 2017 ANNUAL REPORT | | | | 97 |
The following table presents further detailed information on the various sources of remeasurement in OCI included in the prior table.
| | | | | | | | | | | | | | | | | | | | |
| | | | | | REMEASUREMENT (GAINS)/LOSSES INCLUDED IN OCI | |
| (IN MILLIONS) | | RETURN ON
PLAN ASSETS
(EXCLUDING
INTEREST
INCOME) | | | ACTUARIAL
CHANGES ARISING
FROM CHANGES
IN DEMOGRAPHIC
ASSUMPTIONS | | | ACTUARIAL
CHANGES ARISING
FROM CHANGES
IN FINANCIAL
ASSUMPTIONS | | | ACTUARIAL
CHANGES ARISING
FROM PLAN
EXPERIENCE | | | TOTAL INCLUDED
IN OCI | |
Year ended 31 December 2017 | | | | | | | | | | | | | | | | | | | | |
Pension benefit plans | | | | | | | | | | | | | | | | | | | | |
Defined benefit obligation | | | – | | | | – | | | | 206 | | | | (1) | | | | 205 | |
Fair value of plan assets | | | (85) | | | | – | | | | – | | | | – | | | | (85) | |
Pension benefit plans liability | | | (85) | | | | – | | | | 206 | | | | (1) | | | | 120 | |
Other post-employment benefit plans | | | | | | | | | | | | | | | | | | | | |
Defined benefit obligation | | | – | | | | – | | | | 6 | | | | 3 | | | | 9 | |
Defined benefit plans liability | | | (85) | | | | – | | | | 212 | | | | 2 | | | | 129 | |
Year ended 31 December 2016 | | | | | | | | | | | | | | | | | | | | |
Pension benefit plans | | | | | | | | | | | | | | | | | | | | |
Defined benefit obligation | | | – | | | | 4 | | | | 22 | | | | (1) | | | | 25 | |
Fair value of plan assets | | | (51) | | | | – | | | | – | | | | – | | | | (51) | |
Pension benefit plans liability | | | (51) | | | | 4 | | | | 22 | | | | (1) | | | | (26) | |
Other post-employment benefit plans | | | | | | | | | | | | | | | | | | | | |
Defined benefit obligation | | | – | | | | (1) | | | | 5 | | | | (2) | | | | 2 | |
Defined benefit plans liability | | | (51) | | | | 3 | | | | 27 | | | | (3) | | | | (24) | |
The remeasurement of plan assets is the difference between the actual rate of return on the defined benefit pension plan assets and the discount rate used to measure the obligation. The actual return on plan assets was $156 million (2016 – $118 million).
The following table presents information on the fair value of the plan assets.
| | | | | | | | | | | | | | | | | | | | | | | | | | | | | | | | |
| | | | | | 2017 | | | | | | | | | | | | 2016 | | | | | | | |
(IN MILLIONS, UNLESS OTHERWISE INDICATED) | | QUOTED | | | UNQUOTED | | | TOTAL | | | % | | | QUOTED | | | UNQUOTED | | | TOTAL | | | % | |
Cash and cash equivalents | | | 2 | | | | – | | | | 2 | | | | 0.1% | | | | 1 | | | | – | | | | 1 | | | | 0.1% | |
Short-term investments 1 | | | 97 | | | | – | | | | 97 | | | | 4.8% | | | | 40 | | | | – | | | | 40 | | | | 2.1% | |
Bonds and debentures 2 | | | | | | | | | | | | | | | | | | | | | | | | | | | | | | | | |
Securities issued or guaranteed by the Government of Canada | | | 212 | | | | – | | | | 212 | | | | 10.4% | | | | 178 | | | | – | | | | 178 | | | | 9.5% | |
Other securities | | | 807 | | | | 1 | | | | 808 | | | | 39.6% | | | | 278 | | | | 1 | | | | 279 | | | | 14.9% | |
Equities | | | | | | | | | | | | | | | | | | | | | | | | | | | | | | | | |
Canadian equities | | | 455 | | | | – | | | | 455 | | | | 22.3% | | | | 448 | | | | – | | | | 448 | | | | 24.0% | |
Foreign equities | | | 499 | | | | 1 | | | | 500 | | | | 24.5% | | | | 472 | | | | – | | | | 472 | | | | 25.3% | |
Infrastructure | | | – | | | | 76 | | | | 76 | | | | 3.7% | | | | – | | | | 70 | | | | 70 | | | | 3.7% | |
Real return securities 3 | | | 237 | | | | – | | | | 237 | | | | 11.6% | | | | 209 | | | | 4 | | | | 213 | | | | 11.4% | |
Real estate, net of mortgages payable | | | – | | | | 197 | | | | 197 | | | | 9.6% | | | | – | | | | 170 | | | | 170 | | | | 9.1% | |
Securities sold under repurchase agreements | | | – | | | | (519) | | | | (519) | | | | (25.4)% | | | | – | | | | – | | | | – | | | | – | |
Other liabilities net of non-investment assets | | | – | | | | (24) | | | | (24) | | | | (1.2)% | | | | – | | | | (4) | | | | (4) | | | | (0.1)% | |
Total | | | 2,309 | | | | (268) | | | | 2,041 | | | | 100.0% | | | | 1,626 | | | | 241 | | | | 1,867 | | | | 100.0% | |
| | 1 | Includes $97 million or 3.8% (2016 – $40 million or 2.1%) of investments made in securities issued or guaranteed by related parties. |
| | 2 | Includes $39 million or 1.5% (2016 – $18 million or 1.0%) of investments made in securities we guaranteed (CMB) and $172 million or 6.7% (2016 – $160 million or 8.5%) of investments made in securities issued or guaranteed by related parties. |
| | 3 | Includes $234 million or 9.0% (2016 – $209 million or 11.2%) of investments made in securities issued or guaranteed by related parties. |
| | | | |
| 98 | | | | CANADA MORTGAGE AND HOUSING CORPORATION |
ASSUMPTIONS
The assets and obligation of the defined benefits were measured for accounting purposes as at 31 December 2017. In performing this measurement, the following assumptions were adopted.
| | | | | | | | | | | | | | | | |
| | | PENSION BENEFIT PLANS | | | OTHER POST-EMPLOYMENT BENEFIT PLANS | |
| | | 2017 | | | 2016 | | | 2017 | | | 2016 | |
Defined benefit obligation | | | | | | | | | | | | | | | | |
Discount rate | | | 3.4% | | | | 3.9% | | | | 3.4% | | | | 3.9% | |
Rate of compensation increase | | | 3.3% | | | | 2.8% | | | | 3.3% | | | | 2.8% | |
Inflation rate | | | 2.0% | | | | 2.0% | | | | 2.0% | | | | 2.0% | |
Benefit costs | | | | | | | | | | | | | | | | |
Discount rate | | | 3.9% | | | | 4.0% | | | | 3.9% | | | | 4.1% | |
Rate of compensation increase | | | 2.8% | | | | 3.0% | | | | 2.8% | | | | 3.0% | |
Inflation rate | | | 2.0% | | | | 2.0% | | | | 2% | | | | 2.0% | |
Assumed medical cost trend | | | | | | | | | | | | | | | | |
Initial medical cost trend rate | | | – | | | | – | | | | 5.6% | | | | 5.7% | |
Medical cost trend rate declines to 1 | | | – | | | | – | | | | 4.5% | | | | 4.5% | |
Year that the rate reaches the ultimate trend rate | | | – | | | | – | | | | 2028 | | | | 2029 | |
Life expectancy of plan members at age 65 | | | | | | | | | | | | | | | | |
Male | | | 24 years | | | | 24 years | | | | 24 years | | | | 24 years | |
Female | | | 25 years | | | | 25 years | | | | 25 years | | | | 25 years | |
1 Average decrease per year of 0.1% (2016 – 0.1%).
The discount rates are determined by reference to Canadian AA-rated corporate bonds with terms to maturity approximating the duration of the defined benefit obligation. The weighted average duration of the defined pension benefit obligation is 15 years (2016 – 15 years).
The mortality assumptions used are derived from standard tables published by the Canadian Institute of Actuaries.
SENSITIVITY
The following table shows the impact of changes in the assumptions.
| | | | |
| (IN MILLIONS) | | INCREASE (DECREASE) IN DEFINED
BENEFIT OBLIGATION | | INCREASE (DECREASE) IN NET BENEFIT COSTS
RECOGNIZED IN OPERATING EXPENSES |
50 bps increase/decrease in discount rate | | (191)/217 | | (10)/10 |
50 bps increase/decrease in rate of compensation increase | | 25/(24) | | 3/(3) |
10 bps increase/decrease in inflation rate | | 33/(33) | | 2/(2) |
100 bps increase/decrease in health care cost trend rates | | 11/(9) | | – |
One year increase in life expectancy of plan members | | 77 | | 4 |
The above sensitivity analyses are based on a change in one assumption while holding all other assumptions constant. In practice, this is unlikely to occur and changes in some of the assumptions might be correlated. The method and types of assumptions used in preparing the sensitivity analyses have not changed from the previous year.
CASH FLOWS
In 2018, we expect to make contributions to the defined benefit plans of approximately $55 million.
DEFINED CONTRIBUTION PLAN
The defined contribution plan includes the pre-2016 defined contribution component of the Pension Plan, as well as the stand-alone defined contribution Pension Plan established in 2016 and Supplemental Plan.
CMHC’s contributions to the defined contribution plan were $4 million (2016 – $3 million).
| | | | |
| 2017 ANNUAL REPORT | | | | 99 |
24. INCOME TAXES
The following table presents the components of income tax.
| | | | | | | | |
| (IN MILLIONS) | | 2017 | | | 2016 | |
Current income tax expense | | | 519 | | | | 439 | |
Deferred income tax relating to origination and reversal of temporary differences | | | 58 | | | | 2 | |
Total income tax expense included in net income | | | 577 | | | | 441 | |
Income tax expense (recovery) on other comprehensive loss | | | | | | | | |
Net unrealized gains from available for sale financial instruments | | | (46) | | | | (3) | |
Reclassification of prior years’ net unrealized gains realized in the period in net income | | | (50) | | | | (14) | |
Remeasurement gains (losses) on defined benefit plans | | | (23) | | | | 5 | |
Total income tax recovery included in other comprehensive loss | | | (119) | | | | (12) | |
Total | | | 458 | | | | 429 | |
The following is a reconciliation of the statutory tax rate to the effective tax rate. | |
| (IN MILLIONS, UNLESS OTHERWISE INDICATED) | | 2017 | | | 2016 | |
Income before income taxes | | | 2,380 | | | | 1,819 | |
Statutory tax rate | | | 25% | | | | 25% | |
Income taxes computed at statutory tax rate | | | 595 | | | | 455 | |
Permanent differences | | | (18) | | | | (14) | |
Income tax expense | | | 577 | | | | 441 | |
Effective tax rate | | | 24.2% | | | | 24.2% | |
The statutory tax rate of 25% is comprised of the federal income tax rate of 38% less the general rate reduction of 13%.
The following tables present the tax-effected temporary differences which result in deferred income tax assets and liabilities.
| | | | | | | | | | | | | | | | | | | | |
| (IN MILLIONS) | | 2016 | | | CHANGE THROUGH CONSOLIDATED NET INCOME | | | CHANGE THROUGH
CONSOLIDATED OCI | | | CHANGE THROUGH
CONSOLIDATED EQUITY | | | 2017 | |
Deferred income tax assets | | | | | | | | | | | | | | | | | | | | |
Fair value of financial instruments | | | 24 | | | | (21) | | | | (3) | | | | – | | | | – | |
Post-employment benefits | | | 59 | | | | (11) | | | | 23 | | | | – | | | | 71 | |
Net realized losses on borrowings | | | 24 | | | | 11 | | | | – | | | | – | | | | 35 | |
Total deferred income tax assets | | | 107 | | | | (21) | | | | 20 | | | | – | | | | 106 | |
Deferred income tax liabilities | | | | | | | | | | | | | | | | | | | | |
Fair value of investment properties | | | (35) | | | | (23) | | | | – | | | | – | | | | (58) | |
Other | | | (6) | | | | (8) | | | | – | | | | – | | | | (14) | |
Provision for claims | | | (119) | | | | (6) | | | | – | | | | 7 | | | | (118) | |
Total deferred income tax liabilities | | | (160) | | | | (37) | | | | – | | | | 7 | | | | (190) | |
Net deferred income tax assets (liabilities) | | | (53) | | | | (58) | | | | 20 | | | | 7 | | | | (84) | |
| | | | | |
| (IN MILLIONS) | | 2015 | | | CHANGE THROUGH CONSOLIDATED NET INCOME | | | CHANGE THROUGH CONSOLIDATED OCI | | | CHANGE THROUGH CONSOLIDATED EQUITY | | | 2016 | |
Deferred income tax assets | | | | | | | | | | | | | | | | | | | | |
Fair value of financial instruments | | | 24 | | | | (7) | | | | 7 | | | | – | | | | 24 | |
Post-employment benefits | | | 71 | | | | (7) | | | | (5) | | | | – | | | | 59 | |
Net realized losses on borrowings | | | – | | | | 24 | | | | – | | | | – | | | | 24 | |
Total deferred income tax assets | | | 95 | | | | 10 | | | | 2 | | | | – | | | | 107 | |
Deferred income tax liabilities | | | | | | | | | | | | | | | | | | | | |
Fair value of investment properties | | | (33) | | | | (2) | | | | – | | | | – | | | | (35) | |
Other | | | (6) | | | | – | | | | – | | | | – | | | | (6) | |
Provision for claims | | | (114) | | | | (10) | | | | – | | | | 5 | | | | (119) | |
Total deferred income tax liabilities | | | (153) | | | | (12) | | | | – | | | | 5 | | | | (160) | |
Net deferred income tax assets (liabilities) | | | (58) | | | | (2) | | | | 2 | | | | 5 | | | | (53) | |
The deferred income tax assets have been recognized in full as we believe it is probable that these items will be realized in the normal course of operations.
| | | | |
| 100 | | | | CANADA MORTGAGE AND HOUSING CORPORATION |
25. RELATED PARTY TRANSACTIONS
Our related parties include the Government and its departments, agencies and Crown corporations, key management personnel and their close family members and the Pension Plan.
All material related party transactions and outstanding balances not disclosed elsewhere are disclosed below.
Transactions or balances between the entities that have been eliminated on consolidation are not reported.
GOVERNMENT OF CANADA AND ITS DEPARTMENTS, AGENCIES AND CROWN CORPORATIONS
We are related in terms of common ownership to all Government departments, agencies and Crown corporations. We enter into transactions with some of these entities in the normal course of business.
The following tables summarize income earned and receivable as well as the total amount invested in instruments issued or guaranteed by the Government.
| | | | | | | | |
| (IN MILLIONS) | | 2017 | | | 2016 | |
Investment income – cash equivalents | | | 1 | | | | 1 | |
Investment income – investment securities | | | 58 | | | | 55 | |
| | |
(IN MILLIONS) | | | 2017 | | | | 2016 | |
Cash equivalents | | | 67 | | | | 189 | |
Investment securities | | | 4,191 | | | | 3,806 | |
Interest receivable – investment securities 1 | | | 12 | | | | 11 | |
| | 1 | Included in accrued interest receivable. |
We pay the Government fees in recognition of its financial backing of the Mortgage Loan Insurance and Securitization Activities. The fees, which are recognized in operating expenses over the period covered by the insurance contract, amount to $20 million (2016 – $17 million) for the Securitization Activity and $36 million (2016 – $25 million) for the Mortgage Loan Insurance Activity.
KEY MANAGEMENT PERSONNEL
The following table presents the compensation of key management personnel, defined as those persons having authority and responsibility for planning, directing and controlling our activities. This includes the Board of Directors and the following senior management members: the President and Chief Executive Officer; the Chief Financial Officer; the Chief Risk Officer; the Chief Information Officer and the Senior Vice-Presidents.
| | | | | | | | | | | | | | | | | | | | | | | | |
| | | | | | 2017 | | | | | | | | | 2016 | | | | |
| (IN THOUSANDS) | | BOARD OF
DIRECTORS | | | OTHER KEY
MANAGEMENT
PERSONNEL | | | TOTAL | | | BOARD OF
DIRECTORS | | | OTHER KEY
MANAGEMENT
PERSONNEL | | | TOTAL | |
Short-term benefits | | | 107 | | | | 3,986 | | | | 4,093 | | | | 130 | | | | 4,734 | | | | 4,864 | |
Post-employment benefits | | | – | | | | 682 | | | | 682 | | | | – | | | | 805 | | | | 805 | |
Total | | | 107 | | | | 4,668 | | | | 4,775 | | | | 130 | | | | 5,539 | | | | 5,669 | |
Receivable balances outstanding with members of key management personnel as at 31 December 2017 are nil (2016 – nil).
PENSION PLAN
The following table summarizes interest expense we incurred and administrative services we recovered from the Pension Plan.
| | | | | | | | |
| (IN MILLIONS) | | 2017 | | | 2016 | |
Interest expense – paid to the Pension Plan for its holdings of CMB 1 | | | 1 | | | | 1 | |
Operating expenses recoveries – paid by the Pension Plan for our administration services | | | 4 | | | | 5 | |
| | 1 | Refer to Note 23 for additional information on holdings of CMB by the Pension Plan. |
Receivable balances outstanding with the Pension Plan as at 31 December 2017 are $22 million (2016 – $9 million).
| | | | |
| 2017 ANNUAL REPORT | | | | 101 |
26. COMMITMENTS AND CONTINGENT LIABILITIES
LOANS
Commitments outstanding for loans, net of forgiveness, amounted to $239 million at 31 December 2017 (2016 –$166 million) and are normally advanced within a two-year period.
WORKOUTS ADVANCES FOR MORTGAGE INSURANCE
Commitments outstanding for advances to mortgages or loans in financial difficulty amounted to $16 million at 31 December 2017 (2016 – $24 million) and are normally advanced within a ten-year period. Advances in the amount of $14 million are expected to be made over the next five years.
LETTERS OF CREDIT
We have $125 million (2016 – $107 million) in letters of credit outstanding.
LEGAL CLAIMS
There are legal claims of $8 million (2016 – $9 million) against CMHC. Due to the uncertainty of the outcome of these claims, no provision for loss has been recorded. We do not expect the ultimate resolution of any of the proceedings to which we are party to have a significant adverse effect on our financial position.
OTHER FINANCIAL OBLIGATIONS
Total estimated remaining contractual financial obligations are as follows based on minimum commitment:
| | | | | | | | | | | | | | | | | | | | | | | | |
| (IN MILLIONS) | | 2018 | | | 2019 | | | 2020 | | | 2021 | | | 2022 | | | 2023 AND THEREAFTER | |
Housing programs 1 | | | 1,478 | | | | 1,407 | | | | 1,274 | | | | 1,205 | | | | 1,134 | | | | 4,990 | |
Other contractual obligations | | | 102 | | | | 53 | | | | 45 | | | | 42 | | | | 42 | | | | 26 | |
Operating leases | | | 16 | | | | 14 | | | | 13 | | | | 11 | | | | 10 | | | | 15 | |
Total | | | 1,596 | | | | 1,474 | | | | 1,332 | | | | 1,258 | | | | 1,186 | | | | 5,031 | |
| | 1 | Total remaining contractual financial obligations for Housing programs extend for periods up to 25 years (2016 – 25 years). |
In addition to the above minimum commitments, there is a total of $676 million at 31 December 2017 that can be claimed by various parties over the next two years under the Investment in Affordable Housing if the required criteria are met by the various parties to the agreements.
ASSISTED HOUSING INITIATIVES
We have $80 million of cash and cash equivalents as at 31 December 2017 (2016 – nil) that relates to funds received from the Government that may only be used as part of the Affordable Rental Housing Innovation Fund.
We also have $75 million of cash and cash equivalents that may only be used as part of the RCFI.
27. OPERATING EXPENSES
The following table presents the composition of operating expenses.
| | | | | | | | |
| (IN MILLIONS) | | 2017 | | | 2016 | |
Personnel costs | | | 261 | | | | 268 | |
Depreciation of premises and equipment | | | 3 | | | | 5 | |
Other administrative goods and services | | | 293 | | | | 192 | |
| | | 557 | | | | 465 | |
Less: Housing programs operating expenses 1 | | | (161) | | | | (146) | |
Total operating expenses | | | 396 | | | | 319 | |
| | 1 | These expenses represent operating costs we incurred to support and administer housing programs within the Assisted Housing Activity. These costs are reimbursed by the Government through parliamentary appropriations and are recognized in Housing programs expenses (refer to Note 6). |
| | | | |
| 102 | | | | CANADA MORTGAGE AND HOUSING CORPORATION |
28. CURRENT AND NON-CURRENT ASSETS AND LIABILITIES
The following table presents assets and liabilities we expect to recover or settle after 12 months as at 31 December 2017 and 2016.
| | | | | | | | | | | | | | | | | | | | | | | | |
| | | | | | 2017 | | | | | | | | | 2016 | | | | |
| (IN MILLIONS) | | WITHIN
1 YEAR | | | AFTER
1 YEAR | | | TOTAL | | | WITHIN
1 YEAR | | | AFTER
1 YEAR | | | TOTAL | |
Assets | | | | | | | | | | | | | | | | | | | | | | | | |
Cash and cash equivalents | | | 887 | | | | – | | | | 887 | | | | 1,995 | | | | – | | | | 1,995 | |
Securities purchased under resale agreements | | | – | | | | – | | | | – | | | | 17 | | | | – | | | | 17 | |
Investment securities: | | | | | | | | | | | | | | | | | | | | | | | – | |
Designated at fair value through profit or loss | | | 322 | | | | 912 | | | | 1,234 | | | | 177 | | | | 996 | | | | 1,173 | |
Available for sale | | | 2,302 | | | | 19,810 | | | | 22,112 | | | | 2,356 | | | | 20,870 | | | | 23,226 | |
Derivatives | | | 15 | | | | 46 | | | | 61 | | | | 3 | | | | 83 | | | | 86 | |
Loans: | | | | | | | | | | | | | | | | | | | | | | | – | |
Designated at fair value through profit or loss | | | 603 | | | | 2,303 | | | | 2,906 | | | | 702 | | | | 3,318 | | | | 4,020 | |
Loans and receivables | | | 38,817 | | | | 199,127 | | | | 237,944 | | | | 29,702 | | | | 197,608 | | | | 227,310 | |
Accrued interest receivable | | | 705 | | | | – | | | | 705 | | | | 705 | | | | – | | | | 705 | |
Due from the Government of Canada | | | 27 | | | | 99 | | | | 126 | | | | 15 | | | | 44 | | | | 59 | |
Investment property | | | – | | | | 305 | | | | 305 | | | | – | | | | 267 | | | | 267 | |
Accounts receivable and other assets | | | 278 | | | | 557 | | | | 835 | | | | 248 | | | | 426 | | | | 674 | |
| | | | 43,956 | | | | 223,159 | | | | 267,115 | | | | 35,920 | | | | 223,612 | | | | 259,532 | |
Liabilities | | | | | | | | | | | | | | | | | | | | | | | | |
Securities sold under repurchase agreements | | | 297 | | | | – | | | | 297 | | | | 704 | | | | – | | | | 704 | |
Derivatives | | | 14 | | | | 25 | | | | 39 | | | | 2 | | | | 30 | | | | 32 | |
Borrowings: | | | | | | | | | | | | | | | | | | | | | | | | |
Designated at fair value through profit or loss | | | 1,135 | | | | 3,429 | | | | 4,564 | | | | 1,270 | | | | 4,635 | | | | 5,905 | |
Other financial liabilities | | | 38,564 | | | | 195,028 | | | | 233,592 | | | | 29,324 | | | | 193,832 | | | | 223,156 | |
Accrued interest payable | | | 545 | | | | – | | | | 545 | | | | 542 | | | | – | | | | 542 | |
Dividend payable | | | 2,000 | | | | – | | | | 2,000 | | | | – | | | | – | | | | – | |
Accounts payable and other liabilities | | | 458 | | | | 103 | | | | 561 | | | | 396 | | | | 152 | | | | 548 | |
Provision for claims | | | 317 | | | | 238 | | | | 555 | | | | 390 | | | | 264 | | | | 654 | |
Unearned premiums and fees | | | 1,712 | | | | 4,975 | | | | 6,687 | | | | 1,699 | | | | 4,865 | | | | 6,564 | |
Defined benefit plans liability | | | 95 | | | | 355 | | | | 450 | | | | 89 | | | | 295 | | | | 384 | |
Deferred income tax liabilities | | | – | | | | 84 | | | | 84 | | | | – | | | | 53 | | | | 53 | |
| | | | 45,137 | | | | 204,237 | | | | 249,374 | | | | 34,416 | | | | 204,126 | | | | 238,542 | |
Net | | | (1,181) | | | | 18,922 | | | | 17,741 | | | | 1,504 | | | | 19,486 | | | | 20,990 | |
29. COMPARATIVE FIGURES
Certain comparative information in the consolidated statement of income and comprehensive income has been reclassified to conform to the current year’s presentation. The same comparative information has been reclassified accordingly in the related notes to the consolidated financial statements.
We incur costs to issue CMB that are fully reimbursed by the sellers of NHA MBS into the CMB program. As described in Note 2, our accounting policy is to include transaction costs directly attributable to the issuance of CMB and related reimbursements thereof in the amount initially recognized for the liability. The transaction costs and related reimbursements were both $69 million in 2017 (2016 – $68 million), resulting in no net impact to the borrowings amount initially recognized. Previously we had reported the 2016 comparative figures for the costs and related reimbursements as operating expenses and other income, respectively with no net impact to net income. We have reclassified the 2016 comparative figures to conform to the current year’s presentation.
Certain comparative information presented in Note 14 has been reclassified to conform to the current year’s presentation.
Maturities of CMB held by CMHC were previously presented as repayments but are now presented as eliminations.
30. SUBSEQUENT EVENT
On 22 March 2018, we declared a dividend of $1 billion from our Mortgage Loan Insurance Activity which is expected to be paid by 30 June 2018.
| | | | |
| 2017 ANNUAL REPORT | | | | 103 |
CORPORATE GOVERNANCE
LEGISLATIVE FRAMEWORK
Incorporated under the Canada Mortgage and Housing Corporation Act (CMHC Act), the Corporation is accountable to Parliament through the Minister responsible for CMHC, currently the Minister of Families, Children and Social Development. Our legislative framework includes the CMHC Act, the National Housing Act (NHA) and the Financial Administration Act (FAA).
BOARD OF DIRECTORS
The Board of Directors is responsible for managing our affairs and the conduct of our business in accordance with applicable legislation and the governing by-laws of the Corporation. As steward of the Corporation, the Board of Directors sets strategic direction in support of government policies and priorities, ensures the integrity and adequacy of corporate policies, information systems and management practices, ensures that principal risks are identified and managed, and evaluates and monitors performance and results. The Board of Directors has a duty to protect the long- and short-term interests of the Corporation, safeguard the Corporation’s assets, and be prudent and professional in fulfilling its duties.
The Board is made up of the Chairperson, the President and Chief Executive Officer (CEO), the Deputy Minister of the Minister responsible for CMHC, the Deputy Minister of Finance, and eight other directors. Charters for the Board and its committees (Audit, Corporate Governance and Nominating, Human Resources, Risk Management, Social and Affordable Housing, and Pension Fund Trustees) are posted on our website. The Board meets a minimum of five times per year and holds an annual public meeting.
Our Board of Directors continuously seeks to enhance its governance and risk management policies and practices to ensure they remain responsive to the circumstances and needs of the Corporation and continue to reflect applicable legislation, guidance on matters of governance specific to Crown corporations, and recognized “best practices.” The Board of Directors also helps promote a culture of integrity throughout the Corporation, which is supported by our Code of Ethics and Business Conduct.
In order to identify opportunities for enhanced Board performance and director development and education, the Board undergoes annual assessments, generally alternating between a peer assessment and an overall assessment, the latter of which examines the functioning of the Board as a whole in comparison to the boards of other Crown corporations and financial institutions.
COMPENSATION AND ATTENDANCE RECORD
| | | | | | | | | | | | | | |
| | | | | | | | | MEETING ATTENDANCE | | | | |
| | | | | | | | | | | COMMITTEES * | | |
| | | | | | | GOVERNANCE | | | | | | | | PENSION |
| | | | | BOARD OF | | AND | | | | HUMAN | | RISK | | FUND |
| MEMBER | | COMPENSATION | | DIRECTORS | | NOMINATING | | AUDIT | | RESOURCES | | MANAGEMENT | | TRUSTEES |
Robert P. Kelly | | Note 1 | | 9/9 | | 5/5 | | 2/4 | | 4/4 | | 3/4 | | – |
Evan Siddall | | n/a | | 9/9 | | 5/5 | | 3/4 | | 4/4 | | 4/4 | | 4/4 |
Navjeet (Bob) Dhillon | | 29,200 | | 9/9 | | – | | 4/4 | | – | | 4/4 | | – |
Louise Poirier-Landry | | 25,700 | | 9/9 | | – | | 4/4 | | – | | 4/4 | | 4/4 |
Paul Rochon | | n/a | | 9/9 | | – | | – | | – | | 4/4 | | – |
Bruce Shirreff | | 26,700 | | 9/9 | | 5/5 | | 4/4 | | 4/4 | | 4/4 | | – |
Peter Sharpe | | 26,200 | | 9/9 | | 5/5 | | 3/4 | | 4/4 | | 4/4 | | – |
Louise Levonian | | n/a | | 7/9 | | 3/5 | | – | | 3/4 | | – | | – |
* The above chart reflects all attendance at Committee meetings whether the director was a member of the committee or not.
1 Note: Opted to waive all per diem allocation effective January 2016 until further notice.
| | | | |
| 104 | | | | CANADA MORTGAGE AND HOUSING CORPORATION |
BOARD OF DIRECTORS
As at 31 December 2017

| | | | |
| PICTURED FROM LEFT TO RIGHT | | | | NOT PICTURED |
| | |
Peter Sharpe (5 February 2015–4 February 2019) Chair of the Human Resources Committee Paul Rochon Deputy Minister of Finance Dana Ades Landy (30 January 2018–29 January 2022) Derek Ballantyne Chairperson (effective 29 April 2018) Linda Morris (14 December 2017–13 December 2021) L. Daniel Gauvin (14 December 2017–13 December 2021) Navjeet (Bob) Dhillon (5 February 2015–4 February 2019) Chair of the Audit Committee | | Bruce Shirreff (30 January 2018–29 January 2021) Vice-Chairperson effective 11 January 2018 Chair of the Risk Management Committee Anne Giardini (2 January 2018–1 January 2022) Janice Abbott (14 December 2017–13 December 2020) Evan Siddall President and Chief Executive Officer Chair of the Pension Fund Trustees | | Louise Levonian Deputy Minister, Employment and Social Development Louise Poirier-Landry (30 January 2014 to 29 January 2018) Robert P. Kelly Chairperson (29 April 2013–6 March 2018) Chair of the Corporate Governance and Nominating Committee |
| | | | |
| 2017 ANNUAL REPORT | | | | 105 |
SENIOR MANAGEMENT
OUR EXECUTIVE COMMITTEE
(as of 5 February 2018)
| | |
 | | Evan Siddall President and Chief Executive Officer Evan has worked at some of the world’s largest investment banking firms in Canada and the United States. He also served at the Bank of Canada where, in the wake of the global financial crisis, he spearheaded the development of financial infrastructure to guard against systemic risks. Since joining CMHC in 2014, he has led a transformation to make the organization more high-performing and innovative, with a vision to be at the heart of a world-leading housing system. |
| |
 | | Romy Bowers Chief Commercial Officer Romy joined CMHC in 2015 with more than 15 years’ experience working at and with Canada’s leading private-sector financial institutions. Having recently led CMHC’s risk operations, she now brings her superior insight and client understanding to the organization’s commercial operations. |
| |

| | Deborah Greenberg Chief Legal Officer and Corporate Secretary Deborah is a specialist in commercial law and governance who served in leadership advisory roles at private sector organizations before joining CMHC last year. She is responsible for setting the legal and governance frameworks for all of the company’s operations, and heads its corporate secretariat. |
| |

| | Charles MacArthur Senior Vice-President, Assisted Housing Charlie’s 20+ years at CMHC have given him experience working in every corner of the country and a deep understanding of housing markets. He leads the team delivering the National Housing Strategy. |
| |
 | | Paul Mason Chief Information Officer Paul joined CMHC in 2016 bringing with him more than 20 years of experience running IT operations for leading financial and technology corporations. He leads CMHC’s technology and business transformation. |
| | |

| | Steven Mennill Chief Risk Officer Steve’s experience at CMHC and expertise in urban planning and economics converge to make him one of Canada’s foremost housing authorities. With 23 years of experience at CMHC, including as a key contributor to Canada’s response to the 2008-09 global recession, he now leads CMHC’s Risk Management efforts. |
| |

| | Marie-Claude Tremblay Senior Vice-President, People and Strategy Marie-Claude’s career of service to Canada includes roles in several federal departments and senior positions at CMHC, which she joined in 2010. In her current role, she aligns CMHC’s strategy with its people, overseeing strategy development, human resources and public affairs. |
| |

| | Michel Tremblay Senior Vice-President, Policy and Research Michel’s career is marked by high-level roles in areas including finance and technology. He joined CMHC in 2005, and was integral to the design of Canada’s National Housing Strategy. He now leads efforts to modernize and bolster CMHC’s data analysis and research capabilities, leading to data-driven policy development. |
| |

| | Lisa Williams Chief Financial Officer Prior to joining CMHC in 2003, Lisa used to audit Crown Corporations for Canada’s Auditor General. Her leadership on CMHC’s multi-unit insurance operations, including as Vice-President, Multi-Unit Insurance Operations (2016), have contributed to the organization’s healthy financial performance. She now leads CMHC’s Finance Team. |
| | | | |
| 106 | | | | CANADA MORTGAGE AND HOUSING CORPORATION |
OUR MANAGEMENT COMMITTEE
Fatima Barros
Vice-President, Audit and Evaluation
Isabelle Bougie
Vice-President, Regional Operations
Mark Chamie
Vice-President, Capital Markets
Kathleen Devenny
Vice-President, Financial Planning and Analysis
Nathalie Fredette
Vice-President, Insurance Operations
Christina Haddad
Vice-President, Public Affairs
Steffan Jones
Vice-President, Strategy and Organizational Excellence
Nadine Leblanc
Deputy Chief Risk Officer
Neil Levecque
Chief Data Officer and Vice-President, Technology Strategy
Audrey Moritz
Vice-President, Housing Markets and Indicators
Caroline Sanfaçon
Vice-President, Affordable Housing, Investments and Lending
Carla Staresina
Vice-President, Client Relationship Management
Debbie Stewart
Vice-President, Affordable Housing, Client Solutions Management
Glen Trevisani
Vice-President, Multi-Unit Insurance Operations
| | | | |
| 2017 ANNUAL REPORT | | | | 107 |
GLOSSARY
NON-IFRS FINANCIAL MEASURES
We use a number of financial measures to assess our performance, some of which are not calculated in accordance with IFRS, are not defined by IFRS, and do not have standardized meaning that would ensure consistency and comparability with other institutions.
Arrears rate
The ratio (expressed as a percentage) of all loans that are typically more than 90 days past due to the number of outstanding insured loans.
Capital available to capital required
Under the Securitization Activity, this means the ratio (expressed as a percentage) of capital available to capital required where capital required is calculated by applying risk factors to investment asset and liability exposures using a framework developed in accordance with both regulatory and economic capital principles.
Capital available to minimum capital required
Under the Mortgage Loan Insurance Activity, this means the ratio (expressed as a percentage) of capital available to minimum capital required where capital available is calculated as total equity adjusted for assets with a capital requirement of 100% and minimum capital required is calculated by applying risk factors to investment asset and liability exposures in accordance with guidelines established by OSFI.
Guarantees-in-force
The total guarantees related to the timely payment of principal and interest of NHA MBS for investors in securities issued by Approved Issuers on the basis of housing loans through the NHA MBS program and the CMB issued by the CHT.
Insurance-in-force
The total amount of outstanding loan balances covered by mortgage loan insurance policies at a specific period in time.
Loss ratio
The ratio (expressed as a percentage) of the insurance claims incurred during the period to the premiums and fees earned in the period in the Mortgage Loan Insurance Activity.
Minimum Capital Test (MCT)
The minimum capital required calculated by applying risk factors to the Mortgage Loan Insurance Activity’s assets and liabilities using a defined methodology prescribed by OSFI.
Mortgage insurance defaults
Defaults from the mortgage insurance business occurs when a borrower has missed the equivalent of at least one payment as at the reporting date.
Operating Budget Expense Ratio
The ratio (expressed as a percentage) of operating budget expenses for all of CMHC’s activities (excluding CHT) during the period to premiums, fees, guarantee, and application fees received, net interest income from Lending programs and normalized parliamentary appropriations.
Operating expense ratio
Mortgage Loan Insurance Activity: the ratio (expressed as a percentage) of operating expenses during the period to premiums and fees earned during the period for the Mortgage Loan Insurance Activity.
Securitization Activity: the ratio (expressed as a percentage) of operating expenses during the period, exclusive of those related to the administration of the covered bond legal framework, to guarantee fees earned during the period.
Return on capital holding target (ROCHT)
Reflects annualized net income, adjusted to reflect earnings based on CMHC’s capital holding level of 165% MCT, divided by the weighted average capital holding target for the period.
Return on equity
The annualized net income divided by the average of the beginning and ending equity for the period, used to highlight the operating performance.
Return on required capital (RoRC)
The annualized net income, adjusted to remove investment income earned on capital in excess of capital required, divided by the average required capital for the period.
| | | | |
| 108 | | | | CANADA MORTGAGE AND HOUSING CORPORATION |
Revenue per employee
The ratio of premiums, fees, guarantee, and application fees received, net interest income from Lending programs and normalized parliamentary appropriations during the period, to full-time equivalents (FTEs).
Severity ratio
The ratio (expressed as a percentage) of insurance claims to the original insured loan amount for the claims paid in the period.
OTHER GLOSSARY TERMS
Approved Issuer
A business organization which, having met the criteria established by CMHC, is approved to issue and administer guaranteed NHA MBS.
Approved Lender
A lending institution designated as an approved lender by CMHC under the NHA. Only Approved Lenders may qualify for CMHC loan insurance.
Canada Housing Trust (CHT)
The CHT is a special purpose trust that acquires interests in eligible insured housing loans, such as NHA MBS, and issues CMB. The CHT also purchases highly rated investments and undertakes certain related financial hedging activities. We consolidate the accounts of CHT with Securitization. CHT’s assets and liabilities are neither owned by nor held for our benefit. The beneficiaries of the trust, after payment of all obligations, are one or more charitable organizations.
Core housing need
A household is in core housing need if its housing does not meet one or more of the adequacy, suitability or affordability standards and it would have to spend 30% or more of its before-tax income to access local housing that meets all three standards. Adequate housing does not require any major repairs, according to residents. Suitable housing has enough bedrooms for the size and make-up of resident households, according to National Occupancy Standard (NOS) requirements. Affordable housing costs less than 30% of before-tax household income.
emili
A proprietary online automated mortgage insurance risk assessment and approval system developed by CMHC.
Housing programs
All activities funded by parliamentary appropriations under Assisted Housing and Market Analysis and Research Activities.
Housing support
Contractual commitments for housing and municipal infrastructure that help to reduce affordability problems for low and moderate-income households, to provide accommodation for students and to provide production of moderately priced rental housing. The program also provides ancillary services to support our mandate. This includes the Affordable Housing Centre, the housing-related infrastructure loans to municipalities and other long-term commitments such as the market housing programs and the community services program.
Investment in Affordable Housing (IAH) 2011-2019
Since April 2011, new federal funding for affordable housing has been provided through the IAH. Originally announced as a three-year commitment (2011-2014), the IAH has been extended to 2019 for a total federal investment of more than $1.9 billion over eight years toward reducing the number of Canadians in housing need. Under the IAH, provinces and territories cost-match the federal investment and are responsible for program design and delivery.
Lending programs
We make loans under the NHA to federally-subsidized social housing sponsors, First Nations, provinces, territories and municipalities as well as non-subsidized housing support loans. Our loan portfolio is comprised of a mix of renewable and non-renewable loans which may be on or off-reserve. Direct Lending is the current borrowing initiative we use to refinance our renewable loans as well as to finance new commitments on-reserve. These loans can be financed at lower interest rates due to our status as a federal Crown corporation. As such, we are able to lower the cost of government assistance required for social housing projects. Direct Lending is operated on a planned breakeven basis.
Municipal Infrastructure Lending Program 2009-2011 (MILP)
In Budget 2009, we provided $2 billion in direct low-cost loans to municipalities over a two-year period ending 31 March 2011 to fund housing-related municipal infrastructure.
| | | | |
| 2017 ANNUAL REPORT | | | | 109 |