Exhibit 99.2

A Commitment to Affordability Annual Report 2019
| Our role is to
Evan Siddall
President and Chief Executive Officer
|  |


Table of | ||||||
Contents | ||||||
Message from the Chair | 4 | |||||
| Message from the President | 6 | |||||
| Message from the Chief Financial Officer | 8 | |||||
| Our 2019 Strategy Framework | 10 | |||||
| Management’s Discussion and Analysis | 12 | |||||
| Progress Toward our Aspiration | 13 | |||||
| Our Story Innovating with purpose to solve housing affordability challenges | 16 | |||||
| Our Company | 17 | |||||
| Our Story Putting our clients first to help us find better housing solutions for Canadians | 21 | |||||
| Spotlight on the National Housing Strategy | 22 | |||||
| Our Story Providing tools to support stronger decisions on housing affordability in Canada | 26 | |||||
| Operating Environment | 27 | |||||
| Our Story Modernizing the way we work with emerging technology | 31 | |||||
| Financial Results | 32 | |||||
| Historical Information | 38 | |||||
| Risk Management | 39 | |||||
| Consolidated Financial Statements | 42 | |||||
| Corporate Governance | 115 | |||||
| Glossary | 121 | |||||
Capabilities and Management Systems Definitions
| 124 | |||||
A Commitment to Affordability | 2019 Annual Report 3
 | Message from the Chair
|
Across the country, Canadians continue to cite soaring housing costs as one of their top concerns. For CMHC’s Board of Directors, this reinforces the urgency and pertinence of the company’s strategic focus on affordability for all.
Over the past year, CMHC has marshalled all of its resources around the audacious goal that “by 2030, everyone in Canada has a home that they can afford and that meets their needs.” The Board was—and continues to be—impressed with how senior management and staff quickly and skillfully mobilized to position the company for success. Although his tenure ends in 2020, Evan and our talented management team will continue to push the company to new heights in its service to Canadians.
CMHC’s reputation for delivering strong policy and programs earned it further trust from the federal government, for which housing affordability has been a key priority. In 2019, for the fourth consecutive year, the federal budget announced expanded housing programs involving CMHC—an unprecedented ‘winning streak’ in the company’s history that gives further momentum to its vital work. The Board takes this investment of public funds seriously; we will ensure it improves the lives of Canadians in housing need.
Notably, increased funding of CMHC’s successful Rental Construction Financing initiative is already creating more affordable rental housing for middle-income Canadians. The First-Time Home Buyer Incentive, launched in September 2019, is helping qualified homebuyers reduce their monthly mortgage payments without adding to their financial burdens. The National
Housing Strategy Act will protect the progress we’ve made under the National Housing Strategy and ensure Canadians—especially the most vulnerable populations—continue to benefit from better, more affordable housing for generations to come.
CMHC also played a key role in negotiating bilateral agreements between the federal and provincial-territorial governments. In the coming year, these partnerships will unlock further investments in community housing, direct benefits to Canadians to cover housing costs and fund other regional priorities.
When my fellow Board members and I represent CMHC in meetings and events across Canada and abroad, we are continually encouraged by the incredible work done by our housing affordability colleagues—private and not-for-profit developers, foundations, governments, Indigenous communities and people with lived experience of housing need. As we begin a new decade, I’m grateful for their engagement with CMHC, and I’m more optimistic than ever that together we can achieve affordable housing for all.

Derek Ballantyne
Chair, Board of Directors
4

 | Message from the President
|
CMHC exists for one reason: to make housing affordable for Canadians. Our bold aspiration—that by 2030, everyone in Canada has a home that they can afford and that meets their needs—animates this singular focus. In 2019, we restructured CMHC to reorient our activities toward our clients and accelerate the achievement of our goal.
2019 highlights
We delivered the second of the 10-year, $55-billion+ National Housing Strategy to reduce housing need and homelessness and remain on track to achieve our deliverables. We maximized rental housing supply programs, especially the National Housing Co-investment Fund, the Rental Construction Financing initiative and the Affordable Rental Innovation Fund. As noted in the Chair’s message, additional National Housing Strategy initiatives were launched in 2019, including the First-Time Home Buyer Incentive and Shared Equity Mortgage Providers Fund, the Federal Lands Initiative and the Canadian Community Housing Resource Network.
Promulgation of the National Housing Strategy Act was a milestone achievement for CMHC and Canada. The Act affirms that adequate housing is a fundamental human right in international law. It requires the federal government to maintain a national housing strategy and regularly to report on results, ensuring that housing affordability remains a priority for generations to come. Moreover, it manifests an independent review and reporting framework to surface and explore systemic barriers to housing.
6
In 2019, our commercial operations earned $1.6 billion on $4.7 billion of revenues, generating a return on equity of 14.3% (our government assistance programs are operated to break even). Our ongoing technology and business transformation enabled us to further automate certain routine tasks. We achieved substantially all of our strategic plan targets for the sixth consecutive year.
Just as our operations emphasized rental supply, we also continued to speak out against homeownership policies that stimulate demand via increased borrowing. These jeopardize Canada’s financial stability, economic growth and social inclusivity and, by promoting suburban development, they also result in increased greenhouse gas emissions since it encourages more car usage. Containing housing demand and limiting indebtedness are also reinforced by the mortgage insurance stress test, notwithstanding opposition from mortgage brokers, realtors and homebuilders. Our role is to promote housing affordability, not to stay silent when the real estate industry seeks to preserve its income at the expense of housing affordability.
ROWE™, mobility and the Future of Work
Through our 10-year partnership with Accenture, we continue to modernize CMHC’s Information Technology suite and put technology at the core of our future, even as we reap the benefits of the work done to date.
We are the largest organization in Canada to adopt a Results-Only Work Environment (ROWE) method, where people have the autonomy to choose when and where to work, as long as they deliver the results expected of them. As a result, we’re seeing higher levels of productivity, increased innovation and improved employee engagement.
As a complement to ROWE, we are also transforming our physical environment. We have eliminated assigned offices and are creating spaces for the chance collision of ideas that spawn innovation. Taking advantage of our modernized Information Technology suite, we are renovating our offices into technologically enabled, adaptable spaces—a living laboratory to advance housing innovation.
Diversity and inclusion
CMHC’s renovated office spaces will incorporate universal design accessibility principles as we aim to be an example to others in the public and private sectors—a standard-bearer for inclusivity within our workforce and across the country.
We score above Canadian demographics in a number of areas, including gender diversity. Half of our people leaders are women—an achievement that earned us recognition by McKinsey & Company as a leader in gender diversity in the workplace. While we take pride in our achievements to date, we also recognize that more needs to be done, including with respect to Indigenous people and visible minorities. Notably, in 2019 CMHC hosted the second annual Diversity and Inclusion Conference in Ottawa.
Climate change
We have a responsibility to Canadians to ensure the enduring value of the investments we are making in housing today. In 2019, the Board identified climate change as a defining factor in our long-term outlook. Climate change will determine where housing is built, and how it is financed, designed, constructed and maintained. We must better understand what this will mean for our business and housing in Canada.
To that end, we are developing a climate change strategy that serves our raison d’être of making housing affordable for Canadians. We have appointed a Chief Climate Officer to advance our climate risk management capabilities to undertake targeted analysis and to explore opportunities. We have taken some first steps in this report toward confirming with the recommendations of the Financial Stability Board’s Task Force on Climate-related Financial Disclosures.
Outlook
As this is my final annual report message as President and Chief Executive Officer of CMHC, I want to thank all of my colleagues for the trust they placed in me since 2014. Our country is fortunate for many things; CMHC and the people who breathe life into it are among our national treasures. I will miss this place and remain a booster of their unwavering commitment to ensure that all Canadians have the dignity of a home.

Evan Siddall
President and Chief Executive Officer
A Commitment to Affordability | 2019 Annual Report 7
 | Message from the Chief Financial Officer
|
Everything we do at CMHC is focused on executing our strategy to achieve our 2030 aspiration. Our various programs and activities support the stability of Canada’s financial system and deliver affordable housing solutions to people living in Canada. In pursuing these objectives, we recognize the importance of managing our resources in a responsible and transparent manner. As such, we are pleased to provide insight into our 2019 financial results through our annual report.
Overall, CMHC’s 2019 financial performance was strong. Our total revenues for the year were $4.7 billion, which included over $2 billion in government funding for housing programs and $2.6 billion in revenues from our Mortgage Insurance and Mortgage Funding activities. We generated a consolidated net income of $1.6 billion and earned a return on equity of 14.3%. Given our continued financial strength in 2019, we returned more than $2 billion of capital to the Government of Canada in the form of dividend payments from our Mortgage Insurance and Mortgage Funding activities.
Government-funded programs
We continue to make good progress in the delivery of the National Housing Strategy initiatives. During 2019, we expanded the Rental Construction Financing initiative with additional funding provided through the 2019 Federal Budget. We also ramped up our National Housing Co-investment Fund and are on track to meet our targets by the end of this 10-year program. In 2019, we announced the largest federal housing investment with a municipal partner in Canadian history, supporting the renovation of more than 58,000 affordable housing units in Toronto. In addition, the 2019 Federal Budget provided the opportunity to invest in affordable homeownership, through the launch of the First-Time Home Buyer Incentive and the Shared Equity Mortgage Providers Fund. These programs were designed to help qualified first-time homebuyers purchase homes without adding to their financial burdens.
8
|
Commercial activities
We continued to see strong demand for our multi-unit products insuring more than 127,000 rental housing units during the year. Affordable rental housing comprised almost 6% of the total rental housing units insured. Our homeowner products were stable in 2019, helping almost 100,000 households buy a home. More than 14% of these properties are located in rural communities.
Our Mortgage Funding products continued to provide financial institutions with access to affordable and reliable mortgage financing. Throughout the year, we provided guarantees for more than $249 billion in National Housing Act Mortgage-Backed Securities and $244 billion in Canada Mortgage Bonds. Overall, these guarantees helped provide over $133 billion in funding to lenders.
At the end of 2019, our total insurance contracts outstanding (that is, insurance-in-force) stood at $429 billion and guarantees outstanding (that is, guarantees-in-force) were $493 billion. To support our ongoing operations in regard to these commitments, we hold and manage capital at a level where potential losses can be absorbed in unfavourable economic conditions. As such, at 31 December 2019, we held $12 billion in capital for our Mortgage Insurance activities, representing 195% of our minimum regulatory capital target. In addition, we held $2.3 billion in capital for our Mortgage Funding activities, representing 190% of our required equity.
These are only some of the key financial highlights for 2019. I invite you to read this report in its entirety as it outlines many other elements of our performance and provides a complete picture of our financial results for the year.

Lisa Williams CPA, CA
Chief Financial Officer
A Commitment to Affordability | 2019 Annual Report 9
Our 2019 Strategy
Framework
Our aspiration
By 2030, everyone in Canada has a home that
they can afford and that meets their needs.
Strategic objectives
Our strategy guides every decision we make at
Canada Mortgage and Housing Corporation (CMHC).
It keeps us focused on the paths we will take
to achieve our aspiration. The following four
strategic objectives will position us to succeed.
10
 | Experiment with new ideas
| |||
WHY?
| ||||
| ● | To improve and accelerate housing affordability. | |||
HOW? | ||||
●
| Form strong partnerships.
| |||
●
| Use our funding programs to address prioritized housing needs.
| |||
● | Experiment with new affordable housing solutions. | |||
 | Understand Canadians’ needs | |||
WHY? | ||||
● | To offer differentiated solutions to underserved segments | |||
| of the population. | ||||
HOW? | ||||
●
| Understand the lived experiences of Canadians. | |||
●
| Tailor our solutions to specific housing needs.
| |||
 | Build an open housing data exchange | |||
WHY? | ||||
● | To drive sound housing decisions. | |||
HOW? | ||||
●
| Create a “go to” platform for real-time, standardized housing data.
| |||
●
| Target our insights. | |||
 | Modernize our company
| |||
| WHY? | ||||
● | To manage risk and promote stability of the housing finance system. | |||
HOW? | ||||
●
| Complete our technology and business transformation.
| |||
●
| Automate our mortgage risking platform.
| |||
●
| Transform our workplace and the way we work to drive results.
| |||
●
| Continue to improve risk management practices.
| |||
● | Develop emergency funding programs/procedures for times of crisis. | |||
A Commitment to Affordability | 2019 Annual Report 11
Management’s
The following Management’s Discussion and Analysis of the financial condition and results of operations as approved by the Board of Directors on 25 March 2020 is prepared for the year ended 31 December 2019. This Management’s Discussion and Analysis should be read in conjunction with the audited consolidated financial statements. Unless otherwise indicated, all financial information in this report has been prepared in accordance with International Financial Reporting Standards (IFRS) and all amounts are expressed in Canadian dollars.
|  | |||
Forward-looking statements
Our annual report contains forward-looking statements that include, but are not limited to, statements with respect to our outlook for the regulatory environment in which we operate, the outlook and priorities for each activity and the risk environment. By their nature, forward-looking statements require us to make assumptions and are subject to inherent risks and uncertainties that may cause actual results to differ materially from expectations expressed in the forward-looking statements.
Non-IFRS measures
We use a number of financial measures to assess our performance. Some of these measures are not calculated in accordance with IFRS, are not defined by IFRS, and do not have standardized meanings that would ensure consistency and comparability with other institutions. These non-IFRS measures are presented to supplement the information disclosed and may be useful in analyzing performance and understanding the measures used by management in its financial and operational decision making. Where non-IFRS measures are used throughout the annual report, a definition of the term will be disclosed in the glossary for non-IFRS financial measures.
12
|
Progress Toward
our Aspiration
Performance results
Measures fall into two categories: those reflecting our commitments under the National Housing Strategy, and those related to the four strategic objectives set out in our strategy. Initial strategy targets and certain financial targets have been revised as a result of new investments from the 2019 Budget.
We developed new measures for which baselines needed to be established, as 2019 was the first full year operating under our revised strategy. The results of those efforts are reported below.
National Housing Strategy
The National Housing Strategy targets are cumulative and based on a fiscal year ending on 31 March. We have surpassed our fiscal year targets for 2019-2020 and the following table shows our progress as of 31 December 2019.
National Housing Strategy Measures |
|
2019-2020 |
|
|
2019 |
| ||
(cumulative units since program launch) |
| Fiscal Target
|
|
| Actual
| 1
| ||
Number of new housing units | 22,600 | 34,412 | ||||||
(committed)
| ||||||||
Number of repaired housing units | 29,700 | 60,053 | ||||||
(committed)
|
| 1 | Recognizes a unit as committed once funding is allocated to a specific project. Allocated funding is not reflected in our financial statements. |
For details, see the Spotlight on the National Housing Strategy beginning on page 22.
Strategic objectives results
Our four strategic objectives and their results for 2019 are discussed below. An overview of our performance measures can be found following the table.
Experiment with new ideas | Expected results
| |||||||
● | Exceed National Housing Strategy targets.
| |||||||
● | Diverse funds exist for mortgage lending.
| |||||||
● | Government-funded programs focus on targeted housing outcomes.
| |||||||
| Performance Measures |
2019 Target
|
2019 Actual
| ||||||
Incremental affordable housing funding (three-year delivery)
| $100 million | $103 million | ||||||
Innovation index
| Establish baseline | Baseline established¹ | ||||||
Targeted guaranteed loans rate
| Establish baseline | Baseline established¹ | ||||||
Achievement of the annual strategic project milestones
| 85% | 100% | ||||||
1 Baselines for new measures were developed over the course of 2019. They will inform the targets presented in the next corporate plan. | ||||||||
A Commitment to Affordability | 2019 Annual Report 13
Understand Canadians’ needs |
Expected results
|
| ||||||||||
● | Improve our clients’ experience with CMHC.
|
| ||||||||||
● | CMHC’s programs and services are designed around people with lived experience.
|
| ||||||||||
| ● | Underserved segments have better access to housing financing.
| |||||||||||
Performance Measures
|
|
2019 Target
|
|
|
2019 Actual
|
| ||||||
Net promoter score
| Establish baseline | Baseline established¹ | ||||||||||
% of new or improved program design informed by lived experience data
| Establish baseline | Baseline established¹ | ||||||||||
% of Canadians’ and partners’ needs addressed within service standards
| Establish baseline | Baseline established¹ | ||||||||||
Underserved insurance protection
| 9-10% | 9.6% | ||||||||||
Achievement of the annual strategic project milestones
| 85% | 100% | ||||||||||
1 Baselines for new measures were developed over the course of 2019. They will inform the targets presented in the next corporate plan.
|
| |||||||||||
Build an open housing data exchange |
Expected results
| |||||||||||
● | Anyone can find comprehensive Canadian housing data.
|
| ||||||||||
● | Data is standardized.
| |||||||||||
● | We are influential in housing policy.
| |||||||||||
| Performance Measures |
|
2019 Target
|
|
|
2019 Actual
|
| ||||||
Average usability rating |
|
Establish baseline |
|
|
System Usability Scale |
| ||||||
Achievement of the annual strategic project milestones
| 85% | 100% | ||||||||||
1 The Data Exchange will be launched in 2020, at which time a baseline will be set. During 2019, we adopted a System Usability Score, which has an industry benchmark target of 68%.
|
| |||||||||||
Modernize our company |
Expected results
| |||||||||||
● | CMHC adapts quickly to market conditions.
| |||||||||||
| ● | Automation allows our employees to focus on more innovative activities.
| |||||||||||
| ● | CMHC is well governed.
| |||||||||||
| ● | Generate a reasonable return for the Government of Canada.
| |||||||||||
Performance Measures
|
|
2019 Target
|
|
|
2019 Actual
|
| ||||||
Expense redeployment ratio
| 5% | 6.5% | ||||||||||
Effective workforce index
| 75% | 62%¹ | ||||||||||
Risk maturity index
| 80% | 83% | ||||||||||
Achievement of annual technology and business transformation milestones
| 85% | 93% | ||||||||||
Return on required equity (commercial operations)
| 11.6% | 14.3% | ||||||||||
Operating expense ratio (commercial operations)
| 19.6% | 18.2% | ||||||||||
Operating budget ratio
| 14.5% | 15.6%² | ||||||||||
Achievement of the annual strategic project milestones
| 85% | 70%³ | ||||||||||
1 Employee surveys identified enablement barriers as the main reason for not achieving this target. The top three barriers identified include technology, processes/bureaucracy, and role clarity. |
| |||||||||||
² CMHC’s operating budget ratio exceeded target due to lower actual revenues resulting from changes in the timing of when government funding is required for the National Housing Strategy. |
| |||||||||||
³ Three projects have been paused due to uncertainty regarding future direction. |
| |||||||||||
14
Performance measures overview
In keeping with our commitment to continuously improve the way we deliver results for Canadians, we implemented a standardized approach to designing performance measures in 2019. This approach introduced additional rigour and provided for more consistent and reliable data. These measures are explained below.
Incremental affordable housing funding
We established three large-scale partnerships to deliver at least $100 million in affordable housing over three years.
Innovation index
We developed and introduced an “innovation index” in 2019 that will measure our progress in prototyping and experimenting with new ideas. We will set a target for the number of households that have access to affordable housing thanks to these new solutions, above and beyond National Housing Strategy targets.
Government-backed funding
We track the percentage of guarantees (National Housing Act Mortgage-Backed Securities and Canada Mortgage Bonds) used for affordable housing through the “targeted guaranteed loans rate” that we established in 2019.
Canadians’ and partners’ needs
We established baseline standards in 2019 and targets for 2020. A partner survey will monitor how likely clients are to recommend us to colleagues and peers (also known as a net promoter score or NPS). We will monitor how the lived experience of Canadians shapes future program design.
Underserved segments
We measure the proportion of our commercial activities devoted to underserved populations. This measure takes into account approved homeowner units from rural areas as well as qualifying rental units (new construction and existing) that are classified as affordable.
Data platform
We are working with partners such as Statistics Canada to build an open housing data platform. We will establish targets for the percentage of platform users who find the data consistent, reliable and valuable.
Expense redeployment
We are completing our technology and business transformation and making our mortgage risking platform more efficient through automation. This will translate into fewer operational resource requirements. Success is measured through the redeployment of expense savings in new investments.
Effective workforce index
We transformed our workplace and the way we work to enhance employee experience. We measure improvements in the effective workforce index.
Risk maturity index
We monitor and evaluate the soundness of our risk practices through a weighted assessment of four areas of practice: risk governance, risk appetite, risk programs and risk behaviours.
Financial ratios
We track the return on required equity and our operating expense ratio for our commercial operations. Commercial operations are expected to generate a reasonable return for the Government of Canada with due regard for loss.
Technology and Business Transformation
We monitor the annual achievement of the associated project milestones through our technology and business transformation initiative—a program of Information Technology modernization.
Achievement of the annual strategic project milestones
We monitor the achievement of the milestones associated with each project. In 2019, we prioritized a total of 61 projects designed to put us in a better position to execute our strategy. We achieved 86.7% of the milestones for these strategic projects, exceeding our target of 85%.
Maturing our capabilities and management systems
Our capabilities and management systems are what we need to help us operationalize our strategy.
| ● | Capabilities are the special abilities needed to produce a strategic outcome. |
| ● | Management systems are the building blocks that support and measure our strategy. |
We identified a total of 36 capabilities and management systems that we need. Of these, 12 capabilities and 4 management systems were identified as top priority for which three-year plans were produced by the end of 2019, to build, maintain or strengthen them. Refer to the descriptions of our capabilities and management systems on page 124 for details.
A Commitment to Affordability | 2019 Annual Report 15
| OUR STORY Innovating with purpose to solve housing affordability challenges
|  |
Innovation keeps a company dynamic and ensures adaptation in the face of changing circumstances.
We’re pulling out all the stops to be successful and reach our aspiration. We created an innovation function—to explore new opportunities that disrupt conventional thinking on housing affordability.
We want to innovate with purpose. We have a three-year plan to prototype, experiment and define key problem areas that vulnerable Canadians are facing.
We’re studying barriers to housing supply, like land and constructions costs, development fees and zoning constraints. We’re also digging in on attitudinal barriers, including the belief that renting is less desirable than homeownership and the ‘not in my backyard’ bias against affordable housing.
We are using Solution Labs, Demonstration Initiatives and Research and Scholarship programs to include others in our thinking.
We are also designing and delivering Canada’s first Housing Supply Challenge.
The Housing Supply Challenge is a five-year, $300-million program that comprises a series of challenges designed to encourage the creation of much-needed housing supply. The first challenge is expected to be launched in the spring of 2020.
We’ve launched a multi-year project called Project Galaxy. It explores how CMHC can use technology to make it easier for people to find and live in the right home. To date, 25 concepts have been identified for prototyping. These span the areas of homeownership, rental, community housing and housing supply.
We have the foundational pieces in place and CMHC is poised to drive innovation and help solve Canada’s housing affordability challenges.
16
Our Company
CMHC is Canada’s national housing agency. We carry out four activities in pursuit of our aspiration that: by 2030, everyone in Canada has a home that they can afford and that meets their needs.
Our 2019 corporate highlights
Putting clients at the centre
In 2019, we reorganized to become a client-centric organization designed to meet the needs of our partners and Canadians. The restructure reduced management positions by close to 25% compared to 2018 and decreased spans of control from seven to five by reducing the number of “layers” in the organization. These changes also help us to empower employees and to improve service delivery to our clients.
Changing our approach to work
We focused on making work easier and offering our employees more freedom, autonomy and the opportunity to learn—implementing a Results-Only Work Environment™ (ROWE). We also eliminated assigned offices and created new spaces for collaboration and teamwork.
Transforming our space
We started renovations on our headquarters in Ottawa to create a technologically enabled, highly adaptable space that will support an engaged, diverse and inclusive workforce. We are pursuing Leadership in Energy and Environmental Design (LEED) and WELL building standard certifications, with an end goal of creating a best-in-class example in Canada.
Advancing data and analytics
We strengthened our analytics program by establishing a Centre of Excellence. We also signed seven data-sharing agreements with provinces, territories and Statistics Canada to ensure that housing information and data are better shared among government, industry and housing market participants. We explored several machine learning and deep learning applications that will result in enhancements to our risk modelling and default management activities, as well as several process improvements.
Promoting diversity and inclusion
We are creating an organization where all employees feel valued and included. Within our leadership contract is a commitment to go beyond diversity to broader inclusion. This is intended to foster a greater sense of belonging as well as stronger experimentation and collaboration in the achievement of our strategic objectives. Our commitment to supporting diversity across our company can be seen in some of our representation rates:
| Indicator |
2019 Target | 2019 Actual | ||
| Representation rates of Indigenous People¹ | 3.1% | 2.4% | ||
| Representation rates of Visible Minorities | 25.3% | 27.7% | ||
| Representation rates of Persons with Disabilities | 4.3% | 9.7% | ||
| Women in Leadership | 50.0% | 52.2% |
| 1 | We established better conditions for achieving our targets with more stability and increased engagement with the Indigenous community. In 2019, we had very low attrition with two resignations, however, we also lost two Indigenous employees through our restructuring. Our Indigenous employees on contract were only 4% versus 17% in 2017, which reduces future loss of employees from contract termination. |
We were recognized as being a Best Diversity Employer and Best National Capital Region Employer in 2019. We were also honoured to host a diversity and inclusion conference that explored how diversity and inclusion drive innovation and improve performance.
A Commitment to Affordability | 2019 Annual Report 17
Assisted Housing
What we do
We help Canadians in need access suitable housing that they can afford. This is done through a range of programs and initiatives across the housing spectrum, including government-funded programs, often in partnership with the provinces and territories.
How we do it
| • | We offer housing solutions through programs to support the supply of affordable housing and to ensure affordability, suitability and adequacy for homeowners and renters. |
| • | We work with the non-profit and private actors, Indigenous organizations and communities and all levels of government in the delivery of affordable and community housing programs. We also provide lending at below-market rates and subsidized and non-subsidized housing support. |
Our 2019 highlights
Delivering on the National Housing Strategy
We have surpassed the cumulative program targets for supporting the construction of new units and the repair of existing units (over 94,400 units committed versus fiscal target ³ 52,300 units). In 2019, we met or surpassed initiative targets, including the Rental Construction Financing initiative and the National Housing Co-investment Fund.
The Rental Construction Financing initiative approved over 15,900 units to help where the need for rental housing is very high, while the National Housing Co-investment Fund supported over 6,000 new construction units and over 60,000 units of repair and renewal of mixed-income, mixed-tenure, and mixed-use affordable housing across the country.
We launched the First-Time Home Buyer Incentive in September 2019. This has allowed over 4,700 Canadians to access homeownership more affordably—despite the fact that the fall launch of this program coincided with the period of the year that historically experiences lower volumes of home purchases. Our client outreach drove an increase in the number of applications from Indigenous and Northern communities for National Housing Strategy programs, with a 28% increase in applications for the National Housing Co-investment Fund in 2019 compared to 2018, leading to over $30 million in committed funds.
For more information on the status of individual National Housing Strategy programs, refer to the Spotlight on the National Housing Strategy beginning on page 22.
Progress on our other programs
We have signed agreements with all of the provinces and territories excluding Quebec that represent $10 billion+ in joint governmental funding over 10 years. The funding will protect, renew and expand community housing, and support provincial priorities related to housing repair, construction and affordability.
We made important housing achievements in First Nation communities in 2019 by delivering over 300 units under our Section 95 program. This program funds non-profit rental housing projects. We also opened five new shelters to support survivors of family violence with a $10.4-million investment over three years.
We provided more than $3 million of ongoing financial support through CMHC workout tools. This was offered to federally administered housing providers faced with financial difficulties (difficulties that can negatively impact the long-term viability and sustainability of their housing projects).
Working with our partners and Indigenous organizations
We supported our federal partners at Indigenous Services Canada and Crown Indigenous Relations and Northern Affairs in the co-development and implementation of Inuit, First Nations and Métis housing strategies with the Assembly of First Nations, Métis National Council and the Inuit Tapiriit Kanatami.
Housing Analysis and Research
What we do
We provide research, analysis, insight and expertise to accelerate housing affordability through informed decision making.
How we do it
| • | We work with a wide range of organizations to identify, fill and communicate information gaps to better understand housing affordability. |
| • | We listen to those that have lived experience and to those trying to solve affordability issues in housing markets. We also seek to mobilize others to accelerate housing affordability especially for our most vulnerable populations. |
| • | We prototype and experiment with new ideas to foster and promote informed policy advice on housing solutions. |
18
Our 2019 highlights
Research and publications
We developed a three-year research plan to pursue opportunities that accelerate housing supply and affordability. The plan will identify solutions contributing to a stable housing finance system that also promotes affordability.
We aligned CMHC’s analytical publication suite to focus on geographic areas with the greatest affordability issues. We continued to advance housing data and analysis gaps required for affordable housing decision making. In 2019, downloads were up by more than 30% across all of CMHC’s regular analytical publications.
New surveys and metrics
We conducted new surveys to enhance our understanding of housing conditions of Canadians, including the needs of vulnerable groups. The Canadian Housing Survey is conducted in partnership with Statistics Canada to collect new information on dwelling and neighborhood satisfaction, households living in social and affordable housing, first-time homebuyers and housing affordability. The Social and Affordable Housing Survey – Rental Structures provides a more comprehensive picture of the community and affordable housing stock in Canada.
Results from both surveys were released in the last quarter of 2019, providing new data that was not previously available. Additional releases based on these new surveys will take place in 2020.
We established a new indicator of housing affordability, measuring housing hardship. This measure is intended to complement and not replace other existing indicators of affordability (that is, the 30% shelter-to-income ratio and core housing need).
Mortgage Insurance
What we do
We offer competitive mortgage insurance products to:
| • | support homeownership financing |
| • | facilitate the construction, purchase and refinance of rental and multi-unit residential properties |
| • | support the stability of the Canadian financial system |
We operate these programs on a commercial basis without the need for government funding.
How we do it
| • | We work with lenders to offer transactional homeowner and portfolio mortgage insurance products to Canadians in all parts of Canada. |
| • | We also offer multi-unit mortgage insurance that provides access to preferred interest rates for the construction, purchase and refinancing of multi-unit residential properties. |
| Our products | ||
Transactional Homeowner Insurance | Protects lenders against borrower default, enabling qualified borrowers with down payments of between 5% and 20% to access competitive interest rates.
| |
Portfolio Insurance | Allows lenders to pool low-ratio residential mortgages with down payments of 20% or more (1-4 unit properties) and insure these against borrower default, making them eligible for our securitization programs.
| |
Multi-unit Residential Insurance | Protects lenders against borrower default on loans for the construction, purchase and refinancing of multi-unit (5+ unit) residential properties.
| |
Our 2019 highlights
Homeowner Business Transformation
Our Homeowner Business Transformation will modernize homeowner mortgage risk solutions and build a strong foundation for the future. This transformation will impact a broad range of market participants including Canadians, lenders, partners, third-party service providers and government. We expect to recover our costs through lower losses and operating costs, and an improved understanding of risk. Work currently underway includes standing up technology architecture and delivering changes to risk assessment for portfolio insurance.
Homeowner products
Our homeowner insurance products helped homebuyers to purchase almost 100,000 housing units across Canada in 2019, with more than 14% insured in rural areas of Canada (14.6% versus target ³ 13.5%) where other mortgage insurance options may not always exist. We also offered a rebate on mortgage insurance premiums for properties that are energy-efficient, benefitting around 400 homes across the country.
Multi-unit products
Our multi-unit insurance products stimulated a densified supply in high needs regions with 60% of new construction loans approved in areas where the vacancy rate is 2% or less. Over 60,000 units were approved in Vancouver, Toronto and Montréal. We have been prioritizing projects that are eligible for multi-unit insurance and that support deeper levels of affordability, targeting 5% of our overall units. Over 7,900 homes across the country benefited from these affordable flexibilities, representing an increase of 59% over 2018, with the most active areas located in Toronto (over 1,750 homes) and Winnipeg (over 1,000 homes).
A Commitment to Affordability | 2019 Annual Report 19
Other products and services
We changed our leasehold lending policy to recognize A to A leasing, an alternative form of leasehold interest. This adaption makes it easier for First Nation clients to access mortgage financing on reserve land. We also continued to roll out the Enhanced Claim Service mortgage insurance loss mitigation process during the year to better serve lenders and we have onboarded 58 lenders to date. The Enhanced Claim Service creates a more efficient and streamlined process for claims adjudication, real estate management and property disposal.
Mortgage Funding
What we do
We promote the availability of funding for mortgages in all economic conditions. We do this by enabling approved financial institutions to pool eligible insured mortgages into marketable securities to be sold to investors. These activities generate funds for residential mortgage financing.
How we do it
| • | We guarantee the timely payment of principal and interest of National Housing Act Mortgage-Backed Securities issued by approved financial institutions. |
| • | We also issue Canada Mortgage Bonds through the Canada Housing Trust and we oversee the Canadian Registered Covered Bond programs, another source of mortgage funding. |
| Our products | ||
National Housing Act Mortgage- Backed Securities Program | • Enables approved financial institutions to transform insured residential mortgages into marketable bullet bond securities.
• We guarantee the timely payment of principal and interest to investors, which is backed by the Government of Canada.
| |
Canada Mortgage Bonds Program | • Provides approved financial institutions with access to affordable and reliable mortgage financing in the form of fully amortizing securities.
• We issue Canada Mortgage Bonds (through the Canada Housing Trust) and use the proceeds to purchase National Housing Act Mortgage-Backed Securities.
| |
Canadian Registered Covered Bond Programs | • Enables lenders to sell pools of uninsured Canadian residential mortgages to investors.
• We operate these programs on a cost recovery basis. The programs are not guaranteed by CMHC or the Government of Canada.
| |
Our 2019 highlights
New securitization portal
We launched a new securitization portal to streamline the pooling process by eliminating many existing email-based processes and by expanding self-service functions.
The following table shows the share of outstanding mortgage credit by funding source and demonstrates the importance of our Mortgage Funding programs.
All Mortgage Lenders
| Large Banks
| Other Mortgage Lenders
| ||||||||||
| 2019 | 2018 | 2019 | 2018 | 2019 | 2018 | |||||||
CMHC Securitization | 30% | 30% | 22% | 23% | 51% | 51% | ||||||
Covered Bonds | 10% | 10% | 14% | 13% | 2% | 1% | ||||||
Other funding sources | 60% | 60% | 64% | 64% | 47% | 48% | ||||||
20

The best way to understand needs is to listen and we are tuning in.
We are listening to the lived experiences of Canadians in housing need. We are working to tailor our solutions to their specific needs.
Two solutions launched in 2019 to support affordable homeownership are the First-Time Home Buyer Incentive and the Shared Equity Mortgage Providers Fund.
The First-Time Home Buyer Incentive program launched in September 2019. It offers 5% or 10% of the home’s purchase price to put toward a down payment. This helps reduce household borrowing by lowering mortgage carrying costs.
The Shared Equity Mortgage Providers Fund launched in July 2019 as a $100-million fund supporting existing shared equity mortgage providers. The Fund encourages additional housing supply and helps attract new providers of shared equity mortgages.
CMHC developed these programs and made them available to Canadians on a very short timeline. No small feat—but this is part of our mandate.
We’re keeping clients top of mind. We are becoming more client-centric and channelling our energies toward improving the client experience.
Our new Microsoft Dynamics 365 Customer Relationship Management system serves as a single platform to manage contacts, relationships and activities.
We are using data and analytics to better assess the needs of Canadians. It helps us to develop a deeper understanding and knowledge of local housing supply constraints.
Our Client Experience team has held workshops across the country. We stepped into our clients’ shoes to see our business from their perspective. We mapped their journey, identified their pain points and built a plan to improve their experience with us.
A Commitment to Affordability | 2019 Annual Report 21
Spotlight on the
National Housing Strategy
Canada’s National Housing Strategy is a 10-year, $55-billion+ plan that prioritizes the housing needs of vulnerable population groups and gives more people in Canada a place to call home. The strategy promotes diverse communities and creates a new generation of housing that is mixed-income, mixed-use, accessible and sustainable.
National Housing Co-investment Fund1
Launch: May 2018
Funding: $13.2 billion in loans and contributions from 2018/19 to 2027/28
Output: 60,000 new housing units 240,000 repaired housing units
Status: On track |
This initiative supports the construction of new affordable housing and the repair and renewal of existing community and affordable housing. It provides long-term, low-interest loans or capital contributions and covers a spectrum of housing needs, from shelters to affordable homeownership. The initiative prioritizes housing for vulnerable populations and sets minimum requirements for energy efficiency and accessibility.
Achievements
– As of 31 December 2019, there has been close to 120 applications approved for almost $804 million in contributions and over $1,164 million in low-cost loans for a total commitment of over 66,000 new and repaired units, of which $1,452 million has been financially committed.
– As of 31 December 2019, we have committed almost $594 million to support the construction of over 6,000 units and we have committed over $1,374 million to support the repair of over 60,000 units.
| |
Rental Construction Financing initiative1
Launch: April 2017
Funding: $13.75 billion in loans from 2017/18 to 2027/28
Output: 42,500 new housing units
Status: On track
|
This initiative provides low-cost insured loans to encourage the construction of purpose-built rental housing. It is specifically directed at areas across Canada where the need is clearly demonstrated.
Achievements
– As of 31 December 2019, we committed almost $4,958 million, of which over $2,190 million has been financially committed. This funding will support the construction of over 15,900 units. |
| 1 | Recognizes a unit as committed once funding is allocated to a specific project. Committed funding is not reflected in our financial statements. |
22
Affordable Housing Innovation Fund1
Launch: September 2016
Funding: $200 million from 2016/17 to 2020/21
Output: 4,000 new housing units
Status: On track |
This fund encourages new funding models and innovative building techniques to support the next generation of housing in Canada. Innovative solutions will be vital to help address the challenges facing affordable housing.
Achievements
– As of 31 December 2019, we committed over $115 million to projects, almost $67 million of which has been financially committed.
| |
Federal Lands Initiative1
Launch: February 2019
Funding: $200 million from 2017/18 to 2020/21
Output: 4,000 new housing units
Status: Behind target due to a lack of initiative from other agencies |
This initiative helps transfer surplus federal lands and buildings to be developed or renovated into affordable housing. Eligible applicants receive the properties at a discount or at no cost.
Achievements
– As of 31 December 2019, two properties were approved representing a financial commitment of 283 new units and over $5 million in funding.
– The 2019 cumulative year-end unit target was not met. Seven properties were under negotiation for 169 potential units and three properties were under assessment for a potential of 222 units.
| |
Federal/Provincial/Territorial Housing Agreements
Funding: $15.1 billion from 2018/19 to 2027/28 (federal and provincial-territorial funding)
Output:2 Maintain 330,000 housing units in social housing
Increase rent-assisted housing units by approximately 50,000 units
Maintain and repair Urban Native Social Housing units available to low-income households
Repair at least 60,000 existing social housing units
Adequately support at least 300,000 households through a Canada Housing Benefit |
The new Multilateral Housing Partnership Framework asserts a shared vision for housing and sets the foundation for bilateral agreements on the delivery of key National Housing Strategy initiatives. Provinces and territories³ deliver and cost-match federal funds from the strategy through bilateral agreements with CMHC.
Includes: Province and Territory Priority Funding, Canada Community Housing Initiative, Targeted Support for Northern Housing,4 and Canada Housing Benefit.
Achievements
– We signed bilateral agreements with all provinces and territories with the exception of Quebec, and 2 of out of the 13 provinces and territories had executed addendums under the Canada Housing Benefit.
– As of 31 December 2019, CMHC has agreed with 8 out of the 13 provinces and territories (NB, BC, NU, ON, NS, YK, NL, SK) on targets and outcomes in action plans, which include planned actions and investment over a three-year period. | |
Status: On track
| ||
1 Recognizes a unit as committed once funding is allocated to a specific project. Committed funding is not reflected in our financial statements. | ||
2 Outputs are described in the Federal/Provincial/Territorial Housing Partnership Framework and targets will be confirmed through bilateral agreements and program design. | ||
3 Excluding Quebec. | ||
4 This initiative recognizes a unit as committed once a formal claim is processed for reimbursement. | ||
A Commitment to Affordability | 2019 Annual Report 23
Federal Community Housing Initiative – Phases 1 and 2
Launch: April 2018 (Phase 1) April 2020 (Phase 2)
Funding: $38 million from 2017/18 to 2019/20
$462 million from 2020/21 to 2027/28
Output: Maintain affordability for 27,940 community housing units (Phase 1)
Maintain affordabilty for 11,000 low-income community housing units (Phase 2)
|
This initiative keeps housing affordable for low-income tenants. Phase 1 extends subsidies for federally administered projects with expiring operating agreements until 31 March 2020. Phase 2 provides rent supplement assistance to providers to ensure that low-income households continue to receive rental support; and a second stream provides temporary transitional funding to help at-risk providers transition to the new program.
Achievements
– As of 31 December 2019, we provided subsidy extensions to over 700 projects reaching the end of their operating agreements. Subsidy extensions have supported over 23,300 households, representing a total investment of over $26 million.
| |
Status: On track
| ||
Community Housing Transformation Centre (the Centre) and Community- Based Tenant Initiative
Launch: April 2019
Funding: $68.6 million from 2017/18 to 2027/28
Status: On track |
The Centre and the Community-Based Tenant Initiative provide support and capacity building within the community sector. They also contribute to various local organizations that provide information on housing options and housing-related financial literacy to vulnerable tenants.
Achievements
– We issued a request for proposal for a service delivery agreement to start various components of the Centre and the Community-Based Tenant Initiative in 2019.
| |
First-Time Home Buyer Incentive
Launch: September 2019
Funding: $1.25 billion in loans from 2019/20 to 2021/22
Output: Assist up to 100,000 first-time homebuyers
Status: Benchmarking period until February 2020 |
This initiative helps qualified first-time homebuyers reduce their monthly mortgage payments without increasing their down payment. The First-time Home Buyer Incentive shared-equity mortgage is one where the government has a shared investment in the home. As a result, the government shares in both the upside and downside of the property value.
Achievements
– As of 31 December 2019, 2,950 applications have been approved representing financial commitments of $56 million to assist over 4,700 Canadians to more easily enter into homeownership.
– Target for the first six months of the program was to assist up to 20,000 first-time homebuyers.
|
24
Shared Equity Mortgage Providers Fund
Launch: July 2019
Funding: $100 million in loans from 2019/20 to 2023/24
Output: Assist 1,500 first-time homebuyers
Assist in the creation of 1,500 projected new homeownership units
Status: Behind targets due to limited market size and relative uniqueness of program
|
This $100 million lending fund supports existing shared equity mortgage providers. The fund encourages additional housing supply and helps attract new providers of shared equity mortgages. Repayable loans are offered to eligible proponents to commence new housing projects where shared equity mortgages will be provided (Stream 1) or to fund lending directly through shared equity mortgage providers to first-time homebuyers (Stream 2).
Achievements
– As of 31 December 2019, 10 applications have been received across both streams and are at various stages of underwriting. | |
Data, Innovation and Research
Funding: $241 million from 2018/19 to 2026/27
Status: On track |
We are enhancing housing research and data to identify issues and innovative solutions. We are also assessing the impact of housing policies and shaping the National Housing Strategy.
Achievements
– We conducted two new surveys to enhance the current understanding of housing conditions of people living in Canada, including the needs of vulnerable groups—the Canadian Housing Survey and the Social and Affordable Housing Survey – Rental Structures.
– We presented 6 awards through the CMHC Housing Research Award Program to recognize and advance world-class housing research being done in Canada.
– We funded 11 Solutions Labs, 9 Demonstration Initiatives, 12 applications for the Research and Planning Fund, 8 recipients of the Housing Research Scholarship and Stage 1 of the Collaborative Housing Research Network.
| |
National Housing Strategy Act
Tabled in Parliament on 8 April 2019, as part of Bill C-97, and received Royal Assent on 21 June 2019
Status: Complete |
– The National Housing Strategy Act came into force on 9 July 2019, declaring that it is the housing policy of the Government of Canada to recognize that the right to adequate housing is a fundamental human right affirmed in international law.
– The Act requires the designated Minister to develop, maintain and report on a national housing strategy.
– The Act also creates a diverse National Housing Council and a Federal Housing Advocate to monitor housing policy and the National Housing Strategy and to consider systemic housing issues.
|
A Commitment to Affordability | 2019 Annual Report 25

Data is everywhere. To be useful, it needs to be comprehensive, standardized, up to date and accessible in a single location. A data exchange creates this solution. It’s a focal point of “data in” and “data-insights out”—a secure and convenient place to collect, store, analyze and distribute reliable data.
We have embarked on an ambitious project to develop a housing data exchange that will gather data to provide trusted housing-related information. Creating a secure and user-friendly public platform will benefit everyone in Canada as the general public, policy makers, planners, builders, researchers and financial institutions will have access to the data they need in order to make the best possible decisions on housing.
The Housing Data Exchange will enable users to interact with datasets relating to mortgages, housing finance, rental markets, valuations and property characteristics. Our partnership with Statistics Canada allows us to integrate some of Canada’s longest-standing, independent, and reliable housing data, including the Canadian Housing Statistics Program.
The Housing Data Exchange is being built one application at a time. This staged approach lets us build internal capacity to manage, govern, store and protect the data required.
We have started our work on our first application, the Mortgage Industry Data Analytics Application, and have plans to release the application’s first two products:
| • | Mortgage 360 is an interactive dashboard that provides financial institutions with access to CMHC’s insurance data in real time. This Microsoft Power BI-based dashboard allows lenders to draw insights from their CMHC insured mortgages through various comparison tools and metrics. |
| • | Securitization Analytics allows users to assess pools of mortgages for the securitization process, to evaluate their likely performance and pricing and to run other models. |
As excited as we are to be building something that is on the cutting edge of technology, we have not forgotten what this is all about: making housing affordable to everyone in Canada.
Our contribution to CMHC’s 2030 aspiration is that everyone in Canada will have better access to data-insights and the tools needed to help them make evidence-based housing decisions. We want to encourage decision makers to develop new affordable housing options, choices and policies.
26
Operating
Environment
The Canadian economy posted a near potential annual growth rate of 1.6% in 2019. This pace of growth was less than the 2% rate recorded for 2018.1
Canada’s labour market was marked by record low unemployment rates through much of 2019, underpinning continued gains in personal disposable income. Despite this, consumer spending grew at a slower rate in 2019, leading to an uptick in savings rates. This suggests efforts by Canadians to reduce their high debt levels. Government spending also contributed to GDP growth, albeit to a lesser degree than in 2018.
In 2019, trade tensions between the United States and China weighed on global demand, with the uncertainty dampening levels of business investment in Canada. Spending on machinery and equipment has remained weak, especially in the oil and gas sector. Despite the significant slowdown, Canadian exports still showed modest growth over the year, while imports showed relatively weaker growth.
Canadian household debt remains very high. Despite rising incomes, the debt-to-disposable income ratio reached 176.6% in the third quarter of 2019. The historical high of 178.5% was recorded in the first quarter of 2017.2 Mortgage debt remained the main component of total household debt at 67%, followed by home equity lines of credit at 11% in the second quarter of 2019.3 This means that real estate debt accounts for about three quarters of the outstanding stock of household debt. Further reductions in interest rates will likely result in increased levels of household borrowing, notably via mortgages.
In the housing sector, favourable economic conditions contributed to solid demand in the new home and resale markets. Canadian housing starts reached 208,758 units in 2019. This represents a 2% decline from 2018, but remains near its 10-year record high of 219,976 units set in 2017.
Meanwhile, the Canadian resale market reached 489,623 MLS® sales in 2019. This represents a 6% increase from the 2018 annual pace of roughly 459,837 homes. Average MLS® prices increased 2% to $500,449 in 2019 from $488,302 in 2018. This leaves average prices marginally below their 2017 record high of $508,593.
Altogether, overvalued housing conditions eased for Canada in 2019, as house prices moved more closely in line with housing market fundamentals. However, the national picture continued to mask differences between regions and tenure types, but to a lesser extent than previous assessments. Evidence of moderate overvaluation remains in Vancouver and Victoria.4
In 2020, the COVID-19 pandemic is resulting in severe consequences for Canadians and the economy. This will be a challenging period for housing markets with large downside risks to prices, sales and starts.
COVID-19
Since 31 December 2019, the outbreak of a novel strain of coronavirus, causing the disease specifically identified as “COVID-19,” has resulted in governments worldwide enacting emergency measures to combat the spread of the virus. The Government of Canada has announced a new set of economic measures to help stabilize the economy during this challenging period.
We and other mortgage insurers are offering tools to lenders that can assist homeowners and multi-unit borrowers who may be experiencing financial difficulty. These include payment deferral, loan re-amortization, capitalization of outstanding interest arrears and other eligible expenses, and special payment arrangements. The Government, through CMHC, is providing increased flexibility for homeowners and multi-unit borrowers facing financial difficulties to defer mortgage payments on CMHC-insured mortgage loans. CMHC will permit lenders to allow payment deferral. Similar flexibility will be provided to housing providers that have direct loans with CMHC should they experience financial difficulty, with the objective of providing a solution that meets their needs.
| 1 | Source: Statistics Canada |
| 2 | Source: Statistics Canada |
| 3 | Source: CMHC Mortgage and Consumer Credit Trends Report, Fourth Quarter, 2019 |
| 4 | Source: CMHC Housing Market Assessment Canada, Fourth Quarter, 2019 |
A Commitment to Affordability | 2019 Annual Report 27
As a further proactive and coordinated measure to strengthen the financial system and the Canadian economy, the Government is launching an Insured Mortgage Purchase Program (IMPP). Under this program, the Government will purchase up to $50 billion5 of insured mortgage pools through CMHC. This will provide long-term stable funding to banks and mortgage lenders, help facilitate continued lending to Canadian consumers and businesses, and add liquidity to Canada’s mortgage market. Since the IMPP will be financed through the Crown Borrowing Program, the Minister of Finance has approved increases to our total outstanding short-term and long-term borrowing limits to $20 billion and $54 billion, respectively. In addition, the Minister of Finance increased our NHA MBS and CMB guarantee limits to $195 billion and $60 billion, respectively.
On 20 March 2020, the Minister of Finance announced changes to the eligibility criteria for portfolio insurance to help mortgage lenders access the IMPP. Effective 24 March 2020, low loan-to-value mortgages funded prior to 20 March 2020 with amortization up to 30 years from the date the loan was funded, as well as refinance loans, will be eligible until 31 December 2020. The Government enabled these measures by raising CMHC’s guarantees-in-force and insurance-in-force limits to $750 billion each.
As a result of COVID-19 and the measures being taken nationally to combat the outbreak, there has been a significant increase in employment insurance claims since 31 December 2019. Increases in insurance claims losses may occur, however we are currently unable to estimate the potential impact on our financial results or condition. Furthermore, due to the rapidly changing environment, we may experience increased volatility in our financial results due to remeasurements in our financial instruments and pension obligations, which we cannot reliably estimate at this time. Finally, we may also experience higher homeowner transactional business as experienced in previous economic downturns.
Given our role as Canada’s national housing agency, we may continue to be called upon to support Canadians through the crisis and subsequently to support the economic recovery. According to our Risk Appetite Framework, our role as a key stabilizing component of the Canadian financial system means we will be substantially increasing our appetite for risk as we and other institutions absorb the impacts of these events.
Additional government responses to the pandemic might require further program changes and risk absorption by CMHC. There can be no assurance of the impact or magnitude of these events on our future financial results. As a result, we have prudently suspended our dividend to conserve our capital to support further action by the Government, through CMHC, should the need arise. At 31 December 2019, our capital position remains strong as we are holding capital well in excess of our operating levels. However, in the event our capital position may be impacted, under the Capital and Dividend Policy Framework for Financial Crown Corporations, the Government would stand prepared to inject capital into CMHC should additional capital be needed to deliver on our public policy mandate.
Climate change
Climate-related risks and opportunities
Climate change poses a range of material risks for CMHC and for Canada’s housing system—risks that may jeopardize access to affordable housing. Risks to affordability include:
| • | increased costs associated with adapting housing and communities to be more resilient |
| • | repairing climate change-induced damage as well as higher property and flood insurance premiums |
We want to understand these impacts. We’ll do more extensive analysis of the climate-related risks in 2020. We’ll focus on the housing financed through CMHC’s insurance business and the Canadian housing stock in general.
We are committed to disclosing climate-related risks—financial and non-financial. The Financial Stability Board’s Task Force on Climate-related Financial Disclosures offers a framework to evaluate and report on such risks. We accelerated our climate risk-related analysis in 2019. This helped us understand how climate change will affect Canadian housing and how it may affect our business lines, financial performance and strategy.
This year, we’ll implement a broader climate risk strategy and governance framework that will reflect advances in our understanding of climate change. This will integrate climate-related risks into our Enterprise Risk Management Framework.
| 5 | Subsequently increased to $150 billion on March 26, 2020. |
28
Governance
We can effectively manage a broad spectrum of financial and non-financial risks with oversight by our Board of Directors and leadership team. This includes risks that may arise from climate change.
The risks associated with climate change will materialize over the coming years—well beyond the horizon of our 2030 aspiration. The severity of the impacts depends on how we respond in the short-term. This, and the unprecedented investments we are making in housing through the National Housing Strategy, frames the urgency of our response to safeguard those investments.
The management team presented a preliminary assessment of climate risks and next steps to the Board’s Risk Management Committee. Our Board of Directors identified climate change as a defining factor in our long-term outlook. They’ve reviewed and discussed long-term climate risks to the housing system and will continue to provide strategic direction and oversight of climate risk.
At the management level, we have appointed a Chief Climate Officer to refine our climate change strategy. This officer reports directly to the Chief Executive Officer and will:
| • | guide us in prioritizing our responses to the risks and opportunities that climate change presents |
| • | lead the advancement of our climate risk management capabilities |
| • | drive transformation in reporting and public disclosures to align with the Task Force on Climate-related Financial Disclosures’ recommendations |
| • | advance our sustainability agenda by identifying opportunities to lower our carbon footprint |
Strategy
We are defining the climate-related risks, opportunities and their impacts that we face over the short, medium and long terms. Part of this work includes developing our climate change strategy.
Our direct financial exposure to climate-related events is limited by the contractual terms of the mortgage insurance we offer. We don’t insure against damage caused by flooding, fire or other natural perils, be they climate-related or not. These exclusions don’t mean that we are insulated from climate- related risks, however.
House prices and market conditions may affect our mortgage insurance claims. Homes in some market segments may lose value, potentially leading to increased claims with higher severity. We are assessing how climate change may influence housing markets over time. This could lead to changes in our products or pricing to keep our commitment of promoting affordability and system stability.
We are exposed to climate-related risks through our securitization business, to the extent that Approved Issuers are affected by the condition of housing in the markets in which they operate.
Beyond mortgage insurance and securitization, we are taking other important steps of our own:
| • | constructing our investment portfolios considering sectors affected by climate-related risks |
| • | requiring applicants of many National Housing Strategy programs to meet minimum energy efficiency and greenhouse gas emission reduction requirements |
| • | retrofitting our Ottawa office, which aims for Leadership in Energy and Environmental Design Gold certification |
| • | embracing technology to replace carbon-emitting transportation with virtual meetings |
| • | working to better understand climate change adaptation and mitigation initiatives |
Our strategy includes offering our expertise in housing and mortgages and supporting the Government of Canada’s climate-related initiatives. We are collaborating with Public Safety Canada on a new low-cost national flood insurance program to protect homeowners at high risk of flooding. We see our research supporting informed decisions about how to manage climate change-associated risks.
Risk management
Climate change often manifests as other risks, including credit, market and operational. We’ll refresh our Enterprise Risk Management Framework in 2020 to ensure we identify, assess, monitor and report on climate-related risks. We will embed climate change in our Risk Appetite Framework.
We’ll perform targeted program, portfolio and product reviews to measure and assess climate-related risk factors across our businesses. This will inform management actions that adapt our businesses to the impacts of climate change.
A Commitment to Affordability | 2019 Annual Report 29
We are exploring climate scenario analysis to find out how our businesses may fare under a range of future states. The challenge is that scenarios can extend over multiple decades where uncertainty increases substantially.
By contrast, our stress-testing assesses capital adequacy over a much shorter time frame. We are reviewing best practices and methodologies to enhance our stress-testing program to include climate risk scenario modelling capabilities.
Metrics and targets
Our 2020 Task Force on Climate-related Financial Disclosures alignment project will develop metrics that provide insights into both the risks and the resilience of our businesses to climate-related factors.
Gender-Based Analysis Plus
We recognize that intersecting identity factors and lived realities affect people’s experiences and access to housing. As we strive to help everyone in Canada have a home that they can afford and that meets their needs, we endeavour to apply a Gender-Based Analysis Plus lens to our activities and initiatives. Gender-Based Analysis Plus helps us deliver results for everyone in Canada in a fair and equitable manner.
Office of the Superintendent of Financial Institutions guidelines
Mortgage Insurer Capital Adequacy Test (MICAT) guideline
We implemented the Mortgage Insurer Capital Adequacy Test guideline on 1 January 2019. The Mortgage Insurer Capital Adequacy Test combines the following:
| • | the 1 January 2017 advisory on Capital Requirements Property and Casualty Insurance Companies for Federally Regulated Mortgage Insurers |
| • | the relevant portions of the 2018 Minimum Capital Test for Federally Regulated Mortgage Insurers |
Refer to the Consolidated Financial Statements note 10 – Capital Management for complete disclosure.
Future changes to accounting standards
IFRS 17 Insurance Contracts – effective date of 1 January 2021
In May 2017, the International Accounting Standards Board issued IFRS 17 Insurance Contracts (IFRS 17), which will replace IFRS 4 Insurance Contracts. On 26 June 2019, the International Accounting Standards Board issued an exposure draft containing proposed amendments responding to concerns and implementation challenges raised by participants. The International Accounting Standards Board staff have indicated that they plan to finalize and issue the amended standard by the second quarter of 2020.
The most notable proposed amendment to CMHC is the deferral of the effective date by one year, to 1 January 2022. We have evaluated the entire suite of proposed amendments and, except for the deferral of the effective date, we do not expect them to have a significant impact on our implementation.
We have a team dedicated to analyzing and implementing the new accounting standard, and a detailed project plan is in place. We view our disclosure through the lens of financial stability; in general, more information supports this objective. We continue to evaluate where we need to change our existing accounting and reporting processes and how this could affect our consolidated financial statements.
30

We are continually assessing emerging technology by taking the pulse of new technologies in all industries.
We want to advance our digital business, build partnerships and do more with data. To do this, we experiment, understand and determine what new technologies, tools and systems require further investment to support our aspiration.
Our approach works across many teams at CMHC to experiment and prototype with new technologies.
In 2019, we focused on artificial intelligence or AI. We wanted to understand the implications that AI would have on our workforce and how it would help accelerate housing affordability. We took an in-depth look at how to develop AI responsibly. We delved into understanding things like bias and trust in how AI will help us make decisions and predictions.
We experimented in robotic process automation, or RPA—a specific AI technology. We did a proof of concept on our process for closing out loans that have reached their maturity. The proposed RPA solution would automate 75% of the work allowing employees to focus on higher value activities.
It would also remove the risk of human error with certain tasks and improve the loan processing time down from hours to seconds.
RPA can help and possibly replace some of the repetitive or simple tasks that we still do in the company. With the emergence of RPA, we can empower our people—our best resource—to make better use of their time. Instead of doing simple, repetitive tasks, they can focus on accelerating our affordable housing goal in Canada.
We worked with Accenture to explore how distributed ledger technology (that is, Blockchain) could apply to our securitization activities. We’ll continue to progress in other new technologies in 2020. We’ll be researching, prototyping and experimenting on their use in our company and industry.
Our work is helping drive innovation by changing our approach and working differently to reach our affordability goal.
A Commitment to Affordability | 2019 Annual Report 31
Financial
Results
Condensed consolidated balance sheet
Assisted Housing Activity | Mortgage Insurance Activity | Mortgage Funding Activity | Eliminations | Total | ||||||||||||||||||||||||||||||||||||
(in millions) | 2019 | 2018 | 2019 | 2018 | 2019 | 2018 | 2019 | 2018 | 2019 | 2018 | ||||||||||||||||||||||||||||||
Cash, cash equivalents, investment securities and derivatives | 2,658 | 1,934 | 17,832 | 18,374 | 3,932 | 4,222 | (1,043 | ) | (3,905 | ) | 23,379 | 20,625 | ||||||||||||||||||||||||||||
Loans | 6,200 | 6,421 | 125 | 128 | 244,445 | 234,653 | - | - | 250,770 | 241,202 | ||||||||||||||||||||||||||||||
All other assets | 840 | 784 | 629 | 729 | 643 | 549 | (2 | ) | (13 | ) | 2,110 | 2,049 | ||||||||||||||||||||||||||||
Total assets | 9,698 | 9,139 | 18,586 | 19,231 | 249,020 | 239,424 | (1,045 | ) | (3,918 | ) | 276,259 | 263,876 | ||||||||||||||||||||||||||||
Dividends payable | - | - | - | 500 | - | 175 | - | - | - | 675 | ||||||||||||||||||||||||||||||
Provision for claims | - | - | 407 | 451 | - | - | - | - | 407 | 451 | ||||||||||||||||||||||||||||||
Borrowings | 8,661 | 8,198 | - | - | 244,445 | 234,653 | (991 | ) | (3,896 | ) | 252,115 | 238,955 | ||||||||||||||||||||||||||||
Unearned premiums and fees | - | - | 5,496 | 5,375 | 1,655 | 1,573 | - | - | 7,151 | 6,948 | ||||||||||||||||||||||||||||||
All other liabilities | 735 | 650 | 620 | 822 | 635 | 511 | (17 | ) | (17 | ) | 1,973 | 1,966 | ||||||||||||||||||||||||||||
Total liabilities | 9,396 | 8,848 | 6,523 | 7,148 | 246,735 | 236,912 | (1,008 | ) | (3,913 | ) | 261,646 | 248,995 | ||||||||||||||||||||||||||||
Total equity of Canada | 302 | 291 | 12,063 | 12,083 | 2,285 | 2,512 | (37 | ) | (5 | ) | 14,613 | 14,881 | ||||||||||||||||||||||||||||
Financial position
We ended the year in a strong financial position. In 2019, we declared dividends to the government of $2,020 million, funded from our retained earnings from prior years and our 2019 net income of $1,580 million. We declare dividends to promote wise decision making with scarce resources after regulatory and other capitalization requirements are met ensuring that our Mortgage Insurance and Mortgage Funding activities are appropriately capitalized.
32
Condensed consolidated statement of income and comprehensive income
Assisted Housing Activity | Mortgage Insurance Activity | Mortgage Funding Activity | Eliminations | Total | ||||||||||||||||||||||||||||||||||||
| (in millions) | 2019 | 2018 | 2019 | 2018 | 2019 | 2018 | 2019 | 2018 | 2019 | 2018 | ||||||||||||||||||||||||||||||
Government funding for housing programs1 | 2,039 | 2,336 | - | - | - | - | - | - | 2,039 | 2,336 | ||||||||||||||||||||||||||||||
Premiums and fees earned | - | - | 1,429 | 1,426 | 582 | 483 | - | - | 2,011 | 1,909 | ||||||||||||||||||||||||||||||
All other income2 | 78 | 51 | 538 | 444 | 100 | 68 | (29 | ) | 15 | 687 | 578 | |||||||||||||||||||||||||||||
Total revenues and government funding | 2,117 | 2,387 | 1,967 | 1,870 | 682 | 551 | (29 | ) | 15 | 4,737 | 4,823 | |||||||||||||||||||||||||||||
Housing programs | 1,829 | 2,149 | - | - | - | - | - | - | 1,829 | 2,149 | ||||||||||||||||||||||||||||||
Insurance claims | - | - | 191 | 210 | - | - | - | - | 191 | 210 | ||||||||||||||||||||||||||||||
Operating expenses | 238 | 212 | 312 | 318 | 63 | 55 | - | - | 613 | 585 | ||||||||||||||||||||||||||||||
Total expenses | 2,067 | 2,361 | 503 | 528 | 63 | 55 | - | - | 2,633 | 2,944 | ||||||||||||||||||||||||||||||
Income taxes | 8 | - | 368 | 334 | 155 | 124 | (7 | ) | 4 | 524 | 462 | |||||||||||||||||||||||||||||
Net income | 42 | 26 | 1,096 | 1,008 | 464 | 372 | (22 | ) | 11 | 1,580 | 1,417 | |||||||||||||||||||||||||||||
Other comprehensive income (loss) | (32 | ) | 34 | 205 | (123 | ) | 9 | 32 | (10 | ) | 10 | 172 | (47 | ) | ||||||||||||||||||||||||||
Comprehensive income | 10 | 60 | 1,301 | 885 | 473 | 404 | (32 | ) | 21 | 1,752 | 1,370 | |||||||||||||||||||||||||||||
| 1 | CMHC’s Housing Analysis and Research activities are cost-recovered from government funding for housing programs (2019 – $97 million, 2018 – $72 million), as well as from revenues from our Mortgage Insurance activity (2019 – $18 million, 2018 – $18 million). |
| 2 | Includes net interest income, investment income, net gains (losses) on financial instruments and other income. |
Revenues and expenses
We receive government funding for the expenses we incur to deliver housing programs. In addition, we earn revenues from our Mortgage Insurance and Mortgage Funding activities that include insurance premiums earned from our transactional homeowner, portfolio and multi-unit residential insurance products. Fees earned from our Mortgage Funding activities result from the timely principal and interest payment guarantees we provide under our National Housing Act Mortgage-Backed Securities and Canada Mortgage Bonds programs. Insurance premiums and guarantee fees are included in premiums and fees earned.
In 2019, our total revenues and government funding decreased by $86 million (2%) mainly due to the following:
| · | A reduction of $297 million (13%) in government funding in 2019, mostly driven by the expiry of funding provided under Budget 2016 for housing programs. The expired funding was partially offset by additional funding authorized for existing Indigenous housing, as well as spending on several National Housing Strategy initiatives, such as the Federal, Provincial and Territorial Partnership, National Housing Co-investment Fund and Federal Community Housing Initiative. |
| · | Premiums and fees revenue increased by $102 million (5%). Mortgage Funding guarantee fees earned increased by $99 million (20%) mainly due to recent price increases and the implementation of a revised tiered pricing structure in 2015. Insurance premiums revenue remained stable year over year. |
| · | All other income increased by $109 million (19%) mainly due to higher net gains on financial instruments of $209 million (215%) as a result of gains on our common equity investments prior to their sale in 2019. This increase was partially offset by lower net interest and investment income of $86 million (14%) due to lower yields, since we reinvested proceeds from the sale of all common and preferred shares into money market instruments and bonds. Interest rates also decreased during the year and maturing investments were used to fund the payment of dividends. |
Total expenses decreased by $311 million (11%) mainly due to the following:
| · | The net impact of funding for Budget 2016 and National Housing Strategy initiatives as described above, which resulted in lower housing programs expenses. |
A Commitment to Affordability | 2019 Annual Report 33
Other comprehensive income
In 2019, our other comprehensive income increased by $219 million (466%) mainly due to the following:
| • | A decrease in bond yields in 2019 compared to an increase in 2018. This resulted in an increase of $322 million (313%) in net unrealized gains from debt instruments held at fair value through other comprehensive income. |
| • | This was partially offset by an increase of $147 million (186%) in remeasurement losses on the defined benefit plans. This is due to the net effect of a lower discount rate and a higher return on plan assets resulting in an increase in the pension plan liability by $68 million versus the remeasurement in 2018, which resulted in a decrease in the liability by $79 million. |
Financial performance against 2019 plan
| 2019 | ||||||||
| (in millions) | Actual | Plan | ||||||
Total revenues and government funding | 4,737 | 5,078 | ||||||
Total expenses | 2,633 | 3,108 | ||||||
Income taxes | 524 | 481 | ||||||
Net income | 1,580 | 1,489 | ||||||
Total assets | 276,259 | 275,274 | ||||||
Total liabilities | 261,646 | 261,300 | ||||||
Total equity of Canada | 14,613 | 13,974 | ||||||
Total revenues and government funding were $341 million (7%) lower than plan mainly due to changes in the timing of when government funding is required for the National Housing Strategy, particularly for the National Housing Co-investment Fund, Federal, Provincial and Territorial Partnership, Innovation Fund and Rental Construction Financing initiative. This was also the main driver for the lower than planned expenses in 2019.
Financial metrics and ratios
Mortgage Insurance
| (in percentages) | 2019 | 2018 | ||||||
Loss ratio1 | 13.4 | 14.7 | ||||||
Operating expense ratio | 21.8 | 22.3 | ||||||
Combined ratio | 35.2 | 37.0 | ||||||
Severity ratio | 31.1 | 31.9 | ||||||
Return on equity | 9.1 | 7.4 | ||||||
Return on required equity | 10.6 | 8.3 | ||||||
| 1 | Loss ratio on transactional homeowner and portfolio products excluding multi-unit residential was 19.0% for the twelve months ended 31 December 2019 (22.7% for the twelve months ended 31 December 2018). |
The decrease in the loss ratio is a result of reduced long-term loss experienced for multi-unit residential and lower claims than expected at the end of 2018, as well as a decrease in the provision for loans in arrears for homeowner and portfolio. The decrease in the operating expense ratio is due to lower personnel costs and higher fees and premiums earned. Higher net income and a decrease in the required capital due primarily to a lower insurance-in-force led to an increase in the return on required equity. The increase in return on equity was due to higher net income as a result of net gains on financial instruments, whereas, losses were incurred in 2018.
34
| (in millions, unless otherwise indicated) | Insurance- in-Force ($B) | Insured Volumes (units) | Insured Volumes1 ($) | Premiums and Fees Received | Claims Paid2 | |||||||||||||||||||||||||||||||||||
| 2019 | 2018 | 2019 | 2018 | 2019 | 2018 | 2019 | 2018 | 2019 | 2018 | |||||||||||||||||||||||||||||||
Transactional homeowner | 227 | 236 | 99,855 | 104,440 | 27,069 | 27,579 | 958 | 973 | 212 | 217 | ||||||||||||||||||||||||||||||
Portfolio | 117 | 136 | 22,581 | 18,792 | 5,910 | 4,634 | 30 | 21 | 20 | 20 | ||||||||||||||||||||||||||||||
Multi-unit residential | 85 | 76 | 127,149 | 113,298 | 16,051 | 13,096 | 561 | 451 | 4 | 5 | ||||||||||||||||||||||||||||||
Total | 429 | 448 | 249,585 | 236,530 | 49,030 | 45,309 | 1,549 | 1,445 | 236 | 242 | ||||||||||||||||||||||||||||||
| 1 | Portfolio volumes exclude Lender substitutions. Portfolio substitutions were 10,117 units and $1,435 million in 2019 (16,955 units and $2,424 million in 2018). The decrease is due to lower eligible substitution volumes as past regulations continue to be grandfathered in. |
| 2 | Claims paid does not include social housing mortgage and index-linked mortgage claims. |
Insurance-in-force decreased by $19 billion (4%) due to run-off of existing policies-in-force, primarily in portfolio insurance due to reduced volumes since the introduction of pricing increases commensurate with revised regulatory capital requirements in 2017. New loans insured were $50 billion, while estimated loan amortization and pay-downs were $69 billion.
Transactional homeowner volumes decreased by 4,585 units (4%) primarily as a result of our decision to reduce our market share of the insured mortgage market. Portfolio volumes increased by 3,789 units (20%) and $1.3 billion insured dollars (28%). This is due to two large incremental pools submitted in 2019 as well as a higher average unit cost across all regions. Multi-unit residential volumes increased by 13,851 units (12%) and $3 billion insured dollars (23%) due to significant increases in insured dollars from the Rental Construction Financing initiative ($1.2 billion) and insured volumes supporting higher loan-to-value ratio mortgages that have lower premiums and higher amortization periods to encourage the construction, purchase and refinancing of affordable multi-unit residential rental properties.
Higher multi-unit insured dollar volumes and higher portfolio insured dollar volumes contributed to an overall $104 million (7%) increase in total premiums and fees received. Lower volumes in the transactional homeowner product partially offset this increase.
The decrease in claims paid of $6 million (2%) is primarily due to a decrease in the number of claims for transactional homeowner mainly attributable to Quebec, Atlantic and British Columbia as a result of improvements in the unemployment rate and house prices in 2018, when the majority of the paid claims were incurred.
| 2019 | 2018 | |||||||||||||||
No. of Delinquent Loans | Arrears Rate | No. of Delinquent Loans | Arrears Rate | |||||||||||||
Transactional homeowner | 4,859 | 0.43% | 5,048 | 0.42% | ||||||||||||
Portfolio | 1,275 | 0.15% | 1,296 | 0.13% | ||||||||||||
Multi-unit residential | 67 | 0.28% | 86 | 0.36% | ||||||||||||
Total | 6,201 | 0.31% | 6,430 | 0.29% | ||||||||||||
The arrears rate includes all loans more than 90 days past due as a percentage of outstanding insured loans. There were lower reported delinquencies in all regions except for the Prairies and Territories and British Columbia, which is consistent with employment and house price trends in these regions.
Mortgage Funding
| (in percentages) | 2019 | 2018 | ||||||
Operating expense ratio | 9.3% | 9.5% | ||||||
Return on equity | 19.4% | 15.3% | ||||||
Return on required equity | 36.1% | 23.9% | ||||||
Our Mortgage Funding return on required equity was 12.2 percentage points higher than in 2018 due to the combined effect of an increase in annualized net income and a decrease in average required equity for the year. The increase in net income is largely driven by higher guarantee and application fees earned from pricing changes in recent years as well as increased volumes, while the decrease in average required equity is due to our revised view on the lower risks associated with our Mortgage Funding program.
A Commitment to Affordability | 2019 Annual Report 35
Return on equity was 4.1 percentage points higher due to higher annualized net income as explained above combined with lower equity due to dividends declared.
Total Guarantees-in-Force ($B) | New Securities Guaranteed ($B) | Guarantee and Application Fees Received1 | ||||||||||||||||||||||
(in millions, unless otherwise indicated) | 2019 | 2018 | 2019 | 2018 | 2019 | 2018 | ||||||||||||||||||
National Housing Act Mortgage-Backed Securities | 249 | 254 | 134 | 127 | 518 | 503 | ||||||||||||||||||
Canada Mortgage Bonds | 244 | 234 | 40 | 40 | 146 | 146 | ||||||||||||||||||
Total | 493 | 488 | 174 | 167 | 664 | 649 | ||||||||||||||||||
| 1 | Guarantee and application fees received for National Housing Act Mortgage-Backed Securities; guarantee fees received for Canada Mortgage Bonds. |
Guarantees-in-force increased by $5 billion (1%) as new guarantees issued during the year exceeded maturities.
Guarantee and application fees received increased by $15 million (2%) mainly due to an increase in new securities guaranteed of $7 billion (4%) partially offset by a decrease in volumes that attract a higher guarantee fee from two major banks.
Government funding and housing programs expenses
The following table reconciles the amounts of government funding for housing programs authorized by Parliament as available to us during the Government’s fiscal year (31 March) with the total amount we recognized in our calendar year.
| (in millions) | 2019 | 2018 | ||||||
Amounts provided for housing programs: | ||||||||
Amounts authorized in 2018/19 (2017/18) | ||||||||
Main estimates | 2,452 | 2,735 | ||||||
Supplementary estimates A1,2 | 7 | 41 | ||||||
Supplementary estimates B1,2 | 1 | 1 | ||||||
Supplementary estimates C1 | - | 1 | ||||||
Less: Portion recognized in calendar 2018 (2017) | (1,310 | ) | (1,663 | ) | ||||
Less: Government funding lapsed for 2018/19 (2017/18) | (356 | ) | (74 | ) | ||||
Less: Frozen allotment | (19 | ) | (15 | ) | ||||
2018/19 (2017/18) government funding for housing programs recognized in 2019 (2018) calendar year | 775 | 1,026 | ||||||
Amounts authorized in 2019/20 (2018/19) | ||||||||
Main estimates | 2,657 | 2,452 | ||||||
Supplementary estimates A1,2,3 | 9 | 7 | ||||||
Supplementary estimates B1,4 | 78 | 1 | ||||||
Total fiscal year government funding for housing programs | 2,744 | 2,460 | ||||||
Less: Portion to be recognized in subsequent quarters | (1,462 | ) | (775 | ) | ||||
Less: Forecasted lapse for 2019/20 (actual lapse in 2018/19)4,5 | - | (356 | ) | |||||
Less: Frozen allotment | - | (19 | ) | |||||
2019/20 (2018/19) government funding for housing programs recognized in 2019 (2018) calendar year | 1,282 | 1,310 | ||||||
Total government funding for housing programs recognized—twelve months ended 31 December | 2,057 | 2,336 | ||||||
| 1 | Supplementary estimates are additional government funding voted on by Parliament during the Government‘s fiscal year. |
| 2 | Budget 2016 provided funding over two years for investments in social infrastructure, as well as funding over five years for a new Affordable Housing Innovation Fund. Years one and two of these investments are reflected within the 2016/17 and 2017/18 appropriations. |
| 3 | Approved reprofile request from 2017/18 to 2018/19 in supplementary estimates A for Shelter Enhancement Program. |
| 4 | Approved reprofile request from 2018/19 to 2019/20 in supplementary estimates B for First Nations Housing Management Professional Initiative, National Housing Co-investment Fund, Affordable Housing Innovation Fund and First-Time Home Buyer Incentive. |
| 5 | Approved reprofile request from 2018/19 to future years for National Housing Co-investment Fund, Rental Construction Financing initiative and other National Housing Strategy initiatives. |
36
Capital management
Frameworks
For our Assisted Housing activity, we maintain a reserve fund pursuant to Section 29 of the CMHC Act. Our Lending programs operate on a break-even basis over the long term, however, a portion of their earnings are retained in this reserve fund in order to account for potential future interest rate and credit risk exposure on our loans. Unrealized fair value market fluctuations and remeasurement losses on defined benefit plan liabilities are absorbed in retained earnings. We do not hold capital for our Assisted Housing activities, as they do not present material financial risks to CMHC.
For our Mortgage Insurance activity, our capital management framework follows the Office of the Superintendent of Financial Institutions’ regulations with respect to the use of the Mortgage Insurer Capital Adequacy Test. In doing so, we try to be a standard setter as a risk manager and to price our mortgage insurance products to ensure an adequate return, in order to preserve effective competition.
For our Mortgage Funding activity, our capital management framework follows industry best practices and incorporates regulatory principles from the Office of the Superintendent of Financial Institutions, including those set out in the Office of the Superintendent of Financial Institutions’ E19 – Own Risk and Solvency Assessment guideline, and those of the Basel Committee on Banking Supervision. Our capital adequacy assessment uses an integrated approach to evaluate our capital needs from both a regulatory and economic capital basis to establish capital targets that take into consideration our strategy and risk appetite.
Ratios
The table below presents our capital management ratios as at 31 December.
| (in percentages) | 2019 | 2018 | ||||||
Mortgage Insurance: Capital available to minimum capital required (MICAT) | 195% | 168%¹ | ||||||
Mortgage Funding: Available equity to required equity | 190% | 209% | ||||||
| 1 | Prior to implementing the Mortgage Insurer Capital Adequacy Test (MICAT) on 1 January 2019, this ratio was calculated using the Minimum Capital Test for Federally Regulated Property and Casualty Insurance Companies (MCT). The Mortgage Insurer Capital Adequacy Test ratio as at 31 December 2018 was estimated at 181% excluding transitional arrangements. |
Our Mortgage Insurance Mortgage Insurer Capital Adequacy Test ratio increased by 27 percentage points partially due to the implementation of the Mortgage Insurer Capital Adequacy Test guideline on 1 January 2019, which led to less capital required due to the use of origination credit scores. A smaller insurance-in-force also reduced capital required, while capital required for market risk decreased as we sold many of our equity investments. The increase in capital available was partially offset by our declaration of a $1,320-million dividend.
Our Mortgage Funding available equity to required equity was 19 percentage points lower than in 2018 due to dividend declarations.
Refer to the Consolidated Financial Statements note 10 – Capital Management for further disclosure on capital management.
2020 look ahead
National Housing Act Mortgage-Backed Securities guarantee annual limits
Effective 25 March 2020, the National Housing Act Mortgage-Backed Securities guarantee limit for 2020 was increased to $195 billion from $145 billion. This limit excludes National Housing Act Mortgage-Backed Securities issuance as reinvestment assets for Canada Mortgage Bonds series issued before 1 July 2016. The Canada Mortgage Bonds guarantee limit for 2020 was increased to $60 billion from $40 billion. The 2020 limit increases were in response to the global COVID-19 outbreak. In addition, our pricing strategy continues to evolve ensuring risks and objectives are appropriately considered.
A Commitment to Affordability | 2019 Annual Report 37
Historical Information
Actual | ||||||||||||||||||||
| (in millions, unless otherwise indicated) | 20193 | 20184 | 2017 | 2016 | 2015 | |||||||||||||||
Consolidated Results | ||||||||||||||||||||
Total assets | 276,259 | 263,876 | 267,115 | 259,532 | 252,107 | |||||||||||||||
Total liabilities | 261,646 | 248,995 | 249,374 | 238,542 | 232,468 | |||||||||||||||
Total equity of Canada | 14,613 | 14,881 | 17,741 | 20,990 | 19,639 | |||||||||||||||
Total revenues | 4,737 | 4,823 | 6,152 | 4,625 | 4,636 | |||||||||||||||
Total expenses (including income taxes) | 3,157 | 3,406 | 4,349 | 3,247 | 3,148 | |||||||||||||||
Net income | 1,580 | 1,417 | 1,803 | 1,378 | 1,488 | |||||||||||||||
Operating budget ratio | 15.6% | 14.4% | 11.3% | 12.3% | 11.1% | |||||||||||||||
Assisted Housing | ||||||||||||||||||||
Government funding for housing programs | 2,039 | 2,336 | 3,229 | 2,153 | 2,049 | |||||||||||||||
Net income (loss) | 42 | 26 | 80 | (14 | ) | 25 | ||||||||||||||
Total equity of Canada | 302 | 291 | 234 | 196 | 202 | |||||||||||||||
Mortgage Insurance | ||||||||||||||||||||
Insurance-in-force ($B) | 429 | 448 | 480 | 512 | 526 | |||||||||||||||
Total insured volumes¹ | 50,465 | 47,733 | 53,569 | 84,275 | 80,447 | |||||||||||||||
Premiums and fees received | 1,549 | 1,445 | 1,438 | 1,558 | 1,438 | |||||||||||||||
Premiums and fees earned | 1,429 | 1,426 | 1,557 | 1,505 | 1,592 | |||||||||||||||
Claims paid | 236 | 242 | 329 | 377 | 353 | |||||||||||||||
Insurance claims expense | 191 | 210 | 147 | 334 | 290 | |||||||||||||||
Net income | 1,096 | 1,008 | 1,404 | 1,183 | 1,264 | |||||||||||||||
Arrears rate | 0.31% | 0.29% | 0.29% | 0.32% | 0.34% | |||||||||||||||
Loss ratio | 13.4% | 14.7% | 9.4% | 22.2% | 18.2% | |||||||||||||||
Operating expense ratio | 21.8% | 22.3% | 20.4% | 17.0% | 13.3% | |||||||||||||||
Combined ratio | 35.2% | 37.0% | 29.8% | 39.2% | 31.5% | |||||||||||||||
Severity ratio | 31.1% | 31.9% | 32.2% | 31.9% | 32.0% | |||||||||||||||
Return on equity | 9.1% | 7.4% | 8.3% | 6.5% | 7.4% | |||||||||||||||
Return on required equity | 10.6% | 8.3% | 13.6% | 11.6% | 12.9% | |||||||||||||||
Capital available to minimum capital required (% MICAT)² | 195% | 168% | 184% | 384% | 354% | |||||||||||||||
% Estimated outstanding Canadian residential mortgages with CMHC insurance coverage ($) | 26.4% | 29.1% | 31.9% | 36.0% | 39.1% | |||||||||||||||
Mortgage Funding | ||||||||||||||||||||
Guarantees-in-force ($B) | 493 | 488 | 477 | 452 | 431 | |||||||||||||||
Annual securities guaranteed ($B) | 174 | 167 | 167 | 144 | 116 | |||||||||||||||
Guarantee and application fees received | 664 | 649 | 627 | 579 | 473 | |||||||||||||||
Guarantee and application fees earned | 582 | 483 | 384 | 284 | 268 | |||||||||||||||
Net income | 464 | 372 | 295 | 224 | 215 | |||||||||||||||
Operating expense ratio | 9.3% | 9.5% | 10.8% | 12.6% | 11.1% | |||||||||||||||
Return on equity | 19.4% | 15.3% | 13.4% | 11.3% | 12.0% | |||||||||||||||
Available equity to required equity | 190% | 209% | 135% | 100% | 159% | |||||||||||||||
Return on required equity | 36.1% | 23.9% | 15.1% | 13.5% | 17.9% | |||||||||||||||
% Estimated outstanding Canadian residential mortgages with CMHC securitization guarantee ($) | 30.6% | 31.9% | 32.2% | 32.6% | 32.5% | |||||||||||||||
| 1 | Total insured volumes include portfolio substitutions. |
| 2 | We implemented the Mortgage Insurer Capital Adequacy Test guideline in 2019. Prior years were prepared in accordance with the Minimum Capital Test. |
| 3 | We implemented IFRS 16 Leases in 2019. Prior years were prepared in accordance with IAS 17 Leases and related interpretations. |
| 4 | We implemented IFRS 9 Financial Instruments and IFRS 15 Revenue from Contracts with Customers in 2018. Prior years were prepared in accordance with IAS 39 Financial Instruments: Recognition and Measurement and IAS 18 Revenue. |
38
Risk
Management
We are exposed to a variety of risks that could affect the achievement of our aspiration and strategic objectives. We strive to be a best-in-class housing risk manager to promote stability in the housing system and to protect the public resources entrusted to us.
Our risk management approach
Our Enterprise Risk Management Framework defines our risk management practices and is designed to support an effective risk culture in the company. The framework is structured around four key dimensions: risk governance, risk management program, risk appetite and risk behaviour.
Our risks are governed by risk frameworks and policies and are supported by our “three lines of defence” operating model. This model embeds risk management activities throughout our operations and aligns strategy and performance across all businesses and functions.
It also promotes robust decision making, as well as evaluation and management of risks across the organization.
We categorize key risks facing the organization into seven categories: strategic, reputational, operational, insurance, credit, market and liquidity. Operational risks are further broken down into subcategories such as business process, people, model, reporting, information and technology, change management, and legal and compliance. Our structured risk management programs ensure regular risk assessment and reporting of our risks, as well as provide a coherent process to monitor our top and emerging risks.
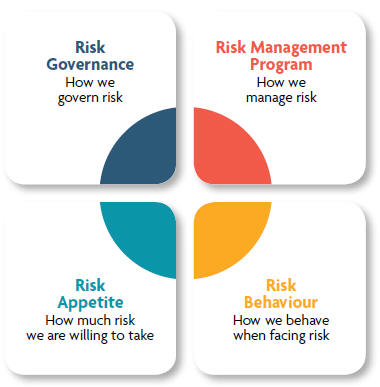
A Commitment to Affordability | 2019 Annual Report 39
Risk appetite
Our response to any particular risk is driven by the Risk Appetite Framework. Our risk appetite enables us to make risk-sensitive decisions and contemplates the risks we are willing to take in pursuit of our aspiration, as well as our strategic objectives. It also allows us to determine risk tolerances and clarifies the escalation process in the event of tolerance breaches.
Importantly, our Risk Appetite Framework is designed to drive the desired risk behaviours in both normal operating economic conditions and during economic downturns.
Risk reporting and monitoring
Our risk reporting and monitoring processes provide a corporate-wide view of our risk profile, flag key and emerging risks, and foster discussions about mitigating actions.
The table below outlines our seven risk categories and their assessment as at 31 December 2019:
| Strategic | ● | Moderate | ||
| Reputational | ● | Moderate | ||
| Operational | ● | High | ||
| Insurance | ● | Low | ||
| Credit | ● | Low | ||
| Market | ● | Low | ||
Liquidity
| ●
| Low
| ||
We provide additional context below for risks assessed as high or moderate.
Operational risk – high ●
Operational risk is the risk of loss or other undesirable outcomes resulting from people, inadequate or failed internal processes or systems, or from external events. We assessed operational risk as high with information security and people risks being identified as top operational concerns to the organization.
We actively manage information security risk to mitigate a rapidly evolving cyber threat environment by continued strengthening of our cyber security capabilities and an enhanced privacy program to protect personal information.
Impacts of our technology transformation are closely monitored to mitigate operational risks associated with changing technology and business process.
Our ability to attract, retain and engage a diverse and talented workforce is key to fulfilling the mission of helping Canadians meet their housing needs. We continue to monitor and enhance recruitment strategies to attract a talented workforce, particularly for specialized positions in a highly competitive labour market.
Reputational risk – moderate ●
We assessed our reputational risk as moderate primarily due to our operational risk exposures, heightened expectations related to housing affordability and our commitments to deliver on our ambitious National Housing Strategy targets and strategic objectives.
We manage these risks through appropriate oversight, governance and controls, and by fostering a robust risk culture, in addition to our new client-centric business model focused on meeting the needs of our partners and Canadians.
Strategic risk – moderate ●
We assessed our strategic risks as moderate given the rapidly changing internal and external environments. Economic and geopolitical uncertainties, elevated levels of household debt, climate change, increasingly competitive labour markets and continued adaption to newly deployed technology and business transformations contribute to our strategic risk and the ability to execute on our new strategy.
In addition, several factors influence our mortgage insurance business, including interest rate trends, house price changes, the unemployment rate, government regulation and competition within the Canadian housing finance market. We continually monitor these factors to ensure that strategic risk remains within our risk tolerance threshold.
Stress-testing results
In 2019, we tested our mortgage insurance and mortgage funding businesses against six very severe but plausible scenarios to determine the extent of potential losses, the impact on our solvency and to take mitigating actions in advance, if advisable. Additional details on these scenarios are included below.
Our stress-testing program was carried out in accordance with the Office of the Superintendent of Financial Institutions’ new capital guidelines for mortgage insurers: the Mortgage Insurer Capital Adequacy Test.
40
Scenario descriptions
| Base Case | Current corporate plan projections, without further stress. | |
| Financial Market Crash | Increased financial stress in the banking sector causes credit and liquidity shortages and leads to the failure of a major financial institution and a mortgage insurance company. | |
| Middle East Conflict | The development of a major conflict in the Middle East causes a significant global oil supply shock, resulting in high inflation and high interest rates. | |
| Global Recession | Downside risks to the United States, European Union and Chinese economies intensify leading to a global recession. | |
| Cyberattack | Repeated major cyberattacks on the Canadian financial system undermine confidence in financial institutions, cause severe disruption to business operations and have a material negative impact on the Canadian economy. | |
| Nuclear Leakage | Nuclear leakage from one of Canada’s largest power stations pushes the Canadian economy into a recession, with knock-on impacts on CMHC’s business activities. | |
| 5/30 | A 5% increase in unemployment rate coupled with a 30% decline in house prices. | |
Our testing confirms that our capital holdings are sufficient to cover our obligations with certain management actions. In a real crisis, CMHC would actively manage losses and capital in order to stabilize housing and financial markets. These actions would be taken in line with our risk appetite and crisis readiness planning and are not reflected in the results below.
For the period 2019-20281 (in millions, unless otherwise indicated) | Base Case |
Financial Market Crash | Middle East Conflict | Global Recession | Cyberattack | Nuclear Leakage | 5/30 | |||||||||||||||||||||
Cumulative net income – Insurance | $12,450 | $4,796 | $8,045 | $6,670 | $8,636 | $6,134 | $4,570 | |||||||||||||||||||||
Lowest point of capital available relative to Own Risk and Solvency Assessment Capital | 165% | 89% | 153% | 140% | 156% | 129% | 78% | |||||||||||||||||||||
Cumulative net income – Securitization | $5,321 | $6,251 | $5,445 | $5,353 | $5,335 | $5,460 | $5,321 | |||||||||||||||||||||
Change in housing prices (peak-to-trough) | 49.7% | -42.6% | -27.0% | -34.2% | -19.8% | -27.4% | -30.2% | |||||||||||||||||||||
Peak unemployment rate | 6.0% | 10.2% | 7.2% | 8.2% | 7.3% | 14.2% | 10.7% | |||||||||||||||||||||
| 1 | The results in the tables are projected over the next 10-year period, however, the crises could extend beyond this date. |
Crisis preparedness
Stress-testing results are used to ensure we remain ready to provide an effective and coordinated response in times of crisis, in line with our financial stability mandate. We have a crisis readiness framework and playbooks, which describe step-by-step actions that would be taken to effectively manage a crisis. These measures are reviewed and updated on an annual basis to ensure appropriateness and relevancy.
A Commitment to Affordability | 2019 Annual Report 41
Consolidated Financial Statements |
| |||||
Management’s Responsibility for Financial Reporting | 43 | |||||
Consolidated Balance Sheet | 46 | |||||
Consolidated Statement of Income and Comprehensive Income | 47 | |||||
Consolidated Statement of Equity of Canada | 48 | |||||
Consolidated Statement of Cash Flows | 49 | |||||
Notes to Consolidated Financial Statements | 50 | |||||
1. Corporate Information | 50 | |||||
2. Basis of Preparation and Significant Accounting Policies | 50 | |||||
3. Current and Future Accounting Changes | 61 | |||||
4. Critical Judgments in Applying Accounting Policies and Making Estimates | 62 | |||||
5. Segmented Information | 64 | |||||
6. Government Funding and Housing Programs Expenses | 67 | |||||
7. Mortgage Insurance | 68 | |||||
8. Mortgage Funding | 74 | |||||
9. Structured Entities | 75 | |||||
10. Capital Management | 76 | |||||
11. Fair Value Measurement | 78 | |||||
12. Cash and Cash Equivalents | 83 | |||||
13. Investment Securities | 84 | |||||
14. Loans | 86 | |||||
15. Borrowings | 90 | |||||
16. Derivatives | 92 | |||||
17. Financial Instruments Income and Expenses | 93 | |||||
18. Market Risk | 94 | |||||
19. Credit Risk | 97 | |||||
20. Liquidity Risk | 101 | |||||
21. Accounts Receivable and Other Assets | 102 | |||||
22. Investment Property | 103 | |||||
23. Accounts Payable and Other Liabilities | 103 | |||||
24. Pension and Other Post-Employment Benefits | 103 | |||||
25. Income Taxes | 109 | |||||
26. Related Party Transactions | 111 | |||||
27. Commitments and Contingent Liabilities | 112 | |||||
28. Operating Expenses | 112 | |||||
29. Current and Non-Current Assets and Liabilities | 113 | |||||
30. Comparative Figures | 114 | |||||
31. Subsequent Event | 114 | |||||
42 | ||||||
Management’s
Responsibility for
Financial Reporting
Year ended 31 December 2019
Management is responsible for the integrity and objectivity of the consolidated financial statements and related financial information presented in this annual report. The consolidated financial statements have been prepared in accordance with International Financial Reporting Standards (IFRS) and, consequently, include amounts that are based on the best estimates and judgment of Management. The financial information contained elsewhere in this annual report is consistent with that in the consolidated financial statements.
In carrying out its responsibilities, Management maintains appropriate financial systems and related internal controls to provide reasonable assurance that financial information is reliable; assets are safeguarded; transactions are properly authorized and are in accordance with the relevant legislation, bylaws of the Corporation and Government directives; resources are managed efficiently and economically; and operations are carried out effectively. The system of internal controls is supported by internal audit, which conducts periodic audits of different aspects of the operations.
The Board of Directors, acting through the Audit Committee whose members are neither officers nor employees of the Corporation, oversees Management’s responsibilities for financial reporting and internal control systems. The Board of Directors, upon the recommendation of the Audit Committee, has approved the consolidated financial statements.
Ernst & Young LLP and the Auditor General of Canada have audited the consolidated financial statements. The auditors have full access to, and meet periodically with, the Audit Committee to discuss their audit and related matters.
 |  | |
| Evan Siddall, BA, LL.B. | Lisa Williams, CPA, CA | |
| President and Chief Executive Officer | Chief Financial Officer | |
| 25 March 2020 | ||
A Commitment to Affordability | 2019 Annual Report 43
| Office of the Auditor General of Canada
| Bureau du vérificateur général du Canada
|  |

INDEPENDENT AUDITORS’ REPORT
To the Minister of Families, Children and Social Development
Report on the Audit of the Consolidated Financial Statements
Opinion
We have audited the consolidated financial statements of Canada Mortgage and Housing Corporation and its subsidiary (the Group), which comprise the consolidated balance sheet as at 31 December 2019, and the consolidated statement of income and comprehensive income, consolidated statement of equity of Canada and consolidated statement of cash flows for the year then ended, and notes to the consolidated financial statements, including a summary of significant accounting policies.
In our opinion, the accompanying consolidated financial statements present fairly, in all material respects, the consolidated financial position of the Group as at 31 December 2019, and its consolidated financial performance and its consolidated cash flows for the year then ended in accordance with International Financial Reporting Standards (IFRSs).
Basis for Opinion
We conducted our audit in accordance with Canadian generally accepted auditing standards. Our responsibilities under those standards are further described in the Auditor’s Responsibilities for the Audit of the Consolidated Financial Statements section of our report. We are independent of the Group in accordance with the ethical requirements that are relevant to our audit of the consolidated financial statements in Canada, and we have fulfilled our other ethical responsibilities in accordance with these requirements. We believe that the audit evidence we have obtained is sufficient and appropriate to provide a basis for our opinion.
Other Information
Management is responsible for the other information.
The other information comprises the information included in the 2019 Annual Report, but does not include the consolidated financial statements and our auditors’ report thereon.
Our opinion on the consolidated financial statements does not cover the other information and we do not express any form of assurance conclusion thereon.
In connection with our audit of the consolidated financial statements, our responsibility is to read the other information and, in doing so, consider whether the other information is materially inconsistent with the consolidated financial statements or our knowledge obtained in the audit, or otherwise appears to be materially misstated.
If, based on the work we have performed, we conclude that there is a material misstatement of this other information, we are required to report that fact.
We have nothing to report in this regard.
Responsibilities of Management and Those Charged with Governance for the Consolidated Financial Statements
Management is responsible for the preparation and fair presentation of the consolidated financial statements in accordance with IFRSs, and for such internal control as management determines is necessary to enable the preparation of consolidated financial statements that are free from material misstatement, whether due to fraud or error.
In preparing the consolidated financial statements, management is responsible for assessing the Group’s ability to continue as a going concern, disclosing, as applicable, matters related to going concern and using the going concern basis of accounting unless management either intends to liquidate the Group or to cease operations, or has no realistic alternative but to do so.
Those charged with governance are responsible for overseeing the Group’s financial reporting process.
Auditor’s Responsibilities for the Audit of the Consolidated Financial Statements
Our objectives are to obtain reasonable assurance about whether the consolidated financial statements as a whole are free from material misstatement, whether due to fraud or error, and to issue an auditor’s report that includes our opinion. Reasonable assurance is a high level of assurance, but is not a guarantee that an audit conducted in accordance with Canadian generally accepted auditing standards will always detect a material misstatement when it exists. Misstatements can arise from fraud or error and are considered material if, individually or in the aggregate, they could reasonably be expected to influence the economic decisions of users taken on the basis of these consolidated financial statements.
As part of an audit in accordance with Canadian generally accepted auditing standards, we exercise professional judgment and maintain professional skepticism throughout the audit. We also:
| • | Identify and assess the risks of material misstatement of the consolidated financial statements, whether due to fraud or error, design and perform audit procedures responsive to those risks, and obtain audit evidence that is sufficient and appropriate to provide a basis for our opinion. The risk of not detecting a material misstatement resulting from fraud is higher than for one resulting from error, as fraud may involve collusion, forgery, intentional omissions, misrepresentations, or the override of internal control. |
| • | Obtain an understanding of internal control relevant to the audit in order to design audit procedures that are appropriate in the circumstances, but not for the |
44
purpose of expressing an opinion on the effectiveness of the Group’s internal control. |
| • | Evaluate the appropriateness of accounting policies used and the reasonableness of accounting estimates and related disclosures made by management. |
| • | Conclude on the appropriateness of management’s use of the going concern basis of accounting and, based on the audit evidence obtained, whether a material uncertainty exists related to events or conditions that may cast significant doubt on the Group’s ability to continue as a going concern. If we conclude that a material uncertainty exists, we are required to draw attention in our auditor’s report to the related disclosures in the consolidated financial statements or, if such disclosures are inadequate, to modify our opinion. Our conclusions are based on the audit evidence obtained up to the date of our auditor’s report. However, future events or conditions may cause the Group to cease to continue as a going concern. |
| • | Evaluate the overall presentation, structure and content of the consolidated financial statements, including the disclosures, and whether the consolidated financial statements represent the underlying transactions and events in a manner that achieves fair presentation. |
| • | Obtain sufficient appropriate audit evidence regarding the financial information of the Canada Housing Trust or business activities within the Group to express an opinion on the consolidated financial statements. We are responsible for the direction, supervision, and performance of the group audit. We remain solely responsible for our audit opinion. |
We communicate with those charged with governance regarding, among other matters, the planned scope and timing of the audit and significant audit findings, including any significant deficiencies in internal control that we identify during our audit.
Report on Compliance with Specified Authorities
Opinion
In conjunction with the audit of the consolidated financial statements, we have audited transactions of Canada Mortgage and Housing Corporation coming to our notice for compliance with specified authorities. The specified authorities against which compliance was audited are Part X of the Financial Administration Act and regulations, the Canada Mortgage and Housing Corporation Act, the National Housing Act, the by-laws of the Canada Mortgage and Housing Corporation, and the directives issued pursuant to section 89 of the Financial Administration Act.
In our opinion, the transactions of Canada Mortgage and Housing Corporation that came to our notice during the audit of the consolidated financial statements have complied, in all material respects, with the specified authorities referred to above. Further, as required by the Financial Administration Act, we report that, in our opinion, the accounting principles in IFRSs have been applied on a basis consistent with that of the preceding year.
Responsibilities of Management for Compliance with Specified Authorities
Management is responsible for Canada Mortgage and Housing Corporation’s compliance with the specified authorities named above, and for such internal control as management determines is necessary to enable Canada Mortgage and Housing Corporation to comply with the specified authorities.
Auditor’s Responsibilities for the Audit of Compliance with Specified Authorities
Our audit responsibilities include planning and performing procedures to provide an audit opinion and reporting on whether the transactions coming to our notice during the audit of the consolidated financial statements are in compliance with the specified authorities referred to above.

Riowen Yves Abgrall, CPA, CA
Principal
for the Interim Auditor General of Canada

Chartered Professional Accountants
Licensed Public Accountants
Ottawa, Canada
25 March 2020
A Commitment to Affordability | 2019 Annual Report 45
Consolidated Balance Sheet
As at 31 December
| (in millions of Canadian dollars)
|
Notes
|
2019
|
2018
| |||||||||
Assets | ||||||||||||
Cash and cash equivalents | 12 | 922 | 837 | |||||||||
Accrued interest receivable | 737 | 724 | ||||||||||
Investment securities: | 13 | |||||||||||
Fair value through profit or loss | 809 | 1,591 | ||||||||||
Fair value through other comprehensive income | 20,633 | 18,164 | ||||||||||
Amortized cost | 947 | - | ||||||||||
Derivatives | 16 | 68 | 33 | |||||||||
Due from the Government of Canada | 6 | 249 | 158 | |||||||||
Loans: | 14 | |||||||||||
Fair value through profit or loss | 1,331 | 2,040 | ||||||||||
Amortized cost | 249,439 | 239,162 | ||||||||||
Accounts receivable and other assets | 21 | 848 | 856 | |||||||||
Investment property | 22 | 276 | 311 | |||||||||
| 276,259 | 263,876 | |||||||||||
Liabilities | ||||||||||||
Securities sold under repurchase agreements | - | 280 | ||||||||||
Accounts payable and other liabilities | 23 | 796 | 567 | |||||||||
Accrued interest payable | 591 | 546 | ||||||||||
Dividends payable | 10 | - | 675 | |||||||||
Derivatives | 16 | 8 | 117 | |||||||||
Provision for claims | 7 | 407 | 451 | |||||||||
Borrowings: | 15 | |||||||||||
Fair value through profit or loss | 2,374 | 3,430 | ||||||||||
Amortized cost | 249,741 | 235,525 | ||||||||||
Defined benefit plans liability | 24 | 449 | 354 | |||||||||
Unearned premiums and fees | 7, 8 | 7,151 | 6,948 | |||||||||
Deferred income tax liabilities | 25 | 129 | 102 | |||||||||
| 261,646 | 248,995 | |||||||||||
Commitments and contingent liabilities | 27 | |||||||||||
Equity of Canada | 10 | |||||||||||
Contributed capital | 25 | 25 | ||||||||||
Accumulated other comprehensive income or loss | 247 | 5 | ||||||||||
Retained earnings | 14,341 | 14,851 | ||||||||||
| 14,613 | 14,881 | |||||||||||
| 276,259 | 263,876 | |||||||||||
The accompanying notes are an integral part of these consolidated financial statements.
|
| |
Derek Ballantyne |
Evan Siddall, BA, LL.B. | |
Chairperson |
President and Chief Executive Officer |
46
Consolidated Statement of
Income and Comprehensive Income
Year ended 31 December
| (in millions of Canadian dollars)
|
Notes
|
2019
|
2018
| |||||||||
Interest income | 17 | 5,447 | 5,294 | |||||||||
Interest expense | 17 | 5,379 | 5,170 | |||||||||
Net interest income | 68 | 124 | ||||||||||
Government funding for housing programs | 6 | 2,039 | 2,336 | |||||||||
Premiums and fees earned | 7, 8 | 2,011 | 1,909 | |||||||||
Investment income | 17 | 483 | 513 | |||||||||
Net gains (losses) on financial instruments | 17 | 112 | (97) | |||||||||
Other income | 24 | 38 | ||||||||||
Total revenues and government funding | 4,737 | 4,823 | ||||||||||
Non-interest expenses | ||||||||||||
Housing programs | 6 | 1,829 | 2,149 | |||||||||
Insurance claims | 191 | 210 | ||||||||||
Operating expenses | 28 | 613 | 585 | |||||||||
Total expenses | 2,633 | 2,944 | ||||||||||
Income before income taxes | 2,104 | 1,879 | ||||||||||
Income taxes | 25 | 524 | 462 | |||||||||
Net income | 1,580 | 1,417 | ||||||||||
Other comprehensive income (loss), net of tax | ||||||||||||
Items that will be subsequently reclassified to net income | ||||||||||||
Net unrealized gains (losses) from debt instruments held at fair value through other comprehensive income | 219 | (103) | ||||||||||
Reclassification of losses (gains) on debt instruments held at fair value through other comprehensive income on disposal in the year | 23 | (14) | ||||||||||
Total items that will be subsequently reclassified to net income | 242 | (117) | ||||||||||
Items that will not be subsequently reclassified to net income | ||||||||||||
Net unrealized losses from equity securities designated at fair value through other comprehensive income | (2) | (9) | ||||||||||
Remeasurement gains (losses) on defined benefit plans | 24, 25 | (68) | 79 | |||||||||
Total items that will not be subsequently reclassified to net income | (70) | 70 | ||||||||||
Total other comprehensive income (loss), net of tax | 172 | (47) | ||||||||||
Comprehensive income | 1,752 | 1,370 | ||||||||||
The accompanying notes are in integral part of these consolidated financial statements.
A Commitment to Affordability | 2019 Annual Report 47
Consolidated Statement of Equity of Canada
Year ended 31 December
| (in millions of Canadian dollars)
|
Notes
|
2019
|
2018
| |||||||||
Contributed capital | 25 | 25 | ||||||||||
Accumulated other comprehensive income (loss) | ||||||||||||
Balance at beginning of year | 5 | 490 | ||||||||||
Impact of adopting IFRS 9 | - | (368) | ||||||||||
Restated opening balance | 5 | 122 | ||||||||||
Other comprehensive income (loss) | 242 | (117) | ||||||||||
Balance at end of year | 247 | 5 | ||||||||||
Retained earnings | ||||||||||||
Balance at beginning of year | 14,851 | 17,226 | ||||||||||
Impact of adopting IFRS 9 | - | 366 | ||||||||||
Impact of adopting IFRS 15 | - | (53) | ||||||||||
Restated opening balance | 14,851 | 17,539 | ||||||||||
Net income | 1,580 | 1,417 | ||||||||||
Other comprehensive income (loss) | (70) | 70 | ||||||||||
Dividends | 10 | (2,020) | (4,175) | |||||||||
Balance at end of year | 14,341 | 14,851 | ||||||||||
Equity of Canada | 10 | 14,613 | 14,881 | |||||||||
The accompanying notes are an integral part of these consolidated financial statements.
48
Consolidated Statement of Cash Flows
Year ended 31 December
| (in millions of Canadian dollars)
|
Notes
|
2019
|
2018
| |||||||||
Cash flows from operating activities | ||||||||||||
Net income | 1,580 | 1,417 | ||||||||||
Adjustments to determine net cash flows from operating activities | ||||||||||||
Amortization of premiums and discounts on financial instruments | 66 | 105 | ||||||||||
Net gains (losses) on financial instruments | (6) | (71) | ||||||||||
Deferred income taxes | 52 | 10 | ||||||||||
Net unrealized gains on investment property | 22 | (3) | - | |||||||||
Changes in operating assets and liabilities | ||||||||||||
Derivatives | (144) | 106 | ||||||||||
Accrued interest receivable | (13) | (19) | ||||||||||
Due from the Government of Canada | (86) | (33) | ||||||||||
Accounts receivable and other assets | 8 | (106) | ||||||||||
Accounts payable and other liabilities | 72 | 5 | ||||||||||
Accrued interest payable | 45 | 1 | ||||||||||
Provision for claims | (44) | (104) | ||||||||||
Defined benefit plans liability | 14 | (1) | ||||||||||
Unearned premiums and fees | 203 | 189 | ||||||||||
Other | 1 | (8) | ||||||||||
Loans | 14 | |||||||||||
Repayments | 31,890 | 39,826 | ||||||||||
Disbursements | (41,398) | (40,003) | ||||||||||
Borrowings | 15 | |||||||||||
Repayments | (33,821) | (40,859) | ||||||||||
Issuances | 44,110 | 41,039 | ||||||||||
| 2,526 | 1,494 | |||||||||||
Cash flows from investing activities | ||||||||||||
Investment securities | ||||||||||||
Sales and maturities | 9,468 | 10,244 | ||||||||||
Purchases | (8,972) | (6,270) | ||||||||||
Investment property | 22 | |||||||||||
Additions | - | (1) | ||||||||||
Disposals | 38 | - | ||||||||||
Securities sold under repurchase agreements | (280) | (17) | ||||||||||
| 254 | 3,956 | |||||||||||
Cash flows from financing activities | ||||||||||||
Dividends paid | 10 | (2,695) | (5,500) | |||||||||
Change in cash and cash equivalents | 85 | (50) | ||||||||||
Cash and cash equivalents | ||||||||||||
Beginning of year | 837 | 887 | ||||||||||
End of year | 922 | 837 | ||||||||||
Represented by | ||||||||||||
Cash | - | 1 | ||||||||||
Cash equivalents | 922 | 836 | ||||||||||
| 922 | 837 | |||||||||||
Supplementary disclosure of cash flows from operating activities | ||||||||||||
Amount of interest received during the year | 6,243 | 6,057 | ||||||||||
Amount of interest paid during the year | 5,616 | 5,372 | ||||||||||
Amount of dividends received during the year | 10 | 34 | ||||||||||
Amount of income taxes paid during the year | 330 | 478 | ||||||||||
The accompanying notes are an integral part of these consolidated financial statements.
A Commitment to Affordability | 2019 Annual Report 49
Notes to Consolidated Financial Statements
Year ended 31 December 2019
1. CORPORATE INFORMATION
Canada Mortgage and Housing Corporation (CMHC or Corporation) was established in Canada as a Crown corporation in 1946 by the Canada Mortgage and Housing Corporation Act (CMHC Act) to carry out the provisions of the National Housing Act (NHA). We are also subject to Part X of the Financial Administration Act (FAA) by virtue of being listed in Part 1 of Schedule III, wholly owned by the Government of Canada (Government), and an agent Crown corporation. Our National Office is located at 700 Montreal Road, Ottawa, Ontario, Canada, K1A 0P7.
Our mandate, as set out in the NHA, is to promote the construction of new houses, the repair and modernization of existing houses, and the improvement of housing and living conditions. In relation to financing for housing, the NHA’s purpose is to promote housing affordability and choice; to facilitate access to, and competition and efficiency in the provision of, housing finance; to protect the availability of adequate funding for housing; and generally to contribute to the well-being of the housing sector. In addition, we have the following objectives in carrying out any activities related to mortgage insurance and guarantee programs and in administering the Canadian covered bond legal framework: (a) to promote the efficient functioning and competitiveness of the housing finance market; (b) to promote and contribute to the stability of the financial system, including the housing market; and (c) to have due regard to the Corporation’s exposure to loss. We deliver on our mandate through our reportable segments: Assisted Housing (AH), Mortgage Insurance (MI) and Mortgage Funding (MF). These activities are supported by our Market Analysis and Research Activity and by our infrastructure of People and Processes.
Within the Public Accounts of Canada, our annual consolidated net income reduces the Government’s annual deficit; our consolidated retained earnings and accumulated other comprehensive income (AOCI) reduce the Government’s accumulated deficit.
The following directives were issued to CMHC pursuant to Section 89 of the FAA:
In September 2008, CMHC, together with a number of other Crown corporations, was issued a directive (P.C. 2008-1598) requiring due consideration to the personal integrity of those to whom it lends or provides benefits. We continue to meet the requirements of this directive.
In December 2014, CMHC was issued a directive (P.C. 2014-1380) intended to ensure that Crown corporations’ pension plans provide a 50:50 current service cost-sharing ratio between employees and employer for pension contributions to be phased in for all members by 31 December 2017. Our new defined benefit plan pension plan effective 1 January 2018 is in line with this directive.
In July 2015, CMHC was issued a directive (P.C. 2015-1106) directing Crown corporations to align their travel, hospitality, conference and event expenditure policies, guidelines and practices with those of the Treasury Board of Canada Secretariat (TBS) in a manner consistent with their legal obligations and to report on the implementation of this directive in the Corporation’s next corporate plan. Our analysis found that our policies were generally aligned with the TBS policies. During 2017, further updates were made by the TBS and as such, our policies were updated effective January 2019 to ensure continued compliance.
2. BASIS OF PREPARATION AND SIGNIFICANT ACCOUNTING POLICIES
Basis of preparation
Our consolidated financial statements have been prepared in accordance with International Financial Reporting Standards (IFRS) as issued by the International Accounting Standards Board (IASB). Except as identified immediately below, we have applied the same accounting policies consistently to all periods presented.
Our consolidated financial statements were approved by the Board of Directors on 25 March 2020.
50
Accounting policy changes
Effective 1 January 2019, we adopted IFRS 16 Leases, which replaces IAS 17 Leases and related interpretations (collectively, IAS 17), as well as IFRIC 23 Uncertainty over Income Tax Treatments. As we have not restated comparative information for 2018, we have disclosed both our 2019 and 2018 accounting policies where applicable in this note. Refer to Note 3 for further information on our adoption of these accounting standards.
Measurement basis
Our consolidated financial statements have been prepared on a going concern basis using a historical cost basis except for the following items in the consolidated balance sheet:
| · | Financial assets at fair value through profit or loss (FVTPL) or fair value through other comprehensive income (FVOCI), as well as liabilities at FVTPL, are measured at fair value. |
| · | Investment property is measured at fair value. |
| · | Defined benefit liabilities for post-employment benefit plans are recognized at the present value of the defined benefit obligations, net of the fair value of plan assets. |
| · | Provision for claims is recognized on an actuarial present value basis. |
Functional currency
Our consolidated financial statements are stated in millions of Canadian dollars, unless otherwise indicated, which is the Corporation’s functional currency.
Basis of consolidation
As required by IFRS 10 Consolidated Financial Statements, we consolidate the accounts of CMHC with those of Canada Housing Trust (CHT), as we control its activities.
We control an investee if, and only if, we have power over the investee (that is, existing rights that give us the current ability to direct the relevant activities of the investee); exposure, or rights, to variable returns from our involvement; and the ability to use our power over the investee to affect our returns.
We reassess whether or not we control an investee if facts and circumstances indicate that there are changes to one or more of the three elements of control.
Inter-segment balances and transactions have been eliminated.
Foreign currency translation
Monetary assets and liabilities denominated in foreign currencies are translated into Canadian dollars at exchange rates prevailing at the balance sheet date. Exchange gains and losses resulting from the translation of foreign denominated balances are included in net gains (losses) on financial instruments. Purchases and sales of foreign securities and the related income are translated into Canadian dollars at the exchange rates prevailing on the respective dates of the transactions.
Significant accounting policies
The following summarizes the significant accounting policies used in the preparation of our consolidated financial statements.
Government funding and housing programs expenses
The Assisted Housing Activity receives government funding for housing programs and initiatives.
Government funding for housing programs
Government funding is recognized when there is reasonable assurance that it will be received and all attached conditions will be complied with. It is recognized in net income over the same period as the related housing programs expenses.
A Commitment to Affordability | 2019 Annual Report 51
Housing programs expenses
Housing programs expenses are recorded on an accrual basis.
Expenses incurred, but not yet reimbursed, are included in due from the Government of Canada.
Mortgage insurance
Product classification
We classify our mortgage insurance as an insurance contract as the lender faces uncertainty with regard to potential borrower default on a mortgage and therefore pays a premium to transfer the risk to us. If the borrower defaults, the claim is significantly larger than the actual premium. Such contracts remain insurance contracts until the underlying insured mortgages are fully repaid or there is a claim.
Premium revenue earned and unearned premiums
Mortgage insurance premiums are due at the inception of the mortgage being insured, at which time they are deferred as unearned premiums and included in unearned premiums and fees. The majority of mortgage insurance issued to date have amortizations of 25 years or less. Unearned premiums are recognized as revenue over the period covered by the insurance contract using earning factors which reflect claim occurrence patterns. The earning patterns are selected based on the principle that premiums would be earned at the same pace as claims are expected to be incurred.
Unearned premiums represent the unamortized portion of the policy premiums for insured loans outstanding at the balance sheet date and therefore relate to claims that may occur from the balance sheet date to the termination of the insurance contract.
Fees
We offer Approved Lenders a service for low loan-to-value applications for transactional homeowners whereby we assess an application using our loan assessment platform which provides Approved Lenders with an insurable or non-insurable result. There is no mortgage insurance coverage associated with this assessment. These fees are recognized immediately as revenue once the decision is rendered.
Application fees designed to recover part or all acquisition costs associated with issuing mortgage insurance policies related to multi-unit residential loans are deferred and amortized on the same basis as the related premiums.
Provision for claims
The provision for claims represents an estimate for expected claims and the related settlement expenses, net of the related expected property sale proceeds and borrower recoveries, for defaults from the mortgage insurance business that have occurred on or before the balance sheet date. This provision includes claims that are incurred but not reported (IBNR), claims that are incurred but not enough reported (IBNER), claims in process (CIP), and claims on loans made under various social housing (SH) programs as well as loans financed by index-linked mortgages (ILM) under the Federal Co-operative Housing Program (SH and ILM). The provision takes into consideration the time value of money and includes an explicit provision for adverse deviation.
A change in the estimated provision for claims is recorded in insurance claims expense in the period in which it occurs.
For further details on the estimates and assumptions used to calculate the provision, see Note 4.
Insurance policy liability adequacy
Liability adequacy tests are performed at each balance sheet date as part of the actuarial valuation to ensure the adequacy of insurance policy liabilities net of deferred acquisition costs (DAC) assets with respect to unearned premiums. Current best estimates of future contractual cash flows, claims handling and administration costs, and investment returns from the assets backing the liabilities are taken into account in the tests. There is a deficiency if the outcome of the liability adequacy test exceeds the unearned premiums balance. In such a case, DAC assets are written off first, and insurance liabilities are increased once the DAC assets are written off in full. Any premium deficiency is immediately recognized in insurance claims expense.
52
Deferred acquisition costs
DAC generally consist of policy issuance costs relating to the underwriting of insurance contracts. A portion of the acquisition costs relating to the unearned premiums is deferred and amortized over the estimated lives of the relevant contracts using the same earning factors as the unearned premiums. DAC assets are included in accounts receivable and other assets and amortization is recorded in operating expenses.
Net estimated borrower recoveries
We estimate the net borrower recoveries related to claims paid based on historical data in accordance with Canadian accepted actuarial practice on an annual basis. Changes to the estimated borrower recovery balance are recorded in insurance claims expense in the year in which they are determined. Net estimated borrower recoveries are included in accounts receivable and other assets.
Government of Canada fees for risk exposure
We pay fees to the Department of Finance to compensate for mortgage insurance risks. These fees are deferred in accounts receivable and other assets and recognized in operating expenses over the period covered by the insurance contract using the same earning factors as the unearned premiums. The fees are payable at the rate of 3.25% of premiums written during the year and an additional 0.1% on new portfolio insurance written.
Timely payment guarantees (TPG)
Classification
Financial guarantee contracts are defined as contracts that require the issuer to make specified payments to reimburse the holder for a loss it incurs because a specified debtor fails to make payment when due. We classify the TPG for National Housing Act Mortgage-Backed Securities (NHA MBS) and Canada Mortgage Bonds (CMB) as financial guarantee contracts. Such contracts remain financial guarantee contracts until all rights and obligations are extinguished or expire.
Recognition and measurement
TPG and application fees are initially recognized in unearned premiums and fees at fair value (the premium received). Subsequently, they are measured at the higher of i) the amount initially recognized less the amortization of guarantee and application fee revenue; and ii) the amount of the allowance for expected credit losses (ECL). The fees are recognized into premiums and fees earned on a straight-line basis over the expected life (typically the contractual life) of the related NHA MBS or CMB. All fees are received prior to the issuance of the corresponding securities.
Government of Canada guarantee fees
We pay guarantee fees to the Department of Finance to compensate for TPG risks. These fees are deferred in accounts receivable and other assets and recognized in operating expenses on a straight-line basis over the period covered by the guarantee. These fees are payable at a rate of 0.075% of CMB issuances.
Financial instruments
Classification and measurement of financial instruments
We classify our financial assets in the following categories: financial assets at FVTPL, FVOCI and amortized cost. Classification is determined at initial recognition based on our business model for managing the asset and the contractual cash flow characteristics of the asset.
Financial liabilities are classified as either financial liabilities at FVTPL or amortized cost, and changes in fair value of liabilities designated at FVTPL due to our own credit risk are presented in other comprehensive income (OCI).
We use settlement date accounting for purchases and sales of financial assets and financial liabilities, and we recognize realized gains and losses on sales on a weighted average cost basis.
A Commitment to Affordability | 2019 Annual Report 53
The following table presents a description of our financial instruments along with their classification under IFRS 9 and the criteria for classifying them as such:
Classification | Financial Instruments (Activity)1 | Description | Criteria and Accounting Treatment | |||
Financial assets at amortized cost | Cash and cash equivalents (AH, MI, MF)
Securities purchased under resale agreements (Reverse Repurchase Agreements) (AH, MI)
Investment securities (AH)
Loans – CMB Program (MF)
Loans – Lending Programs (AH)
Loans (MI) | Highly liquid investments with a term to maturity of 98 days or less from the date of acquisition that are readily convertible to known amounts of cash and which are subject to an insignificant risk of change in value.
Purchase of securities, typically Government treasury bills or bonds, with the commitment to resell the securities to the original seller at a specified price and future date in the near term.
Consists of Corporate, Federal, Provincial and Sovereign debt instruments.
Amounts due from Canadian financial institutions as a result of the sale of their beneficial interest in NHA MBS to CHT.
Loans not economically hedged within our AH Activity.
Mortgages or loans (workouts) that benefit from the MI- supported default management activities that enable borrowers to work through their financial difficulties. | Financial assets are classified at amortized cost if the assets:
a) are held within a business model whose objective is to collect contractual cash flows;
b) generate cash flows on specified dates that are solely payment of principal and interest (SPPI); and
c) have not been designated as FVTPL in order to eliminate or significantly reduce an accounting mismatch that would otherwise arise from classifying them as at amortized cost.
Financial assets at amortized cost are initially recognized at fair value plus transaction costs. They are subsequently measured at amortized cost using the effective interest rate method (EIRM), net of an allowance for ECL.
Interest income is recognized using the EIRM in interest income in AH and investment income in MI and MF.
ECL on financial assets at amortized cost are recognized in net gains (losses) on financial instruments in AH and insurance claims in MI.
Gains and losses arising on derecognition are recognized directly in net gains (losses) on financial instruments, together with foreign exchange gains and losses.
For certain lending program loans originated from 1946 to 1984 through provisions of the NHA, interest rate losses from the loans having lower interest rates than the related borrowings are reimbursed through government funding. In assessing the fair value of these loans at initial recognition, the continued receipt of the government funding in the future is assumed.
| |||
Debt |
Cash equivalents (MI, MF)
Investment Securities – |
Highly liquid investments
Consists of Corporate, |
Debt instruments are classified as at FVOCI if the
| |||
a) are held within a business model whose objective is achieved by collecting contractual cash flows and selling assets;
| ||||||
b) generate cash flows on specified dates that are SPPI; and
| ||||||
c) have not been designated as FVTPL in order to eliminate or significantly reduce an accounting mismatch that would otherwise arise from classifying them as at FVOCI. | ||||||
Financial assets at FVOCI are initially recognized at fair value plus transaction costs. They are subsequently measured at fair value. Unrealized gains and losses arising from changes in fair value are recorded in OCI until the financial asset is derecognized, at which point, cumulative gains or losses previously recognized in OCI are reclassified from AOCI to net gains (losses) on financial instruments. Unrealized foreign exchange gains (losses) are recognized in net gains (losses) on financial instruments. | ||||||
Interest income is recognized using the EIRM in investment income. | ||||||
The cumulative ECL allowance on financial assets held at FVOCI is recorded in OCI and does not reduce the carrying amount of the financial asset. The change in the ECL allowance is recognized in net gains (losses) on financial instruments.
| ||||||
| 1 | Denotes in which Activity we hold the instruments: AH, MI or MF. |
54
Classification | Financial Instruments (Activity)1 | Description | Criteria and Accounting Treatment | |||
Financial assets at FVTPL | Cash equivalents, loans, investment securities designated at FVTPL (AH) | For certain portfolios of loans and associated borrowings originated prior to August 2016, the AH Activity uses derivatives to manage refinancing and reinvestment risks, as well as mismatches between the timing of receipts from assets and payments of liabilities. These assets form part of the lending economic hedging structure and are designated at FVTPL. | Financial assets that do not meet the criteria for classification as financial assets at amortized cost or financial assets at FVOCI are classified as at FVTPL, unless an irrevocable election has been made at initial recognition for certain equity investments to have their changes in fair value be presented in OCI.
Financial assets at FVTPL include any financial assets whose contractual cash flows are not SPPI, or any financial assets that are not held within a business model whose objective is achieved by collecting contractual cash flows or collecting cash flows and selling assets.
| |||
Derivatives – Interest rate swaps (AH) and FX contracts (MI) | Interest rate swaps and foreign exchange contracts used to economically hedge foreign exchange risks on US dollar denominated debt instruments. | Financial assets at FVTPL also include derivatives or instruments that have been irrevocably designated upon initial recognition as at FVTPL in order to eliminate or significantly reduce an accounting mismatch that would otherwise arise from classifying them in those categories.
| ||||
Investment Securities – Common equity securities and limited partnership units (MI)
Investment Securities – debt instruments (MI)
Loans (AH, MI) | Classified at FVTPL.
Subordinated debt securities whose contractual cash flows do not give rise to cash flows that are SPPI.
Loans including those with interest adjustment clauses, those for which we only expect to recover the value of the underlying collateral, those that are economically hedged. | Financial assets at FVTPL are initially recognized and subsequently measured at fair value. Unrealized gains and losses arising from changes in fair value and gains and losses realized on disposition are recorded in net gains (losses) on financial instruments. Transaction costs are recognized in net gains (losses) on financial instruments as incurred.
Interest income and dividend income are recognized in investment income.
ECL are not recognized on financial instruments measured at FVTPL. | ||||
Financial liabilities at FVTPL | Borrowings (AH – Lending programs) | Borrowings that are economically hedged as part of our lending hedging structure. | A financial liability is classified at FVTPL if it is held for trading or designated as at FVTPL. | |||
A financial liability may be irrevocably designated upon initial recognition as at FVTPL if:
| ||||||
a) doing so eliminates or reduces significantly an accounting mismatch; or
| ||||||
b) its performance is evaluated on a fair value basis in accordance with risk management policies.
| ||||||
| Unrealized gains and losses arising from changes in fair value are recognized in net gains (losses) on financial instruments except for changes in fair value attributable to an entity’s own credit risk for financial liabilities designated at FVTPL. These changes are recognized in OCI unless doing so would create an accounting mismatch, in which case the entire fair value change is presented in profit or loss. | ||||||
| 1 | Denotes in which Activity we hold the instruments: AH, MI or MF. |
A Commitment to Affordability | 2019 Annual Report 55
Classification
| Financial Instruments
| Description
| Criteria and Accounting Treatment
| |||
Financial liabilities at amortized cost |
Borrowings – CMB (MF) |
Interest-bearing bullet bonds issued by CHT and guaranteed by CMHC. See below this table for further details about CMB.
|
Financial liabilities are classified at amortized cost, unless they have been classified at FVTPL.
Financial liabilities are initially recognized at fair value plus transaction costs. They are subsequently measured at amortized cost using the EIRM, with interest expense recorded in interest expense in AH and MF and investment income in MI. | |||
Borrowings from the Government of Canada (AH) | Borrowings incurred to fund loans in the AH Activity that are not part of the lending hedging structure.
| |||||
Securities sold under repurchase agreements (MI) | Sale of securities with the commitment to repurchase the securities from the original buyer at a specified price and future date in the near term. Proceeds received from these agreements are generally invested in Reverse Repurchase Agreements or cash equivalents for the purpose of generating additional income. These transactions are entered into simultaneously with matching terms to maturity.
|
| 1 | Denotes in which Activity we hold the instruments: AH, MI or MF. |
Classification and measurement of debt instruments
The classification and measurement of debt instruments is based on the business model for managing the assets and whether contractual cash flows are SPPI.
Business model assessment
The business model reflects how we manage assets in order to generate cash flows. That is, whether the objective is solely to collect contractual cash flows, or to collect both contractual cash flows and cash flows arising from the sale of assets. If neither is applicable, then the financial asset is measured at FVTPL. We assess our business models at a level that reflects how our financial instruments are managed to achieve our business objectives. This assessment begins at the operating segment level, and where applicable, by sub-portfolios of instruments that are managed together within a particular activity to achieve common business objectives.
We perform our business model assessment based on the following main criteria:
| · | Management’s strategic objectives of the business model and how these objectives are carried out in practice. |
| · | How performance of the business model is evaluated and reported to key management personnel. |
| · | The risks that affect the performance of the business model and how we manage those risks. Key risks include market, credit, and liquidity risks as described in detail in Notes 18, 19 and 20 respectively. |
| · | How managers of the business model are compensated. |
| · | The frequency, value and timing of historical sales activity and expectations for future sales activities. |
SPPI assessment
We assess whether the cash flows of our debt instruments meet the SPPI criteria based on the asset’s contractual terms. For this assessment, we define principal as the fair value of the asset upon initial recognition and interest as consideration for the time value of money, the credit risk of the transaction and for other lending risks and costs as well as a profit margin.
Contractual terms that introduce exposure to risk or volatility to the contractual cash flows that are inconsistent with a basic lending agreement do not satisfy the SPPI requirement. Equity instruments and derivatives fail the SPPI test.
56
Financial liabilities at amortized cost
Canada Mortgage Bonds
CMB are interest-bearing bullet bonds issued by CHT and guaranteed by CMHC. Coupon interest payments are made semi-annually for fixed rate CMB and quarterly for floating rate CMB. Principal repayments on the bonds are made at maturity. The Approved MBS Sellers reimburse CHT for the cost of arranging financing, including the fees paid to underwriters and others for the distribution of CMB. Transaction costs directly attributable to the issuance of CMB net of reimbursements thereof are included in the amount initially recognized and amortized to interest expense using the effective interest method.
We may purchase and resell CMB in the market for investment purposes. Purchases are treated as retirements of debt with the difference between the purchase price and the carrying value of the CMB being recognized as a gain or loss in net gains (losses) on financial instruments. Subsequent sales are treated as re-issuance of the debt with gains and losses deferred and amortized over the remaining life of the CMB sold. When CMHC holds a CMB to maturity or acquires CMB in the primary market, the related cash flows are excluded from the consolidated statement of cash flows as they are not considered external cash flows to the consolidated entity.
Measurement of expected credit losses
Credit losses are defined as the difference between all contractual cash flows due to the Corporation in accordance with the contract, and the cash flows that we expect to receive (cash shortfalls), discounted at the original effective interest rate (or credit-adjusted effective interest rate for purchased or originated credit-impaired assets). ECL are the weighted average of credit losses determined by evaluating a range of possible outcomes using reasonable, supportable information about past events and current and forecasted future economic conditions.
The Corporation has developed an impairment model to determine the allowance for ECL on our debt securities classified as amortized cost or FVOCI and our financial guarantee contracts. We determine an allowance for ECL at initial recognition of the financial instrument (or the date we become party to a financial guarantee) that is updated at each balance sheet date throughout the life of the instrument.
The ECL allowance is based on the ECL over the life of the financial instrument (lifetime ECL), unless there has been no significant increase in credit risk (SICR) since initial recognition, in which case the ECL allowance is measured at an amount equal to the portion of lifetime ECL that result from default events possible within the next 12 months (12-month ECL). ECL are determined based on three main drivers: probability of default, loss given default and exposure at default.
| • | Probability of default (PD): a point-in-time estimate of the likelihood of default either over the next 12 months (12-month ECL) or over the remaining life of the instrument (lifetime ECL). Our PDs are determined by mapping internal credit ratings to point-in-time PD tables based on statistical models derived from a large data set of publicly traded entities. |
| • | Loss given default (LGD): the percentage of the gross carrying amount of the instrument that will be lost on default at a given point in time. It is based on the difference between contractual cash flows due and those expected to be received, including the realization of collateral. |
| • | Exposure at default (EAD): the gross carrying amount of the instrument at a given point in time, which is calculated as the present value of the outstanding contractual cash flows using the EIRM. |
| • | The ECL is calculated using a scenario-based approach where, for each scenario, the PD, LGD and EAD are projected for each individual exposure at each cash flow date over the next 12 months (12-month ECL) or remaining life of the instrument (lifetime ECL). The components are multiplied together at each future date and discounted back using the original effective interest rate to the reporting date and summed. A probability-weighted average ECL is then determined across the multiple scenarios. We have modelled all ECL at the individual instrument level. |
Significant increase in credit risk
We have established a policy to perform an assessment at each balance sheet date of whether the instrument’s credit risk has increased significantly since initial recognition (or the date we become party to a financial guarantee). Based on this assessment, we group the instruments into the following categories:
| • | Stage 1: instruments that have not experienced a SICR since initial recognition. ECL are recognized based on 12-month ECL; |
A Commitment to Affordability | 2019 Annual Report 57
| • | Stage 2: instruments that have experienced a SICR since initial recognition. In subsequent periods, if the credit risk of an instrument has improved such that there is no longer a SICR since initial recognition, the ECL allowance will revert to stage 1. ECL are recognized based on lifetime ECL; |
| • | Stage 3: instruments that are considered credit-impaired as one or more events that have a detrimental impact on estimated future cash flows have occurred. ECL are recognized based on lifetime ECL; |
| • | Purchased or originated credit-impaired (POCI) – instruments that are credit impaired on initial recognition. ECL are recognized based on lifetime ECL. |
Interest revenue on stage 3 or POCI financial instruments is calculated based on the carrying amount of the asset, net of the loss allowance, rather than the gross carrying amount.
For instruments that we assess as having low credit risk at the reporting date, we applied the low credit risk exemption (stage 1) and have presumed that credit risk has not increased significantly since initial recognition. We use our internal credit ratings at the reporting date to assess whether the instrument has low credit risk. Our internal ratings are based on internal assessments of counterparty creditworthiness and generally correspond to those provided by credit rating agencies. We consider an instrument to have low credit risk when our internal rating is BBB- or higher.
We apply a backstop to all financial instruments for which the counterparty is more than 30 days past due on its contractual payments, whereby we consider the instrument to have experienced a SICR.
We consider an instrument in default, which is fully aligned with the definition of credit-impaired, when it meets the following criteria:
| • | Observable data exists that has a detrimental impact on the estimated future cash flows such as: |
– significant financial difficulty of the issuer;
– the granting of a new loan to assist the borrower work through financial difficulties;
– it becomes probable that the issuer will enter bankruptcy or other financial reorganization; and
– the disappearance of an active market due to financial difficulties.
| • | Borrower becomes 90 days past due on its contractual payments. |
An instrument is no longer considered impaired when all past due amounts, including interest, have been recovered and it is determined that the principal and interest are fully collectable in accordance with the original contractual terms of the instrument. We write off instruments, either partially or in full, against the related ECL allowance when we judge that there is no realistic prospect of future recovery.
In addition to the 30-day backstop discussed above, we apply the following policies in determining whether there has been a SICR on our financial instruments subject to ECL:
Debt instruments at amortized cost/FVOCI
The Corporation’s credit risk policies restrict investments in debt instruments to an internal rating of BBB- or higher and therefore all debt instruments held are presumed to have low credit risk and we have applied the low credit risk exemption (stage 1).
Loans under the CMB program
Loans under the CMB program represent amounts due from Canadian financial institutions as a result of the sale of their beneficial interest in NHA MBS securities to us. The loans are collateralized by the NHA MBS and associated reinvestment securities acquired in the transactions. The NHA MBS, reinvestment assets and swaps represent the sole source of repayment on the loans, and thus directly affect the probability of a default occurring. Therefore, our assessment of SICR is based on the credit risk of these supporting assets.
The supporting assets are limited to NHA MBS and reinvestment assets rated R-1 (high) or AAA and swap counterparties with a minimum rating of BBB-. As such, all loans under the CMB program are presumed to have low credit risk and we have applied the low credit risk exemption (stage 1).
58
Assisted Housing Activity loans/Mortgage Insurance Activity loans
Loans with an internal rating of BBB- or higher are presumed to have low credit risk and the low credit risk exemption has been applied (stage 1). These loans consist of those issued to municipalities under the Municipal Infrastructure Lending Program and loans indemnified by provinces and territories through provisions under Social Housing Agreements (SHAs) where the credit rating of the province or territory is considered in the SICR assessment. This credit enhancement is relevant to assessing changes in credit risk since it directly impacts the probability of default. The province or territory is responsible for collecting loan payments from the borrower and, in turn, makes all payments to CMHC directly in accordance with the contractual terms of the loan on behalf of the borrower. These payments are made to CMHC, irrespective of the borrower’s payment status.
All remaining loans issued under our Assisted Housing or Mortgage Insurance activities have not been internally rated and therefore the low credit risk presumption is not used. Our SICR assessment of these loans is based on the following criteria, which are primarily based on days past due:
| • | Stage 1: All current loans to 30 days past due. |
| • | Stage 2: Loans between 30 and 90 days past due. |
| • | Stage 3: Loans more than 90 days past due. Also, a loan that is not past due but has been issued a workout loan to assist with financial difficulties will be considered credit impaired irrespective of days past due. |
Under the terms of certain construction loans issued by our Assisted Housing Activity or workout loans issued by our Mortgage Insurance Activity, there may be a period of time where the loan has been advanced but not under repayment and therefore days past due cannot be used in the SICR assessment. For these loans that are not under repayment, we assess SICR by applying the following criteria:
| • | Days past due on loans issued by the same borrower. |
| • | Collective assessment by reviewing past due status of borrowers with shared credit risk characteristics. |
| • | Qualitative assessment of specific indicators of the construction project, such as project delays, performance against budget and remaining costs to complete. |
Financial guarantees
Under the NHA MBS program, a financial institution (the “NHA MBS issuer”) creates a pool of eligible mortgages and sells the pool to investors. The underlying pool of mortgages is designed to provide sufficient cash flows to fund the NHA MBS. The issuer is obligated to fund any cash flow shortfalls that may arise, thus exposing the Corporation to credit risk with the underlying pool of mortgages serving as a credit enhancement. Our assessment of SICR is therefore based on both the credit risk of the issuer and the credit risk of the pool of mortgages underlying the NHA MBS. The pool of mortgages are considered low credit risk since only mortgages insured by CMHC or by approved private mortgage insurers are eligible to be pooled in NHA MBS.
Under the CMB program, the credit risk exposures are, by design, the CMB loans that are the sole source of funds to fulfill CHT’s CMB obligations. As previously discussed, the NHA MBS, reinvestment assets and swaps represent the sole source of repayment on the loans. The SICR assessment for the CMB guarantee is based on the credit risk of these supporting assets all of which have been assessed as low credit risk.
We have assessed the TPG under both the NHA MBS and CMB programs as having low credit risk and will apply the low credit risk exemption (stage 1).
Forward-looking macroeconomic variables
The Corporation has incorporated forward-looking economic information into its ECL by performing the calculation under multiple scenarios resulting in a probability-weighted average ECL based on the weightings of each scenario. We have used three sets of economic scenarios for all instruments representing a baseline, upside and downside scenario.
We performed an economic variable selection process to identify the sets of macroeconomic variables that had the highest correlation with our portfolios. This process resulted in three sets of economic variables that are most highly correlated to our portfolios dependent on the geographic and industry sector of the exposure that include the following variables: unemployment rates, oil prices, 10-year corporate bond spreads, equity index values and the CBOE Volatility Index.
A Commitment to Affordability | 2019 Annual Report 59
All macroeconomic variables are projected over a five-year period, subsequently reverting to long-run averages. Forecasts and scenarios weightings are prepared by the Corporation’s Economics team in collaboration with Risk Management Operations and are reviewed on a quarterly basis.
Canada Mortgage Bonds program
Loans in the CMB program represent amounts due from Canadian financial institutions as a result of the sale of their beneficial interest in NHA MBS securities to CMHC and are funded by the issuance of CMB. There are both fixed and floating rate loans in this category, with principal in all cases being due at maturity.
Under these arrangements, substantially all of the risks and rewards of the NHA MBS are retained by the issuers through swap agreements with the Corporation. Consequently, the NHA MBS and the reinvestment of principal proceeds distributed serve as collateral to the loans and are not recognized in the consolidated balance sheet. This collateral is however held in the name of the Corporation and represents the sole source of principal repayments for the loans. The amount due from the swap counterparties represents the interest earned on the loans and is recognized in interest income.
Investment property
Investment properties are properties held to earn rental income or for capital appreciation, or both. Investment properties are initially recognized at cost plus transaction costs. Subsequent to initial recognition, they are measured at fair value. Gains or losses arising from changes in fair value are recognized in other income in the period in which they arise.
Non-current assets held for sale
Real estate acquired by the Mortgage Insurance Activity through loan default is classified as non-current assets held for sale since its carrying amount will be recovered through a sale transaction. The criteria for held for sale classification includes our commitment to a plan to sell the selected assets and the expectation that such a sale will be completed within a 12-month period. Events or circumstances beyond our control may extend the period to complete the sale beyond one year. Such assets continue to be classified as held for sale as we remain committed to our plan to sell the asset. Non-current assets held for sale are measured at the lower of their carrying amount and their fair value less cost to sell and are included in accounts receivable and other assets. Impairment losses and any subsequent reversals are recognized in insurance claims expense in the period in which they occur. Non-current assets held for sale are not depreciated.
Pension and other post-employment benefits
We have a number of benefit arrangements which provide pension and other post-employment benefits to eligible employees. These include a federally regulated pension plan (Pension Plan), an unregistered supplemental pension plan (Supplemental Plan) and other non-pension post-employment defined benefits consisting mainly of life and medical insurance. The Supplemental Plan offers benefits in excess of statutory limits as defined under the Income Tax Act (ITA).
The Pension Plan is subject to the federal Pension Benefits Standards Act, 1985 (PBSA) and its regulations and to the ITA. Both pension plans are registered with the Office of the Superintendent of Financial Institutions (OSFI) and the Canada Revenue Agency (CRA).
Defined benefit plans
The defined benefit plans include the defined benefit Pension Plan and the defined benefit Supplemental Plan as well as the other non-pension post-employment benefits. The benefits available under both the Pension Plan and the Supplemental Plan are based on length of service and average earnings over the best consecutive five-year period.
The net defined benefit liability recognized is the present value of the obligations under the defined benefit plans less the fair value of the assets of those plans. The defined benefit plan assets are limited to the present value of any economic benefits available in the form of reductions in future contributions to these plans.
Net benefit costs of the plans include the current service costs and the interest cost on the defined benefit obligation net of the interest income on the plan assets and the gain or loss on curtailment. Net benefit costs are included in operating expenses.
Remeasurement gains and losses on defined benefit plans include actuarial gains and losses and changes in the return on plan assets (excluding net interest). They are recognized in OCI as incurred and then flow into retained earnings and are not reclassified to profit or loss in subsequent periods.
60
Income taxes
CMHC is a prescribed federal Crown corporation under Reg. 7100 of the ITA and is subject to federal income tax as a prescribed corporation for purposes of subsection 27(2) of the ITA. We are not subject to provincial income tax. CHT is subject to federal and provincial income taxes on the amount of taxable income for the period and is permitted a deduction for all amounts paid or payable to CHT’s beneficiaries in determining income for tax purposes. As all taxable income was distributed to the beneficiaries, no provision for income taxes has been reflected for CHT.
We use the liability method of accounting for income taxes. Under this method, deferred income tax assets and liabilities are recognized based on the estimated tax effect of temporary differences between the carrying value of assets and liabilities on the financial statements and their respective tax bases. The Corporation uses substantively enacted income tax rates at the balance sheet date that are expected to be in effect when the asset is realized or the liability is settled. The carrying amount of deferred income tax assets is reviewed at each balance sheet date and reduced to the extent that it is no longer probable that sufficient taxable profit will be available to allow all or part of the deferred income tax asset to be utilized.
Related party transactions
Except for funds borrowed from the Government under the Crown Borrowing Program, related party transactions are made on terms equivalent to those that prevail in arm’s length transactions. Funds borrowed under the Crown Borrowing Program included in borrowings designated at FVTPL are at below market rates. In turn, this allows us to make loans at below market rates, which reduces the Government’s cost to subsidize social housing. This generates a gain that is recognized in net gains (losses) on financial instruments at the borrowing date.
Contingent liabilities
Contingent liabilities are possible obligations whose existence will be confirmed only by uncertain future events or present obligations where the transfer of economic benefit is uncertain or cannot be reliably measured.
3. CURRENT AND FUTURE ACCOUNTING CHANGES
Current accounting changes
We actively monitor new standards and amendments to existing standards that have been issued by the IASB. There were no new or amended standards issued by the IASB that we adopted during the year ended 31 December 2019 that had an impact on our consolidated financial statements other than those discussed below.
International Financial Reporting Standard (IFRS) 16 Leases (IFRS 16)
On 1 January 2019, we adopted IFRS 16, which replaces IAS 17 Leases and related interpretations (collectively, IAS 17). As a result, on that date, we recognized assets and liabilities for leased office space in our regional offices, which we previously accounted for as operating leases under IAS 17. In addition, we now recognize depreciation and interest expense instead of operating lease expenses; the impact of this change on our total expenses is immaterial. In accordance with IFRS 16, we continue to record operating lease expenses for leases of low value or with a term of 12 months or less.
We adopted IFRS 16 using the modified retrospective approach; therefore, comparative information has not been restated and continues to be reported under IAS 17. We also applied the transition relief available whereby we did not reassess whether a contract was, or contained, a lease at the transition date.
Upon transition, we recognized right-of-use assets and lease liabilities based on the present value of the remaining lease payments. Since the interest rates implicit in the leases were not readily determinable, we discounted these payments using a weighted-average incremental borrowing rate of 2.5%. The incremental borrowing rate represents the rate we would pay if we financed a particular lease transaction using debt. Therefore, in determining this rate for each of our leases, we have considered factors, such as our credit worthiness, the lease term, the value of the leased asset, the security of the leased asset and the economic environment in which we entered into the lease.
As a result of adopting IFRS 16, we recognized right-of-use assets and lease liabilities of $62 million on 1 January 2019. These are presented in accounts receivable and other assets and accounts payable and other liabilities, respectively. Depreciation and interest expense are presented in operating expenses. There was no cumulative effect to equity from initially applying the standard.
A Commitment to Affordability | 2019 Annual Report 61
Future accounting changes
The following new standards and interpretation issued by the IASB have been assessed as having a possible impact on the Corporation in the future. We intend to adopt each of these standards and this interpretation, if applicable, as at the required effective dates indicated below and are currently assessing the impact on our consolidated financial statements.
IFRS 17 Insurance Contracts – effective date of 1 January 2021
In May 2017, the IASB issued IFRS 17 Insurance Contracts (IFRS 17), which will replace IFRS 4 Insurance Contracts. On 26 June 2019, the IASB issued an Exposure Draft (ED) containing proposed amendments responding to concerns and implementation challenges raised by stakeholders. In total, there are 12 amendments proposed to 8 areas of the standard. The ED also contains several minor adjustments to clarify wording or correct unintended consequences and several proposed changes to defined terms in the standard. The IASB staff have indicated that they plan to finalize and issue the amended standard by Q2 2020. The most notable proposed amendment to CMHC is the proposed deferral of the effective date by one year, to 1 January 2022. We are evaluating the entire suite of proposed amendments and except for the deferral, we do not expect them to have a significant impact on our implementation.
Under IFRS 17, insurance contract liabilities will include the present value of future insurance cash flows, adjusted for risk, as well as a contractual service margin and DAC, which will be released over the coverage period. Contractual service margin will represent the difference between the premium received at inception and the present value of the risk-adjusted cash flows (that is, profit to be earned in the future). If this difference is negative at inception, the insurance contract would be considered onerous and the difference immediately recorded in income. There are also revised presentation and disclosure requirements.
We have a multi-disciplinary team dedicated to analyzing and implementing the new accounting standard, and a detailed project plan is in place. We continue to evaluate where we will need to change our existing accounting and reporting processes and how this could affect our consolidated financial statements.
Conceptual Framework for Financial Reporting
In June 2018, the IASB issued the revised Conceptual Framework for Financial Reporting, replacing the previous version of the Conceptual Framework issued in 2010.
The revised Conceptual Framework has an effective date of 1 January 2020, with earlier application permitted, for companies that use the Conceptual Framework to develop accounting policies when no IFRS Standard applies to a particular transaction. The revised Conceptual Framework includes a new chapter on measurement; guidance on reporting financial performance; improved definitions and guidance, in particular the definitions of an asset and a liability; and clarifications in important areas, such as the roles of stewardship, prudence and measurement uncertainty in financial reporting.
We have completed our assessment and concluded that the revised Conceptual Framework will not have an impact on our consolidated financial statements.
4. CRITICAL JUDGMENTS IN APPLYING ACCOUNTING POLICIES
AND MAKING ESTIMATES
Judgments in applying accounting policies
In the process of applying the accounting policies, in addition to judgments regarding impairment of financial instruments discussed in Note 2, Management has made the following judgments, which have the most significant effect on the amounts recognized in our consolidated financial statements.
Consolidation
Significant judgments are applied in the assessment of whether the substance of the relationship between CMHC and CHT indicates that CMHC controls CHT. We guarantee the timely payment of principal and interest on the CMB, and choose when to provide that guarantee. CHT cannot undertake new business (for example, issue new bonds) without the benefit of a guarantee, and its only available guarantor at present is CMHC. Within that context, we have direct influence on the activities of CHT and can use this influence to manage its exposure to CHT.
62
Derecognition
In assessing whether transfers of NHA MBS from Issuers to CHT under the CMB program qualify for derecognition, significant judgment is applied in determining whether substantially all the risks and rewards of ownership of the NHA MBS have been transferred. We have determined that the sellers of NHA MBS to CHT failed to meet the derecognition criteria as they retain the risk and rewards of the NHA MBS through swap agreements. As a result, we do not recognize the underlying NHA MBS in the consolidated balance sheet but rather account for the transfer as a loan.
Use of estimates and assumptions
The preparation of our consolidated financial statements requires Management to make estimates and assumptions that affect the reported amount of revenues, expenses, assets and liabilities, and the accompanying disclosures. The key assumptions concerning the future and other key sources of estimation uncertainty at the reporting date that have a significant risk of causing a material adjustment to the carrying amounts of assets and liabilities within the next financial year are discussed below. We based our assumptions and estimates on information available when the consolidated financial statements were prepared. Existing circumstances and assumptions about future developments, however, may change due to market changes or circumstances arising that are beyond the control of the Corporation. Such changes are reflected in the assumptions when they occur.
Provision for claims
The provision at 31 December is determined by an external actuary appointed by CMHC, and the main actuarial assumptions are long-term assumptions for probability of default, loss given default and timing of the related cash flows, which are adjusted for the short-term impact of current economic conditions.
Historical experience, grouped by product and age of loans, adjusted for related changes to our insurance products and processes, is used throughout the actuarial valuation. Determining the provision involves the risk that the actual results will deviate, and in certain cases significantly, from the estimates made. In addition, there is a risk that the timing of future liability payments will differ materially from the assumptions underlying the valuation of insurance policy liabilities.
The estimate for claims that are IBNR is made using historical losses and defaults adjusted to consider prevailing legal, economic and regulatory trends; this estimate is generally subject to a greater degree of uncertainty than that for reported claims. The provision for IBNER is estimated from the payment pattern of the supplementary amounts on open claims. The losses on CIP are estimated by multiplying the insured loan amount by the calculated average loss level.
Due to the uniqueness of the programs through which the SH and ILM loans are made, the provision for these loans is determined using the expected losses on the current outstanding balances of the insured loans.
For sensitivity analysis and further information on the measurement of the provision, see Note 7.
Unearned premiums
Mortgage insurance premiums are due at the inception of the mortgage being insured, at which time they are deferred and recognized as revenue over the period covered by the related insurance contracts using factors determined annually by the appointed actuary. The premium earnings factors are based on claim occurrence patterns and amortization periods under the assumption that premiums would be earned at the same rate as claims are incurred. Distinct earning patterns are applied to product types that exhibit substantially different claim occurrence patterns. Claim occurrence patterns are based on long-term historical claim data grouped by age of loans.
Fair value measurement of financial instruments
When the fair values of financial assets and financial liabilities recorded in the consolidated balance sheet cannot be measured based on quoted prices in active markets, their fair value is measured using valuation techniques such as discounted cash flow, spread differential or other valuation models. These models include a degree of judgment in consideration of inputs such as yield curves, market spreads and risk premiums with reference to financial instruments that have similar yields, market risk and maturity characteristics. Changes in assumptions relating to these factors could affect the reported fair value of financial instruments.
A Commitment to Affordability | 2019 Annual Report 63
Valuation of pension benefit obligation
The cost of the defined benefit pension plan and the present value of the pension obligation are determined based on actuarial valuations. The actuarial valuation involves making various assumptions that may differ from actual developments in the future. These include the determination of the discount rate, rate of compensation increase, mortality rates and inflation. Due to the complexities involved in the valuation and its long-term nature, a defined benefit obligation is highly sensitive to changes in these assumptions. All assumptions are reviewed annually.
The assumption most sensitive to change is the discount rate. In determining the appropriate discount rate, we consider the interest rates of Canadian dollar corporate bonds with an ‘AA’ rating and extrapolated as needed along the yield curve to correspond with the expected term of the defined benefit obligation. The mortality rate is based on publicly available public sector mortality tables for Canada.
5. SEGMENTED INFORMATION
CMHC’s operating segments include Assisted Housing, Mortgage Insurance, Mortgage Funding and CHT. As described in Note 1, we have determined our reportable segments as Assisted Housing, Mortgage Insurance and Mortgage Funding.
Our Chief Operating Decision Maker (CODM) is the Corporation’s Executive Committee. Our CODM monitors the operating results of the activities separately for the purpose of making decisions about resource allocation and performance assessment. Segment performance is evaluated based on financial and non-financial metrics that are tied to the objectives of each operating segment and may differ by operating segment.
Assisted Housing includes Housing and Lending programs that share many similarities and satisfy the same objective of supporting access to affordable housing for Canadians in need. Our CODM allocates resources and assesses performance of the Housing and Lending programs as one. Housing programs are administered either directly by CMHC or by provinces and territories under SHA, Investment in Affordable Housing and the Federal/Provincial/Territorial Housing Partnership Framework. We lend to non-profit and private sectors, Indigenous organizations and communities, provinces and municipalities in the delivery of affordable and community housing programs. Assisted Housing revenues are earned from interest income on loans.
Mortgage Insurance provides mortgage insurance for transactional homeowner, portfolio and multi-unit residential loans in all parts of Canada. We operate these programs on a commercial basis with due regard for loss without the need for funding from the Government. Mortgage Insurance revenues are earned from premiums, fees and investment income.
Mortgage Funding provides TPGs of interest and principal of securities issued on the basis of eligible housing loans and on CMB. The guarantees are provided on a commercial basis.
CHT’s functions include the acquisition of interests in eligible housing loans such as NHA MBS, the issuance of CMB, as well as the purchase of highly rated investments and certain related financial hedging activities.
For the purposes of our segmented reporting, Mortgage Funding and CHT, a separate entity, are aggregated in the Mortgage Funding reportable segment. Accordingly, Mortgage Funding revenues are earned from guarantee and application fees, investment income and interest income on loans.
Corporate overheads are allocated to each operating segment and are included in the amounts presented.
We define a major lender to be one from which we receive premiums, guarantee fees, and application fees amounting to 10% or more of our total premiums and fees received. In 2019, we received amounts totaling $589 million, or 22% of our total premiums and fees received, from two major lenders (2018 –$572 million or 23% from two major lenders). We report these amounts in our Mortgage Insurance and Mortgage Funding activities; refer to Note 2 for information on our revenue recognition policies.
For all segments, revenues are attributed to, and assets are located in, Canada.
64
Aggregation of the Mortgage Funding and CHT
Mortgage Funding and CHT both support our objective of ensuring adequate supply of funds for mortgage lending through mortgage securitization. Through the CMB program in its entirety (including the guarantee by Mortgage Funding), we contribute to the stability of the financial system by allowing lenders to access funds for residential mortgage lending.
Both segments’ business is generated by market demand for CMHC’s TPG for mortgage funding through NHA MBS and through CMB issued by CHT.
There are many similarities in the nature of the production processes, customers and methods of distribution. CMB are available to both institutional investors and retail investors and can be bought through investment dealers, banks, trust companies and other types of financial institutions. The guarantee takes effect at issuance.
Assisted
| Mortgage
| Mortgage
| Eliminations
| Total
| ||||||||||||||||||||||||||||||||||||
(in millions)
|
2019
|
2018
|
2019
|
2018
|
2019
|
2018
|
2019
|
2018
|
2019
|
2018
| ||||||||||||||||||||||||||||||
Interest income | 301 | 335 | - | - | 5,152 | 4,965 | (6 | ) | (6 | ) | 5,447 | 5,294 | ||||||||||||||||||||||||||||
Interest expense
|
| 297
|
|
| 321
|
|
| -
|
|
| -
|
|
| 5,143
|
|
| 4,957
|
|
| (61
| )
|
| (108
| )
|
| 5,379
|
|
| 5,170
|
| ||||||||||
Net interest income | 4 | 14 | - | - | 9 | 8 | 55 | 102 | 68 | 124 | ||||||||||||||||||||||||||||||
Government funding for housing programs | 2,039 | 2,336 | - | - | - | - | - | - | 2,039 | 2,336 | ||||||||||||||||||||||||||||||
Premiums and fees earned | - | - | 1,429 | 1,426 | 582 | 483 | - | - | 2,011 | 1,909 | ||||||||||||||||||||||||||||||
Investment income (losses) | - | - | 446 | 530 | 72 | 62 | (35 | ) | (79 | ) | 483 | 513 | ||||||||||||||||||||||||||||
Net gains (losses) on financial instruments | 49 | 2 | 97 | (83 | ) | 15 | (8 | ) | (49 | ) | (8 | ) | 112 | (97 | ) | |||||||||||||||||||||||||
Other income (loss)
|
| 25
|
|
| 35
|
|
| (5
| )
|
| (3
| )
|
| 4
|
|
| 6
|
|
| -
|
|
| -
|
|
| 24
|
|
| 38
|
| ||||||||||
Total revenues and government funding | 2,117 | 2,387 | 1,967 | 1,870 | 682 | 551 | (29 | ) | 15 | 4,737 | 4,823 | |||||||||||||||||||||||||||||
Non-interest expenses | ||||||||||||||||||||||||||||||||||||||||
Housing programs | 1,829 | 2,149 | - | - | - | - | - | - | 1,829 | 2,149 | ||||||||||||||||||||||||||||||
Insurance claims | - | - | 191 | 210 | - | - | - | - | 191 | 210 | ||||||||||||||||||||||||||||||
Operating expenses
|
| 238
|
|
| 212
|
|
| 312
|
|
| 318
|
|
| 63
|
|
| 55
|
|
| -
|
|
| -
|
|
| 613
|
|
| 585
|
| ||||||||||
Total expenses
|
|
2,067
|
|
|
2,361
|
|
|
503
|
|
|
528
|
|
|
63
|
|
|
55
|
|
|
-
|
|
|
-
|
|
|
2,633
|
|
|
2,944
|
| ||||||||||
Income (loss) before income taxes | 50 | 26 | 1,464 | 1,342 | 619 | 496 | (29 | ) | 15 | 2,104 | 1,879 | |||||||||||||||||||||||||||||
Income taxes
|
| 8
|
|
| -
|
|
| 368
|
|
| 334
|
|
| 155
|
|
| 124
|
|
| (7
| )
|
| 4
|
|
| 524
|
|
| 462
|
| ||||||||||
Net income
|
|
42
|
|
|
26
|
|
|
1,096
|
|
|
1,008
|
|
|
464
|
|
|
372
|
|
|
(22
|
)
|
|
11
|
|
|
1,580
|
|
|
1,417
|
| ||||||||||
Total revenues and government funding | 2,117 | 2,387 | 1,967 | 1,870 | 682 | 551 | (29 | ) | 15 | 4,737 | 4,823 | |||||||||||||||||||||||||||||
Inter-segment income (loss)1
|
| (7
| )
|
| (6
| )
|
| (83
| )
|
| (87
| )
|
| 61
|
|
| 108
|
|
| 29
|
|
| (15
| )
|
| -
|
|
| -
|
| ||||||||||
External revenues and government funding
|
| 2,110
|
|
| 2,381
|
|
| 1,884
|
|
| 1,783
|
|
| 743
|
|
| 659
|
|
| -
|
|
| -
|
|
| 4,737
|
|
| 4,823
|
| ||||||||||
| 1 | Inter-segment income relates to the following: |
| • | Assisted Housing recognizes revenues from investing in holdings of CMB; |
| • | Mortgage Insurance recognizes revenues from investing in holdings of CMB; and |
| • | Within Mortgage Funding, CHT recognizes interest expense on CMB held by Assisted Housing and Mortgage Insurance. |
A Commitment to Affordability | 2019 Annual Report 65
Assisted
|
Mortgage
|
Mortgage
| Eliminations
| Total
| ||||||||||||||||||||||||||||||||||||
(in millions)
|
2019
|
2018
|
2019
|
2018
|
2019
|
2018
|
2019
|
2018
|
2019
|
2018
| ||||||||||||||||||||||||||||||
Assets | ||||||||||||||||||||||||||||||||||||||||
Cash and cash equivalents | 630 | 527 | 291 | 309 | 1 | 1 | - | - | 922 | 837 | ||||||||||||||||||||||||||||||
Accrued interest receivable | 103 | 123 | 96 | 113 | 540 | 501 | (2 | ) | (13 | ) | 737 | 724 | ||||||||||||||||||||||||||||
Investment securities: | ||||||||||||||||||||||||||||||||||||||||
Fair value through profit or loss | 1,037 | 1,374 | 122 | 615 | - | - | (350 | ) | (398 | ) | 809 | 1,591 | ||||||||||||||||||||||||||||
Fair value through other comprehensive income | - | - | 17,370 | 17,450 | 3,931 | 4,221 | (668 | ) | (3,507 | ) | 20,633 | 18,164 | ||||||||||||||||||||||||||||
Amortized cost | 972 | - | - | - | - | - | (25 | ) | - | 947 | - | |||||||||||||||||||||||||||||
Derivatives | 19 | 33 | 49 | - | - | - | - | - | 68 | 33 | ||||||||||||||||||||||||||||||
Due from the Government of Canada | 249 | 158 | - | - | - | - | - | - | 249 | 158 | ||||||||||||||||||||||||||||||
Loans: | ||||||||||||||||||||||||||||||||||||||||
Fair value through profit or loss | 1,307 | 2,019 | 24 | 21 | - | - | - | - | 1,331 | 2,040 | ||||||||||||||||||||||||||||||
Amortized cost | 4,893 | 4,402 | 101 | 107 | 244,445 | 234,653 | - | - | 249,439 | 239,162 | ||||||||||||||||||||||||||||||
Accounts receivable and other assets | 221 | 239 | 524 | 569 | 103 | 48 | - | - | 848 | 856 | ||||||||||||||||||||||||||||||
Investment property
|
| 267
|
|
| 264
|
|
| 9
|
|
| 47
|
|
| -
|
|
| -
|
|
| -
|
|
| -
|
|
| 276
|
|
| 311
|
| ||||||||||
|
9,698
|
|
|
9,139
|
|
|
18,586
|
|
|
19,231
|
|
|
249,020
|
|
|
239,424
|
|
|
(1,045
|
)
|
|
(3,918
|
)
|
|
276,259
|
|
|
263,876
|
| |||||||||||
Liabilities | ||||||||||||||||||||||||||||||||||||||||
Securities sold under repurchase agreements | - | - | - | 280 | - | - | - | - | - | 280 | ||||||||||||||||||||||||||||||
Accounts payable and other liabilities | 425 | 376 | 269 | 161 | 102 | 30 | - | - | 796 | 567 | ||||||||||||||||||||||||||||||
Accrued interest payable | 64 | 69 | - | - | 529 | 490 | (2 | ) | (13 | ) | 591 | 546 | ||||||||||||||||||||||||||||
Dividends payable | - | - | - | 500 | - | 175 | - | - | - | 675 | ||||||||||||||||||||||||||||||
Derivatives | 8 | 18 | - | 99 | - | - | - | - | 8 | 117 | ||||||||||||||||||||||||||||||
Provision for claims | - | - | 407 | 451 | - | - | - | - | 407 | 451 | ||||||||||||||||||||||||||||||
Borrowings: | ||||||||||||||||||||||||||||||||||||||||
Fair value through profit or loss | 2,374 | 3,430 | - | - | - | - | - | - | 2,374 | 3,430 | ||||||||||||||||||||||||||||||
Amortized cost | 6,287 | 4,768 | - | - | 244,445 | 234,653 | (991 | ) | (3,896 | ) | 249,741 | 235,525 | ||||||||||||||||||||||||||||
Defined benefit plans liability | 185 | 146 | 260 | 209 | 4 | (1 | ) | - | - | 449 | 354 | |||||||||||||||||||||||||||||
Unearned premiums and fees | - | - | 5,496 | 5,375 | 1,655 | 1,573 | - | - | 7,151 | 6,948 | ||||||||||||||||||||||||||||||
Deferred income tax liabilities
|
| 53
|
|
| 41
|
|
| 91
|
|
| 73
|
|
| -
|
|
| (8
| )
|
| (15
| )
|
| (4
| )
|
| 129
|
|
| 102
|
| ||||||||||
|
9,396
|
|
|
8,848
|
|
|
6,523
|
|
|
7,148
|
|
|
246,735
|
|
|
236,912
|
|
|
(1,008
|
)
|
|
(3,913
|
)
|
|
261,646
|
|
|
248,995
|
| |||||||||||
Equity of Canada
|
|
302
|
|
|
291
|
|
|
12,063
|
|
|
12,083
|
|
|
2,285
|
|
|
2,512
|
|
|
(37
|
)
|
|
(5
|
)
|
|
14,613
|
|
|
14,881
|
| ||||||||||
|
9,698
|
|
|
9,139
|
|
|
18,586
|
|
|
19,231
|
|
|
249,020
|
|
|
239,424
|
|
|
(1,045
|
)
|
|
(3,918
|
)
|
|
276,259
|
|
|
263,876
|
| |||||||||||
| 1 | The balance sheet eliminations remove inter-segment holdings of CMB and inter-segment receivables/payables. |
66
6. GOVERNMENT FUNDING AND HOUSING PROGRAMS EXPENSES
CMHC’s activities are presented into the following three core responsibilities.
| • | Assistance for housing needs: encompasses programs where CMHC provides federal funding to improve access to affordable housing for Canadians in housing need, including Indigenous peoples, Canadians with special or distinct needs, and certain vulnerable groups. |
| • | Financing for housing: encompasses programs whereby CMHC makes financing available for new and existing housing-related initiatives. |
| • | Housing expertise and capacity development: encompasses a variety of programs whereby CMHC supports capacity and skills development activities within the housing sector and conducts research and analysis as well as disseminates information on a range of issues that support the housing sector and informed decision making by government and other sectors. |
The following table presents the amount of government funding and housing programs expenses, including operating expenses incurred to support these programs, for the three core responsibilities.
(in millions)
|
2019
|
2018
| ||||||
Assistance for housing needs |
|
1,843 |
|
|
2,202 |
| ||
Financing for housing | 78 | 38 | ||||||
Housing expertise and capacity development
|
| 136
|
|
| 96
|
| ||
Total |
|
2,057 |
|
|
2,336 |
| ||
Government funding deferred in the period
|
| (18)
|
|
| -
|
| ||
Total recognized
|
|
2,039
|
|
|
2,336
|
| ||
Of the total amount expensed on housing programs, $813 million (2018 – $862 million) was provided for programs transferred to provinces/territories under SHA. Under the SHA, the province/territory assumes our financial and other obligations with respect to these programs in exchange for predetermined annual funding. The accountability framework requires the province/territory to provide an audited Annual Statement of Funding and Expenditures and an Annual Program Performance Report. This funding may become repayable by the provinces/territories if the amounts are not used in accordance with the terms and conditions of the SHA.
Housing programs expenses also include transactions between the Government and us for the reimbursement of:
| • | our operating expenses incurred to support and administer the housing programs, not exceeding the maximum government funding voted by Parliament; |
| • | interest rate losses resulting from certain loans made that contain interest rate clauses that are lower than the associated interest cost on the related borrowings; and |
| • | default losses on certain loans as well as net disposal losses on certain investments in housing programs and real estate properties. |
The following table summarizes the nature of these expenses reimbursed by the Government.
(in millions)
|
2019
|
2018
| ||||||
Operating expenses |
|
210 |
|
|
187 |
| ||
Interest rate losses1 | 25 | 42 | ||||||
Default and disposal losses
|
| -
|
|
| 1
|
| ||
Total
|
|
235
|
|
|
230
|
| ||
| 1 | The total reimbursement for interest losses includes $20 million (2018 – $34 million) toward our losses incurred as a result of the prepayment flexibility initiative and repricing activity on loans. |
A Commitment to Affordability | 2019 Annual Report 67
The following table presents the change in the due from the Government of Canada account. The outstanding balance as at 31 December 2019 is mainly composed of housing programs expenses incurred but not yet reimbursed.
(in millions)
|
2019
|
2018
| ||||||
Balance at beginning of year |
|
158 |
|
|
126 |
| ||
Total government funding recognized in net income during the year | 2,039 | 2,336 | ||||||
Total government funding deferred in the period | 18 | - | ||||||
Total government funding received during the year | (1,969) | (2,301) | ||||||
Third-party remittances from (owing to) the Government of Canada
|
| 3
|
|
| (3)
|
| ||
Balance at end of year
|
|
249
|
|
|
158
|
| ||
7. MORTGAGE INSURANCE
Mortgage Insurance risk management
We assume the risk of loss from borrower default through mortgage insurance contracts entered into with approved lenders, exposing us to uncertainty surrounding the timing, frequency and severity of claims. Insurance risk management policies are in place to identify, mitigate, report and monitor this risk to ensure activities are managed within our risk appetite, tolerances and risk limits to successfully deliver on our mandate and meet our strategic directions.
We manage our exposure to insurance risk of loss through prudent product design, pricing, insurance underwriting policies, claims payment and default management, reserving, fraud and misrepresentation risk management, market diversification and borrower review and monitoring for the multi-unit, portfolio and homeowner products.
Product design
The development of mortgage insurance products takes into account changing client needs, new legislation and regulations, the evolving economic environment and our mandate to serve Canadians across the country, particularly in those market segments not served or less well served by the private sector. Product design is based on prudent underwriting practices combined with our goal to ensure that creditworthy borrowers have access to mortgage insurance products that meet their needs.
Pricing
Premiums are set based on projections of claim frequency, claim severity, return on investment, operating expenses, taxes, capital targets, profitability considerations and market demand. In addition, pricing decisions also take into account other considerations related to competition, strategic direction and CMHC’s public mandate. Pricing risk refers to the potential that these projections and considerations may substantively and persistently differ from actual developments and values in the long term, which could have significant implications for CMHC’s risk of loss, profitability and achievement of mandate.
At least annually, we conduct a pricing review of our products to i) ensure they support Canadians in meeting their housing needs for a wide range of housing types and tenures; ii) support the profitability and long-term viability of the Mortgage Insurance segment; iii) foster competition; iv) support financial stability; and v) be in line with our risk appetite and tolerances.
Insurance underwriting policies
Risks related to underwriting could arise from i) the lender; ii) the borrower; iii) the property; and/or iv) the market. As a result, we have developed prudent and disciplined underwriting policies and guidelines which set the contractual framework and general obligations with respect to underwriting, provide Approved Lenders with underwriting criteria for mortgage insurance and also include policies to obtain the Approved Lender designation.
In addition, for transactional homeowner products, risks related to insurance for different types of residential properties are assessed using our mortgage insurance risk assessment methodology and a rigorous underwriting and post-approval due diligence process.
In the case of multi-unit underwriting, due to different risk characteristics, applications undergo additional individual in-depth assessments to evaluate borrower, property, market and loan characteristics by our underwriters.
68
Claims payment and default management
Our Claims Payment Centre supports Approved Lenders in managing default related to homeowner and small rental loans to reduce risk of default on payment.
Regional centres work with Approved Lenders for multi-unit residential rental, licensed care or retirement properties in resolving default situations, evaluating workout alternatives and other matters. We consider workouts through effective management of projects in difficulty by following established frameworks.
We actively pursue recoveries, which are amounts expected to be recovered from borrowers in order to mitigate our potential loss.
Reserving
Reserving risk refers to the risk that insurance liabilities differ significantly from the actual claim payments. We estimate insurance policy liabilities to cover future losses and payments on claims. These policy liabilities are established based on projections of claim frequency, severity and timing, within the context of the economic environment and recent performance indicators such as arrears rates.
Fraud and misrepresentation risk management
Fraud risk management comprises all activities aiming to detect and prevent fraud or misrepresentation and mitigating losses due to fraud or misrepresentation. We mitigate fraud using models to identify mortgage loan applications that have a high probability of containing misrepresentation and taking the appropriate measures upon identification. We maintain specialized underwriting staff to review these claims and, if appropriate, require enhanced due diligence by the lender.
Market diversification
Concentration risk may arise from insurance contracts issued in a particular geographical area where local economic conditions are significantly different from the national average that could expose the Corporation to a greater risk of loss. The relative impact of the outcome is mitigated as a result of the distribution of business across different geographic areas. We monitor the conditions of the housing market and economy in each region of Canada against predetermined risk tolerances in accordance with our Risk Appetite Framework.
The table below sets out the concentration of loan amount insured during the period:
2019
|
2018
| |||||||||||||||||||||||||||||||
(in percentages)
|
Transactional
| Portfolio
|
Multi-unit
| Overall
|
Transactional
| Portfolio
|
Multi-unit
| Overall
| ||||||||||||||||||||||||
Atlantic
|
|
6 |
|
|
4 |
|
|
6 |
|
|
5 |
|
|
6 |
|
|
1 |
|
|
8 |
|
|
6 |
| ||||||||
Quebec | 31 | 15 | 25 | 27 | 29 | 6 | 26 | 26 | ||||||||||||||||||||||||
Ontario | 31 | 48 | 39 | 36 | 31 | 54 | 39 | 36 | ||||||||||||||||||||||||
Prairies and territories | 22 | 17 | 13 | 19 | 24 | 15 | 11 | 19 | ||||||||||||||||||||||||
British Columbia
|
| 10
|
|
| 16
|
|
| 17
|
|
| 13
|
|
| 10
|
|
| 24
|
|
| 16
|
|
| 13
|
| ||||||||
Canada
|
|
100
|
|
|
100
|
|
|
100
|
|
|
100
|
|
|
100
|
|
|
100
|
|
|
100
|
|
|
100
|
| ||||||||
Monitoring
A comprehensive monitoring and quality assurance framework also enables CMHC’s ongoing rigorous review of business trends, performance and lender compliance in order to make timely adjustments to underwriting and other risk management criteria and processes as needed.
A Commitment to Affordability | 2019 Annual Report 69
Insurance-in-force
At 31 December 2019, insurance-in-force, which represents the maximum potential total risk exposure of the Mortgage Insurance segment, totaled $429 billion (2018 – $448 billion). This amount includes $883 million (2018 – $486 million) in outstanding loan balances from the Lending programs included in the Assisted Housing segment (refer to Note 14). Under Section 11 of the NHA, the total of outstanding insured amounts of all insured loans may not exceed $600 billion (2018 – $600 billion).
The following table presents the percentage distribution of insurance-in-force by region:
2019
|
2018
| |||||||||||||||||||||||||||||||||||||||
(in percentages)
|
Transactional
| Portfolio
|
Multi-unit
| Overall
|
Transactional
| Portfolio
|
Multi-unit
| Overall
| ||||||||||||||||||||||||||||||||
Atlantic | 7 | 4 | 6 | 6 | 7 | 4 | 6 | 6 | ||||||||||||||||||||||||||||||||
Quebec | 24 | 13 | 28 | 22 | 23 | 12 | 29 | 21 | ||||||||||||||||||||||||||||||||
Ontario | 28 | 46 | 37 | 35 | 29 | 47 | 36 | 36 | ||||||||||||||||||||||||||||||||
Prairies and territories | 31 | 19 | 15 | 24 | 30 | 19 | 16 | 24 | ||||||||||||||||||||||||||||||||
British Columbia
|
| 10
|
|
| 18
|
|
| 14
|
|
| 13
|
|
| 11
|
|
| 18
|
|
| 13
|
|
| 13
|
| ||||||||||||||||
Canada
|
|
100
|
|
|
100
|
|
|
100
|
|
|
100
|
|
|
100
|
|
|
100
|
|
|
100
|
|
|
100
|
| ||||||||||||||||
Earned and unearned premiums and fees
The following table presents the composition of premiums and fees earned.
(in millions)
|
2019
|
2018
| ||||||
Earned premiums | 1,399 | 1,397 | ||||||
Earned application fees1
|
| 30
|
|
| 29
|
| ||
Total
|
|
1,429
|
|
|
1,426
|
| ||
| 1 | Includes application fees on multi-unit residential loans, as well as low loan-to-value transactional homeowner application fees of $15 million (2018 - $14 million). |
The following table presents the changes in the unearned premiums and fees balance.
(in millions)
|
2019
|
2018
| ||||||
Balance at beginning of year | 5,375 | 5,352 | ||||||
Premiums deferred on contracts written in the year | 1,517 | 1,420 | ||||||
Premiums earned in the year | (1,399 | ) | (1,397 | ) | ||||
Application fees deferred on contracts written in the year | 18 | 15 | ||||||
Application fees earned in the year1
|
| (15
| )
|
| (15
| )
| ||
Balance at end of year
|
|
5,496
|
|
|
5,375
|
| ||
| 1 | Only includes earned application fees on multi-unit residential loans during the period. Application fee revenue earned on low loan-to-value transactional homeowner application fees are earned immediately as they are received. |
70
Deferred acquisition costs
The following table presents the changes in the DAC balance.
(in millions)
|
2019
|
2018
| ||||||
Balance at beginning of year |
|
181 |
|
|
165 |
| ||
Acquisition costs deferred | 67 | 64 | ||||||
Amortization of deferred acquisition costs
|
| (54)
|
|
| (48)
|
| ||
Balance at end of year1
|
|
194
|
|
|
181
|
| ||
| 1 | Included in accounts receivable and other assets (Note 21). |
Provision for claims
The provision for claims includes amounts set aside for IBNR claims, IBNER claims, CIP and SH and ILM.
Provision for claims comprises the following:
2019
|
2018
| |||||||||||||||||||||||
(in millions)
|
IBNR, IBNER
|
SH and ILM
|
Total
|
IBNR, IBNER
|
SH and ILM
|
Total
| ||||||||||||||||||
Undiscounted estimated losses |
|
341 |
|
|
40 |
|
|
381 |
|
|
369 |
|
|
60 |
|
|
429 |
| ||||||
Discounting | (4) | (6) | (10) | (7) | (10) | (17) | ||||||||||||||||||
Discounted provision for adverse deviation
|
| 27
|
|
| 9
|
|
| 36
|
|
| 28
|
|
| 11
|
|
| 39
|
| ||||||
Total provision for claims
|
|
364
|
|
|
43
|
|
|
407
|
|
|
390
|
|
|
61
|
|
|
451
|
| ||||||
The following table presents the changes in the provision for claims balance.
2019
|
2018
| |||||||||||||||||||||||
(in millions)
|
IBNR, IBNER
|
SH and ILM
|
Total
|
IBNR, IBNER
|
SH and ILM
|
Total
| ||||||||||||||||||
Provision for claims, beginning of year |
|
390 |
|
|
61 |
| 451 |
|
385 |
|
|
109 |
|
|
555 |
| ||||||||
Net claims paid during the year | (236) | (3) | (239) | (242) | (6) | (248) | ||||||||||||||||||
Provision for claims provided for and losses incurred during the period1 | 263 | 4 | 267 | 258 | 1 | 259 | ||||||||||||||||||
Unfavourable (favourable) development on prior period insurance claims | (53) | (19) | (72) | (11) | (43) | (115) | ||||||||||||||||||
Provision for claims, end of year
|
|
364
|
|
|
43
|
|
|
407
|
|
|
390
|
|
|
61
|
|
|
451
|
| ||||||
| 1 | Included as part of insurance claims on the consolidated statement of income and comprehensive income. Provision for claims provided for and losses may not equal insurance claims expense as certain expenses incurred do not impact the provision for claims. |
A Commitment to Affordability | 2019 Annual Report 71
Methodology and significant factors
We estimate our insurance policy liabilities following the actuarial present value basis. Policy liabilities are prepared by the appointed actuary and are based on assumptions and estimates as of the balance sheet date. There is inherent uncertainty in any estimate of ultimate liabilities, including for premium deficiency, IBNR, IBNER, CIP and SH and ILM, because the ultimate liability for claims is subject to the outcome of events yet to occur.
Provisions are reviewed and evaluated at each reporting period in light of emerging claim experience and changing circumstances. The resulting changes in the estimated provision for claims are recorded in insurance claims expense in the year in which they are determined. Estimates of the timing of net cash outflows resulting from our recognized insurance liabilities are provided in Note 29. As the SH and ILM programs are unique, it is difficult to provide a more precise maturity profile beyond 12 months. The majority of mortgages for the SH and ILM loans have remaining amortization periods of 8 years or less. This is consistent with the prior year.
Earning patterns are determined by product type and by amortization period. Approximately 75% of the premiums written are recognized as premiums earned within the first five years of the insurance contract.
The following factors affect the key actuarial assumptions used in the determination of the provision for claims:
| • | Claim frequency – claim frequency, or probability of default, is dependent on the loan-to-value, the underwriting year and other characteristics of the loans insured. It reflects historical and current trends and arrears reporting. |
| • | Claim severity – claim severity, or average loss on claims, is dependent on the dollar value of claims, losses on sales of real estate properties, administrative expenses, payment delays and sale delays. These factors are generally based on historical experience. |
| • | Economic conditions – recent past and projected economic factors, such as unemployment rates, house price inflation and consumer price index, affect the forecast of future claim levels. |
Sensitivity analysis
The following table presents the sensitivity in the significant assumptions that have the greatest effect on the measurement of the insurance contract liabilities. The percentage change in variables is applied to a range of existing actuarial modelling assumptions to derive the possible impact on income before income taxes and equity of Canada for reasonably possible movements in key assumptions with all other assumptions held constant. In practice, this is unlikely to occur and changes in some of the assumptions might be correlated, which might magnify or counteract the sensitivities. The relationship of a change in assumption to the change in value may not be linear. The methodology for sensitivity testing has not changed significantly from the prior year.
(in millions, unless otherwise indicated)
| Change
| Change in
| Impact on Income
| Impact on Equity
| ||||||||||||||||||||
2019
| 2018
| 2019
| 2018
| |||||||||||||||||||||
Loss sensitivity factors
| ||||||||||||||||||||||||
Claim frequency
|
|
Relative
|
|
|
+10%
|
|
|
(38
|
)
|
|
(44
|
)
|
|
(29
|
)
|
|
(33
|
)
| ||||||
|
| Relative
|
|
| -10%
|
|
| 38
|
|
| 44
|
|
| 29
|
|
| 33
|
| |||||||
Claim severity
|
|
Relative
|
|
|
+10%
|
|
|
(39
|
)
|
|
(49
|
)
|
|
(29
|
)
|
|
(37
|
)
| ||||||
|
| Relative
|
|
| -10%
|
|
| 39
|
|
| 49
|
|
| 29
|
|
| 37
|
| |||||||
Economic sensitivity factor
| ||||||||||||||||||||||||
Unemployment rate
|
|
Absolute
|
|
|
+100 bps
|
|
|
(49
|
)
|
|
(58
|
)
|
|
(37
|
)
|
|
(44
|
)
| ||||||
Gross domestic product
|
| Absolute
|
|
| -100 bps
|
|
| (22
| )
|
| (26
| )
|
| (16
| )
|
| (20
| )
| ||||||
Mortgage rates
|
| Absolute
|
|
| +100 bps
|
|
| (16
| )
|
| (20
| )
|
| (12
| )
|
| (15
| )
| ||||||
72
Claims development
Incurred but not reported, incurred but not enough reported and claims in process
The following table shows the development of the expected losses on IBNR, IBNER and CIP claims and their related expenses (excluding SH and ILM) over a period of time and the estimated ultimate cost of claims for 2010 through 2019 to present the earliest material claim that has arisen and for which there is still uncertainty about the amount and timing of claim payments. The information is presented on a default year basis where claims are related to the period in which the insured event occurred and not the period in which the policy was underwritten.
(in millions, unless otherwise indicated)
|
2010
|
2011
|
2012
|
2013
|
2014
|
2015
|
2016
|
2017
|
2018
|
2019
|
Total
| |||||||||||||||||||||||||||||||||
Expected losses
| ||||||||||||||||||||||||||||||||||||||||||||
Default year
|
| 596
|
|
| 551
|
|
| 522
|
|
| 388
|
|
| 346
|
|
| 303
|
|
| 306
|
|
| 247
|
|
| 258
|
|
| 263
|
| ||||||||||||||
One year later
|
| 566
|
|
| 499
|
|
| 428
|
|
| 370
|
|
| 328
|
|
| 324
|
|
| 272
|
|
| 253
|
|
| 258
|
| |||||||||||||||||
Two years later
|
| 560
|
|
| 479
|
|
| 432
|
|
| 372
|
|
| 351
|
|
| 319
|
|
| 280
|
|
| 241
|
| ||||||||||||||||||||
Three years later
|
| 571
|
|
| 480
|
|
| 439
|
|
| 376
|
|
| 345
|
|
| 312
|
|
| 274
|
| |||||||||||||||||||||||
Four years later
|
| 577
|
|
| 484
|
|
| 440
|
|
| 378
|
|
| 343
|
|
| 310
|
| ||||||||||||||||||||||||||
Five years later
|
| 583
|
|
| 484
|
|
| 441
|
|
| 381
|
|
| 339
|
| |||||||||||||||||||||||||||||
Six years later
|
| 582
|
|
| 488
|
|
| 440
|
|
| 376
|
| ||||||||||||||||||||||||||||||||
Seven years later
|
| 581
|
|
| 487
|
|
| 437
|
| |||||||||||||||||||||||||||||||||||
Eight years later
|
| 580
|
|
| 483
|
| ||||||||||||||||||||||||||||||||||||||
Nine years later
|
| 577
|
| |||||||||||||||||||||||||||||||||||||||||
Current estimate of cumulative claims
|
| 577
|
|
| 483
|
|
| 437
|
|
| 376
|
|
| 339
|
|
| 310
|
|
| 274
|
|
| 241
|
|
| 258
|
|
| 263
|
|
| 3,558
|
| |||||||||||
Claims paid
| ||||||||||||||||||||||||||||||||||||||||||||
Default year
|
| 43
|
|
| 37
|
|
| 29
|
|
| 22
|
|
| 19
|
|
| 16
|
|
| 23
|
|
| 19
|
|
| 19
|
|
| 22
|
| ||||||||||||||
One year later
|
| 308
|
|
| 257
|
|
| 225
|
|
| 194
|
|
| 175
|
|
| 175
|
|
| 144
|
|
| 126
|
|
| 136
|
| |||||||||||||||||
Two years later
|
| 161
|
|
| 135
|
|
| 134
|
|
| 119
|
|
| 120
|
|
| 95
|
|
| 87
|
|
| 75
|
| ||||||||||||||||||||
Three years later
|
| 43
|
|
| 39
|
|
| 37
|
|
| 29
|
|
| 23
|
|
| 20
|
|
| 20
|
| |||||||||||||||||||||||
Four years later
|
| 20
|
|
| 11
|
|
| 12
|
|
| 13
|
|
| 3
|
|
| 3
|
| ||||||||||||||||||||||||||
Five years later
|
| 8
|
|
| 3
|
|
| 2
|
|
| 1
|
|
| (1)
|
| |||||||||||||||||||||||||||||
Six years later
|
| (1)
|
|
| 4
|
|
| (1)
|
|
| (1)
|
| ||||||||||||||||||||||||||||||||
Seven years later
|
| (1)
|
|
| (2)
|
|
| (1)
|
| |||||||||||||||||||||||||||||||||||
Eight years later
|
| (1)
|
|
| (1)
|
| ||||||||||||||||||||||||||||||||||||||
Nine years later
|
| (2)
|
| |||||||||||||||||||||||||||||||||||||||||
Cumulative payments to date
|
| 578
|
|
| 483
|
|
| 437
|
|
| 377
|
|
| 339
|
|
| 309
|
|
| 274
|
|
| 220
|
|
| 155
|
|
| 22
|
|
| 3,194
|
| |||||||||||
Provision for claims
|
| (1)
|
|
| -
|
|
| -
|
|
| (1)
|
|
| -
|
|
| 1
|
|
| -
|
|
| 21
|
|
| 103
|
|
| 241
|
|
| 364
|
| |||||||||||
Current estimate of surplus (deficit)
|
| 19
|
|
| 68
|
|
| 85
|
|
| 12
|
|
| 7
|
|
| (7)
|
|
| 32
|
|
| 6
|
|
| -
|
|
| -
|
| ||||||||||||||
Surplus of initial expected loss on claims
|
| 3%
|
|
| 12%
|
|
| 16%
|
|
| 3%
|
|
| 2%
|
|
| -2%
|
|
| 10%
|
|
| 2%
|
|
| 0%
|
|
| 0%
|
| ||||||||||||||
Insurance policy liability adequacy
A liability adequacy test on the premium liabilities and claim liabilities is performed quarterly. Premium liabilities represent a provision for future claims and expenses that are expected to arise from the unearned portion of the policies in-force. Thus, this provision is for claims that have not yet occurred and, therefore, covers the period from the date of the valuation to the date of default (the assumed claim occurrence date).
The liability adequacy test for the Corporation for the year ended 31 December 2019 has identified that no premium deficiency reserve is required (2018 – nil).
A Commitment to Affordability | 2019 Annual Report 73
8. MORTGAGE FUNDING
We guarantee the timely payment of principal and interest of CMB issued by CHT under the CMB program and NHA MBS issued by Approved Issuers on the basis of housing loans under the NHA MBS program in the event that an issuer is unable to satisfy its obligations under these programs. In that circumstance, we will mitigate our loss by realizing on the collateral securing the obligations, consisting primarily of insured mortgage loans, under each of the programs.
At the balance sheet date, the Corporation has not received a claim on its TPG. As such, no provision in addition to the remaining unearned premium is required.
The following table presents the changes in the unearned TPG fees balance.
2019
| 2018
| |||||||||||||||||||||||
(in millions)
| NHA MBS
| CMB
| Total
| NHA MBS
| CMB
| Total
| ||||||||||||||||||
Balance at beginning of year
|
|
1,079
|
|
|
494
|
|
|
1,573
|
|
|
859
|
|
|
476
|
|
|
1,335
|
| ||||||
IFRS 15 adjustment for application fees
|
| -
|
|
| -
|
|
| -
|
|
| 72
|
|
| -
|
|
| 72
|
| ||||||
Restated opening balance
|
| 1,079
|
|
| 494
|
|
| 1,573
|
|
| 931
|
|
| 476
|
|
| 1,407
|
| ||||||
TPG fees received in the year
|
| 518
|
|
| 146
|
|
| 664
|
|
| 503
|
|
| 146
|
|
| 649
|
| ||||||
TPG fees earned in the year1
|
| (445)
|
|
| (137)
|
|
| (582)
|
|
| (355)
|
|
| (128)
|
|
| (483)
|
| ||||||
Balance at end of year
|
|
1,152
|
|
|
503
|
|
|
1,655
|
|
|
1,079
|
|
|
494
|
|
|
1,573
|
| ||||||
| 1 | Includes $367 million (2018 - $421 million) fees earned that were guaranteed prior to the implementation of IFRS. |
The unearned TPG fees balance relates to the consideration received from customers at inception of the TPG contracts, for which revenue is recognized over the expected life of the security. The expected life of the securities varies with the average expected life being five years.
Transaction price allocated to the remaining performance obligations
The following table presents the revenue expected to be recognized in future periods related to performance obligations that are unsatisfied at the balance sheet date.
(in millions)
| 2020
| 2021
| 2022
| 2023
| 2024
| 2025 and
| ||||||||||||||||||
NHA MBS
|
|
435
|
|
|
316
|
|
|
205
|
|
|
117
|
|
|
40
|
|
|
39
|
| ||||||
CMB
|
| 135
|
|
| 108
|
|
| 85
|
|
| 64
|
|
| 42
|
|
| 69
|
| ||||||
Guarantees-in-force
Total guarantees-in-force represents the maximum principal obligation related to TPGs.1 Under Section 15 of the NHA, the aggregate outstanding amount of principal guarantees may not exceed $600 billion (2018 – $600 billion). The following table presents the total guarantees-in-force by program. We do not expect these to result in future cash outflows.
(in billions)
|
| 2019
|
|
| 2018
|
| ||
NHA MBS
|
|
249
|
|
|
254
|
| ||
CMB2
|
| 244
|
|
| 234
|
| ||
Total
|
|
493
|
|
|
488
|
|
| 1 | Exposure excludes the realizable value of the related assets securing the NHA MBS and CMB guaranteed. |
| 2 | Includes $1.0 billion (2018 – $3.9 billion) in investments that are eliminated in the consolidated balance sheet. |
74
The following table presents the maturity profile of the guarantees-in-force based on principal amount outstanding as at 31 December 2019.
(in millions)
|
NHA MBS Guarantees
|
CMB Guarantees
|
Total Guarantees
| |||||||||
2020 | 38,012 | 39,999 | 78,011 | |||||||||
2021 | 59,785 | 37,750 | 97,535 | |||||||||
2022 | 52,425 | 44,250 | 96,675 | |||||||||
2023 | 52,193 | 36,500 | 88,693 | |||||||||
2024 | 44,268 | 37,500 | 81,768 | |||||||||
2025 and thereafter
|
| 2,658
|
|
| 47,500
|
|
| 50,158
|
| |||
Total
|
| 249,341
|
|
| 243,499
|
|
| 492,840
|
| |||
9. STRUCTURED ENTITIES
Consolidated structured entities
Canada Housing Trust
CHT was established in 2001 as a special-purpose trust, separate from CMHC. While we control the activities of CHT, its assets and liabilities are neither owned by nor held for our benefit. CHT’s functions are limited to the acquisition of interests in eligible housing loans such as NHA MBS, the issuance of CMB, as well as the purchase of highly rated investments and certain related financial hedging activities. The beneficiaries of the Trust, after payment of all obligations, are one or more charitable organizations. Financial information for CHT is presented in the following tables on an unconsolidated basis.
Condensed balance sheet
(in millions)
|
2019
|
2018
| ||||||
Loans – amortized cost | 244,445 | 234,653 | ||||||
Other assets
|
| 530
|
|
| 491
|
| ||
Total assets
|
| 244,975
|
|
| 235,144
|
| ||
Borrowings – amortized cost | 244,445 | 234,653 | ||||||
Other liabilities
|
| 530
|
|
| 491
|
| ||
Total liabilities
|
| 244,975
|
|
| 235,144
|
| ||
Total equity of Canada
|
| -
|
|
| -
|
| ||
Condensed statement of income
| ||||||||
| (in millions)
| 2019
| 2018
| ||||||
Interest income – loans | 5,152 | 4,965 | ||||||
Interest expense
|
| 5,143
|
|
| 4,957
|
| ||
Net interest income
|
| 9
|
|
| 8
|
| ||
Total revenues | 9 | 8 | ||||||
Operating expenses
|
| 9
|
|
| 8
|
| ||
Total expenses
|
| 9
|
|
| 8
|
| ||
Net income
|
| -
|
|
| -
|
| ||
A Commitment to Affordability | 2019 Annual Report 75
10. CAPITAL MANAGEMENT
For capital management, we consider our capital available to be equal to the total equity of Canada less assets with a capital requirement of 100%.
Our primary objective with respect to capital management is to ensure that our commercial operations, being our Mortgage Insurance and Mortgage Funding segments, have adequate capital to deliver their mandate, while remaining financially self-sustaining and also to follow prudent business practices and guidelines existing in the private sector as appropriate. Beyond the $25 million capital prescribed by the CMHC Act, we currently have no externally imposed minimal capital requirements; however, we voluntarily follow guidelines set out by the Office of the Superintendent of Financial Institutions (OSFI).
We perform an Own Risk & Solvency Assessment (ORSA), which is an integrated process that evaluates capital adequacy on both a regulatory and economic capital basis and is used to establish capital targets taking into consideration our strategy and risk appetite. Our ‘Own View’ of capital needs is determined by identifying our risks and evaluating whether or not an explicit amount of capital is necessary to absorb losses from each risk. With the above we have also met the requirements of the CMHC Act and the NHA.
We set an internal target for our Mortgage Insurance Activity and our Mortgage Funding Activity at a level that is expected to cover all material risks. The internal target is calibrated using specified confidence intervals and is designed to provide Management with an early indication of the need to resolve financial problems. Under our capital management policy, we operate at available capital levels above the internal target on all but unusual and infrequent occasions. Accordingly, we have established an operating level for our Mortgage Insurance Activity and our Mortgage Funding Activity in excess of our internal target. The operating level is calibrated using confidence intervals specified by our capital management policy and is designed to provide Management with adequate time to resolve financial problems before available capital decreases below the internal target.
We declare dividends to the Government from our Mortgage Insurance and Mortgage Funding activities, to the extent there are profits and retained earnings not allocated to reserves, capitalization or to meet the needs of the Corporation for purposes of the NHA, CMHC Act or any other purpose authorized by Parliament relating to housing. However, our capital is not managed to issue a dividend. In the current year, we paid $675 million in dividends that were declared in 2018, and we declared and paid an additional $2,020 million in dividends.
The components of consolidated capital available are presented below.
(in millions)
|
2019
|
2018
| ||||||
Contributed capital | 25 | 25 | ||||||
Accumulated other comprehensive income | 247 | 5 | ||||||
Appropriated retained earnings | 11,178 | 13,049 | ||||||
Unappropriated retained earnings1
|
| 3,163
|
|
| 1,802
|
| ||
Total equity of Canada2 | 14,613 | 14,881 | ||||||
Less: assets with a capital requirement of 100%
|
| (40)
|
|
| (33)
|
| ||
Total capital available
|
| 14,573
|
|
| 14,848
|
| ||
| 1 | Unappropriated retained earnings represents retained earnings in excess of our operating level for the Mortgage Insurance and Mortgage Funding activities. |
| 2 | Equity of Canada includes the impact of eliminations. |
Mortgage Insurance capital
We implemented the Mortgage Insurer Capital Adequacy Test (MICAT) guideline on 1 January 2019. MICAT combines the 1 January 2017 advisory on Capital Requirements for Federally Regulated Mortgage Insurers and the relevant portions of the 2018 Minimum Capital Test (MCT) for Federally Regulated Property and Casualty Insurance Companies.
With this new guideline, OSFI simplified the calculation of insurance risk, streamlined the requirements for single-family residential mortgages, included requirements for IFRS 16, and specified credit risk factors for securitized assets.
76
Changes in the MICAT framework predominantly relate to streamlining the requirements for single-family residential mortgages as follows:
| • | Base total asset requirements will require the mortgage insurer to use the borrower’s credit score at origination and remove the use of updated credit scores. |
| • | Increases of the base total asset requirements uniformly by 5%, with a corresponding 1% increase in operational risk, to allow for deterioration in borrower credit scores after origination. |
(in millions, unless otherwise indicated)
|
2019
|
2018
| ||||||
Accumulated other comprehensive income | 195 | (45) | ||||||
Appropriated retained earnings
|
| 9,997
|
|
| 11,846
|
| ||
Appropriated capital1 | 10,192 | 11,801 | ||||||
Unappropriated capital
|
| 1,871
|
|
| 282
|
| ||
Total Mortgage Insurance capital | 12,063 | 12,083 | ||||||
Less: assets with a capital requirement of 100%
|
| (40)
|
|
| (33)
|
| ||
Total Mortgage Insurance capital available
|
| 12,023
|
|
| 12,050
|
| ||
Internal target
|
| 155%
|
|
| 155%
|
| ||
Operating level
|
| 165%
|
|
| 165%
|
| ||
Capital available to minimum capital required (% MICAT)2,3
|
| 195%
|
|
| 168%
|
| ||
| 1 | We appropriate retained earnings and AOCI at our operating level of 165% of MICAT. |
| 2 | The MICAT guideline is effective 1 January 2019. For 2018, capital available to minimum capital required is calculated as the MCT ratio. |
| 3 | We have not made use of transitional arrangements, which expired during the fourth quarter of 2019, as provided by the OSFI Advisory. Our MICAT ratio as at 31 December 2019 would be 195% with transitional arrangements (31 December 2018 – 184%). |
Mortgage Funding capital
Mortgage Funding capital is appropriated for the guarantees provided by our NHA MBS and CMB programs. There is no regulatory capital and the appropriated amount of capital is based on our ‘Own View’, as outlined above.
We do not have separate capital amounts for CHT because the TPG exposure to CMB issued by CHT is covered by the Mortgage Funding capital. The amounts of Mortgage Funding capital held also recognize the risk mitigation provided by mortgage insurers, who are required to hold capital for the underlying mortgage default risk.
The following table presents the components of the capital available.
(in millions, unless otherwise indicated)
| 2019
| 2018
| ||||||
Accumulated other comprehensive income | 18 | 6 | ||||||
Appropriated retained earnings
|
| 1,181
|
|
| 1,195
|
| ||
Appropriated capital1 | 1,199 | 1,201 | ||||||
Unappropriated capital
|
| 1,086
|
|
| 1,311
|
| ||
Total Mortgage Funding capital available
|
| 2,285
|
|
| 2,512
|
| ||
Capital available to capital required (%)
|
| 190%
|
|
| 209%
|
| ||
| 1 | We appropriate retained earnings and AOCI at the operating level (capital required), which is set at 110% of our ‘Own View’ of capital needs. Our internal target is set at 105% of our ‘Own View’ of capital needs. |
A Commitment to Affordability | 2019 Annual Report 77
Assisted Housing capital
Lending programs
We maintain a reserve fund pursuant to Section 29 of the CMHC Act. A portion of the Lending programs’ earnings is retained in this reserve fund as part of our strategy to address interest rate risk exposure on prepayable loans as well as credit risk exposure on unsecured loans. The reserve fund is subject to a statutory limit of $240 million (2018 – $240 million), which we have determined through our ORSA to be in a reasonable range. Should the statutory limit be exceeded, we would be required to pay the excess to the Government.
Unrealized fair value fluctuations as well as remeasurement gains and losses on defined benefit plans are absorbed in retained earnings. The Housing programs’ portion of remeasurements is recorded in retained earnings until it is reimbursed by the Government through government funding for housing programs.
The following table presents the components of the capital available.
(in millions)
|
2019
|
2018
| ||||||
Reserve fund | 94 | 111 | ||||||
Retained earnings
|
| 183
|
|
| 155
|
| ||
Total Lending programs capital available
|
| 277
|
|
| 266
|
| ||
Housing programs
We do not hold capital for Housing programs as this activity does not present risks to the Corporation that would require capital to be set aside.
11. FAIR VALUE MEASUREMENT
Fair value measurement
We measure certain financial instruments and non-financial assets at fair value in the consolidated balance sheet and disclose the fair value of certain other items. Fair value is determined using a consistent measurement framework.
Fair value is the price that would be received to sell an asset or paid to transfer a liability in an orderly transaction between market participants at the measurement date under current market conditions. The fair value of an asset or a liability is measured using the assumptions that market participants would use when pricing the asset or liability, assuming that market participants act in their economic best interest. Fair value measurement of non-financial assets (that is, investment property) takes into account a market participant’s ability to generate economic benefits by using the asset in its highest and best use or by selling it to another market participant that would use the asset in its highest and best use. For financial instruments, accrued interest is separately recorded and disclosed.
Fair value hierarchy
The methods used to measure fair value make maximum use of relevant observable inputs and minimize the use of unobservable inputs. Fair value measurements are classified in a fair value hierarchy as Level 1, 2 or 3 according to the observability of the most significant inputs used in making the measurements.
Level 1
Assets and liabilities that are measured based on unadjusted quoted prices in active markets for identical assets or liabilities. An active market is one where transactions are occurring with sufficient frequency and volume to provide pricing information on an ongoing basis.
78
Level 2
Assets and liabilities that are measured based on observable inputs other than Level 1 prices. Level 2 inputs include prices obtained from third-party pricing services based on independent dealers’ quotes for identical assets or liabilities in markets that are not considered sufficiently active. Level 2 also includes fair values obtained by discounting expected future cash flows, making maximum use of directly or indirectly observable market data such as yield curves and implied forward curves constructed from foreign exchange rates, benchmark interest rates and credit spreads of identical or similar assets or liabilities.
Level 3
Assets and liabilities not quoted in active markets that are measured using valuation techniques. Where possible, inputs to the valuation techniques are based on observable market data, such as yield curves and implied forward curves constructed from benchmark interest rates and credit spreads of similar assets or liabilities. Where observable inputs are not available, unobservable inputs are used. For Level 3 assets and liabilities, unobservable inputs are significant to the overall measurement of fair value.
We have processes and controls in place to ensure fair value is appropriately measured. The valuation of financial instruments is performed by the Systems and Analytics Division (SAD) of the Investments and Treasury group. SAD has developed models and methodologies to determine fair value of financial instruments not quoted in active markets that are reviewed and monitored on an ongoing basis. All valuations are subject to independent price verification (IPV) managed by the sector of the Chief Risk Officer. IPV is a process where valuations are independently verified against external market prices and other relevant market data on an ongoing basis.
Generally, the unit of account for a financial instrument is the individual instrument, and valuation adjustments are applied at an individual instrument level, consistent with that unit of account.
For investment property, fair value is determined by independent external property appraisers who hold recognized and relevant professional qualifications and have recent relevant experience and our internal appraisers on a rotating basis.
Methods and assumptions
We measure fair value using the following methods and assumptions:
Investment securities
Equity securities are valued using closing bid price quotes from active markets.
Fixed income securities are valued primarily by indicative quotes obtained from multi-dealer consensus pricing services. Where observable quotes are not available, securities are valued using spread differentials of similar actively traded securities or discounted cash flow techniques using observable discount rate curves for instruments having similar characteristics. Future cash flows of certain floating rate bonds are estimated based on observable implied forward rate curves.
For our private limited partnership and real estate investment trust equity investments, fair value is measured as our share of the partnership’s or trust’s net asset value. In measuring net asset value, the fair value of the partnership’s or trust’s real estate assets is determined at least annually by independent appraisers using the income approach or the market approach, and the fair value of its long-term debt is measured by discounting expected future cash flows.
Loans
Loans are valued by discounting future cash flows using discount rate curves that reflect the collection guarantees provided by provincial, territorial or federal levels of government. Inputs into the discounting model are the Government yield curve and spreads derived from assets with comparable financial risks.
A Commitment to Affordability | 2019 Annual Report 79
Derivatives
Derivatives consist of over-the-counter interest rate swaps and foreign currency forward contracts. These are valued by discounting estimated future cash flows using observable discount rate curves constructed using benchmark interest rates and foreign exchange rates. Future cash flows for floating rate legs are estimated based on observable implied forward rate curves. An adjustment is made to reflect the credit risk that either counterparty may not be able to fulfil its obligations. Inputs to this adjustment include market-implied default rates and estimated recovery rates, and the adjustment takes into account master netting and collateral arrangements in place.
Investment property
The fair value of investment property is determined using either the income approach or the market approach, incorporating the highest and best use of the property. Of the total fair value of investment properties, 71% (2018 – 15%) was based on valuations performed by independent valuators and 29% (2018 – 85%) was based on internal valuations during 2019.
The income approach is primarily applied in determining the fair value of rent-producing properties. Under the income approach, fair value is based upon the present value of expected future cash flows of each property using an unobservable discount rate reflective of the characteristics of the property. Future cash flows are estimated using unobservable assumptions about future rental values and vacancy rates.
The market approach is primarily applied in determining the fair value of vacant land. Under the market approach, fair value is based upon market transactions involving comparable property, with adjustments made to reflect the unique aspects of the property being valued.
The highest and best use of the investment property held in the Assisted Housing segment ($267 million as at 31 December 2019; $264 million as at 31 December 2018) differs from its current use as these investment properties are used to carry out CMHC’s social housing mandate rather than maximize its economic value.
Borrowings
Borrowings from the Government of Canada are valued by discounting future cash flows using discount rate curves derived from the directly observable yields of our market-traded borrowings.
Comparison of carrying and fair values for financial instruments not carried at fair value
The following table compares the carrying and fair values of financial instruments not carried at fair value. Carrying value is the amount at which an item is measured in the consolidated balance sheet.
2019
| 2018
| |||||||||||||||||||||||
(in millions)
| Carrying
| Fair
| Fair Value
| Carrying
| Fair
| Fair Value
| ||||||||||||||||||
Financial assets | ||||||||||||||||||||||||
Loans at amortized cost1 | 249,439 | 251,777 | 2,338 | 239,162 | 239,820 | 658 | ||||||||||||||||||
Investments at amortized cost2 | 947 | 946 | (1) | - | - | - | ||||||||||||||||||
Financial liabilities | ||||||||||||||||||||||||
Borrowings at amortized cost3
|
| 249,741
|
|
| 252,142
|
|
| 2,401
|
|
| 235,525
|
|
| 236,311
|
|
| 786
|
| ||||||
| 1 | $251,107 million (31 December 2018 – $239,704 million) fair value categorized as Level 2, $670 million (31 December 2018 – $116 million) fair value categorized as Level 3. |
| 2 | $946 million (31 December 2018 – nil) fair value categorized as Level 2. |
| 3 | $146,905 million (31 December 2018 – $120,580 million) fair value categorized as Level 1, $105,237 million (31 December 2018 – $115,731 million) fair value categorized as Level 2. |
80
Fair value hierarchy for items carried at fair value
The following table presents the fair value hierarchy for assets and liabilities carried at fair value in the consolidated balance sheet.
| As at | ||||||||||||||||||||||||||||||||
| 2019 | 2018 | |||||||||||||||||||||||||||||||
| (in millions) | Level 1 | Level 2 | Level 3 | Total | Level 1 | Level 2 | Level 3 | Total | ||||||||||||||||||||||||
Assets | ||||||||||||||||||||||||||||||||
Cash equivalents | ||||||||||||||||||||||||||||||||
Interest-bearing deposits with banks | - | 131 | - | 131 | - | 80 | - | 80 | ||||||||||||||||||||||||
Federal government issued | 286 | - | - | 286 | 24 | - | - | 24 | ||||||||||||||||||||||||
Total cash equivalents | 286 | 131 | - | 417 | 24 | 80 | - | 104 | ||||||||||||||||||||||||
Investment securities | ||||||||||||||||||||||||||||||||
FVTPL | ||||||||||||||||||||||||||||||||
Debt instruments | ||||||||||||||||||||||||||||||||
Corporate/other entities | - | 122 | - | 122 | - | 278 | - | 278 | ||||||||||||||||||||||||
Provinces/municipalities | 26 | 304 | - | 330 | 229 | 177 | - | 406 | ||||||||||||||||||||||||
Sovereign and related entities | - | 239 | - | 239 | - | 317 | - | 317 | ||||||||||||||||||||||||
Equities | ||||||||||||||||||||||||||||||||
Canadian common shares | - | - | - | - | 492 | - | - | 492 | ||||||||||||||||||||||||
Limited partnership units | - | - | 118 | 118 | - | - | 98 | 98 | ||||||||||||||||||||||||
Total at FVTPL | 26 | 665 | 118 | 809 | 721 | 772 | 98 | 1,591 | ||||||||||||||||||||||||
FVOCI | ||||||||||||||||||||||||||||||||
Debt instruments | ||||||||||||||||||||||||||||||||
Corporate/other entities | 1,625 | 5,390 | - | 7,015 | 1,412 | 7,200 | - | 8,612 | ||||||||||||||||||||||||
Federal government issued | 9,280 | 40 | - | 9,320 | 4,663 | 57 | - | 4,720 | ||||||||||||||||||||||||
Provinces/municipalities | 667 | 3,463 | - | 4,130 | 1,978 | 2,487 | - | 4,465 | ||||||||||||||||||||||||
Sovereign and related entities | - | 168 | - | 168 | - | 268 | - | 268 | ||||||||||||||||||||||||
Equities | ||||||||||||||||||||||||||||||||
Canadian preferred shares | - | - | - | - | 99 | - | - | 99 | ||||||||||||||||||||||||
Total at FVOCI | 11,572 | 9,061 | - | 20,633 | 8,152 | 10,012 | - | 18,164 | ||||||||||||||||||||||||
Loans designated at FVTPL | - | 1,244 | - | 1,244 | - | 2,002 | - | 2,002 | ||||||||||||||||||||||||
Loans mandatorily at FVTPL | - | 17 | 70 | 87 | - | 17 | 21 | 38 | ||||||||||||||||||||||||
Derivatives | - | 68 | - | 68 | - | 33 | - | 33 | ||||||||||||||||||||||||
Investment property | - | - | 276 | 276 | - | - | 311 | 311 | ||||||||||||||||||||||||
Total assets carried at fair value | 11,884 | 11,186 | 464 | 23,534 | 8,897 | 12,916 | 430 | 22,243 | ||||||||||||||||||||||||
Liabilities | ||||||||||||||||||||||||||||||||
Borrowings designated at FVTPL | - | 2,374 | - | 2,374 | - | 3,430 | - | 3,430 | ||||||||||||||||||||||||
Derivatives | - | 8 | - | 8 | - | 117 | - | 117 | ||||||||||||||||||||||||
Total liabilities carried at fair value | - | 2,382 | - | 2,382 | - | 3,547 | - | 3,547 | ||||||||||||||||||||||||
A Commitment to Affordability | 2019 Annual Report 81
Transfers between fair value hierarchy levels
For assets and liabilities measured at fair value on a recurring basis, we determine if reclassifications have occurred between levels in the hierarchy by reassessing categorization at each balance sheet date. Transfers are dependent on our assessment of market trading activity of the last month of each balance sheet date using internal classification criteria. Transfers between levels are deemed to occur at the beginning of the quarter in which the transfer occurs. There were $1,171 million of transfers from Level 2 to Level 1 and $2,675 million of transfers from Level 1 to Level 2 during the year ended 31 December 2019 (31 December 2018 – $2,575 million and $2,483 million, respectively).
Change in fair value measurement for items classified as Level 3
The following table presents the change in fair value for items carried at fair value and classified as Level 3.
| (in millions) | Investment Securities – FVTPL | Loans – FVTPL | Investment Property | Total | ||||||||||||
2019 | ||||||||||||||||
Fair value as at 1 January 2019 | 98 | 21 | 311 | 430 | ||||||||||||
Purchases/Issuances | 11 | 90 | - | 101 | ||||||||||||
Net gains in profit or loss1,2 | 9 | - | 3 | 12 | ||||||||||||
Cash receipts on settlements/disposals | - | (41) | (38) | (79) | ||||||||||||
Fair value as at 31 December 2019 | 118 | 70 | 276 | 464 | ||||||||||||
2018 | ||||||||||||||||
Fair Value as at 1 January 2018 | 88 | 26 | 305 | 419 | ||||||||||||
Purchases/Issuances | 11 | 46 | 1 | 58 | ||||||||||||
Net gains in profit or loss2 | 4 | 1 | 5 | 10 | ||||||||||||
Cash receipts on settlements/disposals | (5) | (52) | - | (57) | ||||||||||||
Fair value as at 31 December 2018 | 98 | 21 | 311 | 430 | ||||||||||||
| 1 | Included in net gains on financial instruments for investment securities; other income for investment property. |
| 2 | Solely relates to unrealized gains for assets held at the end of the respective periods. |
Unobservable inputs for items classified as Level 3
The valuations of items classified as Level 3 use unobservable inputs, changes in which may significantly affect the measurement of fair value. Valuations were based on assessments of the prevailing conditions at 31 December 2019, which may change materially in subsequent periods. The following table presents quantitative information about the significant unobservable inputs used in Level 3 fair value measurements for items carried at fair value.
82
| 2019 | 2018 | |||||||||||||||||||||||
(in millions, unless otherwise indicated) | Valuation Technique | Unobservable Inputs | Asset Fair Value | Weighted Average Input/Range | Asset Fair Value | Weighted Average Input/Range | ||||||||||||||||||
Investment securities | ||||||||||||||||||||||||
Equities at FVTPL – Limited partnership units | | Share of partnership equity | | | Reported partnership equity | | 118 | n/a | 98 | n/a | ||||||||||||||
Loans at FVTPL | ||||||||||||||||||||||||
MI Activity workout loans | Discounted cash flow | Loss rate | 8 | 63% | 8 | 63% | ||||||||||||||||||
MI Activity mortgage assignments | Market approach | Value per square foot | 16 | $5 - $1,300 | 13 | $11 - $710 | ||||||||||||||||||
AH Activity loans – FTHBI | Market approach | Home-price index | 26 | n/a | - | |||||||||||||||||||
AH Activity – Innovation Fund | Discounted cash flow | Cash flows | 20 | n/a | - | |||||||||||||||||||
Total loans at FVTPL | 70 | 21 | ||||||||||||||||||||||
Investment property | ||||||||||||||||||||||||
MI Activity | Discounted cash flow | | Estimated rental value per square foot | | 9 | $14 - $17 | 47 | $14 - $42 | ||||||||||||||||
| Discount rate | 7% | 6% - 8% | ||||||||||||||||||||||
| Discounted cash flow | | Estimated rental value per square foot | | 30 | $15 - $215 | 27 | $31 - $189 | |||||||||||||||||
AH Activity | Discount rate | 4% - 6% | 4% - 6% | |||||||||||||||||||||
| Market approach | Value per square foot | 237 | $0 - $460 | 237 | $0 - $448 | |||||||||||||||||||
Total investment property | 276 | 311 | ||||||||||||||||||||||
Total Level 3 items carried at fair value | 464 | 430 | ||||||||||||||||||||||
Level 3 sensitivity analysis
Investment property
For investment property, increases (decreases) in estimated rental value and price per square foot could result in a significantly higher (lower) fair value of the properties. Increases (decreases) in discount rates could result in a significantly lower (higher) fair value.
12. CASH AND CASH EQUIVALENTS
The following table provides a breakdown of our cash and cash equivalents:
| 2019 | 2018 | |||||||||||||||||||||||||||||||
| (in millions) | Amortized Cost | FVOCI | FVTPL | Total | Amortized Cost | FVOCI | FVTPL | Total | ||||||||||||||||||||||||
Cash | - | - | - | - | 1 | - | - | 1 | ||||||||||||||||||||||||
Interest-bearing deposits with banks | 419 | - | 131 | 550 | 428 | - | 80 | 508 | ||||||||||||||||||||||||
Corporate/other entities | 26 | - | - | 26 | 151 | - | - | 151 | ||||||||||||||||||||||||
Federal government issued | - | 286 | - | 286 | - | 24 | - | 24 | ||||||||||||||||||||||||
Provinces/municipalities | 60 | - | - | 60 | 153 | - | - | 153 | ||||||||||||||||||||||||
Total cash and cash equivalents | 505 | 286 | 131 | 922 | 733 | 24 | 80 | 837 | ||||||||||||||||||||||||
A Commitment to Affordability | 2019 Annual Report 83
We have $26 million of cash and cash equivalents as at 31 December 2019 (31 December 2018 – $78 million) that relates to funds received from the Government that may only be used as part of the Affordable Rental Housing Innovation Fund.
We have $417 million of cash and cash equivalents (31 December 2018 – $260 million) that may only be used as part of the Rental Construction Financing initiative (RCFi).
We have $34 million of cash and cash equivalents (31 December 2018 – nil) that may only be used as part of the National Housing Co-investment Fund.
13. INVESTMENT SECURITIES
The following tables present the contractual maturity profile and average yield of investment securities.
| Remaining Term to Maturity | ||||||||||||||||||||
| (in millions) | Within 1 Year | 1 to 3 Years | 3 to 5 Years | Over 5 Years | Total 2019 | |||||||||||||||
FVTPL | ||||||||||||||||||||
Fixed income | ||||||||||||||||||||
Corporate/other entities | 61 | 57 | - | 4 | 122 | |||||||||||||||
Provinces/municipalities | 175 | 155 | - | - | 330 | |||||||||||||||
Sovereign and related entities | 160 | 71 | 8 | - | 239 | |||||||||||||||
Total fixed income | 396 | 283 | 8 | 4 | 691 | |||||||||||||||
Yield1 | 1.5% | 1.5% | 2.6% | 5.3% | 1.5% | |||||||||||||||
Canadian equities | 118 | |||||||||||||||||||
Yield2 | 3.8% | |||||||||||||||||||
Total at FVTPL | 809 | |||||||||||||||||||
FVOCI | ||||||||||||||||||||
Fixed income | ||||||||||||||||||||
Corporate/other entities3 | 955 | 2,154 | 1,392 | 2,514 | 7,015 | |||||||||||||||
Federal government issued | 491 | 2,811 | 1,899 | 4,119 | 9,320 | |||||||||||||||
Provinces/municipalities | 212 | 1,093 | 1,196 | 1,629 | 4,130 | |||||||||||||||
Sovereign and related entities | 50 | 75 | - | 43 | 168 | |||||||||||||||
Total at FVOCI | 1,708 | 6,133 | 4,487 | 8,305 | 20,633 | |||||||||||||||
Yield1 | 2.2% | 2.2% | 2.5% | 2.3% | 2.3% | |||||||||||||||
Amortized cost | ||||||||||||||||||||
Fixed income | ||||||||||||||||||||
Corporate/other entities | 223 | 15 | - | - | 238 | |||||||||||||||
Federal government issued | - | 47 | 5 | - | 52 | |||||||||||||||
Provinces/municipalities | 144 | 181 | 46 | - | 371 | |||||||||||||||
Sovereign and related entities | 116 | 130 | 40 | - | 286 | |||||||||||||||
Total at amortized cost | 483 | 373 | 91 | - | 947 | |||||||||||||||
Yield1 | 1.8% | 1.7% | 1.8% | - | 1.8% | |||||||||||||||
Total | 22,389 | |||||||||||||||||||
| 1 | Represents the weighted-average yield, determined as the weighted average of the effective yields of individual securities. |
| 2 | Represents the average yield, determined by dividing dividend income by average cost. |
| 3 | Includes debt securities denominated in U.S. dollars with a carrying value of $2,334 million (2018 – $2,278 million). |
84
Remaining Term to Maturity
| ||||||||||||||||||||
| (in millions) | Within 1 Year | 1 to 3 Years | 3 to 5 Years | Over 5 Years | Total 2018 | |||||||||||||||
FVTPL | ||||||||||||||||||||
Fixed income | ||||||||||||||||||||
Corporate/other entities | 135 | 117 | - | 26 | 278 | |||||||||||||||
Provinces/municipalities | 76 | 304 | 26 | - | 406 | |||||||||||||||
Sovereign and related entities | 80 | 229 | 8 | - | 317 | |||||||||||||||
Total fixed income | 291 | 650 | 34 | 26 | 1,001 | |||||||||||||||
Yield1 | 1.7% | 1.5% | 2.3% | 8.0% | 1.7% | |||||||||||||||
Canadian equities | 590 | |||||||||||||||||||
Yield2 | 3.5% | |||||||||||||||||||
Total at FVTPL | 1,591 | |||||||||||||||||||
FVOCI | ||||||||||||||||||||
Fixed income | ||||||||||||||||||||
Corporate/other entities | 1,018 | 2,561 | 1,660 | 3,373 | 8,612 | |||||||||||||||
Federal government issued | 345 | 2,072 | 967 | 1,336 | 4,720 | |||||||||||||||
Provinces/municipalities | 382 | 892 | 875 | 2,316 | 4,465 | |||||||||||||||
Sovereign and related entities | 101 | 125 | - | 42 | 268 | |||||||||||||||
Total fixed income | 1,846 | 5,650 | 3,502 | 7,067 | 18,065 | |||||||||||||||
Yield1 | 2.3% | 2.2% | 2.5% | 2.9% | 2.5% | |||||||||||||||
Canadian equities | 99 | |||||||||||||||||||
Yield2 | 5.0% | |||||||||||||||||||
Total at FVOCI | 18,164 | |||||||||||||||||||
Total | 19,755 | |||||||||||||||||||
| 1 | Represents the weighted-average yield, determined as the weighted average of the effective yields of individual securities. |
| 2 | Represents the average yield, determined by dividing dividend income by average cost. |
The following table shows the cumulative unrealized gains (losses) on investment securities recorded at fair value.
| 2019 | 2018 | |||||||||||||||||||||||||||||||
| (in millions) | Amortized Cost1 | Gross Cumulative Unrealized Gains | Gross Cumulative Unrealized Losses | Fair Value | Amortized Cost1 | Gross Cumulative Unrealized Gains | Gross Cumulative Unrealized Losses | Fair Value | ||||||||||||||||||||||||
Debt instruments | ||||||||||||||||||||||||||||||||
FVTPL | 692 | 1 | (2) | 691 | 1,007 | 2 | (8) | 1,001 | ||||||||||||||||||||||||
FVOCI2 | 20,345 | 368 | (80) | 20,633 | 17,964 | 275 | (174) | 18,065 | ||||||||||||||||||||||||
Equities | ||||||||||||||||||||||||||||||||
FVTPL | 89 | 29 | - | 118 | 371 | 223 | (4) | 590 | ||||||||||||||||||||||||
FVOCI | - | - | - | - | 108 | - | (9) | 99 | ||||||||||||||||||||||||
| 1 | Amortized cost for equities is weighted-average acquisition cost. |
| 2 | Includes debt instruments denominated in U.S. dollars with a carrying value of $2,334 million (31 December 2018 - $2,278 million). |
A Commitment to Affordability | 2019 Annual Report 85
As at 31 December 2019, we do not hold investment securities (31 December 2018 – $283 million) that are part of securities sold under repurchase agreements with terms that do not exceed 93 days.
We recognize in OCI changes in fair value on these investment securities during the period, with the exception of investments in CHT-issued CMB, which are eliminated from the consolidated financial statements.
Credit quality
The following table presents the credit quality of debt instruments held at FVOCI and at amortized cost as at December 2019 and December 2018, all of which have an expected credit loss (ECL) allowance based on 12-month ECL. Credit ratings are based on our internal credit rating system and amounts in the table represent the gross carrying amounts of the financial assets.
| As at | ||||||||||||||||||||||||||||||||||||||||
31 December 2019
| 31 December 2018
| |||||||||||||||||||||||||||||||||||||||
| (in millions) | AAA | AA- to AA+ | A- to A+ | BBB- to | Total | AAA | AA- to AA+ | A- to A+ | BBB- to | Total | ||||||||||||||||||||||||||||||
Investment securities1 | ||||||||||||||||||||||||||||||||||||||||
FVOCI | 9,973 | 1,653 | 7,591 | 1,416 | 20,633 | 5,510 | 1,975 | 8,887 | 1,693 | 18,065 | ||||||||||||||||||||||||||||||
Amortized cost | 434 | 213 | 300 | - | 947 | - | - | - | - | - | ||||||||||||||||||||||||||||||
| 1 | The internal credit ratings are based upon internal assessments of the counterparty creditworthiness. These ratings correspond to those provided by the credit rating agencies except in cases where stand-alone ratings exist. A counterparty internal credit rating cannot be higher than the highest stand-alone rating from any of the agencies. A stand-alone rating removes the assumption of Government support from the rating. |
Expected credit losses
The ECL allowance for debt instruments held at FVOCI was $5 million at 31 December 2019 (31 December 2018 - $6 million).
The ECL allowance for debt instruments held at amortized cost was nil at 31 December 2019 (31 December 2018 – nil) and no amount was recognized in net gains (losses) on financial instruments for these securities during the year ended 31 December 2019 (nil for the year ended 31 December 2018).
14. LOANS
The following tables present the contractual maturity profile and average yield of loans based on carrying value.
Year of Maturity
| ||||||||||||||||||||||||||||
(in millions, unless otherwise indicated) | 2020 | 2021 | 2022 | 2023 | 2024 | 2025 and Thereafter | Total 2019 | |||||||||||||||||||||
FVTPL | ||||||||||||||||||||||||||||
Lending programs | 623 | 357 | 40 | 83 | 54 | 150 | 1,307 | |||||||||||||||||||||
MI Activity loans | 21 | 3 | - | - | - | - | 24 | |||||||||||||||||||||
Total FVTPL | 644 | 360 | 40 | 83 | 54 | 150 | 1,331 | |||||||||||||||||||||
Yield | 1.7% | 1.5% | 2.0% | 2.5% | 2.3% | 1.6% | 1.7% | |||||||||||||||||||||
Amortized cost | ||||||||||||||||||||||||||||
Loans under the CMB program | 39,991 | 37,799 | 44,376 | 36,513 | 38,002 | 47,764 | 244,445 | |||||||||||||||||||||
Lending programs | 257 | 303 | 520 | 507 | 578 | 2,728 | 4,893 | |||||||||||||||||||||
MI Activity loans | 65 | 12 | 8 | 4 | 5 | 7 | 101 | |||||||||||||||||||||
Total amortized cost | 40,313 | 38,114 | 44,904 | 37,024 | 38,585 | 50,499 | 249,439 | |||||||||||||||||||||
Yield | 2.0% | 2.0% | 2.2% | 2.4% | 2.4% | 2.5% | 2.3% | |||||||||||||||||||||
Total | 40,957 | 38,474 | 44,944 | 37,107 | 38,639 | 50,649 | 250,770 | |||||||||||||||||||||
86
| Year of Maturity | ||||||||||||||||||||||||||||
(in millions, unless otherwise indicated) | 2019 | 2020 | 2021 | 2022 | 2023 | 2024 and thereafter | Total 2018 | |||||||||||||||||||||
FVTPL | ||||||||||||||||||||||||||||
Lending programs | 573 | 723 | 408 | 47 | 96 | 172 | 2,019 | |||||||||||||||||||||
MI Activity loans | 16 | 3 | 2 | - | - | - | 21 | |||||||||||||||||||||
Total FVTPL | 589 | 726 | 410 | 47 | 96 | 172 | 2,040 | |||||||||||||||||||||
Yield | 2.1% | 1.7% | 1.5% | 2.0% | 2.5% | 2.1% | 1.8% | |||||||||||||||||||||
Amortized cost | ||||||||||||||||||||||||||||
Loans under the CMB program | 30,765 | 39,980 | 37,831 | 44,421 | 36,517 | 45,139 | 234,653 | |||||||||||||||||||||
Lending programs | 145 | 158 | 365 | 578 | 545 | 2,611 | 4,402 | |||||||||||||||||||||
MI Activity loans | 51 | 20 | 13 | 5 | 4 | 14 | 107 | |||||||||||||||||||||
Total amortized cost | 30,961 | 40,158 | 38,209 | 45,004 | 37,066 | 47,764 | 239,162 | |||||||||||||||||||||
Yield | 2.1% | 2.1% | 2.1% | 2.3% | 2.5% | 2.6% | 2.3% | |||||||||||||||||||||
Total | 31,550 | 40,884 | 38,619 | 45,051 | 37,162 | 47,936 | 241,202 | |||||||||||||||||||||
The following table presents the cash flows and non-cash changes for loans.
| Cash Flows | Non-cash Changes | |||||||||||||||||||||||||||||||
| (in millions) | Opening Balance | Repayments | Disbursements | Fair Value Changes | Accretion | ECL | Transfers1 | Balance at End of Period | ||||||||||||||||||||||||
2019 | ||||||||||||||||||||||||||||||||
FVTPL | ||||||||||||||||||||||||||||||||
Lending programs | 2,019 | (246) | 46 | 8 | - | - | (520) | 1,307 | ||||||||||||||||||||||||
MI Activity loans | 21 | (42) | 44 | 1 | - | - | - | 24 | ||||||||||||||||||||||||
Total at FVTPL | 2,040 | (288) | 90 | 9 | - | - | (520) | 1,331 | ||||||||||||||||||||||||
Amortized cost | ||||||||||||||||||||||||||||||||
Loans under the CMB program | 234,653 | (30,980) | 40,725 | - | 47 | - | - | 244,445 | ||||||||||||||||||||||||
Lending programs | 4,402 | (608) | 579 | - | - | - | 520 | 4,893 | ||||||||||||||||||||||||
MI Activity loans | 107 | (14) | 4 | - | 1 | 3 | - | 101 | ||||||||||||||||||||||||
Total amortized cost | 239,162 | (31,602) | 41,308 | - | 48 | 3 | 520 | 249,439 | ||||||||||||||||||||||||
Total | 241,202 | (31,890) | 41,398 | 9 | 48 | 3 | - | 250,770 | ||||||||||||||||||||||||
2018 | ||||||||||||||||||||||||||||||||
FVTPL | ||||||||||||||||||||||||||||||||
Lending programs | 2,923 | (355) | - | (8) | - | - | (541) | 2,019 | ||||||||||||||||||||||||
MI Activity loans | 26 | (53) | 46 | 2 | - | - | - | 21 | ||||||||||||||||||||||||
Total at FVTPL | 2,949 | (408) | 46 | (6) | - | - | (541) | 2,040 | ||||||||||||||||||||||||
Amortized cost | ||||||||||||||||||||||||||||||||
Loans under the CMB program | 233,786 | (38,848) | 39,673 | - | 42 | - | - | 234,653 | ||||||||||||||||||||||||
Lending programs | 4,138 | (549) | 273 | - | - | (1) | 541 | 4,402 | ||||||||||||||||||||||||
MI Activity loans | 117 | (21) | 11 | - | 3 | (3) | - | 107 | ||||||||||||||||||||||||
Total amortized cost | 238,041 | (39,418) | 39,957 | - | 45 | (4) | 541 | 239,162 | ||||||||||||||||||||||||
Total | 240,990 | (39,826) | 40,003 | (6) | 45 | (4) | - | 241,202 | ||||||||||||||||||||||||
| 1 | Transfers are matured loans that have been renewed where the new loans are no longer part of a portfolio of economically hedged loans and borrowings and therefore classified at amortized cost. |
A Commitment to Affordability | 2019 Annual Report 87
Credit quality – amortized cost
The following table presents the credit quality of loans at amortized cost, presented separately for those based on 12-month or lifetime ECL. For loans where past due information is used as the primary criteria in assessing SICR, aging of loans past due from contractual due date is presented. For loans where past due information is not the primary criteria used in assessing SICR, credit quality is presented by credit rating category based on our internal credit rating system. Amounts in the table represent the gross carrying amount of the financial asset.
| 2019 | 2018 | |||||||||||||||||||||||
| (in millions) | Stage 1: 12-month ECL | Stage 2: Lifetime ECL (not credit impaired) | Stage 3: Lifetime ECL (credit impaired) | POCI | Total | Total | ||||||||||||||||||
Days past due: | ||||||||||||||||||||||||
0-30 days | 3,109 | - | - | - | 3,109 | 2,482 | ||||||||||||||||||
30-90 | - | 6 | - | - | 6 | 2 | ||||||||||||||||||
90+ | - | - | 104 | - | 104 | 103 | ||||||||||||||||||
POCI | - | - | - | 108 | 108 | 116 | ||||||||||||||||||
Total gross carrying amount | 3,109 | 6 | 104 | 108 | 3,327 | 2,703 | ||||||||||||||||||
Internal credit ratings:1 | ||||||||||||||||||||||||
AAA | - | - | - | - | - | - | ||||||||||||||||||
AA- to AA+ | 749 | - | - | - | 749 | 725 | ||||||||||||||||||
A- to A+ | 488 | - | - | - | 488 | 350 | ||||||||||||||||||
BBB- to BBB+ | 532 | - | - | - | 532 | 836 | ||||||||||||||||||
Total gross carrying amount | 1,769 | - | - | - | 1,769 | 1,911 | ||||||||||||||||||
Total | 4,878 | 6 | 104 | 108 | 5,096 | 4,614 | ||||||||||||||||||
ECL allowance | (1) | - | (46) | (55) | (102) | (105) | ||||||||||||||||||
Total, net of ECL allowance | 4,877 | 6 | 58 | 53 | 4,994 | 4,509 | ||||||||||||||||||
Loans under the CMB program | - | - | - | - | 244,445 | 234,653 | ||||||||||||||||||
Total loans at amortized cost | 249,439 | 239,162 | ||||||||||||||||||||||
| 1 | The internal credit ratings are based upon internal assessments of the counterparty creditworthiness. These ratings correspond to those provided by the credit rating agencies except in cases where stand-alone ratings exist. A counterparty internal credit rating cannot be higher than the highest stand-alone rating from any of the agencies. A stand-alone rating removes the assumption of Government support from the rating. |
Total undrawn loan commitments outstanding at 31 December 2019 were $2,902 million (2018 – $674 million), of which $2,894 million are subject to 12-month ECL (2018 – $664 million) and $8 million are commitments outstanding on purchased or credit impaired loans (2018 – $10 million).
The allowance for expected credit losses on undrawn loan commitments was $6 million at 31 December 2019 (2018 – $3 million), an increase of $3 million for the year (2018 – increase of $3 million).
88
Expected credit losses
The table below presents the change in the ECL allowance recognized in the consolidated statement of income on loans held at amortized cost.
| 2019 | 2018 | |||||||||||||||||||||||
| (in millions) | Stage 1: 12-Month ECL | Stage 2: Lifetime ECL (not credit impaired) | Stage 3: Lifetime ECL (credit impaired) | POCI | Total | Total | ||||||||||||||||||
ECL allowance – beginning of period: | ||||||||||||||||||||||||
Lending program loans | 1 | - | 5 | - | 6 | 5 | ||||||||||||||||||
MI Activity loans | - | - | 41 | 58 | 99 | 96 | ||||||||||||||||||
Total ECL allowance – beginning of period | 1 | - | 46 | 58 | 105 | 101 | ||||||||||||||||||
Increase (decrease) in ECL allowance: | ||||||||||||||||||||||||
Lending program loans | - | - | - | - | - | 1 | ||||||||||||||||||
MI Activity loans | - | - | - | (3) | (3) | 3 | ||||||||||||||||||
Total increase (decrease) in ECL allowance1 | - | - | - | (3) | (3) | 4 | ||||||||||||||||||
ECL allowance – end of period: | ||||||||||||||||||||||||
Lending program loans | 1 | - | 5 | - | 6 | 6 | ||||||||||||||||||
MI Activity loans | - | - | 41 | 55 | 96 | 99 | ||||||||||||||||||
Total ECL allowance – end of period | 1 | - | 46 | 55 | 102 | 105 | ||||||||||||||||||
| 1 | Included in net gains (losses) on financial instruments for Lending program loans and insurance claims expense for MI Activity loans. |
Sources of guarantee
We are assured collection of principal and accrued interest on 99% (2018 – 99%) of our loans. The sources of guarantee for these loans are provided below. For loans at FVTPL, the change in fair value attributable to changes in credit risk is immaterial (2018 – immaterial).
| 2019 | 2018 | |||||||||||||||||||||||
| (in millions) | FVTPL | Amortized Cost | Total | FVTPL | Amortized Cost | Total | ||||||||||||||||||
Provinces and territories through provisions in the SHA | 690 | 1,481 | 2,171 | 1,045 | 1,478 | 2,523 | ||||||||||||||||||
Government of Canada through provisions in the NHA | 20 | 465 | 485 | - | 580 | 580 | ||||||||||||||||||
Indigenous and Northern Affairs Canada through Ministerial Loan Guarantees | 334 | 1,042 | 1,376 | 603 | 747 | 1,350 | ||||||||||||||||||
Loans underwritten by our MI Activity | 94 | 779 | 873 | 154 | 332 | 486 | ||||||||||||||||||
Collateral1 | - | 244,445 | 244,445 | - | 234,653 | 234,653 | ||||||||||||||||||
Total guaranteed loans | 1,138 | 248,212 | 249,350 | 1,802 | 237,790 | 239,592 | ||||||||||||||||||
Other Lending programs loans2 | 169 | 1,126 | 1,295 | 217 | 1,265 | 1,482 | ||||||||||||||||||
MI Activity loans | 24 | 101 | 125 | 21 | 107 | 128 | ||||||||||||||||||
Total | 1,331 | 249,439 | 250,770 | 2,040 | 239,162 | 241,202 | ||||||||||||||||||
| 1 | Represents collateral held for loans under the CMB program which consists of NHA MBS securities and high quality reinvestment assets. |
| 2 | Consists of loans to provincial entities, municipalities and partnerships between governments, non-profits and private sector. |
A Commitment to Affordability | 2019 Annual Report 89
15. BORROWINGS
The following tables present the contractual maturity profile and average yield of borrowings based on carrying value.
| Year of Maturity | ||||||||||||||||||||||||||||
(in millions, unless otherwise indicated) | 2020 | 2021 | 2022 | 2023 | 2024 | 2025 and Thereafter | Total 2019 | |||||||||||||||||||||
Designated at FVTPL | ||||||||||||||||||||||||||||
Borrowings from the Government of Canada | 1,247 | 660 | 80 | 164 | 78 | 145 | 2,374 | |||||||||||||||||||||
Yield1 | 1.5% | 1.3% | 1.9% | 2.4% | 2.3% | 1.5% | 1.6% | |||||||||||||||||||||
Borrowings at amortized cost | ||||||||||||||||||||||||||||
Canada mortgage bonds | 39,397 | 37,690 | 44,241 | 36,467 | 37,890 | 47,769 | 243,454 | |||||||||||||||||||||
Borrowings from the Government of Canada | 605 | 649 | 682 | 610 | 631 | 3,110 | 6,287 | |||||||||||||||||||||
Total borrowings at amortized cost | 40,002 | 38,339 | 44,923 | 37,077 | 38,521 | 50,879 | 249,741 | |||||||||||||||||||||
Yield1 | 2.0% | 2.0% | 2.2% | 2.4% | 2.4% | 2.4% | 2.3% | |||||||||||||||||||||
Total | 41,249 | 38,999 | 45,003 | 37,241 | 38,599 | 51,024 | 252,115 | |||||||||||||||||||||
| 1 | Represents the weighted-average yield, determined by applying the weighted-average effective yields of individual fixed-rate borrowings and the weighted-average yields-to-reset of floating rate borrowings. |
| Year of Maturity | ||||||||||||||||||||||||||||
(in millions, unless otherwise indicated) | 2019 | 2020 | 2021 | 2022 | 2023 | 2024 and Thereafter | Total 2018 | |||||||||||||||||||||
Designated at FVTPL | ||||||||||||||||||||||||||||
Borrowings from the Government of Canada | 1,076 | 1,241 | 653 | 79 | 162 | 219 | 3,430 | |||||||||||||||||||||
Yield1 | 2.0% | 1.5% | 1.3% | 1.9% | 2.4% | 1.8% | 1.7% | |||||||||||||||||||||
Borrowings at amortized cost | ||||||||||||||||||||||||||||
Canada mortgage bonds | 30,467 | 39,047 | 37,533 | 44,084 | 36,169 | 43,457 | 230,757 | |||||||||||||||||||||
Borrowings from the Government of Canada | 497 | 494 | 601 | 624 | 579 | 1,973 | 4,768 | |||||||||||||||||||||
Total borrowings at amortized cost | 30,964 | 39,541 | 38,134 | 44,708 | 36,748 | 45,430 | 235,525 | |||||||||||||||||||||
Yield1 | 2.1% | 2.1% | 2.1% | 2.3% | 2.5% | 2.6% | 2.3% | |||||||||||||||||||||
Total | 32,040 | 40,782 | 38,787 | 44,787 | 36,910 | 45,649 | 238,955 | |||||||||||||||||||||
| 1 | Represents the weighted-average yield, determined by applying the weighted-average effective yields of individual fixed-rate borrowings and the weighted-average yields-to-reset of floating rate borrowings. |
Borrowings – designated at fair value through profit or loss
Included in this category are short- and medium-term borrowings from the Government taken to fund certain Assisted Housing Activity loans originated prior to August 2016. Short-term debt, having an original term to maturity less than 365 days, was nil at 31 December 2019 (2018 – nil). Medium-term debt includes fixed-rate notes, with an original term to maturity ranging from two to ten years.
The carrying amount at 31 December 2019 of borrowings designated at FVTPL is $4 million lower (2018 – $23 million lower) than the contractual amount due at maturity. Our liabilities are backed by the full faith and credit of the Government and there is no significant change in value that can be attributed to changes in credit risk.
90
Borrowings – amortized cost
This category includes borrowings under the CMB program as well as the short- and medium-term borrowings from the Government taken to fund certain Assisted Housing Activity loans, including all those originated after July 2016. Short-term debt, having an original term to maturity less than 365 days, was $78 million at 31 December 2019 (2018 – $41 million). Medium-term debt includes fixed-rate notes, with an original term to maturity ranging from two to ten years. The following table presents the cash flows and non-cash changes for borrowings.
| Cash Flows | Non-cash Changes | |||||||||||||||||||||||||||
| (in millions) | Balance at Beginning of Year | Issuances | Repayments | Fair Value Changes | Accretion and Other | Eliminations | Balance at End of Year | |||||||||||||||||||||
2019 | ||||||||||||||||||||||||||||
Designated at FVTPL | ||||||||||||||||||||||||||||
Borrowings from the Government of Canada | 3,430 | - | (1,075) | 19 | - | - | 2,374 | |||||||||||||||||||||
Borrowings at amortized cost | ||||||||||||||||||||||||||||
Canada mortgage bonds | 230,757 | 40,725 | (30,925) | - | 47 | 2,850 | 243,454 | |||||||||||||||||||||
Borrowings from the Government of Canada | 4,768 | 3,385 | (1,821) | (64) | 19 | - | 6,287 | |||||||||||||||||||||
Total borrowings at amortized cost | 235,525 | 44,110 | (32,746) | (64) | 66 | 2,850 | 249,741 | |||||||||||||||||||||
Total | 238,955 | 44,110 | (33,821) | (45) | 66 | 2,850 | 252,115 | |||||||||||||||||||||
2018 | ||||||||||||||||||||||||||||
Designated at FVTPL | ||||||||||||||||||||||||||||
Borrowings from the Government of Canada | 4,564 | - | (1,128) | (6) | - | - | 3,430 | |||||||||||||||||||||
Borrowings at amortized cost | ||||||||||||||||||||||||||||
Canada mortgage bonds | 229,242 | 39,673 | (38,775) | - | 42 | 575 | 230,757 | |||||||||||||||||||||
Borrowings from the Government of Canada | 4,350 | 1,366 | (956) | (19) | 27 | - | 4,768 | |||||||||||||||||||||
Total borrowings at amortized cost | 233,592 | 41,039 | (39,731) | (19) | 69 | 575 | 235,525 | |||||||||||||||||||||
Total | 238,156 | 41,039 | (40,859) | (25) | 69 | 575 | 238,955 | |||||||||||||||||||||
When CMHC holds CMB to maturity or acquires CMB in the primary market, the related cash flows are excluded from the consolidated statement of cash flows. During the year ended 31 December 2019, there were $55 million (2018 – $73 million) of CMB maturities that have been excluded from repayments in the table above and from investment securities – sales and maturities in the consolidated statement of cash flows. There were no purchases in the primary market during the year ended 31 December 2019 (2018 – nil).
Borrowing authorities
The Minister of Finance approves CMHC’s Borrowing Plan annually and establishes limits and parameters for borrowings. The limits and parameters pertain to capital market borrowings and borrowings from the Government of Canada that have been incurred since April 2008 in the Assisted Housing and Mortgage Funding activities.
The Borrowing Authorities were revised in 2018 to apply limits separately to short-term borrowings outstanding and long-term borrowings issued. These limits for 2019 were $5.0 billion and $4.0 billion, respectively (2018 - $4.6 billion and $1.75 billion). Actual short-term borrowings outstanding as at 31 December 2019, and long-term borrowings issued in 2019 were $78 million and $2.0 billion, respectively (2018 - $41 million and $956 million).
The legislative authority, which is separate from the limits above and does not apply to borrowings of CHT, requires that the total indebtedness outstanding at any time, other than to the Government, not exceed $20 billion (2018 – $20 billion). The outstanding principal balance of this indebtedness was nil as at 31 December 2019 (2018 – nil).
A Commitment to Affordability | 2019 Annual Report 91
16. DERIVATIVES
Derivatives are financial contracts whose value is derived from movements in one or more underlying securities, rates, indices or other instruments. We use derivatives in conjunction with our risk management activities.
Interest rate swaps are transactions in which two parties exchange interest cash flows on a specified notional amount for a predetermined period based on agreed-upon fixed and floating rates. Notional amounts are not exchanged. The value of these swaps is derived from movements in interest rates. We use them to manage reinvestment risk, refinancing risk, or mismatches in the timing of receipts from assets versus payments of liabilities.
Foreign currency forward contracts are over-the-counter contracts in which two parties agree to exchange one currency for another at a specified price for settlement at a future predetermined date. The value of these contracts is derived from movements in foreign exchange and interest rates. We use them to manage currency risk associated with U.S. dollar-denominated debt securities.
The table below provides the notional amounts of the derivative transactions recognized in the consolidated financial statements. Notional amounts, which are off-balance sheet, serve as a point of reference for calculating payments and do not represent the fair value, or the potential gain or loss associated with the credit or market risk of such instruments.
| 2019 | 2018 | |||||||||||||||||||||||||||||||
| Average | Fair Value | Average | Fair Value | |||||||||||||||||||||||||||||
| Term to | Notional | Term to | Notional | |||||||||||||||||||||||||||||
| (in millions) | Maturity | Amount | Asset | Liability | Maturity | Amount | Asset | Liability | ||||||||||||||||||||||||
Interest rate swaps | 1 year | 4,587 | 19 | 8 | 2 years | 6,221 | 33 | 18 | ||||||||||||||||||||||||
Foreign currency forward contracts | Within 1 year | 2,407 | 49 | - | 1 year | 2,223 | - | 99 | ||||||||||||||||||||||||
Total | 6,994 | 68 | 8 | 8,444 | 33 | 117 | ||||||||||||||||||||||||||
Credit exposure of derivatives
The following table presents the credit exposure of derivatives by term to maturity. The replacement value is the total current fair value, including accrued interest of all outstanding contracts with a positive fair value, after factoring in the impact of master netting agreements. The replacement value represents our maximum derivative credit exposure. Potential future credit exposure represents an estimate of the potential change in the market value of the transaction up to maturity, which is calculated in relation to the notional principal of the contracts by applying factors consistent with guidelines issued by OSFI.
Credit risk equivalent is the total of the replacement value and the potential future credit exposure. The risk weighted equivalent is determined by applying a standard OSFI-defined measure of counterparty credit risk to the credit equivalent amount.
| Replacement Value | 2019 | 2018 | ||||||||||||||||||||||||||||||
| (in millions) | Within 1 Year | 1 to 5 Years | Over 5 Years | Potential Future Credit Exposure | Credit Risk Equivalent | Risk- weighted Equivalent | Credit Risk Equivalent | Risk- weighted Equivalent | ||||||||||||||||||||||||
Derivatives | 54 | 9 | 2 | 27 | 92 | 18 | 15 | 3 | ||||||||||||||||||||||||
The fair value of the collateral we hold related to our derivatives as at 31 December 2019 was nil (2018 – nil).
92
17. FINANCIAL INSTRUMENTS INCOME AND EXPENSES
Interest income, investment income and interest expense
The following table outlines the total interest income and expense for financial instruments and the dividend income recognized in the consolidated statement of income and comprehensive income.
| 2019 | 2018 | |||||||||||||||||||||||
| (in millions) | Interest Income | Investment Income (loss) | Interest Expense | Interest Income | Investment Income (loss) | Interest Expense | ||||||||||||||||||
Interest for financial instruments not at FVTPL: | ||||||||||||||||||||||||
Cash equivalents | 6 | 11 | - | 5 | 7 | - | ||||||||||||||||||
Debt instruments – FVOCI | - | 464 | - | - | 475 | - | ||||||||||||||||||
Debt instruments – amortized cost | 7 | - | - | - | - | - | ||||||||||||||||||
Loans – amortized cost | 5,383 | - | - | 5,210 | - | - | ||||||||||||||||||
Securities sold under repurchase agreements | - | (1) | - | - | (7) | - | ||||||||||||||||||
Borrowings – amortized cost | - | - | 5,332 | - | - | 5,097 | ||||||||||||||||||
Total interest for financial instruments not at FVTPL | 5,396 | 474 | 5,332 | 5,215 | 475 | 5,097 | ||||||||||||||||||
Interest for financial instruments at FVTPL: | ||||||||||||||||||||||||
Debt instruments | 15 | 1 | - | 20 | 5 | - | ||||||||||||||||||
Loans | 24 | - | - | 39 | - | - | ||||||||||||||||||
Borrowings | - | - | 47 | - | - | 73 | ||||||||||||||||||
Derivatives | 12 | - | - | 20 | - | - | ||||||||||||||||||
Total interest for financial instruments at FVTPL | 51 | 1 | 47 | 79 | 5 | 73 | ||||||||||||||||||
Total interest | 5,447 | 475 | 5,379 | 5,294 | 480 | 5,170 | ||||||||||||||||||
Dividend income1 | - | 8 | - | - | 33 | - | ||||||||||||||||||
Total | 5,447 | 483 | 5,379 | 5,294 | 513 | 5,170 | ||||||||||||||||||
| 1 | Includes dividend income of $3 million recognized on investments still held at the end of the year (2018 – $31 million). |
A Commitment to Affordability | 2019 Annual Report 93
Gains and losses from financial instruments
The following table presents the gains (losses) related to financial instruments recognized in the consolidated statement of income and comprehensive income.
| (in millions) | 2019 | 2018 | ||||||
Financial instruments designated at FVTPL | ||||||||
Investment securities | 6 | 1 | ||||||
Loans | 8 | (6) | ||||||
Borrowings | (19) | 6 | ||||||
Total financial instruments designated at FVTPL | (5) | 1 | ||||||
Financial instruments mandatorily at FVTPL | ||||||||
Equity securities | 66 | (80) | ||||||
Debt instruments | (1) | (2) | ||||||
Derivatives | 96 | (198) | ||||||
Loans | 1 | 2 | ||||||
Total financial instruments mandatorily at FVTPL | 162 | (278) | ||||||
Debt instruments held at FVOCI1 | (106) | 158 | ||||||
Loans at amortized cost – prepayments | 8 | 22 | ||||||
Borrowings – amortized cost2 | 53 | (2) | ||||||
Expected credit loss recoveries on financial assets | - | 2 | ||||||
Total | 112 | (97) | ||||||
| 1 | Includes foreign exchange losses of $121 million (2018 – gains of $180 million) resulting from translation of U.S. dollar-denominated debt securities. |
| 2 | Includes losses from the retirement of borrowings of $11 million (2018 – $18 million), net of gains from the issuance of borrowings of $64 million (2018 – $16 million). |
18. MARKET RISK
Market risk is the risk of adverse financial impacts arising from changes in underlying market factors, including interest rates, foreign exchange rates, and equity prices.
Interest rate risk
Interest rate risk is the risk that the fair value or future cash flows of a financial instrument will fluctuate because of changes in market interest rates.
The investment portfolios for the Mortgage Insurance and Mortgage Funding activities are managed in accordance with their strategic asset allocation (SAA), which limits interest rate risk relative to internal limits and benchmarks.
The Assisted Housing Activity is exposed to interest rate risk when asset and liability principal and interest cash flows have different payment, repricing or maturity dates. Some of our loans contain prepayment and/or repricing options. As we do not have the right to prepay our borrowings from the Government of Canada totalling $8,661 million (2018 – $8,194 million) without penalty, we are exposed to interest rate risk.
We manage interest rate risk in the Assisted Housing Activity’s lending programs differently depending on the cash flow characteristics of the program’s loans and when the loans were originated. Overall sensitivity of the Assisted Housing Activity to interest rate risk is managed by ensuring the economic value of net assets in the lending programs on an aggregated and stand-alone basis plus the reserve fund remains positive under certain interest rate shock scenarios.
94
For certain Assisted Housing Activity loans originated prior to August 2016 and having a gross carrying amount of $1,261 million as at 31 December 2019, we use derivatives to manage reinvestment and refinancing risks as well as mismatches in the timing of cash flows between the loans, reinvested principal receipts and borrowings. For certain Assisted Housing Activity loans originated after July 2016 and having a gross carrying amount of $2,011 million as at 31 December 2019, an asset/liability matching strategy is employed on a portfolio basis whereby we structure our borrowings so that the associated future obligations match the future cash flows to be received on the loans. Under this matching strategy, derivatives are not used and the term over which principal receipts must be reinvested is significantly reduced. Cumulative cash flow mismatches are limited by policy to $30 million.
For one Assisted Housing Activity loan program, closed to new loans since 2011, we manage interest rate risk through matching the present value of cash flows of the program’s assets and liabilities. Loans in this program had a gross carrying amount of $963 million as at 31 December 2019.
For certain other Assisted Housing Activity loan programs having longer-term expected draw schedules, we use loan pricing to manage the uncertainty of the timing of loan cash flows and investment returns earned on borrowed funds. The gross carrying amount of loans in these programs was $535 million as at 31 December 2019.
Interest rate risk on other Assisted Housing Activity loans of $1,381 million as at 31 December 2019 is managed primarily through the maintenance of a reserve fund pursuant to Section 29 of the CMHC Act.
For one Assisted Housing Activity loan program, which provides non-interest bearing loans, we manage interest rate risk through the reception of government funding (appropriations) for interest costs. Loans in this program had a gross carrying amount of $26 million as at 31 December 2019.
Loans under the CMB program are exposed to both interest rate risk and prepayment/reinvestment risk. Prepayment/ reinvestment risk is the risk that NHA MBS may experience varying degrees of prepayment throughout the term and these prepayments must be reinvested immediately. To mitigate these risks, we enter into swap agreements with approved financial institution counterparties. Under these agreements, both interest rate and prepayment/reinvestment risks are transferred to swap counterparties. We pay all interest received from the underlying NHA MBS and reinvestment assets to the swap counterparties and the swap counterparties pay an amount equal to the coupon payments on the CMB. As a result of these swap agreements, changes in interest rates or prepayments/reinvestments related to the CMB program have no impact on the consolidated statement of income and comprehensive income.
Currency risk
Currency risk is the risk that the fair value or future cash flows of a financial instrument will fluctuate because of changes in foreign exchange rates. We are exposed to currency risk from our holdings in foreign currency denominated investment securities. Our internal policies limit the amount of foreign currency investments and require full economic hedging of currency risk. We held $2,334 million in FVOCI debt securities denominated in U.S. dollars as at 31 December 2019 (2018 – $2,278 million).
Our strategy to fully hedge currency risk is to continuously enter into a series of short-term foreign currency forward contracts generally having terms less than one year. Under these contracts, most of which are settled net, we exchange U.S. dollars for Canadian dollars at an exchange rate fixed at the outset of the contract for settlement at a future predetermined date. Given the short terms of the forward contracts, full hedging of currency risk over the life of the foreign-denominated debt securities will require continued application of our strategy in the future. The exposures presented in the Value at Risk table below reflect the mitigating effect of the hedging instruments. Currency risk was assessed as immaterial as at 31 December 2019 (2018 – immaterial) after accounting for derivatives.
Other price risk
Other price risk is the risk that the fair value or future cash flows of a financial instrument will fluctuate because of changes in market prices, other than those giving rise to interest rate and currency risk. We are exposed to other price risk through fluctuations in prices of equity investments held by the Mortgage Insurance Activity. The fair value of these investments as at 31 December 2019 is $118 million (2018 – $689 million). We limit our exposure to equity investments by using tolerance ranges exposure measures.
A Commitment to Affordability | 2019 Annual Report 95
Sensitivity analyses
Value at risk (VaR)
Market risk for investment securities in the Mortgage Insurance and Mortgage Funding activities is evaluated through the use of VaR models. VaR is a statistical technique used to measure the maximum potential loss of an investment portfolio over a specified holding period with a given level of confidence. The VaR for the Mortgage Insurance and Mortgage Funding activities as at 31 December, calculated with 95% confidence over a 22 business day holding period, is outlined in the table below. VaR is presented separately for individual market risk factors and for the total portfolio. The effect of diversification results from the fact that market risks are not perfectly correlated and, consequently, there is a benefit from investment diversification. The VaR figures are based on one year of historical prices and correlations of bond and equity markets and 26 weeks of volatility.
| (in millions) | 2019 | 2018 | ||||||
Investment securities: | ||||||||
Interest rate risk on debt instruments | ||||||||
CAD-denominated securities | 207 | 148 | ||||||
USD-denominated securities | 35 | 30 | ||||||
Equity risk | - | 26 | ||||||
Effect of diversification | (5) | (36) | ||||||
Total VaR | 237 | 168 | ||||||
Interest rate sensitivity
Market risk for the Assisted Housing Activity portfolios of loans, investments, borrowings and swaps is evaluated by measuring their sensitivity to changes in interest rates.
For the Assisted Housing Activity’s financial instruments designated at FVTPL and derivatives, we assessed the impact of a 200 bps shift in interest rates as immaterial as at 31 December 2019.
The Assisted Housing Activity’s loans and borrowings measured at amortized cost are also exposed to interest rate risk. The net impact of a shift in interest rates on their fair value is presented below.
2019 Interest Rate Shift | 2018 Interest Rate Shift | |||||||||||||||
| (in millions) | -200 bps | +200 bps | -200 bps | +200 bps | ||||||||||||
Increase (decrease) in fair value of net assets1 | (260) | 211 | (75) | 63 | ||||||||||||
| 1 | The changes in fair value of net assets resulting from interest rate shifts presented in this table would not be recognized in comprehensive income as the underlying financial instruments are measured at amortized cost. |
The Assisted Housing Activity’s net interest income is also sensitive to interest rate movements. The maximum negative exposure of net interest income is $0.6 million as at 31 December 2019 (2018 – $0.5 million). This is calculated by scenario analysis using multiple simulations of interest rate volatility with 95% confidence over a one-year period.
96
19. CREDIT RISK
Credit risk is the potential for financial loss arising from failure of a borrower or an institutional counterparty to fulfill its contractual obligations. We are exposed to credit risk from various sources, including borrower default through mortgage insurance contracts and institutional counterparty credit risk arising from financial guarantees under the NHA MBS and CMB programs, lending arrangements, fixed-income investments and derivative transactions. A detailed breakdown of credit risk is presented below.
Maximum exposure to credit risk
| ||||||||
(in billions)
|
2019
|
2018
| ||||||
Mortgage insurance: insurance-in-force (Note 7) | 429 | 448 | ||||||
TPGs: guarantees-in-force (Note 8)1 | 493 | 488 | ||||||
1 Exposure includes underlying instruments which are also insured by CMHC or other mortgage insurers. |
| |||||||
For all financial assets other than guarantees or derivatives, the maximum exposure to credit risk is the carrying amount. For derivatives, the maximum exposure to credit risk is indicated in Note 16.
Credit risk associated with mortgage insurance is managed through prudent product design, underwriting and default management practices, and the establishment of adequate capital reserves as described in Notes 7 and 10.
Credit risk associated with TPGs is managed through due diligence in approving NHA MBS Issuers, ongoing monitoring of Issuer credit quality and program compliance, and the requirement that all mortgages supporting the NHA MBS be insured against borrower default. We have further mitigated this risk by having been assigned all rights, title and interest in the underlying mortgages so that we have access to principal and interest payments in the event of Issuer default.
Credit risk associated with loans in the Assisted Housing Activity is in part mitigated through measures that include loan guarantees from other government entities as described in Note 14. Losses due to default are largely recoverable from various levels of government.
Under the CMB program, loans represent amounts due from Canadian financial institutions as a result of the sale of their beneficial interest in NHA MBS securities to us. The loans are collateralized by the NHA MBS and associated reinvestment securities acquired in the transactions. The collateral is held in our name and represents the sole source of principal repayments for the loans. CMB program collateral held is rated R-1 (high) or AAA by at least two rating agencies.
Under the CMB program, we are exposed to credit-related counterparty risk in the event of default of swap counterparties. This risk is mitigated by transacting with highly rated swap counterparties and collateralization requirements based on credit ratings. All swap counterparties must have a minimum credit rating of BBB (high), or its equivalent, by at least two rating agencies.
The fair value of total loan collateral held under the CMB program was $247,411 million, 101.2% of loan carrying value, as at 31 December 2019 (2018 – $235,576 million, 100.4% of loan carrying value).
Credit risk associated with fixed-income investments and derivatives is managed through the implementation of policies which include minimum counterparty credit ratings and investment portfolio diversification limits by issuer, credit rating, term and by industry sector, and through the use of appropriate legal agreements and collateralization requirements for derivatives.
A Commitment to Affordability | 2019 Annual Report 97
Concentration risk
Concentration risk arises from holdings of financial instruments issued by entities that operate in the same sector or geographic area or engage in similar activities such that they may be affected similarly by changes in economic or other conditions.
The following table presents the concentration of credit risk, by sector and geographic region, of our investment securities and derivative transactions:
(in millions, unless otherwise indicated)
|
2019
|
2018
| ||||||||||||||
By sector: | ||||||||||||||||
Federal | 9,834 | 42.1 | % | 4,960 | 24.0 | % | ||||||||||
Provincial | 4,760 | 20.3 | % | 5,088 | 24.7 | % | ||||||||||
Industrial | 2,848 | 12.2 | % | 3,148 | 15.3 | % | ||||||||||
Financial | 2,581 | 11.0 | % | 3,568 | 17.3 | % | ||||||||||
Energy | 889 | 3.8 | % | 1,239 | 6.0 | % | ||||||||||
Other
|
| 2,467
|
|
| 10.6
| %
|
| 2,621
|
|
| 12.7
| %
| ||||
Total1
|
| 23,379
|
|
| 100.0
| %
|
| 20,624
|
|
| 100
| %
| ||||
By geographic region: | ||||||||||||||||
Canada | 19,575 | 83.7 | % | 16,654 | 80.8 | % | ||||||||||
U.S. | 2,547 | 10.9 | % | 2,730 | 13.2 | % | ||||||||||
Other
|
| 1,257
|
|
| 5.4
| %
|
| 1,240
|
|
| 6.0
| %
| ||||
Total1
|
| 23,379
|
|
| 100.0
| %
|
| 20,624
|
|
| 100
| %
| ||||
1 Total comprised of cash equivalents of $922 million (2018 – $836 million), investment securities of $22,389 million (2018 – $19,755 million) and derivatives with a positive fair value, net of collateral, of $68 million (2018 – $33 million). |
| |||||||||||||||
Credit quality
The following table presents the credit quality of the cash equivalents and investment securities based on an internal credit rating system.1
| 2019 | 2018 | |||||||||||||||||||||||||||||||
| (in millions) | AAA | AA- to AA+ | A- to A+ | Lower than A- | AAA | AA- to AA+ | A-to A+ | Lower than A- | ||||||||||||||||||||||||
Cash equivalents | 286 | 100 | 510 | 26 | 143 | 75 | 458 | 160 | ||||||||||||||||||||||||
Investment securities2 | ||||||||||||||||||||||||||||||||
FVTPL | 266 | 216 | 205 | 4 | 368 | 265 | 355 | 13 | ||||||||||||||||||||||||
FVOCI | 9,973 | 1,653 | 7,591 | 1,416 | 5,510 | 1,975 | 8,917 | 1,762 | ||||||||||||||||||||||||
Amortized cost
|
| 434
|
|
| 213
|
|
| 300
|
|
| -
|
|
| -
|
|
| -
|
|
| -
|
|
| -
|
| ||||||||
1 The internal credit ratings are based upon internal assessments of the counterparty creditworthiness. These ratings correspond to those provided by the credit rating agencies except in cases where stand-alone ratings exist. A counterparty internal credit rating cannot be higher than the highest stand-alone rating from any of the agencies. A stand-alone rating removes the assumption of Government support from the rating. 2 Includes fixed-income investments and preferred equity only. |
| |||||||||||||||||||||||||||||||
98
Derivatives
We limit the credit risk associated with derivative transactions by dealing with counterparties whose credit ratings are in accordance with our Enterprise Risk Management Policies; through the use of International Swaps Derivatives Association (ISDA) master agreements for derivatives; and, where appropriate, through the use of ratings-based collateral thresholds in the Credit Support Annexes (CSA).
ISDA is a master agreement that sets out standard terms that apply to all transactions we entered into with the counterparty. The ISDA outlines procedures and calculations of termination costs in the event of default by either party. The ISDA master agreements give us a legally enforceable right to settle all transactions covered by the agreement with the same counterparty on a net basis in the event of default. All derivative counterparties must have a minimum credit rating of A-, or its equivalent, from at least two rating agencies.
The CSA document, included in the ISDA master agreements, regulates the collateral requirements of derivative transactions and the terms under which collateral is transferred to mitigate credit risk. The CSA gives us the right, in the event of default, to liquidate collateral held and apply proceeds received from liquidation against amounts due from the counterparty. Collateral held to offset mark-to-market exposures is not used for any other purpose than to offset such exposure.
Securities purchased under resale agreements
By their nature, these balances have low credit risk given their short terms and are secured by the underlying securities purchased under the agreements and any incremental margin obtained from counterparties.
These transactions are subject to Global Master Repurchase Agreements that set out the standard terms of all repurchase agreements transacted with each counterparty. These agreements give us a legally enforceable right to settle all repurchase transactions with the same counterparty on a net basis in the event of default. These agreements also provide for the posting of margin by the counterparty when our exposure to that entity exceeds a certain ratings-based threshold. Securities held as eligible margin include debt obligations issued by or guaranteed by the Government, including Crown corporations and CHT. Margin securities should not be used for any other purpose than to offset such exposure. In the event of counterparty default, we have the right to liquidate these securities. We did not hold any margin securities as at 31 December 2019 (2018 – nil).
Netting arrangements and offsetting of financial assets and financial liabilities
The following tables present the potential effects of the netting arrangements described above.
Financial assets
| (i) | (ii) | (iii) = (i) - (ii) | (iv) | (v) = (iii) - (iv) | ||||||||||||||||||||
| Gross | | | Gross Amount | | | Net Amount of Assets Presented | | | Gross Amount Not Offset in the Consolidated Balance Sheet | |
| Net Amount |
| ||||||||||
(in millions) | | Financial Instruments | 2 | | Financial Collateral Received | 3 | ||||||||||||||||||
2019 | ||||||||||||||||||||||||
Derivatives1 | 75 | - | 75 | (10 | ) | - | 65 | |||||||||||||||||
2018 | ||||||||||||||||||||||||
Derivatives1 | 46 | - | 46 | (43 | ) | - | 3 | |||||||||||||||||
| 1 | Derivatives are carried at fair value. Securities purchased under resale agreements are carried at amortized cost. |
| 2 | Gross amounts of financial instruments not offset in the consolidated balance sheet refers to amounts recorded to derivative liabilities and securities sold under repurchase agreements where we have a legally enforceable right to offset against amounts recorded to derivative assets and securities purchased under resale agreements, on a counterparty-by-counterparty basis, in the event of default of the counterparty. |
| 3 | We have the right, in the event of default, to liquidate and apply financial collateral held against amounts due from counterparties. For derivatives, these amounts represent the fair value of collateral posted by swap counterparties to us. For securities purchased under resale agreements, these amounts represent fair value of margin posted by counterparties and of securities we purchased with the commitment to resell to the counterparty at a future date. |
A Commitment to Affordability | 2019 Annual Report 99
Derivative assets, as presented in the above table, are reconciled to the consolidated balance sheet as follows:
| (in millions) | 2019 | 2018 | ||||||
Derivative assets presented in offsetting table | 75 | 46 | ||||||
Less: Accrued interest receivable presented separately in consolidated balance sheet | (7) | (13) | ||||||
Derivative asset balance presented in the consolidated balance sheet | 68 | 33 | ||||||
Financial liabilities
| (i) | (ii) | (iii) = (i) - (ii) | (iv) | (v) = (iii) - (iv) | ||||||||||||||||||||
Gross | Gross Amount | Net Amount of Liabilities | Gross Amount Not Offset in the Consolidated Balance Sheet | |||||||||||||||||||||
| (in millions) | Financial Instruments2 | Financial Collateral Pledged3 | Net Amount | |||||||||||||||||||||
2019 | ||||||||||||||||||||||||
| Derivatives1 | 10 | - | 10 | (10 | ) | - | - | |||||||||||||||||
| Securities sold under repurchase agreements1 | - | - | - | - | - | - | ||||||||||||||||||
Total | 10 | - | 10 | (10 | ) | - | - | |||||||||||||||||
2018 | ||||||||||||||||||||||||
| Derivatives1 | 120 | - | 120 | (43 | ) | - | 77 | |||||||||||||||||
| Securities sold under repurchase agreements1 | 280 | - | 280 | - | (281 | ) | (1 | ) | ||||||||||||||||
Total | 400 | - | 400 | (43 | ) | (281 | ) | 76 | ||||||||||||||||
| 1 | Derivatives are carried at fair value. Securities sold under repurchase agreements are carried at amortized cost. |
| 2 | Gross amounts of financial instruments not offset in the consolidated balance sheet refers to amounts recorded to derivative assets and securities purchased under resale agreements where we have a legally enforceable right to offset against amounts recorded to derivative liabilities and securities sold under repurchase agreements, on a counterparty-by-counterparty basis, in the event of default of the counterparty. |
| 3 | Represents the fair value of securities we sold to counterparties with our commitment to repurchase from the counterparty at a future date, net of the fair value of any margin posted by our counterparties. |
Derivative liabilities, as presented in the above table, are reconciled to the consolidated balance sheet as follows:
| (in millions) | 2019 | 2018 | ||||||
Derivative liabilities presented in offsetting table | 10 | 120 | ||||||
Less: Accrued interest payable presented separately in consolidated balance sheet | (2) | (3) | ||||||
Derivative liabilities balance presented in the consolidated balance sheet | 8 | 117 | ||||||
100
20. LIQUIDITY RISK
Liquidity risk is the risk that we will encounter difficulty in meeting obligations associated with financial liabilities. Liquidity risk comprises both funding liquidity risk, which is the risk that we will be unable to meet our payment obligations when required due to an inability to borrow or realize on overdraft facilities, and market liquidity risk, which is the risk that we are not able to unwind or offset a particular position without incurring losses because of inadequate market depth or market disruption.
The principal financial obligations exposing us to liquidity risk include, but are not limited to:
| • | the payment of claims incurred by the Mortgage Insurance Activity; |
| • | the need to fulfill the TPGs we have issued if sufficient funds are not available for the payment of principal or interest on NHA MBS or CMB by Approved Issuers or CHT, respectively; and |
| • | payments required by borrowings and derivatives. |
We have a liquidity risk policy that includes appropriate limits and other mitigants to ensure sufficient resources to meet current and projected cash requirements.
The Mortgage Insurance and Mortgage Funding activities’ investment portfolios are managed to ensure that there is sufficient cash flow to meet projected claims. Sources of liquidity include fees, premiums, investment income, and proceeds from sales and maturities of investments.
Within the NHA MBS and CMB programs, liquidity risk refers to the risk that we may not be able to provide the funding required, in a timely fashion, to satisfy a call on our TPG obligations. As guarantor, we are exposed to the risk of NHA MBS issuer default, CMB program repo and swap counterparty default, impairment of eligible CMB program collateral securities and system or other operational failures. With respect to our TPGs, our policy is to maintain sufficient liquidity to cover the largest exposure to a single counterparty on a given payment date. Cash, short-term investments and investment securities held in any of CMHC’s activities can be utilized to satisfy a call on the TPGs. Additional liquidity sources in the event of an immediate need to fulfill the TPGs include overdraft facilities and a $350-million line of credit with the Central Paying Agent. The Central Paying Agent acts on CHT’s behalf to carry out certain payment functions in the CMB program, including collection of monthly payments on NHA MBS purchased and administration and reporting of cash flows. Other policies in place to mitigate liquidity risk include ensuring high credit quality investments as permitted by the CHT trust agreements and swap counterparties and the establishment of maturity monitoring guidelines.
The Assisted Housing Activity investment portfolio is managed to ensure that there is sufficient cash flow to meet funding needs in case of contingencies causing operational disruptions, unanticipated needs, and to facilitate use of the Crown Borrowing Program. The asset/liability management strategy ensures that the assets are maintained at the same level as the liabilities. Derivatives are used to hedge mismatches in the timing of cash flows. Further sources of liquidity associated with this portfolio include overdraft facilities and cash and short-term investments in marketable securities. For any additional liquidity requirements, we can access the Crown Borrowing Program upon Department of Finance approval.
As at 31 December 2019, we had $300 million (2018 – $300 million) of overnight overdraft facilities available with our banker and we had drawn $2 million under these facilities (2018 – nil).
We also mitigate liquidity risk through the use of ISDA master netting agreements reducing the amount of cash required to satisfy derivative obligations.
A Commitment to Affordability | 2019 Annual Report 101
Maturity analysis
The following table presents the expected payout pattern of our financial liabilities, including accrued interest; this table therefore cannot be reconciled to the consolidated balance sheet.
(in millions) | | Within 1 Month | | | 1 to 3 Months |
| | 3 to 12 Months |
| | 1 to 5 Years |
| | Over 5 Years | | | Total 2019 | | ||||||
Accounts payable and other liabilities | 27 | 116 | 167 | 191 | 24 | 525 | ||||||||||||||||||
Derivatives | 2 | 2 | 1 | 1 | - | 6 | ||||||||||||||||||
Provision for claims | 30 | 53 | 218 | 73 | 33 | 407 | ||||||||||||||||||
Borrowings – designated at FVTPL | 56 | 300 | 961 | 1,020 | 199 | 2,536 | ||||||||||||||||||
Borrowings – amortized cost | 21 | 11,392 | 34,513 | 171,586 | 54,032 | 271,544 | ||||||||||||||||||
Total | 136 | 11,863 | 35,860 | 172,871 | 54,288 | 275,018 | ||||||||||||||||||
| ||||||||||||||||||||||||
(in millions) | | Within 1 Month | | | 1 to 3 Months |
| | 3 to 12 Months |
| | 1 to 5 Years |
| | Over 5 Years |
| | Total 2018 | | ||||||
Securities sold under repurchase agreements | 129 | 151 | - | - | - | 280 | ||||||||||||||||||
Accounts payable and other liabilities | 21 | 148 | 84 | 102 | 6 | 361 | ||||||||||||||||||
Dividends payable | 675 | - | - | - | - | 675 | ||||||||||||||||||
Derivatives | 1 | 1 | 103 | 6 | - | 111 | ||||||||||||||||||
Provision for claims | 47 | 48 | 218 | 95 | 43 | 451 | ||||||||||||||||||
Borrowings – designated at FVTPL | 300 | 264 | 583 | 2,196 | 232 | 3,575 | ||||||||||||||||||
Borrowings – amortized cost | 59 | 5,711 | 30,753 | 173,839 | 50,334 | 260,696 | ||||||||||||||||||
Total | 1,232 | 6,323 | 31,741 | 176,238 | 50,615 | 266,149 | ||||||||||||||||||
Commitments related to loans and financial guarantees are disclosed in Note 14 and Note 8, respectively.
21. ACCOUNTS RECEIVABLE AND OTHER ASSETS
The following table presents the composition of accounts receivable and other assets.
(in millions) | 2019 | 2018 | ||||||
Deferred Government of Canada fees | 261 | 244 | ||||||
Deferred acquisition costs (Note 7) | 194 | 181 | ||||||
Fixed and intangible assets | 139 | 122 | ||||||
Net estimated borrower recoveries | 79 | 82 | ||||||
Non-current assets held for sale | 59 | 69 | ||||||
Right-of-use assets | 47 | - | ||||||
Accounts receivable | 30 | 40 | ||||||
Income taxes receivable | - | 85 | ||||||
Other | 39 | 33 | ||||||
Total | 848 | 856 | ||||||
102
22. INVESTMENT PROPERTY
The following table presents the changes in the investment property balance. Disclosures related to the determination of fair value of investment property are included in Note 11.
2019
|
2018
| |||||||||||||||||||||||
| (in millions) | Mortgage Insurance | Assisted Housing | Total | Mortgage Insurance | Assisted Housing | Total | ||||||||||||||||||
Balance at beginning of year | 47 | 264 | 311 | 49 | 256 | 305 | ||||||||||||||||||
Additions | - | - | - | 1 | - | 1 | ||||||||||||||||||
Disposals1 | (38 | ) | - | (38 | ) | - | - | - | ||||||||||||||||
Net unrealized gains (losses) in net income2
|
| -
|
|
| 3
|
|
| 3
|
|
| (3
| )
|
| 8
|
|
| 5
|
| ||||||
Balance at end of year
|
| 9
|
|
| 267
|
|
| 276
|
|
| 47
|
|
| 264
|
|
| 311
|
| ||||||
1 There were no disposals in exchange for non-cash consideration in 2019 or 2018. 2 Included in other income. |
| |||||||||||||||||||||||
23. ACCOUNTS PAYABLE AND OTHER LIABILITIES
The following table presents the composition of accounts payable and other liabilities.
| (in millions) | 2019 | 2018 | ||||||
Accrued housing programs expenses | 240 | 140 | ||||||
Income taxes payable | 142 | - | ||||||
Accrued expenses | 85 | 85 | ||||||
Government of Canada fees | 85 | 80 | ||||||
Self-insured provision | 50 | 61 | ||||||
Lease liabilities | 48 | - | ||||||
Affordable Rental Housing Innovation Fund deferred funding | 46 | 79 | ||||||
Other miscellaneous liabilities
|
| 100
|
|
| 122
|
| ||
Total
|
| 796
|
|
| 567
|
| ||
24. PENSION AND OTHER POST-EMPLOYMENT BENEFITS
Defined benefit plans
The defined benefit plans include the defined benefit Pension Plan and Supplemental Plan as well as the other non-pension post-employment defined benefit plans.
Effective 4 April 2013, the defined benefit components of the Pension Plan and the Supplemental Plan were closed to new entrants. Eligible employees joining the Corporation after this date were enrolled in the defined contribution component of the plans. In 2016, the Corporation segregated the defined contribution component of the Pension Plan and transferred the contributions into a new stand-alone defined contribution pension plan. The new stand-alone defined contribution plan was closed to new entrants as of 31 December 2017 and all eligible members were transferred to a new modified defined benefit pension plan. All pension plan modifications will only apply to service that follows the implementation date of 1 January 2018. All benefits earned by employees under the existing plans prior to the implementation date will remain unchanged.
A Commitment to Affordability | 2019 Annual Report 103
Our defined benefit Pension Plan requires contributions to be made to a separately administered fund (Pension Fund) whereas the defined benefit Supplemental Plan and the other non-pension post-employment defined benefits are unfunded and the benefits are paid directly by the Corporation.
Pursuant to a trust agreement we entered into with the Pension Fund Trustees (the Trustees), they are responsible for the management and administration of the Pension Fund. There are seven Trustees, including our President, one member of our Board of Directors, three members of Senior Management and two Pension Council members (a combination of current and retired employees). The Trustees set investment policies and objectives within the context of the investment philosophy and Risk Appetite Framework established by the Board of Directors and periodically review these policies. The Pension Fund’s Investment Committee assists the Trustees in the investment management of the defined benefit Pension Plan.
The Pension Fund’s asset allocation policy is based upon the principle of diversification of investments among various asset classes relative to the liabilities of the defined benefit Pension Plan. The current policy, which is based on liability-driven investment principles, has been established at 40% public equity investments, 41% fixed-income securities and 19% real estate and infrastructure, on a net asset basis. The policy includes permissible ranges around these percentage weights. Additionally, the policy allows for the use of a modest level of leverage of 25% of net asset value to purchase fixed-income assets to reduce the interest rate risk of the portfolio. The investments of the Pension Fund are subject to credit, liquidity and market risks. The most significant of these risks is asset volatility due to market conditions. For service accrued before 1 January 2018, benefits are indexed to the Consumer Price Index (CPI) in accordance with the Pension Plan rules. For service accrued after 1 January 2018, indexation of the benefits to the CPI are conditional in accordance with the Pension Plan rules and upon approval from the Board of Directors. As such, liabilities that are adjusted to CPI are subject to interest rate risks, inflation risk and changes in the life expectancy of the plan members. The most significant risk is interest rate risk as the present value of the liabilities is calculated using a discount rate set with reference to Canadian AA-rated corporate bond yields. If the Pension Fund assets underperform this yield, the funded position of the defined benefit Pension Plan decreases. Financial risks are managed primarily through the diversification of assets and prudent investment strategies.
The actuarial valuation on a going concern basis of our defined benefit component of the Pension Plan reports a surplus as at 31 December 2019. As a result, we are not required to make going concern special payments. The valuation on a solvency basis, which assumes that the plan is wound up at the valuation date, reports a decreasing deficit as at 31 December 2019.
We continue to make full normal contributions and to monitor the defined benefit Pension Plan. The next actuarial valuation will be undertaken as at 31 December 2020, with the results reported in the 2020 consolidated financial statements.
The defined benefit obligation relating to the defined benefit plans is funded as follows:
Pension Benefit Plans
|
Other Post-employment
| |||||||||||||||
(in millions) | 2019 | 2018 | 2019 | 2018 | ||||||||||||
Wholly or partially funded | 2,477 | 2,135 | - | - | ||||||||||||
Wholly unfunded
|
| 102
|
|
| 85
|
|
| 129
|
|
| 118
|
| ||||
Defined benefit obligation |
| 2,579
|
|
| 2,220
|
|
| 129
|
|
| 118
|
| ||||
104
Defined benefit pension and other post-employment benefit plans
The following tables present information about the defined benefit plans.
| | Pension Expense Included in Net Income |
| ||||||||||||||||||||||||||||||||||
| 2019 (in millions) | 1 Jan 2019 | Current Service Cost | Interest Cost/ (income) | Sub-total Included in Net Income | Benefits Paid |
Remeasurements of the Net Defined Benefit Plans Incl. in OCI1 | Employees’ Contributions | CMHC’s Contributions | 31 Dec 2019 | |||||||||||||||||||||||||||
Pension benefit plans | ||||||||||||||||||||||||||||||||||||
Defined benefit obligation | 2,220 | 36 | 84 | 120 | (99) | 312 | 26 | - | 2,579 | |||||||||||||||||||||||||||
Fair value of plan assets | (1,984) | - | (74) | (74) | 99 | (241) | (26) | (33) | (2,259) | |||||||||||||||||||||||||||
Pension benefit plans liability | 236 | 36 | 10 | 46 | - | 71 | - | (33) | 320 | |||||||||||||||||||||||||||
Other post-employment benefit plans | ||||||||||||||||||||||||||||||||||||
Defined benefit obligation | 118 | 1 | 5 | 6 | (5) | 10 | - | - | 129 | |||||||||||||||||||||||||||
Fair value of plan assets | - | - | - | - | 5 | - | - | (5) | - | |||||||||||||||||||||||||||
Other post-employment benefit plans liability | 118 | 1 | 5 | 6 | - | 10 | - | (5) | 129 | |||||||||||||||||||||||||||
Defined benefit plans liability | 354 | 37 | 15 | 52 | - | 81 | - | (38) | 449 | |||||||||||||||||||||||||||
1 The detailed breakdown of remeasurement gains and losses on defined benefit plans included in OCI is found in additional tables below.
|
| |||||||||||||||||||||||||||||||||||
| | Pension Expense Included in Net Income |
| ||||||||||||||||||||||||||||||||||
2018 (in millions) | | 1 Jan 2018 |
| | Current Service Cost |
| | Interest Cost/ (income) |
| | Sub-total Included in Net Income |
| | Benefits Paid |
|
|
Remeasurements of the Net Defined Benefit Plans Incl. in OCI1 |
| | Employees’ Contributions |
| | CMHC’s Contributions |
| | 31 Dec 2018 |
| |||||||||
Pension benefit plans | ||||||||||||||||||||||||||||||||||||
Defined benefit obligation | 2,356 | 39 | 78 | 117 | (105) | (164) | 16 | - | 2,220 | |||||||||||||||||||||||||||
Fair value of plan assets | (2,041) | - | (66) | (66) | 105 | 87 | (16) | (53) | (1,984) | |||||||||||||||||||||||||||
Pension benefit plans liability | 315 | 39 | 12 | 51 | - | (77) | - | (53) | 236 | |||||||||||||||||||||||||||
Other post- employment benefit plans | ||||||||||||||||||||||||||||||||||||
Defined benefit obligation | 135 | 2 | 5 | 7 | (6) | (18) | - | - | 118 | |||||||||||||||||||||||||||
Fair value of plan assets | - | - | - | - | 6 | - | - | (6) | - | |||||||||||||||||||||||||||
Other post- employment benefit plans liability | 135 | 2 | 5 | 7 | - | (18) | - | (6) | 118 | |||||||||||||||||||||||||||
Defined benefit plans liability | 450 | 41 | 17 | 58 | - | (95) | - | (59) | 354 | |||||||||||||||||||||||||||
1 The detailed breakdown of remeasurement gains and losses on defined benefit plans included in OCI is found in additional tables below.
A Commitment to Affordability | 2019 Annual Report 105
The following table presents further detailed information on the various sources of remeasurement in OCI included in the prior table.
| | Remeasurement (gains)/Losses Included in OCI |
| ||||||||||||||||||
(in millions) | Return on Plan Assets (excluding interest income) | Actuarial Changes Arising from Changes in Demographic Assumptions | Actuarial Changes Arising from Changes in Financial Assumptions | Actuarial Changes Arising from Plan Experience | Total Included in OCI | |||||||||||||||
Year ended 31 December 2019 | ||||||||||||||||||||
Pension benefit plans | ||||||||||||||||||||
Defined benefit obligation | - | (14) | 310 | 16 | 312 | |||||||||||||||
Fair value of plan assets | (241) | - | - | - | (241) | |||||||||||||||
Pension benefit plans liability | (241) | (14) | 310 | 16 | 71 | |||||||||||||||
Other post-employment benefit plans | ||||||||||||||||||||
Defined benefit obligation | - | - | 10 | - | 10 | |||||||||||||||
Defined benefit plans liability | (241) | (14) | 320 | 16 | 81 | |||||||||||||||
Year ended 31 December 2018 | ||||||||||||||||||||
Pension benefit plans | ||||||||||||||||||||
Defined benefit obligation | - | - | (182) | 18 | (164) | |||||||||||||||
Fair value of plan assets | 87 | - | - | - | 87 | |||||||||||||||
Pension benefit plans liability | 87 | - | (182) | 18 | (77) | |||||||||||||||
Other post-employment benefit plans | ||||||||||||||||||||
Defined benefit obligation | - | (11) | (14) | 7 | (18) | |||||||||||||||
Defined benefit plans liability | 87 | (11) | (196) | 25 | (95) | |||||||||||||||
The remeasurement of plan assets is the difference between the actual rate of return on the defined benefit pension plan assets and the discount rate used to measure the obligation. The actual return on plan assets was $315 million (2018 – loss on plan assets of $21 million).
106
The following table presents information on the fair value of the plan assets.
(in millions, unless otherwise indicated) | | 2019 |
| 2018 | ||||||||||||||||||||||||||||
| Quoted | Unquoted | Total | % | Quoted | Unquoted | Total | % | |||||||||||||||||||||||||
Cash | 5 | - | 5 | 0.2% | 7 | - | 7 | 0.4% | ||||||||||||||||||||||||
Short-term investments1 | 10 | 51 | 61 | 2.7% | 27 | 32 | 59 | 3.0% | ||||||||||||||||||||||||
Bonds and debentures2 | ||||||||||||||||||||||||||||||||
Securities issued or guaranteed by the Government of Canada | 147 | 61 | 208 | 9.2% | 180 | 3 | 183 | 9.2% | ||||||||||||||||||||||||
Other securities | 256 | 661 | 917 | 40.7% | 114 | 724 | 838 | 42.2% | ||||||||||||||||||||||||
Equities | ||||||||||||||||||||||||||||||||
Canadian equities | 449 | - | 449 | 19.9% | 395 | - | 395 | 19.9% | ||||||||||||||||||||||||
Foreign equities | 541 | 3 | 544 | 24.1% | 475 | - | 475 | 24.0% | ||||||||||||||||||||||||
Infrastructure | - | 111 | 111 | 4.9% | - | 78 | 78 | 3.9% | ||||||||||||||||||||||||
Other real assets | - | 10 | 10 | 0.4% | - | - | - | - | ||||||||||||||||||||||||
Real return securities3 | - | 267 | 267 | 11.8% | 214 | 28 | 242 | 12.2% | ||||||||||||||||||||||||
Real estate, net of mortgages payable | - | 254 | 254 | 11.2% | - | 223 | 223 | 11.2% | ||||||||||||||||||||||||
Securities sold under repurchase agreements | - | (565) | (565) | (25.0)% | - | (500) | (500) | (25.2)% | ||||||||||||||||||||||||
Other liabilities net of non-investment assets | - | (2) | (2) | (0.1)% | - | (16) | (16) | (0.8)% | ||||||||||||||||||||||||
Total | 1,408 | 851 | 2,259 | 100.0% | 1,412 | 572 | 1,984 | 100.0% | ||||||||||||||||||||||||
| 1 | Includes $10 million or 0.4% (2018 – $27 million or 1.4%) of investments made in securities issued or guaranteed by related parties. |
| 2 | Includes $67 million or 3% (2018 – $51 million or 2.6%) of investments made in securities we guaranteed (CMB) and $141 million or 6.2% (2018 – $132 million or 6.7%) of investments made in securities issued or guaranteed by related parties. |
| 3 | Includes $263 million or 11.6% (2018 – $238 million or 12.0%) of investments made in securities issued or guaranteed by related parties. |
A Commitment to Affordability | 2019 Annual Report 107
Assumptions
The assets and obligation of the defined benefits were measured for accounting purposes as at 31 December 2019. In performing this measurement, the following assumptions were adopted.
| Pension Benefit Plans | Other Post-employment Benefit Plans | |||||||||
2019
|
2018
|
2019
|
2018
| |||||||
Defined benefit obligation | ||||||||||
Discount rate | 3.1% | 3.9% | 3.1% | 3.9% | ||||||
Rate of compensation increase | 3.3% | 3.3% | 3.3% | 3.3% | ||||||
Inflation rate | 2.0% | 2.0% | 2.0% | 2.0% | ||||||
Benefit costs | ||||||||||
Discount rate | 3.9% | 3.4% | 3.9% | 3.4% | ||||||
Rate of compensation increase | 3.3% | 3.3% | 3.3% | 3.3% | ||||||
Inflation rate | 2.0% | 2.0% | 2.0% | 2.0% | ||||||
Assumed medical cost trend | ||||||||||
Initial medical cost trend rate | - | - | 5.4% | 5.4% | ||||||
Medical cost trend rate declines to1 | - | - | 4.0% | 4.0% | ||||||
Year that the rate reaches the ultimate trend rate | - | - | 2040 | 2040 | ||||||
Life expectancy of plan members at age 65 | ||||||||||
|
Defined Benefit Plan: 23 years Supplemental Plan: 24 years |
Defined Benefit Plan: 24 years Supplemental Plan: 24 years | ||||||||
| ||||||||||
| Male | 23 years | 24 years | ||||||||
| ||||||||||
| Defined Benefit Plan: 25 years Supplemental Plan: 26 years | Defined Benefit Plan: 25 years Supplemental Plan: 25 years | ||||||||
| ||||||||||
| ||||||||||
| Female | 25 years | 25 years | ||||||||
| ||||||||||
| ||||||||||
1 Average decrease per year of 0.1% (2018 – 0.1%).
The discount rates are determined by reference to Canadian AA-rated corporate bonds with terms to maturity approximating the duration of the defined benefit obligation. The weighted average duration of the defined pension benefit obligation is 16.3 years (2018 – 15 years).
The mortality assumptions used are derived from standard tables published by the Canadian Institute of Actuaries.
108
Sensitivity
The following table shows the impact of changes in the assumptions.
(in millions)
| Increase (decrease) in Defined Benefit Obligation
| Increase (decrease) in Net Benefit Costs Recognized in
| ||||||||
50 bps increase/decrease in discount rate | (209)/238 | (12)/12 | ||||||||
50 bps increase/decrease in rate of compensation increase | 29/(28) | 3/(3) | ||||||||
10 bps increase/decrease in inflation rate | 36/(35) | 2/(2) | ||||||||
100 bps increase/decrease in health care cost trend rates | 10/(8) | - | ||||||||
One-year increase in life expectancy of plan members | 86 | 4 | ||||||||
The above sensitivity analyses are based on a change in one assumption, while holding all other assumptions constant. In practice, this is unlikely to occur and changes in some of the assumptions might be correlated. The method and types of assumptions used in preparing the sensitivity analyses have not changed from the previous year.
Cash flows
In 2020, we expect to make contributions to the defined benefit plans of approximately $31 million.
25. INCOME TAXES
The following table presents the components of income tax.
| (in millions)
| 2019 | 2018 | ||||
Current income tax expense | 472 | 452 | ||||
Deferred income tax relating to origination and reversal of temporary differences | 52 | 10 | ||||
Total income tax expense included in net income | 524 | 462 | ||||
Income tax expense (recovery) on other comprehensive loss | ||||||
Net unrealized gains (losses) from FVOCI financial instruments | 72 | (37) | ||||
Reclassification of prior years’ net unrealized gains realized in the period in net income | 2 | (8) | ||||
Remeasurement gains (losses) on defined benefit plans | (13) | 16 | ||||
Total income tax recovery included in other comprehensive loss | 61 | (29) | ||||
Total | 585 | 433 | ||||
The following is a reconciliation of the statutory tax rate to the effective tax rate.
| ||||||
(in millions, unless otherwise indicated)
| 2019 | 2018 | ||||
Income before income taxes | 2,104 | 1,879 | ||||
Statutory tax rate | 25% | 25% | ||||
Income taxes computed at statutory tax rate | 526 | 470 | ||||
Permanent differences | (2) | (8) | ||||
Income tax expense | 524 | 462 | ||||
Effective tax rate | 24.9% | 24.6% | ||||
The statutory tax rate of 25% is comprised of the federal income tax rate of 38% less the general rate reduction of 13%.
A Commitment to Affordability | 2019 Annual Report 109
The following tables present the tax-effected temporary differences which result in deferred income tax assets and liabilities.
(in millions)
| 2018
| Change Through Net Income
| Change Through
| Change Through
| 2019
| |||||||
Deferred income tax assets | ||||||||||||
Fair value of financial instruments | 6 | (34) | 11 | - | (17) | |||||||
Post-employment benefits | 54 | 2 | 14 | - | 70 | |||||||
Net realized losses on borrowings | 34 | (4) | - | - | 30 | |||||||
Total deferred income tax assets | 94 | (36) | 25 | - | 83 | |||||||
Deferred income tax liabilities | ||||||||||||
Provision for claims1 | (129) | (8) | - | - | (137) | |||||||
Fair value of investment properties | (60) | (1) | - | - | (61) | |||||||
Other | (7) | (7) | - | - | (14) | |||||||
Total deferred income tax liabilities | (196) | (16) | - | - | (212) | |||||||
Net deferred income tax assets (liabilities) | (102) | (52) | 25 | - | (129) | |||||||
1 The provision for claims includes the portion that is self-insured.
| ||||||||||||
(in millions)
| 2017
| Change Through Net income
| Change Through
| Change Through
| 2018
| |||||||
Deferred income tax assets | ||||||||||||
Fair value of financial instruments | - | 20 | (14) | - | 6 | |||||||
Post-employment benefits | 71 | (1) | (16) | - | 54 | |||||||
Net realized losses on borrowings | 35 | (1) | - | - | 34 | |||||||
Total deferred income tax assets | 106 | 18 | (30) | - | 94 | |||||||
Deferred income tax liabilities | ||||||||||||
Provision for claims1 | (118) | (13) | - | 2 | (129) | |||||||
Fair value of investment properties | (58) | (2) | - | - | (60) | |||||||
Other | (14) | (12) | - | 19 | (7) | |||||||
Total deferred income tax liabilities | (190) | (27) | - | 21 | (196) | |||||||
Net deferred income tax assets (liabilities) | (84) | (9) | (30) | 21 | (102) | |||||||
1 The provision for claims includes the portion that is self-insured.
| ||||||||||||
The deferred income tax assets have been recognized in full as it is probable that taxable profit will be available against which the deductible temporary differences can be utilized.
110
26. RELATED PARTY TRANSACTIONS
Our related parties include the Government and its departments, agencies and Crown corporations (in terms of common ownership), key management personnel and their close family members and the Pension Plan.
All material related party transactions and outstanding balances not disclosed elsewhere are disclosed below.
Transactions or balances between the entities that have been eliminated on consolidation are not reported.
Government of Canada and its departments, agencies and Crown corporations
The following tables summarize income earned and receivable, the total amount invested in instruments issued or guaranteed by the Government and government fees.
| (in millions) | 2019 | 2018 | ||||||
Income earned and receivable | ||||||||
Investment income – cash equivalents | 9 | 1 | ||||||
Investment income – investment securities | 119 | 70 | ||||||
Interest receivable – investment securities1 | 26 | 12 | ||||||
Government issued | ||||||||
Cash equivalents | 286 | 24 | ||||||
Investment securities | 9,372 | 4,720 | ||||||
Government fees | ||||||||
Mortgage Funding | 30 | 30 | ||||||
Mortgage Insurance | 43 | 38 | ||||||
1 Included in accrued interest receivable. | ||||||||
Key management personnel
The following table presents the compensation of key management personnel, defined as those persons having authority and responsibility for planning, directing and controlling our activities. This includes the Board of Directors and members of the Executive Committee.
2019 | 2018 | |||||||||||||||||||||||||
| (in thousands) | Board of Directors | Other Key Management Personnel | Total | Board of Directors | Other Key Management Personnel | Total | ||||||||||||||||||||
Short-term benefits | 195 | 4,355 | 4,550 | 170 | 4,579 | 4,749 | ||||||||||||||||||||
Post-employment benefits | - | 862 | 862 | - | 979 | 979 | ||||||||||||||||||||
Total | 195 | 5,217 | 5,412 | 170 | 5,558 | 5,728 | ||||||||||||||||||||
Receivable balances outstanding with members of key management personnel as at 31 December 2019 are nil (2018 – nil).
A Commitment to Affordability | 2019 Annual Report 111
Pension plan
The following table summarizes interest expense we incurred and operating expenses we recovered from the Pension Plan.
| (in millions) | 2019 | 2018 | ||||||
Interest expense – paid to the Pension Plan for its holdings of CMB1 | 1 | 1 | ||||||
Operating expense recoveries – paid by the Pension Plan for our administration services | 4 | 4 | ||||||
1 Refer to Note 24 for additional information on holdings of CMB by the Pension Plan.
Receivable balances outstanding from the Pension Plan as at 31 December 2019 are $2 million (2018 – $14 million).
27. COMMITMENTS AND CONTINGENT LIABILITIES
Letters of credit
We have $118 million (2018 – $118 million) in letters of credit outstanding, which secure benefits accrued up to 31 December 2019 under the Supplemental Plan.
Other financial obligations
Total estimated remaining contractual financial obligations are as follows based on minimum commitment:
| (in millions) | 2020 | 2021 | 2022 | 2023 | 2024 | | 2025 and Thereafter | | ||||||||||||||||
Housing programs1 | 1,354 | 1,253 | 1,196 | 1,060 | 983 | 3,779 | ||||||||||||||||||
Other contractual obligations | 93 | 42 | 42 | 29 | - | - | ||||||||||||||||||
Operating leases | 1 | 1 | 1 | 1 | 1 | 1 | ||||||||||||||||||
Total | 1,448 | 1,296 | 1,239 | 1,090 | 984 | 3,780 | ||||||||||||||||||
1 Total remaining contractual financial obligations for housing programs extend for periods up to 25 years (2018 – 25 years).
In addition to the above minimum commitments, there is a total of $4,264 million as at 31 December 2019 that can be claimed by various parties over the next nine years under the Federal/Provincial/Territorial Housing Agreements that have been signed with the provinces and territories, if the required criteria are met by the various parties to the agreements. Over the coming year, we expect the bilateral agreements will be amended for $2,000 million announced under the Canada Housing Benefit.
Legal claims
There are legal claims of $4 million (2018 – $4 million) against CMHC. Due to the uncertainty of the outcome of these claims, no provision for loss has been recorded. We do not expect the ultimate resolution of any of the proceedings to which we are party to have a significant adverse effect on our financial position.
28. OPERATING EXPENSES
The following table presents the composition of operating expenses.
| (in millions) | 2019 | 2018 | ||||||
Personnel costs | 299 | 293 | ||||||
Depreciation of premises and equipment | 27 | 12 | ||||||
Other administrative goods and services | 287 | 280 | ||||||
Total operating expenses | 613 | 585 | ||||||
112
29. CURRENT AND NON-CURRENT ASSETS AND LIABILITIES
The following table presents assets and liabilities we expect to recover or settle within 12 months of the balance sheet date.
| 2019 | 2018 | |||||||||||||||||||||||
| (in millions) | Within 1 Year | After 1 Year | Total | Within 1 Year | After 1 Year | Total | ||||||||||||||||||
Assets | ||||||||||||||||||||||||
Cash and cash equivalents | 922 | - | 922 | 837 | - | 837 | ||||||||||||||||||
Accrued interest receivable | 737 | - | 737 | 724 | - | 724 | ||||||||||||||||||
Investment securities: | ||||||||||||||||||||||||
Fair value through profit or loss | 396 | 413 | 809 | 291 | 1,300 | 1,591 | ||||||||||||||||||
Fair value through other comprehensive income | 1,708 | 18,925 | 20,633 | 1,845 | 16,319 | 18,164 | ||||||||||||||||||
Amortized cost | 483 | 464 | 947 | - | - | - | ||||||||||||||||||
Derivatives | 53 | 15 | 68 | 2 | 31 | 33 | ||||||||||||||||||
Due from the Government of Canada | 97 | 152 | 249 | 56 | 102 | 158 | ||||||||||||||||||
Loans: | ||||||||||||||||||||||||
Fair value through profit or loss | 644 | 687 | 1,331 | 589 | 1,451 | 2,040 | ||||||||||||||||||
Amortized cost | 40,313 | 209,126 | 249,439 | 30,924 | 208,238 | 239,162 | ||||||||||||||||||
Accounts receivable and other assets | 244 | 604 | 848 | 341 | 515 | 856 | ||||||||||||||||||
Investment property | - | 276 | 276 | - | 311 | 311 | ||||||||||||||||||
| 45,597 | 230,662 | 276,259 | 35,609 | 228,267 | 263,876 | |||||||||||||||||||
Liabilities | ||||||||||||||||||||||||
Securities sold under repurchase agreements | - | - | - | 280 | - | 280 | ||||||||||||||||||
Accounts payable and other liabilities | 581 | 215 | 796 | 459 | 108 | 567 | ||||||||||||||||||
Accrued interest payable | 591 | - | 591 | 546 | - | 546 | ||||||||||||||||||
Dividends payable | - | - | - | 675 | - | 675 | ||||||||||||||||||
Derivatives | 2 | 6 | 8 | 100 | 17 | 117 | ||||||||||||||||||
Provision for claims | 302 | 105 | 407 | 275 | 176 | 451 | ||||||||||||||||||
Borrowings: | ||||||||||||||||||||||||
Fair value through profit or loss | 1,247 | 1,127 | 2,374 | 1,076 | 2,354 | 3,430 | ||||||||||||||||||
Amortized cost | 40,002 | 209,739 | 249,741 | 30,964 | 204,561 | 235,525 | ||||||||||||||||||
Defined benefit plans liability | 106 | 343 | 449 | 109 | 245 | 354 | ||||||||||||||||||
Unearned premiums and fees | 1,924 | 5,227 | 7,151 | 1,850 | 5,098 | 6,948 | ||||||||||||||||||
Deferred income tax liabilities | - | 129 | 129 | - | 102 | 102 | ||||||||||||||||||
| 44,755 | 216,891 | 261,646 | 36,334 | 212,661 | 248,995 | |||||||||||||||||||
Net | 842 | 13,771 | 14,613 | (725 | ) | 15,606 | 14,881 | |||||||||||||||||
A Commitment to Affordability | 2019 Annual Report 113
30. COMPARATIVE FIGURES
Operating expenses presented in the consolidated statement of income and comprehensive income, and in Note 28, have been reclassified to conform to the current period’s presentation. Operating expenses related to the administration of housing programs were included in housing program expenses and are now included in the operating expenses under the Assisted Housing segment to align with the nature of the expense.
Provision for claims presented in the consolidated balance sheet, and in Note 7, has been reclassified to conform to the current period’s presentation. The provision on self-insured loans is now presented in the accounts payable and other liabilities in accordance with IAS 37.
Certain comparative information presented in Note 14 has been reclassified to better reflect loan maturity dates and to conform to the current year’s presentation.
31. SUBSEQUENT EVENT
As part of Canada’s COVID-19 Economic Response Plan, on 16 March 2020, the Government of Canada announced it is launching an Insured Mortgage Purchase Program (IMPP), whereby, the Government will purchase up to $50 billion of insured mortgage pools through CMHC. The purchase of insured mortgage pools under the IMPP will be financed through the Crown Borrowing Program. In conjunction, the Minister of Finance has approved increases to our short-term and long-term borrowing limits to $20 billion and $54 billion, respectively. In addition, the Minister of Finance increased our NHA MBS and CMB guarantee limits to $195 billion and $60 billion, respectively. On 20 March 2020, the Minister of Finance announced changes to the eligibility criteria for portfolio insurance to help mortgage lenders access the IMPP that will remain in force until 31 December 2020. Furthermore, increases in our guarantees-in-force and insurance-in-force limits to $750 billion each, received legislative approval on 25 March 2020.
At this time, it is not possible to reliably estimate any further impacts that the global COVID-19 outbreak may have on the financial results and condition of CMHC.
114
 |
Corporate
Legislative Framework
Incorporated under the CMHC Act, the Company is accountable to Parliament through the Minister responsible for CMHC, currently the Minister of Families, Children and Social Development. Our legislative framework includes the CMHC Act, the National Housing Act, the National Housing Strategy Act and the Financial Administration Act.
Board of Directors
The Board of Directors is responsible for managing our affairs in accordance with applicable legislation and the governing bylaws. As steward of the Company, the Board of Directors sets strategic direction, ensures the integrity and adequacy of corporate policies, information systems and management practices, ensures that principal risks are identified and managed, evaluates the Company’s performance, and monitors its financial results. The Board of Directors has a duty to protect the short- and long-term interests of the Company, safeguard the Corporation’s assets, and exercise care, diligence and skill in fulfilling its duties.
The Board is made up of the Chair, the President and Chief Executive Officer, the Deputy Minister of the Minister responsible for CMHC, the Deputy Minister of Finance, and eight other directors. The Board committees include Audit, Corporate Governance and Nominating, Human Resources, Risk Management, Housing and Capital Projects, Pension Fund Trustees and Executive Committee. The Board meets a minimum of five times per year and holds an annual public meeting.
In order to identify opportunities for enhanced Board performance and director development and education, the Board regularly undergoes assessments, periodically alternating between a peer assessment and an overall assessment. |
A Commitment to Affordability | 2019 Annual Report 115
Our Board of Directors
As of 31 December 2019
 |  |  | ||
| Derek Ballantyne | Janice Abbott | Dana Ades-Landy | ||
| Chair of the Board of Directors and | Chair of Housing and | Chair of the Audit Committee | ||
| Chair of the Corporate Governance | Capital Projects Committee | (January 30, 2018 – January 29, 2022) | ||
| and Nominating Committee | (December 14, 2017 – December 13, 2020) | Senior Vice-President of Heart & Stroke | ||
| (April 29, 2018 – April 28, 2023) | CEO of Atira Women’s Resource Society, | Foundation, Quebec | ||
| CEO of Encasa Financial Inc., Toronto | White Rock | |||
 |  |  | ||
| Navjeet (Bob) Dhillon | Graham Flack | Anne Giardini | ||
| (February 5, 2015 – February 4, 2019) | Deputy Minister, Employment | Chair of Pension Fund Trustees | ||
| Founder, President and CEO of Mainstreet | and Social Development Canada | (January 2, 2018 – January 1, 2022) | ||
| Equity Corp.; Founder, owner and | (effective October 9, 2018) | Chancellor, Simon Fraser University; | ||
| President of Pan Pacific Mercantile | Formerly served as President of | |||
| Group, Calgary | Weyerhaeuser Company Limited, | |||
| Vancouver | ||||
 |  |  | ||
| André Hébert | Gordon Laing | Linda Morris | ||
| (February 27, 2019 – February 26, 2023) | (January 12, 2018 – December 11, 2022) | Chair of the Human Resources | ||
| Head of Technology, Air Canada | President and CEO of Southwest | Committee | ||
| Vacations, Montréal | Properties Limited, Halifax | (December 14, 2017 – December 13, 2021) | ||
| Formerly served as Senior Vice-President | ||||
| of Business Development, Member and | ||||
| Community Engagement at Vancity, | ||||
| Vancouver | ||||
 |  |  | ||
| Paul Rochon | Bruce Shirreff | Evan Siddall | ||
| Deputy Minister, | Vice-Chair and Chair of the | President and | ||
| Department of Finance | Risk Management Committee | Chief Executive Officer | ||
| (effective April 21, 2014) | (January 30, 2018 – January 29, 2021) | |||
| Director of Teranet Inc., Toronto; | ||||
| Formerly served in various Senior | ||||
| Management positions at Toronto | ||||
| Dominion Bank/TD Canada Trust | ||||
116
Compensation and Attendance Record
| Committee Member Attendance | ||||||||||||||||||||||||||||||||
Member
| Compensation
| Board of
| Governance
| Audit
| Human
| Risk
| Affordable
| Pension
| ||||||||||||||||||||||||
Derek Ballantyne | 34,517 | 7/7 | 5/5 | - | - | - | 4/4 | - | ||||||||||||||||||||||||
Janice Abbott | 20,700 | 7/7 | 3/54 | - | 3/3 | 1/44 | 4/4 | - | ||||||||||||||||||||||||
Dana Ades-Landy | 20,450 | 6/7 | - | 5/5 | 3/3 | 4/4 | - | - | ||||||||||||||||||||||||
| Navjeet (Bob) Dhillon | 17,700 | 7/7 | - | 5/5 | 1/3 | 4 | - | 1/4 | 4 | - | ||||||||||||||||||||||
Graham Flack | n/a | 7/7 | 1/54 | - | - | 3/4 | 4 | 2/4 | - | |||||||||||||||||||||||
Anne Giardini | 22,450 | 7/7 | 5/5 | 5/5 | - | 4/4 | - | 4/4 | ||||||||||||||||||||||||
André Hébert1 | 15,310 | 5/7 | - | 4/5 | - | 1/4 | 3/4 | - | ||||||||||||||||||||||||
Gordon Laing | 19,591 | 7/7 | - | 4/5 | - | - | 3/4 | - | ||||||||||||||||||||||||
Linda Morris | 22,700 | 7/7 | - | - | 3/3 | 3/4 | 4/4 | - | ||||||||||||||||||||||||
Paul Rochon | n/a | 7/7 | - | 5/5 | - | 4/4 | - | - | ||||||||||||||||||||||||
Peter Sharpe2 | 2,800 | 1/7 | - | - | - | - | - | - | ||||||||||||||||||||||||
Bruce Shirreff | 18,950 | 7/7 | 5/5 | - | 3/3 | 4/4 | - | - | ||||||||||||||||||||||||
Evan Siddall3
|
| n/a
|
|
| 7/7
|
|
| 5/5
|
|
| 5/5
|
|
| 3/3
|
|
| 4/4
|
|
| 4/4
|
|
| 3/4
|
| ||||||||
| 1 | Term effective 27 February 2019. |
| 2 | Term ended 4 February 2019. |
| 3 | While only a member of the Governance and Nominating Committee, the President is invited to attend all committee meetings of the Board. |
| 4 | Reflects change in membership effective May 2019. |
A Commitment to Affordability | 2019 Annual Report 117
Our Executive Committee
As of 31 December 2019
| Evan Siddall President and Chief Executive Officer |
|
| Romy Bowers Senior Vice-President, Client Solutions | ||||
| Since joining CMHC in 2014, he has led a transformation to make the organization more high-performing and innovative, positioning it to achieve its aspiration of housing affordability for all by 2030. Evan has worked at some of the world’s largest investment banking firms in Canada and the United States. He also served at the Bank of Canada where, in the wake of the global financial crisis, he spearheaded the development of financial infrastructure to guard against systemic risks. | Romy joined CMHC in 2015 with more than 15 years of experience working at and with Canada’s leading private-sector financial institutions. She led CMHC’s risk operations for a period and now heads up a team that brings together the expertise of CMHC’s commercial and assisted housing businesses to better understand the housing needs of Canadians and develop new client-focused products and services to meet those needs. | |||||||
| Deborah Greenberg Chief Information Officer |
| Paul Mason Senior Vice-President, Client Operations | |||||
| Appointed Chief Information Officer in April 2019, Deborah is responsible for leading CMHC’s digital transformation to accelerate housing affordability for Canadians. Her team drives technology and integrated business and workplace solutions and is creating a housing data exchange to support informed decision making. Deborah previously served as CMHC’s Chief Legal Officer and Corporate Secretary. | Paul’s mandate as Senior Vice-President, Client Operations, is to make delivering housing affordability solutions easy. His team is focused on simplifying and improving the customer experience, continuously improving operational efficiencies, and advancing CMHC’s operational agility. Before taking on this new role, Paul led CMHC’s technology and business transformation. | |||||||


118
 | Steven Mennill Chief Risk Officer |
|  | Marie-Claude Tremblay Senior Vice-President, | ||||
| Steve’s experience at CMHC and expertise in urban planning and housing finance converge to make him one of Canada’s foremost housing authorities. He has 27 years of experience at CMHC, including as a key contributor to Canada’s response to the 2008-2009 global recession. He most recently led CMHC’s Risk Management efforts and was appointed Chief Climate Officer in 2020. | Marie-Claude’s career of service to Canada includes roles in several federal departments and senior positions at CMHC, which she joined in 2010. In her current role, she aligns CMHC’s strategy with its people, overseeing strategy development, human resources and communications and marketing. | |||||||
 | Michel Tremblay Senior Vice-President, Policy and Innovation |  | Lisa Williams Chief Financial Officer | |||||
| Michel leads Canada’s foremost team of experts and analysts responsible for accelerating housing affordability in Canada through evidence-based policy, research and disruptive innovation. He joined CMHC in 2005 and was integral to the design of Canada’s National Housing Strategy. His team is now focused on developing radical, game-changing ideas that will help ensure that, by 2030, everyone in Canada has a home that they can afford and that meets their needs. | Lisa is focused on steering her sector into a true partnership role with business lines to help Canadians meet their housing needs. In addition to stewardship of the company’s assets, Lisa is responsible for CMHC’s Investments, Treasury and Legal Services teams. She joined CMHC in 2003 and has made important contributions to the company’s healthy financial performance. | |||||||
 | Kathleen Devenny Vice-President, Audit and Evaluation (Observer) |  | Anik Génier Chief of Staff (Observer) | |||||
| Kathleen was appointed Vice-President of Audit and Evaluation in 2019. She joined CMHC in 2015 after a 20 year career in senior roles in the financial services industry, public accounting and internal audit. Kathleen previously held the positions of Corporate Controller and Deputy Chief Financial Officer at CMHC. | Anik brings 25 years of public sector experience to her role as Chief of Staff to the President. In addition to advising the President, she is responsible for CMHC’s Corporate Governance, which supports the Board of Directors and our internal governance bodies, and the Corporate Relations Office, where she began her career with CMHC in 2011. Anik recently obtained her Governance Professionals of Canada Designation. | |||||||
A Commitment to Affordability | 2019 Annual Report 119
Our Management Committee
As of 31 December 2019
Anik Génier
Chair of Management Committee, Chief of Staff
Nadine Leblanc
Vice-Chair of Management Committee, Vice-President,
Credit Assessment and Underwriting (Multi-Unit)
Sylvie Bourdon
Vice-President, Legal Services
Mark Chamie
Vice-President, Investments and Treasury
Andre Charbonneau
Deputy Chief Financial Officer
Christina Haddad
Vice-President, Communications and Marketing
Steffan Jones
Vice-President, Innovation
Amélie Lecompte
Deputy Chief Information Officer
Neil Levecque
Vice-President, Analytics and Chief Data Officer
Audrey Moritz
Vice-President, Operations – Multi-Unit
Caroline Sanfaçon
Vice-President, Housing Solutions – Multi-Unit
Carla Staresina
Vice-President, Risk Management, Strategy and Products
Debbie Stewart
Vice-President, Partnerships and Promotions
Glen Trevisani
Vice-President, Transformation – Mortgage Insurance
Chris Woodcock (Observer)
Director, Enterprise Risk Management
120
Glossary
Non-IFRS Financial Measures
We use a number of financial measures to assess our performance, some of which are not calculated in accordance with International Financial Reporting Standards (IFRS), are not defined by IFRS, and do not have standardized meaning that would ensure consistency and comparability with other institutions.
Arrears rate
The ratio (expressed as a percentage) of all loans that are typically more than 90 days past due to the number of outstanding insured loans.
Capital available to capital required
Under the Mortgage Funding activity, the ratio (expressed as a percentage) of capital available to capital required where capital required is calculated by applying risk factors to investment asset and liability exposures using a framework developed in accordance with both regulatory and economic capital principles.
Capital available to minimum capital required
Under the Mortgage Insurance activity, the ratio (expressed as a percentage) of capital available to minimum capital required where capital available is calculated as total equity adjusted for assets with a capital requirement of 100% and minimum capital required is calculated by applying risk factors to investment asset and liability exposures in accordance with the guidelines established by the Office of the Superintendent of Financial Institutions.
Guarantees-in-force
The total guarantees related to the timely payment of principal and interest of National Housing Act Mortgage-Backed Securities for investors in securities issued by Approved Issuers on the basis of housing loans through the National Housing Act Mortgage-Backed Securities program and the Canada Mortgage Bonds issued by the Canada Housing Trust.
Insurance-in-force
The total amount of outstanding loan balances covered by mortgage insurance policies at a specific period in time.
Loss ratio
The ratio (expressed as a percentage) of the insurance claims incurred during the period to the premiums and fees earned in the period in the Mortgage Insurance activity.
Minimum Capital Test (MCT)
The minimum capital required calculated by applying risk factors to the Mortgage Insurance activity’s assets and liabilities using a defined methodology prescribed by the Office of the Superintendent of Financial Institutions.
Mortgage Insurance Capital Adequacy Test (MICAT)
The minimum capital required calculated by combining the January 2017 advisory on Capital Requirements for Federally Regulated Mortgage Insurers and the relevant portions of the 2018 Minimum Capital Test (MCT) for Federally Regulated Property and Casualty Insurance Companies.
Mortgage Insurance defaults
Defaults from the Mortgage Insurance business occur when a borrower has missed the equivalent of at least one payment as at the reporting date.
Operating budget ratio
The ratio (expressed as a percentage) of operating budget expenses for all of CMHC’s activities (excluding the Canada Housing Trust) during the period to premiums, fees, guarantee, and application fees received, net interest income from Lending programs and normalized government funding.
Operating expense ratio
Mortgage Insurance activity: the ratio (expressed as a percentage) of operating expenses during the period to premiums and fees earned during the period for the Mortgage Insurance activity.
Mortgage Funding activity: the ratio (expressed as a percentage) of operating expenses during the period, exclusive of those related to the administration of the covered bond legal framework, to guarantee fees earned during the period.
A Commitment to Affordability | 2019 Annual Report 121
Return on equity
The annualized net income divided by the average of the beginning and ending equity for the period, used to highlight operating performance.
Return on required capital (RORE)
The annualized net income, adjusted to remove investment income earned on capital in excess of capital required, divided by the average required capital for the period.
Severity ratio
The ratio (expressed as a percentage) of insurance claims to the original insured loan amount for the claims paid in the period.
Other Glossary Terms
A to A lease
A number of First Nations operating under the First Nations Land Management Act or self-government agreements have adopted provisions in their land code or constitution that permit members holding individual interests in reserve lands to lease their land allotment to themselves (an A to A lease), thereby creating a mortgageable interest that can be used as security.
Approved Issuer
A business organization which, having met the criteria established by CMHC, is approved to issue and administer guaranteed National Housing Act Mortgage-Backed Securities.
Approved Lender
A lending institution designated as an approved lender by CMHC under the National Housing Act. Only Approved Lenders may qualify for CMHC loan insurance.
Canada Housing Trust (CHT)
The Canada Housing Trust is a special-purpose trust that acquires interests in eligible insured housing loans, such as National Housing Act Mortgage-Backed Securities, and issues Canada Mortgage Bonds. The Canada Housing Trust also purchases highly rated investments and undertakes certain related financial hedging activities. We consolidate the accounts of Canada Housing Trust with the Mortgage Funding activity. Canada Housing Trust’s assets and liabilities are neither owned by nor held for our benefit. The beneficiaries of the trust, after payment of all obligations, are one or more charitable organizations.
Committed
Committed refers to funding earmarked to support the building or repair of units whose formal project agreement is still subject to final approvals and conditions.
Core housing need
A household is in core housing need if its housing does not meet one or more of the adequacy, suitability or affordability standards. Adequate housing does not require any major repairs. Suitable housing has enough bedrooms for the size and make-up of resident households, according to National Occupancy Standard requirements. Affordable housing costs less than 30% of before-tax household income to access local housing that meets the adequacy and suitability standards.
Demonstrations Initiative
The National Housing Strategy Demonstrations Initiative highlights innovative solutions aiming to improve the performance, viability and effectiveness of affordable housing.
Employee engagement
This metric measures the commitment of an employee to CMHC. Such commitment is reflected in an employee’s willingness to speak well of CMHC, recommend it as an employer of choice, feel proud of working at CMHC and translate it to a high motivation to do one’s best every day to contribute to the success of CMHC. (Index of 5 questions)
Employee enablement
This metric measures the extent to which employees are in optimal roles, and whether the work environment supports their success. (Index of 4 questions)
Financial commitment
Achieved once a formal loan agreement is duly executed and a binding agreement to provide credit under pre-specified terms and conditions is reached.
Housing hardship rate
The percentage of households that have insufficient income, after paying for their shelter costs, to afford a modest, basic standard of living as determined by the Market Basket Measure.
Housing programs expenses
All activities funded by the government under Assisted Housing and Market Analysis and Research activities.
122
Housing support
Contractual commitments for housing and municipal infrastructure that help to reduce affordability problems for low- and moderate-income households, to provide accommodation for students and to provide production of moderately priced rental housing. The program also provides ancillary services to support our mandate. This includes the Affordable Housing Centre, the housing-related infrastructure loans to municipalities and other long-term commitments, such as the market housing programs and the community services program.
Investment in Affordable Housing (IAH) 2011-2019
Since April 2011, new federal funding for affordable housing has been provided through the Investment in Affordable Housing. Originally announced as a three-year commitment (2011-2014), the Investment in Affordable Housing was extended to 2019 for a total federal investment of more than $1.9 billion over eight years toward reducing the number of Canadians in housing need. Under the Investment in Affordable Housing, provinces and territories cost-match the federal investment and are responsible for program design and delivery.
Lending programs
We make loans under the National Housing Act to federally subsidized social housing sponsors, First Nations, provinces, territories and municipalities as well as non-subsidized housing support loans. Our loan portfolio is comprised of a mix of renewable and non-renewable loans which may be on- or off-reserve. Direct Lending is the current borrowing initiative we use to refinance our renewable loans as well as to finance new commitments on-reserve. These loans can be financed at lower interest rates due to our status as a federal Crown corporation. As such, we are able to lower the cost of government assistance required for social housing projects. Direct Lending is operated on a planned break-even basis.
Lived experience
A term used to describe experience and knowledge gained through direct, first-hand involvement in everyday situations, events, and interactions as a result of personally experiencing housing need or homelessness.
Mixed income housing
Mixed-income housing is any type of housing development (rent or owned) that includes a range of income levels among its residents, including low, moderate and/or higher incomes.
Mixed-use development
Mixed-use development is the development of land or a building with two or more different uses, such as residential, office and retail. Mixed-use can occur vertically within a building, or horizontally on a site.
Remote
Remote refers to a community that is either a long distance from larger settlements (population centre) or lacks transportation links that are typical in more populated areas. A population centre is defined as an area with a population of at least 1,000 and a density of 400 or more people per square kilometre.
Risk culture maturity index
Comprised of several metrics on risk governance, risk appetite, risk management practices and risk behaviour, in addition to results from our Risk Culture Survey, allowing for a more comprehensive view of our corporate risk culture.
Rural area
Rural areas include all land lying outside population centres and the people living within those rural areas.
Solutions Labs
Solutions Labs provide funding and expert solution lab consultants to help solve complex housing problems using innovation methods and tools. The goal is to develop world-leading solutions to housing problems that can contribute to the National Housing Strategy’s key priority areas. Teams with diverse experience and knowledge will outline and identify the housing problem they wish to examine in the lab, their strategy to co-develop and test possible solutions, a roadmap that communicates a clear path for solution uptake and replication.
Vulnerable groups
Women, children and persons belonging, or perceived to belong, to groups that are in a disadvantaged position or marginalised are often referred to as vulnerable groups. In the case of the National Housing Strategy, priority vulnerable groups are currently defined to include survivors (especially women and children) fleeing domestic violence; seniors; Indigenous peoples; people with disabilities; those dealing with mental health and addiction issues; veterans; LGBTQ2+; racialized groups; newcomers (including refugees); individuals and families experiencing homelessness; and young adults.
A Commitment to Affordability | 2019 Annual Report 123
Capabilities
and Management
Systems Definitions
Capabilities and Management Systems are classified into three different groups:
Strategic
| • | Basis for competitive advantage and achieving aspiration |
| • | Meaningful to customers or source of economic advantage |
| • | Two types: those that help an organization in the present; those that help an organization learn, adapt and thrive |
Core
| • | Impact customer choice and/or shape the economic profit proposition |
| • | Not a defensible source of advantage |
| • | Focus on effectiveness |
Foundational
| • | Basic business requirements that are not distinctive and do not impact customer choice |
| • | Required to be a viable competitor |
| • | Focus on efficiency |
| Capability | Classification | Definition | ||
| Analytics | Foundational | The capability to serve our needs for data acquisition, integration, quality, modelling and management, including data visualization. | ||
| Client experience management | Strategic | The capability to have client needs at the centre when designing or making decisions regarding our programs, products, services, technology, internal operations and processes. | ||
| Continuous process improvement | Foundational | The capability to continuously improve internal and external processes through incremental, innovative, and sustainable changes with the goal to improve both the client and user experience and strengthen organizational performance. | ||
| Housing authority | Strategic | The capability to use thought leadership, evidence and an understanding of markets, housing need and household behaviours (that is, psychological, cognitive, behavioural, emotional, cultural and social factors) to influence others to take action and support housing policy decisions. | ||
| Housing finance system risk management | Strategic | The capability to identify and understand systemic risks that have a potential to destabilize housing finance in Canada and impede attainment of our strategic objective. | ||
Inclusion | Strategic | The capability to provide a wider and more inclusive range of housing policies, programs and services that address the diverse housing needs of Canadians. In doing so, we will create and sustain an inclusive workplace culture where all employees have a sense of belonging within our company and are fully enabled to bring their most productive, innovative and collaborative selves to work. | ||
124
Capability
|
|
Classification
|
|
Definition
| ||
Leadership | Strategic | The ability to lead. This includes defining leadership from the perspective of how leaders help organizations achieve success; understanding how leaders can be identified and developed; and understanding how leadership can help organizations be successful and drive performance and results.
| ||||
Partnership development | Strategic | The capability to negotiate, develop and maintain strategic partnerships by understanding needs, connecting the dots, understanding process and risk mitigation, finding solutions, and building consensus.
| ||||
Prototyping and experimentation | Strategic | The capability to design and execute prototypes and experiments in the areas of core, adjacent and disruptive innovation that can be rapidly tested (to learn and improve), ultimately resulting in decisions to implement and scale or to discontinue.
| ||||
Real estate financing | Core | The capability to pre-qualify/evaluate applications, real estate development projects and housing projects, including debt issues, risks, risk appetite and tolerances, and viability to determine likelihood of an applicant meeting its obligations/being successful.
| ||||
Social marketing | Core | Social marketing aims to change or maintain people’s behaviour for the benefit of individuals and society as a whole. Social marketing campaigns borrow from commercial marketing techniques for the purpose of social engaging–influencing a target audience to change their social behaviours and to benefit society. Social marketing campaigns use multiple media channels to reach and saturate a target audience and may use social media tools in combination with other approaches, such as traditional media (billboards, radio, TV, etc.), events and promotional materials.
| ||||
Strategy development and execution | Strategic | The capability that enables the formation and deployment of strategy in pursuit of CMHC’s aspiration and strategic objectives at the individual and organizational level. An integrated set of explicit choices, led and reinforced by CMHC leaders, that uniquely positions CMHC in its environment so as to create sustainable advantage and a superior value proposition to Canadians.
| ||||
Management System | Classification | Definition | ||||
Customer relationship management
| Strategic | A client relationship management system to centralize data about our interactions with our partners and Canadians.
| ||||
Data governance | Foundational | Data governance provides an enterprise-focused integrated view of business data and establishes business rules management and data ownership at the business level impacting all divisions/sectors. It allows for the centralization of data, reduces manual effort, and standardizes processes across the company to improve productivity and enable robust decision making.
| ||||
Service standards framework | Core | Operational baseline measurement standards to measure if quality services are provided and gauge if we are meeting the service standards and continuously improving our services to clients.
| ||||
Strategy framework | Foundational | A system to manage our strategy from the development phase through execution, monitoring and refresh. It will be supported by a structured performance measurement framework and provide guideposts to monitor, steer and adjust the strategy as needed.
| ||||
A Commitment to Affordability | 2019 Annual Report 125