QuickLinks -- Click here to rapidly navigate through this document
Exhibit 99.2

Supplemental Financial Information
For the three and twelve months ended December 31, 2008
The Macerich Company
Supplemental Financial and Operating Information
Table of Contents
All information included in this supplemental financial package is unaudited, unless otherwise indicated.
| | |
| | Page No. |
|---|
| | | |
Corporate overview | | 1-3 |
Overview | | 1 |
Capital information and market capitalization | | 2 |
Changes in total common and equivalent shares/units | | 3 |
Financial data | | 4-5 |
Supplemental FFO information | | 4 |
Capital expenditures | | 5 |
Operational data | | 6-9 |
Sales per square foot | | 6 |
Occupancy | | 7 |
Rent | | 8 |
Cost of occupancy | | 9 |
Balance sheet information | | 10-13 |
Summarized balance sheet information | | 10 |
Debt summary | | 11 |
Outstanding debt by maturity date | | 12-13 |
Financing Activity | | 14-15 |
2009 Summary of financing activity | | 14 |
2010 Summary of financing activity | | 15 |
Development Pipeline Forecast | | 16 |
This supplemental financial information should be read in connection with the Company's fourth quarter 2008 earnings announcement (included as Exhibit 99.1 of the Company's Current Report on 8-K, event date February 11, 2009) as certain disclosures, definitions and reconciliations in such announcement have not been included in this supplemental financial information.
The Macerich Company
Supplemental Financial and Operating Information
Overview
The Macerich Company (the "Company") is involved in the acquisition, ownership, development, redevelopment, management and leasing of regional and community shopping centers located throughout the United States. The Company is the sole general partner of, and owns a majority of the ownership interests in, The Macerich Partnership, L.P., a Delaware limited partnership (the "Operating Partnership").
As of December 31, 2008, the Operating Partnership owned or had an ownership interest in 72 regional malls and 20 community shopping centers aggregating approximately 77 million square feet of gross leasable area ("GLA"). These 92 regional malls and community shopping centers are referred to hereinafter as the "Centers", unless the context requires otherwise.
The Company is a self-administered and self-managed real estate investment trust ("REIT") and conducts all of its operations through the Operating Partnership and the Company's management companies (collectively, the "Management Companies").
All references to the Company in this Exhibit include the Company, those entities owned or controlled by the Company and predecessors of the Company, unless the context indicates otherwise.
This document contains information that constitutes forward-looking statements and includes information regarding expectations regarding the Company's refinancing, development, redevelopment and expansion activities. Stockholders are cautioned that any such forward-looking statements are not guarantees of future performance and involve risks, uncertainties and other factors that may cause actual results, performance or achievements of the Company to vary materially from those anticipated, expected or projected. Such factors include, among others, general industry, economic and business conditions; adverse changes in the real estate markets, including the liquidity of real estate investments; and risks of real estate development, redevelopment, and expansion, including availability, terms and cost of financing, construction delays, environmental and safety requirements, budget overruns, sunk costs and lease-up. Real estate development, redevelopment and expansion activities are also subject to risks relating to the inability to obtain, or delays in obtaining, all necessary zoning, land-use, building, and occupancy and other required governmental permits and authorizations and governmental actions and initiatives (including legislative and regulatory changes) as well as terrorist activities which could adversely affect all of the above factors. Furthermore, occupancy rates and rents at a newly completed property may not be sufficient to make the property profitable. The reader is directed to the Company's various filings with the Securities and Exchange Commission, including the Annual Report on Form 10-K/A for the year ended December 31, 2007 and the Quarterly Reports on Form 10-Q, for a discussion of such risks and uncertainties, which discussion is incorporated herein by reference. The Company does not intend, and undertakes no obligation, to update any forward-looking information to reflect events or circumstances after the date of this document or to reflect the occurrence of unanticipated events unless required by law to do so.
1
The Macerich Company
Supplemental Financial and Operating Information (unaudited)
Capital Information and Market Capitalization
| | | | | | | | | | | | | |
| | Period Ended | |
|---|
| | 12/31/2008 | | 12/31/2007 | | 12/31/2006 | | 12/31/2005 | |
|---|
| | dollars in thousands except per share data
| |
|---|
| | | | | | | | | | | | | | |
Closing common stock price per share | | $ | 18.16 | | $ | 71.06 | | $ | 86.57 | | $ | 67.14 | |
52 week high | |
$ |
76.50 | |
$ |
103.59 | |
$ |
87.10 | |
$ |
71.22 | |
52 week low | | $ | 8.31 | | $ | 69.44 | | $ | 66.70 | | $ | 53.10 | |
Shares outstanding at end of period | | | | | | | | | | | | | |
Class A participating convertible preferred units | | | — | | | 2,855,393 | | | 2,855,393 | | | 2,855,393 | |
Class A non-participating convertible preferred units | | |
193,164 | | |
219,828 | | |
287,176 | | |
287,176 | |
Series A cumulative convertible redeemable preferred stock | | | — | | | 3,067,131 | | | 3,627,131 | | | 3,627,131 | |
Common shares and partnership units | | |
88,529,334 | | |
84,864,600 | | |
84,767,432 | | |
73,446,422 | |
| | | | | | | | | | |
Total common and equivalent shares/units outstanding | | | 88,722,498 | | | 91,006,952 | | | 91,537,132 | | | 80,216,122 | |
| | | | | | | | | | |
Portfolio capitalization data | | | | | | | | | | | | | |
Total portfolio debt, including joint ventures at pro rata | | $ | 7,926,241 | | $ | 7,507,559 | | $ | 6,620,271 | | $ | 6,863,690 | |
Equity market capitalization | | |
1,611,201 | | |
6,466,954 | | |
7,924,369 | | |
5,385,710 | |
| | | | | | | | | | |
Total market capitalization | | $ | 9,537,442 | | $ | 13,974,513 | | $ | 14,544,640 | | $ | 12,249,400 | |
| | | | | | | | | | |
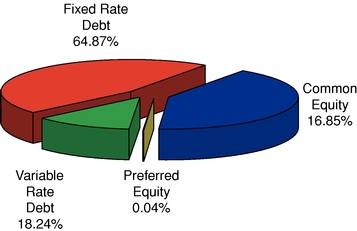
Floating rate debt as a percentage of total debt | | |
21.9 |
% | |
14.8 |
% | |
20.8 |
% | |
35.7 |
% |
Portfolio Capitalization at December 31, 2008
2
The Macerich Company
Supplemental Financial and Operating Information (unaudited)
Changes in Total Common and Equivalent Shares/Units
| | | | | | | | | | | | | | | | | | | |
| | Partnership Units | | Company Common Shares | | Class A
Participating
Convertible Preferred Units ("PCPUs") | | Class A
Non-Participating
Convertible Preferred Units ("NPCPUs") | | Series A Cumulative Convertible Redeemable Preferred Stock | | Total Common and Equivalent Shares/ Units | |
|---|
| | | | | | | | | | | | | | | | | | | | |
Balance as of December 31, 2007 | | | 12,552,837 | | | 72,311,763 | | | 2,855,393 | | | 219,828 | | | 3,067,131 | | | 91,006,952 | |
Redemption of PCPUs in exchange for the distribution of interests in properties | | | | | | | | |
(2,855,393 |
) | | | | | | | |
(2,855,393 |
) |
Issuance of stock/partnership units from stock option exercises, restricted stock issuance or other share or unit-based plans | | | 6,821 | | | 219,107 | | | | | | | | | | | | 225,928 | |
| | | | | | | | | | | | | | |
Balance as of March 31, 2008 | | | 12,559,658 | | | 72,530,870 | | | — | | | 219,828 | | | 3,067,131 | | | 88,377,487 | |
| | | | | | | | | | | | | | |
Conversion of partnership units to common shares | | | (48,625 | ) | | 48,625 | | | — | | | — | | | — | | | — | |
Conversion of partnership units to cash | | |
(6,397 |
) | |
— | | |
— | | |
— | | |
— | | |
(6,397 |
) |
Conversion of NPCPUs to common shares | | | — | | | 9,999 | | | — | | | (9,999 | ) | | — | | | — | |
Conversion of preferred stock to common shares | | |
— | | |
2,022,860 | | |
— | | |
— | | |
(2,022,860 |
) | |
— | |
Issuance of stock/partnership units from stock option exercises, restricted stock issuance or other share- or unit-based plans | | | — | | | 11,640 | | | — | | | — | | | — | | | 11,640 | |
| | | | | | | | | | | | | | |
Balance as of June 30, 2008 | | | 12,504,636 | | | 74,623,994 | | | — | | | 209,829 | | | 1,044,271 | | | 88,382,730 | |
| | | | | | | | | | | | | | |
Conversion of partnership units to common shares | | | (75,385 | ) | | 75,385 | | | — | | | — | | | — | | | — | |
Conversion of partnership units to cash | | |
(5,537 |
) | |
— | | |
— | | |
— | | |
— | | |
(5,537 |
) |
Conversion of NPCPUs to common shares | | | — | | | 16,665 | | | — | | | (16,665 | ) | | — | | | — | |
Conversion of preferred stock to common shares | | | — | | | 1,044,271 | | | — | | | | | | (1,044,271 | ) | | — | |
Issuance of stock/partnership units from stock option exercises, restricted stock issuance or other share or unit based plans | | |
— | | |
325,552 | | |
— | | |
— | | |
— | | |
325,552 | |
| | | | | | | | | | | | | | |
Balance as of September 30, 2008 | | | 12,423,714 | | | 76,085,867 | | | — | | | 193,164 | | | — | | | 88,702,745 | |
| | | | | | | | | | | | | | |
Conversion of partnership units to common shares | | |
(769,605 |
) | |
769,605 | | |
— | | |
— | | |
— | | |
— | |
Conversion of partnership units to cash | | | (8,409 | ) | | — | | | — | | | — | | | — | | | (8,409 | ) |
Issuance of stock/partnership units from stock option exercises, restricted stock issuance or other share- or unit-based plans | | | — | | | 28,162 | | | — | | | — | | | — | | | 28,162 | |
| | | | | | | | | | | | | | |
Balance as of December 31, 2008 | | | 11,645,700 | | | 76,883,634 | | | — | | | 193,164 | | | — | | | 88,722,498 | |
| | | | | | | | | | | | | | |
3
The Macerich Company
Supplemental Financial and Operating Information (unaudited)
Supplemental Funds from Operations ("FFO") Information(a)
| | | | | | | |
| | As of December 31, | |
|---|
| | 2008 | | 2007 | |
|---|
| | dollars in millions
| |
|---|
| | | | | | | | |
Straight line rent receivable | | $ | 62.2 | | $ | 61.0 | |
| | | | | | | | | | | | | |
| | For the Three Months Ended
December 31, | | For the Twelve Months Ended
December 31, | |
|---|
| | 2008 | | 2007 | | 2008 | | 2007 | |
|---|
| | dollars in millions
| |
|---|
| | | | | | | | | | | | | | |
Lease termination fees | | $ | 3.6 | | $ | 1.2 | | $ | 12.4 | | $ | 12.8 | |
| | | | | | | | | | | | | |
Straight line rental income | | $ | 0.9 | | $ | 4.6 | | $ | 8.7 | | $ | 13.5 | |
| | | | | | | | | | | | | |
Gain on sales of undepreciated assets | | $ | 0.3 | | $ | 10.0 | | $ | 3.8 | | $ | 10.8 | |
| | | | | | | | | | | | | |
Amortization of acquired above- and below-market leases (SFAS 141) | | $ | 14.2 | | $ | 3.6 | | $ | 27.4 | | $ | 15.1 | |
| | | | | | | | | | | | | |
Amortization of debt premiums | | $ | 2.9 | | $ | 2.9 | | $ | 11.1 | | $ | 13.5 | |
| | | | | | | | | | | | | |
Interest capitalized | | $ | 8.3 | | $ | 8.6 | | $ | 37.0 | | $ | 34.6 | |
- (a)
- All joint venture amounts included at pro rata.
4
The Macerich Company
Supplemental Financial and Operating Information (unaudited)
Capital Expenditures
| | | | | | | | | | | |
| | Year Ended 12/31/2008 | | Year Ended 12/31/2007 | | Year Ended 12/31/2006 | |
|---|
| | dollars in millions
| |
|---|
| | | | | | | | | | | |
Consolidated Centers | | | | | | | | | | |
Acquisitions of property and equipment | |
$ |
87.5 | |
$ |
387.9 | |
$ |
580.5 | |
Development, redevelopment and expansions of Centers | | | 446.1 | | | 545.9 | | | 184.3 | |
Renovations of Centers | | |
8.5 | | |
31.1 | | |
51.4 | |
Tenant allowances | | | 14.6 | | | 28.0 | | | 27.0 | |
Deferred leasing charges | | |
22.3 | | |
21.6 | | |
21.6 | |
| | | | | | | | |
| | Total | | $ | 579.0 | | $ | 1,014.5 | | $ | 864.8 | |
Joint Venture Centers(a) | | | | | | | | | | |
Acquisitions of property and equipment | | $ | 294.4 | | $ | 24.8 | | $ | 28.7 | |
Development, redevelopment and expansions of Centers | | |
60.8 | | |
33.5 | | |
48.8 | |
Renovations of Centers | | | 3.1 | | | 10.5 | | | 8.1 | |
Tenant allowances | | |
13.8 | | |
15.1 | | |
13.8 | |
Deferred leasing charges | | | 5.0 | | | 4.2 | | | 4.3 | |
| | | | | | | | |
| | Total | | $ | 377.1 | | $ | 88.1 | | $ | 103.7 | |
| | | | | | | | |
- (a)
- All joint venture amounts at pro rata.
5
The Macerich Company
Supplemental Financial and Operating Information (unaudited)
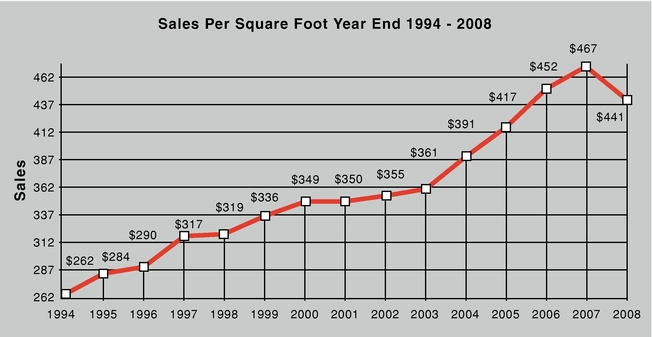
Sales Per Square Foot(a)
| | | | | | | | | | |
| | Wholly Owned Centers | | Joint Venture Centers | | Total Centers | |
|---|
| | | | | | | | | | | |
12/31/2008 | | $ | 420 | | $ | 460 | | $ | 441 | |
12/31/2007(b) | |
$ |
448 | |
$ |
486 | |
$ |
467 | |
12/31/2006 | | $ | 435 | | $ | 470 | | $ | 452 | |
- (a)
- Sales are based on reports by retailers leasing mall and freestanding stores for the trailing 12 months for tenants which have occupied such stores for a minimum of 12 months. Sales per square foot are based on tenants 10,000 square feet and under for regional malls.
- (b)
- Sales per square foot were $467 after giving effect to the Rochester Redemption, including The Shops at North Bridge and excluding the Community/Specialty Centers.
6
The Macerich Company
Supplemental Financial and Operating Information (unaudited)
Occupancy
| | | | | | | | | | |
Period Ended | | Wholly Owned
Regional
Malls(a) | | Joint Venture
Regional
Malls(a) | | Total
Regional
Malls(a) | |
|---|
| | | | | | | | | | | |
12/31/2008 | | | 91.6 | % | | 92.8 | % | | 92.3 | % |
12/31/2007 | | |
92.8 |
% | |
93.3 |
% | |
93.1 |
% |
12/31/2006 | | | 93.1 | % | | 93.7 | % | | 93.4 | % |
| | | | | | | | | | |
Period Ended | | Wholly Owned Centers(b) | | Joint Venture Centers(b) | | Total Centers(b) | |
|---|
| | | | | | | | | | | |
12/31/2008 | | | 91.3 | % | | 93.1 | % | | 92.3 | % |
12/31/2007 | | |
92.8 |
% | |
94.0 |
% | |
93.5 |
% |
12/31/2006 | | | 93.0 | % | | 94.2 | % | | 93.6 | % |
- (a)
- Only includes regional malls. Occupancy data excludes space under development and redevelopment.
- (b)
- Includes regional malls and community shopping centers. Occupancy data excludes space under development and redevelopment.
7
The Macerich Company
Supplemental Financial and Operating Information (unaudited)
Rent
| | | | | | | | | | | |
| | Average Base Rent
PSF(a) | | Average Base Rent
PSF on Leases
Commencing During
the Period(b) | | Average Base Rent
PSF on Leases
Expiring(c) | |
|---|
| | | | | | | | | | | |
Wholly Owned Centers | | | | | | | | | | |
| | 12/31/2008 | |
$ |
41.39 | |
$ |
42.70 | |
$ |
35.14 | |
| | 12/31/2007 | | $ | 38.49 | | $ | 43.23 | | $ | 34.21 | |
| | 12/31/2006 | |
$ |
37.55 | |
$ |
38.40 | |
$ |
31.92 | |
Joint Venture Centers | | | | | | | | | | |
| | 12/31/2008 | |
$ |
42.14 | |
$ |
49.74 | |
$ |
37.61 | |
| | 12/31/2007 | | $ | 38.72 | | $ | 47.12 | | $ | 34.87 | |
| | 12/31/2006 | |
$ |
37.94 | |
$ |
41.43 | |
$ |
36.19 | |
- (a)
- Average base rent per square foot is based on Mall and Freestanding Store GLA for spaces 10,000 square feet and under, occupied as of the applicable date, for each of the Centers owned by the Company. Leases for Promenade at Casa Grande, SanTan Village Power Center and SanTan Village Regional Center were excluded for Years 2007 and 2008. Leases for The Market at Estrella Falls and Santa Monica Place were excluded for Year 2008.
- (b)
- The average base rent per square foot on lease signings commencing during the period represents the actual rent to be paid during the first twelve months for tenants 10,000 square feet and under. Lease signings for Promenade at Casa Grande, SanTan Village Power Center and SanTan Village Regional Center were excluded for Years 2007 and 2008. Lease signings for The Market at Estrella Falls and Santa Monica Place were excluded for Year 2008.
- (c)
- The average base rent per square foot on leases expiring during the period represents the final year minimum rent, on a cash basis, for all tenant leases 10,000 square feet and under expiring during the year. Leases for Promenade at Casa Grande, SanTan Village Power Center and SanTan Village Regional Center were excluded for Years 2007 and 2008. Leases for The Market at Estrella Falls and Santa Monica Place were excluded for Year 2008.
8
The Macerich Company
Supplemental Financial and Operating Information (unaudited)
Cost of Occupancy
| | | | | | | | | | | | |
| | For Years Ended December 31, | |
|---|
| | 2008 | | 2007 | | 2006 | |
|---|
| | | | | | | | | | | |
Wholly Owned Centers | | | | | | | | | | |
| | Minimum rents | | |
8.9 |
% | |
8.0 |
% | |
8.1 |
% |
| | Percentage rents | | | 0.4 | % | | 0.4 | % | | 0.4 | % |
| | Expense recoveries(a) | | |
4.4 |
% | |
3.8 |
% | |
3.7 |
% |
| | | | | | | | |
| | | Total | | | 13.7 | % | | 12.2 | % | | 12.2 | % |
| | | | | | | | |
| | | | | | | | | | | | |
| | For Years Ended December 31, | |
|---|
| | 2008 | | 2007 | | 2006 | |
|---|
| | | | | | | | | | | |
Joint Venture Centers | | | | | | | | | | |
| | Minimum rents | | |
8.2 |
% | |
7.3 |
% | |
7.2 |
% |
| | Percentage rents | | | 0.4 | % | | 0.5 | % | | 0.6 | % |
| | Expense recoveries(a) | | |
3.9 |
% | |
3.2 |
% | |
3.1 |
% |
| | | | | | | | |
| | | Total | | | 12.5 | % | | 11.0 | % | | 10.9 | % |
| | | | | | | | |
- (a)
- Represents real estate tax and common area maintenance charges.
9
The Macerich Company
Supplemental Financial and Operating Information (unaudited)
Summarized Balance Sheet Information
| | | | | | | | |
| | December 31,
2008 | | December 31,
2007 | |
|---|
| | dollars in thousands
| |
|---|
| | | | | | | | |
Cash and cash equivalents | | $ | 66,529 | | $ | 85,273 | |
Pro rata cash and cash equivalents on unconsolidated entities | | |
91,103 | | |
56,194 | |
Investment in real estate, net(a) | | | 6,374,015 | | | 6,187,473 | |
Investment in unconsolidated entities | | |
1,013,930 | | |
785,643 | |
| | Total assets | | | 8,012,216 | | | 7,937,097 | |
Mortgage and notes payable | | |
5,975,269 | | |
5,762,958 | |
Pro rata share of debt on unconsolidated entities | | | 2,017,705 | | | 1,820,411 | |
- (a)
- Includes construction in process of $600,773 at December 31, 2008 and $442,670 at December 31, 2007.
10
The Macerich Company
Supplemental Financial and Operating Information (unaudited)
Debt Summary (at Company's pro rata share)
| | | | | | | | | | | |
| | As of December 31, 2008 | |
|---|
| | Fixed Rate | | Variable Rate(a) | | Total | |
|---|
| | dollars in thousands
| |
|---|
| | | | | | | | | | | |
Consolidated debt | | $ | 4,350,808 | | $ | 1,557,728 | | $ | 5,908,536 | |
Unconsolidated debt | | |
1,836,210 | | |
181,495 | | |
2,017,705 | |
| | | | | | | | |
| | Total debt | | $ | 6,187,018 | | $ | 1,739,223 | | $ | 7,926,241 | |
Weighted average interest rate | | |
5.75 |
% | |
3.22 |
% | |
5.19 |
% |
Weighted average maturity (years) | | | | | | | | |
3.35 | |
- (a)
- Excludes swapped floating rate debt. Swapped debt is included in the fixed debt category.
11
The Macerich Company
Supplemental Financial and Operating Information (Unaudited)
Outstanding Debt by Maturity Date
| | | | | | | | | | | | | | | | |
| | As of December 31, 2008 | |
|---|
Center/Entity (dollars in thousands) | | Maturity Date | | Effective
Interest
Rate (a) | | Fixed | | Floating | | Total Debt
Balance (a) | |
|---|
I. Consolidated Assets: | | | | | | | | | | | | | | | | |
Queens Center (b) | | |
03/01/09 | | |
7.11 |
% |
$ |
88,913 | |
$ |
— | |
$ |
88,913 | |
Carmel Plaza | | | 05/01/09 | | | 8.18 | % | | 25,805 | | | — | | | 25,805 | |
Paradise Valley Mall | | | 05/01/09 | | | 5.89 | % | | 20,259 | | | — | | | 20,259 | |
Northridge Mall | | | 07/01/09 | | | 4.94 | % | | 79,657 | | | — | | | 79,657 | |
Wilton Mall | | | 11/01/09 | | | 4.79 | % | | 42,608 | | | — | | | 42,608 | |
Macerich Partnership Term Loan (c) | | | 04/26/10 | | | 6.50 | % | | 446,250 | | | — | | | 446,250 | |
Macerich Partnership Line of Credit (d) | | | 04/25/10 | | | 6.23 | % | | 400,000 | | | — | | | 400,000 | |
Vintage Faire Mall | | | 09/01/10 | | | 7.91 | % | | 63,329 | | | — | | | 63,329 | |
Santa Monica Place | | | 11/01/10 | | | 7.79 | % | | 77,888 | | | — | | | 77,888 | |
Valley View Center | | | 01/01/11 | | | 5.81 | % | | 125,000 | | | — | | | 125,000 | |
Danbury Fair Mall | | | 02/01/11 | | | 4.64 | % | | 169,889 | | | — | | | 169,889 | |
Shoppingtown Mall | | | 05/11/11 | | | 5.01 | % | | 43,040 | | | — | | | 43,040 | |
Capitola Mall | | | 05/15/11 | | | 7.13 | % | | 37,497 | | | — | | | 37,497 | |
Freehold Raceway Mall | | | 07/07/11 | | | 4.68 | % | | 171,726 | | | — | | | 171,726 | |
Pacific View | | | 08/31/11 | | | 7.25 | % | | 80,851 | | | — | | | 80,851 | |
Pacific View | | | 08/31/11 | | | 7.00 | % | | 6,531 | | | — | | | 6,531 | |
Rimrock Mall | | | 10/01/11 | | | 7.56 | % | | 42,155 | | | — | | | 42,155 | |
Prescott Gateway | | | 12/01/11 | | | 5.86 | % | | 60,000 | | | — | | | 60,000 | |
Hilton Village | | | 02/01/12 | | | 5.27 | % | | 8,547 | | | — | | | 8,547 | |
The Macerich Company—Convertible Senior Notes (e) | | | 03/15/12 | | | 3.71 | % | | 722,506 | | | — | | | 722,506 | |
Tucson La Encantada | | | 06/01/12 | | | 5.84 | % | | 78,000 | | | — | | | 78,000 | |
Chandler Fashion Center | | | 11/01/12 | | | 5.20 | % | | 100,340 | | | — | | | 100,340 | |
Chandler Fashion Center | | | 11/01/12 | | | 6.00 | % | | 66,160 | | | — | | | 66,160 | |
Towne Mall | | | 11/01/12 | | | 4.99 | % | | 14,366 | | | — | | | 14,366 | |
Deptford Mall | | | 01/15/13 | | | 5.41 | % | | 172,500 | | | — | | | 172,500 | |
Queens Center | | | 03/01/13 | | | 7.00 | % | | 213,314 | | | — | | | 213,314 | |
Greeley—Defeaseance | | | 09/01/13 | | | 6.34 | % | | 27,038 | | | — | | | 27,038 | |
FlatIron Crossing | | | 12/01/13 | | | 5.26 | % | | 184,248 | | | — | | | 184,248 | |
Great Northern Mall | | | 12/01/13 | | | 5.11 | % | | 39,591 | | | — | | | 39,591 | |
Fiesta Mall | | | 01/01/15 | | | 4.98 | % | | 84,000 | | | — | | | 84,000 | |
Fresno Fashion Fair | | | 08/01/15 | | | 6.76 | % | | 169,411 | | | — | | | 169,411 | |
Flagstaff Mall | | | 11/01/15 | | | 5.03 | % | | 37,000 | | | — | | | 37,000 | |
South Towne Center | | | 11/05/15 | | | 6.75 | % | | 89,915 | | | — | | | 89,915 | |
Valley River Center | | | 02/01/16 | | | 5.60 | % | | 120,000 | | | — | | | 120,000 | �� |
Salisbury, Center at | | | 05/01/16 | | | 5.83 | % | | 115,000 | | | — | | | 115,000 | |
Deptford Mall | | | 06/01/16 | | | 6.46 | % | | 15,642 | | | — | | | 15,642 | |
Chesterfield Towne Center | | | 01/01/24 | | | 9.07 | % | | 54,111 | | | — | | | 54,111 | |
South Plains Mall | | | 03/01/29 | | | 8.29 | % | | 57,721 | | | — | | | 57,721 | |
| | | | | | | | | | | | | |
Total Fixed Rate Debt for Consolidated Assets | | | | | | 5.72 | % | $ | 4,350,808 | | $ | — | | $ | 4,350,808 | |
| | | | | | | | | | | | | |
Twenty Ninth Street | | | 06/05/09 | | | 2.20 | % | | — | | | 115,000 | | | 115,000 | |
La Cumbre Plaza | | | 08/09/09 | | | 2.58 | % | | — | | | 30,000 | | | 30,000 | |
Promenade at Casa Grande (f) | | | 08/16/09 | | | 3.35 | % | | — | | | 49,859 | | | 49,859 | |
Panorama Mall | | | 02/28/10 | | | 1.62 | % | | — | | | 50,000 | | | 50,000 | |
Macerich Partnership Line of Credit | | | 04/25/10 | | | 3.19 | % | | — | | | 699,500 | | | 699,500 | |
Cactus Power Center (g) | | | 03/14/11 | | | 3.23 | % | | — | | | 345 | | | 345 | |
Victor Valley, Mall of | | | 05/06/11 | | | 3.74 | % | | — | | | 100,000 | | | 100,000 | |
Westside Pavilion | | | 06/05/11 | | | 4.07 | % | | — | | | 175,000 | | | 175,000 | |
SanTan Village Regional Center (h) | | | 06/13/11 | | | 3.91 | % | | — | | | 107,499 | | | 107,499 | |
Oaks, The | | | 07/10/11 | | | 3.48 | % | | — | | | 165,000 | | | 165,000 | |
Oaks, The | | | 07/10/11 | | | 4.24 | % | | — | | | 65,525 | | | 65,525 | |
| | | | | | | | | | | | | |
Total Floating Rate Debt for Consolidated Assets | | | | | | 3.32 | % | $ | — | | $ | 1,557,728 | | $ | 1,557,728 | |
| | | | | | | | | | | | | |
Total Debt for Consolidated Assets | | | | | | 5.08 | % | $ | 4,350,808 | | $ | 1,557,728 | | $ | 5,908,536 | |
| | | | | | | | | | | | | |
II. Unconsolidated Assets (At Company's pro rata share): | | | | | | | | | | | | | |
Inland Center (50%) | | | 03/11/09 | | | 4.69 | % | $ | 27,000 | | $ | — | | $ | 27,000 | |
North Bridge, The Shops at (50%) | | | 07/01/09 | | | 4.67 | % | | 102,746 | | | — | | | 102,746 | |
Biltmore Fashion Park (50%) | | | 07/10/09 | | | 4.70 | % | | 36,573 | | | — | | | 36,573 | |
Redmond Office (51%) | | | 07/10/09 | | | 6.77 | % | | 31,460 | | | — | | | 31,460 | |
Redmond Retail (51%) | | | 08/01/09 | | | 4.81 | % | | 36,134 | | | — | | | 36,134 | |
Corte Madera, The Village at (50.1%) | | | 11/01/09 | | | 7.75 | % | | 32,062 | | | — | | | 32,062 | |
Metrocenter Mall (15%) (i) | | | 02/09/10 | | | 6.05 | % | | 16,800 | | | — | | | 16,800 | |
12
| | | | | | | | | | | | | | | | |
| | As of December 31, 2008 | |
|---|
Center/Entity (dollars in thousands) | | Maturity Date | | Effective
Interest
Rate (a) | | Fixed | | Floating | | Total Debt
Balance (a) | |
|---|
Ridgmar (50%) | | | 04/11/10 | | | 6.11 | % | $ | 28,700 | | $ | — | | $ | 28,700 | |
Kitsap Mall/Place (51%) | | | 06/01/10 | | | 8.14 | % | | 28,793 | | | — | | | 28,793 | |
Cascade (51%) | | | 07/01/10 | | | 5.28 | % | | 19,783 | | | — | | | 19,783 | |
Stonewood Mall (51%) | | | 12/11/10 | | | 7.44 | % | | 37,264 | | | — | | | 37,264 | |
Arrowhead Towne Center (33.3%) | | | 10/01/11 | | | 6.38 | % | | 26,007 | | | — | | | 26,007 | |
SanTan Village Power Center (34.9%) | | | 02/01/12 | | | 5.33 | % | | 15,705 | | | — | | | 15,705 | |
NorthPark Center (50%) | | | 05/10/12 | | | 5.96 | % | | 92,120 | | | — | | | 92,120 | |
NorthPark Center (50%) | | | 05/10/12 | | | 8.33 | % | | 41,109 | | | — | | | 41,109 | |
NorthPark Land (50%) | | | 05/10/12 | | | 8.33 | % | | 39,707 | | | — | | | 39,707 | |
Kierland Greenway (24.5%) | | | 01/01/13 | | | 6.02 | % | | 15,450 | | | — | | | 15,450 | |
Kierland Main Street (24.5%) | | | 01/02/13 | | | 4.99 | % | | 3,753 | | | — | | | 3,753 | |
Scottsdale Fashion Square (50%) | | | 07/08/13 | | | 5.66 | % | | 275,000 | | | — | | | 275,000 | |
Tysons Corner Center (50%) | | | 02/17/14 | | | 4.78 | % | | 165,754 | | | — | | | 165,754 | |
Lakewood Mall (51%) | | | 06/01/15 | | | 5.43 | % | | 127,500 | | | — | | | 127,500 | |
Broadway Plaza (50%) | | | 08/15/15 | | | 6.12 | % | | 74,706 | | | — | | | 74,706 | |
Chandler Festival (50%) | | | 11/01/15 | | | 6.39 | % | | 14,850 | | | — | | | 14,850 | |
Chandler Gateway (50%) | | | 11/01/15 | | | 6.37 | % | | 9,450 | | | — | | | 9,450 | |
Washington Square (51%) | | | 01/01/16 | | | 6.04 | % | | 127,500 | | | — | | | 127,500 | |
Eastland Mall (50%) | | | 06/01/16 | | | 5.80 | % | | 84,000 | | | — | | | 84,000 | |
Empire Mall (50%) | | | 06/01/16 | | | 5.81 | % | | 88,150 | | | — | | | 88,150 | |
Granite Run (50%) | | | 06/01/16 | | | 5.84 | % | | 59,127 | | | — | | | 59,127 | |
Mesa Mall (50%) | | | 06/01/16 | | | 5.82 | % | | 43,625 | | | — | | | 43,625 | |
Rushmore (50%) | | | 06/01/16 | | | 5.82 | % | | 47,000 | | | — | | | 47,000 | |
Southern Hills (50%) | | | 06/01/16 | | | 5.82 | % | | 50,750 | | | — | | | 50,750 | |
Valley Mall (50%) | | | 06/01/16 | | | 5.85 | % | | 22,997 | | | — | | | 22,997 | |
West Acres (19%) | | | 10/01/16 | | | 6.41 | % | | 12,799 | | | — | | | 12,799 | |
Wilshire Building (30%) | | | 01/01/33 | | | 6.35 | % | | 1,836 | | | — | | | 1,836 | |
| | | | | | | | | | | | | |
Total Fixed Rate Debt for Unconsolidated Assets | | | | | | 5.83 | % | $ | 1,836,210 | | $ | — | | $ | 1,836,210 | |
| | | | | | | | | | | | | |
Superstition Springs Center (33.3%) | | | 09/09/09 | | | 1.25 | % | | — | | | 22,498 | | | 22,498 | |
Camelback Colonnade (75%) | | | 10/09/09 | | | 1.90 | % | | — | | | 31,125 | | | 31,125 | |
Metrocenter Mall (15%) (i) | | | 02/09/10 | | | 8.02 | % | | — | | | 3,240 | | | 3,240 | |
Desert Sky Mall (50%) | | | 03/04/10 | | | 2.14 | % | | — | | | 25,750 | | | 25,750 | |
Kierland Tower Lofts (15%) | | | 11/18/10 | | | 3.38 | % | | — | | | 1,679 | | | 1,679 | |
Boulevard Shops (50%) | | | 12/17/10 | | | 4.11 | % | | — | | | 10,700 | | | 10,700 | |
Chandler Village Center (50%) | | | 01/15/11 | | | 2.57 | % | | — | | | 8,643 | | | 8,643 | |
Market at Estrella Falls (35.1%) | | | 06/01/11 | | | 3.94 | % | | — | | | 11,560 | | | 11,560 | |
Los Cerritos Center (51%) | | | 07/01/11 | | | 2.14 | % | | — | | | 66,300 | | | 66,300 | |
| | | | | | | | | | | | | |
Total Floating Rate Debt for Unconsolidated Assets | | | | | | 2.36 | % | $ | — | | $ | 181,495 | | $ | 181,495 | |
| | | | | | | | | | | | | |
Total Debt for Unconsolidated Assets | | | | | | 5.51 | % | $ | 1,836,210 | | $ | 181,495 | | $ | 2,017,705 | |
| | | | | | | | | | | | | |
Total Debt | | | | | | 5.19 | % | $ | 6,187,018 | | $ | 1,739,223 | | $ | 7,926,241 | |
| | | | | | | | | | | | | |
Percentage to Total | | | | | | | | | 78.06 | % | | 21.94 | % | | 100.00 | % |
- (a)
- The debt balances include the unamortized debt premiums/discounts. Debt premiums/discounts represent the excess of the fair value of debt over the principal value of debt assumed in various acquisitions and are amortized into interest expense over the remaining term of the related debt in a manner that approximates the effective interest method. The annual interest rate in the above table represents the effective interest rate, including the debt premiums/discounts and loan financing costs.
- (b)
- The existing loan was replaced by a new $130.0 million loan on February 2, 2009. The new loan bears interest at 7.5% and matures on March 1, 2013.
- (c)
- This debt has an interest rate swap agreement which effectively fixed the interest rate from December 1, 2005 to April 15, 2010.
- (d)
- This debt has an interest rate swap agreement which effectively fixed the interest rate from September 12, 2006 to April 25, 2011.
- (e)
- These convertible senior notes were issued on 3/16/07 in an aggregate amount of $950.0 million. The above table includes the unamortized discount of $4.7 million and the annual interest rate represents the effective interest rate, including the discount. In the fourth quarter of 2008, the Company retired $222.8 million of the notes.
- (f)
- This property is a consolidated joint venture. The above debt balance represents the Company's pro rata share of 51.3%.
- (g)
- This property is a consolidated joint venture. The above debt balance represents the Company's pro rata share of 52.8%.
- (h)
- This property is a consolidated joint venture. The above debt balance represents the Company's pro rata share of 84.9%.
- (i)
- This debt has an interest rate swap agreement, expiring February 15, 2009, which effectively fixed the interest rate.
13
The Macerich Company
Supplemental Financial and Operating Information (Unaudited)
2009 Summary of Financing Activity (at Company's pro rata share)
| | | | | | | | | | | | | | | | | | | | | | | |
Center/Entity (dollars in thousands) | | Sales PSF as
of 12/31/08 | | Maturity
Date | | Total Debt
Maturing in 2009
(Balance as of
12/31/08) | | Less Debt with
Extension Options | | Net Debt
Maturing in
2009 | | Estimated
New Proceeds(a) | | Estimated
Net Proceeds
Over Existing
Loan Amount(a) | |
|---|
| | 2009 closed financings/commitments: | | | | | | | | | | | | | | | | | | | | | |
Queens Center (b) | | $ | 876 | | 03/01/13 | | $ | 88,913 | | | | | $ | 88,913 | | $ | 130,000 | | $ | 41,087 | |
Redmond Office (51%) (c) | | | n/a | | 07/10/09 | | | 31,460 | | | | | | 31,460 | | | 31,620 | | | 160 | |
Washington Square (51%) (d) | | | 682 | | 01/01/16 | | | 64,261 | | | | | | 64,261 | | | 127,500 | | | 63,239 | |
| | | | | | | | | | | | | | | | | | | |
| | | Subtotal—funded or committed: | | | | | | | | | | | | | | 184,634 | | | 289,120 | | | 104,486 | |
| | | | | | | | | | | | | | | | | | | |
| | 2009 loans maturing: | | | | | | | | | | | | | | | | | | | | | |
Biltmore Fashion Park (50%) | | | 837 | | 07/10/09 | | | 36,573 | | | | | | 36,573 | | | 37,000 | | | 427 | |
Carmel Plaza | | | 489 | | 05/01/09 | | | 25,805 | | | | | | 25,805 | | | 25,000 | | | (805 | ) |
Corte Madera, The Village at (50.1%) | | | 788 | | 11/01/09 | | | 32,062 | | | | | | 32,062 | | | 55,000 | | | 22,938 | |
La Cumbre Plaza | | | 444 | | 08/09/09 | | | 30,000 | | | | | | 30,000 | | | 25,000 | | | (5,000 | ) |
Los Cerritos (e) | | | n/a | | | | | | | | | | | — | | | 35,000 | | | 35,000 | |
Northridge Mall | | | 317 | | 07/01/09 | | | 79,657 | | | | | | 79,657 | | | 73,000 | | | (6,657 | ) |
Paradise Valley Mall | | | 311 | | 05/01/09 | | | 20,259 | | | | | | 20,259 | | | 100,000 | | | 79,741 | |
Redmond Retail (51%) | | | 361 | | 08/01/09 | | | 36,134 | | | | | | 36,134 | | | 35,000 | | | (1,134 | ) |
Shops at North Bridge, The (50%) | | | 817 | | 07/01/09 | | | 102,746 | | | | | | 102,746 | | | 125,000 | | | 22,254 | |
Wilton Mall | | | 292 | | 11/01/09 | | | 42,608 | | | | | | 42,608 | | | 50,000 | | | 7,392 | |
| | | | | | | | | | | | | | | | | | | |
| | | Subtotal—remaining 2009 maturities | | | | | | | | | | | | | | 405,844 | | | 560,000 | | | 154,156 | |
| | | | | | | | | | | | | | | | | | | |
| | Expected fundings under existing/new development loans: | | | | | | | | | | | | | | | | | | | | | |
Estrella Falls Marketplace (35.1%) | | | | | | | | | | | | | | — | | | 5,000 | | | 5,000 | |
Northgate Mall (f) | | | n/a | | | | | | | | | | | — | | | 50,000 | | | 50,000 | |
Oaks | | | | | | | | | | | | | | — | | | 20,000 | | | 20,000 | |
| | 2009 loans with extension options (g): | | | | | | | | | | | | | | | | | | | | | |
Camelback Colonnade (75%) | | | | | 10/09/09 | | | 31,125 | | $ | 31,125 | | | — | | | — | | | — | |
Inland Center (50%) | | | | | 03/11/09 | | | 27,000 | | | 27,000 | | | — | | | — | | | — | |
Promenade at Casa Grande (51.3%) | | | | | 08/16/09 | | | 49,859 | | | 49,859 | | | — | | | — | | | — | |
Superstition Springs Center (33.3%) | | | | | 09/09/09 | | | 22,498 | | | 22,498 | | | — | | | — | | | — | |
| | 2009 loans under negotiation for extension: | | | | | | | | | | | | | | | | | | | | | |
Twenty Ninth Street (h) | | | | | 06/05/09 | | | 115,000 | | | 115,000 | | | — | | | — | | | — | |
| | | | | | | | | | | | | | | | |
Total / Average | | $ | 565 | | | | $ | 835,960 | | $ | 245,482 | | $ | 590,478 | | $ | 924,120 | | $ | 333,642 | |
| | | | | | | | | | | | | | | | |
- (a)
- Much of this information is estimated and may change from time to time. See the Company's Forward Looking Statements disclosure on page 1 for factors that may effect the information provided in this table.
- (b)
- The Company refinanced this loan on a portion of Queens Center on February 1, 2009 with a new loan for $130.0 million at a fixed rate of 7.50% that matures 3/1/2013.
- (c)
- The Company has received a commitment for a $32 million refinancing for five years, at a fixed rate of 7.50% which is expected to close in May 2009.
- (d)
- The Company refinanced this loan on December 10, 2008 with a new loan for $127.5 million at a fixed rate of 6.0% that matures 1/1/2016.
- (e)
- This anticipates the exercise of an accordion funding from the existing mortgage.
- (f)
- This anticipates a new development financing totaling approximately $75.0 million.
- (g)
- These loans have extension options that have not yet been exercised by the Company.
- (h)
- The Company is currently negotiating a three year extension of this loan.
14
The Macerich Company
Supplemental Financial and Operating Information (Unaudited)
2010 Summary of Financing Activity (at Company's pro rata share)
| | | | | | | | | | | | | | | | | | | | | | |
Center/Entity (dollars in thousands) | | Sales PSF as
of 12/31/08 | | Maturity
Date | | Total Debt
Maturing in 2010
(Balance as of
12/31/08) | | Less Debt with
Extension Options | | Net Debt
Maturing in
2010 | | Estimated
New Proceeds(a) | | Estimated
Net Proceeds
Over Existing
Loan Amount(a) | |
|---|
| | 2010 loans maturing: | | | | | | | | | | | | | | | | | | | | | |
Boulevard Shops (50%) | | | 386 | | 12/17/10 | | $ | 10,700 | | | | | $ | 10,700 | | $ | 13,000 | | $ | 2,300 | |
Camelback Colonnade (75%) | | | 307 | | 10/09/10 | | | 31,125 | | | | | | 31,125 | | | 42,000 | | | 10,875 | |
Cascade (51%) | | | 338 | | 07/01/10 | | | 19,783 | | | | | | 19,783 | | | 17,000 | | | (2,783 | ) |
Kierland Tower Lofts (15%) | | | n/a | | 11/18/10 | | | 1,679 | | | | | | 1,679 | | | — | | | (1,679 | ) |
Kitsap Mall/Place (51%) | | | 378 | | 06/01/10 | | | 28,793 | | | | | | 28,793 | | | 40,000 | | | 11,207 | |
Macerich Partnership—Term Loan | | | n/a | | 04/26/10 | | | 446,250 | | | | | | 446,250 | | | 350,000 | | | (96,250 | ) |
Metrocenter Mall (15%) | | | 274 | | 02/09/10 | | | 20,040 | | | | | | 20,040 | | | 10,500 | | | (9,540 | ) |
Ridgmar (50%) | | | 311 | | 04/11/10 | | | 28,700 | | | | | | 28,700 | | | 25,000 | | | (3,700 | ) |
Santa Monica Place | | | n/a | | 11/01/10 | | | 77,888 | | | | | | 77,888 | | | 220,000 | | | 142,112 | |
Stonewood Mall (51%) | | | 420 | | 12/11/10 | | | 37,264 | | | | | | 37,264 | | | 75,000 | | | 37,736 | |
Vintage Faire Mall | | | 484 | | 09/01/10 | | | 63,329 | | | | | | 63,329 | | | 180,000 | | | 116,671 | |
| | Expected fundings under existing/new development loans: | | | | | | | | | | | | | | | | | | | | | |
Estrella Falls Marketplace (35.1%) | | | | | | | | | | | | | | — | | | 5,000 | | | 5,000 | |
Northgate Mall | | | | | | | | | | | | | | — | | | 25,000 | | | 25,000 | |
Oaks | | | | | | | | | | | | | | — | | | 40,000 | | | 40,000 | |
| | 2010 loans with extension options: | | | | | | | | | | | | | | | | | | | | | |
Desert Sky Mall (50%) | | | | | 03/04/10 | | | 25,750 | | $ | 25,750 | | | — | | | — | | | — | |
Macerich Partnership—Line of Credit | | | | | 04/26/10 | | | 1,099,500 | | | 1,099,500 | | | — | | | — | | | — | |
Panorama Mall | | | | | 02/28/10 | | | 50,000 | | | 50,000 | | | — | | | — | | | — | |
Promenade at Casa Grande (51.3%) | | | | | 08/16/10 | | | 49,859 | | | 49,859 | | | — | | | — | | | — | |
Superstition Springs Center (33.3%) | | | | | 09/09/10 | | | 22,498 | | | 22,498 | | | — | | | — | | | — | |
| | | | | | | | | | | | | | | | |
Total / Average | | $ | 362 | | | | $ | 2,013,158 | | $ | 1,247,607 | | $ | 765,551 | | $ | 1,042,500 | | $ | 276,949 | |
| | | | | | | | | | | | | | | | |
- (a)
- Much of this information is estimated and may change from time to time. See the Company's Forward Looking Statements disclosure on page 1 for factors that may effect the information in this table.
15
The Macerich Company
Supplemental Financial and Operating Information
Development Pipeline Forecast
as of December 31, 2008
| | | | | | | | | | | | | | | | | | | | | | | | | | | | | |
| |
| |
| |
| |
| |
| |
| |
| |
| | Estimated Year Placed
in Service
(a) | |
|---|
| |
| |
| |
| |
| |
| | Estimated
Pro rata
Project Cost
(a) | | Estimated
Completion
Date
(a) | |
| | 2009 | | 2010 | |
|---|
| |
| |
| | Estimated
Project Size
(a) | | Estimated Total
Project Cost
(a) | |
| | Pro rata
Spent to Date
as of 12-31-08 | |
|---|
Property | | Location | | Project Type | | Ownership % | | COST | | COST | |
|---|
REDEVELOPMENT | | | | | | | | | | | | | | | | | | | | | | | | | | | | | |
Scottsdale Fashion Square | | Scottsdale, AZ | | Expansion—Barneys New York/Retail | | | 170,000 | | $ | 143,000,000 | | | 50 | % | $ | 71,500,000 | | | 2009/2010 | | $ | 35,000,000 | | $ | 60,775,000 | | $ | 10,725,000 | |
The Oaks | | Thousand Oaks, CA | | Expansion and Nordstrom | | | 97,288 | | $ | 235,000,000 | | | 100 | % | $ | 235,000,000 | | | 2008/2009 | | $ | 45,000,000 | | $ | 65,000,000 | | | | |
FlatIron Crossing | | Broomfield, CO | | Redevelopment—Lord & Taylor Building | | | 100,000 | | $ | 17,000,000 | | | 100 | % | $ | 17,000,000 | | | 2009/2010 | | $ | 8,000,000 | | $ | 14,000,000 | | $ | 3,000,000 | |
Northgate Mall | | San Rafael, CA | | New Retail Development | | | 725,000 | | $ | 79,000,000 | | | 100 | % | $ | 79,000,000 | | | 2009/2010 | | $ | 23,000,000 | | $ | 50,000,000 | | $ | 29,000,000 | |
Santa Monica Place | | Santa Monica, CA | | New Mall Development | | | 550,000 | | $ | 265,000,000 | | | 100 | % | $ | 265,000,000 | | | 2010 | | $ | 82,000,000 | | | | | $ | 265,000,000 | |
Fiesta Mall | | Mesa, AZ | | Anchor Replacement | | | 110,000 | | $ | 50,000,000 | | | 100 | % | $ | 50,000,000 | | | 2009 | | $ | 37,000,000 | | $ | 50,000,000 | | | | |
Lakewood Mall | | Lakewood, CA | | Anchor Addition—Costco | | | 160,000 | | $ | 23,000,000 | | | 51 | % | $ | 11,730,000 | | | 2009 | | $ | 10,000,000 | | $ | 11,730,000 | | | | |
Los Cerritos | | Cerritos, CA | | Anchor Expansion—Nordstrom | | | 36,500 | | $ | 56,000,000 | | | 51 | % | $ | 28,560,000 | | | 2010 | | $ | 7,000,000 | | | | | $ | 28,560,000 | |
| | | | | | | | | | | | | | | | | | | | | | |
TOTAL | | | | | | | 1,948,788 | | $ | 868,000,000 | | | | | $ | 757,790,000 | | | | | $ | 247,000,000 | | $ | 251,505,000 | | $ | 336,285,000 | |
LESS COSTS INCURRED THROUGH 12-31-08 | | | | | | | | | | | | | | | | | | | | | | | | $ | 158,000,000 | | $ | 89,000,000 | |
| | | | | | | | | | | | | | | | | | | | | | | | | | | | |
NET COSTS REMAINING TO BE INCURRED | | | | | | | | | | | | | | | | | | | | | | | | $ | 93,505,000 | | $ | 247,285,000 | |
NOTES
(a)—Much of this information is estimated and may change from time to time. See the Company's Forward Looking Statements disclosure on page 1 for factors that may effect the information provided in this table.
16
QuickLinks
The Macerich Company Supplemental Financial and Operating Information Table of ContentsThe Macerich Company Supplemental Financial and Operating Information OverviewThe Macerich Company Supplemental Financial and Operating Information (unaudited) Capital Information and Market CapitalizationPortfolio Capitalization at December 31, 2008The Macerich Company Supplemental Financial and Operating Information (unaudited) Changes in Total Common and Equivalent Shares/UnitsThe Macerich Company Supplemental Financial and Operating Information (unaudited) Supplemental Funds from Operations ("FFO") Information(a)The Macerich Company Supplemental Financial and Operating Information (unaudited) Capital ExpendituresThe Macerich Company Supplemental Financial and Operating Information (unaudited) Sales Per Square Foot(a)The Macerich Company Supplemental Financial and Operating Information (unaudited) OccupancyThe Macerich Company Supplemental Financial and Operating Information (unaudited) RentThe Macerich Company Supplemental Financial and Operating Information (unaudited) Cost of OccupancyThe Macerich Company Supplemental Financial and Operating Information (unaudited) Summarized Balance Sheet InformationThe Macerich Company Supplemental Financial and Operating Information (unaudited) Debt Summary (at Company's pro rata share)The Macerich Company Supplemental Financial and Operating Information (Unaudited) Outstanding Debt by Maturity Date