UNITED STATES
SECURITIES AND EXCHANGE COMMISSION
Washington, DC 20549
FORM N-CSRS
CERTIFIED SHAREHOLDER REPORT OF REGISTERED
MANAGEMENT INVESTMENT COMPANIES
Investment Company Act file number 811-08034
Franklin Real Estate Securities Trust
(Exact name of registrant as specified in charter)
One Franklin Parkway, San Mateo, CA 94403-1906
(Address of principal executive offices) (Zip code)
Craig S. Tyle, One Franklin Parkway, San Mateo, CA 94403-1906
(Name and address of agent for service)
Registrant’s telephone number, including area code: 650 312-2000
Date of fiscal year end: 4/30
Date of reporting period: 10/31/17
| Item 1. | Reports to Stockholders. |
| | |
 | | Semiannual Report and Shareholder Letter October 31, 2017 |
Franklin Real Estate Securities Fund
A SERIES OF FRANKLIN REAL ESTATE SECURITIES TRUST

Sign up for electronic delivery at franklintempleton.com/edelivery
Franklin Templeton Investments
Gain From Our Perspective®
At Franklin Templeton Investments, we’re dedicated to one goal: delivering exceptional asset management for our clients. By bringing together multiple, world-class investment teams in a single firm, we’re able to offer specialized expertise across styles and asset classes, all supported by the strength and resources of one of the world’s largest asset managers. This has helped us to become a trusted partner to individual and institutional investors across the globe.
Dear Shareholder:
During the six months ended October 31, 2017, mostly upbeat economic data, improved US corporate earnings and a supportive monetary policy were positives for US securities markets. At its June meeting, the US Federal Reserve (Fed) increased its target range for the federal funds rate a quarter point to 1.00%–1.25%. Despite low inflation, the Fed made this decision amid signs of a strengthening labor market and moderately rising economic activity. The 10-year US Treasury yield began the period at 2.29% and ended the period at 2.38%. In this environment, US stocks, as measured by the Standard & Poor’s 500® Index, generated a +9.10% total return for the six-month period.1
We are committed to our long-term perspective and disciplined investment approach as we conduct a rigorous, fundamental analysis of securities with a regular emphasis on investment risk management.
We believe active, professional investment management serves investors well. We also recognize the important role of financial advisors in today’s markets and encourage investors to continue to seek their advice. Amid changing markets and economic conditions, we are confident investors with a well-diversified portfolio and a patient, long-term outlook should be well positioned for the years ahead.
In addition, Franklin Real Estate Securities Fund’s semiannual report includes more detail about prevailing conditions and a
discussion about investment decisions during the period. Please remember all securities markets fluctuate, as do mutual fund share prices.
We thank you for investing with Franklin Templeton, welcome your questions and comments, and look forward to serving your future investment needs.
Sincerely,

Edward B. Jamieson
President and Chief Executive Officer –
Investment Management
Franklin Real Estate Securities Trust
This letter reflects our analysis and opinions as of October 31, 2017, unless otherwise indicated. The information is not a complete analysis of every aspect of any market, country, industry, security or fund. Statements of fact are from sources considered reliable.
1. Source: Morningstar.
See www.franklintempletondatasources.com for additional data provider information.
| | |
| | Not FDIC Insured | May Lose Value | No Bank Guarantee |
| | | | | | |
| franklintempleton.com | | Not part of the semiannual report | | | 1 | |
Contents
Semiannual Report
Visit franklintempleton.com for fund updates, to access your account, or to find helpful financial planning tools.
| | | | | | |
| | 2 | | | Semiannual Report | | franklintempleton.com |
Semiannual Report
Franklin Real Estate Securities Fund
We are pleased to bring you Franklin Real Estate Securities Fund’s semiannual report for the period ended October 31, 2017.
Your Fund’s Goal and Main Investments
The Fund seeks to maximize total return by investing at least 80% of its net assets in equity securities of companies operating in the real estate industry predominantly in the US, including real estate investment trusts (REITs) and companies that derive at least half of their assets or revenues from the ownership, construction, management, operation, development or sale of commercial or residential real estate.1
Performance Overview
The Fund’s Class A shares delivered a +1.34% cumulative total return for the six months under review. In comparison, the Standard & Poor’s (S&P®) U.S. Property Index, which tracks the investable universe of publicly traded US property companies, produced a +1.13% total return.2 You can find the Fund’s long-term performance data in the Performance Summary beginning on page 7.
Performance data represent past performance, which does not guarantee future results. Investment return and principal value will fluctuate, and you may have a gain or loss when you sell your shares. Current performance may differ from figures shown. For most recent month-end performance, go to franklintempleton.com or call (800) 342-5236.
Economic and Market Overview
The US economy grew during the six months under review. The economy grew faster in 2017’s third quarter than in the second quarter, driven by consumer spending, inventory investment, business spending and exports. The manufacturing and services sectors expanded during the period. The unemployment rate decreased from 4.4% in April 2017 to 4.1% at period-end.3 Monthly retail sales were volatile during the
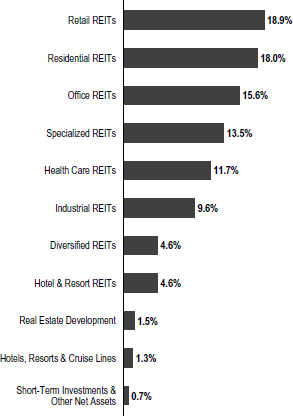
Portfolio Composition
Based on Total Net Assets as of 10/31/17
period. Annual inflation, as measured by the Consumer Price Index, decreased from 2.2% in April 2017 to 2.0% at period-end.3
1. A REIT is a type of real estate company that is dedicated to owning and usually operating income-producing real estate properties such as apartments, hotels, industrial properties, office buildings or shopping centers. Equity REITs generally receive income from rents received, are generally operated by experienced property management teams and typically concentrate on a specific geographic region or property type.
2. Source: Morningstar.
The index is unmanaged and includes reinvestment of any income or distributions. It does not reflect any fees, expenses or sales charges. One cannot invest directly in an index, and an index is not representative of the Fund’s portfolio.
3. Source: Bureau of Labor Statistics.
The dollar value, number of shares or principal amount, and names of all portfolio holdings are listed in the Fund’s Statement of Investments (SOI). The SOI begins on page 14.
| | | | | | |
| franklintempleton.com | | Semiannual Report | | | 3 | |
FRANKLIN REAL ESTATE SECURITIES FUND
At its June meeting, the US Federal Reserve (Fed) raised its target range for the federal funds rate 0.25% to 1.00%–1.25%, amid signs of a growing US economy, strengthening labor market and improving business spending. At its July and September 2017 meetings, the Fed kept its target range unchanged. Furthermore in September, the Fed mentioned that it would begin implementing its balance sheet reduction in October. The minutes of the Fed’s September meeting released in October suggested that many committee members were concerned that low inflation readings this year might not be transitory and could be more persistent than expected.
US equity markets rose during the period, benefiting from mostly upbeat economic data and better US corporate earnings. The markets were also supported by investor optimism arising from Emmanuel Macron’s victory in France’s presidential election, comments from the US Fed chair indicating optimism about the US economy and the likelihood of gradual rate hikes, and the Senate’s approval of a budget plan that raised expectations for tax reforms. However, geopolitical tensions in the Korean peninsula and uncertainty about President Trump’s ability to implement reforms curbed market sentiment. The broad US stock market, as measured by the Standard & Poor’s 500 Index, generated +9.10% total return for the period.2
Investment Strategy
We are research-driven, fundamental investors with an active investment strategy. We use a bottom-up security selection process that incorporates macro-level views in our evaluation process. We analyze individual stock and real estate market fundamentals to provide regional, property type and company-size perspectives in identifying local cyclical and thematic trends that highlight investment opportunities.
Manager’s Discussion
During the six months under review, security selection and an overweighting in the specialty sector contributed to the Fund’s performance relative to the S&P U.S. Property index.4 Shares of Alexandria Real Estate Equities, a specialty REIT with a focus on serving real estate needs of life-science, laboratory-space and technology tenants, performed well during the period. The company owns a portfolio of assets located in innovation centers or cluster markets (i.e., close to major universities and hospitals) in gateway cities such as Cambridge, Massachusetts; San Francisco; and New York City. Based on our analysis, Alexandria’s core portfolio has been generating
| | | | |
| Top 10 Holdings | | | |
| 10/31/17 | | | |
Company Sector/Industry | | % of Total Net Assets | |
Simon Property Group Inc. Retail REITs | | | 7.4% | |
Prologis Inc. Industrial REITs | | | 5.6% | |
Equity Residential Residential REITs | | | 4.4% | |
Welltower Inc. Health Care REITs | | | 4.0% | |
AvalonBay Communities Inc. Residential REITs | | | 3.9% | |
Digital Realty Trust Inc. Specialized REITs | | | 3.4% | |
Public Storage Specialized REITs | | | 3.3% | |
Alexandria Real Estate Equities Inc. Office REITs | | | 3.2% | |
Ventas Inc. Health Care REITs | | | 3.0% | |
Boston Properties Inc. Office REITs | | | 2.9% | |
consistently better-than-expected operating results during the period with steady and strong leasings reflecting the prevailing strong fundamentals in the life-science and technology sectors. We believe Alexandria, which focuses on laboratory and life-science office space, remains well positioned to potentially generate above-average earnings growth for the next few years with the delivery of its current development projects as well as steady growth.
The Fund’s positioning in the industrial property sector also boosted results relative to the benchmark.5 Rexford Industrial Realty, a small-capitalization industrial REIT based in Los Angeles, also performed well during the reporting period. Similar to other players in the sector, Rexford has continued to benefit from strong operating fundamentals, with healthy and steady tenant demand both from traditional and e-commerce businesses. We have continued to favor the company’s focused
4. Specialty sector holdings can be found under office REITs and specialized REITs in the SOI.
5. Industrial property sector holdings can be found under industrial REITs in the SOI.
| | | | |
| 4 | | Semiannual Report | | franklintempleton.com |
FRANKLIN REAL ESTATE SECURITIES FUND
strategy to grow through acquisitions of properties in highly fragmented markets in Southern California’s urban centers, where it does not face competition from larger industrial players. We expect that supply in these markets will remain limited given the difficulty of getting construction permits and the lack of available land. Rexford’s recent core results have remained strong with increased occupancy, above average same-store net-operating-income growth and double-digit percentage increase in rates for new rentals. For all these reasons, we believe the company’s earnings growth should continue to accelerate with strong internal and external growth (through property acquisitions) over the next one to two years.
Other individual contributors to Fund performance over the six-month period included the Fund’s investment in Equity LifeStyle Properties, a manufactured homes REIT that focuses on owning and operating manufactured housing and resort communities in the US. The stock’s performance reflected continued strength in manufactured housing fundamentals with steady demand and no signs of any near-term supply pressures. The company has continued to generate strong core results with stable cash flow growth. Besides steady growth, we also believe that the company, backed by a strong balance sheet and high-quality management, remains well positioned to take advantage of consolidation opportunities within the highly fragmented manufactured-housing industry.
Conversely, stock selection in the triple-net leasing sector detracted from relative performance over the reporting period with holdings such as National Retail Properties (no longer held by period-end), an owner of stand-alone, single-tenant retail across the US.6 Although less cyclical and more e-commerce resistant in its nature than other forms of retail, the triple-net leasing sector has not been immune to the broader retail fallout of 2017 with high-profile tenant issues of its own, including ShopKo and Gander Mountain (each not a Fund holding). Although the company owns what we view as a well-diversified portfolio, shares began to decline given the broader environment and a recent slippage in operating metrics.
Security selection in the residential sector also weighed on results.7 Shares of American Homes 4 Rent declined over the reporting period after performing well in 2016 and the early part of 2017 amid accelerating operating metrics, a compelling external growth story and positive balance sheet initiatives. However, these operating metrics appear to us to have peaked,
showing deterioration in the past two quarters with same-store revenue growth falling in the third quarter of 2017 compared to most of 2016. Additionally, investors were concerned about the external growth strategy and the viability of the company’s proposed build-to-rent strategy.
Other detractors over the reporting period included the Fund’s investment in HCP, one of the largest health care REITs that focuses on life science, senior housing and medical office segments. We believe the stock’s underperformance was largely due to continued weakness in the company’s senior housing portfolio as it continues to face increased supply pressures and other operational challenges. As a result, rent coverage ratio (EBITDAR to rent collected) for one of its largest senior housing operators, Brookdale, steadily deteriorated.8 Additionally, analysts expect HCP’s earnings to be negatively impacted by additional asset sales. The company has been going through a transition following the departure of its former chief executive officer (CEO) last year. We view positively the company’s recently announced simplification strategy by its new CEO to focus on the private-pay, life-science, senior housing and medical office segments. HCP had already exited the riskier skilled nursing segment through a recent spinoff. However, we also think the stock may continue to face pressure in the near term as the company transitions in the next 12 months and until investors see successful execution on its plans to reduce its large tenant concentration and debt.
6. Triple-net leasing sector holdings can be found under diversified REITs and retail REITs in the SOI.
7. Residential sector holdings can be found under residential REITs in the SOI.
8. EBITDAR stands for earnings before interest, taxes, depreciation, amortization and rent.
See www.franklintempletondatasources.com for additional data provider information.
| | | | | | |
| franklintempleton.com | | Semiannual Report | | | 5 | |
FRANKLIN REAL ESTATE SECURITIES FUND
Thank you for your continued participation in Franklin Real Estate Securities Fund. We look forward to serving your future investment needs.
| | |
 | | 
Wilson Magee |
| | |
 | | 
Daniel Scher |
| | |
 | | 
Murat Sensoy, CFA |
| | Portfolio Management Team |
The foregoing information reflects our analysis, opinions and portfolio holdings as of October 31, 2017, the end of the reporting period. The way we implement our main investment strategies and the resulting portfolio holdings may change depending on factors such as market and economic conditions. These opinions may not be relied upon as investment advice or an offer for a particular security. The information is not a complete analysis of every aspect of any market, country, industry, security or the Fund. Statements of fact are from sources considered reliable, but the investment manager makes no representation or warranty as to their completeness or accuracy. Although historical performance is no guarantee of future results, these insights may help you understand our investment management philosophy.
CFA® is a trademark owned by CFA Institute.
| | | | |
| 6 | | Semiannual Report | | franklintempleton.com |
FRANKLIN REAL ESTATE SECURITIES FUND
Performance Summary as of October 31, 2017
The performance table does not reflect any taxes that a shareholder would pay on Fund dividends, capital gain distributions, if any, or any realized gains on the sale of Fund shares. Total return reflects reinvestment of the Fund’s dividends and capital gain distributions, if any, and any unrealized gains or losses. Your dividend income will vary depending on dividends or interest paid by securities in the Fund’s portfolio, adjusted for operating expenses of each class. Capital gain distributions are net profits realized from the sale of portfolio securities.
Performance as of 10/31/171
Cumulative total return excludes sales charges. Average annual total return includes maximum sales charges. Sales charges will vary depending on the size of the investment and the class of share purchased. The maximum is 5.75% and the minimum is 0%. Class A: 5.75% maximum initial sales charge; Advisor Class: no sales charges. For other share classes, visit franklintempleton.com.
| | | | | | | | |
| Share Class | | Cumulative
Total Return2 | | | Average Annual
Total Return3 | |
| | |
| A | | | | | | | | |
6-Month | | | +1.34% | | | | -4.50% | |
1-Year | | | +3.38% | | | | -2.58% | |
5-Year | | | +50.97% | | | | +7.31% | |
10-Year | | | +49.25% | | | | +3.47% | |
| | |
| Advisor | | | | | | | | |
6-Month | | | +1.43% | | | | +1.43% | |
1-Year | | | +3.60% | | | | +3.60% | |
5-Year | | | +52.88% | | | | +8.86% | |
10-Year | | | +52.99% | | | | +4.34% | |
Performance data represent past performance, which does not guarantee future results. Investment return and principal value will fluctuate, and you may have a gain or loss when you sell your shares. Current performance may differ from figures shown. For most recent month-end performance, go to franklintempleton.com or call (800) 342-5236.
See page 8 for Performance Summary footnotes.
| | | | | | |
| franklintempleton.com | | Semiannual Report | | | 7 | |
FRANKLIN REAL ESTATE SECURITIES FUND
PERFORMANCE SUMMARY
Distributions (5/1/17–10/31/17)
| | | | |
| Share Class | | Net Investment
Income | |
A | | | $0.0925 | |
C | | | $0.0358 | |
R6 | | | $0.1276 | |
Advisor | | | $0.1069 | |
Total Annual Operating Expenses4
| | | | |
| Share Class | | | |
A | | | 1.00% | |
Advisor | | | 0.75% | |
Each class of shares is available to certain eligible investors and has different annual fees and expenses, as described in the prospectus.
All investments involve risks, including possible loss of principal. The Fund’s concentration in real estate securities involves special risks, such as declines in the value of real estate and increased susceptibility to adverse economic or regulatory developments affecting the sector. The Fund’s investments in REITs involve additional risks; since REITs typically are invested in a limited number of projects or in a particular market segment, they are more susceptible to adverse developments affecting a single project or market segment than more broadly diversified investments. The Fund is actively managed but there is no guarantee that the manager’s investment decisions will produce the desired results. The Fund’s prospectus also includes a description of the main investment risks.
1. The Fund has a fee waiver associated with any investment it makes in a Franklin Templeton money fund and/or other Franklin Templeton fund, contractually guaranteed through 8/31/18. Fund investment results reflect the fee waiver; without this waiver, the results would have been lower.
2. Cumulative total return represents the change in value of an investment over the periods indicated.
3. Average annual total return represents the average annual change in value of an investment over the periods indicated. Return for less than one year, if any, has not been annualized.
4. Figures are as stated in the Fund’s current prospectus and may differ from the expense ratios disclosed in the Your Fund’s Expenses and Financial Highlights sections in this report. In periods of market volatility, assets may decline significantly, causing total annual Fund operating expenses to become higher than the figures shown.
| | | | |
| 8 | | Semiannual Report | | franklintempleton.com |
FRANKLIN REAL ESTATE SECURITIES FUND
Your Fund’s Expenses
As a Fund shareholder, you can incur two types of costs: (1) transaction costs, including sales charges (loads) on Fund purchases and redemptions; and (2) ongoing Fund costs, including management fees, distribution and service (12b-1) fees, and other Fund expenses. All mutual funds have ongoing costs, sometimes referred to as operating expenses. The table below shows ongoing costs of investing in the Fund and can help you understand these costs and compare them with those of other mutual funds. The table assumes a $1,000 investment held for the six months indicated.
Actual Fund Expenses
The table below provides information about actual account values and actual expenses in the columns under the heading “Actual.” In these columns the Fund’s actual return, which includes the effect of Fund expenses, is used to calculate the “Ending Account Value.” You can estimate the expenses you paid during the period by following these steps (of course, your account value and expenses will differ from those in this illustration): Divide your account value by $1,000 (if your account had an $8,600 value, then $8,600 ÷ $1,000 = 8.6). Then multiply the result by the number in the row for your class of shares under the headings “Actual” and “Expenses Paid During Period” (if Actual Expenses Paid During Period were $7.50, then 8.6 x $7.50 = $64.50). In this illustration, the actual expenses paid this period are $64.50.
Hypothetical Example for Comparison with Other Funds
Under the heading “Hypothetical” in the table, information is provided about hypothetical account values and hypothetical expenses based on the Fund’s actual expense ratio and an assumed rate of return of 5% per year before expenses, which is not the Fund’s actual return. This information may not be used to estimate the actual ending account balance or expenses you paid for the period, but it can help you compare ongoing costs of investing in the Fund with those of other funds. To do so, compare this 5% hypothetical example for the class of shares you hold with the 5% hypothetical examples that appear in the shareholder reports of other funds.
Please note that expenses shown in the table are meant to highlight ongoing costs and do not reflect any transactional costs. Therefore, information under the heading “Hypothetical” is useful in comparing ongoing costs only, and will not help you compare total costs of owning different funds. In addition, if transactional costs were included, your total costs would have been higher.
| | | | | | | | | | | | | | | | | | |
| | | | | | | Actual (actual return after expenses) | | | | Hypothetical (5% annual return before expenses) |
Share Class | | Beginning
Account
Value 5/1/17 | | | | Ending
Account
Value 10/31/17 | | Expenses Paid During Period 5/1/17–10/31/171,2 | | | | Ending
Account
Value 10/31/17 | | Expenses Paid During Period 5/1/17–10/31/171,2 | | | | Net
Annualized
Expense
Ratio2 |
A | | $1,000 | | | | $1,013.40 | | $5.48 | | | | $1,019.76 | | $5.50 | | | | 1.08% |
C | | $1,000 | | | | $1,009.50 | | $9.27 | | | | $1,015.98 | | $9.30 | | | | 1.83% |
R6 | | $1,000 | | | | $1,016.10 | | $2.74 | | | | $1,022.48 | | $2.75 | | | | 0.54% |
Advisor | | $1,000 | | | | $1,014.30 | | $4.21 | | | | $1,021.02 | | $4.23 | | | | 0.83% |
1. Expenses are equal to the annualized expense ratio for the six-month period as indicated above—in the far right column—multiplied by the simple average account value over the period indicated, and then multiplied by 184/365 to reflect the one-half year period.
2. Reflects expenses after fee waivers and expense reimbursements. Does not include acquired fund fees and expenses.
| | | | | | |
| franklintempleton.com | | Semiannual Report | | | 9 | |
FRANKLIN REAL ESTATE SECURITIES TRUST
Financial Highlights
Franklin Real Estate Securities Fund
| | | | | | | | | | | | | | | | | | | | | | | | |
| | | Six Months Ended
October 31, 2017
(unaudited) | | | Year Ended April 30, | |
| | | 2017 | | | 2016 | | | 2015 | | | 2014 | | | 2013 | |
| | | | | | | | | | | | | | | | | | | | | | | | | |
| Class A | | | | | | | | | | | | | | | | | | | | | | | | |
Per share operating performance
(for a share outstanding throughout the period) | | | | | | | | | | | | | | | | | | | | | | | | |
| | | | | | |
Net asset value, beginning of period | | | $22.40 | | | | $22.65 | | | | $21.49 | | | | $19.31 | | | | $19.29 | | | | $16.78 | |
| | | | |
| | | | | | |
| Income from investment operationsa: | | | | | | | | | | | | | | | | | | | | | | | | |
| | | | | | |
Net investment incomeb | | | 0.24 | | | | 0.24 | | | | 0.48 | c | | | 0.30 | | | | 0.26 | | | | 0.23 | |
| | | | | | |
Net realized and unrealized gains (losses) | | | 0.06 | | | | 0.40 | | | | 1.05 | | | | 2.17 | | | | — | d | | | 2.49 | |
| | | | |
| | | | | | |
Total from investment operations | | | 0.30 | | | | 0.64 | | | | 1.53 | | | | 2.47 | | | | 0.26 | | | | 2.72 | |
| | | | |
| | | | | | |
Less distributions from: | | | | | | | | | | | | | | | | | | | | | | | | |
| | | | | | |
Net investment income | | | (0.09 | ) | | | (0.45 | ) | | | (0.37 | ) | | | (0.29 | ) | | | (0.24 | ) | | | (0.21 | ) |
| | | | | | |
Net realized gains | | | — | | | | (0.44 | ) | | | — | | | | — | | | | — | | | | — | |
| | | | |
| | | | | | |
Total distributions | | | (0.09 | ) | | | (0.89 | ) | | | (0.37 | ) | | | (0.29 | ) | | | (0.24 | ) | | | (0.21 | ) |
| | | | |
| | | | | | |
Net asset value, end of period | | | $22.61 | | | | $22.40 | | | | $22.65 | | | | $21.49 | | | | $19.31 | | | | $19.29 | |
| | | | |
| | | | | | |
Total returne | | | 1.34% | | | | 2.92% | | | | 7.17% | | | | 12.95% | | | | 1.49% | | | | 16.38% | |
| | | | | | |
| Ratios to average net assetsf | | | | | | | | | | | | | | | | | | | | | | | | |
| | | | | | |
Expenses before waiver and payments by affiliates | | | 1.08% | | | | 1.00% | | | | 1.00% | | | | 0.99% | | | | 1.05% | | | | 1.03% | |
| | | | | | |
Expenses net of waiver and payments by affiliates | | | 1.08% | g,h | | | 1.00% | g,h | | | 1.00% | h | | | 0.99% | h | | | 1.04% | | | | 1.03% | |
| | | | | | |
Net investment income | | | 2.10% | | | | 1.04% | | | | 2.21% | c | | | 1.41% | | | | 1.43% | | | | 1.33% | |
| | | | | | |
| Supplemental data | | | | | | | | | | | | | | | | | | | | | | | | |
| | | | | | |
Net assets, end of period (000’s) | | | $308,433 | | | | $333,601 | | | | $364,981 | | | | $381,925 | | | | $303,815 | | | | $347,101 | |
| | | | | | |
Portfolio turnover rate | | | 9.23% | | | | 39.66% | | | | 24.21% | | | | 24.12% | | | | 17.04% | | | | 22.69% | |
aThe amount shown for a share outstanding throughout the period may not correlate with the Statement of Operations for the period due to the timing of sales and repurchases of the Fund’s shares in relation to income earned and/or fluctuating fair value of the investments of the Fund.
bBased on average daily shares outstanding.
cNet investment income per share includes approximately $0.11 per share related to income received in the form of a special dividend in connection with certain Fund holdings. Excluding this amount, the ratio of net investment income to average net assets would have been 1.71%.
dAmount rounds to less than $0.01 per share.
eTotal return does not reflect sales commissions or contingent deferred sales charges, if applicable, and is not annualized for periods less than one year.
fRatios are annualized for periods less than one year, except for non-recurring expenses, if any.
gBenefit of expense reduction rounds to less than 0.01%.
hBenefit of waiver and payments by affiliates rounds to less than 0.01%.
| | | | |
| 10 | | Semiannual Report | The accompanying notes are an integral part of these financial statements. | | franklintempleton.com |
FRANKLIN REAL ESTATE SECURITIES TRUST
FINANCIAL HIGHLIGHTS
Franklin Real Estate Securities Fund (continued)
| | | | | | | | | | | | | | | | | | | | | | | | |
| | | Six Months Ended
October 31, 2017
(unaudited) | | | Year Ended April 30, | |
| | | 2017 | | | 2016 | | | 2015 | | | 2014 | | | 2013 | |
| | | | | | | | | | | | | | | | | | | | | | | | | |
| Class C | | | | | | | | | | | | | | | | | | | | | | | | |
Per share operating performance
(for a share outstanding throughout the period) | | | | | | | | | | | | | | | | | | | | | | | | |
| | | | | | |
Net asset value, beginning of period | | | $21.56 | | | | $21.86 | | | | $20.75 | | | | $18.66 | | | | $18.65 | | | | $16.20 | |
| | | | |
| | | | | | |
| Income from investment operationsa: | | | | | | | | | | | | | | | | | | | | | | | | |
| | | | | | |
Net investment incomeb | | | 0.15 | | | | 0.07 | | | | 0.30 | c | | | 0.13 | | | | 0.12 | | | | 0.10 | |
| | | | | | |
Net realized and unrealized gains (losses) | | | 0.06 | | | | 0.38 | | | | 1.02 | | | | 2.11 | | | | — | d | | | 2.40 | |
| | | | |
| | | | | | |
Total from investment operations | | | 0.21 | | | | 0.45 | | | | 1.32 | | | | 2.24 | | | | 0.12 | | | | 2.50 | |
| | | | |
| | | | | | |
Less distributions from: | | | | | | | | | | | | | | | | | | | | | | | | |
| | | | | | |
Net investment income | | | (0.04 | ) | | | (0.31 | ) | | | (0.21 | ) | | | (0.15 | ) | | | (0.11 | ) | | | (0.05 | ) |
| | | | | | |
Net realized gains | | | — | | | | (0.44 | ) | | | — | | | | — | | | | — | | | | — | |
| | | | |
| | | | | | |
Total distributions | | | (0.04 | ) | | | (0.75 | ) | | | (0.21 | ) | | | (0.15 | ) | | | (0.11 | ) | | | (0.05 | ) |
| | | | |
| | | | | | |
Net asset value, end of period | | | $21.73 | | | | $21.56 | | | | $21.86 | | | | $20.75 | | | | $18.66 | | | | $18.65 | |
| | | | |
| | | | | | |
Total returne | | | 0.95% | | | | 2.14% | | | | 6.40% | | | | 12.07% | | | | 0.73% | | | | 15.47% | |
| | | | | | |
| Ratios to average net assetsf | | | | | | | | | | | | | | | | | | | | | | | | |
| | | | | | |
Expenses before waiver and payments by affiliates | | | 1.83% | | | | 1.75% | | | | 1.75% | | | | 1.74% | | | | 1.80% | | | | 1.78% | |
| | | | | | |
Expenses net of waiver and payments by affiliates | | | 1.83% | g,h | | | 1.75% | g,h | | | 1.75% | h | | | 1.74% | h | | | 1.79% | | | | 1.78% | |
| | | | | | |
Net investment income | | | 1.35% | | | | 0.29% | | | | 1.46% | c | | | 0.66% | | | | 0.68% | | | | 0.58% | |
| | | | | | |
| Supplemental data | | | | | | | | | | | | | | | | | | | | | | | | |
| | | | | | |
Net assets, end of period (000’s) | | | $62,426 | | | | $72,637 | | | | $82,147 | | | | $89,328 | | | | $68,914 | | | | $77,324 | |
| | | | | | |
Portfolio turnover rate | | | 9.23% | | | | 39.66% | | | | 24.21% | | | | 24.12% | | | | 17.04% | | | | 22.69% | |
aThe amount shown for a share outstanding throughout the period may not correlate with the Statement of Operations for the period due to the timing of sales and repurchases of the Fund’s shares in relation to income earned and/or fluctuating fair value of the investments of the Fund.
bBased on average daily shares outstanding.
cNet investment income per share includes approximately $0.11 per share related to income received in the form of a special dividend in connection with certain Fund holdings. Excluding this amount, the ratio of net investment income to average net assets would have been 0.96%.
dAmount rounds to less than $0.01 per share.
eTotal return does not reflect sales commissions or contingent deferred sales charges, if applicable, and is not annualized for periods less than one year.
fRatios are annualized for periods less than one year, except for non-recurring expenses, if any.
gBenefit of expense reduction rounds to less than 0.01%.
hBenefit of waiver and payments by affiliates rounds to less than 0.01%.
| | | | | | |
| franklintempleton.com | | The accompanying notes are an integral part of these financial statements. | Semiannual Report | | | 11 | |
FRANKLIN REAL ESTATE SECURITIES TRUST
FINANCIAL HIGHLIGHTS
Franklin Real Estate Securities Fund (continued)
| | | | | | | | | | | | | | | | | | | | |
| | | Six Months Ended
October 31, 2017
(unaudited) | | | Year Ended April 30, | |
| | | 2017 | | | 2016 | | | 2015 | | | 2014a | |
| | | | | | | | | | | | | | | | | | | | | |
| Class R6 | | | | | | | | | | | | | | | | | | | | |
Per share operating performance
(for a share outstanding throughout the period) | | | | | | | | | | | | | | | | | | | | |
| | | | | |
Net asset value, beginning of period | | | $22.61 | | | | $22.83 | | | | $21.67 | | | | $19.46 | | | | $19.30 | |
| | | | |
| | | | | |
| Income from investment operationsb: | | | | | | | | | | | | | | | | | | | | |
| | | | | |
Net investment incomec | | | 0.29 | | | | 0.35 | | | | 0.58 | d | | | 0.41 | | | | 0.34 | |
| | | | | |
Net realized and unrealized gains (losses) | | | 0.08 | | | | 0.41 | | | | 1.05 | | | | 2.19 | | | | 0.14 | |
| | | | |
| | | | | |
Total from investment operations | | | 0.37 | | | | 0.76 | | | | 1.63 | | | | 2.60 | | | | 0.48 | |
| | | | |
| | | | | |
| Less distributions from: | | | | | | | | | | | | | | | | | | | | |
| | | | | |
Net investment income | | | (0.13 | ) | | | (0.54 | ) | | | (0.47 | ) | | | (0.39 | ) | | | (0.32 | ) |
| | | | | |
Net realized gains | | | — | | | | (0.44 | ) | | | — | | | | — | | | | — | |
| | | | |
| | | | | |
Total distributions | | | (0.13 | ) | | | (0.98 | ) | | | (0.47 | ) | | | (0.39 | ) | | | (0.32 | ) |
| | | | |
| | | | | |
Net asset value, end of period | | | $22.85 | | | | $22.61 | | | | $22.83 | | | | $21.67 | | | | $19.46 | |
| | | | |
| | | | | |
Total returne | | | 1.61% | | | | 3.42% | | | | 7.66% | | | | 13.47% | | | | 2.69% | |
| | | | | |
| Ratios to average net assetsf | | | | | | | | | | | | | | | | | | | | |
| | | | | |
Expenses before waiver and payments by affiliates | | | 0.62% | | | | 0.55% | | | | 0.54% | | | | 0.54% | | | | 0.57% | |
| | | | | |
Expenses net of waiver and payments by affiliates | | | 0.54% | g | | | 0.55% | g,h | | | 0.54% | h | | | 0.54% | h | | | 0.56% | |
| | | | | |
Net investment income | | | 2.64% | | | | 1.49% | | | | 2.67% | d | | | 1.86% | | | | 1.91% | |
| | | | | |
| Supplemental data | | | | | | | | | | | | | | | | | | | | |
| | | | | |
Net assets, end of period (000’s) | | | $3,383 | | | | $2,422 | | | | $104,392 | | | | $106,725 | | | | $97,224 | |
| | | | | |
Portfolio turnover rate | | | 9.23% | | | | 39.66% | | | | 24.21% | | | | 24.12% | | | | 17.04% | |
aFor the year May 1, 2013 (effective date) to April 30, 2014.
bThe amount shown for a share outstanding throughout the period may not correlate with the Statement of Operations for the period due to the timing of sales and repurchases of the Fund’s shares in relation to income earned and/or fluctuating fair value of the investments of the Fund.
cBased on average daily shares outstanding.
dNet investment income per share includes approximately $0.11 per share related to income received in the form of a special dividend in connection with certain Fund holdings. Excluding this amount, the ratio of net investment income to average net assets would have been 2.17%.
eTotal return is not annualized for periods less than one year.
fRatios are annualized for periods less than one year, except for non-recurring expenses, if any.
gBenefit of expense reduction rounds to less than 0.01%.
hBenefit of waiver and payments by affiliates rounds to less than 0.01%.
| | | | |
| 12 | | Semiannual Report | The accompanying notes are an integral part of these financial statements. | | franklintempleton.com |
FRANKLIN REAL ESTATE SECURITIES TRUST
FINANCIAL HIGHLIGHTS
Franklin Real Estate Securities Fund (continued)
| | | | | | | | | | | | | | | | | | | | | | | | |
| | | Six Months Ended
October 31, 2017
(unaudited) | | | Year Ended April 30, | |
| | | 2017 | | | 2016 | | | 2015 | | | 2014 | | | 2013 | |
| | | | | | | | | | | | | | | | | | | | | | | | | |
| Advisor Class | | | | | | | | | | | | | | | | | | | | | | | | |
Per share operating performance
(for a share outstanding throughout the period) | | | | | | | | | | | | | | | | | | | | | | | | |
| | | | | | |
Net asset value, beginning of period | | | $22.59 | | | | $22.83 | | | | $21.67 | | | | $19.46 | | | | $19.43 | | | | $16.92 | |
| | | | |
| | | | | | |
| Income from investment operationsa: | | | | | | | | | | | | | | | | | | | | | | | | |
| | | | | | |
Net investment incomeb | | | 0.26 | | | | 0.30 | | | | 0.54 | c | | | 0.33 | | | | 0.29 | | | | 0.27 | |
| | | | | | |
Net realized and unrealized gains (losses) | | | 0.07 | | | | 0.41 | | | | 1.04 | | | | 2.23 | | | | 0.03 | | | | 2.51 | |
| | | | |
| | | | | | |
Total from investment operations | | | 0.33 | | | | 0.71 | | | | 1.58 | | | | 2.56 | | | | 0.32 | | | | 2.78 | |
| | | | |
| | | | | | |
| Less distributions from: | | | | | | | | | | | | | | | | | | | | | | | | |
| | | | | | |
Net investment income | | | (0.11 | ) | | | (0.51 | ) | | | (0.42 | ) | | | (0.35 | ) | | | (0.29 | ) | | | (0.27 | ) |
| | | | | | |
Net realized gains | | | — | | | | (0.44 | ) | | | — | | | | — | | | | — | | | | — | |
| | | | |
| | | | | | |
Total distributions | | | (0.11 | ) | | | (0.95 | ) | | | (0.42 | ) | | | (0.35 | ) | | | (0.29 | ) | | | (0.27 | ) |
| | | | |
| | | | | | |
Net asset value, end of period | | | $22.81 | | | | $22.59 | | | | $22.83 | | | | $21.67 | | | | $19.46 | | | | $19.43 | |
| | | | |
| | | | | | |
Total returnd | | | 1.43% | | | | 3.18% | | | | 7.44% | | | | 13.24% | | | | 1.79% | | | | 16.64% | |
| | | | | | |
| Ratios to average net assetse | | | | | | | | | | | | | | | | | | | | | | | | |
| | | | | | |
Expenses before waiver and payments by affiliates | | | 0.83% | | | | 0.75% | | | | 0.75% | | | | 0.74% | | | | 0.80% | | | | 0.78% | |
| | | | | | |
Expenses net of waiver and payments by affiliates | | | 0.83% | f,g | | | 0.75% | f,g | | | 0.75% | g | | | 0.74% | g | | | 0.79% | | | | 0.78% | |
| | | | | | |
Net investment income | | | 2.35% | | | | 1.29% | | | | 2.46% | c | | | 1.66% | | | | 1.68% | | | | 1.58% | |
| | | | | | |
| Supplemental data | | | | | | | | | | | | | | | | | | | | | | | | |
| | | | | | |
Net assets, end of period (000’s) | | | $32,699 | | | | $50,521 | | | | $22,346 | | | | $17,644 | | | | $12,402 | | | | $108,076 | |
| | | | | | |
Portfolio turnover rate | | | 9.23% | | | | 39.66% | | | | 24.21% | | | | 24.12% | | | | 17.04% | | | | 22.69% | |
aThe amount shown for a share outstanding throughout the period may not correlate with the Statement of Operations for the period due to the timing of sales and repurchases of the Fund’s shares in relation to income earned and/or fluctuating fair value of the investments of the Fund.
bBased on average daily shares outstanding.
cNet investment income per share includes approximately $0.11 per share related to income received in the form of a special dividend in connection with certain Fund holdings. Excluding this amount, the ratio of net investment income to average net assets would have been 1.96%.
dTotal return is not annualized for periods less than one year.
eRatios are annualized for periods less than one year, except for non-recurring expenses, if any.
fBenefit of expense reduction rounds to less than 0.01%.
gBenefit of waiver and payments by affiliates rounds to less than 0.01%.
| | | | | | |
| franklintempleton.com | | The accompanying notes are an integral part of these financial statements. | Semiannual Report | | | 13 | |
FRANKLIN REAL ESTATE SECURITIES TRUST
Statement of Investments, October 31, 2017 (unaudited)
Franklin Real Estate Securities Fund
| | | | | | | | | | |
| | | | | Shares | | | Value | |
| | | | | | | | | | |
| | | Common Stocks 99.3% | | | | | | |
| | | Diversified REITs 4.6% | | | | | | |
| | Gramercy Property Trust | | | 221,800 | | | $ | 6,587,460 | |
| | VEREIT Inc. | | | 745,900 | | | | 5,885,151 | |
| | Washington REIT | | | 195,500 | | | | 6,293,145 | |
| | | | | | | | | | |
| | | | | | | | | 18,765,756 | |
| | | | | | | | | | |
| | | Health Care REITs 11.7% | | | | | | |
| | CareTrust REIT Inc. | | | 278,700 | | | | 5,267,430 | |
| | HCP Inc. | | | 311,300 | | | | 8,043,992 | |
| | Physicians Realty Trust | | | 314,200 | | | | 5,460,796 | |
| | Ventas Inc. | | | 196,220 | | | | 12,312,805 | |
| | Welltower Inc. | | | 245,900 | | | | 16,465,464 | |
| | | | | | | | | | |
| | | | | | | | | 47,550,487 | |
| | | | | | | | | | |
| | | Hotel & Resort REITs 4.6% | | | | | | |
| | Host Hotels & Resorts Inc. | | | 554,300 | | | | 10,842,108 | |
| | MGM Growth Properties LLC, A | | | 71,000 | | | | 2,095,210 | |
| | Sunstone Hotel Investors Inc. | | | 353,335 | | | | 5,766,427 | |
| | | | | | | | | | |
| | | | | | | | | 18,703,745 | |
| | | | | | | | | | |
| | | Hotels, Resorts & Cruise Lines 1.3% | | | | | | |
| | Hilton Worldwide Holdings Inc. | | | 74,033 | | | | 5,351,105 | |
| | | | | | | | | | |
| | | Industrial REITs 9.6% | | | | | | |
| | First Industrial Realty Trust Inc. | | | 274,600 | | | | 8,479,648 | |
| | Prologis Inc. | | | 355,661 | | | | 22,968,588 | |
| | Rexford Industrial Realty Inc. | | | 257,700 | | | | 7,651,113 | |
| | | | | | | | | | |
| | | | | | | | | 39,099,349 | |
| | | | | | | | | | |
| | | Office REITs 15.6% | | | | | | |
| | Alexandria Real Estate Equities Inc. | | | 104,700 | | | | 12,978,612 | |
| | Boston Properties Inc. | | | 97,000 | | | | 11,754,460 | |
| | Brandywine Realty Trust | | | 378,500 | | | | 6,619,965 | |
| | Highwoods Properties Inc. | | | 121,500 | | | | 6,202,575 | |
| | Kilroy Realty Corp. | | | 134,900 | | | | 9,608,927 | |
| | SL Green Realty Corp. | | | 83,500 | | | | 7,989,280 | |
| | Vornado Realty Trust | | | 112,645 | | | | 8,432,605 | |
| | | | | | | | | | |
| | | | | | | | | 63,586,424 | |
| | | | | | | | | | |
| | | Real Estate Development 1.5% | | | | | | |
| a | | Howard Hughes Corp. | | | 46,800 | | | | 5,973,084 | |
| | | | | | | | | | |
| | | Residential REITs 18.0% | | | | | | |
| | American Homes 4 Rent, A | | | 259,200 | | | | 5,515,776 | |
| | AvalonBay Communities Inc. | | | 88,472 | | | | 16,042,628 | |
| | Camden Property Trust | | | 96,500 | | | | 8,804,660 | |
| | Equity Lifestyle Properties Inc. | | | 123,300 | | | | 10,909,584 | |
| | Equity Residential | | | 264,844 | | | | 17,813,407 | |
| | Essex Property Trust Inc. | | | 25,363 | | | | 6,656,012 | |
| | Mid-America Apartment Communities Inc. | | | 73,400 | | | | 7,512,490 | |
| | | | | | | | | | |
| | | | | | | | | 73,254,557 | |
| | | | | | | | | | |
| | | Retail REITs 18.9% | | | | | | |
| | Agree Realty Corp. | | | 72,400 | | | | 3,423,796 | |
| | Federal Realty Investment Trust | | | 24,200 | | | | 2,916,584 | |
| | GGP Inc. | | | 395,800 | | | | 7,702,268 | |
| | Kimco Realty Corp. | | | 107,000 | | | | 1,943,120 | |
| | | | |
| 14 | | Semiannual Report | | franklintempleton.com |
FRANKLIN REAL ESTATE SECURITIES TRUST
STATEMENT OF INVESTMENTS (UNAUDITED)
Franklin Real Estate Securities Fund (continued)
| | | | | | | | | | |
| | | | | Shares | | | Value | |
| | | Common Stocks (continued) | | | | | | |
| | | Retail REITs (continued) | | | | | | |
| | Realty Income Corp. | | | 193,000 | | | $ | 10,358,310 | |
| | Regency Centers Corp. | | | 148,100 | | | | 9,115,555 | |
| | Retail Properties of America Inc., A | | | 433,000 | | | | 5,291,260 | |
| | Simon Property Group Inc. | | | 194,400 | | | | 30,196,152 | |
| | Weingarten Realty Investors | | | 190,000 | | | | 5,785,500 | |
| | | | | | | | | | |
| | | | | | | | | 76,732,545 | |
| | | | | | | | | | |
| | | Specialized REITs 13.5% | | | | | | |
| | American Tower Corp. | | | 40,700 | | | | 5,847,369 | |
| | Coresite Realty Corp. | | | 79,400 | | | | 8,793,550 | |
| | CubeSmart | | | 222,700 | | | | 6,061,894 | |
| | CyrusOne Inc. | | | 121,000 | | | | 7,428,190 | |
| | Digital Realty Trust Inc. | | | 115,000 | | | | 13,620,600 | |
| | Public Storage | | | 64,000 | | | | 13,264,000 | |
| | | | | | | | | | |
| | | | | | | | | 55,015,603 | |
| | | | | | | | | | |
| | Total Common Stocks (Cost $242,458,775) | | | | | | | 404,032,655 | |
| | | | | | | | | | |
| | | Short Term Investments (Cost $982,588) 0.2% | | | | | | |
| | | Money Market Funds 0.2% | | | | | | |
| b,c | | Institutional Fiduciary Trust Money Market Portfolio, 0.69% | | | 982,588 | | | | 982,588 | |
| | | | | | | | | | |
| | Total Investments (Cost $243,441,363) 99.5% | | | | | | | 405,015,243 | |
| | Other Assets, less Liabilities 0.5% | | | | | | | 1,925,425 | |
| | | | | | | | | | |
| | Net Assets 100.0% | | | | | | $ | 406,940,668 | |
| | | | | | | | | | |
See Abbreviations on page 25.
aNon-income producing.
bSee Note 3(f) regarding investments in affiliated management investment companies.
cThe rate shown is the annualized seven-day yield at period end.
| | | | | | |
| franklintempleton.com | | The accompanying notes are an integral part of these financial statements. | Semiannual Report | | | 15 | |
FRANKLIN REAL ESTATE SECURITIES TRUST
Financial Statements
Statement of Assets and Liabilities
October 31, 2017 (unaudited)
Franklin Real Estate Securities Fund
| | | | |
Assets: | | | | |
Investments in securities: | | | | |
Cost - Unaffiliated issuers | | $ | 242,458,775 | |
Cost - Non-controlled affiliates (Note 3f) | | | 982,588 | |
| | | | |
Value - Unaffiliated issuers | | $ | 404,032,655 | |
Value - Non-controlled affiliates (Note 3f) | | | 982,588 | |
Receivables: | | | | |
Investment securities sold | | | 7,604,973 | |
Capital shares sold | | | 162,952 | |
Dividends | | | 40,916 | |
Other assets | | | 135 | |
| | | | |
Total assets | | | 412,824,219 | |
| | | | |
Liabilities: | | | | |
Payables: | | | | |
Investment securities purchased | | | 4,676,648 | |
Capital shares redeemed | | | 480,421 | |
Management fees | | | 180,302 | |
Distribution fees | | | 121,721 | |
Transfer agent fees | | | 328,795 | |
Trustees’ fees and expenses | | | 4,346 | |
Accrued expenses and other liabilities | | | 91,318 | |
| | | | |
Total liabilities | | | 5,883,551 | |
| | | | |
Net assets, at value | | $ | 406,940,668 | |
| | | | |
Net assets consist of: | | | | |
Paid-in capital | | $ | 232,372,537 | |
Undistributed net investment income | | | 2,783,231 | |
Net unrealized appreciation (depreciation) | | | 161,573,880 | |
Accumulated net realized gain (loss) | | | 10,211,020 | |
| | | | |
Net assets, at value | | $ | 406,940,668 | |
| | | | |
| | | | |
| 16 | | Semiannual Report | The accompanying notes are an integral part of these financial statements. | | franklintempleton.com |
FRANKLIN REAL ESTATE SECURITIES TRUST
FINANCIAL STATEMENTS
Statement of Assets and Liabilities (continued)
October 31, 2017 (unaudited)
Franklin Real Estate Securities Fund
| | | | |
| |
| Class A: | | | | |
Net assets, at value | | $ | 308,433,242 | |
| | | | |
Shares outstanding | | | 13,642,465 | |
| | | | |
Net asset value per sharea | | | $22.61 | |
| | | | |
Maximum offering price per share (net asset value per share ÷ 94.25%) | | | $23.99 | |
| | | | |
| |
| Class C: | | | | |
Net assets, at value | | $ | 62,425,606 | |
| | | | |
Shares outstanding | | | 2,872,365 | |
| | | | |
Net asset value and maximum offering price per sharea | | | $21.73 | |
| | | | |
| |
| Class R6: | | | | |
Net assets, at value | | $ | 3,383,104 | |
| | | | |
Shares outstanding | | | 148,056 | |
| | | | |
Net asset value and maximum offering price per share | | | $22.85 | |
| | | | |
| |
| Advisor Class: | | | | |
Net assets, at value | | $ | 32,698,716 | |
| | | | |
Shares outstanding | | | 1,433,301 | |
| | | | |
Net asset value and maximum offering price per share | | | $22.81 | |
| | | | |
aRedemption price is equal to net asset value less contingent deferred sales charges, if applicable.
| | | | | | |
| franklintempleton.com | | The accompanying notes are an integral part of these financial statements. | Semiannual Report | | | 17 | |
FRANKLIN REAL ESTATE SECURITIES TRUST
FINANCIAL STATEMENTS
Statement of Operations
for the six months ended October 31, 2017 (unaudited)
Franklin Real Estate Securities Fund
| | | | |
Investment income: | | | | |
Dividends: | | | | |
Unaffiliated issuers | | $ | 7,065,033 | |
Non-controlled affiliates (Note 3f) | | | 7,401 | |
| | | | |
Total investment income | | | 7,072,434 | |
| | | | |
Expenses: | | | | |
Management fees (Note 3a) | | | 1,127,120 | |
Distribution fees: (Note 3c) | | | | |
Class A | | | 409,218 | |
Class C | | | 344,462 | |
Transfer agent fees: (Note 3e) | | | | |
Class A | | | 497,111 | |
Class C | | | 104,647 | |
Class R6 | | | 1,098 | |
Advisor Class | | | 69,878 | |
Custodian fees (Note 4) | | | 2,784 | |
Reports to shareholders | | | 41,376 | |
Registration and filing fees | | | 51,535 | |
Professional fees | | | 25,944 | |
Trustees’ fees and expenses | | | 16,036 | |
Other | | | 5,826 | |
| | | | |
Total expenses | | | 2,697,035 | |
Expense reductions (Note 4) | | | (19 | ) |
Expenses waived/paid by affiliates (Note 3f and 3g) | | | (5,461 | ) |
| | | | |
Net expenses | | | 2,691,555 | |
| | | | |
Net investment income | | | 4,380,879 | |
| | | | |
Realized and unrealized gains (losses): | | | | |
Net realized gain (loss) from: | | | | |
Investments: | | | | |
Unaffiliated issuers | | | 11,587,982 | |
| | | | |
Net change in unrealized appreciation (depreciation) on: | | | | |
Investments: | | | | |
Unaffiliated issuers | | | (9,634,586 | ) |
| | | | |
Net realized and unrealized gain (loss) | | | 1,953,396 | |
| | | | |
Net increase (decrease) in net assets resulting from operations | | $ | 6,334,275 | |
| | | | |
| | | | |
| 18 | | Semiannual Report | The accompanying notes are an integral part of these financial statements. | | franklintempleton.com |
FRANKLIN REAL ESTATE SECURITIES TRUST
FINANCIAL STATEMENTS
Statements of Changes in Net Assets
Franklin Real Estate Securities Fund
| | | | | | | | |
| | | Six Months Ended
October 31, 2017
(unaudited) | | | Year Ended
April 30, 2017 | |
Increase (decrease) in net assets: | | | | | | | | |
Operations: | | | | | | | | |
Net investment income | | $ | 4,380,879 | | | $ | 5,467,001 | |
Net realized gain (loss) | | | 11,587,982 | | | | 62,146,445 | |
Net change in unrealized appreciation (depreciation) | | | (9,634,586 | ) | | | (53,279,510 | ) |
| | | | | | | | |
Net increase (decrease) in net assets resulting from operations | | | 6,334,275 | | | | 14,333,936 | |
| | | | | | | | |
Distributions to shareholders from: | | | | | | | | |
Net investment income: | | | | | | | | |
Class A | | | (1,298,170 | ) | | | (7,182,116 | ) |
Class C | | | (108,400 | ) | | | (1,156,716 | ) |
Class R6 | | | (13,589 | ) | | | (1,852,446 | ) |
Advisor Class | | | (177,489 | ) | | | (593,315 | ) |
Net realized gains: | | | | | | | | |
Class A | | | — | | | | (7,036,543 | ) |
Class C | | | — | | | | (1,582,188 | ) |
Class R6 | | | — | | | | (1,152,496 | ) |
Advisor Class | | | — | | | | (598,113 | ) |
| | | | | | | | |
Total distributions to shareholders | | | (1,597,648 | ) | | | (21,153,933 | ) |
| | | | | | | | |
Capital share transactions: (Note 2) | | | | | | | | |
Class A | | | (28,459,293 | ) | | | (26,964,280 | ) |
Class C | | | (10,868,513 | ) | | | (8,328,265 | ) |
Class R6 | | | 937,972 | | | | (101,370,904 | ) |
Advisor Class | | | (18,587,288 | ) | | | 28,798,605 | |
| | | | | | | | |
Total capital share transactions | | | (56,977,122 | ) | | | (107,864,844 | ) |
| | | | | | | | |
Net increase (decrease) in net assets | | | (52,240,495 | ) | | | (114,684,841 | ) |
Net assets: | | | | | | | | |
Beginning of period | | | 459,181,163 | | | | 573,866,004 | |
| | | | | | | | |
End of period | | $ | 406,940,668 | | | $ | 459,181,163 | |
| | | | | | | | |
Undistributed net investment income included in net assets: | | | | | | | | |
End of period | | $ | 2,783,231 | | | $ | — | |
| | | | | | | | |
| | | | | | |
| franklintempleton.com | | The accompanying notes are an integral part of these financial statements. | Semiannual Report | | | 19 | |
FRANKLIN REAL ESTATE SECURITIES TRUST
Notes to Financial Statements (unaudited)
Franklin Real Estate Securities Fund
1. Organization and Significant Accounting Policies
Franklin Real Estate Securities Trust (Trust) is registered under the Investment Company Act of 1940 (1940 Act) as an open-end management investment company, consisting of one fund, Franklin Real Estate Securities Fund (Fund) and applies the specialized accounting and reporting guidance in U.S. Generally Accepted Accounting Principles (U.S. GAAP). The Fund offers four classes of shares: Class A, Class C, Class R6, and Advisor Class. Each class of shares may differ by its initial sales load, contingent deferred sales charges, voting rights on matters affecting a single class, its exchange privilege and fees due to differing arrangements for distribution and transfer agent fees.
The following summarizes the Fund’s significant accounting policies.
a. Financial Instrument Valuation
The Fund’s investments in financial instruments are carried at fair value daily. Fair value is the price that would be received to sell an asset or paid to transfer a liability in an orderly transaction between market participants on the measurement date. The Fund calculates the net asset value (NAV) per share as of 4 p.m. Eastern time each day the New York Stock Exchange (NYSE) is open for trading. Under compliance policies and procedures approved by the Fund’s Board of Trustees (the Board), the Fund’s administrator has responsibility for oversight of valuation, including leading the cross-functional Valuation Committee (VC). The VC provides administration and oversight of the Fund’s valuation policies and procedures, which are approved annually by the Board. Among other things, these procedures allow the Fund to utilize independent pricing services, quotations from securities and financial instrument dealers, and other market sources to determine fair value.
Equity securities listed on an exchange or on the NASDAQ National Market System are valued at the last quoted sale price or the official closing price of the day, respectively. Over-the-counter securities are valued within the range of the most recent quoted bid and ask prices. Securities that trade in multiple markets or on multiple exchanges are valued according to the broadest and most representative market. Certain equity securities are valued based upon fundamental characteristics or relationships to similar securities.
Investments in open-end mutual funds are valued at the closing NAV.
The Fund has procedures to determine the fair value of financial instruments for which market prices are not reliable or readily available. Under these procedures, the VC convenes on a regular basis to review such financial instruments and considers a number of factors, including significant unobservable valuation inputs, when arriving at fair value. The VC primarily employs a market-based approach which may use related or comparable assets or liabilities, recent transactions, market multiples, book values, and other relevant information for the investment to determine the fair value of the investment. An income-based valuation approach may also be used in which the anticipated future cash flows of the investment are discounted to calculate fair value. Discounts may also be applied due to the nature or duration of any restrictions on the disposition of the investments. Due to the inherent uncertainty of valuations of such investments, the fair values may differ significantly from the values that would have been used had an active market existed. The VC employs various methods for calibrating these valuation approaches including a regular review of key inputs and assumptions, transactional back-testing or disposition analysis, and reviews of any related market activity.
b. Income Taxes
It is the Fund’s policy to qualify as a regulated investment company under the Internal Revenue Code. The Fund intends to distribute to shareholders substantially all of its taxable income and net realized gains to relieve it from federal income and excise taxes. As a result, no provision for U.S. federal income taxes is required.
The Fund may recognize an income tax liability related to its uncertain tax positions under U.S. GAAP when the uncertain tax position has a less than 50% probability that it will be sustained upon examination by the tax authorities based on its technical merits. As of October 31, 2017, the Fund has determined that no tax liability is required in its financial statements related to uncertain tax positions for any open tax years (or expected to be taken in future tax years). Open tax years are those that remain subject to examination and are based on the statute of limitations in each jurisdiction in which the Fund invests.
| | | | |
| 20 | | Semiannual Report | | franklintempleton.com |
FRANKLIN REAL ESTATE SECURITIES TRUST
NOTES TO FINANCIAL STATEMENTS (UNAUDITED)
Franklin Real Estate Securities Fund (continued)
c. Security Transactions, Investment Income, Expenses and Distributions
Security transactions are accounted for on trade date. Realized gains and losses on security transactions are determined on a specific identification basis. Estimated expenses are accrued daily. Dividend income is recorded on the ex-dividend date. Distributions to shareholders are recorded on the ex-dividend date. Distributable earnings are determined according to income tax regulations (tax basis) and may differ from earnings recorded in accordance with U.S. GAAP. These differences may be permanent or temporary. Permanent differences are reclassified among capital accounts to reflect their tax character. These reclassifications have no impact on net assets or the results of operations. Temporary differences are not reclassified, as they may reverse in subsequent periods.
Realized and unrealized gains and losses and net investment income, excluding class specific expenses, are allocated daily to each class of shares based upon the relative proportion of net assets of each class. Differences in per share distributions by class are generally due to differences in class specific expenses.
Distributions received by the Fund from certain securities may be a return of capital (ROC). Such distributions reduce the cost basis of the securities, and any distributions in excess of the cost
basis are recognized as capital gains. For Real Estate Investment Trust (REIT) securities, the Fund records ROC estimates, if any, on the ex-dividend date and are adjusted once actual tax designations are known.
d. Accounting Estimates
The preparation of financial statements in accordance with U.S. GAAP requires management to make estimates and assumptions that affect the reported amounts of assets and liabilities at the date of the financial statements and the amounts of income and expenses during the reporting period. Actual results could differ from those estimates.
e. Guarantees and Indemnifications
Under the Fund’s organizational documents, its officers and trustees are indemnified by the Fund against certain liabilities arising out of the performance of their duties to the Fund. Additionally, in the normal course of business, the Fund enters into contracts with service providers that contain general indemnification clauses. The Fund’s maximum exposure under these arrangements is unknown as this would involve future claims that may be made against the Fund that have not yet occurred. Currently, the Fund expects the risk of loss to be remote.
2. Shares of Beneficial Interest
At October 31, 2017, there were an unlimited number of shares authorized ($0.01 par value). Transactions in the Fund’s shares were as follows:
| | | | | | | | | | | | | | | | | | | | |
| | | Six Months Ended
October 31, 2017 | | | | | | Year Ended
April 30, 2017 | |
| | | Shares | | | Amount | | | | | | Shares | | | Amount | |
| | | | | |
| Class A Shares: | | | | | | | | | | | | | | | | | | | | |
| Shares sold | | | 547,663 | | | $ | 12,479,636 | | | | | | | | 2,955,684 | | | $ | 69,381,222 | |
| Shares issued in reinvestment of distributions | | | 53,577 | | | | 1,244,665 | | | | | | | | 617,945 | | | | 13,730,198 | |
| Shares redeemed | | | (1,851,291 | ) | | | (42,183,594 | ) | | | | | | | (4,795,254 | ) | | | (110,075,700 | ) |
| | | | |
| Net increase (decrease) | | | (1,250,051 | ) | | $ | (28,459,293 | ) | | | | | | | (1,221,625 | ) | | $ | (26,964,280 | ) |
| | | | |
| Class C Shares: | | | | | | | | | | | | | | | | | | | | |
| Shares sold | | | 102,977 | | | $ | 2,253,539 | | | | | | | | 637,356 | | | $ | 14,522,004 | |
| Shares issued in reinvestment of distributions | | | 4,778 | | | | 106,818 | | | | | | | | 124,497 | | | | 2,659,425 | |
| Shares redeemed | | | (603,819 | ) | | | (13,228,870 | ) | | | | | | | (1,151,295 | ) | | | (25,509,694 | ) |
| | | | |
| Net increase (decrease) | | | (496,064 | ) | | $ | (10,868,513 | ) | | | | | | | (389,442 | ) | | $ | (8,328,265 | ) |
| | | | |
| Class R6 Shares: | | | | | | | | | | | | | | | | | | | | |
| Shares sold | | | 92,215 | | | $ | 2,118,812 | | | | | | | | 99,150 | | | $ | 2,311,501 | |
| Shares issued in reinvestment of distributions | | | 579 | | | | 13,589 | | | | | | | | 132,605 | | | | 3,004,941 | |
| Shares redeemed | | | (51,881 | ) | | | (1,194,429 | ) | | | | | | | (4,697,016 | ) | | | (106,687,346 | ) |
| | | | |
| Net increase (decrease) | | | 40,913 | | | $ | 937,972 | | | | | | | | (4,465,261 | ) | | $ | (101,370,904 | ) |
| | | | |
| | | | | | |
| franklintempleton.com | | Semiannual Report | | | 21 | |
FRANKLIN REAL ESTATE SECURITIES TRUST
NOTES TO FINANCIAL STATEMENTS (UNAUDITED)
Franklin Real Estate Securities Fund (continued)
2. Shares of Beneficial Interest (continued)
| | | | | | | | | | | | | | | | | | | | |
| | | Six Months Ended
October 31, 2017 | | | | | | Year Ended
April 30, 2017 | |
| | | Shares | | | Amount | | | | | | Shares | | | Amount | |
| | | | | |
| Advisor Class Shares: | | | | | | | | | | | | | | | | | | | | |
| Shares sold | | | 429,178 | | | $ | 9,857,455 | | | | | | | | 1,837,014 | | | $ | 42,222,651 | |
| Shares issued in reinvestment of distributions | | | 7,177 | | | | 168,143 | | | | | | | | 48,881 | | | | 1,090,920 | |
| Shares redeemed | | | (1,239,186 | ) | | | (28,612,886 | ) | | | | | | | (628,503 | ) | | | (14,514,966 | ) |
| | | | |
| Net increase (decrease) | | | (802,831 | ) | | $ | (18,587,288 | ) | | | | | | | 1,257,392 | | | $ | 28,798,605 | |
| | | | |
3. Transactions with Affiliates
Franklin Resources, Inc. is the holding company for various subsidiaries that together are referred to as Franklin Templeton Investments. Certain officers and trustees of the Trust are also officers and/or directors of the following subsidiaries:
| | |
| Subsidiary | | Affiliation |
Franklin Templeton Institutional, LLC (FT Institutional) | | Investment manager |
Franklin Templeton Services, LLC (FT Services) | | Administrative manager |
Franklin Templeton Distributors, Inc. (Distributors) | | Principal underwriter |
Franklin Templeton Investor Services, LLC (Investor Services) | | Transfer agent |
a. Management Fees
The Fund pays an investment management fee to FT Institutional based on the average daily net assets of the Fund as follows:
| | |
| Annualized Fee Rate | | Net Assets |
0.625% | | Up to and including $100 million |
0.500% | | Over $100 million, up to and including $250 million |
0.450% | | Over $250 million, up to and including $7.5 billion |
0.440% | | Over $7.5 billion, up to and including $10 billion |
0.430% | | Over $10 billion, up to and including $12.5 billion |
0.420% | | Over $12.5 billion, up to and including $15 billion |
0.400% | | In excess of $15 billion |
For the period ended October 31, 2017, the annualized effective investment management fee rate was 0.507% of the Fund’s average daily net assets.
b. Administrative Fees
Under an agreement with FT Institutional, FT Services provides administrative services to the Fund. The fee is paid by FT Institutional based on the Fund’s average daily net assets, and is not an additional expense of the Fund.
c. Distribution Fees
The Board has adopted distribution plan for each share class, with the exception of Class R6 and Advisor Class shares, pursuant to Rule 12b-1 under the 1940 Act. Under the Fund’s Class A reimbursement distribution plan, the Fund reimburses Distributors for costs incurred in connection with the servicing, sale and distribution of the Fund’s shares up to the maximum annual plan rate. Under the Class A reimbursement distribution plan, costs exceeding the maximum for the current plan year cannot be reimbursed in
| | | | |
| 22 | | Semiannual Report | | franklintempleton.com |
FRANKLIN REAL ESTATE SECURITIES TRUST
NOTES TO FINANCIAL STATEMENTS (UNAUDITED)
Franklin Real Estate Securities Fund (continued)
subsequent periods. In addition, under the Fund’s Class C compensation distribution plan, the Fund pays Distributors for costs incurred in connection with the servicing, sale and distribution of the Fund’s shares up to the maximum annual plan rate. The plan year, for purposes of monitoring compliance with the maximum annual plan rate, is February 1 through January 31.
The maximum annual plan rates, based on the average daily net assets, for each class, are as follows:
| | | | |
Class A | | | 0.25% | |
Class C | | | 1.00% | |
d. Sales Charges/Underwriting Agreements
Front-end sales charges and contingent deferred sales charges (CDSC) do not represent expenses of the Fund. These charges are deducted from the proceeds of sales of Fund shares prior to investment or from redemption proceeds prior to remittance, as applicable. Distributors has advised the Fund of the following commission transactions related to the sales and redemptions of the Fund’s shares for the period:
| | | | |
Sales charges retained net of commissions paid to unaffiliated brokers/dealers | | $ | 21,632 | |
CDSC retained | | $ | 3,539 | |
e. Transfer Agent Fees
Each class of shares, except for Class R6, pays transfer agent fees to Investor Services for its performance of shareholder servicing obligations and reimburses Investor Services for out of pocket expenses incurred, including shareholder servicing fees paid to third parties. These fees are allocated daily based upon their relative proportion of such classes’ aggregate net assets. Class R6 pays Investor Services transfer agent fees specific to that class.
For the period ended October 31, 2017, the Fund paid transfer agent fees of $672,734, of which $216,272 was retained by Investor Services.
f. Investments in Affiliated Management Investment Companies
The Fund invests in one or more affiliated management investment companies for purposes other than exercising a controlling influence over the management or policies. Management fees paid by the Fund are waived on assets invested in the affiliated management investment companies, as noted in the Statement of Operations, in an amount not to exceed the management and administrative fees paid directly or indirectly by each affiliate. Prior to May 1, 2013, the waiver was accounted for as a reduction to management fees. During the period ended October 31, 2017, the Fund held investments in affiliated management investment companies as follows:
| | | | | | | | | | | | | | | | | | | | | | | | | | | | | | | | |
| | | Number of
Shares Held
at Beginning
of Period
| | | Gross
Additions | | | Gross
Reductions | | | Number of
Shares
Held at End
of Period | | | Value
at End
of Period | | | Dividend
Income | | | Realized
Gain (Loss) | | | Net Change
in
Unrealized
Appreciation
(Depreciation) | |
| Non-Controlled Affiliates | | | | | | | | | | | | | | | | | | | | | | | | | | | | | | | | |
Institutional Fiduciary Trust Money Market Portfolio, 0.69% | | | 2,122,603 | | | | 36,714,315 | | | | (37,854,330 | ) | | | 982,588 | | | $ | 982,588 | | | $ | 7,401 | | | $ | — | | | $ | — | |
| | | | | | | | | | | | | | | | | | | | | | | | |
g. Waiver and Expense Reimbursements
Investor Services has voluntarily agreed in advance to waive or limit its fees so that the Class R6 transfer agent fees do not exceed 0.01%. Investor Services may discontinue this waiver in the future.
| | | | | | |
| franklintempleton.com | | Semiannual Report | | | 23 | |
FRANKLIN REAL ESTATE SECURITIES TRUST
NOTES TO FINANCIAL STATEMENTS (UNAUDITED)
Franklin Real Estate Securities Fund (continued)
4. Expense Offset Arrangement
The Fund has entered into an arrangement with its custodian whereby credits realized as a result of uninvested cash balances are used to reduce a portion of the Fund’s custodian expenses. During the period ended October 31, 2017, the custodian fees were reduced as noted in the Statement of Operations.
5. Income Taxes
At October 31, 2017, the cost of investments and net unrealized appreciation (depreciation) for income tax purposes were as follows:
| | | | |
Cost of investments | | $ | 269,494,435 | |
| | | | |
Unrealized appreciation | | $ | 164,753,794 | |
Unrealized depreciation | | | (29,232,986 | ) |
| | | | |
Net unrealized appreciation (depreciation) | | $ | 135,520,808 | |
| | | | |
Differences between income and/or capital gains as determined on a book basis and a tax basis are primarily due to differing treatments of wash sales.
6. Investment Transactions
Purchases and sales of investments (excluding short term securities) for the period ended October 31, 2017, aggregated $40,324,285 and $96,197,955, respectively.
7. Concentration of Risk
The Fund invests a large percentage of its total assets in REIT securities. Such concentration may subject the Fund to special risks associated with real estate securities. These securities may be more sensitive to economic or regulatory developments due to a variety of factors such as local, regional, national and global economic conditions, interest rates and tax considerations.
8. Upcoming Acquisitions/Reorganization
On October 24, 2017, the Board for the Fund approved a proposal to reorganize Franklin Global Trust - Franklin Global Real Estate Fund with and into the Fund, subject to approval by the shareholders of Franklin Global Trust - Franklin Global Real Estate Fund.
9. Credit Facility
The Fund, together with other U.S. registered and foreign investment funds (collectively, Borrowers), managed by Franklin Templeton Investments, are borrowers in a joint syndicated senior unsecured credit facility totaling $2 billion (Global Credit Facility) which matures on February 9, 2018. This Global Credit Facility provides a source of funds to the Borrowers for temporary and emergency purposes, including the ability to meet future unanticipated or unusually large redemption requests.
Under the terms of the Global Credit Facility, the Fund shall, in addition to interest charged on any borrowings made by the Fund and other costs incurred by the Fund, pay its share of fees and expenses incurred in connection with the implementation and maintenance of the Global Credit Facility, based upon its relative share of the aggregate net assets of all of the Borrowers, including an annual commitment fee of 0.15% based upon the unused portion of the Global Credit Facility. These fees are reflected in other expenses in the Statement of Operations. During the period ended October 31, 2017, the Fund did not use the Global Credit Facility.
| | | | |
| 24 | | Semiannual Report | | franklintempleton.com |
FRANKLIN REAL ESTATE SECURITIES TRUST
NOTES TO FINANCIAL STATEMENTS (UNAUDITED)
Franklin Real Estate Securities Fund (continued)
10. Fair Value Measurements
The Fund follows a fair value hierarchy that distinguishes between market data obtained from independent sources (observable inputs) and the Fund’s own market assumptions (unobservable inputs). These inputs are used in determining the value of the Fund’s financial instruments and are summarized in the following fair value hierarchy:
| | • | | Level 1 – quoted prices in active markets for identical financial instruments |
| | • | | Level 2 – other significant observable inputs (including quoted prices for similar financial instruments, interest rates, prepayment speed, credit risk, etc.) |
| | • | | Level 3 – significant unobservable inputs (including the Fund’s own assumptions in determining the fair value of financial instruments) |
The input levels are not necessarily an indication of the risk or liquidity associated with financial instruments at that level.
For movements between the levels within the fair value hierarchy, the Fund has adopted a policy of recognizing the transfers as of the date of the underlying event which caused the movement.
At October 31, 2017, all of the Fund’s investments in financial instruments carried at fair value were valued using Level 1 inputs. For detailed categories, see the accompanying Statement of Investments.
11. Subsequent Events
The Fund has evaluated subsequent events through the issuance of the financial statements and determined that no events have occurred that require disclosure.
Abbreviations
| | |
| Selected Portfolio |
| REIT | | Real Estate Investment Trust |
| | | | | | |
| franklintempleton.com | | Semiannual Report | | | 25 | |
FRANKLIN REAL ESTATE SECURITIES TRUST
FRANKLIN REAL ESTATE SECURITIES FUND
Shareholder Information
Proxy Voting Policies and Procedures
The Fund’s investment manager has established Proxy Voting Policies and Procedures (Policies) that the Fund uses to determine how to vote proxies relating to portfolio securities. Shareholders may view the Fund’s complete Policies online at franklintempleton.com. Alternatively, shareholders may request copies of the Policies free of charge by calling the Proxy Group collect at (954) 527-7678 or by sending a written request to: Franklin Templeton Companies, LLC, 300 S.E. 2nd Street, Fort Lauderdale, FL 33301, Attention: Proxy Group. Copies of the Fund’s proxy voting records are also made available online at franklintempleton.com and posted on the US Securities and Exchange Commission’s website at sec.gov and reflect the most recent 12-month period ended June 30.
Quarterly Statement of Investments
The Trust, on behalf of the Fund, files a complete statement of investments with the US Securities and Exchange Commission for the first and third quarters for each fiscal year on Form N-Q. Shareholders may view the filed Form N-Q by visiting the Commission’s website at sec.gov. The filed form may also be viewed and copied at the Commission’s Public Reference Room in Washington, DC. Information regarding the operations of the Public Reference Room may be obtained by calling (800) SEC-0330.
| | | | |
| 26 | | Semiannual Report | | franklintempleton.com |
This page intentionally left blank.
This page intentionally left blank.
| | |
 | | Semiannual Report and Shareholder Letter |
| | Franklin Real Estate Securities Fund |
| | Investment Manager |
| | Franklin Templeton Institutional, LLC |
| | Distributor |
| | Franklin Templeton Distributors, Inc. |
| | (800) DIAL BEN® / 342-5236 |
| | franklintempleton.com |
| | Shareholder Services |
| | (800) 632-2301 |
Authorized for distribution only when accompanied or preceded by a summary prospectus and/or prospectus. Investors should carefully consider a fund’s investment goals, risks, charges and expenses before investing. A prospectus contains this and other information; please read it carefully before investing.
To help ensure we provide you with quality service, all calls to and from our service areas are monitored and/or recorded.
| | |
| © 2017 Franklin Templeton Investments. All rights reserved. | | 192 S2017 12/17 |
(a) The Registrant has adopted a code of ethics that applies to its principal executive officers and principal financial and accounting officer.
(c) N/A
(d) N/A
(f) Pursuant to Item 12(a)(1), the Registrant is attaching as an exhibit a copy of its code of ethics that applies to its principal executive officers and principal financial and accounting officer.
| Item 3. | Audit Committee Financial Expert. |
(a) (1) The Registrant has an audit committee financial expert serving on its audit committee.
(2) The audit committee financial expert is John B. Wilson and he is “independent” as defined under the relevant Securities and Exchange Commission Rules and Releases.
| Item 4. | Principal Accountant Fees and Services. N/A |
| Item 5. | Audit Committee of Listed Registrants. N/A |
| Item 6. | Schedule of Investments. N/A |
| Item 7. | Disclosure of Proxy Voting Policies and Procedures for Closed-End Management Investment Companies. N/A |
| Item 8. | Portfolio Managers of Closed-End Management Investment Companies. N/A |
| Item 9. | Purchases of Equity Securities by Closed-End Management Investment Company and Affiliated Purchasers. N/A |
| Item 10. | Submission of Matters to a Vote of Security Holders. |
There have been no changes to the procedures by which shareholders may recommend nominees to the Registrant’s Board of Trustees that would require disclosure herein.
| Item 11. | Controls and Procedures. |
(a) Evaluation of Disclosure Controls and Procedures. The Registrant maintains disclosure controls and procedures that are designed to ensure that information required to be disclosed in the Registrant’s
filings under the Securities Exchange Act of 1934 and the Investment Company Act of 1940 is recorded, processed, summarized and reported within the periods specified in the rules and forms of the Securities and Exchange Commission. Such information is accumulated and communicated to the Registrant’s management, including its principal executive officer and principal financial officer, as appropriate, to allow timely decisions regarding required disclosure. The Registrant’s management, including the principal executive officer and the principal financial officer, recognizes that any set of controls and procedures, no matter how well designed and operated, can provide only reasonable assurance of achieving the desired control objectives.
Within 90 days prior to the filing date of this Shareholder Report on Form N-CSR, the Registrant had carried out an evaluation, under the supervision and with the participation of the Registrant’s management, including the Registrant’s principal executive officer and the Registrant’s principal financial officer, of the effectiveness of the design and operation of the Registrant’s disclosure controls and procedures. Based on such evaluation, the Registrant’s principal executive officer and principal financial officer concluded that the Registrant’s disclosure controls and procedures are effective.
(b) Changes in Internal Controls. There have been no changes in the Registrant’s internal controls or in other factors that could materially affect the internal controls over financial reporting subsequent to the date of their evaluation in connection with the preparation of this Shareholder Report on Form N-CSR.
(a) (1) Code of Ethics
(a) (2) Certifications pursuant to Section 302 of the Sarbanes-Oxley Act of 2002 of Matthew T. Hinkle, Chief Executive Officer - Finance and Administration, and Gaston Gardey, Chief Financial Officer and Chief Accounting Officer
(b) Certifications pursuant to Section 906 of the Sarbanes-Oxley Act of 2002 of Matthew T. Hinkle, Chief Executive Officer - Finance and Administration, and Gaston Gardey, Chief Financial Officer and Chief Accounting Officer
SIGNATURES
Pursuant to the requirements of the Securities Exchange Act of 1934 and the Investment Company Act of 1940, the registrant has duly caused this report to be signed on its behalf by the undersigned, thereunto duly authorized.
FRANKLIN REAL ESTATE SECURITIES TRUST
| | |
By | | /s/ Matthew T. Hinkle |
| | Matthew T. Hinkle |
| | Chief Executive Officer – Finance and Administration |
Date | | December 27, 2017 |
Pursuant to the requirements of the Securities Exchange Act of 1934 and the Investment Company Act of 1940, this report has been signed below by the following persons on behalf of the registrant and in the capacities and on the dates indicated.
| | |
By | | /s/ Matthew T. Hinkle |
| | Matthew T. Hinkle |
| | Chief Executive Officer – Finance and Administration |
Date | | December 27, 2017 |
| | |
By | | /s/ Gaston Gardey |
| | Gaston Gardey |
| | Chief Financial Officer and Chief Accounting Officer |
Date | | December 27, 2017 |