SECURITIES AND EXCHANGE COMMISSION
WASHINGTON, D.C. 20549
FORM 20-F
o | REGISTRATION STATEMENT PURSUANT TO SECTION 12(b) OR 12(g) OF THE SECURITIES EXCHANGE ACT OF 1934 |
|
|
OR | |
|
|
x | ANNUAL REPORT PURSUANT TO SECTION 13 OR 15(d) OF THE SECURITIES EXCHANGE ACT OF 1934 |
|
|
OR | |
|
|
o | TRANSITION REPORT PURSUANT TO SECTION 13 OR 15(d) OF THE SECURITIES EXCHANGE ACT OF 1934 |
|
|
OR | |
|
|
o | SHELL COMPANY REPORT PURSUANT TO SECTION 23 OR 15(d) OF THE SECURITIES EXCHANGE ACT OF 1934 |
Date of event requiring this shell company report
For the transition period from to
Commission file number: 001-12440
ENERSIS S.A. |
(Exact name of Registrant as specified in its charter) |
|
ENERSIS S.A. |
(Translation of Registrant’s name into English) |
|
CHILE |
(Jurisdiction of incorporation or organization) |
|
SANTA ROSA 76, SANTIAGO, CHILE |
(Address of principal executive offices) |
|
Nicolás Billikopf, phone: (56-2) 353-4639, fax: (56-2) 378-4789, nbe@enersis.cl, Santa Rosa 76, Piso 15, Santiago, Chile |
(Name, Telephone, E-mail and/or Facsimile number and Address of Company Contact Person) |
Securities registered or to be registered pursuant to Section 12(b) of the Act:
| Title of Each Class |
| Name of Each Exchange on Which Registered |
|
| American Depositary Shares representing Common Stock |
| New York Stock Exchange |
|
| Common Stock, no par value * |
| New York Stock Exchange |
|
| $ 249,734,000 7.40% Notes due December 1, 2016 |
| New York Stock Exchange |
|
| $ 858,000 6.60% Notes due December 1, 2026 |
| New York Stock Exchange |
|
*Listed, not for trading, but only in connection with the registration of American Depositary Shares, pursuant to the requirements of the Securities and Exchange Commission.
Securities registered or to be registered pursuant to Section 12(g) of the Act: None
Securities for which there is a reporting obligation pursuant to Section 15(d) of the Act:
$ 350,000,000 7.375% Notes due January 15, 2014
Indicate the number of outstanding shares of each of the issuer’s classes of capital or common stock as of the close of the period covered by the annual report:
Shares of Common Stock: | 32,651,166,465 |
|
|
Indicate by check mark if the registrant is a well-known seasoned issuer, as defined in Rule 405 of the Securities Act:
x Yes o No
If this report is an annual or transition report, indicate by check mark if the registrant is not required to file reports pursuant to Section 13 or 15(d) of the Securities Exchange Act of 1934:
o Yes x No
Indicate by check mark whether the registrant (1) has filed all reports required to be filed by Section 13 or 15(d) of the Securities Exchange Act of 1934 during the preceding 12 months (or for such shorter period that the registrant was required to file such reports), and (2) has been subject to such filing requirements for the past 90 days:
x Yes o No
Indicate by check mark whether the registrant has submitted electronically and posted on its corporate Web site, if any, every Interactive Data File required to be submitted and posted pursuant to Rule 405 of Regulation S-T (§232.405 of this chapter) during the preceding 12 months (or for such shorter period that the registrant was required to submit and post such files).
o Yes o No
Indicate by check mark whether the registrant is a large accelerated filer, an accelerated filer, or a non-accelerated filer. See definition of “accelerated filer and large accelerated filer” in Rule 12b-2 of the Exchange Act:
Large accelerated filer x | Accelerated filer o | Non-accelerated filer o |
Indicate by check mark which basis of accounting the registrant has used to prepare the financial statements included in this filing:
U.S. GAAP o | International Financial Reporting Standards as issued | Other o |
Indicate by check mark which financial statement item the registrant has elected to follow:
o Item 17 x Item 18
If this is an annual report, indicate by check mark whether the registrant is a shell company (as defined in Rule 12b-2 of the Exchange Act):
o Yes x No
“Enersis’ Simplified Organizational Structure” (*)

(*) Only principal operating subsidiaries are presented here. The percentages listed for each of our subsidiaries represents Enersis’economic interest in such subsidiary.
|
| Page | |
|
|
| |
| 4 | ||
| 9 | ||
| 9 | ||
| 10 | ||
| 10 | ||
| 10 | ||
| 12 | ||
| 12 | ||
| 12 | ||
| 12 | ||
| 23 | ||
| 84 | ||
| 85 | ||
| 115 | ||
| 126 | ||
| 127 | ||
| 129 | ||
| 131 | ||
| 145 | ||
| 149 | ||
| 150 | ||
| 150 | ||
Material Modifications to the Rights of Security Holders and Use of Proceeds |
| 150 | |
| 150 | ||
| 151 | ||
| 151 | ||
| 152 | ||
| 153 | ||
Purchases of Equity Securities by the Issuer and Affiliated Purchasers |
| 153 | |
| 153 | ||
| 154 | ||
| 155 | ||
| 155 | ||
| 155 | ||
| 155 | ||
Acciona |
| ACCIONA, S.A. |
| Spanish construction holding company. Together with Enel, Acciona held a controlling interest in Endesa Spain until June 25, 2009. |
|
|
|
|
|
AFP |
| Administradora de Fondos de Pensiones |
| A legal entity that manages a Chilean pension fund. |
|
|
|
|
|
Ampla |
| Ampla Energia e Serviços S.A. |
| Brazilian distribution company operating in Rio de Janeiro, owned by Endesa Brasil, a subsidiary of Enersis. |
|
|
|
|
|
ANEEL |
| Agéncia Nacional de Energia Elétrica |
| Brazilian governmental agency for electric energy. |
|
|
|
|
|
Betania |
| Central Hidroeléctrica de Betania S.A. E.S.P. |
| Endesa Chile’s Colombian subsidiary which merged with Emgesa, another Endesa Chile subsidiary, in 2007. |
|
|
|
|
|
Cachoeira Dourada |
| Centrais Elétricas Cachoeira Dourada S.A. |
| Brazilian generation company owned by Endesa Brasil, a subsidiary of Enersis. |
|
|
|
|
|
CAM |
| Compañía Americana de Multiservicios Ltda. |
| Enersis’ subsidiary engaged in the electrical parts procurement business. |
|
|
|
|
|
CAMMESA |
| Compañía Administradora del Mercado Mayorista Eléctrico S.A. |
| Argentine autonomous entity in charge of the operation of the Mercado Eléctrico Mayorista (Wholesale Electricity Market), or MEM. CAMMESA’s stockholders are generation, transmission and distribution companies, large users and the Secretariat of Energy. |
|
|
|
|
|
CDEC |
| Centro de Despacho Económico de Carga |
| Autonomous entity in two Chilean electric systems in charge of coordinating the efficient operation and dispatch of generation units to satisfy demand. |
|
|
|
|
|
Celta |
| Compañía Eléctrica Tarapacá S.A. |
| Endesa Chile’s subsidiary that operates in the SING with thermal plants. |
|
|
|
|
|
Cemsa |
| Endesa Cemsa S.A. |
| Energy trading company with operations in Argentina, a subsidiary of Endesa Chile. |
|
|
|
|
|
Chilectra |
| Chilectra S.A. |
| Chilean electricity distribution company operating in the Santiago metropolitan area, a subsidiary of Enersis. |
|
|
|
|
|
CIEN |
| Companhia de Interconexão Energética S.A. |
| Brazilian transmission company, wholly-owned by Endesa Brasil, a subsidiary of Enersis. |
|
|
|
|
|
CNE |
| Comisión Nacional de Energía |
| Chilean National Energy Commission, governmental entity with responsibilities under the Chilean regulatory framework. |
Codensa |
| Codensa S.A. E.S.P. |
| Colombian distribution company that operates mainly in Bogotá, and is a subsidiary of Enersis. |
|
|
|
|
|
Coelce |
| Companhia Energética do Ceará S.A. |
| Brazilian distribution company operating in the state of Ceará. Coelce is controlled by Endesa Brasil, a subsidiary of Enersis. |
|
|
|
|
|
CREG |
| Comisión de Regulación de Energía y Gas |
| Colombian Commission for the Regulation of Energy and Gas. |
|
|
|
|
|
CTM |
| Compañía de Transmisión del Mercosur S.A |
| Endesa Brasil’s subsidiary transmission company with operations in Argentina. |
|
|
|
|
|
DECA |
| Distribuidora Eléctrica de Cundinamarca S.A. |
| Colombian distribution company, subsidiary of Codensa. |
|
|
|
|
|
Edegel |
| Edegel S.A.A. |
| Peruvian generation company, subsidiary of Endesa Chile. |
|
|
|
|
|
Edelnor |
| Empresa de Distribución Eléctrica de Lima Norte S.A.A. |
| Peruvian distribution company with a concession area in the northern part of Lima, and a subsidiary of Enersis. |
|
|
|
|
|
Edesur |
| Empresa Distribuidora Sur S.A. |
| Argentine distribution company with concession area in the south of the Buenos Aires greater metropolitan area, and a subsidiary of Enersis. |
|
|
|
|
|
EEB |
| Empresa de Energía de Bogota S.A. |
| Colombian stated-owned financial and energy holding company, with investments in the electricity generation, transmission, commercialization and distribution sectors; and in the natural gas transmission, distribution and commercialization sectors. |
|
|
|
|
|
EEC |
| Empresa de Energía de Cundinamarca S.A. |
| Colombian electricity distribution company, subsidiary of DECA. |
|
|
|
|
|
El Chocón |
| Hidroeléctrica El Chocón S.A. |
| Endesa Chile’s Argentine generation subsidiary with two hydroelectric plants, El Chocón and Arroyito, both located in the Limay River, Argentina. |
|
|
|
|
|
Elesur |
| Elesur S.A. |
| A former Chilean subsidiary of Enersis that absorbed Chilectra, and later changed its name to Chilectra. |
|
|
|
|
|
Emgesa |
| Emgesa S.A. E.S.P. |
| Colombian generation company controlled by Endesa Chile. |
|
|
|
|
|
Endesa Brasil |
| Endesa Brasil S.A. |
| Brazilian holding company, a subsidiary of Enersis. |
Endesa Chile |
| Empresa Nacional de Electricidad S.A. |
| Our generation subsidiary with consolidated operations in four countries in South America. |
|
|
|
|
|
Endesa Costanera |
| Endesa Costanera S.A. |
| Argentine generation company controlled by Endesa Chile. |
|
|
|
|
|
Endesa Eco |
| Endesa Eco S.A. |
| Chilean electricity company, owner of Central Eólica Canela S.A. and Ojos de Agua mini hydro plant. Endesa Eco is an Endesa Chile subsidiary. |
|
|
|
|
|
Endesa Fortaleza |
| Central Geradora Termelétrica Fortaleza S.A. |
| Operates a combined cycle generating plant, located in the state of Ceará. Endesa Fortaleza is wholly-owned by our subsidiary Endesa Brasil. |
|
|
|
|
|
Endesa Latinoamérica |
| Endesa Latinoamérica, S.A. |
| A subsidiary of Endesa Spain and our direct controller, formerly known as Endesa Internacional, S.A.U. |
|
|
|
|
|
Endesa Spain |
| ENDESA, S.A. |
| A Spanish electricity generation and distribution company with a 60.6% beneficial interest in Enersis. |
|
|
|
|
|
Enel |
| Enel S.p.A. |
| Italian power company, with a 92.1% controlling ownership of Endesa Spain. |
|
|
|
|
|
Enersis |
| ENERSIS S.A. |
| Our company, a publicly held limited liability stock company incorporated under the laws of the Republic of Chile, with subsidiaries engaged primarily in the generation, transmission and distribution of electricity in Chile, Argentina, Brazil, Colombia and Peru. Registrant of this report. |
|
|
|
|
|
ENRE |
| Ente Nacional Regulatorio de la Energía |
| Argentine national regulatory authority for the energy sector. |
|
|
|
|
|
Etevensa |
| Empresa de Generación Termoeléctrica Ventanilla S.A. |
| Peruvian generation company that merged with Edegel in 2006. |
|
|
|
|
|
FONINVEMEM |
| Fondo Para Inversiones Necesarias Que Permitan Incrementar La Oferta De Energía Eléctrica En El Mercado Eléctrico Mayorista |
| Argentine fund created to increase electricity supply in the MEM. |
|
|
|
|
|
GasAtacama |
| GasAtacama S.A. |
| Company involved in gas transportation and electricity generation in the north of Chile that is 50% owned by Endesa Chile. |
|
|
|
|
|
Gener |
| AES Gener S.A. |
| Chilean generation company that competes with the Company in Chile, Argentina and Colombia. |
|
|
|
|
|
GNLQ |
| GNL Quintero S.A. |
| Company created to develop, build, finance, own and operate a LNG regasification facility at Quintero Bay (Chile) in which LNG is |
|
|
|
| unloaded, stored and regasified. |
|
|
|
|
|
IFRS |
| International Financial Reporting Standards |
| Accounting standards adopted by the Company on January 1, 2009. |
|
|
|
|
|
IMV |
| Inmobiliaria Manso de Velasco Ltda. |
| Enersis’ wholly-owned subsidiary engaged in the real estate business. |
|
|
|
|
|
LNG |
| Liquefied Natural Gas. |
| Liquefied natural gas. |
|
|
|
|
|
MEM |
| Mercado Eléctrico Mayorista |
| Wholesale Electricity Market in Argentina. |
|
|
|
|
|
MME |
| Ministério de Minas e Energia |
| Brazilian Ministry of Mines and Energy. |
|
|
|
|
|
NCRE |
| Non Conventional Renewable Energy |
| Energy sources which are continuously replenished by natural processes, such as wind, biomass, mini-hydro, geothermal, wave or tidal energy. |
|
|
|
|
|
NIS |
| Sistema Interconectado Nacional |
| National interconnected electric system. There are such systems in Chile, Argentina, Brazil and Colombia. |
|
|
|
|
|
ONS |
| Operador Nacional do Sistema Elétrico |
| Electric System National Operator. Brazilian non-profit private entity responsible for the planning and coordination of operations in interconnected systems. |
|
|
|
|
|
Osinergmin |
| Organismo Supervisor de la Inversión en Energía y Minería |
| Energy and Mining Investment Supervisor Authority, the Peruvian regulatory electricity authority. |
|
|
|
|
|
Pangue |
| Empresa Eléctrica Pangue S.A. |
| Chilean electricity company, owner of the Pangue power station. Pangue is an Endesa Chile subsidiary. |
|
|
|
|
|
Pehuenche |
| Empresa Eléctrica Pehuenche S.A. |
| Chilean electricity company, owner of three power stations in the Maule River basin. Pehuenche is an Endesa Chile subsidiary. |
|
|
|
|
|
San Isidro |
| Compañía Eléctrica San Isidro S.A. |
| Chilean electricity company, owner of a thermal power station. San Isidro is wholly-owned by Endesa Chile. |
|
|
|
|
|
SEF |
| Superintendencia de Electricidad y Combustible |
| Chilean Superintendency of Electricity and Fuels, a Governmental entity in charge of supervising the Chilean electricity industry. |
|
|
|
|
|
SEIN |
| Sistema Eléctrico Interconectado Nacional |
| Peruvian interconnected electric system. |
|
|
|
|
|
SIC |
| Sistema Interconectado Central |
| Chilean central interconnected electric system covering all of Chile except the north and the extreme south. |
|
|
|
|
|
SING |
| Sistema Interconectado del Norte Grande |
| Electric interconnected system operating in |
|
|
|
| northern Chile. |
|
|
|
|
|
SVS |
| Superintendencia de Valores y Seguros |
| Chilean authority in charge of supervising public companies, securities and the insurance business. |
|
|
|
|
|
TESA |
| Transportadora del Energía de Mercosur S.A. |
| Endesa Brasil’s transmission company subsidiary with operations in Argentina. |
|
|
|
|
|
UF |
| Unidad de Fomento |
| Chilean inflation-indexed, peso-denominated monetary unit. |
|
|
|
|
|
UTA |
| Unidad Tributaria Anual |
| Chilean annual tax unit. One UTA equals 12 UTM. |
|
|
|
|
|
UTM |
| Unidad Tributaria Mensual |
| Chilean monthly tax unit used to define fines, among other purposes, which is inflation indexed. |
|
|
|
|
|
VAD |
| Valor Agregado de Distribución |
| Value added from distribution of electricity. |
|
|
|
|
|
VNR |
| Valor Nuevo de Reemplazo |
| The net replacement value of electricity assets. |
As used in this report on Form 20-F, first person personal pronouns such as “we,” “us” or “our” refer to ENERSIS S.A. (Enersis or the Company) and our consolidated subsidiaries unless the context indicates otherwise. Unless otherwise noted, our interest in our principal subsidiaries, jointly —controlled entities and associates is expressed in terms of our economic interest as of December 31, 2010.
We are a Chilean company engaged through our subsidiaries and jointly-controlled entitiesin the electricity generation, transmission and distribution businesses in Chile, Argentina, Brazil, Colombia and Peru. As of the date of this report, we own 60.0% of Empresa Nacional de Electricidad S.A. (Endesa Chile) and 99.1% of Chilectra S.A. As of the same date, ENDESA, S.A. (Endesa Spain), a Spanish electricity generation and distribution company, owns 60.6% of Enersis. Enel S.p.A. (Enel), an Italian generation and distribution company, owns 92.1% of Endesa Spain through a wholly-owned subsidiary.
In this report on Form 20-F, unless otherwise specified, references to “dollars” or “$,” are to dollars of the United States of America; references to “pesos” or “Ch$” are to Chilean pesos, the legal currency of Chile; references to “Ar$” or “Argentine pesos” are to the legal currency of Argentina; references to “R$” or “reais” are to Brazilian reals, the legal currency of Brazil; references to “soles” are to Peruvian Nuevo Sol, the legal currency of Peru; references to “CPs” or “Colombian pesos” are to the legal currency of Colombia; references to “€” or “Euros” are to the legal currency of the European Union; and references to “UF” are to Unidades de Fomento.
The Unidad de Fomento is a Chilean inflation-indexed, peso-denominated monetary unit. The UF rate is set daily in advance based on changes in the previous month’s inflation rate. As of December 31, 2010, UF 1 was equivalent to Ch$ 21,455.55. The dollar equivalent of UF 1 was $ 45.84 as of December 31, 2010, using the Observed Exchange Rate reported by the Banco Central de Chile (the “Chilean Central Bank,” or the “Central Bank”) as of December 31, 2010 of Ch$ 468.01 per $ 1.00. As of April 30, 2011, UF 1 was equivalent to Ch$ 21,711.55. The dollar equivalent of UF 1 was $ 47.19 at April 30, 2011, using the Observed Exchange Rate reported by the Central Bank as of April 30, 2011 of Ch$ 460.09 per $ 1.00.
Our Consolidated Financial Statements and, unless otherwise indicated, other financial information concerning Enersis included in this report are presented in pesos. Until the year ended December 31, 2008, Enersis prepared its financial statements in accordance with generally accepted accounting principles in Chile (Chilean GAAP). Since January 1, 2009, Enersis has prepared its financial statements in accordance with International Financial Reporting Standards (IFRS), as issued by the International Accounting Standard Board (IASB).
The subsidiaries are consolidated and all their assets, liabilities, income, expenses and cash flows are included in the consolidated financial statements after making the adjustments and eliminations related to intra-Group transactions.
Jointly-controlled entities, which are those that do not have a controlling shareholder but are governed by a joint management agreement, are consolidated by the proportional integration method. Enersis recognizes, line by line, its share of the assets, liabilities, income, expenses and cash flow of such entities, subject to accounting eliminations.
Investments in associates in which the Company has significant influence, are recorded in our Consolidated Financial Statements under the equity method.
For detailed information regarding subsidiaries, jointly-controlled entities and associates, see Appendix No. 1 and No. 3 of the Consolidated Financial Statements.
For the convenience of the reader, this report contains translations of certain peso amounts into dollars at specified rates. Unless otherwise indicated, the dollar equivalent for information in pesos is based on the Observed Exchange Rate as of December 31, 2010, as defined in “Item 3. Key Information — A. Selected Financial Data — Exchange Rates” The Federal Reserve Bank of New York does not report a noon buying rate for pesos. No representation is made that the peso or dollar amounts shown in this report could have been or could be converted into dollars or pesos, as the case may be, at such rate or at any other rate (See “Item 3. Key Information — A. Selected Financial Data — Exchange Rates”).
References to “GW” and “GWh” are to gigawatts and gigawatt hours, respectively; references to “MW” and “MWh” are to megawatts and megawatt hours, respectively; references to “kW” and “kWh” are to kilowatts and kilowatt hours, respectively; references to “kV” are to kilovolts, and references to “MVA” are to megavolt amperes. Unless otherwise indicated, statistics provided in this report with respect to the installed capacity of electricity generation facilities are expressed in MW. One TW = 1,000 GW, one GW = 1,000 MW, and one MW = 1,000 kW.
Statistics relating to aggregate annual electricity production are expressed in GWh and based on a year of 8,760 hours, except for leap years (such as 2008), which are based on 8,784 hours. Statistics relating to installed capacity and production of the electricity industry do not include electricity of self-generators. Statistics relating to our production do not include electricity consumed by us by our own generation units.
Energy losses experienced by generation companies during transmission are calculated by subtracting the number of GWh of energy sold from the number of GWh of energy generated (excluding its own energy consumption and losses on the part of the power plant), within a given period. Losses are expressed as a percentage of total energy generated.
Energy losses during distribution are calculated as the difference between total energy purchased (GWh of physical demand, including own generation) and the energy sold (also measured in GWh), within a given period. Losses are expressed as a percentage of total energy purchased. Losses in distribution arise from illegally tapped energy as well as technical losses.
Calculation of Economic Interest
References are made in this report to the “economic interest” of Enersis in its related companies. In circumstances where we do not directly own an interest in a related company, our economic interest in such ultimate related company is calculated by multiplying the percentage of economic interest in a directly held related company by the percentage of economic interest of any entity in the ownership chain of such related company. For example, if we own 60% of a directly held subsidiary and that subsidiary owns 40% of an associate, our economic interest in such associate would be 60% times 40%, or 24%.
This report contains statements that are or may constitute forward-looking statements within the meaning of Section 27A of the Securities Act of 1933, as amended, and Section 21E of the Securities Exchange Act of 1934, as amended. These statements appear throughout this report and include statements regarding our intent, belief or current expectations, including but not limited to any statements concerning:
· our capital investment program;
· trends affecting our financial condition or results from operations;
· our dividend policy;
· the future impact of competition and regulation;
· political and economic conditions in the countries in which we or our related companies operate or may operate in the future;
· any statements preceded by, followed by or that include the words “believes,” “expects,” “predicts,” “anticipates,” “intends,” “estimates,” “should,” “may” or similar expressions; and
· other statements contained or incorporated by reference in this report regarding matters that are not historical facts.
Because such statements are subject to risks and uncertainties, actual results may differ materially from those expressed or implied by such forward-looking statements. Factors that could cause actual results to differ materially include, but are not limited to:
· changes in the regulatory framework of the electricity industry in one or more of the countries in which we operate;
· our ability to implement proposed capital expenditures, including our ability to arrange financing where required;
· the nature and extent of future competition in our principal markets;
· political, economic and demographic developments in the emerging market countries of South America where we conduct our business; and
· the factors discussed below under “Risk Factors.”
You should not place undue reliance on such statements, which speak only as of the date that they were made. Our independent public accountants have not examined or compiled the forward-looking statements, and, accordingly, do not provide any assurance with respect to such statements. You should consider these cautionary statements together with any written or oral forward-looking statements that we may issue in the future. We do not undertake any obligation to release publicly any revisions to forward-looking statements contained in this report to reflect later events or circumstances or to reflect the occurrence of unanticipated events.
For all these forward-looking statements, we claim the protection of the safe harbor for forward-looking statements contained in the Private Securities Litigation Reform Act of 1995.
Item 1. Identity of Directors, Senior Management and Advisers
Not applicable.
Item 2. Offer Statistics and Expected Timetable
Not applicable.
A. Selected Financial Data
The following summary of consolidated financial data should be read in conjunction with our audited Consolidated Financial Statements, included in this report. Our audited Consolidated Financial Statements as of and for the years ended December 31, 2010, 2009 and 2008 are prepared in accordance with International Financial Reporting Standards (IFRS), as issued by the IASB. For further detail on the adoption of IFRS, please see “Introduction — Financial Information.” The financial data as of and for each of the three years ended December 31, 2010 in the table below are presented in nominal pesos.
Amounts are expressed in millions except for ratios, operating data, shares and ADS (American Depositary Shares) data. For the convenience of the reader, all data presented in dollars in the following summary, as of and for the year ended December 31, 2010, are translated at the Observed Exchange Rate for December 31, 2010 of Ch$ 468.01 per $ 1.00. No representation is made that the peso or dollar amounts shown in this report could have been or could be converted into dollars or pesos, at such rate or at any other rate. For more information concerning historical exchange rates, see “Exchange Rates” below.
The following table sets forth the selected consolidated financial data of Enersis in accordance with IFRS for the periods indicated:
|
| As of and for the year ended December 31, |
| ||||||
|
| 2008 |
| 2009 |
| 2010 |
| 2010 (1) |
|
|
| Ch$ Million |
| Million of $ |
| ||||
CONSOLIDATED INCOME STATEMENT DATA |
|
|
|
|
|
|
|
|
|
Amounts in accordance with IFRS |
|
|
|
|
|
|
|
|
|
Revenues |
| 6,579,945 |
| 6,472,056 |
| 6,563,581 |
| 14,024 |
|
Operating Costs |
| (4,716,294 | ) | (4,544,611 | ) | (4,859,280 | ) | (10,383 | ) |
|
|
|
|
|
|
|
|
|
|
Operating Income |
| 1,863,651 |
| 1,927,445 |
| 1,704,301 |
| 3,641 |
|
Financial Income (Cost), Net |
| (419,366 | ) | (309,256 | ) | (270,605 | ) | (578 | ) |
Total gain (loss) on sale of non-current assets not held forsale |
| 2,503 |
| 50,502 |
| 11,711 |
| 25 |
|
Other non Operating Income (loss), net |
| 3,297 |
| 2,374 |
| 1,288 |
| 3 |
|
|
|
|
|
|
|
|
|
|
|
Income (loss) before Income Taxes |
| 1,450,085 |
| 1,671,065 |
| 1,446,695 |
| 3,091 |
|
Income tax |
| (415,903 | ) | (359,737 | ) | (346,007 | ) | (739 | ) |
|
|
|
|
|
|
|
|
|
|
Net Income |
| 1,034,182 |
| 1,311,328 |
| 1,100,688 |
| 2,352 |
|
Net income attributable to: Owners of parent |
| 507,590 |
| 660,231 |
| 486,227 |
| 1,039 |
|
Net income attributable to: Non-controlling interests |
| 526,592 |
| 651,097 |
| 614,461 |
| 1,313 |
|
Net income (loss) from continuing operations per Share (Ch$/$ per share) |
| 15.55 |
| 20.22 |
| 14.89 |
| 0.0318 |
|
Net income (loss) from continuing operations per ADS |
| 777.29 |
| 1,011.04 |
| 744.58 |
| 1.5910 |
|
Net income (loss) per Share (Ch$/$ per share) |
| 15.55 |
| 20.22 |
| 14.89 |
| 0.0318 |
|
Net income (loss) per ADS (Ch$/$ per ADS) |
| 777.29 |
| 1,011.04 |
| 744.58 |
| 1.5909 |
|
Cash Dividends per Share (Ch$/$ per share) |
| 4.95 |
| 7.02 |
| 4.64 |
| 0.0099 |
|
Cash Dividends per ADS (Ch$/$ per ADS) |
| 247.50 |
| 351.00 |
| 232.00 |
| 0.4957 |
|
Number of shares of common stock (millions) |
| 32,651 |
| 32,651 |
| 32,651 |
|
|
|
Number of American Depositary Shares (millions) |
| 71 |
| 81 |
| 82 |
|
|
|
|
|
|
|
|
|
|
|
|
|
CONSOLIDATED BALANCE SHEET DATA |
|
|
|
|
|
|
|
|
|
Amounts in accordance with IFRS |
|
|
|
|
|
|
|
|
|
Total Assets |
| 13,781,176 |
| 13,210,140 |
| 13,005,845 |
| 27,790 |
|
Non-Current Liabilities |
| 5,049,265 |
| 4,637,749 |
| 4,084,540 |
| 8,727 |
|
Equity Attributable to Owners of parent |
| 3,091,315 |
| 3,518,480 |
| 3,735,545 |
| 7,982 |
|
Equity Attributable to Non-controlling interests |
| 2,937,816 |
| 2,858,524 |
| 2,778,483 |
| 5,937 |
|
|
|
|
|
|
|
|
|
|
|
Other Consolidated Financial Data |
|
|
|
|
|
|
|
|
|
Amounts in accordance with IFRS |
|
|
|
|
|
|
|
|
|
Capital Expenditures Paid (2) |
| 781,542 |
| 736,474 |
| 701,341 |
| 1,499 |
|
Depreciation, amortization and impairment losses |
| 438,064 |
| 539,655 |
| 557,391 |
| 1,191 |
|
(1) Solely for the convenience of the reader, peso amounts have been translated into dollars at the exchange rate of Ch$ 468.01 per dollar, the Observed Exchange Rate as of December 31, 2010.
(2) Capex figures represent effective payments for each year.
|
| As of and for the year ended December 31, |
| ||||||||
|
| 2006 |
| 2007 |
| 2008 |
| 2009 |
| 2010 |
|
OPERATING DATA OF SUBSIDIARIES |
|
|
|
|
|
|
|
|
|
|
|
|
|
|
|
|
|
|
|
|
|
|
|
Chilectra (Chile) |
|
|
|
|
|
|
|
|
|
|
|
Electricity Sold (GWh) |
| 12,377 |
| 12,923 |
| 12,535 |
| 12,585 |
| 13,098 |
|
Number of Customers (thousands) |
| 1,437 |
| 1,483 |
| 1,534 |
| 1,579 |
| 1,610 |
|
Total Energy Losses (%)(1) |
| 5.4 | % | 5.9 | % | 5.9 | % | 6.1 | % | 5.8 | % |
|
|
|
|
|
|
|
|
|
|
|
|
Edesur (Argentina) |
|
|
|
|
|
|
|
|
|
|
|
Electricity Sold (GWh) |
| 14,837 |
| 15,833 |
| 16,160 |
| 16,026 |
| 16,759 |
|
Number of Customers (thousands) |
| 2,196 |
| 2,228 |
| 2,262 |
| 2,305 |
| 2,353 |
|
Total Energy Losses (%)(1) |
| 10.5 | % | 10.7 | % | 10.6 | % | 10.5 | % | 10.5 | % |
|
|
|
|
|
|
|
|
|
|
|
|
Ampla (Brazil) |
|
|
|
|
|
|
|
|
|
|
|
Electricity Sold (GWh) |
| 8,668 |
| 8,985 |
| 9,119 |
| 9,394 |
| 9,927 |
|
Number of Customers (thousands) |
| 2,316 |
| 2,379 |
| 2,466 |
| 2,522 |
| 2,571 |
|
Total Energy Losses (%)(1) |
| 21.9 | % | 21.4 | % | 20.2 | % | 21.2 | % | 20.5 | % |
|
|
|
|
|
|
|
|
|
|
|
|
Coelce (Brazil) |
|
|
|
|
|
|
|
|
|
|
|
Electricity Sold (GWh) |
| 6,769 |
| 7,227 |
| 7,571 |
| 7,860 |
| 8,850 |
|
Number of Customers (thousands) |
| 2,543 |
| 2,689 |
| 2,842 |
| 2,965 |
| 3,095 |
|
Total Energy Losses (%)(1) |
| 13.0 | % | 12.5 | % | 11.7 | % | 11.6 | % | 12.1 | % |
|
|
|
|
|
|
|
|
|
|
|
|
Codensa (Colombia)(2) |
|
|
|
|
|
|
|
|
|
|
|
Electricity Sold (GWh) |
| 10,755 |
| 11,441 |
| 11,822 |
| 11,837 |
| 12,141 |
|
Number of Customers (thousands) |
| 2,138 |
| 2,209 |
| 2,285 |
| 2,361 |
| 2,429 |
|
Total Energy Losses (%)(1) |
| 8.9 | % | 8.7 | % | 8.1 | % | 8.2 | % | 8.2 | % |
|
|
|
|
|
|
|
|
|
|
|
|
EEC (Colombia) (3) |
|
|
|
|
|
|
|
|
|
|
|
Electricity Sold (GWh) |
| n.a. |
| n.a. |
| n.a. |
| 277 |
| 373 |
|
Number of Customers (thousands) |
| n.a. |
| n.a. |
| n.a. |
| 115 |
| 117 |
|
Total Energy Losses (%)(1) |
| n.a. |
| n.a. |
| n.a. |
| 15.2 | % | 17.7 | % |
|
|
|
|
|
|
|
|
|
|
|
|
Edelnor (Peru) |
|
|
|
|
|
|
|
|
|
|
|
Electricity Sold (GWh) |
| 4,874 |
| 5,201 |
| 5,599 |
| 5,716 |
| 6,126 |
|
Number of Customers (thousands) |
| 952 |
| 986 |
| 1,028 |
| 1,061 |
| 1,098 |
|
Total Energy Losses (%)(1) |
| 8.2 | % | 8.1 | % | 8.2 | % | 8.1 | % | 8.3 | % |
|
|
|
|
|
|
|
|
|
|
|
|
Endesa Chile |
|
|
|
|
|
|
|
|
|
|
|
Installed capacity in Chile (MW) |
| 4,477 |
| 4,779 |
| 5,283 |
| 5,650 |
| 5,611 |
|
Installed capacity in Argentina (MW) |
| 3,639 |
| 3,644 |
| 3,652 |
| 3,652 |
| 3,652 |
|
Installed capacity in Colombia (MW) |
| 2,779 |
| 2,829 |
| 2,895 |
| 2,895 |
| 2,914 |
|
Installed capacity in Peru (MW) |
| 1,426 |
| 1,468 |
| 1,467 |
| 1,667 |
| 1,668 |
|
Production in Chile (GWh)(4) |
| 19,973 |
| 18,773 |
| 21,267 |
| 22,239 |
| 20,914 |
|
Production in Argentina (GWh)(4) |
| 13,750 |
| 12,117 |
| 10,480 |
| 11,955 |
| 10,940 |
|
Production in Colombia (GWh)(4) |
| 12,564 |
| 11,942 |
| 12,905 |
| 12,674 |
| 11,283 |
|
Production in Peru (GWh)(4) |
| 6,662 |
| 7,654 |
| 8,102 |
| 8,163 |
| 8,466 |
|
|
|
|
|
|
|
|
|
|
|
|
|
Endesa Brasil |
|
|
|
|
|
|
|
|
|
|
|
Installed capacity in Brazil (MW)(5) |
| 980 |
| 987 |
| 987 |
| 987 |
| 987 |
|
Production in Brazil (GWh)(4)(5) |
| 4,489 |
| 3,954 |
| 3,379 |
| 3,319 |
| 5,095 |
|
(1) Energy losses are calculated as the difference between total energy purchased (GWh of physical demand, including own generation) and the energy sold (GWh), within a given period. Losses are expressed as a percentage of total energy purchased. Losses in distribution arise from illegally tapped energy as well as technical failures.
(2) In February 2009, Codensa, our Colombian distribution subsidiary, acquired approximately 49% of DECA. On March 13, 2009, DECA acquired 82.3% of EEC. Beginning in 2010, we started presenting separately the information concerning EEC, a jointly-controlled company of Codensa, explaining the differences between the 2009 figures for Codensa compared to those reported in our 2009 Form 20-F. This new criterion also affects other 2009 figures relating to Codensa, such as capital expenditures, concession area, transmission lines, substations, transformers and employees.
(3) The results for 2009 include the period of April through December.
(4) Energy production is defined as total generation minus energy consumption and technical losses within our own power plants.
(5) Ampla had generation facilities which were sold in 2006.
Exchange Rates
Fluctuations in the exchange rate between the peso and the dollar will affect the dollar equivalent of the peso price of our shares of common stock, without par value (the Shares or the Common Stock), on the Bolsa de Comercio de Santiago (the Santiago Stock Exchange), the Bolsa Electrónica de Chile (the Chilean Electronic Exchange) and the Bolsa de Corredores de Valparaíso (the Valparaíso Stock Exchange) (collectively, the Chilean Exchanges). These exchange rate fluctuations will likely affect the price of the Company’s ADS and the conversion of cash dividends relating to the Shares represented by ADS from pesos to dollars. In addition, to the extent that significant financial liabilities of the Company are denominated in foreign currencies, exchange rate fluctuations may have a significant impact on earnings.
The Ley Orgánica del Banco Central de Chile 18,840 (the Central Bank Act), provides that the Central Bank may require that certain purchases and sales of foreign currency be carried out in the Mercado Cambiario Formal (the Formal Exchange Market), a market comprised of banks and other entities explicitly authorized by the Central Bank. Purchases and sales of foreign currency, which can take place outside the Formal Exchange Market, can be carried out in the Mercado Cambiario Informal (the Informal Exchange Market), which is a recognized currency market in Chile. Free market forces drive both the Formal and Informal Exchange Markets. Foreign currency for payments and distributions with respect to the ADS may be purchased in either the Formal or the Informal Exchange Market, but such payments and distributions must be remitted through the Formal Exchange Market. The Central Bank publishes the dólar observado (the Observed Exchange Rate) daily, and it is computed by taking the weighted average of the previous business day’s transactions in the Formal Exchange Market.
Since 1993, the Observed Exchange Rate and the Informal Exchange Rate have typically been within less than 1% of each other. The Informal Exchange Rate means the average rate at which transactions are made in the Informal Exchange Market. On December 31, 2010, the Informal Exchange Rate was Ch$ 468.00, or virtually the same as the published Observed Exchange Rate of Ch$ 468.01 per $ 1.00. On April 30, 2011, the informal exchange rate was Ch$ 460.35 per $ 1.00, 0.1% higher than the Observed Exchange Rate corresponding to such date of Ch$ 460.09 per $ 1.00. Unless otherwise indicated, amounts translated to dollars were calculated based on the exchange rates prevailing as of December 31, 2010.
The following table sets forth, for the periods and dates indicated, certain information concerning the Observed Exchange Rate reported by the Central Bank.
|
| Observed Exchange Rate(1) |
| ||||||
Year |
| Low |
| High |
| Average(2) |
| Period- |
|
2006 |
| 511.44 |
| 549.63 |
| 529.64 |
| 532.39 |
|
2007 |
| 493.14 |
| 548.67 |
| 521.06 |
| 496.89 |
|
2008 |
| 431.22 |
| 676.75 |
| 530.48 |
| 636.45 |
|
2009 |
| 491.09 |
| 643.87 |
| 554.22 |
| 507.10 |
|
2010 |
| 468.01 |
| 549.17 |
| 510.38 |
| 468.01 |
|
|
| Monthly Observed Exchange Rate(1) |
| ||||||
Last six months |
| Low |
| High |
| Average(2) |
| Period- |
|
2010 |
|
|
|
|
|
|
|
|
|
November |
| 477.05 |
| 488.04 |
| — |
| 487.87 |
|
December |
| 468.01 |
| 485.34 |
| — |
| 468.01 |
|
|
|
|
|
|
|
|
|
|
|
2011 |
|
|
|
|
|
|
|
|
|
January |
| 466.05 |
| 499.03 |
| — |
| 484.14 |
|
February |
| 468.94 |
| 481.56 |
| — |
| 475.21 |
|
March |
| 472.74 |
| 485.37 |
| — |
| 479.46 |
|
April |
| 460.04 |
| 476.90 |
| — |
| 460.09 |
|
Source: Chilean Central Bank.
(1) Reflects pesos at historical values rather than in constant pesos.
(2) The average of the exchange rates on the last day of each month during the yearly period. This is not applicable to monthly data.
Calculation of the appreciation or devaluation of the Chilean peso against the U.S. dollar in any given period is made by determining the percent change between the reciprocals of the Chilean peso equivalent of $1.00 at the end of the preceding period and the end of the period for which the calculation is being made. For example, to calculate the appreciation of the Chilean peso in 2010, one determines the percent change between the reciprocal of Ch$ 507.10 (the value of one dollar as of December 31, 2009) and the reciprocal of Ch$ 468.01 (the value of one dollar as of December 31, 2010). In this example, the percentage change between 0.001971 (the reciprocal of 507.10) and 0.002136 (the reciprocal of 468.01) is 8.4%, which represents the appreciation of the Chilean peso against the dollar in 2010. A positive percentage change means that the Chilean peso appreciated against the dollar, while a negative percentage change means that the peso devaluated against the dollar.
The following table sets forth the period-end rates for U.S. dollars for the years ended December 31, 2006 through December 31, 2010 and through the date indicated in the table below, based on information published by the Chilean Central Bank.
|
| Period |
| Appreciation |
|
Chilean Peso Equivalent of $ 1 |
|
|
|
|
|
Year Ended: |
|
|
|
|
|
December 31, 2006 |
| 532.39 |
| (3.7 | )% |
December 31, 2007 |
| 496.89 |
| 7.1 | % |
December 31, 2008 |
| 636.45 |
| (21.9 | )% |
December 31, 2009 |
| 507.10 |
| 25.5 | % |
December 31, 2010 |
| 468.01 |
| 8.4 | % |
Source: Chilean Central Bank.
(1) Calculated based on the variation of period-end exchange rates.
B. Capitalization and Indebtedness.
Not applicable.
C. Reasons for the Offer and Use of Proceeds.
Not applicable.
D. Risk Factors.
A financial crisis in any region worldwide can have a significant impact in the countries in which we operate, and consequently, may adversely affect our operations, as well as our liquidity.
The five countries in which we operate are vulnerable to external shocks, which could cause significant economic difficulties and affect their growth. In case any of these economies experience a lower economic growth or a recession, it is likely that our customers will demand less electricity, which could affect our results of operations and financial condition adversely. Furthermore, some of our customers may experience difficulties in paying their electricity bills, and an increase in uncollectible accounts would also affect our results adversely.
In addition, a financial crisis and its disruptive effect on the financial industry can have an adverse impact on our ability to obtain new bank loans under normal terms and conditions. Our ability to tap the capital markets in the five countries where we operate, as well as the international capital markets for other sources of liquidity, may also be diminished, or such financing may be available only at higher interest levels. Reduced liquidity could, in turn, affect our capital expenditures, our long-term investments and acquisitions, our growth prospects, and our dividend payout policy.
South American economic fluctuations are likely to affect our results from operations and financial condition, as well as the value of our securities.
All of our operations are located in five South American countries. Accordingly, our consolidated revenues are sensitive to the performance of South American economies as a whole. If local, regional or worldwide economic trends adversely affect the economy of any of the five countries in which we have investments or operations, our financial condition and results from operations could be adversely affected. Moreover, we have investments in relatively risky countries such as Argentina. Generation and distribution of cash from subsidiaries located in this country have proven to be volatile.
A substantial portion of our operations are located in Chile and Brazil and more than 65% of our operating revenues in 2010 were derived from our operations, making our financial condition and results of operations particularly dependent on the performance of these two economies. In 2010, Chilean GDP increased by 5.2% compared to a 1.7% decrease in 2009. The latest estimate from the Chilean Central Bank forecast growth for 2011, is in the 5.5% - 6.5% range. In 2010, Brazilian GDP increased by 7.5% compared to a 0.2% decrease in 2009. The consensus forecast according to the Brazilian Central Bank is a growth of 4.1% in 2011. However, such growth may not be achieved and the growth trend may not be sustainable in the future in one or both of that countries. Future developments in the Chilean and Brazilian economies may impair our ability to proceed with our strategic plans and adversely impact our financial condition or results of operations.
In addition, the South American financial and securities markets are, to varying degrees, influenced by economic and market conditions in other countries. Although economic conditions are different in each country, investor reaction to developments in one country may have a significant contagion effect on the securities of issuers in other countries, including Chile and Brazil. Chilean and Brazilian financial and securities markets may be adversely affected by events in other countries and such effects may affect the value of our securities.
Certain South American economies have been characterized by frequent and occasionally drastic intervention by governmental authorities, which may adversely affect our business.
Governmental authorities have changed monetary, credit, tariff and other policies to influence the course of the economies of Argentina, Brazil, Colombia and Peru. To a lesser extent, the Chilean government has also exercised and continues to exercise a substantial influence over many aspects of the private sector, which may result in changes to economic or other policies. These governmental actions, intended to control inflation and affect other policies, have often involved wage, price and tariff rate controls as well as other interventionist measures, which in Argentina included freezing bank accounts and imposing capital restrictions in 2001, the nationalization of the private sector pension funds in 2008, and the use of Central Bank reserves of the Argentine Treasury in order to pay down indebtedness maturing in 2010. Changes in the policies of these governmental authorities with respect to tariff rates, exchange controls, regulations and taxation could adversely affect our business and financial results, reducing our profitability, as could inflation, devaluation, social instability and other political, economic or diplomatic developments, including the response by governments in the region to these circumstances.
Our electricity business is subject to risks arising from natural disasters, catastrophic accidents and acts of terrorism, which could adversely affect our operations, earnings and cash flow.
Our primary facilities include power plants, transmission and distribution assets, pipelines, LNG terminals and re-gasification plants, storage and chartered LNG tankers. Our facilities may be damaged by earthquakes, flooding, fires, other catastrophic disasters arising from natural or accidental human causes, as well as acts of terrorism. We could experience severe business disruptions, significant decreases in revenues based on lower demand arising from catastrophic events, or significant additional costs to us not otherwise covered by business interruption insurance clauses. There may be an important time lag between a major accident or catastrophic event and the final reimbursement from our insurance policies, which typically carry non-recoverable deductible amounts, and in any event are subject to caps per event.
We are subject to refinancing risk and to debt covenants that could affect our liquidity.
As of December 31, 2010, our debt in financial terms was $ 7,579 million while, for accounting purposes, it totaled $ 7,864 million. These amounts differ since financial debt, unlike accounting debt, does not include accrued interest.
Our financial debt had the following maturity timetable:
· $ 1,268 million in 2011;
· $ 1,021 million in 2012;
· $ 2,693 million in the 2013-2015 period; and
· $ 2,596 million thereafter.
Set forth below is a breakdown by country of financial debt maturing in 2011:
· $ 66 million — Chile;
· $ 173 million — Argentina;
· $ 643 million — Brazil;
· $ 265 million — Colombia; and
· $ 121 million — Peru.
Our debt agreements are subject to certain debt-to-EBITDA and debt-to-equity financial covenant ratios, among others. They also contain common affirmative and negative covenants, as well as events of default, and in some cases, mandatory prepayment events.
As is customary for certain credit and capital market debt facilities, a significant portion of Enersis and Endesa Chile’s financial indebtedness is subject to cross default provisions, with different definitions, criteria, materiality thresholds, and applicability as to the subsidiaries that could give rise to a cross default.
In the event that any of our cross default provisions is triggered and our existing creditors demand immediate repayment, a portion of our indebtedness could become due and payable.
We may be unable to refinance our indebtedness or obtain such refinancing on terms acceptable to us. In the absence of such refinancing, we could be forced to dispose of assets in order to make up for any shortfall in the payments due on our indebtedness under circumstances that might not be favorable to obtaining the best price for such assets. Furthermore, assets may not be sold quickly enough, or for amounts sufficient to enable us to make such payments.
As of the date of this report, Argentina continues to be the country with the highest refinancing risk. As of December 31, 2010, the third-party financial debt of our Argentine subsidiaries amounted to $ 360.2 million. As a matter of policy for all of our Argentine subsidiaries as long as fundamental issues concerning the electricity sector remain unresolved, we are rolling over our Argentine outstanding debt. If our creditors do not continue to accept rolling over debt principal when it becomes due and we are unable to refinance such obligations, we may default on such indebtedness. For more information on covenants, cross default and relevant provisions for of credit facilities, see “Item 5. Operating and Financial Review and Prospects — B. Liquidity and Capital Resources.”
Since our generation business depends heavily on hydrological conditions, drought conditions may hurt our profitability.
Approximately 58% of our consolidated installed generation capacity in 2010 was hydroelectric. Accordingly, extreme hydrological conditions may affect our business and may have an adverse effect on our results.
During periods of drought, thermal plants, such as ours that use natural gas, fuel oil or coal as a fuel, are dispatched more frequently. Operating costs of thermal plants might be considerably higher than those of hydroelectric plants. Our operating expenses increase during these periods, and depending on our commercial obligations, we may have to buy electricity from the spot market in order to comply with our contractual supply obligations. The cost of these electricity purchases may exceed the price at which we sell contracted electricity, thus producing losses from those contracts.
Governmental regulations may impose additional operating costs which may reduce our profits.
We are subject to extensive regulation of tariffs and other aspects of our business in the five countries in which we operate, and these regulations may adversely affect our profitability. For example, the Chilean government can impose electricity rationing during drought conditions or prolonged failures in power facilities. On February 9, 2011, the Ministry of Energy promulgated a rationing decree that will be in effect from February 17, 2011 to August 31, 2011. If, during rationing, we are unable to generate enough electricity to comply with our contractual obligations, we may be forced to buy electricity in the pool market at the spot price, since even a severe drought does not constitute a force majeure event. The spot price may be significantly higher than our costs to generate the electricity and can be as high as the “cost of failure” set by the National Energy Commission, or the CNE. This “cost of failure,” which is updated semiannually by the CNE, is a measurement of how much final users would pay for one extra MWh under rationing conditions. If we are unable to buy enough electricity in the pool market to comply with all of our contractual obligations, then we would have to compensate our regulated customers for the electricity we failed to provide at the rationed price. If material rationing policies are imposed by regulatory authorities in Chile, our business, financial condition and results from operations may be affected adversely in a material way.
Similarly, if material rationing policies are imposed by the local regulatory authority in the other countries in which we operate, as a result of adverse hydrological conditions, our business, financial condition and results from operations may be affected adversely in a material way. Rationing periods may occur in the future, and consequently our generation subsidiaries may be required to pay regulatory penalties if such subsidiaries fail to provide adequate service under such conditions.
In addition, changes in the regulatory framework, including changes that if adopted would significantly affect our operations, are often submitted to the legislators and administrative authorities in the countries in which we operate and, if approved, could have a material adverse impact on our business. For instance, in 2005 there was a change in the water rights law in Chile that requires us to pay for unused water rights.
Regulatory authorities may impose fines on our subsidiaries.
Our electricity businesses may be subject to regulatory fines for any breach of current regulations, including energy supply failure, in the five countries in which we operate. In Chile, such fines may range from 1 Unidad Tributaria Mensual (UTM), or $ 80, to 10,000 Unidades Tributarias Anuales (UTA), or $ 9.6 million, in each case using the UTM, UTA and foreign exchange rate as of December 31, 2010. In Peru, fines can reach a maximum of 1,300 Unidad Impositiva Tributaria (UIT) or $ 1.7 million as of December 31, 2010; in Colombia fines may range from $ 2,900 to $ 0.6 million; in Argentina, there is no maximum limit for the fines and in Brazil fines may range from $ 0.1 to $ 35.3 million.
Our electricity subsidiaries, supervised by their local regulatory entities, may be subject to these fines in cases where, in the opinion of the regulatory entity, operational failures that affect the regular energy supply to the system are the fault of the company; for instance, when the agents are not coordinated with the system operation. Also, our subsidiaries may be required to pay fines or to compensate customers if those subsidiaries are unable to deliver electricity to them even if such failure is due to forces outside of our control.
For example, in Chile in 2005, the Superintendencia de Electricidad y Combustibles (Chilean Superintendence of Electricity and Fuels), or SEF, imposed fines of 1,260 UTA, or $ 1.1 million, on Endesa Chile due to a blackout that occurred in the Metropolitan Region in 2003. On February 17, 2009, the SEF imposed fines on Endesa Chile, Pehuenche and San Isidro for 200 UTA, 200 UTA and 100 UTA, respectively, or $ 0.4 million in total. Also in 2009, the SEF fined Chilectra for 2,000 UTA, or $ 1.7 million, due to billing management procedures challenged by our customers. In June 2009, the SEF imposed fines on Chilectra in the amount of 1,630 UTA, or $ 1.4 million, due to a blackout that occurred in the Metropolitan Region in 2004. In the case of our foreign subsidiaries, for example, in 2006 in Peru the Comité de Operación
Económica del Sistema (Peruvian Economic Operating Committee of the Interconnected System), or COES-SINAC, ordered Edegel to pay approximately $ 1.3 million to other generating companies that were forced to compensate their clients due to an alleged failure of Edegel to comply with certain quality parameters. In January 2011, ENRE imposed fines on Edesur in the amount of $ 1.3 million due to a blackout that occurred in Buenos Aires during the last days of December 2010. Also, as compensation to end users with respect to the same blackout, ENRE imposed an additional fine for $ 14.9 million.
We depend in part on payments from our subsidiaries, jointly-controlled entities and associates to meet our payment obligations.
We have no significant assets other than the stock of our subsidiaries. Our ability to pay our obligations depends on cash from dividends, loans, interest payments, capital reductions and other distributions from our subsidiaries and equity affiliates. The ability of our subsidiaries and equity affiliates to pay dividends, interest payments, loans and other distributions to us is subject to legal constraints such as dividend restrictions, fiduciary duties, contractual limitations and foreign exchange controls that may be imposed in any of the five countries where they operate.
Historically, we have been able to access the cash flows of our Chilean subsidiaries, but we have not been similarly able to access at all times the cash flows of our non-Chilean operating subsidiaries due to government regulations, strategic considerations, economic conditions and credit restrictions.
Our future results from operations outside Chile may continue to be subject to greater economic and political uncertainties than what we have experienced in Chile, thereby reducing the likelihood that we will be able to rely on cash flows from operations in those entities to repay our debt.
Dividend Limits and Other Legal Restrictions. Some of our non-Chilean subsidiaries are subject to legal reserve requirements and other restrictions on dividend payments. Also, other legal restrictions, such as foreign currency controls, may limit the ability of our non-Chilean subsidiaries and equity affiliates to pay dividends and make loan payments or other distributions to us. In addition, the ability of any of our subsidiaries which are not wholly-owned to distribute cash to us may be limited by the fiduciary duties of the directors of such subsidiaries to their minority shareholders. Furthermore, some of our subsidiaries may be forced by local authorities, according to applicable regulation, to diminish or eliminate dividend payments, such as the temporary restrictions for distributing dividends faced by our Argentine subsidiary, Edesur, during 2009 and 2010. As a consequence of such restrictions, our subsidiaries could, under certain circumstances, be prevented from distributing cash to us.
Contractual Constraints. Distribution restrictions included in some credit agreements of our subsidiaries Endesa Costanera, El Chocón, CIEN and Endesa Fortaleza may prevent dividend distributions and other distributions to shareholders if they are not in compliance with certain financial ratios. Generally, companies are not allowed to make any kind of distribution in case of default on credit agreements.
Operating Results of Our Subsidiaries. The ability of our subsidiaries and equity affiliates to pay dividends or make loan payments or other distributions to us is limited by their operating results. To the extent that the cash requirements at any of our subsidiaries exceed available cash, such subsidiary will not be able to make cash available to us.
Foreign exchange risks may adversely affect our results, and the dollar value of dividends payable to ADS holders.
Most South American currencies in which we and our subsidiaries operate have been subject to large devaluations and appreciations against the dollar and may be subject to significant fluctuations in the future.
Historically, a significant portion of our consolidated indebtedness has been denominated in dollars and, although a substantial portion of our revenues are linked to dollars, we generally have been and will continue to be materially exposed to fluctuations of our local currencies against the dollar because of time lags and other limitations to peg our tariffs to the dollar.
Because of this exposure, the cash generated by our subsidiaries can decrease substantially when local currencies devalue against the dollar. Future volatility in the exchange rate of the currencies in which we receive revenues or incur expenditures, may affect our financial condition and results from operations. For more information on the risks associated with foreign exchange rates, see “Item 11. Quantitative and Qualitative Disclosures About Market Risk.”
As of December 31, 2010, using financial rather than accounting conventions, Enersis’s total consolidated financial debt was $ 7,579 million (net of currency hedging instruments). Of this amount $ 2,243 million, or 29.6%, was denominated in dollars and $ 1,541 million in pesos. In addition to the dollar and the peso, our foreign currency denominated consolidated indebtedness included the equivalent of:
· $ 174 million in Argentine pesos;
· $ 1,590 million in reais;
· $ 0.3 million in euros;
· $ 1,581million in Colombian pesos; and
· $ 450 million in soles.
This totals an aggregate of $ 3,795 million in currencies other than dollars or pesos.
For the twelve-month period ended December 31, 2010, our operating revenues amounted to $ 15,870 million (before consolidation adjustments) of which:
· $ 1,007 million, or 6.4%, was denominated in dollars; and
· $ 2,691 million, or 16.9%, was linked in some way to the dollar.
In the aggregate, 23.3% of our operating revenues (before consolidation adjustments) was either denominated in dollars or linked to dollars through some form of indexation, while 16.3% were in pesos.
Revenues, before consolidation adjustments, in other currencies for the year ended December 31, 2010, included the equivalent of:
· $ 1,395 million in Argentine pesos;
· $ 4,822 million in reais;
· $ 2,597 million in Colombian pesos; and
· $ 776 million in soles.
Although we generate revenues and incur debt in these same currencies, we believe that we are subject to risk in terms of our foreign exchange exposure to these four currencies. The most material case is that of our Argentine generation companies, where most of our debt is denominated in dollars while our revenues are mostly in Argentine pesos.
Furthermore, trading of our common stock underlying ADS is conducted in pesos. Our depositary bank will receive cash distributions that we make with respect to the shares underlying the ADS in pesos. The depositary bank will convert such pesos to dollars at the then-prevailing exchange rate to make dividend and other distribution payments in respect of ADS. If the peso depreciates against the dollar, the value of the ADS and any dollar distributions ADS holders receive from the depositary bank will decrease.
We are involved in litigation proceedings.
We are currently involved in various litigation proceedings, which could result in unfavorable decisions or financial penalties against us, and we will continue to be subject to future litigation proceedings, which could have material adverse consequences to our business.
We are a party to a number of legal proceedings, some of which have been pending for several years. Some of these claims may be resolved against us. Our financial condition or results from operations could be adversely affected if certain material claims are resolved against us. See Note 22.2 of our audited Consolidated Financial Statements.
The values of our generation subsidiaries’ long-term energy supply contracts are subject to fluctuations in the market prices of certain commodities.
We have economic exposure to fluctuations in the market prices of certain commodities as a result of the long-term energy sales contracts we have entered into. We and our subsidiaries have material obligations as selling parties under long-term fixed-price electricity sales contracts. Prices in these contracts are indexed according to different commodities, exchange rate, inflation and the market price of electricity. During 2010, we did not carry out transactions in commodity derivative instruments to manage our exposure to commodity price fluctuations. For further discussion, please refer to “Item 11. Quantitative and Qualitative Disclosures about Market Risk-Commodity Price Risk.”
Our controlling shareholders may have conflicts of interest relating to our business.
Enel beneficially owns 92.1% of Endesa Spain, which in turn owns 60.6% of Enersis’ share capital. Our controlling shareholders have the power to determine the outcome of most material matters that require shareholders’ votes, such as the
election of the majority of our board members and, subject to contractual and legal restrictions, the distribution of dividends. Our controlling shareholders also can exercise influence over our operations and business strategy. Their interests may in some cases differ from those of our other shareholders. Enel and Endesa Spain conduct their business in South America through us as well as through entities in which we do not have an equity interest.
Environmental regulations in the countries in which we operate and other factors may cause delays or impede the development of new projects, as well as increase our costs of operations.
Our operating subsidiaries are also subject to environmental regulations which, among other things, require us to perform environmental impact studies for future projects and obtain permits from both local and national regulators. Approval of these environmental impact studies may take longer than originally planned, and also, may be withheld by governmental authorities. Also, local communities, ethnic or environmental activists may intervene during the approval process in order to prevent the project’s development. They may also seek injunctive or other relief, with negative implications for us if they should succeed with their claims.
In addition to environmental matters, there are other factors that may adversely affect our ability to build new facilities, including delays in obtaining regulatory approvals, shortages or increases in the price of equipment, materials or labor, strikes, adverse weather conditions, natural disasters, accidents or other unforeseen events, and the inability to obtain financing at affordable rates.
In addition, delays or modifications to any proposed project and laws or regulations may change or be interpreted in a manner that could adversely affect our operations or our plans for companies in which we hold investments. See “Item 4. Information on the Company — B. Business Overview — Electricity Industry Regulatory Framework.”
The relative illiquidity and volatility of Chilean securities markets could adversely affect the price of our common stock and ADS.
Chilean securities markets are substantially smaller and less liquid than the major securities markets in the United States. In addition, Chilean securities markets may be affected materially by developments in other emerging markets. The low liquidity of the Chilean market may impair the ability of holders of ADS to sell shares of our common stock withdrawn from the ADS program into the Chilean market in the amount and at the price and time they wish to do so.
Lawsuits against us brought outside of Chile or complaints against us based on foreign legal concepts may be unsuccessful.
All of our assets are located outside of the United States. All of our directors and officers reside outside of the United States and most of their assets are located outside the United States as well. If any shareholder were to bring a lawsuit against our directors, officers or experts in the United States, it may be difficult for them to effect service of legal process within the United States upon these persons or to enforce against them, in United States or Chilean courts, judgments obtained in United States courts based upon the civil liability provisions of the federal securities laws of the United States. In addition, there is doubt as to whether an action could be brought successfully in Chile on the basis of liability based solely upon the civil liability provisions of the United States federal securities laws.
New share issuances might not have the rights granted by former Chapter XXVI.
The Chilean Central Bank Decision 1333-01-070510 adopted on May 10, 2007 extended the effects of the former Chapter XXVI to capital increases approved after April 18, 2001. Under the former Chapter XXVI and the Foreign Investment Contracts, the Chilean Central Bank agreed to grant access to the formal exchange market to convert pesos into dollars (See “Item 10. Additional Information. D — Exchange Rate Controls” for further detail).
Enersis formally requested permission from the Central Bank to enter into a new Foreign Investment Contract to include its capital increase approved by Enersis’ shareholders’ meeting held on March 31, 2003, which was granted by the Central Bank on September 7, 2007, subject to the execution and delivery of a new Foreign Investment Contract, dated September 24, 2008. Nevertheless, the Central Bank’s approval, aimed at extending the effects of the former Chapter XXVI to the capital increase approved in March 31, 2003, is subject to the condition that Enersis inform the Central Bank with respect to the measures adopted in connection with the issuance of new shares prior to such future capital increase in order to differentiate new shares from the shares issued previously under the former Chapter XXVI and enable shareholders to obtain relevant information about such differences. If Enersis does not comply with this condition, the Central Bank could revoke its approval and the benefits granted to the shares issued in the last capital increase of Enersis by the former Chapter XXVI. It is not certain that additional Chilean restrictions applicable to the holders of ADRs, the disposition of underlying shares of
common stock or the repatriation of the proceeds from such disposition will not be imposed in the future, nor can there be any assessment of the duration or impact of such restrictions if imposed.
Item 4. Information on the Company
A. History and Development of the Company.
History
Enersis was originally organized as Compañía Chilena Metropolitana de Distribución Eléctrica S.A., as recorded in a public deed on June 19, 1981. The existence of our company was authorized, and its bylaws were approved, pursuant to Resolution 409-S on July 17, 1981, issued by the Chilean SVS. The bylaws have been amended subsequently. The existence of our company under its current name, Enersis S.A., or Enersis, dates back to August 1, 1988. Enersis is a publicly held limited liability stock company domiciled in Santiago, Chile, and operates under Chilean law and regulations.
Street address: | Santa Rosa 76, Santiago, Código Postal 8330099, Chile. |
Telephone: | (562) 353-4639 |
Fax: | (562) 378-4789 |
Web Site: | www.enersis.cl |
The Company’s authorized representative in the United States of America is Puglisi & Associates, whose contact information is:
Street address: | 850 Library Avenue, Suite 204, Newark, Delaware 19711 |
Telephone: | 1 (302) 738-6680 |
We are an electric utility company engaged, through our subsidiaries and affiliates, in the generation, transmission and distribution of electricity businesses in Chile, Argentina, Brazil, Colombia and Peru.
We are one of the largest publicly listed companies in the electricity sector in South America. We trace our origin to Compañía Chilena de Electricidad Ltda., or CCE, which was formed in 1921 as a result of the merger of Chilean Electric Tramway and Light Co., founded in 1889, and Compañía Nacional de Fuerza Eléctrica, with operations dating back to 1919. In 1970, the Chilean government nationalized CCE. In 1981, CCE’s operations were divided into one generation company, the current AES Gener S.A. (Gener), and two distribution companies, one with a concession in the Valparaíso Region, the current Chilquinta S.A., and the other with a concession in the Santiago metropolitan region, Compañía Chilena Metropolitana de Distribución Eléctrica S.A. From 1982 to 1987, the Chilean electric utility sector went through a process of re-privatization. On August 1, 1988, Compañía Chilena Metropolitana de Distribución Eléctrica S.A. changed its name to Enersis S.A. and became the new parent company of Distribuidora Chilectra Metropolitana S.A., later renamed Chilectra S.A. In the 1990s, we diversified into electricity generation and transmission through our increasing equity stakes in Endesa Chile. We began our international operations in 1992 with the investment in Edesur, an Argentine electricity distribution company. That same year, Endesa Chile, which at that time was not our subsidiary, also started its international operations with its investment in Endesa Costanera, an electricity generation company. We then expanded primarily into electricity generation, transmission and distribution businesses in four South American countries: Argentina, Brazil, Colombia and Peru. We remain focused on the electricity sector, although we have small operations in other businesses that represent less than 2.0% of our consolidated assets, in the aggregate.
In 2005, Endesa Brasil was formed as a company to manage all generation, transmission and distribution assets that Endesa Latinoamérica, S.A., or “Endesa Latinoamérica,” (formerly known as Endesa Internacional, a subsidiary of Endesa Spain), Enersis, Endesa Chile and Chilectra held in Brazil; namely, through Ampla, Endesa Fortaleza, CIEN, Cachoeira Dourada and Coelce. Enersis began consolidating Endesa Brasil in October 2005. As of December 31, 2010, Enersis directly and indirectly controlled 54.3% of Endesa Brasil’s share capital.
In order to optimize taxes, simplify the organizational structure and reduce corporate costs, on April 2006, Enersis decided to merge Elesur S.A. (Elesur) and Chilectra in Chile. As a consequence of this merger, Elesur absorbed Chilectra; the surviving company retained the name of Chilectra.
In order to achieve synergies in Peru, in 2006, we merged Edegel and Etevensa (60% owned by Endesa Spain), a 457 MW thermoelectric generation company.
In September 2007, we merged our generation subsidiaries in Colombia, Emgesa and Betania, resulting in a new company which retained the name Emgesa. Following the merger, as of December 31, 2010, Enersis indirectly controlled 16.1% of Emgesa’s share capital. Pursuant to the terms of a shareholders agreement with another Endesa Spain subsidiary, we control and, therefore, consolidate Emgesa through Endesa Chile.
In February 2009, Codensa, our Colombian distribution subsidiary, acquired approximately 49% of DECA for Ch$ 23.7 billion. The remaining 51% was acquired by Empresa de Energía de Bogotá (EEB). Codensa and EEB jointly control DECA. On March 13, 2009, DECA acquired 82.3% of Empresa de Energía de Cundinamarca S.A (EEC), a Colombian distribution company, for Ch$ 48.5 billion.
On March 26, 2007, Spanish company Acciona, S.A. (Acciona) and Enel, executed an agreement for the joint management of Spanish company, Endesa Spain. The latter, through its Spanish subsidiary Endesa Latinoamérica, holds 60.6% of the share capital of Enersis. On February 20, 2009, Acciona and Enel reached an agreement whereby Acciona would transfer directly and indirectly to Enel Energy Europe S.L.U., wholly owned by Enel, its 25.0% shareholding in Endesa Spain. On June 25, 2009, the transaction was completed, making Enel the ultimate controller of Enersis by virtue of its 92.1% shareholding in Endesa Spain.
Enel is a publicly-traded company headquartered in Italy, primarily engaged in the energy sector, with presence in 40 countries over 4 continents, and has around 95,000 MW of net installed capacity. It provides service to more than 61 million clients through its electricity and gas businesses.
In October 2009, Endesa Chile purchased an additional 29.4% of Edegel from Generalima, a Peruvian indirect subsidiary of Endesa Spain. With this transaction, Endesa Chile increased its economic interest in Edegel from 33.1% to 62.5% and in turn, our economic interest increased to 37.5%. In the same month, we acquired an additional 24.0% of the share capital of our Peruvian subsidiary, Edelnor, increasing our direct and indirect ownership stake in Edelnor from 33.5% to 57.5%.
As of December 31, 2010, we had 14,833 MW of installed capacity with 195 power units in the five countries in which we operate, 13.3 million distribution customers covering approximately 50 million inhabitants, consolidated assets of $ 27.8 billion and our operating revenues were $12.8 billion.
Recent Developments
In December 2010, Buenos Aires experienced unusual meteorological conditions, with the most severe heat wave in the last 58 years lasting nine days with temperatures above 33° Celsius. These conditions resulted in increased electrical consumption, principally due to the use of air conditioning and ventilation systems. During the heat wave, Edesur experienced above-average disruptions in the delivery of electricity to its customers and longer periods of power restoration. As a result of these power cuts, on February 14, 2011, the Argentine Government fined a number of electricity distribution companies, including Edesur. Edesur was fined $ 16.2 million, of which $ 14.9 million are expected to compensate end users through discounts on future invoices. Edesur plans to appeal these fines.
Investments, Capital Expenditures and Divestitures
We coordinate the overall financing strategy, including terms and conditions of borrowings by, and intercompany advances to, our subsidiaries to optimize debt and liquidity management. Our operating subsidiaries independently plan capital expenditure financed by internally generated funds or direct financings. One of our goals is to focus on investments that will provide long-term benefits, such as energy loss reduction projects. Additionally, by focusing on Enersis as a whole and seeking to provide services across the group of companies, we aim to reduce investments at the individual subsidiary level in items such as procurement, telecommunication and information systems. Although we have considered how these investments will be financed as part of the Company’s budget process, we have not committed to any particular financing structure, and investments will depend on the market conditions at the time the cash flows are needed.
Our investment plan is flexible enough so as to adapt to changing circumstances by giving different priorities to each project in accordance with profitability and strategic fit. Investment priorities are currently focused on developing the capacity plan in Chile and Colombia, to guarantee adequate levels of quality of supply and to manage environmental issues.
For the 2011-2015 period, we expect to make capital expenditures of Ch$ 3,206 billion in our controlled subsidiaries, of which Ch$ 687 billion corresponds to investments currently in progress (Ch$ 76 billion in Bocamina II and Ch$ 611 billion in El Quimbo). We anticipate that we will also spend Ch$ 1,837 billion in the maintenance of our distribution network and in our other businesses, Ch$ 592 billion in the maintenance of existing generation plants and Ch$ 90 billion in the studies required
to develop other potential generation projects that are in different stages of progress, including Los Cóndores, Neltume, Choshuenco, HidroAysén, Punta Alcalde and Piruquina in Chile and Curibamba in Perú. For further detail regarding these projects, please see “Item 4 D. Property, Plants and Equipment-Projects under Development.”
The table below sets forth the capital expenditures incurred by our subsidiaries in 2008, 2009 and 2010 and the expected capital expenditures for the 2011-2015 period.
|
| Capital Expenditure (1) |
| ||||||
|
| (in million of Ch$) |
| ||||||
|
| 2008 |
| 2009 |
| 2010 |
| 2011-2015 |
|
Electricity Generation/Transmission |
| 363,698 |
| 395,107 |
| 193,689 |
| 1,368,333 |
|
Electricity Distribution |
| 504,040 |
| 394,099 |
| 440,465 |
| 1,812,575 |
|
Other Businesses |
| 8,980 |
| 12,108 |
| 5,206 |
| 24,709 |
|
|
|
|
|
|
|
|
|
|
|
Total |
| 876,718 |
| 801,314 |
| 639,360 |
| 3,205,617 |
|
(1) Capex figures represent accrued investments for each year, except for future projections.
Capital Expenditures 2008, 2009 and 2010
Electricity Generation
Our generation capital expenditures totaled Ch$ 194 billion in 2010, of which Ch$ 116 billion were incurred in Chile and Ch$ 77 billion abroad. In 2009, these expenditures aggregated Ch$ 395 billion, of which Ch$ 313 billion were incurred in Chile and the rest abroad. In 2008, generation capital expenditures aggregated Ch$ 364 billion, of which Ch$ 252 billion were incurred in Chile and the rest abroad.
Investments in Chile
In 2010, we incurred total capital expenditures of Ch$ 116 billion. The main investments during 2010 were related to the construction of the Bocamina II project, which is still in progress. Ch$ 70 billion was accrued in 2010 in connection with this project. It is estimated that the total investment will be Ch$ 400 billion. We also invested Ch$ 27 billion in maintenance of existing installed capacity and Ch$ 19 billion in other minor projects.
In 2009, we incurred total capital expenditures of Ch$ 313 billion. The main investments carried out during 2009 were: the construction of the 60 MW Canela II wind farm (Ch$ 44 billion was accrued in 2009 and the total investment was Ch$ 90 billion); the Quintero thermal plant project (Ch $33 billion was accrued in 2009, and the total investment was approximately Ch$ 90 billion); and the partial construction of Bocamina II, which is still in progress (Ch $152 billion was accrued in 2009, and the total investment is estimated at Ch$ 400 billion). We also invested Ch$ 48 billion in maintenance of existing installed capacity and Ch$ 35 billion in other minor projects.
In 2008, we incurred total capital expenditures of Ch$ 252 billion. The main investments carried out during 2008 were: the construction of the Canela II wind farm (Ch$ 45 billion was accrued in 2008); the Quintero thermal-plant project (Ch$ 41 billion was accrued in 2008); the construction of Bocamina II, which is still in progress (Ch$ 94 billion was accrued in 2008); and the construction of the Ojos de Agua pass-through hydroelectric plant that has an installed capacity of 9 MW(Ch$ 5 billion was accrued in 2008, and the total investment was Ch$ 15 billion). We also invested Ch$ 35 billion in maintenance of existing installed capacity and Ch$ 32 billion in other minor projects.
Investments Abroad
In 2010, we incurred total capital expenditures abroad of Ch$ 77 billion. Our main investment during 2010 related to commencement of construction of our 400 MW El Quimbo hydroelectric power plant in Colombia. Ch$ 16 billion was accrued in 2010 for this project. It is estimated that the total investment will be Ch$ 630 billion. We also invested Ch$ 60 billion in maintenance of existing installed capacity, mainly in Argentina, Colombia and Peru, and Ch$ 1 billion in other minor projects.
In 2009, we incurred total capital expenditures of Ch$ 82 billion. Our main investment during 2009 was the installation of a 189 MW turbine at the Santa Rosa plant in Peru. Ch$ 10 billion was accrued in 2009 for this project. The total
investment was Ch$ 55 billion. We also invested Ch$ 67 billion in maintenance of existing installed capacity, mainly in Argentina and Peru, and Ch$ 5 billion in other minor projects.
In 2008, we incurred total capital expenditures of Ch$ 111 billion. Our main investment during 2008 was the installation of the new turbine at the Santa Rosa power plant. Ch$ 45 billion was accrued in 2008 for this project. We also invested Ch$ 60 billion in maintenance of existing installed capacity, mainly in Argentina and Colombia, and Ch$ 6 billion in other minor projects.
Electricity Distribution
In 2010, we incurred total capital expenditures of Ch$ 440 billion, principally to better serve the demographic demand growth, new clients, and reduce energy losses. Of the total capital expenditures, Ch$ 36 billion was incurred in Chile and Ch$ 404 billion abroad. In 2009, we incurred total capital expenditures of Ch$ 394 billion in order to serve new clients, reduce energy losses, maintain equipment and lines, and improve service, of which Ch$ 46 billion was incurred in Chile and the rest abroad. In 2008, we incurred total capital expenditures of Ch$ 504 billion, of which Ch$ 59 billion was incurred in Chile and the rest abroad. We detail below how these amounts were allocated for 2008, 2009 and 2010, respectively.
Investments in Chile
In 2010, Chilectra invested Ch$ 36 billion. Chilectra made progress on its investment plan for meeting the growth in energy demand and providing an increasingly reliable service to all its customers, as well as supporting service quality, safety and energy loss-prevention projects.
The company continued with the upgrade from 12 kV to 23 kV by incorporating a capacity of 24 MVA in the medium tension lines. In 2010, four new substations started operations: Apoquindo, Andes, Club Hípico and La Reina. We also strengthened the 110 kV lines that connect the substations Vitacura, La Dehesa and Recoleta with the transmission line.
Chilectra also continued to develop its intelligent networks plan, which integrates electricity infrastructure with new electronic technologies, information systems and communications.
During 2009, Chilectra invested Ch$ 46 billion, allocating a considerable portion of investments to projects related to demand growth, improving service quality and energy loss prevention projects. During 2008, Chilectra made investments of Ch$ 59 billion, mainly in projects related to improving service quality, environment, safety, and information and remote control systems.
Investments Abroad
In Argentina, during 2010, Edesur invested Ch$ 53 billion. Among these investments were important electricity infrastructure works, including the elevation of a high voltage line between Endesa Costanera and the Bosques substation and continued progress on medium-term projects to expand the Quilmes and Don Bosco power substations that will benefit 380,000 customers from the districts of Avellaneda, Quilmes, Florencio Varela and Berazategui beginning in 2011.
We also continued with the renovation and the construction of 1,079 kilometers of electrical networks and the installation of 789 new medium/low voltage transformers.
During 2009, Edesur invested Ch$ 53 billion, mainly in connection with important infrastructure works, such as the capacity increase of the Perito Moreno substation, among others.
During 2008, Edesur invested Ch$ 81 billion, in order to maintain quality service and protect public safety. Toward this end, it undertook several projects, such as the capacity increase in the Héroes de Malvinas substation and the construction of a new substation in Glew, among others.
In Brazil in 2010, total investments were Ch$ 239 billion, an increase of 28% with respect to 2009.
In particular, Ampla’s investments were Ch$ 114 billion, mainly related to projects for reducing energy losses. Coelce invested Ch$125 billion, with a special focus on “Luz para todos,” a project sponsored by the State of Ceará, that connected 16,865 new customers to the low-tension electricity network. This project involved an investment of Ch$ 32 billion as of December 31, 2010.
As a result of investments in 2009 and 2010, Ampla’s energy losses decreased by 0.7 percentage points to 20.5% in 2010 from 21.2% in 2009.
In 2008, Ampla invested in the improvement of its distribution network and obtained an 8.7% rating in 2008 (up from 5.5% in 2007) in terms of quality of energy supply. In addition, due to the investments made during 2008, Coelce connected approximately 148,000 new customers to the low-tension electric power network.
In Colombia in 2010, we invested Ch$ 80 billion, mainly focused on expansion projects for servicing new customers and demand growth, as well as improving quality of energy supplies.
Among the Ch$ 76 billion of investments made by Codensa were the construction of the new 120 MVA Florida substation that will serve the area of El Dorado airport and the town of Engativá and the expansion of the Fontibón and Sesquilé substations.
In EEC, capital expenditures were incurred to improve the quality of service and reduce energy losses. In 2010, the amount invested was Ch$ 4 billion. Ch$ 2 billion was invested in 2009.
During 2009, Codensa invested Ch$ 69 billion, mainly related to expansion projects for servicing new customers and demand growth, and for incorporating equipment and renovating distribution networks in order to continue improving the continuity and quality of energy supplies.
During 2008, Codensa invested Ch$ 80 billion, mainly to improve the reliability of distribution systems in Bogotá, Cundinamarca and the NIS
In Peru in 2010, Edelnor invested Ch$ 33 billion, focused mainly on demand growth, service quality and security in medium and low-tension feeders and energy loss programs.
According to the secondary transmission investment plan, prepared together with the regulator, Osinergmin, the construction of the Zárate substation was completed in 2010 and started its operation in March 2011. The construction of the UNI and Jicamarca substations began in the first quarter of 2010 and are expected to begin their operations in October 2012 and in November 2011, respectively.
Edelnor also continued to improve the availability of electricity for new settlement projects, reduce commercial losses, improve street lighting and improve infrastructure of customer service centers.
In 2009 Edelnor invested Ch$ 37 billion, focused mainly on the expansion and reinforcement of low and medium-tension networks and the increase in capacity of the transforming substations.
In 2008, Edelnor invested Ch$ 44 billion, primarily in expanding its networks and increasing its medium- and low-tension feeders to satisfy demand for electricity that increased 7.8% from 2007 to 2008.
Investments currently in progress
In general terms, projects are expected to be financed with resources to be provided by external financing as well as internally generated funds for each of the companies described.
Investments in Chile
Our main investment currently in progress in Chile is the construction of the Bocamina II steam/coal-fired power plant, which is the second unit of our Bocamina power plant. This project is located in the Coronel district in the Bío-Bío region. Its installed capacity is estimated at 370 MW and the start-up is planned for the second half of 2011. The total investment is approximately Ch$ 400 billion.
Investments in Other Countries
Our main project being developed outside Chile is our 400 MW El Quimbo hydroelectric plant in Colombia. The principal civil works and equipment supply and assembly contracts have been awarded. The total estimated investment is approximately Ch$ 630 billion.
Divestitures
During the last quarter of 2009, the Board of Directors of Enersis authorized the sale of Compañía Americana Multiservicios (CAM) and Synapsis because they were considered “non-core” businesses.
On December 20, 2010, the Board of Directors of Enersis accepted the offer received for its total stake in CAM presented by Graña y Montero S.A.A., a Peruvian company, which offered $ 20 million in cash. The closing took place on February 24, 2011.
At the same meeting, the Board of Directors of Enersis accepted the offer received for its total stake in Synapsis presented by Riverwood Capital L.P., a private equity fund located in the United States, which offered $ 52 million in cash. The closing took place on March 1, 2011.
B. Business Overview.
We are a publicly held limited liability stock company with consolidated operations in Chile, Argentina, Brazil, Colombia and Peru. Our core business segments are electricity generation, transmission, and distribution. We also participate in other activities which are not part of our core business. Since these non-core activities represent less than 1% of our 2010 operating income, we do not report them as a separate business segment for purposes of this discussion, or under IFRS.
Revenues by Business Segment
|
| Year ended December 31, |
| ||||||
|
| 2008 (1) |
| 2009 |
| 2010 |
| % Change |
|
|
| (in million of Ch$) |
| ||||||
Generation Business Segment |
|
|
|
|
|
|
|
|
|
Endesa Chile and subsidiaries(Chile) |
| 1,609,158 |
| 1,373,231 |
| 1,345,371 |
| (2.0 | )% |
Endesa Costanera (Argentina) |
| 240,087 |
| 231,421 |
| 295,231 |
| 27.6 | % |
El Chocón (Argentina) |
| 44,141 |
| 65,298 |
| 57,173 |
| (12.4 | )% |
Cachoeira Dourada (Brazil) |
| 147,105 |
| 88,300 |
| 115,663 |
| 31.0 | % |
Endesa Fortaleza (Brazil) |
| 72,776 |
| 138,595 |
| 150,371 |
| 8.5 | % |
CIEN (Brazil) |
| 110,163 |
| 97,961 |
| 98,909 |
| 1.0 | % |
Emgesa (Colombia) |
| 401,470 |
| 500,964 |
| 507,516 |
| 1.3 | % |
Edegel (Peru) |
| 208,497 |
| 213,625 |
| 211,263 |
| (1.1 | )% |
Less: Intercompany Transactions |
| — |
| (1,037 | ) | (904 | ) | (12.8 | )% |
Total |
| 2,833,397 |
| 2,708,358 |
| 2,780,593 |
| 2.7 | % |
|
|
|
|
|
|
|
|
|
|
Distribution Business Segment |
|
|
|
|
|
|
|
|
|
Chilectra and subsidiaries (Chile) |
| 1,083,673 |
| 1,089,515 |
| 1,016,997 |
| (6.7 | )% |
Edesur (Argentina) |
| 334,164 |
| 327,088 |
| 295,539 |
| (9.6 | )% |
Edelnor (Peru) |
| 254,641 |
| 302,295 |
| 307,159 |
| 1.6 | % |
Ampla (Brazil) |
| 973,759 |
| 1,012,342 |
| 1,046,387 |
| 3.4 | % |
Coelce (Brazil) |
| 763,592 |
| 767,993 |
| 940,654 |
| 22.5 | % |
Codensa (Colombia) |
| 661,474 |
| 741,168 |
| 785,890 |
| 6.0 | % |
Total |
| 4,071,303 |
| 4,240,401 |
| 4,392,626 |
| 3.6 | % |
|
|
|
|
|
|
|
|
|
|
Less: Consolidation Adjustments and Other Businesses. |
| (324,755 | ) | (476,703 | ) | (609,638 | ) | 27.9 | % |
Total |
| 6,579,945 |
| 6,472,056 |
| 6,563,581 |
| 1.4 | % |
(1) Due to internal reclassifications introduced during 2010, some figures may differ from those presented in our Form 20-F for 2009. Differences in figures are not significant and do not affect the consolidated net income previously disclosed in our Form 20-F for 2009.
For further information related to operating revenues and total income by business segment, see “Item 5. Operating and Financial Review and Prospects — A. Operating Results” and note 33.2 to our Consolidated Financial Statements.
Electricity Generation Business Segment
As of December 31, 2010, electricity generation represented 39% of our operating revenues and 60% of our operating income, in both cases before consolidation adjustments.
Our consolidated physical sales for 2010 were 63,431 GWh and our production was 56,699 GWh, 4.9% and 2.8% lower than in 2009, respectively. The total installed capacity in 2010 was 14,833 MW as compared to 14,851 MW in 2009.
Our electricity generation business is conducted primarily through Endesa Chile, which has operating subsidiaries in Chile, Argentina, Colombia and Peru. Since October 2005, the generation, transmission and distribution businesses in Brazil have been managed through our subsidiary, Endesa Brasil. Endesa Chile also holds an equity interest in Endesa Brasil.
The following tables summarize the information relating to Enersis’ electricity generation:
PHYSICAL DATA PER COUNTRY
|
| As of December 31, each year |
| ||||
|
| 2008 |
| 2009 |
| 2010 |
|
Chile |
|
|
|
|
|
|
|
Number of generating facilities (1)(2) |
| 27 |
| 29 |
| 28 |
|
Installed capacity (MW) (3) (2) |
| 5,283 |
| 5,650 |
| 5,611 |
|
Energy generated (GWh) (4) |
| 21,267 |
| 22,239 |
| 20,914 |
|
Energy sales (GWh) |
| 21,532 |
| 22,327 |
| 21,847 |
|
Argentina |
|
|
|
|
|
|
|
Number of generating facilities (1) |
| 5 |
| 5 |
| 5 |
|
Installed capacity (MW) (3) |
| 3,652 |
| 3,652 |
| 3,652 |
|
Energy generated (GWh) (4) |
| 10,480 |
| 11,955 |
| 10,940 |
|
Energy sales (GWh) |
| 11,098 |
| 12,405 |
| 11,378 |
|
Brazil |
|
|
|
|
|
|
|
Number of generating facilities (1) |
| 2 |
| 2 |
| 2 |
|
Installed capacity (MW) (3) |
| 987 |
| 987 |
| 987 |
|
Energy generated (GWh) (4) |
| 3,379 |
| 3,319 |
| 5,095 |
|
Energy sales (GWh) |
| 7,088 |
| 6,869 |
| 6,790 |
|
Colombia |
|
|
|
|
|
|
|
Number of generating facilities (1) |
| 11 |
| 11 |
| 12 |
|
Installed capacity (MW) (3) |
| 2,895 |
| 2,895 |
| 2,914 |
|
Energy generated (GWh) (4) |
| 12,905 |
| 12,674 |
| 11,283 |
|
Energy sales (GWh) |
| 16,368 |
| 16,806 |
| 14,817 |
|
Peru |
|
|
|
|
|
|
|
Number of generating facilities (1) (2) |
| 9 |
| 9 |
| 9 |
|
Installed capacity (MW) (3) (2) |
| 1,467 |
| 1,667 |
| 1,668 |
|
Energy generated (GWh) (4) |
| 8,102 |
| 8,163 |
| 8,466 |
|
Energy sales (GWh) |
| 8,461 |
| 8,321 |
| 8,598 |
|
Total |
|
|
|
|
|
|
|
Number of generating facilities (1) |
| 54 |
| 56 |
| 56 |
|
Installed capacity (MW) (3) |
| 14,284 |
| 14,851 |
| 14,833 |
|
Energy generated (GWh) (4) |
| 56,133 |
| 58,349 |
| 56,699 |
|
Energy sales (GWh) |
| 64,546 |
| 66,728 |
| 63,431 |
|
(1) For details on generation facilities, see “Item 4D. Property Plants and Equipment.”
(2) Quintero and Canela II generation in Chile have been consolidated since July and December 2009, respectively; Santa Rosa TG8’s generation in Peru since November 2009; and San Antonio mini hydro plant in Colombia since May 2010.
(3) Total installed capacity is defined as the maximum MW capacity in generation units, under specific technical conditions and characteristics, in most cases confirmed by satisfaction guarantee tests performed by equipment suppliers. Figures may differ from installed capacity declared to governmental authorities and customers in each country, according to criteria defined by such authorities and relevant contracts.
(4) Energy generated defined as total generation minus own power plant consumption and technical energy losses.
In the electricity industry, it is common to segment the business into hydroelectric and thermoelectric generation, because each method of generation has significantly variable costs. Thermoelectric generation requires the purchase of fuel rather than the use of water from reservoirs or rivers, thereby increasing the variable costs of generation. Of our total consolidated generation in 2010, 59% was from hydroelectric sources, 40% came from thermal sources, and wind energy represented less than 1%.
The following table summarizes Enersis’ consolidated generation by type of energy:
|
| Year ended December 31, |
| ||||||||||
|
| 2008 |
| 2009 |
| 2010 |
| ||||||
|
| (GWh) |
| % |
| (GWh) |
| % |
| GWh |
| % |
|
Hydroelectric |
| 35,605 |
| 63.5 |
| 37,730 |
| 64.7 |
| 33,689 |
| 59.4 |
|
Thermal |
| 20,479 |
| 36.5 |
| 20,563 |
| 35.2 |
| 22,867 |
| 40.3 |
|
Other generation (1) |
| 49 |
| 0.1 |
| 56 |
| 0.1 |
| 143 |
| 0.3 |
|
Total generation |
| 56,133 |
| 100.0 |
| 58,349 |
| 100.0 |
| 56,699 |
| 100.0 |
|
(1) Other generation refers to the generation from the wind farm Canela and Canela II.
In general, in the countries in which we operate, the potential for contracting electricity is related to the volume of electricity demand. Customers identified as small volume regulated customers, such as residential customers subject to government regulated electricity tariffs, must purchase electricity directly from a distribution company. These distribution companies, which purchase large amounts of electricity for small volume residential customers, generally enter into contractual agreements with generators at a regulated tariff price. Those identified as large volume industrial customers also enter into contractual agreements with energy suppliers. However, such large volume industrial customers are not subject to the regulated tariff price. Instead, these customers are allowed to negotiate the price of energy with generators based on the characteristics of the service required. Finally, the pool market, where energy is normally sold at the spot price, is not carried out through contractual agreements but instead complies with pool market operations.
The following table contains information regarding Enersis’ consolidated sales of electricity by type of customer for each of the periods indicated:
ENERSIS CONSOLIDATED PHYSICAL SALES BY TYPE OF CUSTOMER (GWh)
|
| Year ended December 31, |
| ||||||||||
|
| 2008 |
| 2009 |
| 2010 |
| ||||||
|
| Sales |
| % of Sales |
| Sales |
| % of Sales |
| Sales |
| % of Sales |
|
Regulated customers |
| 28,532 |
| 44.3 |
| 29,600 |
| 44.4 |
| 31,530 |
| 49.7 |
|
Unregulated customers |
| 18,096 |
| 27.8 |
| 16,526 |
| 24.8 |
| 15,535 |
| 24.5 |
|
Electricity pool market sales |
| 17,917 |
| 27.8 |
| 20,602 |
| 30.9 |
| 16,366 |
| 25.8 |
|
Total electricity sales |
| 64,546 |
| 100.0 |
| 66,728 |
| 100.0 |
| 63,431 |
| 100.0 |
|
The specific energy consumption limit (measured in GWh) for regulated and unregulated customers is country specific. Moreover, regulatory frameworks often require that regulated distribution companies have contracts to support their commitments to small volume customers and also determine which customers can purchase energy in electricity pool markets.
The following table contains information regarding Enersis physical sales of electricity per customer segment:
ENERSIS CONSOLIDATED PHYSICAL SALES PER CUSTOMER PRICE SEGMENT (GWh) (1)
|
| Year ended December 31, |
| ||||||||||
|
| 2008 |
| 2009 |
| 2010 |
| ||||||
|
| Sales |
| % of |
| Sales |
| % of |
| Sales |
| % of |
|
Contracted sales |
| 46,629 |
| 72.2 |
| 46,126 |
| 69.1 |
| 47,065 |
| 74.2 |
|
Non-contracted sales |
| 17,917 |
| 27.8 |
| 20,602 |
| 30.9 |
| 16,366 |
| 25.8 |
|
Total electricity sales |
| 64, 546 |
| 100.0 |
| 66,728 |
| 100.0 |
| 63,431 |
| 100.0 |
|
(1) Includes sales to distribution companies not backed by contracts in Chile and Peru.
Operations in Chile
We own and operate a total of 28 generation facilities in Chile, directly and through our subsidiaries Pehuenche, Pangue, San Isidro, Celta, Endesa Eco and our jointly controlled company GasAtacama. Of these generation facilities, 16 are hydroelectric, with a total installed capacity of 3,465 MW. This represents 61.7% of our total installed capacity in Chile. There are ten thermal facilities that operate with gas, coal or oil with a total installed capacity of 2,068 MW, representing 36.9% of our total installed capacity in Chile. There are two wind power facilities with 78 MW in the aggregate, representing 1.4% of our total installed capacity in Chile. All of our generation facilities are connected to the country’s central interconnected electricity systems, Sistema Interconectado Central, or the SIC, except for three power facilities (GasAtacama and two Celta units), which are connected to the northern Sistema Interconectado del Norte Grande, or the SING.
The following table sets forth the installed generation capacity for each of the Company’s Chilean subsidiaries:
INSTALLED CAPACITY PER SUBSIDIARY IN CHILE (MW)
|
| 2008 |
| 2009 |
| 2010 |
|
Endesa |
| 3,139 |
| 3,446 |
| 3,407 |
|
Pehuenche |
| 699 |
| 699 |
| 699 |
|
Pangue |
| 467 |
| 467 |
| 467 |
|
San Isidro |
| 379 |
| 379 |
| 379 |
|
Celta |
| 182 |
| 182 |
| 182 |
|
GasAtacama (1) |
| 390 |
| 390 |
| 390 |
|
Endesa Eco |
| 27 |
| 87 |
| 87 |
|
Total |
| 5,283 |
| 5,650 |
| 5,611 |
|
(1) Since 2008, we include 50% of GasAtacama’s installed capacity, our jointly-controlled company.
Our total electricity generation in Chile (including the SIC and the SING) reached 20,914 GWh in 2010, 6.0% lower than in 2009, and accounted for 35.8% of total electricity production in Chile during 2010.
The following table sets forth the electricity generation for each of our Chilean subsidiaries:
ELECTRICITY GENERATION IN CHILE (GWh)
|
| Year ended December 31, |
| ||||
|
| 2008 |
| 2009 |
| 2010 |
|
Endesa |
| 12,204 |
| 12,265 |
| 11,539 |
|
Pehuenche |
| 3,589 |
| 3,613 |
| 2,970 |
|
Pangue |
| 1,763 |
| 2,113 |
| 1,615 |
|
San Isidro |
| 1,289 |
| 1,616 |
| 2,157 |
|
Celta |
| 912 |
| 981 |
| 995 |
|
GasAtacama |
| 1,460 |
| 1,558 |
| 1,445 |
|
Endesa Eco |
| 49 |
| 94 |
| 192 |
|
Total |
| 21,267 |
| 22,239 |
| 20,914 |
|
Hydroelectric generation in 2010 was 15.1% lower than in 2009, explained by lower hydrology in 2010. At December 31, 2010, Chilean reservoir levels contained 2,198 GWh in lower potential energy than at December 31, 2009, a decrease of 38%. The main decrease was in the Endeas Chile’s Laja Reservoir where lower reservoir levels resulted in 1,122 GWh of lower potential energy. The reduced levels of the Laja Reservoir may pose problems for 2011 generation in the event that hydrology does not improve significantly.
The following table shows the potential energy in Chilean reservoirs:
|
| Year ended December 31, |
| ||||||
|
| 2008 |
| 2009 |
| 2010 |
| % Change |
|
|
| (GWh) |
| (GWh) |
| (GWh) |
| 2009 vs. 2010 |
|
Reservoir (company) |
|
|
|
|
|
|
|
|
|
Laja (Endesa Chile) |
| 3,107 |
| 3,045 |
| 1,923 |
| (37 | ) |
Maule (Colbún and Endesa Chile) |
| 1,111 |
| 957 |
| 789 |
| (18 | ) |
Colbún (Colbún) |
| 406 |
| 485 |
| 471 |
| (3 | ) |
Melado (Endesa Chile) |
| 9 |
| 13 |
| 6 |
| (56 | ) |
Chapo (Canutillar) |
| 266 |
| 372 |
| 93 |
| (75 | ) |
Ralco (Endesa Chile) |
| 398 |
| 484 |
| 207 |
| (57 | ) |
Invernada (Endesa Chile) |
| 296 |
| 314 |
| 33 |
| (89 | ) |
Pangue (Endesa Chile) |
| 11 |
| 10 |
| 10 |
| (4 | ) |
Rapel (Endesa Chile) |
| 60 |
| 76 |
| 28 |
| (63 | ) |
Total |
| 5,664 |
| 5,757 |
| 3,559 |
| (38 | ) |
Hydroelectric generation in Chile accounted for 60.4% of our total electricity generation in 2010 compared with 66.8% in 2009. Generation by type in Chile is shown in the following table:
HYDRO/THERMAL GENERATION IN CHILE (GWh)
|
| Year ended December 31, |
| ||||||||||
|
| 2008 |
| 2009 |
| 2010 |
| ||||||
|
| Generation |
| % |
| Generation |
| % |
| Generation |
| % |
|
Hydroelectric generation |
| 13,766 |
| 64.7 |
| 14,864 |
| 66.8 |
| 12,625 |
| 60.4 |
|
Thermal generation |
| 7,453 |
| 35.0 |
| 7,319 |
| 32.9 |
| 8,146 |
| 38.9 |
|
Other generation (1) |
| 49 |
| 0.2 |
| 56 |
| 0.3 |
| 143 |
| 0.7 |
|
Total generation |
| 21,267 |
| 100.0 |
| 22,239 |
| 100.0 |
| 20,914 |
| 100.0 |
|
(1) Other generation refers to the generation of the Canela and Canela II wind farms.
Our thermal electric generation facilities are either natural gas, LNG, coal or oil-fired. In order to satisfy our natural gas and transportation requirements, we enter into long-term gas contracts with suppliers who establish maximum supply amounts and prices and long-term gas transportation agreements with the pipeline companies, which are currently Gas Andes and Electrogas (an Endesa Chile related company). Since March 2008, all of Endesa Chile’s natural gas units can operate with natural gas or diesel and since December 2009, San Isidro, San Isidro 2 and Quintero can operate with LNG.
Because of the lack of Argentine natural gas since 2006, Endesa Chile has been using coal and diesel in an intensive manner, and LNG, more recently, has replaced our dependence on Argentine natural gas. Diesel consumption in 2008, 2009 and 2010 was 728,000 tons, 430,000 tons and 51,000 tons, respectively. On the other hand, coal consumption was 774,000 tons, 760,000 tons and 486,000 tons in 2008, 2009, and 2010, respectively. In 2010, Endesa Chile signed a coal supply contract for 2010 and 2011 with Carboex, a subsidiary of Endesa Spain. LNG consumption has been 206 million m³ and 1,035 million m³ in 2009 and 2010, respectively.
In May 2007, as part of a consortium with ENAP, Metrogas and British Gas, in which Endesa Chile’s participation is 20%, we agreed to the construction of the LNG re-gasification facility in Quintero Bay, in order to deal with the lack of Argentine natural gas. Partial commercial operations began in September 2009. In October 2010, the construction of the facilities was finished, and full commercial operations started on January 1, 2011.
Thermal Unit Quintero began partial commercial operations in July 2009 and full commercial operations in September 2009 using diesel fuel. Partial commercial operations burning LNG began in November 2009 and full commercial operations began in December 2009.
The main effects in the generation of Endesa Chile due to the incorporation of this terminal are as follows: i) San Isidro 2 increased its installed capacity from 353 MW to 399 MW; ii) San Isidro, San Isidro 2 and Quintero may generate with LNG, reducing the operating costs and the environmental impact due to the replacement of diesel fuel by LNG.
The electricity sales per system in Chile had an increase of 3.4% during 2010; sales in the SIC increased 4.2% and sales in the SING increased 1.0%, as is shown in the following table:
ELECTRICITY SALES PER SYSTEM IN CHILE (GWh)
|
| Year ended December 31, |
| ||||
|
| 2008 |
| 2009 |
| 2010 |
|
|
| Sales |
| Sales |
| Sales |
|
Electricity sales in the SIC |
| 39,594 |
| 39,401 |
| 41,061 |
|
Electricity sales in the SING |
| 13,219 |
| 13,657 |
| 13,792 |
|
Total electricity sales |
| 52,813 |
| 53,057 |
| 54,854 |
|
Our physical energy sales in Chile reached 22,327 GWh in 2009 and 21,847 GWh in 2010, which represent a 42.1% and 39.8% market share, respectively. The percentage of the energy purchases to satisfy our contractual obligations to third parties has increased from 2.3% in 2009 to 6.0% in 2010 as a result of the decrease in our generation.
The following table sets forth our electricity purchases and production in Chile:
PHYSICAL GENERATION AND PURCHASES IN CHILE (GWh)
|
| Year ended December 31, |
| ||||||||||
|
| 2008 |
| 2009 |
| 2010 |
| ||||||
|
| (GWh) |
| % |
| (GWh) |
| % |
| (GWh) |
| % |
|
Electricity generation |
| 21,267 |
| 96.8 |
| 22,239 |
| 97.7 |
| 20,914 |
| 94.0 |
|
Electricity purchases |
| 698 |
| 3.2 |
| 532 |
| 2.3 |
| 1,344 |
| 6.0 |
|
Total (1) |
| 21,965 |
| 100 |
| 22,772 |
| 100 |
| 22,257 |
| 100 |
|
(1) Electricity generation plus electricity purchases differ from electricity sales due to transmission losses, as power plant consumption and technical energy losses have already been deducted.
We supply electricity to the major regulated electricity distribution companies, large unregulated industrial firms (primarily in the mining, pulp and steel sectors) and the pool market. Commercial relationships with customers are usually governed by contracts. Supply contracts with distribution companies must be auctioned, are generally standardized and have an average term of ten years.
Supply contracts with unregulated customers (large industrial customers) are specific to the needs of each client and the conditions are agreed between both parties, reflecting competitive market conditions.
In 2008, 2009 and 2010, Endesa Chile (including GasAtacama) had 40, 44 and 59 customers respectively. In 2010, customers included 27 distribution companies in the SIC and in the SING, 29 unregulated industrial customers in the SIC and the SING and three minor commercial customers. The following table sets forth information regarding our sales of electricity in Chile by type of customer:
PHYSICAL SALES PER CUSTOMER PRICE SEGMENT
IN CHILE (GWh)
|
| Year ended December 31, |
| ||||||||||
|
| 2008 |
| 2009 |
| 2010 |
| ||||||
|
| Sales |
| % of |
| Sales |
| % of |
| Sales |
| % of |
|
Regulated customers |
| 12,166 |
| 56.5 |
| 11,966 |
| 53.6 |
| 13,840 |
| 63.3 |
|
Unregulated customers |
| 6,034 |
| 28.0 |
| 6,177 |
| 27.7 |
| 6,456 |
| 29.6 |
|
Electricity pool market sales |
| 3,331 |
| 15.5 |
| 4,183 |
| 18.7 |
| 1,551 |
| 7.1 |
|
Total electricity sales |
| 21,532 |
| 100.0 |
| 22,327 |
| 100.0 |
| 21,847 |
| 100.0 |
|
Our most significant supply contracts with regulated customers are with Chilectra S.A. (Chilectra), an Enersis subsidiary, and Compañía General de Electricidad S.A. (CGE), an unrelated company, the two largest distribution companies in Chile in terms of sales.
In March 2008, Chilectra and other distributors allocated the third long-term energy bid for 1,800 GWh for the period 2011-2021 and 1,500 GWh for the period 2022-2023, in both cases to Gener. In January 2009, Chilquinta, Saesa and CGE allocated the bid for 8,010 GWh, divided in four blocks (BB1, BB2, BB3 and BB4) to be delivered starting in January 2010 for 14, 12, 14 and 15 years, respectively. The energy allocated was 7,110 GWh and represented 88.7% of the bidders’ demand. The energy allocation per company and per block was as follows:
|
| BB1 - |
| BB2 - |
| BB3 - CGE |
| BB4 - |
| Total per |
|
Gener |
| 1,100 |
| — |
| — |
| — |
| 1,100 |
|
Endesa |
| 660 |
| — |
| — |
| 2,000 |
| 2,660 |
|
Campanario |
| — |
| 850 |
| 900 |
| — |
| 1,750 |
|
Monte Redondo |
| — |
| — |
| 100 |
| — |
| 100 |
|
Colbún |
| — |
| — |
| 1,500 |
| — |
| 1,500 |
|
|
|
|
|
|
|
|
|
|
|
|
|
Total allocated |
| 1,760 |
| 850 |
| 2,500 |
| 2,000 |
| 7,110 |
|
Total required |
| 1,760 |
| 850 |
| 2,700 |
| 2,700 |
| 8,010 |
|
% allocated |
| 100.0 | % | 100.0 | % | 92.6 | % | 74.1 | % | 88.7 | % |
In July 2009, CGE allocated the fourth long-term bid for 850 GWh per year, from 2010 to 2021, as follows:
|
| CGE |
|
Endesa |
| 400 |
|
Monte Redondo |
| 175 |
|
Emelda |
| 200 |
|
Eléctrica Puntilla |
| 75 |
|
|
|
|
|
Total allocated |
| 850 |
|
At a recent bid, jointly held by Chilectra and Chilquinta, Endesa was awarded with 50 GWh for 2013, 400 GWh for 2014, 1,250 GWh for 2015, and 1,700 GWh per year for the 2016-2026 period. These contracts end with 1,350 GWh in 2027. It is important to note that these energy contracts include a 10% variation in energy, so the energy supplied could reach 1,870 GWh per year. The breakdown by year and energy block is as follows:
|
|
|
| Years (amounts in GWh) |
| ||||||||||||||||||||||||||||
Company |
| Block |
| 2013 |
| 2014 |
| 2015 |
| 2016 |
| 2017 |
| 2018 |
| 2019 |
| 2020 |
| 2021 |
| 2022 |
| 2023 |
| 2024 |
| 2025 |
| 2026 |
| 2027 |
|
Chilectra |
| BB1 |
| — |
| 300 |
| 900 |
| 1,350 |
| 1,350 |
| 1,350 |
| 1,350 |
| 1,350 |
| 1,350 |
| 1,350 |
| 1,350 |
| 1,350 |
| 1,350 |
| 1,350 |
| 1,350 |
|
Chilquinta |
| BSE4 |
| 50 |
| 50 |
| 50 |
| 50 |
| 50 |
| 50 |
| 50 |
| 50 |
| 50 |
| 50 |
| 50 |
| 50 |
| 50 |
| 50 |
| — |
|
Chilquinta |
| BSE5 |
| — |
| 50 |
| 50 |
| 50 |
| 50 |
| 50 |
| 50 |
| 50 |
| 50 |
| 50 |
| 50 |
| 50 |
| 50 |
| 50 |
| — |
|
Chilquinta |
| BSE6 |
| — |
| — |
| 250 |
| 250 |
| 250 |
| 250 |
| 250 |
| 250 |
| 250 |
| 250 |
| 250 |
| 250 |
| 250 |
| 250 |
| — |
|
ENDESA |
| TOTAL |
| 50 |
| 400 |
| 1,250 |
| 1,700 |
| 1,700 |
| 1,700 |
| 1,700 |
| 1,700 |
| 1,700 |
| 1,700 |
| 1,700 |
| 1,700 |
| 1,700 |
| 1,700 |
| 1,350 |
|
Our contracts with unregulated customers are generally on a long-term basis, and typically range from five to fifteen years. Such contracts are usually automatically extended at the end of the applicable term, unless terminated by either party upon prior notice. Some of them include a price adjustment mechanism in the case of high marginal costs, which also reduces the hydrological risk. Contracts with unregulated customers may also include specifications regarding power sources and equipment, which may be provided at special rates, as well as provisions for technical assistance to the customer. We have not experienced any supply interruptions under our contracts. In case of force majeure events, as contractually defined, which affect our unregulated customers, we are allowed to reject purchases and we are not required to supply electricity. Disputes are typically subject to binding arbitration between the parties, subject to limited exceptions.
The following table sets forth our sales by volume to our five largest distribution and unregulated customers in Chile for each of the periods indicated:
MAIN CUSTOMERS IN CHILE (GWh)
|
| Year ended December 31, |
| ||||||||||
|
| 2008 (5) |
| 2009 |
| 2010 |
| ||||||
|
| Contracted |
| % of |
| Contracted |
| % of |
| Contracted |
| % of |
|
Distribution companies: |
|
|
|
|
|
|
|
|
|
|
|
|
|
Chilectra |
| 3,727 |
| 17.3 |
| 3,731 |
| 16.7 |
| 5,929 |
| 27.1 |
|
CGE |
| 4,800 |
| 22.3 |
| 4,727 |
| 21.2 |
| 3,541 |
| 16.2 |
|
Chilquinta |
| — |
| — |
| — |
| — |
| 895 |
| 4.1 |
|
Saesa (1) |
| 766 |
| 3.6 |
| 669 |
| 3.0 |
| 779 |
| 3.6 |
|
Empresa Eléctrica de la Frontera S.A. (2) |
| 1 |
| 0.0 |
| 1 |
| 0.0 |
| 282 |
| 1.3 |
|
Grupo Emel (3) |
| 845 |
| 3.9 |
| 868 |
| 3.9 |
| 1229 |
| 5.6 |
|
Total sales to five largest distribution companies |
| 10,139 |
| 47.1 |
| 9,997 |
| 44.8 |
| 12,655 |
| 57.9 |
|
Unregulated customers: |
|
|
|
|
|
|
|
|
|
|
|
|
|
Codelco |
| 482 |
| 2.2 |
| 540 |
| 2.4 |
| 545 |
| 2.5 |
|
CMPC |
| 973 |
| 4.5 |
| 912 |
| 4.1 |
| 773 |
| 3.5 |
|
Cía. Minera Los Pelambres |
| 874 |
| 4.1 |
| 926 |
| 4.1 |
| 1,113 |
| 5.1 |
|
Cía. Minera Collahuasi (4) |
| 1,043 |
| 4.8 |
| 1,099 |
| 4.9 |
| 1,114 |
| 5.1 |
|
Cía. Minera Escondida |
| 645 |
| 3.0 |
| 692 |
| 3.1 |
| 638 |
| 2.9 |
|
Cía. Acero del Pacífico — Huachipato |
| 568 |
| 2.6 |
| 500 |
| 2.2 |
| 386 |
| 1.8 |
|
Total sales to six largest unregulated customers |
| 4,586 |
| 21.3 |
| 4,667 |
| 20.9 |
| 4,569 |
| 20.9 |
|
(1) During 2008 and 2009 we did not have a contract with Saesa. Sales during those years were the result of government resolution 88 that forces generators of the CDEC-SIC system to supply energy to distribution companies without contracts.
(2) Until December 2007, Empresa Eléctrica de la Frontera S.A. (Frontel) was a party to two contracts; one was with Endesa Chile and one with Pangue. In 2008, the contract with Endesa Chile terminated. The consumption by Frontel as the result of resolution 88 is not included in this table. Frontel is a subsidiary of Saesa.
(3) The values of the Emel Group for years 2008, 2009 and 2010 includes the 50% of the consumption of the distributors Empresa Eléctrica de Arica, Emelari, Empresa Eléctrica de Iquique S.A., Eliqsa, and Empresa Eléctrica de Antofagasta, Elecda, clients of GasAtacama, and the consumption of the Empresa Eléctrica de Atacama S.A, Emelat, a client of Celta. The consumptions as the result of the government resolution mentioned before are not included in this table. Emel group is a subsidiary of the CGE group.
(4) Consumptions of Cía Minera Collahuasi include the 50% of the contract of GasAtacama with this client and the contracts with Celta.
(5) In 2008, we agreed on a reduction of energy consumption with some customers, including CMPC and Codelco — Salvador.
We compete in the SIC primarily with two generation companies, Gener and Colbún S.A. (Colbún). According to the CDEC-SIC in 2010, Gener and its subsidiaries in the SIC had an installed capacity of 2,339 MW, of which 88.2% was thermoelectric, and Colbún with 2,491 MW, of which 51.7% was thermoelectric. In addition to these two large competitors, there are a number of smaller entities with an aggregate installed capacity of 2,287 MW that generate electricity in the SIC.
Our primary competitors in the SING are E-CL (GDF Suez Group) and Gener, which have 1,798 MW and 931 MW of installed capacity, respectively. Our direct participation in the SING includes our 182 MW Tarapacá thermal plant, owned by our subsidiary Celta, and our participation through our jointly controlled company, GasAtacama, whose power plant has 781 MW of installed capacity. An installed capacity of 390 MW is included in this report as installed capacity of Endesa Chile, an amount that corresponds to Endesa Chile’ 50% ownership of GasAtacama. See “— C. Organizational Structure” for details on related companies.
Electricity generation companies compete largely on the basis of price, technical experience and reliability. In addition, because 61.7% of our installed capacity in the SIC derives from hydroelectric power plants, we have lower marginal production costs than companies generating electricity with thermal plants. During periods of extended droughts, however, we may be forced to buy more expensive electricity from thermoelectric generators at spot prices in order to satisfy our contractual obligations.
Through our subsidiary Endesa Chile, we are the principal operators in the SIC, with 41.5% of the total installed capacity and 46.2% of the physical energy sales of this system in 2010.
In the SING, our subsidiary Celta, and our jointly controlled company GasAtacama, account for 15.5% of the total installed capacity in 2010. Celta, our subsidiary, has a two-turbine 182 MW thermal power plant connected to the SING which represents 4.9% of the total capacity of the SING. For Endesa Chile, GasAtacama represents a total of 390 MW or 10.6% of the total capacity in the SING. For further information regarding to our generation capacity in Chile as of December 31, 2010, please see “— D. Property, Plants and Equipment”.
Operations in Argentina
We participate in electricity generation in Argentina through our subsidiaries Endesa Costanera and El Chocón, with a total of five power plants. El Chocón owns two hydroelectric power plants, with a total installed capacity of 1,328 MW, and Endesa Costanera owns three thermal plants, with a total installed capacity of 2,324 MW. Our hydro and thermal generation plants in Argentina represented 13.0% of the Sistema Interconectado Nacional (the Argentine NIS) installed capacity in 2010.
Our Argentine subsidiaries participate in two new companies, Manuel Belgrano and San Martín. These companies were formed to undertake the construction of two new generation facilities for FONINVEMEM (Fondo Para Inversiones Necesarias que Permitan Incrementar La Oferta de Energía Eléctrica en el Mercado Eléctrico Mayorista). These power plants started operations using gas turbines in 2008, with 1,125 MW of aggregate capacity, and as combined cycles as of March 2010, with an additional 572 MW. The total aggregate capacity of these units is 1,697 MW (848 MW for Manuel Belgrano and 849 MW for San Martín).
Since 2002, government intervention and energy industry authority actions, including limiting the spot price of electricity by considering the variable cost of generating electricity with natural gas and without considering the hydrological conditions of rivers and reservoirs or the use of more expensive fuels, have led to the lack of investment in the electric power sector. (See “ Item 4—Electricity Industry Regulatory Framework” and “ Item — 4 A. History and Development of the Company” for further detail).
As of December 31, 2010, Endesa Costanera’s installed capacity accounted for 8.3% of the total installed capacity in the Argentine NIS. Endesa Costanera’s second combined-cycle plant can operate with either natural gas or diesel. Our 1,138 MW steam turbine power plant can operate with either natural gas or fuel oil.
El Chocón accounted for 4.7% of the installed capacity in the Argentine NIS as of December 31, 2010. El Chocón has a 30-year concession, ending in 2023, for two hydroelectric generation facilities with an aggregate of 1,328 MW of installed capacity. The larger of the two facilities for which El Chocón has a concession of 1,200 MW in installed capacity is the primary flood control installation on the Limay River. The facility’s large reservoir, Ezequiel Ramos Mejía, enables El Chocón to be one of the Argentine NIS major peak suppliers. Variations in El Chocón’s water discharge are moderated by El Chocón’s Arroyito facility, a downstream dam with 128 MW of installed capacity. In November 2008, we finished construction work on the Arroyito dam, and increased the elevation of the reservoir water level, that allows releasing water at an additional 1,150 m³/sec, for a total of 3,750 m³/sec. The additional energy (69 GWh/year) was sold on the spot market until April 2009 and under “Energy Plus” program thereafter. Energy Plus program is the offer of new electricity capacity to supply the electricity demand growth, on top of the demand level for electricity in 2005. (For details on Energy Plus, see “Item 4—Electricity Industry Regulatory Framework”).
The following table sets forth the installed capacity of our Argentine subsidiaries:
INSTALLED CAPACITY PER SUBSIDIARY IN ARGENTINA (MW)
|
| As of December 31, |
| ||||
|
| 2008 |
| 2009 |
| 2010 |
|
Endesa Costanera |
|
|
|
|
|
|
|
Endesa Costanera (steam turbines) |
| 1,138 |
| 1,138 |
| 1,138 |
|
Endesa Costanera (combined cycle II) |
| 859 |
| 859 |
| 859 |
|
Central Termoeléctrica Buenos Aires (combined cycle I) |
| 327 |
| 327 |
| 327 |
|
El Chocón |
|
|
|
|
|
|
|
El Chócon (reservoir) |
| 1,200 |
| 1,200 |
| 1,200 |
|
Arroyito (pass-through) |
| 128 |
| 128 |
| 128 |
|
Total |
| 3,652 |
| 3,652 |
| 3,652 |
|
Our total generation in Argentina reached 10,940 GWh in 2010, 8.5% lower than our 11,955 GWh total electricity generation in 2009. Our generation market share was approximately 9.5% of total electricity production in Argentina during 2010.
The following table sets forth the electricity generation of our Argentine subsidiaries:
ELECTRICITY GENERATION PER SUBSIDIARY IN ARGENTINA (GWh)
|
| Year Ended December 31, |
| ||||
|
| 2008 |
| 2009 |
| 2010 |
|
Endesa Costanera |
| 8,540 |
| 8,172 |
| 7,965 |
|
El Chocón |
| 1,940 |
| 3,783 |
| 2,975 |
|
Total |
| 10,480 |
| 11,955 |
| 10,940 |
|
Hydroelectric generation in Argentina accounted for nearly 27.2% of total generation in 2010, four percentage points lower than in 2009. This was due to the restrictions of the operation of El Chocón that were imposed by CAMMESA and the low level of the reservoir during 2010 that resulted from the drought conditions during the second half of 2010 in the Limay River and in the Collón Curá River, the main tributaries of El Chocón. The monthly flow of the rivers during 2010 and the monthly average is shown in the following table:
|
|
|
| Jan |
| Feb |
| Mar |
| Apr |
| May |
| Jun |
| Jul |
| Aug |
| Sep |
| Oct |
| Nov |
| Dec |
|
|
| 2010 |
| 307 |
| 216 |
| 157 |
| 119 |
| 112 |
| 134 |
| 251 |
| 204 |
| 245 |
| 246 |
| 308 |
| 282 |
|
Limay m3/s |
| Average |
| 250 |
| 178 |
| 125 |
| 113 |
| 167 |
| 292 |
| 357 |
| 366 |
| 345 |
| 342 |
| 358 |
| 329 |
|
|
| % |
| 123 | % | 121 | % | 126 | % | 105 | % | 67 | % | 46 | % | 70 | % | 56 | % | 71 | % | 72 | % | 86 | % | 86 | % |
|
|
|
|
|
|
|
|
|
|
|
|
|
|
|
|
|
|
|
|
|
|
|
|
|
|
|
|
|
| 2010 |
| 246 |
| 122 |
| 79 |
| 72 |
| 90 |
| 224 |
| 427 |
| 282 |
| 420 |
| 549 |
| 589 |
| 381 |
|
Collón Curá m3/s |
| Average |
| 218 |
| 123 |
| 89 |
| 105 |
| 268 |
| 575 |
| 645 |
| 587 |
| 568 |
| 633 |
| 644 |
| 452 |
|
|
| % |
| 113 | % | 99 | % | 89 | % | 69 | % | 34 | % | 39 | % | 66 | % | 48 | % | 74 | % | 87 | % | 91 | % | 84 | % |
The volumes and percentages of hydroelectric and thermal generation are shown in the following table:
HYDRO/THERMAL GENERATION IN ARGENTINA (GWh) (1)
|
| Year ended December 31, |
| ||||||||||
|
| 2008 |
| 2009 |
| 2010 |
| ||||||
|
| (GWh) |
| % |
| (GWh) |
| % |
| (GWh) |
| % |
|
Hydroelectric generation |
| 1,940 |
| 18.5 |
| 3,783 |
| 31.6 |
| 2,975 |
| 27.2 |
|
Thermal generation |
| 8,540 |
| 81.5 |
| 8,172 |
| 68.4 |
| 7,965 |
| 72.8 |
|
Total generation |
| 10,480 |
| 100.0 |
| 11,955 |
| 100.0 |
| 10,940 |
| 100.0 |
|
(1) Generation minus our own power plant consumption and technical losses.
The amount of energy generated and purchased in the last three years is shown in the following table:
PHYSICAL GENERATION AND PURCHASES IN ARGENTINA (GWh)
|
| 2008 |
| 2009 |
| 2010 |
| ||||||
|
| (GWh) |
| % |
| (GWh) |
| % |
| (GWh) |
| % |
|
Electricity generation |
| 10,480 |
| 93.8 |
| 11,955 |
| 95.8 |
| 10,940 |
| 95.5 |
|
Electricity purchases |
| 694 |
| 6.2 |
| 528 |
| 4.2 |
| 517 |
| 4.5 |
|
Total (1) |
| 11,174 |
| 100.0 |
| 12,483 |
| 100.0 |
| 11,457 |
| 100.0 |
|
(1) Energy generation plus energy purchases differ from electricity sales due to own power plant consumption of electricity.
The distribution of physical sales in Argentina, in terms of customer segment, is shown in the following table:
PHYSICAL SALES PER CUSTOMER SEGMENT IN ARGENTINA (GWh)
|
| Year Ended December 31, |
| ||||||||||
|
| 2008 |
| 2009 |
| 2010 |
| ||||||
|
| (GWh) |
| % of |
| (GWh) |
| % of Sales |
| (GWh) |
| % of Sales |
|
Contracted sales |
| 2,397 |
| 21.6 |
| 2,128 |
| 17.2 |
| 2,142 |
| 18.8 |
|
Non-contracted sales |
| 8,701 |
| 78.4 |
| 10,278 |
| 82.8 |
| 9,236 |
| 81.2 |
|
Total electricity sales |
| 11,098 |
| 100.0 |
| 12,405 |
| 100.0 |
| 11,378 |
| 100.0 |
|
PHYSICAL SALES PER SUBSIDIARY IN ARGENTINA (GWh)
|
| Year Ended December 31, |
| ||||
|
| 2008 |
| 2009 |
| 2010 |
|
Endesa Costanera |
| 8,543 |
| 8,284 |
| 8,018 |
|
El Chocón |
| 2,554 |
| 4,122 |
| 3,361 |
|
Total |
| 11,098 |
| 12,405 |
| 11,378 |
|
During 2010, Endesa Costanera served an average of 37 unregulated customers. Endesa Costanera has no contract with distribution companies. Given the regulatory measures adopted since 2003, the current Argentine electricity industry price scenario makes sales to distribution companies less attractive than sales to the wholesale market.
The following table sets forth Endesa Costanera’s sales to its largest unregulated customers for each of the periods indicated:
ENDESA COSTANERA’S MAIN CUSTOMERS (GWh)
|
| Year ended December 31, |
| ||||||||||
|
| 2008 |
| 2009 |
| 2010 |
| ||||||
|
| Contracted |
| % of |
| Contracted |
| % of |
| Contracted |
| % of |
|
YPF |
| 233 |
| 22.5 |
| 122 |
| 15.8 |
| 188 |
| 25.7 |
|
Acindar |
| 88 |
| 8.5 |
| 29 |
| 3.7 |
|
|
| 0.0 |
|
Solvay (1) |
| 130 |
| 12.5 |
| 96 |
| 12.4 |
|
|
| 0.0 |
|
Transclor |
| 63 |
| 6.1 |
| 58 |
| 7.5 |
| 60 |
| 8.2 |
|
Peugeot |
| 63 |
| 6.1 |
| 48 |
| 6.2 |
| 59 |
| 8.0 |
|
Cencosud |
| 59 |
| 5.7 |
| 71 |
| 9.2 |
| 70 |
| 9.6 |
|
Rasic Hnos. |
|
|
|
|
| 40 |
| 5.5 |
| 39 |
| 5.3 |
|
Total sales to our largest unregulated customers |
| 635 |
| 61.5 |
| 464 |
| 60.3 |
| 416 |
| 56.9 |
|
(1) Since September 2009 the contract with Solvay started to decline, because Solvay started to supply themselves with a cogeneration plant.
Sales to the pool market decreased from 7,511 GWh in 2009 to 7,286 GWh in 2010; this reduction is mainly explained by the reduction in thermal generation, due to maintenance of the Central Termoeléctrica Buenos Aires unit during the first quarter of 2010.
During 2008 and 2009, Endesa Costanera, through its subsidiary Endesa Cemsa S.A. (Cemsa), negotiated with a number of gas producers, which allowed Endesa Costanera to diversify and improve the availability of gas for supply to Endesa Costanera’s units, including the ability to trade gas with other generators.
In October 2010, Endesa Costanera started energy exports of power to the company Usinas y Transmisiones Eléctricas (Uruguay) with gas imported from Bolivia.
During 2009, El Chocón served an average of 21 unregulated customers. El Chocón has no contract with distribution companies.
The following table sets forth sales by volume to the largest unregulated customers of El Chocón for each of the periods indicated:
EL CHOCON’S MAIN CUSTOMERS (GWh)
|
| Year ended December 31, |
| ||||||||||
|
| 2008 |
| 2009 |
| 2010 |
| ||||||
|
| Contracted |
| % of |
| Contracted |
| % of |
| Contracted |
| % of |
|
Minera Alumbrera |
| 571 |
| 41.9 |
| 542 |
| 40.0 |
| 505 |
| 35.8 |
|
Profertil (Cemsa) (1) |
| 94 |
| 6.9 |
| 115 |
| 8.5 |
| 112 |
| 7.9 |
|
Massuh |
| 85 |
| 6.2 |
| — |
| — |
| — |
| — |
|
Chevron |
| 136 |
| 10.0 |
| 120 |
| 8.8 |
| 91 |
| 6.4 |
|
Acindar (Cemsa) (1) |
| 88 |
| 6.4 |
| 75 |
| 5.5 |
| 80 |
| 5.7 |
|
Praxair |
| 89 |
| 6.5 |
| 80 |
| 5.9 |
| 87 |
| 6.2 |
|
Air Liquide |
| 30 |
| 2.2 |
| 122 |
| 9.0 |
| 131 |
| 9.3 |
|
Total sales to our largest unregulated customers |
| 1,093 |
| 80.1 |
| 1,055 |
| 77.8 |
| 1,006 |
| 71.3 |
|
(1) Profertil and Acindar do not have contracts with El Chocón, but are served through Cemsa, Endesa Chile’s affiliate.
El Chocón does not have the right to terminate the operating agreement, unless we fail to perform our obligations under the agreement. Under the terms of the operating agreement, we are entitled to a fee payable in dollars based on El Chocón’s annual gross revenues, payable in monthly installments. The management fee for 2008, 2009 and 2010 was $ 2.2 million, $ 2.4 million and $ 2.3 million, respectively.
Electricity demand in the Argentine NIS increased 5.9% during 2010. Total electricity demand was 105,938 GWh in 2008, 104,592 GWh in 2009 and 110,767 GWh in 2010. Our Argentine subsidiaries compete with all the major power plants connected to the Argentine NIS. According to the installed capacity reported by CAMMESA in the monthly report for December 2010, our major competitors in Argentina are the state-controlled company Enarsa (with an installed capacity of 640 MW), nuclear units -NASA- (1,005 MW) and the binational hydroelectric units Yacyreta and Salto Grande (3,225 MW in total). The main private competitors are: AES Group, Sociedad Argentina de Energía S.A. (Sadesa), and Pampa Energía. The AES Group has nine power plants connected to the Argentine NIS with a total capacity of 2,810 MW (43% of which is hydro) and one plant that is not connected to the Argentine NIS that delivers energy to the Chilean SING, Termo Andes, with a total capacity of 411 MW. On the other hand, Sadesa owns a total of approximately 3,860 MW, the most important of which are Piedra del Aguila (hydro, 1,400 MW) and Central Puerto (thermal, 1,777 MW), while Pampa Energía competes with us with five power plants, Diamante and Nihuiles (both hydro, 612 MW in total), and Güemes, Loma de la Lata and Piedra Buena (thermal, 1,356 MW in total).
Generation in Brazil
Endesa Brasil consolidates operations of generation companies Endesa Fortaleza and Cachoeira Dourada; CIEN, which transmits electricity from two transmission lines between Argentina and Brazil; CTM and TESA, subsidiaries of CIEN, which are owners of the Argentine side of the lines; a distribution company, Ampla, which is the second largest electricity distribution company in the State of Rio de Janeiro; and Coelce, which is the sole electricity distributor in the State of Ceará.
As of December 2010, we had a total installed capacity of 987 MW in Brazil. Of this amount, 665 MW corresponds to Cachoeira Dourada and 322 MW to Endesa Fortaleza.
The following table sets forth information relating to Enersis’ installed capacity in Brazil:
INSTALLED CAPACITY IN BRAZIL (MW) (1)
|
| (MW) |
| ||||
|
| 2008 |
| 2009 |
| 2010 |
|
Cachoeira Dourada (hydro) |
| 665 |
| 665 |
| 665 |
|
Endesa Fortaleza (thermal) |
| 322 |
| 322 |
| 322 |
|
Total |
| 987 |
| 987 |
| 987 |
|
(1) Total installed capacity is defined as the maximum MW capacity of generation units under specific technical conditions and characteristics.
The following table sets forth the physical energy production of Cachoeira Dourada and Endesa Fortaleza:
OUR PHYSICAL PRODUCTION IN BRAZIL (GWh)
|
| Year ended December 31, |
| ||||||||||
|
| 2008 |
| 2009 |
| 2010 |
| ||||||
|
| (GWh) |
| % |
| (GWh) |
| % |
| (GWh) |
| % |
|
Cachoeira Dourada |
| 3,308 |
| 97.9 |
| 2,820 |
| 85.0 |
| 3,430 |
| 67.3 |
|
Endesa Fortaleza |
| 71 |
| 2.1 |
| 499 |
| 15.0 |
| 1,665 |
| 32.7 |
|
Total |
| 3,379 |
| 100.0 |
| 3,319 |
| 100.0 |
| 5,095 |
| 100.0 |
|
Cachoeira Dourada is a hydroelectric company with an installed capacity of 665 MW located in the south of Brazil. It has long-term contracts with 34 distribution companies due to the bids realized for regulated consumers by the Contrato de Comercialización de Energía en Ambiente Regulado (CCEAR). The contract sales with regulated clients were for 1,170 GWh. Additionally, Cachoeira has medium term contracts with 30 unregulated clients with an average duration of three years and short term contracts that during 2010 varied between 4 and 19 clients. Cachoeira’s sales to unregulated clients were 2,270 GWh.
The following table sets forth the levels of electricity production and purchases for our Brazilian subsidiaries for the past three years:
PHYSICAL PRODUCTION AND PURCHASES IN BRAZIL (GWh)
|
| Year ended December 31, |
| ||||||||||
|
| 2008 |
| 2009 |
| 2010 |
| ||||||
|
| (GWh) |
| % |
| (GWh) |
| % |
| (GWh) |
| % |
|
Electricity production |
| 3,379 |
| 47.7 |
| 3,319 |
| 47.0 |
| 5,095 |
| 74.5 |
|
Electricity purchases |
| 3,711 |
| 52.3 |
| 3,742 |
| 53.0 |
| 1,746 |
| 25.5 |
|
Total (1) |
| 7,090 |
| 100.0 |
| 7,061 |
| 100.0 |
| 6,841 |
| 100.0 |
|
(1) Electricity generation plus electricity purchases differ from electricity sales due to transmission losses, as power plant consumption and technical losses have already been deducted.
The following table sets forth certain statistical information regarding Cachoeira Dourada’s electricity sales:
|
| Year ended December 31, |
| ||||||||||
|
| 2008 |
| 2009 |
| 2010 |
| ||||||
|
| (GWh) |
| % of |
| (GWh) |
| % of |
| (GWh) |
| % of |
|
Contracted sales |
| 3,947 |
| 89.8 |
| 3,411 |
| 88.3 |
| 3,440 |
| 89.8 |
|
Non-contracted sales |
| 450 |
| 10.2 |
| 451 |
| 11.7 |
| 392 |
| 10.2 |
|
Total electricity sales |
| 4,397 |
| 100.0 |
| 3,862 |
| 100.0 |
| 3,833 |
| 100.0 |
|
Endesa Fortaleza is wholly-owned by Endesa Brasil. Enersis holds a 54.4% controlling interest in Endesa Brasil. Endesa Fortaleza owns a combined cycle plant which uses natural gas. The plant is located 50 kilometers from the capital of the Brazilian state of Ceará, and it began commercial operations in 2003.
Since January 2010 Endesa Fortaleza has had availability of natural gas from the Pecem regasification terminal. During the second half of 2010, the power plant consumed an average of 45 million m³/d of natural gas.
The following table sets forth certain statistical information regarding Endesa Fortaleza’s electricity sales:
|
| Year ended December 31, |
| ||||
|
| 2008 |
| 2009 |
| 2010 |
|
Electricity sales (GWh) |
| 2,690 |
| 3,007 |
| 2,957 |
|
Endesa Fortaleza’s market share is 0.3% of the total installed capacity of the Brazilian system and 1.1% of the thermoelectric generators.
The following table sets forth certain statistical information regarding Endesa Fortaleza’s electricity sales:
|
| Year ended December 31, |
| ||||||||||
|
| 2008 |
| 2009 |
| 2010 |
| ||||||
|
| (GWh) |
| % of |
| (GWh) |
| % of |
| (GWh) |
| % of |
|
Contracted sales |
| 2,690 |
| 100.0 |
| 2,918 |
| 97.1 |
| 2,690 |
| 91.0 |
|
Non-contracted sales |
| 0 |
| 0.0 |
| 88 |
| 2.9 |
| 267 |
| 9.0 |
|
Total electricity sales |
| 2,690 |
| 100.0 |
| 3,007 |
| 100.0 |
| 2,957 |
| 100.0 |
|
Operations in Colombia
Until August 2007, we controlled two electricity generation companies in Colombia, Betania and Emgesa. These companies were merged into Betania, which then changed its name to Emgesa S.A. E.S.P., or Emgesa. We have a 16.1% stake in Emgesa as of December 31, 2010, which we control and consolidate pursuant to a shareholders’ agreement with a subsidiary of Endesa Spain.
As of December 31, 2010, our Colombian subsidiary operated 12 generation facilities in Colombia, with a total installed capacity of 2,914 MW. Emgesa has 2,471 MW in hydroelectric plants and 444 MW in thermoelectric plants. In May 2010, the 19.5 MW mini hydro unit San Antonio started operations.
Our hydroelectric and thermal generation plants in Colombia represent 21.8% of the country’s total electricity generation capacity as of December 2010.
The following table sets forth the installed generation capacity of our Colombian subsidiaries for the last three years:
INSTALLED CAPACITY IN COLOMBIA (MW)(1)
|
| Year ended December 31, |
| ||||
|
| 2008 |
| 2009 |
| 2010 |
|
|
| (MW) |
| ||||
Emgesa |
|
|
|
|
|
|
|
Guavio (reservoir) |
| 1,213 |
| 1,213 |
| 1,213 |
|
Cadena Nueva (reservoir/pass-through) (2) |
| 601 |
| 601 |
| 601 |
|
Betania (reservoir) |
| 541 |
| 541 |
| 541 |
|
Termozipa (steam turbine/coal) |
| 236 |
| 236 |
| 236 |
|
Cartagena (steam turbine/natural gas + diesel oil) |
| 208 |
| 208 |
| 208 |
|
Minor Plants (pass-through) (3) |
| 96 |
| 96 |
| 116 |
|
Total |
| 2,895 |
| 2,895 |
| 2,914 |
|
(1) The figure includes the capacity used for power plant consumption.
(2) Includes two power plants named La Guaca and Paraiso.
(3) As of December 31, 2010 Emgesa owned and operated six minor plants: Charquito, El Limonar, La Tinta, Tequendama, La Junca and San Antonio, which started operations in May 2010.
Approximately 85% of our installed capacity in Colombia is hydroelectric. As a result, our physical generation depends on the reservoir levels and rainfalls. Our generation market share in Colombia was 23.7% in 2008, 22.6% in 2009 and 19.8% in 2010. In addition to hydrological conditions, the amount of generation depends on our commercial strategy. Companies are free to offer their electricity at prices driven by market conditions and are dispatched by a centralized operating entity to generate according to the prices offered, as opposed to being dispatched according to the operating costs, as in other countries in which we operate.
During 2010, thermal generation represented 9.1% of total generation and hydroelectric generation represented the remaining 90.9% of our generation in Colombia. During the second half of 2009 and the first quarter of 2010, there were very dry hydrological conditions in the Colombian system due to the “El Niño” phenomenon, which caused less hydroelectric generation in the region, contrary to Chilean and Peruvian regions. For Emgesa’s hydro units in the Guavio River and Magdalena River (Betania unit), the flow remained critically low until October 2010. The average annual percentage of historical average flow for 2010 was 76% and 82% for the Guavio and Magdalena Rivers, respectively, as shown in the following table:
|
|
|
| Jan |
| Feb |
| Mar |
| Apr |
| May |
| Jun |
| Jul |
| Aug |
| Sep |
| Oct |
| Nov |
| Dec |
| Total |
|
|
| 2010 |
| 62 |
| 81 |
| 184 |
| 429 |
| 647 |
| 730 |
| 793 |
| 469 |
| 311 |
| 288 |
| 435 |
| 267 |
| 4,696 |
|
Guavio River GWh |
| Average |
| 134 |
| 131 |
| 219 |
| 466 |
| 771 |
| 979 |
| 1056 |
| 799 |
| 533 |
| 470 |
| 372 |
| 228 |
| 6,158 |
|
|
| % |
| 73 | % | 57 | % | 44 | % | 46 | % | 62 | % | 84 | % | 75 | % | 59 | % | 58 | % | 61 | % | 117 | % | 117 | % | 76 | % |
|
|
|
|
|
|
|
|
|
|
|
|
|
|
|
|
|
|
|
|
|
|
|
|
|
|
|
|
|
|
|
| 2010 |
| 57 |
| 67 |
| 87 |
| 208 |
| 223 |
| 213 |
| 249 |
| 149 |
| 105 |
| 119 |
| 248 |
| 201 |
| 1,927 |
|
Magdalena River GWh |
| Average |
| 132 |
| 125 |
| 162 |
| 204 |
| 235 |
| 261 |
| 286 |
| 221 |
| 157 |
| 176 |
| 198 |
| 178 |
| 2,337 |
|
|
| % |
| 43 | % | 53 | % | 54 | % | 102 | % | 95 | % | 82 | % | 87 | % | 67 | % | 67 | % | 68 | % | 126 | % | 113 | % | 82 | % |
Emgesa reduced its hydro generation by 1,447 GWh as compared with the 2009 generation and by 2,150 GWh when compared to the 2008 figure. Part of this decrease was replaced by thermal generation (57 GWh more than 2009, and 528 GWh more than 2008), as shown in the following table:
HYDRO/THERMAL GENERATION IN COLOMBIA (GWh) (1)
|
| Year ended December 31, |
| ||||||||||
|
| 2008 |
| 2009 |
| 2010 |
| ||||||
|
| (GWh) |
| % |
| (GWh) |
| % |
| (GWh) |
| % |
|
Hydroelectric generation |
| 12,403 |
| 96.1 |
| 11,700 |
| 92.3 |
| 10,253 |
| 90.9 |
|
Thermal generation |
| 503 |
| 3.9 |
| 974 |
| 7.7 |
| 1,030 |
| 9.1 |
|
Total generation |
| 12,905 |
| 100.0 |
| 12,674 |
| 100.0 |
| 11,283 |
| 100.0 |
|
(1) Generation minus power plant own consumption and technical losses.
During 2010, the Cartagena and Termozipa power plants have been operated intensively with natural gas and coal, respectively, as a result of the “El Niño” phenomenon.
The following table sets forth the levels of electricity production and purchases for our Colombian subsidiaries for the past three years:
PHYSICAL PRODUCTION AND PURCHASES IN COLOMBIA (GWh)
|
| Year ended December 31, |
| ||||||||||
|
| 2008 |
| 2009 |
| 2010 |
| ||||||
|
| (GWh) |
| % |
| (GWh) |
| % |
| (GWh) |
| % |
|
Electricity production |
| 12,905 |
| 78.1 |
| 12,674 |
| 74.7 |
| 11,283 |
| 75.4 |
|
Electricity purchases |
| 3,611 |
| 21.9 |
| 4,284 |
| 25.3 |
| 3,678 |
| 24.6 |
|
Total (1) |
| 16,517 |
| 100.0 |
| 16,958 |
| 100.0 |
| 14,961 |
| 100.0 |
|
(1) Electricity generation plus electricity purchases differ from electricity sales due to transmission losses, as power plant consumption and technical losses have already been deducted.
The only interconnected electricity system in Colombia is the Sistema Interconectado Nacional the “Colombian NIS.” Electricity demand in the Colombian NIS increased 2.6% during 2010. Total electricity consumption was: 53,870 GWh in 2008, 54,679 GWh in 2009 and 56,099 GWh in 2010.
The demand in Colombia’s electricity market has been affected by the agreement on International Transactions of Energy governing the interconnection with Ecuador’s electricity system, which began operations in 2003. During 2010, physical sales to Ecuador were 798 GWh, 279 GWh lower than the 1,077 GWh sold in 2009, due to the drought conditions in Colombia that forced the authorities to limit exports temporarily. Energy imports from Ecuador to Colombia were 10 GWh in 2010 and 16 GWh in 2009.
The distribution of our physical sales in Colombia, in terms of customer segment, is shown in the following table:
PHYSICAL SALES PER CUSTOMER SEGMENT IN COLOMBIA (GWh)
|
| Year ended December 31, |
| ||||||||||
|
| 2008 |
| 2009 |
| 2010 |
| ||||||
|
| Sales |
| % of |
| Sales |
| % of |
| Sales |
| % of Sales |
|
Contracted sales |
| 11,169 |
| 68.2 |
| 11,960 |
| 71.2 |
| 10,946 |
| 73.9 |
|
Non-contracted sales |
| 5,199 |
| 31.8 |
| 4,847 |
| 28.8 |
| 3,871 |
| 26.1 |
|
Total electricity sales |
| 16,368 |
| 100.0 |
| 16,806 |
| 100.0 |
| 14,817 |
| 100.0 |
|
During 2010, Emgesa served an average of 739 contracts with unregulated customers and 11 distribution and trading companies. Our sales to the distribution company Codensa, an affiliated company because of control at the Enersis level, accounted for 39.2% of our total contracted sales in 2010. Physical sales to the five largest unregulated customers altogether reached 5.6% of total contracted sales.
The following table sets forth our sales by volume to our six largest distribution customers in Colombia for the last three years:
MAIN DISTRIBUTION AND TRADING CUSTOMERS IN COLOMBIA (GWh)
|
| Year ended December 31, |
| ||||||||||
|
| 2008 |
| 2009 |
| 2010 |
| ||||||
|
| Contracted |
| % of |
| Contracted |
| % of |
| Contracted |
| % of |
|
|
|
|
|
|
|
|
|
|
|
|
|
|
|
Codensa (1) |
| 3,784 |
| 33.9 |
| 4,697 |
| 39.3 |
| 4,296 |
| 39.2 |
|
Enertolima |
| 150 |
| 1.3 |
| 471 |
| 3.9 |
| 501 |
| 4.6 |
|
Electrocosta |
| 79 |
| 0.7 |
| 517 |
| 4.3 |
| 555 |
| 5.1 |
|
Electricaribe |
| 1,194 |
| 10.7 |
| 954 |
| 8.0 |
| 352 |
| 3.2 |
|
EPM |
| 1,455 |
| 13.0 |
| 720 |
| 6.0 |
| 1,716 |
| 15.7 |
|
Meta |
| 624 |
| 5.6 |
| 163 |
| 1.4 |
| 175 |
| 1.6 |
|
Total sales to our largest distribution customers |
| 7,286 |
| 65.2 |
| 7,523 |
| 62.9 |
| 7,595 |
| 69.4 |
|
(1) A subsidiary of Enersis.
Our most important competitors in Colombia include the following state-owned companies: Empresas Públicas de Medellín (with an installed capacity of 2,600 MW), Isagen (with an installed capacity of 2,106 MW), and Gecelca (with an installed capacity of 1,201 MW). We also compete with the following private sector companies in Colombia: Chivor (1,000 MW), which is owned by Gener (100% owned as of December 2010); Colinversiones, with an installed capacity of 1,459 MW, which includes Termoflores with an installed capacity of 160 MW (281 MW less than the installed capacity registered in 2009, due to temporary retirement of the Flores 2 and 3 units for the conversion to combined cycle; the incorporation of the new Flores IV unit is expected during the first quarter of 2011); Merieléctrica, with an installed capacity of 169 MW; and Epsa, with an installed capacity of 1,111 MW.
Operations in Peru
Through our subsidiary Edegel, we operate a total of nine generation facilities in Peru, with a total installed capacity of 1,668 MW, as of December 2010. Edegel owns seven hydroelectric power plants, with a total installed capacity of 746 MW, two of which are located 280 kilometers from Lima and five of which are located approximately 50 kilometers from Lima. The company has two thermal plants, which represent the remaining 922 MW of total installed capacity. Our hydroelectric and thermal generation plants in Peru represent 25.8% of the country’s total electricity generation capacity according to the information reported in December 2010 by the Organismo Supervisor de la Inversión en Energía y Minería, Supervisory Entity of the Investment on Energy and Mining (Osinergmin).
The following chart sets forth the installed capacity of Edegel:
INSTALLED CAPACITY IN PERU (MW)
|
| Year Ended December 31, |
| ||||
|
| 2008 |
| 2009 |
| 2010 |
|
|
|
|
|
|
|
|
|
Edegel S.A. |
|
|
|
|
|
|
|
Huinco (hydroelectric) |
| 247 |
| 247 |
| 247 |
|
Matucana (hydroelectric) |
| 129 |
| 129 |
| 129 |
|
Callahuanca (hydroelectric) |
| 80 |
| 80 |
| 80 |
|
Moyopampa (hydroelectric) (1) |
| 65 |
| 65 |
| 66 |
|
Huampani (hydroelectric) |
| 30 |
| 30 |
| 30 |
|
Yanango (hydroelectric) |
| 43 |
| 43 |
| 43 |
|
Chimay (hydroelectric) |
| 151 |
| 151 |
| 151 |
|
Santa Rosa (thermal) (2) (3) |
| 229 |
| 430 |
| 429 |
|
Ventanilla (thermal) |
| 493 |
| 493 |
| 493 |
|
Total |
| 1,467 |
| 1,667 |
| 1,668 |
|
(1) During 2010, Moyopampa’s installed capacity increased by 1 MW, due to the result of a capacity test held during this period.
(2) During 2009, Santa Rosa increased its installed capacity due to the incorporation of Unit TG8, which started operations in September 2009 with 193 MW and with an additional 7 MW since November 2009 (200 MW in total).
(3) During 2010, Santa Rosa’s installed capacity decreased by 1 MW, due to the result of a capacity test held during this period.
Our generation market share was 26.1% of total electricity production in Peru in 2010.
HYDRO/THERMAL GENERATION IN PERU (GWh)(1)
|
| Year ended December 31, |
| ||||||||||
|
| 2008 |
| 2009 |
| 2010 |
| ||||||
|
| (GWh) |
| % |
| (GWh) |
| % |
| (GWh) |
| % |
|
Hydroelectric generation |
| 4,189 |
| 51.7 |
| 4,564 |
| 55.9 |
| 4,405 |
| 52.0 |
|
Thermal generation |
| 3,913 |
| 48.3 |
| 3,599 |
| 44.1 |
| 4,061 |
| 48.0 |
|
Total generation |
| 8,102 |
| 100.0 |
| 8,163 |
| 100.0 |
| 8,466 |
| 100.0 |
|
(1) Generation minus power plant own consumption and technical losses.
Hydrological generation represented 52.0% of Edegel’s total production in 2010. Hydro generation decreased by 159 GWh, or 3.5%, compared with 2009 generation, due to the rainy conditions prevailing during 2009. For Edegel, the flow of the rivers during 2009 in the Rimac basin was one of the highest since 1965. This 2010 reduction was offset by an increase of 463 GWh of thermal generation in 2010, explained by the incorporation of Santa Rosa’s Unit TG8.
The flow of the Rimac River for the years 2009 and 2010, compared with the historical average, is shown in the following table:
|
|
|
| Jan |
| Feb |
| Mar |
| Apr |
| May |
| Jun |
| Jul |
| Aug |
| Sep |
| Oct |
| Nov |
| Dec |
| Average |
|
|
| 2009 |
| 42 |
| 78 |
| 70 |
| 52 |
| 26 |
| 17 |
| 14 |
| 12 |
| 12 |
| 17 |
| 37 |
| 55 |
| 36 |
|
Rimac River m³/s |
| Average |
| 42 |
| 57 |
| 60 |
| 40 |
| 21 |
| 15 |
| 12 |
| 10 |
| 11 |
| 13 |
| 17 |
| 27 |
| 27 |
|
|
| % |
| 102 | % | 136 | % | 117 | % | 129 | % | 121 | % | 114 | % | 118 | % | 111 | % | 106 | % | 128 | % | 220 | % | 208 | % | 133 | % |
|
|
|
|
|
|
|
|
|
|
|
|
|
|
|
|
|
|
|
|
|
|
|
|
|
|
|
|
|
|
|
| 2010 |
| 65 |
| 55 |
| 62 |
| 43 |
| 23 |
| 17 |
| 14 |
| 13 |
| 11 |
| 12 |
| 13 |
| 44 |
| 31 |
|
Rimac River m³/s |
| Average |
| 42 |
| 57 |
| 60 |
| 40 |
| 21 |
| 15 |
| 12 |
| 10 |
| 11 |
| 13 |
| 17 |
| 27 |
| 27 |
|
|
| % |
| 157 | % | 95 | % | 104 | % | 107 | % | 107 | % | 114 | % | 120 | % | 126 | % | 105 | % | 93 | % | 78 | % | 165 | % | 115 | % |
The portion of electricity supplied by Edegel’s own generation was 96.5% of total physical sales, requiring only a small amount of purchases to satisfy contractual obligations to customers.
Edegel has gas supply, transportation and distribution contracts for its Ventanilla and Santa Rosa facilities. During 2007, the gas pipeline Camisea-Lima, owned by TGP, reached its full capacity. However, in May 2008, TGP started implementing restrictions on the gas transfer through the pipeline. In order to guarantee the transportation capacity for its natural gas demand, Edegel modified its agreements during 2007 and 2008, shifting from interruptible to firm mode, with a capacity of 1.5 million m³/d (from August 2008 to July 2009) and 2.7 million m³/d (from August 2009 to July 2019). Thus, Edegel expects it will have enough capacity for the combined cycle Ventanilla plant and part of Santa Rosa. In addition, in 2009 Edegel extended the contract for transportation and distribution from August 2019 to 2025 at a level of 2.1 million m³/d.
In August 2010, TGP awarded 0.5 million m³/d in firm transport capacity to Edegel from August 2010 until the end of 2019, in the TGP 14th open season.
In August 2010, the authority published a regulation that enables the secondary market for transport and supply of natural gas.
PHYSICAL GENERATION AND PURCHASES IN PERU (GWh) (1)
|
| Year ended December 31, |
| ||||||||||
|
| 2008 |
| 2009 |
| 2010 |
| ||||||
|
| (GWh) |
| % |
| (GWh) |
| % |
| (GWh) |
| % |
|
Electricity generation |
| 8,102 |
| 93.9 |
| 8,163 |
| 96.0 |
| 8,466 |
| 96.5 |
|
Electricity purchases |
| 525 |
| 6.1 |
| 337 |
| 4.0 |
| 305 |
| 3.5 |
|
Total(1) |
| 8,627 |
| 100.0 |
| 8,499 |
| 100.0 |
| 8,771 |
| 100.0 |
|
(1) Electricity generation plus electricity purchases differ from electricity sales due to transmission losses, as power plant consumption and technical losses have already been deducted.
Sistema Eléctrico Interconectado Nacional, or the SINAC, is the only interconnected system in Peru. Electricity sales in the SINAC increased 8.5% during 2010 compared to 2009, reaching total annual sales of 29,553 GWh.
The distribution of Edegel’s physical sales, in terms of customer segment, is shown in the following table:
PHYSICAL SALES PER CUSTOMER SEGMENT IN PERU (GWh)
|
| Year ended December 31, |
| ||||||||||
|
| 2008 |
| 2009 |
| 2010 |
| ||||||
|
| Sales |
| % of |
| Sales |
| % of |
| Sales |
| % of |
|
Contracted sales (1) |
| 8,225 |
| 97.2 |
| 7,565 |
| 90.9 |
| 7,550 |
| 87.8 |
|
Non-contracted sales |
| 235 |
| 2.8 |
| 755 |
| 9.1 |
| 1,049 |
| 12.2 |
|
Total electricity sales |
| 8,461 |
| 100.0 |
| 8,321 |
| 100.0 |
| 8,598 |
| 100.0 |
|
(1) Includes sales to distributors without contracts.
Edegel’s physical sales in 2010 increased 3.3% compared with 2009. Sales in the spot market increased 38.8% due to the increase in generation and contracted sales remained similar to the values evidenced for 2009. During 2010, Edegel had nine regulated customers. Edegel has had contracts since 1997 with Luz del Sur and Edelnor, an affiliated company because of control at the Enersis level. Edegel also won the bids launched by other distributors during 2006 and 2007. The company has ten unregulated customers. Sales to unregulated customers represented 27.3% of Edegel’s total contracted sales in 2010, compared to 46.3% in 2009, due to the expiration of the contract with Electroperú in September 2009.
During 2010, there were six long-term bids for the supply of various distributors in Peru. Those contracts will be dispatched as of 2013 and 2014 with a duration between 8 and12 years. The energy required varies by year: 36 TWh for 2013, 194 TWh between 2014 and 2021, 120 TWh for 2022 and 2023 and 4 TWh for 2024 and 2025. Edegel allocated 4.9
TWh between 2014 and 2021, 4.4 TWh for 2022 and 2023, and 3.4 TWh for 2024 and 2025 in the Edelnor process. Additionally in that bid, Edegel allocated between 250 and 892 GWh between 2011 and 2013 in medium term bids with Luz del Sur, Seal and Edelnor.
The following table sets forth our sales by volume to our largest customers in Peru for each of the periods indicated:
MAIN CUSTOMERS IN PERU (GWh)
|
| Year ended December 31, |
| ||||||||||
|
| 2008 |
| 2009 |
| 2010 |
| ||||||
|
| Contracted |
| % of |
| Contracted |
| % of |
| Contracted |
| % of |
|
Distribution companies: |
|
|
|
|
|
|
|
|
|
|
|
|
|
Edelnor (Regulated) (1) |
| 1,693 |
| 20.6 |
| 2,663 |
| 35.2 |
| 4,072 |
| 53.9 |
|
Luz del Sur (Regulated) (1) |
| 1,346 |
| 16.4 |
| 949 |
| 12.5 |
| 917 |
| 12.1 |
|
Hidrandina |
| 58 |
| 0.7 |
| 60 |
| 0.8 |
| 59 |
| 0.8 |
|
Electronoroeste |
| 49 |
| 0.6 |
| 50 |
| 0.7 |
| 55 |
| 0.7 |
|
Electronorte |
| 50 |
| 0.6 |
| 54 |
| 0.7 |
| 57 |
| 0.8 |
|
Electrosur |
| 30 |
| 0.4 |
| 32 |
| 0.4 |
| 33 |
| 0.4 |
|
Total sales to our largest distribution companies |
| 3,226 |
| 39.2 |
| 3,808 |
| 50.3 |
| 5,194 |
| 68.8 |
|
|
|
|
|
|
|
|
|
|
|
|
|
|
|
Unregulated customers: |
|
|
|
|
|
|
|
|
|
|
|
|
|
ElectroPerú (2) |
| 2,775 |
| 33.7 |
| 1,821 |
| 24.1 |
| 0 |
| 0.0 |
|
Antamina |
| 644 |
| 7.8 |
| 652 |
| 8.6 |
| 668 |
| 8.9 |
|
Refinería |
| 635 |
| 7.7 |
| 614 |
| 8.1 |
| 974 |
| 12.9 |
|
Siderperú |
| 334 |
| 4.1 |
| 253 |
| 3.3 |
| 263 |
| 3.5 |
|
Total sales to our largest unregulated companies |
| 4,387 |
| 53.3 |
| 3,339 |
| 44.1 |
| 1,905 |
| 25.2 |
|
Total sales to our largest customers |
| 7,613 |
| 92.6 |
| 7,147 |
| 94.5 |
| 7,099 |
| 94.0 |
|
(1) The figures for Edelnor and Luz del Sur represent sales under bilateral contracts with Edegel only, and not withdrawals of these companies assigned to Edegel for non contract-related consumption. For 2008, 2009 and 2010, the energy sold to these distributors includes the amount won by Edegel in the bids realized since 2006. Edelnor is controlled by Enersis.
(2) Since 2006, ElectroPerú has been a customer of Edegel due to a merger with Etevensa. The contract with ElectroPerú expired in September 2009.
Our most important competitors in Peru are Enersur (GDF-Suez group, with an installed capacity of 1,038 MW); ElectroPerú (state-owned competitor, with an installed capacity of 989 MW); Egenor (Duke Energy Group, with an installed capacity of 650 MW); and Kallpa (Inkia Energy group, with an installed capacity of 566 MW).
Electricity Transmission Business Segment
CIEN
CIEN is wholly-owned by Endesa Brasil, and we hold a 54.3% economic interest in CIEN. CIEN consolidates CTM and TESA, which operate the Argentine side of the interconnection line with Brazil. CIEN represented 1.5% of our 2010 operating revenues and 1.6% of our operating income, both before consolidation adjustments. During 2010, CIEN received toll payments for using transmission lines from Argentina.
CIEN allows for the energy integration of Mercosur and the import and export of electricity between Argentina, Uruguay and Brazil. It has two transmission lines covering a distance of 500 kilometers between Rincón in Argentina and the Santa Catarina substation in Brazil, and a total installed capacity of 2,100 MW.
Electricity Distribution Business Segment
Our electricity distribution business is conducted in Chile through Chilectra, in Argentina through Edesur, in Brazil through Ampla and Coelce, in Colombia through Codensa and EEC, and in Peru through Edelnor. For the year ended December 31, 2010, our principal distribution subsidiaries and affiliates sold 67,274 GWh of electricity. For more information on energy sales by our distribution subsidiaries for the past five fiscal years, see “Item 3. Key Information — A. Selected Financial Data.” Currently, Chilectra is the technical operator of Edesur, Edelnor, Ampla and Coelce.
Chilectra
Chilectra is one of the largest electricity distribution companies in Chile in terms of number of the regulated clients, distribution assets and energy sales. Chilectra had consolidated operating income of Ch$ 112 billion for the year ended December 31, 2010. Our interest in Chilectra is 99.1%. Chilectra operates in a concession area of 2,118 square kilometers.
Chilectra transmits and distributes electricity in 33 municipalities of the Metropolitan Region. Its service area is defined primarily as a high density area under the Chilean tariff regulations governing electricity distribution companies and includes all residential, commercial, industrial, governmental and toll customers. The Metropolitan Region, where the capital city of Santiago is located, is Chile’s most densely populated area and has the highest concentration of industries, industrial parks and office facilities in the country. As of December 31, 2010, Chilectra served approximately 1.6 million customers.
As of December 31, 2010, Chilectra had an economic interest of 9.0% in Endesa Brasil. Chilectra holds a 35.6% economic interest in Ampla and a 10.8% interest in Coelce through Investluz and Endesa Brasil. Chilectra also owns a 9.4% interest in Codensa in Colombia, a 15.6% interest in Edelnor in Peru, and 34.0% interest in Edesur. There are no operator fees associated with Chilectra’s involvement in these companies.
Chilectra’s energy losses were 5.8% in 2010, compared to 6.1% in 2009. Chilectra has implemented proprietary billing and accounts receivable management systems, increased labor productivity and improved information systems.
For the fiscal year ended December 31, 2010, residential, commercial, industrial and other customers, who are primarily public and municipal, represented 27%, 27%, 23% and 23%, respectively, of Chilectra’s total energy sales of 13,098 GWh. For the five-year period ended December 31, 2010, physical energy sales increased at a compounded annual rate of 1.4%. For the year ended December 31, 2010, revenues from electricity sales were Ch$ 901 billion.
Total energy purchases reached Ch$ 719 billion, of which Ch$ 306 billion were from Endesa Chile, a related party.
Edesur
Edesur is the second largest electricity distribution company in Argentina in terms of energy purchases after Edenor, an unrelated company. Our economic interest in Edesur is 65.4%. Edesur operates in a concession area of 3,309 square kilometers. Edesur distributes electricity in the south-central part of the greater Buenos Aires metropolitan area. Its service area comprises the major business district of Buenos Aires and several residential areas of the southern part of Buenos Aires. As of December 31, 2010, Edesur distributed electricity to 2.4 million customers. Residential, commercial, industrial and other customers, primarily public and municipal, represented 41%, 26%, 8% and 25%, respectively, of Edesur’s total energy sales. It had energy losses of 10.5% in 2010, the same as in 2009. For the year ended December 31, 2010, revenues from electricity sales amounted to Ch$ 269 billion. In 2010, Edesur’s physical energy sales amounted to 16,759 GWh, increasing at a compounded annual rate of 3.1% during the 2006-2010 period.
Ampla
Ampla is the second largest electricity distribution company in the State of Rio de Janeiro, Brazil in terms of the number of clients and annual energy sales. As of December 31, 2010, we owned a 70.2% economic interest in Ampla. Ampla is engaged mainly in the distribution of electricity to 66 municipalities of the State of Rio de Janeiro and serves 2.6 million customers in a concession area of 32,615 square kilometers, with an estimated population of 8.0 million. As of December 31, 2010, residential, commercial, industrial and other customers represented 38%, 19%, 12% and 32%, respectively, of Ampla’s total sales of 9,927 GWh, increasing at a compounded annual rate of 3.4% during the 2006-2010 period. For the year ended December 31, 2010, revenues from electricity sales amounted to Ch$ 859 billion. As of December 31, 2010, Ampla’s energy losses were 20.5%, compared to 21.2% in 2009.
Coelce
We hold a 35.3% economic interest in Coelce, the sole electricity distributor in the State of Ceará, in northeastern Brazil, through a 60.1% interest in Investluz, which owns 56.6% of the capital stock of Coelce. As of December 31, 2010, Coelce served over 3.1 million customers within a concession area of 148,825 square kilometers. During 2010, Coelce had annual sales of 8,850 GWh, increasing at a compounded annual rate of 6.9% during the 2006-2010 period. Revenues from electricity sales represented Ch$ 789 billion.
Coelce has a relatively stable customer base, with residential customers representing 34% of energy sold. In 2010, Coelce bought 51% of its energy from Endesa Fortaleza and the other 49% from CCEARs. As of December 31, 2010, residential, commercial, industrial and other customers represented 34%, 19%, 17% and 31%, respectively, of Coelce’s total energy sales. As of such date, Coelce’s energy losses were 12.1%, compared to 11.6% in 2009.
Codensa
In 2009, during the privatization of state owned distribution companies, EEB and Codensa, formed a public vehicle called DECA, with EEB holding 51% of the capital and Codensa the remaining 49%.
We hold a 21.7% economic interest in Codensa, and due to a transfer of rights from another Endesa Spain subsidiary, we appoint the majority of the Board members and, therefore, control this company. Codensa is an electricity distribution company that serves a concession area of 18,217 square kilometers in Bogotá and 96 other municipalities in the Department of Cundinamarca, Tolima and Boyacá. More than 9.6 million people, or 23% of the Colombian population, live in Codensa’s service area, where it serves approximately 2.6 million customers. For the year ended December 31, 2010, revenues from electricity sales amounted to Ch$ 623 billion.
During 2010, Codensa’s annual sales reached 12,141 GWh, increasing at a compounded annual rate of 3.1% during the 2006-2010 period. Of these sales, residential, commercial, industrial and other customers represented 36%, 16%, 7% and 41%, respectively.
In 2010, Codensa purchased 47% of its energy from Emgesa, a generating company controlled by Endesa Chile, and 53% from other suppliers. Since 2001, Codensa only services regulated clients. The unregulated market is serviced directly by our generation company, Emgesa, with the exception of the public lighting in Bogotá.
In 2010, Codensa had energy losses of 8.2%, the same as 2009.
EEC
In 2009, the Colombian government awarded DECA an 82% shareholding in EEC. Codensa owns 49% of DECA. EEC is an electricity distribution company that serves a concession area of 5,186 square kilometers in the Department of Cundinamarca. It serves approximately 117,000 customers. For the year ended December 31, 2010, revenues from electricity sales amounted to Ch$ 35 billion. EEC’s annual sales reached 373 GWh, a 34.7% increase compared to 2009, and energy losses reached 17.7%, compared to 15.2% in 2009.
Edelnor
Edelnor is a Peruvian electricity distribution company of which 51.7% is owned by Distrilima. As of December 31, 2010, we owned an equity interest of 64.9% in Distrilima, which represents a 57.5% interest in Edelnor.
Edelnor operates in a concession area of 2,440 square kilometers. For the year ended December 31, 2010, the company had revenues from electricity sales of Ch$ 279 billion. Edelnor has an exclusive concession to distribute electricity in the northern part of the Lima metropolitan area, some provinces of the Lima department, such as Huaral, Huaura, Barranca and Oyón, and in the adjacent province of Callao. As of December 31, 2010, Edelnor distributed electricity to approximately 1.1 million customers, an increase of 3.5% from December 31, 2009.
For the year ended December 31, 2010, Edelnor had total energy sales of 6,126 GWh. The compounded annual growth rate in energy sales for period from 2006 to 2010 was 5.9%. Edelnor had energy losses of 8.3% in 2010, compared to 8.1% in 2009.
Total energy purchases reached Ch$ 168 billion, of which Ch$ 118 billion was from the related parties Edegel and EEPSA.
Non-Electricity Businesses
Non-electricity business represented less than 3.7% of our 2010 operating revenues and less than 0.5% of our 2010 operating income, both before consolidation adjustments.
CAM
CAM is a wholly-owned subsidiary that represented approximately 2.0% of our 2010 operating revenues before consolidation adjustments. CAM is engaged in the electrical parts procurement business and is the entity in charge of providing continuity to our engineering and electrical service activities, both in Chile and abroad. It also concentrates on managing large-scale services for public utility companies, especially in the electricity, telecommunications, gas and water distribution sectors.
During the last quarter of 2009, the Board of Directors of Enersis authorized the sale of CAM’s because it was considered “non core” business. On December 20, 2010, the Board of Directors of Enersis accepted the offer received for its total equity interest in CAM presented by Graña y Montero S.A.A., a Peruvian company, which offered $ 20 million in cash, subject to price adjustments to be made at the closing of the sale operation, which occurred on February 24, 2011.
Synapsis
Synapsis is a wholly owned subsidiary that represented 1.0% of our 2010 operating revenues before consolidation adjustments. It is engaged in the information system business. Synapsis provides IT solutions (outsourcing, hardware, data center, consulting) to the services, energy, telecommunications and public administration markets.
During the last quarter of 2009, the Board of Directors of Enersis authorized the sale of Synapsis’ because it was considered “non core” business, though the potential sale was not considered as highly probable until September 2010. On December 20, 2010, the Board of Directors of Enersis accepted the offer received for its total equity stake in Synapsis presented by Riverwood Capital L.P., a private equity fund located in the United States, which offered $ 52 million in cash, subject to price adjustments to be made at the closing of the sale operation, which occurred on March 1, 2011.
Inmobiliaria Manso de Velasco (IMV)
IMV, a wholly owned subsidiary, develops real estate projects in Chile and represented less than 0.2% of our 2010 operating revenues before consolidation adjustments.
ELECTRICITY INDUSTRY REGULATORY FRAMEWORK
Chile
Industry Structure
The electricity industry in Chile is divided into three business segments: generation, transmission and distribution. The generation segment consists of companies that produce electricity. They sell their production to distribution companies, unregulated customers, or to other generation companies. The transmission segment consists of companies that transmit the electricity produced by generation companies through high voltage lines over 23kV. Finally, the distribution segment is defined for regulatory purposes to include all electricity supply to end users at a voltage no higher than 23 kV.
The electricity sector in Chile is regulated pursuant to Decree with force of Law No. 4 of 2006, as amended, known as the Chilean Electricity Law.
In Chile there are four separate interconnected electricity systems. The main systems that cover the most populated areas of Chile are the SIC, which services the central and south central part of the territory, where 93% of the Chilean population lives, and the SING, which operates in the northern part of the country, where most of the mining industry is located. According to the 2002 census, 6% of the Chilean population lived in the territory serviced by the SING. In addition to the SIC and the SING, there are two isolated systems in southern Chile that provide electricity in remote areas, where no more than 1% of the population lives. The operation of electricity generation companies in each of the two major interconnected
electricity systems is coordinated by their respective dispatch center, or CDEC, an autonomous entity that involves industry groups, transmission companies and large customers. CDEC coordinate the operation of their system as efficient markets for the sale of electricity, in which the lowest marginal cost producer is usually used to satisfy demand at any moment in time. As a result, at any specific level of demand, the appropriate supply will be provided at the lowest possible cost of production available in the system.
Chilean Electricity Law
General
The goal of the Chilean Electricity Law is to provide incentives to maximize efficiency and to provide a simplified regulatory scheme and tariff-setting process which limits the discretionary role of the government by establishing objective criteria for setting prices. The expected result is an economically efficient allocation of resources. The regulatory system is designed to provide a competitive rate of return on investment to stimulate private investment, while ensuring the availability of electricity service to all who request it.
Three governmental entities have primary responsibility for the implementation and enforcement of the Chilean Electricity Law: the Ministry of Energy, the Chilean National Energy Commission (CNE) and Superintendency of Electricity and Fuels (SEF). The Ministry of Energy, created in 2009, develops and coordinates plans, policies and standards for the proper operation of the sector, approves tariffs and node prices set by the CNE, and regulates the granting of concessions to electricity generation, transmission and distribution companies. CNE is the technical entity in charge of defining prices, technical standards and regulatory requirements. SEF monitors the proper operation of electricity, gas and fuel sectors in compliance with the law in terms of safety, quality, and technical standards. There are also other entities related to the energy sector: the Chilean Nuclear Energy Committee in charge of research, development, use and control of nuclear energy, and the Chilean Energy Efficiency Agency, in charge of promoting energy efficiency.
In each transmission system, the pertinent CDEC coordinates the operations of generation companies, in order to minimize the operating costs in the electricity system and monitor the quality of service provided by the generation and transmission companies. Generation companies satisfy their contractual sales requirements with dispatched electricity, whether produced by them or purchased from other generation companies in the spot market.
Sales by Generation Companies to Unregulated Customers
Sales by generation companies may be made to final unregulated customers or to other generation companies under freely negotiated contracts. To balance their contractual obligations with their dispatch, generators have to trade deficit and surplus electricity at the spot market price, which is set hourly by each CDEC, based on the marginal cost of production of the next kWh to be dispatched.
Sales to Distribution Companies and Certain Regulated Customers
Regulated customers are those with a maximum consumption capacity not exceeding 0.5 MW. Customers between 0.5 and 2 MW may choose their status as regulated or unregulated. Customers with capacity needs over 2 MW are unregulated. Historically, sales to distribution companies for resale to regulated customers were made through contracts at regulated prices set by CNE (node prices) in effect at the relevant locations (or nodes) on the interconnected system through which such electricity was supplied. Nevertheless, since 2005 all new contracts between generation and distribution companies for the supply to regulated customers must arise from international bids which have a maximum offer energy price based on the average price paid by the unregulated customers at the time that the bid takes place, which is calculated twice a year by the CNE. If a first bid is unsuccessful, authorities may increase this maximum price by an additional 15%. The bids are awarded on a minimum price basis. The average prices associated with these bids are transferred directly to end users, replacing the regulated node price regime. During the life of the contracts, the energy and capacity prices are indexed according to formulas set forth in the bid documentation and linked to fuel, investment and other costs of energy generation. Under the bid system, all distribution companies have separate electricity contracts for their regulated and unregulated customers from 2010 onwards.
International Bids for Supplying Regulated Customers
The first international auction for the supply to distribution companies’ regulated customers took place in 2006. Chilectra submitted bids in November 2006, July 2007 and March 2008, allocating 100% of the power requirements tendered for the 2010-2025 period. Prices obtained by Chilectra as part of these tenders are consistent with the system’s long-term expansion technology and prices are indexed to the CPI, the price of coal and LNG.
During 2009, Chilectra did not launch any bidding process. A fourth bidding process during 2010 is under assessment for power requirements starting in 2014; this bidding process should be awarded during the first half of 2011. With its existing contracts, Chilectra is expected to meet the demand of its regulated customers until 2013.
Sales of Capacity to Other Generation Companies
Each CDEC determines a firm capacity for each power plant on an annual basis. Firm capacity is the highest capacity which a generator may supply to the system at certain peak hours, taking into consideration statistical information regarding the time it is out of service for maintenance and extremely dry conditions for the operation of hydroelectric plants.
A generation company may be required to purchase or sell capacity in the spot market, depending upon its contractual requirements in relation to the amount of electricity to be dispatched from such company and to its firm capacity.
Transmission
Since transmission assets are built pursuant to concessions granted by the government, the law requires a company to operate on an “open access” basis, in which users may obtain access to the system by contributing towards the costs of operating, maintaining and, if necessary, expanding the system.
The main transmission system consists of 220 kV or higher voltage lines that are used by generators and consumers. Every 4 years a study is done to value the existing system and to define the expansion plan. On December 31, 2010 the study was delivered to the CNE and is currently under review. The main transmission system is paid mainly by generators and less by customers. The annual value of transmission is fixed by a Decree of the Ministry of Energy.
Subtransmission
Subtransmission systems are high voltage lines over 23 kV used mainly by customers. There are seven subtransmission systems defined by decree. Chilectra owns most of the system SIC 3. Every four years a study is done to value the optimal system adapted to demand. On September 21, 2010 the study was delivered to the CNE and is currently under review. The subtransmission systems are paid mainly by customers according to the values fixed by decree of the Ministry of Energy. Generators and unregulated customers pay only for the lines they use in each system.
Distribution Tariffs to Final Customers
The tariffs charged by distribution companies to final customers are determined by the sum of the cost of electricity purchased by the distribution company, a transmission charge and the “value added from distribution of electricity,” or VAD, which allows distribution companies to recover their operating costs. The price for both generation and distribution capacity sold to customers includes a factor which reflects the simultaneous contribution of each customer to peak capacity demand of the system as a whole. The transmission charge reflects the cost paid for electricity transmission and transformation. The VAD includes an allowed return on investment.
VAD Rates
The VAD is based on a “model company” and includes: selling, general and administrative distribution costs; maintenance and operating costs of distribution assets; cost of efficient energy losses; and an expected return on investment, before taxes, of 10% per year in real terms based on the replacement cost of assets used for distribution.
To this end, the CNE selects a company, to which it applies efficiency guidelines which results in a cost structure for the “model company” for each Typical Distribution Area, as described below. The rate is not based on actual costs incurred by any given distribution company, but on investment, operating, maintenance and general administrative standards and overall efficiency of operations for the model company, which is used as a benchmark.
Distribution Tariff-Setting Process
The VAD is set every four years. The CNE classifies companies into groups, according to Typical Distribution Areas, based on economic factors that group companies with similar distribution costs due to population density, which determines equipment requirements in the network.
Actual return on investment for a distribution company depends on its performance relative to the standards chosen by the CNE for the model company. The tariff system allows for a greater return to distribution companies that are more efficient than the model company. Tariff studies are performed by the CNE and distribution companies. Tariffs are estimated as a weighted average of the results of the CNE-commissioned study and the companies’ study, with the results of the CNE’s study bearing twice the weight of the companies’ results. Preliminary tariffs are tested to ensure that they provide an average actual annual internal rate of return between 6% and 14% on the replacement cost of electricity-related assets for the entire distribution segment.
The last process for setting distribution tariffs for Chilectra and the other distribution companies was held in 2008 and will be in effect until November 3, 2012.
Associated electrical services
Along with the VAD rate process for 2008, the CNE published a report on associated electrical services. Agents, generation, transmission and distribution companies submitted their comments. Final rates were published on December 4, 2009. These associated electrical services regulate the rates that can be charged for items such as meter rental and disconnection and reconnection of electricity supply.
Concessions
The law permits generation activity without a concession. However, companies may apply for a concession to facilitate access to third-party properties. Third-party property owners are entitled to compensation, which may be agreed to by the parties or, if there is no agreement, it may be determined by an administrative proceeding that may be appealed in the Chilean courts.
Fines and Compensations
If a rationing decree is enacted in response to prolonged periods of electricity shortages, severe penalties may be imposed on generation companies that contravene the decree. A severe drought is not considered a force majeure event.
Generation companies may also be required to pay fines to the regulatory authorities, related to system blackouts due to any generator’s operational mistake, including failures related to the coordination duties of all system agents as well as to make compensatory payments to electricity consumers affected by shortages of electricity. If generation companies cannot satisfy their contractual commitments to deliver electricity during periods when a rationing decree is in effect and there is no energy available to purchase in the system, the generation company must compensate the customers at the failure cost determined by the authority in each tariff setting.
Distribution companies may be required to compensate final customers if there are shortages of electricity that exceed the authorized standards. These compensatory payments shall be at an amount equal to double the non-supplied energy at failure cost.
Environmental Regulation
The Chilean Constitution grants all citizens the right to live in a pollution-free environment. It further provides that other constitutional rights may be limited in order to protect the environment. Chile has numerous laws, regulations, decrees and municipal ordinances that address environmental considerations. Among them are regulations relating to waste disposal (including the discharge of liquid industrial wastes), the establishment of industries in areas in which they may affect public health, and the protection of water for human consumption.
Environmental Law No. 19,300 was enacted in 1994 and implemented by several rules, such as the Environmental Impact Assessment System Rule issued in 1997 and modified in 2001. This law requires companies to conduct environmental impact study or declaration of any future generation or transmission projects.
In January, 2010, Law No. 19,300 was modified by Law No. 20,417, which introduced changes in the environmental assessment process and in the public institutions involved in it. Consequently, the environmental assessment process is coordinated by the Environmental Assessment Service, and not by the Chilean Environmental Commission, or Conama, which was repealed, as of October 1, 2010. Enersis’ subsidiaries apply the guidelines of the new law when analyzing the development of future projects.
On April 1, 2008, Law No. 20,257 was enacted, and amended the General Services Law. The purpose of the amendment is to promote the use of Non-Connventional Renewable Energy (“NCRE”). This law defines the different types of technologies considered as NCRE, and establishes the obligation of generators between 2010 and 2014, to supply at least 5% of the total energy contracted as of August 31, 2007, to be of such type, and to progressively increase this percentage 0.5 percentage points annually up to 10% as of 2024. Currently, our power plants recognized as NCRE generators are Palmucho, Canela wind farms and Ojos de Agua. Additionally, the law sets forth fines for the generators that do not comply with this obligation. Endesa Chile fully complied with this obligation during 2010 and generated excess energy with NCRE, with the capacity to sell the surplus to other generators. The additional cost of generating with NCRE is being charged as a pass-through in the new contracts, thus eliminating an impact to our revenues.
During 2010, the government has been working on a new regulation for thermal plants emissions, which is expected to take effect during 2011. This rule will regulate emissions of particulate matter (PM 10), sulfur dioxide (SO2), nitrogen oxides (NOx) and mercury, both for existing and new power plants. This rule provides a transition period for existing plants, in order to have time to make the required investments in order to comply with such regulations. Also, a quality standard is being developed that regulates fine particulate matter (PM 2.5).
Water rights
Endesa Chile owns unconditional, absolute and perpetual property water rights granted by the Chilean Water Authority. Chilean generation companies must pay an annual fee for unused water rights. License fees already paid may be recovered through monthly tax credits commencing on the start-up date of the project associated with the water right considered. The maximum license fees to be recovered are those paid during the 8 years before the start-up date. As of the date of this report, Enersis’ subsidiaries have not recovered any license fees already paid. During 2010, we paid Ch$ 2,700 million for 2009 water rights located in the SIC area. This amount may vary in the future according to the actual water rights we may hold each year. Enersis’ subsidiaries continuously analyze which water rights it will maintain, disregard or acquire. We estimate that in 2011 we will pay fees for an aggregate of Ch$ 2,886 million. Thereafter, the water rights law requires an annual fee that will be doubled and will thereafter remain flat for five years, at which point the license fee will be doubled once again. In the case of water rights located in the extreme south of Chile, outside the area comprised by the SIC, the license fees will be paid starting as of January 1, 2012, even though, Enersis’ subsidiaries do not and will not have any water rights in that area.
Argentina
Introduction
Law No. 15,336 of 1960 and Law No. 24,065 of 1992 (together, the Argentine Electricity Act) set the regulatory framework for the electricity sector.
Under the Argentine Electricity Act, the Federal Government:
· Divided the electricity industry into three business segments: generation, transmission and distribution, enabling the electricity market development under conditions of free competition for generation with reduced tariffs, establishing requirements regarding quality standards, and restricting ownership concentration;
· Created the Mercado Eléctrico Mayorista (Wholesale Electricity Market) or “MEM” where four categories of agents (generators, transmitters, distributors and large customers) are allowed to buy and sell electricity as well as related products;
· Imposed the Compañía Administradora del Mercado Mayorista Eléctrico (Administrative Company for the Wholesale Electricity Market) or “CAMMESA,” responsible for the dispatch coordination, the administration of the agent’s transactions in the MEM and the calculation of spot prices; and
· Created the Ente Nacional Regulador de la Electricidad (Electricity National Regulatory Agency) or “ENRE,” in charge of regulating public service activities in the electricity sector and imposing jurisdictional decisions.
The Ministry of Federal Planning, Public Investment and Services, through the Secretariat of Energy, is primarily responsible for the implementation of the Argentine Electricity Act. Among the main tasks, the Secretariat regulates the system dispatch and the activities in the MEM, and grants the concessions or authorization for each activity in the electricity
sector. The Secretariat of Energy is also responsible for policy setting in the oil and natural gas sector, with its direct impact on thermal generators and the electricity sector.
Industry structure
The generation sector is organized on a competitive basis, with independent generators selling their output on the MEM’s spot market or through private contracts to purchasers on the MEM’s contract market or to CAMMESA through special transactions like contracts under Resolutions SE No. 220/2007 and No. 724/2008.
Transmission works under monopoly conditions and is comprised of several companies to whom the Federal Government grants concessions. One concessionaire operates and maintains the highest voltage facilities and eight concessionaires operate and maintain high and medium voltage facilities, to which generation plants, distribution systems and large customers are connected. The international interconnected transmission systems also require concessions granted by the Secretariat of Energy. Transmission companies are authorized to charge different tolls for their services.
Distribution is a public service that works under monopoly conditions and is provided by companies who have also been granted concessions. Distribution companies have the obligation to make electricity available to end users within a specific concession area, regardless of whether the customer has a contract with the distributor or directly with a generator. Accordingly, these companies have regulated tariffs and are subject to quality service specifications. Distribution companies may obtain electricity either in the MEM’s spot market, at a price called “seasonal price,” or in the MEM’s term market through private contracts with generators. The seasonal price, defined by the Secretariat of Energy, is the cap for the costs of electricity bought by distributors and passed through to regulated customers.
There are three electricity distribution areas subject to federal concessions. The concessionaires are Edelap, Edesur and Edenor which are located in the cities of La Plata (Edelap) and Buenos Aires and Greater Buenos Aires area (Edesur, which is controlled by us, and Edenor). Edelap and Edenor are unrelated distribution companies. The local distribution areas are subject to concessions granted by the provincial or municipal authorities. However, all distribution companies acting in the MEM must operate under its rules.
Regulated customers are supplied by distributors at regulated tariffs, unless they have a minimum capacity demand of 30 kW, in which case they can choose to contract their supply directly from generators in the MEM´s spot market, becoming “large customers” who may freely negotiate their prices with generating companies.
Traders are also authorized to act as participants in the MEM. They buy and sell energy and related products from and for agents of the MEM, including electricity royalty payments received by the provinces.
No generator, distributor, large user, nor any company controlled by any of these or controlling the same, may be either owner or a major shareholder of a transmission company or of its controlling companies. At the same time, transmission companies are prohibited from generating, distributing, purchasing and/or selling electricity. Distribution companies are prohibited from owning generation units.
Dispatch and Pricing
CAMMESA controls the coordination of dispatch operations, the spot prices calculation and the administration of the MEM’s economic transactions. CAMMESA is also obliged to comply with special instructions given by the Secretariat of Energy in order to enter into transactions with certain generators in order to buy electricity. All generators that are MEM agents have to be connected to the Sistema Argentino de Interconexión (Argentine Interconnected System) or “Argentine NIS” and are obliged to comply with the dispatch order to generate and deliver energy to the Argentine NIS, in order to be sold in the spot market or in the term market. Distribution companies, traders and large users that have entered into private supply contracts with generation companies, pay the contractual price directly to the generator and also pay a toll to the transmission and/or distribution company for the use of their systems.
The spot price is calculated on an hourly basis by CAMMESA and must reflect the cost of the marginal kW to be dispatched in the Argentine NIS and is paid to generators and sellers of energy at the spot market. The Argentine Electricity Act sets that electricity prices in the spot market are determined on a marginal cost basis. Since 2002, the Secretariat of Energy started to modify several criteria regarding the spot prices and imposed, among other restrictions, caps for the spot prices to be paid to generators and only recognized for calculation purposes the natural gas costs established by the Federal Government, even though additional costs are collected by the market and paid to the generator.
In order to stabilize the prices for distribution tariffs, the market has a seasonal price as the energy price to be paid by distributors for their purchases of electricity traded in the spot market. It is a fixed price determined every six months by the Secretariat of Energy after CAMMESA recommends the seasonal price level for the next period according to its estimated spot price, which is based on its evaluation of the expected supply, demand and available capacity, as well as other factors. The seasonal price is maintained for at least 90 days. Since 2002, the Secretariat of Energy has been approving seasonal prices lower than those recommended by CAMMESA.
Regulatory Developments: the industry after the Public Emergency Law
General
Law No. 25,561, the Public Emergency Law, was enacted in 2002 to manage the public crisis which began that year. It forced the renegotiation of public service contracts (such as electricity transmission and distribution concession contracts) and imposed the conversion of dollar denominated obligations into Argentine pesos at a pegged rate of Ar$ 1 per $ 1. It also empowered the Federal Government to implement additional monetary, financial and exchange measures to overcome the economic crisis in the medium term. These measures have been periodically extended. In fact, Law No. 26,563, enacted in December 2009, extended the measures until December 31, 2011.
The Secretariat of Energy introduced several regulatory measures aimed to correct the effects of the devaluation into the MEM’s costs and prices and to reduce the price to be paid by the end users.
Generation
The mandatory conversion of transmission and distribution tariffs from dollars to Argentine pesos at the pegged rate of Ar$ 1 per $ 1 as of 2002, when the market exchange rate was approximately Ar$ 3 per $ 1, and the regulatory measures to cap and reduce the spot and seasonal prices hindered the pass through of generation variable costs into the tariffs to end users.
Resolution SE No. 240/2003 changed the way to fix spot prices, decoupling the spot price calculation from the marginal costs of operation. Until this resolution, spot prices on the MEM were typically fixed by units operating with natural gas during the warm season (from September through April) and units operating with fuel/diesel in the winter (May-August). Then, due to restrictions on natural gas supply, winter prices were higher, and related to imported fuels priced in dollars. Resolution SE No. 240/2003 seeks to avoid the pegged price indexation to the dollar and, although generation dispatch is still based on actual fuels used, the calculation of the spot price under the Resolution is defined as if all dispatched generation units did not have the existing restrictions on natural gas supply. Water value is not considered if its opportunity cost is higher than the cost of generating with natural gas. The resolution also set a cap on the spot price at 120 Ar$/MWh, which was still valid during 2010. The real variable costs of thermal units burning liquid fuels were paid by CAMMESA through the Transitory Additional Dispatch Cost (Sobrecosto transitorio de despacho, STD) plus a margin of 2.5 Ar$/MWh, according to the Notes SE 6,866 of 2009 and 6,169 of 2010, valid from May 2010 until December 2011.
The government avoided the increase in electricity tariffs to end users and seasonal prices were maintained substantially fixed in Argentine pesos, although gas producers received price revisions by the authority, recovering part of the value that they lost with the devaluation. In this scenario, CAMMESA sells energy to distributors who pay seasonal prices, and buys energy from generators at spot prices that recognize rising gas prices and at a contractual prices defined by the instructions of the Secretariat of Energy. To overcome this in balance, the authority — through Resolution SE N° 406/2003 — only allows payments to generators for amounts collected from the purchasers in the spot market. This Resolution set a priority of payment for different services: capacity payment, fuel cost and energy sales margin, among others. CAMMESA accumulates debt with generators, and the system gives an incorrect price signal to the agents by not encouraging savings in electricity consumption or investments to satisfy the growth in electricity demand, including investments in transmission capacity.
Additionally, generators suffer a reduction of estimated income from contract prices because they are reduced as a consequence of the spot price level.
In order to enhance the energy supply, the Secretariat of Energy created different schemes to sell “more reliable energy.” Resolution 1,281/2006 created the Energy Plus Service, which is the offer of new electricity capacity to supply the growth in electricity demand, over the “Base Demand,” which was the demand for electricity in 2005. The Energy Plus Service is supplied by generators that install new capacity or that offer existing generation capacity not connected to the NIS before. All “large customers” that, as of November 1, 2006, had a higher demand than their Base Demand, had to contract excess demand with the Energy Plus Service. The consumption that exceeded the Base Demand without a supply contract should pay additional amounts for the surplus energy. The price of the contracts for Energy Plus Service have to be approved by the
relevant authorities. Consumption of unregulated customers that could not be secured by an Energy Plus Service contract could request CAMMESA to conduct an auction to satisfy their demand.
Resolutions SE No. 220/2007 and No. 724/2008 give thermal generators the opportunity to reduce some of the adverse effects of Resolution SE No. 406/2003 by entering into MEM Supply Commitment Contract or “CCAM.” Generators can perform maintenance or repowering investments to improve their unit’s availability and add additional capacity to the system. After authorization, the generator can sign a CCAM at prices that permit the recovery of capital expenditures. Additionally, energy sales through a CCAM receive payment priority compared with spot energy sales (Res. No. 406/2003). Generators with a CCAM can supply energy to CAMMESA for up to 36 months, renewable only for an additional period of six months.
During 2009, Resolution SE No. 762 created the Hydroelectric National Program to promote the construction of new hydro plants. The program enables authorized generators to subscribe energy supply contracts with CAMMESA for up to fifteen years at prices that allow for an investment payback.
The Federal Government has adopted several other measures to promote new investments, including: auctions to expand the capacity of natural gas transportation and of electricity transmission; the implementation of certain projects for the construction of power plants; the creation of fiduciary funds to finance these expansions; and the awarding of contracts with renewable energy, called “GENREN program”. For more details, refer to “Environmental regulation” below. Law No. 26,095 of 2006 created specific charges that must be paid by end users to finance new electricity and gas infrastructure projects. The Federal Government has also enacted some regulations to promote the rational and efficient use of electricity.
On November 25, 2010, the Secretariat of Energy signed an agreement with some generation companies, including Enersis’ subsidiaries, in order to: i) increase thermoelectric unit availability, increase energy and capacity prices and ii) develop new generation units through the contribution of outstanding debts of CAMMESA owed to the generation companies.
FONINVEMEM
Resolution SE No. 712/2004 created FONINVEMEM, a fund whose purpose is to increase electricity capacity/generation within the MEM. Pursuant to Resolution SE No. 406/2003, the Secretariat of Energy decided to pay the generators the spot prices up to the amount available at a stabilization fund, after collecting the funds from the purchasers in the spot market at seasonal prices, lower than spot prices for the same period. FONINVEMEM would receive the differences between spot prices and payments to sellers, according to Resolution SE No. 406/2003, from January 1, 2004 to December 31, 2006. CAMMESA was appointed to manage the FONINVEMEM.
Pursuant to Resolution SE No. 1,193/2005 all private generators in the MEM were called to participate in the construction, operation and maintenance of the electric energy generation plants to be built with the FONINVEMEM, consisting of two combined cycle generation plants of approximately 850 MW each, which were finished during 2010 as combined cycle plants. These power plants are powered by natural gas or alternative fuels.
Because of the insufficient resources to conclude the plants, Resolution SE No. 564/2007 gathered all of the MEM’s private sector generators to commit to FONINVEMEM by including the differences between spot prices and payments made pursuant to Resolution SE No. 406/2003 for an extra period ending December 31, 2007.
Transmission and distribution
Transmission and distribution companies have been renegotiating contracts since 2005 and although tariffs were partially and temporarily established, definitive tariffs are still pending.
As a result, although the terms to define energy prices pursuant to the Argentine Electricity Act are still in force, their implementation reflects the measures taken by the authorities that reduce compensation for all electricity companies.
During 2006, our subsidiary Edesur entered into an “Agreement for Renegotiation of Concession Contract.” This Agreement established among several conditions, a transitional tariff regime, a regime for the quality of service, and an Integral Rate Revision Process (RTI) to be implemented by ENRE according to Law No. 25,561. This would set conditions for a new tariff regime for a five year period. Under the framework of the RTI process, Edesur presented to ENRE in December 2009 its Tariff Proposal, as well as the support studies, according to requirements established by the regulator in Res. ENRE 467/08. The aforementioned presentation only included the income requirements without the rate proposals,
which were later presented to ENRE in May of 2010. As of the date of this report, ENRE has not defined new tariffs and maintains in force the transitional tariff regime.
Resolution No. 45/2010 of the Secretary of Energy
Resolution No. 45/2010 determined bonus payments to residential customers under the Energy Efficiency Program (Puree), particulary those whose demand is less than 1,000 kWh every two months. Puree was created in 2004 and established bonuses and penalties to customers depending on the level of energy savings; the net difference between the bonuses and penalties was originally deposited in the Stabilization Fund, but this was subsequently modified at the request of Edesur and Edenor, which were authorized by the Secretary of Energy to use 100% of these resources to compensate for its cost variations that were not transferred to the tariffs paid by regulated customers. ENRE monitors these distribution costs with a mechanism called MCC (monitoring cost mechanism).
Resolutions ENRE No. 525/2010 and 551/2010
Resolution ENRE N° 525/2010 of September 22 and Resolution ENRE No. 551/2010 of October 6, 2010, published on January 4, 2011, suspended the dividend distribution procedure of clause 7.4 of the Agreement Act (concession agreement). Resolution No. 525/2010 postponed dividend distribution initially for 180 days and Resolution No.525/2010 postponed it indefinitely. ENRE based this determination on alleged non-compliance of required information of the investment plan and deterioration of the conditions of service provision. ENRE determined that the Investment Plan 2010 should amount to at least Ar$ 414 million, in order to improve quality of service, especially in the municipalities of the greater Buenos Aires area. Additionally, Edesur was required to present a detailed Program of Operational Regularization (POR) which would be monitored by a committee composed of the municipalities of the concession area.
Natural gas market
End customers’ demand for natural gas peaks during winters. In this season, there have been natural gas shortages to supply power plants for several years. In order to assure internal supply, thermal generators consume alternative fuels, such as diesel and fuel oil. Since 2002, the lack of investment in natural gas production forced the system to burn increasing amounts of liquid fuels. In 2004, the Argentine government entered into an agreement with Venezuela to guarantee fuel oil supplies until 2010.
To improve the natural gas supply, the government has adopted different actions. Since 2004, local gas producers and the government have entered into various agreements to guarantee gas supply at rising prices. In July 2009, the last agreement was signed, establishing a 30% increase in the natural gas tariff to power producers until December 2009. Additionally in 2006, Argentina and Bolivia entered into a 20-year agreement under which Argentina has the right to receive up to 28 million cubic meters daily of natural gas. During the winters of 2008, 2009 and 2010, various ships arrived at Bahía Blanca with LNG for the system.
An additional measure related to natural gas in recent years was the creation of the Electronic Gas Market (MEG). Through the MEG, the regulatory authorities increased the transparency of physical and commercial operations in the spot market.
Export and Import of Energy
In order to give priority to the internal market supply, the Secretariat of Energy adopted additional measures that restricted electricity and gas exports. Resolution SE No. 949/2004 established measures that allowed agents to export and import electricity under very restricted conditions. These measures prevented generators from satisfying their export commitments.
The Secretariat of Energy published Disposition No. 27/2004, together with related resolutions and decrees, which created a plan to ration natural gas exports and the use of transport capacity. These norms implied the beginning of restrictions for gas delivery to Chile and Brazil. These restrictions are expected to continue, especially considering that during 2010, Resolution Enargas No. 1410 was published, which modified the procedures for gas dispatch starting in October 2010. According to that resolution, the priority of gas dispatch is as follows: i) residential and commercial users; ii) the Compressed Natural Gas market; iii) large customers; iv) thermal units; and v) exports.
Environmental Regulation
Electricity facilities are subject to federal and local environmental laws and regulations, including Law No. 24,051, or the Hazardous Waste Law, and its ancillary regulations.
Certain reporting and monitoring obligations and emission standards are imposed on the electricity sector. Failure to satisfy these requirements entitles the government to impose penalties, such as suspension of operations, which, in case of public services, could result in the cancellation of concessions.
Law No. 26,190, enacted in 2007, defined the use of renewable resources for electricity production as a national interest and set as a target 8% market share for generation from renewable energies within a term of 10 years. During 2009, the government took actions to reach this objective, launching an international auction to promote the installation of up to 1,000 MW of renewable capacity, publishing Resolution No. 712/2009. This resolution created a mechanism to sell renewable energy through fifteen-year contracts under special price conditions. In June 2010, the “GENREN program” awarded a total of 895 MW, distributed in 754 MW of wind power; 110 MW of bio-fuels; 11 MW of mini-hydro; and 20 MW of solar units. The prices awarded vary from $ 150/MWh (for mini-hydro units) to $ 598/MWh (for solar units).
Brazil
Industry Structure
Brazil’s electricity industry is organized into one large interconnected electricity system, which is known as the Sistema Interligado Nacional (the Brazilian NIS), which comprises most of the regions of Brazil, and several other small, isolated systems.
Generation, transmission and distribution are legally separated activities in Brazil. According to the specifications set forth in Law No. 9,427/96, unregulated consumers in Brazil are currently those customers who: (i) demand at least 3,000 kW and choose to contract the energy supply directly with generators or retailers; or (ii) demand capacity in the range of 500-3,000 kW and choose to contract the energy supply directly with alternative generators or traders.
The electricity industry in Brazil is regulated by the Federal Government, acting through the Ministry of Mines and Energy, or MME, which has exclusive authority over the electricity sector, and whose primary role is to establish the policies, guidelines and regulations for the sector. Regulatory policies are implemented by the Brazilian governmental agency for electric energy or ANEEL, whose main responsibilities include, among others: (1) supervision of the concessions for electricity sale, generation, transmission and distribution ; (2) enactment of regulations for the electricity sector; (3) implementation and regulation of the exploitation of electricity resources, including the use of hydroelectricity; (4) promotion of a bidding process for new concessions; (5) resolution of administrative disputes between electricity sector agents; and (6) setting the criteria and methodology for determining distribution and transmission tariffs, as well as the approval of all the electricity tariffs.
Other regulatory authorities include: (i) the Brazilian Electricity System Operator (ONS), comprised of generation, transmission and distribution companies, and independent consumers, responsible for the coordination and control of the generation and transmission operations of the Brazilian NIS, subject to the ANEEL’s regulation and supervision; (ii) the Electricity Trading Board (CCEE), a non-profit company subject to authorization, inspection and regulation by ANEEL whose main purpose is to carry out the wholesale transactions and trading of electric power within the Brazilian NIS by registering the agreements resulting from market adjustments and whose agents are gathered into four categories: Generation, Distribution, Trading and Consumers and; and (iii) the National Energy Policy Council (CNPE), which is in charge of developing the national electricity policy.
Deregulation and Privatization
The Concessions Law (No. 8,987) and the Power Sector Law (No. 9,074), both enacted in 1995, intend to promote competition and attract private capital into the electricity sector. Since then, several assets owned by the Federal Government of Brazil and/or state governments have been privatized.
Independent Power Producers and Self-Producers
The Power Sector Law also introduced the concept of independent power producers, or IPPs, in order to open the electricity sector to private sector investment. IPPs are single agents, or agents acting in a consortium, who receive a concession, permit or authorization from the Brazilian government to produce electricity for sale on their own account.
The Concessions Law also provides that, upon receiving a concession, IPPs, self-producers, suppliers and consumers will have access to the distribution and transmission systems owned by other concessionaires, provided that they are reimbursed for their costs as determined by ANEEL.
Law No. 9,648/98 created the wholesale energy market, composed by the generation and distribution companies. According to this market regulation, the purchase and sale of electricity are freely negotiated.
Pursuant to Law No. 10,433/02, the wholesale energy market structure came to be closely regulated and monitored by ANEEL, which is also responsible for setting wholesale energy market governance rules including measures to stimulate permanent external investment.
Law No. 10,848/04 seeks to maintain public service for the production and distribution of electricity to consumers within each concession area, restructures the planning system, guarantees transparency in the auction and bidding process for public projects to mitigate the systemic risks, maintains centralized and coordinated operations of the energy system, grants universal use and access to electricity throughout Brazil, and modifies the bidding process of public service concessions.
Structure of the Electricity Sector
The market regulation established pursuant to Laws No. 10,847 and 10,848 seeks to provide cheaper tariffs for consumers and guarantees the expansion of the system, with the Power Research Company, (EPE), a governmental body, responsible for the planning of generation and transmission activities. This market regulation has defined an unregulated contracting environment and a regulated environment.
In the unregulated contracting environment, the conditions for purchasing energy are negotiable between suppliers and their customers. Regarding the regulated environment, where distribution companies operate, the purchase of energy must be conducted pursuant to a bidding process coordinated by ANEEL.
Pursuant to the market regulations, 100% of the energy demand from distributors must be satisfied through long-term contracts in advance of the expiration of current contracts in the regulated environment.
Another change imposed on the electricity sector is the separation of the bidding process for “existing power” and “new power project.” The government believes that a “new power project” needs more favorable contractual conditions such as long term power purchase agreements (15 years for thermal and 30 years for hydro) and certain price levels for each technology. These agreements promote investment for the required expansion. On the other hand, “existing power”, which includes depreciated power plants, can sell their energy at lower prices in shorter term contracts.
Distribution
The Concessions Law establishes three kinds of revisions to final consumer tariffs: annual tariff resetting, and both ordinary and extraordinary tariff reviews.
Distribution companies’ pricing aims to maintain constant concessionaire operating margins by allowing for tariff gains due to costs beyond management’s control and by permitting the concessionaire to retain any efficiency gains achieved for defined periods of time. Tariffs to end users are also adjusted according to the variation of costs incurred in purchasing electricity.
Ordinary tariff reviews take into account the entire tariff-setting structure for the company, including the costs of providing services, the costs of purchasing energy and the return for the investor. Under their concessions, Coelce and Ampla are subject to tariff reviews every four and five years, respectively. The asset base consists of the market replacement value depreciated during their useful life from an accounting point of view, and the rate of return for the assets is based on the Weighted Average Cost of Capital, or WACC, for a model company. The operating and maintenance costs reflected in the tariff are calculated based on the model company which considers the singular characteristics of the distribution concession area.
The law guarantees an economic and financial equilibrium for a company in the event that there is a substantial change in its operating cost. In the event that the cost components over which management does not exert influence, such as energy purchases and taxes, increases significantly within the period between two annual tariff adjustments, the concessionaire may make a request to ANEEL to charge those costs to the final customers.
2010 Tariff Review
A tariff review applicable to Ampla was introduced on March 15, 2010, with an average 1.4% price reduction for all consumers and a 5.1% decrease for customers supplied in low voltage (households, commerce and rural customers). The tariffs were affected by a 24% decrease in the 2009 currency rate, which reduced the costs of purchasing power from Itaipú. The index was also affected by the negative effect of the Compensation for the Variation of Parcela A (CVA). CVA refers to the costs over which management does not have an influence.
The tariff revision applicable to Coelce was introduced on April 22, 2010, with an average 4.0% price increase for all consumers and a 4.2% increase for customers supplied in low voltage. The tariffs were affected principally by the variation of fossil fuels costs (CCC), which are a resource used by the Government to subsidize isolated systems in Northern Regions in Brazil; this represented half of the total rate adjustment.
Social Tariff for Electricity — New Regulation
ANEEL’s Resolution No. 407/2010 modified the Social Tariff regime for low income customers, which actually represent 60% and 30% of the base of customers for Ampla and Coelce, respectively. The new regulation could have a potential economic effect related to the 60% reduction in the subsidy for Coelce and 80% for Ampla until November 2011, as well as an effect on customer satisfaction and possible increases in energy theft and delays in payments of electricity bills. The modifications of the Social Tariff scheme include the requirement that low income beneficiaries of the social tariff must be registered in the federal social database programs and must have a family income lower than the minimum legal wage equivalent.
Concessions
Companies or consortia that intend to build or operate hydroelectric generation facilities with a capacity exceeding 30 MW or transmission networks in Brazil have to resort to a public tender process. Concessions granted to the holder give the right to generate, transmit or distribute electricity, as the case may be, in a given concession area for a certain period of time.
Concessions are limited to 35 years for new generation concessions and to 30 years for new transmission or distribution concessions. Existing concessions may be renewed at the Brazilian government’s discretion for a period equal to their initial term.
Electricity Sales
In the regulated market, electricity distribution companies buy the electricity through bids that are regulated by ANEEL and organized by CCEE. Distributors must buy electricity at public bids.
There are three types of regulated bids: new energy bids, existing energy bids and adjustment bids. The government also has the right to call special bids for renewable electricity (biomass, mini-hydro, solar and wind power). ANEEL and CCEE hold the bids annually. The contracting system is multilateral, with generating companies entering into contracts with all distributors who call for bids.
The unregulated market includes the sale of electricity between generation concessionaires, independent producers, self-producers, sellers of electricity, importers of electricity, unregulated and special consumers. It also includes contracts in place between generators and distributors until their expiration, at which point new contracts may be entered into under the terms of the new regulatory framework.
Hydroelectrical Energy Reassignment
Brazil created a special mechanism to share hydrological risk between all hydro generators, called Reallocating Energy Mechanism. Each hydro power plant has an assigned energy certificate which defines both the proportion of the total generated hydro energy owned by a plant and the maximum energy amount that the plant can sell through contracts. Differences between actual production and the assigned energy must be traded at a regulated fixed tariff (currently approximately $ 4/MWh).
Settlement Spot Price
The spot price is used to value the purchase and sale of electric power in the short term market. According to the law, CCEE is responsible for the setting of the electricity price in the spot market. This price is calculated on a marginal costs basis, modeling future operation conditions and setting a merit order curve with variable costs for thermal units and opportunity cost for hydroelectric plants, resulting in one price for each subsystem set for the week subsequent to the determination.
Fines applicable to agents in the electricity industry
Selling agents are responsible to the buying agent for payments if they are unable to satisfy their delivery obligations. ANEEL regulations set forth the fines applicable to electricity agents based on the nature and the materiality of the violation (including warnings, fines, temporary suspension of the right to participate in bids for new concessions, licenses or authorizations and forfeiture). For each violation, fines may be imposed for up to 2.0% of the concessionaire’s revenues arising from the sale of electricity and services provided (net of taxes) in the 12-month period immediately preceding any assessment notice.
ANEEL may also impose restrictions on the terms and conditions of agreements between related parties and, in extreme circumstances, terminate such agreements.
A party defaulting on payment of contributions to subsidy funds for the promotion and development of the electricity sector or any other payments due by virtue of the purchase of electricity in the ACR (regulated contract environment) or from Itaipú cannot use tariff adjustments (except for the extraordinary revision).
Incentives for the Development of Alternative Sources of Energy
Law No. 10,438/02 created certain incentive programs for the use of alternative sources in the generation of electricity (Proinfa). It assures the purchase of the electricity generated by Eletrobrás for a period of 20 years and financial support from the Banco Nacional do Desenvolvimento, or BNDES. Other programs include a discount of up to 50% on the distribution or transmission tariffs and a special exception for the consumers with electricity demand in the range of 500-3,000 kW (special consumers) who decide to migrate to ACL (unregulated environment), provided that such consumers purchase electricity from generating companies using alternative sources of electricity.
Additionally, the government developed bidding processes for alternative energies (for example, the bidding process for wind projects that was held in December 2009, for 753 MW).
Public Bids
During 2010, there were four bidding processes for new generation projects, awarding 99 plants for a total of 17,054 MW: 89 plants of NCRE for a total of 2,892 MW, three major hydroelectric plants for a total of 13,353 MW, and seven mid-size hydroelectric plants for a total of 809 MW.
Environmental Regulation
The Brazilian Constitution gives both the federal and state governments power to enact laws designed to protect the environment and to issue regulations under such laws. While the federal government has power to enact environmental regulations, state governments have the power to enact more stringent environmental regulations. Most of the environmental regulations in Brazil are at the state and local level rather than at the federal level.
Hydroelectric facilities are required to obtain concessions for water rights and environmental approvals. Thermal electricity generation, transmission and distribution companies are required to obtain environmental approvals from environmental regulatory authorities.
Colombia
In 1994, the Colombian Congress passed significant reforms to the public utilities industry. These reforms, contained in Law 142 of 1994 (“LSPD”), known as the Public Utility Services Law, and Law 143 of 1994, were the result of constitutional amendments made in 1991, and created the basic legal framework that currently governs the electricity sector in Colombia. The most significant reforms included the opening of the electricity industry to private sector participation, the functional segregation of the electricity sector into four distinct activities (namely generation, transmission, distribution and trading), the creation of an open and competitive wholesale electricity market, the regulation of transmission and distribution activities as regulated monopolies, and the adoption of universal access principles applicable to transmission and distribution networks.
Utility companies are required to ensure continuous and efficient service, facilitate the access of low-income users to subsidies granted by the government, inform users regarding efficient and safe use of the services, protect the environment, allow access and interconnection to other public service companies and large customers, cooperate with the authorities in the event of an emergency to prevent damage to users, and report to the authority any commercial start-up of operations.
The Colombian Electricity Act sets out the principles for the electricity industry, which are implemented through the resolutions enacted by the Energy and Gas Regulatory Commission, or “CREG.” Such principles are: efficiency (the correct allocation and use of resources and the supply of electricity at minimum cost); quality (compliance with technical requirements); continuity (continuous electricity supply without unjustified interruptions); adaptability (the incorporation of modern technology and administrative systems to promote quality and efficiency); neutrality (impartial treatment to all electricity consumers); solidarity (the provision of funds by high-income consumers to subsidize the subsistence consumption of low-income consumers); and fairness (an adequate and nondiscriminatory supply of electricity to all regions and sectors of the country).
The Colombian Electricity Act regulates the generation, trading, transmission, and distribution (the Activities) of electricity. Under the law, any company, domestic or foreign, may undertake any of the Activities. New companies, however, must engage exclusively in one of the Activities. Trading can be combined with either generation or distribution.
The market share for generators and traders is limited. The limit for generators is 25% of the Colombian system Firm Energy. Firm Energy refers to the maximum electric energy that a generation plant is able to deliver on a continuous basis during a year, in extremely dry conditions; for instance, in the case of the El Niño phenomenon.
Similarly, a trader may not account for more than 25% of the trading activity in the Colombian NIS. Limitations for traders take into account international energy sales. Market share is calculated on a monthly basis and traders have up to six months to reduce their share when the limit is exceeded.
Such limits are applied to economic groups, including companies that are controlled by, or under common control with, other companies. In addition, generators may not own more than a 25% interest in a distributor, and vice versa. However, this limitation only applies to individual companies and does not preclude cross-ownership by companies of the same corporate group.
A generator, distributor, trader or an integrated company (i.e., a firm combining generation, transmission and distribution activities), cannot own more than 15% of the equity in a transmission company if the latter represents more than 2% of the national transmission business in terms of revenues. A distribution company can have more than 25% of an integrated company’s equity if the market share of the latter company is less than 2% of the national generation business. A company created before the enactment of Law No.143 is banned from merging with another company created after Law No.143 came into effect.
The Ministry of Mines and Energy defines the government’s policy for the energy sector. Other government entities which play an important role in the electricity industry are: Public Utility Superintendency of Colombia, which is in charge of overseeing and auditing utilities; CREG, which is in charge of regulating the energy and gas sectors; and the Mining and Energy Planning Agency, which is in charge of planning the expansion of the generation and transmission network.
CREG is empowered to issue regulations that govern technical and commercial operations and to set charges for regulated activities. CREG’s main functions are to establish conditions for gradual deregulation of the electricity sector toward an open and competitive market, approve charges for transmission and distribution networks and charges for retailing to regulated customers, establish the methodology for calculating and establishing maximum tariffs for supplying the regulated market, establish regulations for planning and coordination of operations of the Colombian NIS, establish technical requirements for quality, reliability and security of supply, and protect customers’ rights.
Generation
The generation sector is organized on a competitive basis with companies selling their production on the electricity pool market, the wholesale market, at the spot price or by long-term private contracts with other participants and unregulated customers at freely negotiated prices. The Colombian NIS is the system formed by generation plants, the interconnection grid, regional transmission lines, distribution lines and consumer loads. The spot price is the price paid by the participant in the wholesale market for energy dispatched under the direction of the Dispatch National Center (CND). The hourly spot price paid for energy reflects prices offered by generators in the wholesale market and the respective supply and demand conditions.
Generators connected to the Colombian NIS can also receive “reliability payments” which are a result of the Firm Energy Obligation that they provide to the system. The Firm Energy Obligation (OEF) is a commitment on the part of generation companies backed by its physical resource capable of producing firm energy during scarcity periods. The generator that acquires an OEF will receive a fixed compensation during the commitment period, whether or not the fulfillment of its obligation is required. To receive reliability payments, generators have to participate in firm energy bids by declaring and certifying their firm energy. Until November 2012, the transition period, the firm energy supply for reliability purposes will be assigned proportionally to the declared firm energy of each generator. Beyond the transition period, the additional firm energy required by the system will be allocated by bids. The only auction held for this period took place in May 6, 2008, when existing generators participated with new generation projects while meeting the established market share limits.
Dispatch and Pricing
The purchase and sale of electricity can take place between generators, distributors acting in their capacity as traders, traders (who do not generate or distribute electricity) and unregulated customers. There are no restrictions for new entrants into the market as long as the participants comply with the applicable laws and regulations.
The wholesale market facilitates the sale of excess energy that has not been committed under contracts. In the wholesale market, an hourly spot price for all dispatched units is established based on the offer price of the highest priced generating dispatched unit for that period. The CND receives price bids each day from all the generators participating in the wholesale market. These bids indicate prices and the hourly available capacity for the following day. Based on this information, the CND guided by “optimal dispatch” principle (which assumes an infinite transmission capacity through the network), ranks the generators according to their offer price, starting with the lowest bid, and establishing the merit order, on an hourly basis, determining which generators will be dispatched the following day to satisfy expected demand. The price for all generators is set as the most expensive generator dispatched in each hourly period under the optimal dispatch. This price-ranking system is intended to ensure that national demand, increased by the total amount of energy exported to other countries, will be satisfied by the lowest cost combination of available generating units in the country.
Additionally, the CND performs the “planned dispatch,” which takes into account the limitations of the network, as well as every other condition necessary to satisfy the energy demands expected for the following day in a safe, reliable and cost-efficient manner. The cost differences between the “planned dispatch” and the “optimal dispatch” are called restrictions costs. The net value of these restrictions is assigned proportionally to all the traders within the Colombian NIS, according to their demands of energy, who pass these costs to the end users. Some generators have initiated legal proceedings arguing that recognized prices do not cover the costs associated with these restrictions.
From the second half of 2009 until June 2010, there was a critical hydrological condition in Colombia, due to the presence of the El Niño phenomenon. In order to handle this situation, the Ministry of Mines and Energy and CREG enacted various temporary resolutions to modify the dispatch and pricing rules, in order to ensure system reliability and prevent a possible deficit. Since June 2010, climate conditions have returned to normal and no power outages have occurred.
Export and Import Electricity
Decision CAN 536 of 2002, signed by the countries that participate in the Andean Nations Community (CAN) — Colombia, Ecuador, Bolivia and Peru-, established the general framework for the Subregional interconnection of electrical systems that created a coordinated economic dispatch of the countries involved in the interconnections. In this context, in March 2003 the interconnection system between Colombia and Ecuador was inaugurated.
In November 2009, Decision CAN 720 of 2009 was enacted; it replaced transitorily Decision CAN 536 for a maximum period of two years. Resolutions CREG 160-2009 and 189-2009 adapted the regulatory framework in Colombia according to the new Decision.
Transmission
Transmission companies which operate at least at 220 kV compose the National Transmission System, or NTS. They are required to provide access to third parties on equal conditions and are authorized to collect a tariff for their services. The transmission tariff includes a connection charge that underwrites the cost of operating the facilities, and a usage charge, which applies only to traders.
CREG guarantees an annual fixed income to transmission companies. Income is determined by the new replacement value of the networks and equipment and by the resulting value of bidding processes awarding new projects for the expansion of the NTS. This value is allocated among the traders of the NTS in proportion to their energy demand.
The expansion of the NTS is conducted according to model expansion plans designed by the Mining and Energy Planning Agency and pursuant to bidding processes opened to existing and new transmission companies, which are handled by the Ministry of Mines and Energy in accordance with the guidelines set by CREG. Accordingly, the construction, operation and maintenance of new projects is awarded to the company that offers the lowest present value of cash flows needed for carrying out the project. During 2009, CREG defined a transmission charge methodology.
Distribution
Distribution is defined as the operation of local networks below 220 kV. Any user may have access to a distribution network for which it pays a connection charge. CREG regulates distribution prices that should permit distribution companies to recover costs, including operating, maintenance and capital costs operating efficiently. Distribution charges are set by CREG for each company based on the replacement cost of the existing distribution assets, cost of capital, as well as operational and maintenance costs that vary depending on the voltage level.
A new compensation methodology for the distribution was defined by CREG in 2008 that set the WACC at 13.9% before taxes for assets operating at 34.5 kV or less and 13% before taxes for assets operating above 34.5 kV. CREG also defined a new methodology for the calculation of distribution charges by defining an incentive scheme for administrative, operational and maintenance costs, service quality and energy losses. During 2009, after auditing the information reported by the companies, CREG defined the new distribution charges applicable from 2009 until 2013.
Trading
The retail market is divided into regulated and unregulated customers. Customers in the unregulated market may freely contract for electricity supply directly from a generator or a distributor, acting as traders, or from a pure trader. The unregulated customer market, which for 2010 represented about 32.2% of the market, consists of customers with a peak demand of more than 0.1 MW or a minimum monthly consumption of 55 MWh.
Trading is the resale to end users of electricity purchased in the wholesale market. It may be conducted by generators, distributors or independent agents, which comply with certain requirements. Parties freely agree upon trading prices for unregulated customers.
Trading to regulated customers is subject to the “regulated freedom regime” under which tariffs are set by each trader using a combination of general cost formulas given by CREG and individual trading costs approved by CREG for each trader. Since CREG approves limits on costs, traders in the regulated market may set lower tariffs for economic reasons. Tariffs include, among other things, energy procurement costs, transmission charges, distribution charges and a trading margin.
The tariff formula became effective on February 1, 2008. The main changes in the new formula are the establishment of a fixed monthly charge and the introduction of reduction costs of non-technical energy losses in the trading charges. In addition, CREG allows the traders in the regulated market to choose tariff options to manage tariff increments.
In order to improve wholesale price formation, CREG is designing a new energy procurement scheme based on long term energy bids, known as Organized Market. The final rules for this new system are still not available, but CREG has this issue on its 2011 agenda.
Another trading change is the incorporation of an energy derivatives market. In May 2009, the company Derivex was created by the Bolsa de Valores de Colombia S.A. and XM Compañía de Expertos en Mercados S.A. E.S.P. In October 2010, the company began its operation with the first electricity forward contract, and it also plans to manage in the future derivative contracts related with natural gas and coal.
During 2010, CREG strengthened regulatory measures aiming to control default risk by forcing independent traders to leave the market after defaulting.
Environmental Regulation
The environmental framework in Colombia was established in Law No. 99 of 1993, which also established the Ministry of the Environment as the authority for determining environmental policies. The Ministry defines issues and executes policies and regulations that focus on the recovery, conservation, protection, organization, administration and use of renewable resources. Therefore, the use of natural resources or any impact to them as a result of any activity or project will require the issuance of permits and environmental licenses and the establishment of environmental management plans.
Any entity planning to develop projects or activities relating to generation, interconnection, transmission or distribution of electricity that may result in environmental deterioration must first obtain an environmental license.
According to Law No. 99, generation plants that have a total installed nominal capacity above 10 MW are required to contribute to the conservation of the environment through a payment for their activities at a regulated tariff. Hydroelectric power plants must pay 6% of their generation and thermoelectric plants must pay 4% of their generation. This payment is made monthly to the municipalities and environmental corporations where these facilities are located.
Peru
Industry Structure
The general legal framework applicable to the Peruvian electricity industry are: the Law of Electric Concessions (Decree Law No. 25,844) and its ancillary regulations, the Law to Secure the Efficient Development of Electric Generation (Law No. 28,832), the Technical Regulation on the Quality of the Electric Supply (Supreme Decree 020-97), the Electricity Import and Export Regulation (Supreme Decree 049-2005), the Antitrust Law on the Electricity Sector (Law No. 26,876), and the Law that regulates the activity of the Supervisor Organization of Investments in Energy and Mining (Law No. 26,734, together with Law No. 27,699).
Some of the characteristics of the regulatory framework are (i) the separation of the three main activities: generation, transmission and distribution; (ii) freedom of prices for the supply of energy in competitive market conditions; (iii) a system of regulated prices based on the principle of efficiency together with a bidding regime; and (iv) private operation of the interconnected electricity systems subject to the principles of efficiency and quality of service.
There is one interconnected system, the SEIN, and several isolated regional and smaller systems that provide electricity to specific areas.
The Ministry of Energy and Mining, or the MINEM, defines energy policies applicable nationwide, regulates environmental matters applicable to the energy sector and oversees the granting, supervision, maturity and termination of licenses, authorizations and concessions for generation, transmission, and distribution activities.
Osinergmin is an autonomous public regulatory entity that controls and enforces compliance with legal and technical regulations related to electrical and hydrocarbon activities, controls and enforces compliance with the obligations stated in the concession contracts, and is responsible for the preservation of the environment in connection with the development of these activities. Osinergmin’s Tariff Regulatory Bureau has the authority to publish the regulated tariffs. Osinergmin also controls
and supervises the bidding processes required by distribution companies to purchase energy from generators. The Committee of Economic Operation of the System, or COES, coordinates the operation and dispatch of electricity of the SEIN and prepares the technical and financial study that serves as a basis for the annual bus bar price calculations, as defined below. The COES includes as members the generation, transmission and distribution companies, as well as unregulated customers.
Services provided by generation, transmission and distribution companies have to comply with technical standards stated in the Technical Regulations on the Quality of the Electric Supply. Failure to do so might result in the imposition of fines by Osinergmin.
Dispatch and Pricing
The coordination of electricity dispatch operations, the setting of spot prices and the control and administration of economic transactions that take place in the SEIN are controlled by COES. Generators can sell energy directly to large customers and buy the deficit or transfer the surplus between contracted energy and actual production in the pool at spot price. Distribution companies and large customers that have entered into private supply contracts with generation companies pay the contractual price directly to the generator (which includes tolls and compensations for the use of transmission systems) and also pay a toll to distribution companies for the use of their networks.
Customers with a demand of less than 200 kW are considered regulated customers, and the supply of their energy is considered as a public service. Customers whose annual demand is within the range of 200-2,500 kW are free to choose to be considered as regulated or unregulated customers.
In 2008, due to gas transport and electricity transmission problems, Osinergmin defined a new rule to calculate spot prices until December 2013. Decree 049-2008 established two models, one which represented a theoretical dispatch without considering any restrictions and, the other one, considering real dispatch with restrictions. The spot price is obtained from the theoretical dispatch, and the additional cost of operation resulting from system restrictions are paid to the affected generators through a mechanism established by the authority.
Generators receive a capacity payment whose main component is the product of an annual calculation that considers firm power of every power plant connected to the system. Every year, Osinergmin sets the power price that shall be assigned and paid to each generator pursuant to this concept.
Transmission
Transmission activities are divided in two categories: principal, which are for common use and allow the flow of energy through the national grid; and secondary, which are those lines that connect a power plant with the national grid, that connect principal transmission with the network of distribution companies or that connect directly to certain final consumers. Law No. 28,832, enacted in 2006, also defined “guaranteed transmission systems” and “complementary transmission systems”, applicable to projects commissioned after the enactment of that law. Guaranteed system lines are the result of a public bid and complementary system lines are freely constructed and exploited as private projects. Principal and guaranteed system lines are accessible to all generators and allow electricity to be delivered to all customers. Transmission concessionaires receive an annual fixed income, as well as variable tariff revenues and connection tolls per kW. The secondary and complementary system lines are accessible to all generators but are used to serve only certain customers who are responsible for making payments related to their use of the system.
Distribution
The Efficient Development Law (Law No. 28,832), dated July 2006, established a bidding regime for the acquisition of energy and capacity by distributors through a mechanism to determine prices during the life of a contract. The approval of this mechanism is important to generators, because it sets a mechanism for determining a price for the duration of a contract that is not fixed by the regulator.
The new contracts to sell energy to distribution companies for resale to regulated customers must be made at fixed prices determined by public bids. Only a small part of the electricity purchased by distribution companies (included in old contracts) is still maintained at bus bar prices. Bus bar prices are set annually by Osinergmin and are the maximum prices for electricity purchased by distribution companies that can be transferred to regulated customers in those contracts.
The electricity tariff for regulated customers includes charges for capacity and energy for generation and transmission (bus bar prices) and for the VAD which considers a regulated return over capital investments, operating and maintenance fixed charges and a standard percentage for energy distribution losses.
During 2010, Edelnor successfully conducted three long term bids, for coverage of the regulated and unregulated market for the 2014-2025 period; the company successfully awarded 100% of the required demand in each bidding process.
Concessions and authorizations
Generation companies that have a power plant with an installed capacity greater than 500 kW require a concession granted by the MINEM. Similarly, generation companies operating thermal power plants with an installed capacity greater than 500 kW require an authorization granted by the MINEM.
A concession for electricity generation activity is an agreement between the generator and MINEM, while an authorization is merely a unilateral permit granted by said public entity. Authorizations are granted by the MINEM for an unlimited period of time, although their termination is subject to the same considerations and requirements as the termination of concessions under the procedures set forth in the Law of Electrical Concessions (Law No. 25,844), November 19, 1992, and related regulations.
Cold Reserve
During 2009, MEM carried out several studies which concluded that, in the near future, SEIN would not tolerate any unavailability of large power plants due to the lack of power generation capacity in the system. As a result, MEM recommended the construction of new power plants that would serve as backup (“Cold Reserve”) in order to guarantee the flow of electricity to the system and avoid blackouts. As a result, the government agency in charge of promoting private investments (“Proinversión”) carried out a public bid in August 2010, seeking to secure investments for the addition of an extra 800 MW to the system, divided in three projects located in Talara, Trujillo and Ilo. Nevertheless, the bid resulted with only two of the projects being awarded: Talara (200 MW, for EEPSA, an affiliate of Endesa Latinoamérica) and Ilo (400 MW, for Enersur, an unrelated company). These plants will receive regular payments for being permanently available to operate and provide energy to the SEIN whenever the COES calls on them and will also be reimbursed for the fuel costs incurred in generating electricity.
Environmental Regulation
The environmental legal framework applicable to energy related activities in Peru is set forth in the Environmental Law (Law No. 28,611), dated October 15, 2005, and in the Regulation for Environmental Protection regarding Electricity Activities (Supreme Decree 029-94-EM). The MINEM dictates the specific environmental legal dispositions applicable to electric activities, and Osinergmin is in charge of supervising certain aspects of their application and implementation. According to the Environmental Law, the Ministry of Environment (created in May 2008) is in charge, as principal duties, of (i) designing the general environmental policies to every productive activity; and (ii) establishing the main guidelines of the different government authorities on their specific environmental sector regulations. During 2010, most supervision functions regarding the application and implementation of the Environmental Law’s dispositions were transferred from Osinergmin to the Ministry of Environment.
In 2008, the MINEM enacted Supreme Decree 050-2008 to promote electricity generation using non conventional renewable energy (NCRE). Said legal disposition states as a goal that at least 5% of the SEIN’s demand must be supplied using NCRE. This 5% goal should be increased every five years. Technologies considered as NCRE include biomass, wind, tidal, geothermal, solar and mini-hydro (less than 20 MW) power.
Raw Materials
For information regarding Enersis’ raw materials, please see “Item 11(a) and 11(b). Quantitative and Qualitative Disclosures About Market Risk — Commodity Price Risk.”
C. Organizational Structure.
Principal Subsidiaries and Affiliates
We are part of a group led by the Italian company, Enel. Enel owns 92.1% of Endesa Spain, and the latter owns 60.6% of the share capital of Enersis through its Spanish subsidiary Endesa Latinoamérica.
Enel is a publicly-traded company headquartered in Italy, primarily engaged in the energy sector, with presence in 23 countries and more than 95,000 MW of installed capacity. It provides service to 60.9 million clients through its electricity and gas businesses.
The following chart shows the relative position of Enersis in the Enel Group, as well as our most important operating subsidiaries and jointly-controlled companies:
“Enersis’ Simplified Organizational Structure” (*)
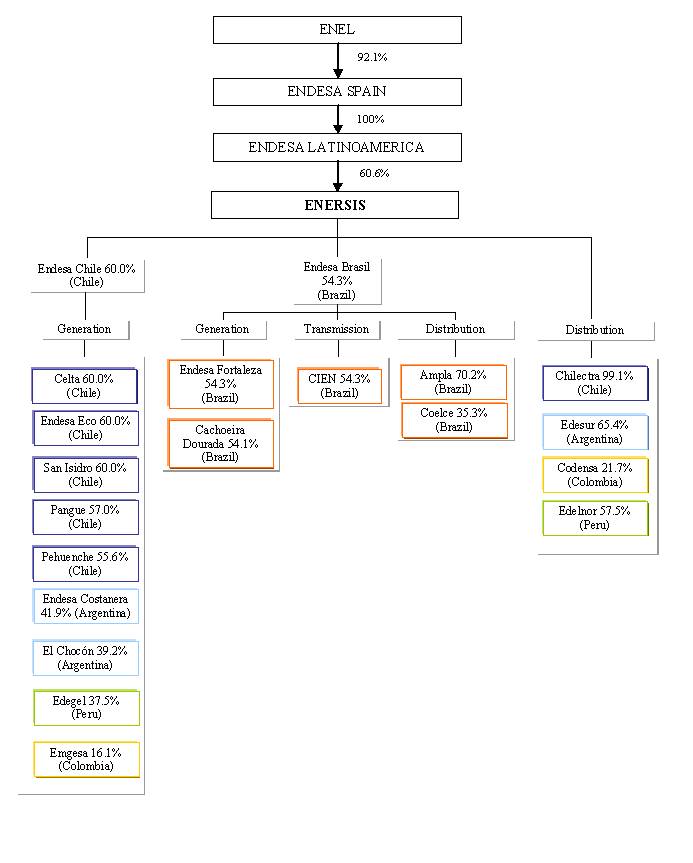
The companies listed in the following table were consolidated by us as of December 31, 2010. In the case of subsidiaries, our economic interest is calculated by multiplying our percentage economic interest in a directly held subsidiary by the percentage economic interest of any entity in the chain of ownership of such ultimate subsidiary.
Principal Subsidiaries and Country of Operations |
| % Economic |
| Consolidated Main Subsidiary |
| Operating Income |
|
|
| (in billions of Ch$ except percentages) |
| ||||
Electricity Generation |
|
|
|
|
|
|
|
Endesa Chile (Chile) (1) |
| 60.0 | % | 6,034.9 |
| 890.7 |
|
Endesa Fortaleza (Brazil) |
| 54.3 | % | 230.3 |
| 59.1 |
|
Cachoeira Dourada (Brazil) |
| 54.1 | % | 228.9 |
| 75.9 |
|
Electricity Transmission |
|
|
|
|
|
|
|
CIEN (Brazil) |
| 54.3 | % | 398.4 |
| 28.1 |
|
Electricity Distribution |
|
|
|
|
|
|
|
Chilectra (Chile) |
| 99.1 | % | 1,462.0 |
| 111.8 |
|
Ampla (Brazil) |
| 70.2 | % | 1,250.0 |
| 120.7 |
|
Edesur (Argentina) |
| 65.4 | % | 431.0 |
| 3.9 |
|
Edelnor (Peru) |
| 57.5 | % | 433.5 |
| 64.9 |
|
Coelce (Brazil) |
| 35.3 | % | 1,043.9 |
| 181.3 |
|
Codensa (Colombia) |
| 21.7 | % | 1,141.9 |
| 207.2 |
|
Other non-electricity businesses |
|
|
|
|
|
|
|
CAM (Chile) |
| 100.0 | % | 97.7 |
| -0.7 |
|
IMV (Chile) |
| 100.0 | % | 68.1 |
| 7.9 |
|
Synapsis (Chile) |
| 100.0 | % | 37.9 |
| -3.1 |
|
(1) Endesa Chile consolidated all generation facilities in Chile, Argentina, Colombia and Peru.
Endesa Chile (Chile)
Endesa Chile is a publicly traded electricity generation company in Chile. On a stand-alone basis, excluding direct subsidiaries in Chile (described below), Endesa Chile has a total installed capacity of 3,407 MW as of December 2010, with 45 generation units operating in the SIC. Of the total capacity, nearly 66% comes from hydroelectric power plants, including Ralco with 690 MW, El Toro with 450 MW, Rapel with 377 MW, and Antuco with 320 MW, among others. Regarding our thermoelectric facilities, nearly 88% are gas/fuel oil power plants, and the rest are coal-steam power plants. Our economic interest in Endesa Chile is 60.0%.
Celta (Chile)
Celta was formed in 1995 to build and operate two thermoelectric plants in the SING: a coal-fired plant with an installed capacity of 158 MW and a gas/fuel oil power plant with 24 MW of installed capacity. Celta is wholly-owned by Endesa Chile. Our economic interest in Celta is 60.0%.
Endesa Eco (Chile)
On April 18, 2005, Endesa Chile created Endesa Eco S.A., whose objectives are the promotion and development of renewable energy projects such as mini-hydro, wind, geo-thermal, solar and biomass power plants and to act as the depositary and trader of emission reduction certificates obtained by these projects. As of December 2010, Endesa Eco’s installed capacity was 87 MW. Endesa Eco is a wholly-owned subsidiary of Endesa Chile. Our economic interest in Endesa Eco is 60.0%.
San Isidro (Chile)
San Isidro, a company wholly-owned by Endesa Chile, was incorporated in Chile in 1996 to build and operate a 379 MW combined-cycle thermal plant in Quillota, in the Valparaíso Region. The plant began commercial operations in 1998. A 220 kV transmission line of 9 kilometers was built to connect this thermal plant to the SIC. This transmission system is owned by Transquillota Ltda., in which San Isidro has a 50% interest. Our economic interest in San Isidro is 60.0%.
Pangue (Chile)
Pangue was incorporated to build and operate a 467 MW installed capacity hydroelectric power station in the Bío-Bío River. The first unit started operations in 1996, and the second unit started operations in 1997. Endesa Chile holds 95% of Pangue’s share capital. Our economic interest in Pangue is 57.0%.
Pehuenche (Chile)
Pehuenche, a generation company connected to the SIC, owns three hydroelectric facilities south of Santiago in the high rainfall hydrological basin of the Maule River, with a total installed capacity of 699 MW. The 570 MW Pehuenche plant started operations in 1991, the 89 MW Curillinque plant started operations in 1993, and the 40 MW Loma Alta plant started operating in 1997. Endesa Chile holds 92.7% of Pehuenche. Our economic interest in Pehuenche is 55.6%.
Endesa Costanera (Argentina)
Endesa Costanera is a publicly traded electricity generation company in Argentina, with 2,324 MW of total installed capacity in Buenos Aires, including six steam turbines with an aggregate capacity of 1,138 MW which burn oil and gas, and two natural gas combined cycle facilities with a total installed capacity of 1,186 MW. The company was acquired from the Argentine government after the privatization of Servicios Eléctricos del Gran Buenos Aires S.A. in 1992, when Endesa Chile acquired a 24% interest. In February 2007, Endesa Chile increased its total ownership to the current level of 69.8%. Our current economic interest in Endesa Costanera is 41.9%.
El Chocón (Argentina)
El Chocón is an electricity generation company, incorporated in Argentina, located between the Neuquén and Río Negro provinces, in the Comahue Basin in southern Argentina. It has two hydroelectric power stations with an aggregate installed capacity of 1,328 MW. A 30-year concession, which expires in 2023, was granted by the Argentine government to our subsidiary, Hidroinvest S.A., which bought 59.0% of the shares in July 1993 during the privatization process. Endesa Chile operates El Chocón for a fee pursuant to an operating agreement with a term equal to the duration of the concession. In March 2007, Endesa Chile increased its beneficial interest in El Chocón from 44.8% to 65.4%. Our economic interest in El Chocón is 39.2%.
Edegel (Peru)
Edegel is an electricity generation company, acquired by Endesa Chile in 1995. It currently owns seven hydroelectric plants and two thermal plants, with a combined installed capacity of 1,668 MW. In October 2009, Endesa Chile purchased an additional 29.4% share in Edegel from Generalima, a subsidiary of Endesa Latinoamérica. Thus, Endesa Chile increased its beneficial ownership in Edegel from 33.1% to 62.5%. Our economic interest in Edegel is 37.5%.
In May 2009, as contemplated in the contract signed by Edegel in 2000 for the financing of the Yanango and Chimay projects, the equity contribution for the subsidiary Chinango S.A.C., constituted in March 2008, took place. Edegel holds an 80% share of Chinango, and Peruana de Energía S.A.A. owns the remaining 20% share.
Emgesa (Colombia)
Emgesa has a total installed generating capacity of 2,914 MW, of which 85% corresponds to hydroelectric power plants and the remaining to thermoelectric power plants. On September 1, 2007 Central Hidroeléctrica Betania S.A. E.S.P. and Emgesa S.A. E.S.P. were merged into Betania, which then adopted the name of “Emgesa S.A. E.S.P.”
On September 15, 1997, Central Hidroeléctrica Betania, through its former subsidiary Inversiones Betania S.A. and in association with Endesa Desarrollo S.A. of Spain, was awarded control of Emgesa through Capital de Energía S.A. (CESA), with 48.5% of the shares. On January 30, 2006, due to a company restructuring, CESA ceased to exist. On March 2, 2006,
Emgesa purchased the assets of Termocartagena (208 MW) through a public tender process. Empresa de Energía de Bogotá S.A. has a direct participation in Emgesa of 51.5%. Endesa Chile’s beneficial ownership in Emgesa is 26.9%, even though it has 31.3% of the voting rights, and due to a transfer of rights from another subsidiary of Endesa Spain, has the right to appoint the majority of the Board members and, therefore, controls Emgesa. Our economic interest in Emgesa is 16.1%.
Endesa Brasil (Brazil)
In 2005, Endesa Brasil was formed as a company to manage all generation, transmission and distribution assets that Endesa Latinoamérica, Enersis, Endesa Chile and Chilectra held in Brazil; namely, through Ampla, Endesa Fortaleza, Investluz, CIEN, Cachoeira Dourada and Coelce. Enersis has a beneficial interest of 54.3% in Endesa Brasil.
CIEN (Brazil)
CIEN is a Brazilian transmission company, wholly-owned by Endesa Brasil. Cien transmits electricity from two transmission lines between Argentina and Brazil covering a distance of 500 kilometers. CIEN consolidates CTM and TESA, which operate the Argentine side of the interconnection line with Brazil. Our economic interest in CIEN is 54.3%.
Ampla (Brazil)
Ampla is the second largest electricity distribution company in the State of Rio de Janeiro, Brazil. Ampla is engaged mainly in the distribution of electricity to 66 municipalities of the State of Rio de Janeiro and serves 2.6 million customers in a concession area of 32,615 square kilometers. As of December 31, 2010, we had a 70.2% economic interest in Ampla.
Coelce (Brazil)
Coelce is the sole electricity distributor in the State of Ceará, in northeastern Brazil. As of December 31, 2010, Coelce served over 3.1 million customers within a concession area of 148,825 square kilometers. We hold a 35.3% economic interest in Coelce.
Chilectra (Chile)
Chilectra is one of the largest electricity distribution companies in Chile as measured by the number of regulated clients, distribution assets and energy sales. Chilectra operates in a concession area of 2,118 square kilometers in the Santiago metropolitan area serving approximately 1.6 million customers. Our economic interest in Chilectra is 99.1%.
Edesur (Argentina)
Edesur is the second largest electricity distribution company in Argentina measured by energy purchases. Edesur operates in a concession area of 3,309 square kilometers. Edesur distributes electricity in the south-central part of the greater Buenos Aires metropolitan area serving approximately 2.4 million customers. Our economic interest in Edesur is 65.4%
Codensa (Colombia)
Codensa is an electricity distribution company that serves a concession area of 18,217 square kilometers in Bogotá and 96 other municipalities in the Department of Cundinamarca, Tolima and Boyacá where it serves approximately 2.6 million customers.
We hold a 21.7% economic interest in Codensa, and due to a transfer of rights from another Endesa Spain subsidiary, we appoint the majority of the Board members and, therefore, control this company.
Edelnor (Peru)
Edelnor is a Peruvian electricity distribution company. Edelnor operates in a concession area of 2,440 square kilometers. Ite has an exclusive concession to distribute electricity in the northern part of the Lima metropolitan area, some provinces of the Lima department such as Huaral, Huaura, Barranca and Oyón, and in the adjacent province of Callao. It As of December 31, 2010, Edelnor distributed electricity to approximately 1.1 million customers. We hold 57.5% of the economic interest in Edelnor.
IMV (Chile)
IMV, a wholly owned subsidiary, develops real estate projects in Chile and represented less than 0.2% of our 2010 operating revenues before consolidation adjustments.
Selected Related and Jointly-Controlled Companies
Cemsa (Argentina)
Cemsa is responsible for trading electricity. As of the date of this report, Endesa Chile has an indirect ownership holding in Cemsa of 45%. Cemsa’s other shareholder is Endesa Spain through Endesa Latinoamérica. Our economic interest is 27.0%.
Electrogas (Chile)
Electrogas was constituted in 1996. This company offers natural gas transportation services to the Valparaíso Region in Chile, especially to the San Isidro and Nehuenco combined-cycle plants at Quillota. Endesa Chile has a beneficial interest of 42.5% share in this company. The other shareholders are Colbún S.A. and ENAP. Our economic interest is 25.5%.
GasAtacama (Chile)
Endesa Chile has a 50% beneficial interest in GasAtacama, located in the northern region of Chile. Since 2007, Southern Cross Latin America Private Equity Fund III, L.P. owns the remaining 50% beneficial interest. Subsidiaries of this holding company were Gasoducto Atacama Chile S.A., Gasoducto Atacama Argentina S.A. and GasAtacama Generación S.A., which are involved in electricity generation and natural gas transportation. On November 28, 2008, GasAtacama Generación S.A. and Gasoducto Atacama Chile S.A. merged into GasAtacama Generación S.A., which changed its name to GasAtacama Chile S.A. Our economic interest is 30.0%.
HidroAysén (Chile)
HidroAysén was incorporated in March 2007. Endesa Chile has a 51% ownership interest and Colbún S.A. the remaining 49%. The company was created to develop and exploit the Aysén project, a hydroelectrical project located in the Aysén Region, in the southern region of Chile. Our economic interest is 30.6%.
GNL Quintero
GNL Quintero was incorporated on March 9, 2007. Endesa Chile has a 20% ownership interest and the remaining interest is owned by British Gas (40%), ENAP (20%) and Metrogas (20%). This company operates a LNG regasification facility located in Quintero Bay whereby LNG is unloaded, stored and regasified.
This project was built by Chicago Bridge & Iron and currently has a regasification capacity of 9.6 million m3 per day and two 160,000 m3 LNG containment tanks. Our economic interest is 12.0%.
D. Property, Plants and Equipment.
Property, Plants and Equipment of Generating Companies
We conduct our generation business through our subsidiaries, Endesa Chile and Endesa Brasil. Endesa Chile consolidates revenues from generating companies in Argentina, Colombia and Peru, which involve a total of 26 generation power plants detailed below, which together with the plants in Chile, total 54 power plants. Endesa Brasil has operations only in Brazil, with two generation power plants and a transmission system consisting of two 2,100 MW transmission lines 500 kilometers long, linking Rincón de Santa María en Argentina with Itá in Santa Catarina state in Brazil.
A substantial portion of our generating subsidiaries’ cash flow and net income is derived from the sale of electricity produced by its electricity generation facilities. Significant damage to one or more of their main electricity generation facilities or interruption in the production of electricity, whether as a result of an earthquake, flood, volcanic activity or any
other such cause, could have a material adverse effect on their operations. Our generating subsidiaries insure all electricity generation facilities against damage due to earthquakes, fires, floods, other Acts of God (but not for prolonged droughts, which is a risk not covered by insurance companies) and from damage due to third-party actions, based on the appraised value of the facilities as determined from time to time by an independent appraiser. Based on geological, hydrological and engineering studies, management believes that the risk of an event with a material adverse effect is remote. Claims under our generating subsidiaries’ insurance policies are subject to customary deductibles and other conditions. We also maintain business interruption insurance providing for coverage for failure of any of our facilities for a period of up to 24 months, including the deductible period.
The insurance coverage taken for non-Chilean property is approved by each company’s management, taking into account the quality of the insurance companies and the needs, conditions and risk evaluations of each generating facility, and is based on general corporate guidelines.
All insurance policies are purchased from reputable international insurers. We continuously monitor and meet with the insurance companies in order to obtain what we believe is the most commercially reasonable insurance coverage.
The following table identifies the power plants that we own, at the end of each year, and their basic characteristics:
|
|
|
|
|
| Installed Capacity | ||||
Country/Company |
| Power Plant Name |
| Power Plant Type (1) |
| 2008 |
| 2009 |
| 2010 |
|
|
|
|
|
|
|
| MW |
|
|
Argentina |
|
|
|
|
|
|
|
|
|
|
Endesa Costanera |
| Total |
|
|
| 2,324 |
| 2,324 |
| 2,324 |
|
| Endesa Costanera Steam Turbine |
| Steam Turbine/Natural Gas+ Fuel Oil |
| 1,138 |
| 1,138 |
| 1,138 |
|
| Endesa Costanera Combined Cycle II |
| Combined Cycle/Natural Gas+Diesel Oil |
| 859 |
| 859 |
| 859 |
|
| Central Buenos Aires Combined Cycle I |
| Combined Cycle/Natural Gas |
| 327 |
| 327 |
| 327 |
|
|
|
|
|
|
|
|
|
|
|
El Chocón |
| Total |
|
|
| 1,328 |
| 1,328 |
| 1,328 |
|
| Chocón |
| Reservoir |
| 1,200 |
| 1,200 |
| 1,200 |
|
| Arroyito |
| Pass-through |
| 128 |
| 128 |
| 128 |
Total Capacity in Argentina |
|
|
|
|
| 3,652 |
| 3,652 |
| 3,652 |
|
|
|
|
|
|
|
|
|
|
|
Brazil |
|
|
|
|
|
|
|
|
|
|
Cachoeira Dourada |
| Cachoeira Dourada |
| Pass Through |
| 665 |
| 665 |
| 665 |
Endesa Fortaleza |
| Endesa Fortaleza |
| Combined Cycle/ Gas |
| 322 |
| 322 |
| 322 |
Total Capacity in Brazil |
|
|
|
|
| 987 |
| 987 |
| 987 |
|
|
|
|
|
|
|
|
|
|
|
Chile |
|
|
|
|
|
|
|
|
|
|
Endesa Chile |
| Total |
|
|
| 3,139 |
| 3,446 |
| 3,407 |
|
| Total Hydroelectric |
|
|
| 2,286 |
| 2,290 |
| 2,290 |
|
| Rapel |
| Reservoir |
| 377 |
| 377 |
| 377 |
|
| Cipreses |
| Reservoir |
| 106 |
| 106 |
| 106 |
|
| El Toro |
| Reservoir |
| 450 |
| 450 |
| 450 |
|
| Los Molles |
| Pass-through |
| 18 |
| 18 |
| 18 |
|
| Sauzal |
| Pass-through |
| 77 |
| 77 |
| 77 |
|
| Sauzalito |
| Pass-through |
| 12 |
| 12 |
| 12 |
|
| Isla (2) |
| Pass-through |
| 68 |
| 70 |
| 70 |
|
| Antuco |
| Pass-through |
| 320 |
| 320 |
| 320 |
|
| Abanico |
| Pass-through |
| 136 |
| 136 |
| 136 |
|
| Ralco |
| Reservoir |
| 690 |
| 690 |
| 690 |
|
| Palmucho (3) |
| Pass-through |
| 32 |
| 34 |
| 34 |
|
| Total Thermal |
|
|
| 853 |
| 1,156 |
| 1,117 |
|
| Huasco (4) |
| Steam Turbine/Coal |
| 16 |
| 16 |
| 0 |
|
| Bocamina |
| Steam Turbine/Coal |
| 128 |
| 128 |
| 128 |
|
| Diego de Almagro (5) |
| Gas Turbine/ Diesel Oil |
| 47 |
| 47 |
| 24 |
|
| Huasco |
| Gas Turbine/IFO 180 Oil |
| 64 |
| 64 |
| 64 |
|
| Taltal |
| Gas Turbine/Natural Gas+Diesel Oil |
| 245 |
| 245 |
| 245 |
|
| San Isidro 2 (6) |
| Combined Cycle /Natural Gas+Diesel Oil |
| 353 |
| 399 |
| 399 |
|
| Quintero (7) |
| Gas Turbine/Natural Gas+Diesel Oil |
| — |
| 257 |
| 257 |
Pehuenche |
| Total |
|
|
| 699 |
| 699 |
| 699 |
|
| Pehuenche |
| Reservoir |
| 570 |
| 570 |
| 570 |
|
| Curillinque |
| Pass-through |
| 89 |
| 89 |
| 89 |
|
| Loma Alta |
| Pass-through |
| 40 |
| 40 |
| 40 |
Pangue |
| Pangue |
| Reservoir |
| 467 |
| 467 |
| 467 |
San Isidro |
| San Isidro |
| Combined Cycle /Natural Gas+Diesel Oil |
| 379 |
| 379 |
| 379 |
Celta |
| Total |
|
|
| 182 |
| 182 |
| 182 |
|
| Tarapacá |
| Steam Turbine/Coal |
| 158 |
| 158 |
| 158 |
|
| Tarapacá |
| Gas Turbine/Diesel Oil |
| 24 |
| 24 |
| 24 |
Endesa Eco |
| Total |
|
|
| 27 |
| 87 |
| 87 |
|
| Canela |
| Wind Farm |
| 18 |
| 18 |
| 18 |
|
| Canela II (8) |
| Wind Farm |
| — |
| 60 |
| 60 |
|
| Ojos de Agua |
| Pass-through |
| 9 |
| 9 |
| 9 |
Gasatacama |
| Atacama |
| Combined Cycle /Natural Gas+Diesel Oil |
| 390 |
| 390 |
| 390 |
Total Capacity in Chile |
|
|
|
|
| 5,283 |
| 5,650 |
| 5,611 |
|
|
|
|
|
|
|
|
|
|
|
Colombia |
|
|
|
|
|
|
|
|
|
|
Emgesa |
| Total |
|
|
| 2,895 |
| 2,895 |
| 2,914 |
|
| Guavio |
| Reservoir |
| 1,213 |
| 1,213 |
| 1,213 |
|
| Paraíso |
| Reservoir |
| 276 |
| 276 |
| 276 |
|
| La Guaca |
| Pass-through |
| 325 |
| 325 |
| 325 |
|
| Termozipa |
| Steam Turbine/Coal |
| 236 |
| 236 |
| 236 |
|
| Cartagena |
| Steam Turbine/ Natural Gas + Diesel Oil |
| 208 |
| 208 |
| 208 |
|
| Minor plants (9) |
| Pass-through |
| 96 |
| 96 |
| 116 |
|
| Betania |
| Reservoir |
| 541 |
| 541 |
| 541 |
Total Capacity in Colombia |
|
|
|
|
| 2,895 |
| 2,895 |
| 2,914 |
Peru |
|
|
|
|
|
|
|
|
|
|
|
|
|
|
|
|
|
|
|
|
|
Edegel |
| Total |
|
|
| 1,467 |
| 1,473 |
| 1,474 |
|
| Huinco |
| Pass-through |
| 247 |
| 247 |
| 247 |
|
| Matucana |
| Pass-through |
| 129 |
| 129 |
| 129 |
|
| Callahuanca |
| Pass-through |
| 80 |
| 80 |
| 80 |
|
| Moyopampa |
| Pass-through |
| 65 |
| 65 |
| 66 |
|
| Huampani |
| Pass-through |
| 30 |
| 30 |
| 30 |
|
| Yanango (10) |
| Pass-through |
| 43 |
| — |
| — |
|
| Chimay (10) |
| Pass-through |
| 151 |
| — |
| — |
|
| Santa Rosa (11) (12) |
| Gas Turbine/Diesel Oil |
| 229 |
| 430 |
| 429 |
|
| Ventanilla |
| Combined Cycle/Natural Gas |
| 493 |
| 493 |
| 493 |
Chinango |
| Total |
|
|
| 0 |
| 194 |
| 194 |
|
| Yanango |
| Pass-through |
| — |
| 43 |
| 43 |
|
| Chimay |
| Pass-through |
| — |
| 151 |
| 151 |
Total Capacity in Peru |
|
|
|
|
| 1,467 |
| 1,667 |
| 1,668 |
Consolidated Capacity |
|
|
|
|
| 14,284 |
| 14,851 |
| 14,833 |
(1) | Reservoir and pass-through refer to a hydroelectric plant that uses a dam or a river, respectively, to move the turbines which generate electricity. |
| “Steam” refers to the technology of a thermal power plant that uses natural gas, coal, diesel or fuel oil, to produce steam that moves the turbines to generate the electricity. |
| “Gas Turbine” (GT) or “Open Cycle” refers to the technology of a thermal power plant that uses either diesel or natural gas to produce gas that moves the turbines to generate the electricity. |
| “Combined Cycle” refers to the technology of a thermal power plant that uses natural gas, diesel oil or fuel oil to generate gas that first moves the turbines to generate electricity and then recovers the gas that escapes from that process to generate steam to move another turbine. |
| “Wind Farm” refers to the technology that transforms the kinetic energy of wind into electricity. |
(2) | In December 2009, the CDEC-SIC recognized an increase in the installed capacity of the Isla power plant, from 68 MW to 70 MW. |
(3) | In December 2009, the CDEC-SIC recognized an increase in the installed capacity of the Palmucho power plant, from 32 MW to 34 MW. |
(4) | The commercial operation of Huasco’s steam/coal turbine ended on July 31, 2010. |
(5) | Until March 2010, it included one additional unit of Diego de Almagro (23 MW), which Endesa Chile had rented from Codelco since 2001. |
(6) | In December 2009, the CDEC-SIC recognized an increase in the installed capacity of the San Isidro 2 power plant, from 353 MW to 399 MW, due to the use of GNL as a replacement for diesel. |
(7) | In July and September 2009, the first and second unit started their commercial operations with a gross output of 129 MW and 128 MW, respectively. The Quintero power plant was finally declared as having a gross capacity of 257 MW, in open cycle operating with diesel, and from December 2009, it is also able to operate with natural gas from the LNG re-gasification plant. |
(8) | In December 2009, the Canela II wind farm started its commercial operations with a total declared capacity of 60 MW. |
(9) | Minor plants are registered with a total capacity of 116 MW. As of December 31, 2010 Emgesa owned and operated six minor plants: Charquito, El Limonar, La Tinta, Tequendama, La Junca and San Antonio. |
(10) | In May 2009, Yanango and Chimay power plants were transferred to Chinango, Edegel’s subsidiary. |
(11) | During 2008, the installed capacity of Santa Rosa was redefined as required by the relevant authority. |
(12) | In September 2009, the gas turbine, corresponding to the expansion of Santa Rosa thermal plant started its commercial operations with a gross capacity of 193 MW. In November 2009, a capacity increase of 7 MW was recognized, reaching 200 MW. Additionally, in April 2009, a capacity increase of 0.61 MW in the TG7 turbine of the Santa Rosa plant was also recognized. |
As of December 31, 2010, the Company has certified under the ISO 14,001 Standard the Environmental Management System of its 56 generation facilities in South America. In turn, the electricity generation certified under this standard was equivalent to 99.6% of the total production, equivalent to 57,546 GWh.
Investment Projects Completed during 2010
Argentina. Manuel Belgrano and San Martín Power Plant Projects
Two power plant projects, Manuel Belgrano and San Martín, both related to Endesa Chile through its subsidiaries, Endesa Costanera and El Chocón, were completed during 2010. Each project consisted of the installation of a combined cycle gas turbine, the first located next to Campana (80 kilometers north of Buenos Aires), and the second, in Timbúes (35 kilometers north of Rosario).
The Manuel Belgrano power plant was declared in commercial operations as a combined cycle plant on January 7, 2010 with an installed capacity of 848 MW. The annual generation during 2010 was 4,018 GWh. The San Martín power plant started its commercial operations as a combined cycle on February 2, 2010 with an installed capacity of 849 MW. The annual generation during 2010 was 3,139 GWh.
Chile. LNG Receiving Terminal at Quintero, Valparaíso Region
In May 2007, as part of a consortium with ENAP, Metrogas and British Gas, in which Endesa Chile participates with a 20% stake, we agreed to construct the LNG regasification facility in Quintero Bay. Partial commercial operations began in September 2009 and full commercial operations began on January 1, 2011. During 2010, 26 commercial ships unloaded LNG in this facility, and Endesa Chile consumed 978 million m3 of LNG during that period.
Projects under Construction
Chile. Bocamina Power Plant Expansion, Second Unit
Located in the district of Coronel, Bío-Bío Region, the project benefits from the existing harbor services, as well as some ancillary facilities of the first unit, built for coal storing and ashes disposal. This second unit will use pulverized coal and technology for emissions reduction. Its installed capacity is estimated at 370 MW. As a result of the February 27, 2010 earthquake, which severely affected the Bío-Bío Region, the start-up date, originally expected for December 2010, has been postponed until the second half of 2011. This project is being financed with internally generated funds.
Colombia. El Quimbo Hydroelectric Project
El Quimbo hydroelectric project is located in the department of Huila, on the Magdalena River, upstream of the Betania power plant. Its installed capacity will be 400 MW through two generation units. We expect that the project will start operations by December 2014. This project will be financed mainly with resources to be provided by external financing and to a lesser extent by internally generated funds of Emgesa.
In 2009, the Ministry of the Environment approved the environmental license and building permission. As a result of the awarding process, Emgesa assumed a Firm Energy Obligation for El Quimbo starting in December 2014.
The principal contracts, corresponding to the civil works and the manufacture, supply and assembly of the equipment, were awarded to the Impregilo — OHL consortium and the Alstom — Schrader Camargo consortium.
Projects under Development
The estimated investments disclosed in this section aggregate the funds that the Company expects to spend in nominal dollars in each year. Budgeted amounts include connecting lines that could eventually be owned by third parties and paid as tolls. In general terms, projects are expected to be financed with resources to be provided by external financing as well as internally generated funds for each of the companies described.
We continuously analyze different growth opportunities in the countries in which we participate. Thus, the expected start-up for each project is continuously assessed and will be defined based on the commercial opportunities and the financing capacity of the Company to fund these projects. The most relevant projects in the pipeline are as follows:
Chile. Los Cóndores Project
The Los Cóndores project will be located in the Maule Region. It consists of the construction of a pass-through hydroelectric plant of 150 MW installed capacity, which will use the waters from the Maule lake reservoir through an adduction system 12 kilometers long. The plant will be connected to the SIC at the Ancoa substation.
The project is completing its feasibility study for a revised version that implies the construction of a tunnel with TBM technology (tunnel machinery) which involves higher efficiencies, safety standards and a lower environmental impact.
The environmental approval procedures for the line connecting with the SIC began in October 2010. Total estimated investment is in the range of $ 450-$ 500 million, of which $ 21 million have been paid. Start-up is expected no earlier than the second half of 2016. Until now, this project has been financed with resources provided by Endesa Chile. During 2011, we expect to present a modification to the environmental impact study, conclude the basic engineering studies and start the bidding process for construction.
Chile. Neltume and Choshuenco Hydroelectric Projects
The Neltume and Choshuenco projects are located in Los Ríos Region, on the upper part of the Valdivia River basin. The Neltume project consists of a 490 MW installed capacity pass through hydro plant. The Choshuenco project uses the flows of the Llanquihue River at its source, at the junction with the Fuy and Neltume Rivers, with the possibility of building a pass through hydroplant of approximately 130 MW. Total estimated investment for the Neltume project is in the range of $ 850-$ 900 million, of which $ 28 million have been paid. For Choshuenco, total estimated investment is in the range of $ 400-$ 450 million, of which $ 5 million have been paid. Start-up is expected no earlier than the second half of 2017 for the Neltume project and first half of 2018 for the Choshuenco project. Until now, both projects have been financed with resources provided by Endesa Chile.
The Neltume project is at its basic engineering stage and some design improvements continue to be analyzed. On December 2, 2010, the project’s environmental impact assessment was re-submitted and was accepted for process on December 10, 2010 by the environmental authority. The project for the Neltume-Pullinque transmission line was submitted to the environmental evaluation system on December 9, 2010, and was accepted for process on December 16, 2010. The Choshuenco project is in a stage of analyzing alternatives.
Chile. HidroAysén Project
The HidroAysén hydroelectric project consists of five hydroelectric power stations, with an aggregate installed capacity of 2,750 MW, two of which are in the Baker River (660 MW and 360 MW) and the other three are in the Pascua River (770 MW, 500 MW, and 460 MW). Connection to the SIC consists of a 500 kV high-voltage direct current (HVDC) transmission line with an extension of approximately 2,000 kilometers. Estimated investment for Endesa Chile’s 51% participation is in the range of $ 2,700-$ 3,200 million, of which $ 92 million have been paid. Start-up of the first unit is expected no earlier than the second half of 2019. Until now, our stake in this project has been financed with resources provided by Endesa Chile. On May 9, 2011 the environmental authorities approved the Environmental Impact Assessment presented for the HidroAysén project.
On December 31, 2009, the contract with Transelec for the provision of services for the development of the pro-forma project and environmental assessments for the HVDC line for transporting electricity to the SIC expired. Effective January 1, 2010 HidroAysén assumed the management of all the contracts that were in effect at that date, including those associated with the preparation of the environmental impact study. In February 2010, the evaluation of requests from third parties interested in using transmission line the capacity was completed, thus complying with the open-season process established in Condition No.1 of resolution No.022/2007 of the Antitrust Tribunal, without any of the interested companies presenting the payment of the amount corresponding to the line’s preliminary costs and evaluation.
Different communications’ initiatives were continued with the region’s inhabitants, with the communities and local authorities, and at a nationwide level, showing the principal advantages of hydroelectricity to the different stakeholders of the project. Additionally, HidroAysén has assumed a voluntary commitment to provide cheaper energy to the Aysén Region, which currently pays one of the highest electricity costs in the country. This project consists of increasing the energy availability in the region by 26.6 MW, mainly through mini-hydroelectric plants.
The construction of the HidroAysén project is expected to improve road infrastructure, telecommunications coverage, and the development of new services associated with the construction, especially housing, meals, transport and commerce. In addition, it will create new jobs, which would rise to a monthly average of 2,260, with a peak of 5,000 at the stage of highest demand.
Chile. Punta Alcalde Power Plant
The project consists of the construction of a thermoelectric plant with two steam-coal units, with a total installed capacity of 740 MW, located in the Atacama Region. The plant will be connected to the SIC at the Maitencillo substation through a 220 kV transmission system.
Total estimated investment for the first unit of this plant is in the range of $ 1,050-$ 1,100 million, of which $ 14 million have been paid. Start-up is expected no earlier than first half of 2016. Until now, this project has been financed with resources provided by Endesa Chile.
The project is in its feasibility stage and on-site studies are being made. The project’s environmental impact study process, which was submitted on February 27, 2009, is continuing. As of December 2010, progress was being made in preparing responses to the ICSARA No.3.
Chile. Piruquina Mini Hydro Project
The project is developed by Endesa Eco and is located in the Chiloé Island, 17 km from Castro. It consists of a pass-through hydroelectric power plant which will use water flow from the Carihueico River. According to the feasibility study, the installed capacity will be 7.6 MW. The plant will be connected to the SIC at the Pid-Pid substation, located about 10 kilometers from the plant.
Total estimated investment is in the range of $ 25-$ 30 million, of which $ 3 million have been paid. Start-up is expected no earlier than the first half of 2013. Until now, this project has been financed with resources provided by Endesa Chile.
In November 2009, the Los Lagos Region Corema approved the environmental impact study. On December 10, 2010, the notice to proceed was given to the company CON-PAX for stage No.1 of the EPC contract, which includes the preparation of the basic engineering and obtaining of the environmental and other permits. Once stage No.1 is completed, Endesa Eco can give notice to proceed for stage No.2, corresponding to the construction of the plant.
Peru. Curibamba Hydroelectric Project
This corresponds to a 188 MW plant located in the department of Junín and which uses waters from the rivers Comas and Uchubamba, in the upper part of the river where the Chimay power plant is located.
Total estimated investment for this plant is in the range of $ 300-$ 350 million, of which $ 3 million have been paid. Start-up is expected no earlier than the second half of 2016. Until now, this project has been financed with resources provided by Edegel.
On September 16, 2010 the environmental impact study of the generating plant was submitted to the Energy Environmental Affairs Authority (DGAAE). The preparation of the environmental impact study for the transmission line has begun in October 2010. Progress was also made during 2010 in carrying out the topographical and bathymetric studies, the study of the property deed and diagnosis of the social-economic situation of the inhabitants of the project’s area of influence.
Property, Plants and Equipment of Distribution Companies
We also have significant interests or investments in electricity distribution. The description of each distribution company is included in this “Item 4. Information on the Company.” The table set forth below describes our main equipment used for our distribution business, such as transmission lines, substations, distribution networks and transformers.
We are insured against damage to substations, transformers that are within the substations, the distribution network that is not farther than 1 kilometer from the substations and administrative buildings. Risks covered include losses caused by fires, explosions, earthquakes, floods, lightning, damage to machinery and other such events. Insurance policies include liability clauses, which protect our companies from complaints made by third parties. Transmission lines and the equipment attached to them do not qualify as insurable assets for property damage, although they have insurance policies including civil liability clauses for damages against third parties caused by these transmission installations.
TABLE OF DISTRIBUTION FACILITIES
General Characteristics
|
|
|
| Concession Area |
| Transmission |
| ||||
|
| Location |
| (km2) |
| 2008 |
| 2009 |
| 2010 |
|
Chilectra |
| Chile |
| 2,118 |
| 355 |
| 355 |
| 355 |
|
Edesur |
| Argentina |
| 3,309 |
| 1,160 |
| 1,162 |
| 1,162 |
|
Edelnor |
| Peru |
| 2,440 |
| 425 |
| 436 |
| 449 |
|
Ampla |
| Brazil |
| 32,615 |
| 2,333 |
| 2,333 |
| 2,339 |
|
Coelce |
| Brazil |
| 148,825 |
| 4,244 |
| 4,312 |
| 4,351 |
|
Codensa |
| Colombia |
| 14,087 |
| 1,227 |
| 1,240 |
| 1,240 |
|
EEC |
| Colombia |
| 4,130 |
| — |
| 34 |
| 35 |
|
Total |
|
|
| 207,524 |
| 9,744 |
| 9,872 |
| 9,932 |
|
(1) The transmission lines consist of circuits with voltages in the 27-220 kV range.
Power and Interconnection Substations and Transformers (1)
|
| 2008 |
| 2009 |
| 2010 |
| ||||||||||||
|
| Number of |
| Number of |
| Capacity |
| Number of |
| Number of |
| Capacity |
| Number of |
| Number of |
| Capacity |
|
Chilectra |
| 53 |
| 148 |
| 6,652 |
| 53 |
| 149 |
| 6,729 |
| 53 |
| 152 |
| 6,904 |
|
Edesur |
| 66 |
| 171 |
| 11,406 |
| 67 |
| 173 |
| 11,481 |
| 67 |
| 173 |
| 11,481 |
|
Edelnor |
| 29 |
| 64 |
| 2,452 |
| 29 |
| 64 |
| 2,572 |
| 29 |
| 67 |
| 2,757 |
|
Ampla |
| 116 |
| 226 |
| 4,376 |
| 117 |
| 226 |
| 4,434 |
| 116 |
| 222 |
| 4,386 |
|
Coelce |
| 95 |
| 151 |
| 2,145 |
| 97 |
| 154 |
| 2,211 |
| 98 |
| 156 |
| 2,273 |
|
Codensa |
| 61 |
| 206 |
| 7,460 |
| 62 |
| 208 |
| 7,524 |
| 62 |
| 211 |
| 7,665 |
|
EEC |
| — |
| — |
| — |
| 23 |
| 32 |
| 161 |
| 23 |
| 31 |
| 170 |
|
Total |
| 420 |
| 966 |
| 34,491 |
| 448 |
| 1,006 |
| 35,112 |
| 448 |
| 1,012 |
| 35,636 |
|
(1) Voltage of these transformers is in the range of 500 kV (high voltage) and 7 kV (medium voltage).
Distribution Network - Medium and Low Voltage Lines (1)
|
| 2008 |
| 2009 |
| 2010 |
| ||||||
|
| Medium Voltage |
| Low Voltage |
| Medium Voltage |
| Low Voltage |
| Medium Voltage |
| Low Voltage |
|
Chilectra |
| 4,745 |
| 9,817 |
| 4,822 |
| 9,964 |
| 4,945 |
| 10,285 |
|
Edesur |
| 7,118 |
| 15,760 |
| 7,223 |
| 15,870 |
| 7,318 |
| 15,937 |
|
Edelnor |
| 3,480 |
| 18,053 |
| 3,597 |
| 18,708 |
| 3,694 |
| 19,234 |
|
Ampla |
| 31,238 |
| 16,901 |
| 32,052 |
| 17,146 |
| 32,562 |
| 17,278 |
|
Coelce |
| 68,435 |
| 42,281 |
| 74,829 |
| 44,297 |
| 78,578 |
| 45,684 |
|
Codensa |
| 18,417 |
| 22,096 |
| 18,881 |
| 22,202 |
| 19,104 |
| 22,579 |
|
EEC |
| — |
| — |
| 3,606 |
| 5,430 |
| 3,624 |
| 5,608 |
|
Total |
| 133,433 |
| 124,908 |
| 145,011 |
| 133,618 |
| 149,824 |
| 136,605 |
|
(1) Medium voltage lines: 7 kV—34.5 kV; low voltage lines: 380-110 V.
Transformers for Distribution (1)
|
| 2008 |
| 2009 |
| 2010 |
| ||||||
|
| Number of |
| Capacity |
| Number of |
| Capacity |
| Number of |
| Capacity |
|
Chilectra |
| 27,768 |
| 6,062 |
| 28,057 |
| 6,256 |
| 28,362 |
| 6,500 |
|
Edesur |
| 23,834 |
| 5,110 |
| 23,474 |
| 5,339 |
| 23,583 |
| 5,508 |
|
Edelnor |
| 9,481 |
| 1,252 |
| 9,540 |
| 1,304 |
| 9,665 |
| 1,347 |
|
Ampla |
| 102,878 |
| 3,561 |
| 105,308 |
| 3,701 |
| 107,663 |
| 3,882 |
|
Coelce |
| 115,086 |
| 3,825 |
| 124,800 |
| 3,944 |
| 128,836 |
| 4,411 |
|
Codensa |
| 62,952 |
| 7,559 |
| 64,792 |
| 7,821 |
| 65,836 |
| 8,055 |
|
EEC |
| — |
| — |
| 6,628 |
| 321 |
| 6,687 |
| 304 |
|
Total |
| 341,999 |
| 27,369 |
| 362,599 |
| 28,686 |
| 370,632 |
| 30,007 |
|
(1) Voltage of these transformers is in the range of 34.5 kV (medium voltage) and 110 V (low voltage).
Major Encumbrances
Endesa Costanera’s supplier debt with Mitsubishi Corporation corresponds to the remaining payments in the purchase of equipment. As of December 31, 2010, the value of the assets pledged as liens on this debt was Ch$ 41 billion. Additionally, Endesa Costanera has executed liens for Ch$ 12 billion as of December 31, 2010 in favor of Credit Suisse First Boston in order to guarantee a loan.
Edegel has a debt arising from the financing of the Ventanilla power plant. As of December 31, 2010, the value of the assets pledged as liens for this debt was Ch$ 96 billion. For further information, see Note 34 of our audited Consolidated Financial Statements.
Climate Change
In recent years, the country and the region have seen a growing development related to non conventional renewable energy and strategies to face climate change. This has led both the public and private sectors to conduct suitable strategies for adapting themselves to the new requirements, evidenced by legal obligations at the local level, commitments assumed by countries at the international level and the demanding requirements of the international markets in these matters.
Non-conventional renewable energies (NCRE) provide energy with minimal or no adverse environmental impact. They are therefore considered as technological options that strengthen sustainable energy development as they supplement the production of traditional generators.
During 2010, Enersis and its subsidiaries, in particular Endesa Chile’s subsidiary Endesa Eco, carried out several activities and held working meetings with different public, academic and private entities, in order to learn and share experiences about the technical and regulatory developments in connection with NCRE and climate change at both the local
and international levels, analyze and establish strategic alliances, develop social and private projects and strengthen the leadership position achieved by the company in Chile.
In addition to the Canela wind farm (18 MW, in operation since late 2007) and the Ojos de Agua mini-hydroelectric plant (9 MW) in operation since 2008, the Canela II wind farm (60 MW), located in the Coquimbo Region, started operations in 2009.
Regarding the development of emission reduction mechanisms, during 2010, the projects in the Clean Development Mechanism (CDM) circuit were:
Ojos de Agua Mini-Hydroelectric Plant: Procedures began during 2009 for the verification of the greenhouse gas emissions (CO2) avoided by the Ojos de Agua mini-hydroelectric plant the year before, in order to certify and trade these emission reductions under the CDM. In 2010, we also requested the verification of the greenhouse gas emissions avoided during 2009. Since its start-up in 2008, the installation has avoided the emission of some 42,000 tons of CO2, which can be traded once they are verified.
Canela Wind Farm: On April 3, 2009, the United Nations Climate Change Office approved the registration of the Canela project in the CDM circuit as a CDM project, which recognizes that this wind farm may verify and trade the greenhouse gas emissions it will avoid during its useful life. During 2010, the Designated Operational Entity was contracted for verifying the first period of carbon credits. Since its start-up in 2009, the installation has avoided the emission of some 47,000 tons of CO2, which can be traded on the CDM circuit as soon as they are verified.
Canela II Wind Farm: A large part of the procedures for validating the Canela 60 MW wind farm (Canela II) were carried out during 2010, a requirement prior to obtaining registration of the reduction with the UNFCCC. On October 18, 2010 the Ministry of the Environment, as the Designated National Authority, signed the letter accrediting that the project contributes to the country’s sustainable development and therefore meets the requirements for being registered as a CDM project. According to the base-line analysis presented in the Project Design Document (PDD), we estimate that the facility will avoid the emission of 89,608 tons of CO2 annually.
Detail of CDM projects processed in 2010 by Endesa Eco
CDM project |
| Company/country |
| Position as of December 31, 2010 |
| Emission factor |
| Approximate |
Ojos de Agua mini-hydroelectric plant |
| Endesa Eco (Chile) |
| Registered with the Executive Authority of the UNFCCC since April 2007 and currently in verification the reduction in emissions of 2008 and 2009 period. |
| 0.4348 |
| 42,000 |
Canela wind farm |
| Central Eólica |
| Registered with the Executive Authority of the UNFCCC since April 2009 |
| 0.5713 |
| 47,000 |
Canela II wind farm |
| Central Eólica |
| PDD prepared, public enquiry held and validation in progress. |
| 0.6541 |
| 89,608 |
(1) CER: Certified Emission Reductions.
The greenhouse gas emissions of the Company for the last three years, including our 50% stake in GasAtacama, were 12.4 million tons in 2008, 12.2 million tons in 2009 and 11.8 million tons in 2010.
Item 4A. Unresolved Staff Comments
None
Item 5. Operating and Financial Review and Prospects
A. Operating Results.
The following discussion should be read in conjunction with our Consolidated Financial Statements and the notes thereto, included in Item 18 in this annual report, and “Selected Financial Data,” included in Item 3 herein. Our Consolidated Financial Statements as of December 31, 2008, 2009 and 2010 have been prepared in accordance with IFRS. Effective January 1, 2009, we adopted IFRS as issued by the IASB, in replacement of the previous accounting principles, which were under Chilean GAAP.
1. Discussion of Main Factors Affecting Operating Results and Financial Condition of the Company
We are an investment company that owns and operates electric power generation, transmission, and distribution companies in Chile, Argentina, Brazil, Colombia and Peru. Most of our revenues, income and cash flows come from the operations of our subsidiaries, jointly-controlled companies and associates in these five countries.
Factors such as hydrologic conditions, regulatory developments, extraordinary actions adopted by government authorities and economic conditions in each country in which we operate are important in determining our financial results. In addition, the results from operations and financial condition are affected by variations in growth rate and exchange rates between the peso and the currencies of the other four countries in which we operate. These exchange variations may have an important impact in the consolidation of the results of our companies outside Chile. Lastly, we have certain critical accounting policies that affect our consolidated operating results.
Our portfolio strategy allows the impact of significant changes in one country to be sometimes offset by opposing changes in other countries, or within our two segments, leading to no significant impacts on consolidated figures. The impact of these factors on us, for the years covered by this report, is discussed below.
a. Hydrological Conditions: Generation Business
A substantial part of our generation business depends on hydrological conditions prevailing in the countries where we operate, although only extreme hydrological conditions materially affect the Company’s operating results and financial condition. In terms of installed capacity, in 2008, 2009 and 2010, 60%, 58% and 58% of Enersis’ consolidated installed capacity, respectively, has been hydroelectric. Consolidated hydroelectric capacity was 8,641 MW as of December 31, 2008, 8,654 MW as of December 31, 2009 and 8,675 MW as of December 31, 2010.
Hydrological conditions in 2008, 2009 and 2010 have not led to significant changes in our financial condition and results from operations. Hydroelectric generation was 35,605 GWh in 2008, 37,730 GWh in 2009 and 33,689 GWh in 2010. The lower hydroelectric generation in 2010 was associated with lower hydrological conditions in Chile, Argentina and Colombia as compared to the previous year. Consolidated operating income was Ch$ 1,864 billion in 2008, Ch$ 1,927 billion in 2009 and Ch$ 1,704 billion in 2010.
Our thermal generators burn natural gas, LNG, coal or diesel. We can offset the effect of low hydrology (reservoir levels, rain and snow), in the geographical areas where we operate our plants by thermal generation and purchases. The company’s thermal installed capacity and the ability to purchase electricity from other generators allow us to increase thermal generation and/or purchase electricity from competitors to meet our commitments. In addition, given industry structure and the percentage of hydroelectric generation capacity in the countries where we operate, when hydrology is low, electricity prices generally increase. Under certain circumstances, low hydrology could potentially lead to higher revenues and sometimes, higher operating income.
Operating costs of thermal generation and energy purchases are higher than the variable cost of hydroelectric generation, in normal hydrological conditions. The cost of thermal generation does not directly depend on hydrology but instead on global commodity prices. However, the cost of electricity purchases in the spot market does depend on hydrology and commodity prices. For further information on the effects of hydrological conditions on our operating results, please see “Item 3. Key Information — D. Risk Factors — “Since our generation business depends heavily on hydrological conditions, drought conditions may hurt our profitability.”
b. Regulatory Developments
The regulatory frameworks governing our business in the five countries where we operate have a material effect on our results from operations. In particular, regulators set (i) generation tariffs taking into consideration factors such as fuel costs, reservoir levels, exchange rates, future investments in installed capacity and demand growth, and (ii) distribution tariffs taking into account the costs of energy purchases paid by distribution companies (which distribution companies pass on to their customers) and the “Value Added from Distribution,” or VAD; all of which are intended to reflect investment and operating costs incurred by distribution and generation companies and is meant to allow such companies to obtain a return on their investments. The earnings of our electricity subsidiaries are determined to a large degree by government regulators, mainly through the tariff setting process. For additional information relating to the regulatory frameworks in the countries where we operate, see “Item 4. Information on the Company — B. Business Overview — Electricity Industry Regulatory Framework.”
c. Economic Conditions
Macroeconomic conditions in the countries in which we operate may have a significant effect on our operating results. For example, when a country experiences sustained economic growth, consumption of electricity by industrial and individual consumers increases. Other macroeconomic factors such as the variation of the local currency in the countries where we operate may impact our results from operations, as well as assets and liabilities, depending on the percentage denominated in dollars. For example, a devaluation of local currencies against the dollar increases in the cost of capital expenditure plans. For additional information, see “Item 3. Key Information—D. Risk factors—Foreign exchange risks may adversely affect our results and the dollar value of dividends payable to ADS holders “and”—South American economic fluctuations are likely to affect our results from operations and financial condition, as well as the value of our securities.”
Economic Growth and Electricity Demand
Economic growth in 2010 was strong in all of the countries in which we operate, largely based on domestic private consumptions and investment. The worldwide financial and economic crisis adversely impacted developed economies, but Latin America showed resilience to global threats and the outlook remains better than for the developed world. According to the IMF’s October 2010 Regional Economic Outlook: Western Hemisphere, the estimated 2011 GDP growth for Latin America and the Caribbean (simple average) is 4.0%. Brazil, Chile, Peru and Colombia are expected to lead the way. Nonetheless, there are several risks to the outlook. The main risk is inflation pressure in these economies. Most commodity-exporting countries in Latin America are facing highly favorable conditions, and particularly those with stronger fundamentals, who have easiest access to external financing and stand to benefit the most from low global interest rates. Capital inflows to the region are accelerating and should stay strong throughout 2011. The political outlook in Argentina is highly uncertain, but the near term risk for that economy remains overheated growth.
Demand for electricity in 2010 was also higher compared to 2009 due to the economic recovery in most of those countries. The GDP and electricity growth rate for the years covered by this report are included in the following table:
|
| 2008 |
| 2009 |
| 2010 |
| ||||||
|
| GDP |
| Electricity |
| GDP |
| Electricity |
| GDP |
| Electricity |
|
Chile (1) |
| 3.7 |
| 0.3 |
| (1.7 | ) | 0.5 |
| 5.2 |
| 3.4 |
|
Argentina |
| 6.8 |
| 2.9 |
| 0.9 |
| (1.3 | ) | 7.5 |
| 5.9 |
|
Colombia |
| 2.7 |
| 1.9 |
| 0.8 |
| 1.5 |
| 4.7 |
| 2.6 |
|
Brazil |
| 5.1 |
| 2.8 |
| (0.2 | ) | (1.0 | ) | 7.5 |
| 7.1 |
|
Peru |
| 9.8 |
| 9.5 |
| 0.9 |
| 0.9 |
| 8.3 |
| 8.5 |
|
Source: GDP growth data for all countries except Chile was obtained from the Regional Economic Outlook: Western Hemisphere (October 2010) of the International Monetary Fund (IMF). GDP growth data for Chile was obtained from the Chilean Central Bank. Electricity demand growth data was obtained from internal Company physical energy data.
(1) Electricity demand growth in the SIC and the SING.
Local Currency Exchange Rate
Variations in the parity of the dollar and the local currency in each of the countries in which we have operations may have an impact on our operating results and overall financial position. The impact will depend on the level at which tariffs
are pegged to the dollar, dollar-denominated assets and liabilities existing in the period and also the translation of financial statements of our foreign subsidiaries for consolidation purposes to the presentation currency, which is the Chilean peso.
The following table sets forth the closing and average local currencies per dollar exchange rates for the periods indicated.
|
| Local Currency Dollar Exchange Rates |
| ||||||||||
|
| 2008 |
| 2009 |
| 2010 |
| ||||||
|
| Average |
| Year End |
| Average |
| Year End |
| Average |
| Year End |
|
Chile (peso per dollar) |
| 521.8 |
| 636.45 |
| 559.15 |
| 507.10 |
| 510.22 |
| 468.01 |
|
Argentina (Argentine peso per dollar) |
| 3.16 |
| 3.45 |
| 3.77 |
| 3.80 |
| 3.92 |
| 3.98 |
|
Colombia (Colombian peso per dollar) |
| 1,963 |
| 2,246 |
| 2,155 |
| 2,044 |
| 1,895 |
| 1,914 |
|
Brazil (reais per dollar) |
| 1.83 |
| 2.34 |
| 2.00 |
| 1.74 |
| 1.69 |
| 1.66 |
|
Peru (sol per dollar) |
| 2.92 |
| 3.14 |
| 3.01 |
| 2.89 |
| 2.81 |
| 2.81 |
|
(1) Sources: Central Bank of each country.
As of December 31, 2010, Enersis had total consolidated indebtedness in financial terms of $ 7,579 million, of which 29.6% was denominated in dollars, 21.0% in reais, 20.9% in Colombian pesos, 20.3% in pesos, 5.9% in soles and 2.3% in Argentine pesos.
For the year ended December 31, 2010, our operating revenues before consolidation adjustments amounted to $ 15,870 million of which approximately 23% were either denominated in dollars or linked to dollars through some form of indexation. In respect of the total balance, $ 4,822 million were revenues in reais, $ 2,581 million in pesos, $ 2,597 million in Colombian pesos, $ 1,395 million in Argentine pesos and $ 776 million in soles.
d. Critical Accounting Policies
Financial Reporting Release Section 501.1 encourages all companies to include a discussion of critical accounting policies or methods used in the preparation of financial statements. Critical accounting policies are defined as those that reflect significant judgments and uncertainties, which would potentially result in materially different results under different assumptions and conditions. We believe that our critical accounting policies are limited to those described below with reference to the preparation of our financial statements under IFRS.
Impairment of Long-Lived Assets
During the period, and principally at period end, the Company evaluates whether there is any indication that an asset has been impaired. Should any such indication exist, the company estimates the recoverable amount of that asset to determine, where appropriate, the amount of impairment. In the case of identifiable assets that do not independently generate cash flows, the company estimates the recoverability of the Cash Generating Unit to which the asset belongs, which is understood to be the smallest identifiable group of assets that generates independent cash inflows.
Notwithstanding the preceding paragraph, in the case of Cash Generating Units to which goodwill or intangible assets with an indefinite useful life have been allocated, a recoverability analysis is performed routinely at each period end.
The recoverable amount is the greater between the fair value less the cost needed to sell and the value in use, which is defined as the present value of the estimated future cash flows. In order to calculate the recoverable value of property, plant and equipment, goodwill and intangible assets, value in use criteria is used by the Group in practically all cases.
To estimate the value in use, the Group prepares future cash flow projections, before tax, based on the most recently available budgets. These budgets incorporate management’s best estimates of revenue and costs of Cash Generating Units using sector projections, past experience and future expectations.
In general, these projections cover the next ten years, estimating cash flows for subsequent years by applying reasonable growth rates between 3.3% and 6.7% that, in no case, are increasing nor exceed the average long-term growth rates for the particular sector and country.
These cash flows are discounted at a given pre-tax rate in order to calculate their present value. This rate reflects the cost of capital of the business and the geographical area in which the business is carried on. In order to calculate the discount rate,
the current time value of money and the risk premiums generally used by analysts for the business and the geographical area are taken into account.
The discount rates, before tax, expressed in nominal terms and applied in 2010 and 2009 are the following:
|
|
|
| 2009 |
| 2010 | ||||
Country |
| Currency |
| Minimum |
| Maximum |
| Minimum |
| Maximum |
Chile |
| pesos |
| 9.2% |
| 9.5% |
| 7.5% |
| 8.8% |
Argentina |
| Argentine peso |
| 19.5% |
| 15.0% |
| 16.9% | ||
Brazil |
| Brazilian reais |
| 11.3% |
| 9.6% |
| 10.8% | ||
Peru |
| soles |
| 9.1% |
| 7.9% |
| 8.1% | ||
Colombia |
| Colombian peso |
| 11.5% |
| 9.6% |
| 9.8% | ||
If the recoverable amount is less than the net carrying amount of the asset, the corresponding provision for impairment loss is recorded for the difference, and charged to “Reversal of impairment loss (impairment loss) recognized in profit or loss” in the consolidated statement of comprehensive income.
Impairment losses recognized for an asset in prior periods are reversed when its estimated recoverable amount changes, increasing the asset’s value with a credit to earnings, limited to the asset’s carrying amount if no adjustment had occurred. In the case of goodwill, adjustments that would have been made are not reversible.
Litigation and Contingencies
The Company is currently involved in some legal and tax proceedings. As discussed in Note 22.2 to our Consolidated Financial Statements as of December 31, 2010, we have estimated the probable outflows of resources of resolving these claims. We have reached this estimate after consulting our legal and tax advisors who are carrying out our defense in these matters and an analysis of potential results, assuming a combination of litigation and settlement strategies.
Hedges Revenues Directly Linked to the Dollar
The Company has established a policy to hedge the portion of its revenues directly linked to the dollar by obtaining financing in this currency. Exchange differences related to this debt, as they are cash flow hedge transactions, are charged, net of taxes, to an equity reserve account and recorded as income during the period in which the hedged cash flows are realized. This term has been estimated at ten years.
This policy reflects a detailed analysis of our future dollar revenue streams. Such analysis may change in the future due to new electricity regulations limiting the amount of revenues tied to the dollar.
Pension and Post-Employment Benefits Liabilities
We have various defined benefits plans for our employees. These plans pay benefits to employees at retirement and use formulas based on years of service and the compensation of the participants. We also offer certain additional benefits for some retired employees in particular.
The liabilities shown for the pensions and post-employment benefits reflect our best estimate of the future cost of meeting our obligations under these plans. The accounting applied to these defined benefit plans involves actuarial calculations which contain key assumptions that include: employee turnover, life expectancy and retirement ages, discount rates, expected returns on assets, the future level of compensation and benefits, the claims rate under medical plans and future medical costs. These assumptions change as economic and market conditions vary and any change in any of these assumptions could have an important effect on the reported results from operations.
The effect of an increase of one percentage point in the discount rate used to determine the present value of the post-employment defined benefits would decrease the liability by Ch$ 48,203 million (Ch$ 40,456 million in 2009 and Ch$ 37,411 million in 2008) and the effect of a decrease of one percentage point in the rate used to determine the present value of the post-employment defined benefits would increase the liability by Ch$ 56,463 million (Ch$ 47,467 million in 2009 and Ch$ 41,370 million in 2008).
For further detail of the main accounting policies and the methods used in the preparation of the financial statements, see Notes 2 and 3 to our Consolidated Financial Statements.
Recent Accounting Pronouncements
Please see “Item 18. Financial Statements — Note 2.2” for additional information regarding recent accounting pronouncement.
2. Enersis’ Results from Operations for the Years ended December 31, 2009 and December 31, 2010
Due to internal reclassifications introduced during 2010, some figures may differ from those presented in our Form 20-F for 2009. Differences in figures are not significant and do not affect the consolidated net income previously disclosed in our Form 20-F for 2009.
Revenues
Generation and Transmission Business
The following table sets forth the physical electricity sales of our subsidiaries and their corresponding changes for the twelve-month periods ended on December 31, 2009 and 2010.
|
| Physical sales during |
| ||||||
|
| Year ended December 31, |
| ||||||
|
| 2009 |
| 2010 |
| Change |
| % Change |
|
|
|
|
| (GWh) |
|
|
|
|
|
|
|
|
|
|
|
|
|
|
|
Endesa Chile (Chile) (1) |
| 22,327 |
| 21,847 |
| (480 | ) | (2.1 | )% |
Endesa Costanera (Argentina) |
| 8,284 |
| 8,018 |
| (266 | ) | (3.2 | )% |
El Chocón (Argentina) |
| 4,122 |
| 3,361 |
| (761 | ) | (18.5 | )% |
Edegel (Peru) |
| 8,321 |
| 8,598 |
| 277 |
| 3.3 | % |
Emgesa (Colombia) |
| 16,806 |
| 14,817 |
| (1,989 | ) | (11.8 | )% |
Cachoeira Dourada (Brazil) |
| 3,862 |
| 3,833 |
| (29 | ) | (0.8 | )% |
Endesa Fortaleza (Brazil) |
| 3,007 |
| 2,957 |
| (50 | ) | (1.7 | )% |
Total |
| 66,728 |
| 63,431 |
| (3,297 | ) | (4.9 | )% |
(1) Includes Endesa Chile and its generation subsidiaries.
Distribution Business
Distribution revenues are derived mainly from the resale of electricity purchased from generators. Revenues associated with distribution include the recovery of the cost of electricity purchased and the resulting revenue from the VAD, which is associated with the recovery of costs and the return on the investment with respect to the distribution assets plus the losses permitted in the regulatory tariffs. Other revenue deriving from our distribution services consists of charges related to new connections and the maintenance and rental of meters.
The following table sets forth the physical electricity sales of our subsidiaries, by country, and their corresponding variations for the years ended December 31, 2009 and 2010.
|
| Physical sales during |
| ||||||
|
| Year ended December 31, |
| ||||||
|
| 2009 |
| 2010 |
| Change |
| % Change |
|
|
| (GWh) |
|
|
| ||||
Chilectra (Chile) |
| 12,585 |
| 13,098 |
| 513 |
| 4.1 | % |
Edesur (Argentina) |
| 16,026 |
| 16,759 |
| 733 |
| 4.6 | % |
Edelnor (Peru) |
| 5,716 |
| 6,126 |
| 410 |
| 7.2 | % |
Ampla (Brazil) |
| 9,394 |
| 9,927 |
| 533 |
| 5.7 | % |
Coelce (Brazil) |
| 7,860 |
| 8,850 |
| 990 |
| 12.6 | % |
Codensa (Colombia)(1) |
| 12,114 |
| 12,515 |
| 400 |
| 3.3 | % |
Total |
| 63,694 |
| 67,274 |
| 3,580 |
| 5.6 | % |
(1) Values for Codensa include the consolidation of 49.0% of DECA. This consolidation also affects other figures in this section, such as operating income, revenues, operating costs and number of clients.
Revenues by Business Segment
The table below presents our revenues for 2009 and 2010:
|
| Year ended December 31, |
| ||||||
|
| 2009 |
| 2010 |
| Change |
| % Change |
|
|
| (in million of Ch$) |
|
|
| ||||
Generation and Transmission Business |
|
|
|
|
|
|
|
|
|
Endesa Chile and subsidiaries (Chile) |
| 1,373,231 |
| 1,345,371 |
| (27,860 | ) | (2.0 | )% |
Endesa Costanera (Argentina) |
| 231,421 |
| 295,231 |
| 63,810 |
| 27.6 | % |
El Chocón (Argentina) |
| 65,298 |
| 57,173 |
| (8,125 | ) | (12.4 | )% |
Cachoeira Dourada (Brazil) |
| 88,300 |
| 115,663 |
| 27,363 |
| 31.0 | % |
Endesa Fortaleza (Brazil) |
| 138,595 |
| 150,371 |
| 11,776 |
| 8.5 | % |
CIEN (Brazil) |
| 97,961 |
| 98,909 |
| 948 |
| 1.0 | % |
Emgesa (Colombia) |
| 500,964 |
| 507,516 |
| 6,552 |
| 1.3 | % |
Edegel (Peru) |
| 213,625 |
| 211,263 |
| (2,362 | ) | (1.1 | )% |
Less: Intercompany Transactions |
| (1,037 | ) | (904 | ) | 133 |
| (12.8 | )% |
Total |
| 2,708,358 |
| 2,780,593 |
| 72,235 |
| 2.7 | % |
|
|
|
|
|
|
|
|
|
|
Distribution Business |
|
|
|
|
|
|
|
|
|
Chilectra and subsidiaries (Chile) |
| 1,089,515 |
| 1,016,997 |
| (72,518 | ) | (6.7 | )% |
Edesur (Argentina) |
| 327,088 |
| 295,539 |
| (31,549 | ) | (9.6 | )% |
Edelnor (Peru) |
| 302,295 |
| 307,159 |
| 4,864 |
| 1.6 | % |
Ampla (Brazil) |
| 1,012,342 |
| 1,046,387 |
| 34,045 |
| 3.4 | % |
Coelce (Brazil) |
| 767,993 |
| 940,654 |
| 172,661 |
| 22.5 | % |
Codensa (Colombia) |
| 741,168 |
| 785,890 |
| 44,722 |
| 6.0 | % |
Total |
| 4,240,401 |
| 4,392,626 |
| 152,225 |
| 3.6 | % |
|
|
|
|
|
|
|
|
|
|
Less: Consolidation Adjustments and Other Businesses. |
| (476,703 | ) | (609,638 | ) | (132,935 | ) | 27.9 | % |
Total |
| 6,472,056 |
| 6,563,581 |
| 91,525 |
| 1.4 | % |
Generation and Transmission Business: Revenues
Revenues in Chile in 2010 decreased 2.0%, mainly as a result of a decrease of 2.1% in physical sales, to 21,847 GWh, due to the lower electricity demand in Chile after the earthquake that took place on February 27, 2010 and a 2.6% decrease in average prices in 2010 expressed in peso terms. In 2010, there were lower sales in the spot market due to reduced hydrology, partially offset by higher sales to contracted customers as a result of improved economic conditions and a recovery in energy demand by the end of 2010 compared to 2009.
In Argentina, revenues of Endesa Costanera in 2010 increased 27.6%, as a result of a 30.7% increase in average energy sale prices, which was partially offset by a 3.2% reduction in physical sales to 8,018 GWh. Revenues of El Chocón, decreased 12.4%, mainly due to a 18.5% decrease in physical sales to 3,361 GWh. In 2010, generation was 21.3% lower due to reduced hydroelectric availability. For both companies the net effect of translating results from the local currency of each country to Chilean pesos (the “currency translation effect”) was negative, resulting in a 13.6% decrease in revenues in pesos.
In Brazil, revenues of Cachoeira Dourada in 2010 increased 31.0%, mainly as a result of an increase of 27.7% in average sales prices, expressed in local currency. Physical energy sales were virtually the same. Revenues of Endesa Fortaleza in 2010 increased 8.5%, as a result of an increase of 4.0% in average sales prices, expressed in local currency. This was partly offset by a 1.7% decrease in physical sales to 2,957 GWh. In both companies, the currency translation effect on revenues was positive, causing an increase of 7.5% in pesos as compared to 2009.
Revenues of CIEN in 2010 increased 1.0%, mainly due to the currency translation effect, which produced a 7.5% increase in revenues in pesos. This increase was partially offset by reduced export revenues of 6.5%. In 2009, CIEN exported energy to Uruguay and Argentina starting in February of that year, whereas in 2010 exports to Argentina started later in the year.
In Colombia, revenues of Emgesa increased by Ch$ 6.6 billion, or 1.3%, mainly due to the 10% increase in the average energy sales price expressed in local currency. This was offset by an 11.8% reduction in physical sales, and amounted to 14,817 GWh in 2010. This is essentially due to reduced sales on the spot market and to electricity companies as a result of lower hydroelectric production. The currency translation effect on revenues was positive, causing an increase of 2.7% in peso terms.
Revenues of Edegel, our generating company in Peru, declined by Ch$ 2.4 billion, or 1.1%, in 2010, mainly as a result of a 5.6% decrease in the average sales price in local currency, and the reduction in sales to unregulated customers. This was partially offset by larger sales to regulated customers and in the spot market. It is also explained by the effect of the translation from soles to the peso in both years, producing a reduction in pesos of 2.2% in 2010 compared to 2009. This was partially offset by the 3.3% increase in physical sales to 8,598 GWh in 2010.
Distribution Business: Revenues
In Chile, revenues of Chilectra in 2010 decreased by 6.7%, mainly due to the decrease in sub-transmission tolls set by the authority and the amendment of the process used to determine electricity purchase prices, which resulted from the auction of long-term energy purchase contracts. Revenues also decreased because of reduced margins on other businesses of Ch$ 5,303 million related to reduced activity with large customers and transfer business of networks as a result of reduced post-earthquake activity. This was partially offset by the 4.1% increase in physical sales to 13,098 GWh. The number of customers increased 30,583 to a total exceeding 1.6 million, and energy losses were 5.8%, compared to 6.1% in 2009.
In Argentina, revenues of Edesur in 2010 decreased 9.6%, principally due to a reduced average sales price of 2.9% and the currency translation effect that resulted in a reduction in pesos revenues of 13.6%. This decrease was partially offset by the 4.6% increase in physical sales. Energy losses remained unchanged at 10.5% and the number of customers increased 47,660, to a total exceeding 2.3 million.
In Peru, revenues of Edelnor in 2010 increased 1.6%, mainly due to a 7.2% increase in physical sales, to 6,126 GWh. This was partially offset by a 3.2% reduction in the average sales price and the currency translation effect, which resulted in a 2.2% decrease in peso revenues in 2010. The number of customers increased 37,025 to 1.1 million, and energy losses increased to 8.3%.
In Brazil, revenues of Ampla in 2010 increased 3.4%, mainly due a 5.7% increase in physical sales to 9,927 GWh and the currency translation effect, which resulted in a 7.5% increase in pesos revenues. This increase was partially offset by an
8.8% reduction in the average sales price. The number of customers increased 48,998, to a total exceeding 2.5 million, and energy losses declined from 21.2% to 20.5% in 2010.
Revenues of Coelce in 2010 increased 22.5%, mainly due to a 12.6% increase in physical sales to 8,850 GWh, a 1.9% increase in the average sales price in local currency and the currency translation effect, which resulted in a 7.5% increase in pesos revenues. The number of customers increased 129,131 to a total exceeding 3.1 million, and energy losses increased from 11.6% to 12.1% in 2010.
In Colombia, revenues of Codensa in 2010 increased 6.0%, mainly due to a 5.5% increase in the average sales price in local currency, a 3.3% increase in physical sales to 12,515 GWh, and the currency translation effect, which resulted in a 2.2% increase in pesos revenues. This increase was partially offset by a reduction in other operating revenues, including “Codensa Hogar” and public lighting. The number of customers rose by 72,578 to a total exceeding 2.5 million in December 2010, and energy losses increased to 8.5%.
Operating Costs
Operating costs mainly consist of electricity purchases from other parties, depreciation, amortization and impairment losses, fuel purchases, maintenance costs, tolls paid to transmission companies, and employee salaries. Operating costs also include Administrative and Selling expenses.
The following table shows the breakdown of operating costs as a percentage of total operating costs, for the years ended December 2009 and 2010.
|
| Year ended December 31 |
| ||
|
| 2009 |
| 2010 |
|
|
| (percentage of total costs of |
| ||
Electricity purchases |
| 33.5 | % | 32.0 | % |
Depreciation, amortization and impairment losses |
| 11.9 | % | 11.5 | % |
Fuel purchases |
| 12.8 | % | 13.8 | % |
Other Variable cost |
| 17.5 | % | 18.3 | % |
Transmission tolls |
| 7.0 | % | 8.4 | % |
Staff benefit costs |
| 7.4 | % | 6.8 | % |
Other fixed costs |
| 10.1 | % | 9.3 | % |
|
| 100 | % | 100 | % |
The cost structure of the Company was virtually the same in 2009 and 2010.
The table below sets forth the breakdown of operational costs for the years ending on December 31, 2009 and 2010:
|
| Year ended December 31, |
| ||||||
|
| 2009 |
| 2010 |
| Change |
| % Change |
|
|
| (in million of Ch$) |
|
|
| ||||
Generation and Transmission Business |
|
|
|
|
|
|
|
|
|
Endesa Chile and subsidiaries (Chile) |
| 733,191 |
| 832,601 |
| 99,410 |
| 13.6 | % |
Endesa Costanera (Argentina) |
| 227,041 |
| 284,391 |
| 57,350 |
| 25.3 | % |
El Chocón (Argentina) |
| 26,598 |
| 25,522 |
| (1,076 | ) | (4.0 | )% |
Cachoeira Dourada (Brazil) |
| 37,671 |
| 39,800 |
| 2,129 |
| 5.7 | % |
Endesa Fortaleza (Brazil) |
| 54,669 |
| 91,257 |
| 36,588 |
| 66.9 | % |
CIEN (Brazil) |
| 49,969 |
| 70,853 |
| 20,884 |
| 41.8 | % |
Emgesa (Colombia) |
| 250,153 |
| 245,978 |
| (4,175 | ) | (1.7 | )% |
Edegel (Peru) |
| 137,576 |
| 140,944 |
| 3,368 |
| 2.4 | % |
Less: Intercompany Transactions |
| (918 | ) | (902 | ) | 16 |
| (1.7 | )% |
Total |
| 1,515,950 |
| 1,730,444 |
| 214,494 |
| 14.1 | % |
|
|
|
|
|
|
|
|
|
|
Distribution Business |
|
|
|
|
|
|
|
|
|
Chilectra and Subsidiaries (Chile) |
| 960,483 |
| 905,231 |
| (55,252 | ) | (5.8 | )% |
Edesur (Argentina) |
| 295,212 |
| 291,595 |
| (3,617 | ) | (1.2 | )% |
Edelnor (Peru) |
| 239,870 |
| 242,227 |
| 2,357 |
| 1.0 | % |
Ampla (Brazil) |
| 825,215 |
| 925,698 |
| 100,483 |
| 12.2 | % |
Coelce (Brazil) |
| 616,720 |
| 759,371 |
| 142,651 |
| 23.1 | % |
Codensa (Colombia) |
| 541,283 |
| 578,667 |
| 37,384 |
| 6.9 | % |
Less: Intercompany Transactions |
| 201 |
| 126 |
| (75 | ) | (37.3 | )% |
Total |
| 3,478,984 |
| 3,702,915 |
| 223,931 |
| 6.4 | % |
|
|
|
|
|
|
|
|
|
|
Less: Consolidation Adjustments and Other Businesses. |
| (450,323 | ) | (574,079 | ) | (123,756 | ) | 27.5 | % |
Total |
| 4,544,611 |
| 4,859,280 |
| 314,669 |
| 6.9 | % |
Generation and Transmission Business: Operating Costs
Operating costs in Chile increased by 13.6% in 2010 as compared to 2009, totaling Ch$ 832.6 billion, largely due to higher energy purchases of Ch$ 87.1 billion, transport costs of Ch$ 53.9 billion and other variable costs of Ch$ 41.1 billion. Production was 20,914 GWh, 6.0% below 2009 levels. Lower hydroelectric generation forced us to rely more intensively on more costly thermal energy, and thus, our energy purchase cost increased by 166%. This was partially offset by the reduction in depreciation and impairment of fixed assets of Ch$ 55.8 billion and in fuel costs of Ch$ 27.2 billion.
The operating costs of Endesa Costanera rose by Ch$ 57.4 billion, or 25.3%. This is largely due to higher energy and fuel costs of Ch$ 62.7 billion and an increase in personnel expenses of Ch$3.3 billion, partially compensated by a reduction in other costs such as depreciation, transport costs, other fixed costs and energy purchases. The operating costs of El Chocón declined by Ch$1.1 billion, or 4.0%, mainly due to reduced other variable costs of Ch$0.7 billion, reduced transport costs of Ch$0.4 billion and reduced depreciation of Ch$0.7 billion, partly offset by an increase in energy purchases of Ch$0.8 billion. In both companies, the currency translation effect resulted in a 13.6% reduction in operating costs in pesos.
The operating costs of Cachoeira Dourada rose by 5.7%, or Ch$ 2.1 billion, to Ch$ 39.8 billion in 2010, mainly due to an increase in other variable costs of Ch$ 2.5 billion. The operating costs of Endesa Fortaleza increased by Ch$ 36.6 billion, or 66.9%, mainly due to higher fuel purchase costs of Ch$44.1 billion and an increase in other variable costs of Ch$ 2.2 billion,
partly offset by reduced energy purchase costs of Ch$ 9.0 billion. For both companies, the currency translation effect resulted in a 7.5% increase in operating costs measured in pesos.
The operating costs of CIEN were Ch$ 70.9 billion, 41.8% higher than the prior year. This is largely due to an increase in the charge for depreciation and impairment losses of Ch$ 34.8 billion, partially offset by Ch$ 16.2 billion of lower variable costs. The currency translation effect resulted in a 7.5% increase in operating costs measured in pesos.
The operating costs of Emgesa declined by Ch$ 4.2 billion, or 1.7%, mainly due to reduced energy purchases of Ch$ 19.2 billion, partly offset by higher fuel costs of Ch$ 7.2 billion, as a result of lower hydrology in the first half of 2010, as well as higher transport expenses of Ch$ 3.8 billion, an increase in personnel expenses of Ch$ 1.3 billion and an increase in other fixed operating costs of Ch$ 2.1 billion. The currency translation effect resulted in a 2.7% increase in operating costs in pesos.
The operating costs of Edegel grew by Ch$ 3.4 billion, or 2.4%, largely explained by higher energy purchase costs of Ch$ 4.8 billion and higher fuel costs of Ch$ 5.0 billion. This principally reflects the absence of the non-recurring reversal of provisions for energy purchases for distribution customers without contracts, booked in 2009, and, to a lesser extent, by higher average energy purchase prices, which more than offset the 9.3% reduction in physical purchases. The increase in operating costs was partially offset by reduced fixed costs of Ch$ 4.5 billion, lower transport costs of Ch$ 0.9 billion and reduced other variable costs of Ch$ 0.7 billion. The currency translation effect resulted in a 2.2% decrease in operating costs in pesos.
Distribution Business: Operating Costs
The operating costs of Chilectra fell by Ch$ 55.3 billion, or 5.8%, in 2010, mainly due to reduced energy purchase costs of Ch$ 96.9 billion. This decrease is explained by a lower average purchase price, partially offset by an increase in physical purchases. There was also a reduction of Ch$ 5.9 billion in other variable operating costs, compensated by an increase in transport costs of Ch$ 45.5 billion and an increase in the charge for depreciation and impairment of Ch$ 1.9 billion.
The operating costs of Edesur declined by Ch$ 3.6 billion, or 1.2%. This is mainly explained by reduced energy purchase costs of Ch$ 11.2 billion, reduced personnel costs of Ch$ 2.9 billion and a reduced charge for depreciation and impairment of Ch$ 2.5 billion, partly offset by higher fixed costs of Ch$ 13.4 billion, which were mainly fines and payments to end users resulting from interruptions to the electricity service during the year. The currency translation effect resulted in a 13.6% decrease in operating costs in pesos.
The operating costs of Edelnor increased by Ch$ 2.4 billion, or 1.0%, mainly due to the increase in other variable costs of Ch$11.6 billion, partly offset by lower energy purchase costs of Ch$3.6 billion and other fixed costs of Ch$5.8 billion. The currency translation effect resulted in a 2.2% decrease in operating costs in pesos.
The operating costs of Ampla grew by Ch$ 100.5 billion, or 12.2%. This is mainly due to an increase in energy purchase costs of Ch$50.2 billion, in other operating costs of Ch$ 5.2 billion, in transport costs of Ch$ 5.9 billion and in depreciation and impairment of Ch$ 39.7 billion. The operating costs of Coelce rose by Ch$ 142.6 billion, or 23.1% in 2010. This is due to an increase in energy purchase costs of Ch$ 49.0 billion, an increase in other variable costs (basically the construction of fixed assets in the concession area of Ch$ 71.3 billion), higher transport costs of Ch$ 4.7 billion, increases in depreciation and impairment of Ch$ 8.0 billion and an increase in other fixed operating costs of Ch$ 7.8 billion. In both companies, the currency translation effect resulted in a 7.5% increase in operating costs in pesos.
The operating costs of Codensa rose by Ch$ 37.4 billion, or 6.9%, in 2010, mainly due to larger energy purchases of Ch$ 42.4 billion as a result of the 6.6% increase in average purchase prices in local currency, an increase in physical purchases, higher transport costs of Ch$ 2.2 billion and an increase in depreciation and impairment of Ch$ 4.6 billion. This was partly offset by a reduction in other variable costs of Ch$ 11.1 billion. The currency translation effect resulted in a 2.7% increase in operating costs in pesos.
Operating Income
The following table shows the operating income by company, for the years ended December 31, 2009 and 2010.
|
| Year ended December 31, |
| ||||||
|
| 2009 |
| 2010 |
| Change |
| % Change |
|
|
| (in million of Ch$) |
|
|
| ||||
Generation and Transmission Business |
|
|
|
|
|
|
|
|
|
Endesa Chile and subsidiaries (Chile) |
| 640,040 |
| 512,770 |
| (127,270 | ) | (19.9 | )% |
Endesa Costanera (Argentina) |
| 4,380 |
| 10,840 |
| 6,460 |
| 147.5 | % |
El Chocón (Argentina) |
| 38,700 |
| 31,651 |
| (7,049 | ) | (18.2 | )% |
Cachoeira Dourada (Brazil) |
| 50,629 |
| 75,863 |
| 25,234 |
| 49.8 | % |
Endesa Fortaleza (Brazil) |
| 83,926 |
| 59,114 |
| (24,812 | ) | (29.6 | )% |
CIEN (Brazil) |
| 47,992 |
| 28,056 |
| (19,936 | ) | (41.5 | )% |
Emgesa (Colombia) |
| 250,811 |
| 261,538 |
| 10,727 |
| 4.3 | % |
Edegel (Peru) |
| 76,049 |
| 70,319 |
| (5,730 | ) | (7.5 | )% |
Less: Intercompany Transactions |
| (119 | ) | (2 | ) | 117 |
| (98.3 | )% |
Total |
| 1,192,408 |
| 1,050,149 |
| (142,259 | ) | (11.9 | )% |
|
|
|
|
|
|
|
|
|
|
Distribution Business |
|
|
|
|
|
|
|
|
|
Chilectra and subsidiaries (Chile) |
| 129,032 |
| 111,766 |
| (17,266 | ) | (13.4 | )% |
Edesur (Argentina) |
| 31,876 |
| 3,944 |
| (27,932 | ) | (87.6 | )% |
Edelnor (Peru) |
| 62,425 |
| 64,932 |
| 2,507 |
| 4.0 | % |
Ampla (Brazil) |
| 187,127 |
| 120,689 |
| (66,438 | ) | (35.5 | )% |
Coelce (Brazil) |
| 151,273 |
| 181,283 |
| 30,010 |
| 19.8 | % |
Codensa (Colombia) |
| 199,885 |
| 207,223 |
| 7,338 |
| 3.7 | % |
Less: Intercompany Transactions |
| (201 | ) | (126 | ) | 75 |
| (37.3 | )% |
Total |
| 761,417 |
| 689,711 |
| (71,706 | ) | (9.4 | )% |
|
|
|
|
|
|
|
|
|
|
Less: Consolidation Adjustments and Other Businesses. |
| (26,380 | ) | (35,559 | ) | (9,179 | ) | 34.8 | % |
Total |
| 1,927,445 |
| 1,704,301 |
| (223,144 | ) | (11.6 | )% |
Non-Operating Result
The following table shows the non-operating results for the years ended December 31, 2009 and 2010, and the percentage change between both years:
|
| Year ended December 31, |
| ||||||
|
| 2009 |
| 2010 |
| Change |
| % Change |
|
|
| (in million of Ch$) |
|
|
| ||||
|
|
|
|
|
|
|
|
|
|
Financial result |
|
|
|
|
|
|
|
|
|
Financial income |
| 159,670 |
| 171,237 |
| 11,567 |
| 7.2 | % |
Financial costs |
| (482,472 | ) | (438,358 | ) | 44,114 |
| (9.1 | )% |
Gain (loss) for indexed assets and liabilities |
| 21,781 |
| (15,056 | ) | (36,837 | ) | n/a |
|
Net Foreign currency exchange differences |
| (8,235 | ) | 11,572 |
| 19,807 |
| n/a |
|
Total |
| (309,256 | ) | (270,605 | ) | 38,651 |
| (12.5 | )% |
|
|
|
|
|
|
|
|
|
|
Other non-operating results |
|
|
|
|
|
|
|
|
|
Total gain (loss) on sale of non-current assets not held for sale |
| 50,502 |
| 11,711 |
| (38,791 | ) | (76.8 | )% |
Other non-operating income |
| 2,374 |
| 1,288 |
| (1,086 | ) | (45.7 | )% |
Total |
| 52,876 |
| 12,999 |
| (39,877 | ) | (75.4 | )% |
|
|
|
|
|
|
|
|
|
|
Non-operating results |
| (256,380 | ) | (257,606 | ) | (1,226 | ) | 0.5 | % |
Financial Result
Financial result in 2010 was a loss of Ch$ 270.6 billion, which was reduced 12.5% or Ch$ 38.6 billion, as compared to the prior year. This is mainly due to reduced financial costs of Ch$ 44.1 billion, as a result of lower average debt and lower average interest rates during 2010, as compared to 2009. It is also explained by a reduced charge for exchange differences which show a positive variation of Ch$ 19.8 billion, mainly coming from Chile, Argentina and Brazil. In Chile, this is due to the effect of the peso appreciation of 8.4% against the dollar in 2010 (compared to an appreciation of 25.5% in 2009), which impacts net assets and liabilities denominated in dollars. In Argentina, the Argentine peso depreciated by approximately 4% against the dollar during 2010 (compared to a devaluation of approximately 9% in 2009). The effect on assets and debt in dollars is a gain of Ch$8.2 billion in 2010 and loss of Ch$ 17.3 billion in 2009. In Brazil, the real appreciated almost 5% (compared to an appreciation of over 30% in 2009), which translates into a reduced gain of Ch$ 17.7 billion (loss of Ch$ 3.7 billion in 2010 and gain of Ch$ 14.0 billion in 2009). Finally, higher financial income of Ch$ 11.6 billion, as a result of an increase in income from larger cash placements during the year, contributed to the reduction in financial loss in 2010 compared to 2009.
The reduced losses described above were partially offset by higher indexation expenses of Ch$ 36.8 billion due to the negative effect produced by variations in the value of the Unidad de Fomento (UF) in debt denominated in UF of some of our Chilean subsidiaries. This is because the UF in 2010 increased in value by 2.4%, compared to a decrease of 2.4% in 2009.
Result of asset sales
The result of asset sales shows a reduced gain of Ch$ 38.8 billion in 2010, mainly due to the booking in 2009 of gains on the sales of shares in Empresa de Energía de Bogotá for Ch$ 28.1 billion and the sale of the credit portfolio of Codensa Hogar for Ch$ 12.8 billion.
As a result of all of the foregoing, total non-operating results remain virtually unchanged when comparing 2009 and 2010.
Net Income for the Year
The following table shows our net income for the year for the periods indicated.
|
| Year ended December 31, |
| ||||||
|
| 2009 |
| 2010 |
| Change |
| % Change |
|
|
| (in million of Ch$) |
|
|
| ||||
Operating income |
| 1,927,445 |
| 1,704,301 |
| (223,144 | ) | (11.6 | )% |
Non-operating results |
| (256,380 | ) | (257,606 | ) | (1,226 | ) | (0.5 | )% |
Net income before taxes |
| 1,671,065 |
| 1,446,695 |
| (224,370 | ) | (13.4 | )% |
|
|
|
|
|
| 0 |
|
|
|
Income tax |
| (359,737 | ) | (346,007 | ) | 13,730 |
| (3.8 | )% |
|
|
|
|
|
|
|
|
|
|
Net Income from Continuing Operations After Tax |
| 1,311,328 |
| 1,100,688 |
| (210,640 | ) | (16.1 | )% |
Net income from discontinued operations |
| 0 |
| 0 |
| 0 |
| 0.0 | % |
|
|
|
|
|
|
|
|
|
|
Net Income |
| 1,311,328 |
| 1,100,688 |
| (210,640 | ) | (16.1 | )% |
Net Income attributable to: Owners of Parent |
| 660,231 |
| 486,227 |
| (174,004 | ) | (26.4 | )% |
Net income attributable to: Non-controlling interests |
| 651,097 |
| 614,461 |
| (36,636 | ) | (5.6 | )% |
Corporate income tax expense was reduced by Ch$ 13.7 billion in 2010 compared to 2009, mainly due to a reduction in Ampla of Ch$ 23.7 billion, Gas Atacama of Ch$ 13.2 billion, CGTF of Ch$ 10.3 billion, Edesur of Ch$ 10.0 billion, CIEN of Ch$ 4.3 billion and Pangue of Ch$ 2.6 billion. These decreases were partially offset by increases in Enersis of Ch$ 27.9 billion, Endesa Costanera of Ch$ 7.2 billion, Emgesa of Ch$ 6.9 billion, Pehuenche of Ch$ 5.5 billion and Chilectra of Ch$ 2.2 billion.
3. Enersis’ Results from Operations for the Years ended December 31, 2008 and December 31, 2009
Due to internal reclassifications introduced during 2010, some figures may differ from those presented in our Forms 20-F 2008 and 2009. Differences in figures are not significant, and do not affect the consolidated net income previously disclosed.
Revenues
Generation and Transmission Business
The following table sets forth the physical sales of electricity by our subsidiaries by country and their corresponding changes for the years ended December 31, 2008 and 2009.
|
| Physical sales during |
| ||||||
|
| Year ended December 31, |
| ||||||
|
| 2008 |
| 2009 |
| Change |
| % |
|
|
| (GWh) |
|
|
| ||||
|
|
|
|
|
|
|
|
|
|
Endesa Chile (Chile) (1) (3) |
| 21,532 |
| 22,327 |
| 795 |
| 3.7 | % |
Endesa Costanera (Argentina) |
| 8,543 |
| 8,284 |
| (260 | ) | (3.0 | )% |
El Chocón (Argentina) |
| 2,554 |
| 4,122 |
| 1,567 |
| 61.4 | % |
Edegel (Peru) |
| 8,461 |
| 8,321 |
| (140 | ) | (1.7 | )% |
Emgesa (Colombia) |
| 16,368 |
| 16,806 |
| 438 |
| 2.7 | % |
Cachoeira Dourada (Brazil) (2) |
| 4,397 |
| 3,862 |
| (535 | ) | (12.2 | )% |
Endesa Fortaleza (Brazil) |
| 2,690 |
| 3,007 |
| 317 |
| 11.8 | % |
Total |
| 64,546 |
| 66,728 |
| 2,182 |
| 3.4 | % |
(1) Includes Endesa Chile and its generation subsidiaries.
(2) Includes sales to Endesa Fortaleza for 189.9 GWh in the first quarter of 2008.
(3) Upon adoption of IFRS, energy sales in 2008 and 2009 include 50% of GasAtacama
Distribution Business
Distribution revenues are derived mainly from the resale of electricity purchased from generators. Revenues associated with distribution include the recovery of the cost of electricity purchased and the resulting revenue from the VAD, which is associated with the recovery of costs and the return on the investment with respect to the distribution assets plus the losses permitted in the regulatory tariffs. Other revenue derived from our distribution services consists of charges related to new connections and the maintenance and rental of meters.
The table below shows the physical sales of electricity by our distribution subsidiaries arranged by country, and their corresponding changes for the year ended December 31, 2008 and 2009.
|
| Physical sales during |
| ||||||
|
| 2008 |
| 2009 |
| Change |
| % Change |
|
|
| (GWh) |
|
|
| ||||
Chilectra (Chile) |
| 12,535 |
| 12,585 |
| 49 |
| 0.4 | % |
Edesur (Argentina) |
| 16,160 |
| 16,026 |
| (134 | ) | (0.8 | )% |
Edelnor (Peru) |
| 5,599 |
| 5,716 |
| 117 |
| 2.1 | % |
Ampla (Brazil) |
| 9,119 |
| 9,394 |
| 275 |
| 3.0 | % |
Coelce (Brazil) |
| 7,571 |
| 7,860 |
| 289 |
| 3.8 | % |
Codensa (Colombia) |
| 11,822 |
| 12,114 |
| 292 |
| 2.5 | % |
Total |
| 62,805 |
| 63,694 |
| 889 |
| 1.4 | % |
Revenues by Business Segment
The table below presents our revenues for 2008 and 2009:
|
| Year ended December 31, |
| ||||||
|
| 2008 |
| 2009 |
| Change |
| % Change |
|
|
| (in million of Ch$) |
|
|
| ||||
Generation and Transmission Business |
|
|
|
|
|
|
|
|
|
Endesa Chile and subsidiaries (Chile) |
| 1,609,158 |
| 1,373,231 |
| (235,927 | ) | (14.7 | )% |
Endesa Costanera (Argentina) |
| 240,087 |
| 231,421 |
| (8,666 | ) | (3.6 | )% |
El Chocón (Argentina) |
| 44,141 |
| 65,298 |
| 21,157 |
| 47.9 | % |
Cachoeira Dourada (Brazil) |
| 147,105 |
| 88,300 |
| (58,805 | ) | (40.0 | )% |
CIEN (Brazil) |
| 72,776 |
| 97,961 |
| 25,185 |
| 34.6 | % |
Endesa Fortaleza (Brazil) |
| 110,163 |
| 138,595 |
| 28,432 |
| 25.8 | % |
Emgesa (Colombia) |
| 401,470 |
| 500,964 |
| 99,494 |
| 24.8 | % |
Edegel (Peru) |
| 208,497 |
| 213,625 |
| 5,128 |
| 2.5 | % |
Less: Intercompany Transactions |
| — |
| (1,037 | ) | (1,037 | ) | N/A |
|
Total |
| 2,833,397 |
| 2,708,358 |
| (125,039 | ) | (4.4 | )% |
|
|
|
|
|
|
|
|
|
|
Distribution Business |
|
|
|
|
|
|
|
|
|
Chilectra and subsidiaries (Chile) |
| 1,083,673 |
| 1,089,515 |
| 5,842 |
| 0.5 | % |
Edesur (Argentina) |
| 334,164 |
| 327,088 |
| (7,076 | ) | (2.1 | )% |
Edelnor (Peru) |
| 254,641 |
| 302,295 |
| 47,654 |
| 18.7 | % |
Ampla (Brazil) |
| 973,759 |
| 1,012,342 |
| 38,583 |
| 4.0 | % |
Coelce (Brazil) |
| 763,592 |
| 767,993 |
| 4,401 |
| 0.6 | % |
Codensa (Colombia) |
| 661,474 |
| 741,168 |
| 79,694 |
| 12.0 | % |
Total |
| 4,071,303 |
| 4,240,401 |
| 169,098 |
| 4.2 | % |
|
|
|
|
|
|
|
|
|
|
Less: Consolidation Adjustments and Other Businesses. |
| (324,755 | ) | (476,703 | ) | (151,948 | ) | 46.8 | % |
Total |
| 6,579,945 |
| 6,472,056 |
| (107,889 | ) | (1.6 | )% |
Generation and Transmission Businesses: Revenues
Total revenues in 2009 in Chile declined by 14.7% to Ch$ 1,373.2 billion as a result of lower average sales prices, as compared to the previous year, reflecting a decrease in energy generating costs in the system. This was partly offset by the 3.7% increase in physical sales to 22,327 GWh, due to an increase of 4,183 GWh in sales in the spot market. The average price for total sales of Endesa Chile in Chile fell by 22%, from $ 139 per MWh in 2008 to $108 per MWh in 2009.
The “currency translation effect” is the net effect of translating the results from the local currency of each country to pesos.
In Argentina, Endesa Costanera’s revenues declined by Ch$ 8.7 billion, or 3.6%. This is explained in part by lower physical sales, which declined by 3.0% to 8,284 GWh, though this was partly offset by a 7.5% increase in average sales prices in local currency during 2009. On the other hand, El Chocón’s revenues increased by 47.9%, the equivalent of Ch$ 21.2 billion, mainly due to the 61.4% increase in physical sales as a result of greater reservoir water levels at the beginning of the year, which brought greater hydraulic availability. The average sale price remained unchanged in both years at around Ar$ 106 per MWh. In both companies, the currency translation effect negatively affected results, which causing a 8.5% decrease in revenues in pesos.
In Colombia, Emgesa’s revenues rose by Ch$ 99.5 billion, or 24.8%, mainly due to the 24% increase in the average sales price in local currency due to the low hydrology during the year, and also to a 2.7% increase in physical sales, which rose to 16,806 GWh. This was partially offset by the currency translation effect, which generated a 2.2% reduction in revenues in pesos.
In Brazil, the revenues of Cachoeira Dourada declined by Ch$ 58.8 billion, or 40.0%. This was the result of reduced sales prices and a 12.2% reduction in physical sales to 3,862 GWh. In contrast, Endesa Fortaleza’s revenues in 2009 rose by Ch$ 28.4 billion, or 25.8%. This was mainly due to an increase in physical sales from 2,690 GWh to 3,007 GWh and a 12.1% higher average sale price in local currency. In both cases, the currency translation effect produced a reduction in pesos of 1.8% compared to 2008.
The revenues of our subsidiary CIEN in 2009 amounted to Ch$ 98.0 billion, an increase of 34.6% over 2008. In February, the company started exporting energy to Uruguay and Argentina, as opposed to the previous year when exports to Argentina began in April. This was partially offset by the currency translation effect which resulted in a reduction in pesos of 1.8% compared to 2008.
The revenues for Edegel, our electricity generator in Peru, rose by Ch$ 5.1 billion, or 2.5%, in 2009, mainly due to the currency translation effect. Physical sales declined by 1.7% to 8,321 GWh and the average sales price in local currency fell by 3.5%.
Distribution Business: Revenues
In Chile, Chilectra’s revenues in 2009 rose slightly, by 0.5% compared to 2008, mainly due to the 0.4% increase in physical sales to 12,585 GWh. Energy demand grew by 0.6% over 2008. The number of customers increased by 45,200, or 3.0%, and energy losses were 6.1%, compared to 5.9% in 2008.
In Argentina, Edesur’s revenues fell by Ch$ 7.1 billion during 2009, or 2.1%, compared to 2008, mainly as a result of the currency translation effect. Physical sales declined by 0.8% to 16,026 GWh in 2009, in line with the 1.0% reduction in energy demand. This was partially offset by an increase in average sales prices in local currency of 9.0%. Energy losses decreased to 10.5% from 10.6% in 2008, and the number of customers rose by 42,829 to 2.3 million.
In Peru, Edelnor’s revenues increased by 18.7% in 2009, mainly due to a 2.0% higher energy demand, a reduction in energy losses and the currency translation effect, which resulted in an increase in pesos of 4.5% in 2009. Physical energy sales rose by 2.1% to 5,716 GWh. The number of customers increased by 32,758 to 1.1 million and energy losses declined by 0.1 percentage point to 8.1%.
In Brazil, Ampla’s revenues increased by Ch$ 38.6 billion, or 4.0%, in 2009, mainly due to higher sales of Ch$ 44.8 billion which resulted from a higher average sale price in local currency of 8.4%, and an increase in physical sales, which rose by 3% to 9,394 GWh in 2009. In addition, tolls and other services increased by Ch$ 11.8 billion. This was partially offset by Ch$ 20.5 billion in lower revenues attributable to the construction of fixed assets in the concession zone and the
effect of translating the financial statements from reais to pesos. Energy demand increased by 4.4%, the number of customers grew by 55,129 to over 2.5 million and energy losses rose from 20.2% to 21.2% in 2009.
Coelce’s revenues rose by 0.6% to Ch$ 768.0 billion, mainly due to 12.0% higher average sales prices in local currency, an increase in physical sales of 3.8% to 7,860 GWh and lower energy losses, which decreased from 11.7% in 2008 to 11.6% in 2009. This was partially offset by reduced revenues from the construction of fixed assets in the concession zone of Ch$ 47.1 billion and the currency translation effect. Energy demand increased by 3.6% and the number of customers increased by 123,631 to over 2.9 million.
In Colombia, Codensa’s revenues in 2009 increased by 12.0%, or Ch$ 79.7 billion, mainly due to a 12.7% increase in the average sales price in local currency, a 0.3% rise in energy demand (which led to a 0.1% increase in physical sales to 11,837 GWh) and the first time consolidation of DECA (which in turn consolidates EEC) with Ch$ 34.1 billion in revenues. This was partially offset by the currency translation effect, which caused a 2.2% fall in pesos. The number of customers rose by 75,671 to 2.4 million in December 2009.
Operating Costs
Operating costs consist primarily of purchases of electricity from third parties, depreciation, amortization and impairment losses, fuel purchases, maintenance expenses, tolls paid to transmission companies and employee salaries. Operating costs also include Administration and Selling expenses.
The table below shows the breakdown of the expenses detailed above as a percentage of our total operating costs for the years ended December 2008 and 2009.
|
| Year ended December 31 |
| ||
|
| 2008 |
| 2009 |
|
|
| (percentage of total costs of |
| ||
Electricity purchases |
| 34.4 | % | 33.5 | % |
Depreciation, amortization and impairment losses |
| 9.3 | % | 11.9 | % |
Fuel purchases |
| 18.0 | % | 12.8 | % |
Other variable costs |
| 16.6 | % | 17.5 | % |
Transmission tolls |
| 6.3 | % | 7.0 | % |
Staff benefit costs |
| 6.1 | % | 7.4 | % |
Other fixed costs |
| 9.3 | % | 10.1 | % |
|
| 100.0 | % | 100.0 | % |
The table below sets forth the breakdown of operational costs for the years ending on December 31, 2008 and 2009:
|
| Year ended December 31, |
| ||||||
|
| 2008 |
| 2009 |
| Change |
| % Change |
|
|
| (in million of Ch$) |
|
|
| ||||
Generation and Transmission Business |
|
|
|
|
|
|
|
|
|
Endesa Chile and subsidiaries (Chile) |
| 1,041,421 |
| 733,191 |
| (308,230 | ) | (29.6 | )% |
Endesa Costanera (Argentina) |
| 221,662 |
| 227,041 |
| 5,379 |
| 2.4 | % |
El Chocón (Argentina) |
| 25,110 |
| 26,598 |
| 1,488 |
| 5.9 | % |
Cachoeira Dourada (Brazil) |
| 52,323 |
| 37,671 |
| (14,652 | ) | (28.0 | )% |
CIEN (Brazil) |
| 27,054 |
| 49,969 |
| 22,915 |
| 84.7 | % |
Endesa Fortaleza (Brazil) |
| 81,653 |
| 54,669 |
| (26,984 | ) | (33.0 | )% |
Emgesa (Colombia) |
| 184,652 |
| 250,153 |
| 65,501 |
| 35.5 | % |
Edegel (Peru) |
| 156,551 |
| 137,576 |
| (18,975 | ) | (12.1 | )% |
Less: Intercompany Transactions |
| (763 | ) | (918 | ) | (155 | ) | 20.3 | % |
Total |
| 1,789,663 |
| 1,515,950 |
| (273,713 | ) | (15.3 | )% |
|
|
|
|
|
|
|
|
|
|
Distribution Business |
|
|
|
|
|
|
|
|
|
Chilectra and Subsidiaries (Chile) |
| 870,050 |
| 960,483 |
| 90,433 |
| 10.4 | % |
Edesur (Argentina) |
| 288,537 |
| 295,212 |
| 6,675 |
| 2.3 | % |
Edelnor (Peru) |
| 201,697 |
| 239,870 |
| 38,173 |
| 18.9 | % |
Ampla (Brazil) |
| 805,293 |
| 825,215 |
| 19,922 |
| 2.5 | % |
Coelce (Brazil) |
| 623,650 |
| 616,720 |
| (6,930 | ) | (1.1 | )% |
Codensa (Colombia) |
| 458,494 |
| 541,283 |
| 82,789 |
| 18.1 | % |
Less: Intercompany Transactions |
| 0 |
| 201 |
| 201 |
| N/A |
|
Total |
| 3,247,721 |
| 3,478,984 |
| 229,574 |
| 7.1 | % |
|
|
|
|
|
|
|
|
|
|
Less: Consolidation Adjustments and Other Businesses. |
| (321,090 | ) | (450,323 | ) | (129,233 | ) | (40.2 | )% |
Total |
| 4,716,294 |
| 4,544,611 |
| (171,683 | ) | (3.6 | )% |
Generation and Transmission Business: Operating Costs
Operating costs in Chile fell by 29.6% in 2009 compared to 2008, totaling Ch$ 733.2 billion, mainly due to a reduction in fuel costs of Ch$ 260.7 billion. Production was 22,239 GWh, a 4.6% increase over 2008, permitting a 61.2% reduction in energy purchase costs, or Ch$ 82.6 billion. This was partially offset by an increase in depreciation and impairment of fixed assets of Ch$ 44.2 billion.
Endesa Costanera’s operating costs were Ch$ 5.4 billion or 2.4% higher. This is mainly explained by higher energy and fuel costs of Ch$ 2.1 billion, an increase in personnel costs of Ch$1.6 billion and higher depreciation of Ch$ 1.6 billion. El Chocón’s operating costs rose by Ch$ 1.5 billion, or 5.9%, mainly due to higher toll charges of Ch$ 0.6 billion, higher personnel costs of Ch$ 0.3 billion and higher depreciation of Ch$ 0.3 billion. In both companies, the currency translation effect resulted in reduced operating costs in pesos.
Emgesa’s operating costs increased by Ch$ 65.5 billion, or 35.5%, principally due to higher energy purchases of 673 GWh (which implied a higher cost of Ch$ 44.8 billion, as a result of an increase in sales and reduced energy generation), larger fuel costs of Ch$ 9.8 billion, a larger depreciation charge of Ch$ 6.0 billion and an increase in personnel costs of Ch$ 2.9 billion. The currency translation effect produced a 2.2% reduction in the operating costs in pesos.
Cachoeira Dourada’s operating costs declined by Ch$ 14.6 billion, or 28.0%, to Ch$ 37.7 billion in 2009, mainly due to reduced energy purchases of Ch$ 13.5 billion, which resulted from the reduction in average prices. Endesa Fortaleza’s operating costs declined by Ch$ 27.0 billion, or 33.0%, mainly due to lower energy purchase costs of Ch$ 20.9 billion, which resulted from lower average prices and lower fuel costs of Ch$ 6.0 billion. In both cases, the currency translation effect caused a reduction in the operating costs measured in pesos.
CIEN’S operating costs amounted to Ch$ 50.0 billion, 84.7% more than the year before. This was the result of higher variable costs of Ch$ 20.6 billion, offset partially by the currency translation effect, which caused a 1.8% reduction in costs measured in pesos.
Edegel’s operating costs decreased by Ch$ 19.0 billion, or 12.1%, mainly as a result of lower energy purchase costs of Ch$ 22.9 billion, lower average purchase prices and volumes, and reduced fuel costs of Ch$ 9.1 billion due to greater hydraulic generation. This was partially offset by higher personnel and operating costs of Ch$ 3.2 billion and the currency translation effect.
Distribution Business: Operating Costs
Chilectra’s operating costs increased by Ch$ 90.4 billion, or 10.4%, mainly due to an increase in energy purchase costs, which rose by Ch$ 82.5 billion. This increase is the result of a 5.5% higher average purchase price and a 1% rise in physical purchases. There was also an increase in other fixed operating costs of Ch$ 6.4 billion, basically because of an increase in outsourced services of Ch$ 3.3 billion due to greater activity in the business of connections for large customers and in disconnection and re-connection activities. Operating costs were also affected by higher repair and conservation activities of Ch$ 2.1 billion.
Edesur’s operating costs increased by 2.3%, or Ch$ 6.7 billion, mainly the result of by higher personnel costs of Ch$ 10.5 billion, partially offset by reduced energy purchase costs of Ch$ 4.4 billion. The currency translation effect shows an 8.5% reduction in the operating costs.
Edelnor’s operating costs rose by Ch$ 38.2 billion, or 18.9%, mainly due to the increase in energy purchase costs of Ch$ 31.9 billion that resulted from higher purchases required to meet the 2.0% increase in demand, and an increase in other variable and personnel expenses of Ch$ 5.5 billion. The currency translation effect resulted in a 4.5% increase in the operating costs in pesos.
Ampla’s operating costs grew by Ch$ 19.9 billion, or 2.5%. This is mainly the result of an increase in inputs and services of Ch$ 23.3 billion, an increase in other supplies of Ch$13.7 billion and a Ch$ 9.7 billion in higher charges for depreciation and amortization. On the other hand, Coelce’s operating costs declined by Ch$ 6.9 billion, or 1.1%, in 2009. This is the result of decreased fixed asset construction costs in the concession zone of Ch$ 47.1 billion and lower energy purchase costs of Ch$ 31.0 billion, which were partially offset by an increase of Ch$ 6.7 billion in the charge for depreciation and amortization and an increase in personnel costs of Ch$ 2.7 billion. In both companies, the currency translation effect resulted in reduced operating costs expressed in pesos.
Codensa’s operating costs rose by Ch$ 82.8 billion, or 18.1%, in 2009, mainly due to higher energy purchase costs of Ch$ 58.3 billion (as a result of a 18.9% higher average purchase price in local currency), as well as higher personnel costs of Ch$ 11.7 billion and an increase of Ch$ 5.2 billion in depreciation and amortization. The currency translation effect shows a 2.2% reduction in the costs expressed in pesos.
Operating Income
The following table shows the operating income by company, for the years ended December 31, 2008 and 2009.
|
| Year ended December 31, |
| ||||||
|
| 2008 |
| 2009 |
| Change |
| % Change |
|
|
| (in million of Ch$) |
|
|
| ||||
Generation and Transmission Business |
|
|
|
|
|
|
|
|
|
Endesa Chile and subsidiaries (Chile) |
| 567,737 |
| 640,040 |
| 72,303 |
| 12.7 | % |
Endesa Costanera (Argentina) |
| 18,425 |
| 4,380 |
| (14,045 | ) | (76.2 | )% |
El Chocón (Argentina) |
| 19,031 |
| 38,700 |
| 19,669 |
| 103.4 | % |
Cachoeira Dourada (Brazil) |
| 94,782 |
| 50,629 |
| (44,153 | ) | (46.6 | )% |
CIEN (Brazil) |
| 45,722 |
| 47,992 |
| 2,270 |
| 5.0 | % |
Endesa Fortaleza (Brazil) |
| 28,510 |
| 83,926 |
| 55,416 |
| 194.4 | % |
Emgesa (Colombia) |
| 216,818 |
| 250,811 |
| 33,993 |
| 15.7 | % |
Edegel (Peru) |
| 51,946 |
| 76,049 |
| 24,103 |
| 46.4 | % |
Less: Intercompany Transactions |
| 763 |
| (119 | ) | (882 | ) | (115.6 | )% |
Total |
| 1,043,734 |
| 1,192,408 |
| 148,674 |
| 14.2 | % |
|
|
|
|
|
|
|
|
|
|
Distribution Business |
|
|
|
|
|
|
|
|
|
Chilectra and subsidiaries (Chile) |
| 213,623 |
| 129,032 |
| (84,591 | ) | (39.6 | )% |
Edesur (Argentina) |
| 45,627 |
| 31,876 |
| (13,751 | ) | (30.1 | )% |
Edelnor (Peru) |
| 52,944 |
| 62,425 |
| 9,481 |
| 17.9 | % |
Ampla (Brazil) |
| 168,466 |
| 187,127 |
| 18,661 |
| 11.1 | % |
Coelce (Brazil) |
| 139,942 |
| 151,273 |
| 11, 331 |
| 8.1 | % |
Codensa (Colombia) |
| 202,980 |
| 199,885 |
| (3,095 | ) | (1.5 | )% |
Less: Intercompany Transactions |
| — |
| (201 | ) | (201 | ) | N/A |
|
Total |
| 823,582 |
| 761,417 |
| (62,165 | ) | (7.5 | )% |
|
|
|
|
|
|
|
|
|
|
Less: Consolidation Adjustments and Other Businesses. |
| (3,665 | ) | (26,380 | ) | (22,715 | ) | 619.8 | % |
Total |
| 1,863,651 |
| 1,927,445 |
| 63,794 |
| 3.4 | % |
Non-operating results
The table below sets forth non-operating income (expense) for the years ended December 31, 2008 and 2009 and the percentage change from period to period.
|
| Year ended December 31, |
| ||||||
|
| 2008 |
| 2009 |
| Change |
| % Change |
|
|
| (in million of Ch$) |
|
|
| ||||
|
|
|
|
|
|
|
|
|
|
Financial results |
|
|
|
|
|
|
|
|
|
Financial income |
| 181,753 |
| 159,670 |
| (22,083 | ) | (12.2 | )% |
Financial costs |
| (515,108 | ) | (482,472 | ) | 32,636 |
| 6.3 | % |
Gain (loss) for indexed assets and liabilities |
| (62,378 | ) | 21,781 |
| 84,159 |
| N.A. |
|
Net Foreign currency exchange differences |
| (23,633 | ) | (8,235 | ) | 15,398 |
| (65.2 | )% |
Total |
| (419,366 | ) | (309,256 | ) | 110,110 |
| 26.3 | % |
|
|
|
|
|
|
|
|
|
|
Other non-operating results |
|
|
|
|
|
|
|
|
|
Total gain (loss) on sale of non-current assets not held for sale |
| 2,503 |
| 50,502 |
| 47,999 |
| 1,917.7 | % |
Other non-operating income |
| 3,297 |
| 2,374 |
| (923 | ) | (28.0 | )% |
Total |
| 5,800 |
| 52,876 |
| 47,076 |
| 811.7 | % |
|
|
|
|
|
|
|
|
|
|
Non-operating results |
| (413,566 | ) | (256,380 | ) | 157,186 |
| 38.0 | % |
Financial Results
Financial results amounted to a loss of Ch$ 309.3 billion, which is a 26.3% reduction in loss compared to the previous year, or Ch$ 110.1 billion. This is mainly explained by the result of the UF variation arising from UF-denominated debt in Chile, which resulted in Ch$ 84.2 billion in lower costs. The UF decreased by 2.4% in 2009, compared to an increase of 9.3% in 2008. Net financial expenses also fell by Ch$ 10.6 billion, principally due to the reduced average interest rate.
Exchange differences show a positive change of Ch$ 15.4 billion, mainly in Chile and Brazil. In Chile, the 25% appreciation of the peso against the dollar, compared to a devaluation of 22% in 2008, positively impacted net assets carried in dollars. In Brazil, the appreciation reached approximately 34%, compared to the 24% devaluation in 2008, resulting in a loss of Ch$ 17,112 million in 2008 and gain of Ch$ 7,340 million in 2009 net effect on assets and debt in dollars.
Result of asset sales
The result of asset sales shows a gain of Ch$ 48.0 billion in 2009, mainly due to a Ch$ 28.1 billion gain obtained on the sale of shares of EEB, a gain on the sale of credit portfolio by Codensa for Ch$ 12.8 billion and increased gains on sales of the Enea project in Chile, for Ch$ 10.1 billion.
Net Income
The following table sets forth our net income for the indicated periods.
|
| Year ended December 31, |
| ||||||
|
| 2008 |
| 2009 |
| Change |
| % Change |
|
|
| (in million of Ch$) |
|
|
| ||||
Operating income |
| 1,863,651 |
| 1,927,445 |
| 63,794 |
| 3.4 | % |
Non-operating income |
| (413,566 | ) | (256,380 | ) | 157,186 |
| 38.0 | % |
Net income before taxes |
| 1,450,085 |
| 1,671,065 |
| 220,980 |
| 15.2 | % |
|
|
|
|
|
|
|
|
|
|
Income tax |
| (415,903 | ) | (359,737 | ) | 56,166 |
| 13.5 | % |
|
|
|
|
|
|
|
|
|
|
Net Income from Continuing Operations After Tax |
|
|
|
|
|
|
|
|
|
Net income from discontinued operations |
| 0 |
| 0 |
| 0 |
| 0 | % |
|
|
|
|
|
|
|
|
|
|
Net Income |
| 1,034,182 |
| 1,311,328 |
| 277,146 |
| 26.8 | % |
Net Income attributable to: Owners of parent |
| 507,590 |
| 660,231 |
| 152,641 |
| 30.1 | % |
Net income attributable to: Non-controlling interests |
| 526,592 |
| 651,097 |
| 124,505 |
| 23.6 | % |
Corporate income tax shows a reduced charge of Ch$ 56.2 billion in 2009, mainly due to reductions in Endesa Chile of Ch$ 60.2 billion, in Coelce of Ch$ 21.5 billion, in Pehuenche of Ch$ 12.5 billion and in San Isidro of Ch$ 6.0 billion. This is partially offset by increases in GasAtacama of Ch$ 16.5 billion, in Emgesa of Ch$ 12.3 billion, in Edegel of Ch$ 7.0 billion, in Cachoeira Dourada of Ch$ 4.8 billion and in Pangue of Ch$ 4.1 billion.
B. Liquidity and Capital Resources.
We are a company with no significant assets other than the stock of our subsidiaries. The following discussion of cash sources and uses reflects the key drivers of cash flow for Enersis.
Enersis receives cash inflows from its subsidiaries, as well as from related companies in Chile and abroad. Foreign subsidiaries and associates’ cash flows may not be available to satisfy our own liquidity needs, mainly because they are not wholly-owned, and because there is a time lag before we have effective access to those funds, through dividends or capital reductions.
We believe that cash flow generated from our business operations, as well as cash balances, borrowings from commercial banks, and ample access to both Chilean and foreign capital markets will suffice to satisfy all our needs for
working capital, debt service, dividends and routine capital expenditures. Our subsidiary, Endesa Chile, has a small revolving bank loan due in July 2011, and we do not foresee any difficulty in funding this obligation.
Set forth below, is the consolidated cash flow from an accounting perspective:
|
| 2009 |
| 2010 |
|
|
| (in Ch$ billion) |
| ||
|
|
|
|
|
|
Net Cash Flows Provided by Operating Activities |
| 2,038.3 |
| 1,943.4 |
|
Net Cash Flows Used in Investing Activities |
| (867.3 | ) | (775.8 | ) |
Net Cash Flows Used in Financing Activities |
| (1,308.4 | ) | (1,283.0 | ) |
|
|
|
|
|
|
Net Increase (Decrease) in Cash and Cash Equivalents before Effect of Exchange Rates Changes |
| (137.3 | ) | (115.4 | ) |
Effects of foreign exchange rate variations on cash and cash equivalents |
| (45.8 | ) | (58.2 | ) |
|
|
|
|
|
|
Beginning Balance of Cash and Cash Equivalents, Statements of Cash Flows |
| 1,318.1 |
| 1,134.9 |
|
Ending Balance of Cash and Cash Equivalents, Statements of Cash Flows |
| 1,134.9 |
| 961.4 |
|
For the year ended December 31, 2010, operating activities generated a positive net cash flow of Ch$ 1,943 billion, a decrease of 4.7% when compared to 2009. This cash flow is explained primarily by the period’s net income of Ch$ 1,101 billion. Other drivers of operating cash flow were non-monetary adjustments for Ch$ 527 billion, which mainly includes amortization and depreciation in the period Ch$ 449 billion and impairments for a total amount of Ch$ 108 billion. This was partially offset by tax payments of Ch$ 349 billion.
For the twelve-month period ended on December 31, 2009, operating activities of the company led to a net cash inflow of Ch$ 2,038 billion. The main driver was a positive inflow as a result of the net income of the period that amounted to Ch$ 1,311.3 billion. See “Item 5. Operating and Financial Review and Prospects — A. Operating Results — Net Income”. Other drivers of operating cash flow were non-monetary adjustments for Ch$ 509 billion, mainly explained by the amortization and depreciation in the period for a total amount of Ch$ 454 billion, and an increase in provisions for a total amount of Ch$ 104 billion. This was partially offset by income tax payments that totaled Ch$ 235 billion.
For the twelve-month period ended on December 31, 2010, investment activities led to a net negative cash flow of Ch$ 776 billion, a 10.5% decrease compared to 2009. This cash flow corresponds primarily to the incorporation of fixed assets of Ch$ 474 billion. Major investments in the generation business were Bocamina II in Chile, with Ch$ 70 billion invested (from an estimated total investment of Ch$ 400 billion) and El Quimbo in Colombia with an investment of Ch$ 16 billion (from an estimated total investment of Ch$ 630 billion). We have also spent Ch$ 87 billion in maintenance of existing installed generation capacity, mainly in Argentina, Colombia and Peru. On the other hand, major investments in the distribution business were in Brazil, with Ch$ 125 billion invested in Coelce and Ch$ 114 billion invested in Ampla. In Colombia, investments amounted to Ch$ 80 billion. The investment cash flow is also explained by intangible assets’ purchases of Ch$ 227.4 billion and other investments of Ch$ 94.8 billion.
For the twelve-month period ended on December 31, 2009, investment activities generated a net cash outflow of Ch$ 867 billion, including fixed and intangible assets for a total amount of Ch$ 13 billion, mainly as a result of investments at the level of the Company and our subsidiaries Chilectra, Codensa, Edelnor, Edesur, Ampla and Coelce. It is also explained by other outflows that totaled Ch$ 342 billion that mainly correspond to the acquisition of additional equity stakes in Edegel and Edelnor, the acquisition of an equity interest in DECA, and also due to margin calls at the level of the Company. See “Item 4. Information of the Company — A. History and Development of the Company —Investments, Capital Expenditures and Divestitures”. This was partially offset by proceeds for sale of financial assets for Ch$ 190 billion, which corresponds mainly to the sale of the Codensa’s retail business (Codensa Hogar) and the sale of the participation in Empresa de Energía de Bogotá.
For the twelve-month period ended on December 31, 2010, financing activities originated a negative cash flow of Ch$ 1,283 billion. The main drivers are described below:
The aggregated cash inflows were mainly explained by:
· Endesa Chile obtained loans for Ch$ 153 billion.
· Emgesa carried out an equity decrease of Ch$ 107 billion, of which Ch$ 27 billion were received by Endesa Chile.
· Codensa issued bonds for Ch$54 billion and obtained loans for Ch$ 62 billion.
· Edegel issued bonds for Ch$ 29 billion.
The aggregated cash outflows were mainly explained by:
· Ch$ 556 billion in dividend payments (Ch$ 304 billion from Endesa Chile, Ch$ 183 from Codensa and Ch$ 49 billion from Chilectra among others).
· Ch$ 245 billion in payment of interest expense (Ch$ 119 billion in Endesa Chile and Ch$ 28 billion in Codensa among others).
· Endesa Chile payment of its Ch$ 211 billion revolving credit.
For the twelve month period ended on December 31, 2009, the financing activities of the company totaled a net cash outflow of Ch$ 1,308 billion. The main drivers are described below:
The aggregated cash inflows were mainly explained by:
· Issuance of local bonds by Emgesa for Ch$ 157 billion.
· Issuance of local bonds by Ampla for Ch$ 74 billion.
· Issuance of commercial paper by Coelce for Ch$ 54 billion.
The aggregated cash outflows were mainly explained by:
· Ch$ 462 billion in dividend payments.
· Ch$ 203 billion bullet payment of principal of Endesa Chile’s Yankee Bond due in April 2009.
· Ch$ 201 billion in payment of interest expense.
· Ch$ 84 billion associated with Endesa Chile’s Yankee Bond Put Option exercised in February 2009.
· Ch$ 76 billion repayment of Enersis’ revolving credit facility due in November 2009.
For a description of liquidity risks related to our company, please see “Item 3. Key Information — D. Risk Factors — We depend in part on payments from our subsidiaries and affiliates to meet our payment obligations” in this report.
We coordinate the overall financing strategy of our majority-owned subsidiaries. Our operating subsidiaries independently develop their capital expenditure plans. Generally, our policy is to have the operating subsidiaries independently finance their capital expansion programs through internally generated funds or direct financings. For information regarding our commitments for capital expenditures, see “Item 4. Information on the Company — A. History and Development of the Company — Capital Investment Program” and our contractual obligations table set forth below.
As of December 31, 2010, our international credit ratings, and those of Endesa Chile, were as follows: “Baa3 with stable outlook” from Moody’s Investor Services, Inc. (Moody’s) and “BBB+ with stable outlook” from both Standard & Poor’s Rating Services (S&P) and Fitch Ratings Ltd. (Fitch). However, on April 25, 2011, Moody’s upgraded our international rating and that of Endesa Chile to “Baa2 with stable outlook”.
In its most recent press release, Moody’s stated that the upgrade “largely reflects each issuer’s strong consolidated metrics and our expectation that both companies’ future financial performance will continue to remain consistent with the Baa rating category despite an expectation for some degradation in near-term financial performance due to lower margin in certain markets.”
Moody’s also explained that “the group’s consolidated cash flows are further supported by the operations of the regulated subsidiaries, which generally provides a source of predictable earnings and cash flows”.
Economic and political stability in the countries where we operate, regulatory framework stability, structural changes affecting energy demand, and environmental issues are some of the factors that could influence credit ratings in either direction. The classifications might also be impacted if we face a significant change in our investments in non-Chilean countries, important changes in our financial position, or a significant change in liquidity. A positive change in Argentina’s regulatory framework may also positively influence our credit ratings.
Positive changes in ratings may have a direct impact on our financing cost and our ability to access capital markets in better terms. For instance, some of our credit facilities include a rating grid pricing in its terms.
We have accessed the international equity capital markets, with three SEC-registered ADS issuances in October 1993, February 1996 and September 2000, for Enersis, and once in 1994 for Endesa Chile. We have also frequently issued bonds in the United States, for Enersis and Endesa Chile. Since 1996, Enersis, Endesa Chile and its subsidiary Pehuenche have issued a total of $ 3,520 million in Yankee Bonds.
The following table lists the Yankee Bonds issued by Enersis and Endesa Chile outstanding as of December 31, 2010. The weighted average annual interest rate for such bonds is 7.9%, without giving effect to each bond’s duration, or put options.
|
|
|
|
|
|
|
| Aggregate Principal Amount |
| ||
Issuer |
| Term |
| Maturity |
| Coupon |
| Issued |
| Outstanding |
|
|
|
|
|
|
| (as a percentage) |
| (in $ million) |
| ||
|
|
|
|
|
|
|
|
|
|
|
|
Enersis |
| 10 years |
| January 2014 |
| 7.375 | % | 350 |
| 350 |
|
Enersis (1) |
| 10 years |
| December 2016 |
| 7.400 | % | 350 |
| 250 |
|
Enersis (2) |
| 30 years |
| December 2026, Put 2003 |
| 6.600 | % | 150 |
| 1 |
|
Subtotal |
|
|
|
|
| 7.384 | % | 850 |
| 601 |
|
|
|
|
|
|
|
|
|
|
|
|
|
Endesa Chile |
| 10 years |
| August 2013 |
| 8.350 | % | 400 |
| 400 |
|
Endesa Chile |
| 12 years |
| August 2015 |
| 8.625 | % | 200 |
| 200 |
|
Endesa Chile (1) |
| 30 years |
| February 2027 |
| 7.875 | % | 230 |
| 206 |
|
Endesa Chile (3) |
| 40 years |
| February 2037, Put 2009 |
| 7.325 | % | 220 |
| 71 |
|
Endesa Chile (1) |
| 100 years |
| February 2097 |
| 8.125 | % | 200 |
| 40 |
|
Subtotal |
|
|
|
|
| 8.214 | % | 1,250 |
| 917 |
|
|
|
|
|
|
|
|
|
|
|
|
|
Total |
|
|
|
|
| 7.886 | % | 2,100 |
| 1,518 |
|
(1) Enersis and Endesa Chile repurchased bonds in 2001.
(2) Holders of the 6.6% Enersis Yankee bonds due 2026 exercised a put option on December 1, 2003 for an aggregate principal amount of $ 149 million, leaving $ 1 million outstanding.
(3) Holders of the 7.325% Endesa Chile Yankee bonds due 2037 exercised a put option on February 1, 2009, for a total amount of $ 149.2 million. The remaining $ 70.8 million in bonds mature in February 2037.
In January 2011, our Colombian subsidiary, Emgesa, accessed the international debt capital markets, with the issuance of Rule 144A/Reg S Notes in local Colombian currency for the equivalent of $ 400 million, due in January 2021. This is the first offshore private sector issuance in Colombian pesos. The net proceeds from the sale of the Notes will be used to finance new projects, such as El Quimbo, to repay existing debt and for other general corporate purposes.
Enersis and Endesa Chile, as well as our subsidiaries in the five countries in which we operate, have access to their domestic capital markets, where we have issued debt instruments including commercial paper and medium and long term bonds that are primarily sold to pension funds, life insurance companies and other institutional investors. In the last 15 years, Enersis and Endesa Chile have accessed the local market with total bond issuances for UF 43.0 million or $ 1,971 million (as of December 31, 2010).
The following table lists UF-denominated Chilean bonds issued by Enersis and Endesa Chile, outstanding as of December 31, 2010.
|
|
|
|
|
| Coupon |
| Aggregate Principal Amount |
| ||||
Issuer |
| Term |
| Maturity |
| rate) |
| Issued |
| Outstanding |
| ||
|
|
|
|
|
| (as a percentage) |
| (UF |
| (UF million) |
| (in $ million) |
|
|
|
|
|
|
|
|
|
|
|
|
|
|
|
Enersis Serie B2 |
| 21 years |
| June 2022 |
| 5.75 | % | 2.5 |
| 1.6 |
| 71 |
|
Endesa Chile Serie F |
| 21 years |
| August 2022 |
| 6.20 | % | 1.5 |
| 1.4 |
| 65 |
|
Endesa Chile Serie K |
| 20 years |
| April 2027 |
| 3.80 | % | 4.0 |
| 4.0 |
| 183 |
|
Endesa Chile Serie H |
| 25 years |
| October 2028 |
| 6.20 | % | 4.0 |
| 3.8 |
| 174 |
|
Endesa Chile Serie M |
| 21 years |
| December 2029 |
| 4.75 | % | 10.0 |
| 10.0 |
| 458 |
|
|
|
|
|
|
|
|
|
|
|
|
|
|
|
Total |
|
|
|
|
| 5.01 | % | 22.5 |
| 20.8 |
| 951 |
|
The following table lists local bonds issued by our foreign subsidiaries, outstanding as of December 31, 2010. We present aggregate information for each company. The maturity column for each company reflects the issuance with the longest maturity, and the coupon rate corresponds to the weighted average coupon of all issuances for each company.
Issuer |
| Maturity |
| Coupon (1) |
| Aggregate Principal |
|
|
|
|
|
|
| (in $ million) |
|
|
|
|
|
|
|
|
|
Ampla |
| December 2015 |
| 12.15 | % | 378 |
|
Codensa |
| December 2018 |
| 8.39 | % | 697 |
|
Coelce |
| July 2014 |
| 12.77 | % | 154 |
|
Edegel |
| January 2028 |
| 6.50 | % | 201 |
|
Edelnor |
| August 2020 |
| 7.22 | % | 292 |
|
Emgesa |
| February 2024 |
| 8.75 | % | 689 |
|
Edesur |
| June 2012 |
| 11.75 | % | 25 |
|
Total |
|
|
|
|
| 2,438 |
|
(1) Many of the coupon rates are variable rates based on local indexes, such as inflation. The table reflects the coupon rate taking into account each local index as of December 31, 2010.
For a full description of the local bonds issued by Enersis and Endesa Chile, see “ — Unsecured liabilities detailed by currency and maturity” and “ — Secured liabilities breakdown by currency and maturity” in Note 18 to our Consolidated Financial Statements.
We frequently participate in the international commercial bank markets governed by the laws of the State of New York through both bilateral and syndicated senior unsecured loans. As of the date of this report, the amounts outstanding or available for these bank loans are listed below:
Borrower |
| Type |
| Maturity |
| Facility Amount |
| Amount Drawn |
|
|
|
|
|
|
| ($ million) |
| (in $ million) |
|
|
|
|
|
|
|
|
|
|
|
Enersis |
| Syndicated revolving loan |
| December 2012 |
| 100 |
| 0 |
|
Endesa Chile |
| Syndicated revolving loan |
| July 2011 |
| 200 |
| 0 |
|
Endesa Chile |
| Syndicated revolving loan |
| June 2014 |
| 200 |
| 0 |
|
Endesa Chile |
| Syndicated term loan |
| June 2014 |
| 200 |
| 200 |
|
|
|
|
|
|
|
|
|
|
|
Total |
|
|
|
|
| 700 |
| 200 |
|
The Enersis revolving credit facility due December 2012 and the Endesa Chile revolving credit facility due June 2014 do not contain a condition precedent requirement regarding the non-occurrence of a “Material Adverse Effect” (or MAE, as
defined contractually) prior to a disbursement, allowing the companies full flexibility to draw on up to $ 300 million in the aggregate from such committed revolving facilities under any circumstances, including situations involving a MAE.
Enersis and Endesa Chile also borrow from banks in Chile under fully committed facilities in which a potential MAE would not be an impediment to this source of liquidity. In December 2009, both companies signed 3-year bilateral revolving loans for an aggregate of UF 4.8 million (equivalent to $ 219 million as of December 31, 2010) as detailed below.
Borrower |
| Type |
| Maturity |
| Facility Amount |
| Amount Drawn |
|
|
|
|
|
|
| (UF million) |
| (UF million) |
|
|
|
|
|
|
|
|
|
|
|
Enersis |
| Bilateral revolving loans |
| December 2012 |
| 2.4 |
| 0 |
|
Endesa Chile |
| Bilateral revolving loans |
| December 2012 |
| 2.4 |
| 0 |
|
|
|
|
|
|
|
|
|
|
|
Total |
|
|
|
|
| 4.8 |
| 0 |
|
Our subsidiaries also have access to fully committed credit lines in the local markets, as detailed above.
Borrower |
| Type |
| Maturity |
| Facility Amount |
| Amount Drawn |
|
|
|
|
|
|
| ($ million) |
| (in $ million) |
|
|
|
|
|
|
|
|
|
|
|
Ampla |
| Bilateral revolving loans |
| April 2011 |
| 24 |
| 0 |
|
Coelce |
| Bilateral revolving loans |
| April 2011 |
| 30 |
| 0 |
|
|
|
|
|
|
|
|
|
|
|
Total |
|
|
|
|
| 54 |
| 0 |
|
As a result of the foregoing, we have access to fully committed undrawn revolving loans, both international and domestic, for up to approximately $ 773 million in the aggregate as of December 31, 2010.
Enersis and Endesa Chile also borrow routinely from uncommitted Chilean bank facilities with approved lines of credit for approximately $ 320 million in the aggregate. Unlike the previous committed lines not subject to MAE conditions precedent prior to disbursements, this source of funding in the Chilean market is not guaranteed under all circumstances. Our subsidiaries also have access to uncommitted local bank facilities, for a total amount of $ 1,775 million, of which $ 1,210 million are undrawn.
Also, both Enersis and Endesa Chile can tap the Chilean commercial paper market under programs that have been registered with the Chilean SVS for a maximum of $ 200 million for each borrower. In addition, Enersis had a local bond program registered with the SVS for UF 12.5 million that has not been issued yet.
Finally, our foreign subsidiaries also have access to other types of financing, including governmental facilities, supplier credit and leasing, among others.
Except for the SEC-registered Yankee bonds, which are not subject to financial covenants, Enersis and Endesa Chile’s outstanding debt facilities include such covenants. The types of financial covenants, and their respective limits, vary from one type of debt to another. As of December 31, 2010, the most restrictive financial covenants affecting Enersis was Debt to EBITDA covenant, corresponding to the revolving loan facility that matures in December 2012, while in the case of Endesa Chile, it was the Adjusted Consolidated Leverage test, corresponding to the revolving loan facility that matures in July 2011. Under such covenants, the maximum additional debt that could be incurred without a breach of covenant is $ 8.8 billion and $ 5.1 billion for Enersis and Endesa Chile, respectively, allowing both companies to double their current financial debt. As of the date of this report, we are in compliance with our financial covenants contained in our debt instruments.
As is customary for certain credit and capital market debt facilities, a significant portion of Enersis and Endesa Chile’s financial indebtedness is subject to cross default provisions. Each of the revolving credit facilities described above, as well as all of Enersis and Endesa Chile’s Yankee Bonds, have cross default provisions with different definitions, criteria, materiality thresholds, and applicability as to the subsidiaries that could give rise to a cross default.
The cross default provision for the Endesa Chile revolving credit facility due in July 2011, governed by the laws of the State of New York, refers to so-called “Relevant Subsidiaries,” a contractually defined term that refers to our most important subsidiaries. Under such credit facilities, only matured defaults exceeding $ 50 million qualify for a potential cross default when the principal exceeds $ 50 million, or its equivalent in other currencies. There is a mathematical determination to determine the list of Relevant Subsidiaries, which may vary somewhat from year to year. As of December 2010, Endesa Chile’s Relevant Subsidiaries with debt to third parties include only Emgesa and Edegel, both rated AAA in the local markets, and Emgesa is rated BBB- in the international market. In the case of a matured default above the materiality threshold, revolving credit facility’s lenders would have the option to accelerate if the lenders representing more than 50% of the aggregate debt of a particular facility then outstanding choose to do so. As of the date of this report, there is no amount outstanding of this facility, and therefore, there is no current exposure to cross default under this credit agreement. None of the Enersis local facilities due in December 2012, the Endesa Chile local facilities due on the same date or the facilities maturing in June 2014 has cross default provisions to debt other than the respective borrower’s own indebtedness.
In the case of the Enersis bilateral loans maturing in December 2012, governed by the laws of the State of New York, the definition of “Relevant Subsidiary” makes reference (by definition and not by a formula) only to Endesa Chile and Chilectra, and the latter does not have any debt with third parties. Therefore, the risk of a cross default under these bank loans is very limited, since there is no reference to subsidiaries in countries other than Chile.
After amendments in July 2009 following a successful solicitation consent, our Yankee Bonds’ cross default provisions may be triggered only by debt of the respective borrower or its Chilean subsidiaries. A matured default of either Enersis, Endesa Chile or one of their respective Chilean subsidiaries could result in a cross default to Enersis and Endesa Chile’s Yankee Bonds if such matured default, on an individual basis, has a principal exceeding $ 30 million, or its equivalent in other currencies. In the case of a matured default above the materiality threshold, Yankee bondholders would have the option to accelerate if either the Trustee or bondholders representing no less than 25% of the aggregate debt of a particular series then outstanding choose to do so. Following the 2009 Yankee amendments which ring-fenced Chile, a payment default or a bankruptcy/insolvency default outside of Chile has no contractual effect on our Yankee Bond indentures, no matter how material.
The cross acceleration and bankruptcy/insolvency clauses of three of our four Endesa Chile UF-denominated Chilean bonds were amended in February 2010 after bondholders’ approval in January 2010. After the amendments, all series of Endesa Chile’s Chilean bonds ring-fenced Endesa Chile, and none of its subsidiaries, either in Chile or outside Chile, can trigger a cross default to Endesa Chile.
At the time of this report, Endesa Costanera, our Argentine subsidiary, has not paid the installment due March 2011 for $ 20.9 million of its supplier credit with Mitsubishi Corporation (MC) dating back to 1996. This has been a recurring situation ever since the Argentine crisis of 2002. For additional information of the Argentina crisis and its consequence in the electricity industry, please see “Item 4. Information on the Company. B. Business Overview. Electricity Industry Regulatory Framework. Argentina. Regulatory Developments: the industry after the Public Emergency Law”. However, on March 31, 2011, MC temporarily waived the payment due from Endesa Costanera. The waiver also states MC’s willingness to discuss a new payment date for the amount past due.
Except for Endesa Costanera, our companies have access to existing credit lines sufficient to satisfy all of its present working capital needs. In 2010, Endesa Costanera had total indebtedness of approximately $ 72 million (including debt with MC of $ 28 million). Endesa Costanera’s access to the capital markets has been very limited due to the difficult financial situation still prevailing in Argentina, especially for the utilities sector, the poor capital markets development due to the shortage of off-shore financing and the pension fund system nationalization. Notwithstanding these unusual circumstances, Endesa Costanera was still able to refinance its debt maturing in 2010.
Payment of dividends and distributions by our subsidiaries and affiliates represent an important source of funds for us. The payment of dividends and distributions by certain subsidiaries and affiliates are subject to legal restrictions, such as legal reserve requirements, and capital and retained earnings criteria, and other contractual restrictions. We have been advised by legal counsel in the various geographical locations where our subsidiaries and affiliates operate that there currently are no additional legal restrictions on the payment to Enersis of dividends or distributions to us in the jurisdictions where such subsidiaries or affiliates are incorporated. Certain credit facilities and investment agreements of our subsidiaries restrict the payment of dividends or distributions in certain special circumstances. For a description of liquidity risks resulting from our company status, please see “Item 3. Key Information — D. Risk factors —We depend in part on payments from our subsidiaries and affiliates to meet our payment obligations”.
Our estimated capital expenditures for the 2011-2015 period, expressed in dollars at internally estimated exchange rates, amount to $ 5,974 million, of which $ 5,778 million is considered non-discretionary investments. We include maintenance capital expenditures as non-discretionary. It is important for us to maintain the quality and operation standards required for our facilities, but we do have some flexibility regarding the timing for these investments. We consider the investment in non-conventional renewable energy (NCRE) projects in Chile to be non-discretionary. These investments are being made to comply with regulations that call for 5% of the total contracted energy to be based on NCRE. Finally, expansion projects under execution are also non-discretionary. We consider the remaining $ 197 million of the $ 5,974 million of our estimated capital expenditure for 2011-2015 to be discretionary. The latter includes expansion projects that are still under evaluation, in which case we would undertake them only if deemed profitable.
We do not currently anticipate liquidity shortfalls affecting our ability to satisfy the obligations described in this report. We expect to refinance our indebtedness as it becomes due, fund our purchase obligations outlined previously with internally generated cash, and fund capital expenditures with a mixture of internally generated cash and borrowings.
Transactions that most significantly affected Enersis foreign subsidiaries’ liquidity in 2010 included:
· Endesa Costanera: refinancing of all 2010 indebtedness for approximately $ 72 million. Within this refinancing, we highlight the $ 28 million refinancing due to MC and $ 8.6 million to Credit Suisse.
· El Chocón: syndicated loan for $ 22 million for 3.5 years, which enabled the company to refinance its short-term debt and to increase the debt’s average life. The company also signed forward contracts for $ 29 million.
· Edesur: refinancing of two loans in advance for approximately $ 8 million, which allowed increasing the debt’s average life.
· Coelce: refinancing of debt maturing in 2010 for approximately $ 46 million.
· Endesa Brasil: payment of IFC’s equity interest for $ 111 million.
· Codensa: Bond issuances for a total of $ 116 million for three and six year maturities.
· Emgesa: The first placement of commercial paper was carried out for $ 39 million to refinance short-term debt and local bond issuances for $ 309 million with terms between 5 and 15 years.
· Edelnor: Local bond issuance during 2010 for approximately $ 36 million, used to refinance indebtedness.
· Edegel: Bond issuance for $ 20 million and obtained a 7-year term loan for $ 61 million to refinance debt maturing in 2012. The company also signed forward contracts for $ 39 million.
Transactions that most significantly affected Enersis foreign subsidiaries’ liquidity in 2009 included:
· Endesa Costanera: refinancing of all debt maturing in 2009 for approximately $ 76 million. Also, Endesa Costanera refinanced $ 4.3 million with Credit Suisse due in 2010, extending its maturity to 2011.
· El Chocón: syndicated loan for $ 31 million for 3 years, which enabled the company to refinance its short-term debt. It also arranged a 2.5-years interest rate swap for $ 30 million.
· Edesur: refinancing of debt maturing in 2010 for approximately $ 46 million, extending the average life of its debt and converting all its debt into local currency.
· Ampla: debentures for $ 146 million in two series with maturities between three and six years, whose proceeds were used to refinance short-term debt.
· Coelce: commercial paper for approximately $ 106 million for one year to refinance short-term debt. The company also issued debentures for $ 130 million dollars to repay the commercial paper. Finally, it also contracted a committed line of credit for $ 50 million.
· Codensa: sale of the Codensa Hogar business portfolio, with proceeds of approximately $ 275 million for this operation. Codensa also placed commercial paper for $ 18 million, in order to refinance short-term debt, and issued domestic bonds for $ 31 million to finance the purchase of Empresa de Energía de Cundinamarca.
· Emgesa: local bonds for $ 309 million, the proceeds of which were used to refinance short-term debt.
· Edelnor: bank debt for $ 77 million. The company also issued local bonds for $ 38 million with maturities between three and six years, which were used to refinance short-term debt.
· Edegel: local bonds for $ 34 million denominated in both dollar and local currency, used to refinance short-term debt. Edegel also renegotiated bank loans for $ 42 million, which enabled it to reduce the interest rate and extend the term.
C. Research and Development, Patents and Licenses, etc.
None.
D. Trend Information.
Enersis is a company with subsidiaries engaged in the generation, transmission and distribution of electricity in five South American countries. Therefore, our businesses are subject to a wide variety of conditions that may result in variability in our earnings and cash flows from year to year. In general, our net income is a result of our operating income from our generation and distribution businesses and other factors such as income from unconsolidated related companies, foreign currency exchange rate effects and tax expense.
In our generation business, our operating income for 2010 decreased by 11.9% as compared to 2009. This percent change in the generation segment operating income in 2010 varies in each of the five countries where we operate and is due to numerous factors, including hydrological conditions, the price of fuel used to generate electricity and the prevailing spot market and regulated prices for electricity. We expect to continue evidencing a reasonably good operating performance over the coming years, given the favorable macroeconomic perspective for most of the countries in which we operate. The economies of these South American nations were less impacted by the latest international financial crisis as compared to developed countries. There are high expectations for the next few years for a strong economic recovery, including a 4% growth in the national economic product, on average, and a correspondingly stable electricity demand growth.
On the other hand, development of new generation facilities in South America has always followed behind demand growth. We anticipate that this tendency will continue in the foreseeable future. Also, due to growing environmental restrictions, transmission line saturation, obstacles for fuel transportation and scarcity of places where to locate plants, these new projects involve higher development costs than in the past. We foresee that average electricity prices will adjust to recognize these increased costs. This situation could increase the value of our assets, especially in the case of hydroelectric power plants, which have lower production costs, and thus benefit from greater profitability in scenarios of increasing prices to end users. Furthermore, an important part of the new installed capacity under development in the five countries in which we operate corresponds to thermal power plants, with coal and natural gas as their principal fuels, and only a few hydroelectric projects are being developed. Thus, we expect this situation will also impact long term spot prices positively. Long term contracts awarded in different international bids to Enersis, through its subsidiaries, has already incorporated these expected price levels. Currently, we have 23% of our expected annual generation sold under contracts of at least ten years, and 33% in contracts of at least five years.
However, spot prices are subject to great volatility, affecting our forecasted income. In order to address this risk in the generation business, the Company has implemented commercial policies in order to control relevant variables and provide stability to the profit margins. Our commercial policy seeks to establish a global framework to conduct the energy trading operations, setting responsibilities, guidelines and acceptable risk limits aligned with company objectives. Therefore, our company defines contractual volumes that minimize the risk of supply in adverse hydrological conditions and includes, where necessary with some industrial clients, risk mitigation clauses.
In order to mitigate the risk of increasing fuel costs, Enersis has fuel supply contracts to cover part of the fuel needed by its thermal generation units, which operate with coal, natural gas and diesel or fuel oil. In Chile, through an equity interest in GNL Quintero, we are the only electricity company participating in the LNG terminal at Quintero bay (the only facility of its kind in the SIC market), enhancing our position to manage fuel supply risks, mainly when facing increasing fuel costs scenarios. This becomes particularly relevant given the increasing trend to penalize other technologies that are intensive in
fuels, such as coal and diesel, which have a stronger environmental impact. As of December 31, 2010, we have not made any transaction with commodities’ derivate instruments to handle fuel price fluctuations. For further information on this subject, please see “Item 11(a) and 11(b). Quantitative and Qualitative Disclosures About Market Risk — Commodity Price Risk”.
With respect to our distribution business segment, our operating income for 2010 decreased by 9.4% as compared to 2009. This decrease is a combination of numerous factors in each of the five countries where we operate. These include, among others, effects of regular tariff adjustments, which are partially offset by operational efficiency and the increase in electricity sales due to growth in population and gross domestic product (GDP) in the countries in which we operate. Technological advances, such as smart metering, have enabled us to limit the increase in electricity losses in a challenging economic environment. We expect that the South American countries in which we operate will continue to experience high growth rates, positively impacting our distribution business performance. In particular, we expect the growth rates in the electricity sector to continue, mainly due to the gap in the per capita electricity consumption that these countries have with respect to more developed countries, which in some cases are half the consumption of developed countries. We expect electricity demand to grow approximately 5% annually, on average, over the next 10 years.
In connection with distribution segment tariffs, taking into account the future periodic review process in each country in which we operate, we expect that the regulator will continue to recognize investments, encourage efficiency and establish rates that will allow for an appropriate return on investment. We also anticipate that our distribution companies will probably increase their profitability during the period between periodic tariff—setting processes. After tariffs have been set, the companies have the opportunity to increase their efficiency and obtain an extra profit associated with such gains in efficiency achieved during the period subsequent to the new tariff setting. For a better understanding of the cycles involving the process, please see the figure below, where we conceptually describe the effect of the application of the price cap model used by regulators in most of the countries where we operate.
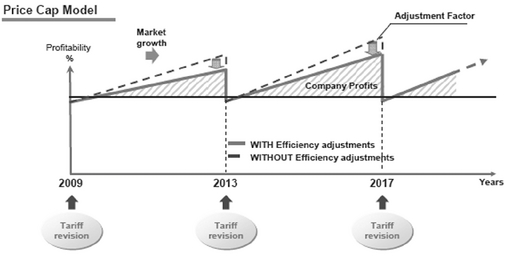
Although the price at which a distribution company purchases the electricity has a substantial impact on the price at which it is sold to end users, it does not have an impact on our profitability. The cost of electricity purchased is passed through to tariffs to end users. However, it is important to note that distribution companies usually enter into long—term contracts in order to decrease exposure to electricity price volatility. This is a common practice in most of the countries in which we operate.
Though our operations in the five countries allow us to somewhat offset and counterbalance variations with respect to these main factors that affect our operating results, in light of the variability of these factors over time and across the countries in which we operate, we cannot claim that we are fully hedged in our portfolio of generation assets in these countries. Furthermore, we cannot ascertain the likelihood or the extent to which past performance will be indicative of future performance with respect to our generation business. Any significant change with respect to hydrological conditions,
fuel price or the electricity price, among other factors, could affect our operating income in the generation business. At the same time, any significant change with respect to economic and population growth, as well as changes in the regulatory regimes in the countries in which we operate, among other factors, could affect our operating income in the distribution business. Variability in our earnings and cash flows can also arise from non—operating factors as well, such as foreign currency exchange rates. For further information regarding 2010 results of the Company compared with those recorded in previous periods, please see “Item 5. Operating and Financial Review and Prospects — A. Operating Results - Enersis’ Results of Operations for the Years Ended December 31, 2009 and December 31, 2010” and “Item 5. Operating and Financial Review and Prospects — A. Operating Results - Enersis’ Results of Operations for the Years Ended December 31, 2008 and December 31, 2009”. Investors should not look at our past performance as indicative of future performance.
We do not expect that our current debt agreements, which imposes certain restrictions, could have a negative impact on our capital expenditure plan as described in “Item 5. Operating and Financial Review and Prospects — B. Liquidity and Capital Resources.” We have a large leverage capacity prior to a potential breach of a debt covenant. As of December 31, 2010, Enersis is able to incur up to $ 8.8 billion in incremental debt, while Endesa Chile has an additional debt capacity of $ 5.1 billion, in each case beyond current levels of consolidated indebtedness. We believe that Enersis will continue to have similar comfortable levels of further leverage capacity in the foreseeable future.
In connection with funding sources, as of December 31, 2010, the Company has approximately $ 719 million in committed revolving facilities which have not yet been drawn, and additional uncommitted Chilean lines of credit for another $ 320 million in the aggregate. In addition, both Enersis and Endesa Chile have registered with the SVS certain commercial paper programs for up to $ 400 million in the aggregate and local bond programs for up to $ 573 million. These funding sources can be increased in the case of need.
Finally, as explained above, we expect that the Company will continue generating significant amounts of operating cash, which can be used to finance part of the capital expenditure plan. If needed, our shareholders also have the possibility to adjust the dividend payout ratio, subject to some legal restrictions, in order to allocate the cash needed for our investment plan.
E. Off—balance Sheet Arrangements.
Enersis is not a party to any off—balance sheet arrangements.
F. Tabular Disclosure of Contractual Obligations.
The table below sets forth the Company’s cash payment obligations as of December 31, 2010:
Ch$ billion (1) |
| Total |
| 2011 |
| 2012-2013 |
| 2014-2015 |
| After |
|
Bank debt |
| 630 |
| 176 |
| 303 |
| 120 |
| 31 |
|
Local bonds (2) |
| 1,557 |
| 229 |
| 286 |
| 253 |
| 788 |
|
Yankee bonds |
| 906 |
| 0 |
| 187 |
| 366 |
| 352 |
|
Other debt (3) |
| 384 |
| 178 |
| 127 |
| 65 |
| 14 |
|
Interest expense |
| 300 |
| 51 |
| 83 |
| 74 |
| 92 |
|
Pension and post-retirement obligations(4) |
| 263 |
| 41 |
| 77 |
| 73 |
| 72 |
|
Purchase obligations(5) |
| 31,159 |
| 1,690 |
| 2,846 |
| 2,535 |
| 24,089 |
|
Financial leases |
| 86 |
| 12 |
| 21 |
| 21 |
| 32 |
|
Total contractual obligations |
| 35,285 |
| 2,377 |
| 3,930 |
| 3,507 |
| 25,470 |
|
(1) All figures are in Ch$ of each year.
(2) Hedging instruments included modifies substantially the principal amount of debt.
(3) Other debt includes governmental loan facilities, supplier credits and short—term commercial paper among others.
(4) We have funded and unfunded pension and post—retirement benefit plans. Our funded plans have contractual annual commitments for contributions which do not change based on funding status. Cash flow estimates in the table are based on such annual contractual commitments including certain estimable variable factors such as interest. Cash flow estimates in the table relating to our unfunded plans are based on future discounted payments necessary to meet all of our pension and post—retirement obligations. The amount of Ch$ 72 billion in the “After 2015” column includes all of our cash flow estimates relating to our unfunded plans, but does not include any amount for our funded plans, because such plans do not have an expiration or settlement date.
(5) Includes generation and distribution business purchase obligations comprised mainly of energy purchases, operating and maintenance contracts and other services. Of the total amount of Ch$ 31,159 billion, 84% corresponds to energy purchases, 12% corresponds primarily to fuel supply, services in medium and low voltage lines, and supply of cables, and the remaining 4% to miscellaneous services, such as GNL regasification, fuel transport and coal handling.
G. Safe Harbor.
This “Item 5. Operating and Financial Review and Prospects,” contains information that may constitute forward—looking statements. See “Forward—Looking Statements” in the Introduction of this report, for safe harbor provisions.
Item 6. Directors, Senior Management and Employees
A. Directors and Senior Management.
Our Board of Directors consists of seven members who are elected for a three—year term at an Ordinary Shareholders’ Meeting, or OSM. If a vacancy occurs in the interim, the Board of Directors elects a temporary director to fill the vacancy until the next OSM, when the entire Board of Directors will be elected. Our Executive Officers are appointed by the Board of Directors and hold office at the discretion of the Board. Set forth below are the members of our Board of Directors as of December 31, 2010.
Directors |
| Position |
| Held Since |
Pablo Yrarrázaval V. |
| Chairman |
| 2002 |
Andrea Brentan |
| Vice Chairman |
| 2009 |
Rafael Fernández (1) |
| Director |
| 2010 |
Rafael Miranda R. |
| Director |
| 1999 |
Hernán Somerville S. |
| Director |
| 1999 |
Eugenio Tironi B. |
| Director |
| 2000 |
Leonidas Vial (1) |
| Director |
| 2010 |
(1) Appointed Board member in April 2010.
Set forth below are brief biographical descriptions of our directors, five of whom reside in Chile and two in Spain, as of December 31, 2010.
Pablo Yrarrázaval V.
Chairman of the Board of Directors
Mr. Yrarrázaval became Chairman of the Board of Directors in July 2002 and was Chairman of the Directors’ Committee since April 2003 until January 2010. Mr. Yrarrázaval is a partner in the brokerage firm Corredora de Bolsa Yrarrázaval y Compañía Limitada, Vice Chairman of Depósito Central de Valores S.A., DCV, and is also Chairman of the Santiago Stock Exchange, a position he has held since 1989. Before Mr. Yrarrázaval became Chairman of Enersis, he was Chairman of Endesa Chile.
Andrea Brentan
Vice Chairman of the Board of Directors
Mr. Brentan has been Vice Chairman since 2009. He was a research assistant at New York University from 1975 to 1977 and then held various positions at GIE, an Italian power plant contractor operating worldwide, until the beginning of 1991. From 1991 to 1999, he successively held the positions of CFO, General Manager and CEO at Sae Sadelmi, a Milan—based company belonging to the ABB Group which is engaged in power plant engineering, procurement and construction and electrical generation equipment manufacturing and service. From 2000 to 2002, he was the Head of the Worldwide Steam Power Plant Business at Alstom, based in Paris. He joined Enel in November 2002, where he held several positions in the company, including Head of Business Development and M&A unit of the International Division, Chairman of Viesgo S.A., Chairman of Enel North America, Enel Latin America and Slovenske Elektrarne and Director of Enel Energy Europe. Until June 2009, he served as Director of the Iberian Peninsula and Latin American Division of Enel and Vice Chairman of the Board of Endesa Spain, when he became CEO of Endesa Spain. Mr. Brentan is a mechanical engineer from Politécnico di Milano and holds a M.Sc. in Applied Sciences from New York University.
Rafael Fernández M.
Director of the Board, Member of the Directors’ Committee
Mr. Fernández was appointed Director of Enersis in April 2010. From 1997 to 2006, Mr. Fernández served as Chairman of the Board of various Argentine companies in the electricity generation, transmission, distribution and commercialization businesses, as well as in natural gas production and transport companies. He also founded and was a member until 2004 of the Academic Committee of the Master’s in Electricity Business of ITBA (Buenos Aires, Argentina) and since 2006 he has been a member of the Advisory Committee of the Development Department of Universidad Alberto Hurtado. Between 2002 and 2006, he was the Executive Director of the Gas and Energy Business division of Petrobrás Energía—Argentina. Between 2006 and January 2010, he served as CEO and Director of Petrobras Chile Petrolera Ltda. He currently is CEO of Corporación de Capacitación y Empleo, a subsidiary of Sociedad de Fomento Fabril (SOFOFA). Mr. Fernández is a civil industrial engineer from Pontificia Universidad Católica de Chile.
Rafael Miranda R.
Director of the Board
Mr. Miranda has been a Director of the Board since 1999. He joined Endesa Spain in 1987. From 1987 to 1997, he was Managing Director. Between February 1997 and June 2009, he served as Endesa Spain’s CEO. Currently, Mr. Miranda is Chairman of Endesa Foundation, Honorary Chairman of Eurelectric (European Electricity Association), Chairman of the Social Council of Burgos University and Chairman of the Spanish Council of INSEAD. Mr. Miranda holds a B.Sc. in Industrial Engineering from Comillas University (ICAI) and a Master’s Degree in Management Science from the School of Industrial Organization.
Hernán Somerville S.
Director of the Board, Chairman of the Directors’ Committee
Mr. Somerville has been a Director of the Board since 1999. From 1983 to 1988, Mr. Somerville was Director of the Chilean Central Bank, serving as Chief Debt Negotiator for Chilean public debt and private commercial bank debt. Mr. Somerville was the former Chairman of the Confederation of Production & Commerce in Chile. Since 1989, Mr. Somerville has been the Managing Director and Partner of Fintec, an investment, advisory and management company. He is also the non—executive Chairman of the Chilean Association of Banks and Financial Institutions, former Chairman of the Latin American Federation of Banks and Chairman of Transbank S.A., which manages credit and debit cards in Chile. He is also a Board Member of Corp Banca, INACAP. Mr. Somerville is one of the three Chilean representatives at the Asia Pacific Economic Council’s Business Advisory Committee, and is Chairman of the Chilean Pacific Foundation. Mr. Somerville has a law degree from Universidad de Chile and an M.C.J. degree from New York University Law School.
Eugenio Tironi B.
Director of the Board
Mr. Tironi has been a Director of Enersis since July 2000. Between 1990 and 1994, Mr. Tirnoni was a Director of the Secretariat of Communication and Culture of the Chilean Government. Mr. Tironi was also a visiting professor at Notre Dame University (U.S.A) in 2002, and Sorbonne—Nouvelle (France) in 2006. In addition, since 1994, he has been the Chairman of Tironi Asociados, a strategic communications’ firm, which advises Chilean and international firms in several Latin American countries. He is currently a researcher at CIEPLAN, a professor at Universidad Adolfo Ibañez and a member of the Board of Trustees of Universidad Alberto Hurtado. He is also a board member of different non—profit organizations, such as Paz Ciudadana, Un techo para Chile and Fundación Orquestas Sinfónicas Juveniles e Infantiles. Mr. Tironi has published seventeen books in Chile and abroad, and is a regular columnist of the Chilean newspaper, El Mercurio. Mr. Tironi received a Ph.D. in sociology from L’École des Hautes Études en Sciences Sociales (Paris, France).
Leonidas Vial E.
Director of the Board, Member of the Directors’ Committee
Mr. Vial was appointed Director of Enersis in April 2010. He was Director of Endesa Chile since April 1995 until March 2010. Mr. Vial has been Vice Chairman of the Santiago Stock Exchange since June 1988, as well as a Director of Empresas Santa Carolina S.A., Cía Industrial El Volcán S.A, Larraín Vial S.A., Chairman of Cía. CIC S.A. and director of Embotelladora Arica, none of which are related to the Endesa Group.
Executive Officers (as of December 31, 2010) |
| Position |
| Current Position Held Since |
Ignacio Antoñanzas A. |
| Chief Executive Officer |
| 2006 |
Massimo Tambosco |
| Deputy Chief Executive Officer |
| 2010 |
Ramiro Alfonsín B. |
| Planning and Control Officer |
| 2007 |
Angel Chocarro G. |
| Accounting Officer |
| 2009 |
Alfredo Ergas S. |
| Chief Financial Officer |
| 2003 |
Juan Pablo Larraín M. |
| Communications Officer |
| 2009 |
Eduardo López M. |
| Procurement Officer |
| 2010 |
Carlos Alberto Niño F. |
| Human Resources Officer |
| 2010 |
Francisco Silva B. |
| General Services Officer |
| 2010 |
Alba Marina Urrea |
| Internal Audit Officer |
| 2010 |
Domingo Valdés P. |
| General Counsel |
| 1999 |
Set forth below are brief biographical descriptions of our Executive Officers, all of whom reside in Chile:
Ignacio Antoñanzas A. was appointed CEO of Enersis in October 2006. He started his career as a commodities trader. He joined Endesa Spain in 1994, having worked mainly during his professional career in generation and corporate strategy areas. He has been the CEO of Endesa Net Factory and Director of Endesa Italia. Until assuming his current position, he served as Deputy General Manager of Strategy for Endesa Spain. Since June 2009, he also serves as Executive Vice President at Endesa Spain in charge of Latin America. Mr. Antoñanzas holds a degree in Mining Engineering with a major in energy and fuels from the Universidad Politécnica de Madrid.
Massimo Tambosco. became Deputy Chief Executive Officer in October 2010. Between 2000 and 2009, he held several positions in finance, planning and control, corporate control and M&A for different Enel Group companies and business units. Previously, he was CFO of Ferrero de México and Administration Manager of Roca S.r.l. From March 2009 until his most recent appointment, he held the position of Deputy CFO of Endesa Spain in Spain. Mr. Tambosco holds a degree in business administration from the Università Commerciale Luigi Bocconi in Milano, Italy, and attended Executive Programs in the Kellogg School of Management in Chicago and the Harvard Business School in Boston.
Ramiro Alfonsín B. became Planning and Control Officer in March 2007. Before joining the Endesa Group, Mr. Alfonsín worked as Senior Financial Advisor at Banco Urquijo KBL Group, as Management Advisor of the Corporate Development and Institutional Relations at Alcatel, and also as Corporate Banking Associate at ABN Amro Bank N.V. He joined the Endesa Spain Group in June 2000, working in Endesa Net Factory as Investment and Risk Capital Manager and later as Planning and Control Manager. Subsequently, he worked in Endesa Italia as a Planning and Investment Deputy Director and in Endesa Europa as Investment and Corporate Relations Deputy Director. Currently, Mr. Alfonsín is a board member of several companies of Enersis in Argentina, Brazil, Chile and Peru. He holds a degree in Business Administration from the Pontificia Universidad Católica de Argentina.
Ángel Chocarro G. is the Enersis’ Accounting Officer since November 2009. Mr. Chocarro has held several positions in both Enersis and the Endesa Spain Group. From 2005 to 2009, he was Enersis’ Director of Consolidation, Internal Controls, and Accounting Criteria. Mr. Chocarro has a degree in Economics and Business Administration from Universidad del País Vasco, Spain.
Alfredo Ergas S. has been the CFO of Enersis since July 2003 after having held a similar position at Endesa Chile. Mr. Ergas joined Enersis in April 1993. He served as Deputy Chief Financial Officer of Endesa Chile and later in Enersis as Planning and Control Director. Afterwards, Mr. Ergas served as CFO and Chief Controlling Officer of the Chilean telecommunications company, Smartcom, from 2000 to 2002. Mr. Ergas is the Chairman of InBest, a non—profit organization formed in November 2009 aimed at promoting the Chilean capital market’s strengths and advantages in financial services before the international financial community. Mr. Ergas also serves as Chairman of the Issuers’ Committee of the Chilean American Chamber of Commerce, AmCham, and Board Director of the Alumni Association of Commercial Engineers of Universidad de Chile. Mr. Ergas is a commercial engineer from Universidad de Chile, and has an M.B.A. degree from Trium Global Executive M.B.A., an alliance between NYU, HEC and LSE.
Juan Pablo Larraín M. joined Enersis in August 2006 as Chilectra’s Communications Officer. In November 2009, he was appointed Enersis’ Communication Officer and Endesa Spain’s Communication Officer for Latin America and Chile. Before joining Enersis, he worked as Editor in Chief of Diario Financiero; Communications’ Officer at Hill & Knowlton
Chile, National Editor at El Mercurio (Valparaíso) and News Service Editor at Red TV. Mr. Larraín graduated from the School of Journalism at Finis Terrae University (Chile) and holds a Master’s Degree in Professional Journalism from Complutense University (Spain).
Eduardo López M. was appointed Enersis’ Procurement Officer in June 2008. He joined the group in 1981, having held several positions in the finance department in Chilectra until 1992. Between 1992 and 1995 he worked at Edesur where he served as Sales Manager. He also was CEO at Diprel S.A., a former Enersis subsidiary, between 1996 and 2001. In 2002, he was appointed as Enersis’ Purchase Manager and in 2004 he held the same position at CAM until 2008. Mr. López is a commercial engineer from Universidad Católica de Valparaiso, in Chile.
Carlos Niño F. was appointed Enersis’ Human Resources Officer in December 2010. He joined the group in 1998, having held several positions as Human Resources Officer at different companies, including Codensa and Emgesa in Colombia and Chilectra in Chile. He also was Endesa Latinoamérica Personnel Management Manager in 2009. Previously, he was Personnel Director of Legis S.A. and Human Resources Officer of Colmena Salud. Mr. Niño is a lawyer from Universidad Externado de Colombia and holds a M.Sc. in Labor and Social Security Law from the Pontificia Universidad Javeriana in Colombia.
Francisco Silva B. was appointed Enersis’ General Services Officer of Enersis in December 2010. Mr. Silva joined Chilectra in 1987 and has worked primarily in human resources and general management positions in several subsidiaries and affiliates of Enersis since then. Between 1998 and 2000, and between July 2003 and December 2010 he was Enersis’ Human Resources Officer. From January 2001 to June 2003, he worked as Adjunct Director of an Endesa Spain subsidiary in Spain. Mr. Silva holds a degree in public administration from Universidad de Chile, and received a D.P.A. from Universidad Adolfo Ibáñez, Chile, in 1986.
Alba Marina Urrea. has been Internal Audit Officer since March 2010. She has been linked to the Group for twelve years and has been responsible for the audit of our subsidiaries in Colombia and Peru. She previously served as Audit Director in Cementos Samper, Accounting Director at Cemex Colombia and as Senior Auditor at Arthur Andersen Colombia. She is a public accountant from the Autonomous University of Bucaramanga (Colombia), with a concentration in Finance from the Universidad del Rosario in Bogotá and a certification at the Institute of Internal Auditors, which accredits her as a Certified Internal Auditor.
Domingo Valdés P. has been General Counsel since May 1999. He joined the Enersis Group as a corporate attorney at law for Chilectra in 1993 and became Legal Counsel at Enersis in December 1997. Mr. Valdés worked as an intern at the New York City law firms of Milbank, Tweed, Hadley & McCloy and Chadbourne & Parke LLP. Before joining Chilectra, Mr. Valdés was a lawyer at Chase Manhattan Bank, N.A., Corporate Department (Chile) and an associate at Carey & Cía., a Santiago based law firm. Mr. Valdés is also Secretary of the Enersis Board of Directors and a Professor of Economic and Antitrust Law at Universidad de Chile Law School. Mr. Valdés is a lawyer from Universidad de Chile with a Master of Laws’ Degree from the University of Chicago.
B. Compensation.
Directors are paid a variable annual fee, depending on net earnings of the Company and a monthly fee paid in advance, depending on their attendance to the board meetings and their participation as Director of any of our subsidiaries. In 2010, the total compensation paid to each of our directors, including fees for attendance at meetings of the Directors’ Committee, was as follows:
Director |
| Variable |
| Fixed |
| Directors |
| Total |
|
|
| Year ended December 31, 2010 (in thousands of Ch$) |
| ||||||
Pablo Yrarrázaval V, |
| 63,798 |
| 55,023 |
| 759 |
| 119,580 |
|
Andrea Brentan (1) |
| 0 |
| 0 |
| 0 |
| 0 |
|
Patricio Claro G (2) |
| 9,701 |
| 8,373 |
| 3,803 |
| 21,877 |
|
Rafael Fernández M. (3) |
| 22,198 |
| 19,138 |
| 6,638 |
| 47,974 |
|
Rafael Miranda R. |
| 31,899 |
| 27,511 |
| 0 |
| 59,410 |
|
Hernán Somerville S. |
| 31,899 |
| 26,743 |
| 10,185 |
| 68,827 |
|
Eugenio Tironi B. |
| 31,899 |
| 26,750 |
| 764 |
| 59,413 |
|
Leonidas Vial (3) |
| 22,198 |
| 19,138 |
| 6,638 |
| 47,974 |
|
Total. |
| 213,593 |
| 182,676 |
| 28,787 |
| 425,057 |
|
(1) Mr. Brentan waived his compensation as Board Director.
(2) Mr. Claro ceased to be a Director of Enersis in April 2010.
(3) Mr. Vial and Mr. Fernández were appointed Directors in April 2010.
We do not disclose, to our shareholders or otherwise, information on individual Executive Officer’s compensations. For the year ended December 31, 2010, the aggregate gross compensation paid or accrued, attributable to fiscal year 2010, including performance—based bonuses for the Executive Officers of Enersis, was Ch$ 2,199 million. Enersis’ Executive Officers are eligible for variable compensation under a bonus plan for meeting company—wide objectives and for their individual contribution to the Company’s results and objectives. The annual bonus plan provides for a range of bonus amounts according to seniority level. The bonuses eventually paid to executives consist of a certain number of gross monthly salaries.
The amount set aside or accrued by the Company to provide severance indemnity to its Executive Officers amounts to Ch$ 482 million, of which Ch$ 66 million was accrued during 2010. There are no other amounts set aside or accrued to provide for pension, retirement or similar benefits for our Executive Officers.
All of our Executive Officers have severance indemnity agreements with the Company in the event of voluntary resignation, mutual agreement among the parties, or death. They do not have a right to severance indemnity if their relationship with the Company is terminated due to willful misconduct, prohibited negotiations, unjustified absences, abandonment of duties, among other causes, as defined in article 160 of the Chilean Code of Labor. All of the Company’s employees are entitled to legal severance pay if dismissed due to the needs of the Company, as defined in article 161 of the Chilean Labor Code.
C. Board Practices.
The Board of Directors as of December 31, 2010 was elected at the OSM of April 22, 2010, and the term for this Board of Directors will expire in April 2013. For information as to the years in which each director began his service at the board, please see “Item 6. Directors, Senior Management and Employees — A. Directors and Senior Management” above. The members of the Board of Directors do not have service contracts with Enersis or any of its subsidiaries that provide benefits upon termination of employment.
Corporate Governance
Enersis is managed by its Board of Directors which, in accordance with its bylaws, consists of seven directors who are elected at an OSM. Each director serves for a three—year term and the term of each of the seven directors expires on the same day. The directors can be reelected indefinitely. Staggered terms are not permitted under Chilean law. If a vacancy occurs on the board during the three—year term, the Board of Directors may appoint a temporary director to fill the vacancy. Any vacancy will trigger an election for every seat on the Board of Directors at the next OSM.
Chilean corporate law provides that a company’s board of directors is responsible for the management, administration and representation of a company in all matters concerning its corporate purpose, subject to the provisions of the company’s bylaws and the stockholders’ resolutions. In addition to the bylaws, the Enersis Board of Directors has adopted regulations and policies that guide our corporate governance principles.
The Charter Governing Executives, approved by our Board on May 28, 2003, and the Employee Code of Conduct, explain our principles and ethical values, establish the rules governing our contact with customers and suppliers, and establish the principles that should be followed by employees, including ethical conduct, professionalism and confidentiality. They also impose limitations on the activities that our executives and other employees may undertake outside the scope of their employment with us.
In order to ensure compliance with Securities Market Law 18,045 and SVS regulations, our Board of Directors at its meeting held on May 28, 2008, approved the “Manual for the Management of Information of Interest to the Market,” (“Manual”). This document addresses applicable standards regarding the information of transactions of the Company’s securities or those of its affiliates by directors, management, principal executives, employees and other related parties; existence of blackout periods for such transactions by directors, principal executives and other related parties; existence of mechanisms for the continuous disclosure of information that is of interest to the market; and mechanisms that provide protection for confidential information. The Manual was released to the market on May 30, 2008 and posted on the company’s website at www.enersis.cl. In February 2010, the Manual was modified in order to comply with the provisions of Law No. 20,382 (Corporate Governance Improvement Law).
The provisions of this Manual shall be applied to the members of our Board, as well as Enersis executives and employees who have access to privileged information, and especially those who work in areas related to the securities markets.
In order to supplement the aforementioned corporate governance regulations, the Company’s Board, at its meeting held on June 24, 2010 approved a Code of Ethics and a Zero Tolerance anti—Corruption Plan (“ZTAC Plan”). The Code of Ethics is structured on the basis of general principles such as impartiality, honesty, integrity and others of similar importance, which are implied in the behavior criteria detailed in the document. The ZTAC Plan reinforces the principles included in the Code of Ethics, but with special emphasis on avoiding corruption in the form of bribes, preferential treatment and other similar matters.
Given that the provisions of the Manual were included in the “Internal Regulations on Conduct in the Securities Markets”, approved by our Board on January 31, 2002, the Board revoked this latter document in June 2010.
At its meeting of March 29, 2011 Enersis’ Board approved the Prevention Model required by Law 20,393 of December 2, 2009, which imposes criminal responsibility on legal entities for the crimes of asset laundering, financing of terrorism and bribing of Chilean or foreign public officials. The law encourages companies to adopt this model, whose implementation involves compliance with duties of direction and supervision. The adoption of this model therefore reduces, and in some cases relieves, the effects of criminal responsibility even when a crime is committed. One of the elements of this model is the Prevention Officer which was appointed by the Board at its meeting held on October 27, 2010. As of December 31, 2010, the Prevention Officer was Alba Marina Urrea, Auditing Officer.
On October 27, 2010, the Board approved “GUIDELINES 231 Guidelines applicable to non—Italian subsidiaries in accordance with Legislative Decree 231 of June 8, 2001. Application to Endesa and its Group”. Given that Enersis’ parent company, Enel S.p.A. has to comply with Legislative Decree 231, which establishes management responsibility for Italian companies as a consequence of certain crimes committed in Italy or abroad, in the name of or for the benefit of such entities, including those crimes contemplated in Chilean Law 20,393, this document, approved by the Board, sets a group of measures, with standards of behavior expected from all employees, advisers, auditors, officials, directors as well as consultants, contractors, commercial partners, agents and suppliers.
Decree 231 includes various activities of a preventive nature that are coherent with and integral to the requirements and compliance with Chilean Law 20,393, which deals with the criminal responsibility of legal entities. All of the above is supplementary to the behavioral regulations included in the Code of Ethics and ZTAC Plan.
Compliance with NYSE Listing Standards on Corporate Governance
The following is a summary of the significant differences between our corporate governance practices and those applicable to domestic issuers under the corporate governance rules of the New York Stock Exchange (“NYSE”).
Independence and Functions of the Audit Committee
Under the NYSE corporate governance rules, all members of the Audit Committee must be independent. We have been subject to this requirement since July 31, 2005.
On April 22, 2010, at an Extraordinary Shareholders’ Meeting or ESM, the Company’s bylaws were amended and the Audit Committee was merged with the Directors’ Committee. According to the Company’s bylaws all of the members of this Committee must satisfy the requirements of independence as stipulated by the NYSE. Also, Chilean Law requires that the majority of the Directors’ Committee (at least two out of three members) be independent directors, According to Chilean Law a member would not be considered independent if, at any time, within the last 18 months he or she: (i) maintained any relationship of a relevant nature and amount with the company, with other companies of the same group, with its controlling shareholder or with the principal officers of any of them or has been a director, manager, administrator or officer of any of them; (ii) maintained a family relationship with any of the members described in (i) above; (iii) has been a director, manager, administrator or principal officer of a non—profit organizations that have received contributions from (i) above; (iv) has been a partner or a shareholder that has controlled, directly or indirectly, 10% or more of the capital stock or has been a director, manager, administrator or principal officer of an entity that has provided consulting or legal services for a relevant consideration or external audit services to the persons listed in (i) above; and (v) has been a partner or a shareholder that has controlled, directly or indirectly, 10% or more of the capital stock or has been a director, manager, administrator or principal officer of the principal competitors, suppliers or clients. In case there are not sufficient independent directors on the Board to serve on the committee, Chilean Law determines that the independent director nominates the rest of the members of the committee among the rest of the Board members that do not meet the Chilean law independence requirements. Chilean Law also requires that all publicly held limited liability stock companies that have a market capitalization of at least UF 1,500,000 (approximately US$ 69 million as of December 31, 2010) and at least 12.5% of its voting shares are held by shareholders that individually control or own less than 10% of such shares, must have at least one independent director and a Directors’ Committee.
Under the NYSE corporate governance rules, the Audit Committee of a U.S. company must perform the functions detailed in, and otherwise comply with the requirements of NYSE Listed Company Manual Rules 303A.06 and 303A.07. Non—U.S. companies have been required to comply with Rule 303A.06 beginning July 31, 2005 but are not required to comply with Rule 303A.07. Since July 31, 2005, we have complied with the independence and the functional requirements of Rule 303A.06. As required by the Sarbanes—Oxley Act (“SOX”) and the NYSE corporate governance rules, on June 29, 2005, Enersis’ Board of Directors created an Audit Committee, composed of three directors who were also members of the Board. As previously mentioned, this Audit Committee was merged into the Directors’ Committee in April 2010. As required by the company’s bylaws, the members of Directors’ Committee-composed of three members of the Board-should comply with Chilean law, as well as with the criteria and requirements of independence prescribed by the SOX, SEC and NYSE.
As of December 31, 2010, our Directors’ Committee was composed of three independent directors, all of whom met both the independence criteria of Chilean law and NYSE.
Our Directors’ Committee performs the following functions:
· examination of Financial Statements and the Reports of the External Auditors, prior to their submission to shareholders’ approval;
· formulation of the proposal to the Board of Directors for the selection of external auditors and private rating agencies;
· examination of information related to operations by the Company with related parties and/or related to operations in which the Company’s Board members or relevant executive officers, their spouses or relatives, and/or legal entities in which Board members or relevant executive officers have worked in the last 18 months, either directly or indirectly;
· examination of the compensation framework and plans for managers, executive officers and employees;
· preparation of an Annual Management Report, including its main recommendations to shareholders;
· information to the Board of Directors about the convenience of recruiting external auditors to provide non-auditing services, when such services are not prohibited by law, depending on whether such services might affect the external auditors’ independence;
· oversight of the work of external auditors;
· review and approval of the annual auditing plan by the external auditors;
· evaluation of qualifications, independence and quality of the auditing services;
· elaboration of policies regarding employment of former members of the external auditing firm;
· review and discussion of problems or disagreements between management and external auditors regarding the auditing process;
· establishment of procedures for receiving and dealing with complaints regarding accounting, internal control and auditing matters;
· any other function mandated to the committee by the bylaws, the Board of Directors or the Shareholders of the Company.
As of December 31, 2010, Messrs. Leonidas Vial, Rafael Fernández and Hernán Somerville (Chairman) were members of this committee, all of whom satisfied the requirements of independence of the NYSE.
Corporate Governance Guidelines
The NYSE’s corporate governance rules require U.S.—listed companies to adopt and disclose corporate governance guidelines. Although Chilean law does not contemplate this practice (except for the Manual), the Company has adopted the codes of conduct described above, and at its ESM held in March 2006, approved the inclusion of articles in its bylaws that govern the creation, composition, attributions, functions and compensation of the Directors’ Committee and the Audit Committee.
In order to comply with the new requirements of Law 20,382, which amended the Chilean Companies Act, at the ESM of April 22, 2010, the shareholders of the Company approved amendments to the Company’s bylaws, including amendments providing for the merger of the Directors’ and Audit Committees. The new Directors’ Committee is composed of three members that comply with the independence requirements of the Sarbanes—Oxley Act and the NYSE corporate governance rules. The members of this merged committee are Messrs. Hernán Somerville S., Leonidas Vial E. and Rafael Fernández M. Such committee includes among its functions the duties previously performed by the Audit Committee.
D. Employees.
The following table provides the total number of full time employees at the Company and its subsidiaries for the past three fiscal years:
Company |
| 2008 |
| 2009 |
| 2010 |
|
In Argentina |
|
|
|
|
|
|
|
Endesa Costanera |
| 274 |
| 281 |
| 354 |
|
El Chocón |
| 51 |
| 51 |
| 50 |
|
Edesur |
| 2,577 |
| 2,606 |
| 2,611 |
|
Other businesses (1) |
| 177 |
| 151 |
| 100 |
|
Total full time personnel in Argentina |
| 3,079 |
| 3,089 |
| 3,115 |
|
|
|
|
|
|
|
|
|
In Brazil |
|
|
|
|
|
|
|
Cachoeira Dourada |
| 63 |
| 66 |
| 65 |
|
Endesa Fortaleza |
| 62 |
| 69 |
| 63 |
|
CIEN (2) |
| 66 |
| 63 |
| 64 |
|
Ampla (3) |
| 1,296 |
| 1,233 |
| 1,224 |
|
Coelce |
| 1,190 |
| 1,201 |
| 1,290 |
|
Endesa Brasil |
| 37 |
| 41 |
| 40 |
|
Other businesses (1) |
| 409 |
| 233 |
| 170 |
|
Total full time personnel in Brazil |
| 3,123 |
| 2,906 |
| 2,916 |
|
|
|
|
|
|
|
|
|
In Chile |
|
|
|
|
|
|
|
Endesa Chile |
| 554 |
| 595 |
| 599 |
|
Pehuenche |
| 3 |
| 3 |
| 3 |
|
Celta |
| 1 |
| 1 |
| 1 |
|
Ingendesa (4) |
| 418 |
| 417 |
| 400 |
|
Túnel El Melón |
| 24 |
| 16 |
| 16 |
|
GasAtacama (5) |
| 92 |
| 96 |
| 94 |
|
Hidroaysén (5) |
| 26 |
| 29 |
| 24 |
|
Consorcio Ara—Ingendesa (5) |
| 5 |
| 15 |
| 14 |
|
Enersis |
| 232 |
| 301 |
| 303 |
|
Chilectra (6) |
| 717 |
| 731 |
| 719 |
|
ICT Servicios Informáticos |
| — |
| — |
| 100 |
|
Other businesses (7) |
| 965 |
| 851 |
| 654 |
|
Total full time personnel in Chile |
| 3,037 |
| 3,055 |
| 2,927 |
|
|
|
|
|
|
|
|
|
In Colombia |
|
|
|
|
|
|
|
Emgesa |
| 404 |
| 415 |
| 430 |
|
Codensa |
| 923 |
| 896 |
| 966 |
|
DECA (5) |
| 0 |
| 119 |
| 115 |
|
Other businesses(1) |
| 287 |
| 208 |
| 133 |
|
Total full time personnel in Colombia |
| 1,614 |
| 1,638 |
| 1,644 |
|
|
|
|
|
|
|
|
|
In Peru |
|
|
|
|
|
|
|
Edegel |
| 219 |
| 224 |
| 228 |
|
Edelnor |
| 542 |
| 577 |
| 525 |
|
Other businesses(1) |
| 198 |
| 134 |
| 115 |
|
Total full time personnel in Peru |
| 959 |
| 935 |
| 868 |
|
|
|
|
|
|
|
|
|
Total full time personnel of Enersis and Subsidiaries |
| 11,812 |
| 11,623 |
| 11,470 |
|
(1) Includes CAM and Synapsis.
(2) Includes 5 employees of TESA and CTM who work in Argentina.
(3) Includes EN—Brasil Comercio e Servicios S.A.
(4) Includes 5 employees of Ingendesa Brasil who work in Brasil.
(5) Jointly controlled companies; includes personnel on a proportional basis.
(6) Includes Luz Andes S.A. and Empresa Eléctrica de Colina S.A.
(7) Includes CAM, Synapsis and IMV.
The following table provides the total number of temporary employees at the Company and its subsidiaries for the past three fiscal years:
Company |
| 2008 |
| 2009 |
| 2010 |
| Average 2010 |
|
In Argentina |
|
|
|
|
|
|
|
|
|
Endesa Costanera |
| — |
| — |
| 22 |
| 15 |
|
El Chocón |
| — |
| — |
| — |
| — |
|
Edesur |
| 13 |
| 22 |
| 16 |
| 16 |
|
Other businesses (1) |
| 1 |
| 1 |
| 1 |
| 1 |
|
Total temporary personnel in Argentina |
| 14 |
| 23 |
| 39 |
| 32 |
|
|
|
|
|
|
|
|
|
|
|
In Brazil |
|
|
|
|
|
|
|
|
|
Cachoeira Dourada |
| — |
| — |
| — |
| — |
|
Endesa Fortaleza |
| 1 |
| 1 |
| — |
| — |
|
CIEN (2) |
| 1 |
| 1 |
| 1 |
| 1 |
|
Ampla (3) |
| 2 |
| 2 |
| — |
| 0 |
|
Coelce |
| 88 |
| 97 |
| 18 |
| 13 |
|
Endesa Brasil |
| — |
| — |
| — |
| — |
|
Other businesses (1) |
| 78 |
| 17 |
| 11 |
| 10 |
|
Total temporary personnel in Brazil |
| 170 |
| 118 |
| 30 |
| 24 |
|
|
|
|
|
|
|
|
|
|
|
In Chile |
|
|
|
|
|
|
|
|
|
Endesa Chile |
| 5 |
| 3 |
| 4 |
| 2 |
|
Pehuenche |
| — |
| — |
| — |
| — |
|
Celta |
| — |
| — |
| — |
| — |
|
Ingendesa (4) |
| 301 |
| 170 |
| 103 |
| 119 |
|
Túnel El Melón |
| 1 |
| — |
| — |
| — |
|
Gasatacama (5) |
| — |
| — |
| — |
| — |
|
Hidroaysén (5) |
| — |
| — |
| — |
| — |
|
Consorcio Ara—Ingendesa (5) |
| — |
| — |
| — |
| — |
|
Enersis |
| — |
| — |
| 6 |
| 1 |
|
Chilectra (6) |
| — |
| — |
| — |
| — |
|
ICT Servicios Informáticos |
| — |
| — |
| — |
| — |
|
Other businesses (7) |
| 9 |
| 5 |
| 14 |
| 15 |
|
Total temporary personnel in Chile |
| 316 |
| 178 |
| 127 |
| 137 |
|
|
|
|
|
|
|
|
|
|
|
In Colombia |
|
|
|
|
|
|
|
|
|
Emgesa |
| — |
| — |
| 14 |
| 2 |
|
Codensa |
| 9 |
| 2 |
| 2 |
| 2 |
|
DECA (5) |
| — |
| — |
| — |
| — |
|
Other businesses(1) |
| 143 |
| 276 |
| 311 |
| 272 |
|
Total temporary personnel in Colombia |
| 152 |
| 278 |
| 327 |
| 276 |
|
|
|
|
|
|
|
|
|
|
|
In Peru |
|
|
|
|
|
|
|
|
|
Edegel |
| 23 |
| 15 |
| 16 |
| 11 |
|
Edelnor |
| 29 |
| 18 |
| 28 |
| 20 |
|
Other businesses(1) |
| 218 |
| 217 |
| 227 |
| 201 |
|
Total temporary personnel in Peru |
| 270 |
| 250 |
| 271 |
| 232 |
|
|
|
|
|
|
|
|
|
|
|
Total temporary personnel of Enersis and Subsidiaries |
| 922 |
| 847 |
| 794 |
| 701 |
|
(1) Includes CAM and Synapsis.
(2) Includes TESA and CTM.
(3) Includes EN—Brasil Comercio e Servicios S.A.
(4) Includes Ingendesa Brasil.
(5) Jointly controlled companies; includes personnel on a proportional basis.
(6) Includes Luz Andes S.A. and Empresa Eléctrica de Colina S.A.
(7) Includes CAM, Synapsis and IMV.
Chile
All Chilean employees who are dismissed for reasons other than misconduct are entitled by law to a severance payment. According to Chilean law, permanent employees are entitled to a basic payment of one-month’s salary for each year (or a six-month portion thereof) worked, subject to a limit of a total payment of no more than 11 months’ pay for employees hired after August 14, 1981. Severance payments to employees hired prior to that date consist of one-month’s salary for each full year worked, not subject to any limitation on the total amount payable. The Company voluntarily makes severance payments above the limits established by Chilean law. In addition, under Endesa Chile’s collective bargaining agreements, Endesa Chile is obligated to make severance payments to all covered employees in cases of voluntary resignation or death in specified amounts that increase according to seniority.
During 2007, we entered into two collective agreements with our employees, which expire in 2011. In Endesa Chile, there are six worker unions, one of which was created in 2008. In 2008, this new union signed a collective bargaining agreement that expires in June 2011. On that same year, Endesa Chile signed three other collective agreements, two of which will expire in December 2011 and one in June 2012. Finally, during 2009, it entered into two collective bargaining agreements with its employees, which expire in 2011. Five collective bargaining agreements with Chilectra employees took effect in December 2008 and expire in December 2012. In Cam, a collective agreement expired in December 2010. Additionally, three other agreements have been signed, pending ratification by the new owners. Synapsis entered into a new collective bargaining agreement with its employees, expiring in August 2012. At Ingendesa, there are three worker unions with a collective bargaining agreement expiring in December 2011.
Argentina
In Edesur, we have proceeded to agree on two collective agreements in 2010 whose term will end on March 31, 2014. There are three other collective agreements in which the extension was agreed to in order to wait for the results of the negotiations and agreements of other distribution companies.
Brazil
In Brazil there are twelve collective agreements, of which five were negotiated in 2010 (as in the case of Chile, the two CAM Brazil agreements are awaiting for ratification by the new owner). In 2011, we will negotiate three agreements in Ampla, two in Cien, one in Cachoeira and one Endesa Fortaleza. Under Brazilian law, collective bargaining Agreements cannot last for more than two years.
Colombia
During 2010, there were three collective agreements that were negotiated without having reached an agreement; one with Emgesa, one with Codensa and one with EEC. We expect to sign these collective agreements in 2011.
Peru
Two collective bargaining agreements are still in force. During 2009, Edelnor signed four new collective bargaining agreements, which will expire in December 2012. On the other hand, Edegel signed one new agreement, which expires in 2013. In 2010, we also negotiated two bargaining agreements with subsidiaries of CAM and Synapsis.
E. Share Ownership.
To the best of the Company’s knowledge, none of Enersis’ directors or officers own more than 0.1% of the shares of the Company. None of Enersis’ directors and officers has any stock options. It is not possible to confirm whether any of our directors or officers have a beneficial, rather than direct, interest in the shares of Enersis. To the best of our knowledge, any share ownership by all of the directors and officers of Enersis, in the aggregate, amount to significantly less than 10% of our outstanding shares.
Item 7. Major Shareholders and Related Party Transactions
A. Major Shareholders.
Enersis’ only outstanding voting securities are shares of common stock. Endesa Spain, our major shareholder through Endesa Latinoamérica, has no different voting rights than Enersis’ other shareholders. As of March 31, 2011, our 32,651,166,465 shares of common stock outstanding were held by 7,605 stockholders of record. There were seven record holders in the United States as of such date.
It is not practicable for us to determine the number of ADS or common shares beneficially owned in the United States, as we are not able to ascertain the domicile of the final beneficial holders represented by the seven official ADR record holders in the United States of America. Likewise, we cannot readily determine the domicile of any of our foreign stockholders who hold our common stock, either directly or indirectly.
As of March 31, 2011, Endesa Spain beneficially owns 60.6% of the shares of Enersis. Chilean private pension funds, Administradora de Fondos de Pensiones, or AFPs, own 13.5% in the aggregate. Chilean stockbrokers, mutual funds, insurance companies, foreign equity funds, and other Chilean institutional investors collectively own 8.5 % of our equity. ADR holders own 12.8% of the equity. The remaining 4.6% is held by 7,460 other minority shareholders.
The following table sets forth certain information concerning ownership of the common stock as of March 31, 2011 with respect to each stockholder known to us to own more than 5% of the outstanding shares of common stock:
|
| Number of |
| Percentage |
|
Endesa Spain (1) |
| 19,794,583,473 |
| 60.6 | % |
(1) Endesa Spain’s 60.6% interest is held through Endesa Latinoamérica.
Since June 25, 2009, Enel has been the ultimate controlling shareholder of Enersis by virtue of its 92.1% shareholding in Endesa Spain. Enel is a publicly-traded company headquartered in Italy, primarily engaged in the energy sector, with presence in 40 countries over 4 continents, and has around 95,000 MW of net installed capacity. It provides service to more than 61 million clients through its electricity and gas businesses.
B. Related Party Transactions.
Article 146 of Law 18,046 ( the “Chilean Companies Act”) defines related—party transactions as all operations involving the company and any entity belonging to the corporate group, its parent companies, controlling companies, subsidiaries or related companies, board members, managers, administrators, senior officers or company liquidators, including their spouses, some of their relatives and all entities controlled by them, in addition to individuals who may appoint at least one member of the company’s directors or who control 10% or more of voting capital, or companies in which a board member, manager, administrator, senior officer or company liquidator have been serving in the same position within the last 18 months. The law establishes that in the event that these persons fulfill the requirements established by Article 146, such persons must immediately inform the Board of Directors of their related—party nature or such other group as the Board may appoint for that purpose. As required by law, “related—party transactions” must comply with corporate interests, as well as prices, terms and conditions prevailing in the market at the time of their approval. They must also meet all legal requirements, including board acknowledgement and approval of the transaction (excluding the affected directors), approval by the ESM (in some cases, with requisite majority approval) and be approved pursuant to regulatory procedures.
The aforementioned law, which also applies to Enersis’ affiliates, also provides for some exceptions, stating that in certain cases, Board approval would suffice for “related—party transactions”, pursuant to certain related—party transaction thresholds and when such transactions are conducted in compliance with the related—party policies defined by the company’s board. At its meetings held on December 17, 2009 and April 23, 2010, Enersis’ Board of Directors approved a related—party policy (política de habitualidad) effective as of January 1, 2010. This policy is available on the company’s website.
If an operation is not in compliance with Article 146, this would not affect the operation’s validity, but the company or shareholders may demand compensation from the individual associated with the infringement as provided under law, and to reparation for damages. It is our policy that all cash inflows and outflows of our Chilean subsidiaries be managed through our centralized cash management policy. It is a common practice in Chile to transfer surplus funds from one company to another affiliate that has a cash deficit. These operations are carried out through either short—term loans or through structured inter—company loans. Under Chilean laws and regulations, such transactions must be carried out on an arm’s—length basis. Our centralized cash management is more efficient for both financial and tax reasons. All of these operations are subject to the supervision of our Directors’ Committee. As of December 2010, these operations were priced at TIP (Chilean variable interest rate) + 0.43% per month.
In other countries in which we do business, these inter—company transactions are permitted, but they have adverse tax consequences. Accordingly, we do not similarly manage the cash flows of our non—Chilean subsidiaries.
Enersis has also made structured loans to its Chilean subsidiaries at the same cost of funds for Enersis, primarily to finance foreign investments. As of December 31, 2010, the outstanding net balance for such loans was $ 313 million, and the largest amount outstanding during 2010 and 2009 was $ 335 million and $ 504 million, respectively. Additionally, there were no outstanding loans granted by Enersis to its foreign subsidiaries as of December 31, 2010.
The currency denomination of the structured loans granted by Enersis to its Chilean subsidiaries as of December 31, 2010 is the U.S. dollar. The interest rate on these intercompany loans to Enersis’ Chilean subsidiaries ranges from LIBOR plus 0.49% to LIBOR plus 6.19%, with a nominal weighted average interest rate as of December 31, 2010 of approximately LIBOR plus 3.1%.
Endesa Chile has also made structured loans to its related parties in Chile, primarily to finance projects and to refinance existing indebtedness. As of December 31, 2010, the outstanding net balance for such loans was $ 75 million. The largest amount outstanding during 2010 and 2009 was $ 256 million and $ 313 million respectively. Endesa Chile has only one outstanding loan granted to a foreign subsidiary, Endesa Costanera. The outstanding net balance of this loan was $ 7.1 million as of December 31, 2010. The largest net amount outstanding during 2010 and 2009 for such loan was $ 7.1 million.
The interest rates on these intercompany loans to Endesa—Chile’s Chilean subsidiaries range from LIBOR plus 0.75% to LIBOR plus 7.15%, with a nominal weighted average interest rate as of December 31, 2010 of approximately LIBOR plus 7.0%. The interest rate on the intercompany loan to Endesa—Chile’s foreign subsidiaries was LIBOR plus 5.5% as of December 2010.
As of the date of this report, the above—mentioned transactions have not experienced material changes. For more information regarding transactions with related parties, refer to Note 8 of our Consolidated Financial Statements.
C. Interests of Experts and Counsel.
Not applicable.
Consolidated Statements and Other Financial Information.
See “Item 18. Financial Statements” for our Consolidated Financial Statements.
Legal Proceedings
We and our subsidiaries are parties to legal proceedings arising in the ordinary course of business. Management considers that it is unlikely that any loss associated with pending lawsuits will significantly affect the normal development of our business.
For detailed information as of December 31, 2010 on the status of the material pending lawsuits that have been filed against the Company or its subsidiaries, please refer to Note 22.2 of our Consolidated Financial Statements. In 2009, in relation to the legal proceedings reported in the Notes to the Consolidated Financial Statements, the Company decided to use the criteria of disclosing lawsuits above a minimum threshold of $ 20 million of potential impact to Enersis, and, in some cases, qualitative criteria according to the materiality of the impact in the conduct of our business.
The lawsuits status includes a general description, the process status and the estimate of the amount involved in each lawsuit.
Dividend Policy
The Board generally establishes a definitive dividend payable each year, and attributable to the prior year, which cannot be less than the legal minimum of 30% of annual net income before negative goodwill amortization. As agreed at a meeting held on February 28, 2011, the Board of Directors proposed to the OSM held on April 26, 2011 the payment of a definitive dividend of Ch$ 7.44578 per share for fiscal year 2010, equivalent to a payout ratio of 50% (based on annual net income before negative goodwill amortization). The provisional dividend of Ch $ 1.57180 per share paid in January 2011 was deducted from the definitive dividend to be paid on May 12, 2011, as agreed by the OSM.
The Board of Directors also approved a dividend policy for fiscal year 2011, according to which a provisional dividend will be paid to stockholders equal to 15% of the net income accumulated through September 30, 2011. The Board of Directors will propose a definitive dividend payout equal to 55% of the annual net income for fiscal year 2011. Actual dividend payments will be subject to net profits obtained in each period, as well as to expectations of future profit levels and other conditions that may exist at the time of such dividend declaration. The fulfillment of the aforementioned dividend policy will depend on actual 2011 net income. The proposed dividend policy is subject to the Board of Director’s prerogative to change the amount and timing of the dividend under the circumstances at the time of the payment.
Currently, there are no restrictions on the ability of Enersis or any of its subsidiaries to pay dividends, other than certain legal restriction of limiting the amount of dividend distributions and in the event of specific circumstances under certain credit agreements, such as: Endesa Costanera, El Chocón, CIEN and Endesa Fortaleza may not pay dividends unless it complies with certain financial covenants. In general terms, companies may not pay dividends in case of default on credit agreements. (See “Item 5. Operating and Financial Review and Prospects — B. Liquidity and capital resources” for further detail on Enersis debt instruments).
Stockholders set dividend policies at each subsidiary and affiliate. There are currently no material currency controls which prohibit Enersis from repatriating the dividend payments from its non—Chilean principal subsidiaries and affiliates.
The Company pays dividends to shareholders with a record date of five business days before the payment date. Holders of ADS on the applicable record dates will be entitled to participate in all future dividends.
Dividends
The table below sets forth, for each of the years indicated, the per share amounts of dividends distributed by the Company and the amount of dividends distributed per 50 common shares (one ADS represents 50 common shares) in dollars. See “Item 10. Additional Information — D. Exchange Controls.”
Year |
| Nominal |
| $ per |
|
|
|
|
|
|
|
2006 |
| 2.11 |
| 0.17 |
|
2007 |
| 5.42 |
| 0.43 |
|
2008 |
| 4.95 |
| 0.39 |
|
2009 |
| 7.02 |
| 0.69 |
|
2010 |
| 4.64 |
| 0.50 |
|
(1) Amounts shown are in historical pesos and reflect all the dividends paid in a given year, and not the dividends accrued on that year. These dividends may have been accrued the prior year or the same year in which they were paid. These amounts do no reflect reduction for any applicable Chilean withholding tax.
(2) The dollar per ADS amount has been calculated by applying the Observed Exchange Rate as of December 31 of each year, to the peso amount. One ADS represents 50 common shares.
For a discussion of Chilean withholding taxes and access to the formal currency market in Chile in connection with the payment of dividends and sales of ADS and the underlying Common Stock, see “Item 10. Additional Information — E. Taxation” and “Item 10. Additional Information — D. Exchange Controls.”
B. Significant Changes.
None.
A. Offer and Listing Details.
Market Price and Volume Information
The shares of our common stock currently trade on Chilean, United States and Spanish exchanges. Transactions in Chile take place on three exchanges: the Santiago Stock Exchange, the Electronic Stock Exchange and the Valparaíso Stock Exchange.
Shares of our common stock have traded in the United States on the New York Stock Exchange (NYSE) since October 19, 1993 in the form of ADS, under the ticker symbol “ENI.” Each ADS represents 50 shares of common stock, with the ADS in turn evidenced by American Depositary Receipts (ADRs). The ADRs are outstanding under the Second Amended and Restated Deposit Agreement dated as of September 30, 2010 among us, Citibank, N.A., as Depositary, and the holders from time to time of ADRs issued thereunder. Only persons in whose names ADRs are registered on the books of the Depositary are treated by the Depositary as owners of ADRs.
As of March 31, 2011, there were 83,521,058 ADS (equivalent to 4,176,052,900 common shares) outstanding of Enersis, representing 12.8% of the total number of outstanding shares. It is not practicable for us to determine the proportion of ADS beneficially owned by U.S. final beneficial holders.
During 2010, volume traded on the Santiago Stock Exchange amounted to 5,319,468,919 shares.
The table below shows, for the periods indicated, high and low closing prices in pesos for the Shares on the Santiago Stock Exchange and high and low closing prices of the ADS in dollars as reported by the NYSE.
|
| Chilean Pesos Per share(1) |
| U.S.$ per ADS(2) |
| ||||
|
| High |
| Low |
| High |
| Low |
|
2011 |
|
|
|
|
|
|
|
|
|
April |
| 204.63 |
| 192.00 |
| 21 2/3 |
| 20 1/3 |
|
March |
| 201.50 |
| 182.00 |
| 21 |
| 18 7/8 |
|
February |
| 204.00 |
| 180.00 |
| 21 1/5 |
| 19 |
|
January |
| 221.10 |
| 200.00 |
| 23 2/5 |
| 20 1/2 |
|
1st quarter |
| 221.10 |
| 180.00 |
| 23 2/5 |
| 18 7/8 |
|
|
|
|
|
|
|
|
|
|
|
2010 |
| 244.00 |
| 195.00 |
| 25 3/8 |
| 17 7/9 |
|
December |
| 244.00 |
| 213.02 |
| 24 1/3 |
| 22 4/9 |
|
November |
| 244.00 |
| 222.00 |
| 25 3/8 |
| 22 6/7 |
|
4th quarter |
| 244.00 |
| 213.02 |
| 25 3/8 |
| 22 4/9 |
|
3rd quarter |
| 239.11 |
| 212.00 |
| 24 1/7 |
| 19 5/8 |
|
2nd quarter |
| 223.00 |
| 195.00 |
| 21 |
| 17 7/9 |
|
1st quarter |
| 245.00 |
| 207.99 |
| 23 7/8 |
| 19 1/3 |
|
|
|
|
|
|
|
|
|
|
|
2009 |
| 231.50 |
| 162.50 |
| 23 |
| 12 3/4 |
|
4th quarter |
| 231.50 |
| 181.00 |
| 23 |
| 17 1/5 |
|
3rd quarter |
| 208.50 |
| 189.50 |
| 19 3/5 |
| 17 |
|
2nd quarter |
| 199.00 |
| 169.00 |
| 18 1/2 |
| 14 1/3 |
|
1st quarter |
| 188.71 |
| 162.50 |
| 16 1/6 |
| 12 3/4 |
|
|
|
|
|
|
|
|
|
|
|
2008 |
| 194.80 |
| 110.00 |
| 20 1/4 |
| 10 1/8 |
|
|
|
|
|
|
|
|
|
|
|
2007 |
| 215.00 |
| 157.00 |
| 20 1/2 |
| 14 1/3 |
|
|
|
|
|
|
|
|
|
|
|
2006 |
| 173.00 |
| 108.50 |
| 16 2/5 |
| 10 1/7 |
|
(1) As reported by the Santiago Stock Exchange. Pesos per share reflect the nominal price as of the trade date.
(2) As reported by the NYSE. One ADS = 50 shares of common stock.
B. Plan of Distribution.
Not applicable.
C. Markets.
In Chile, the Company’s stock is traded on three stock exchanges. The largest exchange in the country, the Santiago Stock Exchange, was established in 1893 as a private company. Its equity consists of 48 shares held by 45 stockholders as of the date of this report. As of December 31, 2010, 227 companies had shares listed on the Santiago Stock Exchange. For the year ended 2010, the Santiago Stock Exchange accounted for 89.3% of Enersis’ total equity traded in Chile. In addition, approximately 10.4% of Enersis’ equity trading was conducted on the Electronic Exchange, an electronic trading market that was created by banks and non—member brokerage houses, and 0.3% was traded on the Valparaíso Exchange.
Equities, closed—end funds, fixed—income securities, short—term and money market securities, gold and dollars are traded on the Santiago Stock Exchange. In 1990, the Santiago Stock Exchange initiated a futures market with two instruments, dollar futures and Selective Shares Price Index, or IPSA, futures. Securities are traded primarily through an open—voice auction system, a firm offer system and the daily auction. Trading through the open voice system occurs on each business day from 9:00 a.m. to 4:00 p.m., from April through October, and from 9:00 a.m. to 5:00 p.m. from November through March, Santiago time, which differs from New York City time by up to two hours, depending on the season. The Santiago Stock Exchange has an electronic trading system called Telepregón, which operates continuously from 9:30 a.m. to 4:00 p.m. from April through October, and from 9:00 a.m. to 5:00 p.m. from November through March on each business day. From April
through October, auctions may be conducted, three times a day, at 9:15 a.m., 12:30 p.m. and 3:45 p.m. From November through March, the 3:45 p.m. auction is held at 4:45 p.m. instead.
There are two share price indices on the Santiago Stock Exchange, the General Index, or IGPA, and the IPSA. The IPSA is calculated using the prices of the 40 shares with higher amounts traded, on a quarterly basis, and market capitalization above $ 200 million. The IGPA is calculated using the prices of shares that are traded at least 5% of the trading days of a year and with total annual transactions exceeding UF 10,000 ($ 0.5 million as of December 31, 2010). The shares included in the IPSA and IGPA are weighted according to the value of the shares traded. As of December 31, 2010, Enersis and Endesa Chile were included in the IPSA. Enersis has been included in the IPSA since the last quarter of 1988, while Endesa Chile has been included since its privatization in the 1980’s.
Shares of Enersis were first listed and began trading on the Bolsa de Valores Latinoamericanos de la Bolsa de Madrid, or Latibex, as of December 17, 2001. One trading unit is the equivalent of 50 common shares (the same unit conversion of 50:1 as an ADS) and the trading ticker symbol is “XENI.” Santander Investment S.A. acts as the liaison entity, and the Banco Santander—Chile as the Depositary in Chile. Trading of our shares on the Latibex amounted to approximately 0.45 million units in 2010, which in turn was equivalent to € 7.2 million. The stock closed at € 17.5 on the Latibex on the last day of trading in 2010.
For further information see “Item 9. The Offer and Listing — A. Offer and Listing Details — Market Price and Volume Information”.
D. Selling Shareholders.
Not applicable.
E. Dilution.
Not applicable.
F. Expense of the Issue.
Not applicable.
Item 10. Additional Information
A. Share Capital.
Not applicable.
B. Memorandum and Articles of Association.
Description of Share Capital
Set forth below is certain information concerning our share capital and a brief summary of certain significant provisions of our bylaws and Chilean law.
General
Shareholders’ rights in Chilean companies are governed by the company’s bylaws (estatutos), which serve the same purpose as the articles or certificate of incorporation and the bylaws of a company incorporated in the United States, and by Law 18,046 (the Chilean Companies Act). In addition, D.L. 3500, or the Pension Funds’ System Law, which permits the investment by Chilean pension funds in stock of qualified companies, indirectly affects corporate governance and prescribes certain rights of shareholders. In accordance with the Chilean Companies Act, legal actions by shareholders to enforce their rights as shareholders of the company must be brought in Chile in arbitration proceedings or, at the option of the plaintiff, before Chilean courts. Members of the board of directors, managers, officers and principal executives of the company, or shareholders that individually own shares with a book value or stock value higher that UF 5,000 ($ 229,221 as of December 31, 2010) do not have the option to bring the procedure to the courts.
The Chilean securities markets are principally regulated by the Superintendence of Securities and Insurance, or SVS, under Law 18,045 (the Securities Market Law) and the Chilean Companies Act. These two laws provide for disclosure requirements, restrictions on insider trading and price manipulation, and protection of minority shareholders. The Securities Market Law sets forth requirements for public offerings, stock exchanges and brokers, and outlines disclosure requirements for companies that issue publicly offered securities. The Chilean Companies Act and the Securities Market Law, both as amended, provide rules regarding takeovers, tender offers, transactions with related parties, qualified majorities, share repurchases, directors’ committee, independent directors, stock options and derivative actions.
Public Register
Enersis is a publicly held stock corporation incorporated under the laws of Chile. Enersis was constituted by public deed issued on June 19, 1981 by the Santiago Notary Public, Mr. Patricio Zaldívar M. Its existence was approved by SVS Resolution 409-S of July 17, 1981 and it was registered on July 21, 1981 in the Commercial Registrar (Registro de Comercio del Conservador de Bienes Raíces y Comercio de Santiago), on pages 13099 No. 7269. Enersis is registered with the SVS and its entry number is 0175. Enersis is also registered with the United States Securities and Exchange Commission.
Reporting Requirements Regarding Acquisition or Sale of Shares
Under Article 12 of the Securities Market Law and General Rule 269 of the SVS, certain information regarding transactions in shares of a publicly held stock corporation or in contracts or securities whose price or results depend on or are conditioned in whole or in part on the price of such shares must be reported to the SVS and the Chilean stock exchanges. Since ADS are deemed to represent the shares of common stock underlying the American Depositary Receipts (“ADRs”), transactions in ADRs will be subject to these reporting requirements and those established in Circular 1375 of the SVS. Shareholders of publicly held stock corporations are required to report to the SVS and the Chilean stock exchanges:
· any direct or indirect acquisition or sale of shares made by a holder who owns, directly or indirectly, at least 10% of a publicly held stock corporation’s subscribed capital;
· any direct or indirect acquisition or sale of contracts or securities whose price or results depend on or are conditioned in whole or in part on the price of shares, made by a holder who owns, directly or indirectly, at least 10% of a publicly held stock corporation’s subscribed capital;
· any direct or indirect acquisition or sale of shares made by a holder who, due to an acquisition of shares of such publicly held stock company, results in the holder acquiring, directly or indirectly, at least 10% of a publicly held stock company’s subscribed capital; and
· any direct or indirect acquisition or sale of shares in any amount, made by a director, receiver, principal executive, general manager or manager of a publicly held stock company.
In addition, majority shareholders of a publicly held stock corporation must inform the SVS and the Chilean stock exchanges if such transactions are entered into with the intention of acquiring control of the company or if they are making a passive financial investment instead.
Under Article 54 of the Securities Market Law and General Rule 104 enacted by the SVS, any person who directly or indirectly intends to take control of a publicly held stock corporation must disclose this intent to the market at least ten business days in advance of the proposed change of control and, in any event, as soon as the negotiations for the change of control have taken place or reserved information of the publicly held stock corporation has been provided.
Corporate Objectives and Purposes
Article 4 of our bylaws states that our corporate objectives and purposes are, among other things, to conduct the exploration, development, operation, generation, distribution, transmission, transformation, or sale of energy in any form, directly or through other companies, as well as to provide engineering-consultancy services related to these objectives, in Chile and abroad and to participate in the telecommunications business.
Board of Directors
Our Board of Directors is comprised of seven members who are appointed by shareholders at the OSM of the Company and are elected for a period of three years, at the end of which they will be re-elected or replaced.
The seven directors elected at the OSM are the seven individual nominees who receive the highest majority of the votes. Each shareholder may vote his shares in favor of one nominee or may apportion his shares among any number of nominees. The effect of these voting provisions is to ensure that a shareholder owning more than 12.5% of our shares is able to elect a member of the Board.
The compensation of the directors is set annually at the Ordinary Shareholders’ Meeting. See “Item 6. Directors, Senior Management and Employees — B. Compensation.”
Agreements entered into by Enersis with related parties can only be executed when such agreements serve the interest of the Company, and their price, terms and conditions are consistent with prevailing market conditions at the time of their approval and comply with all the requirements and procedures indicated in article 147 of the Chilean Companies Act.
Certain Powers of the Board of Directors
Our bylaws provide that every arrangement or contract that the Company enters into with its controlling shareholder, its directors or Executives, or with their related parties, must be previously approved by two thirds of the Board of Directors and be included in the Board meetings and must comply with the provisions of the Chilean Companies Act.
Our bylaws do not contain provisions relating to:
· the directors’ power, in the absence of an independent quorum, to vote on compensation for themselves or any members of their body;
· borrowing powers exercisable by the directors and how such borrowing powers can be varied;
· retirement or non-retirement of directors under an age limit requirement; or
· number of shares, if any, required for directors’ qualification.
Certain Provisions Regarding Shareholder Rights
As of the date of the filing of this report, Enersis’ capital is comprised of only one class of shares, all of which are ordinary shares and have the same rights.
Our bylaws do not contain any provisions relating to:
· redemption provisions;
· sinking funds; or
· liability for capital calls by the Company.
Under Chilean law, the rights of holders of stock of the Company may only be changed by an amendment to the bylaws that complies with the requirements explained below under “Item 10. Additional Information — B. Memorandum and Articles of Association. — Shareholders’ Meetings and Voting Rights.”
Capitalization
Under Chilean law, only the shareholders of a company acting at an ESM have the power to authorize a capital increase. When an investor subscribes for shares, these are officially issued and registered under his name, and the subscriber is treated as a shareholder for all purposes, except receipt of dividends and for return of capital in the event that the shares have been subscribed but not paid for. The subscriber becomes eligible to receive dividends only for the shares that he has actually paid for or, if he has paid for only a portion of such shares, the pro rata portion of the dividends declared with respect to such shares unless the company’s bylaws provide otherwise. If a subscriber does not fully pay for shares for which he has subscribed on or prior to the date agreed upon for payment, the company is entitled to auction the shares on the stock exchange where such shares are traded and has a cause of action against the subscriber for the difference between the
subscription price and the price actually received at auction, if any. However, until such shares are sold at auction, the subscriber continues to possess all the rights of a shareholder, except the right to receive dividends and return of capital. When there are authorized and issued shares for which full payment has not been made within the period fixed by shareholders at the same ESM at which the subscription was authorized (which in no case may exceed three years from the date of such meeting), the Board must proceed to collect payment, unless the shareholders’ meeting had authorized (by two thirds of the voting shares) to reduce the company’s capital to the amount effectively collected.
As of December 31, 2010, the subscribed and fully paid capital of the Company totaled Ch$ 2,825 billion and consisted of 32,651,166,465 shares.
Preemptive Rights and Increases of Share Capital
The Chilean Companies Act requires Chilean companies to grant shareholders preemptive rights to purchase a sufficient number of shares to maintain their existing ownership percentage of such company whenever such company issues new shares.
Under Chilean law, preemptive rights are exercisable or freely transferable by shareholders during a 30-day period following the day the capital increase is made public. During such 30-day period, and for an additional 30-day period immediately following the initial 30-day period, publicly held stock corporations are not permitted to offer any unsubscribed shares to third parties on terms which are more favorable than those offered to their shareholders. At the end of the second 30-day period, a Chilean publicly held stock corporation is authorized to sell non-subscribed shares to third parties on any terms, provided they are sold on one of the Chilean stock exchanges.
Shareholders’ Meetings and Voting Rights
An OSM must be held within the first four months following the end of our fiscal year. The last OSM was held on April 26, 2011. An ESM may be called by the board of directors when deemed appropriate, when requested by shareholders representing at least 10% of the issued shares with voting rights or by the SVS. To convene an OSM, or an ESM, notice must be given three times in a newspaper located in our corporate domicile. The newspaper designated by our shareholders is El Mercurio de Santiago. The first notice must be published not less than 15 days and no more than 20 days in advance of the scheduled meeting. Notice must also be mailed to each shareholder, to the SVS and to the Chilean stock exchanges.
Under Chilean law, a quorum for a shareholders’ meeting is established by the presence, in person or by proxy, of shareholders representing at least a majority of the issued shares with voting rights of a company. If a quorum is not present at the first meeting, a reconvened meeting can take place at which the shareholders present are deemed to constitute a quorum regardless of the percentage of the shares represented. The second meeting must take place within 45 days following the scheduled date for the first meeting. Shareholders’ meetings adopt resolutions by the affirmative vote of a majority of those shares present or represented at the meeting. An ESM must be called to take the following actions:
· a transformation of the company into a form other than a publicly held stock corporation under the Chilean Companies Act, a merger or split-up of the company;
· an amendment to the term of duration or early dissolution of the company;
· a change in the corporation’s domicile;
· a decrease of corporate capital;
· an approval of capital contributions in kind and non-monetary assessments;
· a modification of the authority reserved to shareholders or limitations on the board of directors;
· a reduction in the number of members of the board of directors;
· a disposition of 50% or more of the assets of the corporation, whether it includes disposition of liabilities or not, as well as the approval or the amendment of the business plan which contemplates the disposition of assets in an amount greater that such percentage.
· the disposition of 50% or more of the assets of a subsidiary, as long as such subsidiary represents at least 20% of the
assets of the corporation, as well as any disposition of its shares that results in the parent company losing its position as controller;
· the form of distributing corporate benefits;
· issue of guarantees for third-party liabilities which exceed 50% of the assets, except when the third party is a subsidiary of the company, in which case approval of the board of directors is deemed sufficient;
· the purchase of the corporation’s own shares;
· others established by the bylaws or the laws;
· certain remedies for the nullification of the corporate bylaws;
· inclusion in the bylaws of the right to purchase shares from minority shareholders, when the controlling shareholders reache 95% of the company’s shares by means of a tender offer for all of the company’s shares, where at least 15% of the shares have been acquired from unrelated shareholders;
· approval or ratification of acts or contracts with related parties.
Regardless of the quorum present, the vote required for any of the actions above is at least two-thirds of the outstanding shares with voting rights.
Bylaw amendments for the creation of a new class of shares, or an amendment to or an elimination of those classes of shares that already exist, must be approved by at least two-thirds of the outstanding shares of the affected series.
Chilean law does not require a publicly held stock corporation to provide its shareholders the same level and type of information required by the securities laws regarding the solicitation of proxies. However, shareholders are entitled to examine the books of a publicly held stock corporation within the 15-day period before its scheduled OSM. Under Chilean law, a notice of a shareholders meeting listing matters to be addressed at the meeting must be mailed at least 15 days prior to the date of such meeting, and, an indication of the way complete copies of the documents that support the matters submitted for voting can be obtained, which must also be made available to shareholders on the company’s website. In the case of an OSM, the annual report of the Company’s activities, which includes audited financial statements, must also be made available to shareholders and published on the Company’s website at: www.enersis.cl.
The Chilean Companies Act provides that, upon the request by the Directors’ Committee or by shareholders representing at least 10% of the issued shares with voting rights, a Chilean company’s annual report must include, in addition to the materials provided by the board of directors to shareholders, such shareholders’ comments and proposals in relation to the company’s affairs. Similarly, the Chilean Companies Act provides that whenever the board of directors of a publicly held stock corporation convenes an OSM and solicits proxies for the meeting, or circulates information supporting its decisions or other similar material, it is obligated to include the pertinent comments and proposals that may have been made by the Directors’ Committee or by shareholders owning 10% or more of the shares with voting rights who request that such comments and proposals be so included.
Only shareholders registered as such with Enersis at least five business days prior to the date of a meeting are entitled to attend and vote their shares. A shareholder may appoint another individual, who does not need to be a shareholder, as his proxy to attend the meeting and vote on his behalf. Proxies for such representation shall be given in writing for all the shares held by the owner. Every shareholder entitled to attend and vote at a shareholders’ meeting shall have one vote for every share subscribed.
There are no limitations imposed by Chilean law or the company’s bylaws on the right of nonresidents or foreigners to hold or vote shares of common stock. However, the registered holder of the shares of common stock represented by ADS, and evidenced by outstanding ADRs, is the custodian of the Depositary, currently Citibank N.A. (Chile), or any successor thereto. Accordingly, holders of ADRs are not entitled to receive notice of meetings of shareholders directly or to vote the underlying shares of common stock represented by ADS and evidenced by the ADRs directly. The Deposit Agreement contains provisions pursuant to which the Depositary has agreed to solicit instructions from registered holders of ADRs as to the exercise of the voting rights pertaining to the shares of common stock represented by the ADS and evidenced by such ADRs. Subject to compliance with the requirements of the Deposit Agreement and receipt of such instructions, the Depositary has agreed to endeavor, insofar as practicable and permitted under Chilean law and the provisions of the bylaws,
to vote or cause to be voted (or grant a discretionary proxy to the Chairman of the Board of Directors of the company or to a person designated by the Chairman of the Board of Directors of the company to vote) the shares of common stock represented by the ADS evidenced by such ADRs in accordance with any such instruction. The Depositary shall not itself exercise any voting discretion over any shares of common stock underlying ADS. If no voting instructions are received by the Depositary from a holder of ADRs with respect to the shares of common stock represented by the ADS, and evidenced by such ADRs, on or before the date established by the Depositary for such purpose, the shares of common stock represented by the ADS, may be voted in the manner directed by the Chairman of the Board of the company, subject to limitations set forth in the Deposit Agreement.
Dividends and Liquidation Rights
According to the Chilean Companies Act, unless otherwise decided by unanimous vote of its issued shares eligible to vote, all companies must distribute a cash dividend in an amount equal to at least 30% of their consolidated net income, before amortization and negative goodwill for each year (calculated according to the local accounting rules applicable to the company when preparing financial statements to be submitted to the SVS), unless and except to the extent the company has carried forward losses. The law provides that the board of directors must propose the dividend policy to the shareholders at the OSM.
Any dividend in excess of 30% of net income may be paid, at the election of the shareholder, in cash, in Enersis shares or in shares of publicly held corporations held by Enersis. Shareholders who do not expressly elect to receive a dividend other than in cash are legally presumed to have decided to receive the dividend in cash.
Dividends which are declared but not paid within the appropriate time period set forth in the Chilean Companies Act (as to minimum dividends, 30 days after declaration; as to additional dividends, the date set for payment at the time of declaration) are adjusted to reflect the change in the value of UF, from the date set for payment to the date such dividends are actually paid. Such dividends also accrue interest at the then prevailing rate for UF-denominated deposits during such period. The right to receive a dividend lapses if it is not claimed within five years from the date such dividend is payable. Payments not collected in such period are transferred for the benefit of the Fire Department, formed by volunteers.
In the event of a liquidation of Enersis, the holders of shares would participate in the assets available in proportion to the number of paid-in shares held by them, after payment to all creditors.
Approval of Financial Statements
The Board of Directors is required to submit Enersis’ consolidated financial statements to the shareholders annually for their approval. If the shareholders by a vote of a majority of shares present (in person or by proxy) at the shareholders’ meeting reject the financial statements, the Board of Directors must submit new financial statements no later than 60 days from the date of such meeting. If the shareholders reject the new financial statements, the entire Board of Directors is deemed removed from office and a new board is elected at the same meeting. Directors who individually approved such financial statements are disqualified for reelection for the following period. Our shareholders have never rejected the financial statements presented by the Board of Directors.
Change of Control
The Capital Markets Law establishes a comprehensive regulation related to tender offers. The law defines a tender offer as the offer to purchase shares of companies which publicly offer their shares or securities convertibles into shares and which offer is made to shareholders to purchase their shares under conditions which allow the bidder to reach a certain percentage of ownership of the company within a fixed period of time. These provisions apply to both voluntary and hostile tender offers.
Acquisition of Shares
There are no provisions in our bylaws that discriminate against any existing or prospective holder of shares as a result of such shareholder owning a substantial number of shares. However, no person may directly or indirectly own more than 65% of the outstanding shares of our stock. The foregoing restriction does not apply to the depositary as record owner of shares represented by ADRs, but it does apply to each beneficial ADS holder. Additionally, our bylaws prohibit any shareholder from exercising voting power with respect to more than 65% of the common stock owned by such shareholder or on behalf of others representing more than 65% of the outstanding issued shares with voting rights.
Right of Dissenting Shareholders to Tender Their Shares
The Chilean Companies Act provides that upon the adoption of any of the resolutions enumerated below at a meeting of shareholders, dissenting shareholders acquire the right to withdraw from the company and to compel the company to repurchase their shares, subject to the fulfillment of certain terms and conditions. In order to exercise such withdrawal rights, holders of ADRs must first withdraw the shares represented by their ADRs pursuant to the terms of the deposit agreement.
“Dissenting” shareholders are defined as those who at a shareholders’ meeting vote against a resolution that results in the withdrawal right, or who if absent from such meeting, state in writing their opposition to the respective resolution, within the 30 days following the shareholders’ meeting. The price paid to a dissenting shareholder of a publicly held stock corporation whose shares are quoted and actively traded on one of the Chilean stock exchanges, is the greater of (i) the weighted average of the sales prices for the shares as reported on the Chilean stock exchanges on which the shares are quoted for the two-month period preceding the shareholders’ meeting giving rise to the withdrawal right, and (ii) the market price resulting from the average price of transactions on such day. If, because of the volume, frequency, number and diversity of the buyers and sellers, the SVS determines that the shares are not actively traded on a stock exchange, the price paid to the dissenting shareholder shall be the book value. Book value for this purpose shall equal paid capital plus reserves and profits, less losses, divided by the total number of subscribed shares, whether entirely or partially paid. For the purpose of making this calculation, the last consolidated statements of financial position is used, as adjusted to reflect inflation up to the date of the shareholders’ meeting which gave rise to the withdrawal right.
The resolutions that result in a shareholder’s right to withdraw include, among others, the following:
· the transformation of the company into an entity which is not a publicly held stock corporation governed by Chilean Companies Act;
· the merger of the company with another company;
· disposition of 50% or more of the assets of the corporation, whether it includes disposition of liabilities or not, as well as the approval or the amendment of the business plan which contemplates the disposition of assets in an amount greater than such percentage;
· the disposition of 50% or more of the assets of a subsidiary, as long as such subsidiary represents at least 20% of the assets of the corporation, as well as any disposition of its shares that results in the parent company losing its position of controller;
· issue of guarantees for third parties’ liabilities which exceed 50% of the assets (if the third party is a subsidiary of the company, the approval of the board of directors is sufficient);
· the creation of preferential rights for a class of shares or an amendment to the existing ones. In this case the right to withdraw only accrues to the dissenting shareholders of the class or classes of shares adversely affected;
· certain remedies for the nullification of the corporate bylaws; and
· such other causes as may be established by the law or by the company’s bylaws.
Investments by AFPs
The Pension Funds’ System Law permits AFPs to invest their funds in companies that are subject to Title XII and, subject to greater restrictions, in other companies. The determination of which stocks may be purchased by AFPs is made by the Risk Classification Committee. The Risk Classification Committee establishes investment guidelines and is empowered to approve or disapprove those companies that are eligible for AFP investments. Except for the period from March 2003 to March 2004, Enersis has been a Title XII Company since 1985 and is approved by the Risk Classification Committee.
Title XII companies are required to have bylaws that limit the ownership of any shareholder to a specified maximum percentage, bylaws that require that certain actions be taken only at a meeting of the shareholders and bylaws that give the shareholders the right to approve certain investment and financing policies.
Registrations and Transfers
Shares issued by Enersis are registered with an administrative agent named Depósito Central de Valores S.A., Depósito de Valores. This entity is responsible for Enersis’ shareholders registry as well. In case of jointly owned shares, an attorney-in-fact must be appointed to represent the joint owners in dealing with Enersis.
C. Material contracts.
None.
D. Exchange Controls.
The Central Bank is responsible for, among other things, monetary policies and exchange controls in Chile. Currently applicable foreign exchange regulations are set forth in the Compendium of Foreign Exchange Regulations (the Compendium) approved by the Chilean Central Bank in 2002. Appropriate registration of a foreign investment in Chile permits the investor access to the Formal Exchange Market. Foreign investments can be registered with the Foreign Investment Committee under D.L. 600 of 1974 or can be registered with the Central Bank under the Central Bank Act, Law 18840 of October 1989.
a) Foreign Investments Contracts and Chapter XXVI
Regarding our initial public offering of ADS in 1993, we entered into a foreign investment contract (the Foreign Investment Contract) with the Chilean Central Bank and the Depositary, pursuant to Article 47 of the Central Bank Act and Chapter XXVI of the former Compendium of Foreign Exchange Regulations (Chapter XXVI), which governed the issuance of ADS by a Chilean company. Pursuant to the Foreign Investment Contract, the foreign exchange for payments and distributions with respect to the ADS may be purchased in either the Formal Exchange Market or the Informal Exchange Market, but such payments must be necessarily remitted through the Formal Exchange Market.
As of April 19, 2001, Chapter XXVI was eliminated and new investments in ADRs by non-residents of Chile, are now governed instead by Chapter XIV of the Compendium. This change was made with the purpose of simplifying and facilitating the flow of capital to and from Chile. As a result of the elimination of Chapter XXVI, access to the Formal Exchange Market is no longer assured. However, because our Foreign Investment Contract was entered into pursuant to Chapter XXVI, the principles of Chapter XXVI still apply to its terms. Foreign investors who have purchased their shares under a Foreign Investment Contract pursuant to Chapter XXVI continue to have access to the Formal Exchange Market for the purpose of converting pesos to dollars and repatriating from Chile amounts received with respect to the deposited shares of common stock or shares of common stock withdrawn from deposit on surrender of ADRs (including amounts received as cash dividends and proceeds from the sale in Chile of the underlying shares of common stock and any rights with respect thereto). However, foreign investors who have not deposited the shares of common stock into our ADS facility will not have the benefits of our Foreign Investment Contract with the Central Bank but instead will be subject to the normal foreign investment rules.
The following is a summary of certain provisions which were contained in Chapter XXVI and the Foreign Investment Contract and therefore remain relevant. This summary does not purport to be complete and is qualified in its entirety by reference to Chapter XXVI and the Foreign Investment Contract.
Under Chapter XXVI and the Foreign Investment Contract, the Central Bank agreed to grant to the Depositary, on behalf of ADR holders, and to any investor not residing or domiciled in Chile who withdraws common stock upon delivery of ADRs (such shares of common stock being referred to herein as Withdrawn Shares) access to the Formal Exchange Market to convert pesos into dollars (and to remit such dollars outside of Chile), including amounts received as:
· cash dividends;
· proceeds from the sale in Chile of Withdrawn Shares subject to receipt by the Central Bank of a certificate from the holder of the Withdrawn Shares (or from an institution authorized by the Central Bank) that such holder’s residence and domicile are outside Chile and a certificate from a Chilean stock exchange (or from a brokerage or securities firm established in Chile) that such Withdrawn Shares were sold on a Chilean stock exchange;
· proceeds from the sale in Chile of rights to subscribe for additional shares of Common Stock;
· proceeds from the liquidation, merger or consolidation of our Company; and
· other distributions, including, without limitation, those resulting from any recapitalization, as a result of holding shares of Common Stock represented by ADS or Withdrawn Shares.
Transferees of Withdrawn Shares were not entitled to any of the foregoing rights under Chapter XXVI. Investors receiving Withdrawn Shares in exchange for ADRs had the right to redeposit such shares in exchange for ADRs, provided that certain conditions relating to redeposit were satisfied.
Chapter XXVI provided that access to the Formal Exchange Market in connection with dividend payments was conditioned upon certification by us to the Central Bank that a dividend payment has been made and any applicable tax has been withheld. Chapter XXVI also provided that the access to the Formal Exchange Market in connection with the sale of Withdrawn Shares or distributions thereon was conditioned upon receipt by the Central Bank of certification by the Depositary (or the Custodian on its behalf) that such shares have been withdrawn in exchange for ADRs and receipt of a waiver of the benefit of the Foreign Investment Contract with respect thereto until such Withdrawn Shares were redeposited.
The Foreign Investment Contract provides that a person who brings foreign currency into Chile to purchase shares of common stock with the benefit of the Foreign Investment Contract must convert it into pesos on the same day and has five banking business days within which to invest in shares of common stock in order to receive the benefits of the Foreign Investment Contract. If such person decides within such period not to acquire shares of common stock, such person can access the Formal Exchange Market to reacquire dollars, provided that the applicable request is presented to the Central Bank within seven banking business days of the initial conversion into pesos. Shares acquired as described above may be deposited for ADRs and receive the benefits of the Foreign Investment Contract, subject to receipt by the Central Bank of a certificate from the Depositary (or the Custodian on its behalf) that such deposit has been effected, that the related ADRs have been issued and receipt of a declaration from the person making such deposit waiving the benefits of the Foreign Investment Contract with respect to the deposited shares of common stock.
Access to the Formal Exchange Market under any of the circumstances described above is not automatic. Such access requires approval of the Central Bank based on a request presented through a banking institution established in Chile. The Foreign Investment Contract provides that if the Central Bank has not acted on such request within seven banking days, the request will be deemed approved.
Under current Chilean law, the Foreign Investment Contract cannot be changed unilaterally by the Central Bank. It is not certain, however, that additional Chilean restrictions applicable to the holders of ADRs, the disposition of underlying shares of Common Stock or the repatriation of the proceeds from such disposition could not be imposed in the future, nor can there be any assessment of the duration or impact of such restrictions, if imposed.
The Compendium and International Bond Issuances
Chilean issuers may offer bonds issued by the Central Bank internationally under Chapter XIV, as amended, of the Compendium.
E. Taxation.
Chilean Tax Considerations
The following discussion summarizes material Chilean income and withholding tax consequences to beneficial owners arising from the ownership and disposition of the shares and ADS. The summary which follows does not purport to be a comprehensive description of all of the tax considerations that may be relevant to a decision to purchase, own or dispose of shares or ADS and does not purport to deal with the tax consequences applicable to all categories of investors, some of which may be subject to special rules. Holders of shares and ADS are advised to consult their own tax advisors concerning the Chilean and other tax consequences of the ownership of shares or ADS.
The summary that follows is based on Chilean law, as in effect on the date hereof, and is subject to any changes in these or other laws occurring after such date, possibly with retroactive effect. Under Chilean law, provisions contained in statutes such as tax rates applicable to foreign investors, the computation of taxable income for Chilean purposes and the manner in which Chilean taxes are imposed and collected may be amended only by another law. In addition, the Chilean tax authorities enact rulings and regulations of either general or specific application and interpret the provisions of the Chilean Income Tax Law. Chilean tax may not be assessed retroactively against taxpayers who act in good faith relying on such rulings,
regulations and interpretations, but Chilean tax authorities may change their rulings, regulations and interpretations in the future. The discussion that follows is also based, in part, on representations of the Depositary, and assumes that each obligation in the deposit agreement and any related agreements will be performed in accordance with its terms. As of this date, there is currently no applicable income tax treaty in effect between the United States and Chile. However, in 2010 the United States and Chile signed an income tax treaty that will enter into force once the treaty is ratified by both countries. There can be no assurance that the treaty will be ratified by either country. The following summary assumes that there is no applicable income tax treaty in effect between the United States and Chile.
As used in this report, the term “foreign holder” means either:
· in the case of an individual, a person who is not a resident of Chile; for purposes of Chilean taxation, an individual holder is resident of Chile if he or she has resided in Chile for more than six months in one calendar year, or a total of more than six months in two consecutive fiscal years; or
· in the case of a legal entity, an entity that is not organized under the laws of Chile, unless the shares or ADS are assigned to a branch, agent, representative or permanent establishment of such entity in Chile.
Taxation of Shares and ADS
Taxation of Cash Dividends and Property Distributions
General Rule: Cash dividends paid with respect to the shares or ADS held by a foreign holder will be subject to a 35% Chilean withholding tax, which is withheld and paid by the company. A credit against the Chilean withholding tax is available based on the level of corporate income tax actually paid by the company on the income to be distributed; however, this credit does not reduce the Chilean withholding tax on a one—for—one basis because it also increases in the same amount the base on which the Chilean withholding tax is imposed. In addition, if the company distributes less than all of its distributable income, the credit for the Chilean corporate income tax paid by the company is proportionately reduced. Since January 1, 2004, the Chilean corporate tax rate is 17% (see below regarding a temporary rate increase for 2011 and 2012). The example below illustrates the effective Chilean withholding tax burden on a cash dividend received by a foreign holder, assuming a Chilean withholding tax rate of 35%, an effective Chilean corporate income tax rate of 17% and a distribution of 50% of the net income of the company distributable after payment of the Chilean corporate income tax:
1 |
| Company taxable income (based on Line 1 = 100) |
| 100.0 |
|
2 |
| Chilean corporate income tax : 17% x Line 1 |
| 17.0 |
|
3 |
| Net distributable income: Line 1 – Line 2 |
| 83.0 |
|
4 |
| Dividend distributed (50% of net distributable income): 50% of Line 3 |
| 41.5 |
|
5 |
| Withholding tax: (35% of the sum of Line 4 plus 50% of Line 2) |
| (17.5 | ) |
6 |
| Credit for 50% of Chilean corporate income tax : 50% x Line 2 |
| 8.5 |
|
7 |
| Net withholding tax : Line 5 + Line 6 |
| (9.0 | ) |
8 |
| Net dividend received: Line 4 + Line 7 |
| 32.5 |
|
9 |
| Effective dividend withholding rate : Line 7 / Line 4 |
| 21.69 | % |
In general, the effective dividend Chilean withholding tax rate, after giving effect to the credit for the Chilean corporate income tax paid by the company, can be computed using the following formula:
Effective Dividend | = | (Withholding tax rate) - (Chilean corporate income tax rate) |
Withholding Tax Rate |
| 1 - (Chilean corporate income tax rate) |
Using the prevailing rates, the Effective Dividend Withholding Rate = (35%-17%) / (100%-17%) = 21.69%
Dividends are generally assumed to have been paid out of the Company’s oldest retained profits for purposes of determining the level of Chilean corporate income tax that was paid by the Company. For information as to the retained earnings of the Company for tax purposes and the tax credit available on the distribution of such retained earnings, see Note 17 to our Consolidated Financial Statements.
Under Chilean Income Tax Law, dividend distributions made in property are subject to the same Chilean tax rules as cash dividends. Stock dividends are not subject to Chilean taxation.
The Chilean Income Tax Law was amended in July 2010. Pursuant to the amendments in 2011, the Chilean corporate income tax rate will be increased from 17% to 20%, either on a cash or accrual tax basis. In 2012, the corporate income tax rate will decrease to 18.5%, and in 2013, the rate will once again return to the 17% rate prevailing for 2010. As discussed above, the corporate income tax is a credit against the withholding tax rate applicable on cash dividends received by a foreign holder.
Exceptions: Despite the aforementioned general rule, there are special circumstances under which a different tax treatment would apply depending on the source of the income or due to special circumstances existing at the date of the dividend distribution. The most common special cases are briefly described below:
1) Circumstances where there is no credit against the Chilean withholding tax: Dividends distributed by the company to foreign holders would not receive a credit against the Chilean withholding tax. By way of example, such is the case when dividend distributions exceed the company’s taxable income or when the income was not subject to corporate income tax due to an exemption. In these cases, the foreign holder will be subject to the Chilean withholding tax rate of 35%, without the corporate income tax credit.
2) Circumstances where dividends have been imputed to income exempted from all Chilean income taxes: In these cases, dividends distributed by the company to the foreign holder will not be subject to Chilean withholding tax. Income exempted from Chilean income tax is expressly listed in the Chilean Income Tax Law.
3) Circumstances where dividends are subject to a provisional withholding tax: In the event that on the date of the dividend distribution there are no earnings on which income tax has been paid and there are no tax—exempt earnings, a provisional withholding must be made on the dividends at the time of payment to the foreign holders. This provisional withholding is calculated as if the dividends were paid from taxable income without corporate tax credit. In other words, dividends will be subject to a 35% Chilean withholding tax rate, but they will not receive a corporate tax credit of 17%.
The provisional withholding tax must be confirmed with information as of December 31 of the year in which the dividend was paid. This confirmation must be based on the company’s effective income as of December 31.
4) Circumstances when it is possible to use in Chile certain credits against income taxes paid abroad, or “foreign tax credit”: This occurs when dividends distributed by the Chilean company have as their source income generated by companies domiciled in third countries. If that income was subject to withholding tax or corporate income tax in those third countries, such income will have a credit or “foreign tax credit” against corresponding Chilean taxes, which can be proportionally transferred to the shareholders of the Chilean company.
Taxation on sale or exchange of ADS, outside Chile
Gains obtained by a foreign holder from the sale or exchange of ADS outside Chile will not be subject to Chilean taxation.
Taxation on sale or exchange of Shares where shares or ADS were acquired on or before April 19, 2001
Gain recognized on a sale or exchange of shares (as distinguished from sales or exchanges of ADS representing such common shares) will be subject to both a 17% Chilean income tax and the 35% Chilean withholding tax (the former being creditable against the latter) if (i) the foreign holder acquired and disposed of the shares in the ordinary course of its business or as a regular trader of shares, or (ii) the foreign holder and the purchaser of the shares are related parties within the meaning of the Chilean Income Tax Law. In all other cases, gains on the disposition of shares will be subject to a 17% Chilean income tax but will not be subject to the 35% Chilean withholding tax. The date of acquisition of the ADS is considered to be the date of acquisition of the shares for which the ADS are exchanged.
Taxation on sale or exchange of Shares where Shares or ADS were acquired after April 19, 2001
The Chilean Income Tax Law includes a tax exemption on capital gains arising from the sale of shares of listed companies traded in the stock markets. Although there are certain restrictions, in general terms, the amendment provides that in order to qualify for the capital gain exemption: (i) the shares must be of a public stock company with a certain minimum level of trading on a stock exchange; (ii) the sale must be carried out in a Chilean stock exchange, or in a tender offer subject to Chapter XXV of the Chilean Securities Market Law; (iii) the shares which are being sold must have been acquired on a stock exchange, or in a tender offer subject to Chapter XXV of the Chilean Securities Market Law, or in an initial public offering (due to the creation of a company or to a capital increase), or due to the exchange of convertible bonds; and (iv) the
shares must have been acquired after April 19, 2001. If the shares do not qualify for the exemption, capital gains on their sale or exchange, if any, will be taxed in accordance with the rules described in the preceding paragraph. In addition, if the exemption does not apply and the foreign holder has held the shares for less than one year, gains from the disposition of shares will be subject to both income and withholding tax as described in the preceding paragraph. The date of acquisition of the ADS is considered to be the date of acquisition of the shares for which the ADS are exchanged.
Taxation of Rights and ADS Rights
For Chilean tax purposes, the receipt of rights or ADS rights by a foreign holder of shares or ADS pursuant to a rights offering is a nontaxable event. In addition, there are no Chilean income tax consequences to foreign holders upon the exercise or the lapse of the rights or the ADS rights. Any gain on the sale, exchange or transfer of the rights by a foreign holder is subject to a 35% Chilean withholding tax.
Other Chilean Taxes
There is no gift, inheritance or succession taxes applicable to the ownership, transfer or disposition of ADS by a foreign holder, but such taxes will generally apply to the transfer at death or by gift of the shares by a foreign holder. There is no Chilean stamp, issue, registration or similar taxes or duties payable by holders of shares or ADS.
Material U.S. Income Tax Considerations
This discussion is based on the Internal Revenue Code of 1986, as amended (the Code), administrative pronouncements, judicial decisions and final, temporary and proposed Treasury regulations, all as of the date hereof. These authorities are subject to change, possibly with retroactive effect. This discussion assumes that the Depositary’s activities are clearly and appropriately defined so as to ensure that the tax treatment of ADS will be identical to the tax treatment of the underlying shares.
As of this date, there is currently no applicable income tax treaty in effect between the United States and Chile. However, in 2010 the United States and Chile signed an income tax treaty that will enter into force once the treaty is ratified by both countries. There can be no assurance that the treaty will be ratified by either country. The following summary assumes that there is no applicable income tax treaty in effect between the United States and Chile.
The following are the material U.S. federal income tax consequences to beneficial owners described herein of owning and disposing of shares or ADS, but it does not purport to be a comprehensive description of all of the tax considerations that may be relevant to a particular person’s decision to hold such securities. The discussion applies only if you hold shares or ADS as capital assets for U.S. federal income tax purposes and it does not describe all of the tax consequences that may be relevant in light of your particular circumstances, such as if you are:
· certain financial institutions;
· insurance companies;
· dealers and traders in securities who use a mark—to—market method of tax accounting;
· persons holding shares or ADS as part of a hedge, “straddle,” integrated transaction or similar transaction;
· persons whose functional currency for U.S. federal income tax purposes is not the U.S. dollar;
· partnerships or other entities classified as partnerships for U.S. federal income tax purposes;
· persons liable for the alternative minimum tax;
· tax—exempt organizations;
· persons holding shares or ADS that own or are deemed to own ten percent or more of our stock;
· persons who acquired our shares or ADS pursuant to the exercise of any employee stock option or otherwise as compensation; or
· persons holding shares or ADS in connection with a trade or business conducted outside of the United States.
If an entity classified as a partnership for U.S. federal income tax purposes holds shares or ADS, the U.S. federal income tax treatment of a partner will generally depend on the status of the partner and upon the activities of the partnership. Partnerships holding shares or ADS and partners in such partnerships should consult their tax advisors as to the particular U.S. federal income tax consequences of holding and disposing of the shares or ADS.
You are a “U.S. Holder” for purposes of this discussion if you are a beneficial owner of our shares or ADS and if you are, for U.S. federal income tax purposes:
· a citizen or individual resident of the United States; or
· a corporation, or other entity taxable as a corporation, created or organized in or under the laws of the United States or any political subdivision thereof; or
· an estate, the income of which is subject to U.S. federal income taxation regardless of its source; or
· a trust (i) that validly elects to be treated as a U.S. person for U.S. federal income tax purposes or (ii)(A) if a court within the United States is able to exercise primary supervision over the administration of the trust and (B) one or more U.S. persons have the authority to control all substantial decisions of the trust.
You are a “Non—U.S. Holder” for purposes of this discussion if you are a beneficial owner of our shares or ADS and are not a U.S. Holder.
In general, if you own ADS, you will be treated as the owner of the shares represented by those ADS for U.S. federal income tax purposes. Accordingly, no gain or loss will be recognized if you exchange ADS for the underlying shares represented by those ADS.
The U.S. Treasury has expressed concerns that parties to whom ADS are released before shares are delivered to the Depositary (pre—release) or intermediaries in the chain of ownership between holders and the issuer of the security underlying the ADS may be taking actions that are inconsistent with the claiming of foreign tax credits for holders of depositary shares. Such actions would also be inconsistent with the claiming of the reduced tax rate, described below, applicable to dividends received by certain non—corporate holders. Accordingly, the analysis of the creditability of Chilean taxes, and the availability of the reduced tax rate for dividends received by certain non—corporate holders, each described below, could be affected by actions taken by such parties or intermediaries.
This discussion assumes that the Company is not, and will not become, a passive foreign investment company, as described below.
The summary of U.S. federal income tax consequences set out below is intended for general informational purposes only. You should consult your tax advisors with respect to the particular tax consequences to you of owning or disposing of shares or ADS, including the applicability and effect of state, local, non—U.S. and other tax laws and the possibility of changes in tax laws.
Taxation of Distributions
Distributions paid on shares or ADS other than certain pro rata distributions of common shares will be treated as dividends taxable as ordinary income to the extent paid out of our current or accumulated earnings and profits (as determined under U.S. federal income tax principles). Because we do not maintain calculations of our earnings and profits under U.S. federal income tax principles, it is expected that distributions generally will be reported as dividends.
Subject to applicable limitations and the discussion above regarding concerns expressed by the U.S. Treasury, dividends paid by qualified foreign corporations to certain non—corporate U.S. Holders in taxable years beginning before January 1, 2013 are taxable at a maximum rate of 15%. A foreign company is treated as a qualified foreign corporation with respect to dividends paid on stock that is readily tradable on an established securities market in the United States, such as the New York Stock Exchange where our ADS are traded. You should consult your tax advisors to determine whether the favorable rate will apply to dividends you receive and whether you are subject to any special rules that limit your ability to be taxed at this favorable rate.
The amount of a dividend will include the net amount withheld by us in respect of Chilean withholding taxes on the distribution. The amount of the dividend will be treated as foreign—source dividend income to you and will not be eligible for
the dividends—received deduction generally allowed to U.S. corporations under the Code. Dividends will be included in your income on the date of your, or in the case of ADS, the Depositary’s, receipt of the dividend. The amount of any dividend paid in Chilean pesos will be a U.S. dollar amount calculated by reference to the exchange rate for converting Chilean pesos into dollars in effect on the date of such receipt regardless of whether the payment is in fact converted into dollars. If the dividend is converted into U.S. dollars on the date of receipt, you generally should not be required to recognize foreign currency gain or loss in respect of the dividend income. You may have foreign currency gain or loss if the dividend is converted into dollars on a date after the date of receipt.
Subject to applicable limitations that may vary depending upon your circumstances and subject to the discussion above regarding concerns expressed by the U.S. Treasury, the net amount of Chilean withholding tax (after reduction for the credit for Chilean corporate income tax, as discussed above under “Item 10. Additional Information—E. Taxation—Chilean Tax Considerations — Taxation of Shares and ADS — Taxation of Cash Dividends and Property Distributions”) withheld from dividends on shares or ADS will be creditable against your U.S. federal income tax liability. The rules governing foreign tax credits are complex and, therefore, you should consult your tax advisor regarding the availability of foreign tax credits in your particular circumstances. Instead of claiming a credit, you may, at your election, deduct such Chilean taxes in computing your taxable income, subject to generally applicable limitations under U.S. law. An election to deduct foreign taxes instead of claiming foreign tax credits must apply to all taxes paid or accrued in the taxable year to foreign countries and possessions of the United States.
Subject to the discussion below under “Information Reporting and Backup Withholding,” if you are a Non—U.S. Holder, you generally will not be subject to U.S. federal income or withholding tax on dividends received by you on your shares or ADS, unless you conduct a trade or business in the United States and such income is effectively connected with that trade or business.
Sale or Other Disposition of Shares or ADS
For U.S. federal income tax purposes, the gain or loss you realize on the sale or other disposition of shares or ADS will be a capital gain or loss, and will be a long—term capital gain or loss if you have held the shares or ADS for more than one year. The amount of your gain or loss will equal the difference between your tax base in the shares or ADS disposed of and the amount realized on the disposition, in each case as determined in dollars. Such gain or loss will generally be U.S.—source gain or loss for foreign tax credit purposes. In addition, certain limitations exist on the deductibility of capital losses by both corporate and individual taxpayers.
In certain circumstances, Chilean taxes may be imposed upon the sale of shares. See “Item 10. Additional Information—E. Taxation—Chilean Tax Considerations — Taxation of Shares and ADS.” If a Chilean tax is imposed on the sale or disposition of shares, and a U.S. Holder does not receive significant foreign source income from other sources, such U.S. Holder may not be able to credit such Chilean tax against his U.S. federal income tax liability.
Subject to the discussion below under “Information Reporting and Backup Withholding,” a Non—U.S. Holder of ADS or shares generally will not be subject to United States income or withholding tax on gain from the sale or other disposition of ADS or shares unless (i) such gain is effectively connected with the conduct of a trade or business within the United States or (ii) the Non—U.S. Holder is an individual who is present in the United States for at least 183 days during the taxable year of the disposition and certain other conditions are met.
Passive Foreign Investment Company Rules
We believe that we were not a “passive foreign investment company” (PFIC) for U.S. federal income tax purposes for our 2010 taxable year. However, because PFIC status depends upon the composition of a company’s income and assets and the market value of its assets from time to time, and because it is unclear whether certain types of our income constitute passive income for PFIC purposes, there can be no assurance that we will not be considered a PFIC for any taxable year. If we were a PFIC for 2010 or for any prior or future taxable year during which you held shares or ADS, certain adverse consequences could apply to you, including the imposition of higher amounts of tax than would otherwise apply, and additional filing requirements. You should consult your tax advisors regarding the consequences to you if we were a PFIC, as well as the availability and advisability of making any election, which may mitigate the adverse consequences of PFIC status.
Information Reporting and Backup Withholding
Payments of dividends and sales proceeds that are made within the United States or through certain U.S.—related financial intermediaries generally are subject to information reporting and to backup withholding unless (i) you are an exempt
recipient or (ii) in the case of backup withholding, you provide a correct taxpayer identification number and certify that you are not subject to backup withholding.
U.S. information reporting and backup withholding may also apply to Non—U.S. Holders that are not “exempt recipients” and that fail to provide certain information as may be required by United States law and applicable regulations.
The amount of any backup withholding from a payment to you will be allowed as a credit against your U.S. federal income tax liability and may entitle you to a refund, provided that the required information is timely furnished to the Internal Revenue Service.
Legislation enacted in 2010 requires certain U.S. Holders to report to the Internal Revenue Service information with respect to their investment in shares or, it is assumed, ADS not held through a custodial account with a U.S. financial institution. Investors who fail to report required information could become subject to substantial penalties and/or extended statue of limitations.
You should consult your tax advisors with respect to the particular consequences to you of owning or disposing of shares or ADS.
F. Dividends and Paying Agents.
Not applicable.
G. Statement by Experts.
Not applicable.
H. Documents on Display.
We are subject to the information requirements of the Exchange Act, except that as a foreign issuer, we are not subject to the proxy rules (other than general anti-fraud rules) or the short-swing profit disclosure rules of the Exchange Act. In accordance with these statutory requirements, we file or furnish reports and other information with the SEC. Reports and other information filed or furnished by us with the SEC may be inspected and copied at the public reference facilities maintained by the SEC at Room 1024, 100 F Street, N.E., Washington, D.C. 20549, and at the SEC’s regional offices at 233 Broadway, New York, New York 10279 and 475 West Jackson Boulevard, Suite 900, Chicago, Illinois 60604. Copies of such material may also be inspected at the offices of the New York Stock Exchange, 11 Wall Street, New York, New York 10005, on which our ADS are listed. In addition, the SEC maintains a website that contains information filed electronically with the SEC, which can be accessed over the Internet at http://www.sec.gov.
I. Subsidiary information.
Not applicable.
Item 11. Quantitative and Qualitative Disclosures About Market Risk
The Company is exposed to risks arising from changes in commodity prices, interest rates and foreign exchange rates. Our Board of Directors approves risk management policies at all levels.
Commodity Price Risk
In our electricity generation business, we are exposed to market risks arising from the price volatility of electricity, natural gas, diesel oil, and coal.
Natural gas is used in some of our power plants. We seek to ensure our supply of this fuel by securing long-term contracts with our suppliers for terms that are expected to match the lifetime of our generation assets. These contracts generally have provisions that allow us to purchase gas at market prices prevailing at the time the purchase occurs. As of December 31, 2010, 2009 and 2008, we did not hold any contracts classified as either derivative financial instruments, financial instruments or derivative commodity instruments related to natural gas.
In the countries where we operate using coal and diesel oil, the dispatch mechanism allows the thermal power plants to cover their variable costs. However, under certain circumstances, fuel price fluctuations might affect marginal costs. We transfer commodity prices variations to the sale contract prices according to indexing formulas but only to the degree that this
is possible in our different markets. As of December 31, 2010, 2009 and 2008, we did not hold any contracts classified as either derivative financial instruments, financial instruments or derivative commodity instruments related either to coal or to diesel oil.
Additionally, through adequate commercial risk mitigation policies, and a hydro-thermal power plant mix, we seek to naturally protect our operating income from electricity price volatility. As of December 31, 2010, 2009 and 2008, we did not hold electricity price-sensitive instruments.
The Company is permanently analyzing ways for hedging commodity price risk. In the future we may use price-sensitive instruments.
Interest Rate and Foreign Currency Risk
The recorded values of our financial debt as of December 31, 2010, are detailed below, according to maturity. Total values do not include the effect of derivatives.
|
| Expected Maturity Date |
| ||||||||||||||
As of December 31, |
| 2011 |
| 2012 |
| 2013 |
| 2014 |
| 2015 |
| Thereafter |
| Total |
| Fair |
|
|
| (in millions of Ch$) |
| ||||||||||||||
Fixed Rate |
|
|
|
|
|
|
|
|
|
|
|
|
|
|
|
|
|
Chilean $ /UF |
| 0 |
| 0 |
| 0 |
| 0 |
| 0 |
| 0 |
| 0 |
| 0 |
|
Weighted average interest rate |
| — |
| — |
| — |
| — |
| — |
| — |
| — |
| — |
|
$ |
| 46,209 |
| 29,589 |
| 202,957 |
| 185,819 |
| 113,977 |
| 316,583 |
| 895,134 |
| 1,154,196 |
|
Weighted average interest rate |
| 6.9 | % | 6.8 | % | 8.8 | % | 7.7 | % | 8.9 | % | 7.5 | % | 8.0 | % |
|
|
Other currencies (2) |
| 127,593 |
| 65,162 |
| 73,120 |
| 59,268 |
| 25,222 |
| 46,682 |
| 397,408 |
| 414,620 |
|
Weighted average interest rate |
| 6.6 | % | 8.5 | % | 6.4 | % | 7.7 | % | 6.9 | % | 7.0 | % | 7.1 | % |
|
|
Total Fixed Rate |
| 174,162 |
| 94,751 |
| 276,078 |
| 245,087 |
| 139,199 |
| 363,264 |
| 1,292,542 |
| 1,569,116 |
|
Weighted average interest rate |
| 6.7 | % | 7.9 | % | 8.2 | % | 7.7 | % | 8.5 | % | 7.5 | % | 7.7 | % |
|
|
|
|
|
|
|
|
|
|
|
|
|
|
|
|
|
|
|
|
Variable Rate |
|
|
|
|
|
|
|
|
|
|
|
|
|
|
|
|
|
Chilean $ /UF |
| 10,023 |
| 9,478 |
| 10,099 |
| 10,419 |
| 11,076 |
| 408,013 |
| 459,108 |
| 205,877 |
|
Weighted average interest rate |
| 8.4 | % | 8.5 | % | 8.5 | % | 8.5 | % | 8.5 | % | 7.1 | % | 7.3 | % |
|
|
$ |
| 50,724 |
| 37,896 |
| 10,795 |
| 104,147 |
| 16,459 |
| 38,856 |
| 258,878 |
| 258,600 |
|
Weighted average interest rate |
| 3.3 | % | 3.2 | % | 2.6 | % | 1.8 | % | 2.8 | % | 2.8 | % | 2.6 | % |
|
|
Other currencies (2) |
| 356,945 |
| 335,415 |
| 146,244 |
| 135,537 |
| 74,595 |
| 318,636 |
| 1,367,191 |
| 1,433,744 |
|
Weighted average interest rate |
| 10.2 | % | 10.2 | % | 10.3 | % | 11.7 | % | 8.2 | % | 7.6 | % | 9.6 | % |
|
|
Total Variable Rate |
| 417,692 |
| 382,789 |
| 167,138 |
| 249,922 |
| 102,130 |
| 765,505 |
| 2,085,177 |
| 2,195,221 |
|
Weighted average interest rate |
| 9.3 | % | 9.5 | % | 9.7 | % | 7.4 | % | 7.4 | % | 7.1 | % | 8.2 | % |
|
|
|
|
|
|
|
|
|
|
|
|
|
|
|
|
|
|
|
|
TOTAL |
| 591,854 |
| 477,540 |
| 443,216 |
| 495,010 |
| 241,329 |
| 1,128,770 |
| 3,377,719 |
| 3,764,337 |
|
(1) As of December 31, 2010, fair values were calculated based on the discounted value of future cash flows expected to be paid (or received), considering current discount rates that reflect the different risks involved.
(2) “Other currencies” includes the Euro, reais, Colombian pesos, Argentine pesos and soles.
The recorded values of our financial debt as of December 31, 2009, are detailed below, according to maturity. Total values do not include the effect of derivatives.
|
| Expected Maturity Date |
| ||||||||||||||
As of December 31, |
| 2010 |
| 2011 |
| 2012 |
| 2013 |
| 2014 |
| Thereafter |
| Total |
| Fair |
|
|
| (in millions of Ch$) |
| ||||||||||||||
Fixed Rate |
|
|
|
|
|
|
|
|
|
|
|
|
|
|
|
|
|
Chilean $ /UF |
| — |
| — |
| — |
| — |
| — |
| — |
| 0 |
| 0 |
|
Weighted average interest rate |
| — |
| — |
| — |
| — |
| — |
| — |
| 0 |
| 0 |
|
US$ |
| 59,199 |
| 31,511 |
| 30,934 |
| 219,994 |
| 201,527 |
| 443,111 |
| 986,277 |
| 1,179,135 |
|
Weighted average interest rate |
| 7.5 | % | 7.0 | % | 6.7 | % | 8.6 | % | 7.4 | % | 8.0 | % | 7.9 | % |
|
|
Other currencies (2) |
| 101,568 |
| 71,436 |
| 72,471 |
| 53,898 |
| 53,528 |
| 55,050 |
| 407,950 |
| 438,993 |
|
Weighted average interest rate |
| 4.0 | % | 8.0 | % | 7.5 | % | 7.0 | % | 7.8 | % | 7.0 | % | 6.6 | % |
|
|
Total Fixed Rate |
| 160,767 |
| 102,947 |
| 103,405 |
| 273,892 |
| 255,055 |
| 448,616 |
| 1,027,072 |
| 1,618,128 |
|
Weighted average interest rate |
| 5.3 | % | 7.7 | % | 7.3 | % | 8.3 | % | 7.5 | % | 8.0 | % | 7.8 | % |
|
|
|
|
|
|
|
|
|
|
|
|
|
|
|
|
|
|
|
|
Variable Rate |
|
|
|
|
|
|
|
|
|
|
|
|
|
|
|
|
|
Chilean $ /UF |
| 15,374 |
| 7,057 |
| 7,176 |
| 7,616 |
| 7,749 |
| 405,056 |
| 450,028 |
| 569,917 |
|
Weighted average interest rate |
| 7.2 | % | 3.7 | % | 3.7 | % | 3.7 | % | 3.7 | % | 2.4 | % | 2.7 | % |
|
|
US$ |
| 175,297 |
| 147,598 |
| 53,624 |
| 12,887 |
| 111,493 |
| 28,772 |
| 529,671 |
| 529,671 |
|
Weighted average interest rate |
| 2.3 | % | 2.5 | % | 3.1 | % | 5.0 | % | 2.4 | % | 3.1 | % | 2.6 | % |
|
|
Other currencies (2) |
| 313,116 |
| 350,462 |
| 342,360 |
| 124,379 |
| 135,539 |
| 364,045 |
| 1,629,901 |
| 1,751,004 |
|
Weighted average interest rate |
| 10.9 | % | 11.5 | % | 12.3 | % | 10.9 | % | 9.8 | % | 8.9 | % | 10.8 | % |
|
|
Total Variable Rate |
| 503,787 |
| 505,117 |
| 403,160 |
| 144,882 |
| 254,781 |
| 797,873 |
| 2,609,600 |
| 2,850,292 |
|
Weighted average interest rate |
| 7.8 | % | 8.8 | % | 10.9 | % | 10.0 | % | 6.4 | % | 5.4 | % | 7.7 | % |
|
|
|
|
|
|
|
|
|
|
|
|
|
|
|
|
|
|
|
|
TOTAL |
| 664,554 |
| 608,063 |
| 506,564 |
| 418,774 |
| 509,837 |
| 1,296,034 |
| 4,003,827 |
| 4,468,720 |
|
(1) As of December 31, 2009, fair values were calculated based on the discounted value of future cash flows expected to be paid (or received), considering current discount rates that reflect the different risks involved.
(2) “Other currencies” includes the Euro, reais, Colombian pesos, Argentine pesos and soles.
Interest Rate Risk
At December 31, 2009 and 2010, 63.8% and 48.6% of our outstanding net debt obligations were subject to floating interest rates.
We maintain an appropriate mix of variable and fixed rate debt, calculated based on total net debt, according to the policy approved by our Board of Directors. We manage interest rate risk through the use of interest rate derivatives. The percentages mentioned above include the effect of interest rate derivatives (swaps or collars) that hedge the risk for part of our debt.
As of December 31, 2010, the recorded values for financial accounting purposes and the corresponding fair value of the instruments that hedge for our interest rate risk are as follows:
|
| Expected Maturity Date |
| ||||||||||||||
As of December 31, |
| 2011 |
| 2012 |
| 2013 |
| 2014 |
| 2015 |
| Thereafter |
| Total |
| Fair |
|
|
| (in millions of Ch$) (1) |
| ||||||||||||||
Variable to fixed rates |
| 21,056 |
| 8,786 |
| 4,627 |
| 295,687 |
| 3,752 |
| 5,959 |
| 339,867 |
| 21,257 |
|
Fixed to variable rates |
| 0 |
| 0 |
| 0 |
| 272,885 |
| 0 |
| 203,222 |
| 476,107 |
| (232,551 | ) |
(1) Calculated based on the Observed Exchange Rate as of December 31, 2010, which was Ch$ 468.01 = $ 1.00.
(2) Fair values were calculated based on the discounted value of future cash flows expected to be paid (or received), considering current discount rates that reflect the different risks involved.
By comparison, as of December 31, 2009 the recorded values for financial accounting purposes and the corresponding fair values of the instruments that hedge for our interest rate risk exposure, were as follows:
|
| Expected Maturity Date |
| ||||||||||||||
As of December 31, |
| 2010 |
| 2011 |
| 2012 |
| 2013 |
| 2014 |
| Thereafter |
| Total |
| Fair |
|
|
| (in millions of Ch$) (1) |
| ||||||||||||||
Variable to fixed rates |
| 39,095 |
| 26,128 |
| 26,393 |
| 3,188 |
| 117,499 |
| 1,564 |
| 213,866 |
| (2,174 | ) |
Fixed to variable rates |
| — |
| — |
| — |
| — |
| 266,365 |
| 198,366 |
| 464,731 |
| (198,660 | ) |
(1) Calculated based on the Observed Exchange Rate as of December 31, 2009, which was Ch$ 507.10 = $ 1.00.
(2) Fair values were calculated based on the discounted value of future cash flows expected to be paid (or received), considering current discount rates that reflect the different risks involved.
Foreign Currency Risk
We are exposed to foreign currency risk arising from debt denominated in dollars, Chilean pesos and other currencies. Some of our subsidiaries have a natural hedge between their revenues and the currency in which their debt is denominated. For example, in the case of our subsidiaries in Colombia, both revenues and debt are linked to the Colombian peso. In other cases, we do not have this natural hedge or we have it to a lesser degree, and we therefore try to manage this exposure with currency derivatives, such as UF/dollar exchange, dollar/UF exchange and dollar/local currency derivatives. However, this is not always possible because of market conditions. For instance, it is not possible in the case of Endesa Costanera in Argentina, because its revenues are linked to the Argentine peso and a substantial part of its debt is denominated in dollars, and there is no possibility of obtaining acceptable market conditions to hedge for this debt.
Since 2004, we have had a corporate currency risk policy. This policy takes the level of operating income of each country that is indexed to the dollar and seeks to hedge with dollar liabilities.
As of December 31, 2010, the recorded values for financial accounting purposes and the corresponding fair value of the instruments that hedge for our foreign exchange risk were as follows:
|
| Expected Maturity Date |
| ||||||||||||||
As of December 31, |
| 2011 |
| 2012 |
| 2013 |
| 2014 |
| 2015 |
| Thereafter |
| Total |
| Fair |
|
|
| (in millions of Ch$) (1) |
| ||||||||||||||
UF to $ |
| — |
| — |
| — |
| 185,166 |
| — |
| — |
| 185,166 |
| 24,971 |
|
$ to Ch$/UF |
| — |
| — |
| — |
| 272,885 |
| — |
| 203,222 |
| 476,107 |
| (232,551 | ) |
$ to Other currencies (3) |
| 12,386 |
| 5,909 |
| 1,794 |
| 1,923 |
| 2,060 |
| — |
| 32,861 |
| (11,592 | ) |
(1) Calculated based on the Observed Exchange Rate as of December 31, 2010, which was Ch$ 468.01 = $ 1.00.
(2) Fair values were calculated based on the discounted value of future cash flows expected to be paid (or received), considering current discount rates that reflect the different risks involved.
(3) Other currencies include reais, Argentinean pesos and soles.
By comparison, as of December 31, 2009 the recorded values for financial accounting purposes and the corresponding fair values of the instruments that hedge for our interest rate risk, were as follows:
|
| Expected Maturity Date |
| ||||||||||||||
As of December 31, |
| 2010 |
| 2011 |
| 2012 |
| 2013 |
| 2014 |
| Thereafter |
| Total |
| Fair |
|
|
| (in millions of Ch$) (1) |
| ||||||||||||||
UF to $ |
| — |
| — |
| — |
| — |
| — |
| — |
| 0 |
| 0 |
|
$ to Ch$/UF |
| — |
| — |
| — |
| — |
| 266,365 |
| 198,366 |
| 464,731 |
| (198,660 | ) |
$ to Other currencies (3) |
| 7,114 |
| 6,624 |
| 11,324 |
| 1,944 |
| 2,083 |
| — |
| 29,088 |
| (12,181 | ) |
(1) Calculated based on the Observed Exchange Rate as of December 31, 2009, which was Ch$ 507.10 = $ 1.00.
(2) Fair values were calculated based on the discounted value of future cash flows expected to be paid (or received), considering current discount rates that reflect the different risks involved.
(3) Other currencies include reais and soles.
(d) Safe Harbor
The information in this “Item 11. Quantitative and Qualitative Disclosures About Market Risk,” contains information that may constitute forward—looking statements. See “Forward—Looking Statements” in the Introduction of this report, for safe harbor provisions.
Item 12. Description of Securities Other Than Equity Securities
A. Debt Securities.
Not applicable.
B. Warrants and Rights.
Not applicable.
C. Other Securities.
Not applicable.
D. American Depositary Shares.
Depositary Fees and Charges
The Company’s ADS program is administered by Citibank, N.A., as Depositary. Under the terms of the Deposit Agreement, an ADS holder may have to pay the following service fees to the Depositary:
Service Fees |
| Fees |
(1) Issuance of ADS upon deposit of Shares. |
| Up to $5.00 per 100 ADS (or fraction thereof) issued. |
(2) Delivery of deposited securities against surrender of ADS |
| Up to $5.00 per 100 ADS (or fraction thereof) surrendered. |
(3) Distribution of cash dividends or other cash distributions (i.e., sale of rights and other entitlements). |
| Up to $5.00 per 100 ADS (or fraction thereof) held. |
(4) Distribution of ADS pursuant to (i) stock dividends or other free stock distributions, or (ii) exercise of rights to purchase additional ADS. |
| Up to $5.00 per 100 ADS (or fraction thereof) held. |
(5) Distribution of securities other than ADS or rights to purchase additional ADS (i.e., spin—off of shares). |
| Up to $5.00 per 100 ADS (or fraction thereof) held. |
(6) Depositary services |
| Up to $5.00 per 100 ADS (or fraction thereof) held on the applicable record date(s) established by the Depositary. |
Depositary Payments for Fiscal Year 2010
The Depositary has agreed to reimburse certain expenses related to the Company’s ADS program and incurred by the Company in connection with the program. In 2010, the Depositary reimbursed expenses related to Investor Relations’ activities for a total amount of $ 440,851.
Item 13. Defaults, Dividend Arrearages and Delinquencies
None.
Item 14. Material Modifications to the Rights of Security Holders and Use of Proceeds
None.
Item 15. Controls and Procedures
(a) Disclosure Controls and Procedures
The Company carried out an evaluation under the supervision and with the participation of the Company’s management, including the Chief Executive Officer and Chief Financial Officer, of the effectiveness of the design and operation of the Company’s “disclosure controls and procedures” (as defined in Rules 13 (a) - 15 (e) and 15 (d) - 15 (e) under the Exchange Act) for the year ended December 31, 2010.
There are inherent limitations to the effectiveness of any system of disclosure controls and procedures, including the possibility of human error, and the circumvention or overriding of the controls and procedures. Accordingly, the Company’s disclosure controls and procedures are designed to provide reasonable assurance of achieving their control objectives.
Based upon the Company’s evaluation, the Chief Executive Officer and the Chief Financial Officer concluded that the disclosure controls and procedures are effective in providing reasonable assurance that information required to be disclosed in the reports the Company files and submits under the Exchange Act is recorded, processed, summarized and reported within the time periods specified in the applicable rules and forms, and that it is gathered and communicated to the Company’s Management, including the Chief Executive Officer and Chief Financial Officer, as appropriate, to allow timely decisions regarding required disclosure.
Our disclosure controls and procedures are designed to provide reasonable assurance of achieving their objectives, and our principal executive officer and principal financial officer have concluded that our disclosure controls and procedures are effective at that reasonable assurance level.
(b) Management’s Annual Report on Internal Control Over Financial Reporting
As required by Section 404 of the Sarbanes—Oxley Act of 2002, Enersis’ management is responsible for establishing and maintaining “adequate internal control over financial reporting” (as defined in Rule 13(a)-15 (f) under the Exchange Act). The Company’s internal control over financial reporting is designed to provide reasonable assurance regarding the reliability of financial reporting and the preparation of the financial statements for external purposes in accordance with IFRS, as issued by the IASB.
Because of its inherent limitations, internal control over financial reporting may not necessarily prevent or detect some misstatements. It can only provide reasonable assurance regarding financial statement preparation and presentation. Also, projections of any evaluation of effectiveness for future periods are subject to the risk that controls may become inadequate because of changes in conditions or because the degree of compliance with the policies or procedures may deteriorate over time.
Management assessed the effectiveness of its internal control over financial reporting for the year ended December 31, 2010. The assessment was based on criteria established in the “Internal Controls — Integrated Framework” issued by the Committee of Sponsoring Organizations of the Treadway Commission (COSO). Based on the assessment, Enersis’ Management has concluded that as of December 31, 2010, the Company’s internal control over financial reporting was effective.
(c) Attestation Report
Deloitte Auditores y Consultores Ltda., the independent registered public accounting firm that has audited our Consolidated Financial Statements, has issued an attestation report on the company’s internal control over financial reporting as of December 31, 2010. This attestation report appears on page F—2.
(d) Changes in internal control
There were no changes in the Company’s internal control over financial reporting that occurred during 2010 that have materially affected, or are reasonably likely to materially affect, the Company’s internal control over financial reporting.
Item 16. [Reserved]
Item 16A. Audit Committee Financial Expert
As of December 31, 2010, the Directors’ Committee’s (which performs the functions of the Audit Committee) financial expert was Mr. Leonidas Vial, as determined by the Board of Directors. Mr. Vial is an independent member of the Directors’ Committee pursuant to the requirement of both Chilean law and NYSE corporate governance rules.
The standards of ethical conduct at Enersis are currently governed by means of four corporate rulings or policies: the Charter Governing Executives (Estatuto del Directivo), the Code of Ethics, the Zero Tolerance anti—Corruption Plan (the “ZTAC Plan”) and the Manual for the Management of Information of Interest to the Market (the “Manual”).
The Charter Governing Executives, approved as a corporate statute, was adopted by the Board of Directors in May 2003 and is applicable to all managers contractually related to Enersis, including the Chief Executive Officer, the Chief Financial Officer and other senior officers of the Company, and to all senior management of controlled subsidiaries in which Enersis is the majority shareholder, both in Chile and internationally. The objective of this statute is to establish standards for the governance of our management’s actions.
The Manual, adopted by Enersis’ Board of Directors in May 2008 and amended in February 2010, addresses the following issues: applicable standards to the information of transactions of the Company’s securities or those of its affiliates by directors, management, principal executives, employees and other related parties; existence of blackout periods for such transactions by directors, management, principal executives, employees and other related parties; existence of mechanisms for the continuous release of information that is of interest to the market; and mechanisms that provide protection for confidential information.
In addition to the above mentioned corporate governance rules, the Board of the Company in its meeting of June 24, 2010 approved the Code of Ethics and the ZTAC Plan. The Code of Ethics is based on general principles such as impartiality, honesty, integrity and other qualities of similar importance, which are translated into detailed behavioral criteria. The ZTAC Plan reinforces the principles included in the Code of Ethics, but with a special emphasis in avoiding corruption in the form of bribery, preferential treatment, and other similar acts.
A copy of these documents is available upon request, free of charge, by writing or calling us at:
Investor Relations Department
ENERSIS S.A.
Santa Rosa 76, Piso 15
Santiago, Chile
(56-2) 353-4682
During fiscal year 2010, there have been no amendments to any provisions of the Charter Governing Executives. The Manual was amended in February 2010, to comply with the new regulations imposed by the authority. The Internal Regulations on Conduct in Securities Markets, approved by the Board on January 31, 2002, was revoked by the Board of Enersis on June 24, 2010 because contents of this document were included in the Manual.
No waivers from any provisions of the Charter Governing Executives, the Code of Ethics, the ZTAC Plan or the Manual, were expressly or implicitly granted to the Chief Executive Officer, the Chief Financial Officer or any other senior financial officer of the Company in fiscal year 2010.
Item 16C. Principal Accountant Fees and Services
The following table provides information on the aggregate fees billed by our principal accountants, Deloitte Auditores y Consultores Ltda., as well as the other member firms of Deloitte Touche Tohmatsu and their respective affiliates (including Deloitte Consulting) by type of service rendered for periods indicated.
Services Rendered |
| 2009 |
| 2010 |
|
|
| (in $ million) |
| ||
Audit Fees (1) |
| 3.1 |
| 3.7 |
|
Audit—Related Fees (2) |
| 0.2 |
| 0.6 |
|
Tax Fees |
| — |
| — |
|
All Other Fees (3) |
| — |
| 0.1 |
|
Total |
| 3.3 |
| 4.3 |
|
(1) | Corresponds to fees billed for each of the last two fiscal years for professional services rendered by Deloitte for the audit of Enersis’s annual consolidated financial statements or services that are normally provided by Deloitte, in connection with statutory and regulatory filings or engagements for those fiscal years. The increase of $0.3 million in fees during 2010 was mainly due to the appreciation of the Chilean peso against the dollar and also an increase in services that are normally provided by Deloitte, in connection with statutory and regulatory filings. |
(2) | Corresponds to fees billed in each of the last two fiscal years for assurance and related services by Deloitte that are reasonably related to the performance of the audit or review of Enersis’s subsidiaries financial statements and are not reported under (1) above. |
(3) | Corresponds to fees billed in each of the last two fiscal years for products and services provided by Deloitte other than the services reported in (1) and (2) above. |
The amounts included in the table above and the related footnotes have been classified in accordance with SEC guidance.
All of the fees disclosed under Audit—Related Fees and All Other Fees were pre—approved by the Audit Committee.
Audit Committee Pre—Approval Policies and Procedures
Our external auditors are appointed by our shareholders at the OSM. Similarly, the shareholders of our subsidiaries, which are located in countries where applicable law and regulation so establishes, appoint their own external auditors.
The Directors’ Committee (which performs the functions of the Audit Committee), through the Economic Financial General Directorate, or EFGD, manages appointment proposals, review of engagement letters, fee negotiations, quality control in respect of the services provided, review and control of independence issues and other related matters.
The Directors’ Committee has a pre—approval policy regarding the contracting of Enersis’ external auditor, or any affiliate of the external auditor, for professional services. The professional services covered by such policy include audit and non—audit services provided to Enersis.
Fees payable in connection with recurring audit services are pre—approved as part of our annual budget. Fees payable in connection with non—recurring audit services, once they have been analyzed by the EFGD, are submitted to the Audit Committee for approval or rejection.
The pre—approval policy established by the Directors’ Committee for non—audit services and Audit-Related Fees is as follows:
· The business unit that has requested the service and the audit firm expected to perform the service must request that the EFGD manager review the nature of the service to be provided.
· At that point, the EFGD analyzes the request and requires the audit firm that will provide the service to issue a certificate signed by the partner responsible for the audit of our Consolidated Financial Statements confirming such audit firm’s independence.
· Finally, the proposal is submitted to the Audit Committee for approval or denial.
The services described in footnote (2) and (3) to the table above have been approved in line with the procedure described immediately above since July 2005.
In addition, due to the SEC release number 34—53677 File No. PCAOB—2006—01 (Audit Committee Pre—Approval of Certain Tax Services), the Directors’ Committee has designed, approved and implemented the necessary procedures to fulfill the new requirements described by this rule.
Item 16D. Exemptions from Listing Requirements for Audit Committees
Not applicable.
Item 16E. Purchases of Equity Securities by the Issuer and Affiliated Purchasers
Neither Enersis nor any affiliated purchaser acquired any shares of Enersis during 2010.
Item 16F. Change in Registrant’s Certifying Accountants
On March 29, 2011, the Director’s Committee recommended to the Board of Directors that the Board propose to shareholders a change in the Company’s independent registered public accounting firm at the General Shareholders’ Meeting to be held on April 26, 2011. On such date, the shareholders approved the Board of Directors’ proposal to nominate Ernst & Young Servicios Profesionales de Auditoría y Asesorías Limitada (“E&Y”) as the new independent registered public accounting firm for Enersis. Deloitte Auditores y Consultores Ltda. (“Deloitte”) served as the independent registered public accounting firm for Enersis for the 2009 and 2010 fiscal years, in each case pursuant to the terms of an annual engagement letter. On April 27, 2011, Deloitte was notified by the Company that shareholders had approved appointment of another independent registered public accounting firm for the 2011 fiscal year, and Deloitte was discharged from its engagement by the Company.
The audit reports of Deloitte on the Company’s consolidated financial statements as of and for the years ended December 31, 2009 and 2010 did not contain any adverse opinion or disclaimer of opinion, nor were they qualified or modified as to uncertainty, audit scope or accounting principles.
The audit reports of Deloitte on the effectiveness of the Company’s internal control over financial reporting as of December 31, 2009 and 2010 did not contain any adverse opinion or disclaimer of opinion and were not qualified or modified as to uncertainty, audit scope or accounting principles.
During the Company’s two most recent fiscal years ended December 31, 2009 and 2010, and the subsequent interim periods through April 26, 2011, there were no disagreements with Deloitte on any matter of accounting principles or practices, financial statement disclosure, or auditing scope or procedure, which disagreements, if not resolved to Deloitte’s satisfaction, would have caused Deloitte to make reference to the subject matter of such disagreements in connection with its reports on the Company’s consolidated financial statements for such periods.
During the Company’s two most recent fiscal years ended December 31, 2009 and 2010 and the subsequent periods through April 26, 2011, there were no reportable events (as defined in Item 16F(a)(1)(v) of Form 20-F).
The Company has provided Deloitte with a copy of this Form 20-F prior to its filing with the Securities and Exchange Commission (“SEC”). The Company requested Deloitte to furnish the Company with a letter addressed to the SEC stating whether or not it agrees with the above statements, as required by Item 16F(a)(3) of Form 20-F. Such letter is filed as Exhibit 15.1.
The Company’s Board of Directors, no later than June 30, will engage E&Y as the Company’s new independent registered public accounting firm to audit the Company’s consolidated financial statements and internal control over financial reporting for the fiscal year ending December 31, 2011.
During the Company’s two most recent fiscal years and any subsequent interim periods prior to the Company’s engagement of E&Y, neither the Company nor anyone acting on its behalf has consulted E&Y on any of the matters or events set forth in Item 16F(a)(2)(i) and Item 16F(a)(2)(ii) of Form 20-F.
Item 16G. Corporate Governance
To review the significant differences between our corporate governance practices and the NYSE Corporate Governance Standards, please see “Item 6. Directors, Senior Management and Employees—C. Board practices.”
None.
ENERSIS S.A. and Subsidiaries
Index to the Audited Consolidated Financial Statements
Reports of Independent Registered Public Accounting Firms: |
|
Report of Deloitte Auditores y Consultores Ltda.— Enersis S.A. | F-1 |
Report of Deloitte Auditores y Consultores Ltda. — Enersis S.A. — Internal Control over Financial Reporting | F-2 |
Report of KPMG. Auditores Consultores Ltda. — Empresa Nacional de Electricidad S.A. | F-4 |
Report of KPMG Auditores Consultores Ltda. — Empresa Nacional de Electricidad S.A. — Internal Control over Financial Reporting | F-6 |
Reports of Deloitte Touche Tohmatsu Auditores Independentes — Endesa Brasil S.A. | F-8 |
Reports of Deloitte & Touche Ltda. — Emgesa S.A. E.S.P. | F-10 |
|
|
Consolidated Financial Statements: |
|
Consolidated Statements of Financial Position as of December 31, 2010 and 2009 | F-12 |
Consolidated Statements of Comprehensive Income for the years ended December 31, 2010, 2009 and 2008 | F-14 |
Consolidated Statements of Changes in Equity for the years ended December 31, 2010, 2009 and 2008 | F-16 |
Consolidated Statements of Cash Flows for the years ended December 31, 2010, 2009 and 2008 | F-18 |
Notes to the Consolidated Financial Statements | F-19 |
|
|
SCHEDULE I Enersis S.A.’s condensed unconsolidated financial information | F-143 |
Exhibit |
| Description |
1.1 |
| By—laws (Estatutos) of ENERSIS S.A., as amended. (*) |
8.1 |
| List of Subsidiaries as of December 31, 20010 |
12.1 |
| Certification of Chief Executive Officer pursuant to Section 302 of the Sarbanes—Oxley Act |
12.2 |
| Certification of Chief Financial Officer pursuant to Section 302 of the Sarbanes—Oxley Act |
13.1 |
| Certification of Chief Executive Officer and Chief Financial Officer pursuant to Section 906 of the Sarbanes—Oxley Act |
15.1 |
| Letter dated April 27, 2011 of Deloitte S.L. as required by Item 16F of Form 20-F. |
(*) Incorporated by reference to Enersis’ Form 20-F for the year ended December 31, 2009.
We will furnish to the Securities and Exchange Commission, upon request, copies of any not filed instruments that define the rights of stakeholders of Enersis.
SIGNATURES
The registrant certifies that it meets all of the requirements for filing on Form 20—F and that it has duly caused and authorized the undersigned to sign this annual report on its behalf.
| ENERSIS S.A. |
| |||
|
|
|
| ||
|
|
|
| ||
| By: | /s/ Ignacio Antoñanzas A. | |||
|
| Name: | Ignacio Antoñanzas A. | ||
|
| Title: | Chief Executive Officer | ||
|
|
|
| ||
Date: May 31, 2011. |
|
|
| ||
Enersis and Subsidiaries
Audited Consolidated Financial Statements as of
December 31, 2010 and 2009 and for each of the three years in the period ended December 31, 2010
together with the Reports of Independent Registered Public Accounting Firms
Enersis and Subsidiaries
Index to the Audited Consolidated Financial Statements
Reports of Independent Registered Public Accounting Firms: |
|
Report of Deloitte Auditores y Consultores Ltda.— Enersis S.A. | F-1 |
F-2 | |
Report of KPMG. Auditores Consultores Ltda. — Empresa Nacional de Electricidad S.A. | F-4 |
F-6 | |
Reports of Deloitte Touche Tohmatsu Auditores Independentes — Endesa Brasil S.A. | F-8 |
F-10 | |
|
|
Consolidated Financial Statements: |
|
Consolidated Statements of Financial Position as of December 31, 2010 and 2009 | F-12 |
Consolidated Statements of Comprehensive Income for the years ended December 31, 2010, 2009 and 2008 | F-14 |
Consolidated Statements of Changes in Equity for the years ended December 31, 2010, 2009 and 2008 | F-16 |
Consolidated Statements of Cash Flows for the years ended December 31, 2010, 2009 and 2008 | F-18 |
F-19 | |
|
|
SCHEDULE I Enersis S.A.’s condensed unconsolidated financial information | F-143 |
Ch$ | Chilean pesos |
US$ | United States dollars |
UF | The UF is a Chilean inflation-indexed, peso-denominated monetary unit that is set daily in advance based on the previous month’s inflation rate. |
ThCh$ | Thousand of Chilean pesos |
ThUS$ | Thousand of United States dollars |
| Deloitte Auditores y Consultores Ltda. RUT: 80.276.200-3 Av. Providencia 1760 Pisos 6, 7, 8, 9 y 13 Providencia, Santiago Chile Fono: (56-2) 729 7000 Fax: (56-2) 374 9177 e-mail: deloittechile@deloitte.com www.deloitte.cl |
REPORT OF INDEPENDENT REGISTERED PUBLIC ACCOUNTING FIRM
To the Board of Directors and Stockholders of
Enersis S.A.:
We have audited the accompanying consolidated statements of financial position of Enersis S.A. and subsidiaries (the “Company”) as of December 31, 2010 and 2009, and the related consolidated statements of comprehensive income, changes in equity, and cash flows for each of the three years in the period ended December 31, 2010, and the schedule of Enersis S.A.’s condensed unconsolidated financial information. These consolidated financial statements and the schedule are the responsibility of the Company’s management. Our responsibility is to express an opinion on these consolidated financial statements and the schedule based on our audits. We did not audit the financial statements of Empresa Nacional de Electricidad S.A. (a subsidiary), certain of its consolidated subsidiaries, certain of its associates accounted for using the equity method and certain of its jointly controlled entities accounted for using proportionate consolidation (hereinafter collectively referred to as “Endesa-Chile”), which statements reflect total assets constituting 35.01% and 31.01% of the Company’s consolidated total assets as of December 31, 2010 and 2009, respectively, and total revenues constituting 27.31%, 24.03% and 28.11% of the Company’s consolidated total revenues for the years ended December 31, 2010, 2009 and 2008, respectively. Those financial statements were audited by other auditors whose reports have been furnished to us, and our opinion, insofar as it relates to the amounts included for Endesa-Chile, is based solely on the reports of the other auditors.
We conducted our audits in accordance with the standards of the Public Company Accounting Oversight Board (United States of America). Those standards require that we plan and perform the audit to obtain reasonable assurance about whether the financial statements are free of material misstatement. An audit includes examining, on a test basis, evidence supporting the amounts and disclosures in the financial statements. An audit also includes assessing the accounting principles used and significant estimates made by management, as well as evaluating the overall financial statement presentation. We believe that our audits and the reports of the other auditors provide a reasonable basis for our opinion.
In our opinion, based on our audits and the reports of the other auditors, such consolidated financial statements present fairly, in all material respects, the financial position of Enersis S.A. and subsidiaries as of December 31, 2010 and 2009, and the results of their operations and their cash flows for each of the three years in the period ended December 31, 2010, in conformity with International Financial Reporting Standards (IFRS) as issued by the International Accounting Standards Board (“IASB’’). Also, in our opinion, the related condensed unconsolidated information schedule, when considered in relation to the basic consolidated financial statements, taken as whole, present fairly, in all material respects, the information set forth therein.
We have also audited, in accordance with the standards of the Public Company Accounting Oversight Board (United States of America), the Company’s internal control over financial reporting as of December 31, 2010, based on the criteria established in Internal Control—Integrated Framework issued by the Committee of Sponsoring Organizations of the Treadway Commission and our report dated April 27, 2011 expressed an unqualified opinion on the Company’s internal control over financial reporting based on our audit and the report of the other auditors.

Santiago, Chile
April 27, 2011
| Deloitte Auditores y Consultores Ltda. RUT: 80.276.200-3 Av. Providencia 1760 Pisos 6, 7, 8, 9 y 13 Providencia, Santiago Chile Fono: (56-2) 729 7000 Fax: (56-2) 374 9177 e-mail: deloittechile@deloitte.com www.deloitte.cl |
REPORT OF INDEPENDENT REGISTERED PUBLIC ACCOUNTING FIRM
To the Board of Directors and Stockholders of
Enersis S.A.:
We have audited the internal control over financial reporting of Enersis S.A. and subsidiaries (the “Company”) as of December 31, 2010, based on criteria established in Internal Control — Integrated Framework issued by the Committee of Sponsoring Organizations of the Treadway Commission. The Company’s management is responsible for maintaining effective internal control over financial reporting and for its assessment of the effectiveness of internal control over financial reporting, included in the accompanying Management’s Annual Report on Internal Control Over Financial Reporting. Our responsibility is to express an opinion on the Company’s internal control over financial reporting based on our audit. We did not examine the effectiveness of internal control over financial reporting of Empresa Nacional de Electricidad S.A. (a subsidiary) and certain of its subsidiaries, associates and jointly controlled entities (collectively hereinafter referred to as “Endesa-Chile”), whose financial statements reflect total assets and revenues constituting 35.01% and 27.31%, respectively, of the related consolidated financial statement amounts as of and for the year ended December 31, 2010. The effectiveness of Endesa-Chile’s internal control over financial reporting was audited by other auditors whose report has been furnished to us, and our opinion, insofar as it relates to the effectiveness of Endesa-Chile’s internal control over financial reporting, is based solely on the report of the other auditors.
We conducted our audit in accordance with the standards of the Public Company Accounting Oversight Board (United States of America). Those standards require that we plan and perform the audit to obtain reasonable assurance about whether effective internal control over financial reporting was maintained in all material respects. Our audit included obtaining an understanding of internal control over financial reporting, assessing the risk that a material weakness exists, testing and evaluating the design and operating effectiveness of internal control based on the assessed risk, and performing such other procedures as we considered necessary in the circumstances. We believe that our audit provides a reasonable basis for our opinion.
A company’s internal control over financial reporting is a process designed by, or under the supervision of, the company’s principal executive and principal financial officers, or persons performing similar functions, and effected by the company’s board of directors, management, and other personnel to provide reasonable assurance regarding the reliability of financial reporting and the preparation of financial statements for external purposes in accordance with generally accepted accounting principles. A company’s internal control over financial reporting includes those policies and procedures that (1) pertain to the maintenance of records that, in reasonable detail, accurately and fairly reflect the transactions and dispositions of the assets of the company; (2) provide reasonable assurance that transactions are recorded as necessary to permit preparation of financial statements in accordance with generally accepted accounting principles, and that receipts and expenditures of the company are being made only in accordance with authorizations of management and directors of the company; and (3) provide reasonable assurance regarding prevention or timely detection of unauthorized acquisition, use, or disposition of the company’s assets that could have a material effect on the financial statements.
Because of the inherent limitations of internal control over financial reporting, including the possibility of collusion or improper management override of controls, material misstatements due to error or fraud may not be prevented or detected on a timely basis. Also, projections of any evaluation of the effectiveness of the internal control over financial reporting to future periods are subject to the risk that the controls may become inadequate because of changes in conditions, or that the degree of compliance with the policies or procedures may deteriorate.
In our opinion, based on our audit and the report of the other auditors, the Company maintained, in all material respects, effective internal control over financial reporting as of December 31, 2010, based on the criteria established in Internal Control — Integrated Framework issued by the Committee of Sponsoring Organizations of the Treadway Commission.
We have also audited, in accordance with the standards of the Public Company Accounting Oversight Board (United States of America), the consolidated financial statements as of and for the year ended December 31, 2010 of the Company and the schedule of Enersis S.A.’s condensed unconsolidated financial information and our report dated April 27, 2011 expressed an unqualified opinion on those financial statements and such financial statements schedule based on our audit and the report of the other auditors.

Santiago, Chile
April 27, 2011
Report of Independent Registered Public Accounting Firm
The Board of Directors and Shareholders of
Empresa Nacional de Electricidad S.A. (Endesa-Chile):
We have audited the accompanying consolidated statements of financial position of Endesa-Chile and subsidiaries (the Company) as of December 31, 2010 and 2009, and the related consolidated statements of comprehensive income, changes in equity, and cash flows for each of the years in the three-year period ended December 31, 2010. These consolidated financial statements are the responsibility of the Company’s management. Our responsibility is to express an opinion on these consolidated financial statements based on our audits. We did not audit the December 31, 2010 and 2009 financial statements of certain subsidiaries and nonsubsidiary investees carried on the equity method of accounting, which statements reflect total assets constituting 31.91 percent and 33.02 percent of the Company’s consolidated total asset position as of December 31, 2010 and 2009, respectively, and total revenues constituting 27.35 percent, 23.48 percent and 18.09 percent of the Company’s consolidated revenues for the years ended December 31, 2010, 2009 and 2008, respectively. Those consolidated financial statements prepared in accordance with the local statutory accounting basis were audited by other auditors whose reports have been furnished to us and our opinion, insofar as it relates to the amounts included for those entities on such basis of accounting, is based solely on the reports of the other auditors. Accordingly, we have audited the conversion adjustments to the financial statements of these subsidiaries and nonsubsidiary investees prepared in accordance with the local statutory accounting basis to conform them to the Company’s accounting basis referred to below.
We conducted our audits in accordance with the standards of the Public Company Accounting Oversight Board (United States). Those standards require that we plan and perform the audit to obtain reasonable assurance about whether the consolidated financial statements are free of material misstatement. An audit includes examining, on a test basis, evidence supporting the amounts and disclosures in the consolidated financial statements, assessing the accounting principles used and significant estimates made by management, as well as evaluating the overall financial statement presentation. We believe that our audits and the reports of the other auditors provide a reasonable basis for our opinion.
In our opinion, based on our audits and the reports of the other auditors, the consolidated financial statements referred to above present fairly, in all material respects, the financial position of Endesa-Chile and subsidiaries as of December 31, 2010 and 2009, and the results of their operations and their cash flows for each of the years in the three-year period ended December 31, 2010, in conformity with International Financial Reporting Standards (IFRS) as issued by the International Accounting Standards Board (IASB).
© 2011 KPMG Auditores Consultores Ltda., a Chilean limited liability partnership and a member firm of the KPMG network of Independent member firms affiliated with KPMG International Cooperative (“KPMG International”), a Swiss entity. All rights reserved.
We also have audited, in accordance with the standards of the Public Company Accounting Oversight Board (United States), Endesa-Chile’s internal control over financial reporting as of December 31, 2010, based on the criteria established in Internal Control — Integrated Framework issued by the Committee of Sponsoring Organizations of the Treadway Commission (COSO), and our report dated April 27, 2011, expressed an unqualified opinion on the effectiveness of the Company’s internal control over financial reporting.
KPMG Auditores Consultores Ltda.
Santiago, Chile
April 27, 2011
© 2011 KPMG Auditores Consultores Ltda., a Chilean limited liability partnership and a member firm of the KPMG network of Independent member firms affiliated with KPMG International Cooperative (“KPMG International”), a Swiss entity. All rights reserved.

Report of Independent Registered Public Accounting Firm
The Board of Directors and Shareholders of
Empresa Nacional de Electricidad S.A.(Endesa-Chile):
We have audited Endesa-Chile’s internal control over financial reporting as of December 31, 2010, based on criteria established in Internal Control - Integrated Framework issued by the Committee of Sponsoring Organizations of the Treadway Commission (COSO). Endesa-Chile’s management is responsible for maintaining effective internal control over financial reporting and for its assessment of the effectiveness of internal control over financial reporting, included in the accompanying Management’s Annual Report on Internal Control over Financial Reporting. Our responsibility is to express an opinion on Endesa-Chile’s internal control over financial reporting based on our audit.
We conducted our audit in accordance with the standards of the Public Company Accounting Oversight Board (United States). Those standards require that we plan and perform the audit to obtain reasonable assurance about whether effective internal control over financial reporting was maintained in all material respects. Our audit included obtaining an understanding of internal control over financial reporting, assessing the risk that a material weakness exists, and testing and evaluating the design and operating effectiveness of internal control based on the assessed risk. Our audit also included performing such other procedures as we considered necessary in the circumstances. We believe that our audit provides a reasonable basis for our opinion.
A company’s internal control over financial reporting is a process designed to provide reasonable assurance regarding the reliability of financial reporting and the preparation of financial statements for external purposes in accordance with generally accepted accounting principles. A company’s internal control over financial reporting includes those policies and procedures that (1) pertain to the maintenance of records that, in reasonable detail, accurately and fairly reflect the transactions and dispositions of the assets of the company; (2) provide reasonable assurance that transactions are recorded as necessary to permit preparation of financial statements in accordance with generally accepted accounting principles, and that receipts and expenditures of the company are being made only in accordance with authorizations of management and directors of the company; and (3) provide reasonable assurance regarding prevention or timely detection of unauthorized acquisition, use, or disposition of the company’s assets that could have a material effect on the financial statements.
© 2011 KPMG Auditores Consultores Ltda., a Chilean limited liability partnership and a member firm of the KPMG network of Independent member firms affiliated with KPMG International Cooperative (“KPMG International”), a Swiss entity. All rights reserved.
Because of its inherent limitations, internal control over financial reporting may not prevent or detect misstatements. Also, projections of any evaluation of effectiveness to future periods are subject to the risk that controls may become inadequate because of changes in conditions, or that the degree of compliance with the policies or procedures may deteriorate.
In our opinion, Endesa-Chile maintained, in all material respects, effective internal control over financial reporting as of December 31, 2010, based on criteria established in Internal Control — Integrated Framework issued by the Committee of Sponsoring Organizations of the Treadway Commission.
We also have audited, in accordance with the standards of the Public Company Accounting Oversight Board (United States), the consolidated statement of financial position of Endesa-Chile and subsidiaries as of December 31, 2010, and the related consolidated statements of comprehensive income, changes in stockholder’s equity, and cash flows for the year then ended, and our report dated April 27, 2011 expressed an unqualified opinion on those consolidated financial statements.
KPMG Auditores Consultores Ltda.
Santiago, Chile
April 27, 2011
© 2011 KPMG Auditores Consultores Ltda., a Chilean limited liability partnership and a member firm of the KPMG network of Independent member firms affiliated with KPMG International Cooperative (“KPMG International”), a Swiss entity. All rights reserved.

REPORT OF INDEPENDENT REGISTERED PUBLIC ACCOUNTING FIRM
To the Board of Directors and Shareholders of
Endesa Brasil S.A.
Niterόi - RJ
We have audited the accompanying consolidated financial statements of Endesa Brasil S.A., and subsidiaries (the “Company”) as of December 31, 2010 and 2009, and the related consolidated statement of income, statement of comprehensive income, changes in shareholders’ equity and cash flows for the years then ended. These financial statements, prepared in accordance with accounting practice adopted in Brazil and presented in Brazilian real, are the responsibility of the Company’s Management. Our responsibility is to express an opinion on these financial statements based on our audits.
We conducted our audits in accordance with the auditing standards of the Public Company Accounting Oversight Board (United States). Those standards require that we plan and perform the audit to obtain reasonable assurance about whether the financial statements are free of material misstatement. The Company is not required to have, nor were we engaged to perform, an audit of its internal control over financial reporting. Our audits included consideration of internal control over financial reporting as a basis for designing audit procedures that are appropriate in the circumstances, but not for the purpose of expressing an opinion on the effectiveness of the Company’s internal control over financial reporting. Accordingly, we express no such opinion. An audit also includes examining, on a test basis, evidence supporting the amounts and disclosures in the financial statements, assessing the accounting principles used and significant estimates made by management, as well as evaluating the overall financial statement presentation. We believe that our audits provide a reasonable basis for our opinion.
In our opinion, the consolidated financial statements present fairly, in all material respects, the financial position of Endesa Brasil S.A. and subsidiaries as of December 31, 2010 and 2009, and the results of their operations and cash flows for the years then ended in accordance with accounting practices adopted in Brazil.
As discussed in note 2 to the financial statements, in the fiscal year 2010 the Company adopted the new accounting practices adopted in Brazil which contemplate the pronouncements, guidelines and interpretations issued by CPC — Accounting Pronouncements Committee and approved by CFC — Brazilian Federal Accounting Council. The new accounting practices adopted in Brazil substantially changed all accounting pronouncements and standards which were in use through December 31, 2009. Therefore, the financial statements for the year 2009 have been restated to reflect the new accounting standards.
As mentioned in note 1 to the consolidated financial statements, the subsidiary Companhia de Interconexão Energética — CIEN is discussing with the regulatory agencies to change C1EN’s “trading” activity to “transmission” activity, in order to obtain the Allowed Annual Revenue (RAP).
![]()
DELOITTE TOUCHE TOHMATSU
Auditores Independentes
Rio de Janeiro
April 26, 2011
| Deloitte Touche Tohmatsu Rio de Janeiro - RJ - 20030-021 Brasil
Tel: + 55 (21) 3981-0500 |

REPORT OF INDEPENDENT REGISTERED PUBLIC ACCOUNTING FIRM
To the Board of Directors and Shareholders of
Endesa Brasil S.A.
Niterόi - RJ
1. We have audited the accompanying consolidated balance sheets of Endesa Brasil S.A. and subsidiaries (the “Company”) as of December 31, 2009 and 2008, and the related consolidated statements of income, changes in shareholders’ equity, and cash flows for the years then ended. These financial statements, prepared in accordance with accounting practices adopted in Brazil and presented in Brazilian real, are the responsibility of the Company’s Management. Our responsibility is to express an opinion on these financial statements based on our audits.
2. We conducted our audits in accordance with the auditing standards of the Public Company Accounting Oversight Board (United States). Those standards require that we plan and perform the audit to obtain reasonable assurance about whether the financial statements are free of material misstatement. The Company is not required to have, nor were we engaged to perform, an audit of its internal control over financial reporting. Our audits included consideration of internal control over financial reporting as a basis for designing audit procedures that are appropriate in the circumstances, but not for the purpose of expressing an opinion on the effectiveness of the Company’s internal control over financial reporting. Accordingly, we express no such opinion. An audit also includes examining, on a test basis, evidence supporting the amounts and disclosures in the financial statements, assessing the accounting principles used and significant estimates made by management, as well as evaluating the overall financial statement presentation. We believe that our audits provide a reasonable basis for our opinion.
3. In our opinion, such consolidated financial statements present fairly, in all material respects, the financial position of Endesa Brasil S.A. and subsidiaries as of December 31, 2009 and 2008, and the results of their operations, changes in shareholders’ equity, and cash flows for the years then ended in accordance with accounting practices adopted in Brazil.
4. As mentioned in note 1 to the consolidated financial statements, the subsidiary Companhia de Interconexão Energética — CIEN is seeking alternatives for new businesses, including the discussions with the regulatory agencies to change CIEN’s “trading” activity to “transmission” activity, in order to obtain the Allowed Annual Revenue (RAP).
![]()
DELOITTE TOUCHE TOHMATSU
Auditores Independentes
Rio de Janeiro
May 25, 2010
| Deloitte & Touche Ltda. |
Carrera 7 No. 74 - 09 | |
Nit. 860.005.813-4 | |
Bogotá | |
| Colombia |
|
|
| Tel. +57(1) 5461810 |
| Fax. +57(1) 2178088 |
| www.deloitte.com/co |
REPORT OF INDEPENDENT REGISTERED PUBLIC ACCOUNTING FIRM
To the Board of Directors and Shareholders of
Emgesa S.A. E.S.P.:
We have audited the balance sheet of EMGESA S.A. E.S.P. (the “Company”) as of December 31, 2010, and the statements of income, shareholders’ equity and cash flows for the three month period ended December 31, 2010 and the nine month period ended September 30, 2010. These financial statements are the responsibility of the Company’s management (none of which are included herein). Our responsibility is to express an opinion on these financial statements based on our audits.
We conducted our audits in accordance with the standards of the Public Company Accounting Oversight Board (United States of America). Those standards require that we plan and perform the audit to obtain reasonable assurance about whether the financial statements are free of material misstatement. The Company is not required to have, nor were we engaged to perform, an audit of its internal control over financial reporting. Our audits included consideration of internal control over financial reporting as a basis for designing audit procedures that are appropriate in the circumstances, but not for the purpose of expressing an opinion on the effectiveness of the Company’s internal control over financial reporting. Accordingly, we express no such opinion. An audit also includes examining, on a test basis, evidence supporting the amounts and disclosures in the financial statements, assessing the accounting principles used and significant estimates made by management, as well as evaluating the overall financial statement presentation. We believe that our audits provide a reasonable basis for our opinion.
In our opinion, such financial statements present fairly, in all material respects, the financial position of EMGESA S.A. E.S.P. as of December 31, 2010, and the results of its operations and its cash flows for the three month period ended December 31, 2010, and the nine month period ended September 30, 2010, in conformity with accounting principles generally accepted in Colombia.
![]()
Deloitte & Touche Ltda.
Bogotá, Colombia
March 25, 2011
© 2011 Deloitte Touche Tohmatsu.
Deloitte se refiere a una o más de las firmas miembros de Deloitte Touche Tohmatsu Limited, una compañia privada del Reino Unido limitada por garantia, y su red de firmas miembros, cada una como una entidad única e independiente y legalmente separada. Una descripción detallada de la estructura legal de Deloitte Touche Tohmatsu Limited y sus firmas miembros puede verse en el sitio web www.deloitte.com/about.
“ Deloitte Touche Tohmatsu Limited es una compañia privada limitada por garantia constituida en Inglaterra & Gales bajo el número 07271800, y su domicilio registrado: Hill House, 1 Little New Street, London, EC4A 3TR, Reino Unido”
| Deloitte & Touche Ltda. |
Carrera 7 No. 74 - 09 | |
Nit. 860.005.813-4 | |
Bogotá | |
Colombia | |
|
|
| Tel. +57(1) 5461810 |
| Fax. +57(1) 2178088 |
| www.deloitte.com/co |
REPORT OF INDEPENDENT REGISTERED PUBLIC ACCOUNTING FIRM
To the Board of Directors and Shareholders of
Emgesa S.A. E.S.P.:
We have audited the accompanying balance sheet of EMGESA S.A. E.S.P. (the “Company”) as of December 31, 2009, and the statements of income, shareholders’ equity and cash flows for each of the two years in the period ended December 31, 2009 (none of which are included herein). These financial statements are the responsibility of the Company’s management. Our responsibility is to express an opinion on these financial statements based on our audits.
We conducted our audits in accordance with the standards of the Public Company Accounting Oversight Board (United States of America). Those standards require that we plan and perform the audit to obtain reasonable assurance about whether the financial statements are free of material misstatement. The Company is not required to have, nor were we engaged to perform, an audit of its internal control over financial reporting. Our audits included consideration of internal control over financial reporting as a basis for designing audit procedures that are appropriate in the circumstances, but not for the purpose of expressing an opinion on the effectiveness of the Company’s internal control over financial reporting. Accordingly, we express no such opinion. An audit also includes examining, on a test basis, evidence supporting the amounts and disclosures in the financial statements, assessing the accounting principles used and significant estimates made by management, as well as evaluating the overall financial statement presentation. We believe that our audits provide a reasonable basis for our opinion.
In our opinion, such financial statements present fairly, in all material respects, the financial position of EMGESA S.A. E.S.P. as of December 31, 2009, and the results of its operations and its cash flows for each of the two years in the period ended December 31, 2009, in conformity with accounting principles generally accepted in Colombia.
![]()
Deloitte & Touche Ltda.
Bogotá, Colombia
March 25, 2011
© 2011 Deloitte Touche Tohmatsu
Deloitte se refiere a una o más de las firmas miembros de Deloitte Touche Tohmatsu Limited, una compañia privada del Reino Unido limitada por garantia, y su red de firmas miembros, cada una como una entidad única e independiente y legalmente separada. Una descripcion detallada de la estructura legal de Deloitte Touche Tohmatsu Limited y sus firmas miembros puede verse en el sitio web www.deloitte,com/about
“ Deloitte Touche Tohmatsu Limited es una compañia privada limitada por garantia constituida en Inglaterra & Gales bajo el número 07271800, y su domicilio registrado: Hill House, 1 Little New Street, London, EC4A 3TR, Reino Unido”
ENERSIS S.A. AND SUBSIDIARIES
Consolidated Statements of Financial Position
As of December 31, 2010 and 2009
(In thousands of Chilean pesos - ThCh$)
|
|
|
| 12-31-2010 |
| 12-31-2009 |
|
|
| Note |
| ThCh$ |
| ThCh$ |
|
|
|
|
|
|
|
|
|
ASSETS |
|
|
|
|
|
|
|
CURRENT ASSETS |
|
|
|
|
|
|
|
Cash and cash equivalents |
| 5 |
| 961,355,037 |
| 1,134,900,821 |
|
Other current financial assets |
| 6 |
| 7,817,509 |
| 1,536,149 |
|
Other current non-financial assets |
|
|
| 35,993,248 |
| 35,181,784 |
|
Trade and other current receivables |
| 7 |
| 1,038,098,240 |
| 1,141,966,600 |
|
Accounts receivable from related companies |
| 8 |
| 20,471,607 |
| 19,014,232 |
|
Inventories |
| 9 |
| 62,651,704 |
| 56,319,268 |
|
Current tax assets |
| 10 |
| 137,987,341 |
| 112,175,952 |
|
Total current assets other than assets classified as held for sale and discontinued operations |
|
|
| 2,264,374,686 |
| 2,501,094,806 |
|
Non-current assets classified as held for sale and discontinued operation |
| 11 |
| 73,893,290 |
| 70,360,851 |
|
TOTAL CURRENT ASSETS |
|
|
| 2,338,267,976 |
| 2,571,455,657 |
|
|
|
|
|
|
|
|
|
NON-CURRENT ASSETS |
|
|
|
|
|
|
|
Other non-current financial assets |
| 6 |
| 62,968,722 |
| 30,496,757 |
|
Other non-current non-financial assets |
|
|
| 103,736,295 |
| 94,255,253 |
|
Non-current receivables |
| 7 |
| 319,567,960 |
| 194,977,413 |
|
Investment accounted for using equity method |
| 12 |
| 14,101,652 |
| 21,281,461 |
|
Intangible assets other than goodwill |
| 13 |
| 1,452,586,405 |
| 1,446,122,245 |
|
Goodwill |
| 14 |
| 1,477,021,924 |
| 1,501,351,933 |
|
Property, plant and equipment, net |
| 15 |
| 6,751,940,655 |
| 6,864,071,242 |
|
Investment property |
| 16 |
| 33,019,154 |
| 31,231,839 |
|
Deferred tax assets |
| 17 |
| 452,634,364 |
| 454,896,521 |
|
TOTAL NON-CURRENT ASSETS |
|
|
| 10,667,577,131 |
| 10,638,684,664 |
|
|
|
|
|
|
|
|
|
TOTAL ASSETS |
|
|
| 13,005,845,107 |
| 13,210,140,321 |
|
The attached notes are an integral part of these consolidated financial statements
ENERSIS S.A. AND SUBSIDIARIES
Consolidated Statements of Financial Position
As of December 31, 2010 and 2009
(In thousands of Chilean pesos — ThCh$)
|
|
|
| 12-31-2010 |
| 12-31-2009 |
|
|
| Note |
| ThCh$ |
| ThCh$ |
|
|
|
|
|
|
|
|
|
LIABILITIES AND EQUITY |
|
|
|
|
|
|
|
CURRENT LIABILITIES |
|
|
|
|
|
|
|
Other current financial liabilities |
| 18 |
| 665,598,018 |
| 729,028,195 |
|
Trade and other current payables |
| 21 |
| 1,224,489,998 |
| 979,906,352 |
|
Accounts payable to related companies |
| 8 |
| 148,202,260 |
| 111,955,779 |
|
Other short-term provisions |
| 22 |
| 115,449,236 |
| 100,024,455 |
|
Current tax liabilities |
| 10 |
| 147,666,655 |
| 185,285,671 |
|
Current provisions for employee benefits |
| 23 |
| 5,450,382 |
| 4,915,167 |
|
Other current non-financial liabilities |
|
|
| 35,790,548 |
| 33,621,553 |
|
Total current liabilities other than liabilities associated with non-current assets classified as held for sale and discontinued operations |
|
|
| 2,342,647,097 |
| 2,144,737,172 |
|
Liabilities associated with non-current assets classified as held for sale and discontinued operations |
| 11 |
| 64,630,389 |
| 50,650,366 |
|
TOTAL CURRENT LIABILITIES |
|
|
| 2,407,277,486 |
| 2,195,387,538 |
|
|
|
|
|
|
|
|
|
NON-CURRENT LIABILITIES |
|
|
|
|
|
|
|
Other non-current financial liabilities |
| 18 |
| 3,014,956,447 |
| 3,533,443,820 |
|
Other non-current payables |
| 21 |
| 37,236,712 |
| 68,909,402 |
|
Accounts payable to related companies |
| 8 |
| 1,084,290 |
| 3,556,672 |
|
Other-long term provisions |
| 22 |
| 225,522,329 |
| 250,286,912 |
|
Deferred tax liabilities |
| 17 |
| 555,923,578 |
| 573,049,297 |
|
Non-current provisions for employee benefits |
| 23 |
| 215,818,975 |
| 182,688,990 |
|
Other non-current non-financial liabilities |
|
|
| 33,997,334 |
| 25,814,046 |
|
TOTAL NON-CURRENT LIABILITIES |
|
|
| 4,084,539,665 |
| 4,637,749,139 |
|
TOTAL LIABLITIES |
|
|
| 6,491,817,151 |
| 6,833,136,677 |
|
|
|
|
|
|
|
|
|
EQUITY |
|
|
|
|
|
|
|
Issued capital |
| 24 |
| 2,824,882,835 |
| 2,824,882,835 |
|
Retained earnings |
| 24 |
| 2,103,689,509 |
| 1,817,613,206 |
|
Share premium |
| 24 |
| 158,759,648 |
| 158,759,648 |
|
Other reserves |
| 24.5 |
| (1,351,787,356 | ) | (1,282,776,134 | ) |
Equity attributable to owners of parent |
|
|
| 3,735,544,636 |
| 3,518,479,555 |
|
Non-controlling interests |
| 24.6 |
| 2,778,483,320 |
| 2,858,524,089 |
|
TOTAL EQUITY |
|
|
| 6,514,027,956 |
| 6,377,003,644 |
|
|
|
|
|
|
|
|
|
TOTAL LIABILITIES AND EQUITY |
|
|
| 13,005,845,107 |
| 13,210,140,321 |
|
The attached notes are an integral part of these consolidated financial statements
ENERSIS S.A. AND SUBSIDIARIES
Consolidated Statements of Comprehensive Income
For the years ended December 31, 2010, 2009 and 2008
(In thousands of Chilean pesos - ThCh$, except share data)
|
|
|
| 2010 |
| 2009 |
| 2008 |
|
|
| Note |
| ThCh$ |
| ThCh$ |
| ThCh$ |
|
|
|
|
|
|
|
|
|
|
|
STATEMENT OF COMPREHENSIVE INCOME |
|
|
|
|
|
|
|
|
|
Sales |
| 25 |
| 6,179,229,824 |
| 6,113,283,615 |
| 6,100,864,285 |
|
Other operating income |
| 25 |
| 384,351,289 |
| 358,772,038 |
| 479,080,416 |
|
Total Revenues |
|
|
| 6,563,581,113 |
| 6,472,055,653 |
| 6,579,944,701 |
|
|
|
|
|
|
|
|
|
|
|
Raw materials and consumable used |
| 26 |
| (3,521,646,254 | ) | (3,210,593,577 | ) | (3,547,990,286 | ) |
Contribution Margin |
|
|
| 3,041,934,859 |
| 3,261,462,076 |
| 3,031,954,415 |
|
|
|
|
|
|
|
|
|
|
|
Other work performed by entity and capitalized |
|
|
| 44,869,365 |
| 33,730,519 |
| 32,599,560 |
|
Employee benefits expense |
| 27 |
| (374,678,013 | ) | (370,402,445 | ) | (322,628,433 | ) |
Depreciation and amortization expense |
| 28 |
| (449,017,275 | ) | (454,369,959 | ) | (417,710,326 | ) |
Reversal of impairment loss (impairment loss) recognized in profit or loss |
| 28 |
| (108,373,429 | ) | (85,285,525 | ) | (20,353,265 | ) |
Other expenses |
| 29 |
| (450,434,769 | ) | (457,689,197 | ) | (440,211,323 | ) |
Operating Income |
|
|
| 1,704,300,738 |
| 1,927,445,469 |
| 1,863,650,628 |
|
|
|
|
|
|
|
|
|
|
|
Other gains (losses) |
| 30 |
| 11,983,434 |
| 50,640,278 |
| 2,538,961 |
|
Financial income |
| 31 |
| 171,236,948 |
| 159,670,405 |
| 181,753,335 |
|
Financial costs |
| 31 |
| (438,358,251 | ) | (482,472,627 | ) | (515,108,257 | ) |
Share of the profit (loss) of associates accounted for using the equity method |
| 12 |
| 1,015,739 |
| 2,235,579 |
| 3,261,180 |
|
Foreign currency exchange differences |
| 31 |
| 11,572,474 |
| (8,235,253 | ) | (23,632,778 | ) |
Gain (loss) for indexed assets and liabilities |
| 31 |
| (15,055,706 | ) | 21,781,329 |
| (62,378,252 | ) |
|
|
|
|
|
|
|
|
|
|
Net Income Before Tax |
|
|
| 1,446,695,376 |
| 1,671,065,180 |
| 1,450,084,817 |
|
Income tax |
| 32 |
| (346,006,968 | ) | (359,737,610 | ) | (415,902,784 | ) |
Net Income from continuing operations |
|
|
| 1,100,688,408 |
| 1,311,327,570 |
| 1,034,182,033 |
|
Net Income from discontinued operations |
|
|
| — |
| — |
| — |
|
Net Income |
|
|
| 1,100,688,408 |
| 1,311,327,570 |
| 1,034,182,033 |
|
Attributable to: |
|
|
|
|
|
|
|
|
|
Owners of parent |
|
|
| 486,226,814 |
| 660,231,043 |
| 507,589,633 |
|
Non-controlling interests |
|
|
| 614,461,594 |
| 651,096,527 |
| 526,592,400 |
|
Net Income |
|
|
| 1,100,688,408 |
| 1,311,327,570 |
| 1,034,182,033 |
|
|
|
|
|
|
|
|
|
|
|
Basic earnings per share |
|
|
|
|
|
|
|
|
|
Basic earnings per share from continuing operations |
| Ch$/share |
| 14.89 |
| 20.22 |
| 15.55 |
|
Basic earnings per share |
| Ch$/share |
| 14.89 |
| 20.22 |
| 15.55 |
|
|
|
|
|
|
|
|
|
|
|
Diluted earnings per share |
|
|
|
|
|
|
|
|
|
Diluted earnings per share from continuing operations |
| Ch$/share |
| 14.89 |
| 20.22 |
| 15.55 |
|
Diluted earnings per share |
| Ch$/share |
| 14.89 |
| 20.22 |
| 15.55 |
|
The attached notes are an integral part of these consolidated financial statements
ENERSIS S.A. AND SUBSIDIARIES
Consolidated Statements of Comprehensive Income
For the years ended December 31, 2010, 2009 and 2008
(In thousands of Chilean pesos - ThCh$)
|
|
|
| 2010 |
| 2009 |
| 2008 |
|
|
| Note |
| ThCh$ |
| ThCh$ |
| ThCh$ |
|
STATEMENT OF COMPREHENSIVE INCOME |
|
|
|
|
|
|
|
|
|
Net income |
|
|
| 1,100,688,408 |
| 1,311,327,570 |
| 1,034,182,033 |
|
Components of other comprehensive income, before tax |
|
|
|
|
|
|
|
|
|
Exchange differences on translation |
|
|
|
|
|
|
|
|
|
Foreign currency translation gains (losses) |
|
|
| (138,554,045 | ) | (246,854,956 | ) | 191,370,521 |
|
|
|
|
|
|
|
|
|
|
|
Available-for-sale financial assets |
|
|
|
|
|
|
|
|
|
Gain (losses) on exchange differences on translation, before tax |
|
|
| (179 | ) | 61,031 |
| 436 |
|
|
|
|
|
|
|
|
|
|
|
Cash flow hedge |
|
|
|
|
|
|
|
|
|
Gains (losses) on cash flow hedge, before tax |
|
|
| 50,576,145 |
| 201,567,024 |
| (278,888,089 | ) |
Reclassification adjustments on cash flow hedge, before tax |
|
|
| (19,664,842 | ) | (8,765,356 | ) | (22,119,660 | ) |
Total cash flow hedge |
|
|
| 30,911,303 |
| 192,801,668 |
| (301,007,749 | ) |
|
|
|
|
|
|
|
|
|
|
Actuarial gains (losses) on defined benefit plans |
|
|
| (48,495,375 | ) | (15,599,453 | ) | (34,060,925 | ) |
Total other Components of other comprehensive income, before tax |
|
|
| (156,138,296 | ) | (69,591,710 | ) | (143,697,717 | ) |
|
|
|
|
|
|
|
|
|
|
Income tax relating to components of other comprehensive income |
|
|
|
|
|
|
|
|
|
Income tax relating to available-for-sale financial assets of other comprehensive income |
|
|
| 31 |
| (10,528 | ) | (3 | ) |
Income tax relating to cash flow hedge of other comprehensive income |
|
|
| (5,301,050 | ) | (33,917,966 | ) | 46,849,978 |
|
Income tax relating to defined benefit plans of other comprehensive income |
|
|
| 16,515,279 |
| 1,369,374 |
| 11,439,369 |
|
Total income tax |
|
|
| 11,214,260 |
| (32,559,120 | ) | 58,289,344 |
|
|
|
|
|
|
|
|
|
|
|
Other Comprehensive Income |
|
|
| (144,924,036 | ) | (102,150,830 | ) | (85,408,373 | ) |
Total Comprehensive Income |
|
|
| 955,764,372 |
| 1,209,176,740 |
| 948,773,660 |
|
Comprehensive income attributable to |
|
|
|
|
|
|
|
|
|
Owners of parent |
|
|
| 396,687,094 |
| 655,007,019 |
| 433,164,534 |
|
Non-controlling interests |
|
|
| 559,077,278 |
| 554,169,721 |
| 515,609,126 |
|
Total Comprehensive Income |
|
|
| 955,764,372 |
| 1,209,176,740 |
| 948,773,660 |
|
The attached notes are an integral part of these consolidated financial statements
ENERSIS S. A. AND SUBSIDIARIES
Consolidated Statements of Changes in Equity
For the years ended December 31, 2010, 2009 and 2008.
(In thousands of Chilean pesos - ThCh$)
Changes in other reserves
Statement of changes in Equity, Net |
| Issued capital |
| Share |
| Reserve of |
| Reserve of cash |
| Reserve of |
| Reserve of gains |
| Other |
| Other reserves |
| Retained |
| Equity |
| Non- |
| Total Equity |
|
Equity at beginning of period 1/01/2010 |
| 2,824,882,835 |
| 158,759,648 |
| 196,973,210 |
| (188,691,145 | ) | — |
| 41,699 |
| (1,291,099,898 | ) | (1,282,776,134 | ) | 1,817,613,206 |
| 3,518,479,555 |
| 2,858,524,089 |
| 6,377,003,644 |
|
Changes in equity |
| — |
| — |
| — |
| — |
| — |
| — |
| — |
| — |
| — |
| — |
| — |
| — |
|
Comprehensive income |
| — |
| — |
| — |
| — |
| — |
| — |
| — |
| — |
| — |
| — |
| — |
| — |
|
Net income |
| — |
| — |
| — |
| — |
| — |
| — |
| — |
| — |
| 486,226,814 |
| 486,226,814 |
| 614,461,594 |
| 1,100,688,408 |
|
Other comprehensive income |
| — |
| — |
| (83,694,320 | ) | 14,682,972 |
| (20,528,498 | ) | 126 |
| — |
| (89,539,720 | ) | — |
| (89,539,720 | ) | (55,384,316 | ) | (144,924,036 | ) |
Comprehensive income |
| — |
| — |
| — |
| — |
| — |
| — |
| — |
| — |
| — |
| 396,687,094 |
| 559,077,278 |
| 955,764,372 |
|
Dividends |
| — |
| — |
| — |
| — |
| — |
| — |
| — |
| — |
| (179,622,013 | ) | (179,622,013 | ) | — |
| (179,622,013 | ) |
Increase (decrease) through transfers and other changes |
| — |
| — |
| — |
| — |
| 20,528,498 |
| — |
| — |
| 20,528,498 |
| (20,528,498 | ) | — |
| (639,118,047 | ) | (639,118,047 | ) |
Total changes in equity |
| — |
| — |
| (83,694,320 | ) | 14,682,972 |
| — |
| 126 |
| — |
| (69,011,222 | ) | 286,076,303 |
| 217,065,081 |
| (80,040,769 | ) | 137,024,312 |
|
|
|
|
|
|
|
|
|
|
|
|
|
|
|
|
|
|
|
|
|
|
|
|
|
|
|
Equity at end of period 12/31/2010 |
| 2,824,882,835 |
| 158,759,648 |
| 113,278,890 |
| (174,008,173 | ) | — |
| 41,825 |
| (1,291,099,898 | ) | (1,351,787,356 | ) | 2,103,689,509 |
| 3,735,544,636 |
| 2,778,483,320 |
| 6,514,027,956 |
|
Changes in other reserves
Statement of changes in Equity, Net |
| Issued capital |
| Share |
| Reserve of |
| Reserve of cash |
| Reserve of |
| Reserve of gains |
| Other |
| Other reserves |
| Retained |
| Equity |
| Non- |
| Total Equity |
|
Equity at beginning of period 01/01/2009 |
| 2,824,882,835 |
| 158,759,648 |
| 283,959,611 |
| (276,767,607 | ) | — |
| 9,565 |
| (1,291,099,898 | ) | (1,283,898,329 | ) | 1,391,570,726 |
| 3,091,314,880 |
| 2,937,816,340 |
| 6,029,131,220 |
|
Changes in equity |
| — |
| — |
| — |
| — |
| — |
| — |
| — |
| — |
| — |
| — |
| — |
| — |
|
Comprehensive income |
| — |
| — |
| — |
| — |
| — |
| — |
| — |
| — |
| — |
| — |
| — |
| — |
|
Net income |
| — |
| — |
| — |
| — |
| — |
| — |
| — |
| — |
| 660,231,043 |
| 660,231,043 |
| 651,096,527 |
| 1,311,327,570 |
|
Other comprehensive income |
| — |
| — |
| (86,986,401 | ) | 88,076,462 |
| (6,346,219 | ) | 32,134 |
| — |
| (5,224,024 | ) | — |
| (5,224,024 | ) | (96,926,806 | ) | (102,150,830 | ) |
Comprehensive income |
| — |
| — |
| — |
| — |
| — |
| — |
| — |
| — |
| — |
| 655,007,019 |
| 554,169,721 |
| 1,209,176,740 |
|
Dividends |
| — |
| — |
| — |
| — |
| — |
| — |
| — |
| — |
| (227,842,344 | ) | (227,842,344 | ) | — |
| (227,842,344 | ) |
Increase (decrease) through transfers and other changes |
| — |
| — |
| — |
| — |
| 6,346,219 |
| — |
| — |
| 6,346,219 |
| (6,346,219 | ) | — |
| (633,461,972 | ) | (633,461,972 | ) |
Total changes in equity |
| — |
| — |
| (86,986,401 | ) | 88,076,462 |
| — |
| 32,134 |
| — |
| 1,122,195 |
| 426,042,480 |
| 427,164,675 |
| (79,292,251 | ) | 347,872,424 |
|
|
|
|
|
|
|
|
|
|
|
|
|
|
|
|
|
|
|
|
|
|
|
|
|
|
|
Equity at end of period 12/31/2009 |
| 2,824,882,835 |
| 158,759,648 |
| 196,973,210 |
| (188,691,145 | ) | — |
| 41,699 |
| (1,291,099,898 | ) | (1,282,776,134 | ) | 1,817,613,206 |
| 3,518,479,555 |
| 2,858,524,089 |
| 6,377,003,644 |
|
The attached notes are an integral part of these consolidated financial statements
ENERSIS S. A. AND SUBSIDIARIES
Consolidated Statements of Changes in Equity
For the years ended December 31, 2010, 2009 and 2008.
(In thousands of Chilean pesos - ThCh$)
Changes in other reserves
Statement of changes in Equity, Net |
| Issued capital |
| Share |
| Reserve of |
| Reserve of cash |
| Reserve of |
| Reserve of gains |
| Other |
| Other reserves |
| Retained |
| Equity |
| Non- |
| Total Equity |
|
Equity at beginning of period 01/01/2008 |
| 2,594,015,459 |
| 158,759,648 |
| 199,615,814 |
| (44,390,168 | ) | — |
| 9,108 |
| (841,137,396 | ) | (685,902,642 | ) | 834,258,472 |
| 2,901,130,937 |
| 2,604,433,149 |
| 5,505,564,086 |
|
Changes in equity |
| — |
| — |
| — |
| — |
| — |
| — |
| — |
| — |
| — |
| — |
| — |
| — |
|
Comprehensive income |
| — |
| — |
| — |
| — |
| — |
| — |
| — |
| — |
| — |
| — |
| — |
| — |
|
Net income |
| — |
| — |
| — |
| — |
| — |
| — |
| — |
| — |
| 507,589,633 |
| 507,589,633 |
| 526,592,400 |
| 1,034,182,033 |
|
Other comprehensive income |
| — |
| — |
| 84,591,396 |
| (145,917,895 | ) | (13,099,057 | ) | 457 |
| — |
| (74,425,099 | ) | — |
| (74,425,099 | ) | (10,983,274 | ) | (85,408,373 | ) |
Comprehensive income |
| — |
| — |
| — |
| — |
| — |
| — |
| — |
| — |
| — |
| 433,164,534 |
| 515,609,126 |
| 948,773,660 |
|
Dividends |
| — |
| — |
| — |
| — |
| — |
| — |
| — |
| — |
| (242,980,591 | ) | (242,980,591 | ) | — |
| (242,980,591 | ) |
Increase (decrease) through transfers and other changes |
| 230,867,376 |
| — |
| (247,599 | ) | (86,459,544 | ) | 13,099,057 |
| — |
| (449,962,502 | ) | (523,570,588 | ) | 292,703,212 |
| — |
| (182,225,935 | ) | (182,225,935 | ) |
Total changes in equity |
| 230,867,376 |
| — |
| 84,343,797 |
| (232,377,439 | ) | — |
| 457 |
| (449,962,502 | ) | (597,995,687 | ) | 557,312,254 |
| 190,183,943 |
| 333,383,191 |
| 523,567,134 |
|
|
|
|
|
|
|
|
|
|
|
|
|
|
|
|
|
|
|
|
|
|
|
|
|
|
|
Equity at end of period 12/31/2008 |
| 2,824,882,835 |
| 158,759,648 |
| 283,959,611 |
| (276,767,607 | ) | — |
| 9,565 |
| (1,291,099,898 | ) | (1,283,898,329 | ) | 1,391,570,726 |
| 3,091,314,880 |
| 2,937,816,340 |
| 6,029,131,220 |
|
The attached notes are an integral part of these consolidated financial statements
ENERSIS S.A. AND SUBSIDIARIES
Consolidated Statements of Cash Flows
For the years ended December 31, 2010, 2009 and 2008
(In thousands of Chilean pesos - ThCh$)
|
|
|
| 2010 |
| 2009 |
| 2008 |
|
|
| Note |
| ThCh$ |
| ThCh$ |
| ThCh$ |
|
Indirect Statement of Cash Flow |
|
|
|
|
|
|
|
|
|
Cash flows from (used in) operating activities |
|
|
|
|
|
|
|
|
|
Net income |
|
|
| 1,100,688,408 |
| 1,311,327,570 |
| 1,034,182,033 |
|
Adjustments to reconcile net income |
|
|
|
|
|
|
|
|
|
Adjustments for income tax expense |
| 32 |
| 346,006,968 |
| 359,737,610 |
| 415,902,784 |
|
Adjustments for decrease (increase) in inventories |
|
|
| 13,375,040 |
| 31,682,662 |
| 8,248,778 |
|
Adjustments for decrease (increase) in trade accounts receivable |
|
|
| (164,046,056 | ) | 112,512,315 |
| (168,319,588 | ) |
Adjustments for decrease (increase) in other operating receivables |
|
|
| (171,236,948 | ) | (159,670,405 | ) | (181,753,335 | ) |
Adjustments for increase (decrease) in trade accounts payable |
|
|
| 128,804,617 |
| (218,629,211 | ) | (55,137,025 | ) |
Adjustments for increase (decrease) in other operating payables |
|
|
| 453,413,957 |
| 460,691,298 |
| 577,486,509 |
|
Adjustments for depreciation and amortization expense |
| 28 |
| 449,017,275 |
| 454,369,959 |
| 417,710,326 |
|
Adjustments for impairment loss (reversal of impairment loss) recognised in profit or loss |
| 28 |
| 108,373,429 |
| 85,285,525 |
| 20,353,265 |
|
Adjustments for provisions |
|
|
| (29,193,303 | ) | 16,436,304 |
| (22,406,116 | ) |
Adjustments for unrealized foreign exchange losses (gains) |
| 31 |
| (11,572,474 | ) | 8,235,523 |
| 23,632,778 |
|
Adjustments for undistributed profits of associates |
|
|
| (1,015,739 | ) | (2,235,579 | ) | (3,261,180 | ) |
Other adjustments for non-cash items |
|
|
| 71,286,149 |
| (53,398,066 | ) | 5,959,027 |
|
Total adjustments to reconcile net income |
|
|
| 1,193,212,915 |
| 1,095,017,935 |
| 1,038,416,223 |
|
|
|
|
|
|
|
|
|
|
|
Income taxes refund (paid) |
|
|
| (349,296,688 | ) | (367,981,146 | ) | (160,176,953 | ) |
Other inflows (outflows) of cash |
|
|
| (1,189,488 | ) | (34,668 | ) | (1,224,517 | ) |
Net cash flows from (used in) operating activities |
|
|
| 1,943,415,147 |
| 2,038,329,691 |
| 1,911,196,786 |
|
|
|
|
|
|
|
|
|
|
|
Cash flows from (used in) investing activities |
|
|
|
|
|
|
|
|
|
Cash flows used to acquire non-controlling interests |
|
|
| — |
| (290,471,658 | ) | — |
|
Other cash payments to acquire interests in joint ventures |
|
|
| — |
| (19,912,162 | ) | — |
|
Loans to related companies |
|
|
| — |
| (8,615,091 | ) | (27,298,838 | ) |
Proceeds from sales of property, plant and equipment |
|
|
| 8,889,879 |
| 7,559,368 |
| 14,139,478 |
|
Purchase of property, plant and equipment |
|
|
| (473,921,829 | ) | (526,521,933 | ) | (496,750,943 | ) |
Proceeds from sales of intangible assets |
|
|
| 1,424,691 |
| 5,292,416 |
| — |
|
Purchase of intangible assets |
|
|
| (227,418,842 | ) | (209,939,738 | ) | (284,740,824 | ) |
Proceeds from other long-term assets |
|
|
| — |
| 190,166,892 |
| 7,730,911 |
|
Purchase of other long-term assets |
|
|
| — |
| (12,641 | ) | (50,359 | ) |
Dividends received |
|
|
| 3,278,931 |
| 2,675,741 |
| 5,826,418 |
|
Interest received |
|
|
| 6,807,678 |
| 4,346,438 |
| 11,043,445 |
|
Other inflows (outflows) of cash |
|
|
| (94,841,624 | ) | (21,834,208 | ) | 62,999,998 |
|
Net cash flows from (used in) investing activities |
|
|
| (775,781,116 | ) | (867,266,576 | ) | (707,100,714 | ) |
|
|
|
|
|
|
|
|
|
|
Cash flows from (used in) financing activities |
|
|
|
|
|
|
|
|
|
|
|
|
|
|
|
|
|
|
|
Proceeds from borrowings |
|
|
| 263,124,754 |
| 826,440,011 |
| 1,424,250,917 |
|
Proceeds from loans from related companies |
|
|
| 821,636 |
| — |
| 412,223 |
|
Repayments of borrowings |
|
|
| (740,286,720 | ) | (1,283,351,536 | ) | (1,223,027,402 | ) |
Payments of finance lease liabilities |
|
|
| (24,129,963 | ) | (3,171,884 | ) | (6,996,069 | ) |
Repayment of loans to related companies |
|
|
| — |
| (16,986,597 | ) | (14,159,571 | ) |
Dividends paid |
|
|
| (556,087,040 | ) | (578,607,484 | ) | (460,210,179 | ) |
Interest paid |
|
|
| (244,595,847 | ) | (252,736,851 | ) | (230,036,860 | ) |
Other inflows (outflows) of cash |
|
|
| 18,132,411 |
| 8,350 |
| 470,255 |
|
Net cash flows from (used in) financing activities |
|
|
| (1,283,020,769 | ) | (1,308,405,991 | ) | (509,296,686 | ) |
|
|
|
|
|
|
|
|
|
|
Net increase (decrease) in cash and cash equivalents before effect of exchange rate changes |
|
|
| (115,386,738 | ) | (137,342,876 | ) | (694,799,386 | ) |
|
|
|
|
|
|
|
|
|
|
Effect of exchange rate changes on cash and cash equivalents |
|
|
|
|
|
|
|
|
|
Effect of exchange rate changes on cash and cash equivalents |
|
|
| (58,159,046 | ) | (45,818,128 | ) | 34,385,374 |
|
Net increase (decrease) in cash and cash equivalents |
|
|
| (173,545,784 | ) | (183,161,004 | ) | 729,184,760 |
|
Cash and cash equivalents at beginning of period |
| 5 |
| 1,134,900,821 |
| 1,318,061,825 |
| 588,877,065 |
|
Cash and cash equivalents at end of period |
| 5 |
| 961,355,037 |
| 1,134,900,821 |
| 1,318,061,825 |
|
The attached notes are an integral part of these consolidated financial statements
ENERSIS S.A. AND SUBSIDIARIES
NOTES TO THE CONSOLIDATED FINANCIAL STATEMENTS
Index |
| ||
|
| ||
1. | Financial statements and activities of the Group | ||
|
| ||
2. | Basis of presentation of the consolidated financial statements | ||
| 2.1 | Accounting principles | |
| 2.2 | New accounting pronouncements | |
| 2.3 | Responsibility for the information and estimates made | |
| 2.4 | Subsidiaries and jointly controlled entities | |
|
| 2.4.1. | Changes in the scope of consolidation |
|
| 2.4.2. | Companies consolidated with less than 50% share |
|
| 2.4.3. | Companies not consolidated with greater 50% share |
| 2.5 | Basis of consolidation and business combinations | |
| 2.6 | Reclassifications | |
|
|
|
|
3. | Accounting principles applied | ||
| a) | Property, plant and equipment | |
| b) | Investment property | |
| c) | Goodwill | |
| d) | Intangible assets other than goodwill | |
|
| d.1) | Concessions |
|
| d.2) | Research and development expenses |
|
| d.3) | Other intangible assets |
| e) | Asset impairment | |
| f) | Leases | |
| g) | Financial instruments | |
|
| g.1) | Financial assets other than derivatives |
|
| g.2) | Cash and cash equivalents |
|
| g.3) | Financial liabilities other than derivatives |
|
| g.4) | Derivative financial instruments and hedge accounting |
|
| g.5) | Fair value measurements and classifications of financial instruments |
|
| g.6) | Derecognition of financial assets |
| h) | Investments accounted for using equity method | |
| i) | Inventories | |
| j) | Non-current assets held for sale and discontinued operations | |
| k) | Treasury shares | |
| l) | Provisions | |
|
| l.1) | Provisions for post-employment benefit and similar obligations |
| m) | Conversion of balances in foreign currency | |
| n) | Current/Non-current classification | |
| o) | Income tax | |
| p) | Revenue and expense recognition | |
| q) | Earnings per share | |
| r) | Dividends | |
| s) | Cash flow statement | |
|
|
| |
4. | Sector regulation and electricity system operations | ||
| 4.1 | Generation | |
| 4.2 | Distribution | |
|
|
|
|
5. | Cash and cash equivalents | ||
6. | Other financial assets | ||
|
| ||
7. | Trade and other receivables | ||
|
|
| |
8. | Balances and transactions with related companies | ||
| 8.1 | Balances and transactions with related companies | |
| a) | Receivables from related companies | |
| b) | Payables to related companies | |
| c) | Significant transactions and income/expense effects | |
| 8.2 | Board of directors and key management personnel | |
| 8.3 | Compensation of key management personnel | |
| 8.4 | Compensation plans linked to share price | |
|
|
| |
9. | Inventories | ||
|
| ||
10. | Current tax receivables and payables | ||
|
| ||
11. | Non-current assets and disposal groups held for sale | ||
|
| ||
12. | Investments accounted for using equity method and jointly-controlled companies | ||
| 12.1 | Equity method accounted investments | |
| 12.2 | Jointly co ntrolled companies | |
|
|
| |
13. | Intangible assets other than goodwill | ||
|
| ||
14. | Goodwill | ||
|
| ||
15. | Property, plant and equipment | ||
|
| ||
16. | Investment property | ||
|
|
| |
17. | Deferred tax | ||
|
| ||
18. | Other financial liabilities | ||
| 18.1 | Breakdown of interest-bearing liabilities | |
| 18.2 | Unsecured liabilities detailed by currency and maturity | |
| 18.3 | Secured liabilities breakdown by currency and maturity | |
| 18.4 | Hedged debt | |
| 18.5 | Other information | |
|
|
| |
19. | Risk management policy | ||
| 19.1 | Interest rate risk | |
| 19.2 | Exchange rate risk | |
| 19.3 | Commodities risk | |
| 19.4 | Liquidity risk | |
| 19.5 | Credit risk | |
| 19.6 | Risk measurement | |
|
|
| |
20. | Financial instruments | ||
| 20.1 | Financial instruments classified by nature and category | |
| 20.2 | Derivative instruments | |
| 20.3 | Fair value hierarchies | |
|
|
| |
21. | Trade and other payables | ||
22. | Provisions | |
| 22.1 | Provisions |
| 22.2 | Lawsuits and arbitration proceedings |
|
|
|
23. | Provisions for employee benefits | |
| 23.1 | General information |
| 23.2 | Details, movements and financial statement presentation |
| 23.3 | Other disclosures |
|
|
|
24. | Equity | |
| 24.1 | Equity attributable to the parent company´s owners |
| 24.2 | Foreign currency translation reserves |
| 24.3 | Capital management |
| 24.4 | Restrictions on the ability of subsidiaries to transfer funds to the parent |
| 24.5 | Other reserves |
| 24.6 | Non-controlling interests |
|
|
|
25. | Revenues | |
|
| |
26. | Raw materials and consumables used | |
|
| |
27. | Employee benefits expense | |
|
| |
28. | Depreciation, amortization and impairment losses | |
|
| |
29. | Other expenses | |
|
| |
30. | Other gains (losses) | |
|
| |
31. | Financial costs | |
|
| |
32. | Income tax | |
|
| |
33. | Segment information | |
| 33.1 | Segmentation criteria |
| 33.2 | Generation, distribution and other |
| 33.3 | Countries |
| 33.4 | Generation and distribution by countries |
|
|
|
34. | Third party guarantees other contingent assets and liabilities, and other commitments | |
| 34.1 | Direct guarantees |
| 34.2 | Indirect guarantees |
| 34.3 | Other information |
|
|
|
35. | Personnel figures | |
|
|
|
36. | Subsequent events | |
|
|
|
37. | Environment | |
|
|
|
38. | Summarized financial information of principal subsidiaries and jointly-controlled entities | |
|
| |
Appendix No. 1 Enersis group companies | ||
Appendix No. 2 Changes in the scope of consolidation
Appendix No. 3 Enersis Group associated companies
Appendix No. 4 Additional information on financial debt
Appendix No. 5 Assets and liabilities in foreign currencies
ENERSIS S.A. AND SUBSIDIARIES
CONSOLIDATED FINANCIAL STATEMENTS AS OF DECEMBER 31, 2010
(In thousands of Chilean pesos - ThCh$)
1. FINANCIAL STATEMENTS AND ACTIVITIES OF THE GROUP
Enersis S.A. (hereinafter the “Parent Company” or the “Company”) and its subsidiaries the Enersis Group (hereinafter, Enersis or the Group).
Enersis S.A. is a publicly-traded corporation with registered address and head office located at Avenida Santa Rosa, No. 76, Santiago, Chile. The Company was registered in the securities register of the Superintendency of Securities and Insurance of Chile (Superintendencia de Valores y Seguros or “SVS”), under number 175. In addition, the Company is registered with the Securities and Exchange Commission of the United States of America (hereinafter “U.S. SEC”), and with Spain’s “Comisión Nacional del Mercado de Valores.” The Company’s shares are listed in the New York Stock Exchange since 1993, and in Latibex since 2001.
Enersis S.A. is a subsidiary of ENDESA, S.A., a Spanish entity controlled by Enel S.p.A. (hereinafter, “Enel”).
Initially, the Company was created under the corporate name of “Compañía Chilena Metropolitana de Distribución Eléctrica S.A.” back in 1981. Later on, the Company changed its by-laws and its name to Enersis S.A. effective August 1, 1988. For tax purposes, the Company operates under Chilean tax identification number 94,271,000-3.
As of December 31, 2010, the Group had 12,264 employees. During 2010, the Group’s average total employees were 12,261. See Note 35 for additional information regarding employee distribution by class and country.
The Company’s corporate purpose consists in engaging, whether in Chile or abroad, in exploration, development, operation, generation, distribution, transmission, and transformation and/or sale of energy in any form or nature, either directly or through another company; and also performing telecommunication activities, and providing engineering advice in Chile or abroad. The Company’s corporate purpose also includes investing in, and the management of investments made in, subsidiaries and associates that are generators, transmitters, distributors, or traders of electricity, or whose corporate purpose includes anyone of the following:
(i) energy in any form or nature,
(ii) supply of public services or of services whose main component is energy,
(iii) telecommunications and computer services, and
(iv) intermediation businesses on the internet.
The Company’s 2009 consolidated financial statements were approved by the Board of Directors at a meeting held on January 27, 2010. Subsequently, the consolidated financial statements were submitted to the consideration of a General Shareholders Meeting held on April 22, 2010, which provided the final approval on the consolidated financial statements.
These consolidated financial statements are presented in thousands of Chilean pesos (unless expressly stated otherwise), as the Chilean peso is the functional currency of the main economic environment in which the Company operates. Foreign operations are recorded, in accordance with the accounting policies set forth in footnotes 2.5 and 3m.
2. BASIS OF PRESENTATION OF THE CONSOLIDATED FINANCIAL STATEMENTS
2.1 Accounting Principles
The consolidated financial statements of Enersis and subsidiaries as of December 31, 2010 have been prepared in accordance with International Financial Reporting Standards (“IFRS”) and approved by its Board of Directors’ at its meeting held on January 26, 2011.
These consolidated financial statements present fairly the financial position of Enersis and subsidiaries as of December 31, 2010 and 2009, as well as the results of operations, the changes in equity and the cash flows for each of the three years in the period ended December 31, 2010.
The consolidated financial statements included herein have been prepared from accounting records maintained by the Company and its subsidiaries. Each entity prepares its financial statements according to the accounting principles and standards in force in each country, and through the consolidation process, the corresponding adjustments and reclassifications have been made in order to present the consolidated financial statements in accordance with IFRS.
2.2 New accounting pronouncements
a) Accounting pronouncement effective from January 1, 2010
Standards, Interpretations and Amendments |
| Mandatory application for: |
IFRS 3 revised: Business Combinations |
| Annual periods beginning on or after July 1, 2009. |
Amendment to IAS 39: Eligible Hedged Items |
| Annual periods beginning on or after July 1, 2009. |
Amendment to IAS 27: Consolidated and Separate Financial Statements |
| Annual periods beginning on or after July 1, 2009. |
Improvements to IFRS (issued in 2009): |
| The majority of annual periods beginning on or after July 1, 2009. |
Amendment to IFRS 2: Share-Based Payments |
| Annual periods beginning on or after January 1, 2010. |
IFRIC 17: Distributions of Non-cash Assets to Owners |
| Annual periods beginning on or after July 1, 2009. |
The application of these accounting pronouncements has not had any significant effects for the Group. The remaining accounting criteria applied in 2010 are consistent with those applied in 2009.
b) Accounting pronouncements effective January 1, 2011 and after:
As of the issuance date of the consolidated financial statements presented herein, the following accounting pronouncements have been issued by the IASB but their application was not yet mandatory.
Standards, Interpretations and Amendments |
| Mandatory application for: |
Amendment to IAS 32: Classification of Rights Issues |
| Annual periods beginning on or after February 1, 2010. |
IFRS 9: Financial Instruments: Classification and Measurement |
| Annual periods beginning on or after January 1, 2013. |
IAS 24 Revised: Related Party Disclosures |
| Annual periods beginning on or after January 1, 2011. |
IFRIC 19: Extinguishing Financial Liabilities with Equity Instruments |
| Annual periods beginning on or after July 1, 2010. |
Amendment to IFRIC 14: Prepayments of a Minimum Funding Requirement |
| Annual periods beginning on or after January 1, 2011. |
Improvements to IFRS (issued in 2010): |
| The majority of annual periods beginning on or after January 1, 2011. |
Amendment to IFRS 7: Financial Instruments: Disclosures |
| Annual periods beginning on or after July 1, 2011. |
Amendment to IAS 12: Income Taxes |
| Annual periods beginning on or after January 1, 2012. |
The Group is assessing the impact of the application of IFRS 9 from its effective date. In Management’s opinion, the application of other standards, interpretations and amendments pending application will not have a significant effect on the consolidated financial statements of Enersis and subsidiaries.
2.3 Responsibility for the information and estimates made.
The Company’s Board is responsible for the information contained in these consolidated financial statements and expressly states that all IFRS principles and standards that are applicable to the Group have been fully implemented.
In preparing the consolidated financial statements, certain estimates made by the Company’s Management have been used in order to quantify some of the assets, liabilities, income, expenses and commitments recorded in such statements.
These estimates basically refer to:
· The valuation of assets and goodwill to determine the existence of impairment losses (see Note 3.e).
· The assumptions used to calculate the actuarial liabilities and obligations to employees (see Note 23).
· The useful life of property, plant and equipment and intangible assets (see Notes 3.a and 3.d).
· The assumptions used to calculate the fair value of financial instruments (see Notes 3.g.5. and 20).
· Energy supplied to customers and not invoiced at the end of each year.
· Certain assumptions inherent in the electricity system affecting transactions with other companies, such as production, customer billings, energy consumption, etc. used on the estimations of electricity system settlements. These settlements must occur in the corresponding final settlement dates, which have not occured as of the date of issuance of the consolidated financial statements, and could affect the balances of assets, liabilities, income and expenses recorded in such statements.
· The probability that uncertain or contingent liabilities will be incurred and their related amounts (see Note 3.l).
· Future disbursement for the closure of facilities and restoration of land (see Note 3.a).
· The tax results of the various subsidiaries of the Group that will be reported to the respective tax authorities in the future, which have served as the basis for recording different balances related to income taxes in the current consolidated financial statements (see Note 3.o).
Although these estimates have been based on the best information available at the date of issuance of the consolidated financial statements presented herein, it is possible that events may occur in the future that will require a change (increase or decrease) to these estimates in subsequent years, which would be done prospectively, recognizing the effects of such estimation change in the corresponding future consolidated financial statements.
2.4 Subsidiaries and jointly-controlled entities
Subsidiaries are defined as entities in which the Parent Company controls the majority of the voting rights or, should that not be the case, is authorized to direct the financial and operating policies of such entities.
Jointly-controlled entities are entities in which the situation described in the preceding paragraph exists as a result of an agreement with other shareholders and control is exercised jointly with them.
Appendix No. 1 of these consolidated financial statements, titled “Enersis Group Companies,” described Enersis relationship with each of its subsidiaries and jointly-controlled entities.
2.4.1 Changes in the scope of consolidation
During 2010 there were no significant changes in Enersis Group’s scope of consolidation. In 2009 the following transactions occurred that changed the Group’s scope of consolidation:
On February 25, 2009, our subsidiary Compañía Distribuidora y Comercializadora de Energía S.A. (“Codensa S.A.”) made a capital contribution amounting to ThCh$ 23,744,357 in Distribuidora Eléctrica de Cundinamarca S.A. (“DECA”), that was used to subscribe and pay 489,997 shares, that represents a 48.997% of DECA’s ownership interest. The remaining 51.003% ownership interest in DECA was subscribed and paid by Empresa Eléctrica de Bogotá, a company that has entered into an agreement with Codensa S.A. for the joint control of DECA.
Subsequently, on March 13, 2009, DECA acquired an 82.34% ownership interest in Empresa de Energía de Cundinamarca for ThCh$ 48,460,838. As a result of this acquisition DECA recognized goodwill amounting to ThCh$ 14,457,069 (see Notes 5.c and 14).
The section titled “Changes in the scope of consolidation,” included as Appendix No. 2 to the consolidated financial statements, shows the companies included within the scope of the Group’s consolidation, together with a detail of the Group’s respective ownership interest percentages.
2.4.2 Companies consolidated with less than 50% share.
Although Enersis Group holds less than a 50% share in Codensa and in Empresa Generadora de Energía Eléctrica S.A. (“Emgesa”), they are deemed to be subsidiaries since the Group exercises control over the entity, directly or indirectly, through contracts or agreements with shareholders, or as a consequence of its structure, composition and shareholder classes.
2.4.3 Companies not consolidated with greater 50% share.
Although Enersis Group holds more than 50% interest in Centrales Hidroeléctricas de Aysén, S.A. (hereinafter “Hidroaysén”), Hydroaysén is considered to be a jointly-controlled entity because the Group, through contracts and agreements with shareholders, exercises joint control of the entity.
2.5 Basis of consolidation and business combinations
The subsidiaries are consolidated and all their assets, liabilities, income, expenses and cash flows are included in the consolidated financial statements after making the adjustments and eliminations related to intra-Group transactions.
Jointly-controlled entities are consolidated by using the proportional consolidation method. The Group recognizes, line by line, its share of the assets, liabilities, income and expenses of such entities, so that the aggregation of balances and subsequent eliminations, takes place only in the proportion of Group’s ownership interest in them.
The results of subsidiaries and jointly-controlled entities are included in the consolidated comprehensive income statement, from the effective date of acquisition until the effective date of disposal or termination of joint control, as appropriate.
The consolidation of the operations of the Parent Company and its subsidiaries, as well as the jointly-controlled entities, was performed applying the following basic principles:
1. At the date of acquisition, the assets, liabilities and contingent liabilities of the subsidiary or jointly-controlled entity are recorded at market value. In the event that there is a positive difference between the acquisition cost and the fair value of the assets and liabilities of the acquired entity, including contingent liabilities, corresponding to the parent’s share, this difference is recorded as goodwill. In the event that the difference is negative, it is recorded with a credit to income.
2. Non-controlling interests in equity and in the financial results of the consolidated subsidiaries are presented, respectively, under the line items “Non-controlling interests” in the consolidated statement of financial position and “Net Income attributable to non-controlling interests” and “Other comprehensive income attributable to non controlling interests” in the consolidated statement of comprehensive income.
3. Translation of financial statements of foreign companies with functional currencies other than the Chilean peso is performed as follows:
a. For assets and liabilities, the prevailing exchange rate on the closing date of the financial statements is used.
b. For items in the comprehensive income statement, the average exchange rate for the year is used.
c. Equity remains at the historical exchange rate from the date of acquisition or contribution, and for retained earnings at the average exchange rate at the date of generation.
Exchange differences arising in the conversion of the financial statements are recognized within the heading “Exchange difference on translation” within the consolidated statement of comprehensive income: Other comprehensive income. (see Note 24.2).
Translation adjustments that existed at the Group’s transition date to IFRS, January 1, 2004, were deemed to be zero and transferred to reserves, using the exemption for that purpose in IFRS 1 “First time Adoption of IFRS” (see Note 24.5).
All balances and transactions between consolidated companies, as well as the share of the proportionally consolidated companies, were eliminated in the consolidation process.
2.6 Reclassifications
The Group has made certain reclassifications to the consolidated financial statements as of December 31, 2009 and 2008, as a result of new instructions issued on March 25, 2010 by the SVS through Circular No. 1975. These reclassifications relate mainly to regrouping of financial assets and liabilities within current or non-current, as applicable, and regrouping items under the statements of comprehensive income, but they do not affect the operating income
3. ACCOUNTING PRINCIPLES APPLIED
The main accounting policies used in preparing the accompanying consolidated financial statements were as follows:
a) Property, plant and equipment
Property, plant and equipment are valued at acquisition cost, net of accumulated depreciation and any impairment losses it may have experienced. In addition to the price paid to acquire each item, the cost also includes, where appropriate, the following concepts:
· Finance expenses accrued during the construction period that are directly attributable to the acquisition, construction or production of qualified assets, which require substantial period of time before being ready for use such as, for example, electricity generating or distribution facilities. The interest rate used is that of the specific financing or, if none exists, the mean financing rate of the company carrying out the investment. The mean financing rate depends principally on the geographic area and ranges between 5.19% and 7.46%. The amount capitalized for this concept amounted to ThCh$ 15,137,380, ThCh$ 9,173,217 and ThCh$ 9,470,558 for the years ended December 31, 2010, 2009 and 2008, respectively.
· Capitalized employee expenses directly related to work in progress for the years ended December 31, 2010, 2009 and 2008, were ThCh$ 26,741,111, ThCh$ 16,723,291 and ThCh$ 18,611,427, respectively.
· Future disbursements that the Group must make to close their facilities are incorporated into the value of the asset at present value, recording the corresponding provision in accounting. On a yearly basis, the Group reviews their estimate of these future disbursements, increasing or decreasing the value of the asset based on the results of this estimate. (see Note 22).
· Items acquired before the Group’s date of transtion to IFRS, January 1, 2004, include, where appropriate, asset reappraisals permitted in various countries to adjust the value of the property, plant and equipment for inflation as of that date. (see Note 24.5).
Construction work in progress items are transferred to operating assets once the testing period has been completed when they are available for use, at which time depreciation begins.
Expansion, modernization or improvement costs that represent an increase in productivity, capacity or efficiency or a longer useful life are capitalized as a greater cost for the corresponding assets.
The replacement or overhaul of whole components that increase the asset’s useful life, or its economic capacity, are recorded as an increase in value for the respective assets, derecognizing the replaced or overhauled components.
Periodic maintenance, conservation and repair expenses are recorded directly in income as an expense for the year in which they are incurred.
The Company, based on the outcome of impairment testing explained in Note 3.e, believes that the book value of these assets does not exceed their net recoverable value.
Property, plant and equipment, net of its residual value, is depreciated by distributing the cost of the different items that compose it on a straight-line basis over its estimated useful life, which is the period during which the companies expect to use such assets. Useful life estimates are periodically reviewed and, if appropriate, adjusted prospectively.
The following are the main classes of property, plant and equipment with their respective estimated useful lives
Classes of Property, Plant and Equipment |
| Years of estimated useful life |
|
|
|
|
|
Buildings |
| 22 – 100 |
|
Plant and Equipment |
| 3 – 65 |
|
IT Equipment |
| 3 – 15 |
|
Fixtures and Fittings |
| 5 – 21 |
|
Motor Vehicles |
| 5 – 10 |
|
Other |
| 2 – 33 |
|
Additionally, and for more information, there is a greater opening of the useful lives for plant and equipment class:
|
| Years of estimated useful life |
|
Generating facilities: |
|
|
|
Hydroelectric power plants |
|
|
|
Civil engineering work |
| 35-65 |
|
Electromechanical equipment |
| 10-40 |
|
Coal-fired/fuel-oil power plants |
| 25-40 |
|
Combined cycle plants |
| 10-25 |
|
Renewable energy power plants |
| 35 |
|
Transmission and distribution facilities: |
|
|
|
High-voltage network |
| 10-60 |
|
Low- and medium-voltage network |
| 10-60 |
|
Measuring and remote control equipment |
| 3-50 |
|
Other facilities |
| 4-25 |
|
In relation to the administrative concessions held by the Group companies, following is a detail of the years to maturity period for concessions that do not have an indefinite term:
Concession holder and operator |
| Country |
| Concession |
| Period remaining |
|
Empresa Distribuidora Sur S.A.Edesur (Distribution) |
| Argentina |
| 95 years |
| 77 years |
|
Hidroeléctrica El Chocón S.A. (Generation) |
| Argentina |
| 30 years |
| 13 years |
|
Transportadora de Energía S.A. (Transmission) |
| Argentina |
| 85 years |
| 77 years |
|
Compañía de Transmisión del Mercosur S.A. (Transmission) |
| Argentina |
| 87 years |
| 77 years |
|
Central Electrica Cachoeira Dourada S.A. (Generation) |
| Brazil |
| 30 years |
| 17 years |
|
Central Generadora Termeléctrica Fortaleza S.A (Generation) |
| Brazil |
| 30 years |
| 21 years |
|
Compañía de Interconexión Energética S.A.Cien (Transmission, Line 1) |
| Brazil |
| 20 years |
| 10 years |
|
Compañía de Interconexión Energética S.A.Cien (Transmission, Line 2) |
| Brazil |
| 20 years |
| 12 years |
|
Management of the Group evaluated the specific contract term of each of the aforementioned concessions, which vary by country, business or legal jurisprudence, and concluded that no determining factors exist to indicate that the grantor, which in each case is a government entity, controls the infrastructure and, at the same time, can continuously set the price to be charged for services. Those requirements are essential for applying IFRIC 12 “Service Concession Arrangements,” which establishes how to record and value certain types of concessions (see Note 3.d.1 for concession arrangement within the scope of IFRIC 12).
Gains or losses that arise from the sale or disposal of items of property, plant and equipment are recognized in income for the period and calculated as the difference between the sale value and the net book value.
b) Investment property
Investment property includes land and buildings held for the purpose to earn rentals and/or for capital appreciation.
Investment property is measured initially at its cost. Subsequent to initial recognition, investment property is measured at cost less any accumulated depreciation and any accumulated impairment losses. Investment property, excluding land, is depreciated on a straight-line basis over the useful lives of the related assets.
The fair value of the investment property is disclosed in Note 16.
c) Goodwill
Goodwill generated upon consolidation represents the difference between the acquisition cost and the Group share of the fair value of assets and liabilities, including identifiable contingent assets and liabilities of a subsidiary as of the acquisition date.
Acquired assets and liabilities are temporarily valued as of the date the company takes control and reviewed within no more than a year after the acquisition date. Until the fair value of assets and liabilities is ultimately determined, the difference between the acquisition price and the book value of the acquired company is temporarily recorded as goodwill.
If goodwill is finally determined to exist in the financial statements the year following the acquisition, the prior year accounts presented for comparison purposes, are modified to include the value of acquired assets and liabilities and final goodwill from the acquisition date.
Goodwill generated from acquiring companies with functional currencies other than the Chilean peso is valued at the functional currency of the acquired company and converted to Chilean pesos using the exchange rate in effect as of the date of the statement of financial position.
Goodwill generated before the date of transition to IFRS, January 1, 2004, is maintained at its net value recorded as of that date, while goodwill originated afterwards is valued at acquisition cost (see Notes 14 and 24.5).
Goodwill is not amortized, instead, at each period end the Company estimates whether any impairment has reduced its recoverable value to an amount less than the net recorded cost and, if appropriate, immediately adjusts for impairment (see Note 3.e).
Until December 31, 2009, in those cases where the Group acquired an additional ownership interest in a company already controlled and consolidated, the difference between the price of the additional ownership interest and the balance of “Equity attributable to non-controlling interests” that was derecognized as a result of the acquisition was recorded as goodwill. In those cases where the Group sold part of its interest in a controlled company that did not result in loss of control, the difference between the sale price and the balance of “Equity attributable to non-controlling interests” was recognized in net income for the year.
Beginning in 2010, as part of the adoption of the amendments related to IAS 27 (Revised 2008) “Consolidated and Separate Financial Statements,” any change in ownership interests in subsidiaries that do not result in loss of control are recognized within Equity attributable to owners of parent. During 2010, there were no transactions with non-controlling interests.
d) Intangible assets other than goodwill
d.1) Concessions
IFRIC 12 “Service Concession Arrangements” provides accounting guidance operators for public-to-private service concession arrangements. This accounting interpretation applies if:
a) The grantor controls or regulates which services the operator should provide with the infrastructure, to whom it must provide them and at what price; and
b) The grantor controls - through ownership, beneficial entitlement or otherwise-any significant residual interest in the infrastructure at the end of the term of the arrangement.
If both of the above conditions are met, the consideration received by the Group for the infrastructure construction is recognized at its fair value, as either, an intangible asset to the extent that the Group receives the right to charge users of the public service/facility as long as those charges are conditional on usage of the facility, or as a financial asset to the extent that the Group has an unconditional contractual right to receive cash or another financial asset from the grantor or a third party. The Group recognizes the contractual obligations assumed for the infrastructure maintenance during the infrastructure’s use, or for its return to the grantor at the end of the concession agreement within the conditions specified in such concession agreement, as long as it does not relate to an activity that generates income, in accordance with the Group’s provision accounting policy.
Finance expenses attributable to the concession arrangement are capitalized based on criteria established in Note 3 a) above, to the extent that the Group has a contractual right to receive an intangible asset. The median financing rate in Brazil, where the concession arrangements that require capital expenditures are located, ranges between 9.5% and 12.5% in prior periods. During 2010, we did not capitalize finance expenses. Note that the finance expenses capitalized in 2009 and 2008 were ThCh$ 1,992,733 and ThCh$ 2,648,915, respectively.
Additionally, during the years ended December 31, 2010, 2009, and 2008 we capitalized employee expenses attributable to construction in progress in the amount of ThCh$ 18,128,254, ThCh$ 17,007,228 and ThCh$ 13,988,133, respectively.
Intangible assets from concession arrangements are amortized over the term of the concessions.
The subsidiaries that have recognized an intangible asset from their service concession agreements are the following:
Concession hoder and operator |
| Country |
| Term |
| Remaining period to |
|
Ampla Energía e Serviços S.A. (*) (Distribution) |
| Brazil |
| 30 years |
| 16 years |
|
Companhia Energética do Ceará S.A. (*) (Distribution) |
| Brazil |
| 30 years |
| 17 years |
|
Sociedad Concesionaria Túnel El Melón S.A. (Highway infrastructure) |
| Chile |
| 23 years |
| 6 years |
|
(*) Considering that part of the rights acquired by our subsidiaries are unconditional, a financial asset at amortized cost has also been recognized (see Notes 3.g.1 and 7).
d.2) Research and development expenses
The Group follows the policy of recording as intangible assets in the statement of financial position, the costs incurred in a project’s development phase as long as its technical viability and economic returns are reasonably assured.
Expenditures on research activities are recognized as an expense in the period in which they are incurred. In 2010, 2009 and 2008 no research and development expenses were recognized.
d.3) Other intangible assets
These intangible assets correspond primarily to computer software, water rights, and easements. They are initially recognized at acquisition or production cost and, subsequently, are measured at cost less accumulated amortization and impairment losses, if any.
Computer softwares are amortized, on an average, in five years. Certain easements and water rights have indefinite useful lives, as such, they are not amortized. Easements and water rights in some cases have indefinite useful live, as thus, are not amortized. In others cases, they have a useful live that, depending on their own characteristics, range between 40 and 60 years, term which is used to amortize the asset.
The criteria for recognizing impairment losses or, if appropriate, recoveries of impairment losses recorded in prior periods are explained in letter e) of this Note.
e) Asset impairment
During the period, and principally at period end, the Company evaluates whether there is any indication that an asset has been impaired. Should any such indication exist, the company estimates the recoverable amount of that asset to determine, where appropriate, the amount of impairment. In the case of identifiable assets that do not independently generate cash flows, the company estimates the recoverability of the Cash Generating Unit to which the asset belongs, which is understood to be the smallest identifiable group of assets that generates independent cash inflows.
Notwithstanding the preceding paragraph, in the case of Cash Generating Units to which goodwill or intangible assets with an indefinite useful life have been allocated, a recoverability analysis is performed routinely at each period end.
The recoverable amount is the greater between the fair value less the cost needed to sell and the value in use, which is defined as the present value of the estimated future cash flows. In order to calculate the recoverable value of property, plant and equipment, goodwill and intangible assets, value in use criteria is used by the Group in practically all cases.
To estimate the value in use, the Group prepares future cash flow projections, before tax, based on the most recently available budgets. These budgets incorporate management’s best estimates of revenue and costs of Cash Generating Units using sector projections, past experience and future expectations.
In general, these projections cover the next ten years, estimating cash flows for subsequent years by applying reasonable growth rates between 3.3% and 6.7% that, in no case, are increasing nor exceed the average long-term growth rates for the particular sector and country.
These cash flows are discounted at a given pre-tax rate in order to calculate their present value. This rate reflects the cost of capital of the business and the geographical area in which the business is carried on. In order to calculate the discount rate, the current time value of money and the risk premiums generally used by analysts for the business and the geographical area are taken into account.
The discount rates, before tax, expressed in nominal terms and applied in 2010 and 2009 are the following:
|
|
|
| 2010 |
| 2009 |
| ||||
Country |
| Currency |
| Minimum |
| Maximum |
| Minimum |
| Maximum |
|
Chile |
| Chilean peso |
| 7.5 | % | 8.8 | % | 9.2% |
| 9.5% |
|
Argentina |
| Argentine peso |
| 15.0 | % | 16.9 | % | 19.5% |
| ||
Brazil |
| Brazilian reais |
| 9.6 | % | 10.8 | % | 11.3% |
| ||
Peru |
| Peruvian sol |
| 7.9 | % | 8.1 | % | 9.1% |
| ||
Colombia |
| Colombian peso |
| 9.6 | % | 9.8 | % | 11.5% |
| ||
If the recoverable amount is less than the net carrying amount of the asset, the corresponding provision for impairment loss is recorded for the difference, and charged to “Reversal of impairment loss (impairment loss) recognized in profit or loss” in the consolidated statement of comprehensive income.
Impairment losses recognized for an asset in prior periods are reversed when its estimated recoverable amount changes, increasing the asset’s value with a credit to earnings, limited to the asset’s carrying amount if no adjustment had occurred. In the case of goodwill, adjustments that would have been made are not reversible.
The following procedure is used to determine the need to adjust financial assets for impairment:
· In the case of commercial assets, the Group has a policy to record impairment through an allowance account determined based on the age of past-due balances, which is generally applied except in those cases where a specific collectability analysis is recommended, such as the case for receivables from public-related companies.
· In the case of receivables of a financial nature, impairment is determined on case-by-case basis. As of the date of issuance of these consolidated financial statements, the Company had no significant past due non commercial financial assets.
f) Leases
Leases that transfer to the lessee substantially all of the risks and rewards incidental to ownership are classified as finance leases. All other leases are classified as operating leases.
Finance leases in which the Group acts as a lessee are recognized when the agreement begins. At that point, the Group records an asset based on the nature of the lease and a liability for the same amount, equal to the lower of the fair value of the leased asset or the present value of the minimum lease payments. Subsequently, the minimum lease payments are divided between finance expense and principal reduction. The finance expense is recorded in the income statement and distributed over the lease term, so as to obtain a constant interest rate for each period over the balance of the debt pending amortization. The asset is amortized in the same terms as other similar depreciable assets, as long as there is reasonable certainty that the lessee will acquire ownership of the asset at the end of the lease. If no such certainty exists, the asset will be amortized over the lesser term between the useful life of the asset and the term of the lease.
Operating lease payments are expensed on a straight-line basis over the term of the lease unless another type of systematic basis of distribution is deemed more representative.
g) Financial instruments
Financial instruments are contracts that give rise to both a financial asset in one company and a financial liability or equity instrument in another company.
g.1) Financial assets other than derivatives
The Group classifies its financial assets other than derivatives, whether permanent or temporary, and excluding equity method investments (see Note 12) and investments held for sale (see Note 11), into four categories:
· Trade and other current receivables and Accounts receivable from related companies: These are recorded at amortized cost, which corresponds to initial fair value less principal repayments made, plus accrued and uncharged interest, calculated using the effective interest method.
The effective interest method is used to calculate the amortized cost of a financial asset or liability (or group of financial assets or financial liabilities) and is charged to finance income or cost over the
relevant period. The effective interest rate is the discount rate that matches the estimated cash flows to be received or paid over the expected life of the financial instrument (or, when appropriate, over a shorter period) to the net carrying amount of the financial asset or financial liability.
· Held-to-maturity investments: Investments that Enersis intends to hold and is capable of holding until their maturity are accounted for at amortized cost as defined in the preceding paragraph.
· Financial assets at fair value with changes in net income: This includes the trading portfolio and those financial assets that have been designated as such upon initial recognition and that are managed and evaluated using fair value criteria. They are valued in the consolidated statement of financial position at fair value, with changes in value recorded directly in income when they occur.
· Available-for-sale financial assets: These are financial assets specifically designated as available for sale or that do not fit within any of the three preceding categories and consist almost entirely of financial investments in equity instruments (see Note 6).
These investments are recorded in the consolidated statement of financial position at fair value when it can be reliably determined. Changes in fair value, net of taxes, are recorded with a charge or credit to an equity reserve known as “Gains (losses) on remeasuring available-for-sale financial assets” until the investment is disposed of, at which time the amount accumulated in this account for that investment is fully charged to the comprehensive income statement. Should the fair value be less than the acquisition cost and if there is objective evidence that the asset has been more than temporarily impaired, the difference is recorded directly in the comprehensive income statement.
In the case of interests in unlisted companies or companies with very little liquidity, normally the market value cannot be reliably determined. When this occurs, those interests are valued at acquisition cost or a lesser amount if evidence of impairment exists.
Purchases and sales of financial assets are accounted for using their trade date.
g.2) Cash and cash equivalents
This account within the statement of consolidated financial position includes cash and in banks, time deposits and other highly liquid short-term investments readily convertible to cash and which are subject to insignificant risk of changes in value.
g.3) Financial liabilities other than derivatives
Financial liabilities are generally recorded based on cash received, net of any costs incurred in the transaction. In subsequent periods, these obligations are valued at their amortized cost, using the effective interest rate method (see Note 3.g.1).
In the particular case that a liability is the underlying item of a fair value hedge derivative, as an exception, such liability will be valued at its fair value for the portion of the hedged risk.
In order to calculate the fair value of debt, both in the cases when it is recorded in the statement of financial position and for fair value disclosure purposes as seen in Note 20, debt has been divided into fixed interest rate debt (hereinafter “fixed-rate debt”) and variable interest rate debt (hereinafter “floating-rate debt”). Fixed-rate debt is that on which fixed-interest coupons established at the beginning of the transaction are paid explicitly or implicitly over its term. Floating-rate debt is that issued at a floating interest rate, i.e., each coupon is established at the beginning of each period based on the reference interest rate. All debt has been valued by discounting expected future cash flows with a market-interest rate curve based on the payment’s currency.
g.4) Derivative financial instruments and hedge accounting
Derivatives held by the Group correspond primarily to transactions entered into to hedge interest and/or exchange rate risk, intended to eliminate or significantly reduce these risks in the underlying transactions being hedged.
Derivatives are recorded at fair value as of the date of the statement of financial position as follows; if their fair value is positive, they are recorded within “Other financial assets”; and if their fair value is negative, they are recorded within “Other financial liabilities.”
Changes in fair value are recorded directly in income except when the derivative has been designated for accounting purposes as a hedge instrument and all of the conditions established under IFRS for applying hedge accounting are met, including that the hedge is highly effective. In this case, changes are recorded as follows:
· Fair value hedges: The underlying portion for which the risk is being hedged is valued at its fair value as is the hedge instrument, recording any changes in the value of both in the comprehensive income statement by netting the effects in the same comprehensive income statement account.
· Cash flow hedges: Changes in the fair value of the effective portion of derivatives are recorded in an equity reserve known as “Reserve of cash flow hedges.” The cumulative loss or gain in this account is transferred to the comprehensive income statement to the extent that the underlying item impacts the comprehensive income statement because of the hedged risk, netting the effect in the same comprehensive income statement account. Gains or losses from the ineffective portion of the hedge are recorded directly in the comprehensive income statement.
A hedge is considered highly effective when changes in the fair value or the cash flows of the underlying item directly attributable to the hedged risk, are offset by changes in the fair value or the cash flows of the hedging instrument, with effectiveness ranging from 80% to 125%.
The Company does not apply hedge accounting to its investments abroad.
As a general rule, long-term commodity purchase or sale agreements are recorded in the consolidated statement of financial position at their fair value as of period end, recording any differences in value directly in income, except when all of the following conditions are met:
· The sole purpose of the agreement is for the own use.
· The Group’s futures projections justify the existence of these agreements with the purpose of own use.
· Past experience with agreements shows that they have been utilized for own use, except in certain isolated cases in which they had to be used for exceptional reasons or reasons associated with logistical management issues outside the control and projection of the Group.
· The agreement does not stipulate settlement by differences and the parties do not make it a practice to settle similar contracts by differences in the past.
The long-term commodity purchase or sale agreements maintained by the Group, which are mainly for electricity, fuel and other supplies, meet the conditions described above. Thus, the purpose of fuel purchase agreements is to be used to generate electricity, the electricity purchase contracts are used to materialize sales to end-customers and the electricity sale contracts are used to sell the company’s own product.
The Company also evaluates the existence of embedded derivatives in contracts or financial instruments to determine if their characteristics and risk are closely related to the principal contract as long as the set is not being accounted for at fair value. If they are not closely related, they are recorded separately and changes in value are accounted for directly in the comprehensive income statement.
g.5) Fair value measurement and classification of financial instruments
The fair value of the various derivative financial instruments is calculated as follows:
·. For derivatives traded on a formal market, by its quoted price as of year end.
·. Enersis and subsidiaries value derivatives not traded on formal markets, using discounted expected cash flows and generally accepted options valuation models, based on current and future market conditions as of year-end.
Based on the described procedures, the Group classifies financial instruments in the different levels:
Level 1: Quoted prices (unadjusted) in active markets for identical assets or liabilities;
Level 2: Inputs other than quoted prices included within Level 1 that are observable for the asset or liability, either directly (i.e. as prices) or indirectly (i.e. derived from prices); and
Level 3: Inputs for assets or liabilities that are not based on observable market data (unobservable inputs).
g.6) Derecognition of financial assets
Financial assets are derecognized when:
· The contractual rights to receive the financial asset’s cash flows expire or have been transferred, or if the contractual rights are retained, the Group has assumed a contractual obligation to pay the financial asset’s cash flows to one or more receiver.
· The Group has transferred substantially all the risks and rewards of ownership of the financial asset, or, when it neither transfers nor retains substantially all the risks and rewards but does not retain control over the asset.
Where the Group retains substantially all the inherent risks and rewards of ownership of the tranferred asset, it continues recognizing the transferred asset in its entirety and recognizes a financial liability for the consideration received. Transactions costs are recognized in profit and loss by using the effective interest method (see Note 3.g.1.)
h) Investments accounted for using equity method
Investments in associates in which the Group has significant influence are recorded using the equity method. In general, significant influence is assumed in cases in which the Group has more than 20% interest.
The equity method consists of recording the investment in the statement of financial position based on the share of its equity that the Group’s interest represents in its capital, adjusted for, if appropriate, the effect of transactions with subsidiaries plus any goodwill generated in acquiring the company. If the resulting amount were negative, zero is recorded for that investment in the statement of financial position, unless there is a commitment from the Group to support the company’s negative equity situation, in which case a provision is recorded.
Dividends received from these companies are deducted from the value of the investment and any profit or loss obtained from them to which the Group is entitled based on its interest is recorded within “Share of profit (loss) of associates accounted for using equity method.”
Appendix No. 3 “Enersis Group Associated Companies,” included in these consolidated financial statements, provides information about Enersis’s relation with each of its associates.
i) Inventories
Inventories are valued at the lesser of their weighted average acquisition price or net realizable value.
j) Non-current assets held for sale and discontinued operations
The Group classifies as “Non-current assets held for sale,” property, plant and equipment; intangible assets; investments accounted for using the equity method; and disposals groups (group of assets to be disposed of and liabilities directly associated with those assets), if as of the date of the consolidated financial statements, the Group has taken active measures for their sale and estimates that such sale is highly probable
These held-for-sale assets or disposal groups are measured at the lower of their carrying amount and fair value less costs to sell. Depreciation and amortization on these assets cease when they meet the criteria to be classified as held for sale.
Non-current assets held for sale and the components of the disposal groups classified as held for sale are presented in the accompanying consolidated statement of financial position as a single line item within assets called “Non-current assets or disposal groups classified as held for sale” and the respective liabilities are presented as a single line item within liabilities called “Liabilities included in disposal groups classified as held for sale.”
The Group classifies as “Discontinued operations” those which represent separate major lines of business or are part of a single coordinated plan to dispose of a separate major line of business that either has been disposed of, or are classified as held for sale. Additionally, the Group classifies as “Discontinued operations” subsidiaries that have been acquired exclusively for resale.
The components of profit or loss after taxes from discontinued operations are presented as a single line item in the consolidated comprehensive income statement as “Net income from discontinued operations.”
k) Treasury shares
Treasury shares are deducted from equity in the consolidated statement of financial position and valued at acquisition cost.
The gains and losses from the disposal of treasury shares are recorded under the heading Total equity: treasury shares. As of December 31, 2010, there are no treasury shares and no transactions with equity share were made during 2010, 2009 and 2008.
l) Provisions
Obligations existing as of the date of the consolidated financial statements resulting from past events which may negatively impact the Group’s equity and whose amount and timing of payment are uncertain, are recorded as provisions in the consolidated statement of financial position at the present value of the most likely amount that it is believed that the Group will have to disburse to settle the obligation.
Provisions are quantified using the best information available as of the date of issuance of the consolidated financial statements regarding the consequences of the event causing the provision and are re-estimated at each subsequent accounting close.
l.1) Provisions for post-employment benefit and similar obligations
Some of the Group’s subsidiaries have pension and similar obligations to their employees. Such obligations, which combine defined benefits and defined contributions, are basically formalized through pension plans, except for certain non-monetary benefits, mainly electricity supply obligations, which, due to their nature, have not been externalized, and are covered by the related in-house provisions.
For defined benefit plans, the cost of providing benefits is determined using the Projected Unit Credit Method, with actuarial valuations being carried out at the end of each reporting period. Past service costs relating to changes in benefits are recognized immediately to the extent that the benefits are already vested, and otherwise are amortized on a straight-line basis over the average period until the benefits become vested.
The defined benefit plan obligations in the statement of financial position represent the present value of the defined benefit obligations a adjusted for unrecognized actuarial gains and losses and unrecognized past service costs, and reduced by the fair value of plan assets.
For each of the plans, any positive difference between the actuarial liability for past services and the plan assets is recognized under line item “Provisions for employee benefits” within current and non-current liabilities in the consolidated statement of financial position and any negative difference is recognized under line item “Other financial assets” within non-current assets in the consolidated statement of financial position, provided that such negative difference is recoverable by the Group, usually through a reduction in future contributions and taking into consideration the limit established in IFRIC 14, “IAS 19 The limit on a defined benefit asset, minimum funding requirements and their interaction.”
Contributions to defined contribution benefit plans are recognized as an expense in the consolidated statement of comprehensive income when the employees have rendered their services.
Actuarial gains and losses arising in the measurement of both the plan liabilities and the plan assets, including the limit in IFRIC 14, are recognized directly under “Equity — Retained earnings.”
m) Conversion of balances in foreign currency
Transactions carried out by each company in a currency other than its functional currency are recorded using the exchange rates in effect as of the date of each transaction. During the year, any differences that arise between the exchange rate recorded in accounting and the rate prevailing as of the date of collection or payment are recorded as “Foreign currency exchange differences” in the comprehensive income statement.
Likewise, as of each year end, balances receivable or payable in a currency other than each company’s functional currency are converted using the period-end exchange rate. Any valuation differences are recorded as “Foreign currency exchange differences” in the comprehensive income statement.
The Group has established a policy to hedge the portion of its revenue that is directly linked to the US dollar by obtaining financing in this currency. Exchange differences related to this debt, as they are cash flow hedge transactions, are charged, net of taxes, to a reserve account in equity and recorded in income during the period in which the hedged cash flows are realized. This term has been estimated at ten years.
n) Current/Non-Current Classification
In the accompanying consolidated statement of financial position, assets and liabilities expected to be recovered or settled within twelve months are presented as current items and those assets and liabilities expected to be recovered or settled in more than twelve months are presented as non-current items.
Should the Company have any obligations that mature in less than twelve months but can be refinanced over the long term at the Company’s discretion, through unconditionally available credit agreements with long-term maturities, such obligations may be classified as long-term liabilities.
o) Income tax
Income taxes for the year are determined as the sum of current taxes from the Group numerous subsidiaries and result from applying the tax rate to the taxable base for the year, after allowable deductions have been made, plus any changes in deferred tax assets and liabilities and tax credits, both for tax losses and deductions. Differences between the book value and tax basis of assets and liabilities generate deferred tax asset and liability balances, which are calculated using tax rates expected to be in effect when the assets and liabilities are realized.
Current taxes and changes in deferred tax assets and liabilities not arising from business combinations are recorded in income or in equity in the statement of financial position, based on where the gains or losses originating them were recorded.
Any fluctuations from business combinations that are not recorded upon taking control because their recovery is not assured are recognized by reductions, if appropriate, to the value of goodwill accounted for in the business combination.
Deferred tax assets and tax credits are recognized only when it is likely that there will be future tax gains sufficient enough to recover deductions for temporary differences and make use of tax losses.
Deferred tax liabilities are recognized for all temporary differences, except those derived from the initial recognition of goodwill and those that arose from valuing investments in subsidiaries, associates and jointly-controlled companies in which the Group can control their reversal and where it is likely that they will not be reversed in the foreseeable future.
Any deductions that can be applied at a given moment to current tax liabilities are credited to earnings within the income tax account, except when doubts exist about their tax realization, in which case they are not recognized until they are effectively realized, or when they correspond to specific tax incentives, in which case they are recorded as grants.
At each accounting period close, the Company reviews the deferred taxes it has recorded, both assets and liabilities, in order to ensure they remain current and otherwise make any necessary corrections based on the results of this analysis.
p) Revenue and expense recognition
Revenue and expense are recognized on an accrual basis.
Revenue is recognized when the gross inflow of economic benefits arising in the course of the Group’s ordinary activities in the year occurs, provided that this inflow of economic benefits results in an increase in total equity that is not related to contributions from equity participants and that these benefits can be measured reliably. Revenue is measured at the fair value of the consideration received or receivable arising there from.
Revenue associated with the rendering of services is only recognized if it can be estimated reliably, by reference to the stage of completion of the transaction at the date of the statement of financial position.
The Group excludes from the revenue figure gross inflows of economic benefits received by it when it acts as an agent or commission agent on behalf of third parties, and only recognizes as revenue economic benefits received for its own account.
When goods or services are exchanged or swapped for goods or services which are of a similar nature, the exchange is not regarded as a transaction which generates revenue.
The Group records for the net amount non-financial asset purchase or sale contracts settled for the net amount of cash or through some other financial instruments. Contracts entered into and maintained for the purpose of receiving or delivering these non-financial assets are recognized on the basis of the contractual terms of the purchase, sale or usage requirements expected by the entity.
Interest income (expense) is recognized by reference to the effective interest rate applicable to the principal outstanding over the related repayment period.
q) Earnings per share
Basic earnings per share are calculated by dividing net income attributable to owners of the Parent (the numerator) by the weighted average number of ordinary shares outstanding (the denominator) during the year, excluding, if any, the average number of shares of the Parent held by the Group.
During 2010, 2009 and 2008, the Group did not engage in any transaction of any kind that have potential dilutive effects leading to diluted earnings per share that could differ from basic earnings per share.
r) Dividends
Article No. 79 of Chilean Companies Act establishes that, except if unanimously agreed otherwise by shareholders of all issued shares, listed corporations should distribute a cash dividend to its shareholders on a yearly basis, prorated based on their shares or the proportion established in the company’s by laws if there are preferred shares, of at least 30% of net income for each period, except when accumulated losses from prior years must be absorbed.
As it is practically impossible to achieve a unanimous agreement given Enersis’s highly fragmented share capital, as of the end of each year the amount of the dividend obligation to its shareholders, net of interim dividends approved during the year, is determined and accounted for in “Trade and other current payables” or “Accounts payable to related companies,” as appropriate, and charged to Equity.
Interim and final dividends are deducted from equity as soon as they are approved by the competent body, which in the first case is normally the Company’s Board of Directors and in the second case is the Ordinary Shareholders’ Meeting.
s) Cash flow statement
The cash flow statement reflects the changes in cash that took place during the year in relation to both continuing and discontinued operations, calculated using the indirect method. The following terms are used in the consolidated cash flow statements:
· Cash flows: inflows and outflows of cash or cash equivalents, which are defined as highly-liquid investments maturing in less than three months with a low risk of changes in value.
· Operating activities are the principal revenue-producing activities of the Group and other activities that are not investing or financing activities.
· Investing activities are the acquisition and disposal of long-term assets and other investments not included in cash and cash equivalents.
· Financing activities are activities that result in changes in the size and composition of the contributed equity and borrowings of the Group.
4. SECTOR REGULATION AND ELECTRICITY SYSTEM OPERATIONS
There are different regulations in the Latin American countries in which the Group operates. We discuss below the main characteristics of each business.
4.1 Generation:
Chile
In Chile the electricity sector is regulated by the General Law of Electrical Services (Chilean Electricity Law), also known as DFL No. 1 of 1982, of the Ministry of Mining —whose compiled and coordinated text was established by DFL No. 4 issued in 2006 by the Ministry of Economy (“Electricity Law”)— as well as by an associated Regulation (D.S. No. 327 issued in 1998). Three government bodies are primarily responsible for enforcing this law: The National Energy Commission (“CNE”), which has the authority for proposing regulated tariffs (node prices), which require the final approval of the Ministry of Economy and prepares the indicative plan, a ten-year guide for the expansion of the system that must be consistent with the calculated node prices; the Superintendency of Electricity and Fuels ( “SEF”), which sets and enforces the technical standards of the system and the proper compliance with the law; and, the recently created Ministry of Energy, which will be responsible for proposing and guiding public policies on energy matters, and it combines together the SEF, the CNE and the Chilean Commission for Nuclear Energy (“ChCNE”), thus strengthening coordination and allowing an integrated view of the energy sector. The Ministry of Energy also includes an Agency for Energy Efficiency and a Center for Renewable Energy. The Chilean Electricity Law has established an “Experts Panel” whose main task is to resolve potential discrepancies among all participants in the electricity market such as electricity companies, system operator, regulator, etc.
The Chilean electrical sector is divided into four interconnected electrical systems: the Sistema Interconectado Central (SIC), the Sistema Interconectado del Norte Grande ( “SING”), and two separate medium-size systems located in southern Chile, one in Aysén and the other in Magallanes. The SIC is the main electrical system covering 2,400 km, connecting Taltal in the northern part with Quellon, located on the island of Chiloe, in the southern part of the country . The SING covers the northern part of the country, from Arica down to Coloso, covering approximately 700 km.
The electricity industry is divided into three business segments: generation, transmission, and distribution, operating in an interconnected and coordinated manner, and whose main purpose is to supply electrical energy to the market at minimum cost while maintaining quality and safety service standards required by the electrical regulations. Given their characteristics, Transmission and Distribution businesses are natural monopolies, and are segments regulated as such by the electricity low, requiring free access to networks and establishing regulated tariffs.
Under the Chilean Electricity Law, companies engaged in generation and transmission on an interconnected electrical system must coordinate their operations in a centralized manner through an operating agent, the Centro de Despacho Económico de Carga (“CDEC”), in order to operate the system at minimum cost while maintaining service safety. For this reason, the CDEC plans and operates the system, including the calculation of the so called “marginal cost,” which is the price at which energy transfers among generators performed through the CDEC are valued.
Therefore, a company’s decision to generate electricity is subject to CDEC’s operation plan. On the other hand, a company is free to decide whether to sell its energy to regulated or unregulated customers. Any surplus or deficit between sales to customers and energy supply, is sold to, or purchased from, other generators at the spot market price.
An electricity generator company may have the following types of clients:
(i) Regulated customers: Corresponds to those residential and commercial consumers and small and medium size businesses with a connected maximum capacity equal to or less than, 2,000 KW that are located in the concession area of a distribution company. Until 2009, the transfer prices between generators and distribution companies were capped at a maximum value called node price, which is regulated by the
Ministry of Economy. Node prices are determined every six months, in April and October, based on a report prepared by the CNE that takes into account projections of expected marginal costs in the system over the next 48 months for the SIC and 24 months for the SING. Beginning on 2010, the transfer prices between generators and distributors will be established in regulated bidding processes carried out by these companies.
(ii) Unregulated customers: Corresponds to those customers, mainly industrial and mining companies, with a connected maximum capacity over 2,000 KW. These consumers can freely negotiate prices for electrical supply with generators and/or distributors. Customers with capacity between 500 and 2,000 KW have the option to contract energy at prices agreed upon with their suppliers or be subject to regulated prices, with a minimum stay of at least four years under each price regime.
(iii) Spot market: Represents the energy and capacity transactions among generators that result from the CDEC coordination to achieve the economical operation of the system, where the excess (surpluses/deficits) between the energy supply and the energy to comply with business commitments is transferred through sale (purchase) to (from) other generators in the CDEC. In the case of energy, transfers are valued at the marginal cost; in the case of capacity, at the node prices set every semester by the regulators.
In Chile, the capacity that must be paid back to each generator depends on an annual calculation performed by the CDEC, which yields the final capacity of each power plant, that is independent from the dispatched capacity.
Beginning in 2010 with the enactment of Law 20,018 distribution companies must have permanently available supply to cover their entire demand projected for a period of three years; as such they have to undertake long-term public bids.
Regarding renewable energy, in April of 2008 Law 20,257 was enacted, which encourages the use of Non-Conventional Renewable Energies (“ERNC”). This law requires generators to provide at least 5% of their energy from renewable sources between years 2010 and 2014. This requirement progressively increases by 0.5% from years 2015 until 2024, where a 10% renewable energy requirement would be reached.
Rest of Latin America
In the other Latin American countries where the Group operates, different regulations are enforced. In general, regulations in Brazil, Argentina, Peru and Colombia allow participation of private capital in the electricity sector, uphold free competition in electricity generation, and define criteria to avoid certain levels of economic concentration and/or market practices that may cause a decline in this activity. Unlike Chile, state-owned companies participate in the electricity sector together with private companies in the electricity generation, transmission and distribution activities
The participation of companies in different activities (generation, distribution, and commercial), is allowed, as long as these activities are properly separated, both from an accounting and corporate point of view. Nevertheless, the transmission sector is where the strictest restrictions are usually imposed, mainly due to its nature and the need to assure adequate access to all players.
In regards to the main characteristics of the electricity generation business, one can indicate that in general these are open markets in which private players are free to make their own investment decisions. The exceptions are Brazil, a country which, based on the contractual needs of the distribution companies, the Ministry of Energy actively participates in the electricity system’s expansion by establishing capacity quotas by technology (separate bids for thermal, hydraulic, or renewable energies) or participates directly by organizing public bids for specific projects; and Argentina where despite the government has promoted initiatives to encourage electricity investments, such as “Energia Plus,” the increase in installed capacity has not been as expected. On November 25, 2010, the Ministry of Energy of Argentina and the participants in the electricity generation market signed an agreement that, among other aspects, seeks to increase new generation project developments financed with funds that make up part of the outstanding debt that the Argentine government has with electricity companies.
The operation in these countries is coordinated in a centralized manner in which an independent operator coordinates the dispatch of electrical charges. Except for Colombia, where charge dispatched is based on prices offered by the players, in the other countries charge dispatched is centralized, based on variable production costs
that seeks to assure the fulfillment of the demand at a minimum cost for the system. From that dispatch, the marginal cost, which defines the price for spot transactions, is determined.
Nevertheless, Argentina and Peru currently intervene to some extent in the formation of price in these marginal generation markets. This occurs in Argentina after the 2002 crisis, and in Peru as a result of a recent Emergency Law enacted in 2008 that defines a marginal idealized cost, considering that no actual restrictions exist on the transportation system for gas and electricity.
In Colombia, Brazil, Peru and Argentina generation players are able to sell energy through contracts in the regulated market or in the unregulated market, and trade their surplus/deficit on the spot market. The unregulated market is focused on the segment of large users, although the limits that define such a status vary in each market. The principal differences among the markets involve the way of regulating the sale of energy among generators and distributors and how regulated prices are established for the determination of the tariffs charged to end users.
Initially, Argentine law contemplated that the selling price charged by generators to distributors would have to be obtained from a centralized calculation of the average spot price expected for the next six months. However, after the 2002 crisis, Argentine authorities have established the price arbitrarily, forcing intervention in the marginal system and provoking a mismatch between actual generation costs and payment of the demand through distributors. Additionally, energy that can be sold by generators is limited to the demand that each generator had sold via energy contracts during the May - June 2005 period.
In Brazil, the regulated purchase price used in the determination of tariffs to end users is based on average prices of open bids, and there are separate bidding processes for existing and new energy. Bidding processes for new energy contemplate long-term generation contracts in which new generation projects must cover the growth of demand foreseen by distributors. The open bids for existing energy consider shorter contractual terms and seek to cover the distributors’ contractual needs arising from the expiry of prior contracts. Each bidding process is coordinated centrally. Authorities define maximum prices and, as a result, contracts are signed where all distributors participating in the process buy pro rata from each offering generator.
In Colombia distributors are free to decide their supply, being able to define the conditions of public bidding processes where they acquire energy for the regulated market and are able to buy energy in the spot market. Prices paid by end users reflect an average of the purchase price. Since 2004, the CREG (the Colombian energy and gas regulation commission) is working in a proposal to modify the energy contracting system in the Colombian market. Under the proposal, the existing contracting system will be modified into an electronic contract system. This mechanism will replace the current bidding process for energy auctions with standardized commercial conditions, where contractual demand will be treated as one aggregate demand.
In Peru, similar to Chile, distributors are obligated to enter into contracts, and the legislation was amended so that the public bids for energy would be based on distributor requirements. Currently, there are only a few contracts between generators and distributors that are in force at “bar price,” which is defined based on a centralized calculation. Nevertheless, since 2007 contracts are based on public bids. Authorities approve bidding bases and define the maximum price for each bid.
With the exception of Colombia, in all the other countries there is some statute in force that promotes use of renewable energy. In practical terms, there are no incentives or obligations similar to those in Chile that would push these renewable energy technologies to be competitive on a greater scale. Authorities are responsible for promoting specific bidding processes benefiting from special conditions in order to make these projects viable.
4.2 Distribution:
In the five countries where the Group operates, selling prices charged to clients are based on the purchase price paid to generators plus a component associated with the value added in distribution. Regulators set this value periodically through reviews of distribution tariffs. As a result, distribution is an essentially regulated activity.
Chile
In Chile, the distribution value added (“VAD”) is established every four years. For this, the local regulator, (i.e. the CNE) classifies companies in accordance with typical areas that group companies with similar distribution
costs. A distribution company’s return on investment is dependent on the company’s performance in relation to model company standards defined by the regulator. In April 2009, the regulator published tariff formulas which are effective for the period November 2008 through November 2012.
Rest of Latin America
In Peru, the VAD is calculated every 4 years, also using a model company method based on a typical area. In October 2009 the tariffs for the 2009-2013 period were published
In Brazil there are three types of tariff adjustments:
(i) Ordinary Tariff Reviews (“RTO”) which are conducted periodically in accordance with the provisions in the concession contracts (in Coelce every 4 years and in Ampla every 5 years).
(ii) Annual adjustment (IRT); and
(iii) Extraordinary Reviews.
The latest RTO for Ampla is applicable for the 2009-2014 periods and for Coelce for the 2007-2011 periods. The most recent annual adjustments made by Aneel were in March 2010 for Ampla and April 2010 for Coelce.
In Colombia, the CREG established in 2008 a new methodology for calculating the rate of return applicable to the compensation of the distribution, and a new methodology for establishing the charges for regional transmission and local distribution systems use. In October 2009 the CREG published the distribution charges for Codensa for the period 2009-2013.
In Argentina, tariffs were frozen after the country’s debt default in 2001. Edesur’s tariff restructuring started in 2007 with the enforcement of the “acta de acuerdo.” In the current year, tariff adjustments (positive impact in the VAD) and inflation readjustments (via the cost monitoring mechanism, “MMC”) have been made. In July 2008 increases were authorized for clients with consumption in excess of 650kWh quarterly, and in October 2008 the government approved an increase for consumption in excess of 1,000kWh per month; this last increase is a pass-through to the generators and was suspended between June and September 2010 but restarted in October 2010. The RTI (comprehensive tariff review) related to Edesur’s concession contract is still pending.
· Market for unregulated customers
In the countries where the Group operates, distributors can supply their customers under a regulated or freely-agreed conditions. The supply limitations imposed on the unregulated market are as follows:
Country |
| kW Threshold |
Argentina |
| > 30 kW |
Brazil |
| > 3,000 kW |
Chile |
| > 500 kW |
Colombia |
| > 100 kW o 55 MWh-month (**) |
Peru |
| > 200 kW (*) |
(*) In April 2009, Peru established that clients between 200 and 2,500 kW could choose between regulated or unregulated market.
(**) Colombia wants to decrease this threshold to 65kW or 35 MWh per month starting in January 2011. However, this decision has not been ratified.
· Limits on integration and concentration
In general, current legislation defends free competition and defines criteria to avoid certain levels of economic concentration and/or market practices that would lead to a deterioration of the market.
In principle, the regulators allow the participation of companies in different activities (e.g. generation, distribution, and commercialization) as long as there is an adequate separation of each activity, for both
accounting and company purposes. Nevertheless, most of the restrictions imposed involve the transport sector mainly because of its nature and the need to guarantee adequate access to all agents. In Argentina and Colombia there are specific restrictions if generation or distribution companies want to become majority shareholders in transportation companies.
Additionally, in Colombia, companies that were created subsequent to 1994 cannot be vertically integrated. Furthermore, generation companies cannot participate in a distribution company if the participation rate is greater than 25% and vice versa. Moreover, companies in Peru need a permit from the local authority if they have a interest stake greater than 5% in a business and want to participate in another business.
Regarding concentration in a specific sector, in Argentina and Chile, there are no specific limits that affect the vertical or horizontal integration of a company. On the other hand, in Peru, integrations are subject to authorization if such integration is 5% vertical and 15% horizontal. In Colombia, for the generation and commercialization sectors, companies cannot have a market participation that exceeds 25%. Finally in Brazil, since 2007 there have been no restrictions to generation integration. As for distribution, there are concentration limits, both on a national and electric subsystem level. On a national level, the authorities allow a 20% concentration in both segments. As for the electric subsystem, the limit is 35% of the North and Northeast subsystems and 25% of the South, Southeast, and Midwest subsystems.
With regard to consolidations and mergers between agents of the same segment, current regulation requires authorization from the local regulator.
· Access to the Network.
In the countries where the Group operates, the right of access and toll or access price is regulated by the local authority. In Peru, the toll setting process that recognizes investments in Secondary and Complementary Transmission Systems for the period July 2006 through April 2013, and which are effective starting November 1, 2009 concluded back in 2009.
In Chile, during 2010, local authorities developed part of the tariff process for the determination of the Subtransmission System Annual Value for the period 2011 through 2014. The CNE is preparing the respective technical report, which should be published on January 21. In case there are any discrepancies, companies can present them to the Experts Panel. Subsequently, the CNE will incorporate such report and create a final technical report, which the Ministry of Energy will use to publish its subtransmission tariff decreed.
5. CASH AND CASH EQUIVALENTS
a) The detail of cash and cash equivalents as of December 31, 2010, 2009 and 2008 is as follows:
|
| Balance at |
| ||||
|
| 12-31-2010 |
| 12-31-2009 |
| 12-31-2008 |
|
Cash and Cash Equivalents |
| ThCh$ |
| ThCh$ |
| ThCh$ |
|
|
|
|
|
|
|
|
|
Cash balances |
| 279,960 |
| 2,033,228 |
| 3,141,215 |
|
Bank balances |
| 186,975,512 |
| 280,296,850 |
| 186,008,671 |
|
Time Deposits |
| 518,742,837 |
| 631,827,134 |
| 671,273,838 |
|
Other fixed-income investments |
| 255,356,728 |
| 220,743,609 |
| 457,638,101 |
|
|
|
|
|
|
|
|
|
Total |
| 961,355,037 |
| 1,134,900,821 |
| 1,318,061,825 |
|
Time deposits have a maturity of three months or less from their date of acquisition and accrue the market interest for this type of investments. The other short-term investments debt securities mainly comprise of resale agreements with maturity of 30 days or less. There are no amounts of cash and cash equivalents balances held by the Group that are not available for its use.
b) The detail of cash and cash equivalents by currency is as follows:
|
| 12-31-2010 |
| 12-31-2009 |
| 12-31-2008 |
|
Currency |
| ThCh$ |
| ThCh$ |
| ThCh$ |
|
|
|
|
|
|
|
|
|
Chilean peso |
| 322,190,328 |
| 171,799,777 |
| 462,051,789 |
|
Argentine peso |
| 45,357,753 |
| 28,624,735 |
| 34,431,374 |
|
Colombian peso |
| 150,964,209 |
| 395,598,094 |
| 237,747,307 |
|
Brazilian reais |
| 309,896,646 |
| 370,793,677 |
| 318,762,025 |
|
Peruvian sol |
| 39,467,666 |
| 21,485,345 |
| 17,347,852 |
|
U.S. dollar |
| 93,478,435 |
| 146,599,193 |
| 247,721,478 |
|
|
|
|
|
|
|
|
|
Total |
| 961,355,037 |
| 1,134,900,821 |
| 1,318,061,825 |
|
c) The following table sets forth the amounts paid for the acquisition of associates, jointly controlled entities and other entities, during 2010, 2009 and 2008:
|
| 12-31-2010 |
| 12-31-2009 |
| 12-31-2008 |
|
Acquisitions of Associates and Other Entities |
| ThCh$ |
| ThCh$ |
| ThCh$ |
|
|
|
|
|
|
|
|
|
Amounts Paid for Acquisitions in Cash and Cash Equivalents |
| — |
| (23,744,357 | ) | — |
|
Amount of Cash and Cash Equivalents in Entities Acquired |
| — |
| 3,832,195 |
| — |
|
Assets and Liabilities Other than Cash or Cash Equivalents in Entities Acquired |
| — |
| 12,828,632 |
| — |
|
Total Purchase Consideration Paid to Acquired Entities, Net (*) |
| — |
| (7,083,530 | ) | — |
|
(*) Corresponds to a 48.997% of goodwill recognized by DECA in the acquisition of Empresa de Energía de Cundinamarca. As DECA is a jointly controlled entity, is reported by our subsidiary Codensa S.A. using proportionate consolidation (see Notes 2.4.2 and 14).
6. OTHER FINANCIAL ASSETS
The detail of other financial assets as of December 31, 2010 and 2009 is as follows:
|
| Balance at |
| ||||||
|
| 12-31-2010 |
| 12-31-2009 |
| ||||
Other Financial Assets |
| Current |
| Non- |
| Current |
| Non- |
|
|
|
|
|
|
|
|
|
|
|
Available-for-sale financial investments - unquoted equity securities |
| — |
| 2,422,288 |
| — |
| 2,423,878 |
|
Available-for-sale financial investments - quoted equity securities |
| — |
| 88,909 |
| — |
| 88,838 |
|
Post-employment benefit (Surplus) (*) |
| — |
| 3,352,698 |
| — |
| — |
|
Financial assets held-to-maturity |
| 7,735,440 |
| 29,461,230 |
| — |
| 24,548,711 |
|
Hedging derivatives (**) |
| 64,518 |
| 27,212,944 |
| — |
| 2,238,039 |
|
Non-hedging derivatives (***) |
| 17,551 |
| 91,262 |
| 1,536,089 |
| 732,253 |
|
Other assets |
| — |
| 339,391 |
| 60 |
| 465,038 |
|
|
|
|
|
|
|
|
|
|
|
Total |
| 7,817,509 |
| 62,968,722 |
| 1,536,149 |
| 30,496,757 |
|
(*) See Note 23.2
(**) See Note 20.2.a
(***) See Note 20.2.b
7. TRADE AND OTHER RECEIVABLES
a) The detail of trade and other receivables as of December 31, 2010 and 2009, is as follows:
|
| Balance as of |
| ||||||
|
| 12-31-2010 |
| 12-31-2009 |
| ||||
Trade and other receivables, Gross |
| Current |
| Non-Current |
| Current |
| Non-Current |
|
Trade and Other Receivables, Gross |
| 1,216,533,291 |
| 335,892,068 |
| 1,303,666,808 |
| 198,609,866 |
|
Trade Receivables, Gross |
| 1,124,250,876 |
| 206,462,719 |
| 1,254,497,316 |
| 128,738,890 |
|
Other Receivables, Gross |
| 92,282,415 |
| 129,429,349 |
| 49,169,492 |
| 69,870,976 |
|
|
| Balance as of |
| ||||||
|
| 12-31-2010 |
| 12-31-2009 |
| ||||
Trade and other receivables, Net |
| Current |
| Non-Current |
| Current |
| Non-Current |
|
|
|
|
|
|
|
|
|
|
|
Trade and Other Receivables, Net |
| 1,038,098,240 |
| 319,567,960 |
| 1,141,966,600 |
| 194,977,413 |
|
Trade Receivables, Net (1) |
| 953,663,462 |
| 190,617,091 |
| 1,097,562,493 |
| 126,907,444 |
|
Other Receivables, Net (2) |
| 84,434,778 |
| 128,950,869 |
| 44,404,107 |
| 68,069,969 |
|
(1) Includes ThCh$ 40,268,000 corresponding to receivables due to our subsidiary Cachoeira Dourada S.A. from Compañía de Electricidade de Goiás (CELG). CELG a state-owned entity of the State of Goiás has recognized its outstanding debt and is negotiating the best financing alternative to obtain the proceeds to pay its debt. The Group anticipates a favorable outcome as a result of such negotiations and expects to at least recover the carrying amount recognized.
(2) The non-current portion includes the financial asset classified as loans and receivables measured at amortized cost arising from application of IFRIC 12, Service Concession Arrangement totaling ThCh$ 122,301,426 and ThCh$ 34,203,618 as of December 31, 2010 and 2009, respectively.
In general, no interest is charged on trade and other receivables.
There are no trade and other receivables balances held by the Group that are not available for its use.
There are no significant balance transactions with single external customers in relation to the Group’s total revenues or receivables.
Refer to Note 8.1 for detail information about amounts, terms and conditions associated with accounts receivable from related companies.
b) As of December 31, 2010 and December 31, 2009, the balance of unimpaired past due trade receivables is as follows:
|
| Balance as of |
| ||
Trade accounts receivable past due and unpaid but not impaired |
| 12-31-2010 |
| 12-31-2009 |
|
Less than three months |
| 249,377,836 |
| 170,338,640 |
|
Between three and six months |
| 38,107,825 |
| 29,491,746 |
|
Between six and twelve months |
| 29,162,945 |
| 67,272,982 |
|
Greater than twelve months |
| 173,268,810 |
| 108,528,471 |
|
Total |
| 489,917,416 |
| 375,631,839 |
|
c) The reconciliation of changes in the allowance for impairment of trade receivables is as follows:
Trade Receivables Past Due Impaired |
| Current and |
|
Balance at January 1, 2009 |
| 163,511,186 |
|
Increases (decreases) for the year (*) |
| 22,179,120 |
|
Amounts written-off |
| (23,420,721 | ) |
Foreign Currency Translation Differences |
| 3,063,076 |
|
Balance at December 31, 2009 |
| 165,332,661 |
|
Increases (Decreases) for the year (*) |
| 95,391,111 |
|
Amounts Written-off |
| (60,563,032 | ) |
Foreign Currency Translation Differences |
| (5,401,581 | ) |
Balance at December 31, 2010 |
| 194,759,159 |
|
(*) See Note 28 for impairment of financial assets
8. BALANCES AND TRANSACTIONS WITH RELATED COMPANIES
Related party transactions are performed at current market conditions.
Balances and transactions between the Company and its subsidiaries and jointly-controlled entities have been eliminated on consolidation and are not disclosed in this note.
As of the date of these financial statements, no guarantees have been given or received nor has any allowance for bad or doubtful accounts been recorded in respect of the receivable balances for related party transactions
8.1 Balances and transactions with related companies
The detail of the amounts receivable and payable between the Company and its related companies is as follows:
a) Receivables from related companies:
|
|
|
|
|
|
|
|
|
|
|
|
|
| Balance as of |
| ||||||
|
|
|
|
|
|
|
|
|
|
|
|
|
| Current |
| Non-Current |
| ||||
Taxpayer |
| Company |
| Description |
| Term |
| Nature |
| Currency |
| Country |
| 12/31/2010 |
| 12/31/2009 |
| 12/31/2010 |
| 12/31/2009 |
|
Foreign |
| E. E. Piura |
| Other services |
| Less than 90 days |
| Common Immediate Parent |
| Soles |
| Peru |
| 144,144 |
| 187,654 |
| — |
| — |
|
Foreign |
| E. E. Piura |
| Other services |
| Less than 90 days |
| Common Immediate Parent |
| Ch$ |
| Peru |
| — |
| 5,199 |
| — |
| — |
|
Foreign |
| Endesa Energía S.A. |
| Other services |
| Less than 90 days |
| Common Immediate Parent |
| CPs |
| Spain |
| 57,725 |
| 23,575 |
| — |
| — |
|
Foreign |
| Endesa Latinoamérica S.A.U |
| Expenses |
| Less than 90 days |
| Related to Immediate Parent |
| US$ |
| Spain |
| 26,166 |
| 245,659 |
| — |
| — |
|
Foreign |
| Endesa Latinoamérica S.A.U |
| Other services |
| Less than 90 days |
| Related to Immediate Parent |
| CPs |
| Spain |
| 27,787 |
| — |
| — |
| — |
|
Foreign |
| Endesa Latinoamérica S.A.U |
| Other services |
| Less than 90 days |
| Related to Immediate Parent |
| Ar$ |
| Spain |
| — |
| 52,688 |
| — |
| — |
|
Foreign |
| Endesa España |
| Other services |
| Less than 90 days |
| Related to Immediate Parent |
| US$ |
| Spain |
| 4230 |
| — |
| — |
| — |
|
Foreign |
| Endesa España |
| Other services |
| Less than 90 days |
| Related to Immediate Parent |
| Ch$ |
| Spain |
| 47,229 |
| — |
| — |
| — |
|
Foreign |
| Eléctrica Cabo Blanco S.A. |
| Other services |
| Less than 90 days |
| Common Immediate Parent |
| Soles |
| Peru |
| — |
| 1,579 |
| — |
| — |
|
Foreign |
| Generalima S.A. |
| Other services |
| Less than 90 days |
| Common Immediate Parent |
| Ch$ |
| Peru |
| 134,482 |
| 1,579 |
| — |
| — |
|
Foreign |
| Enel |
| Other services |
| Less than 90 days |
| Ultimate Controlling Party |
| Ch$ |
| Italy |
| — |
| 219,278 |
| — |
| — |
|
Foreign |
| SACME |
| Other services |
| Less than 90 days |
| Associate |
| Ar$ |
| Argentina |
| 312,951 |
| 154,115 |
| — |
| — |
|
Foreign |
| Endesa CEMSA S.A. |
| Commercial Current Account |
| Less than 90 days |
| Associate |
| Ar$ |
| Argentina |
| 18,413,497 |
| 16,241,814 |
| — |
| — |
|
Foreign |
| Endesa CEMSA S.A. |
| Commercial Current Account |
| Less than 90 days |
| Associate |
| Ch$ |
| Argentina |
| — |
| 3,121 |
| — |
| — |
|
Foreign |
| Endesa Servicios S.L.U. |
| Other services |
| Less than 90 days |
| Common Immediate Parent |
| US$ |
| Spain |
| — |
| 15,586 |
| — |
| — |
|
Foreign |
| Endesa Servicios S.L.U. |
| Other services |
| Less than 90 days |
| Common Immediate Parent |
| Euros |
| Spain |
| — |
| 26,98 |
| — |
| — |
|
Foreign |
| Endesa Servicios S.L.U. |
| Other services |
| Less than 90 days |
| Common Immediate Parent |
| Ch$ |
| Spain |
| — |
| 424,958 |
| — |
| — |
|
76,788,080-4 |
| GNL Quintero S.A. |
| Other services |
| Less than 90 days |
| Associate |
| US$ |
| Chile |
| 458,094 |
| — |
| — |
| — |
|
76,418,940-k |
| GNL Chile S.A. |
| Other services |
| Less than 90 days |
| Associate |
| US$ |
| Chile |
| 533,218 |
| 577,755 |
| — |
| — |
|
76,418,940-k |
| GNL Chile S.A. |
| Loans |
| Less than 90 days |
| Associate |
| Ch$ |
| Chile |
| 312,084 |
| 285,024 |
| — |
| — |
|
76,583,350-7 |
| Konecta Chile S.A. |
| Other services |
| Less than 90 days |
| Associate |
| Ch$ |
| Chile |
| — |
| 547,668 |
| — |
| — |
|
|
|
|
|
|
|
|
|
|
|
|
| Total |
| 20,471,607 |
| 19,014,232 |
| — |
| — |
|
b) Payables to related companies:
|
|
|
|
|
|
|
|
|
|
|
|
|
| Balance as of |
| ||||||
|
|
|
|
|
|
|
|
|
|
|
|
|
| Current |
| Non-Current |
| ||||
Taxpayer |
| Company |
| Description |
| Term |
| Nature |
| Currency |
| Country |
| 12/31/2010 |
| 12/31/2009 |
| 12/31/2010 |
| 12/31/2009 |
|
Foreign |
| E E Piura |
| Other services |
| Less than 90 days |
| Common Parent |
| Soles |
| Peru |
| 858,345 |
| 718,613 |
| — |
| — |
|
Foreign |
| Endesa Latinoamérica S.A.U. |
| Dividends |
| Less than 90 days |
| Related to immediate Parent |
| Ar$ |
| Spain |
| 127,669 |
| 144,655 |
| — |
| — |
|
Foreign |
| Endesa Latinoamérica S.A.U. |
| Dividends |
| Less than 90 days |
| Related to Immediate Parent |
| Ch$ |
| Spain |
| 89,382,016 |
| 72,313,821 |
| — |
| — |
|
Foreign |
| Endesa Latinoamérica S.A.U. |
| Dividends |
| Less than 90 days |
| Related to Immediate Parent |
| R$ |
| Spain |
| — |
| 582 |
| — |
| — |
|
Foreign |
| Endesa Latinoamérica S.A.U. (1) |
| Loans |
| More than one year |
| Related to Immediate Parent |
| US$ |
| Spain |
| 2,428,068 |
| 2,644,130 |
| 1,084,290 |
| 3,556,672 |
|
Foreign |
| SACME |
| Other services |
| Less than 90 days |
| Associate |
| Ar$ |
| Argentina |
| 139,826 |
| 99,036 |
| — |
| — |
|
96,806,130-5 |
| Electrogas S.A. |
| Other services |
| Less than 90 days |
| Associate |
| Ch$ |
| Chile |
| 217,889 |
| 263,041 |
| — |
| — |
|
Foreign |
| Endesa CEMSA S.A. |
| Commercial Current Account |
| Less than 90 days |
| Associate |
| Ar$ |
| Argentina |
| 15,953,845 |
| 16,763,778 |
| — |
| — |
|
Foreign |
| Endesa CEMSA S.A. |
| Other services |
| Less than 90 days |
| Associate |
| R$ |
| Argentina |
| 15,658,298 |
| 19,000,085 |
| — |
| — |
|
Foreign |
| Endesa CEMSA S.A. |
| Other services |
| Less than 90 days |
| Associate |
| Ar$ |
| Argentina |
| 3,006 |
| — |
| — |
| — |
|
Foreign |
| Endesa Servicios S.L.U. |
| Other services |
| Less than 90 days |
| Common Immediate Parent |
| US$ |
| Spain |
| — |
| 8,038 |
| — |
| — |
|
76,418,940-k |
| GNL Chile S.A. |
| Other services |
| Less than 90 days |
| Associate |
| Ch$ |
| Chile |
| 23,427,988 |
| — |
| — |
| — |
|
Foreign |
| Carboex S.A. |
| Other services |
| Less than 90 days |
| Common Parent |
| Ch$ |
| Spain |
| 5,310 |
| — |
| — |
| — |
|
|
|
|
|
|
|
|
|
|
|
|
| Total |
| 148,202,260 |
| 111,955,779 |
| 1,084,290 |
| 3,556,672 |
|
(1) The balance payable to Endesa Latinoamérica S.A.U. relates to a loan granted to Compañía Interconexao Energética S.A. (“Cien”) to purchase machinery and equipment necessary to complete the construction of its second transmission line. The loan is denominated in US dollars, bears an annual interest rate of 3.49% and matures in May 2012.
c) Significant transactions and income/expense effects:
Transactions with related companies and their effects in profit or loss for the years ended December 31, 2010, 2009 and 2008 are as follows:
Taxpayer |
| Company |
| Country |
| Nature of the Relationship |
| Description of |
| 12-31-2010 |
| 12-31-2009 |
| 12-31-2008 |
|
Foreign |
| E E Piura |
| Peru |
| Common Immediate Parent |
| Energy Purchases |
| (14,267,877 | ) | (9,528,999 | ) | (9,935,134 | ) |
Foreign |
| E E Piura |
| Peru |
| Common Immediate Parent |
| Other Services Rendered |
| 191,034 |
| 243,809 |
| 5,176 |
|
Foreign |
| E E Piura |
| Peru |
| Common Immediate Parent |
| Energy Sales |
| 3,512 |
| 968,848 |
| — |
|
Foreign |
| E E Piura |
| Peru |
| Common Immediate Parent |
| Other Operating Expenses |
| (56,482 | ) | — |
| — |
|
Foreign |
| E E Piura |
| Peru |
| Common Immediate Parent |
| Other Operating Income |
| 162,670 |
| — |
| — |
|
Foreign |
| Endesa Energ��a S.A. |
| Spain |
| Common Immediate Parent |
| Other Services Rendered |
| 39,585 |
| 35,352 |
| — |
|
Foreign |
| Endesa Latinoamérica S.A |
| Spain |
| Immediate Parent |
| Financial Interest |
| (178,114 | ) | 1,533,007 |
| (797,186 | ) |
Foreign |
| Endesa Servicios |
| Spain |
| Common Immediate Parent |
| Other Services Rendered |
| 70,331 |
| 480,584 |
| 909,196 |
|
Foreign |
| Endesa Servicios |
| Spain |
| Common Immediate Parent |
| Other Sales |
| 127,091 |
| — |
| — |
|
Foreign |
| Endesa Servicios |
| Spain |
| Common Immediate Parent |
| Other Operating Expenses |
| (7,380 | ) | — |
| — |
|
Foreign |
| Eléctrica Cabo Blanco S.A. |
| Colombia |
| Common Immediate Parent |
| Other Services Rendered |
| 2,705 |
| — |
| — |
|
Foreign |
| Generalima S.A. |
| Peru |
| Common Immediate Parent |
| Other Services Rendered |
| 395,480 |
| 113,001 |
| — |
|
76,418,940-k |
| GNL Chile S.A. |
| Chile |
| Associate |
| Gas Consumption |
| (157,412,913 | ) | — |
| — |
|
76,788,080-4 |
| GNL Quinteros S.A. |
| Chile |
| Associate |
| Energy Sales |
| 418,290 |
| 398,267 |
| — |
|
76,788,080-4 |
| GNL Quinteros S.A. |
| Chile |
| Associate |
| Loans |
| — |
| (247,192 | ) | — |
|
76,788,080-4 |
| GNL Quinteros S.A. |
| Chile |
| Associate |
| Other Services Rendered |
| 86,563 |
| 37,651 |
| 11,256 |
|
Foreign |
| SACME |
| Argentina |
| Associate |
| Other Services Rendered |
| (759,389 | ) | (759,968 | ) | — |
|
96,880,800-1 |
| Empresa Eléctrica Puyehue S.A. |
| Chile |
| Associate |
| Energy Purchases |
| (1,919,788 | ) | — |
| — |
|
96,880,800-2 |
| Empresa Eléctrica Puyehue S.A. |
| Chile |
| Associate |
| Energy Sales |
| 48,042 |
| — |
| — |
|
96.524.140-K |
| Empresa Eléctrica Panguipulli S.A. |
| Chile |
| Associate |
| Energy Purchases |
| (3,554,055 | ) | — |
| — |
|
96,524,140-K |
| Empresa Eléctrica Panguipulli S.A. |
| Chile |
| Associate |
| Energy Sales |
| 8,876 |
| — |
| — |
|
Foreign |
| Enel S.P.A. |
| Italy |
| Ultimate Controlling Party |
| Other Services Rendered |
| — |
| 688,898 |
| — |
|
Foreign |
| Enel |
| Italy |
| Ultimate Controlling Party |
| Other sales |
| 175,358 |
| — |
| — |
|
96,806,130-5 |
| Electrogas S.A. |
| Chile |
| Associate |
| Gas TransportationTolls |
| (2,814,618 | ) | (1,239,471 | ) | — |
|
76,583,350-7 |
| Konecta Chile S.A. |
| Chile |
| Associate |
| Loans |
| — |
| 49,992 |
| — |
|
76,583,350-8 |
| Konecta Chile S.A. |
| Chile |
| Associate |
| Other Variable Expenses |
| (22,179 | ) | — |
| — |
|
76,583,350-7 |
| Konecta Chile S.A. |
| Chile |
| Associate |
| Other Services Rendered |
| 170,762 |
| 3,028 |
| 12,120 |
|
|
|
|
|
|
|
|
| Total |
| (179,092,496 | ) | (7,223,193 | ) | (9,794,572 | ) |
Transfers of short-term funds between related companies are treated as current cash transactions, with associated variable interest rates based on market conditions. The resulting amounts receivable or payable are usually at 30 days term, with automatic rollover for the same term and amortization in line with cash flows.
8.2 Board of directors and key management personnel
Enersis is managed by Board of Directors which consists of seven members. Each director serves for a three-year term after which they can be reelected.
The Board of Directors was elected at the Ordinary Shareholders Meeting held on April 22, 2010. The Chairman, Vice Chairman, and Secretary were designated at the same Meeting.
a) Accounts receivable and payable and other transactions
· Accounts receivable and payable
There are no outstanding amounts receivable or payable between the Company and the members of the Board of Directors and Key Management Personnel.
· Other transactions
No other transactions have been performed between the Company and the members of the Board of Directors and Key Management Personnel.
b) Compensation of Directors
In accordance with article 33 of Law No. 18,046, which governs stock corporations, the compensation of Directors is established each year at the Ordinary Shareholders Meeting of Enersis S.A.
The remuneration consists of paying a variable annual compensation equal to one-thousandth portion of the profit for the year (attributable to Shareholders of the company). Also, each member of the Board will be paid a monthly compensation determined as follows:
· UF 72.00 as monthly fee fixed; and
· UF 36.00 as per diem for Board meetings attendance.
The amounts paid for the monthly fee will be treated as payment in advance of the variable annual compensation described above. The remuneration for the Chairman of the Board will be twice than that for a director, and the compensation of the Vice Chairman will be 50% higher than that for a director.
Any payment in advance received will be deducted from the annual variable compensation with no reimbursement if the annual variable compensation is lower than the aggregated payment in advances. The variable compensation will be paid after the Ordinary Shareholders’ Meeting approves the Annual Report, Balance Sheet and Financial Statements, and the Independent Auditors’ Reports and Account Inspectors’ Reports relating to a corresponding year.
If any Director of Enersis S.A. is a member of more than one Board in any Chilean or foreign subsidiaries and/or associates, or holds the position of director or advisor in other Chilean or foreign companies or legal entities in which Enersis S.A. has a direct or indirect ownership interest, such Director can be compensated for his/her participation in only one of those Boards.
The Executive Officers of Enersis S.A. and/or any of its Chilean or foreign subsidiaries or associates will not receive any compensation or per diem if they hold the position of director in any of the Chilean or foreign subsidiaries or associates of Enersis S.A. Nevertheless, the executives can receive such compensation or per diem provided they are authorized as payment in advance over the variable portion of their remuneration received from the respective companies for which the executives are employed.
Directors Committee:
Each member of the Directors Committee shall receive a variable remuneration equal to 0.11765 thousandth of the profit for the year (attributable to owners of parent). Also each member will be paid a monthly compensation determined as follows:
· UF 24.00 as monthly fixed fee, and
· UF 12.00 as per diem for meetings attendance.
The amounts paid for the monthly fee will be treated as payment in advance of the variable annual compensation described above.
Any payment in advance received will be deducted from the annual variable compensation with no reimbursement if the annual variable compensation is lower than the aggregated payments in advance. The variable compensation will be paid after the Ordinary Shareholders’ Meeting approves the Annual Report, Financial Statements, and the Independent Auditors’ Reports and Account Inspectors’ Reports relating to the corresponding year.
The following tables set forth the compensation paid to the members of the Board of Directors, Directors Committee and Audit Committee as of December 31, 2010 and 2009:
|
|
|
|
|
| 12-31-2010 |
| ||||||||
ID |
| Name |
| Position |
| Period in position |
| Enersis |
| Board of |
| Directors |
| Audit |
|
5,710,967-k |
| Pablo Yrarrázaval Valdés |
| Chairman |
| January to December 2010 |
| 55,023 |
| — |
| 759 |
| — |
|
Foreing |
| Andrea Bentran (1) |
| Vice Chairman |
| January to December 2010 |
| — |
| — |
| — |
| — |
|
48,070,966-7 |
| Rafael Miranda Robredo (2) |
| Director |
| January to December 2010 |
| 27,511 |
| — |
| — |
| — |
|
5,719,922-9 |
| Leonidas Vial Echeverría (3) |
| Director |
| April to December 2010 |
| 19,138 |
| — |
| 6,638 |
| — |
|
6,429,250-1 |
| Rafael Fernández Morandé (3) |
| Director |
| April to December 2010 |
| 19,138 |
| — |
| 6,638 |
| — |
|
4,132,185-7 |
| Hernán Somerville Senn |
| Director |
| January to December 2010 |
| 26,743 |
| — |
| 8,665 |
| 1,520 |
|
5,715,860-3 |
| Eugenio Tironi Barrios |
| Director |
| January to December 2010 |
| 26,750 |
| — |
| 764 |
| — |
|
5,206,994-7 |
| Patricio Claro Grez (4) |
| Director |
| January to April 2010 |
| 8,373 |
| — |
| 2,284 |
| 1,520 |
|
|
|
|
|
|
| Total |
| 182,676 |
| — |
| 25,748 |
| 3,040 |
|
|
|
|
|
|
| 12-31-2009 |
| ||||||||
ID |
| Name |
| Position |
| Period in position |
| Enersis |
| Board of |
| Directors |
| Audit |
|
5,710,967-k |
| Pablo Yrarrázaval Valdés |
| Chairman |
| January to December 2009 |
| 55,012 |
| — |
| 8,388 |
| — |
|
Foreing |
| Andrea Brentan |
| Vice Chairman |
| August to December 2009 |
| — |
| — |
| — |
| — |
|
48,070,966-7 |
| Rafael Miranda Robredo (2) |
| Director |
| January to December 2009 |
| 35,855 |
| — |
| — |
| — |
|
48,077,275-k |
| Pedro Larrea Paguaga |
| Director |
| January to July 2009 |
| 16,856 |
| — |
| — |
| — |
|
4,132,185-7 |
| Hernán Somerville Senn |
| Director |
| January to December 2009 |
| 28,280 |
| — |
| 9,163 |
| 3,824 |
|
5,715,860-3 |
| Eugenio Tironi Barrios |
| Director |
| January to December 2009 |
| 28,279 |
| — |
| — |
| — |
|
5,206,994-7 |
| Patricio Claro Grez |
| Director |
| January to December 2009 |
| 28,280 |
| — |
| 9,163 |
| 3,824 |
|
4,108,103-1 |
| Juan Eduardo Errázuriz Ossa (5) |
| Director |
| January to October 2009 |
| 23,698 |
| — |
| — |
| 3,061 |
|
|
|
|
|
|
| Total |
| 216,260 |
| — |
| 26,714 |
| 10,709 |
|
|
|
|
|
|
| 12-31-2008 |
| ||||||||
ID |
| Name |
| Position |
| Period in position |
| Enersis |
| Board of |
| Directors |
| Audit |
|
5,710,967-k |
| Pablo Yrarrázaval Valdés |
| Chairman |
| January to December 2008 |
| 53,446 |
| — |
| 8,939 |
| — |
|
48,070,966-7 |
| Rafael Miranda Robredo |
| Vice Chairman |
| January to December 2008 |
| 40,335 |
| — |
| — |
| — |
|
48,077,275-k |
| Pedro Larrea Paguaga |
| Director |
| January to December 2008 |
| 25,951 |
| — |
| — |
| — |
|
4,132,185-7 |
| Hernán Somerville Senn |
| Director |
| January to December 2008 |
| 26,722 |
| — |
| 8,939 |
| 5,863 |
|
5,715,860-3 |
| Eugenio Tironi Barrios |
| Director |
| January to December 2008 |
| 26,721 |
| — |
| — |
| — |
|
5,206,994-7 |
| Patricio Claro Grez |
| Director |
| January to December 2008 |
| 26,722 |
| — |
| 8,939 |
| 5,863 |
|
4,108,103-1 |
| Juan Eduardo Errázuriz Ossa |
| Director |
| April to December 2008 |
| 19,539 |
| — |
| — |
| 2,982 |
|
48,101,910-9 |
| Juan Ignacio de la Mata Gorostizaga |
| Director |
| January to March 2008 |
| 6,458 |
| — |
| — |
| 2,156 |
|
|
|
|
|
|
|
|
|
|
|
|
|
|
|
|
|
|
|
|
|
|
| Total |
| 225,894 |
| — |
| 26,817 |
| 16,864 |
|
(1) Andrea Brentan has resigned to receive his compensation as member of the Board of Directors.
(2) Vice Chairman until July 31, 2009 and Director since August 1, 2009.
(3) Director beginning on April 27, 2010.
(4) Director until April 27 2010.
(5) Director until October 28, 2009.
c) Guarantees established by the Company in favor of the Directors.
No guarantees have been given to or received from Directors.
8.3 Compensation of Key Management Personnel
a) Compensation received by Key Management personnel
Key Management Personnel
ID |
| Name |
| Position |
22,298,662-1 |
| Ignacio Antoñanzas Alvear |
| Chief Executive Officer |
23,535,550-7 |
| Massimo Tambosco (1) |
| Deputy Chief Executive Officer |
9,574,296-3 |
| Alfredo Ergas Segal |
| Chief Financial Officer |
14,710,692-0 |
| Angel Chocarro García (2) |
| Accounting Officer |
22,357,225-1 |
| Ramiro Alfonsín Balza |
| Planning and Control Officer |
23,363,734-3 |
| Urrea Gómez Alba Marina (3) |
| Internal Audit Officer |
7,006,337-9 |
| Francisco Silva Bafalluy (4) |
| General Services Officer |
11,470,853-4 |
| Juan Pablo Larraín Medina (2) |
| Communications Officer |
23,014,537-7 |
| Carlos Niño Forero (5) |
| Human Resources Officer |
7,706,387-0 |
| Eduardo Lopez Miller (3) |
| Procurement Officer |
6,973,465-0 |
| Domingo Valdés Prieto |
| General Counsel |
(1) Beginning on October 1, 2010.
(2) Beginning on November 1, 2009.
(3) Beginning on April 1, 2010.
(4) Until November 2010 he was the Human Resources Officer and since December 1, 2010 he is General Services Officer.
(5) Beginning on December 1, 2010.
The compensation paid to key management personnel totaled ThCh$ 2,695,060 as of December 31, 2010 (ThCh$ 2,399,672 and ThCh$ 2,230,137 as of December 31, 2009 and 2008, respectively). Such compensation includes the remunerations paid and the accrued short-term (annual bonuses) and long-term (severance indemnities payment) benefits.
Incentive plans for principal executives and managers
Enersis has implemented for its executives an annual bonuses plan based on meeting company-wide objetives and on the level of their individual contribution in achieving the overall goals of the Group. The plan provides for a range of bonuses amounts according to seniority level. The bonuses eventually paid to the executives consist of a certain number of monthly gross remunerations.
b) Guarantees established by the Company in favor of the management
No guarantees have been given to or received from key management personnel.
8.4 Compensation plans linked to share price
There are no share-based payments granted to the Directors or key management personnel.
9. INVENTORIES
The detail of inventories as of December 31, 2010 and 2009 is as follows:
|
| Balance at |
| ||
|
| 12-31-2010 |
| 12-31-2009 |
|
Classes of Inventory |
| ThCh$ |
| ThCh$ |
|
|
|
|
|
|
|
Raw materials |
| 10,889,721 |
| 3,461,372 |
|
Goods |
| 691,241 |
| 1,467,734 |
|
Supplies for production |
| 30,931,763 |
| 42,152,882 |
|
Other inventories (*) |
| 20,138,979 |
| 9,237,280 |
|
|
|
|
|
|
|
Total |
| 62,651,704 |
| 56,319,268 |
|
|
| Balance at |
| ||
|
| 12-31-2010 |
| 12-31-2009 |
|
(*) Other Inventories |
| ThCh$ |
| ThCh$ |
|
|
|
|
|
|
|
Supplies for Projects and for Spare Parts |
| 2,222,761 |
| 3,399,724 |
|
Electric Supplies |
| 17,916,218 |
| 5,837,556 |
|
|
|
|
|
|
|
Total |
| 20,138,979 |
| 9,237,280 |
|
There are no inventories pledged as security for liabilities.
The cost of inventories recognized as an expense as of December 31, 2010 was ThCh$ 672,038,103 (ThCh$ 580,237,613 and ThCh$ 847,411,384 as of December 31, 2009 and 2008, respectively). See Note 26.
As of December 31, 2010, 2009, and 2008 no inventories have been written-down.
10. CURRENT TAX RECEIVABLES AND PAYABLES
The detail of current tax receivables as of December 31, 2010 and 2009 is as follows:
|
| Balance at |
| ||
|
| 12-31-2010 |
| 12-31-2009 |
|
|
| ThCh$ |
| ThCh$ |
|
|
|
|
|
|
|
Monthly provisional tax payments |
| 72,580,350 |
| 20,644,496 |
|
VAT tax credit |
| 29,618,364 |
| 51,159,855 |
|
Tax credit for absorbed profits |
| 14,672,543 |
| 17,116,026 |
|
Tax credit for training expenses |
| 242,796 |
| 251,365 |
|
Other |
| 20,873,288 |
| 23,004,210 |
|
|
|
|
|
|
|
Total |
| 137,987,341 |
| 112,175,952 |
|
The detail of current tax payables as of December 31, 2010 and 2009 is as follows:
|
| Balance at |
| ||
|
| 12-31-2010 |
| 12-31-2009 |
|
|
| ThCh$ |
| ThCh$ |
|
|
|
|
|
|
|
Income tax payable |
| 72,454,199 |
| 118,845,936 |
|
VAT Tax Charge |
| 36,856,368 |
| 37,272,870 |
|
Stamp Taxes |
| 733 |
| — |
|
Provision for taxes |
| 1,583,669 |
| 3,963,860 |
|
Other |
| 36,771,686 |
| 25,203,005 |
|
|
|
|
|
|
|
Total |
| 147,666,655 |
| 185,285,671 |
|
11. NON-CURRENT ASSETS AND DISPOSAL GROUPS HELD FOR SALE
During the fourth quarter of 2009, the Board of Directors of Enersis authorized the sale of the subsidiaries Compañía Americana de Multiservicios (“CAM”) and Synapsis Soluciones y Servicios IT Ltda. (“Synapsis”) as they were considered “non-core” businesses. The sale process included at first an internal verification of the market and the hiring of a financial advisor to provide assistance in the sale process, so that, once offers were received, they were submitted to the Board so that it can make the final decision about the sale and its specific conditions.
The potential sale of CAM was considered to be highly probable as of the end of 2009. As for Synapsis, such consideration was taken into account as of the September 2010. After those dates, the Company applied IFRS 5 Non-current Assets Held for Sale and Discontinued Operations (“IFRS 5”) to account for those transactions.
CAM and Synapsis provide services in the five countries where Enersis operates in Latin America, i.e. Chile, Argentina, Brazil, Colombia and Peru. CAM is present with its products and services in the complete electric cycle such as provision, materials logistics, construction and startup of electric projects, certification of equipment, and measurement of final consumption. On the other hand, Synapsis is a company that provides information technolog services. It specializes in defining strategies companies can use and software selection that satisfies current business needs. Synapsis also designs the infrastructure of the services that will be provided and the methodology that should be used among other services.
On December 20, 2010, the Board of Directors of Enersis accepted the offers received to purchase its entire interests in CAM and Synapsis. The CAM offer was presented by Graña y Montero S.A.A, a Peruvian company that offered US$ 20 million, which will be paid in cash, subjet to price adjustments at the closing of the sale transaction. As for Synapsis, Riverwood Capital L.P., a company domiciled in the United States of America,
presented a US$ 52 million offer to purchase Synapsis, that will be paid upon closing of the sales transaction. The Company foresees that both operations will be finalized during the first months of 2011.
As described in Note 3 j) non-current assets and disposal groups held for sale have been recorded at the lesser of book value or fair value less costs to sell. The impact of this treatment was to record an additional impairment on CAM’s net assets as of December 31, 2010 in the amount of ThCh$ 14,881,960, which accumulates to a total impairment related to CAM in the amount of ThCh$ 36,797,809 as of December 31, 2010 (ThCh$ 21,915,849 as of December 31, 2009), which was calculated based on the sales price received (see Note 28 for additional information regarding asset impairment).
The detail of the assets and liabilities classified as held for sale as of December 31, 2010 and 2009, is as follows:
ASSETS |
| 12-31-2010 |
| 12-31-2009 |
|
|
|
|
|
|
|
CURRENT ASSETS |
| 47,201,981 |
| 50,431,921 |
|
Cash and cash equivalents |
| 9,495,181 |
| 4,011,638 |
|
Other Current non-financial assets |
| 1,250,133 |
| — |
|
Trade and other receivables |
| 22,976,361 |
| 28,831,795 |
|
Inventories |
| 7,439,747 |
| 14,764,600 |
|
Current tax assets |
| 6,040,559 |
| 2,823,888 |
|
|
|
|
|
|
|
NON-CURRENT ASSETS |
| 26,691,309 |
| 19,928,930 |
|
Other non-current financial assets |
| 53,909 |
| — |
|
Other non-current non-financial assets |
| 547,349 |
| 170,776 |
|
Non-current receivables |
| 2,367,103 |
| 3,968,937 |
|
Intangible assets other tan goodwill |
| 1,461,938 |
| 1,358,619 |
|
Property, plant and equipment, net |
| 19,130,668 |
| 10,817,749 |
|
Deferred taxes |
| 3,130,342 |
| 3,612,849 |
|
|
|
|
|
|
|
TOTAL ASSETS |
| 73,893,290 |
| 70,360,851 |
|
LIABILITIES |
| 12-31-2010 |
| 12-31-2009 |
|
|
|
|
|
|
|
CURRENT LIABILITIES |
| 56,007,440 |
| 42,058,254 |
|
Other current financial liabilities |
| 6,210,788 |
| 7,013,861 |
|
Trade and other payables |
| 28,912,663 |
| 21,981,684 |
|
Other short term provisions |
| 11,739,296 |
| 6,856,461 |
|
Other current non-financial liabilities |
| 9,144,693 |
| 6,206,248 |
|
|
|
|
|
|
|
NON-CURRENT LIABILITIES |
| 8,622,949 |
| 8,592,112 |
|
Other non-current financial liabilities |
| 837,446 |
| 1,108,759 |
|
Deferred taxes |
| 4,171,839 |
| 4,727,164 |
|
Non-current provisions for employee benefits |
| 2,582,969 |
| 2,108,280 |
|
Other non-current non-financial liabilities |
| 1,030,695 |
| 647,909 |
|
|
|
|
|
|
|
TOTAL LIABILITIES |
| 64,630,389 |
| 50,650,366 |
|
As of December 31, 2010, the foreign currency translation difference from CAM and Synapsis recognized as other comprehensive income was ThCh$ (3,236,883). (see Note 24.2).
12. INVESTMENTS ACCOUNTED FOR USING EQUITY METHOD AND JOINTLY-CONTROLLED COMPANIES
12.1 Equity method accounted investments
a) The following tables set forth the changes in the shareholders’ equity of the Group’s equity method investments during the years ended December 31, 2010 and 2009:
ID |
| Movements in investments |
| Country of |
| Functional |
| Ownership |
| Balance as of |
| Share |
| Dividends |
| Foreign |
| Other |
| Balance at |
|
|
|
|
|
|
|
|
|
|
|
|
|
|
|
|
|
|
|
|
|
|
|
96,806,130-5 |
| Electrogas S.A. (1) |
| Chile |
| US Dollar |
| 0.02 | % | 3,775 |
| 1,867 |
| (1,635 | ) | (180 | ) | — |
| 3,827 |
|
96,889,570-2 |
| Inversiones Electrogas S.A. |
| Chile |
| Chilean Peso |
| 42.50 | % | 7,818,937 |
| 3,352,867 |
| (3,186,199 | ) | 104,080 |
| — |
| 8,089,685 |
|
76,788,080-4 |
| GNL Quintero S.A. |
| Chile |
| US Dollar |
| 20.00 | % | 10,127,465 |
| (2,542,879 | ) | — |
| (569,597 | ) | (4,131,356 | ) | 2,883,633 |
|
Foreign |
| Endesa CEMSA S.A. |
| Argentina |
| Argentine Peso |
| 45.00 | % | 3,297,780 |
| 202,973 |
| — |
| (406,675 | ) | — |
| 3,094,078 |
|
Foreign |
| Sacme S.A. |
| Argentina |
| Argentine Peso |
| 50.00 | % | 33,226 |
| 911 |
| — |
| (3,986 | ) | — |
| 30,151 |
|
76,583,350-7 |
| Konecta Chile S.A. |
| Chile |
| Chilean Peso |
| 26.20 | % | 278 |
| — |
| — |
| — |
| — |
| 278 |
|
|
|
|
|
|
|
|
|
|
|
|
|
|
|
|
|
|
|
|
|
|
|
|
|
|
|
|
|
|
| TOTAL |
| 21,281,461 |
| 1,015,739 |
| (3,187,834 | ) | (876,358 | ) | (4,131,356 | ) | 14,101,652 |
|
|
|
|
|
|
|
|
|
|
|
|
|
|
|
|
|
|
|
|
|
|
|
ID |
| Movements in investments |
| Country of |
| Functional |
| Ownership |
| Balance as of |
| Share |
| Dividends |
| Foreign |
| Other |
| Balance at |
|
|
|
|
|
|
|
|
|
|
|
|
|
|
|
|
|
|
|
|
|
|
|
96,806,130-5 |
| Electrogas S.A. (1) |
| Chile |
| US Dollar |
| 0.02 | % | 4,275 |
| 1,632 |
| (1,291 | ) | (841 | ) | — |
| 3,775 |
|
96,889,570-2 |
| Inversiones Electrogas S.A. |
| Chile |
| Chilean Peso |
| 42.50 | % | 9,065,667 |
| 2,871,709 |
| (3,202,586 | ) | (915,853 | ) | — |
| 7,818,937 |
|
76,788,080-4 |
| GNL Quintero S.A. |
| Chile |
| US Dollar |
| 20.00 | % | 24,126,683 |
| (825,889 | ) | — |
| (4,508,852 | ) | (8,664,477 | ) | 10,127,465 |
|
Foreign |
| Endesa CEMSA S.A. |
| Argentina |
| Argentine Peso |
| 45.00 | % | 4,592,900 |
| 186,494 |
| — |
| (1,481,614 | ) | — |
| 3,297,780 |
|
Foreign |
| Sacme S.A. |
| Argentina |
| Argentine Peso |
| 50.00 | % | 43,868 |
| 1,633 |
| — |
| (12,275 | ) | — |
| 33,226 |
|
76,583,350-7 |
| Konecta Chile S.A. |
| Chile |
| Chilean Peso |
| 26.20 | % | 278 |
| — |
| — |
| — |
| — |
| 278 |
|
|
|
|
|
|
|
|
|
|
|
|
|
|
|
|
|
|
|
|
|
|
|
|
|
|
|
|
|
|
| TOTAL |
| 37,833,671 |
| 2,235,579 |
| (3,203,877 | ) | (6,919,435 | ) | (8,664,477 | ) | 21,281,461 |
|
(1) The Group exercises significant influence indirectly through the 42.5% ownership held in Inversiones Electrogas S.A. which is the immediate parent of Electrogas S.A.with a 99.95% of ownership interest.
b) As of December 31, 2010 and 2009 no changes in ownership interest in our investment associates have occurred.
c) Additional financial information about the investments in associates
· Significant influence investments
The following tables set forth summarized information of the main investment in associates where the group has significant influence, including the aggregated amounts of assets, liabilities, revenues, expenses and profit or loss as of December 31, 2010 and 2009:
December 31, 2010
Significant influence |
| Ownership |
| Current |
| Non-Current |
| Current |
| Non-Current |
| Revenues |
| Expenses |
| Profit (Loss) |
|
Endesa CEMSA S.A. |
| 45.00 | % | 42,063,375 |
| 710,433 |
| 35,898,080 |
| — |
| 3,631,967 |
| (3,180,916 | ) | 451,051 |
|
Inversiones Electrogas S.A. |
| 42.50 | % | — |
| 19,034,552 |
| — |
| — |
| 8,053,180 | �� | (164,082 | ) | 7,889,098 |
|
GNL Quintero S.A. |
| 20.00 | % | 43,182,432 |
| 548,261,034 |
| 15,642,419 |
| 561,382,881 |
| 46,342,847 |
| (59,057,243 | ) | (12,714,396 | ) |
Electrogas S.A. (1) |
| 0.02125 | % | 6,145,145 |
| 36,271,189 |
| 8,307,494 |
| 16,098,755 |
| 15,575,506 |
| (6,788,817 | ) | 8,786,689 |
|
December 31, 2009
Significant influence |
| Ownership |
| Current |
| Non-Current |
| Current |
| Non-Current |
| Revenues |
| Expenses |
| Profit (Loss) |
|
Endesa CEMSA S.A. |
| 45.00 | % | 54,486,842 |
| 168,678 |
| 47,327,120 |
| — |
| 19,339,396 |
| (18,924,965 | ) | 414,431 |
|
Inversiones Electrogas S.A. |
| 42.50 | % | — |
| 18,471,729 |
| 74,230 |
| — |
| 6,940,967 |
| (184,004 | ) | 6,756,963 |
|
GNL Quintero S.A. |
| 20.00 | % | 28,098,229 |
| 562,965,213 |
| 205,586,895 |
| 334,839,224 |
| 12,893,075 |
| (17,022,519 | ) | (4,129,444 | ) |
Electrogas S.A. (1) |
| 0.02125 | % | 5,606,476 |
| 41,393,766 |
| 8,210,466 |
| 21,027,132 |
| 13,510,320 |
| (5,830,170 | ) | 7,680,150 |
|
Appendix No. 3 to these consolidated financial statements provides information about the principal activities and ownership interest of the Group’s investment in associates.
All of our associates do not have published price quotations.
12.2 Jointly controlled companies
The following tables set forth summarized information of jointly controlled companies that are reported using proportional consolidation as of December 31, 2010 and 2009.
December 31, 2010
|
| Ownership |
| Current |
| Non-Current |
| Current |
| Non-Current |
| Revenues |
| Expenses |
| Profit (Loss) |
|
Hidroaysén S.A. |
| 51.00 | % | 7,609,649 |
| 99,469,947 |
| 7,655,622 |
| 642,418 |
| — |
| (7,186,862 | ) | (7,186,862 | ) |
Transmisora Eléctrica de Quillota Ltda |
| 50.00 | % | 3,226,372 |
| 9,502,126 |
| 1,730,150 |
| 943,702 |
| 2,122,132 |
| (1,196,978 | ) | 925,154 |
|
GasAtacama S.A. |
| 50.00 | % | 111,484,190 |
| 291,968,048 |
| 138,310,532 |
| 43,440,220 |
| 334,321,296 |
| (294,331,806 | ) | 39,989,490 |
|
Sistemas Sec S.A. |
| 49.00 | % | 4,948,616 |
| 6,402,040 |
| 4,057,366 |
| 3,793,979 |
| 5,420,246 |
| (5,074,838 | ) | 345,408 |
|
Distribuidora Eléctrica de Cundinamarca S.A. |
| 48.99 | % | 22,106,093 |
| 95,012,672 |
| 25,746,539 |
| 29,366,858 |
| 71,377,710 |
| (63,501,842 | ) | 7,875,868 |
|
December 31, 2009
|
| Ownership |
| Current |
| Non-Current |
| Current |
| Non-Current |
| Revenues |
| Expenses |
| Profit (Loss) |
|
Hidroaysén S.A. |
| 51.00 | % | 8,111,503 |
| 86,908,393 |
| 37,110,402 |
| — |
| — |
| (5,994,070 | ) | (5,994,070 | ) |
Transmisora Eléctrica de Quillota Ltda. |
| 50.00 | % | 1,288,870 |
| 10,198,482 |
| 1,480,132 |
| 876,728 |
| 2,327,365 |
| (1,207,963 | ) | 1,119,402 |
|
GasAtacama S.A. |
| 50.00 | % | 114,435,232 |
| 316,349,774 |
| 187,877,000 |
| 42,467,600 |
| 343,304,368 |
| (319,108,438 | ) | 24,195,930 |
|
Sistemas Sec S.A. |
| 49.00 | % | 6,640,078 |
| 6,667,086 |
| 4,893,676 |
| 5,059,582 |
| 7,814,302 |
| (7,063,659 | ) | 750,643 |
|
Distribuidora Eléctrica de Cundinamarca S.A. |
| 48.99 | % | 29,898,954 |
| 91,606,547 |
| 25,873,650 |
| 33,287,228 |
| 68,128,403 |
| (66,239,227 | ) | 1,889,176 |
|
13. INTANGIBLE ASSETS OTHER THAN GOODWILL
Intangible asset as of December 31, 2010 and 2009 are detailed as follows:
|
| 12-31-2010 |
| 12-31-2009 |
|
Intangible Assets, Net |
| ThCh$ |
| ThCh$ |
|
|
|
|
|
|
|
Intangible Assets, Net |
| 1,452,586,405 |
| 1,446,122,245 |
|
Easements |
| 10,698,674 |
| 11,786,094 |
|
Water Rights |
| 13,745,590 |
| 12,291,780 |
|
Concessions |
| 1,362,756,775 |
| 1,357,976,679 |
|
Development Costs |
| 2,262,982 |
| 12,330 |
|
Patents, Registered Trademarks and Other Rights |
| 23,121 |
| 6,844,249 |
|
Computer Software |
| 58,255,724 |
| 52,003,080 |
|
Other Identifiable Intangible Assets |
| 4,843,539 |
| 5,208,033 |
|
|
| 12-31-2010 |
| 12-31-2009 |
|
Intangible Assets, Gross |
| ThCh$ |
| ThCh$ |
|
|
|
|
|
|
|
Intangible Assets, Gross |
| 2,257,171,663 |
| 2,147,973,843 |
|
Easements |
| 14,216,582 |
| 15,269,989 |
|
Water Rights |
| 17,263,434 |
| 15,232,158 |
|
Concessions |
| 2,052,188,016 |
| 1,950,821,927 |
|
Development Costs |
| 3,875,653 |
| 25,522 |
|
Patents, Registered Trademarks and Other Rights |
| 25,123 |
| 8,541,903 |
|
Computer Software |
| 158,061,864 |
| 145,952,298 |
|
Other Identifiable Intangible Assets |
| 11,540,991 |
| 12,130,046 |
|
|
| 12-31-2010 |
| 12-31-2009 |
|
Accumulated Amortization and Impairment |
| ThCh$ |
| ThCh$ |
|
|
|
|
|
|
|
Accumulated Amortization and Impairment, Total |
| (804,585,258 | ) | (701,851,598 | ) |
Easements |
| (3,517,908 | ) | (3,483,895 | ) |
Water Rights |
| (3,517,844 | ) | (2,940,378 | ) |
Concessions |
| (689,431,241 | ) | (592,845,248 | ) |
Development Costs |
| (1,612,671 | ) | (13,192 | ) |
Patents, Registered Trademarks and Other Rights |
| (2,002 | ) | (1,697,654 | ) |
Computer Software |
| (99,806,140 | ) | (93,949,218 | ) |
Other Identifiable Intangible Assets |
| (6,697,452 | ) | (6,922,013 | ) |
The reconciliation of the carrying amounts of intangible assets for the years ended December 31, 2010 and 2009 is as follows:
Year ended December 31, 2010
Movements in intangible assets |
| Development |
| Easements, |
| Water |
| Concessions, |
| Patents, |
| Computer |
| Other ThCh$ |
| Intangible ThCh$ |
|
|
|
|
|
|
|
|
|
|
|
|
|
|
|
|
|
|
|
Opening Balance at 01/01/2010 |
| 12,33 |
| 11,786,094 |
| 12,291,780 |
| 1,357,976,679 |
| 6,844,249 |
| 52,003,080 |
| 5,208,033 |
| 1,446,122,245 |
|
Movements in Identifiable Intangible Assets |
|
|
|
|
|
|
|
|
|
|
|
|
|
|
|
|
|
Additions |
| 854,638 |
| 878,399 |
| 378,822 |
| 250,062,078 |
| — |
| 19,185,187 |
| 3,201,990 |
| 274,561,114 |
|
Transfers to (from) Non-Current Assets and Disposal Groups Held for Sale |
| — |
| — |
| — |
| — |
| — |
| (2,176,053 | ) | (216,865 | ) | (2,392,918 | ) |
Disposals |
| — |
| — |
| — |
| (13,311,084 | ) | — |
| 45,607,881 |
| — |
| 32,296,797 |
|
Amortization (*) |
| (1,322 | ) | (21,426 | ) | (349,391 | ) | (94,009,562 | ) | — |
| (12,177,319 | ) | (4,417,989 | ) | (110,977,009 | ) |
Foreign Currency Translation Differences |
| (243,935 | ) | 67,799 |
| (388,157 | ) | (66,056,947 | ) | (1,932 | ) | (46,319,510 | ) | 254 |
| (112,942,428 | ) |
Other Increases (Decreases) |
| 1,641,271 |
| (2,012,192 | ) | 1,812,536 |
| (71,904,389 | ) | (6,819,196 | ) | 2,132,458 |
| 1,068,116 |
| (74,081,396 | ) |
Movements in Identifiable Intangible Assets, Total |
| 2,250,652 |
| (1,087,420 | ) | 1,453,810 |
| 4,780,096 |
| (6,821,128 | ) | 6,252,644 |
| -364,494 |
| 6,464,160 |
|
|
|
|
|
|
|
|
|
|
|
|
|
|
|
|
|
|
|
Closing Balance Identifiable Intangible Assets at 12/31/2010 |
| 2,262,982 |
| 10,698,674 |
| 13,745,590 |
| 1,362,756,775 |
| 23,121 |
| 58,255,724 |
| 4,843,539 |
| 1,452,586,405 |
|
(*) See Note 28 depreciation, amortization and impairment losses.
Year ended as of December 31, 2009
Movements in intangible assets |
| Development |
| Easements, |
| Water |
| Concessions, |
| Patents, registered |
| Computer |
| Other |
| Intangible assets, net |
|
|
|
|
|
|
|
|
|
|
|
|
|
|
|
|
|
|
|
Opening Balance at 01/01/2009 |
| 17,123 |
| 8,357,393 |
| 10,503,656 |
| 1,186,692,686 |
| 5,316,837 |
| 53,667,078 |
| 1,055,864 |
| 1,265,610,637 |
|
|
|
|
|
|
|
|
|
|
|
|
|
|
|
|
|
|
|
Movements |
|
|
|
|
|
|
|
|
|
|
|
|
|
|
|
|
|
Additions from Internal Developments |
| — |
| — |
| — |
| — |
| — |
| 805,735 |
| — |
| 805,735 |
|
Additions |
| — |
| 922,067 |
| — |
| 201,622,235 |
| 394,063 |
| 11,036,515 |
| 4,987,412 |
| 218,962,292 |
|
Transfers to (from) Non-Current Assets and Disposal Groups Held for Sale |
| — |
| — |
| — |
| — |
| — |
| (1,547,852 | ) | (233,741 | ) | (1,781,593 | ) |
|
|
|
|
|
|
|
|
|
|
|
|
|
|
|
|
|
|
Amortization |
| (1,333 | ) | (24,159 | ) | (346,002 | ) | (94,784,374 | ) | (226,916 | ) | (11,499,590 | ) | (900,038 | ) | (107,782,412 | ) |
Foreign Currency Translation Differences |
| (3,460 | ) | (62,423 | ) | (1,513,556 | ) | 82,055,009 |
| (907,664 | ) | 452,281 |
| (391,739 | ) | 79,628,448 |
|
Other Increases (Decreases) |
| — |
| 2,593,216 |
| 3,647,682 |
| (17,608,877 | ) | 2,267,929 |
| (911,087 | ) | 690,275 |
| (9,320,862 | ) |
Movements, Total |
| (4,793 | ) | 3,428,701 |
| 1,788,124 |
| 171,283,993 |
| 1,527,412 |
| (1,663,998 | ) | 4,152,169 |
| 180,511,608 |
|
|
|
|
|
|
|
|
|
|
|
|
|
|
|
|
|
|
|
Closing Balance Identifiable Intangible Assets at 12/31/2009 |
| 12,33 |
| 11,786,094 |
| 12,291,780 |
| 1,357,976,679 |
| 6,844,249 |
| 52,003,080 |
| 5,208,033 |
| 1,446,122,245 |
|
In accordance with estimates and projections of the management of the Group, the expected future cash flows attributable to intangible assets allow recovering the carrying amount of these assets recorded as of December 31, 2010 (see Note 3.e).
As of December 31, 2010 and 2009 the Company does not have significant intangible assets with indefinite useful life.
14. GOODWILL
The following table sets forth goodwill by cash-generating-unit or group of them to which it belongs and their movements for the years ended December 31, 2010 and 2009:
Company |
| Opening |
| Additions |
| Foreign Currency |
| Closing Balance |
| Foreign Currency |
| Closing |
|
Distrilec Inversora S.A. |
| 7,383,186 |
| — |
| (2,037,713 | ) | 5,345,473 |
| (628,562 | ) | 4,716,911 |
|
Empresa Distribuidora Sur S.A. |
| 6,255,347 |
| — |
| (1,726,437 | ) | 4,528,910 |
| (532,544 | ) | 3,996,366 |
|
Ampla Energía e Serviços S.A. |
| 231,535,198 |
| — |
| 16,093,387 |
| 247,628,585 |
| (7,897,598 | ) | 239,730,987 |
|
Investluz S.A. |
| 117,678,473 |
| — |
| 8,123,310 |
| 125,801,783 |
| (4,012,172 | ) | 121,789,611 |
|
Empresa Eléctrica de Colina Ltda. |
| 2,240,478 |
| — |
| — |
| 2,240,478 |
| — |
| 2,240,478 |
|
Compañía Distribuidora y Comercializadora de Energía S.A. |
| 12,291,649 |
| — |
| (1,543,016 | ) | 10,748,633 |
| (212,190 | ) | 10,536,443 |
|
Empresa Eléctrica Pangue S.A. |
| 3,139,337 |
| — |
| — |
| 3,139,337 |
| — |
| 3,139,337 |
|
Endesa Costanera S.A. |
| 4,556,780 |
| — |
| (1,266,688 | ) | 3,290,092 |
| (386,875 | ) | 2,903,217 |
|
Southern Cone Power Argentina S.A. |
| 3,779,030 |
| — |
| (1,045,539 | ) | 2,733,491 |
| (321,426 | ) | 2,412,065 |
|
Hidroeléctrica el Chocón S.A. |
| 19,586,941 |
| — |
| (5,410,532 | ) | 14,176,409 |
| (1,666,976 | ) | 12,509,433 |
|
Compañía Eléctrica San Isidro S.A. |
| 1,516,768 |
| — |
| — |
| 1,516,768 |
| — |
| 1,516,768 |
|
Empresa de Energía de Cundinamarca S.A. (1) |
| — |
| 7,083,530 |
| 414,012 |
| 7,497,542 |
| (149,075 | ) | 7,348,467 |
|
Empresa de Distribución Eléctrica de Lima Norte S.A. (2) |
| — |
| 43,662,944 |
| (3,146,697 | ) | 40,516,247 |
| (2,010,631 | ) | 38,505,616 |
|
Cachoeira Dourada S.A. |
| 85,140,100 |
| — |
| 6,189,928 |
| 91,330,028 |
| (3,426,563 | ) | 87,903,465 |
|
Edegel S.A. (2) |
| 553,603 |
| 81,370,212 |
| (6,003,555 | ) | 75,920,260 |
| (2,989,192 | ) | 72,931,068 |
|
Emgesa S.A. E.S.P. |
| 5,455,951 |
| — |
| (686,926 | ) | 4,769,025 |
| (95,607 | ) | 4,673,418 |
|
Chilectra S.A. |
| 128,374,362 |
| — |
| — |
| 128,374,362 |
| — |
| 128,374,362 |
|
Empresa Nacional de Electricidad S.A. |
| 731,782,459 |
| — |
| — |
| 731,782,459 |
| — |
| 731,782,459 |
|
Inversiones Distrilima S.A. |
| 13,925 |
| — |
| (1,874 | ) | 12,051 |
| (598 | ) | 11,453 |
|
Total |
| 1,361,283,587 |
| 132,116,686 |
| 7,951,660 |
| 1,501,351,933 |
| (24,330,009 | ) | 1,477,021,924 |
|
In accordance with the Group’s management estimates and projections, the future cash flows projections used to determined the recoverable amount of the Cash Generating Units (or groups of Cash-Generating Units), to which the acquired goodwill has been allocated, exceeds its carrying amount, as such no impairment losses have been recognized as of December 31, 2010 and 2009 (see Note 3.e).
(1) The addition corresponds to DECA’s purchase of Empresa de Energía de Cundinamarca’s 48.997% ownership interest in March of 2009. As DECA is jointly controlled by our subsidiary Codensa S.A., it is reported by Codensa S.A. using proportionate consolidation (see Notes 2.4.1 and 5.c).
(2) The additions in Edegel and Edelnor originated as a result of the acquisitions that took place in October of 2009, as per the detail in Note 24.6. Both Edegel and Edelnor were already being consolidated.
15. PROPERTY, PLANT AND EQUIPMENT
Property, plant and equipment as of December 31, 2010 and 2009 are as follows:
|
| 12-31-2010 |
| 12-31-2009 |
|
Classes of Property, Plant and Equipment, Net |
| ThCh$ |
| ThCh$ |
|
|
|
|
|
|
|
Property, Plant and Equipment, Net |
| 6,751,940,655 |
| 6,864,071,242 |
|
Construction in Progress |
| 810,013,619 |
| 710,996,813 |
|
Land |
| 122,864,336 |
| 105,539,626 |
|
Buildings |
| 477,500,896 |
| 537,134,153 |
|
Plant and Equipment |
| 5,242,469,609 |
| 5,290,412,998 |
|
IT Equipment |
| 6,929,468 |
| 14,165,508 |
|
Fixtures and Fittings |
| 9,513,233 |
| 9,551,749 |
|
Motor Vehicles |
| 1,892,193 |
| 1,702,512 |
|
Other |
| 80,757,301 |
| 194,567,883 |
|
|
| 12-31-2010 |
| 12-31-2009 |
|
Classes of Property, Plant and Equipment, Gross |
| ThCh$ |
| ThCh$ |
|
|
|
|
|
|
|
Property, Plant and Equipment, Gross |
| 11,520,970,856 |
| 11,449,077,029 |
|
Construction in Progress |
| 810,013,619 |
| 710,996,813 |
|
Land |
| 122,864,336 |
| 105,539,626 |
|
Buildings |
| 669,526,026 |
| 729,774,296 |
|
Plant and Equipment |
| 9,723,445,293 |
| 9,471,762,740 |
|
IT Equipment |
| 28,566,533 |
| 44,699,294 |
|
Fixtures and Fittings |
| 46,408,473 |
| 51,720,215 |
|
Motor Vehicles |
| 7,212,430 |
| 8,117,546 |
|
Other |
| 112,934,146 |
| 326,466,499 |
|
Classes of Accumulated Depreciation and Impairment, Property, |
| 12-31-2010 |
| 12-31-2009 |
|
Plant and Equipment |
| ThCh$ |
| ThCh$ |
|
|
|
|
|
|
|
Accumulated Depreciation and Impairment, Property, Plant and Equipment, Total |
| (4,769,030,201 | ) | (4,585,005,787 | ) |
Buildings |
| (192,025,130 | ) | (192,640,143 | ) |
Plant and Equipment |
| (4,480,975,684 | ) | (4,181,349,742 | ) |
IT Equipment |
| (21,637,065 | ) | (30,533,786 | ) |
Fixtures and Fittings |
| (36,895,240 | ) | (42,168,466 | ) |
Motor Vehicles |
| (5,320,237 | ) | (6,415,034 | ) |
Other |
| (32,176,845 | ) | (131,898,616 | ) |
The reconciliation of the carrying amounts of property, plant and equipment for the years ended December 31, 2010 and 2009 is as follows:
Changes in 2010 |
| Construction |
| Land |
| Buildings, |
| Plant and |
| IT |
| Fixtures and |
| Motor |
| Other |
| Property, |
|
Opening Balance at January 1, 2010 |
| 710,996,813 |
| 105,539,626 |
| 537,134,153 |
| 5,290,412,998 |
| 14,165,508 |
| 9,551,749 |
| 1,702,512 |
| 194,567,883 |
| 6,864,071,242 |
|
Changes |
|
|
|
|
|
|
|
|
|
|
|
|
|
|
|
|
|
|
|
Additions |
| 396,969,270 |
| — |
| — |
| — |
| — |
| — |
| — |
| — |
| 396,969,270 |
|
Disposals |
| (56,851 | ) | (386,262 | ) | (43,444 | ) | (1,366,863 | ) | (36,068 | ) | (270 | ) | (16,026 | ) | (59,964 | ) | (1,965,748 | ) |
Transfers to (from) Non-Current Assets and Disposal Groups Held for Sale |
| (3,390,701 | ) | (172,020 | ) | (1,442,144 | ) | (3,863,098 | ) | (4,573,105 | ) | (7,257,038 | ) | (957,760 | ) | (1,179,076 | ) | (22,834,942 | ) |
Depreciation Expense |
| — |
| — |
| (17,163,012 | ) | (306,759,286 | ) | (5,642,316 | ) | (3,851,776 | ) | (1,017,273 | ) | (3,606,603 | ) | (338,040,266 | ) |
Impairment Loss Recognized in profit or loss (*) |
| — |
| — |
| — |
| (1,340,235 | ) | — |
| — |
| — |
| — |
| (1,340,235 | ) |
Foreign Currency Translation Differences |
| (12,614,659 | ) | (3,009,524 | ) | (27,306,886 | ) | (112,716,613 | ) | 163,184 |
| (633,677 | ) | (105,158 | ) | (5,798,019 | ) | (162,021,352 | ) |
Other Increases (Decreases) |
| (281,890,253 | ) | 20,892,516 |
| (13,677,771 | ) | 378,102,706 |
| 2,852,265 |
| 11,704,245 |
| 2,285,898 |
| (103,166,920 | ) | 17,102,686 |
|
Total Changes |
| 99,016,806 |
| 17,324,710 |
| (59,633,257 | ) | (47,943,389 | ) | (7,236,040 | ) | (38,516 | ) | 189,681 |
| (113,810,582 | ) | (112,130,587 | ) |
Closing Balance at December 31, 2010 |
| 810,013,619 |
| 122,864,336 |
| 477,500,896 |
| 5,242,469,609 |
| 6,929,468 |
| 9,513,233 |
| 1,892,193 |
| 80,757,301 |
| 6,751,940,655 |
|
Changes in 2009 |
| Construction |
| Land |
| Buildings, |
| Plant and |
| IT |
| Fixtures and |
| Motor |
| Other |
| Property, |
|
Opening Balance at January 1, 2009 |
| 704,106,532 |
| 107,263,181 |
| 635,062,398 |
| 5,645,814,015 |
| 17,959,471 |
| 24,495,712 |
| 4,152,102 |
| 76,938,720 |
| 7,215,792,131 |
|
Changes |
|
|
|
|
|
|
|
|
|
|
|
|
|
|
|
|
|
|
|
Additions |
| 614,263,886 |
| — |
| — |
| — |
| — |
| — |
| — |
|
|
| 614,263,886 |
|
Acquisitions Through Business Combinations |
| 738,56 |
| 321,713 |
| 162,902 |
| 31,858,508 |
| 119,254 |
| 144,707 |
| 25,407 |
| 32,58 |
| 33,403,631 |
|
Disposals |
| (5,566,491 | ) | (172,005 | ) | (28,910 | ) | 14,737,550 |
| (32,472 | ) | (16,548 | ) | (254,650 | ) | (11,661,348 | ) | (2,994,874 | ) |
Transfers to (from) Non-Current Assets and Disposal Groups Held for Sale |
| (2,604,574 | ) | — |
| (153,130 | ) | (768,227 | ) | (1,445,215 | ) | (7,121,974 | ) | (1,113,818 | ) | (981,469 | ) | (14,188,407 | ) |
Depreciation Expense |
| — |
| — |
| (17,141,091 | ) | (305,897,443 | ) | (5,723,356 | ) | (3,317,429 | ) | (1,144,121 | ) | (13,364,107 | ) | (346,587,547 | ) |
Impairment Loss Recognized in profit or loss (*) |
| — |
| — |
| — |
| (43,999,600 | ) | — |
| — |
| — |
| — |
| (43,999,600 | ) |
Foreign Currency Translation Differences |
| (21,558,720 | ) | (22,245,010 | ) | (80,797,075 | ) | (365,052,553 | ) | (5,358,344 | ) | (12,300,921 | ) | (1,465,393 | ) | (33,890,366 | ) | (542,668,382 | ) |
Other Increases (Decreases) |
| (578,382,380 | ) | 20,371,747 |
| 29,059 |
| 313,720,748 |
| 8,646,170 |
| 7,668,202 |
| 1,502,985 |
| 177,493,873 |
| (48,949,596 | ) |
Total Changes |
| 6,890,281 |
| (1,723,555 | ) | (97,928,245 | ) | (355,401,017 | ) | (3,793,963 | ) | (14,943,963 | ) | (2,449,590 | ) | 117,629,163 |
| (351,720,889 | ) |
Closing Balance at December 31, 2009 |
| 710,996,813 |
| 105,539,626 |
| 537,134,153 |
| 5,290,412,998 |
| 14,165,508 |
| 9,551,749 |
| 1,702,512 |
| 194,567,883 |
| 6,864,071,242 |
|
(*) See Note 28, for impairment loss information.
Additional information in Property, Plant and Equipment:
a) Main Investments
Material investments in the electricity generation business include developments in the program to create new capacity.
In Chile, the construction of the Bocamina II Coal-fired Thermal Power Plant with capacity of 370 MW stands out among other projects. The project Central Térmica Quintero, consisting primarily of an open-cycle plant that operates both with LNG (liquid natural gas) and with diesel with capacity of 257 MW, was completed and started operations on September 2009. The Canela II Wind Farm Expansion project with 40 wind generators with 60 MW capacity has been finalized and put in operation on December 2009, reinforcing Endesa Chile’s commitment witer the environment by developing non-conventional renewable energies (NCREs).
In Colombia, the Central Hidráulica El Quimbo, a hydroelectric dam with 400W of installed capacity and average anual generation around 2,216 GWH, is currently under construction.
In Peru, the Santa Rosa Open Cycle Thermoelectric Power Plant with a capacity of 189 MW was completed and placed in service in September 2009. This plant is currently operating using natural gas from Camisea.
b) Finance leases
As of December 31, 2010 and 2009, property, plant and equipment includes ThCh$ 129,749,447 and ThCh$ 137,586,941, respectively, in leased assets classified as finance leases.
The present value of future minimum lease payments derived from these finance leases is as follows:
|
| 12-31-2010 |
| 12-31-2009 |
| ||||||||
|
| Gross |
| Interest |
| Present |
| Gross |
| Interest |
| Present |
|
Less than one year |
| 12,311,927 |
| 2,117,942 |
| 10,193,985 |
| 14,573,470 |
| 3,253,227 |
| 11,320,243 |
|
Between 1 and 5 years |
| 40,900,311 |
| 8,856,066 |
| 32,044,245 |
| 57,745,294 |
| 12,162,349 |
| 45,582,945 |
|
More than 5 years |
| 32,304,929 |
| 3,209,115 |
| 29,095,814 |
| 48,383,017 |
| 7,089,994 |
| 41,293,023 |
|
Total |
| 85,517,167 |
| 14,183,123 |
| 71,334,044 |
| 120,701,781 |
| 22,505,570 |
| 98,196,211 |
|
Leased assets relate to:
1. Endesa Chile S.A.: lease agreement for Electric Transmission Lines and Installations (Ralco-Charrúa 2X220 KV) entered into between Endesa Chile and Abengoa Chile S.A. The lease agreement has a 20-year maturity and bears interest at an annual rate of 6.5%.
2. Edegel S.A.: lease agreements to finance the project of converting the Ventanilla thermoelectrical plant to a combined cycle plant. The agreements were entered between Edegel S.A. and the financial institutions Banco de Crédito del Perú and BBVA - Banco Continental. These agreements have an 8-year maturity and bear interest at an annual rate of Libor + 2.0% and Libor +3.0% as of December 31, 2010 and 2009, respectively.
c) Operating leases
As of December 31, 2010, 2009 and 2008 total payments recognized as expense from operating leases totaled ThCh$ 16,980,825, ThCh$ 19,969,187 and ThCh$ 15,312,905, respectively.
As of December 31, 2010, 2009 and 2008 the total future minimum lease payments under those contracts are as follows:
|
| 12-31-2010 |
| 12-31-2009 |
| 12-31-2008 |
|
Less than one year |
| 13,309,401 |
| 14,046,981 |
| 14,910,341 |
|
Between 1 and 5 years |
| 20,500,145 |
| 22,922,219 |
| 3,982,855 |
|
More than 5 years |
| 7,954,802 |
| 8,952,380 |
| 14,376,703 |
|
Total |
| 41,764,348 |
| 45,921,580 |
| 33,269,899 |
|
d) Other information
i) As of December 31, 2010 and 2009, the Group had contractual commitments for the acquisition of property, plant and equipment amounting to ThCh$ 205,979,469 and ThCh$ 334,581,961, respectively.
ii) As of December 31, 2010 and 2009, the Group had property, plant and equipment pledged as security for liabilities amounting to ThCh$ 305,655,772 and ThCh$ 462,772,688, respectively (see Note 34).
iii) The Company and its foreign subsidiaries have insurance policies for risk, earthquake, machinery breakdown and damages for business interruption with a US$ 300 million limit in the case of generating companies and a US$ 30 million limit for distribution companies, including business interruption coverage, The premiums associated with these policies are presented under line item “Prepayments” within assets,
iv) GasAtacama, in which Endesa Chile has a 50% interest consolidated using the proportional integration method, has, among other assets, a combined-cycle electricity generation plant in northern Chile. As importing natural gas from neighboring countries was not possible, GasAtacama has been forced to generate electricity using alternative fuels, the cost of which significantly increased during the last months of 2007 due to increases in oil prices. As a result, the company filed lawsuits for early termination of a contract with distributor Emel. On January 25, 2008, a ruling was issued in arbitration proceedings on this matter to deny early termination. This situation significantly reduced the recoverable value of the aforementioned plant and, therefore, as of December 31, 2007, an impairment provision of US$ 110 million was recorded.
v) The current situation regarding long-lived assets, mostly plants and infrastructure constructed with the purpose of providing energy resources for the SIC system from year 1998, has changed, principally due to the installation of new thermal plants in the SIC, the arrival of LNG, and the estimated development of new projects. This situation has created an environment of excess supply for future years resulting in the expectation that some of these assets will not be used. Accordingly, at December 31, 2009 the Company has recorded an impairment provision for these assets for ThCh$ 43,999,600,
vi) As a result of the February 27, 2010 earthquake in Chile, some of our plant and equipment were partially or totally impaired. The impact on our total assets, however, is minor as the only facilities that suffered some damage in infrastructure were the Bocamina and Bocamina II plants, the latter under construction, as well as a few other assets from our distribution business.
Due to the aforementioned impairments, we have written down ThCh$ 395,153 in assets. Additionally, the Group had to incur expenditures related to repairment and capital improvements totaling ThCh$ 13,043,744, primarily in the Bocamina plant. All of the disbursements incurred are covered by insurance, which contain a US$ 2.5 million policy deductible.
The Group has the necessary insurance coverage for these types of exceptional claims, which provide coverage for material damage, as well as business interruption. See Note 25 for additional information.
vii) Companhia De Interconexão Energética (‘CIEN’) sells electricity in Argentina and Brazil. Because of the reduction in the maximum availability of the generation and physical guarantee of energy and its associated power, the Company is focusing its business on a different compensation structure that is not based on the purchase and sale of energy between the countries. Given the strategic importance of the Company’s assets
in the relations between Brazil and Argentina, the Brazilian government has been presented with a new business plan model changing its selling activity to an electricity transmission activity with payment of a fixed compensation, which is in the process of being approved. This new plan involves integrating its transmission lines with the Brazilian transmission grid operated by the Brazilian Government.
In prior periods, the Argentinean and Uruguayan governments, formalized toll payments with the Company to transport energy between the two countries. Management considers that this situation further emphasizes the importance of the application made to the Brazilian Government to approve the new business plan and considers that it will probably be approved. In addition, on July 4, 2010 the Company signed a new transmission contract for a six-month period for a total of US$ 155 million to cover the energy transmission required by the Argentinean government.
Based on its estimates on the different business alternatives, CIEN’s management considers that it will not have any problems in recovering all its net assets. It is expected that CIEN’s new business model will start operating during the next year.
16. INVESTMENT PROPERTY
The detail of the composition of, and changes in, investment property during 2010 and 2009 is as follows:
Investment Properties |
| ThCh$ |
|
|
|
|
|
Opening Balance at January 1, 2009 |
| 26,368,681 |
|
Additions |
| 5,063,418 |
|
Disposals |
| (2,985,275 | ) |
Depreciation Expense |
| (24,029 | ) |
Impairment Losses Reversed Recognized in Consolidated Statement of Comprehensive Income(*) |
| 2,809,044 |
|
Balance at December 31, 2009 |
| 31,231,839 |
|
Additions |
| 1,303,676 |
|
Disposals |
| (2,732,209 | ) |
Depreciation Expense |
| (24,029 | ) |
Impairment Losses Reversed Recognized in Consolidated Statement of Comprehensive Income(*) |
| 3,239,877 |
|
Closing Balance Investment Property at December 31, 2010 |
| 33,019,154 |
|
(*) Impairment losses reversed are presented in line item Reversal of impairment loss (impairment loss) recognized in profit or loss in the consolidated statements of comprehensive income, see Note 28.
The fair value of the Group’s investment properties as of December 31, 2010 and 2009 determined on the basis of valuations carried out internally was ThCh$ 34,099,993 and ThCh$ 34,921,883, respectively.
The selling price of investment properties disposed of in 2010 and 2009 was ThCh$ 8,015,891 and ThCh$ 7,369,162, respectively.
The amounts recognized in profit or loss during 2010, 2009, and 2008 as direct operating expenses arising from investment properties were not significant.
The Group has insurance policies to cover operational risks of its investment properties, as well as to cover legal claims against the Group that could potentially arise from exercising its business activity. The Group’s management considers that the insurance policy coverage is sufficient against the risks involved.
17. DEFERRED TAX
a) The deferred taxes recognized by temporary differences as of December 31, 2010 and 2009 are as follows:
|
| Deferred Tax Assets |
| Deferred Tax Liabilities |
| ||||
Temporary Differences |
| 12-31-2010 |
| 12-31-2009 |
| 12-31-2010 |
| 12-31-2009 |
|
Deferred Tax Relating to Depreciation |
| 124,814,250 |
| 112,732,337 |
| 474,063,238 |
| 511,370,845 |
|
Deferred Tax Relating to Amortization |
| — |
| — |
| 8,292,149 |
| 8,226,527 |
|
Deferred Tax Relating to Accruals |
| 9,031,226 |
| 7,805,157 |
| 26,142,262 |
| 27,169,053 |
|
Deferred Tax Relating to Provisions |
| 130,298,290 |
| 143,783,859 |
| 7,494,432 |
| 5,799,412 |
|
Deferred Tax Relating to Foreign Exchange Contracts |
| 46,746,028 |
| 29,199,072 |
| 1,155,119 |
| 2,919,974 |
|
Deferred Tax Relating to Post-employment Benefit Obligations |
| 38,073,254 |
| 27,080,973 |
| 3,674,593 |
| 1,391,382 |
|
Deferred Tax Relating to Revaluations of Financial Instruments |
| 39,794,055 |
| 34,574,100 |
| 4,324,798 |
| 293,219 |
|
Deferred Tax Relating to Tax Losses |
| 36,399,383 |
| 64,935,086 |
| — |
| — |
|
Deferred Tax Relating to Other items |
| 27,477,878 |
| 34,785,937 |
| 30,776,987 |
| 15,878,885 |
|
|
|
|
|
|
|
|
|
|
|
Total |
| 452,634,364 |
| 454,896,521 |
| 555,923,578 |
| 573,049,297 |
|
b) The following table sets forth the changes in deferred taxes in the Consolidated Statement of Financial Position during 2010 and 2009:
|
| Assets |
| Liabilities |
|
Deferred Tax Movements |
| ThCh$ |
| ThCh$ |
|
Balance at January 01, 2009 |
| 511,300,668 |
| 635,013,331 |
|
Increase (Decrease) in Profit or Loss |
| (41,820,393 | ) | (20,683,609 | ) |
Increase (Decrease) in Equity |
| 6,628,427 |
| 9,440,909 |
|
Foreign Currency Translation |
| (16,112,600 | ) | (47,324,914 | ) |
Other Increase (Decrease) |
| (5,099,581 | ) | (3,396,420 | ) |
Balance at December 31, 2009 |
| 454,896,521 |
| 573,049,297 |
|
Increase (Decrease) in Profit or Loss |
| (9,615,881 | ) | (2,995,918 | ) |
Increase (Decrease) in Equity |
| 13,742,269 |
| 2,870,641 |
|
Foreign Currency Translation |
| (12,073,361 | ) | (17,943,096 | ) |
Other Increase (Decrease) |
| 5,684,816 |
| 942,654 |
|
Balance at December 31, 2010 |
| 452,634,364 |
| 555,923,578 |
|
Recovery of deferred tax assets will depend on whether sufficient tax profits are obtained in the future. The Company believes that the future profit projections for its numerous subsidiaries will allow these assets to be recovered.
c) As of December 31, 2010 and 2009, the Group has not recognized deferred tax assets related to tax losses totaling ThCh$ 16,551,349 and ThCh$ 24,643,223, respectively. The unrecognized tax losses can be carried forward indefinitely.
The Group has not recognized deferred tax liabilities for taxable temporary differences associated with investment in subsidiaries, associates, and jointly controlled entities, as it is able to control the timing of the reversal of the temporary differences and considers that it is probable that such temporary differences will not reverse in the foreseeable future. The aggregate amount of taxable temporary differences associated with investments in subsidiaries, associates, and jointly controlled entities, for which deferred tax liabilities have not been recognized totaled ThCh$ 1,995,679,814 as of December 31, 2010 (Ch$ 931,081,512 as of December 31, 2009).
The Group is potentially subject to income tax audits by the tax authorities of each country in which the Group operates. Such tax audits can be performed until the applicable statute of limitation expire. Tax audits by their
nature are often complex and could require several years to complete. The following table sets forth a summary of tax years, potentially subject to examination, in the significant tax jurisdictions in which the Group operates:
Country |
| Period |
|
Chile |
| 2007-2010 |
|
Argentina |
| 2006-2010 |
|
Brazil |
| 2006-2010 |
|
Colombia |
| 2008-2010 |
|
Peru |
| 2007-2010 |
|
Given the range of possible interpretations of tax standards, the results of any future inspections carried out by tax authorities for the years subject to audit can give rise to tax liabilities that cannot currently be quantified. Nevertheless, Enersis’s Management estimates that the liabilities, if any, that may arise from such audits, would not significantly impact the companies’ future results.
The deferred tax effects of the components of other comprehensive income for the years 2010 and 2009 are as follows:
|
| Balance at 12-31-2010 |
| Balance at 12-31-2009 |
| Balance at 12-31-2008 |
| ||||||||||||
Deferred tax effects of components of other |
| Amount |
| Income |
| Amount |
| Amount |
| Income |
| Amount |
| Amount |
| Income |
| Amount |
|
Income |
| ThCh$ |
| ThCh$ |
| ThCh$ |
| ThCh$ |
| ThCh$ |
| ThCh$ |
| ThCh$ |
| ThCh$ |
| ThCh$ |
|
Available-for-Sale Financial Assets |
| (179 | ) | 31 |
| (148 | ) | 61,031 |
| (10,528 | ) | 50,503 |
| 436 |
| (3 | ) | 433 |
|
Cash Flow Hedge |
| 30,911,303 |
| (5,301,050 | ) | 25,610,253 |
| 192,801,668 |
| (33,917,966 | ) | 158,883,702 |
| (301,007,749 | ) | 46,849,978 |
| (254,157,771 | ) |
Foreign currency translation |
| (138,554,045 | ) | — |
| (138,554,045 | ) | (246,854,956 |
| — |
| (246,854,956 |
| 191,370,521 |
| — |
| 191,370,521 |
|
Actuarial income on defined benefit pension plans |
| (48,495,375 | ) | 16,515,279 |
| (31,980,096 | ) | (15,599,453 | ) | 1,369,374 |
| (14,230,079 | ) | (34,060,925 | ) | 11,439,369 |
| (22,621,556 | ) |
|
|
|
|
|
|
|
|
|
|
|
|
|
|
|
|
|
|
|
|
Total |
| (156,138,296 | ) | 11,214,260 |
| (144,924,036 | ) | (69,591,710 | ) | (32,559,120 | ) | (102,150,830 | ) | (143,697,717 | ) | 58,289,344 |
| (85,408,373 | ) |
18. OTHER FINANCIAL LIABILITIES
The balance of other financial liabilities as of December 31, 2010 and 2009 is as follows:
|
| 12-31-2010 |
| 12-31-2009 |
| ||||
Classes of financial liabilities |
| Current |
| Non-Current |
| Current |
| Non-Current |
|
Interest bearing loans |
| 652,979,492 |
| 2,763,822,330 |
| 718,111,432 |
| 3,313,724,298 |
|
Hedging derivatives (*) |
| 10,002,909 |
| 240,113,443 |
| 8,441,901 |
| 206,931,247 |
|
Non-hedging derivatives (**) |
| — |
| — |
| 420,822 |
| — |
|
Obligation for concession of Túnel El Melón |
| 1,967,333 |
| 11,020,674 |
| 1,778,071 |
| 12,788,275 |
|
Other financial liabilities |
| 648,284 |
| — |
| 275,969 |
| — |
|
|
|
|
|
|
|
|
|
|
|
Total |
| 665,598,018 |
| 3,014,956,447 |
| 729,028,195 |
| 3,533,443,820 |
|
(*) See Note 20.2.a
(**) See Note 20.2.b
18.1 Breakdown of interest-bearing liabilities
The current and non-current detail of interest-bearing borrowings as of December 31, 2010, and 31, 2009 are as follows:
|
| 12-31-2010 |
| 12-31-2009 |
| ||||
|
| Current |
| Non-current |
| Current |
| Non-current |
|
Bank loans |
| 244,503,010 |
| 566,764,624 |
| 345,447,781 |
| 832,837,904 |
|
Unsecured obligations |
| 281,652,334 |
| 2,039,070,748 |
| 230,892,915 |
| 2,277,447,381 |
|
Secured obligations |
| 9,522,288 |
| 17,703,710 |
| 11,023,415 |
| 28,559,670 |
|
Finance leases |
| 10,193,985 |
| 61,140,059 |
| 11,320,243 |
| 86,875,968 |
|
Other loans |
| 107,107,875 |
| 79,143,189 |
| 119,427,078 |
| 88,003,375 |
|
|
|
|
|
|
|
|
|
|
|
Total |
| 652,979,492 |
| 2,763,822,330 |
| 718,111,432 |
| 3,313,724,298 |
|
Bank Loans by currency and contractual maturity as of December 31, 2010 and December 31, 2009, is as follows:
a) Summary of Bank Loans by currency and maturity
|
|
|
|
|
|
|
| Current |
| Non-Current |
| ||||||||||
Country |
| Currency |
| Nominal |
| Secured/ |
| One toThree |
| Three to twelve |
| Total |
| One to Three |
| Three to Five |
| More than five |
| Total Non- |
|
|
|
|
|
|
|
|
| ThCh$ |
| ThCh$ |
| ThCh$ |
| ThCh$ |
| ThCh$ |
| ThCh$ |
| ThCh$ |
|
Chile |
| US$ |
| 2.75 | % | Unsecured |
| 381,532 |
| 18,915,156 |
| 19,296,688 |
| 2,871,499 |
| 95,144,820 |
| — |
| 98,016,319 |
|
Peru |
| US$ |
| 2.95 | % | Unsecured |
| 999,046 |
| 16,410,407 |
| 17,409,453 |
| 11,694,152 |
| 6,908,207 |
| 21,661,326 |
| 40,263,685 |
|
Peru |
| Soles |
| 3.96 | % | Unsecured |
| 1,839,538 |
| — |
| 1,839,538 |
| 31,245,764 |
| — |
| — |
| 31,245,764 |
|
Argentina |
| US$ |
| 5.24 | % | Unsecured |
| 5,085,358 |
| 17,057,145 |
| 22,142,503 |
| 4,013,854 |
| — |
| — |
| 4,013,854 |
|
Argentina |
| Ar$ |
| 17.27 | % | Unsecured |
| 14,760,009 |
| 16,463,487 |
| 31,223,496 |
| 27,395,848 |
| 706,664 |
| — |
| 28,102,512 |
|
Colombia |
| CPs |
| 6.91 | % | Unsecured |
| — |
| 5,041,882 |
| 5,041,882 |
| — |
| 74,201,702 |
| — |
| 74,201,702 |
|
Brazil |
| US$ |
| 6.35 | % | Unsecured |
| 262,048 |
| 9,294,804 |
| 9,556,852 |
| 15,760,620 |
| 13,466,382 |
| 10,628,347 |
| 39,855,349 |
|
Brazil |
| R$ |
| 10.17 | % | Unsecured |
| 20,644,352 |
| 117,348,246 |
| 137,992,598 |
| 210,069,710 |
| 31,928,737 |
| 9,066,992 |
| 251,065,439 |
|
|
|
|
|
|
|
|
|
|
|
|
|
|
|
|
|
|
|
|
|
|
|
|
|
|
|
|
| Total |
| 43,971,883 |
| 200,531,127 |
| 244,503,010 |
| 303,051,447 |
| 222,356,512 |
| 41,356,665 |
| 566,764,624 |
|
|
|
|
|
|
|
|
| Current |
| Non-Current |
| ||||||||||
Country |
| Currency |
| Nominal |
| Secured/ |
| One toThree |
| Three to twelve |
| Total |
| One to Three |
| Three to Five |
| More than |
| Total Non- |
|
|
|
|
|
|
|
|
| ThCh$ |
| ThCh$ |
| ThCh$ |
| ThCh$ |
| ThCh$ |
| ThCh$ |
| ThCh$ |
|
Chile |
| US$ |
| 2.22 | % | Unsecured |
| 370,984 |
| 163,384,485 |
| 163,755,469 |
| 104,732,133 |
| 103,684,532 |
| 829,651 |
| 209,246,316 |
|
Peru |
| US$ |
| 5.12 | % | Unsecured |
| 11,446,321 |
| 6,188,337 |
| 17,634,658 |
| 13,297,208 |
| 11,561,913 |
| — |
| 24,859,121 |
|
Peru |
| Soles |
| 4.38 | % | Unsecured |
| 8,715,418 |
| — |
| 8,715,418 |
| 42,167,699 |
| — |
| — |
| 42,167,699 |
|
Argentina |
| US$ |
| 8.7 | % | Unsecured |
| 8,324,583 |
| 13,621,109 |
| 21,945,692 |
| 36,113,536 |
| — |
| — |
| 36,113,536 |
|
Argentina |
| Ar$ |
| 15.94 | % | Unsecured |
| 3,963,387 |
| 6,873,342 |
| 10,836,729 |
| 18,960,874 |
| — |
| — |
| 18,960,874 |
|
Colombia |
| CPs |
| 12.92 | % | Unsecured |
| 744,192 |
| 9,592,842 |
| 10,337,034 |
| — |
| 75,661,785 |
| — |
| 75,661,785 |
|
Brazil |
| US$ |
| 6.04 | % | Unsecured |
| 2,111,064 |
| 4,375,237 |
| 6,486,301 |
| 11,827,324 |
| 23,742,212 |
| 18,359,821 |
| 53,929,357 |
|
Brazil |
| R$ |
| 11.21 | % | Unsecured |
| 194,837 |
| 105,541,643 |
| 105,736,480 |
| 196,029,381 |
| 175,869,835 |
| — |
| 371,899,216 |
|
|
|
|
|
|
|
|
|
|
|
|
|
|
|
|
|
|
|
|
|
|
|
|
|
|
|
|
| Total |
| 35,870,786 |
| 309,576,995 |
| 345,447,781 |
| 423,128,155 |
| 390,520,277 |
| 19,189,472 |
| 832,837,904 |
|
The fair value of current and non-current bank borrowings totaled ThCh$ 844,554,823 and ThCh$ 1,307,770,461 as of December 31, 2010 and 2009, respectively.
· Identification of Bank Borrowings by Companies
Company |
| Company |
| Country |
| ID Number |
| Financial Institution |
| Country |
| Currency |
| Effective |
| Nominal |
|
Foreign |
| Ampla |
| Brazil |
| Foreign |
| Banco Itaú |
| Brazil |
| Reais |
| 9,88% |
| 9,88% |
|
Foreign |
| Ampla |
| Brazil |
| Foreign |
| Unibanco |
| Brazil |
| Reais |
| 9,76% |
| 9,76% |
|
Foreign |
| Ampla |
| Brazil |
| Foreign |
| Banco Alfa |
| Brazil |
| Reais |
| 9,53% |
| 9,53% |
|
Foreign |
| Ampla |
| Brazil |
| Foreign |
| Brasdesco |
| Brazil |
| Reais |
| 6,92% |
| 6,92% |
|
Foreign |
| Ampla |
| Brazil |
| Foreign |
| Banco do Brasil |
| Brazil |
| Reais |
| 9,63% |
| 9,63% |
|
Foreign |
| Ampla |
| Brazil |
| Foreign |
| BANCO HSBC |
| Brazil |
| Reais |
| 9,63% |
| 9,63% |
|
Foreign |
| CGTF Fortaleza |
| Brazil |
| Foreign |
| IFC - A |
| Brazil |
| US$ |
| 7,93% |
| 7,89% |
|
Foreign |
| CGTF Fortaleza |
| Brazil |
| Foreign |
| IFC - B |
| Brazil |
| US$ |
| 2,78% |
| 2,98% |
|
Foreign |
| CGTF Fortaleza |
| Brazil |
| Foreign |
| IFC - C |
| Brazil |
| US$ |
| 11,95% |
| 11,96% |
|
Foreign |
| Chinango |
| Peru |
| Foreign |
| BANCO CONTINENTAL |
| Peru |
| Soles |
| 4,60% |
| 4,52% |
|
Foreign |
| Chinango |
| Peru |
| Foreign |
| BANCO CONTINENTAL |
| Peru |
| US$ |
| 3,21% |
| 3,21% |
|
Foreign |
| Chinango |
| Peru |
| Foreign |
| BANCO CONTINENTAL |
| Peru |
| US$ |
| 3,52% |
| 3,52% |
|
Foreign |
| Chinango |
| Peru |
| Foreign |
| BANCO CONTINENTAL |
| Peru |
| US$ |
| 4,12% |
| 4,12% |
|
Foreign |
| Chinango |
| Peru |
| Foreign |
| BANCO CONTINENTAL |
| Peru |
| Soles |
| 3,80% |
| 3,75% |
|
Foreign |
| Chinango S.A.C. |
| Peru |
| 0-E |
| BANCO DE CREDITO |
| Peru |
| US$ |
| 1,63% |
| 1,63% |
|
Foreign |
| Chinango S.A.C. |
| Peru |
| 0-E |
| BANCO DE CREDITO |
| Peru |
| US$ |
| 1,63% |
| 1,63% |
|
Foreign |
| CIEN (Companhía Interconexao Energética S.A.) |
| Brazil |
| Foreign |
| Banco Santander Central Hispano |
| Brazil |
| Reais |
| 1,70% |
| 1,70% |
|
Foreign |
| Coelce |
| Brazil |
| Foreign |
| Banco do Brasil |
| Brazil |
| US$ |
| 6,67% |
| 4,64% |
|
Foreign |
| Coelce |
| Brazil |
| Foreign |
| Banco Europeo de Investimentos |
| Brazil |
| US$ |
| 6,58% |
| 5,49% |
|
Foreign |
| Coelce |
| Brazil |
| Foreign |
| Eletrobras |
| Brazil |
| Reais |
| 6,58% |
| 6,35% |
|
Foreign |
| Coelce |
| Brazil |
| Foreign |
| Banco do Brasil |
| Brazil |
| Reais |
| 10,75% |
| 10,75% |
|
Foreign |
| Coelce |
| Brazil |
| Foreign |
| Bndes |
| Brazil |
| Reais |
| 9,95% |
| 9,95% |
|
Foreign |
| Coelce |
| Brazil |
| Foreign |
| Banco do Nordeste |
| Brazil |
| Reais |
| 8,50% |
| 7,67% |
|
Foreign |
| Coelce |
| Brazil |
| Foreign |
| Banco ABN Amro |
| Brazil |
| Reais |
| 7,00% |
| 7,00% |
|
Foreign |
| Edegel |
| Peru |
| Foreign |
| BANCO DE CREDITO |
| Peru |
| US$ |
| 5,70% |
| 5,70% |
|
Foreign |
| Edegel |
| Peru |
| Foreign |
| BANCO DE CREDITO |
| Peru |
| US$ |
| L3M+2,5% |
| L3M+2,5% |
|
Foreign |
| Edegel |
| Peru |
| Foreign |
| BANCO CONTINENTAL |
| Peru |
| US$ |
| L3M+3% |
| L3M+3% |
|
Foreign |
| Edegel |
| Peru |
| 0-E |
| BANCO CONTINENTAL |
| Peru |
| US$ |
| L3M+3% |
| L3M+3% |
|
Foreign |
| Edegel |
| Peru |
| Foreign |
| BANCO SCOTIABANK |
| Peru |
| US$ |
| L6M+1,25% |
| L6M+1,25% |
|
Foreign |
| Edegel |
| Peru |
| Foreign |
| BANCO CONTINENTAL |
| Peru |
| Soles |
| 4,28% |
| 4,21% |
|
Foreign |
| Edegel |
| Peru |
| Foreign |
| BANCO CONTINENTAL |
| Peru |
| Soles |
| 4,40% |
| 4,33% |
|
Foreign |
| Edegel |
| Peru |
| Foreign |
| BANCO CONTINENTAL |
| Peru |
| Soles |
| 4,30% |
| 4,23% |
|
Foreign |
| Edelnor |
| Peru |
| Foreign |
| Banco de Crédito |
| Peru |
| Soles |
| 2,60% |
| 2,60% |
|
Foreign |
| Edelnor |
| Peru |
| Foreign |
| Banco de Crédito |
| Peru |
| Soles |
| 4,00% |
| 4,00% |
|
Foreign |
| Edelnor |
| Peru |
| Foreign |
| Banco de Crédito |
| Peru |
| Soles |
| 4,00% |
| 4,00% |
|
Foreign |
| Edelnor |
| Peru |
| Foreign |
| Banco de Crédito |
| Peru |
| Soles |
| 4,00% |
| 4,00% |
|
Foreign |
| Edelnor |
| Peru |
| Foreign |
| Banco de Crédito |
| Peru |
| Soles |
| 4,00% |
| 4,00% |
|
Foreign |
| Edelnor |
| Peru |
| Foreign |
| Banco de Crédito |
| Peru |
| Soles |
| 2,60% |
| 2,60% |
|
Foreign |
| Edelnor |
| Peru |
| Foreign |
| Banco de Crédito |
| Peru |
| Soles |
| 4,00% |
| 4,00% |
|
Foreign |
| Edelnor |
| Peru |
| Foreign |
| Banco de Crédito |
| Peru |
| Soles |
| 4,00% |
| 4,00% |
|
Foreign |
| Edelnor |
| Peru |
| Foreign |
| Banco Continental |
| Peru |
| Soles |
| 4,40% |
| 4,40% |
|
Foreign |
| Edelnor |
| Peru |
| Foreign |
| Scotiabank |
| Peru |
| Soles |
| 4,35% |
| 4,35% |
|
Foreign |
| Edelnor |
| Peru |
| Foreign |
| Scotiabank |
| Peru |
| Soles |
| 4,35% |
| 4,35% |
|
Foreign |
| Edesur S.A. |
| Argentina |
| Foreign |
| BBVA |
| Argentina |
| Ar$ |
| 20,00% |
| 20,00% |
|
Foreign |
| Edesur S.A. |
| Argentina |
| Foreign |
| Banco de la Ciudad de Buenos Aires |
| Argentina |
| Ar$ |
| 14,85% |
| 14,61% |
|
Foreign |
| Edesur S.A. |
| Argentina |
| Foreign |
| Standard Bank |
| Argentina |
| Ar$ |
| 17,43% |
| 16,05% |
|
Foreign |
| Edesur S.A. |
| Argentina |
| Foreign |
| Banco Santander Rio |
| Argentina |
| Ar$ |
| 15,98% |
| 15,84% |
|
Foreign |
| Edesur S.A. |
| Argentina |
| Foreign |
| BBVA |
| Argentina |
| Ar$ |
| 20,00% |
| 20,00% |
|
Foreign |
| Edesur S.A. |
| Argentina |
| Foreign |
| Standard Bank |
| Argentina |
| Ar$ |
| 16,75% |
| 16,05% |
|
Foreign |
| Edesur S.A. |
| Argentina |
| Foreign |
| Banco Santander Rio |
| Argentina |
| Ar$ |
| 15,17% |
| 15,84% |
|
Foreign |
| Edesur S.A. |
| Argentina |
| Foreign |
| Banco de la Ciudad de Buenos Aires |
| Argentina |
| Ar$ |
| 15,19% |
| 14,52% |
|
Foreign |
| Emgesa |
| Colombia |
| Foreign |
| Davivienda |
| Colombia |
| CPs |
| 6,99% |
| 6,99% |
|
Foreign |
| Emgesa |
| Colombia |
| Foreign |
| Bancolombia |
| Colombia |
| CPs |
| 6,99% |
| 6,99% |
|
Foreign |
| Emgesa |
| Colombia |
| Foreign |
| Bancolombia |
| Colombia |
| CPs |
| 6,99% |
| 6,99% |
|
Foreign |
| Emgesa |
| Colombia |
| Foreign |
| BBVA Colombia |
| Colombia |
| CPs |
| 6,99% |
| 6,99% |
|
Foreign |
| Emgesa |
| Colombia |
| Foreign |
| Banco Santander |
| Colombia |
| CPs |
| 6,99% |
| 6,99% |
|
Foreign |
| Endesa Costanera S.A. |
| Argentina |
| Foreign |
| Banco Santander Río |
| Argentina |
| US$ |
| 4,67% |
| 4,67% |
|
Foreign |
| Endesa Costanera S.A. |
| Argentina |
| Foreign |
| Banco Provincia de Buenos Aires |
| Argentina |
| US$ |
| 5,86% |
| 5,86% |
|
Foreign |
| Endesa Costanera S.A. |
| Argentina |
| Foreign |
| Banco Galicia |
| Argentina |
| US$ |
| Libor+3% |
| Libor+3% |
|
Foreign |
| Endesa Costanera S.A. |
| Argentina |
| Foreign |
| Banco Ciudad |
| Argentina |
| US$ |
| 5,70% |
| 5,70% |
|
|
|
|
| December 31,2010 |
| December 31,2009 |
| ||||||||||||||||||||||||
|
|
|
| Current M$ |
| Non- Current M$ |
| Current M$ |
| Non Current M$ |
| ||||||||||||||||||||
Company |
| Type |
| Less than |
| More tan 90 |
| Total |
| 1 to 3 |
| 3 to 5 years |
| Over 5 |
| Total |
| Less than |
| More than |
| Total |
| 1 to 3 |
| 3 to 5 years |
| Over 5 |
| Total |
|
Foreign |
| Semi-annually |
| 4,887 |
| 1,882,368 |
| 1,887,255 |
| 1,882,350 |
| — |
| — |
| 1,882,350 |
| — |
| 780,505 |
| 780,505 |
| 2,319,872 |
| 777,6 |
| — |
| 3,097,472 |
|
Foreign |
| Semi-annually |
| 48,591 |
| 1,500,240 |
| 1,548,831 |
| 1,500,240 |
| — |
| — |
| 1,500,240 |
| — |
| 821,168 |
| 821,168 |
| 2,311,183 |
| 774,687 |
| — |
| 3,085,870 |
|
Foreign |
| Semi-annually |
| 2,321,766 |
| 1,410,000 |
| 3,731,766 |
| 14,100,000 |
| — |
| — |
| 14,100,000 |
| — |
| 3,822,187 |
| 3,822,187 |
| 13,032,988 |
| 4,368,539 |
| — |
| 17,401,527 |
|
Foreign |
| Semi-annually |
| 7,117,655 |
| 7,145,880 |
| 14,263,535 |
| 18,425,880 |
| — |
| — |
| 18,425,880 |
| — |
| 2,419,186 |
| 2,419,186 |
| 24,041,519 |
| 8,058,497 |
| — |
| 32,100,016 |
|
Foreign |
| At Maturity |
| 286,544 |
| — |
| 286,544 |
| 28,200,000 |
| — |
| — |
| 28,200,000 |
| — |
| 235,626 |
| 235,626 |
| — |
| 29,002,545 |
| — |
| 29,002,545 |
|
Foreign |
| Semi-annually |
| 369,719 |
| 21,150,000 |
| 21,519,719 |
| 21,150,000 |
| — |
| — |
| 21,150,000 |
| — |
| 270,019 |
| 270,019 |
| 32,582,471 |
| 10,921,346 |
| — |
| 43,503,817 |
|
Foreign |
| Semi-annually |
| — |
| 2,034,087 |
| 2,034,087 |
| 4,532,161 |
| 5,229,685 |
| 6,034,564 |
| 15,796,410 |
| 2,134,813 |
| — |
| 2,134,813 |
| 4,238,891 |
| 5,254,214 |
| 10,230,260 |
| 19,723,365 |
|
Foreign |
| Semi-annually |
| — |
| 3,219,291 |
| 3,219,291 |
| 7,145,677 |
| 8,204,039 |
| — |
| 15,349,716 |
| 3,270,587 |
| — |
| 3,270,587 |
| 6,717,015 |
| 8,263,288 |
| 4,579,861 |
| 19,560,164 |
|
Foreign |
| Semi-annually |
| — |
| — |
| — |
| — |
| — |
| 3,289,176 |
| 3,289,176 |
| 18,869 |
| — |
| 18,869 |
| — |
| — |
| 3,549,700 |
| 3,549,700 |
|
Foreign |
| At Maturity |
| 27,549 |
| — |
| 27,549 |
| 4,901,950 |
| — |
| — |
| 4,901,950 |
| 19,996 |
| — |
| 19,996 |
| 5,156,948 |
| — |
| — |
| 5,156,948 |
|
Foreign |
| At Maturity |
| — |
| — |
| — |
| — |
| — |
| — |
| — |
| 1,028,759 |
| — |
| 1,028,759 |
| — |
| — |
| — |
| — |
|
Foreign |
| At Maturity |
| — |
| — |
| — |
| — |
| — |
| — |
| — |
| 15,962 |
| 1,014,199 |
| 1,030,161 |
| — |
| — |
| — |
| — |
|
Foreign |
| At Maturity |
| — |
| — |
| — |
| — |
| — |
| — |
| — |
| 27,89 |
| 1,521,300 |
| 1,549,190 |
| — |
| — |
| — |
| — |
|
Foreign |
| At Maturity |
| 1,936 |
| — |
| 1,936 |
| 1,333,864 |
| — |
| — |
| 1,333,864 |
| 1,228 |
| — |
| 1,228 |
| 1,403,251 |
| — |
| — |
| 1,403,251 |
|
Foreign |
| At Maturity |
| — |
| 3,524,902 |
| 3,524,902 |
| — |
| — |
| — |
| — |
| — |
| — |
| — |
| — |
| — |
| — |
| — |
|
Foreign |
| At Maturity |
| — |
| 6,579,812 |
| 6,579,812 |
| — |
| — |
| — |
| — |
| — |
| — |
| — |
| — |
| — |
| — |
| — |
|
Foreign |
| Semi-annually |
| — |
| 56,558,766 |
| 56,558,766 |
| 56,400,000 |
| — |
| — |
| 56,400,000 |
| — |
| 58,453,666 |
| 58,453,666 |
| 116,494,360 |
| — |
| — |
| 116,494,360 |
|
Foreign |
| Semi-annually |
| 28,592 |
| 125,856 |
| 154,448 |
| 167,212 |
| 32,658 |
| 1,304,607 |
| 1,504,477 |
| — |
| 170,373 |
| 170,373 |
| — |
| 1,773,044 |
| — |
| 1,773,044 |
|
Foreign |
| Semi-annually |
| 233,456 |
| 3,915,570 |
| 4,149,026 |
| 3,915,570 |
| — |
| — |
| 3,915,570 |
| — |
| 4,254,934 |
| 4,254,934 |
| 18,929,356 |
| 2,333,260 |
| — |
| 21,262,616 |
|
Foreign |
| Semi-annually |
| 1,106,146 |
| 3,547,766 |
| 4,653,912 |
| 7,202,141 |
| 4,305,798 |
| 9,066,992 |
| 20,574,931 |
| — |
| 6,964,706 |
| 6,964,706 |
| — |
| 21,634,459 |
| — |
| 21,634,459 |
|
Foreign |
| Semi-annually |
| 967,059 |
| 2,757,153 |
| 3,724,212 |
| 8,054,776 |
| 976,09 |
| — |
| 9,030,866 |
| — |
| 3,499,199 |
| 3,499,199 |
| — |
| 11,672,734 |
| — |
| 11,672,734 |
|
Foreign |
| Semi-annually |
| 6,439,374 |
| 15,673,356 |
| 22,112,730 |
| 35,333,122 |
| 13,847,857 |
| — |
| 49,180,979 |
| — |
| 9,165,296 |
| 9,165,296 |
| — |
| 37,630,530 |
| — |
| 37,630,530 |
|
Foreign |
| Semi-annually |
| 1,982,611 |
| 5,722,717 |
| 7,705,328 |
| 17,821,201 |
| 12,798,992 |
| — |
| 30,620,193 |
| — |
| 11,815,731 |
| 11,815,731 |
| — |
| 37,047,536 |
| — |
| 37,047,536 |
|
Foreign |
| Semi-annually |
| — |
| — |
| — |
| — |
| — |
| — |
| — |
| — |
| 7,294,354 |
| 7,294,354 |
| — |
| 19,228,350 |
| — |
| 19,228,350 |
|
Foreign |
| At Maturity |
| 583,558 |
| 1,686,071 |
| 2,269,629 |
| 8,430,354 |
| — |
| — |
| 8,430,354 |
| 1,920,085 |
| 3,152,668 |
| 5,072,753 |
| — |
| — |
| — |
| — |
|
Foreign |
| Quartely |
| — |
| — |
| — |
| — |
| — |
| — |
| — |
| 3,681,430 |
| — |
| 3,681,430 |
| — |
| 11,561,913 |
| — |
| 11,561,913 |
|
Foreign |
| Quartely |
| — |
| — |
| — |
| — |
| 6,908,207 |
| 21,661,326 |
| 28,569,533 |
| — |
| — |
| — |
| — |
| — |
| — |
| — |
|
Foreign |
| Quartely |
| 415,488 |
| 1,246,464 |
| 1,661,952 |
| 1,577,727 |
| — |
| — |
| 1,577,727 |
| 1,619,527 |
| — |
| 1,619,527 |
| 7,820,494 |
| — |
| — |
| 7,820,494 |
|
Foreign |
| Semi-annually |
| — |
| 3,373,158 |
| 3,373,158 |
| 1,686,071 |
| — |
| — |
| 1,686,071 |
| — |
| 3,652,838 |
| 3,652,838 |
| 5,476,714 |
| — |
| — |
| 5,476,714 |
|
Foreign |
| At Maturity |
| — |
| — |
| — |
| — |
| — |
| — |
| — |
| 13,155 |
| — |
| 13,155 |
| 2,631,096 |
| — |
| — |
| 2,631,096 |
|
Foreign |
| At Maturity |
| — |
| — |
| — |
| — |
| — |
| — |
| — |
| 25,609 |
| — |
| 25,609 |
| 5,262,192 |
| — |
| — |
| 5,262,192 |
|
Foreign |
| At Maturity |
| — |
| — |
| — |
| — |
| — |
| — |
| — |
| 27,189 |
| — |
| 27,189 |
| 5,086,786 |
| — |
| — |
| 5,086,786 |
|
Foreign |
| At Maturity |
| 101,81 |
| — |
| 101,81 |
| 3,501,393 |
| — |
| — |
| 3,501,393 |
| 5,252,955 |
| — |
| 5,252,955 |
| — |
| — |
| — |
| — |
|
Foreign |
| Semi-annually |
| 10,102 |
| — |
| 10,102 |
| 2,500,995 |
| — |
| — |
| 2,500,995 |
| 8,901 |
| — |
| 8,901 |
| 2,631,096 |
| — |
| — |
| 2,631,096 |
|
Foreign |
| Semi-annually |
| 10,102 |
| — |
| 10,102 |
| 2,500,995 |
| — |
| — |
| 2,500,995 |
| 8,901 |
| — |
| 8,901 |
| 2,631,096 |
| — |
| — |
| 2,631,096 |
|
Foreign |
| Semi-annually |
| 4,255 |
| — |
| 4,255 |
| 2,167,529 |
| — |
| — |
| 2,167,529 |
| 3,481 |
| — |
| 3,481 |
| 2,280,283 |
| — |
| — |
| 2,280,283 |
|
Foreign |
| Semi-annually |
| 4,041 |
| — |
| 4,041 |
| 1,000,398 |
| — |
| — |
| 1,000,398 |
| 3,56 |
| — |
| 3,56 |
| 1,052,438 |
| — |
| — |
| 1,052,438 |
|
Foreign |
| Semi-annually |
| 16,837 |
| — |
| 16,837 |
| 4,168,325 |
| — |
| — |
| 4,168,325 |
| 10,613 |
| — |
| 10,613 |
| — |
| — |
| — |
| — |
|
Foreign |
| Semi-annually |
| 10,102 |
| — |
| 10,102 |
| 2,500,995 |
| — |
| — |
| 2,500,995 |
| 14,835 |
| — |
| 14,835 |
| 4,385,160 |
| — |
| — |
| 4,385,160 |
|
Foreign |
| Semi-annually |
| 1,544,238 |
| — |
| 1,544,238 |
| — |
| — |
| — |
| — |
| 8,901 |
| — |
| 8,901 |
| 2,631,096 |
| — |
| — |
| 2,631,096 |
|
Foreign |
| Semi-annually |
| 108,566 |
| — |
| 108,566 |
| 6,669,320 |
| — |
| — |
| 6,669,320 |
| 109,098 |
| — |
| 109,098 |
| 7,016,257 |
| — |
| — |
| 7,016,257 |
|
Foreign |
| At Maturity |
| — |
| — |
| — |
| — |
| — |
| — |
| — |
| 1,603,498 |
| — |
| 1,603,498 |
| — |
| — |
| — |
| — |
|
Foreign |
| At Maturity |
| — |
| — |
| — |
| — |
| — |
| — |
| — |
| 1,603,498 |
| — |
| 1,603,498 |
| — |
| — |
| — |
| — |
|
Foreign |
| Semi-annually |
| — |
| 1,177,774 |
| 1,177,774 |
| — |
| — |
| — |
| — |
| — |
| 1,334,474 |
| 1,334,474 |
| — |
| — |
| — |
| — |
|
Foreign |
| At Maturity |
| — |
| — |
| — |
| 1,413,329 |
| — |
| — |
| 1,413,329 |
| — |
| — |
| — |
| 1,601,369 |
| — |
| — |
| 1,601,369 |
|
Foreign |
| Quartely |
| — |
| — |
| — |
| 1,413,328 |
| 353,332 |
| — |
| 1,766,660 |
| — |
| — |
| — |
| 2,001,711 |
| — |
| — |
| 2,001,711 |
|
Foreign |
| Quartely |
| — |
| — |
| — |
| 1,943,328 |
| — |
| — |
| 1,943,328 |
| — |
| — |
| — |
| 3,336,185 |
| — |
| — |
| 3,336,185 |
|
Foreign |
| Semi-annually |
| — |
| 1,177,774 |
| 1,177,774 |
| 2,355,548 |
| — |
| — |
| 2,355,548 |
| — |
| — |
| — |
| 5,337,896 |
| — |
| — |
| 5,337,896 |
|
Foreign |
| Quartely |
| — |
| — |
| — |
| 1,413,328 |
| — |
| — |
| 1,413,328 |
| — |
| — |
| — |
| 2,001,711 |
| — |
| — |
| 2,001,711 |
|
Foreign |
| Semi-annually |
| — |
| 1,001,108 |
| 1,001,108 |
| 2,355,548 |
| 353,332 |
| — |
| 2,708,880 |
| — |
| — |
| — |
| 2,668,948 |
| — |
| — |
| 2,668,948 |
|
Foreign |
| At Maturity |
| — |
| — |
| — |
| 918,665 |
| — |
| — |
| 918,665 |
| — |
| — |
| — |
| 1,040,890 |
| — |
| — |
| 1,040,890 |
|
Foreign |
| Annual |
| — |
| 521,504 |
| 521,504 |
| — |
| 7,675,010 |
| — |
| 7,675,010 |
| — |
| 992,23 |
| 992,23 |
| — |
| 7,826,033 |
| — |
| 7,826,033 |
|
Foreign |
| Annual |
| — |
| 373,568 |
| 373,568 |
| — |
| 5,497,818 |
| — |
| 5,497,818 |
| — |
| 710,761 |
| 710,761 |
| — |
| 5,606,000 |
| — |
| 5,606,000 |
|
Foreign |
| Annual |
| — |
| 1,230,198 |
| 1,230,198 |
| — |
| 18,104,904 |
| — |
| 18,104,904 |
| — |
| 2,340,613 |
| 2,340,613 |
| — |
| 18,461,158 |
| — |
| 18,461,158 |
|
Foreign |
| Annual |
| — |
| 1,363,850 |
| 1,363,852 |
| — |
| 20,071,871 |
| — |
| 20,071,871 |
| — |
| 2,594,904 |
| 2,594,904 |
| — |
| 20,466,830 |
| — |
| 20,466,830 |
|
Foreign |
| Semi-annually |
| — |
| 1,552,762 |
| 1,552,764 |
| — |
| 22,852,099 |
| — |
| 22,852,099 |
| — |
| 2,954,334 |
| 2,954,334 |
| — |
| 23,301,764 |
| — |
| 23,301,764 |
|
Foreign |
| At Maturity |
| — |
| — |
| — |
| — |
| — |
| — |
| — |
| 706,604 |
| — |
| 706,604 |
| — |
| — |
| — |
| — |
|
Foreign |
| At Maturity |
| 602,549 |
| — |
| 602,549 |
| — |
| — |
| — |
| — |
| 685,119 |
| — |
| 685,119 |
| — |
| — |
| — |
| — |
|
Foreign |
| At Maturity |
| 713,26 |
| — |
| 713,26 |
| — |
| — |
| — |
| — |
| 385,93 |
| — |
| 385,93 |
| — |
| — |
| — |
| — |
|
Foreign |
| At Maturity |
| — |
| — |
| — |
| — |
| — |
| — |
| — |
| 1,034,484 |
| — |
| 1,034,484 |
| — |
| — |
| — |
| — |
|
Identification of Bank Borrowings by Companies (continuation)
Company ID |
| Company |
| Country |
| ID Number |
| Financial Institution |
| Country |
| Currency |
| Effective |
| Nominal |
|
Foreign |
| Endesa Costanera S.A. |
| Argentina |
| Foreign |
| Credit Suisse International |
| Argentina |
| US$ |
| Libor+12% |
| Libor+12% |
|
Foreign |
| Endesa Costanera S.A. |
| Argentina |
| Foreign |
| Citibank |
| Argentina |
| US$ |
| Libor+4,8% |
| Libor+4,8% |
|
Foreign |
| Endesa Costanera S.A. |
| Argentina |
| Foreign |
| Banco Nación Argentina |
| Argentina |
| Ar$ |
| BAIBOR+5% |
| BAIBOR+5% |
|
Foreign |
| Endesa Costanera S.A. |
| Argentina |
| Foreign |
| Mediocredito Italiano |
| Argentina |
| Ar$ |
| 1,75% |
| 1,75% |
|
Foreign |
| Endesa Costanera S.A. |
| Argentina |
| Foreign |
| Banco Santander Río |
| Argentina |
| Ar$ |
| 16,07% |
| 16,07% |
|
Foreign |
| Endesa Costanera S.A. |
| Argentina |
| Foreign |
| Banco Comafi |
| Argentina |
| Ar$ |
| 15,00% |
| 15,00% |
|
Foreign |
| Endesa Costanera S.A. |
| Argentina |
| Foreign |
| Banco Itau |
| Argentina |
| Ar$ |
| BAIBOR+5% |
| BAIBOR+5% |
|
Foreign |
| Endesa Costanera S.A. |
| Argentina |
| Foreign |
| Citibank |
| Argentina |
| Ar$ |
| 13,80% |
| 13,80% |
|
Foreign |
| Endesa Costanera S.A. |
| Argentina |
| Foreign |
| Banco Galicia |
| Argentina |
| Ar$ |
| 15,50% |
| 15,50% |
|
Foreign |
| Endesa Costanera S.A. |
| Argentina |
| Foreign |
| Citibank |
| Argentina |
| US$ |
| 5,32% |
| 5,32% |
|
Foreign |
| Endesa Costanera S.A. |
| Argentina |
| Foreign |
| Banco Galicia |
| Argentina |
| US$ |
| 6,39% |
| 6,39% |
|
Foreign |
| Endesa Costanera S.A. |
| Argentina |
| Foreign |
| Banco Supervielle |
| Argentina |
| Ar$ |
| 13,80% |
| 13,80% |
|
Foreign |
| Endesa Costanera S,A, |
| Argentina |
| Foreign |
| Banco Macro |
| Argentina |
| Ar$ |
| 16,00% |
| 16,00% |
|
Foreign |
| Endesa Costanera S.A. |
| Argentina |
| Foreign |
| Banco Ciudad |
| Argentina |
| Ar$ |
| 15,80% |
| 15,80% |
|
Foreign |
| Endesa Costanera S.A. |
| Argentina |
| Foreign |
| Banco Standard |
| Argentina |
| Ar$ |
| 17,14% |
| 17,14% |
|
91,081,000-6 |
| Endesa S.A. (Chile) |
| Chile |
| Foreign |
| B,N,P, Paribas |
| U.S. |
| US$ |
| 6,32% |
| 5,98% |
|
91,081,000-6 |
| Endesa S.A. (Chile) |
| Chile |
| Foreign |
| Export Development Corpotation Loan |
| U.S. |
| US$ |
| Libor+1,0 |
| Libor+1,0 |
|
91,081,000-6 |
| Endesa S.A. (Chile) |
| Chile |
| Foreign |
| Banco Bilbao Vizcaya Argentaria S.A. |
| U.S. |
| US$ |
| Libor+0,750 |
| Libor+0,750 |
|
91,081,000-6 |
| Endesa S.A. (Chile) |
| Chile |
| Foreign |
| The Bank of Tokyo-Mitsubishi. Ltd. |
| U.S. |
| US$ |
| Libor+0,300 |
| Libor+0,300 |
|
91,081,000-6 |
| Endesa S.A. (Chile) |
| Chile |
| Foreign |
| Caja Madrid, Caja Madrid Miami Agency |
| U.S. |
| US$ |
| Libor+0,300 |
| Libor+0,300 |
|
91,081,000-6 |
| Endesa S.A. (Chile) |
| Chile |
| Foreign |
| Banco Santander Central Hispano S,A, N.Y.B. |
| U.S. |
| US$ |
| Libor+0,300 |
| Libor+0,300 |
|
91,081,000-6 |
| Endesa S.A. (Chile) |
| Chile |
| Foreign |
| Citibank NA. Nassau, Bahamas Branch |
| U.S. |
| US$ |
| Libor+0,301Q |
| Libor+0,301 |
|
91,081,000-6 |
| Endesa S.A. (Chile) |
| Chile |
| Foreign |
| Ing Bank N.V. |
| U.S. |
| US$ |
| Libor+0,750 |
| Libor+0,750 |
|
91,081,000-6 |
| Endesa S.A. (Chile) |
| Chile |
| Foreign |
| San Paolo IMI S.p.A |
| U.S. |
| US$ |
| Libor+0,750 |
| Libor+0,750 |
|
91,081,000-6 |
| Endesa S.A. (Chile) |
| Chile |
| Foreign |
| HSBC Bank pic Spanish Branch |
| U.S. |
| US$ |
| Libor+0,750 |
| Libor+0,750 |
|
91,081,000-6 |
| Endesa S.A. (Chile) |
| Chile |
| Foreign |
| ABN AMRO Bank |
| U.S. |
| US$ |
| Libor+0,750 |
| Libor+0,750 |
|
91,081,000-6 |
| Endesa S.A. (Chile) |
| Chile |
| Foreign |
| Instituto de Credito Oficial |
| U.S. |
| US$ |
| Libor+0,300 |
| Libor+0,300 |
|
91,081,000-6 |
| Endesa S.A. (Chile) |
| Chile |
| Foreign |
| Deutsche Bank AG New York Branch |
| U.S. |
| US$ |
| Libor+0,750 |
| Libor+0,750 |
|
91,081,000-6 |
| Endesa S.A. (Chile) |
| Chile |
| Foreign |
| The Royal Bank of Scotland PLC |
| U.S. |
| US$ |
| Libor+0,300 |
| Libor+0,300 |
|
91,081,000-6 |
| Endesa S.A. (Chile) |
| Chile |
| Foreign |
| Export Development Corpotation Loan |
| U.S. |
| US$ |
| Libor+0,300 |
| Libor+0,300 |
|
91,081,000-6 |
| Endesa S.A. (Chile) |
| Chile |
| Foreign |
| B.N.P. Paribas Panama Branch |
| U.S. |
| US$ |
| Libor+0,300 |
| Libor+0,300 |
|
91,081,000-6 |
| Endesa S.A. (Chile) |
| Chile |
| Foreign |
| Banco Español de crédito S.A. N.Y.B. |
| U.S. |
| US$ |
| Libor+0,300 |
| Libor+0,300 |
|
91,081,000-6 |
| Endesa S.A. (Chile) |
| Chile |
| 97,030,000-7 |
| Banco Estado |
| U.S. |
| US$ |
| Libor+0,300 |
| Libor+0,300 |
|
91,081,000-6 |
| Endesa S.A. (Chile) |
| Chile |
| Foreign |
| The Bank of Nova Scotia |
| U.S. |
| US$ |
| Libor+0,750 |
| Libor+0,750 |
|
Foreign |
| Hidroeléctrica El Chocón |
| Argentina |
| Foreign |
| Deutsche Bank |
| Argentina |
| US$ |
| Libor+3,5% |
| Libor+3,5% |
|
Foreign |
| Hidroeléctrica El Chocón |
| Argentina |
| Foreign |
| Standard Bank |
| Argentina |
| US$ |
| Libor+3,5% |
| Libor+3,5% |
|
Foreign |
| Hidroeléctrica El Chocón |
| Argentina |
| Foreign |
| ITAU - Sindicado |
| Argentina |
| Ar$ |
| BPC + 5,75% |
| BPC + 5,75% |
|
Foreign |
| Hidroeléctrica El Chocón |
| Argentina |
| Foreign |
| STANDARD - Sindicado |
| Argentina |
| Ar$ |
| BPC + 5,75% |
| BPC + 5,75% |
|
Foreign |
| Hidroeléctrica El Chocón |
| Argentina |
| Foreign |
| SANTANDER - Sindicado |
| Argentina |
| Ar$ |
| BPC + 5,75% |
| BPC + 5,75% |
|
Foreign |
| Hidroeléctrica El Chocón |
| Argentina |
| Foreign |
| HIPOTECARIO - Sindicado |
| Argentina |
| Ar$ |
| BPC + 5,75% |
| BPC + 5,75% |
|
Foreign |
| Hidroeléctrica El Chocón |
| Argentina |
| Foreign |
| GALICIA - Sindicado |
| Argentina |
| Ar$ |
| BPC + 5,75% |
| BPC + 5,75% |
|
Foreign |
| Hidroeléctrica El Chocón |
| Argentina |
| Foreign |
| ITAU - Sindicado |
| Argentina |
| Ar$ |
| BPC + 5,75% |
| BPC + 5,75% |
|
Foreign |
| Hidroeléctrica El Chocón |
| Argentina |
| Foreign |
| SANTANDER - Sindicado |
| Argentina |
| Ar$ |
| BPC + 5,75% |
| BPC + 5,75% |
|
Foreign |
| Hidroeléctrica El Chocón |
| Argentina |
| Foreign |
| Ciudad |
| Argentina |
| Ar$ |
| 15,84% |
| 15,84% |
|
Foreign |
| Hidroeléctrica El Chocón |
| Argentina |
| Foreign |
| CITIBANK |
| Argentina |
| Ar$ |
| 15,22% |
| 15,22% |
|
Foreign |
| Hidroeléctrica El Chocón |
| Argentina |
| Foreign |
| FRANCES |
| Argentina |
| Ar$ |
| 14,93% |
| 14,93% |
|
Foreign |
| Hidroeléctrica El Chocón |
| Argentina |
| Foreign |
| INDUSTRIAL |
| Argentina |
| Ar$ |
| 17,20% |
| 17,20% |
|
Foreign |
| Hidroeléctrica El Chocón |
| Argentina |
| Foreign |
| MACRO |
| Argentina |
| Ar$ |
| 17,75% |
| 17,75% |
|
Foreign |
| Hidroeléctrica El Chocón |
| Argentina |
| Foreign |
| ITAU - Nuevo Sindicado |
| Argentina |
| Ar$ |
| 19,12% |
| 19,12% |
|
Foreign |
| Hidroeléctrica El Chocón |
| Argentina |
| Foreign |
| STANDARD - Nuevo Sindicado |
| Argentina |
| Ar$ |
| 19,12% |
| 19,12% |
|
Foreign |
| Hidroeléctrica El Chocón |
| Argentina |
| Foreign |
| SANTANDER - Nuevo Sindicado |
| Argentina |
| Ar$ |
| 19,12% |
| 19,12% |
|
Foreign |
| Hidroeléctrica El Chocón |
| Argentina |
| Foreign |
| HIPOTECARIO - Nuevo Sindicado |
| Argentina |
| Ar$ |
| 19,12% |
| 19,12% |
|
Foreign |
| Hidroeléctrica El Chocón |
| Argentina |
| Foreign |
| GALICIA - Nuevo Sindicado |
| Argentina |
| Ar$ |
| 19,12% |
| 19,12% |
|
96,830,980-3 |
| Inversiones Gas Atacama Holding Ltda, |
| Chile |
| Foreign |
| PNC BANK |
| U.S. |
| US$ |
| 3,09% |
| 3,09% |
|
96,830,980-3 |
| Inversiones Gas Atacama Holding Ltda, |
| Chile |
| 96,963,440-6 |
| SC GROUP |
| Chile |
| US$ |
| 7,50% |
| 7,50% |
|
96,589,170-6 |
| Pangue |
| Chile |
| Foreign |
| Export Development Corporation |
| Canadá |
| US$ |
| 1,63% |
| 1,63% |
|
Foreign |
| Synapsis Brazil Ltda, |
| Brazil |
| Foreign |
| BNB |
| Brazil |
| Reais |
| 11,30% |
| 11,30% |
|
Foreign |
| Synapsis Colombia Ltda, |
| Colombia |
| Foreign |
| Banco de Bogotá |
| Colombia |
| CPs |
| 11,50% |
| 11,50% |
|
|
|
|
| December 31,2010 |
| December 31,2009 |
| ||||||||||||||||||||||||
|
|
|
| Current M$ |
| Non- Current M$ |
| Current M$ |
| Non Current M$ |
| ||||||||||||||||||||
Company ID |
| Type |
| Less than |
| More tan 90 |
| Current, |
| 1 to 3 |
| 3 to 5 years |
| Over 5 |
| Non- |
| Less than |
| More than |
| Current, |
| 1 to 3 yearss |
| 3 to 5 years |
| Over 5 |
| Non- |
|
Foreign |
| At Maturity |
| 6,596 |
| — |
| 6,596 |
| 4,013,854 |
| — |
| — |
| 4,013,854 |
| 2,176,661 |
| — |
| 2,176,661 |
| 2,173,458 |
| — |
| — |
| 2,173,458 |
|
Foreign |
| At Maturity |
| 614,327 |
| — |
| 614,327 |
| — |
| — |
| — |
| — |
| — |
| 407,548 |
| 407,548 |
| — |
| — |
| — |
| — |
|
Foreign |
| At Maturity |
| — |
| 1,815,068 |
| 1,815,068 |
| 2,077,593 |
| — |
| — |
| 2,077,593 |
| 686,987 |
| 2,668,948 |
| 3,355,935 |
| — |
| — |
| — |
| — |
|
Foreign |
| At Maturity |
| — |
| 963,655 |
| 963,655 |
| — |
| — |
| — |
| — |
| — |
| 1,951,134 |
| 1,951,134 |
| 972,164 |
| — |
| — |
| 972,164 |
|
Foreign |
| At Maturity |
| 882,153 |
| — |
| 882,153 |
| — |
| — |
| — |
| — |
| 306,929 |
| — |
| 306,929 |
| — |
| — |
| — |
| — |
|
Foreign |
| At Maturity |
| — |
| — |
| — |
| — |
| — |
| — |
| — |
| 404,479 |
| — |
| 404,479 |
| — |
| — |
| — |
| — |
|
Foreign |
| At Maturity |
| 2,679,318 |
| — |
| 2,679,318 |
| — |
| — |
| — |
| — |
| 1,730,145 |
| 918,786 |
| 2,648,931 |
| — |
| — |
| — |
| — |
|
Foreign |
| At Maturity |
| — |
| 3,705,866 |
| 3,705,866 |
| — |
| — |
| — |
| — |
| 562,347 |
| — |
| 562,347 |
| — |
| — |
| — |
| — |
|
Foreign |
| At Maturity |
| 1,778,439 |
| — |
| 1,778,439 |
| — |
| — |
| — |
| — |
| 257,554 |
| — |
| 257,554 |
| — |
| — |
| — |
| — |
|
Foreign |
| At Maturity |
| 381,952 |
|
|
| 381,952 |
| — |
| — |
| — |
| — |
| — |
| 1,136,571 |
| 1,136,571 |
| — |
| — |
| — |
| — |
|
Foreign |
| At Maturity |
| — |
| 277,01 |
| 277,01 |
| — |
| — |
| — |
| — |
| 158,669 |
| — |
| 158,669 |
| — |
| — |
| — |
| — |
|
Foreign |
| At Maturity |
| 1,779,852 |
| — |
| 1,779,852 |
| — |
| — |
| — |
| — |
| — |
| — |
| — |
| — |
| — |
| — |
| — |
|
Foreign |
| At Maturity |
| 357,808 |
| — |
| 357,808 |
| — |
| — |
|
|
| — |
|
|
|
|
| — |
| — |
| — |
| — |
| — |
|
Foreign |
| At Maturity |
| — |
| 954,115 |
| 954,115 |
| — |
| — |
| — |
| — |
| — |
| — |
| — |
| — |
| — |
| — |
| — |
|
Foreign |
| At Maturity |
| 1,159,754 |
| — |
| 1,159,754 |
| — |
| — |
| — |
| — |
| — |
| — |
| — |
| — |
| — |
| — |
| — |
|
91,081,000-6 |
| Semi-annually |
| — |
| 821,662 |
| 821,662 |
| 1,531,395 |
| 1,531,396 |
| — |
| 3,062,791 |
| — |
| 901,716 |
| 901,716 |
| 1,659,304 |
| 1,659,304 |
| 829,651 |
| 4,148,259 |
|
91,081,000-6 |
| Semi-annually |
| 356,896 |
| 335,088 |
| 691,984 |
| 1,340,104 |
| 670,052 |
| — |
| 2,010,156 |
| — |
| 759,503 |
| 759,503 |
| 1,452,034 |
| 1,452,035 |
| — |
| 2,904,069 |
|
91,081,000-6 |
| At Maturity |
| 24,636 |
| — |
| 24,636 |
| — |
| 27,418,295 |
| — |
| 27,418,295 |
| — |
| 15,815,933 |
| 15,815,933 |
| — |
| 30,540,510 |
| — |
| 30,540,510 |
|
91,081,000-6 |
| At Maturity |
| — |
| — |
| — |
| — |
| 15,335,657 |
| — |
| 15,335,657 |
| — |
| 12,675,768 |
| 12,675,768 |
| 17,110,472 |
| 16,594,577 |
|
|
| 33,705,049 |
|
91,081,000-6 |
| At Maturity |
| — |
| — |
| — |
| — |
| 23,235,843 |
| — |
| 23,235,843 |
| — |
| 8,241,742 |
| 8,241,742 |
| — |
| 25,143,298 |
|
|
| 25,143,298 |
|
91,081,000-6 |
| At Maturity |
| — |
| — |
| — |
| — |
| 15,335,656 |
| — |
| 15,335,656 |
| — |
| 10,771,619 |
| 10,771,619 |
| 17,110,472 |
| 16,594,577 |
|
|
| 33,705,049 |
|
91,081,000-6 |
| At Maturity |
| — |
| — |
| — |
| — |
| — |
| — |
| — |
|
|
| 15,840,616 |
| 15,840,616 |
| 17,110,473 |
| — |
|
|
| 17,110,472 |
|
91,081,000-6 |
| At Maturity |
| — |
| — |
| — |
| — |
| — |
| — |
| — |
| — |
| 20,326,059 |
| 20,326,059 |
| — |
| — |
|
|
| — |
|
91,081,000-6 |
| At Maturity |
| — |
| — |
| — |
| — |
| — |
| — |
| — |
| — |
| 12,672,493 |
| 12,672,493 |
| — |
| — |
|
|
| — |
|
91,081,000-6 |
| At Maturity |
| — |
| — |
| — |
| — |
| — |
| — |
| — |
| — |
| 10,560,411 |
| 10,560,411 |
| — |
| — |
|
|
| — |
|
91,081,000-6 |
| At Maturity |
| — |
| — |
| — |
| — |
| — |
| — |
| — |
| — |
| 5,280,206 |
| 5,280,206 |
| — |
| — |
|
|
| — |
|
91,081,000-6 |
| At Maturity |
| — |
| — |
| — |
| — |
| — |
| — |
| — |
| — |
| 5,280,206 |
| 5,280,206 |
| 10,139,549 |
| — |
|
|
| 10,139,539 |
|
91,081,000-6 |
| At Maturity |
| — |
| — |
| — |
| — |
| — |
| — |
| — |
|
|
| 4,224,164 |
| 4,224,164 |
| — |
| — |
|
|
| — |
|
91,081,000-6 |
| At Maturity |
| — |
| — |
| — |
| — |
| — |
| — |
| — |
| — |
| — |
| — |
| 5,069,769 |
| — |
|
|
| 5,069,769 |
|
91,081,000-6 |
| At Maturity |
| — |
| — |
| — |
| — |
| — |
| — |
| — |
| — |
| — |
| — |
| 12,674,424 |
| — |
|
|
| 12,674,424 |
|
91,081,000-6 |
| At Maturity |
| — |
| — |
| — |
| — |
| — |
| — |
| — |
| — |
| — |
| — |
| 10,139,539 |
| — |
|
|
| 10,139,539 |
|
91,081,000-6 |
| At Maturity |
| — |
| — |
| — |
|
|
| 11,617,921 |
|
|
| 11,617,921 |
| — |
| — |
| — |
| 5,069,769 |
| 12,571,649 |
|
|
| 17,641,418 |
|
91,081,000-6 |
| At Maturity |
| — |
| — |
| — |
| — |
| — |
| — |
| — |
| — |
| — |
| — |
| 6,970,933 |
| — |
|
|
| 6,970,933 |
|
91,081,000-6 |
| At Maturity |
| — |
| — |
| — |
| — |
| — |
| — |
| — |
| — |
| 5,068,997 |
| 5,068,997 |
| — |
| — |
|
|
| — |
|
Foreign |
| At Maturity |
| 1,383,337 |
| 8,390,068 |
| 9,773,405 |
| — |
| — |
| — |
| — |
| 1,508,290 |
| 4,437,126 |
| 5,945,416 |
| 10,564,564 |
| — |
|
|
| 10,564,564 |
|
Foreign |
| At Maturity |
| 1,383,337 |
| 8,390,068 |
| 9,773,405 |
| — |
| — |
| — |
| — |
| 1,508,290 |
| 4,437,126 |
| 5,945,416 |
| 10,564,564 |
| — |
|
|
| 10,564,564 |
|
Foreign |
| At Maturity |
| 22,071 |
| 1,095,330 |
| 1,117,401 |
| 1,095,330 |
| — |
| — |
| 1,095,330 |
| — |
| — |
| — |
| — |
| — |
|
|
|
|
|
Foreign |
| At Maturity |
| 22,071 |
| 1,095,330 |
| 1,117,401 |
| 1,095,330 |
| — |
| — |
| 1,095,330 |
| — |
| — |
| — |
| — |
| — |
|
|
|
|
|
Foreign |
| At Maturity |
| 23,732 |
| 1,177,774 |
| 1,201,506 |
| 1,177,774 |
| — |
| — |
| 1,177,774 |
| — |
| — |
| — |
| — |
| — |
|
|
|
|
|
Foreign |
| At Maturity |
| 19,936 |
| 989,33 |
| 1,009,266 |
| 989,33 |
| — |
| — |
| 989,33 |
| — |
| — |
| — |
| — |
| — |
|
|
|
|
|
Foreign |
| At Maturity |
| 9,493 |
| 471,11 |
| 480,603 |
| 471,11 |
| — |
| — |
| 471,11 |
| — |
| — |
| — |
| — |
| — |
|
|
|
|
|
Foreign |
| At Maturity |
| 8,307 |
| 412,221 |
| 420,528 |
| 412,221 |
| — |
| — |
| 412,221 |
| — |
| — |
| — |
| — |
| — |
|
|
|
|
|
Foreign |
| At Maturity |
| 8,307 |
| 412,221 |
| 420,528 |
| 412,221 |
| — |
| — |
| 412,221 |
| — |
| — |
| — |
| — |
| — |
|
|
|
|
|
Foreign |
| At Maturity |
| 10,029 |
| — |
| 10,029 |
| — |
| — |
| — |
| — |
| 14,946 |
| — |
| 14,946 |
| — |
| — |
|
|
|
|
|
Foreign |
| At Maturity |
| 729,446 |
| — |
| 729,446 |
| — |
| — |
| — |
| — |
| — |
| — |
| — |
| — |
| — |
|
|
|
|
|
Foreign |
| At Maturity |
| 596,14 |
| — |
| 596,14 |
| — |
| — |
| — |
| — |
| — |
| — |
| — |
| — |
| — |
|
|
|
|
|
Foreign |
| At Maturity |
| 711,729 |
| — |
| 711,729 |
| — |
| — |
| — |
| — |
| — |
| — |
| — |
|
|
|
|
|
|
|
|
|
Foreign |
| At Maturity |
| 2,391,059 |
| — |
| 2,391,059 |
| — |
| — |
| — |
| — |
| — |
| — |
| — |
| — |
| — |
| — |
| — |
|
Foreign |
| At Maturity |
| 245,369 |
| 2,314 |
| 247,683 |
| 1,226,886 |
| — |
| — |
| 1,226,886 |
| — |
| — |
|
|
| — |
| — |
| — |
| — |
|
Foreign |
| At Maturity |
| 539,813 |
| 5,092 |
| 544,905 |
| 2,699,066 |
| — |
| — |
| 2,699,066 |
| — |
| — |
|
|
| — |
| — |
| — |
| — |
|
Foreign |
| At Maturity |
| 392,591 |
| 3,703 |
| 396,294 |
| 1,962,957 |
| — |
| — |
| 1,962,957 |
| — |
| — |
|
|
| — |
| — |
| — |
| — |
|
Foreign |
| At Maturity |
| 196,296 |
| 1,851 |
| 198,147 |
| 981,478 |
| — |
| — |
| 981,478 |
| — |
| — |
|
|
| — |
| — |
| — |
| — |
|
Foreign |
| At Maturity |
| 196,296 |
| 1,851 |
| 198,147 |
| 981,478 |
| — |
| — |
| 981,478 |
| — |
| — |
|
|
| — |
| — |
| — |
| — |
|
96,830,980-3 |
| Semi-annually |
| — |
| 208,031 |
| 208,031 |
| — |
| — |
| — |
| — |
| — |
| — |
|
|
| 225,406 |
| — |
| — |
| 225,406 |
|
96,830,980-3 |
| Annual |
| — |
| 17,550,375 |
| 17,550,375 |
| — |
| — |
| — |
| — |
|
|
| 34,965,052 |
| 34,965,052 |
| — |
| — |
| — |
| — |
|
96,589,170-6 |
| Semi-annually |
| — |
| — |
| — |
| — |
| — |
| — |
| — |
| 370,984 |
| — |
| 370,984 |
| — |
| — |
| — |
| — |
|
Foreign |
| Annual |
| — |
| — |
| — |
| — |
| — |
| — |
| — |
| 194,837 |
| — |
| 194,837 |
| — |
| — |
| — |
| — |
|
Foreign |
| Semi-annually |
| — |
| — |
| — |
| — |
| — |
| — |
| — |
| 744,192 |
| — |
| 744,192 |
| — |
| — |
| — |
| — |
|
|
| Total |
| 43,971,883 |
| 200,531,127 |
| 244,503,010 |
| 303,051,447 |
| 222,356,512 |
| 41,356,665 |
| 566,764,624 |
| 35,870,786 |
| 309,576,995 |
| 345,447,781 |
| 423,128,155 |
| 390,520,277 |
| 19,189,472 |
| 832,837,904 |
|
Appendix No. 4, letter a), presents additional information on financial debt which includes a projection of future cash flows (undiscounted) that the Group will have to disburse to settle the bank loans detailed above.
18.2 Unsecured liabilities detailed by currency and maturity
· Summary of unsecured obligations by currency and maturity as of December 31, 2010 and 2009
|
|
|
|
|
|
|
| Current |
| Non- Current |
| ||||||||||
|
|
|
|
|
|
|
| Maturity |
| Current |
| Maturity |
| Non-Current |
| ||||||
Country |
| Currency |
| Nominal |
| Secured/ |
| One to three |
| Three to twelve |
| Portion at |
| One to three |
| Three to five |
| Five years or |
| Portion at |
|
|
|
|
|
|
|
|
|
|
|
|
|
|
|
|
|
|
|
|
|
|
|
Chile |
| US$ |
| 8.10 | % | Unsecured |
| 20,226,869 |
| 722,956 |
| 20,949,825 |
| 185,675,099 |
| 263,691,199 |
| 261,884,873 |
| 711,251,171 |
|
Chile |
| UF |
| 5.32 | % | Unsecured |
| 1,091,599 |
| 9,114,072 |
| 10,205,671 |
| 14,544,226 |
| 15,984,434 |
| 396,428,448 |
| 426,957,108 |
|
Peru |
| US$ |
| 6.88 | % | Unsecured |
| 870,099 |
| 3,801,453 |
| 4,671,552 |
|
|
| 7,528,779 |
| 27,242,221 |
| 34,771,000 |
|
Peru |
| Soles |
| 7.35 | % | Unsecured |
| 19,784,574 |
| 49,456 |
| 19,834,030 |
| 57,933,048 |
| 51,988,516 |
| 39,215,602 |
| 149,137,166 |
|
Argentina |
| Ar$ |
| 12.28 | % | Unsecured |
| — |
| 7,736,090 |
| 7,736,090 |
| 3,862,274 |
|
|
| — |
| 3,862,274 |
|
Colombia |
| CPs |
| 7.88 | % | Unsecured |
| 1,586,797 |
| 131,473,631 |
| 133,060,428 |
| 89,822,752 |
| 37,829,581 |
| 414,522,034 |
| 542,174,367 |
|
Brazil |
| Reais |
| 11.29 | % | Unsecured |
| 7,503,875 |
| 77,690,863 |
| 85,194,738 |
| 128,445,480 |
| 42,472,182 |
|
|
| 170,917,662 |
|
|
|
|
|
|
| Total |
| 51,063,813 |
| 230,588,521 |
| 281,652,334 |
| 480,282,879 |
| 419,494,691 |
| 1,139,293,178 |
| 2,039,070,748 |
|
|
|
|
|
|
|
|
| Current |
| Non- Current |
| ||||||||||
|
|
|
|
|
|
|
| Maturity |
| Current |
| Maturity |
| Non-Current |
| ||||||
Country |
| Currency |
| Nominal |
| Secured/ |
| One to three |
| Three to twelve |
| Portion at |
| One to three |
| Three to five |
| Five years or |
| Portion at |
|
|
|
|
|
|
|
|
|
|
|
|
|
|
|
|
|
|
|
|
|
|
|
Chile |
| US$ |
| 7.88 | % | Unsecured |
| 15,916,932 |
| 6,782,703 |
| 22,699,635 |
| — |
| 374,659,229 |
| 396,512,189 |
| 771,171,418 |
|
Chile |
| CH$ |
| 5.01 | % | Unsecured |
| 1,081,503 |
| 8,843,672 |
| 9,925,175 |
| 9,968,809 |
| 10,597,098 |
| 414,087,715 |
| 434,653,622 |
|
Peru |
| US$ |
| 6.97 | % | Unsecured |
| — |
| 789,504 |
| 789,504 |
| 4,056,799 |
| 10,795,915 |
| 28,443,379 |
| 43,296,093 |
|
Peru |
| Soles |
| 7.23 | % | Unsecured |
| 7,806,462 |
| 314,504 |
| 8,120,966 |
| 40,135,949 |
| 72,592,833 |
| 43,870,894 |
| 156,599,676 |
|
Argentina |
| Ar$ |
| 11.75 | % | Unsecured |
| — |
| 8,807,528 |
| 8,807,528 |
| 13,211,293 |
| — |
| — |
| 13,211,293 |
|
Colombia |
| CPs |
| 9.94 | % | Unsecured |
| 1,446,813 |
| 130,251,384 |
| 131,698,197 |
| 57,977,534 |
| 101,954,329 |
| 447,119,273 |
| 607,051,136 |
|
Brazil |
| Reais |
| 12.94 | % | Unsecured |
| — |
| 48,851,910 |
| 48,851,910 |
| 154,419,099 |
| 97,045,044 |
| — |
| 251,464,143 |
|
|
|
|
|
|
| Total |
| 26,251,710 |
| 204,641,205 |
| 230,892,915 |
| 279,769,483 |
| 667,644,448 |
| 1,330,033,450 |
| 2,277,447,381 |
|
18.3 Secured liabilities breakdown by currency and maturity
· Summary of secured obligations by currency and maturity as of December 31, 2010 and 2009
|
|
|
|
|
|
|
| Current |
| Non-Current |
| ||||||||||
|
|
|
|
|
|
|
| Maturity |
|
|
| Maturity |
| Non-Current |
| ||||||
Country |
| Currency |
| Nominal |
| Secured/ |
| One to three |
| Three to twelve |
| Current Total |
| One to three |
| Three to five |
| Five years or |
| Total at |
|
|
|
|
|
|
|
|
|
|
|
|
|
|
|
|
|
|
|
|
|
|
|
Peru |
| US$ |
| 6.15 | % | Secured |
| — |
| 66,252 |
| 66,252 |
| 9,367,060 |
| — |
| — |
| 9,367,060 |
|
Peru |
| Soles |
| 6.26 | % | Secured |
| 4,373,389 |
| 5,082,647 |
| 9,456,036 |
| 4,168,325 |
| 4,168,325 |
| — |
| 8,336,650 |
|
|
|
|
|
|
| Total |
| 4,373,389 |
| 5,148,899 |
| 9,522,288 |
| 13,535,385 |
| 4,168,325 |
| — |
| 17,703,710 |
|
|
|
|
|
|
|
|
| Current |
| Non-Current |
| ||||||||||
|
|
|
|
|
|
|
| Maturity |
|
|
| Maturity |
| Non-Current |
| ||||||
Country |
| Currency |
| Nominal |
| Secured/ |
| One to three |
| Three to twelve |
| Current Total |
| One to three |
| Three to five |
| Five years or |
| Total at |
|
|
|
|
|
|
|
|
|
|
|
|
|
|
|
|
|
|
|
|
|
|
|
Peru |
| US$ |
| 6.06 | % | Secured |
| — |
| 72,618 |
| 72,618 |
| 10,141,998 |
| — |
| — |
| 10,141,998 |
|
Peru |
| Soles |
| 6.28 | % | Secured |
| — |
| 10,950,797 |
| 10,950,797 |
| 9,647,352 |
| 8,770,320 |
| — |
| 18,417,672 |
|
|
|
|
|
|
| Total |
| — |
| 11,023,415 |
| 11,023,415 |
| 19,789,350 |
| 8,770,320 |
| — |
| 28,559,670 |
|
The fair value of current and non-current secured and unsecured obligations totaled ThCh$ 2,753,493,822 and ThCh$ 2,957,767,022 as of December 31, 2010 and 2009, respectively.
· Secured and unsecured obligations by Company
Company ID |
| Company |
| Country |
| Finncial |
| Financial Institution |
| Country |
| Currency |
| Interest effective |
| Nominal interest |
| Secured |
|
Foreign |
| Chinango |
| Peru |
| Foreign |
| BANCO CONTINENTAL |
| Peru |
| Soles |
| 6.72% |
| 6.72% |
| SI |
|
Foreign |
| Chinango |
| Peru |
| Foreign |
| BANCO CONTINENTAL |
| Peru |
| Soles |
| 6.47% |
| 6.47% |
| SI |
|
Foreign |
| Chinango |
| Peru |
| Foreign |
| BANCO CONTINENTAL |
| Peru |
| Soles |
| 6.09% |
| 6.09% |
| SI |
|
Foreign |
| Chinango |
| Peru |
| Foreign |
| BANCO CONTINENTAL |
| Peru |
| Soles |
| 6.16% |
| 6.16% |
| SI |
|
Foreign |
| Chinango |
| Peru |
| Foreign |
| BANCO CONTINENTAL |
| Peru |
| Soles |
| 6.16% |
| 6.16% |
| SI |
|
Foreign |
| Chinango |
| Peru |
| Foreign |
| BANCO CONTINENTAL |
| Peru |
| Soles |
| 5.91% |
| 5.91% |
| SI |
|
Foreign |
| Chinango |
| Peru |
| Foreign |
| BANCO CONTINENTAL |
| Peru |
| US$ |
| 6.57% |
| 6.06% |
| SI |
|
|
|
|
|
|
|
|
|
|
| Total |
|
|
|
|
|
|
|
|
|
|
|
|
|
|
|
|
|
|
|
|
|
|
|
|
|
|
|
|
|
Foreign |
| Ampla |
| Brazil |
| Foreign |
| BONOS |
| Brazil |
| Reais |
| CDI+0.85%aa |
| CDI+0.85%aa |
| No |
|
Foreign |
| Ampla |
| Brazil |
| Foreign |
| BONOS |
| Brazil |
| Reais |
| CDI+1.10%aa |
| CDI+1.10%aa |
| No |
|
Foreign |
| Ampla |
| Brazil |
| Foreign |
| BONOS |
| Brazil |
| Reais |
| CDI+6.58%aa |
| CDI+6.58%aa |
| No |
|
Foreign |
| Codensa |
| Colombia |
| Foreign |
| B5 |
| Colombia |
| CPs |
| IPC+6.14% |
| IPC+6.14% |
| No |
|
Foreign |
| Codensa |
| Colombia |
| Foreign |
| B8 |
| Colombia |
| CPs |
| IPC+6.34% |
| IPC+6.34% |
| No |
|
Foreign |
| Codensa |
| Colombia |
| Foreign |
| B302 |
| Colombia |
| CPs |
| IPC+4.60% |
| IPC+4.60% |
| No |
|
Foreign |
| Codensa |
| Colombia |
| Foreign |
| B102 |
| Colombia |
| CPs |
| IPC+5.3% |
| IPC+5.3% |
| No |
|
Foreign |
| Codensa |
| Colombia |
| Foreign |
| B52 |
| Colombia |
| CPs |
| DTF+2.40% |
| DTF+2.40% |
| No |
|
Foreign |
| Codensa |
| Colombia |
| Foreign |
| B203 |
| Colombia |
| CPs |
| DTF+2.11% |
| DTF+2.11% |
| No |
|
Foreign |
| Codensa |
| Colombia |
| Foreign |
| B503 |
| Colombia |
| CPs |
| DTF+2.58% |
| DTF+2.58% |
| No |
|
Foreign |
| Codensa |
| Colombia |
| Foreign |
| B503 |
| Colombia |
| CPs |
| IPC+5.99% |
| IPC+5.99% |
| No |
|
Foreign |
| Codensa |
| Colombia |
| Foreign |
| B102 |
| Colombia |
| CPs |
| IPC+5.55% |
| IPC+5.55% |
| No |
|
Foreign |
| Compañía Distribuidora y Comercializadora de Energía S,A, |
| Colombia |
| Foreign |
| B304 |
| Colombia |
| CPs |
| IPC+3.92% |
| IPC+3.92% |
| No |
|
Foreign |
| Codensa |
| Colombia |
| Foreign |
| B304 |
| Colombia |
| CPs |
| IPC+3.92% |
| IPC+3.92% |
| No |
|
Foreign |
| Coelce |
| Brazil |
| Foreign |
| Itaú |
| Brazil |
| Reais |
| 12.00% |
| 12.00% |
| No |
|
Foreign |
| Coelce |
| Brazil |
| Foreign |
| Santander |
| Brazil |
| Reais |
| 12.00% |
| 12.00% |
| No |
|
Foreign |
| Edegel |
| Peru |
| Foreign |
| BANCO CONTINENTAL |
| Peru |
| Soles |
| 6.28% |
| 6.28% |
| No |
|
Foreign |
| Edegel |
| Peru |
| Foreign |
| BANCO CONTINENTAL |
| Peru |
| Soles |
| 6.28% |
| 6.28% |
| No |
|
Foreign |
| Edegel |
| Peru |
| Foreign |
| BANCO CONTINENTAL |
| Peru |
| Soles |
| 6.75% |
| 6.63% |
| No |
|
Foreign |
| Edegel |
| Peru |
| Foreign |
| BANCO CONTINENTAL |
| Peru |
| Soles |
| 6.50% |
| 6.50% |
| No |
|
Foreign |
| Edegel |
| Peru |
| Foreign |
| BANCO CONTINENTAL |
| Peru |
| Soles |
| 6.44% |
| 6.44% |
| No |
|
Foreign |
| Edegel |
| Peru |
| Foreign |
| BANCO CONTINENTAL |
| Peru |
| Soles |
| 6.63% |
| 6.63% |
| No |
|
Foreign |
| Edegel |
| Peru |
| Foreign |
| BANCO CONTINENTAL |
| Peru |
| Soles |
| 6.59% |
| 6.47% |
| No |
|
Foreign |
| Edegel |
| Peru |
| Foreign |
| BANCO CONTINENTAL |
| Peru |
| US$ |
| 6.28% |
| 5.97% |
| No |
|
Foreign |
| Edegel |
| Peru |
| Foreign |
| BANCO CONTINENTAL |
| Peru |
| US$ |
| 6.34% |
| 5.97% |
| No |
|
Foreign |
| Edegel |
| Peru |
| Foreign |
| BANCO CONTINENTAL |
| Peru |
| US$ |
| 9.00% |
| 6.34% |
| No |
|
Foreign |
| Edegel |
| Peru |
| Foreign |
| BANCO CONTINENTAL |
| Peru |
| US$ |
| 7.78% |
| 7.78% |
| No |
|
Foreign |
| Edegel |
| Peru |
| Foreign |
| BANCO CONTINENTAL |
| Peru |
| US$ |
| 7.13% |
| 7.13% |
| No |
|
Foreign |
| Edegel |
| Peru |
| Foreign |
| BANCO SCOTIABANK |
| Peru |
| US$ |
| 6.63% |
| 6.63% |
| No |
|
Foreign |
| Edegel |
| Peru |
| Foreign |
| BANCO SCOTIABANK |
| Peru |
| US$ |
| 6.00% |
| 6.00% |
| No |
|
Foreign |
| Edegel |
| Peru |
| Foreign |
| BANCO SCOTIABANK |
| Peru |
| US$ |
| 6.00% |
| 6.00% |
| No |
|
Foreign |
| Edegel |
| Peru |
| Foreign |
| BANCO SCOTIABANK |
| Peru |
| US$ |
| 6.00% |
| 6.00% |
| No |
|
Foreign |
| Edelnor |
| Peru |
| Foreign |
| Caja de Pensiones Militar Policial |
| Peru |
| Soles |
| 7.38% |
| 7.38% |
| No |
|
Foreign |
| Edelnor |
| Peru |
| Foreign |
| FCR - Macrofondo |
| Peru |
| Soles |
| 1.27% |
| 0.54% |
| No |
|
Foreign |
| Edelnor |
| Peru |
| Foreign |
| Rimac Internacional Cia de Seguros |
| Peru |
| Soles |
| 8.67% |
| 5.44% |
| No |
|
Foreign |
| Edelnor |
| Peru |
| Foreign |
| Rimac Internacional Cia de Seguros |
| Peru |
| Soles |
| 9.92% |
| 6.50% |
| No |
|
Foreign |
| Edelnor |
| Peru |
| Foreign |
| AFP Integra |
| Peru |
| Soles |
| 9.92% |
| 6.50% |
| No |
|
Foreign |
| Edelnor |
| Peru |
| Foreign |
| Fondo de Seguro de Retiro de Suboficiales y Especialistas Fosersoe |
| Peru |
| Soles |
| 8.94% |
| 8.75% |
| No |
|
Foreign |
| Edelnor |
| Peru |
| Foreign |
| AFP Integra |
| Peru |
| Soles |
| 7.45% |
| 7.31% |
| No |
|
Foreign |
| Edelnor |
| Peru |
| Foreign |
| Seguro Social de Salud - Essalud |
| Peru |
| Soles |
| 8.00% |
| 7.84% |
| No |
|
Foreign |
| Edelnor |
| Peru |
| Foreign |
| AFP Profuturo |
| Peru |
| Soles |
| 7.71% |
| 7.56% |
| No |
|
Foreign |
| Edelnor |
| Peru |
| Foreign |
| AFP Integra |
| Peru |
| Soles |
| 8.32% |
| 8.16% |
| No |
|
Foreign |
| Edelnor |
| Peru |
| Foreign |
| AFP Horizonte |
| Peru |
| Soles |
| 7.35% |
| 7.22% |
| No |
|
Foreign |
| Edelnor |
| Peru |
| Foreign |
| AFP Integra |
| Peru |
| Soles |
| 7.19% |
| 7.06% |
| No |
|
Foreign |
| Edelnor |
| Peru |
| Foreign |
| AFP Integra |
| Peru |
| Soles |
| 8.16% |
| 8.00% |
| No |
|
|
| December 2010 |
| December-2009 |
| ||||||||||||||||||||||||
|
| Current |
| Non-Current |
| Current |
| Non- Current |
| ||||||||||||||||||||
Company ID |
| Less |
| More |
| Total Current, |
| 1 to 3 |
| 3 to 5 |
| Over 5 years |
| Total |
| Less |
| More |
| total Current, |
| 1 to 3 years |
| 3 to 5 |
| Over 5 |
| Total |
|
Foreign |
| — |
| — |
| — |
| — |
| — |
| — |
| — |
| — |
| 6,218,332 |
| 6,218,332 |
| — |
| — |
| — |
| — |
|
Foreign |
| — |
| 52,430 |
| 52,430 |
| 4,168,325 |
| — |
| — |
| 4,168,325 |
| — |
| 55,078 |
| 55,078 |
| — |
| 4,385,160 |
| — |
| 4,385,160 |
|
Foreign |
| — |
| 5,030,217 |
| 5,030,217 |
| — |
| — |
| — |
| — |
| — |
| 4,431,993 |
| 4,431,993 |
| — |
| — |
| — |
| — |
|
Foreign |
| 4,255,775 |
| — |
| 4,255,775 |
| — |
| — |
| — |
| — |
| — |
| 29,644 |
| 29,644 |
| 5,262,192 |
| — |
| — |
| 5,262,192 |
|
Foreign |
| 117,614 |
| — |
| 117,614 |
| — |
| 4,168,325 |
| — |
| 4,168,325 |
| — |
| 123,662 |
| 123,662 |
| — |
| 4,385,160 |
| — |
| 4,385,160 |
|
Foreign |
| — |
| — |
| — |
| — |
| — |
| — |
| — |
| — |
| 92,088 |
| 92,088 |
| 4,385,160 |
| — |
| — |
| 4,385,160 |
|
Foreign |
| — |
| 66,252 |
| 66,252 |
| 9,367,060 |
| — |
| — |
| 9,367,060 |
| — |
| 72,618 |
| 72,618 |
| 10,141,998 |
| — |
| — |
| 10,141,998 |
|
|
| 4,373,389 |
| 5,148,899 |
| 9,522,288 |
| 13,535,385 |
| 4,168,325 |
| — |
| 17,703,710 |
| — |
| 11,023,415 |
| 11,023,415 |
| 19,789,350 |
| 8,770,320 |
| — |
| 28,559,670 |
|
|
|
|
|
|
|
|
|
|
|
|
|
|
|
|
|
|
|
|
|
|
|
|
|
|
|
|
|
|
|
Foreign |
| 4,686,546 |
| 52,169,863 |
| 56,856,409 |
| 52,170,000 |
| — |
| — |
| 52,170,000 |
| — |
| — |
| — |
| — |
| — |
| — |
| — |
|
Foreign |
| 174,000 |
| — |
| 174,000 |
| 32,523,060 |
| — |
| — |
| 32,523,060 |
| — |
| — |
|
|
| — |
| — |
| — |
| — |
|
Foreign |
| 153,269 |
| — |
| 153,269 |
| 13,096,397 |
| 26,860,183 |
| — |
| 39,956,580 |
| — |
| 46,910,823 |
| 46,910,823 |
| 154,419,099 |
| 26,147,159 |
| — |
| 180,566,258 |
|
Foreign |
| 240,683 |
| 48,655,410 |
| 48,896,093 |
| — |
| — |
| — |
| — |
| 239,630 |
| — |
| 239,630 |
| 49,612,813 |
| — |
| — |
| 49,612,813 |
|
Foreign |
| 307,948 |
| — |
| 307,948 |
| 60,819,262 |
| — |
| — |
| 60,819,262 |
| 306,773 |
| — |
| 306,773 |
| — |
| 62,016,015 |
| — |
| 62,016,015 |
|
Foreign |
| 353,650 |
| — |
| 353,650 |
| — |
| — |
| — |
| — |
| 173,600 |
| 55,667,344 |
| 55,840,944 |
| — |
| — |
| — |
| — |
|
Foreign |
| — |
| — |
| — |
| — |
| — |
| 94,695,348 |
| 94,695,348 |
| 350,428 |
| — |
| 350,428 |
| — |
| — |
| 96,558,689 |
| 96,558,689 |
|
Foreign |
| 22,810 |
| — |
| 22,810 |
| 8,203,302 |
| — |
| — |
| 8,203,302 |
| 89,286 |
| — |
| 89,286 |
| 8,364,721 |
| — |
| — |
| 8,364,721 |
|
Foreign |
| — |
| — |
| — |
| — |
| — |
| — |
| — |
| 25,907 |
| 27,038,982 |
| 27,064,889 |
| — |
| — |
| — |
| — |
|
Foreign |
| 69,066 |
| — |
| 69,066 |
| 20,800,188 |
| — |
| — |
| 20,800,188 |
| 78,909 |
| — |
| 78,909 |
| — |
| 18,728,836 |
| — |
| 18,728,836 |
|
Foreign |
| 89,400 |
| — |
| 89,400 |
| — |
| 18,367,417 |
| — |
| 18,367,417 |
| 93,489 |
| — |
| 93,489 |
| — |
| 21,209,478 |
| — |
| 21,209,478 |
|
Foreign |
| 90,029 |
| — |
| 90,029 |
| — |
| — |
| 19,462,164 |
| 19,462,164 |
| 88,791 |
| — |
| 88,791 |
| — |
| — |
| 19,845,125 |
| 19,845,125 |
|
Foreign |
| 132,693 |
| — |
| 132,693 |
| — |
| 19,462,164 |
| — |
| 19,462,164 |
| — |
| — |
| — |
| — |
| — |
| — |
| — |
|
Foreign |
| 280,518 |
| — |
| 280,518 |
| — |
| — |
| 35,275,172 |
| 35,275,172 |
| — |
| — |
| — |
| — |
| — |
| — |
| — |
|
Foreign |
| 890,856 |
| 25,521,000 |
| 26,411,856 |
| — |
| — |
| — |
| — |
| — |
| 970,543 |
| 970,543 |
| — |
| 35,448,942 |
| — |
| 35,448,942 |
|
Foreign |
| 1,599,204 |
| — |
| 1,599,204 |
| 30,656,023 |
| 15,611,999 |
| — |
| 46,268,022 |
| — |
| 970,544 |
| 970,544 |
| — |
| 35,448,943 |
| — |
| 35,448,943 |
|
Foreign |
| — |
| 6,578 |
| 6,578 |
| — |
| — |
| 4,168,325 |
| 4,168,325 |
| — |
| 6,920 |
| 6,920 |
| — |
| — |
| 4,385,160 |
| 4,385,160 |
|
Foreign |
| 128,730 |
| — |
| 128,730 |
| — |
| — |
| 4,168,325 |
| 4,168,325 |
| — |
| — |
| — |
| — |
| — |
| 4,385,160 |
| 4,385,160 |
|
Foreign |
| 75,030 |
| — |
| 75,030 |
| — |
| 3,334,660 |
| — |
| 3,334,660 |
| — |
| 78,933 |
| 78,933 |
| — |
| 3,508,128 |
| — |
| 3,508,128 |
|
Foreign |
| 76,767 |
| — |
| 76,767 |
| 4,168,325 |
| — |
| — |
| 4,168,325 |
| — |
| 80,760 |
| 80,760 |
| — |
| 4,385,160 |
| — |
| 4,385,160 |
|
Foreign |
| — |
| 29,070 |
| 29,070 |
| 4,168,325 |
| — |
| — |
| 4,168,325 |
| — |
| 30,582 |
| 30,582 |
| — |
| 4,385,160 |
| — |
| 4,385,160 |
|
Foreign |
| — |
| 13,808 |
| 13,808 |
| 4,168,325 |
| — |
| — |
| 4,168,325 |
| — |
| 14,526 |
| 14,526 |
| — |
| 4,385,160 |
| — |
| 4,385,160 |
|
Foreign |
| 97,660 |
| — |
| 97,660 |
| — |
| 4,718,544 |
| — |
| 4,718,544 |
| — |
| 102,783 |
| 102,783 |
| — |
| 4,964,001 |
| — |
| 4,964,001 |
|
Foreign |
| 127,919 |
| — |
| 127,919 |
| — |
| — |
| 4,683,530 |
| 4,683,530 |
| — |
| 108,963 |
| 108,963 |
| 4,056,799 |
| 4,995,402 |
| 5,866,821 |
| 14,919,022 |
|
Foreign |
| 100,637 |
| 3,746,824 |
| 3,847,461 |
| — |
| — |
| — |
| — |
| — |
| 138,506 |
| 138,506 |
| — |
| — |
| 5,070,999 |
| 5,070,999 |
|
Foreign |
| 127,923 |
| — |
| 127,923 |
| — |
| — |
| 4,683,530 |
| 4,683,530 |
| — |
| 59,148 |
| 59,148 |
| — |
| 4,929,095 |
| — |
| 4,929,095 |
|
Foreign |
| — |
| 54,629 |
| 54,629 |
| — |
| 4,552,391 |
| — |
| 4,552,391 |
| — |
| 143,209 |
| 143,209 |
| — |
| — |
| 4,140,994 |
| 4,140,994 |
|
Foreign |
| 132,266 |
| — |
| 132,266 |
| — |
| — |
| 3,824,571 |
| 3,824,571 |
| — |
| 102,050 |
| 102,050 |
| — |
| — |
| 3,222,567 |
| 3,222,567 |
|
Foreign |
| 94,171 |
| — |
| 94,171 |
| — |
| 2,976,388 |
| — |
| 2,976,388 |
| — |
| 153,978 |
| 153,978 |
| — |
| — |
| 5,070,999 |
| 5,070,999 |
|
Foreign |
| 142,213 |
| — |
| 142,213 |
| — |
| — |
| 4,683,530 |
| 4,683,530 |
| — |
| 83,650 |
| 83,650 |
| — |
| — |
| 5,070,999 |
| 5,070,999 |
|
Foreign |
| 77,278 |
| — |
| 77,278 |
| — |
| — |
| 4,683,530 |
| 4,683,530 |
| — |
| — |
| — |
| — |
| — |
| — |
| — |
|
Foreign |
| 67,692 |
| — |
| 67,692 |
| — |
| — |
| 4,683,530 |
| 4,683,530 |
| — |
| — |
| — |
| — |
|
|
| — |
| — |
|
Foreign |
| 3,465,734 |
| — |
| 3,465,734 |
| — |
| — |
| — |
| — |
| 5,317,877 |
| — |
| 5,317,877 |
| — |
| — |
| — |
| — |
|
Foreign |
| 819,886 |
| — |
| 819,886 |
| — |
| — |
| — |
| — |
| 4,485 |
| — |
| 4,485 |
| 858,071 |
| — |
| — |
| 858,071 |
|
Foreign |
| 40,394 |
| — |
| 40,394 |
| — |
| 3,932,869 |
| — |
| 3,932,869 |
| 41,573 |
| — |
| 41,573 |
| — |
| 4,047,701 |
| — |
| 4,047,701 |
|
Foreign |
| 14,881 |
| — |
| 14,881 |
| — |
| 3,924,661 |
| — |
| 3,924,661 |
| 15,316 |
| — |
| 15,316 |
| — |
| 4,039,254 |
| — |
| 4,039,254 |
|
Foreign |
| 8,489 |
| — |
| 8,489 |
| — |
| 7,835,713 |
| — |
| 7,835,713 |
| 8,737 |
| — |
| 8,737 |
| — |
| 8,064,483 |
| — |
| 8,064,483 |
|
Foreign |
| 24,315 |
| — |
| 24,315 |
| — |
| 5,001,990 |
| — |
| 5,001,990 |
| 25,580 |
| — |
| 25,580 |
| — |
| — |
| 5,262,192 |
| 5,262,192 |
|
Foreign |
| 25,430 |
| — |
| 25,430 |
| 666,932 |
| — |
| — |
| 666,932 |
| 124,703 |
| — |
| 124,703 |
| 3,508,128 |
| — |
| — |
| 3,508,128 |
|
Foreign |
| 19,965 |
| — |
| 19,965 |
| 2,500,995 |
| — |
| — |
| 2,500,995 |
| 26,753 |
| — |
| 26,753 |
| — |
| 701,626 |
| — |
| 701,626 |
|
Foreign |
| 118,993 |
| — |
| 118,993 |
| — |
| — |
| 3,001,194 |
| 3,001,194 |
| 21,003 |
| — |
| 21,003 |
| — |
| 2,631,096 |
| — |
| 2,631,096 |
|
Foreign |
| 60,180 |
| — |
| 60,180 |
| — |
| — |
| 2,500,995 |
| 2,500,995 |
| 125,183 |
| — |
| 125,183 |
| — |
| — |
| 3,157,315 |
| 3,157,315 |
|
Foreign |
| 3,432,135 |
| — |
| 3,432,135 |
| — |
| — |
| — |
| — |
| 63,311 |
| — |
| 63,311 |
| — |
| — |
| 2,631,096 |
| 2,631,096 |
|
Foreign |
| 150,163 |
| — |
| 150,163 |
| — |
| — |
| 4,535,138 |
| 4,535,138 |
| 102,546 |
| — |
| 102,546 |
| 3,508,128 |
| — |
| — |
| 3,508,128 |
|
Foreign |
| 38,844 |
| — |
| 38,844 |
| 2,500,995 |
| — |
| — |
| 2,500,995 |
| 157,975 |
| — |
| 157,975 |
| — |
| — |
| 4,771,054 |
| 4,771,054 |
|
· Secured and unsecured obligations by Company (continuation)
Company ID |
| Company |
| Country |
| Finncial |
| Financial Institution |
| Country |
| Currency |
| Interest effective |
| Nominal interest |
| Secured |
|
Foreign |
| Edelnor |
| Peru |
| Foreign |
| FCR - Macrofondo |
| Peru |
| Soles |
| 6.77% |
| 6.66% |
| No |
|
Foreign |
| Edelnor |
| Peru |
| Foreign |
| AFP Profuturo |
| Peru |
| Soles |
| 5.77% |
| 5.69% |
| No |
|
Foreign |
| Edelnor |
| Peru |
| Foreign |
| AFP Integra |
| Peru |
| Soles |
| 5.99% |
| 5.91% |
| No |
|
Foreign |
| Edelnor |
| Peru |
| Foreign |
| AFP Horizonte |
| Peru |
| Soles |
| 6.06% |
| 5.97% |
| No |
|
Foreign |
| Edelnor |
| Peru |
| Foreign |
| AFP Prima |
| Peru |
| Soles |
| 7.06% |
| 6.94% |
| No |
|
Foreign |
| Edelnor |
| Peru |
| Foreign |
| AFP Prima |
| Peru |
| Soles |
| 6.67% |
| 6.56% |
| No |
|
Foreign |
| Edelnor |
| Peru |
| Foreign |
| AFP Prima |
| Peru |
| Soles |
| 6.96% |
| 6.84% |
| No |
|
Foreign |
| Edelnor |
| Peru |
| Foreign |
| AFP Integra |
| Peru |
| Soles |
| 6.03% |
| 5.94% |
| No |
|
Foreign |
| Edelnor |
| Peru |
| Foreign |
| Mapfre Perú Cia de Seguros |
| Peru |
| Soles |
| 6.38% |
| 6.28% |
| No |
|
Foreign |
| Edelnor |
| Peru |
| Foreign |
| AFP Prima |
| Peru |
| Soles |
| 6.93% |
| 6.81% |
| No |
|
Foreign |
| Edelnor |
| Peru |
| Foreign |
| AFP Prima |
| Peru |
| Soles |
| 7.25% |
| 7.13% |
| No |
|
Foreign |
| Edelnor |
| Peru |
| Foreign |
| AFP Prima |
| Peru |
| Soles |
| 7.64% |
| 7.50% |
| No |
|
Foreign |
| Edelnor |
| Peru |
| Foreign |
| AFP Prima |
| Peru |
| Soles |
| 7.87% |
| 7.72% |
| No |
|
Foreign |
| Edelnor |
| Peru |
| Foreign |
| AFP Profuturo |
| Peru |
| Soles |
| 8.49% |
| 8.31% |
| No |
|
Foreign |
| Edelnor |
| Peru |
| Foreign |
| AFP Profuturo |
| Peru |
| Soles |
| 8.42% |
| 8.25% |
| No |
|
Foreign |
| Edelnor |
| Peru |
| Foreign |
| AFP Profuturo |
| Peru |
| Soles |
| 7.97% |
| 7.81% |
| No |
|
Foreign |
| Edelnor |
| Peru |
| Foreign |
| AFP Profuturo |
| Peru |
| Soles |
| 8.06% |
| 7.91% |
| No |
|
Foreign |
| Edelnor |
| Peru |
| Foreign |
| AFP Profuturo |
| Peru |
| Soles |
| 8.23% |
| 8.06% |
| No |
|
Foreign |
| Edelnor |
| Peru |
| Foreign |
| Fondo Mi Vivienda |
| Peru |
| Soles |
| 6.67% |
| 6.56% |
| No |
|
Foreign |
| Edelnor |
| Peru |
| Foreign |
| Rimac Internacional Cia de Seguros |
| Peru |
| Soles |
| 7.06% |
| 7.06% |
| No |
|
Foreign |
| Edelnor |
| Peru |
| Foreign |
| AFP Prima |
| Peru |
| Soles |
| 6.63% |
| 6.63% |
| No |
|
Foreign |
| Edelnor |
| Peru |
| Foreign |
| quinta serie A |
| Peru |
| Soles |
| 7.44% |
| 7.44% |
| No |
|
Foreign |
| Edesur S,A, |
| Argentina |
| Foreign |
| oeds7 |
| Argentina |
| Ar$ |
| 12.28% |
| 11.75% |
| No |
|
Foreign |
| Edesur S,A, |
| Argentina |
| Foreign |
| oeds7 |
| Argentina |
| Ar$ |
| 12.28% |
| 11.75% |
| No |
|
Foreign |
| Emgesa |
| Colombia |
| Foreign |
| Bonos A-10 |
| Colombia |
| CPs |
| 7.97% |
| 7.74% |
| No |
|
Foreign |
| Emgesa |
| Colombia |
| Foreign |
| Bonos B-103 |
| Colombia |
| CPs |
| 7.21% |
| 7.03% |
| No |
|
Foreign |
| Emgesa |
| Colombia |
| Foreign |
| Bonos B-103 |
| Colombia |
| CPs |
| 7.33% |
| 7.33% |
| No |
|
Foreign |
| Emgesa |
| Colombia |
| Foreign |
| Bonos A102 |
| Colombia |
| CPs |
| 8.39% |
| 8.14% |
| No |
|
Foreign |
| Emgesa |
| Colombia |
| Foreign |
| Bonos A5 |
| Colombia |
| CPs |
| 5.32% |
| 5.22% |
| No |
|
Foreign |
| Emgesa |
| Colombia |
| Foreign |
| Bonos B10 |
| Colombia |
| CPs |
| 8.39% |
| 8.14% |
| No |
|
Foreign |
| Emgesa |
| Colombia |
| Foreign |
| Bonos B15 |
| Colombia |
| CPs |
| 8.29% |
| 8.04% |
| No |
|
Foreign |
| Emgesa |
| Colombia |
| Foreign |
| Bonos A5 |
| Colombia |
| CPs |
| 9.27% |
| 9.27% |
| No |
|
Foreign |
| Emgesa |
| Colombia |
| Foreign |
| Bonos B9 |
| Colombia |
| CPs |
| 8.09% |
| 7.86% |
| No |
|
Foreign |
| Emgesa |
| Colombia |
| Foreign |
| Bonos B12 |
| Colombia |
| CPs |
| 8.30% |
| 8.05% |
| No |
|
Foreign |
| Emgesa |
| Colombia |
| Foreign |
| Bonos B7 |
| Colombia |
| CPs |
| 8.00% |
| 8.00% |
| No |
|
Foreign |
| Emgesa |
| Colombia |
| Foreign |
| Bonos B72 |
| Colombia |
| CPs |
| 8.55% |
| 8.55% |
| No |
|
Foreign |
| Emgesa |
| Colombia |
| Foreign |
| Bonos Comerciales |
| Colombia |
| CPs |
| 4.20% |
| 4.20% |
| No |
|
91,081,000-6 |
| Endesa S.A. (Chile) |
| Chile |
| Foreign |
| The Bank of New York Mellon - Primera Emisión S-1 |
| U.S. |
| US$ |
| 7.96% |
| 7.88% |
| No |
|
91,081,000-6 |
| Endesa S.A. (Chile) |
| Chile |
| Foreign |
| The Bank of New York Mellon - Primera Emisión S-2 |
| U.S. |
| US$ |
| 7.40% |
| 7.33% |
| No |
|
91,081,000-6 |
| Endesa S.A. (Chile) |
| Chile |
| Foreign |
| The Bank of New York Mellon - Primera Emisión S-3 |
| U.S. |
| US$ |
| 8.26% |
| 8.13% |
| No |
|
91,081,000-6 |
| Endesa S.A. (Chile) |
| Chile |
| 97,004,000-5 |
| Banco Santander Chile – 264 Serie-F |
| Chile |
| Ch$ |
| 6.44% |
| 6.20% |
| No |
|
91,081,000-6 |
| Endesa S.A. (Chile) |
| Chile |
| Foreign |
| The Bank of New York Mellon - 144 - A |
| U.S. |
| US$ |
| 8.50% |
| 8.35% |
| No |
|
91,081,000-6 |
| Endesa S.A. (Chile) |
| Chile |
| Foreign |
| The Bank of New York Mellon - 144 - A |
| U.S. |
| US$ |
| 8.83% |
| 8.63% |
| No |
|
91,081,000-6 |
| Endesa S.A. (Chile) |
| Chile |
| 97,004,000-5 |
| Banco Santander Chile – 317 Serie-H |
| Chile |
| Ch$ |
| 7.17% |
| 6.20% |
| No |
|
91,081,000-6 |
| Endesa S.A. (Chile) |
| Chile |
| 97,004,000-5 |
| Banco Santander Chile – 318 Serie-K |
| Chile |
| Ch$ |
| 3.86% |
| 3.80% |
| No |
|
91,081,000-6 |
| Endesa S.A. (Chile) |
| Chile |
| 97,004,000-5 |
| Banco Santander Chile – 522 Serie-M |
| Chile |
| Ch$ |
| 4.82% |
| 4.75% |
| No |
|
94,271,000-3 |
| Enersis S.A. |
| Chile |
| Foreign |
| Yankee bonos 2016 |
| U.S. |
| US$ |
| 7.40% |
| 7.40% |
| No |
|
94,271,000-3 |
| Enersis S.A. |
| Chile |
| Foreign |
| Yankee bonos 2026 |
| U.S. |
| US$ |
| 6.60% |
| 6.60% |
| No |
|
94,271,000-3 |
| Enersis S.A. |
| Chile |
| Foreign |
| Yankee bonos 2014 |
| U.S. |
| US$ |
| 7.38% |
| 7.38% |
| No |
|
94,271,000-3 |
| Enersis S.A. |
| Chile |
| Foreign |
| Bonos UF 269 |
| Chile |
| Ch$ |
| 5.75% |
| 5.75% |
| No |
|
|
|
|
|
|
|
|
|
|
|
|
|
|
| Total |
|
|
| ||
|
| December-2010 |
| December-2009 |
| ||||||||||||||||||||||||
|
| Current |
| Non-Current |
| Current |
| Non-Current |
| ||||||||||||||||||||
Company ID |
| Less than |
| More than |
| Current, |
| 1 to 3 |
| 3 to 5 |
| Over 5 |
| Non- |
| Less than |
| More than |
| Current, |
| 1 to 3 |
| 3 to 5 |
| Over 5 |
| Non- |
|
Foreign |
| 37,405 |
| — |
| 37,405 |
| 3,334,660 |
| — |
| — |
| 3,334,660 |
| 40,864 |
| — |
| 40,864 |
| — |
| 2,631,096 |
| — |
| 2,631,096 |
|
Foreign |
| 38,844 |
| — |
| 38,844 |
| — |
| 3,334,660 |
| — |
| 3,334,660 |
| 39,351 |
| — |
| 39,351 |
| 3,508,128 |
| — |
| — |
| 3,508,128 |
|
Foreign |
| 192,403 |
| — |
| 192,403 |
| 6,669,320 |
| — |
| — |
| 6,669,320 |
| 40,864 |
| ��� |
| 40,864 |
| — |
| — |
| 3,508,128 |
| 3,508,128 |
|
Foreign |
| 155,513 |
| — |
| 155,513 |
| — |
| 6,669,320 |
| — |
| 6,669,320 |
| 202,412 |
| — |
| 202,412 |
| 7,016,256 |
| — |
| — |
| 7,016,256 |
|
Foreign |
| 98,477 |
| — |
| 98,477 |
| 5,001,990 |
| — |
| — |
| 5,001,990 |
| 163,603 |
| — |
| 163,603 |
| — |
| — |
| 7,016,256 |
| 7,016,256 |
|
Foreign |
| 161,653 |
| — |
| 161,653 |
| 5,001,990 |
| — |
| — |
| 5,001,990 |
| 103,599 |
| — |
| 103,599 |
| 5,262,192 |
| — |
| — |
| 5,262,192 |
|
Foreign |
| 3,401,208 |
| — |
| 3,401,208 |
| — |
| — |
| — |
| — |
| 170,062 |
| — |
| 170,062 |
| — |
| 5,262,192 |
| — |
| 5,262,192 |
|
Foreign |
| 70,401 |
| — |
| 70,401 |
| 3,334,660 |
| — |
| — |
| 3,334,660 |
| 70,010 |
| — |
| 70,010 |
| 3,508,128 |
| — |
| — |
| 3,508,128 |
|
Foreign |
| 13,410 |
| — |
| 13,410 |
| — |
| 4,168,325 |
| — |
| 4,168,325 |
| 74,064 |
| — |
| 74,064 |
| — |
| 3,508,128 |
| — |
| 3,508,128 |
|
Foreign |
| 14,025 |
| — |
| 14,025 |
| — |
| — |
| 4,168,325 |
| 4,168,325 |
| 14,107 |
| — |
| 14,107 |
| — |
| 4,385,160 |
| — |
| 4,385,160 |
|
Foreign |
| 3,452,068 |
| — |
| 3,452,068 |
| — |
| — |
| — |
| — |
| 14,754 |
| — |
| 14,754 |
| — |
| — |
| 4,385,160 |
| 4,385,160 |
|
Foreign |
| 181,248 |
| — |
| 181,248 |
| 5,001,990 |
| — |
| — |
| 5,001,990 |
| 123,515 |
| — |
| 123,515 |
| 3,508,128 |
| — |
| — |
| 3,508,128 |
|
Foreign |
| 9,509 |
| — |
| 9,509 |
| 2,167,529 |
| — |
| — |
| 2,167,529 |
| 190,677 |
| — |
| 190,677 |
| — |
| 5,262,192 |
| — |
| 5,262,192 |
|
Foreign |
| 2,589,753 |
| — |
| 2,589,753 |
| — |
| — |
| — |
| — |
| 10,004 |
| — |
| 10,004 |
| 2,280,283 |
| — |
| — |
| 2,280,283 |
|
Foreign |
| 152,924 |
| — |
| 152,924 |
| 4,245,022 |
| — |
| — |
| 4,245,022 |
| 11,811 |
| — |
| 11,811 |
| 2,712,660 |
| — |
| — |
| 2,712,660 |
|
Foreign |
| 182,356 |
| — |
| 182,356 |
| 5,001,990 |
| — |
| — |
| 5,001,990 |
| 160,879 |
| — |
| 160,879 |
| 4,465,847 |
| — |
| — |
| 4,465,847 |
|
Foreign |
| 99,528 |
| — |
| 99,528 |
| — |
| 4,153,319 |
| — |
| 4,153,319 |
| 191,842 |
| — |
| 191,842 |
| — |
| 5,262,192 |
| — |
| 5,262,192 |
|
Foreign |
| 42,106 |
| — |
| 42,106 |
| — |
| 4,914,455 |
| — |
| 4,914,455 |
| 104,706 |
| — |
| 104,706 |
| — |
| — |
| 4,369,373 |
| 4,369,373 |
|
Foreign |
| 73,597 |
| — |
| 73,597 |
| — |
| — |
| 5,001,990 |
| 5,001,990 |
| 44,296 |
| — |
| 44,296 |
| — |
| 5,170,104 |
| — |
| 5,170,104 |
|
Foreign |
| 36,820 |
| — |
| 36,820 |
| — |
| — |
| 3,334,660 |
| 3,334,660 |
| — |
| — |
| — |
| — |
| — |
| — |
| — |
|
Foreign |
| 148,809 |
| — |
| 148,809 |
| — |
| — |
| 5,001,990 |
| 5,001,990 |
| — |
| — |
| — |
| — |
| — |
| — |
| — |
|
Foreign |
| 34,921 |
| — |
| 34,921 |
| — |
| — |
| 3,334,660 |
| 3,334,660 |
| — |
| — |
| — |
| — |
| — |
| — |
| — |
|
Foreign |
| — |
| 3,886,654 |
| 3,886,654 |
| — |
| — |
| — |
| — |
| — |
| 8,807,528 |
| 8,807,528 |
| 13,211,293 |
| — |
| — |
| 13,211,293 |
|
Foreign |
| — |
| 3,849,436 |
| 3,849,436 |
| 3,862,274 |
| — |
| — |
| 3,862,274 |
|
|
| — |
| — |
| — |
| — |
| — |
| — |
|
Foreign |
| — |
| 411,850 |
| 411,850 |
| — |
| — |
| 51,088,180 |
| 51,088,180 |
| — |
| 77,674 |
| 77,674 |
| — |
| — |
| 54,124,027 |
| 54,124,027 |
|
Foreign |
| — |
| 2,810,154 |
| 2,810,154 |
| — |
| — |
| 42,837,829 |
| 42,837,829 |
| — |
| 313,888 |
| 313,888 |
| — |
| — |
| 42,170,891 |
| 42,170,891 |
|
Foreign |
| — |
| 78,448 |
| 78,448 |
| — |
| — |
| 9,384,105 |
| 9,384,105 |
| — |
| 2,781,270 |
| 2,781,270 |
| — |
| — |
| 9,922,563 |
| 9,922,563 |
|
Foreign |
| — |
| — |
| — |
| — |
| — |
| — |
| — |
| — |
| 41,039,701 |
| 41,039,701 |
| — |
| — |
| 59,535,375 |
| 59,535,375 |
|
Foreign |
| — |
| 83,357 |
| 83,357 |
| — |
| — |
| 12,027,617 |
| 12,027,617 |
| — |
| 98,880 |
| 98,880 |
| — |
| — |
| 12,264,287 |
| 12,264,287 |
|
Foreign |
| — |
| 449,458 |
| 449,458 |
| — |
| — |
| 38,938,924 |
| 38,938,924 |
| — |
| 446,152 |
| 446,152 |
| — |
| — |
| 39,705,134 |
| 39,705,134 |
|
Foreign |
| — |
| 161,483 |
| 161,483 |
| — |
| — |
| 13,501,876 |
| 13,501,876 |
| — |
| 160,448 |
| 160,448 |
| — |
| — |
| 13,767,556 |
| 13,767,556 |
|
Foreign |
| — |
| 1,042,712 |
| 1,042,712 |
| — |
| — |
| 22,435,009 |
| 22,435,009 |
| — |
| 1,063,229 |
| 1,063,229 |
| — |
| — |
| 22,876,468 |
| 22,876,468 |
|
Foreign |
| — |
| 1,108,613 |
| 1,108,613 |
| — |
| — |
| 53,083,052 |
| 53,083,052 |
| — |
| 1,101,083 |
| 1,101,083 |
| — |
| — |
| 54,127,579 |
| 54,127,579 |
|
Foreign |
| — |
| 465,607 |
| 465,607 |
| — |
| — |
| 21,792,758 |
| 21,792,758 |
| — |
| 462,733 |
| 462,733 |
| — |
| — |
| 22,221,579 |
| 22,221,579 |
|
Foreign |
| — |
| 44,319,708 |
| 44,319,708 |
| — |
| — |
| — |
| — |
| — |
| — |
| — |
| — |
| — |
| — |
| — |
|
Foreign |
| — |
| 14,773,236 |
| 14,773,236 |
| — |
| — |
| — |
| — |
| — |
| — |
| — |
| — |
| — |
| — |
| — |
|
Foreign |
| — |
| 17,113,595 |
| 17,113,595 |
| — |
| — |
| — |
| — |
| — |
| — |
| — |
| — |
| — |
| — |
| — |
|
91,081,000-6 |
| 3,161,628 |
| — |
| 3,161,628 |
| — |
| — |
| 94,921,874 |
| 94,921,874 |
| 3,425,699 |
| — |
| 3,425,699 |
| — |
| — |
| 102,917,226 |
| 102,917,226 |
|
91,081,000-6 |
| 1,011,025 |
| — |
| 1,011,025 |
| — |
| — |
| 32,652,675 |
| 32,652,675 |
| 1,095,470 |
| — |
| 1,095,470 |
| — |
| — |
| 35,440,766 |
| 35,440,766 |
|
91,081,000-6 |
| 640,355 |
| — |
| 640,355 |
| — |
| — |
| 13,515,600 |
| 13,515,600 |
| 693,840 |
| — |
| 693,840 |
| — |
| — |
| 15,095,048 |
| 15,095,048 |
|
91,081,000-6 |
| 1,091,599 |
| 321,834 |
| 1,413,433 |
| 1,609,167 |
| 2,252,833 |
| 25,121,867 |
| 28,983,867 |
| 1,081,503 |
| 314,143 |
| 1,395,646 |
| 1,256,571 |
| 1,884,860 |
| 25,832,339 |
| 28,973,770 |
|
91,081,000-6 |
| 6,513,139 |
| — |
| 6,513,139 |
| 185,675,099 |
| — |
| — |
| 185,675,099 |
| 7,057,142 |
| — |
| 7,057,142 |
| — |
| 195,594,900 |
| — |
| 195,594,900 |
|
91,081,000-6 |
| 3,363,822 |
| — |
| 3,363,822 |
| — |
| 92,366,575 |
| — |
| 92,366,575 |
| 3,644,781 |
| — |
| 3,644,781 |
| — |
| — |
| 99,962,409 |
| 99,962,409 |
|
91,081,000-6 |
| — |
| 5,497,845 |
| 5,497,845 |
| 8,925,508 |
| 8,925,508 |
| 54,281,364 |
| 72,132,380 |
| — |
| 5,421,895 |
| 5,421,895 |
| 8,712,238 |
| 8,712,238 |
| 57,413,607 |
| 74,838,083 |
|
91,081,000-6 |
| — |
| 673,096 |
| 673,096 |
| — |
| — |
| 85,561,441 |
| 85,561,441 |
| — |
| 657,013 |
| 657,013 |
| — |
| — |
| 83,760,687 |
| 83,760,687 |
|
91,081,000-6 |
| — |
| 419,706 |
| 419,706 |
| — |
| — |
| 210,717,524 |
| 210,717,524 |
| — |
| 409,678 |
| 409,678 |
| — |
| — |
| 214,572,642 |
| 214,572,642 |
|
94,271,000-3 |
| — |
| 720,747 |
| 720,747 |
| — |
| — |
| 120,393,171 |
| 120,393,171 |
| — |
| 780,947 |
| 780,947 |
| — |
| — |
| 142,661,648 |
| 142,661,648 |
|
94,271,000-3 |
| — |
| 2,209 |
| 2,209 |
| — |
| — |
| 401,553 |
| 401,553 |
| — |
| 2,393 |
| 2,393 |
| — |
| — |
| 435,092 |
| 435,092 |
|
94,271,000-3 |
| 5,536,900 |
| — |
| 5,536,900 |
| — |
| 171,324,624 |
| — |
| 171,324,624 |
| — |
| 5,999,363 |
| 5,999,363 |
| — |
| 179,935,747 |
| — |
| 179,935,747 |
|
94,271,000-3 |
| — |
| 2,201,591 |
| 2,201,591 |
| 4,009,551 |
| 4,806,093 |
| 20,746,252 |
| 29,561,896 |
| — |
| 2,040,943 |
| 2,040,943 |
| — |
| — |
| 32,508,440 |
| 32,508,440 |
|
|
| 51,063,813 |
| 230,588,521 |
| 281,652,334 |
| 480,282,879 |
| 419,494,691 |
| 1,139,293,178 |
| 2,039,070,748 |
| 26,251,710 |
| 204,641,205 |
| 230,892,915 |
| 279,769,483 |
| 667,644,448 |
| 1,330,033,450 |
| 2,277,447,381 |
|
Appendix No,4, letter b) presents additional information on financial debt which includes a projection of future cash flows (undiscounted) that the Group will have to disburse to settle the secured and unsecured obligations detailed above.
- Detail of financial lease obligations
Company ID |
| Company |
| Country |
| Company ID |
| Financial Institution |
| Country |
| Currency |
| Interest |
|
91,081,000-6 |
| Endesa S,A, (Chile) |
| Chile |
| 87,509,100-K |
| Leasing Abengoa Chile |
| Chile |
| US$ |
| 6.40 | % |
Foreign |
| Edegel |
| Peru |
| Foreign |
| Banco Scotiabank |
| Peru |
| US$ |
| 2.03 | % |
96,830,980-3 |
| Gas Atacama S.A. |
| Chile |
| 96,976,410-5 |
| Gasred S,A, |
| Chile |
| US$ |
| 8.27 | % |
Foreign |
| Edelnor |
| Peru |
| Foreign |
| BBVA |
| Peru |
| Soles |
| 6.30 | % |
Foreign |
| Edesur S.A. |
| Argentina |
| Foreign |
| COMAFI |
| Argentina |
| Ar$ |
| 21.19 | % |
Foreign |
| Synapsis Brazil Ltda, |
| Brazil |
| Foreign |
| Leasing — IBM |
| Brazil |
| Reais |
| 10.00 | % |
|
| December - 2010 |
| December - 2009 |
| ||||||||||||||||||||||
|
| Current |
| Non-Current |
| Current |
| Non-Current |
| ||||||||||||||||||
Company ID |
| Less than 90 |
| More than |
| Current, |
| 1 to 3 years |
| 3 to 5 years |
| Over 5 years |
| Non-Current, |
| Lees than 90 |
| Current, Total |
| 1 to 3 years |
| 3 to 5 years |
| Over 5 years |
| Non-Current, |
|
91,081,000-6 |
| — |
| 881,720 |
| 881,720 |
| 3,004,174 |
| 2,342,336 |
| 12,408,341 |
| 17,754,851 |
| 897,056 |
| 897,056 |
| 3,056,426 |
| 2,383,077 |
| 14,753,667 |
| 20,193,170 |
|
Foreign |
| 1,877,853 |
| 5,562,774 |
| 7,440,627 |
| 12,096,296 |
| 11,246,668 |
| 16,687,463 |
| 40,030,427 |
| 8,485,635 |
| 8,485,635 |
| 28,873,973 |
| 9,844,821 |
| 24,156,332 |
| 62,875,126 |
|
96,830,980-3 |
| — |
| 249,450 |
| 249,450 |
| — |
| — |
| — |
| — |
| 249,240 |
| 249,240 |
| 270,538 |
| — |
| — |
| 270,538 |
|
Foreign |
| 448,208 |
| 713,588 |
| 1,161,796 |
| 2,406,791 |
| — |
| — |
| 2,406,791 |
| 1,204,165 |
| 1,204,165 |
| 941,406 |
| — |
| — |
| 941,406 |
|
Foreign |
| — |
| 460,392 |
| 460,392 |
| 947,990 |
| — |
| — |
| 947,990 |
| 484,147 |
| 484,147 |
| 1,574,946 |
| — |
| — |
| 1,574,946 |
|
Foreign |
| — |
| — |
| — |
| — |
| — |
| — |
| — |
| — |
| — |
| 1,020,782 |
| — |
| — |
| 1,020,782 |
|
|
|
|
|
|
|
|
|
|
|
|
|
|
|
|
|
|
|
|
|
|
|
|
|
|
|
|
|
Total Leasing |
| 2,326,061 |
| 7,867,924 |
| 10,193,985 |
| 18,455,251 |
| 13,589,004 |
| 29,095,804 |
| 61,140,059 |
| 11,320,243 |
| 11,320,243 |
| 35,738,071 |
| 12,227,898 |
| 38,909,999 |
| 86,875,968 |
|
Appendix No.4 letter c) presents additional information on financial lease obligations which includes a projection of future cash flows (undiscounted) that the Group will have to disburse to settle these obligations.
- Detail of other obligations
Company ID |
| Company |
| Country |
| Company ID |
| Financial Institution |
| Country |
| Currency |
| Interest |
|
Foreign |
| Endesa Costanera S,A, |
| Argentina |
| Foreign |
| Mitsubishi (deuda garantizada) |
| Argentina |
| US$ |
| 7.42 | % |
Foreign |
| Endesa Costanera S,A, |
| Argentina |
| Foreign |
| Mitsubishi (deuda no garantizada) |
| Argentina |
| US$ |
| 7.42 | % |
Foreign |
| Endesa Costanera S,A, |
| Argentina |
| Foreign |
| Otros |
| Argentina |
| Ar$ |
| N/A |
|
91,081,000-6 |
| Endesa S.A. (Chile) |
| Chile |
| N/A |
| Otros |
| Chile |
| Ch$ |
| 1.58 | % |
96,830,980-3 |
| Gas Atacama S.A. |
| Chile |
| N/A |
| Otros |
| Chile |
| Ch$ |
| N/A |
|
96,827,970-K |
| Endesa Eco S.A. |
| Chile |
| 96,601,250-1 |
| Inversiones Centinela S,A, |
| Chile |
| US$ |
| N/A |
|
94,271,000-3 |
| Enersis S.A. |
| Chile |
| N/A |
| Otros |
| Chile |
| Ch$ |
| N/A |
|
96,800,570-7 |
| Chilectra S.A. |
| Chile |
| N/A |
| Otros |
| Chile |
| Ch$ |
| N/A |
|
Foreign |
| Ampla |
| Brazil |
| Foreign |
| Eletrobrás |
| Brazil |
| Reais |
| 7.75 | % |
Foreign |
| Ampla |
| Brazil |
| Foreign |
| Otros |
| Brazil |
| Reais |
| 10.95 | % |
Foreign |
| Ampla |
| Brazil |
| Foreign |
| Bndes |
| Brazil |
| Reais |
| 10.13 | % |
Foreign |
| Endesa Brasil S.A. |
| Brazil |
| Foreign |
| IFC |
| Brazil |
| US$ |
| N/A |
|
|
| December-2010 |
| December-2009 |
| ||||||||||||||||||||||
|
| Current |
| Non-Current |
| Current |
| Non-Current |
| ||||||||||||||||||
Company ID |
| Less than 90 |
| More than |
| Current, |
| 1 to 3 years |
| 3 to 5 years |
| Over 5 years |
| Non-Current, |
| Less than 90 |
| Current |
| 1 to 3 |
| 3 to 5 years |
| Over 5 |
| Non-Current, |
|
Foreign |
| 17,408,628 |
| 8,223,739 |
| 25,632,367 |
| — |
| 37,523,997 |
| — |
| 37,523,997 |
| 11,158,204 |
| 11,158,204 |
| 8,788,901 |
| 7,591,100 |
| — |
| 16,380,001 |
|
Foreign |
| — |
| — |
| — |
| — |
| 12,332,589 |
| — |
| 12,332,589 |
| 11,158,205 |
| 11,158,205 |
| 22,261,205 |
| 19,227,325 |
| — |
| 41,488,530 |
|
Foreign |
| 1,542,295 |
| 1,517,680 |
| 3,059,975 |
| 1,011,826 |
| — |
| — |
| 1,011,826 |
| 7,414,204 |
| 7,414,204 |
| 3,002,567 |
| — |
| — |
| 3,002,567 |
|
91,081,000-6 |
| — |
| 894 |
| 894 |
| — |
| — |
| — |
| — |
| 1,661 |
| 1,661 |
| — |
| — |
| — |
| — |
|
96,830,980-3 |
| — |
| — |
| — |
| 792,809 |
| — |
| — |
| 792,809 |
| — |
| — |
| 894,018 |
| — |
| — |
| 894,018 |
|
96,827,970-K |
| — |
| — |
| — |
| — |
| 12,395,250 |
| — |
| 12,395,250 |
| — |
| — |
| 11,953,000 |
| — |
| — |
| 11,953,000 |
|
94,271,000-3 |
| — |
| 821 |
| 821 |
| — |
| — |
| — |
| — |
| 32 |
| 32 |
| — |
| — |
| — |
| — |
|
96,800,570-7 |
| — |
| 1,180 |
| 1,180 |
| — |
| — |
| — |
| — |
| 115,477 |
| 115,477 |
| — |
| — |
| — |
| — |
|
Foreign |
| 96,367 |
| 410,814 |
| 507,181 |
| 1,190,260 |
| 1,190,260 |
| 1,775,735 |
| 4,156,255 |
| — |
| — |
| — |
| — |
| 4,822,575 |
| 4,822,575 |
|
Foreign |
| 8,353,041 |
| 17,646,086 |
| 25,999,127 |
| 10,399,296 |
| 531,167 |
| — |
| 10,930,463 |
| 597,908 |
| 597,908 |
| — |
| — |
| — |
| — |
|
Foreign |
| — |
| — |
| — |
|
|
|
|
|
|
| — |
| 33,543,177 |
| 33,543,177 |
| 9,462,684 |
|
|
|
|
| 9,462,684 |
|
Foreign |
| — |
| 51,906,330 |
| 51,906,330 |
| — |
| — |
| — |
| — |
| 55,438,210 |
| 55,438,210 |
| — |
| — |
| — |
| — |
|
|
|
|
|
|
|
|
|
|
|
|
|
|
|
|
|
|
|
|
|
|
|
|
|
|
|
|
|
Total |
| 27,400,331 |
| 79,707,544 |
| 107,107,875 |
| 13,394,191 |
| 63,973,263 |
| 1,775,735 |
| 79,143,189 |
| 119,427,078 |
| 119,427,078 |
| 56,362,375 |
| 26,818,425 |
| 4,822,575 |
| 88,003,375 |
|
Appendix No.4 letter d) presents additional information on other obligations which includes a projection of future cash flows (undiscounted) that the Group will have to disburse to settle these obligations.
18.4 Hedged debt
Of Enersis’s US dollar denominated debt, as of December 31, 2010, ThCh$ 679,999,810 is related to future cash flow hedges for the Group’s US dollar linked operating income (see Note 3.m.). As of December 31, 2009, this amount totals ThCh$ 964,291,218.
The following table details movements in “Reserve of cash flow hedges” during 2010, 2009 and 2008 due to exchange differences of this debt:
|
| 12-31-2010 |
| 12-31-2009 |
| 12-31-2008 |
|
Balance in hedging at the beginning of year |
| 60,346,205 |
| (61,905,837 | ) | 128,332,092 |
|
Foreign currency differences exchange recorded in net equity |
| 15,654,909 |
| 126,579,938 |
| (179,193,798 | ) |
Recognition of foreign currency exchange differences in profit or loss |
| (8,252,587 | ) | (4,327,896 | ) | (11,044,131 | ) |
Balance in hedging |
| 67,748,527 |
| 60,346,205 |
| (61,905,837 | ) |
18.5 Other information
As of December 31, 2010 and 2009, the Enersis Group has long term lines of credit available for use amounting to ThCh$ 242,750,000 and ThCh$ 253,550,000, respectively.
Various credit facilities of the Company and various of its subsidiaries contain certain financial covenant ratios, customary on these types of arrangements. Those credit facilities also include affirmative and negative covenants that require ongoing monitoring. Additionally, there are certain restriction in the events of default sections that also require compliance.
Some of Enersis’s and Endesa Chile’s credit facilities include cross default provisions. Regarding the provision affecting Enersis, the loan subscribed on December 2009 under the New York jurisdiction that matures December 2012, points out that a cross default arises when Enersis, Chilectra or Endesa Chile become due with any one of its debt repayments. A similar provision applies to Endesa Chile with its loan syndicated under the State of New York law that matures in July 2011. According to that loan’s stipulations, a cross default can arise due to lack of payment of either interest or principal by Endesa Chile or its “Relevant Subsidiaries” as defined in the credit facility. Note that there have been no disbursements under either of these credit facilities as of December 2010. As for Endesa Chile’s loan that is syndicated the State of New York law, subscribed in 2008 and expiring in 2014, and which contains a disbursed balance of US$ 200 million as of December 31, 2010, the loan does not make reference to Endesa Chile’s subsidiaries, as a result, a cross default can only originate if Endesa Chile defaults on other of its own debt. For debt repayments to become accelerated due to cross default, the amount in default must exceed US$ 50 million, or its equivalent in other currencies. Additionally, other conditions must be met before debt repayments can be accelerated, including expiration of the grace period (if any) and a formal notice documenting intention to accelerate debt repayment from the lenders that represent more than 50% of the balance owed under the credit facility. Additionally, in December 2009, both Enersis and Endesa Chile subsribed loans under Chilean law that stipulate that a cross default will arise only by the debtor’s default. In these loans, the amount in default must also exceed the US$ 50 million threshold aforementioned or its equivalent in foreign currency. Note that since their subscription, these credit facilities have not been disbursed.
Regarding Enersis and Endesa Chile’s bonds registered with the U.S. SEC, commonly known as “Yankee Bonds,” the cross default for nonpayment can arise from other debt affecting the same company, or from any of its Chilean subsidiaries, regardless of the amount, as long as the principal that originated the cross default exceeds US$ 30 million, or its equivalent in other currency. The acceleration of the debt repayment caused by the cross default provision does not happen automatically, instead, bondholders of at least 25% of a certain series of the Yankee Bonds must demand this. Additionally, the bankruptcy or insolvency of a foreign subsidiary does not have a contractual impact on Enersis’s and Endesa Chile’s Yankee Bonds.
Enersis’s and Endesa Chile’s Chilean bonds stipulate that a cross default can only arise if the “Issuer” of the debt instrument (as defined in the debt agreement) is in default. Furthermore, the acceleration of the debt repayment must be requested by at least 50% of the bondholders of a particular series
As of December 31, 2010 and 2009, Enersis S.A, Endesa Chile, and their respective subsidiaries were in full compliance with all above described financial and other covenants and restrictions.
19. RISK MANAGEMENT POLICY
The Group’s companies are exposed to certain risks that are managed by systems tthat identify, measure, limit concentration and supervise.
Among the main basic principles defined by the Group are:
· Compliance with corporate governance standards.
· Strict compliance with all of the Group’s internal policies.
· Each business and corporate area defines:
I. Markets and products to operate based on its knowledge and ability to ensure an effective risk management.
II. Criteria regarding counterparts.
III. �� Authorized operators.
· Business and corporate areas establish their risk tolerance in a manner consistent with the defined strategy for each market in which they operate.
· All of the operations of the businesses and corporate areas are performed within limits approved by the corresponding internal authorities.
· Businesses, corporate areas, lines of business and companies design risk management controls that are necessary to ensure that transactions in the markets are conducted in accordance with Enersis’ policies, standards and procedures.
19.1 Interest rate risk
Changes in interest rates affect the fair value of assets and liabilities bearing fixed interest rates, as well as, the expected future cash flows of assets and liabilities subject to floating interest rates.
The objective of managing interest rate risk exposure is to achieve a balance in the debt structure to minimize the cost of debt with reduced volatility in profit or loss.
In compliance with the current interest rate hedging policy, the proportion of fixed debt and/or hedged debt over the net total debt was 51% as of December 31, 2010.
Depending on the Group’s estimates and on the objectives of the debt structure, hedging transactions are performed by entering into derivatives contracts to mitigate interest rate risk. Derivative instruments currently used to comply with the risk management policy are interest rate swaps to set floating rate to fixed rate.
The financial debt structure of the Group detailed by fixed, hedged and floating rate debt net of hedging derivatives instruments is as follows:
Net position:
|
| 12-31-2010 |
| 12-31-2009 |
|
Fixed Interest Rate |
| 51 | % | 35 | % |
Hedged Interest Rate |
| 0 | % | 1 | % |
Floating Interest Rate |
| 49 | % | 64 | % |
Total |
| 100 | % | 100 | % |
19.2 Exchange rate risk
Exchange rate risks involve basically the following transactions:
· Debt contracted by the Group’s companies that is denominated in a foreign currency, when the Company’s contribution margin is not highly indexed to such foreign currency.
· Payments to be made in international markets for the acquisition of project related materials.
· Group company income directly linked to dollar changes.
· Cash flows from foreign subsidiaries to the Chilean parent company, exposed to exchange rate fluctuations.
In order to mitigate the foreign currency risk, the Group’s foreign currency risk management policy is based on cash flows and considers maintaining a balance between U.S. dollar flows and the levels of assets and liabilities denominated in such currency. The objective is to minimize the exposure to variability in cash flows that are attributable to foreign exchange risk.
The hedging instruments currently being used to comply with the policy are currency swaps and forward exchange contracts. In addition, the policy seeks to refinance the debt in the functional currency of each of the companies of the Group.
19.3 Commodities risk
The Group has a risk exposure to price changes in certain commodities, basically due to:
· Purchases of fuel used to generate electricity.
· Energy purchase/sale transactions performed in local markets.
The company has not entered into commodity derivative instruments to manage fluctuations in fuel prices; however, it is permanently analyzing and verifying the appropriateness of using this type of instruments, as such has not discarded its use in the future.
In order to reduce the risk in situations of extreme drought, the company has designed a commercial policy by defining the levels of sales commitments in line with the capacity of its generating power plants in a dry year and including risk mitigation terms in certain contracts with unregulated customers.
19.4 Liquidity risk
The Group maintains a liquidity risk management policy consisting of entering into long-term committed banking facilities and temporary financial investments for amounts matching the projected needs over a period of time subject to the situation and expectations of debt and capital markets.
The projected needs above include maturities of financial debt, net of financial derivatives. For further details regarding the features and conditions of financial obligations and financial derivatives, see Notes 18, 20 and Appendix No. 4
As of December 31, 2010, the Group has cash and cash equivalent totaling ThCh$ 961,355,037 and unconditional available lines of credits totaling ThCh$ 242,750,000. As of December 31, 2009, the Group had ThCh$ 1,134,900,821 in cash and cash equivalents and ThCh$ 253,550,000 in unconditional available lines of credit.
19.5 Credit risk
Given the current economic situation, the Group has been conducting detailed monitoring of its credit risk.
Trade receivables:
The credit risk for receivables from the Group’s commercial activity has historically been very low, due to the short term period of collections from customers, resulting in non significant cumulative amounts of receivables. The above trend applies to our electricity generating and distribution lines of business.
In our electricity generating line of business, the regulations in certain countries, allow the suspension of the energy service to customers with outstanding payments, and most of the contracts have termination clauses for payment default. The Company monitors on an ongoing basis its credit risk and measures quantitatively its maximum exposure to the payment default risk, which as stated above, is very low.
In our electricity distribution line of business, the suspension of the energy service for payment default of our customers is permitted in all cases, in accordance with current regulations in each country, which facilitates our credit risk management, which is also very low.
Financial assets:
Cash surpluses are invested in highest rated local and foreign financial entities (with risk rating equivalent to investment grade) with established thresholds for each entity.
In order to select the banks where to invest, those banks with at least two investment grade ratings received from the three major international rating agencies (Moody’s, S&P y Fitch), are selected to make the investments.
Investments are supported with treasury bonds from the countries where the company operates and/or with commercial paper issued by highest rated banks, where depending on the circumstances and market conditions treasury bonds are preferred.
Derivative instruments are entered into with entities with solid creditworthiness, where approximately 90% of the derivative transactions performed are with A or higher rated entities.
19.6 Risk measurement
The Enersis Group measures the Value at Risk (VaR) of its debt positions and financial derivatives, in order to ensure that the risk assumed by the company remains consistent with the risk exposure defined by Management, thereby reducing the volatility in the income statement.
The portfolio of positions included in order to calculate the current Value at Risk consists of the following:
· Debt
· Financial derivatives
The VaR determined represents the potential loss in value of the portfolio of positions described above in one-day with a 95% confidence level. To determine the VaR, we take into account the volatility of the risk variables affecting the value of the portfolio of positions including:
· U.S. dollar Libor interest rate.
· The customary local indices used in the banking industry for the debt, considering the various currencies in which our companies operate
· The exchange rates of the various currencies included in the calculation.
The calculation of VaR is based on generating possible future scenarios (at one day) of market values (both spot and term) for the risk variables, using Monte Carlo simulations. The number of scenarios generated ensures compliance with the simulation convergence criteria. The table of volatilities and correlations between the various risk variables calculated based on the historical values of the logarithmic price return has been applied to simulate the future price scenario.
Once the price scenarios have been obtained, the fair value of the portfolio is calculated using such scenarios, thereby obtaining a distribution of possible values at one day. The one-day 95% VaR number is calculated as the 5% percentile of the potential increases in the fair value of the portfolio in one day.
The various debt positions and financial derivatives included in the calculation have been valued consistently using the financial capital calculation methodology reported to Management.
Taking into account the assumptions described above, the Value at Risk of the previously discussed positions, broken down by type of position, is shown in the following table:
Financial Positions |
| 12-31-2010 |
| 12-31-2009 |
|
Interest Rate |
| 38,847,459 |
| 29,778,643 |
|
Exchange Rate |
| 539,575 |
| 3,860,371 |
|
Correlation |
| (2,695,024 | ) | (7,740,115 | ) |
Total |
| 36,692,010 |
| 25,898,899 |
|
The VaR positions have evolved during 2010 and 2009 based on the maturity/initiation of operations throughout the year.
20. FINANCIAL INSTRUMENTS
20.1 Financial instruments, classified by nature and category
a) The detail of financial assets, classified by nature and category, as of December 31, 2010, and 2009, is as follows:
|
| December 31, 2010 |
| ||||||||||
|
| Financial Assets |
| Financial Assets at |
| Held-to- |
| Loans and |
| Available-for- |
| Hedge |
|
|
|
|
|
|
|
|
|
|
|
|
|
|
|
Equity Instruments |
| — |
| — |
| — |
| — |
| — |
| — |
|
Derivative Instruments |
| 17,551 |
| — |
| — |
| — |
| — |
| 64,518 |
|
Other Financial Assets |
| — |
| — |
| 7,735,440 |
| 1,058,569,847 |
| — |
| — |
|
Total Current |
| 17,551 |
| — |
| 7,735,440 |
| 1,058,569,847 |
| — |
| 64,518 |
|
|
|
|
|
|
|
|
|
|
|
|
|
|
|
Equity Instruments |
| — |
| — |
| — |
| — |
| 2,511,197 |
| — |
|
Derivative Instruments |
| 91,262 |
| — |
| — |
| — |
| — |
| 27,212,944 |
|
Other Financial Assets |
| — |
| — |
| 29,461,230 |
| 323,260,049 |
| — |
| — |
|
Total Non-Current |
| 91,262 |
| — |
| 29,461,230 |
| 323,260,049 |
| 2,511,197 |
| 27,212,944 |
|
|
|
|
|
|
|
|
|
|
|
|
|
|
|
Total |
| 108,813 |
| — |
| 37,196,670 |
| 1,381,829,896 |
| 2,511,197 |
| 27,277,462 |
|
|
| December 31, 2009 |
| ||||||||||
|
| Financial Assets |
| Financial Assets at |
| Held-to- |
| Loans and |
| Available-for- |
| Hedge |
|
|
|
|
|
|
|
|
|
|
|
|
|
|
|
Equity Instruments |
| — |
| — |
| — |
| — |
| — |
| — |
|
Derivative Instruments |
| 1,536,149 |
| — |
| — |
| — |
| — |
| — |
|
Other Financial Assets |
| — |
| — |
| — |
| 1,160,980,832 |
| — |
| — |
|
Total Current |
| 1,536,149 |
| — |
| — |
| 1,160,980,832 |
| — |
| — |
|
|
|
|
|
|
|
|
|
|
|
|
|
|
|
Equity Instruments |
| — |
| — |
| — |
| — |
| 2,512,716 |
| — |
|
Derivative Instruments |
| 732,253 |
| — |
| — |
| — |
| — |
| 2,238,039 |
|
Other Financial Assets |
| — |
| — |
| 24,548,711 |
| 195,442,451 |
| — |
| — |
|
Total Non-Current |
| 732,253 |
| — |
| 24,548,711 |
| 195,442,451 |
| 2,512,716 |
| 2,238,039 |
|
|
|
|
|
|
|
|
|
|
|
|
|
|
|
Total |
| 2,268,402 |
| — |
| 24,548,711 |
| 1,356,423,283 |
| 2,512,716 |
| 2,238,039 |
|
b) The detail of financial liabilities, classified by nature and category, as of December 31, 2010, and 2009, is as follows:
|
| December 31, 2009 |
| ||||||
|
| Financial Liabilities |
| Financial |
| Loans and |
| Hedge |
|
|
|
|
|
|
|
|
|
|
|
Interest-Bearing Loans |
| 6,582,907 |
| — |
| 711,528,525 |
| — |
|
Derivative Instruments |
| 420,822 |
| — |
| — |
| 8,441,901 |
|
Other Financial Liabilities |
| — |
| — |
| 1,093,916,171 |
| — |
|
Total Current |
| 7,003,729 |
| — |
| 1,805,444,696 |
| 8,441,901 |
|
|
|
|
|
|
|
|
|
|
|
Interest-Bearing Loans |
| 22,673,861 |
| 11,953,000 |
| 3,279,097,437 |
| — |
|
Derivative Instruments |
| — |
| — |
| — |
| 206,931,247 |
|
Other Financial Liabilities |
| — |
| — |
| 85,254,349 |
| — |
|
Total Non-Current |
| 22,673,861 |
| 11,953,000 |
| 3,364,351,786 |
| 206,931,247 |
|
|
|
|
|
|
|
|
|
|
|
Total |
| 29,677,590 |
| 11,953,000 |
| 5,169,796,482 |
| 215,373,148 |
|
20.2 Derivative instruments
The risk management policy of the Group establishes using interest rate and foreign exchange rate derivatives to hedge its exposure to interest rate and foreign currency risks.
The Company classifies its hedging relationships as follows:
· Cash flow hedges: Those that hedge the cash flows of the hedged underlying item.
· Fair value hedges: Those that hedge the fair value of the hedged underlying item.
· Non-hedge derivatives: Financial derivatives that do not meet the requirements established by IFRS to be designated as hedge instruments are recorded at fair value with changes in net income (assets held for trading).
a) Assets and liabilities for hedge derivative instruments
As of December 31, 2010, and 2009, financial derivative transactions that qualify as hedge instruments resulted in recognition of the following assets and liabilities in the statement of financial position:
|
| 12-31-2010 |
| 12-31-2009 |
| ||||||||||||
|
| Assets |
| Liabilities |
| Assets |
| Liabilities |
| ||||||||
|
| Current |
| Non-Current |
| Current |
| Non-Current |
| Current |
| Non-Current |
| Current |
| Non-Current |
|
|
|
|
|
|
|
|
|
|
|
|
|
|
|
|
|
|
|
Interest Rate Hedge: |
| 64,518 |
| 1,825,059 |
| 661,966 |
| 4,878,454 |
| — |
| 2,157,177 |
| 1,122,388 |
| 3,328,432 |
|
Cash Flow Hedge |
| 64,518 |
| 1,825,059 |
| 661,966 |
| 4,878,454 |
| — |
| 2,157,177 |
| 1,122,388 |
| 3,328,432 |
|
Fair Value Hedge |
| — |
|
|
|
|
|
|
| — |
| — |
| — |
| — |
|
Interest Rate Hedge: |
| — |
| 25,387,885 |
| 9,340,943 |
| 235,234,989 |
| — |
| 80,862 |
| 7,319,513 |
| 203,602,815 |
|
Cash Flow Hedge |
| — |
| 25,387,885 |
| 3,867,323 |
| 229,257,717 |
| — |
| 80,862 |
| 2,537,129 |
| 196,123,295 |
|
Fair Value Hedge |
| — |
| — |
| 5,473,620 |
| 5,977,272 |
| — |
| — |
| 4,782,384 |
| 7,479,520 |
|
TOTAL |
| 64,518 |
| 27,212,944 |
| 10,002,909 |
| 240,113,443 |
| — |
| 2,238,039 |
| 8,441,901 |
| 206,931,247 |
|
· General Information relating to hedge derivative instruments
Hedging derivative instruments and their corresponding hedged instruments are shown in the following table:
|
|
|
|
|
| 12-31-2010 |
| 12-31-2009 |
|
|
|
Detail of Hedge |
| Description of Hedge |
| Description of Hedged |
| Fair Value of Hedge |
| Fair Value of Hedge |
| Nature of Risks |
|
|
|
|
|
|
|
|
|
|
|
|
|
SWAP |
| Interest Rate |
| Bank Borrowings |
| (3,715,361 | ) | (3,225,872 | ) | Cash flow |
|
SWAP |
| Interest Rate |
| Unsecured obligations, (Bonds) |
| — |
| 1,617,247 |
| Cash flow |
|
SWAP |
| Exchange Rate |
| Bank Borrowings |
| (509,567 | ) | 80,862 |
| Cash flow |
|
SWAP |
| Exchange Rate |
| Bank Borrowings |
| (11,450,892 | ) | (12,261,904 | ) | Fair value |
|
SWAP |
| Exchange Rate |
| Unsecured obligations, (Bonds) |
| (207,163,070 | ) | (198,660,424 | ) | Cash flow |
|
COLLAR |
| Interest Rate |
| Bank Borrowings |
|
|
| (685,018 | ) | Cash flow |
|
For years 2010, 2009 and 2008, the Group had not recognized significant gains or losses for ineffective cash flow hedges.
The following table details the gain or losses recognized on the hedging instrument and on the hedged item attributable to the hedged risk:
|
| 12-31-2010 |
| 12-31-2009 |
| 12-31-2008 |
| ||||||
|
| Gain |
| Loss |
| Gain |
| Loss |
| Gain |
| Loss |
|
Hedging Instrument |
| 3,788,165 |
| — |
| — |
| 9,435,859 |
| — |
| 4,329,485 |
|
Hedged Item |
| — |
| 6,749,098 |
| 7,893,882 |
| — |
| 4,948,720 |
| — |
|
TOTAL |
| 3,788,165 |
| 6,749,098 |
| 7,893,882 |
| 9,435,859 |
| 4,948,720 |
| 4,329,485 |
|
b) Financial derivative instrument assets and liabilities at fair value with changes in net income
As of December 31, 2010, and 2009, financial derivative transactions recorded at fair value with changes in net income, resulted in the recognition of the following assets and liabilities in the statement of financial position:
|
| December 31, 2010 |
| December 31, 2009 |
| ||||||||||||
|
| Current |
| Current |
| Non-Current |
| Non-Current |
| Current |
| Current |
| Non-Current |
| Non-Current |
|
|
| ThCh$ |
| ThCh$ |
| ThCh$ |
| ThCh$ |
| ThCh$ |
| ThCh$ |
| ThCh$ |
| ThCh$ |
|
|
|
|
|
|
|
|
|
|
|
|
|
|
|
|
|
|
|
Non-hedging derivative instruments |
| 17,551 |
| — |
| 91,262 |
| — |
| 1,536,089 |
| 420,822 |
| 732,253 |
| — |
|
c) Other information on derivatives
The following tables set forth the fair value of hedging and non-hedging derivatives entered into by the Group as well as the remaining contractual maturities as of December 31, 2010 and 2009:
|
| December 31, 2010 |
| ||||||||||||||
|
| Notional Value |
| ||||||||||||||
Financial |
| Fair Value |
| Less than 1 |
| 1-2 Years |
| 2-3 Years |
| 3-4 Years |
| 4-5 Years |
| Subsequent |
| Total |
|
Interest Rate Hedge: |
| (3,650,843 | ) | 16,841,269 |
| — |
| 10,670,628 |
| 107,488,844 |
| 6,314,801 |
| 13,385,086 |
| 154,700,628 |
|
Cash Flow Hedge |
| (3,650,843 | ) | 16,841,269 |
| — |
| 10,670,628 |
| 107,488,844 |
| 6,314,801 |
| 13,385,086 |
| 154,700,628 |
|
Exchange Rate Hedge: |
| (219,188,046 | ) | 7,219,945 |
| 13,573,114 |
| — |
| 462,159,584 |
| 9,023,829 |
| 203,222,043 |
| 695,198,515 |
|
Cash Flow Hedge |
| (207,737,155 | ) | 7,219,945 |
| 4,680,100 |
| — |
| 462,159,584 |
| — |
| 203,222,043 |
| 677,281,672 |
|
Fair Value Hedge |
| (11,450,892 | ) | — |
| 8,893,014 |
| — |
| — |
| 9,023,829 |
| — |
| 17,916,843 |
|
Derivatives not designated for hedge accounting |
| 108,813 |
| 72,537 |
| — |
| — |
| — |
| — |
| — |
| 72,537 |
|
Total |
| (222,730,077 | ) | 24,133,751 |
| 13,573,114 |
| 10,670,628 |
| 569,648,428 |
| 15,338,630 |
| 216,607,129 |
| 849,971,680 |
|
|
| December 31, 2009 |
| ||||||||||||||
|
| Notional Value |
| ||||||||||||||
Financial |
| Fair Value |
| Less than 1 |
| 1-2 Years |
| 2-3 Years |
| 3-4 Years |
| 4-5 Years |
| Subsequent |
| Total |
|
Interest Rate Hedge: |
| (2,293,643 | ) | 39,094,718 |
| 26,127,883 |
| 26,392,796 |
| 3,187,503 |
| 117,499,266 |
| 1,563,664 |
| 213,865,830 |
|
Cash Flow Hedge |
| (2,293,643 | ) | 39,094,718 |
| 26,127,883 |
| 26,392,796 |
| 3,187,503 |
| 117,499,266 |
| 1,563,664 |
| 213,865,830 |
|
Exchange Rate Hedge: |
| (210,841,466 | ) | 6,791,682 |
| 6,431,553 |
| 11,188,708 |
| 1,857,687 |
| 268,355,058 |
| 200,498,983 |
| 495,123,671 |
|
Cash Flow Hedge |
| (198,579,562 | ) | — |
| — |
| 5,071,000 |
| — |
| 266,364,546 |
| 198,366,150 |
| 469,801,696 |
|
Fair Value Hedge |
| (12,261,904 | ) | 6,791,682 |
| 6,431,553 |
| 6,117,708 |
| 1,857,687 |
| 1,990,512 |
| 2,132,833 |
| 25,321,975 |
|
Derivatives not designated for hedge accounting |
| 1,847,520 |
| 91,970,309 |
| 31,945,255 |
| — |
| — |
| — |
| — |
| 123,915,564 |
|
Total |
| (211,287,589 | ) | 137,856,709 |
| 64,504,691 |
| 37,581,504 |
| 5,045,190 |
| 385,854,324 |
| 202,062,647 |
| 832,905,065 |
|
The hedging and non-hedging derivatives contractual maturities do not represent the total Group’s risks exposure, as the amounts set forth in the above tables have been drawn up based on undiscounted contractual cash inflows and outflows for their settlement.
20.3 Fair value hierarchies
Financial instruments recognized at fair value in the consolidated statement of financial position are classified based on the hierarchies described in Note 3.g.5. The following table details financial assets and liabilities measured at fair value as of December 31, 2010 and 2009.
|
|
|
| Fair Value Measured at End of Reporting Period using: |
| ||||
Financial Instruments Measured at Fair Value |
| 12-31-2010 |
| Level 1 |
| Level 2 |
| Level 3 |
|
Financial Assets |
|
|
|
|
|
|
|
|
|
Cash Flow Hedge Derivatives |
| 27,277,462 |
| — |
| 27,277,462 |
| — |
|
Fair Value Hedge Derivatives |
| — |
| — |
| — |
| — |
|
Derivatives not Designated for Hedge Accounting |
| 108,813 |
| — |
| 108,813 |
| — |
|
Available-for-Sale Financial Assets, Non-Current |
| 88,909 |
| 88,909 |
| — |
| — |
|
Total |
| 27,475,184 |
| 88,909 |
| 27,386,275 |
| — |
|
Financial Liabilities |
|
|
|
|
|
|
|
|
|
Cash Flow Hedging Derivatives |
| 238,665,460 |
| — |
| 238,665,460 |
| — |
|
Fair Value Hedging Derivatives |
| 11,450,892 |
| — |
| 11,450,892 |
| — |
|
Derivatives not Designated for Hedge Accounting |
| — |
| — |
| — |
| — |
|
Interest-Bearing Borrowings, Short-Term |
| 6,509,732 |
| — |
| 6,509,732 |
| — |
|
Interest-Bearing Borrowings, Long-Term |
| 15,171,516 |
| — |
| 15,171,516 |
|
|
|
Other non-current financial liabilities |
| 12,395,250 |
|
|
| — |
| 12,395,250 |
|
Total |
| 284,192,850 |
| — |
| 271,797,600 |
| 12,395,250 |
|
|
|
|
| Fair Value Measured at End of Reporting Period using: |
| ||||
Financial Instruments Measured at Fair Value |
| 12-31-2009 |
| Level 1 |
| Level 2 |
| Level 3 |
|
Financial Assets |
|
|
|
|
|
|
|
|
|
Cash Flow Hedge Derivatives |
| 2,238,039 |
| — |
| 2,238,039 |
| — |
|
Fair Value Hedge Derivatives |
| — |
| — |
| — |
| — |
|
Derivatives not Designated for Hedge Accounting |
| 2,268,342 |
| — |
| 2,268,342 |
| — |
|
Available-for-Sale Financial Assets, Non-Current |
| 88,838 |
| 88,838 |
| — |
| — |
|
Total |
| 4,595,219 |
| 88,838 |
| 4,506,381 |
| — |
|
Financial Liabilities |
|
|
|
|
|
|
|
|
|
Cash Flow Hedging Derivatives |
| 203,111,244 |
| — |
| 203,111,244 |
| — |
|
Fair Value Hedging Derivatives |
| 12,261,904 |
| — |
| 12,261,904 |
| — |
|
Derivatives not Designated for Hedge Accounting |
| 420,822 |
| — |
| 420,822 |
| — |
|
Other current financial liabilities |
| 6,582,907 |
| — |
| 6,582,907 |
| — |
|
Other non-current financial liabilities |
| 34,626,861 |
|
|
| 22,673,861 |
| 11,953,000 |
|
Total |
| 257,003,738 |
| — |
| 245,050,738 |
| 11,953,000 |
|
20.3.1 The following is the reconciliation between opening and closing balances for Level 3 fair value measurement of financial instruments:
Non-current interest-bearing loans |
| ThCh$ |
|
|
|
|
|
Balance at December 31, 2008 |
| 2,429,372 |
|
Total losses recognized in Finance Profit or Loss |
| 9,523,628 |
|
Balance at December 31, 2009 |
| 11,953,000 |
|
Total losses recognized in Finance Profit or Loss |
| 442,250 |
|
Balance at December 31, 2010 |
| 12,395,250 |
|
21. TRADE AND OTHER PAYABLES
Trade and other payables as of December 31, 2010, and 2009, is as follows:
|
| Current |
| Non-Current |
| ||||
Trade and other payables |
| 12-31-2010 |
| 12-31-2009 |
| 12-31-2010 |
| 12-31-2009 |
|
Trade payables |
| 305,079,295 |
| 341,167,159 |
| 4,477,313 |
| — |
|
Other payables |
| 919,410,703 |
| 638,739,193 |
| 32,759,399 |
| 68,909,402 |
|
Total |
| 1,224,489,998 |
| 979,906,352 |
| 37,236,712 |
| 68,909,402 |
|
The detail of Trade Accounts and other Payables as of December 31, 2010, and 2009 is as follows:
|
| Current |
| Non-Current |
| ||||
|
|
|
| One to Five Years |
| ||||
Trade and Other Payables |
| 12-31-2010 |
| 12-31-2009 |
| 12-31-2010 |
| 12-31-2009 |
|
Energy Suppliers |
| 417,786,845 |
| 326,840,301 |
| 5,565,832 |
| — |
|
Fuel and Gas Suppliers |
| 110,816,084 |
| 69,218,546 |
| — |
| — |
|
Payables for Goods and Services |
| 385,380,841 |
| 380,805,716 |
| 13,410,089 |
| 12,945,147 |
|
Dividends Payable to Third Parties |
| 154,811,729 |
| 116,022,795 |
| — |
| — |
|
Fines and Claims |
| 53,729,963 |
| 42,549,570 |
| — |
| — |
|
Research and Development |
| 33,202,794 |
| 10,815,336 |
| 1,895,349 |
| 7,427,918 |
|
Payables to Tax Institutions |
| 32,851,967 |
| 13,726,011 |
| 11,216,940 |
| 23,292,682 |
|
Mitsubishi Contract |
| 3,397,620 |
| — |
| 3,288,535 |
| 7,361,867 |
|
Social Programs Obligations |
| 1,122,119 |
| — |
| — |
| 5,348,256 |
|
Other accounts payable |
| 31,390,036 |
| 19,928,077 |
| 1,859,967 |
| 12,533,532 |
|
Total |
| 1,224,489,998 |
| 979,906,352 |
| 37,236,712 |
| 68,909,402 |
|
See Note 19.4 for the description of the liquidity risk management policy.
22. PROVISIONS
22.1 Provisions
a) The detail of provisions as of December 31, 2010, and 2009 is as follows:
|
| Current |
| Non-Current |
| ||||
Provisions |
| 12-31-2010 |
| 12-31-2009 |
| 12-31-2010 |
| 12-31-2009 |
|
|
|
|
|
|
|
|
|
|
|
Provision for Warranty |
| — |
| — |
| 2,821,692 |
| 2,875,372 |
|
Legal Proceedings Provision |
| 44,903,128 |
| 23,013,945 |
| 209,740,117 |
| 235,390,414 |
|
Decommissioning, Restoration and Rehabilitation Costs |
|
|
| — |
| 10,779,096 |
| 10,234,267 |
|
Energy and Capacity Purchases Provision |
| 4,318,563 |
| 20,226,885 |
| — |
| — |
|
Supplier and Services Provision |
| 26,183,409 |
| 9,716,326 |
| — |
| — |
|
Employee Benefits Provision |
| 31,935,562 |
| 33,739,527 |
| 1,201,357 |
| 1,128,270 |
|
Other provisions |
| 8,108,574 |
| 13,327,772 |
| 980,067 |
| 658,589 |
|
|
|
|
|
|
|
|
|
|
|
Total |
| 115,449,236 |
| 100,024,455 |
| 225,522,329 |
| 250,286,912 |
|
b) Movements in provisions as of December 31, 2010 and 2009 are as follows:
Movements in Provisions |
| Warranty |
| Legal |
| Decommissioning, |
| Other |
| Total |
|
Balance at January 1, 2010 |
| 2,875,372 |
| 258,404,359 |
| 10,234,267 |
| 78,797,369 |
| 350,311,367 |
|
Movements in Provisions |
|
|
|
|
|
|
|
|
|
|
|
Additional Provisions |
| — |
| 30,017,390 |
| — |
| 8,668,661 |
| 38,686,051 |
|
Increase (Decrease) in Existing Provisions |
| 37,506 |
| 26,663,407 |
| 563,12 |
| 5,321,740 |
| 32,585,773 |
|
Provisions Used |
| — |
| (21,169,685 | ) | — |
| (16,888,613 | ) | (38,058,298 | ) |
Unused Provisions Reversed |
| — |
| (32,025,516 | ) | — |
| -121,367 |
| (32,146,883 | ) |
Increase from Time Value of Money Adjustment |
| — |
| — |
| 56,434 |
| 53,791 |
| 110,225 |
|
Foreign Currency Translation |
| (91,186 | ) | (7,644,162 | ) | (74,726 | ) | (3,995,350 | ) | (11,805,424 | ) |
Other Increases (Decreases) |
| — |
| 397,452 |
| 1 |
| 891,301 |
| 1,288,754 |
|
Total Movements in Provisions |
| (53,680 | ) | (3,761,114 | ) | 544,829 |
| (6,069,837 | ) | (9,339,802 | ) |
Balance at December 31, 2010 |
| 2,821,692 |
| 254,643,245 |
| 10,779,096 |
| 72,727,532 |
| 340,971,565 |
|
Movements in Provisions |
| Warranty |
| Legal |
| Decommissioning, |
| Other |
| Total |
|
Balance at January 1, 2009 |
| 9,259,434 |
| 190,451,554 |
| 2,319,202 |
| 120,461,202 |
| 322,491,392 |
|
Movements in Provisions |
|
|
|
|
|
|
|
|
|
|
|
Additional Provisions |
| 906,083 |
| 83,456,936 |
| 8,145,666 |
| 6,800,178 |
| 99,308,863 |
|
Increase (Decrease) in Existing Provisions |
| -360,598 |
| 16,068,663 |
| -64,827 |
| 5,428,891 |
| 21,072,129 |
|
Acquisitions Through Business Combinations |
| — |
| (204,714 | ) | — |
| (2,728,637 | ) | (2,933,351 | ) |
Provisions Used |
| — |
| (18,558,588 | ) | — |
| (19,728,719 | ) | (38,287,307 | ) |
Unused Provisions Reversed |
| — |
| (18,722,980 | ) | — |
| (30,725,462 | ) | (49,448,442 | ) |
Increase from Time Value of Money Adjustment |
| — |
| 26,94 |
| 91,233 |
| 37,887 |
| 156,06 |
|
Foreign Currency Translation |
| 151,197 |
| 7,869,827 |
| (257,007 | ) | (7,603,706 | ) | 160,311 |
|
Other Increases (Decreases) |
| (7,080,744 | ) | (1,983,279 | ) | — |
| 6,855,735 |
| (2,208,288 | ) |
Total Movements in Provisions |
| (6,384,062 | ) | 67,952,805 |
| 7,915,065 |
| (41,663,833 | ) | 27,819,975 |
|
Balance at December 31, 2009 |
| 2,875,372 |
| 258,404,359 |
| 10,234,267 |
| 78,797,369 |
| 350,311,367 |
|
22.2 Lawsuits and arbitration proceedings
As of the date of preparation of these consolidated financial statements, the following are the most relevant lawsuits involving Enersis S.A. and its subsidiaries:
1. Law 25,561, known as Public Emergency and Reformation of Exchange Regime, enacted on January 6, 2002 by the Argentine authorities, rendered ineffective certain terms and conditions of the concession contract entered into by the subsidiary Edesur. In addition, this Law provided that concession contracts involving public services would have to be renegotiated over a reasonable term in order to adapt them to the new circumstances. However, the fact that the concession contract entered into by Edesur was not renegotiated prompted Enersis S.A., Chilectra S.A., Endesa Chile and Elesur S.A. (currently, Chilectra S.A.) to submit in 2003 a petition for arbitration in accordance with the Chilean-Argentine Treaty for Promotion and Protection of Investments, with the International Center for Resolution of Disputes involving Investments (known as CIADI). The filing put forward as main petition that the involved investments would be declared expropriated, with ensuing payment of damages totaling US$1,306,875,960. In the alternative, a payment of damages was requested, totaling US$318,780,600, based on the negative effects on claimants’ investments caused by a lack of fair and equal treatment; in both cases, subject to a compounded interest of 6.9% a year. In addition, the petition sought payment of the damages generated starting on July 1, 2004. Finally, it requested payment of US$102,164,683 to Elesur S.A. (currently, Chilectra S.A) for the loss it suffered in the sale of its shares. On June 15, 2005, the Argentine authorities and Edesur signed the documentation underlying a so-called “Acta de Acuerdo” (Written Agreement), which was not rejected by the Argentine parliament, and which was later ratified by the Executive branch of the Republic of Argentina. The Written Agreement sets forth terms and conditions that modify and supplement the concession contract, and establish changes in rates, first during a transitory period and then through a thorough rate review process aimed at laying down the conditions for rates for a 5-year period. Arbitration was suspended in March of 2006 in compliance with the Written Agreement. When suspended, arbitration had reached a stage at which the arbitral tribunal was required to notify the parties of its ruling on the matter of jurisdiction raised by the Republic of Argentina. The current suspension is the result of several extensions requested by the plaintiffs. Regarding the most recent extension, dated August 6, 2009, the arbitral tribunal had requested the parties to report on the status of the negotiation process envisaged in the Written Agreement. On August 12, 2009, the claimants answered this request and filed a petition seeking to extend the suspension of the arbitration process for an additional 12 months, beginning on the date of that filing. The Argentine Republic indicated that it did not oppose the extension of the suspension period requested by the claimants. On August 25, 2009, the Company received a communication from the arbitral tribunal, which agreed to maintain the suspension of the arbitration proceeding until August 12, 2010 at which time, the arbitral tribunal indicated it will request the parties to report on the status of the negotiation process in conformity with the Written Agreement. In a communication dated September 30, 2010, the arbitral tribunal requested a status report, which the claimants responded to by requesting a new 12 month extension on the suspension period. On October 13, 2010, the arbitral tribunal communicated its approval of the suspension of the proceeding until October 6, 2011. At the end of this period, the arbitral tribunal will request the parties involved to inform it regarding the status of negotiations in accordance with the Written Agreement.
On October 15, 2010, Robert Volterra, one of the arbitrators, submitted his resignation, which was accepted by the other two arbitrators. According to applicable law, plaintiffs must now assign a replacement for Mr. Volterra within a 45 day period starting with the date when the resignation was communicated. Nevertheless, on November 10, 2010, the plaintiffs requested the suspension of the proceeding with regard to the designation of the substitute for Robert Volterra, with which request the Argentine Republic agreed.
2. Meridional Servicios, Emprendimientos y Participaciones (hereinafter, “Meridional”) is a company whose only assets are the rights derived from litigation that it acquired from the construction companies Mistral and CIVEL, which had entered into a contract with Centrais Elétricas Fluminense S.A. (“CELF”) for the construction of civil works. This contract was cancelled by CELF prior to the privatization that gave rise to the Brazilian distribution subsidiary called Ampla. Since CELF’s assets were transferred to Ampla in the privatization process, in 1998 Meridional sued Ampla, alleging that such assets were transferred in violation of Meridional’s rights. It should be pointed out that Ampla only acquired assets from CELF, but is not
CELF’s legal successor, because CELF, a State-run company, continues to exist as a separate legal entity. The plaintiff seeks payment of outstanding invoices and contractual damages arising from the cancellation of civil construction contracts. The plaintiff is seeking payment in an amount estimated at US$430.31 million. The lower court ruling was in favor of Ampla and appealed by the plaintiff, which was granted. Ampla filed a new petition (“embargos de declaración”) with the objective of negating the previous decision and obtaining a new trial. On June 2, 2009, the courts ruled in favor of Ampla and annulled the resolutions issued in past proceedings dating back to April 4, 2009. According to the resolutions dated December 1, 2009 and December 15, 2009, the ruling that granted the relief sought by Meridional was amended and reformulated thereby maintaining the first ruling in favor of Ampla and the State of Rio de Janeiro. Against that decision, Meridional appealed again (via a embargo de declaracíon), which was ruled inadmissible on February 23, 2010. In May 2010, Meridional presented a new petition (embargo de declaracíon), against the aforementioned agreement, which was also declared inadmissible and Meridional was issued a warning that it would be penalized if it filed any future frivolous appeals. On May 28, 2010, Meridional presented a new petition (grievance procedure), which was unanimously rejected on June 8, 2010 and Meridional was assessed a fine equal to 1% of the value of the claim, since the petition was deemed groundless and delayed the trial. In July 2010, Meridional presented a new petition (embargo de declaracíon), which was not recognized. Against such decision, Meridional filed a new petition (regimental tort). On August 30, 2010, the Rapporteur decided to not admit the petition and determined that the petition be removed from the process. Moreover, the Rapporteur asked the tribunal secretary to discourage the admission of new petitions from Meridional as well as to issue a certificate called “transito em julgado” (res judicata) indicating that the matter has already been settled in court. Based on this decision, on September 13, 2010, Meridional filed a new petition (mandado de segurança (injunction).
3. During 2002 the Brazilian distribution subsidiary Ampla signed with Enertrade Comercializadora de Energía S.A. (“Enertrade”) a contract for the purchase of electricity lasting 20 years effective December 31, 2002. This contract was sent for evaluation and approval to Agencia Nacional de Energía Eléctrica (“ANEEL”), and ANEEL indicated that the price for energy would have to be lower. Based on that decision, Ampla paid for the contract the price authorized by ANEEL. However, in December 2005 Enertrade initiated an arbitration proceeding against Ampla with Cámara de Conciliación y Arbitraje de la Fundación Getúlio Vargas/RJ. On March 19, 2009 the arbitral tribunal issued a ruling that ordered Ampla: i) to pay the difference between the price set forth in the contract and the amount actually paid in the period from January 1, 2004 to August 28, 2006, adjusted and with interest; ii) to pay for October to December 2003 an updated price plus interest and a 2% penalty. In addition, the arbitral tribunal ruled that the contract had ended on August 28, 2006 and that Ampla owes nothing to Enertrade after that date. Ampla filed a petition seeking the annulment of the arbitration ruling, including a petition (“anticipación de tutela”) asking that execution of the arbitration ruling be suspended until a final ruling be passed in a pending trial of Enertrade vs. ANEEL (“mandato de seguridad”), where administrative approval of the same energy purchase contract taken to arbitration is being discussed. The amount involved is estimated at US$41.3 million. On May 22, 2009 the “anticipación de tutela” was granted, which suspended the effects of the arbitration ruling. On June 30, 2009 an Enertrade petition was rejected and the suspension was upheld. On July 9, 2009 an Enertrade petition (agravo de instrumento) against the ruling was rejected. On July 20, 2009 Enertrade filed another petition (agravo regimental) against the resolution that rejected the previous petition. On August 25, 2009 the petition (agravo regimental) filed by Enertrade was rejected. Ampla filed a response that included the lower court ruling passed in the trial (“mandado de seguranca”) of Enertrade vs. ANEEL (on July 7, 2009 a lower court ruling rejected Enertrade’s allegations). On September 2, 2009 a court order was sent to the CCEE (Cámara de Comercialización de Energía Eléctrica) informing it of the “anticipación de tutela” so that the CCEE would suspend the execution of the arbitration ruling until a final decision is passed on the annulment petition. On September 28, 2009 the ruling passed in the trial between Enertrade vs. ANEEL became final —a ruling that indicated that the parties were obligated to add to the contract the conditions imposed by ANEEL (the price reduction). On November 11, 2009 both parties filed a joint petition requesting suspension of proceedings for 30 days and in December they requested the continuation of that suspension. On March 17, 2010, the parties requested the termination of the suspension period as the parties could not reach an agreement. On June 2, 2010, the courts ruled favorably towards Ampla on the petition filed by Enertrade (“Agravo de Instrumento”) (instrumental grievance). As a result of the arbitration, ANEEL approved the agreement (“Termo Aditivo”) between Ampla and Enertrade that adjusts the power purchase agreement. The lower court judge convened a conciliation hearing on September 13, 2010. On August 2, 2010, Enertrade filed a new petition (embargo de declaración) with the
Court of Justice seeking reversal of the lower court ruling. On August 26, 2010, the Court of Justice confirmed the lower court ruling in favor of Ampla. However, Enertrade can present an appeal to the Superior Courts of Brasilia. On September 10, 2010, Ampla and Enertrade requested a new suspension of the process for 90 days to resume negotiations and implement the agreement. The Court adjourned, without setting a date, the conciliation hearing previously set for September 13, 2010.
4. Companhia Brasileira de Antibióticos (“CIBRAN”) sued the Brazilian distribution subsidiary Ampla seeking payment of damages for loss of products and raw materials and break-down of machinery, among other things, which allegedly was caused by Ampla’s poor service between 1987 and May 1994. CIBRAN is also seeking payment of punitive damages. The amount involved is estimated at approximately US$45.7 million. The lawsuit was added to six other proceedings whose foundation is disruption of energy. On June 21, 2010, the judge required the parties and their technical advisors to comment on the expert’s report and granted a 30 (thirty) day period for this event. The expert’s report was unfavorable towards Ampla. Consequently, on August 27, 2010, Ampla challenged the report pointing out contradictions in the report and requesting the annulment of the expert’s report or questioning of the expert by the Company’s technical advisors.
5. On October 26, 2009 Tractebel Energía S.A. sued CIEN for alleged failure to perform the agreement called “Purchase and Sale of 300 MW of firm capacity with associated energy from Argentina” (Contrato de Compra y Venta de 300 MW de Potencia firme con energia asociada proveniente de Argentina) entered into in 1999 by and between CIEN and Centrais Geradoras do Sul do Brazil S.A (Gerasul — currently, Tractebel Energia S.A.). Tractebel Energia S.A. is asking the court to order CIEN to pay a penalty of R$ 117,666,976.00 (US$ 70,880,000) plus other fines, for non-availability of “firm capacity and associated energy”, and it asks the court to determine those other fines in the ruling. Non-performance by CIEN was alleged to occur because of the failure of CIEN to guarantee to Tractebel the availability of the firm energy power capacity that was contractually guaranteed to Tractebel, which would allegedly have occurred since March of 2005. On November 27, 2009 CIEN answered the lawsuit, arguing that the non-availability of energy was caused by the “Argentine crisis”, since Argentina is the country from which CIEN imports all the energy that it delivers, when needed, to Tractebel Energia S.A. The defendant also alleges that the “Argentine crisis” was an unexpected event, for which CIEN has no responsibility, and that this situation was even acknowledged by the Brazilian authorities of that period. On April 9, 2010, CIEN presented to the court a written statement regarding the reply submitted by Tractebel. The lawsuit is currently in the lower court and at an initial stage. On September 1, 2010, the lawsuit was sent to the judge for him to decide whether to grant a motion (despacho saneador) to conclude the parties’ pleadings and initiate the investigation/production of evidence.
6. Lawsuit filed by Fumas Centrais Eletricas S.A. (“Fumas”) and notified on June 15, 2010 based on alleged breach of CIEN’s power purchase Agreement N° 12,399 for the purchase of 700MW of capacity with energy originating from Argentina. Under the agreement, which was signed on May 5, 1998, CIEN commits itself to purchase energy from the Argentina’s electricity wholesale market (Mercado Eléctrico Mayorista de la República Argentina hereinafter “MEM”) and transport it from the Argentine electric system (Sistema Eléctrico Argentino) to the Brazilian transmission interconnection system (Sistema de Transmissao de Interligacao) at the Itá substation. The contract has a 20 year term effective June 21, 2000. On April 11, 2005, CIEN informed Fumas that it will not be able to fulfill the agreement due to events beyond its control, regarded as force majeure. On April 14, 2005, Fumas notified CIEN that it would reject CIEN’s force majeure claim. Fumas is requesting the courts order CIEN to pay a R$520,280,659 (US$313.42 million) fine contemplated in the contract in case of rescission, as adjusted plus interest from the date of filing of the claim until actual payment, as well as other penalties based on the lack of availability of the contracted capacity, and other charges to be determined upon the issuance of the final verdict. CIEN replied on July 28, 2010. Fumas answered on August 26, 2010. On October 4, 2010, the judge ruled that the trial is at a stage when the parties need to present their evidence. On October 25, 2010, CIEN proposed the courts the production of additional documentary proof without any need at this time to specify what documents would be presented, which will occur during a future phase.
7. In December, 2001 the article of the Federal Constitution, on which our Brazilian distribution subsidiary, Ampla, relied to argue it was not required to pay certain taxes (COFINS, Contribuição para o Financiamento da Seguridade Social) and pursuant to which Ampla did not pay tax, was amended. There is an article of the Constitution stating that legislative changes come into force 90 days after their publication. Based on that, Ampla began to pay the COFINS only as of April, 2002. However, the Brazilian Tax Authorities argue that this article of the Constitution only applies to changes in laws, but not to the Constitution itself, whose changes come into force immediately. Furthermore, the Tax Authorities argue that, by reason of the change in Ampla’s tax status (from earned to accrued) the taxable amount of the COFINS increased during the first semester of 2002. Notice was given of the proceedings in July 2003. The first appealable decision was decided against Ampla, and it filed an appeal in October, 2003. In November 2007, the appeal was ruled on by the court of appeals and the decision was partly favorable to the Treasury in terms of the period in which a change in the Constitution comes into force and partly favorable to Ampla in terms of the change in the tax status from earned to accrued. In April, 2008, the Ministry of the Treasury filed an appeal against this decision in the Higher Court of Appeals. In October, 2008, Ampla filed its answer to the appeal and also filed an appeal with the Higher Court to attempt to change that part of the decision that was not favorable to Ampla. In May, 2009, the Federal Treasury (Hacienda Pública Federal) applied interest to the fine imposed. This new interest arises from an internal administrative act (addressed to the tax authorities but for general application) of the tax authorities and has started to be applied uniformly by the Federal Treasury (SRF). The interest on the fine has been calculated by applying the Selic (Special System of Liquidation and Custody: an adjustment index set by the federal government based on the referential interest rate of the Brazilian Central Bank), as of the month after receiving the Record of Infringement. Consequently, since the Record was received in July, 2003, the Selic corresponds to the interest accumulated as of August 2003, which is 81.42%. In August, 2009, Ampla was notified that the Special Appeal filed by the company had not been admitted to be heard. Ampla filed another appeal against this resolution with the President of the Higher Court for hearing Tax Issues. The purpose of this appeal is for the Special Appeal to be received. The decision on the Special Appeal filed by the SRF is pending. The appeal filed by Ampla with the President of the Higher Court for Tax Issues is also pending resolution. The amount involved is US$95.63 million.
8. In 1998, our Brazilian distribution subsidiary Ampla issued FRNs (bonds) for US$350 million maturing in 2008 in order to finance its investment in Coelce. Such bonds were purchased by Cerj Overseas (a foreign subsidiary of Ampla). The bonds had a special tax treatment according to which no withholding tax (15% or 25%) would be applied to payments of interest abroad, provided that, among other requirements, there was no advanced amortization before the average 96 month amortization deadline. Cerj Overseas obtained financing through a 6-month loan outside Brazil to acquire the bonds. At the end of that period (October 1998), due to problems in obtaining other sources of financing, Cerj Overseas had to obtain re-financing from Ampla, which provided Cerj Overseas with loans in reales. The Brazilian tax authorities argue that the special tax treatment was lost in 1998 because the loans in reales made by Ampla to Cerj Overseas were the equivalent of an advanced amortization of the debt before the 96 month amortization deadline. A Record of Infringement was notified in July 2005. In August, 2005, Ampla filed an appeal with the lower administrative court of appeal and such appeal was rejected. In April 2006, an appeal was filed with the Council of Taxpayers, the intermediate administrative court (Consejo de Contribuyentes). In December, 2007, the Council of Taxpayers ruled completely in favor of Ampla. In January of 2010, Ampla was notified of this favorable decision by the Council of Taxpayers as well as the appeal filed by Hacienda Pública. In February 2010, Ampla presented its arguments against the appeal filed by the tax authorities. The amount of this lawsuit is US$430.35 million.
9. In 2002, the State of Rio de Janeiro (“RJ”) issued a decree stipulating that the ICMS (Imposto sobre operações relativas à circulação de mercadorias e sobre prestações de serviços de transporte interestadual, intermunicipal e de comunicação) should be calculated and paid on the 10th, 20th, and 30th days of the same month of the accrual. Due to cash problems, our Brazilian distribution subsidiary Ampla continued to pay the ICMS in accordance with the previous system (payment on the 5th of the month following its accrual). In October 2004, and notwithstanding the existence of an informal agreement with RJ and two separate amnesty laws, RJ notified Ampla of a resolution to collect a fine on late payments. Such resolution was appealed by Ampla in that same year. In February 2007, Ampla was notified of the administrative decision that ratified the fine imposed by RJ. In March 2007, Ampla filed an appeal with the Council of Taxpayers, the intermediate administrative court (Consejo de Contribuyentes). Ampla obtained a temporary
ruling (liminar) in its favor, allowing it to file the appeal without the need to make a deposit or post a bond to guarantee 30% of the adjusted amount of the fine. On August 26, 2010, Ampla received notification that the Council of Taxpayers decided against it. Afterwards, on September 1, 2010, Ampla presented a new appeal to the Full Council (Consejo Pleno, special body of the Council of Taxpayers) to reverse the decision of the Council of Taxpayers. Ampla is currently awaiting the decision from the Full Council. The amount of the lawsuit is US$ 97.67 million.
10. Towards the end of 2002, our Brazilian generating subsidiary CGTF filed a petition against the Federal Union seeking to classify the goods imported for the turbo-generator units as corresponding to the item “Other Generating Sets”, in order to be able to avail itself of the 0% rate for Import Tax (II) and for the Tax on Industrialized Products (IPI). The Federal Union argues that the imported goods do not correspond to “Other Generating Sets”. CGTF obtained an incidental resolution in its favor allowing it to clear the goods through customs with a 0% rate, subject to a prior legal deposit of R$56 million (US$35.72 million, updated at July 2009). Also, to avoid expiration of the taxes, the Brazilian federal tax authorities issued a record of tax enforcement that was suspended until the pending lawsuit against the Federal Union is resolved. In September of 2008, the lower court issued a ruling favorable to CGTF. The ruling recognized the classification of the turbo-generator units in accordance with CGTF’s original classification and determined that the judicial deposit should remain as a guarantee until a final decision is reached. In February 2009, the Brazilian federal tax authorities filed an appeal with the Regional Federal Court (Tribunal Regional Federal or “TRF”). In May of 2010, the TRF also ruled in favor of CGTF thereby confirming the decision of the lower court in favor of CGTF and rejecting the appeal filed by the Brazilian tax authorities. This decision became final as the Brazilian tax authorities did not file any appeal with the superior courts. In September 2009, the temporary resolution that allowed CGTF to clear the goods through customs with a 0% tax rate subject to a legal deposit was confirmed. In October 2009, the decision which confirmed the first ruling in favor of CGTF was published. In November 2009, the Brazilian tax authorities presented a special petition (embargos de declaracion) against such resolution which was resolved in favor of CGTF. In March 2010, the Brazilian tax authorities filed a special petition against such decision in the Supreme Court of Justice in Brazilia. In administrative proceedings regarding the tax enforcement issued by the Brazilian tax authorities to avoid expiration of the taxes, the lower administrative court ruled in favor of CGTF because the record of enforcement (Acta) was declared null and void. The decision is based on the fact that the record of enforcement was issued without taking into consideration the proper legal requirements and formalities. As this resolution was based on formalities (rather than on substantive matters), there is the theoretical possibility for the Brazilian tax authorities to issue another record that meets the formal requirements, for which there is no specific deadline. In October 2008, the Council of Taxpayers, the intermediate court of administrative appeal, completely ratified the decision by the lower court confirming that the record of enforcement issued by the Brazilian federal tax authorities was null and void due to formal flaws. In April 2009, such decision became final and therefore the record is now extinct. The lawsuit is currently pending resolution of a petition submitted by the Brazilian tax authorities to the Supreme Court of Justice in Brasilia. The amount involved is US$43.92 million.
11. In 2005, three lawsuits were filed against Endesa Chile, the Treasury (Fisco) and the General Water Board (Direccion General de Aguas or DGA), which are currently being treated as a single proceeding. The lawsuits request the annulment of DGA Resolution 134 that gave Endesa the right to non-consumptive use of water for the Neltume Hydroelectric Power Plant project. The lawsuits also request compensation for damages. Alternatively, the lawsuit requests compensation for damages allegedly caused to the plaintiffs by the loss of quality of their properties on the shores of Lake Pirehueico and by the loss in value of their properties. The defendants, including Endesa Chile, have rejected these allegations on the grounds that, among other arguments, the DGA Resolution 134 meets all legal requirements and the exercise by Endesa Chile of this right does not cause any damages to the plaintiffs. At this date, the proceeding is at the stage of receiving evidence by the parties. The amount related to these lawsuits is undetermined.
12. There were five proceedings initiated between 2008 and 2009 against Pangue S.A., a subsidiary of Endesa Chile, where the plaintiffs seek compensation for losses incurred by flooding that, according to the plaintiffs, was caused by the operation of the Pangue S.A. hydroelectric power plant during July 2006. Pangue S.A. responded to such lawsuits arguing that it was in compliance with existing regulations in the operation of the power plant and that it acted with due diligence and care. Consequently, Pangue S.A. claims that there is no causal relationship between the flooding and the operation of the power plant during
the relevant period. These proceedings were filed in various courts and currently one of them is close to being resolved and two of them are at the discovery stage. In one of the two remaining proceedings, the courts ruled in favor of Pangue S.A., and currently there are pending appeals filed with the court of appeals by the plaintiffs. The remaining proceeding is no longer in effect due to inactivity by the plaintiffs. The amount claimed in the four proceedings that are still in effect is equal to ThCh$ 17,718,704 (US$ 37.86 million) in the aggregate. As for the proceeding that was closed, it entailed ThCh$ 1,916,466 (US$ 4 million) and is not covered in terms of equity risk by an insurance company. The potential damages arising from the four proceedings that are in effect are covered by insurance.
13. During 2010, several plaintiffs initiated four judicial proceedings against Endesa Chile seeking compensation for flooding of the Bio Bio river in the VIII Region. In these proceedings, the plaintiffs blame the company for losses attributed to the poor operation of the Ralco hydroelectric power plant during the flooding. In one of the proceedings, the lawsuit also includes the Public Works Ministry (“MOP”). In November 2010, the plaintiff withdrew the claim against Endesa but decided to continue it against MOP. The remaining lawsuits are currently in evidentiary hearing. The plaintiff has the burden to prove causation between the operation of the Ralco hydroelectric plant and the flooding during the period in question (i.e., that the flooding was caused by poor operation of the plant). The amount of the three proceedings that are currently in effect against Endesa Chile equals ThCh $ 14,610,043 (US$ 31.21 million). The proceeding against Endesa Chile that was dismissed by the plaintiff amounted to ThCh$33,751,490 (US$72.11 million). All of the risks arising from these proceedings are covered by an insurance policy.
14. In July and September of 2010, Ingeniería y Construcción Madrid S.A. and Transportes Silva y Silva Limitada, filed separate lawsuits against Endesa Chile and the Dirección General de Aguas (“DGA”), to nullify and void the administrative resolution that granted to Endesa Chile use of the water rights for the Neltume hydroelectric plant, and the administrative resolution that authorized the transfer of the collection point of such rights. The goal of the plaintiffs is to obtain payment for their water rights that are located in an area of the hydraulic works of the future Neltume hydroelectric power plant. Endesa Chile has rejected the claims, arguing that the plaintiffs are attempting to unlawfully litigate to prevent the construction of the plant in order to obtain compensation. The discussion period in the proceeding initiated by Ingeniería y Construcción Madrid S.A has expired and Endesa Chile has responded to the lawsuit in the proceeding initiated by Transportes Silva y Silva Limitada. The amount involved in these proceedings are undetermined.
15. In 2001, the inhabitants of Sibaté, Department of Cundinamarca filed a claim against the Colombian generating subsidiary Emgesa S.A. ESP., Empresa de Energía de Bogotá S.A. ESP. and the Corporación Autónoma Regional seeking joint and several damages caused by the pollution of the El Muña reservoir by pumping of polluted water from the Bogotá river by Emgesa S.A. ESP. Emgesa responded that it is not liable for these damages, arguing, among other things, that it receives already polluted water. The total amount of the lawsuit equals ThCPs 3,000,000,000 (US$1,547.72 million). Emgesa S.A. ESP. petitioned to have approximately 80 public and private entities that discharge into the Bogotá River and that have responsibility for the environmental management of this river basin to be brought into the lawsuit. Therefore, the case file (expediente) was sent to the State Council (Consejo de Estado) and the public and private entities have filed petitions in opposition. On June 29, 2010 the parties were notified of a motion filed by one of the plaintiffs that seeks to declare the Cundinamarca Administrative Court’s rulings for the period after August 1, 2006 null and void. This request is based on the argument that the court lacks jurisdiction over this proceeding since according to Law 472 of 1998, the Administrative Circuit Courts are the relevant courts to hear class actions. Emgesa rejected such annulment request. The proceedings will be reassigned to Magistrate Olga Valle de la Hoz who is among the new magistrates that are in compliance with Law 1285.
16. In 2001, the tax authority in Peru, SUNAT, issued certain tax and penalty resolutions questioning the depreciation of Edegel’s revalued assets. In January of 2002, Edegel filed a petition (recurso de reclamacion) against these resolutions, which was declared without merit by the SUNAT. Edegel filed an appeal before the Tribunal Fiscal de la Nación (National Tax Tribunal), which ruled in favor of Edegel in 2004, confirming (i) Edegel’s right to depreciate the greater value of the asset based on the fact that Edegel had an agreement for legal stability (convenio de estabilidad jurídica), and (ii) the non-application of Rule VIII of the Internal Revenue Code as there was no fraud. The resolution provided that SUNAT must ensure
that the revaluation of the assets was not done at an amount greater than market value. From that date, Edegel has received several notices from SUNAT for determination of the revaluation surplus and the tax amount owed. In January 2006, a complaint and appeal were filed against the resolution of SUNAT before the Tribunal Fiscal de la Nación, the ruling of which is pending. The amount of these claims equals approximately US$ 45.43 million.
The Management of Enersis S.A. considers that the provisions recorded in the Consolidated Financial Statements adequately cover the risks of the litigation described in this note, so such litigation is not expected to give rise to any additional liabilities to those recorded.
Given the characteristics of the risks covered by these provisions, a reasonable schedule of dates of payment, if any, cannot possibly be determined.
23. PROVISIONS FOR EMPLOYEE BENEFITS
23.1 General information:
Enersis S.A. and certain of its subsidiaries in Chile, Brazil, Colombia, and Argentina sponsor various post-employment benefits for all qualifying employees. These benefits are calculated and recorded in the financial statements according to the criteria described in Note 3.l.1., and include the following employee benefits:
a) Defined benefits plans:
· Complementary pension: The beneficiary is entitled to receive a monthly amount that supplements the pension obtained from the respective social security system.
· Staff severance indemnities: The beneficiary receives a certain number of contractual salaries upon retirement. Such benefit is subject to a vesting minimum service requirement period, which depending on the company, varies within a range between 5 to 15 years.
· Electric supply: The beneficiary receives a monthly amount to cover a portion of his/her billed residential electricity consumption.
· Health benefit: The beneficiary receives additional health coverage to that entitled by his/her social security regime.
b) Defined contribution benefits:
The Group makes contributions to a retirement benefit plan where the beneficiary receives additional pension supplements for his/her retirement, disability, or death.
23.2 Details, movements and financial statement presentation:
a) The post-employment obligations associated with defined benefits plans and the related assets plan as of December 31, 2010 and 2009 is detailed as follows:
The amounts included in the consolidated statement of financial position are the following:
|
| Balance at |
| ||
|
| 12-31-2010 |
| 12-31-2009 |
|
|
| ThCh$ |
| ThCh$ |
|
|
|
|
|
|
|
Post-Employment Benefit Obligation, Current |
| 5,450,382 |
| 4,915,167 |
|
Post-Employment Benefit Obligation, Non-Current |
| 215,818,975 |
| 182,688,990 |
|
Total |
| 221,269,357 |
| 187,604,157 |
|
(-) Surplus of plan assets (*) |
| (3,352,698 | ) | — |
|
|
|
|
|
|
|
Total post-employment obligatins, net |
| 217,916,659 |
| 187,604,157 |
|
(*) Corresponds to the excess of the fair value of plan assets over the present value of the defined benefit obligation in the subsidiary Coelce. This amount has been presented within “Other financial assets” (see Note 6).
The amount included in the statement of financial position arising from the Group´s obligation in respect of its defined benefit plans were as follows:
|
| 12-31-2010 |
| 12-31-2009 |
|
|
|
|
|
|
|
Present value of defined benefit obligations |
| 554,990,745 |
| 510,334,175 |
|
(-) Fair value of Plan Assets (*) |
| (377,239,859 | ) | (362,690,337 | ) |
|
|
|
|
|
|
Total |
| 177,750,886 |
| 147,643,838 |
|
|
|
|
|
|
|
Amount Not Recognised as an Asset |
| 31,425,234 |
| 31,876,650 |
|
Minimum Funding Requirement (IFRIC 14) (**) |
| 11,527,032 |
| 10,233,447 |
|
Transfer to Disposal Groups Held for Sale (***) |
| (2,786,493 | ) | (2,149,778 | ) |
|
|
|
|
|
|
Post-Employment Benefit Obligations Total |
| 217,916,659 |
| 187,604,157 |
|
(*) Plan assets to fund defined benefit plans in our Brazilian subsidiaries (Ampla and Coelce) the remaining defined benefit plans in our other subsidiaries are unfunded.
(**) The Brazilian subsidiaries are subject to minimum funding requirements of contributions that must be made to a plan over a given period, in accordance with IFRIC 14. The administration has estimated that only 26.75% will be recovered.
(***) Corresponds to defined benefit obligations in our subsidiaries CAM and Synapsis classified as held for sale (see Note 11).
b) The reconciliation of opening and closing balances of the present value of the defined benefit obligation as of December 31, 2010 and 2009 is as follow:
Present Value of Post-Employment Benefit Obligations |
| ThCh$ |
|
Opening Balance at January 1, 2009 |
| 443,320,261 |
|
Current Service Cost |
| 5,138,692 |
|
Interest Cost |
| 51,679,594 |
|
Actuarial (Gains) Losses |
| 35,705,096 |
|
Foreign Currency Translation |
| 11,423,745 |
|
Benefits Paid |
| (44,397,635 |
|
Business Combinations (*) |
| 7,464,422 |
|
|
|
|
|
Balance at December 31, 2009 |
| 510,334,175 |
|
|
|
|
|
Current Service Cost |
| 4,455,159 |
|
Interest Cost |
| 52,703,379 |
|
Contributions by plan participants |
| 1,461,694 |
|
Actuarial (Gains) Losses |
| 48,675,226 |
|
Foreign Currency Translation |
| (15,843,247 | ) |
Benefits Paid |
| (46,795,641 | ) |
|
|
|
|
Closing Balance at December 31, 2010 |
| 554,990,745 |
|
(*) Balance arising on business combination occurred on February 25, 2009 (see Note 14.1).
As of December 31, 2010, out of the total amount of post-employment benefit obligations a 6.4% (7.1% in 2009) relates to defined benefit plans from Chilean companies; a 79.1% (76.3% in 2009) relates to defined benefit plans from Brazilian companies; a 14.1% (16.2% in 2009) relates to defined benefit plans from Colombian companies and; a 0.4% (0.4% in 2009) relates to defined benefit plans from one Argentine companies.
c) Movements in the present value of the plan assets in the periods presented were as follows:
Fair Value of Plan Assets |
| ThCh$ |
|
Balance at January 1, 2009 |
| (264,762,082 | ) |
Expected Return |
| (32,050,585 | ) |
Actuarial (Gains) Losses |
| (60,896,738 | ) |
Foreign Currency Translation |
| (21,040,531 | ) |
Contributions |
| (15,488,990 | ) |
Benefits Paid |
| 31,548,589 |
|
Balance at December 31, 2009 |
| (362,690,337 | ) |
Expected Return |
| (41,253,550 | ) |
Actuarial (Gains) Losses |
| (2,416,269 | ) |
Foreign Currency Translation |
| 12,205,535 |
|
Contributions |
| (15,530,103 | ) |
Benefits Paid |
| 32,444,865 |
|
|
|
|
|
Balance at December 31, 2010 |
| (377,239,859 | ) |
The amounts included in the fair value of plan assets for equity instruments of the Group’s own financial instruments and for property occupied by the Group are as follows:
|
| 12-31-2010 |
| 12-31-2009 |
|
|
|
|
|
|
|
Equity instruments |
| 7,526,454 |
| 8,448,047 |
|
Real estate |
| 2,044,062 |
| 1,722,538 |
|
|
|
|
|
|
|
Total |
| 9,570,516 |
| 10,170,585 |
|
d) The major categories of plan assets at the end of each reporting period are as follows:
|
| 12-31-2010 |
| 12-31-2009 |
| ||||
Category of Plan Assets |
| ThCh$ |
| % |
| ThCh$ |
| % |
|
Equity instruments (variable income) |
| 65,913,747 |
| 18 | % | 67,097,712 |
| 19 | % |
Fixed Income Assets |
| 283,356,040 |
| 75 | % | 264,763,946 |
| 73 | % |
Real Estate Investments |
| 23,748,294 |
| 6 | % | 25,388,324 |
| 7 | % |
Other |
| 4,221,778 |
| 1 | % | 5,440,355 |
| 1 | % |
Total |
| 377,239,859 |
| 100 | % | 362,690,337 |
| 100 | % |
The expected rate of return of the plan assets has been estimated considering the projections for financial markets of fixed and variable income instruments, and assuming that asset categories will have a similar weighing from that of the prior year. The return on plan assets was 12.90% and 19.77% as of December 31, 2010 and 2009, respectively.
e) The total expense recognized in profit or loss in respect of the defined benefit plans as of December 31, 2010, 2009 and 2008, are as follows:
Expense Recognized in Profit or Loss |
| 12-31-2010 |
| 12-31-2009 |
| 12-31-2008 |
|
Current Service Cost |
| 4,455,159 |
| 5,138,692 |
| 4,072,922 |
|
Interest Cost |
| 52,703,379 |
| 51,679,594 |
| 47,749,152 |
|
Expected Return on Plan Assets |
| (41,253,550 | ) | (32,050,585 | ) | (33,741,755 | ) |
|
|
|
|
|
|
|
|
Expense Recognized in Profit or Loss |
| 15,904,988 |
| 24,767,701 |
| 18,080,319 |
|
Actuarial (Gains) and Losses |
| 48,495,375 |
| 15,599,453 |
| 34,060,925 |
|
Total Expense Recognized in Profit or Loss |
| 64,400,363 |
| 40,367,154 |
| 52,141,244 |
|
23.3 Other disclosures:
· Actuarial Assumptions:
As of December 31, 2010 and 2009 the following assumptions were used in the actuarial calculation of defined benefits:
|
| Chile |
| Brazil |
| Colombia |
| Argentina | ||||||||
|
| 12-31-2010 |
| 12-31-2009 |
| 12-31-2010 |
| 12-31-2009 |
| 12-31-2010 |
| 12-31-2009 |
| 12-31-2010 |
| 12-31-2009 |
|
|
|
|
|
|
|
|
|
|
|
|
|
|
|
|
|
Discount Rates Used |
| 6.50% |
| 6.50% |
| 10.50% |
| 10.80% / 11.50% |
| 9.52% |
| 11.59% |
| 16.80% |
| 13.94% |
Expected Return on Plan Assets |
| N/A |
| N/A |
| 12.90% / 13.41% |
| 11.28% / 13.02% |
| N/A |
| N/A |
| N/A |
| N/A |
Expected Rate of Salary Increases |
| 3.00% |
| 3.00% |
| 4.50% |
| 5.77% / 6.59% |
| 4.51% |
| 6.48% |
| 11.30% |
| 8.00% |
Mortality Tables |
| RV-2004 / RV-85 |
| RV-2004 / RV-85 |
| AT 2000 |
| AT-83/AT-49 |
| RV- 08 |
| ISS 1980-1989 |
| CSO 1980 |
| CSO 1980 |
· Sensitivity:
As of December 31, 2010, the sensitivity of the value of the actuarial liability for post-employment benefits to variations of 100 basis points in the discount rate assumes a decrease of ThCh$ 48,202,624 (ThCh$ 40,456,334 as of December 31, 2009) if the rate rises and an increase of ThCh$ 56,462,882 (ThCh$ 47,466,911 as of December 31, 2009) if the rate falls.
· Future disbursements:
The Group expects to make a contribution of ThCh$ 5,450,382 to the defined benefit plans during the next financial year.
· Defined contribution:
The total expense recognized in the consolidated statement of comprehensive income within line item “Employee expenses” represents contributions payables to the defined contribution plans by the Group. As December 31, 2010, 2009 and 2008 the amounts recognized as expenses were ThCh$ 1,382,818, ThCh$ 2,132,317 and ThCh$ 1,697,800 respectively.
24. EQUITY
24.1 Equity attributable to the parent company´s owners
24.1.1 Subscribed and paid capital and number of shares
The share capital as of December 31, 2010 and 2009 was ThCh$ 2,824,882,835 and is divided into 32,651,166,465 fully subscribed and paid no par value shares listed at the Bolsa de Comercio de Santiago de Chile, Bolsa Electrónica de Chile, Bolsa de Valores de Valparaíso, New York Stock Exchange (NYSE), and Bolsa de Valores Latinoamericanos de la Bolsa de Madrid (LATIBEX). There has been no change in the numbers of shares during the years 2010 and 2009.
Capital contributions made in 1995 and 2003 resulted in share premiums amounting to ThCh$ 125,881,577 and ThCh$ 32,878,071, respectively. The Chilean Companies Law permits the use of the share premium account balance to increase capital and does not establish any specific restrictions as to its use.
24.1.2 Dividends
The Company’s Board of Directors, at the Board Meeting held on March 25, 2009 agreed to propose to the General Shareholders Meeting the distribution of a final dividend equivalent to 35.27% of the net income of year 2008, at Ch$ 6.1 per share.
The proposal above modified the dividends policy for the year 2008 which considered a proposed final dividend distribution equivalent to 70% out of the total net income, which was reported as a Material Event on March 25, 2009.
At the Board Meeting held on February 26, 2010 , the Board agreed to propose to the General Ordinary Shareholders’ Meeting to be held on April 22, 2010, the distribution of a final dividend in the amount of 35,11% of the Company’s net income corresponding to 2009. This equals a dividend of Ch$ 7.1 per share.
The aforementioned proposal modified the Company’s Dividend Policy for 2009, which allowed for an expected final dividend of 60% of the Company’s net income. This was disclosed as an Essential Event dated February 26, 2010. In the General Ordinary Shareholders’ Meeting held on April 22, 2010, the shareholders agreed to distribute the minimum mandatory dividend and an additional dividend amounting to Ch$ 7.1 per share. Such dividend was partially paid during 2009 (Interim Dividend No. 80) and the Ch$ 4.64323 per share surplus was paid on May 6, 2010 (Final Dividend No. 81).
The Board agreed to establish a dividend policy for 2010 in the amount of 60% of 2010 net income.
The Enersis Board in its Ordinary Session dated October 27, 2010 unanimously agreed to pay an interim dividend on January 27, 2011 equal to Ch$ 1.57180 per share out of 2010 net income and corresponding to 15% of the Company’s net income as of September 30, 2010.
The aforementioned information constitutes a modification in the Company’s 2010 dividend policy, which provided for the December interim dividend
The compliance of the aforementioned dividend plan is conditional on the actual net income earned by the Company during the current year, as well as the results the Company’s periodic projections indicate.
The following table details the dividends paid in the last six years:
Dividend No. |
| Type of Dividend |
| Date of Payment |
| Pesos per Share |
| Charged to Period |
|
72 |
| Final |
| 04-20-2005 |
| 0.41654 |
| 2004 |
|
73 |
| Final |
| 04-03-2006 |
| 1.00000 |
| 2005 |
|
74 |
| Interim |
| 12-26-2006 |
| 1.11000 |
| 2006 |
|
75 |
| Final |
| 05-23-2007 |
| 4.89033 |
| 2006 |
|
76 |
| Interim |
| 12-27-2007 |
| 0.53119 |
| 2007 |
|
77 |
| Final |
| 04-30-2008 |
| 3.41256 |
| 2007 |
|
78 |
| Interim |
| 12-19-2008 |
| 1.53931 |
| 2008 |
|
79 |
| Final |
| 05-12-2009 |
| 4.56069 |
| 2008 |
|
80 |
| Interim |
| 12-17-2009 |
| 2.45677 |
| 2009 |
|
81 |
| Final |
| 05-06-2010 |
| 4.64323 |
| 2009 |
|
24.2 Foreign currency translation reserves
The following table details translation adjustments net of taxes in the consolidated statement of financial position and the consolidated statement of change in equity for the threee years in the period ended December 31, 2010:
Foreign currency translation |
| December 31, 2010 |
| December 31, 2009 |
| December 31, 2008 |
|
Distrilec Inversora S.A. |
| (31,997,882 | ) | (25,140,985 | ) | (3,123,655 | ) |
Edesur S.A. |
| (39,533,598 | ) | (30,917,314 | ) | (3,519,749 | ) |
Ampla Energía S.A. |
| 131,368,333 |
| 145,683,499 |
| 115,076,940 |
|
Ampla Investimentos S.A. |
| 2,457,495 |
| 3,558,280 |
| 1,445,939 |
|
Codensa S.A. |
| 6,372,677 |
| 8,666,552 |
| 28,716,101 |
|
Distrilima S.A. |
| (8,023,006 | ) | (3,620,410 | ) | 10,412,874 |
|
Investluz S.A. |
| 3,645,236 |
| 3,681,834 |
| 3,644,801 |
|
Endesa Brasil S.A. |
| 32,580,194 |
| 55,686,633 |
| 14,166,519 |
|
Central Costanera S.A. |
| (7,112,768 | ) | (3,495,910 | ) | (4,619,633 | ) |
Endesa Argentina S.A. |
| 286,480 |
| 286,480 |
| 9,403,155 |
|
Gas Atacama S.A. |
| (2,013,576 | ) | 2,261,348 |
| 13,277,982 |
|
Emgesa |
| 38,858,582 |
| 40,494,477 |
| 62,314,686 |
|
Hidroeléctrica El Chocón S.A. |
| (10,306,187 | ) | (7,744,971 | ) | (677,259 | ) |
Generandes Perú S.A. |
| 766,900 |
| 9,417,649 |
| 31,521,222 |
|
Grupo Synapsis |
| (1,148,937 | ) | (339,801 | ) | 2,370,640 |
|
Grupo CAM |
| (2,087,946 | ) | (1,259,460 | ) | 3,423,263 |
|
Other |
| (833,107 | ) | (244,691 | ) | 125,785 |
|
Total |
| 113,278,890 |
| 196,973,210 |
| 283,959,611 |
|
24.3 Capital management
The objective of the Company is to maintain an adequate level of capitalization in order to be able to secure its access to the financial markets, so as to fulfill its medium and long-term goals while maximizing the return to its shareholders and maintaining a robust financial position.
24.4 Restrictions on the ability of subsidiaries to transfer funds to the parent
Certain subsidiaries of the Group must meet certain financial ratio covenants which require them to have a minimum level of equity or other requirements that restrict the transferring of assets to the parent company. The Group’s restricted net assets as of December 31, 2010 from its subsidiaries Endesa Chile, Endesa Brasil, Ampla Energía, Coelce and Edelnor totaled ThCh$ 1,021,823,880, ThCh$ 99,763,921, ThCh$ 390,800,750, ThCh$ 48,782,665 and ThCh$ 68,032,153 respectively (see Schedule I).
24.5 Other reserves
Other reserves within Equity as of December 31, 2010, 2009 and 2008 are as follows:
|
| Balance at |
|
|
| Balance at |
|
|
| January 01, |
| Movements |
| December 31, |
|
|
| 2010 |
| 2010 |
| 2010 |
|
|
|
|
|
|
|
|
|
Exchange differences on translation |
| 196,973,210 |
| (83,694,320 | ) | 113,278,890 |
|
Cash flow hedges |
| (188,691,145 | ) | 14,682,972 |
| (174,008,173 | ) |
Remeasurement of Available-for-sale financial assets |
| 41,699 |
| 126 |
| 41,825 |
|
Miscellaneous Other Reserve |
| (1,291,099,898 | ) | — |
| (1,291,099,898 | ) |
TOTAL |
| (1,282,776,134 | ) | (69,011,222 | ) | (1,351,787,356 | ) |
|
| Balance at |
|
|
| Balance at |
|
|
| January 01, |
| Movements |
| December 31, |
|
|
| 2009 |
| 2009 |
| 2009 |
|
|
|
|
|
|
|
|
|
Exchange differences on translation |
| 283,959,611 |
| (86,986,401 | ) | 196,973,210 |
|
Cash flow hedges |
| (276,767,607 | ) | 88,076,462 |
| (188,691,145 | ) |
|
|
|
|
|
|
|
|
Available-for-sale financial assets |
| 9,565 |
| 32,134 |
| 41,699 |
|
Miscellaneous Other Reserve |
| (1,291,099,898 | ) | — |
| (1,291,099,898 | ) |
TOTAL |
| (1,283,898,329 | ) | 1,122,195 |
| (1,282,776,134 | ) |
|
| Balance at |
|
|
| Balance at |
|
|
| January 01, |
| Movements |
| December 31, |
|
|
| 2008 |
| 2008 |
| 2008 |
|
|
|
|
|
|
|
|
|
Exchange differences on translation |
| 199,615,814 |
| 84,343,797 |
| 283,959,611 |
|
Cash flow hedges |
| (44,390,168 | ) | (232,377,439 | ) | (276,767,607 | ) |
|
|
|
|
|
|
|
|
Available-for-sale financial assets |
| 9,108 |
| 457 |
| 9,565 |
|
Miscellaneous Other Reserve |
| (841,137,396 | ) | (449,962,502 | ) | (1,291,099,898 | ) |
TOTAL |
| (685,902,642 | ) | (597,995,687 | ) | (1,283,898,329 | ) |
· Translation reserve arises from exchange differences relating to :
· Translation of the financial statements of our foreign operations from their functional currencies to our presentation currency (i.e. Chilean peso) (see Note 2.5.3); and
· Translation of goodwill arising on the acquisition of foreign operations with a functional currency other than the Chilean peso (Note 3.c).
· Hedging reserve represents the cumulative portion of gains and losses on hedging instruments deemed effective in cash flow hedges (Note 3.g.4. and 3.m).
· Other miscellaneous reserves
Other miscellaneous reserves include the following:
(I) In accordance with Oficio Circular No. 456 of the SVS, accumulated price level restatements related to paid-in capital since our transition to IFRS 1 on January 1, 2004 through December 31, 2008. Note that despite the Company adopted IFRS as its accounting standards as of January 1, 2009, the January 1, 2004 transition
date disclosed previously was the same date used by the our Parent Company ENDESA, S.A. in its transition to IFRS.
(II) Translation differences existing at the date of transition to IFRS (exemption IFRS 1 “First-time adoption”).
(III) Reserve arising from transactions between entities under common control, mainly explained by the creation of the Endesa Brasil Holding in 2005 and the merger of our Colombian subsidiaries Emgesa and Betania in 2007.
24.6 Non-controlling interests
The main changes in minority interests during the years ended December 31, 2010 and 2009 are described below.
a) On October 9, 2009, our subsidiary Endesa Chile acquired an additional 29.3974% ownership interest of Edegel S.A.A. for a total consideration US$ 375 million, resulting in a reduction amounting to ThCh$ 127,551,963 in the equity attributable to minority interests in such entity.
· Likewise, on October 15, 2009, Enersis acquired an additional 24% ownership interest of Empresa de Distribución Eléctrica de Lima Norte S.A.A. (“Edelnor”) for a total consideration of US$ 145.7 million, resulting in a reduction amounting to ThCh$ 37,886,392 in the equity attributable to minority interests in such entity.
· The Boards of Directors of Endesa Chile and Enersis authorized both transactions described above after reviewing external valuations performed by investment banks hired for this purpose, as well as internal valuations performed by the executive management of each company. These acquisitions were made from Generalima S.A.C., a Peruvian company fully owned by Endesa Latinoamérica S.A.U., the direct parent company of Enersis.
b) On the other hand, the negative fluctuation reflected in the line item “Increase (decrease) through transfers and other changes” of the consolidated statements of changes in equity is explained primarily by the following:
(i) the amount corresponding to the non-controlling interests in dividends declared by the consolidated subsidiaries
(ii) the amount corresponding to the non-controlling interests in the Emgesa S.A. E.S.P. return of capital. That balance amounts to ThCh$ 85,231,132 as of December 31, 2010 (ThCh$ 0 as of December 31, 2009 and 2008).
25. REVENUES
The detail of revenues presented in the Statement of Comprehensive income for the years ended December 31, 2010, 2009 and 2008 is as follows:
|
| For the year ended |
| ||||
Revenues |
| 2010 |
| 2009 |
| 2008 |
|
|
|
|
|
|
|
|
|
Energy Sales |
| 5,653,724,917 |
| 5,579,145,884 |
| 5,561,463,872 |
|
|
|
|
|
|
|
|
|
Other Sales |
| 50,570,774 |
| 56,489,259 |
| 45,682,484 |
|
Sale of Measuring Equipment |
| 2,621,293 |
| 2,822,658 |
| 3,798,709 |
|
Sale of Electronic Supplies |
| 31,263,834 |
| 39,840,661 |
| 31,760,232 |
|
Sale of Products and Services |
| 16,685,647 |
| 13,825,940 |
| 10,123,543 |
|
|
|
|
|
|
|
|
|
Other Revenue from Services |
| 474,934,133 |
| 477,648,472 |
| 493,717,929 |
|
Tolls and Transmission |
| 182,638,100 |
| 229,183,380 |
| 250,583,706 |
|
Lease of Measuring Equipment |
| 9,646,546 |
| 8,327,754 |
| 9,966,455 |
|
Public Lighting |
| 31,092,463 |
| 30,603,007 |
| 36,640,855 |
|
Verifications and Connections |
| 14,106,659 |
| 14,869,456 |
| 22,801,523 |
|
Engineering Services |
| 15,871,319 |
| 19,960,120 |
| 18,460,358 |
|
Advisory Services |
| 23,442,524 |
| 26,976,336 |
| 23,528,236 |
|
Other Services |
| 198,136,522 |
| 147,728,419 |
| 131,736,796 |
|
|
|
|
|
|
|
|
|
Total Revenue |
| 6,179,229,824 |
| 6,113,283,615 |
| 6,100,864,285 |
|
|
| For the year ended |
| ||||
Other operating income |
| 2010 |
| 2009 |
| 2008 |
|
|
|
|
|
|
|
|
|
Revenue from Construction Contracts |
| 252,401,048 |
| 200,493,636 |
| 275,584,358 |
|
Mutual Supports |
| 23,287,510 |
| 17,809,432 |
| 16,614,018 |
|
Third Party Services to own and Third Party Fixtures |
| 10,611,783 |
| 24,832,249 |
| 18,887,136 |
|
Income from Leases |
| 699,787 |
| 841,083 |
| 3,112,862 |
|
Sale of New Businesses |
| 11,380,343 |
| 9,238,121 |
| 13,226,000 |
|
Other Income |
| 85,970,818 |
| 105,557,517 |
| 151,656,042 |
|
|
|
|
|
|
|
|
|
Total other operating income |
| 384,351,289 |
| 358,772,038 |
| 479,080,416 |
|
1) During the current year, the Company recognized Ch$ 22,226 million related to the Bocamina power plant business interruption insurance policy. Note that as a result of the February 27, 2010 earthquake, the Bocamina Power Plant activities were affected. Consequently, this is why the Company received the proceeds noted herein. (see Note No.15 d) vi).
26. RAW MATERIALS AND CONSUMABLES USED
Raw materials and consumables used presented in profit or loss for the 2010, 2009 and 2008 period are detailed as follows:
|
| For the year ended |
| ||||
Raw materials and consumable used |
| 2010 |
| 2009 |
| 2008 |
|
|
|
|
|
|
|
|
|
Energy Purchases |
| (1,554,714,636 | ) | (1,520,198,225 | ) | (1,624,238,985 | ) |
Cost Fuel Consumed |
| (672,038,103 | ) | (580,237,613 | ) | (847,411,384 | ) |
Transportation Costs |
| (405,983,092 | ) | (316,287,883 | ) | (294,860,018 | ) |
Costs from Construction Contracts |
| (252,401,048 | ) | (200,493,636 | ) | (275,584,358 | ) |
Other Variable Supplies and Services |
| (636,509,375 | ) | (593,376,220 | ) | (505,895,541 | ) |
|
|
|
|
|
|
|
|
Total |
| (3,521,646,254 | ) | (3,210,593,577 | ) | (3,547,990,286 | ) |
27. EMPLOYEE BENEFITS EXPENSES
Employee expenses recognized in profit or loss for the 2010, 2009 and 2008 period are detailed as follows:
|
| For the year ended |
| ||||
Employee Benefits expenses |
| 12-31-2010 |
| 12-31-2009 |
| 12-31-2008 |
|
|
|
|
|
|
|
|
|
Wages and Salaries |
| (295,339,462 | ) | (296,862,091 | ) | (269,904,674 | ) |
Post-Employment Benefit Obligation Expense |
| (5,837,977 | ) | (7,271,009 | ) | (5,770,722 | ) |
Social Security and Other Contributions |
| (63,391,743 | ) | (52,252,408 | ) | (40,925,405 | ) |
Other Employee Expenses |
| (10,108,831 | ) | (14,016,937 | ) | (6,027,632 | ) |
|
|
|
|
|
|
|
|
Total |
| (374,678,013 | ) | (370,402,445 | ) | (322,628,433 | ) |
28. DEPRECIATION, AMORTIZATION AND IMPAIRMENT LOSSES
Depreciation, amortization and impairment losses recognized in profit or loss for the 2010, 2009 and 2008 period are detailed as follows:
|
| For the year ended |
| ||||
|
| 12-31-2010 |
| 12-31-2009 |
| 12-31-2008 |
|
|
|
|
|
|
|
|
|
Depreciation |
| (338,040,266 | ) | (346,587,547 | ) | (330,545,457 | ) |
Amortization |
| (110,977,009 | ) | (107,782,412 | ) | (87,164,869 | ) |
|
|
|
|
|
|
|
|
Subtotal |
| (449,017,275 | ) | (454,369,959 | ) | (417,710,326 | ) |
Impairment Losses (*) |
| (108,373,429 | ) | (85,285,525 | ) | (20,353,265 | ) |
|
|
|
|
|
|
|
|
Total |
| (557,390,704 | ) | (539,655,484 | ) | (438,063,591 | ) |
|
| For the year ended |
| ||||
(*) Impairment losses |
| 12-31-2010 |
| 12-31-2009 |
| 12-31-2008 |
|
|
|
|
|
|
|
|
|
Financial assets (see Note 7c) |
| (95,391,111 | ) | (22,179,120 | ) | (19,755,884 | ) |
Assets and disposal groups held for sale (see Note 11) |
| (14,881,960 | ) | (21,915,849 | ) | — |
|
Property, plant and equipment (see Note 15) |
| (1,340,235 | ) | (43,999,600 | ) | — |
|
Reversal of impairment loss — investment property (see Note 16) |
| 3,239,877 |
| 2,809,044 |
| (597,381 | ) |
|
|
|
|
|
|
|
|
Total |
| (108,373,429 | ) | (85,285,525 | ) | (20,353,265 | ) |
29. OTHER EXPENSES
Other miscellaneous operating expenses for the 2010, 2009 and 2008 period are detailed as follows:
|
| For the year ended |
| ||||
Other expenses |
| 2010 |
| 2009 |
| 2008 |
|
|
|
|
|
|
|
|
|
Other Supplies and Services |
| (130,232,972 | ) | (146,952,970 | ) | (156,589,606 | ) |
Professional, outsourcing and other services |
| (113,944,110 | ) | (117,604,978 | ) | (108,338,771 | ) |
Repairs and Maintenance |
| (69,199,458 | ) | (53,933,371 | ) | (57,359,157 | ) |
Indemnities and Fines |
| (41,316,694 | ) | (20,934,632 | ) | (11,474,146 | ) |
Taxes and Charges |
| (26,456,298 | ) | (33,891,117 | ) | (34,795,817 | ) |
Insurance Premiums |
| (19,147,361 | ) | (19,866,916 | ) | (14,076,198 | ) |
Leases and Rental Cost |
| (16,980,825 | ) | (19,969,187 | ) | (22,103,036 | ) |
Marketing, Public Relations and Advertising |
| (16,207,055 | ) | (16,338,026 | ) | (10,949,704 | ) |
Other Supplies |
| (11,701,238 | ) | (19,372,298 | ) | (15,665,284 | ) |
Travel Expense |
| (4,306,510 | ) | (4,966,691 | ) | (5,192,877 | ) |
Environmental Expenses |
| (942,248 | ) | (3,859,011 | ) | (3,666,727 | ) |
|
|
|
|
|
|
|
|
Total |
| (450,434,769 | ) | (457,689,197 | ) | (440,211,323 | ) |
30. OTHER GAINS (LOSSES)
The detail of other gain (loss) for the 2010, 2009 and 2008 period are detailed as follows:
|
| For the year ended |
| ||||
Other gains (losses) |
| 12-31-2010 |
| 12-31-2009 |
| 12-31-2008 |
|
|
|
|
|
|
|
|
|
Investment Sales |
| 272,686 |
| 28,113,548 |
| 964,000 |
|
Sale of receivables portfolio - Codensa Hogar |
| — |
| 12,784,152 |
| — |
|
Land Sales |
| 8,381,710 |
| 9,253,010 |
| — |
|
Other Assets |
| 3,329,038 |
| 489,568 |
| 1,574,961 |
|
|
|
|
|
|
|
|
|
Total |
| 11,983,434 |
| 50,640,278 |
| 2,538,961 |
|
31. FINANCIAL COSTS
The detail of financial income and costs for the 2010, 2009 and 2008 period are detailed as follows:
|
| For the year ended |
| ||||
Financial income |
| 12-31-2010 |
| 12-31-2009 |
| 12-31-2008 |
|
|
|
|
|
|
|
|
|
Income from cash and cash equivalents |
| 68,144,673 |
| 79,364,437 |
| 77,155,433 |
|
Income from expected return on plan assets (Brazil) |
| 41,253,550 |
| 32,050,585 |
| 33,741,755 |
|
Other finance income |
| 56,962,380 |
| 41,884,708 |
| 61,502,064 |
|
Incomo from other financial assets |
| 4,876,345 |
| 6,370,675 |
| 9,354,083 |
|
|
|
|
|
|
|
|
|
Total |
| 171,236,948 |
| 159,670,405 |
| 181,753,335 |
|
|
| For the year ended |
| ||||
Financial Costs |
| 2010 |
| 2009 |
| 2008 |
|
|
|
|
|
|
|
|
|
|
| (438,358,251 | ) | (482,472,627 | ) | (515,108,257 | ) |
|
|
|
|
|
|
|
|
Bank Loans |
| (127,921,732 | ) | (137,274,372 | ) | (161,830,097 | ) |
Secured and unsecured obligations |
| (150,777,160 | ) | (171,723,898 | ) | (200,639,335 | ) |
Finance Leasing |
| (3,056,546 | ) | (3,733,454 | ) | (4,696,187 | ) |
Valuation of Financial Derivative |
| (19,034,198 | ) | (19,307,617 | ) | (18,723,566 | ) |
Financial Provision |
| (73,709,974 | ) | (12,105,233 | ) | (18,121,169 | ) |
Post-Employment Benefit Obligation |
| (52,703,379 | ) | (51,679,594 | ) | (47,749,152 | ) |
Capitalized borrowing costs |
| 15,137,380 |
| 11,165,950 |
| 12,119,473 |
|
Other Financial Costs |
| (26,292,642 | ) | (97,814,409 | ) | (75,468,224 | ) |
|
|
|
|
|
|
|
|
Gain (Loss) for Indexed Assets and Liabilities |
| (15,055,706 | ) | 21,781,329 |
| (62,378,252 | ) |
|
|
|
|
|
|
|
|
Foreign Currency Exchange Differences, Net |
| 11,572,474 |
| (8,235,253 | ) | (23,632,778 | ) |
|
|
|
|
|
|
|
|
Positive |
| 83,236,540 |
| 82,015,125 |
| 74,524,243 |
|
Negative |
| (71,664,066 | ) | (90,250,378 | ) | (98,157,021 | ) |
|
|
|
|
|
|
|
|
Total Financial Costs |
| (441,841,483 | ) | (468,926,551 | ) | (601,119,287 | ) |
Total Financial Results |
| (270,604,535 | ) | (309,256,146 | ) | (419,365,952 | ) |
32. INCOME TAX
Income tax as presented in the accompanying consolidated statements of comprehensive income for the 2010 and 2009 periods are detailed herein. Also, the following table reconciles income taxes resulting from applying the general current tax rate to “Net income before taxes” to the income tax expense recorded in the accompanying consolidated statement of comprehensive income for 2010, 2009 and 2008:
|
| For the year ended |
| ||||
Income Tax |
| 2010 |
| 2009 |
| 2008 |
|
|
|
|
|
|
|
|
|
Current Tax Expense |
| (397,519,578 | ) | (422,830,225 | ) | (308,467,764 | ) |
Tax Benefit Effect from Tax Assets Not Previously Recognized |
| 51,094,799 |
| 39,752,182 |
| 19,021,973 |
|
Adjustments to Current Tax of Prior Period |
| (2,869,081 | ) | 12,569,886 |
| 2,842,103 |
|
Other Current Tax Expense |
| (2,597,705 | ) | (4,276,209 | ) | (6,191,896 | ) |
|
|
|
|
|
|
|
|
Current Tax Expense, Net |
| (351,891,565 | ) | (374,784,366 | ) | (292,795,584 | ) |
|
|
|
|
|
|
|
|
Deferred Tax Income (Expense) Relating to Origination and Reversal of Temporary Differences |
| (5,841,500 | ) | 7,274,742 |
| (115,182,582 | ) |
Deferred Tax Income (Expense) Relating toTax Rate Changes or Imposition of New Taxes |
| (1,450,689 | ) | — |
| — |
|
Tax Benefit Effect from Tax Assets Not Previously Recognized |
| — |
| 1,700,625 |
| — |
|
Other Deferred Tax Income (Expense) |
| 13,176,786 |
| 6,071,389 |
| (7,924,618 | ) |
|
|
|
|
|
|
|
|
Deferred Tax Income (Expense), Net |
| 5,884,597 |
| 15,046,756 |
| (123,107,200 | ) |
Tax Effect of Changes in the Tax Status of the Entity or its Shareholders |
| — |
| — |
| — |
|
|
|
|
|
|
|
|
|
Income tax Expense |
| (346,006,968 | ) | (359,737,610 | ) | (415,902,784 | ) |
The principal temporary differences are detailed in Note 17 a.
Reconciliation of Tax Expense |
| 2010 |
| 2009 |
| 2008 |
|
|
|
|
|
|
|
|
|
Tax Expense Using Statutory Rate |
| (245,938,215 | ) | (284,081,079 | ) | (246,514,420 | ) |
Tax Effect of Rates in Other Jurisdictions |
| (159,695,526 | ) | (166,163,264 | ) | (135,494,792 | ) |
Tax Effect of Non-Taxable Revenues |
| 44,357,904 |
| 40,858,030 |
| 67,957,672 | ) |
Tax Effect of Non-Tax-Deductible Expenses |
| (9,065,332 | ) | (29,309,173 | ) | (67,703,775 | ) |
Tax Effect of Utilization of Previously Unrecognised Tax Losses |
| — |
| (489,108 | ) | — |
|
Tax Effect of Tax Benefit Not Previously Recognized in Income Statement |
| — |
| (1,098,324 | ) | — |
|
Tax Effect from Change in Tax Rate |
| (1,450,689 | ) | — |
|
|
|
Tax Effect from Under or Over Provided Tax in Prior Periods |
| (2,869,081 | ) | 12,569,886 |
| 2,842,103 | ) |
Price-Level Restatement for Tax Purposes (Investments and Equity) |
| 28,653,971 |
| 67,975,422 |
| (36,989,572 | ) |
Total Adjustments to Tax Expense Using Statutory Rate |
| (100,068,753 | ) | (75,656,531 | ) | (169,388,364 | ) |
|
|
|
|
|
|
|
|
Income Tax |
| (346,006,968 | ) | (359,737,610 | ) | (415,902,784 | ) |
On July 29, 2010, Chile Law Nº 20,455 “Modifica diversos cuerpos legales para obtener recursos destinados al financiamiento de la reconstrucción del país” (modifies tax entities to obtain resources towards financing the reconstruction of the country) was enacted and published in the Diario Oficial on July 31, 2010. This law, among other things temporarily increases tax rates for commercial years 2011 and 2012 (20% and 18.5%, respectively), and returns back to 17% in 2013. As a result, as of December 31, 2010 the Company has recognized a greater deferred income tax expense in the amount of ThCh$ 1,069,481
33. SEGMENT INFORMATION
33.1 Segmentation criteria
In performing its activities the Group is organized primarily around its core businesses that are electric energy generation, transmission and distribution. On that basis the Group has established two major business lines.
In addition, segment information has been organized considering geographical areas in which the Group operates, as follows:
· Chile
· Argentina
· Brazil
· Peru
· Colombia
Given the Group’s corporate organization basically matches the business organization and therefore the segments organization, the segment information reported is based on the financial information of the companies forming each segment.
The following tables detail the segment information for years 2010 and 2009.
33.2 Generation, distribution and other
Line of Business |
| Generation |
| Distribution |
| Eliminations and Others |
| Total |
| ||||||||
|
| 12-31-2010 |
| 12-31-2009 |
| 12-31-2010 |
| 12-31-2009 |
| 12-31-2010 |
| 12-31-2009 |
| 12-31-2010 |
| 12-31-2009 |
|
ASSETS |
| ThCh$ |
| ThCh$ |
| ThCh$ |
| ThCh$ |
| ThCh$ |
| ThCh$ |
| ThCh$ |
| ThCh$ |
|
|
|
|
|
|
|
|
|
|
|
|
|
|
|
|
|
|
|
CURRENT ASSETS |
| 1,064,310,315 |
| 1,251,419,545 |
| 1,156,629,416 |
| 1,216,399,232 |
| 117,328,245 |
| 103,636,879 |
| 2,338,267,976 |
| 2,571,455,656 |
|
Cash and cash equivalents |
| 410,734,005 |
| 619,035,609 |
| 308,918,527 |
| 431,604,221 |
| 241,702,505 |
| 84,260,991 |
| 961,355,037 |
| 1,134,900,821 |
|
Other current financial assets |
| 5,535,951 |
| 1,536,089 |
| 2,281,558 |
| — |
| — |
| 60 |
| 7,817,509 |
| 1,536,149 |
|
Other current non-financial assets |
| 7,342,281 |
| 9,669,785 |
| 27,188,821 |
| 22,454,464 |
| 1,462,146 |
| 3,057,535 |
| 35,993,248 |
| 35,181,784 |
|
Trade and other current receivables |
| 321,074,432 |
| 396,480,263 |
| 690,037,361 |
| 719,323,724 |
| 26,986,447 |
| 26,162,612 |
| 1,038,098,240 |
| 1,141,966,599 |
|
Accounts receivables from related companies |
| 186,356,762 |
| 120,472,782 |
| 87,128,995 |
| 4,072,112 |
| (253,014,150 | ) | (105,530,662 | ) | 20,471,607 |
| 19,014,232 |
|
Inventories |
| 42,162,603 |
| 40,201,722 |
| 15,560,743 |
| 16,117,546 |
| 4,928,358 |
| — |
| 62,651,704 |
| 56,319,268 |
|
Current tax assets |
| 91,104,281 |
| 64,023,295 |
| 25,513,411 |
| 22,827,165 |
| 21,369,649 |
| 25,325,492 |
| 137,987,341 |
| 112,175,952 |
|
|
|
|
|
|
|
|
|
|
|
|
|
|
|
|
|
|
|
Non-current assets classified as held for sale and discontinued operations |
| — |
| — |
| — |
| — |
| 73,893,290 |
| 70,360,851 |
| 73,893,290 |
| 70,360,851 |
|
|
|
|
|
|
|
|
|
|
|
|
|
|
|
|
|
|
|
NON-CURRENT ASSETS |
| 5,808,436,926 |
| 5,853,309,145 |
| 4,743,201,791 |
| 4,640,589,157 |
| 115,938,414 |
| 144,786,363 |
| 10,667,577,132 |
| 10,638,684,665 |
|
Other non-current financial assets |
| 28,295,886 |
| 4,141,795 |
| 5,211,606 |
| 1,673,211 |
| 29,461,230 |
| 24,681,751 |
| 62,968,722 |
| 30,496,757 |
|
Other non-current non-financial assets |
| 31,459,012 |
| 32,513,871 |
| 70,535,341 |
| 60,321,995 |
| 1,741,942 |
| 1,419,387 |
| 103,736,295 |
| 94,255,253 |
|
Non-current receivables |
| 139,301,288 |
| 87,673,729 |
| 179,381,740 |
| 105,909,541 |
| 884,932 |
| 1,394,143 |
| 319,567,960 |
| 194,977,413 |
|
Non-current account receivables from related companies |
| 764,220 |
| 10,958,042 |
| 324,864 |
| 210,855 |
| (1,089,084 | ) | (11,168,897 | ) | — |
| — |
|
Investment accounted for using equity method |
| 591,361,178 |
| 584,075,094 |
| 683,656,485 |
| 683,579,189 |
| (1,260,916,011 | ) | (1,246,372,822 | ) | 14,101,652 |
| 21,281,461 |
|
Intangible assets other than goodwill |
| 31,398,642 |
| 30,060,644 |
| 1,405,434,608 |
| 1,392,815,685 |
| 15,753,155 |
| 23,245,916 |
| 1,452,586,405 |
| 1,446,122,245 |
|
Goodwill |
| 97,673,241 |
| 102,811,891 |
| 130,262,504 |
| 134,386,985 |
| 1,249,086,179 |
| 1,264,153,057 |
| 1,477,021,924 |
| 1,501,351,933 |
|
Property, plant and equipment, net |
| 4,739,297,094 |
| 4,859,937,779 |
| 2,017,266,712 |
| 1,996,440,599 |
| (4,623,151 | ) | 7,692,864 |
| 6,751,940,655 |
| 6,864,071,242 |
|
Investment property |
| — |
| — |
| — |
| — |
| 33,019,154 |
| 31,231,839 |
| 33,019,154 |
| 31,231,839 |
|
Deferred tax assets |
| 148,886,365 |
| 141,136,300 |
| 251,127,931 |
| 265,251,097 |
| 52,620,068 |
| 48,509,124 |
| 452,634,364 |
| 454,896,521 |
|
|
|
|
|
|
|
|
|
|
|
|
|
|
|
|
|
|
|
TOTAL ASSETS |
| 6,872,747,241 |
| 7,104,728,690 |
| 5,899,831,207 |
| 5,856,988,389 |
| 233,266,659 |
| 248,423,242 |
| 13,005,845,107 |
| 13,210,140,321 |
|
Line of Business |
| Generation |
| Distribution |
| Eliminations and Others |
| Total |
| ||||||||
|
| 12-31-2010 |
| 12-31-2009 |
| 12-31-2010 |
| 12-31-2009 |
| 12-31-2010 |
| 12-31-2009 |
| 12-31-2010 |
| 12-31-2009 |
|
LIABILITIES AND EQUITY |
| ThCh$ |
| ThCh$ |
| ThCh$ |
| ThCh$ |
| ThCh$ |
| ThCh$ |
| ThCh$ |
| ThCh$ |
|
|
|
|
|
|
|
|
|
|
|
|
|
|
|
|
|
|
|
CURRENT LIABILITIES |
| 1,143,674,971 |
| 1,133,935,750 |
| 1,359,242,371 |
| 1,071,289,696 |
| (95,639,857 | ) | (9,837,908 | ) | 2,407,277,486 |
| 2,195,387,538 |
|
Other current financial liabilities |
| 315,103,380 |
| 412,941,840 |
| 284,864,090 |
| 246,570,238 |
| 65,630,548 |
| 69,516,117 |
| 665,598,018 |
| 729,028,195 |
|
Trade and other current payables |
| 417,077,978 |
| 413,827,992 |
| 714,678,936 |
| 490,784,193 |
| 92,733,084 |
| 75,294,167 |
| 1,224,489,998 |
| 979,906,352 |
|
Accounts payables to related companies |
| 288,461,159 |
| 133,099,350 |
| 202,751,731 |
| 212,446,858 |
| (343,010,631 | ) | (233,590,429 | ) | 148,202,260 |
| 111,955,779 |
|
Other short-term provisions |
| 43,331,481 |
| 31,787,013 |
| 51,478,884 |
| 46,641,813 |
| 20,638,871 |
| 21,595,629 |
| 115,449,236 |
| 100,024,455 |
|
Current tax liabilities |
| 69,759,646 |
| 132,249,173 |
| 75,509,768 |
| 49,105,703 |
| 2,397,241 |
| 3,930,795 |
| 147,666,655 |
| 185,285,671 |
|
Current provisions for employee benefits |
| 2,703,107 |
| 3,448,733 |
| 2,690,108 |
| 1,359,124 |
| 57,167 |
| 107,310 |
| 5,450,382 |
| 4,915,167 |
|
Other current non-financial liabilities |
| 7,238,220 |
| 6,581,649 |
| 27,268,854 |
| 24,381,767 |
| 1,283,474 |
| 2,658,137 |
| 35,790,548 |
| 33,621,553 |
|
|
|
|
|
|
|
|
|
|
|
|
|
|
|
|
|
|
|
Liabilities associated with non-current assets classified as held for sale and discontinued operations |
| — |
| — |
| — |
| — |
| 64,630,389 |
| 50,650,366 |
| 64,630,389 |
| 50,650,366 |
|
|
|
|
|
|
|
|
|
|
|
|
|
|
|
|
|
|
|
NON-CURRENT LIABILITIES |
| 2,110,719,491 |
| 2,487,255,434 |
| 1,545,885,669 |
| 1,804,820,750 |
| 427,934,505 |
| 345,672,955 |
| 4,084,539,665 |
| 4,637,749,139 |
|
Other non-current financial liabilities |
| 1,621,961,525 |
| 1,957,137,539 |
| 831,035,287 |
| 1,021,187,352 |
| 561,959,635 |
| 555,118,929 |
| 3,014,956,447 |
| 3,533,443,820 |
|
Other non-current payables |
| 13,548,800 |
| 24,082,594 |
| 23,380,657 |
| 44,618,834 |
| 307,255 |
| 207,974 |
| 37,236,712 |
| 68,909,402 |
|
Accounts payables to related companies |
| 1,163,160 |
| 46,997,128 |
| 147,930,726 |
| 181,853,843 |
| (148,009,596 | ) | (225,294,299 | ) | 1,084,290 |
| 3,556,672 |
|
Other-long term provisions |
| 67,038,203 |
| 58,292,397 |
| 158,484,126 |
| 191,993,937 |
| — |
| 578 |
| 225,522,329 |
| 250,286,912 |
|
Deferred tax liabilities |
| 349,429,640 |
| 352,011,147 |
| 200,477,944 |
| 213,169,128 |
| 6,015,994 |
| 7,869,022 |
| 555,923,578 |
| 573,049,297 |
|
Non-current provisions for employee benefits |
| 27,147,186 |
| 26,576,882 |
| 181,236,136 |
| 148,308,890 |
| 7,435,653 |
| 7,803,218 |
| 215,818,975 |
| 182,688,990 |
|
Other non-current non-financial liabilities |
| 30,430,977 |
| 22,157,747 |
| 3,340,793 |
| 3,688,766 |
| 225,564 |
| (32,467 | ) | 33,997,334 |
| 25,814,046 |
|
|
|
|
|
|
|
|
|
|
|
|
|
|
|
|
|
|
|
EQUITY |
| 3,618,352,778 |
| 3,483,537,506 |
| 2,994,703,167 |
| 2,980,877,943 |
| (99,027,989 | ) | (87,411,805 | ) | 6,514,027,956 |
| 6,377,003,644 |
|
Equity attributable to owners of parent |
| 3,618,352,778 |
| 3,483,537,506 |
| 2,994,703,167 |
| 2,980,877,943 |
| (99,027,989 | ) | (87,411,805 | ) | 3,735,544,636 |
| 3,518,479,555 |
|
Issued capital |
| 1,830,431,254 |
| 1,752,378,473 |
| 1,122,271,982 |
| 1,122,271,981 |
| (127,820,401 | ) | (49,767,619 | ) | 2,824,882,835 |
| 2,824,882,835 |
|
Retained earnings |
| 1,566,278,776 |
| 1,423,967,654 |
| 1,339,970,908 |
| 1,310,880,528 |
| (802,560,175 | ) | (917,234,976 | ) | 2,103,689,509 |
| 1,817,613,206 |
|
Share premium |
| — |
|
|
| — |
|
|
| 158,759,648 |
| 158,759,648 |
| 158,759,648 |
| 158,759,648 |
|
Other reserves |
| 221,642,748 |
| 307,191,379 |
| 532,460,277 |
| 547,725,434 |
| 672,592,939 |
| 720,831,142 |
| (1,351,787,356 | ) | (1,282,776,134 | ) |
|
|
|
|
|
|
|
|
|
|
|
|
|
|
|
|
|
|
Non-controlling interests |
| — |
| — |
| — |
| — |
| — |
| — |
| 2,778,783,320 |
| 2,858,524,089 |
|
|
|
|
|
|
|
|
|
|
|
|
|
|
|
|
|
|
|
TOTAL LIABILITIES AND EQUITY |
| 6,872,747,241 |
| 7,104,728,690 |
| 5,899,831,207 |
| 5,856,988,389 |
| 233,266,659 |
| 248,423,242 |
| 13,005,845,107 |
| 13,210,140,321 |
|
Line of Business |
| Generation |
| Distribution |
| Eliminations and Others |
| Total |
| ||||||||||||||||
|
| 12-31-2010 |
| 12-31-2009 |
| 12-31-2008 |
| 12-31-2010 |
| 12-31-2009 |
| 12-31-2008 |
| 12-31-2010 |
| 12-31-2009 |
| 12-31-2008 |
| 12-31-2010 |
| 12-31-2009 |
| 12-31-2008 |
|
STATEMENT OF COMPREHENSIVE INCOME |
| ThCh$ |
| ThCh$ |
| ThCh$ |
| ThCh$ |
| ThCh$ |
| ThCh$ |
| ThCh$ |
| ThCh$ |
| ThCh$ |
| ThCh$ |
| ThCh$ |
| ThCh$ |
|
|
|
|
|
|
|
|
|
|
|
|
|
|
|
|
|
|
|
|
|
|
|
|
|
|
|
REVENUES |
| 2,780,593,331 |
| 2,708,357,655 |
| 2,833,397,146 |
| 4,392,625,917 |
| 4,240,401,202 |
| 4,071,303,190 |
| (609,638,135 | ) | (476,703,204 | ) | (324,755,635 | ) | 6,563,581,113 |
| 6,472,055,653 |
| 6,579,944,701 |
|
Sales |
| 2,735,326,188 |
| 2,692,140,931 |
| 2,828,078,633 |
| 4,053,333,247 |
| 3,892,291,952 |
| 3,624,951,955 |
| (609,429,611 | ) | (471,149,268 | ) | (352,166,303 | ) | 6,179,229,824 |
| 6,113,283,615 |
| 6,100,864,285 |
|
Energy sales |
| 2,599,487,673 |
| 2,570,529,382 |
| 2,697,746,885 |
| 3,754,753,999 |
| 3,642,828,755 |
| 3,359,696,230 |
| (700,516,755 | ) | (634,212,253 | ) | (495,979,243 | ) | 5,653,724,917 |
| 5,579,145,884 |
| 5,561,463,872 |
|
Other sales |
| 15,262,308 |
| 6,009,988 |
| 14,564,928 |
| 9,220,770 |
| 12,431,451 |
| 15,718,375 |
| 26,087,696 |
| 38,047,820 |
| 15,308,562 |
| 50,570,774 |
| 56,489,259 |
| 45,591,865 |
|
Other services rendered |
| 120,576,207 |
| 115,601,561 |
| 115,766,820 |
| 289,358,478 |
| 237,031,746 |
| 249,537,350 |
| 64,999,448 |
| 125,015,165 |
| 128,504,378 |
| 474,934,133 |
| 477,648,472 |
| 493,808,548 |
|
Other operating income |
| 45,267,143 |
| 16,216,724 |
| 5,318,513 |
| 339,292,670 |
| 348,109,250 |
| 446,351,235 |
| (208,524 | ) | (5,553,936 | ) | 27,410,668 |
| 384,351,289 |
| 358,772,038 |
| 479,080,416 |
|
|
|
|
|
|
|
|
|
|
|
|
|
|
|
|
|
|
|
|
|
|
|
|
|
|
|
RAW MATERIALS AND CONSUMABLE USED |
| (1,300,677,879 | ) | (1,058,410,593 | ) | (1,409,584,454 | ) | (2,861,855,754 | ) | (2,687,937,114 | ) | (2,541,144,864 | ) | 640,887,379 |
| 535,754,130 |
| 402,739,032 |
| (3,521,646,254 | ) | (3,210,593,577 | ) | (3,547,990,286 | ) |
Energy purchases |
| (264,194,654 | ) | (197,058,728 | ) | (292,347,152 | ) | (1,988,241,950 | ) | (1,958,392,871 | ) | (1,826,983,648 | ) | 697,721,968 |
| 635,253,374 |
| 495,091,815 |
| (1,554,714,636 | ) | (1,520,198,225 | ) | (1,624,238,985 | ) |
Fuel consumption |
| (672,030,596 | ) | (580,234,432 | ) | (847,407,262 | ) | — |
| — |
| — |
| (7,507 | ) | (3,181 | ) | (4,122 | ) | (672,038,103 | ) | (580,237,613 | ) | (847,411,384 | ) |
Transport expenses |
| (233,134,592 | ) | (177,886,470 | ) | (191,958,097 | ) | (216,929,666 | ) | (158,940,229 | ) | (121,232,612 | ) | 44,081,166 |
| 20,538,816 |
| 18,330,691 |
| (405,983,092 | ) | (316,287,883 | ) | (294,860,018 | ) |
Other variable supplies and services |
| (131,318,037 | ) | (103,230,963 | ) | (77,871,943 | ) | (656,684,138 | ) | (570,604,014 | ) | (592,928,604 | ) | (100,908,248 | ) | (120,034,879 | ) | (110,679,352 | ) | (888,910,423 | ) | (793,869,856 | ) | (781,479,899 | ) |
|
|
|
|
|
|
|
|
|
|
|
|
|
|
|
|
|
|
|
|
|
|
|
|
|
|
CONTRIBUTION MARGIN |
| 1,479,915,452 |
| 1,649,947,062 |
| 1,423,812,692 |
| 1,530,770,163 |
| 1,552,464,088 |
| 1,530,158,326 |
| 31,249,244 |
| 59,050,926 |
| 77,983,397 |
| 3,041,934,859 |
| 3,261,462,076 |
| 3,031,954,415 |
|
|
|
|
|
|
|
|
|
|
|
|
|
|
|
|
|
|
|
|
|
|
|
|
|
|
|
Other work performed by entity and capitalized |
| 688,024 |
| 731,901 |
| 500,315 |
| 34,742,737 |
| 32,998,618 |
| 32,099,245 |
| 9,438,604 |
| — |
| — |
| 44,869,365 |
| 33,730,519 |
| 32,599,560 |
|
Employee benefits expense |
| (76,018,545 | ) | (69,577,977 | ) | (57,198,723 | ) | (215,810,871 | ) | (216,622,884 | ) | (187,917,987 | ) | (82,848,597 | ) | (84,201,584 | ) | (77,511,723 | ) | (374,678,013 | ) | (370,402,445 | ) | (322,628,433 | ) |
Other expenses |
| (109,579,510 | ) | (118,108,486 | ) | (107,836,118 | ) | (368,445,516 | ) | (367,766,183 | ) | (338,627,214 | ) | 27,590,256 |
| 28,185,472 |
| 6,252,009 |
| (450,434,770 | ) | (457,689,197 | ) | (440,211,323 | ) |
|
|
|
|
|
|
|
|
|
|
|
|
|
|
|
|
|
|
|
|
|
|
|
|
|
|
GROSS OPERATING RESULT |
| 1,295,005,421 |
| 1,462,992,500 |
| 1,259,278,166 |
| 981,256,513 |
| 1,001,073,639 |
| 1,035,712,370 |
| (14,570,493 | ) | 3,034,814 |
| 6,723,683 |
| 2,261,691,441 |
| 2,467,100,953 |
| 2,301,714,219 |
|
|
|
|
|
|
|
|
|
|
|
|
|
|
|
|
|
|
|
|
|
|
|
|
|
|
|
Depreciation, amortization and impairment losses |
| (244,856,745 | ) | (270,584,246 | ) | (215,544,370 | ) | (291,545,799 | ) | (239,656,554 | ) | (212,130,213 | ) | (20,988,160 | ) | (29,414,684 | ) | (10,389,008 | ) | (557,390,704 | ) | (539,655,484 | ) | (438,063,591 | ) |
|
|
|
|
|
|
|
|
|
|
|
|
|
|
|
|
|
|
|
|
|
|
|
|
|
|
OPERATING INCOME |
| 1,050,148,676 |
| 1,192,408,254 |
| 1,043,733,796 |
| 689,710,714 |
| 761,417,085 |
| 823,582,157 |
| (35,558,653 | ) | (26,379,870 | ) | (3,665,325 | ) | 1,704,300,737 |
| 1,927,445,469 |
| 1,863,650,628 |
|
|
|
|
|
|
|
|
|
|
|
|
|
|
|
|
|
|
|
|
|
|
|
|
|
|
|
FINANCIAL RESULTS |
| (139,218,164 | ) | (186,313,678 | ) | (243,706,955 | ) | (102,247,567 | ) | (99,796,594 | ) | (159,078,864 | ) | (29,138,804 | ) | (23,145,874 | ) | (16,580,133 | ) | 270,604,535 |
| (309,256,146 | ) | (419,365,952 | ) |
Financial income |
| 27,877,778 |
| 40,841,166 |
| 54,086,804 |
| 133,877,625 |
| 117,121,114 |
| 125,109,709 |
| 9,481,545 |
| 1,708,125 |
| 2,556,822 |
| 171,236,948 |
| 159,670,405 |
| 181,753,335 |
|
Financial costs |
| (178,040,606 | ) | (239,569,394 | ) | (251,422,396 | ) | (236,239,696 | ) | (226,454,904 | ) | (249,354,432 | ) | (24,077,949 | ) | (16,448,329 | ) | (14,331,429 | ) | (438,358,251 | ) | (482,472,627 | ) | (515,108,257 | ) |
Gain (loss) for indexed assets and liabilities |
| (2,885,747 | ) | 9,009,669 |
| (16,686,361 | ) | 153,805 |
| 458,162 |
| (3,048,824 | ) | (12,323,764 | ) | 12,313,498 |
| (42,643,067 | ) | (15,055,706 | ) | 21,781,329 |
| (62,378,252 | ) |
Foreign currency exchange differences |
| 13,830,411 |
| 3,404,881 |
| (29,685,002 | ) | (39,301 | ) | 9,079,034 |
| (31,785,317 | ) | (2,218,636 | ) | (20,719,168 | ) | 37,837,541 |
| 11,572,474 |
| (8,235,253 | ) | (23,632,778 | ) |
Gains |
| 59,335,473 |
| 71,795,866 |
| 48,055,032 |
| 7,262,527 |
| 18,584,732 |
| 53,858,472 |
| 24,733,368 |
| (8,365,473 | ) | (27,389,261 | ) | 91,331,368 |
| 82,015,125 |
| 74,524,243 |
|
Losses |
| (45,505,062 | ) | (68,390,985 | ) | (77,740,034 | ) | (7,301,828 | ) | (9,505,698 | ) | (85,643,789 | ) | (26,952,004 | ) | (12,353,695 | ) | 65,226,802 |
| (79,758,894 | ) | (90,250,378 | ) | (98,157,021 | ) |
|
|
|
|
|
|
|
|
|
|
|
|
|
|
|
|
|
|
|
|
|
|
|
|
|
|
Share of the profit (loss) of associates accounted for using the equity method |
| 811,855 |
| 2,233,946 |
| 2,567,160 |
| 911 |
| 82,758,254 |
| 74,875,698 |
| 202,973 |
| (82,756,621 | ) | (74,181,678 | ) | 1,015,739 |
| 2,235,579 |
| 3,261,180 |
|
Gains (losses) fron other investments |
| 234,251 |
| (55,494 | ) | 1,016,336 |
| — |
| 82,850 |
| — |
| 38,435 |
| 110,587 |
| (980,654 | ) | 272,686 |
| 137,943 |
| 35,682 |
|
Gains (losses) on sale of property, plant and equipment |
| 1,631,416 |
| 64,430 |
| (274,282 | ) | 1,365,276 |
| 24,938,953 |
| 2,879,810 |
| 8,714,057 |
| 28,498,952 |
| (102,249 | ) | 11,710,749 |
| 50,502,335 |
| 2,503,279 |
|
|
|
|
|
|
|
|
|
|
|
|
|
|
|
|
|
|
|
|
|
|
|
|
|
|
|
NET INCOME BEFORE TAX |
| 913,608,034 |
| 1,008,337,458 |
| 803,336,055 |
| 588,829,334 |
| 769,400,548 |
| 742,258,801 |
| (55,741,992 | ) | (106,672,826 | ) | (95,510,039 | ) | 1,446,695,376 |
| 1,671,065,180 |
| 1,450,084,818 |
|
|
|
|
|
|
|
|
|
|
|
|
|
|
|
|
|
|
|
|
|
|
|
|
|
|
|
Income tax |
| (197,506,450 | ) | (201,746,950 | ) | (221,991,980 | ) | (144,802,540 | ) | (178,201,978 | ) | (169,399,898 | ) | (3,697,978 | ) | 20,211,318 |
| (24,510,906 | ) | (346,006,968 | ) | (359,737,610 | ) | (415,902,784 | ) |
|
|
|
|
|
|
|
|
|
|
|
|
|
|
|
|
|
|
|
|
|
|
|
|
|
|
NET INCOME AFTER TAX FROM CONTINUING OPERATIONS |
| 716,101,584 |
| 806,590,508 |
| 581,344,075 |
| 444,026,794 |
| 591,198,570 |
| 572,858,903 |
| (59,439,970 | ) | (86,461,508 | ) | (120,020,945 | ) | 1,100,688,408 |
| 1,311,327,570 |
| 1,034,182,033 |
|
Net income from discontinued operations |
| — |
| — |
| — |
| — |
| — |
| — |
| — |
| — |
| — |
| — |
| — |
| — |
|
NET INCOME |
| 716,101,584 |
| 806,590,508 |
| 581,344,075 |
| 444,026,794 |
| 591,198,570 |
| 572,858,903 |
| (59,439,970 | ) | (86,461,508 | ) | (120,020,945 | ) | 1,100,688,408 |
| 1,311,327,570 |
| 1,034,182,033 |
|
|
|
|
|
|
|
|
|
|
|
|
|
|
|
|
|
|
|
|
|
|
|
|
|
|
|
RESULT FOR THE PERIOD |
| 716,101,584 |
| 806,590,508 |
| 581,344,075 |
| 444,026,794 |
| 591,198,570 |
| 572,858,903 |
| (59,439,970 | ) | (86,461,508 | ) | (120,020,945 | ) | 1,100,688,408 |
| 1,311,327,570 |
| 1,034,182,033 |
|
Owners of parent |
| — |
| — |
| — |
| — |
| — |
| — |
| — |
| — |
| — |
| 486,226,814 |
| 660,231,043 |
| 507,589,633 |
|
Non-controlling interests |
| — |
| — |
| — |
| — |
| — |
| — |
| — |
| — |
| — |
| 614,461,594 |
| 651,096,527 |
| 526,592,399 |
|
33.3 Countries
Country |
| Chile |
| Argentina |
| Brazil |
| Colombia |
| Peru |
| Eliminations |
| Total |
| ||||||||||||||
|
| 12-31-2010 |
| 12-31-2009 |
| 12-31-2010 |
| 12-31-2009 |
| 12-31-2010 |
| 12-31-2009 |
| 12-31-2010 |
| 12-31-2009 |
| 12-31-2010 |
| 12-31-2009 |
| 12-31-2010 |
| 12-31-2009 |
| 12-31-2010 |
| 12-31-2009 |
|
ASSETS |
| ThCh$ |
| ThCh$ |
| ThCh$ |
| ThCh$ |
| ThCh$ |
| ThCh$ |
| ThCh$ |
| ThCh$ |
| ThCh$ |
| ThCh$ |
| ThCh$ |
| ThCh$ |
| ThCh$ |
| ThCh$ |
|
|
|
|
|
|
|
|
|
|
|
|
|
|
|
|
|
|
|
|
|
|
|
|
|
|
|
|
|
|
|
CURRENT ASSETS |
| 958,252,718 |
| 843,756,651 |
| 206,682,679 |
| 238,697,969 |
| 773,987,829 |
| 867,294,187 |
| 298,436,755 |
| 566,973,953 |
| 118,519,262 |
| 107,238,468 |
| (17,611,267 | ) | (52,505,572 | ) | 2,338,267,976 |
| 2,571,455,656 |
|
Cash and cash equivalents |
| 396,117,160 |
| 285,514,616 |
| 64,001,651 |
| 53,307,697 |
| 309,608,364 |
| 370,493,421 |
| 150,969,852 |
| 395,571,472 |
| 40,658,010 |
| 30,013,615 |
| — |
| — |
| 961,355,037 |
| 1,134,900,821 |
|
Other current financial assets |
| 17,551 |
| 1,536,149 |
| 2,271,690 |
| — |
| 5,463,750 |
| — |
| 64,518 |
| — |
| — |
| — |
| — |
| — |
| 7,817,509 |
| 1,536,149 |
|
Other current non-financial assets |
| 2,823,979 |
| 7,146,069 |
| 3,453,937 |
| 7,152,112 |
| 24,929,082 |
| 14,426,954 |
| 1,741,706 |
| 3,440,009 |
| 3,044,544 |
| 3,016,640 |
| — |
| — |
| 35,993,248 |
| 35,181,784 |
|
Trade and other current receivables |
| 424,328,700 |
| 453,263,074 |
| 105,722,882 |
| 148,041,880 |
| 399,849,969 |
| 435,142,404 |
| 134,933,800 |
| 154,237,487 |
| 55,329,513 |
| 58,929,971 |
| (82,066,624 | ) | (107,648,217 | ) | 1,038,098,240 |
| 1,141,966,599 |
|
Accounts receivables from related companies |
| 9,118,913 |
| 12,683,334 |
| 20,580,614 |
| 21,301,343 |
| — |
| 168,850 |
| 85,521 |
| (117,203 | ) | 124,492 |
| 114,182 |
| (9,437,933 | ) | (15,136,274 | ) | 20,471,607 |
| 19,014,232 |
|
Inventories |
| 31,508,007 |
| 20,148,347 |
| 4,012,205 |
| 7,295,836 |
| 1,329,912 |
| 1,512,096 |
| 10,639,048 |
| 12,448,709 |
| 15,162,532 |
| 14,914,280 |
| — |
| — |
| 62,651,704 |
| 56,319,268 |
|
Current tax assets |
| 94,338,408 |
| 63,465,062 |
| 6,639,700 |
| 1,599,101 |
| 32,806,752 |
| 45,550,462 |
| 2,310 |
| 1,393,479 |
| 4,200,171 |
| 249,780 |
| — |
| (81,932 | ) | 137,987,341 |
| 112,175,952 |
|
|
|
|
|
|
|
|
|
|
|
|
|
|
|
|
|
|
|
|
|
|
|
|
|
|
|
|
|
|
|
Non-current assets classified as held for sale and discontinued operations |
| — |
| — |
| — |
| — |
| — |
| — |
| — |
| — |
| — |
| — |
| 73,893,290 |
| 70,360,851 |
| 73,893,290 |
| 70,360,851 |
|
|
|
|
|
|
|
|
|
|
|
|
|
|
|
|
|
|
|
|
|
|
|
|
|
|
|
|
|
|
|
NON-CURRENT ASSETS |
| 7,882,741,067 |
| 7,901,624,978 |
| 612,376,604 |
| 574,512,830 |
| 3,724,836,639 |
| 3,670,419,041 |
| 2,089,588,249 |
| 2,113,095,226 |
| 1,087,290,030 |
| 1,150,463,047 |
| (4,729,255,458 | ) | (4,771,430,457 | ) | 10,667,577,131 |
| 10,638,684,665 |
|
Other non-current financial assets |
| 57,422,721 |
| 28,767,604 |
| — |
| — |
| 3,352,698 |
| — |
| 8,267 |
| 874 |
| 2,185,036 |
| 1,728,279 |
| — |
| — |
| 62,968,722 |
| 30,496,757 |
|
Other non-current non-financial assets |
| 1,327,410 |
| 1,953,655 |
| 10,897,471 |
| 11,592,175 |
| 89,288,250 |
| 79,129,668 |
| 1,111,481 |
| 1,124,049 |
| — |
| 455,706 |
| 1,111,683 |
| — |
| 103,736,295 |
| 94,255,253 |
|
Non-current receivables |
| 9,751,497 |
| 13,413,378 |
| 123,872,850 |
| 70,806,123 |
| 177,122,226 |
| 101,549,009 |
| 8,821,387 |
| 8,893,522 |
| — |
| 315,381 |
| — |
| — |
| 319,567,960 |
| 194,977,413 |
|
Non-current account receivables from related companies |
| 5,570,592 |
| — |
| — |
| — |
| 36,381,275 |
| 36,839,087 |
| — |
| — |
| — |
| — |
| (41,951,867 | ) | (36,839,087 | ) | — |
| — |
|
Investment accounted for using equity method |
| 4,728,577,212 |
| 4,767,024,721 |
| 4,360,892 |
| 7,966,302 |
| 1,231,117,115 |
| 1,234,083,877 |
| — |
| 1,370 |
| 49,494,618 |
| 47,596,359 |
| (5,999,448,185 | ) | (6,035,391,168 | ) | 14,101,652 |
| 21,281,461 |
|
Intangible assets other than goodwill |
| 43,574,579 |
| 44,867,672 |
| 3,394,462 |
| 3,150,025 |
| 1,362,506,970 |
| 1,359,418,701 |
| 40,486,684 |
| 34,811,295 |
| 2,623,710 |
| 3,874,552 |
| — |
| 0 |
| 1,452,586,405 |
| 1,446,122,245 |
|
Goodwil |
| 2,311,244 |
| 2,312,300 |
| 2,453,791 |
| 2,780,777 |
| 120,673,559 |
| 124,648,965 |
| 7,348,467 |
| 7,497,542 |
| 10,502,214 |
| 11,050,603 |
| 1,333,732,649 |
| 1,353,061,746 |
| 1,477,021,924 |
| 1,501,351,933 |
|
Property, plant and equipment, net |
| 2,907,392,986 |
| 2,904,691,507 |
| 435,556,490 |
| 449,530,241 |
| 502,536,126 |
| 548,867,547 |
| 1,908,861,856 |
| 1,933,700,358 |
| 1,021,665,793 |
| 1,083,269,232 |
| (24,072,596 | ) | (55,987,643 | ) | 6,751,940,655 |
| 6,864,071,242 |
|
Investment property |
| 33,019,154 |
| 31,231,839 |
| — |
| — |
| — |
| — |
| — |
| — |
| — |
| — |
| — |
| — |
| 33,019,154 |
| 31,231,839 |
|
Deferred tax assets |
| 93,793,672 |
| 107,362,302 |
| 31,840,648 |
| 28,687,187 |
| 201,858,420 |
| 185,882,187 |
| 122,950,107 |
| 127,066,216 |
| 818,659 |
| 2,172,935 |
| 1,372,858 |
| 3,725,694 |
| 452,634,364 |
| 454,896,521 |
|
|
|
|
|
|
|
|
|
|
|
|
|
|
|
|
|
|
|
|
|
|
|
|
|
|
|
|
|
|
|
TOTAL ASSETS |
| 8,840,993,785 |
| 8,745,381,629 |
| 819,059,283 |
| 813,210,799 |
| 4,498,824,468 |
| 4,537,713,228 |
| 2,388,025,004 |
| 2,680,069,179 |
| 1,205,809,292 |
| 1,257,701,515 |
| (4,746,866,725 | ) | (4,823,936,029 | ) | 13,005,845,107 |
| 13,210,140,321 |
|
Country |
| Chile |
| Argentina |
| Brazil |
| Colombia |
| Peru |
| Eliminations |
| Total |
| ||||||||||||||
|
| 12-31-2010 |
| 12-31-2009 |
| 12-31-2010 |
| 12-31-2009 |
| 12-31-2010 |
| 12-31-2009 |
| 12-31-2010 |
| 12-31-2009 |
| 12-31-2010 |
| 12-31-2009 |
| 12-31-2010 |
| 12-31-2009 |
| 12-31-2010 |
| 12-31-2009 |
|
LIABILITIES AND EQUITY |
| ThCh$ |
| ThCh$ |
| ThCh$ |
| ThCh$ |
| ThCh$ |
| ThCh$ |
| ThCh$ |
| ThCh$ |
| ThCh$ |
| ThCh$ |
| ThCh$ |
| ThCh$ |
| ThCh$ |
| ThCh$ |
|
|
|
|
|
|
|
|
|
|
|
|
|
|
|
|
|
|
|
|
|
|
|
|
|
|
|
|
|
|
|
CURRENT LIABILITIES |
| 647,462,363 |
| 903,928,510 |
| 368,365,266 |
| 315,322,679 |
| 749,685,522 |
| 577,406,981 |
| 432,517,038 |
| 333,334,592 |
| 122,675,915 |
| 122,026,286 |
| 86,571,381 |
| (56,631,510 | ) | 2,407,277,486 |
| 2,195,387,538 |
|
Other current financial liabilities |
| 57,353,811 |
| 203,071,576 |
| 91,305,044 |
| 72,071,471 |
| 316,931,058 |
| 255,852,777 |
| 138,102,310 |
| 142,035,231 |
| 61,905,795 |
| 56,003,931 |
| — |
| (6,791 | ) | 665,598,018 |
| 729,028,195 |
|
Trade and other current payables |
| 397,291,875 |
| 412,036,076 |
| 188,824,968 |
| 145,853,738 |
| 350,493,006 |
| 262,836,323 |
| 242,087,064 |
| 121,147,948 |
| 46,211,217 |
| 38,025,476 |
| (418,132 | ) | 6,791 |
| 1,224,489,998 |
| 979,906,352 |
|
Accounts payables to related companies |
| 95,959,740 |
| 156,069,449 |
| 21,522,018 |
| 31,800,330 |
| 22,670,347 |
| 31,040,271 |
| (8,763,202 | ) | 120,530 |
| (5,545,768 | ) | 125,143 |
| 22,359,124 |
| (107,199,944 | ) | 148,202,260 |
| 111,955,779 |
|
Other short-term provisions |
| 61,952,297 |
| 52,152,629 |
| 31,334,089 |
| 23,007,266 |
| 9,290,490 |
| 9,409,249 |
| 1,498,668 |
| 3,592,400 |
| 11,373,692 |
| 11,862,911 |
| — |
| — |
| 115,449,236 |
| 100,024,455 |
|
Current tax liabilities |
| 26,985,525 |
| 71,611,640 |
| 18,739,444 |
| 27,624,545 |
| 45,603,630 |
| 15,799,839 |
| 50,694,810 |
| 57,901,052 |
| 5,643,246 |
| 12,430,527 |
| — |
| (81,932 | ) | 147,666,655 |
| 185,285,671 |
|
Current provisions for employee benefits |
| 1,341,781 |
| 1,714,434 |
| 591,831 |
| 119,702 |
| — |
| — |
| 3,516,770 |
| 3,081,031 |
| — |
| — |
| — |
| — |
| 5,450,382 |
| 4,915,167 |
|
Other current non-financial liabilities |
| 6,577,334 |
| 7,272,706 |
| 16,047,872 |
| 14,845,627 |
| 4,696,991 |
| 2,468,522 |
| 5,380,618 |
| 5,456,400 |
| 3,087,733 |
| 3,578,298 |
| — |
| — |
| 35,790,548 |
| 33,621,553 |
|
|
|
|
|
|
|
|
|
|
|
|
|
|
|
|
|
|
|
|
|
|
|
|
|
|
|
|
|
|
|
Liabilities associated with non-current assets classified as held for sale and discontinued operations |
| — |
| — |
| — |
| — |
| — |
| — |
| — |
| — |
| — |
| — |
| 64,630,389 |
| 50,650,366 |
| 64,630,389 |
| 50,650,366 |
|
|
|
|
|
|
|
|
|
|
|
|
|
|
|
|
|
|
|
|
|
|
|
|
|
|
|
|
|
|
|
NON-CURRENT LIABILITIES |
| 1,798,546,677 |
| 1,929,817,486 |
| 182,056,288 |
| 214,399,921 |
| 866,894,226 |
| 1,140,582,690 |
| 749,238,211 |
| 817,235,201 |
| 525,104,242 |
| 572,081,308 |
| (37,299,979 | ) | (36,367,467 | ) | 4,084,539,665 |
| 4,637,749,139 |
|
Other non-current financial liabilities |
| 1,511,148,690 |
| 1,643,950,501 |
| 87,795,042 |
| 131,351,744 |
| 483,293,292 |
| 725,623,564 |
| 616,376,069 |
| 682,712,921 |
| 316,343,354 |
| 349,805,090 |
| — |
| — |
| 3,014,956,447 |
| 3,533,443,820 |
|
Other non-current payables |
| 3,595,790 |
| 7,570,291 |
| 325,183 |
| 478,409 |
| 33,173,070 |
| 60,139,340 |
| 142,669 |
| 721,362 |
| — |
| — |
| — |
| — |
| 37,236,712 |
| 68,909,402 |
|
Accounts payables to related companies |
| — |
| — |
| 36,634,177 |
| 37,218,338 |
| 1,750,092 |
| 3,556,672 |
| — |
| — |
| — |
| — |
| (37,299,979 | ) | (37,218,338 | ) | 1,084,290 |
| 3,556,672 |
|
Other-long term provisions |
| 17,164,654 |
| 16,062,212 |
| 11,451,261 |
| 7,703,251 |
| 183,780,246 |
| 213,128,470 |
| 2,198,153 |
| 2,725,990 |
| 10,928,015 |
| 10,666,989 |
| — |
| — |
| 225,522,329 |
| 250,286,912 |
|
Deferred tax liabilities |
| 222,646,728 |
| 216,277,536 |
| 21,549,260 |
| 24,538,307 |
| 61,907,742 |
| 69,347,637 |
| 52,263,418 |
| 51,497,425 |
| 197,556,430 |
| 211,388,392 |
| — |
| — |
| 555,923,578 |
| 573,049,297 |
|
Non-current provisions for employee benefits |
| 33,170,562 |
| 32,408,576 |
| 1,400,727 |
| 1,915,904 |
| 102,989,784 |
| 68,787,007 |
| 78,257,902 |
| 79,577,503 |
| — |
| — |
| — |
| — |
| 215,818,975 |
| 182,688,990 |
|
Other non-current non-financial liabilities |
| 10,820,253 |
| 13,548,370 |
| 22,900,638 |
| 11,193,968 |
| — |
| — |
| — |
| — |
| 276,443 |
| 220,837 |
| — |
| 850,871 |
| 33,997,334 |
| 25,814,046 |
|
|
|
|
|
|
|
|
|
|
|
|
|
|
|
|
|
|
|
|
|
|
|
|
|
|
|
|
|
|
|
EQUITY |
| 6,394,984,745 |
| 5,911,635,633 |
| 268,637,728 |
| 283,488,199 |
| 2,882,244,720 |
| 2,819,723,557 |
| 1,206,269,755 |
| 1,529,499,386 |
| 558,029,135 |
| 563,593,921 |
| (4,796,138,127 | ) | (4,730,937,052 | ) | 6,514,027,956 |
| 6,377,003,644 |
|
Equity Attributable to owners of parent |
| 6,394,984,745 |
| 5,911,635,633 |
| 268,637,728 |
| 283,488,199 |
| 2,882,244,720 |
| 2,819,723,557 |
| 1,206,269,755 |
| 1,529,499,386 |
| 558,029,135 |
| 563,593,921 |
| (4,796,138,127 | ) | (4,730,937,052 | ) | 3,735,544,636 |
| 3,518,479,555 |
|
Issued capital |
| 5,504,650,136 |
| 5,486,091,755 |
| 233,455,382 |
| 231,131,872 |
| 1,016,335,188 |
| 1,016,332,368 |
| 147,297,657 |
| 263,851,437 |
| 198,134,490 |
| 198,134,490 |
| (4,274,990,018 | ) | (4,370,659,087 | ) | 2,824,882,835 |
| 2,824,882,835 |
|
Retained earnings |
| 2,687,545,567 |
| 2,779,151,819 |
| 77,431,069 |
| 42,103,877 |
| 466,813,310 |
| 441,729,773 |
| 274,298,955 |
| 266,283,171 |
| 56,504,426 |
| 54,446,993 |
| (1,438,903,818 | ) | (1,766,102,427 | ) | 2,103,689,509 |
| 1,817,613,206 |
|
Share premium |
| 158,759,648 |
| 158,759,648 |
| — |
|
|
| — |
|
|
| — |
|
|
| — |
|
|
| — |
|
|
| 158,759,648 |
| 158,759,648 |
|
Other reserves |
| (1,955,970,606 | ) | (2,512,367,589 | ) | (42,248,723 | ) | 10,252,450 |
| 1,419,096,222 |
| 1,361,661,416 |
| 784,673,143 |
| 999,364,778 |
| 303,390,219 |
| 311,012,438 |
| 917,755,709 |
| 1,405,824,462 |
| (1,351,787,356 | ) | (1,282,776,134 | ) |
|
|
|
|
|
|
|
|
|
|
|
|
|
|
|
|
|
|
|
|
|
|
|
|
|
|
|
|
|
|
Non-controlling interests |
| — |
| — |
| — |
| — |
| — |
| — |
| — |
| — |
| — |
| — |
| — |
| — |
| 2,778,483,320 |
| 2,858,524,089 |
|
|
|
|
|
|
|
|
|
|
|
|
|
|
|
|
|
|
|
|
|
|
|
|
|
|
|
|
|
|
|
TOTAL LIABILITIES AND EQUITY |
| 8,840,993,785 |
| 8,745,381,629 |
| 819,059,283 |
| 813,210,799 |
| 4,498,824,468 |
| 4,537,713,228 |
| 2,388,025,004 |
| 2,680,069,179 |
| 1,205,809,292 |
| 1,257,701,515 |
| (4,746,866,725 | ) | (4,823,936,029 | ) | 13,005,845,017 |
| 13,210,140,321 |
|
Country |
| Chile |
| Argentina |
| Brazil |
| Colombia |
| ||||||||||||||||
STATEMENT OF |
| 12-31-2010 |
| 12-31-2009 |
| 12-31-2008 |
| 12-31-2010 |
| 12-31-2009 |
| 12-31-2008 |
| 12-31-2010 |
| 12-31-2009 |
| 12-31-2008 |
| 12-31-2010 |
| 12-31-2009 |
| 12-31-2008 |
|
CMPRHENSIVE INCOME |
| ThCh$ |
| ThCh$ |
| ThCh$ |
| ThCh$ |
| ThCh$ |
| ThCh$ |
| ThCh$ |
| ThCh$ |
| ThCh$ |
| ThCh$ |
| ThCh$ |
| ThCh$ |
|
REVENUES |
| 2,085,557,501 |
| 2,283,457,941 |
| 2,561,381,944 |
| 658,417,051 |
| 637,839,445 |
| 632,637,111 |
| 2,230,116,193 |
| 1,979,203,998 |
| 1,975,106,500 |
| 1,163,978,952 |
| 1,096,256,547 |
| 974,880,849 |
|
Sales |
| 2,041,203,346 |
| 2,260,373,406 |
| 2,491,246,815 |
| 644,085,670 |
| 624,398,698 |
| 624,490,495 |
| 1,953,154,510 |
| 1,732,004,318 |
| 1,654,781,654 |
| 1,135,970,285 |
| 1,040,262,693 |
| 921,815,437 |
|
Energy sales |
| 1,868,868,808 |
| 2,071,597,022 |
| 2,264,007,672 |
| 614,505,180 |
| 590,796,228 |
| 588,450,892 |
| 1,778,434,279 |
| 1,564,412,704 |
| 1,507,602,436 |
| 1,019,682,987 |
| 948,485,479 |
| 802,743,947 |
|
Other sales |
| 37,515,316 |
| 42,402,319 |
| 39,123,276 |
| — |
| -49,808 |
| -26,17 |
| 3,332,080 |
| 4,180,089 |
| 3,629,769 |
| 6,557,919 |
| 6,515,455 |
| 6,773,311 |
|
Other services rendered |
| 134,819,222 |
| 146,374,065 |
| 188,115,867 |
| 29,580,490 |
| 33,652,278 |
| 36,065,773 |
| 171,388,151 |
| 163,411,525 |
| 143,549,449 |
| 109,729,379 |
| 85,261,759 |
| 112,298,179 |
|
Other operating income |
| 44,354,155 |
| 23,084,535 |
| 70,135,129 |
| 14,331,381 |
| 13,440,747 |
| 8,146,616 |
| 276,961,683 |
| 247,199,680 |
| 320,324,846 |
| 28,008,667 |
| 55,993,854 |
| 53,065,412 |
|
|
|
|
|
|
|
|
|
|
|
|
|
|
|
|
|
|
|
|
|
|
|
|
|
|
|
RAW MATERIALS AND CONSUMABLE USED |
| (1,157,432,602 | ) | (1,131,384,329 | ) | (1,446,959,418 | ) | (413,059,847 | ) | (365,964,562 | ) | (370,813,615 | ) | (1,308,455,877 | ) | (1,074,015,467 | ) | (1,139,232,970 | ) | (463,847,068 | ) | (428,527,683 | ) | (369,319,650 | ) |
Energy purchases |
| (542,253,232 | ) | (581,492,020 | ) | (624,048,664 | ) | (148,902,836 | ) | (160,131,967 | ) | (167,266,666 | ) | (543,260,558 | ) | (443,577,232 | ) | (534,060,340 | ) | (246,229,847 | ) | (229,843,920 | ) | (170,730,018 | ) |
Final consumption |
| (318,644,651 | ) | (345,815,766 | ) | (606,488,766 | ) | (242,853,893 | ) | (180,160,003 | ) | (179,081,276 | ) | (37,260,897 | ) | 6,826,322 |
| (1,475,184 | ) | (27,780,401 | ) | (20,572,023 | ) | (10,740,338 | ) |
Transport expenses |
| (183,181,403 | ) | (107,329,158 | ) | (122,589,953 | ) | (4,875,869 | ) | (6,886,114 | ) | (5,941,477 | ) | (93,660,230 | ) | (82,792,555 | ) | (42,309,186 | ) | (111,637,522 | ) | (105,632,478 | ) | (109,761,926 | ) |
Other variable supplies and services |
| (113,353,316 | ) | (96,747,385 | ) | (93,832,035 | ) | (16,427,249 | ) | (18,786,478 | ) | (18,524,196 | ) | (634,274,192 | ) | (554,472,002 | ) | (561,388,260 | ) | (78,199,298 | ) | (72,479,262 | ) | (78,087,368 | ) |
|
|
|
|
|
|
|
|
|
|
|
|
|
|
|
|
|
|
|
|
|
|
|
|
|
|
CONTRIBUTION MARGIN |
| 928,124,899 |
| 1,152,073,612 |
| 1,114,422,526 |
| 245,357,204 |
| 271,874,883 |
| 261,823,496 |
| 921,660,316 |
| 905,188,531 |
| 835,873,530 |
| 700,131,884 |
| 667,728,864 |
| 605,561,199 |
|
|
|
|
|
|
|
|
|
|
|
|
|
|
|
|
|
|
|
|
|
|
|
|
|
|
|
Other work performed by entity and capitalized |
| 11,962,653 |
| 2,666,652 |
| 2,786,572 |
| 8,296,765 |
| 8,057,055 |
| 9,659,647 |
| 18,128,254 |
| 17,007,228 |
| 13,988,133 |
| 4,423,015 |
| 3,003,205 |
| 3,403,751 |
|
Employee benefits expense |
| (113,164,815 | ) | (110,843,668 | ) | (98,809,277 | ) | (79,533,998 | ) | (79,385,952 | ) | (68,432,786 | ) | (109,354,257 | ) | (108,515,145 | ) | (102,600,391 | ) | (51,541,615 | ) | (47,341,752 | ) | (32,556,642 | ) |
Other expenses |
| (100,976,501 | ) | (106,575,741 | ) | (118,795,022 | ) | (89,055,759 | ) | (77,076,137 | ) | (77,646,187 | ) | (148,686,023 | ) | (158,794,504 | ) | (160,441,991 | ) | (78,880,441 | ) | (75,624,710 | ) | (67,934,089 | ) |
|
|
|
|
|
|
|
|
|
|
|
|
|
|
|
|
|
|
|
|
|
|
|
|
|
|
GROSS OPERATING RESULT |
| 725,946,236 |
| 937,320,855 |
| 899,604,799 |
| 85,064,212 |
| 123,469,849 |
| 125,404,170 |
| 681,748,290 |
| 654,886,110 |
| 586,819,281 |
| 574,132,843 |
| 547,765,607 |
| 508,474,219 |
|
|
|
|
|
|
|
|
|
|
|
|
|
|
|
|
|
|
|
|
|
|
|
|
|
|
|
Depreciation, amortization and impairment losses |
| (119,048,628 | ) | (194,587,688 | ) | (127,972,346 | ) | (34,724,330 | ) | (42,541,505 | ) | (39,515,793 | ) | (229,368,429 | ) | (145,172,290 | ) | (127,709,024 | ) | (102,190,376 | ) | (96,735,454 | ) | (85,664,439 | ) |
|
|
|
|
|
|
|
|
|
|
|
|
|
|
|
|
|
|
|
|
|
|
|
|
|
|
OPERATING INCOME |
| 606,897,608 |
| 742,733,167 |
| 771,632,453 |
| 50,339,882 |
| 80,928,344 |
| 85,888,377 |
| 452,379,861 |
| 509,713,820 |
| 459,110,257 |
| 471,942,467 |
| 451,030,153 |
| 422,809,780 |
|
|
|
|
|
|
|
|
|
|
|
|
|
|
|
|
|
|
|
|
|
|
|
|
|
|
|
FINANCIAL RESULTS |
| (106,356,565 | ) | (114,219,912 | ) | (100,582,441 | ) | (15,788,028 | ) | (40,008,868 | ) | (33,991,662 | ) | (64,838,758 | ) | (69,697,374 | ) | (116,872,511 | ) | (62,523,560 | ) | (72,011,415 | ) | (81,020,937 | ) |
Financial income |
| 15,604,598 |
| 26,321,994 |
| 65,133,484 |
| 10,926,110 |
| 9,381,341 |
| 13,252,883 |
| 132,197,987 |
| 103,326,143 |
| 121,819,505 |
| 11,883,669 |
| 20,075,886 |
| 11,831,792 |
|
Financial costs |
| (109,360,408 | ) | (135,713,458 | ) | (182,620,847 | ) | (34,924,333 | ) | (32,076,508 | ) | (28,731,330 | ) | (193,320,965 | ) | (187,048,645 | ) | (204,079,510 | ) | (74,211,667 | ) | (92,155,200 | ) | (92,660,863 | ) |
Gain (loss) for indexed assets and liabilities |
| (15,055,706 | ) | 21,781,329 |
| (62,378,252 | ) | — |
| — |
| — |
| — |
| — |
| — |
| — |
| — |
| — |
|
Foreign currency exchange differences |
| 2,454,951 |
| (26,609,777 | ) | 79,283,174 |
| 8,209,526 |
| (17,313,701 | ) | (18,513,215 | ) | (3,715,780 | ) | 14,025,128 |
| (34,612,506 | ) | -195,562 |
| 67,899 |
| -191,866 |
|
Gains |
| 38,536,192 |
| 34,338,086 |
| 271,371,140 |
| 20,715,091 |
| 3,564,040 |
| 6,412,116 |
| 30,931,909 |
| 47,716,990 |
| 59,112,491 |
| 963,52 |
| 1,887,294 |
| 1,922,331 |
|
Losses |
| (36,081,241 | ) | (60,947,863 | ) | (192,087,966 | ) | (12,505,565 | ) | (20,877,741 | ) | (24,925,331 | ) | (34,647,689 | ) | (33,691,862 | ) | (93,724,997 | ) | (1,159,082 | ) | (1,819,395 | ) | (2,114,197 | ) |
|
|
|
|
|
|
|
|
|
|
|
|
|
|
|
|
|
|
|
|
|
|
|
|
|
|
Share of the profit (loss) of associates accounted for using the equity method |
| 811,657 |
| (8,074,230 | ) | 6,515,223 |
| 203,884 |
| 374,621 |
| 3,309,096 |
| — |
| — |
| 44,465 |
| — |
| — |
| — |
|
Negative consolidation difference |
| — |
| — |
| — |
| — |
| — |
| — |
| — |
| — |
| — |
| — |
| — |
| — |
|
Gains (losses) from other investments |
| 1,626,786 |
| 172,804 |
| -980,654 |
| 1,596,643 |
| 2,683,755 |
| — |
| 29,251 |
| — |
| — |
| — |
| -34,772 |
| 252,022 |
|
Gains (losses) on sale of property, plant and equipment |
| 8,825,168 |
| 37,360,860 |
| 745,342 |
| — |
| — |
| — |
| -34,755 |
| 486,834 |
| 291,052 |
| 2,515,018 |
| 12,851,414 |
| 74,57 |
|
|
|
|
|
|
|
|
|
|
|
|
|
|
|
|
|
|
|
|
|
|
|
|
|
|
|
NET INCOME BEFORE TAX |
| 511,804,654 |
| 657,972,689 |
| 677,329,923 |
| 36,351,712 |
| 43,977,852 |
| 55,205,811 |
| 387,535,600 |
| 440,503,280 |
| 342,573,263 |
| 411,933,925 |
| 391,835,380 |
| 342,115,435 |
|
|
|
|
|
|
|
|
|
|
|
|
|
|
|
|
|
|
|
|
|
|
|
|
|
|
|
Income tax |
| (91,503,756 | ) | (68,971,765 | ) | (189,164,031 | ) | (13,131,879 | ) | (15,197,010 | ) | (19,940,788 | ) | (66,998,716 | ) | (107,407,226 | ) | (67,172,932 | ) | (134,315,662 | ) | (127,250,804 | ) | (108,259,160 | ) |
|
|
|
|
|
|
|
|
|
|
|
|
|
|
|
|
|
|
|
|
|
|
|
|
|
|
NET INCOME AFTER TAX FROM CONTINUING OPERATIONS |
| 420,300,898 |
| 589,000,924 |
| 488,165,892 |
| 23,219,833 |
| 28,780,842 |
| 35,265,023 |
| 320,536,884 |
| 333,096,054 |
| 275,400,331 |
| 277,618,263 |
| 264,584,576 |
| 233,856,275 |
|
Net income from discontinued operations |
| — |
| — |
| — |
| — |
| — |
| — |
| — |
| — |
| — |
| — |
| — |
| — |
|
NET INCOME |
| 420,300,898 |
| 589,000,924 |
| 488,165,892 |
| 23,219,833 |
| 28,780,842 |
| 35,265,023 |
| 320,536,884 |
| 333,096,054 |
| 275,400,331 |
| 277,618,263 |
| 264,584,576 |
| 233,856,275 |
|
|
|
|
|
|
|
|
|
|
|
|
|
|
|
|
|
|
|
|
|
|
|
|
|
|
|
RESULT FOR THE PERIOD |
| 420,300,898 |
| 589,000,924 |
| 488,165,892 |
| 23,219,833 |
| 28,780,842 |
| 35,265,023 |
| 320,536,884 |
| 333,096,054 |
| 275,400,331 |
| 277,618,263 |
| 264,584,576 |
| 233,856,275 |
|
Owners of parent |
| — |
| — |
| — |
| — |
| — |
| — |
| — |
| — |
| — |
| — |
| — |
| — |
|
Non-controlling interests |
| — |
| — |
| — |
| — |
| — |
| — |
| — |
| — |
| — |
| — |
| — |
| — |
|
Country |
| Peru |
| Eliminations |
| Total |
| ||||||||||||
STATEMENT OF |
| 12-31-2010 |
| 12-31-2009 |
| 12-31-2008 |
| 12-31-2010 |
| 12-31-2009 |
| 12-31-2008 |
| 12-31-2010 |
| 12-31-2009 |
| 12-31-2008 |
|
CMPRHENSIVE INCOME |
| ThCh$ |
| ThCh$ |
| ThCh$ |
| ThCh$ |
| ThCh$ |
| ThCh$ |
| ThCh$ |
| ThCh$ |
| ThCh$ |
|
REVENUES |
| 429,229,748 |
| 479,144,395 |
| 439,343,346 |
| (3,718,332 | ) | (3,846,673 | ) | (3,405,049 | ) | 6,563,581,113 |
| 6,472,055,653 |
| 6,579,944,701 |
|
Sales |
| 408,534,345 |
| 460,091,173 |
| 411,934,933 |
| (3,718,332 | ) | (3,846,673 | ) | (3,405,049 | ) | 6,179,229,824 |
| 6,113,283,615 |
| 6,100,864,285 |
|
Energy sales |
| 372,233,663 |
| 403,854,451 |
| 398,658,925 |
| — |
| — |
| — |
| 5,653,724,917 |
| 5,579,145,884 |
| 5,561,463,872 |
|
Other sales |
| 4,375,367 |
| 5,012,398 |
| (2,533,699 | ) | (1,209,908 | ) | (1,571,194 | ) | (1,374,622 | ) | 50,570,774 |
| 56,489,259 |
| 45,591,865 |
|
Other services rendered |
| 31,925,315 |
| 51,224,324 |
| 15,809,707 |
| (2,508,424 | ) | (2,275,479 | ) | (2,030,427 | ) | 474,934,133 |
| 477,648,472 |
| 493,808,548 |
|
Other operating income |
| 20,695,403 |
| 19,053,222 |
| 27,408,413 |
| — |
| — |
| — |
| 384,351,289 |
| 358,772,038 |
| 479,080,416 |
|
|
|
|
|
|
|
|
|
|
|
|
|
|
|
|
|
|
|
|
|
RAW MATERIALS AND CONSUMABLE USED |
| (180,533,345 | ) | (213,585,176 | ) | (224,934,369 | ) | 1,682,485 |
| 2,883,640 |
| 3,269,736 |
| (3,521,646,254 | ) | (3,210,593,577 | ) | (3,547,990,286 | ) |
Energy purchases |
| (74,068,163 | ) | (105,153,086 | ) | (128,133,297 | ) | — |
| — |
| — |
| (1,554,714,636 | ) | (1,520,198,225 | ) | (1,624,238,985 | ) |
Final consumption |
| (45,498,261 | ) | (40,516,143 | ) | (49,625,820 | ) | — |
| — |
| — |
| (672,038,103 | ) | (580,237,613 | ) | (847,411,384 | ) |
Transport expenses |
| (12,628,068 | ) | (13,647,578 | ) | (14,257,476 | ) | — |
| — |
| — |
| (405,983,092 | ) | (316,287,883 | ) | (294,860,018 | ) |
Other variable supplies and services |
| (48,338,853 | ) | (54,268,369 | ) | (32,917,776 | ) | 1,682,485 |
| 2,883,640 |
| 3,269,736 |
| (888,910,423 | ) | (793,869,856 | ) | (781,479,899 | ) |
|
|
|
|
|
|
|
|
|
|
|
|
|
|
|
|
|
|
|
|
CONTRIBUTION MARGIN |
| 248,696,403 |
| 265,559,219 |
| 214,408,977 |
| (2,035,847 | ) | -963,033 |
| -135,313 |
| 3,041,934,859 |
| 3,261,462,076 |
| 3,031,954,415 |
|
|
|
|
|
|
|
|
|
|
|
|
|
|
|
|
|
|
|
|
|
Other work performed by entity and capitalized |
| 2,058,678 |
| 2,996,379 |
| 2,761,457 |
| — |
| — |
| — |
| 44,869,365 |
| 33,730,519 |
| 32,599,560 |
|
Employee benefits expense |
| (21,083,328 | ) | (24,315,928 | ) | (20,229,337 | ) | — |
| — |
| — |
| (374,678,013 | ) | (370,402,445 | ) | (322,628,433 | ) |
Other expenses |
| (33,890,176 | ) | (40,566,405 | ) | (33,173,638 | ) | 1,054,130 |
| 948,3 |
| 17,779,604 |
| (450,434,770 | ) | (457,689,197 | ) | (440,211,323 | ) |
|
|
|
|
|
|
|
|
|
|
|
|
|
|
|
|
|
|
|
|
GROSS OPERATING RESULT |
| 195,781,577 |
| 203,673,265 |
| 163,767,459 |
| -981,717 |
| -14,733 |
| 17,644,291 |
| 2,261,691,441 |
| 2,467,100,953 |
| 2,301,714,219 |
|
|
|
|
|
|
|
|
|
|
|
|
|
|
|
|
|
|
|
|
|
Depreciation, amortization and impairment losses |
| (60,339,333 | ) | (60,618,547 | ) | (57,201,989 | ) | (11,719,608 | ) | — |
| — |
| (557,390,704 | ) | (539,655,484 | ) | (438,063,591 | ) |
|
|
|
|
|
|
|
|
|
|
|
|
|
|
|
|
|
|
|
|
OPERATING INCOME |
| 135,442,244 |
| 143,054,718 |
| 106,565,470 |
| (12,701,325 | ) | -14,733 |
| 17,644,291 |
| 1,704,300,737 |
| 1,927,445,469 |
| 1,863,650,628 |
|
|
|
|
|
|
|
|
|
|
|
|
|
|
|
|
|
|
|
|
|
FINANCIAL RESULTS |
| (25,742,132 | ) | (34,167,002 | ) | (27,550,531 | ) | 4,645,177 |
| 20,848,425 |
| (59,347,870 | ) | (270,604,535 | ) | (309,256,146 | ) | (419,365,952 | ) |
Financial income |
| 2,116,913 |
| 3,631,106 |
| 2,318,379 |
| (1,492,329 | ) | (3,066,065 | ) | (32,602,708 | ) | 171,236,948 |
| 159,670,405 |
| 181,753,335 |
|
Financial costs |
| (28,154,018 | ) | (38,544,881 | ) | (30,040,734 | ) | 1,613,140 |
| 3,066,065 |
| 23,025,027 |
| (438,358,251 | ) | (482,472,627 | ) | (515,108,257 | ) |
Gain (loss) for indexed assets and liabilities |
| — |
| — |
| — |
| — |
| — |
| — |
| (15,055,706 | ) | 21,781,329 |
| (62,378,252 | ) |
Foreign currency exchange differences |
| 294,973 |
| 746,773 |
| 171,824 |
| 4,524,366 |
| 20,848,425 |
| (49,770,189 | ) | 11,572,474 |
| (8,235,253 | ) | (23,632,778 | ) |
Gains |
| 1,553,835 |
| 2,333,966 |
| 2,087,857 |
| (1,369,179 | ) | (7,825,251 | ) | (266,381,692 | ) | 91,331,368 |
| 82,015,125 |
| 74,524,243 |
|
Losses |
| (1,258,862 | ) | (1,587,193 | ) | (1,916,033 | ) | 5,893,545 |
| 28,673,676 |
| 216,611,503 |
| (79,758,894 | ) | (90,250,378 | ) | (98,157,021 | ) |
|
|
|
|
|
|
|
|
|
|
|
|
|
|
|
|
|
|
|
|
Share of the profit (loss) of associates accounted for using the equity method |
| — |
| 9,935,172 |
| — |
| 198 |
| 16 |
| (6,607,604 | ) | 1,015,739 |
| 2,235,579 |
| 3,261,180 |
|
Negative consolidation difference |
| — |
| — |
| — |
| — |
| — |
| — |
| — |
| — |
| — |
|
Gains (losses) from other investments |
| — |
| — |
| 764,314 |
| (2,979,994 | ) | (2,683,844 | ) | — |
| 272,686 |
| 137,943 |
| 35,682 |
|
Gains (losses) on sale of property, plant and equipment |
| 405,317 |
| -196,773 |
| 1,469,753 |
| — |
| — |
| -77,438 |
| 11,710,749 |
| 50,502,335 |
| 2,503,279 |
|
|
|
|
|
|
|
|
|
|
|
|
|
|
|
|
|
|
|
|
|
NET INCOME BEFORE TAX |
| 110,105,429 |
| 118,626,115 |
| 81,249,006 |
| (11,035,944 | ) | 18,149,864 |
| (48,388,621 | ) | 1,446,695,376 |
| 1,671,065,180 |
| 1,450,084,818 |
|
|
|
|
|
|
|
|
|
|
|
|
|
|
|
|
|
|
|
|
|
Income tax |
| (40,056,955 | ) | (40,910,805 | ) | (31,365,873 | ) | — |
| — |
| — |
| (346,006,968 | ) | (359,737,610 | ) | (415,902,784 | ) |
|
|
|
|
|
|
|
|
|
|
|
|
|
|
|
|
|
|
|
|
NET INCOME AFTER TAX FROM CONTINUING OPERATIONS |
| 70,048,474 |
| 77,715,310 |
| 49,883,133 |
| (11,035,944 | ) | 18,149,864 |
| (48,388,621 | ) | 1,100,688,408 |
| 1,311,327,570 |
| 1,034,182,033 |
|
Net income from discontinued operations |
| — |
| — |
| — |
| — |
| — |
| — |
| — |
| — |
| — |
|
NET INCOME |
| 70,048,474 |
| 77,715,310 |
| 49,883,133 |
| (11,035,944 | ) | 18,149,864 |
| (48,388,621 | ) | 1,100,688,408 |
| 1,311,327,570 |
| 1,034,182,033 |
|
|
|
|
|
|
|
|
|
|
|
|
|
|
|
|
|
|
|
|
|
RESULT FOR THE PERIOD |
| 70,048,474 |
| 77,715,310 |
| 49,883,133 |
| (11,035,944 | ) | 18,149,864 |
| (48,388,621 | ) | 1,100,688,408 |
| 1,311,327,570 |
| 1,034,182,033 |
|
Owners of parent |
| — |
| — |
| — |
| — |
| — |
| — |
| 486,226,814 |
| 660,231,043 |
| 507,589,633 |
|
Non-controlling interests |
| — |
| — |
| — |
| — |
| — |
| — |
| 614,461,594 |
| 651,096,527 |
| 526,592,399 |
|
Line of Business |
| Distribution |
| ||||||||||||||||||||||
Contry |
| Chile |
| Argentina |
| Brazil |
| Colombia |
| ||||||||||||||||
OTHER COMPREHENSIVE |
| 12-31-2010 |
| 12-31-2009 |
| 12-31-2008 |
| 12-31-2010 |
| 12-31-2009 |
| 12-31-2008 |
| 12-31-2010 |
| 12-31-2009 |
| 12-31-2008 |
| 12-31-2010 |
| 12-31-2009 |
| 12-31-2008 |
|
INCOME |
| ThCh$ |
| ThCh$ |
| ThCh$ |
| ThCh$ |
| ThCh$ |
| ThCh$ |
| ThCh$ |
| ThCh$ |
| ThCh$ |
| ThCh$ |
| ThCh$ |
| ThCh$ |
|
TOTAL REVENUE |
| 1,016,997,495 |
| 1,089,515,077 |
| 1,083,673,527 |
| 295,538,314 |
| 327,087,549 |
| 334,163,433 |
| 1,987,041,550 |
| 1,780,335,633 |
| 1,737,351,383 |
| 785,889,588 |
| 741,167,816 |
| 661,474,041 |
|
Sales |
| 1,003,001,004 |
| 1,066,239,632 |
| 1,029,231,804 |
| 287,867,341 |
| 318,293,459 |
| 326,185,382 |
| 1,717,875,184 |
| 1,536,790,709 |
| 1,417,506,289 |
| 757,935,491 |
| 684,930,692 |
| 608,621,511 |
|
Energy sales |
| 900,798,434 |
| 1,007,550,579 |
| 957,408,717 |
| 268,829,105 |
| 297,441,695 |
| 304,372,978 |
| 1,648,205,624 |
| 1,473,905,923 |
| 1,366,406,783 |
| 657,681,311 |
| 585,665,734 |
| 495,404,370 |
|
Other sales |
| 7,166,927 |
| 10,418,293 |
| 14,144,725 |
| — |
| — |
| — |
| — |
| — |
| — |
| 2,035,272 |
| 1,999,965 |
| 1,561,021 |
|
Other services rendered |
| 95,035,643 |
| 48,270,760 |
| 57,678,362 |
| 19,038,236 |
| 20,851,764 |
| 21,812,404 |
| 69,669,560 |
| 62,884,786 |
| 51,099,506 |
| 98,218,908 |
| 97,264,993 |
| 111,656,120 |
|
Other operating income |
| 13,996,491 |
| 23,275,445 |
| 54,441,723 |
| 7,670,973 |
| 8,794,090 |
| 7,978,051 |
| 269,166,366 |
| 243,544,924 |
| 319,845,094 |
| 27,954,097 |
| 56,237,124 |
| 52,852,530 |
|
|
|
|
|
|
|
|
|
|
|
|
|
|
|
|
|
|
|
|
|
|
|
|
|
|
|
RAW MATERIALS AND CONSUMABLE USED |
| (788,044,087 | ) | (845,396,679 | ) | (767,639,080 | ) | (142,565,611 | ) | (153,916,681 | ) | (159,168,886 | ) | (1,310,974,462 | ) | (1,109,711,167 | ) | (1,130,171,924 | ) | (426,625,508 | ) | (393,206,055 | ) | (334,348,884 | ) |
Energy purchases |
| (718,972,828 | ) | (815,863,794 | ) | (733,339,877 | ) | (139,626,236 | ) | (150,780,462 | ) | (155,199,248 | ) | (644,017,840 | ) | (544,826,586 | ) | (581,737,614 | ) | (317,529,068 | ) | (275,176,733 | ) | (216,843,446 | ) |
Final consumption |
| — |
| — |
| — |
| — |
| — |
| — |
| — |
| — |
| — |
| — |
| — |
| — |
|
Transport expenses |
| (45,459,555 | ) | — |
| — |
| (1,239,345 | ) | (1,522,314 | ) | (1,251,828 | ) | (88,561,822 | ) | (77,941,315 | ) | (37,664,618 | ) | (81,668,944 | ) | (79,476,600 | ) | (82,316,166 | ) |
Other variable supplies and services |
| (23,611,704 | ) | (29,532,885 | ) | (34,299,203 | ) | (1,700,030 | ) | (1,613,905 | ) | (2,717,810 | ) | (578,394,800 | ) | (486,943,266 | ) | (510,769,692 | ) | (27,427,496 | ) | (38,552,722 | ) | (35,189,272 | ) |
|
|
|
|
|
|
|
|
|
|
|
|
|
|
|
|
|
|
|
|
|
|
|
|
|
|
CONTRIBUTION MARGIN |
| 228,953,408 |
| 244,118,398 |
| 316,034,447 |
| 152,972,703 |
| 173,170,868 |
| 174,994,547 |
| 676,067,088 |
| 670,624,466 |
| 607,179,459 |
| 359,264,080 |
| 347,961,761 |
| 327,125,157 |
|
|
|
|
|
|
|
|
|
|
|
|
|
|
|
|
|
|
|
|
|
|
|
|
|
|
|
Other work performed by entity and capitalized |
| 2,524,049 |
| 2,666,652 |
| 2,786,572 |
| 8,296,765 |
| 8,057,055 |
| 9,659,647 |
| 18,128,254 |
| 17,007,228 |
| 13,988,133 |
| 3,734,991 |
| 2,485,358 |
| 3,072,770 |
|
Employee benefits expense |
| (24,818,903 | ) | (24,641,080 | ) | (22,379,909 | ) | (63,168,597 | ) | (66,048,079 | ) | (57,132,352 | ) | (86,726,523 | ) | (84,491,569 | ) | (79,763,096 | ) | (30,266,521 | ) | (29,972,265 | ) | (18,866,451 | ) |
Other expenses |
| (64,729,067 | ) | (64,826,993 | ) | (58,294,743 | ) | (77,589,301 | ) | (64,218,481 | ) | (63,964,619 | ) | (146,667,574 | ) | (153,761,807 | ) | (138,155,164 | ) | (61,109,969 | ) | (60,815,070 | ) | (54,306,942 | ) |
|
|
|
|
|
|
|
|
|
|
|
|
|
|
|
|
|
|
|
|
|
|
|
|
|
|
GROSS OPERATING RESULT |
| 141,929,487 |
| 157,316,977 |
| 238,146,367 |
| 20,511,570 |
| 50,961,363 |
| 63,557,223 |
| 460,801,245 |
| 449,378,318 |
| 403,249,332 |
| 271,622,581 |
| 259,659,784 |
| 257,024,534 |
|
|
|
|
|
|
|
|
|
|
|
|
|
|
|
|
|
|
|
|
|
|
|
|
|
|
|
Depreciation, amortization and impairment losses |
| (30,162,735 | ) | (28,284,945 | ) | (24,523,395 | ) | (16,567,619 | ) | (19,085,702 | ) | (17,930,213 | ) | (158,955,423 | ) | (111,178,295 | ) | (94,840,968 | ) | (64,400,224 | ) | (59,775,278 | ) | (54,044,759 | ) |
|
|
|
|
|
|
|
|
|
|
|
|
|
|
|
|
|
|
|
|
|
|
|
|
|
|
OPERATING INCOME |
| 111,766,752 |
| 129,032,032 |
| 213,622,972 |
| 3,943,951 |
| 31,875,661 |
| 45,627,010 |
| 301,845,822 |
| 338,200,023 |
| 308,408,364 |
| 207,222,357 |
| 199,884,506 |
| 202,979,775 |
|
|
|
|
|
|
|
|
|
|
|
|
|
|
|
|
|
|
|
|
|
|
|
|
|
|
|
FINANCIAL RESULTS |
| 2,470,113 |
| 2,906,811 |
| (24,720,995 | ) | (6,198,811 | ) | (5,626,845 | ) | (2,207,707 | ) | (61,918,267 | ) | (57,393,403 | ) | (82,562,607 | ) | (26,452,173 | ) | (29,268,297 | ) | (37,367,598 | ) |
Financial income |
| 10,576,373 |
| 14,891,938 |
| 15,332,306 |
| 9,324,258 |
| 6,866,221 |
| 9,850,439 |
| 103,066,394 |
| 83,232,583 |
| 91,971,784 |
| 9,289,334 |
| 9,885,040 |
| 7,413,288 |
|
Financial costs |
| (8,048,514 | ) | (17,384,760 | ) | (23,194,285 | ) | (16,070,345 | ) | (12,048,619 | ) | (11,419,883 | ) | (163,934,510 | ) | (145,101,661 | ) | (157,038,747 | ) | (35,637,190 | ) | (39,051,936 | ) | (44,767,844 | ) |
Gain (loss) for indexed assets and liabilities |
| 153,805 |
| 458,162 |
| (3,048,824 | ) | — |
| — |
| — |
| — |
| — |
| — |
| — |
| — |
| — |
|
Foreign currency exchange differences |
| (211,551 | ) | 4,941,471 |
| (13,810,192 | ) | 547,276 |
| (444,447 | ) | (638,263 | ) | (1,050,151 | ) | 4,475,675 |
| (17,495,644 | ) | (104,317 | ) | (101,401 | ) | (13,042 | ) |
Gains |
| 2,679,429 |
| 8,283,203 |
| 54,746 |
| 617,720 |
| 1,287,472 |
| 4,141,772 |
| 3,249,786 |
| 6,419,927 |
| 45,866,420 |
| 604,900 |
| 1,561,581 |
| 1,707,677 |
|
Losses |
| (2,890,980 | ) | (3,341,732 | ) | (13,864,938 | ) | (70,444 | ) | (1,731,919 | ) | (4,780,035 | ) | (4,299,937 | ) | (1,944,252 | ) | (63,362,064 | ) | (709,217 | ) | (1,662,982 | ) | (1,720,719 | ) |
|
|
|
|
|
|
|
|
|
|
|
|
|
|
|
|
|
|
|
|
|
|
|
|
|
|
Share of the profit (loss) of associates accounted for using the equity method |
| — |
| 82,756,621 |
| 74,874,562 |
| 911 |
| 1,633 |
| 1,136 |
| — |
| — |
| — |
| — |
| — |
| — |
|
Negative consolidation difference |
| — |
| — |
| — |
| — |
| — |
| — |
| — |
| — |
| — |
| — |
| — |
| — |
|
Gains (losses) from other investments |
| — |
| 82,850 |
| — |
| — |
| — |
| — |
| — |
| — |
| — |
| — |
| — |
| — |
|
Gains (losses) on sale of property, plant and equipment |
| (3,349 | ) | 12,050,737 |
| (303,324 | ) | — |
| — |
| — |
| — |
| 250,284 |
| 285,472 |
| 1,389,720 |
| 12,755,736 |
| (102,143 | ) |
|
|
|
|
|
|
|
|
|
|
|
|
|
|
|
|
|
|
|
|
|
|
|
|
|
|
NET INCOME BEFORE TAX |
| 114,233,516 |
| 226,829,051 |
| 263,473,215 |
| (2,253,949 | ) | 26,250,449 |
| 43,420,439 |
| 239,927,555 |
| 281,056,904 |
| 226,131,229 |
| 182,159,904 |
| 183,371,945 |
| 165,510,034 |
|
|
|
|
|
|
|
|
|
|
|
|
|
|
|
|
|
|
|
|
|
|
|
|
|
|
|
Income tax |
| (23,402,198 | ) | (21,064,399 | ) | (37,443,250 | ) | 635,038 |
| (9,357,145 | ) | (15,723,362 | ) | (46,763,793 | ) | (72,619,778 | ) | (50,427,526 | ) | (56,459,150 | ) | (56,364,261 | ) | (49,651,639 | ) |
|
|
|
|
|
|
|
|
|
|
|
|
|
|
|
|
|
|
|
|
|
|
|
|
|
|
NET INCOME AFTER TAX FROM CONTINUING OPERATIONS |
| 90,831,318 |
| 205,764,652 |
| 226,029,965 |
| (1,618,911 | ) | 16,893,304 |
| 27,697,077 |
| 193,163,762 |
| 208,437,126 |
| 175,703,703 |
| 125,700,754 |
| 127,007,684 |
| 115,858,395 |
|
Net income from discontinued operations |
| — |
| — |
| — |
| — |
| — |
| — |
| — |
| — |
| — |
| — |
| — |
| — |
|
NET INCOME |
| 90,831,318 |
| 205,764,652 |
| 226,029,965 |
| (1,618,911 | ) | 16,893,304 |
| 27,697,077 |
| 193,163,762 |
| 208,437,126 |
| 175,703,703 |
| 125,700,754 |
| 127,007,684 |
| 115,858,395 |
|
|
|
|
|
|
|
|
|
|
|
|
|
|
|
|
|
|
|
|
|
|
|
|
|
|
|
RESULT FOR THE PERIOD |
| 90,831,318 |
| 205,764,652 |
| 226,029,965 |
| (1,618,911 | ) | 16,893,304 |
| 27,697,077 |
| 193,163,762 |
| 208,437,126 |
| 175,703,703 |
| 125,700,754 |
| 127,007,684 |
| 115,858,395 |
|
Owners of parent |
| — |
| — |
| — |
| — |
| — |
| — |
| — |
| — |
| — |
| — |
| — |
| — |
|
Non-controlling interests |
| — |
| — |
| — |
| — |
| — |
| — |
| — |
| — |
| — |
| — |
| — |
| — |
|
Line of Business |
| Distribution |
| ||||||||||||||||
Contry |
| Peru |
| Eliminations |
| Total |
| ||||||||||||
OTHER COMPREHENSIVE |
| 12-31-2010 |
| 12-31-2009 |
| 12-31-2008 |
| 12-31-2010 |
| 12-31-2009 |
| 12-31-2008 |
| 12-31-2010 |
| 12-31-2009 |
| 12-31-2008 |
|
INCOME |
| ThCh$ |
| ThCh$ |
| ThCh$ |
| ThCh$ |
| ThCh$ |
| ThCh$ |
| ThCh$ |
| ThCh$ |
| ThCh$ |
|
TOTAL REVENUE |
| 307,158,970 |
| 302,295,127 |
| 254,640,806 |
| — |
| — |
| — |
| 4,392,625,917 |
| 4,240,401,202 |
| 4,071,303,190 |
|
Sales |
| 286,654,227 |
| 286,037,460 |
| 243,406,969 |
| — |
| — |
| — |
| 4,053,333,247 |
| 3,892,291,952 |
| 3,624,951,955 |
|
Energy sales |
| 279,239,525 |
| 278,264,824 |
| 236,103,382 |
| — |
| — |
| — |
| 3,754,753,999 |
| 3,642,828,755 |
| 3,359,696,230 |
|
Other sales |
| 18,571 |
| 13,193 |
| 12,629 |
| — |
| — |
| — |
| 9,220,770 |
| 12,431,451 |
| 15,718,375 |
|
Other services rendered |
| 7,396,131 |
| 7,759,443 |
| 7,290,958 |
| — |
| — |
| — |
| 289,358,478 |
| 237,031,746 |
| 249,537,350 |
|
Other operating income |
| 20,504,743 |
| 16,257,667 |
| 11,233,837 |
| — |
| — |
| — |
| 339,292,670 |
| 348,109,250 |
| 446,351,235 |
|
|
|
|
|
|
|
|
|
|
|
|
|
|
|
|
|
|
|
|
|
RAW MATERIALS AND CONSUMABLE USED |
| (193,646,086 | ) | (185,706,532 | ) | (149,816,090 | ) | — |
| — |
| — |
| (2,861,855,754 | ) | (2,687,937,114 | ) | (2,541,144,864 | ) |
Energy purchases |
| (168,095,978 | ) | (171,745,296 | ) | (139,863,463 | ) | — |
| — |
| — |
| (1,988,241,950 | ) | (1,958,392,871 | ) | (1,826,983,648 | ) |
Final consumption |
| — |
| — |
| — |
| — |
| — |
| — |
| — |
| — |
| — |
|
Transport expenses |
| — |
| — |
| — |
| — |
| — |
| — |
| (216,929,666 | ) | (158,940,229 | ) | (121,232,612 | ) |
Other variable supplies and services |
| (25,550,108 | ) | (13,961,236 | ) | (9,952,627 | ) | — |
| — |
| — |
| (656,684,138 | ) | (570,604,014 | ) | (592,928,604 | ) |
|
|
|
|
|
|
|
|
|
|
|
|
|
|
|
|
|
|
|
|
CONTRIBUTION MARGIN |
| 113,512,884 |
| 116,588,595 |
| 104,824,716 |
| — |
| — |
| — |
| 1,530,770,163 |
| 1,552,464,088 |
| 1,530,158,326 |
|
|
|
|
|
|
|
|
|
|
|
|
|
|
|
|
|
|
|
|
|
Other work performed by entity and capitalized |
| 2,058,678 |
| 2,782,325 |
| 2,592,123 |
| — |
| — |
| — |
| 34,742,737 |
| 32,998,618 |
| 32,099,245 |
|
Employee benefits expense |
| (10,830,327 | ) | (11,469,891 | ) | (9,776,179 | ) | — |
| — |
| — |
| (215,810,871 | ) | (216,622,884 | ) | (187,917,987 | ) |
Other expenses |
| (18,349,605 | ) | (24,143,832 | ) | (23,905,746 | ) | — |
| — |
| — |
| (368,445,516 | ) | (367,766,183 | ) | (338,627,214 | ) |
|
|
|
|
|
|
|
|
|
|
|
|
|
|
|
|
|
|
|
|
GROSS OPERATING RESULT |
| 86,391,630 |
| 83,757,197 |
| 73,734,914 |
| — |
| — |
| — |
| 981,256,513 |
| 1,001,073,639 |
| 1,035,712,370 |
|
|
|
|
|
|
|
|
|
|
|
|
|
|
|
|
|
|
|
|
|
Depreciation, amortization and impairment losses |
| (21,459,798 | ) | (21,332,334 | ) | (20,790,878 | ) | — |
| — |
| — |
| (291,545,799 | ) | (239,656,554 | ) | (212,130,213 | ) |
|
|
|
|
|
|
|
|
|
|
|
|
|
|
|
|
|
|
|
|
OPERATING INCOME |
| 64,931,832 |
| 62,424,863 |
| 52,944,036 |
| — |
| — |
| — |
| 689,710,714 |
| 761,417,085 |
| 823,582,157 |
|
|
|
|
|
|
|
|
|
|
|
|
|
|
|
|
|
|
|
|
|
FINANCIAL RESULTS |
| (10,890,729 | ) | (10,414,860 | ) | (12,219,957 | ) | 742,300 |
| — |
| — |
| (102,247,567 | ) | (99,796,594 | ) | (159,078,864 | ) |
Financial income |
| 1,621,266 |
| 2,245,332 |
| 2,069,892 |
| — |
| — |
| (1,528,000 | ) | 133,877,625 |
| 117,121,114 |
| 125,109,709 |
|
Financial costs |
| (12,549,137 | ) | (12,867,928 | ) | (14,461,673 | ) | — |
| — |
| 1,528,000 |
| (236,239,696 | ) | (226,454,904 | ) | (249,354,432 | ) |
Gain (loss) for indexed assets and liabilities |
| — |
| — |
| — |
| — |
| — |
| — |
| 153,805 |
| 458,162 |
| (3,048,824 | ) |
Foreign currency exchange differences |
| 37,142 |
| 207,736 |
| 171,824 |
| 742,300 |
| — |
| — |
| (39,301 | ) | 9,079,034 |
| (31,785,317 | ) |
Gains |
| 315,166 |
| 1,032,549 |
| 2,087,857 |
| (204,474 | ) | — |
| — |
| 7,262,527 |
| 18,584,732 |
| 53,858,472 |
|
Losses |
| (278,024 | ) | (824,813 | ) | (1,916,033 | ) | 946,774 |
| — |
| — |
| (7,301,828 | ) | (9,505,698 | ) | (85,643,789 | ) |
|
|
|
|
|
|
|
|
|
|
|
|
|
|
|
|
|
|
|
|
Share of the profit (loss) of associates accounted for using the equity method |
| — |
| — |
| — |
| — |
| — |
| — |
| 911 |
| 82,758,254 |
| 74,875,698 |
|
Negative consolidation difference |
| — |
| — |
| — |
| — |
| — |
| — |
| — |
| — |
| — |
|
Gains (losses) from other investments |
| — |
| — |
| — |
| — |
| — |
| — |
| — |
| 82,850 |
| — |
|
Gains (losses) on sale of property, plant and equipment |
| (21,095 | ) | (117,804 | ) | 2,999,805 |
| — |
| — |
| — |
| 1,365,276 |
| 24,938,953 |
| 2,879,810 |
|
|
|
|
|
|
|
|
|
|
|
|
|
|
|
|
|
|
|
|
|
NET INCOME BEFORE TAX |
| 54,020,008 |
| 51,892,199 |
| 43,723,884 |
| 742,300 |
| — |
| — |
| 588,829,334 |
| 769,400,548 |
| 742,258,801 |
|
|
|
|
|
|
|
|
|
|
|
|
|
|
|
|
|
|
|
|
|
Income tax |
| (18,812,437 | ) | (18,796,395 | ) | (16,154,121 | ) | — |
| — |
| — |
| (144,802,540 | ) | (178,201,978 | ) | (169,399,898 | ) |
|
|
|
|
|
|
|
|
|
|
|
|
|
|
|
|
|
|
|
|
NET INCOME AFTER TAX FROM CONTINUING OPERATIONS |
| 35,207,571 |
| 33,095,804 |
| 27,569,763 |
| 742,300 |
| — |
| — |
| 444,026,794 |
| 591,198,570 |
| 572,858,903 |
|
Net income from discontinued operations |
| — |
| — |
| — |
| — |
| — |
| — |
| — |
| — |
| — |
|
NET INCOME |
| 35,207,571 |
| 33,095,804 |
| 27,569,763 |
| 742,300 |
| — |
| — |
| 444,026,794 |
| 591,198,570 |
| 572,858,903 |
|
|
|
|
|
|
|
|
|
|
|
|
|
|
|
|
|
|
|
|
|
RESULT FOR THE PERIOD |
| 35,207,571 |
| 33,095,804 |
| 27,569,763 |
| 742,300 |
| — |
| — |
| 444,026,794 |
| 591,198,570 |
| 572,858,903 |
|
Owners of parent |
| — |
| — |
| — |
| — |
| — |
| — |
| — |
| — |
| — |
|
Non-controlling interests |
| — |
| — |
| — |
| — |
| — |
| — |
| — |
| — |
| — |
|
33.4 Generation and distribution by countries
a) Generation
Line of Business |
| Generation |
| ||||||||||||||||||||||||||
Country |
| Chile |
| Argentina |
| Brazil |
| Colombia |
| Peru |
| Eliminations |
| Total |
| ||||||||||||||
|
| 12-31-2010 |
| 12-31-2009 |
| 12-31-2010 |
| 12-31-2009 |
| 12-31-2010 |
| 12-31-2009 |
| 12-31-2010 |
| 12-31-2009 |
| 12-31-2010 |
| 12-31-2009 |
| 12-31-2010 |
| 12-31-2009 |
| 12-31-2010 |
| 12-31-2009 |
|
ASSETS |
| ThCh$ |
| ThCh$ |
| ThCh$ |
| ThCh$ |
| ThCh$ |
| ThCh$ |
| ThCh$ |
| ThCh$ |
| ThCh$ |
| ThCh$ |
| ThCh$ |
| ThCh$ |
| ThCh$ |
| ThCh$ |
|
CURRENT ASSETS |
| 581,919,944 |
| 507,744,040 |
| 96,454,500 |
| 140,991,440 |
| 206,821,621 |
| 306,278,528 |
| 154,997,283 |
| 256,813,794 |
| 50,330,357 |
| 54,343,007 |
| (26,213,389 | ) | (14,751,264 | ) | 1,064,310,315 |
| 1,251,419,545 |
|
Cash and cash equivalents |
| 225,658,998 |
| 239,557,586 |
| 18,626,377 |
| 24,950,525 |
| 77,999,226 |
| 172,292,830 |
| 74,583,887 |
| 160,939,980 |
| 13,865,517 |
| 21,294,688 |
| — |
| — |
| 410,734,005 |
| 619,035,609 |
|
Other current financial assets |
| 17,551 |
| 1,536,089 |
| — |
| — |
| 5,463,750 |
| — |
| 54,650 |
| — |
| — |
| — |
| — |
| — |
| 5,535,951 |
| 1,536,089 |
|
Other current non-financial assets |
| 1,073,419 |
| 3,006,861 |
| 2,254,847 |
| 2,376,964 |
| 808,494 |
| 714,402 |
| 1,370,458 |
| 1,554,560 |
| 1,835,063 |
| 2,016,998 |
| — |
| — |
| 7,342,281 |
| 9,669,785 |
|
Trade and other current receivables |
| 150,897,103 |
| 165,592,963 |
| 53,364,468 |
| 91,453,569 |
| 83,976,499 |
| 80,628,076 |
| 41,680,862 |
| 55,169,859 |
| 11,027,554 |
| 11,073,405 |
| (19,872,054 | ) | (7,437,609 | ) | 321,074,432 |
| 396,480,263 |
|
Accounts receivables from related companies |
| 103,058,701 |
| 35,218,885 |
| 20,203,295 |
| 18,151,446 |
| 28,663,608 |
| 32,909,657 |
| 32,368,651 |
| 32,526,869 |
| 8,403,843 |
| 8,979,580 |
| (6,341,335 | ) | (7,313,655 | ) | 186,356,762 |
| 120,472,782 |
|
Inventories |
| 24,443,037 |
| 18,778,149 |
| 1,750,879 |
| 3,803,384 |
| 22,842 |
| 22,134 |
| 4,936,465 |
| 6,622,526 |
| 11,009,380 |
| 10,975,529 |
| — |
| — |
| 42,162,603 |
| 40,201,722 |
|
Current tax assets |
| 76,771,135 |
| 44,053,507 |
| 254,634 |
| 255,552 |
| 9,887,202 |
| 19,711,429 |
| 2,310 |
| — |
| 4,189,000 |
| 2,807 |
| — |
| — |
| 91,104,281 |
| 64,023,295 |
|
|
|
|
|
|
|
|
|
|
|
|
|
|
|
|
|
|
|
|
|
|
|
|
|
|
|
|
|
|
|
Non-current assets classified as held for sale and discontinued operations |
| — |
| — |
| — |
| — |
| — |
| — |
| — |
| — |
| — |
| — |
| — |
| — |
| — |
| — |
|
|
|
|
|
|
|
|
|
|
|
|
|
|
|
|
|
|
|
|
|
|
|
|
|
|
|
|
|
|
|
NON-CURRENT ASSETS |
| 3,989,974,642 |
| 3,993,095,099 |
| 290,297,224 |
| 249,643,009 |
| 614,488,434 |
| 676,395,960 |
| 1,203,713,202 |
| 1,228,326,578 |
| 730,619,632 |
| 785,935,394 |
| (1,020,656,208 | ) | (1,080,086,895 | ) | 5,808,436,926 |
| 5,853,309,145 |
|
Other non-current financial assets |
| 27,935,909 |
| 4,060,933 |
| — |
| — |
| — |
| — |
| — |
| — |
| 359,977 |
| 80,862 |
| — |
| — |
| 28,295,886 |
| 4,141,795 |
|
Other non-current non-financial assets |
| 146,349 |
| 550,079 |
| 10,203,998 |
| 10,805,636 |
| 19,997,184 |
| 19,728,902 |
| 1,111,481 |
| 1,092,649 |
| — |
| 336,605 |
| — |
| — |
| 31,459,012 |
| 32,513,871 |
|
Non-current receivables |
| 1,820,235 |
| 2,378,486 |
| 123,377,243 |
| 62,959,282 |
| 11,129,694 |
| 19,307,193 |
| 2,974,116 |
| 3,028,768 |
| — |
| — |
| — |
| — |
| 139,301,288 |
| 87,673,729 |
|
Non-current account receivables from related companies |
| 5,570,592 |
| — |
| — |
| — |
| 37,063,260 |
| 47,710,556 |
| — |
| — |
| — |
| — |
| (41,869,632 | ) | (36,752,514 | ) | 764,220 |
| 10,958,042 |
|
Investment accounted for using equity method |
| 1,591,313,598 |
| 1,598,184,456 |
| 3,094,078 |
| 3,297,780 |
| 10,950,060 |
| 11,308,690 |
| — |
| 1,366 |
| 49,494,618 |
| 47,596,359 |
| (1,063,491,176 | ) | (1,076,313,557 | ) | 591,361,178 |
| 584,075,094 |
|
Intangible assets other than goodwill |
| 9,638,098 |
| 8,007,620 |
| 190,799 |
| 246,210 |
| 972,900 |
| 4,055,751 |
| 20,247,206 |
| 17,245,016 |
| 349,639 |
| 506,047 |
| — |
| — |
| 31,398,642 |
| 30,060,644 |
|
Goodwil |
| 12,636 |
| 13,692 |
| 2,453,791 |
| 2,780,777 |
| — |
| — |
| — |
| — |
| 10,502,214 |
| 11,050,603 |
| 84,704,600 |
| 88,966,819 |
| 97,673,241 |
| 102,811,891 |
|
Property, plant and equipment, net |
| 2,328,158,165 |
| 2,359,882,964 |
| 136,585,507 |
| 154,533,019 |
| 480,313,680 |
| 528,479,286 |
| 1,125,145,217 |
| 1,148,817,647 |
| 669,094,525 |
| 724,212,506 |
| — |
| (55,987,643 | ) | 4,739,297,094 |
| 4,859,937,779 |
|
Investment property |
| — |
| — |
| — |
| — |
| — |
| — |
| — |
| — |
| — |
| — |
| — |
| — |
| — |
| — |
|
Deferred tax assets |
| 25,379,060 |
| 20,016,869 |
| 14,391,808 |
| 15,020,305 |
| 54,061,656 |
| 45,805,582 |
| 54,235,182 |
| 58,141,132 |
| 818,659 |
| 2,152,412 |
| — |
| — |
| 148,886,365 |
| 141,136,300 |
|
|
|
|
|
|
|
|
|
|
|
|
|
|
|
|
|
|
|
|
|
|
|
|
|
|
|
|
|
|
|
TOTAL ASSETS |
| 4,571,894,586 |
| 4,500,839,139 |
| 386,751,724 |
| 390,634,449 |
| 821,310,055 |
| 982,674,488 |
| 1,358,710,485 |
| 1,485,140,372 |
| 780,949,989 |
| 840,278,401 |
| (1,046,869,597 | ) | (1,094,838,159 | ) | 6,872,747,241 |
| 7,104,728,690 |
|
Line of Business |
| Generation |
| ||||||||||||||||||||||||||
Country |
| Chile |
| Argentina |
| Brazil |
| Colombia |
| Peru |
| Eliminations |
| Total |
| ||||||||||||||
|
| 12-31-2010 |
| 12-31-2009 |
| 12-31-2010 |
| 12-31-2009 |
| 12-31-2010 |
| 12-31-2009 |
| 12-31-2010 |
| 12-31-2009 |
| 12-31-2010 |
| 12-31-2009 |
| 12-31-2010 |
| 12-31-2009 |
| 12-31-2010 |
| 12-31-2009 |
|
LIABILITIES AND EQUITY |
| ThCh$ |
| ThCh$ |
| ThCh$ |
| ThCh$ |
| ThCh$ |
| ThCh$ |
| ThCh$ |
| ThCh$ |
| ThCh$ |
| ThCh$ |
| ThCh$ |
| ThCh$ |
| ThCh$ |
| ThCh$ |
|
|
|
|
|
|
|
|
|
|
|
|
|
|
|
|
|
|
|
|
|
|
|
|
|
|
|
|
|
|
|
CURRENT LIABILITIES |
| 461,971,755 |
| 625,965,349 |
| 151,057,167 |
| 143,720,453 |
| 182,940,166 |
| 180,531,897 |
| 286,630,051 |
| 130,634,275 |
| 61,493,965 |
| 71,313,577 |
| (418,133 | ) | (18,229,801 | ) | 1,143,674,971 |
| 1,133,935,750 |
|
Other current financial liabilities |
| 43,626,925 |
| 189,810,430 |
| 79,751,906 |
| 61,487,491 |
| 64,363,398 |
| 66,171,126 |
| 87,860,103 |
| 57,137,900 |
| 39,501,048 |
| 38,334,893 |
| — |
| — |
| 315,103,380 |
| 412,941,840 |
|
Trade and other current payables |
| 221,957,794 |
| 279,642,827 |
| 28,920,947 |
| 30,014,055 |
| 63,002,748 |
| 55,325,502 |
| 86,644,371 |
| 28,526,181 |
| 16,970,251 |
| 20,319,427 |
| (418,133 | ) | — |
| 417,077,978 |
| 413,827,992 |
|
Accounts payables to related companies |
| 142,252,923 |
| 70,031,934 |
| 28,374,815 |
| 29,317,861 |
| 37,105,842 |
| 49,239,836 |
| 80,508,993 |
| 2,477,464 |
| 218,586 |
| 262,056 |
| — |
| (18,229,801 | ) | 288,461,159 |
| 133,099,350 |
|
Other short-term provisions |
| 35,783,147 |
| 25,922,905 |
| 2,553,179 |
| 1,163,928 |
| 1,874,736 |
| 1,883,131 |
| 22,520 |
| 26,684 |
| 3,097,899 |
| 2,790,365 |
| — |
| — |
| 43,331,481 |
| 31,787,013 |
|
Current tax liabilities |
| 14,656,865 |
| 57,461,125 |
| 11,212,408 |
| 21,511,319 |
| 16,593,444 |
| 7,912,298 |
| 26,604,320 |
| 37,298,367 |
| 692,609 |
| 8,066,064 |
| — |
| — |
| 69,759,646 |
| 132,249,173 |
|
Current provisions for employee benefits |
| — |
| 367,702 |
| — |
| — |
| — |
| — |
| 2,703,107 |
| 3,081,031 |
| — |
| — |
| — |
| — |
| 2,703,107 |
| 3,448,733 |
|
Other current non-financial liabilities |
| 3,694,101 |
| 2,728,426 |
| 243,912 |
| 225,799 |
| (2 | ) | 4 |
| 2,286,637 |
| 2,086,648 |
| 1,013,572 |
| 1,540,772 |
| — |
| — |
| 7,238,220 |
| 6,581,649 |
|
|
|
|
|
|
|
|
|
|
|
|
|
|
|
|
|
|
|
|
|
|
|
|
|
|
|
|
|
|
|
Liabilities associated with non-current assets classified as held for sale and discontinued operations |
| — |
| — |
| — |
| — |
| — |
| — |
| — |
| — |
| — |
| — |
| — |
| — |
| — |
| — |
|
|
|
|
|
|
|
|
|
|
|
|
|
|
|
|
|
|
|
|
|
|
|
|
|
|
|
|
|
|
|
NON-CURRENT LIABILITIES |
| 1,172,214,180 |
| 1,310,207,063 |
| 141,817,640 |
| 160,157,823 |
| 156,436,680 |
| 270,850,843 |
| 356,958,221 |
| 424,071,893 |
| 319,926,947 |
| 358,335,279 |
| (36,634,177 | ) | (36,367,467 | ) | 2,110,719,491 |
| 2,487,255,434 |
|
Other non-current financial liabilities |
| 949,189,055 |
| 1,089,852,354 |
| 70,465,040 |
| 98,646,588 |
| 94,332,102 |
| 162,226,842 |
| 339,291,052 |
| 406,377,244 |
| 168,684,276 |
| 200,034,511 |
| — |
| — |
| 1,621,961,525 |
| 1,957,137,539 |
|
Other non-current payables |
| 3,288,535 |
| 7,361,867 |
| — |
| — |
| 10,117,596 |
| 16,720,727 |
| 142,669 |
| — |
| — |
| — |
| — |
| — |
| 13,548,800 |
| 24,082,594 |
|
Accounts payables to related companies |
| 78,870 |
| 76,986 |
| 36,634,177 |
| 37,218,338 |
| 1,084,290 |
| 46,920,142 |
| — |
| — |
| — |
| — |
| (36,634,177 | ) | (37,218,338 | ) | 1,163,160 |
| 46,997,128 |
|
Other-long term provisions |
| 9,797,457 |
| 9,246,395 |
| — |
| — |
| 46,119,690 |
| 38,132,390 |
| 348,770 |
| 430,975 |
| 10,772,286 |
| 10,482,637 |
| — |
| — |
| 67,038,203 |
| 58,292,397 |
|
Deferred tax liabilities |
| 192,358,468 |
| 184,228,532 |
| 11,817,785 |
| 13,113,742 |
| 4,783,002 |
| 6,850,742 |
| — |
| — |
| 140,470,385 |
| 147,818,131 |
| — |
| — |
| 349,429,640 |
| 352,011,147 |
|
Non-current provisions for employee benefits |
| 9,971,456 |
| 9,313,208 |
| — |
| — |
| — |
| — |
| 17,175,730 |
| 17,263,674 |
| — |
| — |
| — |
| — |
| 27,147,186 |
| 26,576,882 |
|
Other non-current non-financial liabilities |
| 7,530,339 |
| 10,127,721 |
| 22,900,638 |
| 11,179,155 |
| — |
| — |
| — |
| — |
| — |
| — |
| — |
| 850,871 |
| 30,430,977 |
| 22,157,747 |
|
|
|
|
|
|
|
|
|
|
|
|
|
|
|
|
|
|
|
|
|
|
|
|
|
|
|
|
|
|
|
EQUITY |
| 2,937,708,650 |
| 2,564,666,727 |
| 93,876,916 |
| 86,756,173 |
| 481,933,209 |
| 531,291,748 |
| 715,122,213 |
| 930,434,204 |
| 399,529,077 |
| 410,629,545 |
| (1,009,817,287 | ) | (1,040,240,891 | ) | 3,618,352,778 |
| 3,483,537,506 |
|
Equity Attributable to owners of parent |
| 2,937,708,650 |
| 2,564,666,727 |
| 93,876,916 |
| 86,756,173 |
| 481,933,209 |
| 531,291,748 |
| 715,122,213 |
| 930,434,204 |
| 399,529,077 |
| 410,629,545 |
| (1,009,817,287 | ) | (1,040,240,891 | ) | 3,618,352,778 |
| 3,483,537,506 |
|
Issued capital |
| 2,132,404,418 |
| 2,114,323,325 |
| 92,185,037 |
| 92,185,037 |
| 203,659,553 |
| 203,659,553 |
| 142,906,410 |
| 259,460,190 |
| 164,297,758 |
| 164,297,758 |
| (905,021,922 | ) | (1,081,547,390 | ) | 1,830,431,254 |
| 1,752,378,473 |
|
Retained earnings |
| 1,152,825,041 |
| 1,133,764,178 |
| 10,088,706 |
| 3,698,891 |
| 123,291,764 |
| 124,457,334 |
| 149,784,385 |
| 138,029,796 |
| 23,141,069 |
| 21,916,044 |
| 107,147,811 |
| 2,101,411 |
| 1,566,278,776 |
| 1,423,967,654 |
|
Share premium |
| — |
|
|
| — |
|
|
| — |
|
|
| — |
|
|
| — |
|
|
| — |
|
|
| — |
| — |
|
Other reserves |
| (347,520,809 | ) | (683,420,776 | ) | (8,396,827 | ) | (9,127,755 | ) | 154,981,892 |
| 203,174,861 |
| 422,431,418 |
| 532,944,218 |
| 212,090,250 |
| 224,415,743 |
| (211,943,176 | ) | 39,205,088 |
| 221,642,748 |
| 307,191,379 |
|
|
|
|
|
|
|
|
|
|
|
|
|
|
|
|
|
|
|
|
|
|
|
|
|
|
|
|
|
|
|
Non-controlling intersts |
| — |
| — |
| — |
| — |
| — |
| — |
| — |
| — |
| — |
| — |
| — |
| — |
| — |
| — |
|
|
|
|
|
|
|
|
|
|
|
|
|
|
|
|
|
|
|
|
|
|
|
|
|
|
|
|
|
|
|
TOTAL LIABILITIES AND EQUITY |
| 4,571,894,585 |
| 4,500,839,139 |
| 386,751,724 |
| 390,634,449 |
| 821,310,055 |
| 982,674,488 |
| 1,358,710,485 |
| 1,485,140,372 |
| 780,949,989 |
| 840,278,401 |
| (1,046,869,597 | ) | (1,094,838,159 | ) | 6,872,747,241 |
| 7,104,728,690 |
|
Line of Business |
| Generation |
| ||||||||||||||||||||||
Country |
| Chile |
| Argentina |
| Brazil |
| Colombia |
| ||||||||||||||||
STATEMENT OF COMPREHENSIVE |
| 12-31-2010 |
| 12-31-2009 |
| 12-31-2008 |
| 12-31-2010 |
| 12-31-2009 |
| 12-31-2008 |
| 12-31-2010 |
| 12-31-2009 |
| 12-31-2008 |
| 12-31-2010 |
| 12-31-2009 |
| 12-31-2008 |
|
INCOME |
| ThCh$ |
| ThCh$ |
| ThCh$ |
| ThCh$ |
| ThCh$ |
| ThCh$ |
| ThCh$ |
| ThCh$ |
| ThCh$ |
| ThCh$ |
| ThCh$ |
| ThCh$ |
|
REVENUES |
| 1,345,370,795 |
| 1,373,230,894 |
| 1,609,158,073 |
| 358,089,711 |
| 303,112,035 |
| 291,376,414 |
| 359,211,026 |
| 318,321,960 |
| 322,895,567 |
| 507,515,749 |
| 500,964,413 |
| 401,470,271 |
|
Sales |
| 1,315,430,658 |
| 1,367,051,056 |
| 1,607,534,965 |
| 351,429,303 |
| 299,912,430 |
| 291,207,849 |
| 351,386,168 |
| 314,667,204 |
| 322,415,815 |
| 507,137,563 |
| 500,829,922 |
| 401,257,389 |
|
Energy sales |
| 1,286,727,887 |
| 1,349,609,938 |
| 1,551,715,509 |
| 345,706,935 |
| 293,388,675 |
| 284,077,914 |
| 258,243,192 |
| 224,502,356 |
| 256,787,667 |
| 506,194,881 |
| 500,175,971 |
| 400,576,991 |
|
Other sales |
| 15,262,308 |
| 6,009,988 |
| 14,564,928 |
| — |
| — |
| — |
| — |
| — |
| — |
| — |
| — |
| — |
|
Other services rendered |
| 13,440,463 |
| 11,431,130 |
| 41,254,528 |
| 5,722,368 |
| 6,523,755 |
| 7,129,935 |
| 93,142,976 |
| 90,164,848 |
| 65,628,148 |
| 942,682 |
| 653,951 |
| 680,398 |
|
Other operating income |
| 29,940,137 |
| 6,179,838 |
| 1,623,108 |
| 6,660,408 |
| 3,199,605 |
| 168,565 |
| 7,824,858 |
| 3,654,756 |
| 479,752 |
| 378,186 |
| 134,491 |
| 212,882 |
|
|
|
|
|
|
|
|
|
|
|
|
|
|
|
|
|
|
|
|
|
|
|
|
|
|
|
RAW MATERIALS AND CONSUMABLE USED |
| (666,388,433 | ) | (511,521,900 | ) | (871,056,362 | ) | (267,824,397 | ) | (208,539,466 | ) | (206,239,901 | ) | (109,560,464 | ) | (82,267,885 | ) | (105,146,536 | ) | (176,663,972 | ) | (184,067,482 | ) | (128,688,480 | ) |
Energy purchases |
| (139,373,210 | ) | (52,310,897 | ) | (134,937,913 | ) | (9,296,132 | ) | (9,375,553 | ) | (12,067,418 | ) | (27,257,255 | ) | (32,746,221 | ) | (67,914,740 | ) | (72,764,711 | ) | (91,955,452 | ) | (47,123,986 | ) |
Final consumption |
| (318,637,144 | ) | (345,812,585 | ) | (606,484,644 | ) | (242,853,893 | ) | (180,160,003 | ) | (179,081,276 | ) | (37,260,897 | ) | 6,826,322 |
| (1,475,184 | ) | (27,780,401 | ) | (20,572,023 | ) | (10,740,338 | ) |
Transport expenses |
| (161,189,862 | ) | (107,314,035 | ) | (122,578,858 | ) | (3,636,524 | ) | (5,363,800 | ) | (4,689,649 | ) | (5,098,408 | ) | (4,851,240 | ) | (4,644,568 | ) | (50,431,204 | ) | (46,663,960 | ) | (45,787,546 | ) |
Other variable supplies and services |
| (47,188,217 | ) | (6,084,383 | ) | (7,054,947 | ) | (12,037,848 | ) | (13,640,110 | ) | (10,401,558 | ) | (39,943,904 | ) | (51,496,746 | ) | (31,112,044 | ) | (25,687,656 | ) | (24,876,047 | ) | (25,036,610 | ) |
|
|
|
|
|
|
|
|
|
|
|
|
|
|
|
|
|
|
|
|
|
|
|
|
|
|
CONTRIBUTION MARGIN |
| 678,982,362 |
| 861,708,994 |
| 738,101,711 |
| 90,265,314 |
| 94,572,569 |
| 85,136,513 |
| 249,650,562 |
| 236,054,075 |
| 217,749,031 |
| 330,851,777 |
| 316,896,931 |
| 272,781,791 |
|
|
|
|
|
|
|
|
|
|
|
|
|
|
|
|
|
|
|
|
|
|
|
|
|
|
|
Other work performed by entity and capitalized |
| — |
| — |
| — |
| — |
| — |
| — |
| — |
| — |
| — |
| 688,024 |
| 517,847 |
| 330,981 |
|
Employee benefits expense |
| (31,556,880 | ) | (29,654,313 | ) | (25,162,701 | ) | (14,457,685 | ) | (11,009,053 | ) | (9,040,946 | ) | (11,622,887 | ) | (11,417,189 | ) | (9,425,455 | ) | (12,219,664 | ) | (10,959,497 | ) | (7,918,996 | ) |
Other expenses |
| (50,276,801 | ) | (51,829,666 | ) | (49,242,289 | ) | (11,003,847 | ) | (12,461,750 | ) | (11,769,971 | ) | (11,621,153 | ) | (14,560,167 | ) | (13,389,523 | ) | (21,201,983 | ) | (19,127,781 | ) | (17,815,369 | ) |
|
|
|
|
|
|
|
|
|
|
|
|
|
|
|
|
|
|
|
|
|
|
|
|
|
|
GROSS OPERATING RESULT |
| 597,148,681 |
| 780,225,015 |
| 663,696,721 |
| 64,803,782 |
| 71,101,766 |
| 64,325,596 |
| 226,406,522 |
| 210,076,719 |
| 194,934,053 |
| 298,118,154 |
| 287,327,500 |
| 247,378,407 |
|
|
|
|
|
|
|
|
|
|
|
|
|
|
|
|
|
|
|
|
|
|
|
|
|
|
|
Depreciation, amortization and impairment losses |
| (84,379,198 | ) | (140,184,964 | ) | (95,960,199 | ) | (18,093,428 | ) | (23,365,251 | ) | (21,474,934 | ) | (67,594,458 | ) | (32,305,072 | ) | (31,315,802 | ) | (36,580,792 | ) | (36,516,121 | ) | (30,560,196 | ) |
|
|
|
|
|
|
|
|
|
|
|
|
|
|
|
|
|
|
|
|
|
|
|
|
|
|
OPERATING INCOME |
| 512,769,483 |
| 640,040,051 |
| 567,736,522 |
| 46,710,354 |
| 47,736,515 |
| 42,850,662 |
| 158,812,064 |
| 177,771,647 |
| 163,618,251 |
| 261,537,362 |
| 250,811,379 |
| 216,818,211 |
|
|
|
|
|
|
|
|
|
|
|
|
|
|
|
|
|
|
|
|
|
|
|
|
|
|
|
FINANCIAL RESULT |
| (62,503,182 | ) | (89,797,956 | ) | (103,738,107 | ) | (9,499,131 | ) | (33,772,058 | ) | (32,325,027 | ) | (20,035,955 | ) | (25,088,330 | ) | (39,128,021 | ) | (35,915,163 | ) | (42,513,775 | ) | (43,391,504 | ) |
Financial income |
| 4,880,575 |
| 9,495,037 |
| 16,185,633 |
| 1,504,063 |
| 2,507,846 |
| 3,255,124 |
| 19,217,791 |
| 18,523,222 |
| 32,285,675 |
| 3,440,657 |
| 11,968,380 |
| 5,364,390 |
|
Financial costs |
| (70,389,036 | ) | (90,931,585 | ) | (120,459,878 | ) | (18,112,699 | ) | (19,226,132 | ) | (16,877,948 | ) | (36,376,407 | ) | (52,183,133 | ) | (53,210,680 | ) | (39,278,398 | ) | (54,646,985 | ) | (48,548,045 | ) |
Gain (loss) for indexed assets and liabilities |
| (2,885,747 | ) | 9,009,669 |
| (16,686,361 | ) | — |
| — |
| — |
| — |
| — |
| — |
| — |
| — |
| — |
|
Foreign currency exchange differences |
| 5,891,026 |
| (17,371,077 | ) | 17,222,499 |
| 7,109,505 |
| (17,053,772 | ) | (18,702,203 | ) | (2,877,339 | ) | 8,571,581 |
| (18,203,016 | ) | (77,422 | ) | 164,830 |
| (207,849 | ) |
Gains |
| 12,258,950 |
| 28,981,945 |
| 47,547,505 |
| 19,544,626 |
| 2,092,050 |
| 1,443,093 |
| 27,014,846 |
| 39,823,108 |
| 12,692,663 |
| 188,272 |
| 263,663 |
| 128,111 |
|
Losses |
| (6,367,924 | ) | (46,353,022 | ) | (30,325,006 | ) | (12,435,121 | ) | (19,145,822 | ) | (20,145,296 | ) | (29,892,185 | ) | (31,251,527 | ) | (30,895,679 | ) | (265,694 | ) | (98,833 | ) | (335,960 | ) |
|
|
|
|
|
|
|
|
|
|
|
|
|
|
|
|
|
|
|
|
|
|
|
|
|
|
Share of the profit (loss) of associates accounted for using the equity method |
| 811,855 |
| (8,074,214 | ) | 2,567,160 |
| — |
| 372,988 |
| — |
| — |
| — |
| — |
| — |
| — |
| — |
|
Negative consolidation difference |
| — |
| — |
| — |
| — |
| — |
| — |
| — |
| — |
| — |
| — |
| — |
| — |
|
Gains (losses) from other investments |
| 234,251 |
| (20,722 | ) | — |
| — |
| — |
| — |
| — |
| — |
| — |
| — |
| (34,772 | ) | 252,022 |
|
Gains (losses) on sale of property, plant and equipment |
| 24,894 |
| 34,186 |
| (336,047 | ) | — |
| — |
| — |
| 23,169 |
| 25,505 |
| (2,413 | ) | 1,127,732 |
| 83,708 |
| 167,699 |
|
|
|
|
|
|
|
|
|
|
|
|
|
|
|
|
|
|
|
|
|
|
|
|
|
|
|
NET INCOME BEFORE TAX |
| 451,337,301 |
| 542,181,345 |
| 466,229,528 |
| 37,211,223 |
| 14,337,445 |
| 10,525,635 |
| 138,799,278 |
| 152,708,822 |
| 124,487,817 |
| 226,749,931 |
| 208,346,540 |
| 173,846,428 |
|
|
|
|
|
|
|
|
|
|
|
|
|
|
|
|
|
|
|
|
|
|
|
|
|
|
|
Income tax |
| (70,628,343 | ) | (76,281,986 | ) | (131,655,968 | ) | (13,781,110 | ) | (5,927,003 | ) | (4,381,628 | ) | (15,507,514 | ) | (28,251,488 | ) | (14,003,436 | ) | (76,652,558 | ) | (69,788,953 | ) | (57,450,682 | ) |
|
|
|
|
|
|
|
|
|
|
|
|
|
|
|
|
|
|
|
|
|
|
|
|
|
|
NET INCOME AFTER TAX FROM CONTINUING OPERATIONS |
| 380,708,958 |
| 465,899,359 |
| 334,573,560 |
| 23,430,113 |
| 8,410,442 |
| 6,144,007 |
| 123,291,764 |
| 124,457,334 |
| 110,484,381 |
| 150,097,373 |
| 138,557,587 |
| 116,395,746 |
|
Net income from discontinued operations |
| — |
| — |
| — |
| — |
| — |
| — |
| — |
| — |
| — |
| — |
| — |
| — |
|
NET INCOME |
| 380,708,958 |
| 465,899,359 |
| 334,573,560 |
| 23,430,113 |
| 8,410,442 |
| 6,144,007 |
| 123,291,764 |
| 124,457,334 |
| 110,484,381 |
| 150,097,373 |
| 138,557,587 |
| 116,395,746 |
|
|
|
|
|
|
|
|
|
|
|
|
|
|
|
|
|
|
|
|
|
|
|
|
|
|
|
RESULT FOR THE PERIOD |
| 380,708,958 |
| 465,899,359 |
| 334,573,560 |
| 23,430,113 |
| 8,410,442 |
| 6,144,007 |
| 123,291,764 |
| 124,457,334 |
| 110,484,381 |
| 150,097,373 |
| 138,557,587 |
| 116,395,746 |
|
Owners of parent |
| — |
| — |
| — |
| — |
| — |
| — |
| — |
| — |
| — |
| — |
| — |
| — |
|
Non-controlling interests |
| — |
| — |
| — |
| — |
| — |
| — |
| — |
| — |
| — |
| — |
| — |
| — |
|
Line of Business |
| Generation |
| ||||||||||||||||
Country |
| Peru |
| Eliminations |
| Total |
| ||||||||||||
STATEMENT OF COMPREHENSIVE |
| 12-31-2010 |
| 12-31-2009 |
| 12-31-2008 |
| 12-31-2010 |
| 12-31-2009 |
| 12-31-2008 |
| 12-31-2010 |
| 12-31-2009 |
| 12-31-2008 |
|
INCOME |
| ThCh$ |
| ThCh$ |
| ThCh$ |
| ThCh$ |
| ThCh$ |
| ThCh$ |
| ThCh$ |
| ThCh$ |
| ThCh$ |
|
REVENUES |
| 211,263,618 |
| 213,624,981 |
| 208,496,821 |
| (857,568 | ) | (896,628 | ) | — |
| 2,780,593,331 |
| 2,708,357,655 |
| 2,833,397,146 |
|
Sales |
| 210,800,064 |
| 210,576,947 |
| 205,662,615 |
| (857,568 | ) | (896,628 | ) | — |
| 2,735,326,188 |
| 2,692,140,931 |
| 2,828,078,633 |
|
Energy sales |
| 202,614,778 |
| 202,852,442 |
| 204,588,804 |
| — |
| — |
| — |
| 2,599,487,673 |
| 2,570,529,382 |
| 2,697,746,885 |
|
Other sales |
| — |
| — |
| — |
| — |
| — |
| — |
| 15,262,308 |
| 6,009,988 |
| 14,564,928 |
|
Other services rendered |
| 8,185,286 |
| 7,724,505 |
| 1,073,811 |
| (857,568 | ) | (896,628 | ) | — |
| 120,576,207 |
| 115,601,561 |
| 115,766,820 |
|
Other operating income |
| 463,554 |
| 3,048,034 |
| 2,834,206 |
| — |
| — |
| — |
| 45,267,143 |
| 16,216,724 |
| 5,318,513 |
|
|
|
|
|
|
|
|
|
|
|
|
|
|
|
|
|
|
|
|
|
RAW MATERIALS AND CONSUMABLE USED |
| (80,240,613 | ) | (72,013,860 | ) | (98,453,175 | ) | — |
| — |
| — |
| (1,300,677,879 | ) | (1,058,410,593 | ) | (1,409,584,454 | ) |
Energy purchases |
| (15,503,346 | ) | (10,670,605 | ) | (30,303,095 | ) | — |
| — |
| — |
| (264,194,654 | ) | (197,058,728 | ) | (292,347,152 | ) |
Final consumption |
| (45,498,261 | ) | (40,516,143 | ) | (49,625,820 | ) | — |
| — |
| — |
| (672,030,596 | ) | (580,234,432 | ) | (847,407,262 | ) |
Transport expenses |
| (12,778,594 | ) | (13,693,435 | ) | (14,257,476 | ) | — |
| — |
| — |
| (233,134,592 | ) | (177,886,470 | ) | (191,958,097 | ) |
Other variable supplies and services |
| (6,460,412 | ) | (7,133,677 | ) | (4,266,784 | ) | — |
| — |
| — |
| (131,318,037 | ) | (103,230,963 | ) | (77,871,943 | ) |
|
|
|
|
|
|
|
|
|
|
|
|
|
|
|
|
|
|
|
|
CONTRIBUTION MARGIN |
| 131,023,005 |
| 141,611,121 |
| 110,043,646 |
| (857,568 | ) | (896,628 | ) | — |
| 1,479,915,452 |
| 1,649,947,062 |
| 1,423,812,692 |
|
|
|
|
|
|
|
|
|
|
|
|
|
|
|
|
|
|
|
|
|
Other work performed by entity and capitalized |
| — |
| 214,054 |
| 169,334 |
| — |
| — |
| — |
| 688,024 |
| 731,901 |
| 500,315 |
|
Employee benefits expense |
| (6,161,429 | ) | (6,537,925 | ) | (5,650,625 | ) | — |
| — |
| — |
| (76,018,545 | ) | (69,577,977 | ) | (57,198,723 | ) |
Other expenses |
| (16,333,294 | ) | (21,025,750 | ) | (16,383,207 | ) | 857,568 |
| 896,628 |
| 764,241 |
| (109,579,510 | ) | (118,108,486 | ) | (107,836,118 | ) |
|
|
|
|
|
|
|
|
|
|
|
|
|
|
|
|
|
|
|
|
GROSS OPERATING RESULT |
| 108,528,282 |
| 114,261,500 |
| 88,179,148 |
| — |
| — |
| 764,241 |
| 1,295,005,421 |
| 1,462,992,500 |
| 1,259,278,166 |
|
|
|
|
|
|
|
|
|
|
|
|
|
|
|
|
|
|
|
|
|
Depreciation, amortization and impairment losses |
| (38,208,869 | ) | (38,212,838 | ) | (36,233,239 | ) | — |
| — |
| — |
| (244,856,745 | ) | (270,584,246 | ) | (215,544,370 | ) |
|
|
|
|
|
|
|
|
|
|
|
|
|
|
|
|
|
|
|
|
OPERATING INCOME |
| 70,319,413 |
| 76,048,662 |
| 51,945,909 |
| — |
| — |
| 764,241 |
| 1,050,148,676 |
| 1,192,408,254 |
| 1,043,733,796 |
|
|
|
|
|
|
|
|
|
|
|
|
|
|
|
|
|
|
|
|
|
FINANCIAL RESULT |
| (14,738,535 | ) | (23,600,707 | ) | (15,329,863 | ) | 3,473,802 |
| 28,459,148 |
| (9,794,433 | ) | (139,218,164 | ) | (186,313,678 | ) | (243,706,955 | ) |
Financial income |
| 455,981 |
| 1,341,180 |
| 248,487 |
| (1,621,289 | ) | (2,994,499 | ) | (3,252,505 | ) | 27,877,778 |
| 40,841,166 |
| 54,086,804 |
|
Financial costs |
| (15,505,355 | ) | (25,576,058 | ) | (15,578,350 | ) | 1,621,289 |
| 2,994,499 |
| 3,252,505 |
| (178,040,606 | ) | (239,569,394 | ) | (251,422,396 | ) |
Gain (loss) for indexed assets and liabilities |
| — |
| — |
| — |
| — |
| — |
| — |
| (2,885,747 | ) | 9,009,669 |
| (16,686,361 | ) |
Foreign currency exchange differences |
| 310,839 |
| 634,171 |
| — |
| 3,473,802 |
| 28,459,148 |
| (9,794,433 | ) | 13,830,411 |
| 3,404,881 |
| (29,685,002 | ) |
Gains |
| 805,044 |
| 635,100 |
| — |
| (476,265 | ) | — |
| (13,756,340 | ) | 59,335,473 |
| 71,795,866 |
| 48,055,032 |
|
Losses |
| (494,205 | ) | (929 | ) | — |
| 3,950,067 |
| 28,459,148 |
| 3,961,907 |
| (45,505,062 | ) | (68,390,985 | ) | (77,740,034 | ) |
|
|
|
|
|
|
|
|
|
|
|
|
|
|
|
|
|
|
|
|
Share of the profit (loss) of associates accounted for using the equity method |
| — |
| 9,935,172 |
| — |
| — |
| — |
| — |
| 811,855 |
| 2,233,946 |
| 2,567,160 |
|
Negative consolidation difference |
| — |
| — |
| — |
| — |
| — |
| — |
| — |
| — |
| — |
|
Gains (losses) from other investments |
| — |
| — |
| 764,314 |
| — |
| — |
| — |
| 234,251 |
| (55,494 | ) | 1,016,336 |
|
Gains (losses) on sale of property, plant and equipment |
| 455,621 |
| (78,969 | ) | (103,521 | ) | — |
| — |
| — |
| 1,631,415 |
| 64,430 |
| (274,282 | ) |
|
|
|
|
|
|
|
|
|
|
|
|
|
|
|
|
|
|
|
|
NET INCOME BEFORE TAX |
| 56,036,499 |
| 62,304,158 |
| 37,276,839 |
| 3,473,802 |
| 28,459,148 |
| (9,030,192 | ) | 913,608,034 |
| 1,008,337,458 |
| 803,336,055 |
|
|
|
|
|
|
|
|
|
|
|
|
|
|
|
|
|
|
|
|
|
Income tax |
| (20,936,925 | ) | (21,497,520 | ) | (14,500,266 | ) | — |
| — |
| — |
| (197,506,450 | ) | (201,746,950 | ) | (221,991,980 | ) |
|
|
|
|
|
|
|
|
|
|
|
|
|
|
|
|
|
|
|
|
NET INCOME AFTER TAX FROM CONTINUING OPERATIONS |
| 35,099,574 |
| 40,806,638 |
| 22,776,573 |
| 3,473,802 |
| 28,459,148 |
| (9,030,192 | ) | 716,101,584 |
| 806,590,508 |
| 581,344,075 |
|
Net income from discontinued operations |
| — |
| — |
| — |
| — |
| — |
| — |
| — |
| — |
| — |
|
NET INCOME |
| 35,099,574 |
| 40,806,638 |
| 22,776,573 |
| 3,473,802 |
| 28,459,148 |
| (9,030,192 | ) | 716,101,584 |
| 806,590,508 |
| 581,344,075 |
|
|
|
|
|
|
|
|
|
|
|
|
|
|
|
|
|
|
|
|
|
RESULT FOR THE PERIOD |
| 35,099,574 |
| 40,806,638 |
| 22,776,573 |
| 3,473,802 |
| 28,459,148 |
| (9,030,192 | ) | 716,101,584 |
| 806,590,508 |
| 581,344,075 |
|
Owners of parent |
| — |
| — |
| — |
| — |
| — |
| — |
| — |
| — |
| — |
|
Non-controlling interests |
| — |
| — |
| — |
| — |
| — |
| — |
| — |
| — |
| — |
|
b) Distribution
Line of Business |
| Distribution |
| ||||||||||||||||||||||||||
Country |
| Chile |
| Argentina |
| Brazil |
| Colombia |
| Peru |
| Eliminations |
| Total |
| ||||||||||||||
|
| 12-31-2010 |
| 12-31-2009 |
| 12-31-2010 |
| 12-31-2009 |
| 12-31-2010 |
| 12-31-2009 |
| 12-31-2010 |
| 12-31-2009 |
| 12-31-2010 |
| 12-31-2009 |
| 12-31-2010 |
| 12-31-2009 |
| 12-31-2010 |
| 12-31-2009 |
|
ASSETS |
| ThCh$ |
| ThCh$ |
| ThCh$ |
| ThCh$ |
| ThCh$ |
| ThCh$ |
| ThCh$ |
| ThCh$ |
| ThCh$ |
| ThCh$ |
| ThCh$ |
| ThCh$ |
| ThCh$ |
| ThCh$ |
|
|
|
|
|
|
|
|
|
|
|
|
|
|
|
|
|
|
|
|
|
|
|
|
|
|
|
|
|
|
|
CURRENT ASSETS |
| 308,282,584 |
| 201,194,118 |
| 110,182,639 |
| 93,131,605 |
| 406,074,360 |
| 533,785,021 |
| 255,980,239 |
| 333,863,028 |
| 76,808,391 |
| 54,915,535 |
| (698,797 | ) | (490,075 | ) | 1,156,629,416 |
| 1,216,399,232 |
|
Cash and cash equivalents |
| 106,822,082 |
| 17,933,851 |
| 45,328,399 |
| 28,163,140 |
| 53,589,588 |
| 145,450,780 |
| 76,385,965 |
| 232,157,724 |
| 26,792,493 |
| 7,898,726 |
| — |
| — |
| 308,918,527 |
| 431,604,221 |
|
Other current financial assets |
| — |
| — |
| 2,271,690 |
| — |
| — |
| — |
| 9,868 |
| — |
| — |
| — |
| — |
| — |
| 2,281,558 |
| — |
|
Other current non-financial assets |
| 1,422,618 |
| 3,508,628 |
| 1,199,090 |
| 4,765,940 |
| 22,986,384 |
| 12,292,485 |
| 371,248 |
| 959,511 |
| 1,209,481 |
| 927,900 |
| — |
| — |
| 27,188,821 |
| 22,454,464 |
|
Trade and other current receivables |
| 185,002,586 |
| 169,492,117 |
| 52,358,414 |
| 55,933,943 |
| 326,401,464 |
| 358,989,786 |
| 93,252,938 |
| 93,045,071 |
| 44,301,959 |
| 41,842,319 |
| — |
| 20,488 |
| 690,037,361 |
| 719,323,724 |
|
Accounts receivables from related companies |
| 6,640,662 |
| 1,726,640 |
| 379,832 |
| 208,445 |
| 209,526 |
| 465,212 |
| 80,257,637 |
| 1,874,539 |
| 340,135 |
| 307,839 |
| (698,797 | ) | (510,563 | ) | 87,128,995 |
| 4,072,112 |
|
Inventories |
| 2,136,612 |
| 1,370,198 |
| 2,261,326 |
| 3,492,452 |
| 1,307,070 |
| 1,489,962 |
| 5,702,583 |
| 5,826,183 |
| 4,153,152 |
| 3,938,751 |
| — |
| — |
| 15,560,743 |
| 16,117,546 |
|
Current tax assets |
| 6,258,024 |
| 7,162,684 |
| 6,383,888 |
| 567,685 |
| 12,860,328 |
| 15,096,796 |
| — |
| — |
| 11,171 |
| — |
| — |
| — |
| 25,513,411 |
| 22,827,165 |
|
|
|
|
|
|
|
|
|
|
|
|
|
|
|
|
|
|
|
|
|
|
|
|
|
|
|
|
|
|
|
Non-current assets classified as held for sale and discontinued operations |
| — |
| — |
| — |
| — |
| — |
| — |
| — |
| — |
| — |
| — |
| — |
| — |
| — |
| — |
|
|
|
|
|
|
|
|
|
|
|
|
|
|
|
|
|
|
|
|
|
|
|
|
|
|
|
|
|
|
|
NON-CURRENT ASSETS |
| 1,153,691,583 |
| 1,194,415,123 |
| 320,842,717 |
| 320,067,184 |
| 2,026,122,046 |
| 1,879,491,174 |
| 885,875,047 |
| 882,909,627 |
| 356,670,398 |
| 363,706,049 |
| — |
| — |
| 4,743,201,791 |
| 4,640,589,157 |
|
Other non-current financial assets |
| 25,582 |
| 24,920 |
| — |
| — |
| 3,352,698 |
| — |
| 8,267 |
| 874 |
| 1,825,059 |
| 1,647,417 |
| — |
| — |
| 5,211,606 |
| 1,673,211 |
|
Other non-current non-financial assets |
| 550,802 |
| 491,799 |
| 693,473 |
| 786,539 |
| 69,291,066 |
| 59,012,257 |
| — |
| 31,400 |
| — |
| — |
| — |
| — |
| 70,535,341 |
| 60,321,995 |
|
Non-current receivables |
| 7,046,330 |
| 9,640,749 |
| 495,607 |
| 7,846,841 |
| 165,992,532 |
| 82,241,816 |
| 5,847,271 |
| 5,864,754 |
| — |
| 315,381 |
| — |
| — |
| 179,381,740 |
| 105,909,541 |
|
Non-current account receivables from related companies |
| — |
| — |
| — |
| — |
| 324,864 |
| 210,855 |
| — |
| — |
| — |
| — |
| — |
| — |
| 324,864 |
| 210,855 |
|
Investment accounted for using equity method |
| 546,854,493 |
| 578,500,084 |
| 30,151 |
| 33,228 |
| 136,771,841 |
| 105,045,877 |
| — |
| — |
| — |
| — |
| — |
| — |
| 683,656,485 |
| 683,579,189 |
|
Intangible assets other than goodwill |
| 18,189,812 |
| 16,104,398 |
| 3,203,663 |
| 2,903,815 |
| 1,361,527,584 |
| 1,353,856,678 |
| 20,239,478 |
| 17,026,418 |
| 2,274,071 |
| 2,924,376 |
| — |
| — |
| 1,405,434,608 |
| 1,392,815,685 |
|
Goodwil |
| 2,240,478 |
| 2,240,478 |
| — |
| — |
| 120,673,559 |
| 124,648,965 |
| 7,348,467 |
| 7,497,542 |
| — |
| — |
| — |
| — |
| 130,262,504 |
| 134,386,985 |
|
Property, plant and equipment, net |
| 561,616,684 |
| 544,647,596 |
| 298,970,983 |
| 294,838,019 |
| 20,391,138 |
| 14,398,121 |
| 783,716,639 |
| 783,737,988 |
| 352,571,268 |
| 358,818,875 |
| — |
| — |
| 2,017,266,712 |
| 1,996,440,599 |
|
Investment property |
| — |
| — |
| — |
| — |
| — |
| — |
| — |
| — |
| — |
| — |
| — |
| — |
| — |
| — |
|
Deferred tax assets |
| 17,167,402 |
| 42,765,099 |
| 17,448,840 |
| 13,658,742 |
| 147,796,764 |
| 140,076,605 |
| 68,714,925 |
| 68,750,651 |
| — |
| — |
| — |
| — |
| 251,127,931 |
| 265,251,097 |
|
|
|
|
|
|
|
|
|
|
|
|
|
|
|
|
|
|
|
|
|
|
|
|
|
|
|
|
|
|
|
TOTAL ASSETS |
| 1,461,974,167 |
| 1,395,609,241 |
| 431,025,356 |
| 413,198,789 |
| 2,432,196,406 |
| 2,413,276,195 |
| 1,141,855,286 |
| 1,216,772,655 |
| 433,478,789 |
| 418,621,584 |
| (698,797 | ) | (490,075 | ) | 5,899,831,207 |
| 5,856,988,389 |
|
Line of Business |
| Distribution |
| ||||||||||||||||||||||||||
Country |
| Chile |
| Argentina |
| Brazil |
| Colombia |
| Peru |
| Eliminations |
| Total |
| ||||||||||||||
|
| 12-31-2010 |
| 12-31-2009 |
| 12-31-2010 |
| 12-31-2009 |
| 12-31-2010 |
| 12-31-2009 |
| 12-31-2010 |
| 12-31-2009 |
| 12-31-2010 |
| 12-31-2009 |
| 12-31-2010 |
| 12-31-2009 |
| 12-31-2010 |
| 12-31-2009 |
|
LIABILITIES AND EQUITY |
| ThCh$ |
| ThCh$ |
| ThCh$ |
| ThCh$ |
| ThCh$ |
| ThCh$ |
| ThCh$ |
| ThCh$ |
| ThCh$ |
| ThCh$ |
| ThCh$ |
| ThCh$ |
| ThCh$ |
| ThCh$ |
|
CURRENT LIABILITIES |
| 171,286,364 |
| 147,471,992 |
| 226,189,613 |
| 170,584,075 |
| 614,669,478 |
| 456,935,441 |
| 269,331,660 |
| 235,651,234 |
| 78,464,053 |
| 61,137,029 |
| (698,797 | ) | (490,075 | ) | 1,359,242,371 |
| 1,071,289,696 |
|
Other current financial liabilities |
| 2,668 |
| 115,477 |
| 11,553,138 |
| 10,583,980 |
| 200,661,330 |
| 134,048,604 |
| 50,242,207 |
| 84,153,139 |
| 22,404,747 |
| 17,669,038 |
| — |
| — |
| 284,864,090 |
| 246,570,238 |
|
Trade and other current payables |
| 86,947,700 |
| 64,754,414 |
| 159,903,785 |
| 115,839,550 |
| 283,143,792 |
| 202,959,678 |
| 155,442,693 |
| 90,054,931 |
| 29,240,966 |
| 17,175,620 |
| — |
| — |
| 714,678,936 |
| 490,784,193 |
|
Accounts payables to related companies |
| 63,921,986 |
| 59,694,812 |
| 2,212,567 |
| 2,451,028 |
| 91,625,748 |
| 104,779,978 |
| 34,172,478 |
| 34,562,690 |
| 11,517,749 |
| 11,448,425 |
| (698,797 | ) | (490,075 | ) | 202,751,731 |
| 212,446,858 |
|
Other short-term provisions |
| 6,792,229 |
| 7,260,776 |
| 28,780,910 |
| 21,138,602 |
| 6,153,804 |
| 6,106,634 |
| 1,476,148 |
| 3,463,182 |
| 8,275,793 |
| 8,672,619 |
| — |
| — |
| 51,478,884 |
| 46,641,813 |
|
Current tax liabilities |
| 10,039,050 |
| 11,275,178 |
| 7,526,565 |
| 6,040,230 |
| 28,903,026 |
| 7,005,679 |
| 24,090,490 |
| 20,455,585 |
| 4,950,637 |
| 4,329,031 |
| — |
| — |
| 75,509,768 |
| 49,105,703 |
|
Current provisions for employee benefits |
| 1,284,614 |
| 1,239,422 |
| 591,831 |
| 119,702 |
| — |
| — |
| 813,663 |
| — |
| — |
| — |
| — |
| — |
| 2,690,108 |
| 1,359,124 |
|
Other current non-financial liabilities |
| 2,298,117 |
| 3,131,913 |
| 15,620,817 |
| 14,410,983 |
| 4,181,778 |
| 2,034,868 |
| 3,093,981 |
| 2,961,707 |
| 2,074,161 |
| 1,842,296 |
| — |
| — |
| 27,268,854 |
| 24,381,767 |
|
|
|
|
|
|
|
|
|
|
|
|
|
|
|
|
|
|
|
|
|
|
|
|
|
|
|
|
|
|
|
Liabilities associated with non-current assets classified as held for sale and discontinued operations |
| — |
| — |
| — |
| — |
| — |
| — |
| — |
| — |
| — |
| — |
| — |
| — |
| — |
| — |
|
|
|
|
|
|
|
|
|
|
|
|
|
|
|
|
|
|
|
|
|
|
|
|
|
|
|
|
|
|
|
NON-CURRENT LIABILITIES |
| 196,967,970 |
| 219,826,811 |
| 40,238,648 |
| 54,242,098 |
| 711,221,766 |
| 923,842,504 |
| 392,279,990 |
| 393,163,308 |
| 205,177,295 |
| 213,746,029 |
| — |
| — |
| 1,545,885,669 |
| 1,804,820,750 |
|
Other non-current financial liabilities |
| — |
| — |
| 17,330,002 |
| 32,705,156 |
| 388,961,190 |
| 562,375,940 |
| 277,085,017 |
| 276,335,677 |
| 147,659,078 |
| 149,770,579 |
| — |
| — |
| 831,035,287 |
| 1,021,187,352 |
|
Other non-current payables |
| — |
| 450 |
| 325,183 |
| 478,409 |
| 23,055,474 |
| 43,418,613 |
| — |
| 721,362 |
| — |
| — |
| — |
| — |
| 23,380,657 |
| 44,618,834 |
|
Accounts payables to related companies |
| 146,500,704 |
| 170,085,874 |
| — |
| — |
| 1,430,022 |
| 11,767,969 |
| — |
| — |
| — |
| — |
| — |
| — |
| 147,930,726 |
| 181,853,843 |
|
Other-long term provisions |
| 7,367,197 |
| 6,815,239 |
| 11,451,261 |
| 7,703,251 |
| 137,660,556 |
| 174,996,080 |
| 1,849,383 |
| 2,295,015 |
| 155,729 |
| 184,352 |
| — |
| — |
| 158,484,126 |
| 191,993,937 |
|
Deferred tax liabilities |
| 24,272,266 |
| 24,179,982 |
| 9,731,475 |
| 11,424,565 |
| 57,124,740 |
| 62,496,895 |
| 52,263,418 |
| 51,497,425 |
| 57,086,045 |
| 63,570,261 |
| — |
| — |
| 200,477,944 |
| 213,169,128 |
|
Non-current provisions for employee benefits |
| 15,763,453 |
| 15,292,150 |
| 1,400,727 |
| 1,915,904 |
| 102,989,784 |
| 68,787,007 |
| 61,082,172 |
| 62,313,829 |
| — |
| — |
| — |
| — |
| 181,236,136 |
| 148,308,890 |
|
Other non-current non-financial liabilities |
| 3,064,350 |
| 3,453,116 |
| — |
| 14,813 |
| — |
| — |
| — |
| — |
| 276,443 |
| 220,837 |
| — |
| — |
| 3,340,793 |
| 3,688,766 |
|
|
|
|
|
|
|
|
|
|
|
|
|
|
|
|
|
|
|
|
|
|
|
|
|
|
|
|
|
|
|
EQUITY |
| 1,093,719,833 |
| 1,028,310,438 |
| 164,597,095 |
| 188,372,616 |
| 1,106,305,162 |
| 1,032,498,250 |
| 480,243,636 |
| 587,958,113 |
| 149,837,441 |
| 143,738,526 |
| — |
| — |
| 2,994,703,167 |
| 2,980,877,943 |
|
Equity Attributable to owners of parent |
| 1,093,719,833 |
| 1,028,310,438 |
| 164,597,095 |
| 188,372,616 |
| 1,106,305,162 |
| 1,032,498,250 |
| 480,243,636 |
| 587,958,113 |
| 149,837,441 |
| 143,738,526 |
| — |
| — |
| 2,994,703,167 |
| 2,980,877,943 |
|
Issued capital |
| 368,494,984 |
| 368,494,984 |
| 135,477,599 |
| 135,477,598 |
| 581,523,764 |
| 581,523,764 |
| 3,934,010 |
| 3,934,010 |
| 32,841,625 |
| 32,841,625 |
| — |
| — |
| 1,122,271,982 |
| 1,122,271,981 |
|
Retained earnings |
| 998,431,191 |
| 953,527,838 |
| 66,482,841 |
| 34,889,191 |
| 126,556,216 |
| 171,869,360 |
| 123,200,147 |
| 126,241,783 |
| 25,300,513 |
| 24,352,356 |
| — |
| — |
| 1,339,970,908 |
| 1,310,880,528 |
|
Share premium |
| — |
|
|
| — |
|
|
| — |
|
|
| — |
|
|
| — |
|
|
| — |
|
|
| — |
| — |
|
Other reserves |
| (273,206,342 | ) | (293,712,384 | ) | (37,363,345 | ) | 18,005,827 |
| 398,225,182 |
| 279,105,126 |
| 353,109,479 |
| 457,782,320 |
| 91,695,303 |
| 86,544,545 |
| — |
| — |
| 532,460,277 |
| 547,725,434 |
|
|
|
|
|
|
|
|
|
|
|
|
|
|
|
|
|
|
|
|
|
|
|
|
|
|
|
|
|
|
|
Non-Controlling Interests |
| — |
| — |
| — |
| — |
| — |
| — |
| — |
| — |
| — |
| — |
| — |
| — |
| — |
| — |
|
|
|
|
|
|
|
|
|
|
|
|
|
|
|
|
|
|
|
|
|
|
|
|
|
|
|
|
|
|
|
TOTAL LIABILITIES AND EQUITY |
| 1,461,974,167 |
| 1,395,609,241 |
| 431,025,356 |
| 413,198,789 |
| 2,432,196,406 |
| 2,413,276,195 |
| 1,141,855,286 |
| 1,216,772,655 |
| 433,478,789 |
| 418,621,584 |
| (698,797 | ) | (490,075 | ) | 5,899,831,207 |
| 5,856,988,389 |
|
|
|
|
|
|
|
|
|
|
|
|
|
|
|
|
|
|
|
|
|
|
|
|
|
|
|
Line of Business |
| Distribution |
| ||||||||||||||||||||||
Contry |
| Chile |
| Argentina |
| Brazil |
| Colombia |
| ||||||||||||||||
STATEMENT OF COMPREHENSIVE |
| 12-31-2010 |
| 12-31-2009 |
| 12-31-2008 |
| 12-31-2010 |
| 12-31-2009 |
| 12-31-2008 |
| 12-31-2010 |
| 12-31-2009 |
| 12-31-2008 |
| 12-31-2010 |
| 12-31-2009 |
| 12-31-2008 |
|
INCOME |
| ThCh$ |
| ThCh$ |
| ThCh$ |
| ThCh$ |
| ThCh$ |
| ThCh$ |
| ThCh$ |
| ThCh$ |
| ThCh$ |
| ThCh$ |
| ThCh$ |
| ThCh$ |
|
REVENUES |
| 1,016,997,495 |
| 1,089,515,077 |
| 1,083,673,527 |
| 295,538,314 |
| 327,087,549 |
| 334,163,433 |
| 1,987,041,550 |
| 1,780,335,633 |
| 1,737,351,383 |
| 785,889,588 |
| 741,167,816 |
| 661,474,041 |
|
Sales |
| 1,003,001,004 |
| 1,066,239,632 |
| 1,029,231,804 |
| 287,867,341 |
| 318,293,459 |
| 326,185,382 |
| 1,717,875,184 |
| 1,536,790,709 |
| 1,417,506,289 |
| 757,935,491 |
| 684,930,692 |
| 608,621,511 |
|
Energy sales |
| 900,798,434 |
| 1,007,550,579 |
| 957,408,717 |
| 268,829,105 |
| 297,441,695 |
| 304,372,978 |
| 1,648,205,624 |
| 1,473,905,923 |
| 1,366,406,783 |
| 657,681,311 |
| 585,665,734 |
| 495,404,370 |
|
Other sales |
| 7,166,927 |
| 10,418,293 |
| 14,144,725 |
| — |
| — |
| — |
| — |
| — |
| — |
| 2,035,272 |
| 1,999,965 |
| 1,561,021 |
|
Other services rendered |
| 95,035,643 |
| 48,270,760 |
| 57,678,362 |
| 19,038,236 |
| 20,851,764 |
| 21,812,404 |
| 69,669,560 |
| 62,884,786 |
| 51,099,506 |
| 98,218,908 |
| 97,264,993 |
| 111,656,120 |
|
Other operating income |
| 13,996,491 |
| 23,275,445 |
| 54,441,723 |
| 7,670,973 |
| 8,794,090 |
| 7,978,051 |
| 269,166,366 |
| 243,544,924 |
| 319,845,094 |
| 27,954,097 |
| 56,237,124 |
| 52,852,530 |
|
|
|
|
|
|
|
|
|
|
|
|
|
|
|
|
|
|
|
|
|
|
|
|
|
|
|
RAW MATERIALS AND CONSUMABLE USED |
| (788,044,087 | ) | (845,396,679 | ) | (767,639,080 | ) | (142,565,611 | ) | (153,916,681 | ) | (159,168,886 | ) | (1,310,974,462 | ) | (1,109,711,167 | ) | (1,130,171,924 | ) | (426,625,508 | ) | (393,206,055 | ) | (334,348,884 | ) |
Energy purchases |
| (718,972,828 | ) | (815,863,794 | ) | (733,339,877 | ) | (139,626,236 | ) | (150,780,462 | ) | (155,199,248 | ) | (644,017,840 | ) | (544,826,586 | ) | (581,737,614 | ) | (317,529,068 | ) | (275,176,733 | ) | (216,843,446 | ) |
Final consumption |
| — |
| — |
| — |
| — |
| — |
| — |
| — |
| — |
| — |
| — |
| — |
| — |
|
Transport expenses |
| (45,459,555 | ) | — |
| — |
| (1,239,345 | ) | (1,522,314 | ) | (1,251,828 | ) | (88,561,822 | ) | (77,941,315 | ) | (37,664,618 | ) | (81,668,944 | ) | (79,476,600 | ) | (82,316,166 | ) |
Other variable supplies and services |
| (23,611,704 | ) | (29,532,885 | ) | (34,299,203 | ) | (1,700,030 | ) | (1,613,905 | ) | (2,717,810 | ) | (578,394,800 | ) | (486,943,266 | ) | (510,769,692 | ) | (27,427,496 | ) | (38,552,722 | ) | (35,189,272 | ) |
| �� |
|
|
|
|
|
|
|
|
|
|
|
|
|
|
|
|
|
|
|
|
|
|
|
|
CONTRIBUTION MARGIN |
| 228,953,408 |
| 244,118,398 |
| 316,034,447 |
| 152,972,703 |
| 173,170,868 |
| 174,994,547 |
| 676,067,088 |
| 670,624,466 |
| 607,179,459 |
| 359,264,080 |
| 347,961,761 |
| 327,125,157 |
|
|
|
|
|
|
|
|
|
|
|
|
|
|
|
|
|
|
|
|
|
|
|
|
|
|
|
Other work performed by entity and capitalized |
| 2,524,049 |
| 2,666,652 |
| 2,786,572 |
| 8,296,765 |
| 8,057,055 |
| 9,659,647 |
| 18,128,254 |
| 17,007,228 |
| 13,988,133 |
| 3,734,991 |
| 2,485,358 |
| 3,072,770 |
|
Employee benefits expense |
| (24,818,903 | ) | (24,641,080 | ) | (22,379,909 | ) | (63,168,597 | ) | (66,048,079 | ) | (57,132,352 | ) | (86,726,523 | ) | (84,491,569 | ) | (79,763,096 | ) | (30,266,521 | ) | (29,972,265 | ) | (18,866,451 | ) |
Other expenses |
| (64,729,067 | ) | (64,826,993 | ) | (58,294,743 | ) | (77,589,301 | ) | (64,218,481 | ) | (63,964,619 | ) | (146,667,574 | ) | (153,761,807 | ) | (138,155,164 | ) | (61,109,969 | ) | (60,815,070 | ) | (54,306,942 | ) |
|
|
|
|
|
|
|
|
|
|
|
|
|
|
|
|
|
|
|
|
|
|
|
|
|
|
GROSS OPERATING RESULT |
| 141,929,487 |
| 157,316,977 |
| 238,146,367 |
| 20,511,570 |
| 50,961,363 |
| 63,557,223 |
| 460,801,245 |
| 449,378,318 |
| 403,249,332 |
| 271,622,581 |
| 259,659,784 |
| 257,024,534 |
|
|
|
|
|
|
|
|
|
|
|
|
|
|
|
|
|
|
|
|
|
|
|
|
|
|
|
Depreciation, amortization and impairment losses |
| (30,162,735 | ) | (28,284,945 | ) | (24,523,395 | ) | (16,567,619 | ) | (19,085,702 | ) | (17,930,213 | ) | (158,955,423 | ) | (111,178,295 | ) | (94,840,968 | ) | (64,400,224 | ) | (59,775,278 | ) | (54,044,759 | ) |
|
|
|
|
|
|
|
|
|
|
|
|
|
|
|
|
|
|
|
|
|
|
|
|
|
|
OPERATING INCOME |
| 111,766,752 |
| 129,032,032 |
| 213,622,972 |
| 3,943,951 |
| 31,875,661 |
| 45,627,010 |
| 301,845,822 |
| 338,200,023 |
| 308,408,364 |
| 207,222,357 |
| 199,884,506 |
| 202,979,775 |
|
|
|
|
|
|
|
|
|
|
|
|
|
|
|
|
|
|
|
|
|
|
|
|
|
|
|
FINANCIAL RESULTS |
| 2,470,113 |
| 2,906,811 |
| (24,720,995 | ) | (6,198,811 | ) | (5,626,845 | ) | (2,207,707 | ) | (61,918,267 | ) | (57,393,403 | ) | (82,562,607 | ) | (26,452,173 | ) | (29,268,297 | ) | (37,367,598 | ) |
Financial income |
| 10,576,373 |
| 14,891,938 |
| 15,332,306 |
| 9,324,258 |
| 6,866,221 |
| 9,850,439 |
| 103,066,394 |
| 83,232,583 |
| 91,971,784 |
| 9,289,334 |
| 9,885,040 |
| 7,413,288 |
|
Financial costs |
| (8,048,514 | ) | (17,384,760 | ) | (23,194,285 | ) | (16,070,345 | ) | (12,048,619 | ) | (11,419,883 | ) | (163,934,510 | ) | (145,101,661 | ) | (157,038,747 | ) | (35,637,190 | ) | (39,051,936 | ) | (44,767,844 | ) |
Gain (loss) for indexed assets and liabilities |
| 153,805 |
| 458,162 |
| (3,048,824 | ) | — |
| — |
| — |
| — |
| — |
| — |
| — |
| — |
| — |
|
Foreign currency exchange differences |
| (211,551 | ) | 4,941,471 |
| (13,810,192 | ) | 547,276 |
| (444,447 | ) | (638,263 | ) | (1,050,151 | ) | 4,475,675 |
| (17,495,644 | ) | (104,317 | ) | (101,401 | ) | (13,042 | ) |
Gains |
| 2,679,429 |
| 8,283,203 |
| 54,746 |
| 617,720 |
| 1,287,472 |
| 4,141,772 |
| 3,249,786 |
| 6,419,927 |
| 45,866,420 |
| 604,900 |
| 1,561,581 |
| 1,707,677 |
|
Losses |
| (2,890,980 | ) | (3,341,732 | ) | (13,864,938 | ) | (70,444 | ) | (1,731,919 | ) | (4,780,035 | ) | (4,299,937 | ) | (1,944,252 | ) | (63,362,064 | ) | (709,217 | ) | (1,662,982 | ) | (1,720,719 | ) |
|
|
|
|
|
|
|
|
|
|
|
|
|
|
|
|
|
|
|
|
|
|
|
|
|
|
Share of the profit (loss) of associates accounted for using the equity method |
| — |
| 82,756,621 |
| 74,874,562 |
| 911 |
| 1,633 |
| 1,136 |
| — |
| — |
| — |
| — |
| — |
| — |
|
Negative consolidation difference |
| — |
| — |
| — |
| — |
| — |
| — |
| — |
| — |
| — |
| — |
| — |
| — |
|
Gains (losses) from other investments |
| — |
| 82,850 |
| — |
| — |
| — |
| — |
| — |
| — |
| — |
| — |
| — |
| — |
|
Gains (losses) on sale of property, plant and equipment |
| (3,349 | ) | 12,050,737 |
| (303,324 | ) | — |
| — |
| — |
| — |
| 250,284 |
| 285,472 |
| 1,389,720 |
| 12,755,736 |
| (102,143 | ) |
|
|
|
|
|
|
|
|
|
|
|
|
|
|
|
|
|
|
|
|
|
|
|
|
|
|
NET INCOME BEFORE TAX |
| 114,233,516 |
| 226,829,051 |
| 263,473,215 |
| (2,253,949 | ) | 26,250,449 |
| 43,420,439 |
| 239,927,555 |
| 281,056,904 |
| 226,131,229 |
| 182,159,904 |
| 183,371,945 |
| 165,510,034 |
|
|
|
|
|
|
|
|
|
|
|
|
|
|
|
|
|
|
|
|
|
|
|
|
|
|
|
Income tax |
| (23,402,198 | ) | (21,064,399 | ) | (37,443,250 | ) | 635,038 |
| (9,357,145 | ) | (15,723,362 | ) | (46,763,793 | ) | (72,619,778 | ) | (50,427,526 | ) | (56,459,150 | ) | (56,364,261 | ) | (49,651,639 | ) |
|
|
|
|
|
|
|
|
|
|
|
|
|
|
|
|
|
|
|
|
|
|
|
|
|
|
NET INCOME AFTER TAX FROM CONTINUING OPERATIONS |
| 90,831,318 |
| 205,764,652 |
| 226,029,965 |
| (1,618,911 | ) | 16,893,304 |
| 27,697,077 |
| 193,163,762 |
| 208,437,126 |
| 175,703,703 |
| 125,700,754 |
| 127,007,684 |
| 115,858,395 |
|
Net income from discontinued operations |
| — |
| — |
| — |
| — |
| — |
| — |
| — |
| — |
| — |
| — |
| — |
| — |
|
NET INCOME |
| 90,831,318 |
| 205,764,652 |
| 226,029,965 |
| (1,618,911 | ) | 16,893,304 |
| 27,697,077 |
| 193,163,762 |
| 208,437,126 |
| 175,703,703 |
| 125,700,754 |
| 127,007,684 |
| 115,858,395 |
|
|
|
|
|
|
|
|
|
|
|
|
|
|
|
|
|
|
|
|
|
|
|
|
|
|
|
RESULT FOR THE PERIOD |
| 90,831,318 |
| 205,764,652 |
| 226,029,965 |
| (1,618,911 | ) | 16,893,304 |
| 27,697,077 |
| 193,163,762 |
| 208,437,126 |
| 175,703,703 |
| 125,700,754 |
| 127,007,684 |
| 115,858,395 |
|
Owners of parent |
| — |
| — |
| — |
| — |
| — |
| — |
| — |
| — |
| — |
| — |
| — |
| — |
|
Non-controlling interests |
| — |
| — |
| — |
| — |
| — |
| — |
| — |
| — |
| — |
| — |
| — |
| — |
|
Line of Business |
| Distribution |
| ||||||||||||||||
Contry |
| Peru |
| Eliminations |
| Total |
| ||||||||||||
STATEMENT OF COMPREHENSIVE |
| 12-31-2010 |
| 12-31-2009 |
| 12-31-2008 |
| 12-31-2010 |
| 12-31-2009 |
| 12-31-2008 |
| 12-31-2010 |
| 12-31-2009 |
| 12-31-2008 |
|
INCOME |
| ThCh$ |
| ThCh$ |
| ThCh$ |
| ThCh$ |
| ThCh$ |
| ThCh$ |
| ThCh$ |
| ThCh$ |
| ThCh$ |
|
REVENUES |
| 307,158,970 |
| 302,295,127 |
| 254,640,806 |
| — |
| — |
| — |
| 4,392,625,917 |
| 4,240,401,202 |
| 4,071,303,190 |
|
Sales |
| 286,654,227 |
| 286,037,460 |
| 243,406,969 |
| — |
| — |
| — |
| 4,053,333,247 |
| 3,892,291,952 |
| 3,624,951,955 |
|
Energy sales |
| 279,239,525 |
| 278,264,824 |
| 236,103,382 |
| — |
| — |
| — |
| 3,754,753,999 |
| 3,642,828,755 |
| 3,359,696,230 |
|
Other sales |
| 18,571 |
| 13,193 |
| 12,629 |
| — |
| — |
| — |
| 9,220,770 |
| 12,431,451 |
| 15,718,375 |
|
Other services rendered |
| 7,396,131 |
| 7,759,443 |
| 7,290,958 |
| — |
| — |
| — |
| 289,358,478 |
| 237,031,746 |
| 249,537,350 |
|
Other operating income |
| 20,504,743 |
| 16,257,667 |
| 11,233,837 |
| — |
| — |
| — |
| 339,292,670 |
| 348,109,250 |
| 446,351,235 |
|
|
|
|
|
|
|
|
|
|
|
|
|
|
|
|
|
|
|
|
|
RAW MATERIALS AND CONSUMABLE USED |
| (193,646,086 | ) | (185,706,532 | ) | (149,816,090 | ) | — |
| — |
| — |
| (2,861,855,754 | ) | (2,687,937,114 | ) | (2,541,144,864 | ) |
Energy purchases |
| (168,095,978 | ) | (171,745,296 | ) | (139,863,463 | ) | — |
| — |
| — |
| (1,988,241,950 | ) | (1,958,392,871 | ) | (1,826,983,648 | ) |
Final consumption |
| — |
| — |
| — |
| — |
| — |
| — |
| — |
| — |
| — |
|
Transport expenses |
| — |
| — |
| — |
| — |
| — |
| — |
| (216,929,666 | ) | (158,940,229 | ) | (121,232,612 | ) |
Other variable supplies and services |
| (25,550,108 | ) | (13,961,236 | ) | (9,952,627 | ) | — |
| — |
| — |
| (656,684,138 | ) | (570,604,014 | ) | (592,928,604 | ) |
|
|
|
|
|
|
|
|
|
|
|
|
|
|
|
|
|
|
|
|
CONTRIBUTION MARGIN |
| 113,512,884 |
| 116,588,595 |
| 104,824,716 |
| — |
| — |
| — |
| 1,530,770,163 |
| 1,552,464,088 |
| 1,530,158,326 |
|
|
|
|
|
|
|
|
|
|
|
|
|
|
|
|
|
|
|
|
|
Other work performed by entity and capitalized |
| 2,058,678 |
| 2,782,325 |
| 2,592,123 |
| — |
| — |
| — |
| 34,742,737 |
| 32,998,618 |
| 32,099,245 |
|
Employee benefits expense |
| (10,830,327 | ) | (11,469,891 | ) | (9,776,179 | ) | — |
| — |
| — |
| (215,810,871 | ) | (216,622,884 | ) | (187,917,987 | ) |
Other expenses |
| (18,349,605 | ) | (24,143,832 | ) | (23,905,746 | ) | — |
| — |
| — |
| (368,445,516 | ) | (367,766,183 | ) | (338,627,214 | ) |
|
|
|
|
|
|
|
|
|
|
|
|
|
|
|
|
|
|
|
|
GROSS OPERATING RESULT |
| 86,391,630 |
| 83,757,197 |
| 73,734,914 |
| — |
| — |
| — |
| 981,256,513 |
| 1,001,073,639 |
| 1,035,712,370 |
|
|
|
|
|
|
|
|
|
|
|
|
|
|
|
|
|
|
|
|
|
Depreciation, amortization and impairment losses |
| (21,459,798 | ) | (21,332,334 | ) | (20,790,878 | ) | — |
| — |
| — |
| (291,545,799 | ) | (239,656,554 | ) | (212,130,213 | ) |
|
|
|
|
|
|
|
|
|
|
|
|
|
|
|
|
|
|
|
|
OPERATING INCOME |
| 64,931,832 |
| 62,424,863 |
| 52,944,036 |
| — |
| — |
| — |
| 689,710,714 |
| 761,417,085 |
| 823,582,157 |
|
|
|
|
|
|
|
|
|
|
|
|
|
|
|
|
|
|
|
|
|
FINANCIAL RESULTS |
| (10,890,729 | ) | (10,414,860 | ) | (12,219,957 | ) | 742,300 |
| — |
| — |
| (102,247,567 | ) | (99,796,594 | ) | (159,078,864 | ) |
Financial income |
| 1,621,266 |
| 2,245,332 |
| 2,069,892 |
| — |
| — |
| (1,528,000 | ) | 133,877,625 |
| 117,121,114 |
| 125,109,709 |
|
Financial costs |
| (12,549,137 | ) | (12,867,928 | ) | (14,461,673 | ) | — |
| — |
| 1,528,000 |
| (236,239,696 | ) | (226,454,904 | ) | (249,354,432 | ) |
Gain (loss) for indexed assets and liabilities |
| — |
| — |
| — |
| — |
| — |
| — |
| 153,805 |
| 458,162 |
| (3,048,824 | ) |
Foreign currency exchange differences |
| 37,142 |
| 207,736 |
| 171,824 |
| 742,300 |
| — |
| — |
| (39,301 | ) | 9,079,034 |
| (31,785,317 | ) |
Gains |
| 315,166 |
| 1,032,549 |
| 2,087,857 |
| (204,474 | ) | — |
| — |
| 7,262,527 |
| 18,584,732 |
| 53,858,472 |
|
Losses |
| (278,024 | ) | (824,813 | ) | (1,916,033 | ) | 946,774 |
| — |
| — |
| (7,301,828 | ) | (9,505,698 | ) | (85,643,789 | ) |
|
|
|
|
|
|
|
|
|
|
|
|
|
|
|
|
|
|
|
|
Share of the profit (loss) of associates accounted for using the equity method |
| — |
| — |
| — |
| — |
| — |
| — |
| 911 |
| 82,758,254 |
| 74,875,698 |
|
Negative consolidation difference |
| — |
| — |
| — |
| — |
| — |
| — |
| — |
| — |
| — |
|
Gains (losses) from other investments |
| — |
| — |
| — |
| — |
| — |
| — |
| — |
| 82,850 |
| — |
|
Gains (losses) on sale of property, plant and equipment |
| (21,095 | ) | (117,804 | ) | 2,999,805 |
| — |
| — |
| — |
| 1,365,276 |
| 24,938,953 |
| 2,879,810 |
|
|
|
|
|
|
|
|
|
|
|
|
|
|
|
|
|
|
|
|
|
NET INCOME BEFORE TAX |
| 54,020,008 |
| 51,892,199 |
| 43,723,884 |
| 742,300 |
| — |
| — |
| 588,829,334 |
| 769,400,548 |
| 742,258,801 |
|
|
|
|
|
|
|
|
|
|
|
|
|
|
|
|
|
|
|
|
|
Income tax |
| (18,812,437 | ) | (18,796,395 | ) | (16,154,121 | ) | — |
| — |
| — |
| (144,802,540 | ) | (178,201,978 | ) | (169,399,898 | ) |
|
|
|
|
|
|
|
|
|
|
|
|
|
|
|
|
|
|
|
|
NET INCOME AFTER TAX FROM CONTINUING OPERATIONS |
| 35,207,571 |
| 33,095,804 |
| 27,569,763 |
| 742,300 |
| — |
| — |
| 444,026,794 |
| 591,198,570 |
| 572,858,903 |
|
Net income from discontinued operations |
| — |
| — |
| — |
| — |
| — |
| — |
| — |
| — |
| — |
|
NET INCOME |
| 35,207,571 |
| 33,095,804 |
| 27,569,763 |
| 742,300 |
| — |
| — |
| 444,026,794 |
| 591,198,570 |
| 572,858,903 |
|
|
|
|
|
|
|
|
|
|
|
|
|
|
|
|
|
|
|
|
|
RESULT FOR THE PERIOD |
| 35,207,571 |
| 33,095,804 |
| 27,569,763 |
| 742,300 |
| — |
| — |
| 444,026,794 |
| 591,198,570 |
| 572,858,903 |
|
Owners of parent |
| — |
| — |
| — |
| — |
| — |
| — |
| — |
| — |
| — |
|
Non-controlling interests |
| — |
| — |
| — |
| — |
| — |
| — |
| — |
| — |
| — |
|
34 THIRD PARTY GUARANTEE, OTHER CONTINGENT ASSETS AND LIABILITIES AND OTHER COMMITMENTS
34.1 Direct guarantees
|
|
|
|
|
|
|
|
|
|
|
|
|
| Balance Pending |
|
|
|
|
|
|
|
|
|
|
|
|
| ||||
|
| Debtor |
|
|
| Assets Commited |
| At December 31, |
| Guarantee Released |
| ||||||||||||||||||||
Creditor of Guarantee |
| Name |
| Relation |
| Type of Guarantee |
| Type |
| Currency |
| Accounting |
| Currency |
| 2010 |
| 2009 |
| 2011 |
| Assets |
| 2012 |
| Assets |
| 2013 |
| Assets |
|
Various creditors |
| Pangue S.A. |
| Creditor |
| Mortage and Pledge |
| Real Estate and Equipment |
| ThCh$ |
| — |
| ThCh$ |
| — |
| 370,984 |
| — |
| — |
| — |
| — |
| — |
| — |
|
Soc, de Energía de la República Argentina |
| Endesa Argentina, Endesa Costanera |
| Creditor |
| Pledge |
| Shares |
| ThCh$ |
| 664,311 |
| ThCh$ |
| 963,655 |
| 2,923,298 |
| — |
| — |
| — |
| — |
| — |
| — |
|
Mitsubishi |
| Endesa Costanera |
| Creditor |
| Pledge |
| Combined Cycle |
| ThCh$ |
| 41,642,467 |
| ThCh$ |
| 66,236,055 |
| 72,279,911 |
| — |
| — |
| — |
| — |
| — |
| — |
|
Credit Suisse First Boston |
| Endesa Costanera |
| Creditor |
| Pledge |
| Combined Cycle |
| ThCh$ |
| 12,875,127 |
| ThCh$ |
| 4,011,514 |
| 4,346,571 |
| — |
| — |
| — |
| — |
| — |
| — |
|
Various creditors |
| Endesa Matriz |
| Creditor |
| Pledge |
| — |
| ThCh$ |
|
|
| ThCh$ |
| 228,156 |
| 2,728,493 |
| — |
| — |
| — |
| — |
| — |
| — |
|
Various creditors |
| Edegel |
| Creditor |
| Pledge |
| Real Estate |
| ThCh$ |
| 96,211,278 |
| ThCh$ |
| 13,008,383 |
| 39,780,681 |
| — |
| — |
| — |
| — |
| — |
| — |
|
Banco Santander (Agente de garantía) |
| G.N.L. Quintero |
| Investee |
| Pledge |
| Shares |
| ThCh$ |
| — |
| ThCh$ |
| 94,071,116 |
| 93,151,966 |
| — |
| — |
| — |
| — |
| — |
| — |
|
Deutsche Bank (*) / Santander Benelux |
| Enersis S.A. |
| Creditor |
| Deposit Account |
| Deposit Accounts |
| ThCh$ |
| 29,461,230 |
| ThCh$ |
| 62,720,234 |
| 108,091,723 |
| — |
| — |
| — |
| — |
| — |
| — |
|
Various creditors |
| Ampla S.A. |
| Creditor |
| Pledge on Collections and Others |
| — |
| ThCh$ |
| 14,033,299 |
| ThCh$ |
| 84,993,209 |
| 135,611,919 |
| — |
| — |
| — |
| — |
| — |
| — |
|
Various creditors |
| Coelce S.A. |
| Creditor |
| Pledge on Collections and Others |
| — |
| ThCh$ |
| 11,281,150 |
| ThCh$ |
| 102,571,290 |
| 124,589,138 |
| — |
| — |
| — |
| — |
| — |
| — |
|
International Finance Corporation |
| CGT Fortaleza S.A. |
| Creditor |
| Mortage and Pledge |
| Real Estate and Equipment |
| ThCh$ |
| 154,926,900 |
| ThCh$ |
| 17,867,290 |
| 48,053,928 |
| — |
| — |
| — |
| — |
| — |
| — |
|
Various creditors |
| Sinapsis Brazil |
| Creditor |
| Mortage and Pledge |
| Real Estate |
| ThCh$ |
| — |
| ThCh$ |
| — |
| 337,403 |
| — |
| — |
| — |
| — |
| — |
| — |
|
Various creditors |
| Cam Argentina |
| Creditor |
| Pledge |
| Government Bonds |
| ThCh$ |
| 55,222 |
| ThCh$ |
| 49,673 |
| 101,367 |
| — |
| — |
| — |
| — |
| — |
| — |
|
As of December 31, 2010, 2009 and 2008 Enersis and its subsidiaries had commitments for future purchases of energy amounting to ThCh$ 26,115,482,639, ThCh$ 27,957,381,822 and ThCh$ 37,345,298,398, respectively.
34.2 Indirect guarantees
|
|
|
|
|
|
|
|
|
|
|
| Balance Pending |
|
|
|
|
|
|
|
|
|
|
| ||||
Creditor |
| Debtor |
| Assets Commited |
| At December 31, |
| Guarantee Realesed |
| ||||||||||||||||||
of |
| Name |
| Relation |
| Type of |
| Currency |
| Accounting |
| Currency |
| 2010 |
| 2009 |
| 2011 |
| Assets |
| 2012 |
| Assets |
| 2013 |
|
Bank Credit Notes |
| CIEN |
| Subsidiary |
| Guarantee |
| ThCh$ |
| 140,797,232 |
| ThCh$ |
| 140,797,232 |
| 174,741,558 |
| — |
| — |
| — |
| — |
| — |
|
Bonds and Loans Bank |
| Chinango |
| Subsidiary |
| Guarantee |
| ThCh$ |
| 34,817,262 |
| ThCh$ |
| 34,817,262 |
| 26,349,554 |
| — |
| — |
| — |
| — |
| — |
|
34.3 Other information
The Ministry of Economy of Chile, from May 19, 2005 to December 31, 2009, established that regulated energy supply for non-contracted distribution companies must be provided by all electricity generating companies on a pro rata basis of their established capacity.
Subsequent regulations stated that electricity generating companies will receive for supplying energy to non-contracted distribution companies the node price effective at that time and that they would be credited or charged the positive or negative differences, respectively, arising in respect to the marginal cost. In addition, it was also stated that such differences may not be more than 20% of the node price, if so, the remaining balances will be incorporated in subsequents node prices’ calculations, until such differences be fully settled.
The estimated recoverable balance of our subsidiary Endesa Chile totaled Ch$ 66,000 million as of December 31, 2010. Such remaining balance will be recovered by the distributions companies through increases in the tariff rate that will be applied and billed from future energy consumptions by the regulated customers in the Energy System.
35 PERSONNEL FIGURES
Enersis’s personnel, including information regarding subsidiaries and jointly-controlled companies in the five Latin American countries where the Group is present, is distributed as follows as of December 31, 2010 and 2009:
|
| 12-31-2010 |
| ||||||||
Country |
| Managers and |
| Professionals |
| Worker |
| Total |
| Average |
|
Chile |
| 106 |
| 2,397 |
| 546 |
| 3,049 |
| 3,152 |
|
Argentina |
| 33 |
| 2,276 |
| 850 |
| 3,159 |
| 3,115 |
|
Brazil |
| 45 |
| 2,514 |
| 387 |
| 2,946 |
| 2,940 |
|
Peru |
| 18 |
| 944 |
| 177 |
| 1,139 |
| 1,131 |
|
Colombia |
| 27 |
| 1,819 |
| 125 |
| 1,971 |
| 1,923 |
|
Total |
| 229 |
| 9,950 |
| 2,085 |
| 12,264 |
| 12,261 |
|
(*) Include 387 employees from Synapsis and 1,313 employees from Cam (see Note 11).
|
| 12-31-2009 |
| ||||||||
Country |
| Managers and |
| Professionals |
| Worker |
| Total |
| Average |
|
Chile |
| 120 |
| 2,485 |
| 620 |
| 3,225 |
| 3,317 |
|
Argentina |
| 33 |
| 2,233 |
| 846 |
| 3,112 |
| 3,129 |
|
Brazil |
| 50 |
| 2,261 |
| 719 |
| 3,030 |
| 3,135 |
|
Peru |
| 22 |
| 972 |
| 193 |
| 1,187 |
| 1,208 |
|
Colombia |
| 29 |
| 1,746 |
| 141 |
| 1,916 |
| 1,970 |
|
Total |
| 254 |
| 9,697 |
| 2,519 |
| 12,470 |
| 12,759 |
|
36 SUBSEQUENT EVENTS
Due to the electric service interruptions during December 22, 2010 through December 29, 2010 in the south of Buenos Aires, our subsidiary, Edesur was notified of Disposition No. 01/2011 by the Ente Nacional Regulador de la Electricidad en Argentina (E.N.R.E.), the local regulator in Argentina, which orders a comprehensive technical, legal, economic, and financial audit be performed on the company for a period of thirty days. The main purpose of this audit is to verify Edesur’s compliance with its obligations and acquired commitments. The comprehensive audit under consideration started on January 5, 2011.
As of the issuance of the financial statements, E.N.R.E.’s comprehensive audit is ongoing in accordance with the terms and conditions defined by E.N.R.E.. Edesur continues with its activities in the ordinary course of business and continues providing electric distribution services to the public in a regular and continuous manner, thereby meeting its current legal obligations.
Management estimates that the results of the audit will not have a significant impact in Enersis’s consolidated financial statements.
No other significant events have occurred between December 31, 2010 and date of issuance of these financial statements that could materially affect the presentation of the financial statements.
37. ENVIRONMENT
The detail of environmental expenses as of December 31, 2010, 2009 and 2008 is as follows:
Company incurring the cast |
| Project |
| 12-31-2010 |
| 12-31-2009 |
| 12-31-2008 |
|
|
|
|
|
|
|
|
|
|
|
Endesa Chile S.A. |
| Studies, monitoring, lab analysis, removal and final disposal of solid waste in hydroelectric power stations (HPS) and thermoelectric power stations |
| — |
| 2,416,053 |
| 2,159,245 |
|
Gasatacama S.A. |
| Environmental monitoring (air quality, marine monitoring, etc.) |
| 72,984 |
| 65,481 |
| — |
|
Hidroaysén S.A. |
| Educational and Tourism Expenses |
| 294,327 |
| 116,820 |
| — |
|
Pehuenche |
| Environmental Expenses |
|
|
| 57,394 |
| 39,056 |
|
Endesa Costanera S.A. |
| Certification of management system, Quality control and fuel quality, Disposal of dangerous waste, Environmental impact study, Environmental leaflets, Hose inspection and tests, Maintenance ISO14,001/9.001, Liquid waste monitoring, Drilling to monitor water tables and other |
| — |
| — |
| 373,796 |
|
Edegel S.A. |
| Environmental monitoring, waste management, mitigations and restorations. |
| 444,983 |
| 667,059 |
| 633,621 |
|
Codensa |
| Environmental management of PCB transformers. |
| 69,820 |
| 53,926 |
| — |
|
Coelce |
| Environmental monitoring, waste management, ISO 14,001 Audit. |
| 4,344 |
| 212,166 |
| 229,805 |
|
Ampla Energía |
| Environmental license and environmental management equipment |
| 17,377 |
| 8,688 |
| 25,646 |
|
Edesur S.A. |
| Final disposal of residues and contaminating elements. |
| 10,287 |
| 151,563 |
| 88,095 |
|
CIEN |
| Environmental compensation, facility improvement and environmental control, setting up the landscaping project |
|
|
| 11,491 |
| 38,144 |
|
CDSA |
| Repopulation of deposits |
|
|
| 50,449 |
| 37,707 |
|
CGTF |
| Purchase of environmental monitoring equipment. |
|
|
| 25,505 |
| 23,858 |
|
Compañía de Transmisión del Mercosur S.A. |
| ISO 14,001 Audit, Resolution ENRE 57/2003 (Public Safety), environmental monitoring and environmental standards update. |
| 13,412 |
| 10,837 |
| 9,715 |
|
Transportadora de Energía S.A. |
| ISO 14,001 Audit, Resolution ENRE 57/2003 (Public Safety), environmental monitoring and environmental standards update. |
| 14,714 |
| 11,579 |
| 8,039 |
|
|
|
|
|
|
|
|
|
|
|
Total |
| 942,248 |
| 3,859,011 |
| 3,666,727 |
| ||
38. SUMMARIZED FINANCIAL INFORMATION OF PRINCIPAL SUBSIDIARIES AND JOINTLY-CONTROLLED ENTITIES
As of December 31, 2010 and 2009, the summarized financial information under IFRS is as follows:
|
| 12-31-2010 |
| ||||||||||||||||||
|
| Type of Financial |
| Current |
| Non-Current |
| Total |
| Current |
| Non-Current |
| Total |
| Revenue |
| Costs |
| Profit (Loss) |
|
Chilectra S.A. |
| consolidated |
| 308,282,584 |
| 1,153,691,583 |
| 1,461,974,167 |
| (171,286,364 | ) | (196,967,970 | ) | (368,254,334 | ) | 1,003,001,004 |
| (852,052,652 | ) | 150,948,352 |
|
Synapsis Soluc. y Serv. IT Ltda. |
| consolidated |
| 27,547,119 |
| 10,385,607 |
| 37,932,726 |
| (15,618,790 | ) | (1,915,098 | ) | (17,533,888 | ) | 66,028,200 |
| (70,214,530 | ) | (4,186,330 | ) |
Inmobiliaria Manso de Velasco Ltda. |
| consolidated |
| 32,323,759 |
| 35,782,164 |
| 68,105,923 |
| (3,422,178 | ) | (1,623,485 | ) | (5,045,663 | ) | 10,546,195 |
| (2,729,975 | ) | 7,816,220 |
|
Compañía Americana de Multiservicios de Chile Ltda. |
| consolidated |
| 71,769,555 |
| 25,904,845 |
| 97,674,400 |
| (45,136,731 | ) | (6,707,851 | ) | (51,844,582 | ) | 131,410,554 |
| (133,224,067 | ) | (1,813,513 | ) |
ICT Servicios Informáticos Ltda. |
| separate |
| 4,077,868 |
| 233,684 |
| 4,311,552 |
| (3,372,931 | ) | (456,919 | ) | (3,829,850 | ) | 2,174,853 |
| (2,193,935 | ) | (19,082 | ) |
Inversiones Distrilima S.A. |
| separate |
| 368,480 |
| 46,340,936 |
| 46,709,416 |
| (3,835 | ) | — |
| (3,835 | ) | 11,116,825 |
| (18,031 | ) | 11,098,794 |
|
Empresa de Distribución Eléctrica de Lima Norte S.A.A. |
| separate |
| 76,439,911 |
| 356,670,398 |
| 433,110,309 |
| (78,460,218 | ) | (205,177,295 | ) | (283,637,513 | ) | 286,654,227 |
| (251,428,625 | ) | 35,225,602 |
|
Empresa Nacional de Electricidad S.A. |
| separate |
| 693,166,827 |
| 3,171,595,808 |
| 3,864,762,635 |
| (464,147,067 | ) | (1,057,670,971 | ) | (1,521,818,038 | ) | 1,173,423,692 |
| (654,190,040 | ) | 519,233,652 |
|
Endesa Eco S.A. |
| separate |
| 6,327,207 |
| 138,782,297 |
| 145,109,504 |
| (137,123,791 | ) | (20,442,170 | ) | (157,565,961 | ) | 13,515,877 |
| (16,056,170 | ) | (2,540,293 | ) |
Empresa Eléctrica Pehuenche S.A. |
| separate |
| 54,209,408 |
| 242,417,018 |
| 296,626,426 |
| (60,865,292 | ) | (41,020,747 | ) | (101,886,039 | ) | 234,534,178 |
| (57,265,757 | ) | 177,268,421 |
|
Compañía Eléctrica San Isidro S.A. |
| separate |
| 43,642,004 |
| 81,215,943 |
| 124,857,947 |
| (55,987,180 | ) | (11,948,576 | ) | (67,935,756 | ) | 167,998,478 |
| (154,961,416 | ) | 13,037,062 |
|
Empresa Eléctrica Pangue S.A. |
| separate |
| 26,348,540 |
| 135,422,607 |
| 161,771,147 |
| (48,954,765 | ) | (13,940,056 | ) | (62,894,821 | ) | 99,324,285 |
| (35,590,926 | ) | 63,733,359 |
|
Compañía Eléctrica Tarapacá S.A. |
| separate |
| 28,342,554 |
| 77,234,443 |
| 105,576,997 |
| (7,312,647 | ) | (7,839,404 | ) | (15,152,051 | ) | 45,280,244 |
| (41,788,042 | ) | 3,492,202 |
|
Inversiones Endesa Norte S.A. |
| separate |
| — |
| 25,157,716 |
| 25,157,716 |
| (3,370,464 | ) | — |
| (3,370,464 | ) | — |
| (146,130 | ) | (146,130 | ) |
Inversiones Gasatacama Holding Ltda. |
| separate |
| 55,742,095 |
| 145,984,024 |
| 201,726,119 |
| (69,155,266 | ) | (21,720,110 | ) | (90,875,376 | ) | 167,160,648 |
| (147,165,903 | ) | 19,994,745 |
|
Sociedad Concesionaria Túnel el Melón S.A. |
| separate |
| 21,178,870 |
| 17,552,855 |
| 38,731,725 |
| (2,391,836 | ) | (13,674,875 | ) | (16,066,711 | ) | 6,701,752 |
| (2,364,828 | ) | 4,336,924 |
|
Endesa Argentina S.A. |
| separate |
| 7,852,572 |
| 33,753,943 |
| 41,606,515 |
| (44,284 | ) | — |
| (44,284 | ) | 5,641,118 |
| 151,175 |
| 5,792,293 |
|
Endesa Costanera S.A. |
| separate |
| 45,572,669 |
| 128,841,292 |
| 174,413,961 |
| (107,230,903 | ) | (65,903,875 | ) | (173,134,778 | ) | 288,534,151 |
| (290,157,746 | ) | (1,623,595 | ) |
Hidroeléctrica El Chocón S.A. |
| separate |
| 18,399,302 |
| 144,894,940 |
| 163,294,242 |
| (43,781,981 | ) | (38,683,634 | ) | (82,465,615 | ) | 57,172,784 |
| (32,791,612 | ) | 24,381,172 |
|
Emgesa S.A. E.S.P. |
| separate |
| 154,997,283 |
| 1,203,713,202 |
| 1,358,710,485 |
| (286,630,051 | ) | (356,958,221 | ) | (643,588,272 | ) | 507,137,563 |
| (357,040,190 | ) | 150,097,373 |
|
Generandes Perú S.A. |
| separate |
| 54,688 |
| 180,174,348 |
| 180,229,036 |
| (21,008 | ) | — |
| (21,008 | ) | 21,122,454 |
| (214,017 | ) | 20,908,437 |
|
Edegel S.A.A. |
| separate |
| 44,851,844 |
| 643,944,854 |
| 688,796,698 |
| (40,685,019 | ) | (282,540,573 | ) | (323,225,592 | ) | 188,755,959 |
| (152,380,933 | ) | 36,375,026 |
|
Chinango S.A. |
| separate |
| 5,717,609 |
| 98,861,331 |
| 104,578,940 |
| (21,081,723 | ) | (49,460,678 | ) | (70,542,401 | ) | 23,636,752 |
| (19,685,636 | ) | 3,951,116 |
|
Centrales Hidroeléctricas de Aysén S.A. |
| separate |
| 3,880,921 |
| 50,729,673 |
| 54,610,594 |
| (3,904,367 | ) | (327,633 | ) | (4,232,000 | ) | — |
| (3,665,300 | ) | (3,665,300 | ) |
Endesa Brasil S.A. |
| separate |
| 269,141,082 |
| 1,085,178,300 |
| 1,354,319,382 |
| (58,046,034 | ) | — |
| (58,046,034 | ) | 200,739,840 |
| 6,041,979 |
| 206,781,819 |
|
Central Generadora Termoeléctrica Fortaleza S.A. |
| separate |
| 67,892,629 |
| 162,438,204 |
| 230,330,833 |
| (32,581,434 | ) | (39,966,450 | ) | (72,547,884 | ) | 142,546,333 |
| (93,304,291 | ) | 49,242,042 |
|
Centrais Elétricas Cachoeira Dourada S.A. |
| separate |
| 94,488,048 |
| 134,422,068 |
| 228,910,116 |
| (13,765,546 | ) | (7,521,222 | ) | (21,286,768 | ) | 115,662,684 |
| (40,215,273 | ) | 75,447,411 |
|
Compañía de Interconexión Energética S.A. |
| separate |
| 44,440,944 |
| 317,628,162 |
| 362,069,106 |
| (136,593,186 | ) | (108,949,008 | ) | (245,542,194 | ) | 93,177,151 |
| (94,574,840 | ) | (1,397,689 | ) |
Compañía de Transmisión del Mercosur S.A. |
| separate |
| 14,503,105 |
| 3,826,350 |
| 18,329,455 |
| (449,321 | ) | (15,233,324 | ) | (15,682,645 | ) | 2,983,647 |
| (2,420,226 | ) | 563,421 |
|
Compañía Energética Do Ceará S.A. |
| separate |
| 177,267,456 |
| 737,234,010 |
| 914,501,466 |
| (244,318,033 | ) | (226,036,818 | ) | (470,354,851 | ) | 788,759,176 |
| (634,806,589 | ) | 153,952,587 |
|
EN-Brazil Comercio e servicios S.A. |
| separate |
| 1,033,812 |
| 54,708 |
| 1,088,520 |
| (489,835 | ) | — |
| (489,835 | ) | 1,879,321 |
| (1,267,362 | ) | 611,959 |
|
Ampla Energía e Serviços S.A. |
| separate |
| 218,527,158 |
| 1,031,433,894 |
| 1,249,961,052 |
| (307,918,902 | ) | (484,006,188 | ) | (789,274,854 | ) | 929,116,008 |
| (877,038,622 | ) | 52,077,386 |
|
Ampla Investimentos e Serviços S.A. |
| separate |
| 1,579,764 |
| 136,771,841 |
| 138,351,605 |
| (60,967,554 | ) | — |
| (60,967,554 | ) | — |
| 22,325,366 |
| 22,325,366 |
|
Compañía Distribuidora y Comercializadora de Energía S.A. |
| separate |
| 251,294,158 |
| 865,089,733 |
| 1,116,383,891 |
| (262,861,871 | ) | (377,891,111 | ) | (640,752,982 | ) | 723,345,987 |
| (599,569,993 | ) | 123,775,994 |
|
Empresa de Energía de Cundinamarca S.A. |
| separate |
| 10,831,321 |
| 46,553,360 |
| 57,384,681 |
| (12,615,030 | ) | (14,388,879 | ) | (27,003,909 | ) | 36,621,778 |
| (31,864,753 | ) | 4,757,025 |
|
Empresa Distribuidora Sur S.A. |
| separate |
| 110,182,639 |
| 320,842,717 |
| 431,025,356 |
| (226,189,613 | ) | (40,238,648 | ) | (266,428,261 | ) | 287,867,341 |
| (289,486,252 | ) | (1,618,911 | ) |
|
| 12-31-2009 |
| ||||||||||||||||||
|
| Financial |
| Current |
| Non-Current |
| Total |
| Current |
| Non-Current |
| Total |
| Revenue |
| Costs |
| Profit (Loss) |
|
Chilectra S.A. |
| consolidated |
| 201,194,118 |
| 1,194,415,123 |
| 1,395,609,241 |
| (147,471,992 | ) | (219,826,811 | ) | (367,298,803 | ) | 1,061,070,988 |
| (855,306,336 | ) | 205,764,652 |
|
Synapsis Soluc. y Serv. It Ltda. |
| consolidated |
| 28,912,134 |
| 16,922,968 |
| 45,835,102 |
| (17,358,762 | ) | (3,154,269 | ) | (20,513,031 | ) | 74,219,655 |
| (68,902,742 | ) | 5,316,913 |
|
Inmobiliaria Manso de Velasco Ltda. |
| consolidated |
| 29,801,117 |
| 35,598,877 |
| 65,399,994 |
| (3,722,228 | ) | (1,924,456 | ) | (5,646,684 | ) | 9,871,348 |
| (2,731,187 | ) | 7,140,161 |
|
Compañía Americana de Multiservicios de Chile Ltda. |
| consolidated |
| 80,290,795 |
| 26,207,497 |
| 106,498,292 |
| (45,563,544 | ) | (8,592,112 | ) | (54,155,656 | ) | 136,535,810 |
| (137,832,037 | ) | (1,296,227 | ) |
Inversiones Distrilima S.A. |
| consolidated |
| 54,918,692 |
| 363,706,049 |
| 418,624,741 |
| (61,140,186 | ) | (213,746,029 | ) | (274,886,215 | ) | 285,214,506 |
| (252,118,702 | ) | 33,095,804 |
|
Empresa de Distribución Eléctrica de Lima Norte S.A.A. |
| separate |
| 54,913,605 |
| 363,706,049 |
| 418,619,654 |
| (61,137,905 | ) | (213,746,029 | ) | (274,883,934 | ) | 285,214,506 |
| (252,452,604 | ) | 32,761,902 |
|
Empresa Nacional de Electricidad S.A. |
| consolidated |
| 942,361,242 |
| 5,226,991,370 |
| 6,169,352,612 |
| (981,101,681 | ) | (2,233,249,079 | ) | (3,214,350,760 | ) | 2,408,239,446 |
| (1,636,139,092 | ) | 772,100,354 |
|
Endesa Eco S.A. |
| separate |
| 20,342,545 |
| 141,348,885 |
| 161,691,430 |
| (151,709,864 | ) | (19,897,730 | ) | (171,607,594 | ) | 5,363,817 |
| (13,478,980 | ) | (8,115,163 | ) |
Empresa Eléctrica Pehuenche S.A. |
| separate |
| 66,918,651 |
| 250,679,247 |
| 317,597,898 |
| (93,120,578 | ) | (41,741,967 | ) | (134,862,545 | ) | 199,025,325 |
| (44,152,639 | ) | 154,872,686 |
|
Compañía Eléctrica San Isidro S.A. |
| separate |
| 53,986,693 |
| 85,953,344 |
| 139,940,037 |
| (34,584,533 | ) | (16,770,373 | ) | (51,354,906 | ) | 119,444,441 |
| (107,229,856 | ) | 12,214,585 |
|
Empresa Eléctrica Pangue S.A. |
| separate |
| 64,692,377 |
| 139,047,187 |
| 203,739,564 |
| (77,357,564 | ) | (14,588,592 | ) | (91,946,156 | ) | 102,435,170 |
| (27,600,506 | ) | 74,834,664 |
|
Compañía Eléctrica Tarapacá S.A. |
| separate |
| 18,895,799 |
| 79,166,484 |
| 98,062,283 |
| (4,768,430 | ) | (6,362,133 | ) | (11,130,563 | ) | 59,026,738 |
| (52,369,255 | ) | 6,657,483 |
|
Inversiones Endesa Norte S.A. |
| separate |
| — |
| 25,157,716 |
| 25,157,716 |
| (3,224,334 | ) | — |
| (3,224,334 | ) | — |
| (166,553 | ) | (166,553 | ) |
Inversiones Gasatacama Holding LTDA. |
| separate |
| 114,435,229 |
| 316,349,769 |
| 430,784,998 |
| (187,876,998 | ) | (42,467,597 | ) | (230,344,595 | ) | 343,304,368 |
| (319,083,247 | ) | 24,221,121 |
|
Sociedad Concesionaria Túnel el Melón S.A. |
| separate |
| 17,507,583 |
| 18,587,880 |
| 36,095,463 |
| (2,090,726 | ) | (15,675,501 | ) | (17,766,227 | ) | 6,092,068 |
| (1,160,459 | ) | 4,931,609 |
|
Endesa Argentina S.A. |
| consolidated |
| 118,381,851 |
| 236,958,705 |
| 355,340,556 |
| (143,599,544 | ) | (122,228,745 | ) | (265,828,289 | ) | 293,388,675 |
| (284,129,957 | ) | 9,258,718 |
|
Endesa Costanera S.A. |
| separate |
| 46,132,764 |
| 139,465,744 |
| 185,598,508 |
| (108,896,949 | ) | (73,587,167 | ) | (182,484,116 | ) | 228,090,396 |
| (238,967,631 | ) | (10,877,235 | ) |
Hidroeléctrica El Chocón S.A. |
| separate |
| 59,552,103 |
| 91,442,295 |
| 150,994,398 |
| (35,636,058 | ) | (48,641,578 | ) | (84,277,636 | ) | 65,298,279 |
| (46,084,169 | ) | 19,214,110 |
|
Emgesa S.A. E.S.P. |
| separate |
| 256,813,794 |
| 1,228,326,578 |
| 1,485,140,372 |
| (130,634,275 | ) | (424,071,893 | ) | (554,706,168 | ) | 500,829,922 |
| (362,272,335 | ) | 138,557,587 |
|
Generandes Perú S.A. |
| consolidated |
| 54,343,007 |
| 785,935,394 |
| 840,278,401 |
| (71,313,577 | ) | (358,335,279 | ) | (429,648,856 | ) | 212,448,615 |
| (171,641,977 | ) | 40,806,638 |
|
Edegel S.A.A. |
| separate |
| 50,563,350 |
| 699,489,852 |
| 750,053,202 |
| (55,480,341 | ) | (309,812,958 | ) | (365,293,299 | ) | 197,723,819 |
| (162,768,423 | ) | 34,955,396 |
|
Chinango S.A. |
| separate |
| 3,874,902 |
| 103,736,922 |
| 107,611,824 |
| (16,093,363 | ) | (61,224,726 | ) | (77,318,089 | ) | 15,511,080 |
| (14,352,555 | ) | 1,158,525 |
|
Centrales Hidroeléctricas de Aysén S.A. |
| separate |
| 8,111,503 |
| 86,908,393 |
| 95,019,896 |
| (37,110,402 | ) | — |
| (37,110,402 | ) | — |
| (5,994,071 | ) | (5,994,071 | ) |
Endesa Brasil S.A. |
| consolidated |
| 893,078,804 |
| 2,406,346,709 |
| 3,299,425,513 |
| (577,155,133 | ) | (1,141,081,701 | ) | (1,718,236,834 | ) | 1,711,404,371 |
| (1,364,089,971 | ) | 347,314,400 |
|
Central Generadora Termoeléctrica Fortaleza S.A. |
| separate |
| 87,928,488 |
| 182,920,900 |
| 270,849,388 |
| (25,278,405 | ) | (49,516,510 | ) | (74,794,915 | ) | 134,940,094 |
| (63,564,728 | ) | 71,375,366 |
|
Centrais Elétricas Cachoeira Dourada S.A. |
| separate |
| 91,279,739 |
| 142,472,021 |
| 233,751,760 |
| (11,003,768 | ) | (9,298,289 | ) | (20,302,057 | ) | 88,299,914 |
| (37,997,130 | ) | 50,302,784 |
|
Compañía de Interconexión Energética S.A. |
| separate |
| 127,070,301 |
| 351,003,039 |
| 478,073,340 |
| (144,249,724 | ) | (212,036,044 | ) | (356,285,768 | ) | 91,427,196 |
| (88,648,012 | ) | 2,779,184 |
|
Compañía Energética Do Ceará S.A. |
| separate |
| 191,087,737 |
| 792,573,748 |
| 983,661,485 |
| (168,439,779 | ) | (307,791,206 | ) | (476,230,985 | ) | 640,026,534 |
| (522,045,742 | ) | 117,980,792 |
|
Ampla Energía e Serviços S.A. |
| separate |
| 341,853,282 |
| 981,871,549 |
| 1,323,724,831 |
| (222,039,416 | ) | (616,051,298 | ) | (838,090,714 | ) | 884,182,453 |
| (785,368,668 | ) | 98,813,785 |
|
Ampla Investimentos e Serviços S.A. |
| separate |
| 844,002 |
| 105,045,877 |
| 105,889,879 |
| (66,456,246 | ) | — |
| (66,456,246 | ) | 18,119,070 |
| (8,357,451 | ) | 9,761,619 |
|
Compañía Distribuidora y Comercializadora de Energía S.A. |
| consolidated |
| 333,863,028 |
| 882,909,627 |
| 1,216,772,655 |
| (235,651,234 | ) | (393,163,308 | ) | (628,814,542 | ) | 684,122,654 |
| (556,287,367 | ) | 127,835,287 |
|
Empresa de Energía de Cundinamarca S.A. |
| separate |
| 29,937,971 |
| 76,304,505 |
| 106,242,476 |
| (25,954,531 | ) | (31,814,970 | ) | (57,769,501 | ) | 80,777,391 |
| (76,030,326 | ) | 4,747,065 |
|
Empresa Distribuidora Sur S.A. |
| separate |
| 93,131,605 |
| 320,067,184 |
| 413,198,789 |
| (170,584,075 | ) | (54,242,098 | ) | (224,826,173 | ) | 315,723,562 |
| (298,830,258 | ) | 16,893,304 |
|
APPENDIX No. 1 ENERSIS GROUP COMPANIES
This appendix is part of Note 2.4 “Subsidiaries and jointly-controlled entities.”
|
|
|
| Functional |
| % Ownership Interest as of |
| % Ownership Interest as of |
|
|
| Company |
|
|
| ||||||||
Rut |
| Company |
| Currency |
| Direct |
| Indirect |
| Total |
| Direct |
| Indirect |
| Total |
| Relation |
| Address |
| Activity |
|
|
|
|
|
|
|
|
|
|
|
|
|
|
|
|
|
|
|
|
|
|
|
|
|
96,773,290-7 |
| Aguas Santiago Poniente S.A. |
| Chilean peso |
| 0.00 | % | 78.88 | % | 78.88 | % | 0.00 | % | 78.88 | % | 78.88 | % | Subsidiary |
| Chile |
| Sanitation Services |
|
Foreign |
| Ampla Energía E Serviços S.A. |
| Brazilian reais |
| 13.68 | % | 78.25 | % | 91.93 | % | 13.68 | % | 78.25 | % | 91.93 | % | Subsidiary |
| Brazil |
| Electric Energy Production, Transportation And Distribution |
|
Foreign |
| Ampla Investimentos E Serviços S.A. |
| Brazilian real |
| 13.68 | % | 78.25 | % | 91.93 | % | 13.68 | % | 78.25 | % | 91.93 | % | Subsidiary |
| Brazil |
| Electric Energy Production, Transportation,Distribution and Commerce |
|
Foreign |
| Atacama Finance Co |
| US dollar |
| 0.00 | % | 50.00 | % | 50.00 | % | 0.00 | % | 50.00 | % | 50.00 | % | Joint control |
| Islas Caimán |
| Portfolio Company |
|
Foreign |
| Compañía Americana de Multiservicios de Brasil Ltda. |
| Brazilian reais |
| 0.00 | % | 99.99 | % | 99.99 | % | 0.00 | % | 99.99 | % | 99.99 | % | Subsidiary |
| Brazil |
| Purchase and Sale of Electric Products |
|
Foreign |
| Centrais Elétricas Cachoeira Dourada S.A. |
| Brazilian reais |
| 0.00 | % | 99.61 | % | 99.61 | % | 0.00 | % | 99.61 | % | 99.61 | % | Subsidiary |
| Brazil |
| Electric Energy Generation and Marketing |
|
76,003,204-2 |
| Central Eólica Canela S.A. |
| Chilean peso |
| 0.00 | % | 75.00 | % | 75.00 | % | 0.00 | % | 75.00 | % | 75.00 | % | Subsidiary |
| Chile |
| Promotion and Development of Renewable Energy Projects |
|
Foreign |
| Central Generadora Termoeléctrica Fortaleza S.A. |
| Brazilian reais |
| 0.00 | % | 100.00 | % | 100.00 | % | 0.00 | % | 100.00 | % | 100.00 | % | Subsidiary |
| Brazil |
| Development of a Thermoelectric Project |
|
76,652,400-1 |
| Centrales Hidroeléctricas De Aysén S.A. |
| Chilean peso |
| 0.00 | % | 51.00 | % | 51.00 | % | 0.00 | % | 51.00 | % | 51.00 | % | Joint control |
| Chile |
| Development and Running of a Hydroelectric Project |
|
99,573,910-0 |
| Chilectra Inversud S.A. |
| Chilean peso |
| 0.00 | % | 100.00 | % | 100.00 | % | 0.00 | % | 100.00 | % | 100.00 | % | Subsidiary |
| Chile |
| Portfolio Company |
|
96,800,570-7 |
| Chilectra S.A. |
| Chilean peso |
| 99.08 | % | 0.01 | % | 99.09 | % | 99.08 | % | 0.01 | % | 99.09 | % | Subsidiary |
| Chile |
| Participate in companies of any nature |
|
Foreign |
| Chinango S.A.C. |
| Peruvian sol |
| 0.00 | % | 80.00 | % | 80.00 | % | 0.00 | % | 80.00 | % | 80.00 | % | Subsidiary |
| Peru |
| Electric energy generation, Marketing and Distribution |
|
Foreign |
| Compañía Americana de Multiservicios de Argentina Ltda. |
| Argentine peso |
| 0.00 | % | 100.00 | % | 100.00 | % | 0.00 | % | 100.00 | % | 100.00 | % | Subsidiary |
| Argentina |
| Electric Network Meters, Postal, Energy Meter Calibration |
|
96,543,670-1 |
| Compañía Americana de Multiservicios de Chile Ltda. |
| Chilean peso |
| 99.99 | % | 0.00 | % | 99.99 | % | 99.99 | % | 0.00 | % | 99.99 | % | Subsidiary |
| Chile |
| Purchase and Sale of Electric Products |
|
Foreign |
| Compañía Americana de Multiservicios de Colombia Ltda. |
| Colombian peso |
| 0.00 | % | 100.00 | % | 100.00 | % | 0.00 | % | 100.00 | % | 100.00 | % | Subsidiary |
| Colombia |
| Calibration and Measurement Technical Services |
|
Foreign |
| Compañía Americana de Multiservicios Del Perú Ltda. |
| Peruvian sol |
| 0.00 | % | 100.00 | % | 100.00 | % | 0.00 | % | 100.00 | % | 100.00 | % | Subsidiary |
| Peru |
| Purchase, Sale and Distribution of Electric Products |
|
Foreign |
| Compañía de Interconexión Energética S.A. |
| Brazilian reais |
| 0.00 | % | 100.00 | % | 100.00 | % | 0.00 | % | 100.00 | % | 100.00 | % | Subsidiary |
| Brazil |
| Electric Energy Production, Transportation and Distribution |
|
Foreign |
| Compañía de Transmisión del Mercosur S.A. |
| Argentine peso |
| 0.00 | % | 99.99 | % | 99.99 | % | 0.00 | % | 99.99 | % | 99.99 | % | Subsidiary |
| Argentina |
| Electric Energy Production, Transportation and Distribution |
|
Foreign |
| Compañía Distribuidora y Comercializadora de energía S.A. |
| Colombian peso |
| 12.47 | % | 9.35 | % | 21.82 | % | 12.47 | % | 9.35 | % | 21.82 | % | Subsidiary |
| Colombia |
| Electric Energy Distribution and Marketing |
|
96,783,220-0 |
| Compañía Eléctrica San Isidro S.A. |
| Chilean peso |
| 0.00 | % | 100.00 | % | 100.00 | % | 0.00 | % | 100.00 | % | 100.00 | % | Subsidiary |
| Chile |
| Complete Electric Energy Cycle |
|
96,770,940-9 |
| Compañía Eléctrica Tarapacá S.A. |
| Chilean peso |
| 0.00 | % | 100.00 | % | 100.00 | % | 0.00 | % | 100.00 | % | 100.00 | % | Subsidiary |
| Chile |
| Complete Electric Energy Cycle |
|
Foreign |
| Compañía Energética Do Ceará S.A. |
| Brazilian reais |
| 0.00 | % | 58.87 | % | 58.87 | % | 0.00 | % | 58.87 | % | 58.87 | % | Subsidiary |
| Brazil |
| Complete Electric Energy Cycle |
|
77,625,850-4 |
| Consorcio Ara- Ingendesa Ltda. |
| Chilean peso |
| 0.00 | % | 50.00 | % | 50.00 | % | 0.00 | % | 50.00 | % | 50.00 | % | Joint Control |
| Chile |
| Project Engineering Consulting |
|
76,738,990-6 |
| Consorcio Ara- Ingendesa Sener Ltda. |
| Chilean peso |
| 0.00 | % | 33.33 | % | 33.33 | % | 0.00 | % | 33.33 | % | 33.33 | % | Joint Control |
| Chile |
| Execution and Compliance Contract of Ingeníeria Básica Linea Maipu |
|
77,573,910-K |
| Consorcio Ingendesa Minimetal Ltda. |
| Chilean peso |
| 0.00 | % | 50.00 | % | 50.00 | % | 0.00 | % | 50.00 | % | 50.00 | % | Joint Control |
| Chile |
| Engineering Services |
|
|
|
|
| Functional |
| % Ownership Interest as of |
| % Ownership Interest as of |
|
|
| Company |
|
|
| ||||||||
Rut |
| Company |
| Currency |
| Direct |
| Indirect |
| Total |
| Direct |
| Indirect |
| Total |
| Relation |
| Address |
| Activity |
|
|
|
|
|
|
|
|
|
|
|
|
|
|
|
|
|
|
|
|
|
|
|
|
|
96,764,840-K |
| Constructora y Proyectos Los Maitenes S.A. |
| Chilean peso |
| 0.00 | % | 55.00 | % | 55.00 | % | 0.00 | % | 55.00 | % | 55.00 | % | Subsidiary |
| Chile |
| Construction and Facilities |
|
Foreign |
| Distribuidora Eléctrica de Cundinamarca S.A. |
| Colombian peso |
| 0.00 | % | 49.00 | % | 49.00 | % | 0.00 | % | 49.00 | % | 49.00 | % | Joint Control |
| Colombia |
| Electric Energy Distribution and Marketing |
|
Foreign |
| Distrilec Inversora S.A. |
| Argentine peso |
| 27.19 | % | 24.31 | % | 51.50 | % | 27.19 | % | 24.31 | % | 51.50 | % | Subsidiary |
| Argentina |
| Portfolio Company |
|
Foreign |
| Edegel S.A.A |
| Peruvian sol |
| 0.00 | % | 83.60 | % | 83.60 | % | 0.00 | % | 83.60 | % | 83.60 | % | Subsidiary |
| Peru |
| Electric Energy Generation, Marketing and Distribution |
|
Foreign |
| Emgesa S.A. E.S.P. |
| Peruvian sol |
| 0.00 | % | 26.87 | % | 26.87 | % | 0.00 | % | 26.87 | % | 26.87 | % | Subsidiary |
| Colombia |
| Electric Energy Generation |
|
Foreign |
| Empresa de Distribución Eléctrica de Lima Norte S.A.A |
| Peruvian sol |
| 35.02 | % | 30.15 | % | 65.17 | % | 24.00 | % | 51.68 | % | 75.68 | % | Subsidiary |
| Peru |
| Electric Energy Distribution and Marketing |
|
Foreign |
| Empresa de Energía de Cundinamarca S.A. |
| Colombian peso |
| 0.00 | % | 49.00 | % | 49.00 | % | 0.00 | % | 49.00 | % | 49.00 | % | Joint Control |
| Colombia |
| Electric Energy Distribution and Marketing |
|
96,588,800-4 |
| Empresa de Ingeniería Ingendesa S.A. |
| Chilean peso |
| 0.00 | % | 100.00 | % | 100.00 | % | 0.00 | % | 100.00 | % | 100.00 | % | Subsidiary |
| Chile |
| Engineering Services |
|
Foreign |
| Empresa Distribuidora Sur S.A. |
| Argentine peso |
| 16.02 | % | 77.21 | % | 93.23 | % | 16.02 | % | 77.21 | % | 93.23 | % | Subsidiary |
| Argentina |
| Electric Energy Distribution and Marketing |
|
96,783,910-8 |
| Empresa Eléctrica de Colina Ltda. |
| Chilean peso |
| 0.00 | % | 100.00 | % | 100.00 | % | 0.00 | % | 100.00 | % | 100.00 | % | Subsidiary |
| Chile |
| Complete Energy Cycle and Related Supplies |
|
96,589,170-6 |
| Empresa Eléctrica Pangue S.A. |
| Chilean peso |
| 0.00 | % | 94.99 | % | 94.99 | % | 0.00 | % | 94.99 | % | 94.99 | % | Subsidiary |
| Chile |
| Complete Energy Cycle |
|
96,504,980-0 |
| Empresa Eléctrica Pehuenche S.A. |
| Chilean peso |
| 0.00 | % | 92.65 | % | 92.65 | % | 0.00 | % | 92.65 | % | 92.65 | % | Subsidiary |
| Chile |
| Complete Energy Cycle |
|
91,081,000-6 |
| Empresa Nacional de Electricidad S.A |
| Chilean peso |
| 59.98 | % | 0.00 | % | 59.98 | % | 59.98 | % | 0.00 | % | 59.98 | % | Subsidiary |
| Chile |
| Complete Energy Cycle |
|
Foreign |
| Endesa Argentina S.A. |
| Argentine peso |
| 0.00 | % | 100.00 | % | 100.00 | % | 0.00 | % | 100.00 | % | 100.00 | % | Subsidiary |
| Argentina |
| Portfolio Company |
|
Foreign |
| Endesa Brasil S.A. |
| Brazilian reais |
| 22.06 | % | 49.46 | % | 71.52 | % | 22.06 | % | 49.46 | % | 71.52 | % | Subsidiary |
| Brazil |
| Portfolio Company |
|
Foreign |
| Endesa Costanera S.A. |
| Argentine peso |
| 0.00 | % | 69.76 | % | 69.76 | % | 0.00 | % | 69.76 | % | 69.76 | % | Subsidiary |
| Argentina |
| Electricity Generation and Marketing |
|
96,827,970-K |
| Endesa Eco S.A. |
| Chilean peso |
| 0.00 | % | 100.00 | % | 100.00 | % | 0.00 | % | 100.00 | % | 100.00 | % | Subsidary |
| Chile |
| Renewable Energy Projects |
|
96,526,450-7 |
| Endesa Inversiones Generales S.A. |
| Chilean peso |
| 0.00 | % | 100.00 | % | 100.00 | % | 0.00 | % | 100.00 | % | 100.00 | % | Subsidary |
| Chile |
| Portfolio Company |
|
Foreign |
| Energex Co. |
| US dollar |
| 0.00 | % | 50.00 | % | 50.00 | % | 0.00 | % | 50.00 | % | 50.00 | % | Joint Control |
| Islas Caimán |
| Portfolio Company |
|
Foreign |
| EN-Brasil Comercio e Servicos S.A. |
| Brazilian reais |
| 0.00 | % | 99.99 | % | 99.99 | % | 0.00 | % | 0.00 | % | 0.00 | % | Associate |
| Brazil |
| Portfolio Company |
|
Foreign |
| Eólica Fanzenda Nova-Geracao e Comercializacao de Energía S.A. |
| Brazilian reais |
| 0.00 | % | 99.95 | % | 99.95 | % | 0.00 | % | 0.00 | % | 0.00 | % | Associate |
| Brazil |
| Promotion and Development of Renewable Energy Projects |
|
96,830,980-3 |
| Gas Atacama S.A. |
| US dollar |
| 0.00 | % | 50.00 | % | 50.00 | % | 0.00 | % | 50.00 | % | 50.00 | % | Joint Control |
| Chile |
| Administration and Management of Companies |
|
Foreign |
| Gasoducto Atacama Argentina S.A. |
| US dollar |
| 0.00 | % | 49.99 | % | 49.99 | % | 0.00 | % | 49.99 | % | 49.99 | % | Joint Control |
| Argentina |
| Transportation of Natural Gas |
|
78,882,820-9 |
| Gasoducto Atacama Chile S.A. |
| US dollar |
| 0.00 | % | 50.00 | % | 50.00 | % | 0.00 | % | 50.00 | % | 50.00 | % | Joint Control |
| Chile |
| Transportation of Natural Gas |
|
77,032,280-4 |
| Gasoducto Taltal Ltda. |
| Chilean peso |
| 0.00 | % | 50.00 | % | 50.00 | % | 0.00 | % | 50.00 | % | 50.00 | % | Joint Control |
| Chile |
| Transportation of Natural Gas |
|
Foreign |
| Generandes Perú S.A. |
| Peruvian sol |
| 0.00 | % | 61.00 | % | 61.00 | % | 0.00 | % | 61.00 | % | 61.00 | % | Subsidary |
| Peru |
| Portfolio Company |
|
76,041,891-9 |
| Hidroaysén Transmisión S.A. |
| Chilean peso |
| 0.00 | % | 51.00 | % | 51.00 | % | 0.00 | % | 51.00 | % | 51.00 | % | Joint Control |
| Chile |
| Development of Electric Transmission Systems |
|
Foreign |
| Hidroeléctrica El Chocón S.A. |
| Argentine peso |
| 0.00 | % | 67.67 | % | 67.67 | % | 0.00 | % | 67.67 | % | 67.67 | % | Subsidary |
| Argentina |
| Electric Energy Production and Marketing |
|
Foreign |
| Hidroinvest S.A. |
| Argentine peso |
| 0.00 | % | 96.09 | % | 96.09 | % | 0.00 | % | 96.09 | % | 96.09 | % | Subsidary |
| Argentina |
| Portfolio Company |
|
76,107,186-6 |
| ICT Servicios Informáticos Ltda. |
| Chilean peso |
| 99.00 | % | 1.00 | % | 100.00 | % | 0.00 | % | 0.00 | % | 0.00 | % | Subsidary |
| Chile |
| Information and Technology Services |
|
|
|
|
| Functional |
| % Participation 12/31/2010 |
| % Participation 12/31/2009 |
|
|
| Company |
|
|
| ||||||||
Rut |
| Company |
| Currency |
| Direct |
| Indirect |
| Total |
| Direct |
| Indirect |
| Total |
| Relation |
| Adress |
| Activity |
|
|
|
|
|
|
|
|
|
|
|
|
|
|
|
|
|
|
|
|
|
|
|
|
|
Foreign |
| Ingendesa do Brasil Ltda. |
| Brazilian reais |
| 0.00 | % | 100.00 | % | 100.00 | % | 0.00 | % | 100.00 | % | 100.00 | % | Subsidary |
| Brazil |
| Project Engineering Consulting |
|
79,913,810-7 |
| Inmobiliaria Manso de Velasco Ltda. |
| Chilean peso |
| 99.99 | % | 0.00 | % | 99.99 | % | 99.99 | % | 0.00 | % | 99.99 | % | Subsidary |
| Chile |
| Construction and Works |
|
Foreign |
| Inversiones Distrilima S.A. |
| Peruvian sol |
| 34.99 | % | 15.38 | % | 50.37 | % | 34.99 | % | 15.38 | % | 50.37 | % | Subsidary |
| Peru |
| Portfolio Company |
|
96,887,060-2 |
| Inversiones Endesa Norte S.A. |
| Chilean peso |
| 0.00 | % | 100.00 | % | 100.00 | % | 0.00 | % | 100.00 | % | 100.00 | % | Subsidary |
| Chile |
| Investment in Energy Projects North of Chile |
|
76,014,570-K |
| Inversiones Gas Atacama Holding Ltda. |
| US dollar |
| 0.00 | % | 50.00 | % | 50.00 | % | 0.00 | % | 50.00 | % | 50.00 | % | Joint Control |
| Chile |
| Transportation of Natural Gas |
|
Foreign |
| Inversora Codensa S.A.S. |
| Colombian peso |
| 0.00 | % | 100.00 | % | 100.00 | % | 0.00 | % | 100.00 | % | 100.00 | % | Subsidary |
| Colombia |
| Investment in Dometic Public Energy Services Activities and Portfolio Company |
|
Foreign |
| Investluz S.A. |
| Brazilian reais |
| 0.00 | % | 100.00 | % | 100.00 | % | 0.00 | % | 100.00 | % | 100.00 | % | Subsidary |
| Brazil |
| Portfolio Company |
|
96,800,460-3 |
| Luz Andes Ltda. |
| Chilean peso |
| 0.00 | % | 100.00 | % | 100.00 | % | 0.00 | % | 100.00 | % | 100.00 | % | Subsidary |
| Chile |
| Transport, Distribution and Sale of Energy and Fuel |
|
96,905,700-K |
| Progas S.A. |
| Chilean peso |
| 0.00 | % | 50.00 | % | 50.00 | % | 0.00 | % | 50.00 | % | 50.00 | % | Joint Control |
| Chile |
| Gas Distribution |
|
99,584,600-4 |
| Sistema Sec S.A. |
| Chilean peso |
| 0.00 | % | 49.00 | % | 49.00 | % | 0.00 | % | 49.00 | % | 49.00 | % | Joint control |
| Chile |
| Supply of Signaling, Electrification and Communication Systems |
|
77,047,280-6 |
| Sociedad Agrícola de Cameros Ltda. |
| Chilean peso |
| 0.00 | % | 57.50 | % | 57.50 | % | 0.00 | % | 57.50 | % | 57.50 | % | Subsidary |
| Chile |
| Financial Investments |
|
78,970,360-4 |
| Sociedad Agrícola e Inmobiliaria Pastos Verdes Ltda. |
| Chilean peso |
| 0.00 | % | 55.00 | % | 55.00 | % | 0.00 | % | 55.00 | % | 55.00 | % | Subsidary |
| Chile |
| Financial Investments |
|
96,671,360-7 |
| Sociedad Concesionaria Túnel El Melón S.A. |
| Chilean peso |
| 0.00 | % | 100.00 | % | 100.00 | % | 0.00 | % | 100.00 | % | 100.00 | % | Subsidary |
| Chile |
| Execution, Construction and Operation of the El Melon Tunnel |
|
79,197,570-6 |
| Sociedad Consorcio Ingendesa-Ara Limitada |
| Chilean peso |
| 0.00 | % | 50.00 | % | 50.00 | % | 0.00 | % | 50.00 | % | 50.00 | % | Joint Control |
| Santiago de Chile (Chile) |
| Engineering Services |
|
Foreign |
| Sociedad Portuaria Central Cartagena S.A. |
| Colombian peso |
| 0.00 | % | 99.85 | % | 99.85 | % | 0.00 | % | 4.90 | % | 4.90 | % | Associate |
| Colombia |
| Port Administration |
|
Foreign |
| Southern Cone Power Argentina S.A. |
| Argentine peso |
| 0.00 | % | 100.00 | % | 100.00 | % | 0.00 | % | 100.00 | % | 100.00 | % | Subsidary |
| Argentina |
| Portfolio Company |
|
Foreign |
| Synapsis Argentina S.R.I. |
| Argentine peso |
| 5.00 | % | 95.00 | % | 100.00 | % | 5.00 | % | 95.00 | % | 100.00 | % | Subsidary |
| Argentina |
| Computer Services |
|
Foreign |
| Synapsis Brasil Ltda. |
| Brazilian reais |
| 0.00 | % | 100.00 | % | 100.00 | % | 0.00 | % | 100.00 | % | 100.00 | % | Subsidary |
| Brazil |
| Computer Services |
|
Foreign |
| Synapsis Colombia Ltda. |
| Colombian peso |
| 0.20 | % | 99.80 | % | 100.00 | % | 0.20 | % | 99.80 | % | 100.00 | % | Subsidary |
| Colombia |
| Computer Services |
|
Foreign |
| Synapsis Perú S.R.I. |
| Peruvian sol |
| 0.00 | % | 100.00 | % | 100,00 | % | 0,00 | % | 100,00 | % | 100,00 | % | Subsidary |
| Peru |
| Computer and Communication Services and Products |
|
96,529,420-1 |
| Synapsis Soluciones Y Servicios It Ltda. |
| Chilean peso |
| 99,99 | % | 0,01 | % | 100,00 | % | 99,99 | % | 0,01 | % | 100,00 | % | Subsidary |
| Chile |
| Supply and Market Computer Services and Equipment |
|
Foreign |
| Termoeléctrica José de San Martín S.A. |
| Argentine peso |
| 0,00 | % | 20,86 | % | 20,86 | % | 0,00 | % | 20,86 | % | 20,86 | % | Associate |
| Argentina |
| Construction and Operation of Combined Cycle Plant |
|
Foreign |
| Termoeléctrica Manuel Belgrano S.A. |
| Argentine peso |
| 0,00 | % | 20,86 | % | 20,86 | % | 0,00 | % | 20,86 | % | 20,86 | % | Associate |
| Argentina |
| Electric Energy Generation, Transport and Distribution |
|
77,017,930-0 |
| Transmisora Eléctrica de Quillota Ltda. |
| Chilean peso |
| 0,00 | % | 50,00 | % | 50,00 | % | 0,00 | % | 50,00 | % | 50,00 | % | Joint Control |
| Chile |
| Electric Energy Transportation and Distribution |
|
Foreign |
| Transportadora de Energía S.A. |
| Argentine peso |
| 0,00 | % | 100,00 | % | 100,00 | % | 0,00 | % | 100,00 | % | 100,00 | % | Subsidary |
| Argentina |
| Electric Energy Generation, Transport and Distribution |
|
APPENDIX No. 2 CHANGES IN THE SCOPE OF CONSOLIDATION:
This appendix is part of Note 2.4.1 “Changes in the scope of consolidation.”
|
| % Participation |
| % Participation |
| % Participation |
| ||||||||||||
|
| at December 31, 2010 |
| at December 31, 2009 |
| at December 31, 2008 |
| ||||||||||||
Company |
| Direct |
| Indirect |
| Total |
| Consolidation |
| Direct |
| Indirect |
| Total |
| Consolidation |
| Total |
|
|
|
|
|
|
|
|
|
|
|
|
|
|
|
|
|
|
|
|
|
Distribuidora Eléctrica de Cundinamarca S.A. |
| — |
| — |
| — |
|
|
| — |
| 49.00 | % | 49.00 | % | Proportionate Consolidation |
| 0 | % |
|
|
|
|
|
|
|
|
|
|
|
|
|
|
|
|
|
|
|
|
Sociedad Portuaria Central Cartagena S.A. |
| — |
| — |
| — |
|
|
| — |
| 99.85 | % | 99.85 | % | Consolidation |
| 0 | % |
|
|
|
|
|
|
|
|
|
|
|
|
|
|
|
|
|
|
|
|
ICT Servicios informáticos ltda. |
| 99.00 | % | 1.00 | % | 100.00 | % | Consolidation |
| — |
| 0.00 | % | 0.00 | % | Consolidation |
| 0 | % |
APPENDIX No. 3 ENERSIS GROUP ASSOCIATED COMPANIES:
This appendix is part of Note 3. h) “Investments in associates accounted for using the equity method.”
|
| Company |
| Functional |
| % Participation at |
| % Participation at |
|
|
|
|
| ||||||||
Rut |
| (In alphabetical order) |
| currency |
| Direct |
| Indirect |
| Total |
| Direct |
| Indirect |
| Total |
| Country |
| Activity |
|
|
|
|
|
|
|
|
|
|
|
|
|
|
|
|
|
|
|
|
|
|
|
96,806,130-5 |
| Electrogas S.A |
| US dollar |
| 0.00 | % | 25.49 | % | 25.49 | % | 0.00 | % | 25.49 | % | 25.49 | % | Chile |
| Portfolio Company |
|
Foreign |
| Endesa Cemsa S.A. |
| Argentine peso |
| 0.00 | % | 45.00 | % | 45.00 | % | 0.00 | % | 45.00 | % | 45.00 | % | Argentina |
| Electric Energy Wholesaler |
|
Foreign |
| Endesa Market Place |
| US dollar |
| 15.00 | % | 0.00 | % | 15.00 | % | 15.00 | % | 0.00 | % | 15.00 | % | Spain |
| B2B (New Technologies) |
|
76,418,940-K |
| GNL Chile.S.A. |
| Chilean peso |
| 0.00 | % | 33.33 | % | 33.33 | % | 0.00 | % | 33.33 | % | 33.33 | % | Chile |
| Promote liquified gas supply project |
|
76,788,080-4 |
| GNL Quintero S.A. |
| US dollar |
| 0.00 | % | 20.00 | % | 20.00 | % | 0.00 | % | 20.00 | % | 20.00 | % | Chile |
| Development, Design, Supply of a Liquid Natural Gas Regasifying Terminal |
|
96,889,570-2 |
| Inversiones Electrogas S.A. |
| Chilean peso |
| 0.00 | % | 42.50 | % | 42.50 | % | 0.00 | % | 42.50 | % | 42.50 | % | Chile |
| Portfolio Company |
|
76,583,350-7 |
| Konecta Chile S.A. |
| Chilean peso |
| 0.00 | % | 26.20 | % | 26.20 | % | 0.00 | % | 26.20 | % | 26.20 | % | Chile |
| Services |
|
Foreign |
| Sacme S.A. |
| US dollar |
| 0.00 | % | 50.00 | % | 50.00 | % | 0.00 | % | 50.00 | % | 50.00 | % | Argentina |
| Electric System Supervision and Control |
|
APPEDIX No. 4 ADITIONAL INFORMATION ON FINANCIAL DEBT:
This appendix is part of Note 18 “Other financial liabilities”
The following tables set forth the contractual undiscounted cash flows by type of financial debt:
A) Bank Loans
a) Summary of Bank Loans by currency and maturity
|
|
|
|
|
| Current |
| Non-Current |
| Current |
| Non-Current |
| ||||||||||||||||||||
|
|
|
|
|
| Maturity |
| Total |
| Maturity |
| Total Non- |
| Maturity |
| Total |
| Maturity |
| Total Non- |
| ||||||||||||
|
|
|
|
|
| One to |
| Three to |
| Current as of |
|
|
|
|
| More |
| Current as of |
| One to |
| Three to |
| Current |
|
|
| Three to |
|
|
| Current as |
|
|
|
|
| Nominal |
| Three |
| Twelve |
| December |
| One to Three |
| Three to Five |
| Than Five |
| December 31, |
| Three |
| Twelve |
| As of December |
| One to Three |
| Five |
| More Than |
| of December |
|
|
|
|
| Interest |
| Months |
| Months |
| 31, 2010 |
| Years |
| Years |
| Years |
| 2010 |
| Months |
| Months |
| 31, 2009 |
| Years |
| Years |
| Five Years |
| 31, 2009 |
|
Country |
| Currency |
| Rate |
| ThCh$ |
| ThCh$ |
| ThCh$ |
| ThCh$ |
| ThCh$ |
| ThCh$ |
| ThCh$ |
| ThCh$ |
| ThCh$ |
| ThCh$ |
| ThCh$ |
| ThCh$ |
| ThCh$ |
| ThCh$ |
|
Chile |
| US$ |
| 2.41 | % | 816,706 |
| 18,915,156 |
| 19,731,862 |
| 3,202,593 |
| 83,824,641 |
| — |
| 87,027,234 |
| 1,860,644 |
| 132,415,089 |
| 134,275,733 |
| 110,879,501 |
| 109,023,058 |
| 1,257,552 |
| 221,160,111 |
|
Chile |
| Ch$ |
| — |
| — |
| — |
| — |
| — |
| — |
| — |
| — |
| 770,828 |
| 126,775 |
| 897,603 |
| 236,372 |
| — |
| — |
| 236,372 |
|
Peru |
| US$ |
| 3.40 | % | 1,458,040 |
| 17,809,137 |
| 19,267,177 |
| 14,419,663 |
| 14,145,757 |
| 21,661,326 |
| 50,226,746 |
| 6,879,846 |
| 12,043,084 |
| 18,922,930 |
| 24,300,608 |
| 1,839,338 |
| — |
| 26,139,946 |
|
Peru |
| Soles |
| 4.14 | % | 1,839,538 |
| 1,031,134 |
| 2,870,672 |
| 32,616,930 |
| — |
| — |
| 32,616,930 |
| 959,816 |
| 11,120,797 |
| 12,080,613 |
| 45,433,352 |
| — |
| — |
| 45,433,352 |
|
Argentina |
| US$ |
| 8.00 | % | 5,085,358 |
| 18,145,263 |
| 23,230,621 |
| 4,013,855 |
| — |
| — |
| 4,013,855 |
| 6,253,151 |
| 12,774,805 |
| 19,027,956 |
| 23,974,767 |
| — |
| — |
| 23,974,767 |
|
Argentina |
| Ar$ |
| 13.12 | % | 14,760,009 |
| 24,845,072 |
| 39,605,081 |
| 29,992,159 |
| 2,424,007 |
| — |
| 32,416,166 |
| 8,684,708 |
| 13,360,954 |
| 22,045,662 |
| 37,917,438 |
| — |
| — |
| 37,917,438 |
|
Colombia |
| CPs |
| 7.21 | % | 744,241 |
| 5,091,793 |
| 5,836,034 |
| — |
| 75,664,686 |
| — |
| 75,664,686 |
| 2,474,692 |
| 7,561,559 |
| 10,036,251 |
| 88,421,279 |
| — |
| — |
| 88,421,279 |
|
Brazil |
| US$ |
| 6.17 | % | 765,141 |
| 11,617,821 |
| 12,382,962 |
| 19,990,693 |
| 18,600,098 |
| 10,681,077 |
| 49,271,868 |
| 1,018,392 |
| 12,357,474 |
| 13,375,866 |
| 26,976,832 |
| 14,097,354 |
| 25,725,061 |
| 66,799,247 |
|
Brazil |
| Reais |
| 10.25 | % | 34,521,334 |
| 175,760,765 |
| 210,282,099 |
| 235,737,812 |
| 41,010,710 |
| 9,066,992 |
| 285,815,514 |
| 21,450,497 |
| 133,322,807 |
| 154,773,304 |
| 343,375,204 |
| 95,700,545 |
| 16,831,450 |
| 455,907,199 |
|
|
|
|
|
|
|
|
|
|
|
|
|
|
|
|
|
|
|
|
|
|
|
|
|
|
|
|
|
|
|
|
|
|
|
|
|
|
|
|
| 59,990,367 |
| 273,216,141 |
| 333,206,508 |
| 339,973,705 |
| 235,669,899 |
| 41,409,395 |
| 617,052,999 |
| 50,352,574 |
| 335,083,344 |
| 385,435,918 |
| 701,515,353 |
| 220,660,295 |
| 43,814,063 |
| 965,989,711 |
|
b) Identification of Bank Borrowings by Companies
|
|
|
|
|
|
|
|
|
|
|
|
|
| As of December 31, 2010 |
| ||||||||||||
|
|
|
|
|
|
|
|
|
|
|
|
|
| Current |
| Non-Current |
| ||||||||||
Company |
| Company |
| Country |
| Financial Institution |
| Currency |
| Effective |
| Nominal |
| One to Three |
| Three to |
| Total Current |
| One to Three |
| Three to Five |
| More than Five |
| Total Non- |
|
Foreign |
| Ampla |
| Brazil |
| Banco Itaú |
| Reais |
| 10.72 | % | 10.07 | % | 101,554 |
| 2,149,535 |
| 2,251,089 |
| 2,014,313 |
| — |
| — |
| 2,014,313 |
|
Foreign |
| Ampla |
| Brazil |
| Unibanco |
| Reais |
| 10.67 | % | 10.00 | % | 80,587 |
| 1,698,892 |
| 1,779,479 |
| 1,585,020 |
| — |
| — |
| 1,585,020 |
|
Foreign |
| Ampla |
| Brazil |
| Banco Alfa |
| Reais |
| 10.41 | % | 9.75 | % | 1,826,981 |
| 4,094,262 |
| 5,921,243 |
| 13,333,407 |
| — |
| — |
| 13,333,407 |
|
Foreign |
| Ampla |
| Brazil |
| Brasdesco |
| Reais |
| 8.87 | % | 8.87 | % | 6,269,083 |
| 14,432,333 |
| 20,701,416 |
| 13,641,743 |
| — |
| — |
| 13,641,743 |
|
Foreign |
| Ampla |
| Brazil |
| Banco do Brasil |
| Reais |
| 10.75 | % | 9.76 | % | 763,245 |
| 2,538,618 |
| 3,301,863 |
| 33,485,566 |
| — |
| — |
| 33,485,566 |
|
Foreign |
| Ampla |
| Brazil |
| BANCO HSBC |
| Reais |
| 9.73 | % | 9.73 | % | 1,116,014 |
| 24,085,514 |
| 25,201,528 |
| 22,599,517 |
| — |
| — |
| 22,599,517 |
|
Foreign |
| Ampla |
| Brazil |
| Electrobras |
| Reais |
| 7.23 | % | 7.23 | % | 183,646 |
| 738,057 |
| 921,703 |
| 1,731,933 |
| 3,074,414 |
| 589,902 |
| 5,396,249 |
|
Foreign |
| Ampla |
| Brazil |
| Bndes |
| Reais |
| 11.02 | % | 11.02 | % | 9,075,941 |
| 20,796,621 |
| 29,872,562 |
| 9,181,709 |
| 488,855 |
| — |
| 9,670,564 |
|
Foreign |
| CGTF Fortaleza |
| Brazil |
| IFC - A |
| US$ |
| 8.61 | % | 7.89 | % | 386,442 |
| 3,258,351 |
| 3,644,793 |
| 6,938,582 |
| 5,647,394 |
| 7,977,977 |
| 20,563,953 |
|
Foreign |
| CGTF Fortaleza |
| Brazil |
| IFC - B |
| US$ |
| 3.11 | % | 2.98 | % | 145,163 |
| 3,664,317 |
| 3,809,480 |
| 7,911,466 |
| 8,527,661 |
| — |
| 16,439,127 |
|
Foreign |
| CGTF Fortaleza |
| Brazil |
| IFC - C |
| US$ |
| 12.87 | % | 11.96 | % | 106,304 |
| 353,577 |
| 459,881 |
| 848,122 |
| 4,123,071 |
| 1,072,731 |
| 6,043,924 |
|
Foreign |
| CIEN (Companhía Interconexao Energética S.A.) |
| Brazil |
| Banco Santander Central Hispano |
| Reais |
| 11.15 | % | 11.15 | % | 3,166,878 |
| 64,735,216 |
| 67,902,094 |
| 60,518,449 |
| — |
| — |
| 60,518,449 |
|
Foreign |
| Coelce |
| Brazil |
| Banco Europeo de Investimentos |
| US$ |
| 6.58 | % | 6.58 | % | 18,857 |
| 197,806 |
| 216,663 |
| 293,057 |
| 301,972 |
| 1,630,369 |
| 2,225,398 |
|
Foreign |
| Coelce |
| Brazil |
| Eletrobras |
| Reais |
| 6.58 | % | 6.58 | % | 1,521,161 |
| 5,224,999 |
| 6,746,160 |
| 9,147,592 |
| 12,618,603 |
| 3,906,314 |
| 25,672,509 |
|
Foreign |
| Coelce |
| Brazil |
| Banco do Brasil |
| Reais |
| 10.75 | % | 10.75 | % | 1,412,753 |
| 4,535,398 |
| 5,948,151 |
| 9,770,813 |
| 628,983 |
| — |
| 10,399,796 |
|
Foreign |
| Coelce |
| Brazil |
| Bndes |
| Reais |
| 9.95 | % | 9.95 | % | 9,003,491 |
| 30,731,320 |
| 39,734,811 |
| 58,727,750 |
| 24,199,855 |
| 4,570,776 |
| 87,498,381 |
|
Foreign |
| Coelce |
| Brazil |
| Banco do Nordeste |
| Reais |
| 8.50 | % | 8.50 | % | — |
| — |
| — |
| — |
| — |
| — |
| — |
|
Foreign |
| Coelce |
| Brazil |
| Banco Europeo de Investimentos |
| US$ |
| 5.49 | % | 5.49 | % | 108,375 |
| 4,143,770 |
| 4,252,145 |
| 3,999,466 |
| — |
| — |
| 3,999,466 |
|
Foreign |
| Coelce |
| Brazil |
| Dívida Previdenciária |
| Reais |
| 30.01 | % | -30.01 | % | — |
| — |
| — |
| — |
| — |
| — |
| — |
|
Foreign |
| Edegel |
| Peru |
| Banco de Crédito |
| US$ |
| 3.97 | % | 3.97 | % | 653,107 |
| 1,953,825 |
| 2,606,932 |
| 4,307,956 |
| — |
| 4,307,955 |
| 8,615,911 |
|
Foreign |
| Edegel |
| Peru |
| Banco de Crédito |
| US$ |
| 3.97 | % | 3.97 | % | 438,997 |
| 1,302,348 |
| 1,741,345 |
| 1,603,280 |
| — |
| — |
| 1,603,280 |
|
Foreign |
| Edegel |
| Peru |
| Banco Continental |
| US$ |
| 7.19 | % | 7.19 | % | 245,345 |
| 816,040 |
| 1,061,385 |
| 1,957,430 |
| 14,145,757 |
| 17,353,371 |
| 33,456,558 |
|
Foreign |
| Edegel |
| Peru |
| Banco Scotiabank |
| US$ |
| 5.70 | % | 5.70 | % | 23,655 |
| 3,427,268 |
| 3,450,923 |
| 1,697,864 |
| — |
| — |
| 1,697,864 |
|
Foreign |
| Edegel |
| Peru |
| Banco Continental |
| Soles |
| 4.59 | % | 4.28 | % | — |
| — |
| — |
|
|
| — |
| — |
| — |
|
Foreign |
| Edegel |
| Peru |
| Banco Continental |
| Soles |
| 3.80 | % | 3.80 | % | 12,762 |
| 42,449 |
| 55,211 |
| 1,379,498 |
| — |
| — |
| 1,379,498 |
|
Foreign |
| Edegel |
| Peru |
| Banco Continental |
| Soles |
| 4.30 | % | 4.30 | % | 77,109 |
| 167,805 |
| 244,914 |
| 5,030,048 |
| — |
| — |
| 5,030,048 |
|
Foreign |
| Edegel |
| Peru |
| Banco Scotiabank |
| US$ |
| 5.95 | % | 5.95 | % | — |
| — |
| — |
| — |
| — |
| — |
| — |
|
Foreign |
| Edegel |
| Peru |
| Banco Westlb |
| US$ |
| 5.50 | % | 5.50 | % | — |
| — |
| — |
| — |
| — |
| — |
| — |
|
Foreign |
| Edegel |
| Peru |
| Banco Continental |
| Soles |
| 6.60 | % | 6.60 | % | — |
| — |
| — |
| — |
| — |
| — |
| — |
|
Foreign |
| Edegel |
| Peru |
| Banco de Crédito |
| US$ |
| 9.59 | % | 9.59 | % | 96,936 |
| 10,309,656 |
| 10,406,592 |
| 4,853,133 |
| — |
| — |
| 4,853,133 |
|
Foreign |
| Edegel |
| Peru |
| Banco Scotiabank |
| Soles |
| 6.55 | % | 6.55 | % | — |
| — |
| — |
| — |
| — |
| — |
| — |
|
Foreign |
| Edelnor |
| Peru |
| Banco de Crédito |
| Soles |
| 11.99 | % | 2.60 | % | 25,172 |
| 83,723 |
| 108,895 |
| 2,658,128 |
| — |
| — |
| 2,658,128 |
|
Foreign |
| Edelnor |
| Peru |
| Banco de Crédito |
| Soles |
| 11.99 | % | 4.00 | % | 25,172 |
| 83,723 |
| 108,895 |
| 2,658,128 |
| — |
| — |
| 2,658,128 |
|
Foreign |
| Edelnor |
| Peru |
| Banco de Crédito |
| Soles |
| 4.00 | % | 4.00 | % | 21,816 |
| 72,561 |
| 94,377 |
| 2,310,826 |
| — |
| — |
| 2,310,826 |
|
Foreign |
| Edelnor |
| Peru |
| Banco de Crédito |
| Soles |
| 4.00 | % | 4.00 | % | 10,069 |
| 33,489 |
| 43,558 |
| 1,063,251 |
| — |
| — |
| 1,063,251 |
|
Foreign |
| Edelnor |
| Peru |
| Banco de Crédito |
| Soles |
| 4.00 | % | 4.00 | % | 41,953 |
| 139,539 |
| 181,492 |
| 4,430,213 |
| — |
| — |
| 4,430,213 |
|
Foreign |
| Edelnor |
| Peru |
| Banco de Crédito |
| Soles |
| 11.99 | % | 2.60 | % | 25,172 |
| 83,723 |
| 108,895 |
| 2,658,128 |
| — |
| — |
| 2,658,128 |
|
Foreign |
| Edelnor |
| Peru |
| Banco de Crédito |
| Soles |
| 2.63 | % | 2.63 | % | 1,502,865 |
| — |
| 1,502,865 |
| — |
| — |
| — |
| — |
|
Foreign |
| Edelnor |
| Peru |
| Banco de Crédito |
| Soles |
| 2.64 | % | 2.64 | % | 23,313 |
| 77,542 |
| 100,855 |
| 3,591,829 |
| — |
| — |
| 3,591,829 |
|
Foreign |
| Edelnor |
| Peru |
| Banco de Crédito |
| Soles |
| 2.64 | % | 2.64 | % | — |
| — |
| — |
| — |
| — |
| — |
| — |
|
Foreign |
| Edelnor |
| Peru |
| BBVA |
| Soles |
| 4.41 | % | 4.40 | % | 74,135 |
| 246,580 |
| 320,715 |
| 6,836,881 |
| — |
| — |
| 6,836,881 |
|
Foreign |
| Edelnor |
| Peru |
| Scotiabank |
| Soles |
| 4.35 | % | 4.35 | % | — |
| — |
| — |
| — |
| — |
| — |
| — |
|
Foreign |
| Edelnor |
| Peru |
| Scotiabank |
| Soles |
| 4.35 | % | 4.35 | % | — |
| — |
| — |
| — |
| — |
| — |
| — |
|
Foreign |
| Edelnor |
| Peru |
| Interbank |
| Soles |
| 5.72 | % | 5.72 | % | — |
| — |
| — |
| — |
| — |
| — |
| — |
|
Foreign |
| Edesur S.A. |
| Argentina |
| BBVA |
| Ar$ |
| 22.90 | % | 20.00 | % | 271,817 |
| 3,031,502 |
| 3,303,319 |
| 2,534,402 |
| — |
| — |
| 2,534,402 |
|
Foreign |
| Edesur S.A. |
| Argentina |
| Banco de la Ciudad de Buenos Aires |
| Ar$ |
| 15.40% |
| 14.85 | % | 54,835 |
| 182,384 |
| 237,219 |
| 1,466,744 |
| — |
| — |
| 1,466,744 |
|
Foreign |
| Edesur S.A. |
| Argentina |
| Standard Bank |
| Ar$ |
| 17.61% |
| -17.61 | % | 156,756 |
| 521,383 |
| 678,139 |
| 3,845,625 |
| 727,040 |
| — |
| 4,572,665 |
|
Foreign |
| Edesur S.A. |
| Argentina |
| Banco Santander Rio |
| Ar$ |
| 16.28% |
| 15.98 | % | 120,727 |
| 1,374,409 |
| 1,495,136 |
| 2,008,017 |
| — |
| — |
| 2,008,017 |
|
Foreign |
| Edesur S.A. |
| Argentina |
| Banco Santander Rio |
| Ar$ |
| 17.97% |
| 15.17 | % | 106,623 |
| 354,637 |
| 461,260 |
| 2,530,914 |
| — |
| — |
| 2,530,914 |
|
Foreign |
| Edesur S.A. |
| Argentina |
| Banco de la Ciudad de Buenos Aires |
| Ar$ |
| 17.08% |
| 17.08 | % | 39,530 |
| 131,479 |
| 171,009 |
| 957,228 |
| — |
| — |
| 957,228 |
|
Foreign |
| Emgesa |
| Colombia |
| Davivienda |
| CPs |
| 6.99 | % | 6.99 | % | — |
| 603,337 |
| 603,337 |
| — |
| 7,812,518 |
| — |
| 7,812,518 |
|
Foreign |
| Emgesa |
| Colombia |
| Bancolombia |
| CPs |
| 6.99 | % | 6.99 | % | — |
| 432,186 |
| 432,186 |
| — |
| 5,729,883 |
| — |
| 5,729,883 |
|
Foreign |
| Emgesa |
| Colombia |
| Bancolombia |
| CPs |
| 6.99 | % | 6.99 | % | 328,989 |
| 1,094,247 |
| 1,423,236 |
| — |
| 18,429,277 |
| — |
| 18,429,277 |
|
Foreign |
| Emgesa |
| Colombia |
| BBVA Colombia |
| CPs |
| 6.99 | % | 6.99 | % | — |
| 1,580,860 |
| 1,580,860 |
| — |
| 20,431,485 |
| — |
| 20,431,485 |
|
Foreign |
| Emgesa |
| Colombia |
| Banco Santander Central Hispano |
| CPs |
| 6.99 | % | 6.99 | % | 415,252 |
| 1,381,163 |
| 1,796,415 |
| — |
| 23,261,523 |
| — |
| 23,261,523 |
|
Foreign |
| Endesa Costanera S.A. |
| Argentina |
| Banco Provincia de Buenos Aires |
| US$ |
| 6.00 | % | 6.00 | % | 600,038 |
| — |
| 600,038 |
| — |
| — |
| — |
| — |
|
Foreign |
| Endesa Costanera S.A. |
| Argentina |
| Banco Galicia |
| US$ |
| 5.44 | % | 5.44 | % | 634,568 |
| 351,529 |
| 986,097 |
| — |
| — |
| — |
| — |
|
Foreign |
| Endesa Costanera S.A. |
| Argentina |
| Credit Suisse International |
| US$ |
| 13.88 | % | 12.26 | % | 648,599 |
| 2,010,220 |
| 2,658,819 |
| 2,055,803 |
| — |
| — |
| 2,055,803 |
|
|
| As of December 31, 2009 |
| ||||||||||||
|
| ID |
| Company |
| ||||||||||
Company |
| One to Three |
| Three to |
| Total Current |
| One to Three |
| Three to Five |
| More than |
| Total Non- |
|
Foreign |
| 116,911 |
| 1,126,775 |
| 1,243,686 |
| 3,552,065 |
| — |
| — |
| 3,552,065 |
|
Foreign |
| 115,594 |
| 1,112,222 |
| 1,227,816 |
| 3,504,099 |
| — |
| — |
| 3,504,099 |
|
Foreign |
| 1,955,113 |
| 3,030,536 |
| 4,985,649 |
| 20,236,886 |
| — |
| — |
| 20,236,886 |
|
Foreign |
| 985,138 |
| 3,779,758 |
| 4,764,896 |
| 31,973,976 |
| 7,201,106 |
| 2,901,540 |
| 42,076,622 |
|
Foreign |
| 854,691 |
| 2,611,555 |
| 3,466,246 |
| 6,932,491 |
| 31,716,155 |
| — |
| 38,648,646 |
|
Foreign |
| 1,269,388 |
| 3,878,686 |
| 5,148,074 |
| 49,342,293 |
| — |
| — |
| 49,342,293 |
|
Foreign |
| — |
| — |
| — |
| — |
| — |
| — |
| — |
|
Foreign |
| — |
| 6,792,445 |
| 6,792,445 |
| 2,606,603 |
| — |
| — |
| 2,606,603 |
|
Foreign |
| 456,263 |
| 3,206,151 |
| 3,662,414 |
| 7,785,583 |
| 6,004,096 |
| 12,618,618 |
| 26,408,297 |
|
Foreign |
| 262,389 |
| 3,993,950 |
| 4,256,339 |
| 9,004,830 |
| 7,072,136 |
| 6,350,778 |
| 22,427,744 |
|
Foreign |
| 107,553 |
| 328,635 |
| 436,188 |
| 872,377 |
| 762,434 |
| 4,583,845 |
| 6,218,656 |
|
Foreign |
| 5,553,443 |
| 72,696,422 |
| 78,249,865 |
| 133,977,433 |
| — |
| — |
| 133,977,433 |
|
Foreign |
| 29,795 |
| 235,418 |
| 265,213 |
| 461,208 |
| 258,688 |
| 2,171,820 |
| 2,891,716 |
|
Foreign |
| 3,186,809 |
| 10,352,999 |
| 13,539,808 |
| 23,622,141 |
| 13,075,933 |
| 10,317,174 |
| 47,015,248 |
|
Foreign |
| 245,398 |
| 1,347,354 |
| 1,592,752 |
| 3,204,603 |
| 1,611,851 |
| — |
| 4,816,454 |
|
Foreign |
| 3,334,992 |
| 15,386,699 |
| 18,721,691 |
| 37,053,682 |
| 27,764,499 |
| 3,612,736 |
| 68,430,917 |
|
Foreign |
| 3,833,020 |
| 11,207,356 |
| 15,040,376 |
| 27,368,932 |
| 14,331,001 |
| — |
| 41,699,933 |
|
Foreign |
| 162,392 |
| 4,593,320 |
| 4,755,712 |
| 8,852,834 |
| — |
| — |
| 8,852,834 |
|
Foreign |
| — |
| — |
| — |
| — |
| — |
| — |
| — |
|
Foreign |
| 5,071,000 |
| — |
| 5,071,000 |
| — |
| — |
| — |
| — |
|
Foreign |
| 175,139 |
| 4,118,468 |
| 4,293,607 |
| 10,492,763 |
| 1,839,338 |
| — |
| 12,332,101 |
|
Foreign |
| 513,959 |
| 1,519,062 |
| 2,033,021 |
| 8,387,679 |
| — |
| — |
| 8,387,679 |
|
Foreign |
| 80,855 |
| 3,854,157 |
| 3,935,012 |
| 5,420,166 |
| — |
| — |
| 5,420,166 |
|
Foreign |
| 37,221 |
| 113,730 |
| 150,951 |
| 2,819,269 |
| — |
| — |
| 2,819,269 |
|
Foreign |
| 58,946 |
| 180,114 |
| 239,060 |
| 5,640,104 |
| — |
| — |
| 5,640,104 |
|
Foreign |
| 55,708 |
| 170,218 |
| 225,926 |
| 5,386,989 |
| — |
| — |
| 5,386,989 |
|
Foreign |
| 1,014,200 |
| — |
| 1,014,200 |
| — |
| — |
| — |
| — |
|
Foreign |
| 8,970 |
| 1,014,200 |
| 1,023,170 |
| — |
| — |
| — |
| — |
|
Foreign |
| 141,879 |
| 433,518 |
| 575,397 |
| 6,066,548 |
| — |
| — |
| 6,066,548 |
|
Foreign |
| 15,723 |
| 1,537,197 |
| 1,552,920 |
| — |
| — |
| — |
| — |
|
Foreign |
| 13,235 |
| 40,439 |
| 53,674 |
| 1,506,041 |
| — |
| — |
| 1,506,041 |
|
Foreign |
| 44,279 |
| 135,296 |
| 179,575 |
| 2,735,397 |
| — |
| — |
| 2,735,397 |
|
Foreign |
| 44,279 |
| 135,296 |
| 179,575 |
| 2,735,397 |
| — |
| — |
| 2,735,397 |
|
Foreign |
| 38,384 |
| 117,285 |
| 155,669 |
| 2,370,700 |
| — |
| — |
| 2,370,700 |
|
Foreign |
| 17,711 |
| 54,118 |
| 71,829 |
| 1,094,159 |
| — |
| — |
| 1,094,159 |
|
Foreign |
| 73,798 |
| 225,493 |
| 299,291 |
| 4,558,995 |
| — |
| — |
| 4,558,995 |
|
Foreign |
| 44,279 |
| 135,296 |
| 179,575 |
| 2,735,397 |
| — |
| — |
| 2,735,397 |
|
Foreign |
| 223,057 |
| 5,792,572 |
| 6,015,629 |
| — |
| — |
| — |
| — |
|
Foreign |
| — |
| — |
| — |
| — |
| — |
| — |
| — |
|
Foreign |
| — |
| — |
| — |
| — |
| — |
| — |
| — |
|
Foreign |
| — |
| — |
| — |
| — |
| — |
| — |
| — |
|
Foreign |
| 22,251 |
| 1,608,821 |
| 1,631,072 |
| — |
| — |
| — |
| — |
|
Foreign |
| 24,982 |
| 1,612,523 |
| 1,637,505 |
| — |
| — |
| — |
| — |
|
Foreign |
| 119,807 |
| 366,078 |
| 485,885 |
| 7,784,356 |
| — |
| — |
| 7,784,356 |
|
Foreign |
| 336,907 |
| 2,318,241 |
| 2,655,148 |
| 6,381,557 |
| — |
| — |
| 6,381,557 |
|
Foreign |
| 60,820 |
| 185,840 |
| 246,660 |
| 1,908,848 |
| — |
| — |
| 1,908,848 |
|
Foreign |
| 192,756 |
| 588,978 |
| 781,734 |
| 4,490,131 |
| — |
| — |
| 4,490,131 |
|
Foreign |
| 157,987 |
| 482,738 |
| 640,725 |
| 3,816,535 |
| — |
| — |
| 3,816,535 |
|
Foreign |
| 119,289 |
| 364,494 |
| 483,783 |
| 3,352,871 |
| — |
| — |
| 3,352,871 |
|
Foreign |
| 39,533 |
| 120,796 |
| 160,329 |
| 1,240,752 |
| — |
| — |
| 1,240,752 |
|
Foreign |
| 255,968 |
| 782,125 |
| 1,038,093 |
| 9,120,095 |
| — |
| — |
| 9,120,095 |
|
Foreign |
| 183,357 |
| 560,258 |
| 743,615 |
| 6,781,522 |
| — |
| — |
| 6,781,522 |
|
Foreign |
| 603,814 |
| 1,844,989 |
| 2,448,803 |
| 21,513,776 |
| — |
| — |
| 21,513,776 |
|
Foreign |
| 669,415 |
| 2,045,433 |
| 2,714,848 |
| 23,851,093 |
| — |
| — |
| 23,851,093 |
|
Foreign |
| 762,138 |
| 2,328,754 |
| 3,090,892 |
| 27,154,793 |
| — |
| — |
| 27,154,793 |
|
Foreign |
| — |
| — |
| — |
| — |
| — |
| — |
| — |
|
Foreign |
| — |
| — |
| — |
| — |
| — |
| — |
| — |
|
Foreign |
| 88,632 |
| 2,428,842 |
| 2,517,474 |
| 2,202,337 |
| — |
| — |
| 2,202,337 |
|
Copmany |
|
|
|
|
|
|
|
|
| Effective |
| Nominal |
|
ID |
|
|
|
|
|
|
|
|
| Interest |
| Interest |
|
Number |
| Company |
| Country |
| Financial Institution |
| Currency |
| Rate |
| Rate |
|
Foreign |
| Endesa Costanera S.A. |
| Argentina |
| Citibank |
| US$ |
| 6.30 | % | 5.00 | % |
Foreign |
| Endesa Costanera S.A. |
| Argentina |
| Banco Nación Argentina |
| Ar$ |
| 15.82 | % | 15.82 | % |
Foreign |
| Endesa Costanera S.A. |
| Argentina |
| Mediocredito Italiano |
| Ar$ |
| 14.00 | % | 1.75 | % |
Foreign |
| Endesa Costanera S.A. |
| Argentina |
| Banco Santander Río |
| Ar$ |
| 15.00 | % | 15.00 | % |
Foreign |
| Endesa Costanera S.A. |
| Argentina |
| Banco Itau |
| Ar$ |
| 18.12 | % | 18.12 | % |
Foreign |
| Endesa Costanera S.A. |
| Argentina |
| Citibank |
| Ar$ |
| 13.00 | % | 13.00 | % |
Foreign |
| Endesa Costanera S.A. |
| Argentina |
| Banco Galicia |
| Ar$ |
| 15.00 | % | 15.00 | % |
Foreign |
| Endesa Costanera S.A. |
| Argentina |
| Citibank |
| US$ |
| 10.28 | % | 5.32 | % |
Foreign |
| Endesa Costanera S.A. |
| Argentina |
| Banco de la Ciudad de Buenos Aires |
| Ar$ |
| 6.70 | % | 6.70 | % |
Foreign |
| Endesa Costanera S.A. |
| Argentina |
| Macro |
| Ar$ |
| 14.75 | % | 14.75 | % |
Foreign |
| Endesa Costanera S.A. |
| Argentina |
| Standard Bank |
| Ar$ |
| 15.40 | % | 15.40 | % |
Foreign |
| Endesa Costanera S.A. |
| Argentina |
| Superville |
| Ar$ |
| 13.00 | % | 13.00 | % |
91,081,000-6 |
| Endesa S.A. (Chile) |
| Chile |
| B,N,P, Paribas |
| US$ |
| 5.96 | % | 5.96 | % |
91,081,000-6 |
| Endesa S.A. (Chile) |
| Chile |
| Export Development Corpotation Loan |
| US$ |
| 2.50 | % | 2.50 | % |
91,081,000-6 |
| Endesa S.A. (Chile) |
| Chile |
| Banco Bilbao Vizcaya Argentaria S,A, |
| US$ |
| 1.65 | % | 1.65 | % |
91,081,000-6 |
| Endesa S.A. (Chile) |
| Chile |
| The Bank of Tokyo-Mitsubishi, Ltd, |
| US$ |
| 1.65 | % | 1.65 | % |
91,081,000-6 |
| Endesa S.A. (Chile) |
| Chile |
| Caja Madrid, Caja Madrid Miami Agency |
| US$ |
| 1.65 | % | 1.65 | % |
91,081,000-6 |
| Endesa S.A. (Chile) |
| Chile |
| Banco Santander Central Hispano S,A, N,Y,B, |
| US$ |
| 1.65 | % | 1.65 | % |
91,081,000-6 |
| Endesa S.A. (Chile) |
| Chile |
| Citibank NA ,Nassau, Bahamas Branch |
| US$ |
| 1.65 | % | 1.65 | % |
91,081,000-6 |
| Endesa S.A. (Chile) |
| Chile |
| Ing Bank N,V, |
| US$ |
| 1.65 | % | 1.60 | % |
91,081,000-6 |
| Endesa S.A. (Chile) |
| Chile |
| San Paolo IMI S,p,A |
| US$ |
| 1.65 | % | 1.60 | % |
91,081,000-6 |
| Endesa S.A. (Chile) |
| Chile |
| HSBC Bank pic Spanish Branch |
| US$ |
| 1.65 | % | 1.60 | % |
91,081,000-6 |
| Endesa S.A. (Chile) |
| Chile |
| ABN AMRO Bank |
| US$ |
| 1.65 | % | 1.60 | % |
91,081,000-6 |
| Endesa S.A. (Chile) |
| Chile |
| Instituto de Credito Oficial |
| US$ |
| 1.65 | % | 1.65 | % |
91,081,000-6 |
| Endesa S.A. (Chile) |
| Chile |
| Deutsche Bank AG New York Branch |
| US$ |
| 1.65 | % | 1.60 | % |
91,081,000-6 |
| Endesa S.A. (Chile) |
| Chile |
| The Bank of Nova Scotia |
| US$ |
| 1.65 | % | 1.60 | % |
91,081,000-6 |
| Endesa S.A. (Chile) |
| Chile |
| Banco Bilbao Vizcaya Argentaria S,A, |
| US$ |
| 2.28 | % | 2.28 | % |
91,081,000-6 |
| Endesa S.A. (Chile) |
| Chile |
| Caja Madrid, Caja Madrid Miami Agency |
| US$ |
| 1.77 | % | 1.77 | % |
Foreign |
| Hidroeléctrica El Chocón |
| Argentina |
| Deutsche Bank |
| US$ |
| 3.80 | % | 3.80 | % |
Foreign |
| Hidroeléctrica El Chocón |
| Argentina |
| Standard Bank |
| US$ |
| 3.80 | % | 3.80 | % |
Foreign |
| Hidroeléctrica El Chocón |
| Argentina |
| ITAU - Sindicado |
| Ar$ |
| 18.67 | % | 18.67 | % |
Foreign |
| Hidroeléctrica El Chocón |
| Argentina |
| STANDARD - Sindicado |
| Ar$ |
| 18.67 | % | 18.67 | % |
Foreign |
| Hidroeléctrica El Chocón |
| Argentina |
| SANTANDER - Sindicado |
| Ar$ |
| 18.67 | % | 18.67 | % |
Foreign |
| Hidroeléctrica El Chocón |
| Argentina |
| HIPOTECARIO - Sindicado |
| Ar$ |
| 18.67 | % | 18.67 | % |
Foreign |
| Hidroeléctrica El Chocón |
| Argentina |
| GALICIA - Sindicado |
| Ar$ |
| 18.67 | % | 18.67 | % |
Foreign |
| Hidroeléctrica El Chocón |
| Argentina |
| Citibank |
| Ar$ |
| 14.30 | % | 14.30 | % |
Foreign |
| Hidroeléctrica El Chocón |
| Argentina |
| BBVA |
| Ar$ |
| 14.50 | % | 14.50 | % |
Foreign |
| Hidroeléctrica El Chocón |
| Argentina |
| Macro |
| Ar$ |
| 17.75 | % | 17.75 | % |
Foreign |
| Hidroeléctrica El Chocón |
| Argentina |
| Banco de la Ciudad de Buenos Aires |
| Ar$ |
| 21.50 | % | 21.50 | % |
Foreign |
| Hidroeléctrica El Chocón |
| Argentina |
| Banco Santander Rio - Sindicado |
| Ar$ |
| 17.44 | % | 17.44 | % |
Foreign |
| Hidroeléctrica El Chocón |
| Argentina |
| Citibank |
| Ar$ |
| 17.44 | % | 17.44 | % |
Foreign |
| Hidroeléctrica El Chocón |
| Argentina |
| Banco Industrial de Azul |
| Ar$ |
| 17.14 | % | 17.14 | % |
Foreign |
| Hidroeléctrica El Chocón |
| Argentina |
| Banco Supervielle |
| Ar$ |
| 17.52 | % | 17.52 | % |
Foreign |
| Hidroeléctrica El Chocón |
| Argentina |
| BBVA Banco Francés |
| Ar$ |
| 14.00 | % | 14.00 | % |
96,830,980-3 |
| Inversiones Gas Atacama Holding Ltda, |
| Chile |
| PNC BANK |
| US$ |
| 3.09 | % | 3.09 | % |
99,584,600-4 |
| Sistemas Sec S.A. |
| Chile |
| BBVA |
| US$ |
| 4.68 | % | 4.68 | % |
Foreign |
| Synapsis Brasil Ltda, |
| Brazil |
| BNB |
| Ch$ |
| 9.57 | % | 9.57 | % |
Foreign |
| Synapsis Colombia Ltda, |
| Colombia |
| Banco de Bogotá |
| Ch$ |
| 11.50 | % | 11.50 | % |
|
| As of December 31, 2010 |
| ||||||||||||
|
| Current |
| Non-current |
| ||||||||||
Copmany |
| One to Three |
| Three to |
| Total Current |
| One to Three |
| Three to Five |
| More than Five |
| Total Non- |
|
Foreign |
| 238,978 |
| 188,868 |
| 427,846 |
| — |
| — |
| — |
| — |
|
Foreign |
| 184,556 |
| 2,497,668 |
| 2,682,224 |
| 1,994,435 |
| — |
| — |
| 1,994,435 |
|
Foreign |
| 4,198 |
| 954,555 |
| 958,753 |
| — |
| — |
| — |
| — |
|
Foreign |
| 881,772 |
| — |
| 881,772 |
| — |
| — |
| — |
| — |
|
Foreign |
| 1,853,593 |
| 895,623 |
| 2,749,216 |
| — |
| — |
| — |
| — |
|
Foreign |
| 3,807,821 |
| 146,831 |
| 3,954,652 |
| — |
| — |
| — |
| — |
|
Foreign |
| 1,808,418 |
| — |
| 1,808,418 |
| — |
| — |
| — |
| — |
|
Foreign |
| 6,489 |
| 426,386 |
| 432,875 |
| — |
| — |
| — |
| — |
|
Foreign |
| 35,128 |
| 1,011,545 |
| 1,046,673 |
| — |
| — |
| — |
| — |
|
Foreign |
| 357,550 |
| — |
| 357,550 |
| — |
| — |
| — |
| — |
|
Foreign |
| 1,159,080 |
| — |
| 1,159,080 |
| — |
| — |
| — |
| — |
|
Foreign |
| 1,788,875 |
| — |
| 1,788,875 |
| — |
| — |
| — |
| — |
|
91,081,000-6 |
| 60,946 |
| 944,030 |
| 1,004,976 |
| 1,823,007 |
| 1,648,517 |
| — |
| 3,471,524 |
|
91,081,000-6 |
| 345,404 |
| 700,155 |
| 1,045,559 |
| 1,379,586 |
| 337,839 |
| — |
| 1,717,425 |
|
91,081,000-6 |
| 408,841 |
| 17,060,873 |
| 17,469,714 |
| — |
| 81,838,285 |
| — |
| 81,838,285 |
|
91,081,000-6 |
| — |
| — |
| — |
| — |
| — |
| — |
| — |
|
91,081,000-6 |
| — |
| — |
| — |
| — |
| — |
| — |
| — |
|
91,081,000-6 |
| — |
| — |
| — |
| — |
| — |
| — |
| — |
|
91,081,000-6 |
| — |
| — |
| — |
| — |
| — |
| — |
| — |
|
91,081,000-6 |
| — |
| — |
| — |
| — |
| — |
| — |
| — |
|
91,081,000-6 |
| — |
| — |
| — |
| — |
| — |
| — |
| — |
|
91,081,000-6 |
| — |
| — |
| — |
| — |
| — |
| — |
| — |
|
91,081,000-6 |
| — |
| — |
| — |
| — |
| — |
| — |
| — |
|
91,081,000-6 |
| — |
| — |
| — |
| — |
| — |
| — |
| — |
|
91,081,000-6 |
| — |
| — |
| — |
| — |
| — |
| — |
| — |
|
91,081,000-6 |
| — |
| — |
| — |
| — |
| — |
| — |
| — |
|
91,081,000-6 |
| — |
| — |
| — |
| — |
| — |
| — |
| — |
|
91,081,000-6 |
| — |
| — |
| — |
| — |
| — |
| — |
| — |
|
Foreign |
| 1,479,285 |
| 7,585,610 |
| 9,064,895 |
| 979,026 |
| — |
| — |
| 979,026 |
|
Foreign |
| 1,477,401 |
| 7,582,650 |
| 9,060,051 |
| 979,026 |
| — |
| — |
| 979,026 |
|
Foreign |
| 136,513 |
| 1,869,470 |
| 2,005,983 |
| 1,687,700 |
| — |
| — |
| 1,687,700 |
|
Foreign |
| 106,749 |
| 1,460,783 |
| 1,567,532 |
| 1,318,645 |
| — |
| — |
| 1,318,645 |
|
Foreign |
| 760,895 |
| 1,245,088 |
| 2,005,983 |
| 1,687,700 |
| — |
| — |
| 1,687,700 |
|
Foreign |
| 88,490 |
| 1,223,925 |
| 1,312,415 |
| 1,106,099 |
| — |
| — |
| 1,106,099 |
|
Foreign |
| 41,985 |
| 582,414 |
| 624,399 |
| 526,511 |
| — |
| — |
| 526,511 |
|
Foreign |
| 25,459 |
| 714,554 |
| 740,013 |
| — |
| — |
| — |
| — |
|
Foreign |
| 21,510 |
| 595,558 |
| 617,068 |
| — |
| — |
| — |
| — |
|
Foreign |
| 105,325 |
| 2,599,171 |
| 2,704,496 |
| — |
| — |
| — |
| — |
|
Foreign |
| — |
| — |
| — |
| — |
| — |
| — |
| — |
|
Foreign |
| 463,089 |
| 3,083,714 |
| 3,546,803 |
| 8,328,139 |
| 1,696,967 |
| — |
| 10,025,106 |
|
Foreign |
| — |
| — |
| — |
| — |
| — |
| — |
| — |
|
Foreign |
| 378,715 |
| 368,379 |
| 747,094 |
| — |
| — |
| — |
| — |
|
Foreign |
| — |
| — |
| — |
| — |
| — |
| — |
| — |
|
Foreign |
| — |
| — |
| — |
| — |
| — |
| — |
| — |
|
96,830,980-3 |
| 1,515 |
| 210,098 |
| 211,613 |
| — |
| — |
| — |
| — |
|
99,584,600-4 |
| — |
| — |
| — |
| — |
| — |
| — |
| — |
|
Foreign |
| — |
| — |
| — |
| — |
| — |
| — |
| — |
|
Foreign |
| — |
| — |
| — |
| — |
| — |
| — |
| — |
|
Total |
| 59,990,367 |
| 273,216,141 |
| 333,206,508 |
| 339,973,705 |
| 235,669,899 |
| 41,409,395 |
| 617,052,999 |
|
|
| As of December 31, 2009 |
| ||||||||||||
|
| ID |
| Company |
| ||||||||||
Copmany |
| One to Three |
| Three to |
| Total Current |
| One to Three |
| Three to |
| More than |
| Total Non- |
|
Foreign |
| 2,771,743 |
| — |
| 2,771,743 |
| — |
| — |
| — |
| — |
|
Foreign |
| — |
| — |
| — |
| — |
| — |
| — |
| — |
|
Foreign |
| 12,760 |
| 1,968,909 |
| 1,981,669 |
| 977,862 |
| — |
| — |
| 977,862 |
|
Foreign |
| 4,453,137 |
| — |
| 4,453,137 |
| — |
| — |
| — |
| — |
|
Foreign |
| 1,674,866 |
| 1,015,968 |
| 2,690,834 |
| — |
| — |
| — |
| — |
|
Foreign |
| 858,964 |
| 789,556 |
| 1,648,520 |
| — |
| — |
| — |
| — |
|
Foreign |
| — |
| — |
| — |
| — |
| — |
| — |
| — |
|
Foreign |
| 6,417 |
| 404,266 |
| 410,683 |
| — |
| — |
| — |
| — |
|
Foreign |
| — |
| — |
| — |
| — |
| — |
| — |
| — |
|
Foreign |
| — |
| — |
| — |
| — |
| — |
| — |
| — |
|
Foreign |
| — |
| — |
| — |
| — |
| — |
| — |
| — |
|
Foreign |
| — |
| — |
| — |
| — |
| — |
| — |
| — |
|
91,081,000-6 |
| — |
| — |
| — |
| — |
| — |
| — |
| — |
|
91,081,000-6 |
| — |
| — |
| — |
| — |
| — |
| — |
| — |
|
91,081,000-6 |
| 76,659 |
| 84,077 |
| 160,736 |
| 310,503 |
| 295,877 |
| — |
| 606,380 |
|
91,081,000-6 |
| 76,659 |
| 84,077 |
| 160,736 |
| 310,503 |
| 295,877 |
| — |
| 606,380 |
|
91,081,000-6 |
| 76,659 |
| 84,077 |
| 160,736 |
| 310,503 |
| 295,877 |
| — |
| 606,380 |
|
91,081,000-6 |
| 76,659 |
| 84,078 |
| 160,737 |
| 310,503 |
| 295,877 |
| — |
| 606,380 |
|
91,081,000-6 |
| 76,659 |
| 84,078 |
| 160,737 |
| 310,503 |
| 295,876 |
| — |
| 606,379 |
|
91,081,000-6 |
| 12,790 |
| 173,010 |
| 185,800 |
| 345,665 |
| 239,767 |
| 209,592 |
| 795,024 |
|
91,081,000-6 |
| 12,790 |
| 173,010 |
| 185,800 |
| 345,665 |
| 239,767 |
| 209,592 |
| 795,024 |
|
91,081,000-6 |
| 12,790 |
| 173,010 |
| 185,800 |
| 345,665 |
| 239,767 |
| 209,592 |
| 795,024 |
|
91,081,000-6 |
| 12,790 |
| 173,010 |
| 185,800 |
| 345,665 |
| 239,767 |
| 209,592 |
| 795,024 |
|
91,081,000-6 |
| 350,939 |
| 1,052,816 |
| 1,403,755 |
| 102,121,878 |
| — |
| — |
| 102,121,878 |
|
91,081,000-6 |
| 12,790 |
| 173,010 |
| 185,800 |
| 345,665 |
| 239,767 |
| 209,592 |
| 795,024 |
|
91,081,000-6 |
| 12,790 |
| 173,010 |
| 185,800 |
| 345,665 |
| 239,768 |
| 209,592 |
| 795,025 |
|
91,081,000-6 |
| 580,915 |
| 1,775,019 |
| 2,355,934 |
| 4,711,868 |
| 104,750,582 |
| — |
| 109,462,450 |
|
91,081,000-6 |
| 439,829 |
| 127,820,814 |
| 128,260,643 |
| — |
| — |
| — |
| — |
|
Foreign |
| 1,691,369 |
| 4,966,337 |
| 6,657,706 |
| 10,883,496 |
| — |
| — |
| 10,883,496 |
|
Foreign |
| 1,694,990 |
| 4,975,360 |
| 6,670,350 |
| 10,888,934 |
| — |
| — |
| 10,888,934 |
|
Foreign |
| 199,352 |
| 1,449,462 |
| 1,648,814 |
| 4,169,361 |
| — |
| — |
| 4,169,361 |
|
Foreign |
| 155,744 |
| 1,132,392 |
| 1,288,136 |
| 3,257,313 |
| — |
| — |
| 3,257,313 |
|
Foreign |
| 130,825 |
| 951,209 |
| 1,082,034 |
| 2,736,143 |
| — |
| — |
| 2,736,143 |
|
Foreign |
| 62,298 |
| 452,957 |
| 515,255 |
| 1,302,925 |
| — |
| — |
| 1,302,925 |
|
Foreign |
| 229,470 |
| 1,539,414 |
| 1,768,884 |
| 4,283,140 |
| — |
| — |
| 4,283,140 |
|
Foreign |
| — |
| — |
| — |
| — |
| — |
| — |
| — |
|
Foreign |
| — |
| — |
| — |
| — |
| — |
| — |
| — |
|
Foreign |
| — |
| — |
| — |
| — |
| — |
| — |
| — |
|
Foreign |
| — |
| — |
| — |
| — |
| — |
| — |
| — |
|
Foreign |
| — |
| — |
| — |
| — |
| — |
| — |
| — |
|
Foreign |
| — |
| — |
| — |
| — |
| — |
| — |
| — |
|
Foreign |
| — |
| — |
| — |
| — |
| — |
| — |
| — |
|
Foreign |
| — |
| — |
| — |
| — |
| — |
| — |
| — |
|
Foreign |
| — |
| — |
| — |
| — |
| — |
| — |
| — |
|
96,830,980-3 |
| 5,750 |
| 237,177 |
| 242,927 |
| 231,267 |
| — |
| — |
| 231,267 |
|
99,584,600-4 |
| 23,176 |
| 70,816 |
| 93,992 |
| 187,983 |
| 1,354,489 |
| — |
| 1,542,472 |
|
Foreign |
| 54,395 |
| 126,775 |
| 181,170 |
| 236,372 |
| — |
| — |
| 236,372 |
|
Foreign |
| 716,433 |
| — |
| 716,433 |
| — |
| — |
| — |
| — |
|
Total |
| 50,352,574 |
| 335,083,344 |
| 385,435,918 |
| 701,515,353 |
| 220,660,295 |
| 43,814,063 |
| 965,989,711 |
|
B) Secured and unsecured liabilities
a) Secured and unsecured liabilities detailed by currency and maturity
|
|
|
|
|
| As of December 31, 2010 |
| ||||||||||||
|
|
|
|
|
| Current |
| Non-Current |
| ||||||||||
|
|
|
|
|
| Maturity |
| Total |
| Maturity |
| Total Non- |
| ||||||
|
|
|
|
|
| One to |
| Three to |
| Current as |
|
|
| Three to |
|
|
| Current as of |
|
|
|
|
| Nominal |
| Three |
| Twelve |
| of December |
| One to |
| Five |
| More Than |
| December 31, |
|
|
|
|
| Interest |
| Months |
| Months |
| 31, 2010 |
| Three Years |
| Years |
| Five Years |
| 2010 |
|
Country |
| Currency |
| Rate |
| ThCh$ |
| ThCh$ |
| ThCh$ |
| ThCh$ |
| ThCh$ |
| ThCh$ |
| ThCh$ |
|
|
|
|
|
|
|
|
|
|
|
|
|
|
|
|
|
|
|
|
|
Chile |
| US$ |
| 8.15 | % | 20,226,869 |
| 44,237,144 |
| 64,464,013 |
| 299,076,238 |
| 429,205,042 |
| 515,592,354 |
| 1,243,873,634 |
|
Chile |
| Ch$ |
| 7.82 | % | 8,474,004 |
| 33,742,901 |
| 42,216,905 |
| 77,732,304 |
| 187,444,894 |
| 542,172,671 |
| 807,349,869 |
|
Peru |
| US$ |
| 6.43 | % | 870,099 |
| 6,351,625 |
| 7,221,724 |
| 18,968,745 |
| 8,678,373 |
| 38,097,741 |
| 65,744,859 |
|
Peru |
| Soles |
| 6.77 | % | 19,784,574 |
| 22,667,166 |
| 42,451,740 |
| 64,109,539 |
| 68,651,225 |
| 59,006,695 |
| 191,767,459 |
|
Argentina |
| Ar$ |
| 17.36 | % | 510,018 |
| 9,010,562 |
| 9,520,580 |
| 4,165,269 |
| — |
| — |
| 4,165,269 |
|
Colombia |
| CPs |
| 8.31 | % | 47,619,509 |
| 131,473,631 |
| 179,093,140 |
| 152,631,795 |
| 183,051,591 |
| 442,910,408 |
| 778,593,794 |
|
Brazil |
| Reais |
| 12.12 | % | 7,503,875 |
| 97,708,841 |
| 105,212,716 |
| 155,008,143 |
| 48,941,503 |
| — |
| 203,949,646 |
|
|
|
|
|
|
|
|
|
|
|
|
|
|
|
|
|
|
|
|
|
|
|
|
|
|
| 104,988,948 |
| 345,191,870 |
| 450,180,818 |
| 771,692,033 |
| 925,972,628 |
| 1,597,779,869 |
| 3,295,444,530 |
|
|
|
|
|
|
| As of December 31, 2009 |
| ||||||||||||
|
|
|
|
|
| Current |
| Non-Current |
| ||||||||||
|
|
|
|
|
| Maturity |
| Total |
| Maturity |
| Total Non- |
| ||||||
|
|
|
|
|
| One to |
| Three to |
| Current as |
|
|
| Three to |
|
|
| Current as of |
|
|
|
|
| Nominal |
| Three |
| Twelve |
| of December |
| One to |
| Five |
| More Than |
| December 31, |
|
|
|
|
| Interest |
| Months |
| Months |
| 31, 2009 |
| Three Years |
| Years |
| Five Years |
| 2009 |
|
Country |
| Currency |
| Rate |
| ThCh$ |
| ThCh$ |
| ThCh$ |
| ThCh$ |
| ThCh$ |
| ThCh$ |
| ThCh$ |
|
|
|
|
|
|
|
|
|
|
|
|
|
|
|
|
|
|
|
|
|
Chile |
| US$ |
| 8.15 | % | 15,628,041 |
| 47,752,347 |
| 63,380,388 |
| 126,760,775 |
| 460,199,594 |
| 530,676,061 |
| 1,117,636,430 |
|
Chile |
| Ch$ |
| 7.82 | % | 3,106,823 |
| 15,050,387 |
| 18,157,210 |
| 35,877,886 |
| 29,967,675 |
| 487,997,370 |
| 553,842,931 |
|
Peru |
| US$ |
| 6.43 | % | 724,841 |
| 2,214,792 |
| 2,939,633 |
| 19,585,709 |
| 3,563,753 |
| 34,273,976 |
| 57,423,438 |
|
Peru |
| Soles |
| 6.77 | % | 3,273,694 |
| 25,385,026 |
| 28,658,720 |
| 70,360,662 |
| 91,399,182 |
| 48,895,891 |
| 210,655,735 |
|
Argentina |
| Ar$ |
| 17.36 | % | 657,735 |
| 10,459,172 |
| 11,116,907 |
| 14,674,385 |
| — |
| — |
| 14,674,385 |
|
Colombia |
| CPs |
| 8.31 | % | 72,170,887 |
| 113,532,030 |
| 185,702,917 |
| 213,568,835 |
| 206,774,272 |
| 439,859,884 |
| 860,202,991 |
|
Brazil |
| Reais |
| 12.12 | % | 48,826,017 |
| 22,466,550 |
| 71,292,567 |
| 223,769,344 |
| 54,505,883 |
| 26,865,685 |
| 305,140,912 |
|
|
|
|
|
|
|
|
|
|
|
|
|
|
|
|
|
|
|
|
|
|
|
|
|
|
| 144,388,038 |
| 236,860,304 |
| 381,248,342 |
| 704,597,596 |
| 846,410,359 |
| 1,568,568,867 |
| 3,119,576,822 |
|
b) Secured and unsecured liabilities detailed by Companies
Copmany |
|
|
|
|
|
|
|
|
|
|
| Effective |
| Nominal |
|
ID |
|
|
|
|
|
|
|
|
|
|
| Interest |
| Interest |
|
Number |
| Company |
| Country |
| Financial Institution |
| Country |
| Currency |
| Rate |
| Rate |
|
Foreign |
| Ampla |
| Brazil |
| BONOS |
| Brazil |
| Reais |
| 9.56 | % | 9.56 | % |
Foreign |
| Codensa |
| Colombia |
| B3 |
| Colombia |
| CPs |
| 13.12 | % | 13.12 | % |
Foreign |
| Codensa |
| Colombia |
| B5 |
| Colombia |
| CPs |
| 8.32 | % | 8.32 | % |
Foreign |
| Codensa |
| Colombia |
| B8 |
| Colombia |
| CPs |
| 8.51 | % | 8.51 | % |
Foreign |
| Codensa |
| Colombia |
| B302 |
| Colombia |
| CPs |
| 11.85 | % | 11.85 | % |
Foreign |
| Codensa |
| Colombia |
| B102 |
| Colombia |
| CPs |
| 7.77 | % | 7.77 | % |
Foreign |
| Codensa |
| Colombia |
| B502 |
| Colombia |
| CPs |
| 6.21 | % | 6.21 | % |
Foreign |
| Codensa |
| Colombia |
| B203 |
| Colombia |
| CPs |
| 10.85 | % | 10.85 | % |
Foreign |
| Codensa |
| Colombia |
| B503 |
| Colombia |
| CPs |
| 6.37 | % | 6.37 | % |
Foreign |
| Codensa |
| Colombia |
| B503 |
| Colombia |
| CPs |
| 8.17 | % | 8.17 | % |
Foreign |
| Codensa |
| Colombia |
| B102 |
| Colombia |
| CPs |
| 7.50 | % | 7.50 | % |
Foreign |
| Codensa |
| Colombia |
| B103 |
| Colombia |
| CPs |
| 7.75 | % | 7.75 | % |
Foreign |
| Codensa |
| Colombia |
| B304 |
| Colombia |
| CPs |
| 5.13 | % | 5.13 | % |
Foreign |
| Codensa |
| Colombia |
| B604 |
| Colombia |
| CPs |
| 6.03 | % | 6.03 | % |
Foreign |
| Coelce |
| Brazil |
| Itaú |
| Brazil |
| Reais |
| 10.47 | % | 10.47 | % |
Foreign |
| Coelce |
| Brazil |
| Santander |
| Brazil |
| Reais |
| 13.57 | % | 13.57 | % |
Foreign |
| Edegel |
| Peru |
| BANCO CONTINENTAL |
| Peru |
| Soles |
| 6.74 | % | 6.31 | % |
Foreign |
| Edegel |
| Peru |
| BANCO CONTINENTAL |
| Peru |
| Soles |
| 6.49 | % | 6.28 | % |
Foreign |
| Edegel |
| Peru |
| BANCO CONTINENTAL |
| Peru |
| Soles |
| 6.17 | % | 6.17 | % |
Foreign |
| Edegel |
| Peru |
| BANCO CONTINENTAL |
| Peru |
| Soles |
| 6.11 | % | 6.11 | % |
Foreign |
| Edegel |
| Peru |
| BANCO CONTINENTAL |
| Peru |
| Soles |
| 5.92 | % | 5.92 | % |
Foreign |
| Edegel |
| Peru |
| BANCO CONTINENTAL |
| Peru |
| Soles |
| 6.17 | % | 6.17 | % |
Foreign |
| Edegel |
| Peru |
| BANCO CONTINENTAL |
| Peru |
| Soles |
| 6.33 | % | 6.33 | % |
Foreign |
| Edegel |
| Peru |
| BANCO CONTINENTAL |
| Peru |
| US$ |
| 6.16 | % | 5.97 | % |
Foreign |
| Edegel |
| Peru |
| BANCO CONTINENTAL |
| Peru |
| US$ |
| 6.06 | % | 6.06 | % |
Foreign |
| Edegel |
| Peru |
| BANCO CONTINENTAL |
| Peru |
| US$ |
| 6.44 | % | 6.44 | % |
Foreign |
| Edegel |
| Peru |
| BANCO CONTINENTAL |
| Peru |
| US$ |
| 9.14 | % | 7.78 | % |
Foreign |
| Edegel |
| Peru |
| BANCO CONTINENTAL |
| Peru |
| US$ |
| 7.90 | % | 7.13 | % |
Foreign |
| Edegel |
| Peru |
| BANCO SCOTIABANK |
| Peru |
| US$ |
| 7.24 | % | 6.63 | % |
Foreign |
| Edegel |
| Peru |
| BANCO SCOTIABANK |
| Peru |
| US$ |
| 6.73 | % | 6.00 | % |
Foreign |
| Edegel |
| Peru |
| BANCO SCOTIABANK |
| Peru |
| US$ |
| 6.10 | % | 6.10 | % |
Foreign |
| Edegel |
| Peru |
| BANCO CONTINENTAL |
| Peru |
| Soles |
| 6.23 | % | 6.23 | % |
Foreign |
| Edegel |
| Peru |
| BANCO CONTINENTAL |
| Peru |
| Soles |
| 6.77 | % | 6.47 | % |
Foreign |
| Edegel |
| Peru |
| BANCO CONTINENTAL |
| Peru |
| Soles |
| 6.52 | % | 6.09 | % |
Foreign |
| Edegel |
| Peru |
| BANCO CONTINENTAL |
| Peru |
| Soles |
| 6.46 | % | 6.16 | % |
Foreign |
| Edegel |
| Peru |
| BANCO CONTINENTAL |
| Peru |
| Soles |
| 6.64 | % | 6.16 | % |
Foreign |
| Edegel |
| Peru |
| BANCO CONTINENTAL |
| Peru |
| Soles |
| 6.61 | % | 5.91 | % |
Foreign |
| Edegel |
| Peru |
| BANCO CONTINENTAL |
| Peru |
| US$ |
| 6.06 | % | 6.06 | % |
Foreign |
| Edelnor |
| Peru |
| Caja de Pensiones Militar Policial |
| Peru |
| Soles |
| 5.44 | % | 5.44 | % |
Foreign |
| Edelnor |
| Peru |
| FCR - Macrofondo |
| Peru |
| Soles |
| 6.48 | % | 1.27 | % |
Foreign |
| Edelnor |
| Peru |
| Rimac Internacional Cia de Seguros |
| Peru |
| Soles |
| 6.48 | % | 6.48 | % |
Foreign |
| Edelnor |
| Peru |
| Rimac Internacional Cia de Seguros |
| Peru |
| Soles |
| 0.48 | % | 0.48 | % |
Foreign |
| Edelnor |
| Peru |
| AFP Integra |
| Peru |
| Soles |
| 8.75 | % | 8.75 | % |
Foreign |
| Edelnor |
| Peru |
| Fondo de Seguro de Retiro de Suboficiales y Especialistas - Fosersoe |
| Peru |
| Soles |
| 7.31 | % | 7.31 | % |
Foreign |
| Edelnor |
| Peru |
| AFP Integra |
| Peru |
| Soles |
| 7.84 | % | 7.31 | % |
Foreign |
| Edelnor |
| Peru |
| Seguro Social de Salud - Essalud |
| Peru |
| Soles |
| 7.56 | % | 7.56 | % |
Foreign |
| Edelnor |
| Peru |
| AFP Profuturo |
| Peru |
| Soles |
| 8.16 | % | 7.56 | % |
Foreign |
| Edelnor |
| Peru |
| AFP Integra |
| Peru |
| Soles |
| 7.22 | % | 7.22 | % |
Foreign |
| Edelnor |
| Peru |
| AFP Horizonte |
| Peru |
| Soles |
| 7.06 | % | 7.06 | % |
Foreign |
| Edelnor |
| Peru |
| AFP Integra |
| Peru |
| Soles |
| 8.00 | % | 7.06 | % |
Foreign |
| Edelnor |
| Peru |
| AFP Integra |
| Peru |
| Soles |
| 6.66 | % | 6.66 | % |
Foreign |
| Edelnor |
| Peru |
| FCR - Macrofondo |
| Peru |
| Soles |
| 5.69 | % | 5.69 | % |
Foreign |
| Edelnor |
| Peru |
| AFP Profuturo |
| Peru |
| Soles |
| 5.91 | % | 5.69 | % |
Foreign |
| Edelnor |
| Peru |
| AFP Integra |
| Peru |
| Soles |
| 5.97 | % | 5.91 | % |
Foreign |
| Edelnor |
| Peru |
| AFP Horizonte |
| Peru |
| Soles |
| 6.94 | % | 5.97 | % |
Foreign |
| Edelnor |
| Peru |
| AFP Prima |
| Peru |
| Soles |
| 6.95 | % | 6.94 | % |
Foreign |
| Edelnor |
| Peru |
| AFP Prima |
| Peru |
| Soles |
| 6.84 | % | 6.56 | % |
Foreign |
| Edelnor |
| Peru |
| AFP Prima |
| Peru |
| Soles |
| 5.94 | % | 5.94 | % |
|
| As of December 31, 2010 |
| As of December 31, 2009 |
| ||||||||||||||||||||||||
|
| Current |
| Non-Current |
| Current |
| Non-Current |
| ||||||||||||||||||||
Copmany |
| One to Three |
| Three to |
| Total Current |
| One to Three |
| Three to Five |
| More tham |
| Total Non- |
| One to Three |
| Three to |
| Total Current |
| One to Three |
| Three to |
| More tham |
| Total Non- |
|
Foreign |
| 5,058,194 |
| 66,186,606 |
| 71,244,800 |
| 115,328,463 |
| 32,291,490 |
| — |
| 147,619,953 |
| 44,876,908 |
| 16,330,926 |
| 61,207,834 |
| 171,569,196 |
| 20,634,513 |
| 26,865,685 |
| 219,069,394 |
|
Foreign |
| — |
| — |
| — |
| — |
| — |
| — |
| — |
| 15,340,703 |
| — |
| 15,340,703 |
| — |
| — |
| — |
| — |
|
Foreign |
| 34,864,627 |
| 14,808,827 |
| 49,673,454 |
| — |
| — |
| — |
| — |
| 1,224,568 |
| 3,741,736 |
| 4,966,304 |
| 50,415,585 |
| — |
| — |
| 50,415,585 |
|
Foreign |
| 1,305,256 |
| 4,341,394 |
| 5,646,650 |
| 10,413,670 |
| — |
| 61,681,208 |
| 72,094,878 |
| 1,560,426 |
| 4,767,969 |
| 6,328,395 |
| 12,656,791 |
| 69,367,358 |
| — |
| 82,024,149 |
|
Foreign |
| — |
| — |
| — |
| — |
| — |
| — |
| — |
| 19,819,236 |
| — |
| 19,819,236 |
| — |
| — |
| — |
| — |
|
Foreign |
| 700,056 |
| 2,328,447 |
| 3,028,503 |
| 5,585,228 |
| — |
| 46,648,583 |
| 52,233,811 |
| 852,057 |
| 2,603,507 |
| 3,455,564 |
| 6,911,128 |
| 6,040,136 |
| 44,152,863 |
| 57,104,127 |
|
Foreign |
| 128,474 |
| 427,314 |
| 555,788 |
| 8,288,014 |
| — |
| — |
| 8,288,014 |
| 196,193 |
| 599,478 |
| 795,671 |
| 9,289,007 |
| — |
| — |
| 9,289,007 |
|
Foreign |
| — |
| — |
| — |
| — |
| — |
| — |
| — |
| 609,435 |
| 28,691,230 |
| 29,300,665 |
| — |
| — |
| — |
| — |
|
Foreign |
| 333,765 |
| 1,110,132 |
| 1,443,897 |
| 23,349,393 |
| — |
| — |
| 23,349,393 |
| 504,234 |
| 1,540,715 |
| 2,044,949 |
| 4,089,898 |
| 23,080,746 |
| — |
| 27,170,644 |
|
Foreign |
| 378,323 |
| 1,258,334 |
| 1,636,657 |
| 21,257,241 |
| — |
| — |
| 21,257,241 |
| 455,283 |
| 1,391,144 |
| 1,846,427 |
| 3,692,854 |
| 20,418,444 |
| — |
| 24,111,298 |
|
Foreign |
| 1,124,031 |
| 3,738,624 |
| 4,862,655 |
| 8,967,810 |
| — |
| 76,961,384 |
| 85,929,194 |
| 1,376,910 |
| 4,207,224 |
| 5,584,134 |
| 11,168,268 |
| 9,760,760 |
| 73,074,449 |
| 94,003,477 |
|
Foreign |
| 380,204 |
| 1,264,592 |
| 1,644,796 |
| 3,033,368 |
| — |
| 26,883,291 |
| 29,916,659 |
| — |
| — |
| — |
| — |
| — |
| — |
| — |
|
Foreign |
| 251,482 |
| 836,452 |
| 1,087,934 |
| 20,546,246 |
| — |
| — |
| 20,546,246 |
| 21,393,402 |
| — |
| 21,393,402 |
| — |
| — |
| — |
| — |
|
Foreign |
| 536,552 |
| 1,784,618 |
| 2,321,170 |
| 4,280,751 |
| — |
| 41,490,148 |
| 45,770,899 |
| 403,189 |
| 1,231,967 |
| 1,635,156 |
| 3,270,312 |
| 2,858,163 |
| 25,095,544 |
| 31,224,019 |
|
Foreign |
| 846,422 |
| 26,202,959 |
| 27,049,381 |
| — |
| — |
| — |
| — |
| 717,058 |
| 2,191,011 |
| 2,908,069 |
| 27,411,098 |
| — |
| — |
| 27,411,098 |
|
Foreign |
| 1,599,259 |
| 5,319,276 |
| 6,918,535 |
| 39,679,680 |
| 16,650,013 |
| — |
| 56,329,693 |
| 3,232,051 |
| 3,944,613 |
| 7,176,664 |
| 24,789,050 |
| 33,871,370 |
| — |
| 58,660,420 |
|
Foreign |
| 4,162,360 |
| — |
| 4,162,360 |
| — |
| — |
| — |
| — |
| 103,120 |
| 6,348,902 |
| 6,452,022 |
| — |
| — |
| — |
| — |
|
Foreign |
| 66,273 |
| 220,431 |
| 286,704 |
| 528,747 |
| 1,293,774 |
| 5,217,004 |
| 7,039,525 |
| 70,916 |
| 216,689 |
| 287,605 |
| 575,210 |
| 4,600,274 |
| — |
| 5,175,484 |
|
Foreign |
| 65,396 |
| 217,512 |
| 282,908 |
| 521,745 |
| 1,276,641 |
| 4,424,723 |
| 6,223,109 |
| 67,490 |
| 206,221 |
| 273,711 |
| 547,422 |
| 4,658,872 |
| — |
| 5,206,294 |
|
Foreign |
| 56,693 |
| 188,567 |
| 245,260 |
| 452,314 |
| 3,464,092 |
| — |
| 3,916,406 |
| 66,805 |
| 4,520,998 |
| 4,587,803 |
| — |
| — |
| — |
| — |
|
Foreign |
| 68,242 |
| 226,979 |
| 295,221 |
| 4,482,746 |
| — |
| — |
| 4,482,746 |
| 64,750 |
| 197,846 |
| 262,596 |
| 4,407,463 |
| — |
| — |
| 4,407,463 |
|
Foreign |
| 67,586 |
| 224,796 |
| 292,382 |
| 4,524,506 |
| — |
| — |
| 4,524,506 |
| 80,988 |
| 247,465 |
| 328,453 |
| 5,535,754 |
| — |
| — |
| 5,535,754 |
|
Foreign |
| 69,554 |
| 231,344 |
| 300,898 |
| 4,557,650 |
| — |
| — |
| 4,557,650 |
| 69,203 |
| 211,455 |
| 280,658 |
| 561,316 |
| 490,575 |
| 6,393,595 |
| 7,445,486 |
|
Foreign |
| 269,406 |
| 4,353,667 |
| 4,623,073 |
| 626,739 |
| — |
| 5,590,323 |
| 6,217,062 |
| 159,078 |
| 486,073 |
| 645,151 |
| 11,324,482 |
| — |
| — |
| 11,324,482 |
|
Foreign |
| 75,208 |
| 250,147 |
| 325,355 |
| 428,296 |
| — |
| 3,383,243 |
| 3,811,539 |
| 63,039 |
| 192,619 |
| 255,658 |
| 4,183,579 |
| — |
| — |
| 4,183,579 |
|
Foreign |
| 103,734 |
| 345,028 |
| 448,762 |
| 600,026 |
| 1,468,183 |
| 7,663,880 |
| 9,732,089 |
| 83,750 |
| 255,901 |
| 339,651 |
| 679,302 |
| 593,691 |
| 9,511,585 |
| 10,784,578 |
|
Foreign |
| 75,334 |
| 250,569 |
| 325,903 |
| 601,038 |
| 1,470,659 |
| 4,120,651 |
| 6,192,348 |
| 115,983 |
| 354,393 |
| 470,376 |
| 940,751 |
| 822,191 |
| 4,968,962 |
| 6,731,904 |
|
Foreign |
| 53,683 |
| 178,554 |
| 232,237 |
| 532,248 |
| 846,573 |
| 5,665,215 |
| 7,044,036 |
| 83,747 |
| 255,894 |
| 339,641 |
| 679,283 |
| 593,675 |
| 5,566,542 |
| 6,839,500 |
|
Foreign |
| 78,556 |
| 261,284 |
| 339,840 |
| 567,661 |
| — |
| 5,504,523 |
| 6,072,184 |
| 59,706 |
| 182,436 |
| 242,142 |
| 484,285 |
| 423,252 |
| 3,283,654 |
| 4,191,191 |
|
Foreign |
| 71,151 |
| 236,654 |
| 307,805 |
| 608,863 |
| — |
| 6,169,906 |
| 6,778,769 |
| 83,525 |
| 255,215 |
| 338,740 |
| 677,480 |
| 592,099 |
| 5,490,481 |
| 6,760,060 |
|
Foreign |
| 76,315 |
| 253,831 |
| 330,146 |
| 827,616 |
| 4,892,958 |
| — |
| 5,720,574 |
| 76,013 |
| 232,261 |
| 308,274 |
| 616,547 |
| 538,845 |
| 5,452,752 |
| 6,608,144 |
|
Foreign |
| 78,364 |
| 260,646 |
| 339,010 |
| 625,209 |
| 4,767,047 |
| — |
| 5,392,256 |
| 69,435 |
| 212,161 |
| 281,596 |
| 563,191 |
| 492,214 |
| 5,567,091 |
| 6,622,496 |
|
Foreign |
| 67,914 |
| 225,888 |
| 293,802 |
| 4,639,193 |
| — |
| — |
| 4,639,193 |
| 59,200 |
| 180,888 |
| 240,088 |
| 480,175 |
| 3,887,664 |
| — |
| 4,367,839 |
|
Foreign |
| 64,633 |
| 214,975 |
| 279,608 |
| 164,402 |
| — |
| — |
| 164,402 |
| 71,259 |
| 217,735 |
| 288,994 |
| 577,989 |
| 4,431,875 |
| — |
| 5,009,864 |
|
Foreign |
| 77,560 |
| 5,057,591 |
| 5,135,151 |
| — |
| — |
| — |
| — |
| 70,574 |
| 215,642 |
| 286,216 |
| 572,431 |
| 4,479,259 |
| — |
| 5,051,690 |
|
Foreign |
| — |
| — |
| — |
| — |
| — |
| — |
| — |
| 72,629 |
| 221,923 |
| 294,552 |
| 589,104 |
| 4,507,017 |
| — |
| 5,096,121 |
|
Foreign |
| — |
| — |
| — |
| — |
| — |
| — |
| — |
| 81,828 |
| 250,031 |
| 331,859 |
| 663,720 |
| 5,349,505 |
| — |
| 6,013,225 |
|
Foreign |
| 66,712 |
| 221,891 |
| 288,603 |
| 14,176,258 |
| — |
| — |
| 14,176,258 |
| — |
| — |
| — |
| — |
| — |
| — |
| — |
|
Foreign |
| 53,845 |
| 179,094 |
| 232,939 |
| 429,592 |
| 3,983,249 |
| — |
| 4,412,841 |
| 55,115 |
| 168,408 |
| 223,523 |
| 447,047 |
| 4,326,341 |
| — |
| 4,773,388 |
|
Foreign |
| 64,056 |
| 213,056 |
| 277,112 |
| 511,056 |
| 4,027,619 |
| — |
| 4,538,675 |
| 64,965 |
| 198,504 |
| 263,469 |
| 526,938 |
| 4,411,721 |
| — |
| 4,938,659 |
|
Foreign |
| 127,846 |
| 425,227 |
| 553,073 |
| 1,019,989 |
| 8,041,180 |
| — |
| 9,061,169 |
| 131,384 |
| 401,452 |
| 532,836 |
| 1,065,671 |
| 8,817,754 |
| — |
| 9,883,425 |
|
Foreign |
| 815,693 |
| — |
| 815,693 |
| — |
| — |
| — |
| — |
| 1,396 |
| 4,267 |
| 5,663 |
| 858,552 |
| — |
| — |
| 858,552 |
|
Foreign |
| 110,243 |
| 366,678 |
| 476,921 |
| 879,547 |
| 5,838,330 |
| — |
| 6,717,877 |
| 97,070 |
| 5,327,985 |
| 5,425,055 |
| — |
| — |
| — |
| — |
|
Foreign |
| 3,352,913 |
| — |
| 3,352,913 |
| — |
| — |
| — |
| — |
| 115,137 |
| 351,806 |
| 466,943 |
| 933,886 |
| 816,191 |
| 5,379,888 |
| 7,129,965 |
|
Foreign |
| 13,176 |
| 43,824 |
| 57,000 |
| 719,004 |
| — |
| — |
| 719,004 |
| 64,238 |
| 196,281 |
| 260,519 |
| 3,508,129 |
| — |
| — |
| 3,508,129 |
|
Foreign |
| 47,638 |
| 158,449 |
| 206,087 |
| — |
| 2,752,371 |
| — |
| 2,752,371 |
| 13,828 |
| 42,251 |
| 56,079 |
| 112,158 |
| 701,626 |
| — |
| 813,784 |
|
Foreign |
| 61,654 |
| 205,067 |
| 266,721 |
| 491,892 |
| 3,713,379 |
| — |
| 4,205,271 |
| 49,749 |
| 152,012 |
| 201,761 |
| 403,522 |
| 2,697,429 |
| — |
| 3,100,951 |
|
Foreign |
| 45,473 |
| 151,246 |
| 196,719 |
| 362,794 |
| 3,026,055 |
| — |
| 3,388,849 |
| 64,431 |
| 196,874 |
| 261,305 |
| 522,610 |
| 456,747 |
| 3,480,904 |
| 4,460,261 |
|
Foreign |
| 3,371,548 |
| — |
| 3,371,548 |
| — |
| — |
| — |
| — |
| 47,492 |
| 145,115 |
| 192,607 |
| 385,215 |
| 336,667 |
| 2,869,613 |
| 3,591,495 |
|
Foreign |
| 91,381 |
| 303,942 |
| 395,323 |
| 729,064 |
| 5,590,647 |
| — |
| 6,319,711 |
| 61,802 |
| 188,840 |
| 250,642 |
| 3,529,416 |
| — |
| — |
| 3,529,416 |
|
Foreign |
| 41,929 |
| 139,461 |
| 181,390 |
| — |
| 2,791,758 |
| — |
| 2,791,758 |
| 95,177 |
| 290,818 |
| 385,995 |
| 771,990 |
| 674,698 |
| 5,249,054 |
| 6,695,742 |
|
Foreign |
| 47,769 |
| 158,885 |
| 206,654 |
| 3,379,468 |
| — |
| — |
| 3,379,468 |
| 43,809 |
| 133,860 |
| 177,669 |
| 355,339 |
| 2,763,983 |
| — |
| 3,119,322 |
|
Foreign |
| 49,607 |
| 164,996 |
| 214,603 |
| 395,775 |
| 3,710,199 |
| — |
| 4,105,974 |
| 49,900 |
| 152,471 |
| 202,371 |
| 3,760,399 |
| — |
| — |
| 3,760,399 |
|
Foreign |
| 100,263 |
| 333,484 |
| 433,747 |
| 6,863,872 |
| — |
| — |
| 6,863,872 |
| 69,082 |
| 211,083 |
| 280,165 |
| 560,329 |
| 489,712 |
| 3,578,745 |
| 4,628,786 |
|
Foreign |
| 116,536 |
| 387,610 |
| 504,146 |
| 929,757 |
| 7,552,392 |
| — |
| 8,482,149 |
| 104,716 |
| 319,967 |
| 424,683 |
| 7,651,537 |
| — |
| — |
| 7,651,537 |
|
Foreign |
| 82,678 |
| 274,994 |
| 357,672 |
| — |
| — |
| 5,217,603 |
| 5,217,603 |
| 121,766 |
| 372,064 |
| 493,830 |
| 987,661 |
| 863,189 |
| 49,311,621 |
| 8,991,580 |
|
Foreign |
| 86,221 |
| 286,779 |
| 373,000 |
| 5,342,274 |
| — |
| — |
| 5,342,274 |
| 87,406 |
| 267,074 |
| 354,480 |
| 5,852,670 |
| — |
| — |
| 5,852,670 |
|
Foreign |
| 3,382,087 |
| — |
| 3,382,087 |
| — |
| — |
| — |
| — |
| 90,074 |
| 275,226 |
| 365,300 |
| 730,601 |
| 5,262,193 |
| — |
| 5,992,794 |
|
|
|
|
|
|
|
|
|
|
|
|
|
|
|
|
| As of December 31, 2010 |
| ||||||||||||
|
|
|
|
|
|
|
|
|
|
|
|
|
|
|
| Current |
| Non-Current |
| ||||||||||
Company |
|
|
|
|
|
|
|
|
|
|
| Effective |
| Nominal |
|
|
| Three to |
|
|
|
|
|
|
| More |
|
|
|
ID |
|
|
|
|
|
|
|
|
|
|
| Interest |
| Interest |
| One to Three |
| Twelve |
|
|
| One to Three |
| Three to Five |
| Than Five |
| Total Non- |
|
Number |
| Company |
| Country |
| Financial institution |
| Country |
| Currency |
| Rate |
| Rate |
| Months |
| Months |
| Total Current |
| Years |
| Years |
| Years |
| Current |
|
Foreign |
| Edelnor |
| Peru |
| AFP Integra |
| Peru |
| Soles |
| 6.28 | % | 5.94 | % | 52,756 |
| 175,472 |
| 228,228 |
| 3,577,649 |
| — |
| — |
| 3,577,649 |
|
Foreign |
| Edelnor |
| Peru |
| Mapfre Perú Cia de Seguros |
| Peru |
| Soles |
| 6.81 | % | 6.28 | % | 71,523 |
| 237,891 |
| 309,414 |
| 570,628 |
| 4,283,441 |
| — |
| 4,854,069 |
|
Foreign |
| Edelnor |
| Peru |
| AFP Prima |
| Peru |
| Soles |
| 7.13 | % | 6.81 | % | 74,804 |
| 248,804 |
| 323,608 |
| 596,804 |
| — |
| 5,032,020 |
| 5,628,824 |
|
Foreign |
| Edelnor |
| Peru |
| AFP Prima |
| Peru |
| Soles |
| 7.50 | % | 7.13 | % | 62,993 |
| 3,415,752 |
| 3,478,745 |
| — |
| — |
| — |
| — |
|
Foreign |
| Edelnor |
| Peru |
| AFP Prima |
| Peru |
| Soles |
| 7.72 | % | 7.50 | % | 97,245 |
| 323,445 |
| 420,690 |
| 5,579,682 |
| — |
| — |
| 5,579,682 |
|
Foreign |
| Edelnor |
| Peru |
| AFP Prima |
| Peru |
| Soles |
| 8.31 | % | 7.72 | % | 45,381 |
| 150,941 |
| 196,322 |
| 2,331,681 |
| — |
| — |
| 2,331,681 |
|
Foreign |
| Edelnor |
| Peru |
| AFP Profuturo |
| Peru |
| Soles |
| 8.25 | % | 8.25 | % | 1,850,054 |
| 940,321 |
| 2,790,375 |
| — |
| — |
| — |
| — |
|
Foreign |
| Edelnor |
| Peru |
| AFP Profuturo |
| Peru |
| Soles |
| 7.81 | % | 7.81 | % | 83,531 |
| 4,519,744 |
| 4,603,275 |
| — |
| — |
| — |
| — |
|
Foreign |
| Edelnor |
| Peru |
| AFP Profuturo |
| Peru |
| Soles |
| 7.91 | % | 7.81 | % | 99,607 |
| 331,302 |
| 430,909 |
| 5,395,672 |
| — |
| — |
| 5,395,672 |
|
Foreign |
| Edelnor |
| Peru |
| AFP Profuturo |
| Peru |
| Soles |
| 8.06 | % | 7.91 | % | 84,342 |
| 280,527 |
| 364,869 |
| 672,899 |
| — |
| 9,585,848 |
| 10,258,747 |
|
Foreign |
| Edelnor |
| Peru |
| AFP Profuturo |
| Peru |
| Soles |
| 6.56 | % | 6.56 | % | 81,231 |
| 270,181 |
| 351,412 |
| 648,082 |
| — |
| 10,037,150 |
| 10,685,232 |
|
Foreign |
| Edelnor |
| Peru |
| Fondo Mi Vivienda |
| Peru |
| Soles |
| 7.03 | % | 6.56 | % | 88,558 |
| 294,551 |
| 383,109 |
| 706,538 |
| — |
| 6,375,788 |
| 7,082,326 |
|
Foreign |
| Edelnor |
| Peru |
| Atlantic Security Bank |
| Peru |
| Soles |
| 6.59 | % | 6.16 | % | 55,355 |
| 184,114 |
| 239,469 |
| 441,633 |
| — |
| 3,753,995 |
| 4,195,628 |
|
Foreign |
| Edelnor |
| Peru |
| AFP Integra |
| Peru |
| Soles |
| 0.00 | % | 0.00 | % | 130,063 |
| 432,600 |
| 562,663 |
| 1,037,675 |
| 2,539,051 |
| 9,362,564 |
| 12,939,290 |
|
Foreign |
| Edesur S.A. |
| Argentina |
| oeds7 |
| Argentina |
| Ar$ |
| 8.00 | % | 8.00 | % | 510,018 |
| 9,010,562 |
| 9,520,580 |
| 4,165,269 |
| — |
| — |
| 4,165,269 |
|
Foreign |
| Emgesa |
| Colombia |
| Bonos B10 |
| Colombia |
| CPs |
| 7.05 | % | 7.05 | % | 925,274 |
| 46,241,341 |
| 47,166,615 |
| — |
| — |
| — |
| — |
|
Foreign |
| Emgesa |
| Colombia |
| Bonos A-10 |
| Colombia |
| CPs |
| 7.21 | % | 7.21 | % | 928,950 |
| 3,089,767 |
| 4,018,717 |
| 7,411,403 |
| — |
| 58,531,760 |
| 65,943,163 |
|
Foreign |
| Emgesa |
| Colombia |
| Bonos B-103 |
| Colombia |
| CPs |
| 5.11 | % | 5.11 | % | 789,965 |
| 2,627,492 |
| 3,417,457 |
| 6,302,546 |
| 32,953,942 |
| 41,376,336 |
| 80,632,824 |
|
Foreign |
| Emgesa |
| Colombia |
| Bonos A102 |
| Colombia |
| CPs |
| 6.34 | % | 6.34 | % | 127,910 |
| 425,441 |
| 553,351 |
| 1,020,502 |
| 10,705,143 |
| — |
| 11,725,645 |
|
Foreign |
| Emgesa |
| Colombia |
| Bonos A5 |
| Colombia |
| CPs |
| 4.83 | % | 4.83 | % | 920,115 |
| 3,060,381 |
| 3,980,496 |
| 7,340,914 |
| 12,326,963 |
| — |
| 19,667,877 |
|
Foreign |
| Emgesa |
| Colombia |
| Bonos B10 |
| Colombia |
| CPs |
| 4.83 | % | 4.83 | % | 631,089 |
| 16,269,543 |
| 16,900,632 |
| — |
| — |
| — |
| — |
|
Foreign |
| Emgesa |
| Colombia |
| Bonos B15 |
| Colombia |
| CPs |
| 5.33 | % | 5.33 | % | 525,615 |
| 1,748,240 |
| 2,273,855 |
| 4,193,491 |
| 23,479,236 |
| — |
| 27,672,727 |
|
Foreign |
| Emgesa |
| Colombia |
| Bonos A5 |
| Colombia |
| CPs |
| 7.77 | % | 7.77 | % | 1,080,324 |
| 3,593,253 |
| 4,673,577 |
| 8,619,110 |
| 74,169,812 |
| — |
| 82,788,922 |
|
Foreign |
| Emgesa |
| Colombia |
| Bonos B9 |
| Colombia |
| CPs |
| 6.07 | % | 6.07 | % | 454,112 |
| 1,510,415 |
| 1,964,527 |
| 3,623,022 |
| 8,865,052 |
| 27,196,423 |
| 39,684,497 |
|
Foreign |
| Emgesa |
| Colombia |
| Bonos B12 |
| Colombia |
| CPs |
| 9.27 | % | 8.07 | % | — |
| — |
| — |
| — |
| — |
| — |
| — |
|
Foreign |
| Emgesa |
| Colombia |
| Bonos B104 |
| Colombia |
| CPs |
| 7.94 | % | 7.94 | % | 774,134 |
| 2,574,836 |
| 3,348,970 |
| 6,176,240 |
| 15,112,435 |
| 42,007,978 |
| 63,296,653 |
|
Foreign |
| Emgesa |
| Colombia |
| Bonos C10 |
| Colombia |
| CPs |
| 8.14 | % | 8.14 | % | 278,613 |
| 926,691 |
| 1,205,304 |
| 2,222,846 |
| 5,439,008 |
| 20,133,297 |
| 27,795,151 |
|
Foreign |
| Emgesa |
| Colombia |
| Bonos C10 |
| Colombia |
| CPs |
| 7.00 | % | 7.00 | % | — |
| — |
| — |
| — |
| — |
| — |
| — |
|
Foreign |
| Emgesa |
| Colombia |
| Papeles comerciales |
| Colombia |
| CPs |
| 4.21 | % | 4.00 | % | 180,638 |
| 17,507,497 |
| 17,688,135 |
| — |
| — |
| — |
| — |
|
91,081,000-6 |
| Endesa S.A. (Chile) |
| Chile |
| The Bank of New York Mellon - Primera Emisión S-1 |
| USA |
| US$ |
| 7.88 | % | 7.88 | % | 416,214 |
| 1,384,363 |
| 1,800,577 |
| 3,320,662 |
| 8,125,215 |
| 207,932,292 |
| 219,378,169 |
|
91,081,000-6 |
| Endesa S.A. (Chile) |
| Chile |
| The Bank of New York Mellon - Primera Emisión S-2 |
| USA |
| US$ |
| 7.33 | % | 7.33 | % | 652,512 |
| 2,170,311 |
| 2,822,823 |
| 5,205,909 |
| 12,738,165 |
| 79,957,654 |
| 97,901,728 |
|
91,081,000-6 |
| Endesa S.A. (Chile) |
| Chile |
| The Bank of New York Mellon - Primera Emisión S-3 |
| USA |
| US$ |
| 8.13 | % | 8.13 | % | 1,995,692 |
| 6,637,844 |
| 8,633,536 |
| 15,922,148 |
| 38,959,371 |
| 167,613,573 |
| 222,495,092 |
|
91,081,000-6 |
| Endesa S.A. (Chile) |
| Chile |
| Banco Santander Chile — 264 Serie-F |
| Chile |
| Ch$ |
| 6.20 | % | 6.20 | % | 956,132 |
| 2,405,370 |
| 3,361,502 |
| 6,435,714 |
| 19,069,273 |
| 23,877,508 |
| 49,382,495 |
|
91,081,000-6 |
| Endesa S.A. (Chile) |
| Chile |
| The Bank of New York Mellon - 144 - A |
| USA |
| US$ |
| 8.35 | % | 8.35 | % | 9,543,000 |
| 8,701,669 |
| 18,244,669 |
| 213,837,549 |
| — |
| — |
| 213,837,549 |
|
91,081,000-6 |
| Endesa S.A. (Chile) |
| Chile |
| The Bank of New York Mellon - 144 - A |
| USA |
| US$ |
| 8.63 | % | 8.63 | % | 2,169,821 |
| 7,217,013 |
| 9,386,834 |
| 17,311,397 |
| 50,668,664 |
| 59,466,428 |
| 127,446,489 |
|
91,081,000-6 |
| Endesa S.A. (Chile) |
| Chile |
| Banco Santander Chile — 317 Serie-H |
| Chile |
| Ch$ |
| 6.20 | % | 6.20 | % | 1,758,444 |
| 10,118,583 |
| 11,877,027 |
| 21,414,704 |
| 47,005,622 |
| 67,587,558 |
| 136,007,884 |
|
91,081,000-6 |
| Endesa S.A. (Chile) |
| Chile |
| Banco Santander Chile — 318 Serie-K |
| Chile |
| Ch$ |
| 3.80 | % | 3.80 | % | 1,284,413 |
| 4,272,071 |
| 5,556,484 |
| 10,247,385 |
| 25,073,983 |
| 131,684,135 |
| 167,005,503 |
|
91,081,000-6 |
| Endesa S.A. (Chile) |
| Chile |
| Banco Santander Chile — 522 Serie-M |
| Chile |
| Ch$ |
| 4.75 | % | 4.75 | % | 3,759,700 |
| 12,505,089 |
| 16,264,789 |
| 29,995,867 |
| 73,395,881 |
| 304,052,705 |
| 407,444,453 |
|
94,271,000-3 |
| Enersis S.A. |
| Chile |
| Yankee bonos 2016 |
| USA |
| US$ |
| 7.71 | % | 7.40 | % | 2,270,849 |
| 7,553,041 |
| 9,823,890 |
| 18,117,426 |
| 143,190,238 |
| — |
| 161,307,664 |
|
94,271,000-3 |
| Enersis S.A. |
| Chile |
| Yankee bonos 2026 |
| USA |
| US$ |
| 6.88 | % | 6.60 | % | 6,958 |
| 23,144 |
| 30,102 |
| 55,516 |
| 135,840 |
| 622,407 |
| 813,763 |
|
94,271,000-3 |
| Enersis S.A. |
| Chile |
| Yankee bonos 2014 |
| USA |
| US$ |
| 7.68 | % | 7.38 | % | 3,171,823 |
| 10,549,759 |
| 13,721,582 |
| 25,305,631 |
| 175,387,549 |
| — |
| 200,693,180 |
|
94,271,000-3 |
| Enersis S.A. |
| Chile |
| Bonos UF 269 |
| Chile |
| Ch$ |
| 8.52 | % | 5.75 | % | 715,315 |
| 4,441,788 |
| 5,157,103 |
| 9,638,634 |
| 22,900,135 |
| 14,970,765 |
| 47,509,534 |
|
|
|
|
|
|
|
|
|
|
|
|
|
|
|
|
|
|
|
|
|
|
|
|
|
|
|
|
|
|
|
|
|
|
|
|
| Total |
|
|
|
|
|
|
|
|
| 104.988.948 |
| 345.191.870 |
| 450.180.818 |
| 771.692.033 |
| 925,972,628 |
| 1,597,779,869 |
| 3,295,444,530 |
|
|
| As of December 31, 2009 |
| ||||||||||||
|
| Current |
| Non-Current |
| ||||||||||
Company |
| One to Three |
| Three to |
| Total Current |
| One to Three |
| Three to Five |
| More |
| Total Non- |
|
Foreign |
| 52,117 |
| 159,248 |
| 211,365 |
| 3,542,295 |
| — |
| — |
| 3,542,295 |
|
Foreign |
| 55,115 |
| 168,406 |
| 223,521 |
| 447,042 |
| 3,544,259 |
| — |
| 3,991,301 |
|
Foreign |
| 74,695 |
| 228,234 |
| 302,929 |
| 605,858 |
| 4,813,411 |
| — |
| 5,419,269 |
|
Foreign |
| 78,118 |
| 238,695 |
| 316,813 |
| 633,626 |
| 553,772 |
| 4,777,488 |
| 5,964,886 |
|
Foreign |
| 69,273 |
| 211,668 |
| 280,941 |
| 3,647,445 |
| — |
| — |
| 3,647,445 |
|
Foreign |
| 101,564 |
| 310,335 |
| 411,899 |
| 823,799 |
| 5,466,450 |
| — |
| 6,290,249 |
|
Foreign |
| 47,388 |
| 144,797 |
| 192,185 |
| 2,648,330 |
| — |
| — |
| 2,648,330 |
|
Foreign |
| 55,950 |
| 170,957 |
| 226,907 |
| 2,920,296 |
| — |
| — |
| 2,920,296 |
|
Foreign |
| 87,175 |
| 266,369 |
| 353,544 |
| 4,819,392 |
| — |
| — |
| 4,819,392 |
|
Foreign |
| 103,953 |
| 317,634 |
| 421,587 |
| 843,174 |
| 5,262,193 |
| — |
| 6,105,367 |
|
Foreign |
| 87,465 |
| 267,254 |
| 354,719 |
| 709,437 |
| 620,029 |
| 4,458,783 |
| 5,788,249 |
|
Foreign |
| 84,147 |
| 257,115 |
| 341,262 |
| 682,523 |
| 5,623,562 |
| — |
| 6,306,085 |
|
Foreign |
| — |
| — |
| — |
| — |
| — |
| — |
| — |
|
Foreign |
| — |
| — |
| — |
| — |
| — |
| — |
| — |
|
Foreign |
| 657,735 |
| 10,459,172 |
| 11,116,907 |
| 14,674,385 |
| — |
| — |
| 14,674,385 |
|
Foreign |
| 1,184,467 |
| 3,619,205 |
| 4,803,672 |
| 9,607,344 |
| 8,396,555 |
| 53,304,242 |
| 71,308,141 |
|
Foreign |
| 177,434 |
| 542,158 |
| 719,592 |
| 1,439,184 |
| 1,257,807 |
| 10,103,939 |
| 12,800,930 |
|
Foreign |
| 822,066 |
| 2,511,868 |
| 3,333,934 |
| 6,667,867 |
| 5,827,533 |
| 7,416,861 |
| 62,083,152 |
|
Foreign |
| 1,272,041 |
| 3,886,791 |
| 5,158,832 |
| 48,948,202 |
| — |
| — |
| 48,948,202 |
|
Foreign |
| 848,027 |
| 31,784,107 |
| 32,632,134 |
| — |
| — |
| — |
| — |
|
Foreign |
| 293,884 |
| 897,979 |
| 1,191,863 |
| 15,876,519 |
| — |
| — |
| 15,876,519 |
|
Foreign |
| 195,923 |
| 10,388,423 |
| 10,584,346 |
| — |
| — |
| — |
| — |
|
Foreign |
| 241,092 |
| 736,669 |
| 977,761 |
| 1,955,521 |
| 13,325,090 |
| — |
| 15,280,611 |
|
Foreign |
| 916,023 |
| 2,798,961 |
| 3,714,984 |
| 7,429,968 |
| 6,493,589 |
| 55,297,889 |
| 69,221,446 |
|
Foreign |
| 327,907 |
| 1,001,939 |
| 1,329,846 |
| 2,659,692 |
| 2,324,498 |
| 25,907,411 |
| 30,891,601 |
|
Foreign |
| 527,539 |
| 1,611,923 |
| 2,139,462 |
| 4,278,924 |
| 26,076,868 |
| — |
| 30,355,792 |
|
Foreign |
| 1,147,564 |
| 3,506,446 |
| 4,654,010 |
| 9,308,021 |
| 8,134,955 |
| 69,071,416 |
| 86,514,392 |
|
Foreign |
| 481,284 |
| 1,470,591 |
| 1,951,875 |
| 3,903,750 |
| 3,411,770 |
| 34,264,379 |
| 41,579,899 |
|
Foreign |
| — |
| — |
| — |
| — |
| — |
| — |
| — |
|
91,081,000-6 |
| 443,752 |
| 1,355,909 |
| 1,799,661 |
| 3,599,322 |
| 3,145,709 |
| 30,628,753 |
| 37,373,784 |
|
91,081,000-6 |
| 696,742 |
| 2,128,935 |
| 2,825,677 |
| 5,651,354 |
| 4,939,128 |
| 48,090,698 |
| 58,681,180 |
|
91,081,000-6 |
| 2,134,683 |
| 6,522,643 |
| 8,657,326 |
| 17,314,652 |
| 15,132,532 |
| 209,049,168 |
| 241,496,352 |
|
91,081,000-6 |
| 587,547 |
| 1,141,652 |
| 1,729,199 |
| 3,388,622 |
| 3,650,500 |
| 31,153,499 |
| 38,192,621 |
|
91,081,000-6 |
| 4,433,373 |
| 13,546,417 |
| 17,979,790 |
| 35.959.581 |
| 213.283.056 |
| — |
| 249.242.637 |
|
91,081,000-6 |
| 2,297,667 |
| 7,020,648 |
| 9,318,315 |
| 18.636.629 |
| 16.287.903 |
| 103.768.726 |
| 138.693.258 |
|
91,081,000-6 |
| 748,281 |
| 6,563,199 |
| 7,311,480 |
| 14.149.547 |
| 10.774.238 |
| 79.365.405 |
| 104.289.190 |
|
91,081,000-6 |
| 235,793 |
| 720,479 |
| 956,272 |
| 1.912.545 |
| 1.671.512 |
| 95.330.628 |
| 98.914.685 |
|
91,081,000-6 |
| 1,204,131 |
| 3,679,288 |
| 4,883,419 |
| 9.766.837 |
| 8.535.948 |
| 254.008.392 |
| 272.311.177 |
|
94,271,000-3 |
| 2,342,842 |
| 7,158,684 |
| 9,501,526 |
| 19.003.052 |
| 16.608.147 |
| 138.406.385 |
| 174.017.584 |
|
94,271,000-3 |
| 6,602 |
| 20,173 |
| 26,775 |
| 53.550 |
| 46.801 |
| 732.331 |
| 832.682 |
|
94,271,000-3 |
| 3,272,380 |
| 9,998,938 |
| 13,271,318 |
| 26.542.635 |
| 190.756.318 |
| — |
| 217.298.953 |
|
94,271,000-3 |
| 331,071 |
| 2,945,769 |
| 3,276,840 |
| 6.660.335 |
| 5.335.477 |
| 28.139.446 |
| 40.135.258 |
|
|
|
|
|
|
|
|
|
|
|
|
|
|
|
|
|
|
| 144,388,038 |
| 236,860,304 |
| 381,248,342 |
| 704,597,596 |
| 846,410,359 |
| 1,568,568,867 |
| 3,119,576,822 |
|
C) Finance Lease obligations by company:
|
|
|
|
|
|
|
|
|
|
|
|
|
|
|
| As of December 31, 2010 |
| ||||||||||||
|
|
|
|
|
|
|
|
|
|
|
|
|
|
|
| Current |
| Non-Current |
| ||||||||||
Company |
| Company |
| Country |
| Financial |
| Financial |
| Country |
| Curency |
| Nominal |
| One to Three |
| Three to |
| Total Current |
| One to Three |
| Three to Five |
| More than |
| Total Non- |
|
91,081,000-6 |
| Endesa S.A. (Chile) |
| Chile |
| 87,509,100-K |
| Leasing Abengoa Chile |
| Chile |
| US$ |
| 6.40 | % | 514,759 |
| 1,713,147 |
| 2,227,906 |
| 4,107,030 |
| 10,200,414 |
| 11,875,674 |
| 26,183,118 |
|
Foreign |
| Edegel |
| Peru |
| Foreign |
| Scotiabank |
| Peru |
| US$ |
| 5.16 | % | 2,204,779 |
| 6,628,821 |
| 8,833,600 |
| 14,084,254 |
| 30,098,142 |
| — |
| 44,182,396 |
|
96,830,980-3 |
| Gas Atacama S.A. |
| Chile |
| 96,976,410-5 |
| Gasred S.A. |
| Chile |
| US$ |
| 8.64 | % | 65,489 |
| 195,946 |
| 261,435 |
| — |
| — |
| — |
| — |
|
Foreign |
| Edelnor |
| Peru |
| Foreign |
| BBVA |
| Peru |
| Soles |
| 6.40 | % | 450,157 |
| 909,184 |
| 1,359,341 |
| 2,470,766 |
| — |
| — |
| 2,470,766 |
|
Foreign |
| Edesur S.A. |
| Argentina |
| Foreign |
| COMAFI |
| Argentina |
| Ar$ |
| 3.54 | % | 174,909 |
| 581,159 |
| 756,068 |
| 917,985 |
| 225,762 |
| — |
| 1,143,747 |
|
Foreign |
| Synapsis Brasil Ltda. |
| Brazil |
| Foreign |
| Leasing - IBM |
| Brazil |
| Reais |
| 2.60 | % | — |
| — |
| — |
| — |
| — |
| — |
| — |
|
|
|
|
|
|
|
|
|
|
|
|
|
|
|
|
|
|
|
|
|
|
|
|
|
|
|
|
|
|
|
|
|
|
|
|
|
|
|
|
| Total |
|
|
|
|
| 3.410.093 |
| 10.028.257 |
| 13.438.350 |
| 21.580.035 |
| 40,524,318 |
| 11,875,674 |
| 73,980,027 |
|
|
| As of December 31, 2009 |
| ||||||||||||
|
| Current |
| Non-Current |
| ||||||||||
Company |
| One to Three |
| Three to Twelve |
| Total Current |
| One to Three |
| Three to Five |
| More than |
| Total Non- |
|
91,081,000-6 |
| 554,228 |
| 1,680,476 |
| 2,234,704 |
| 4.463.401 |
| 3.896.027 |
| 21.420.167 |
| 29.779.595 |
|
Foreign |
| 2,200,935 |
| 8,439,132 |
| 10,640,067 |
| 32.300.512 |
| 10.101.808 |
| 26.354.524 |
| 68.756.844 |
|
96,830,980-3 |
| 70,737 |
| 212,201 |
| 282,938 |
| 281.357 |
| — |
| — |
| 281.357 |
|
Foreign |
| 324,545 |
| 971,217 |
| 1,295,762 |
| 774.627 |
| — |
| — |
| 774.627 |
|
Foreign |
| 204,234 |
| 609,693 |
| 813,927 |
| 1.411.773 |
| 748.771 |
| — |
| 2.160.544 |
|
Foreign |
| — |
| — |
| — |
| — |
| — |
| — |
| — |
|
|
|
|
|
|
|
|
|
|
|
|
|
|
|
|
|
Total |
| 3,354,679 |
| 11,912,719 |
| 15,267,398 |
| 39,231,670 |
| 14,746,606 |
| 47,774,691 |
| 101,752,967 |
|
D) Other Liabilities by company:
|
|
|
|
|
|
|
|
|
|
|
|
|
|
|
| As of December 31, 2010 |
| ||||||||||||
|
|
|
|
|
|
|
|
|
|
|
|
|
|
|
| Current |
| Non-Current |
| ||||||||||
Company |
| Company |
| Country |
| Financial |
| Financial Institution |
| Country |
| Currency |
| Nominal |
| One to Three |
| Three to |
| Total Current |
| One to Three |
| Three to |
| More than |
| Total Non- |
|
Foreign |
| Endesa Costanera S.A. |
| Argentina |
| Foreign |
| Mitsubishi (deuda garantizada) |
| Argentina |
| US$ |
| 16.08 | % | 9,372,718 |
| 10,439,827 |
| 19,812,545 |
| 28,222,904 |
| 26,997,497 |
| — |
| 55,220,401 |
|
Foreign |
| Endesa Costanera S.A. |
| Argentina |
| Foreign |
| Mitsubishi (deuda no garantizada) |
| Argentina |
| US$ |
| 16.08 | % | 56,194 |
| 1,181,656 |
| 1,237,850 |
| 1,164,650 |
| 1,117,531 |
| — |
| 2,282,181 |
|
Foreign |
| Endesa Costanera S.A. |
| Argentina |
| Foreign |
| Otros |
| Argentina |
| Ar$ |
| 17.17 | % | 968,330 |
| 1,855,135 |
| 2,823,465 |
| 866,537 |
| — |
| — |
| 866,537 |
|
96,827,970-K |
| Endesa Eco S.A. |
| Chile |
| 96601250-1 |
| Inversiones Centinela S.A. |
| Chile |
| US$ |
| 9.90 | % | — |
| — |
| — |
| 12,395,250 |
| — |
| — |
| 12,395,250 |
|
Foreign |
| Endesa Brasil S.A. |
| Brazil |
| Foreign |
| IFC |
| Brazil |
| US$ |
| 24.09 | % | 51,831,581 |
| — |
|
|
| — |
| — |
|
|
|
|
|
Foreign |
| Ampla Energía E Servicios S.A. |
| Brazil |
| Foreign |
| Bndes |
| Brazil |
| Reais |
| 11.02 | % | — |
| — |
|
|
| — |
| — |
|
|
|
|
|
Foreign |
| Compañía Energética Do Ceará S.A. |
| Brazil |
| Foreign |
| Otros |
| Brazil |
| Reais |
| 10.75 | % | — |
| — |
| — |
| — |
| — |
| — |
| — |
|
|
|
|
|
|
|
|
|
|
|
|
|
|
|
|
|
|
|
|
|
|
|
|
|
|
|
|
|
|
|
|
|
|
|
|
|
|
|
|
| Total |
|
|
|
|
| 62,228,823 |
| 13,476,618 |
| 23,873,860 |
| 42,649,341 |
| 28,115,028 |
| — |
| 70,764,369 |
|
|
| As of December 31, 2009 |
| ||||||||||||
|
| Current |
| Non-Current |
| ||||||||||
Company |
| One to |
| Three to Twelve |
| Total Current |
| One to Three |
| Three to Five |
| More than |
| Total Non- |
|
Foreign |
| 4,181,796 |
| 5,441,296 |
| 9,623,092 |
| 18,442,282 |
| 14,377,659 |
| — |
| 32,819,941 |
|
Foreign |
| 4,181,796 |
| 5,441,296 |
| 9,623,092 |
| 18,442,282 |
| 14,377,658 |
| — |
| 32,819,940 |
|
Foreign |
| 77,062 |
| 235,468 |
| 312,530 |
| 3,223,239 |
| — |
| — |
| 3,223,239 |
|
96,827,970-K |
| — |
| — |
| — |
| 11,688,452 |
| — |
| — |
| 11,688,452 |
|
Foreign |
| — |
| 55,497,068 |
| 55,497,068 |
| — |
| — |
|
|
| — |
|
Foreign |
| 10,712,128 |
| 23,336,844 |
| 34,048,972 |
| 35,333,322 |
| — |
|
|
| 35,333,322 |
|
Foreign |
| 1,941,087 |
| — |
| 1,941,087 |
| — |
| — |
| — |
| — |
|
|
|
|
|
|
|
|
|
|
|
|
|
|
|
|
|
Total |
| 21,093,869 |
| 89,951,972 |
| 111,045,841 |
| 87,129,577 |
| 28,755,317 |
| — |
| 115,884,894 |
|
APPENDIX No. 5 ASSETS AND LIABILITIES IN FOREIGN CURRENCIES:
The detail of assets and liabilities denominated in foreign currencies is the following:
|
|
|
| Functional |
| 12-31-2010 |
| 12-31-2009 |
|
ASSETS |
| Foreign Currency |
| Currency |
| ThCh$ |
| ThCh$ |
|
|
|
|
|
|
|
|
|
|
|
Current Assets |
|
|
|
|
|
|
|
|
|
|
|
|
|
|
|
|
|
|
|
Cash and Cash Equivalent |
|
|
|
|
| 66,329,098 |
| 116,551,541 |
|
|
| U.S. dollar |
| Chilean pesos |
| 46,804,371 |
| 83,606,901 |
|
|
| U.S. dollar |
| Colombian Pesos |
| 6,004 |
| 2,381 |
|
|
| U.S. dollar |
| Peruvian Soles |
| 1,234,825 |
| 8,287,053 |
|
|
| U.S. dollar |
| Argentine Pesos |
| 18,283,898 |
| 24,655,206 |
|
|
|
|
|
|
|
|
|
|
|
Trade and Other Current Receivables |
|
|
|
|
| 17,592,080 |
| 35,725,419 |
|
|
| U.S. dollar |
| Chilean Pesos |
| 17,592,080 |
| 35,725,419 |
|
|
|
|
|
|
|
|
|
|
|
Account Receivable from Related Companies |
|
|
|
|
| 563,614 |
| 288,225 |
|
|
| U.S. dollar |
| Chilean Pesos |
| 563,614 |
| 261,245 |
|
|
| Euros |
| Chilean Pesos |
| — |
| 26,980 |
|
Total current assets other than assets or disposal groups classified as held for sale or as held for distribution to owners |
|
|
|
|
| 84,484,792 |
| 152,565,185 |
|
|
|
|
|
|
|
|
|
|
|
Total Current Assets |
|
|
|
|
| 84,484,792 |
| 152,565,185 |
|
|
|
|
|
|
|
|
|
|
|
Investment accounted for using equity method |
|
|
|
|
| 2,887,460 |
| 10,131,240 |
|
|
| U.S. dollar |
| Chilean pesos |
| 2,887,460 |
| 10,131,240 |
|
|
|
|
|
|
|
|
|
|
|
Goodwill |
|
|
|
|
| 488,403,515 |
| 483,812,158 |
|
|
| Brazilian Reais |
| Peruvian Soles |
| 10,502,214 |
| 11,050,603 |
|
|
| Brazilian Reais |
| Chilean pesos |
| 327,477,479 |
| 318,282,817 |
|
|
| Colombian Pesos |
| Chilean pesos |
| 7,348,467 |
| 10,748,633 |
|
|
| Soles |
| Chilean pesos |
| 118,949,428 |
| 116,436,507 |
|
|
| Argentine Pesos |
| Chlean pesos |
| 24,125,927 |
| 27,293,598 |
|
|
|
|
|
|
|
|
|
|
|
Total Non-Current Assets |
|
|
|
|
| 491,290,975 |
| 493,943,398 |
|
|
|
|
|
|
|
|
|
|
|
Total Assets |
|
|
|
|
| 575,775,767 |
| 646,508,583 |
|
|
|
|
|
|
| 12-31-2010 |
| 12-31-2009 |
| ||||||||||||||||||||||||
|
|
|
|
|
| Current Liabilities |
| Non-Current Liabilities |
| Current Liabilities |
| Non-Current Liabilities |
| ||||||||||||||||||||
|
| Foreign |
| Functional |
| One to |
| Three to |
| Total |
| One to |
| Three to |
| More tan |
| Total Non- |
| One to |
| Three to |
| Total |
| One to |
| Three to |
| More tan |
| Total Non- |
|
|
|
|
|
|
|
|
|
|
|
|
|
|
|
|
|
|
|
|
|
|
|
|
|
|
|
|
|
|
|
|
|
|
|
LIABILITIES |
|
|
|
|
|
|
|
|
|
|
|
|
|
|
|
|
|
|
|
|
|
|
|
|
|
|
|
|
|
|
|
|
|
|
|
|
|
|
|
|
|
|
|
|
|
|
|
|
|
|
|
|
|
|
|
|
|
|
|
|
|
|
|
|
|
|
|
Other Financial Liabilities |
| U.S. dollar |
|
|
| 93,267,733 |
| 137,235,543 |
| 230,503,276 |
| 419,645,875 |
| 622,867,495 |
| 537,908,172 |
| 1,580,421,542 |
| 43,554,407 |
| 296,269,060 |
| 339,823,467 |
| 418,096,478 |
| 631,476,249 |
| 639,707,341 |
| 1,689,280,068 |
|
|
| U.S. dollar |
| Chilean pesos |
| 21,623,823 |
| 65,061,393 |
| 86,685,216 |
| 318,781,111 |
| 523,230,097 |
| 467,468,028 |
| 1,309,479,236 |
| 18,113,650 |
| 182,060,113 |
| 200,173,763 |
| 254,073,486 |
| 573,118,679 |
| 553,353,780 |
| 1,380,545,945 |
|
|
| U.S. dollar |
| Brazilian Reais |
| 52,596,722 |
| 11,617,821 |
| 64,214,543 |
| 19,990,693 |
| 18,600,098 |
| 10,681,077 |
| 49,271,868 |
| 1,018,392 |
| 67,854,542 |
| 68,872,934 |
| 26,976,832 |
| 14,097,354 |
| 25,725,061 |
| 66,799,247 |
|
|
| U.S. dollar |
| Peruvian Soles |
| 4,532,918 |
| 30,789,583 |
| 35,322,501 |
| 47,472,662 |
| 52,922,272 |
| 59,759,067 |
| 160,154,001 |
| 18,169,214 |
| 33,579,600 |
| 51,748,814 |
| 113,071,393 |
| 44,260,216 |
| 60,628,500 |
| 217,960,109 |
|
|
| U.S. dollar |
| Argentine Pesos |
| 14,514,270 |
| 29,766,746 |
| 44,281,016 |
| 33,401,409 |
| 28,115,028 |
| — |
| 61,516,437 |
| 6,253,151 |
| 12,774,805 |
| 19,027,956 |
| 23,974,767 |
| — |
| — |
| 23,974,767 |
|
|
|
|
|
|
|
|
|
|
|
|
|
|
|
|
|
|
|
|
|
|
|
|
|
|
|
|
|
|
|
|
|
|
|
TOTAL LIABIlITIES |
|
|
|
|
| 93,267,733 |
| 137,235,543 |
| 230,503,276 |
| 419,645,875 |
| 622,867,495 |
| 537,908,172 |
| 1,580,421,542 |
| 43,554,407 |
| 296,269,060 |
| 339,823,467 |
| 418,096,478 |
| 631,476,249 |
| 639,707,341 |
| 1,689,280,068 |
|
SCHEDULE I
Rule 5-04 of the Securities and Exchange Commission requires presentation of condensed financial statements of the registrant (parent company) when restricted net asset, defined as assets not to be transferred to the parent company in the form of loans, advance or cash dividends of the subsidiary without the consent of a third party, exceed of the 25% consolidated net assets of the parent and its subsidiaries.
Following are the Enersis separate statements of financial position as of December 31, 2010 and 2009 and the related statements of comprehensive income, changes in equity and cash flows for each of the three years in the period ended December 31, 2010, have been prepared in accordance with International Financial Reporting Standards.
ENERSIS S.A.
Separate Statement of Financial Position as of December 31, 2010 and 2009
(In thousands of Chilean pesos - ThCh$)
|
| 12-31-2010 |
| 12-31-2009 |
|
ASSETS |
| ThCh$ |
| ThCh$ |
|
|
|
|
|
|
|
CURRENT ASSETS |
|
|
|
|
|
Cash and cash equivalents |
| 62,696,278 |
| 27,325,320 |
|
Other current non-financial assets |
| 189,330 |
| 117,483 |
|
Trade and other current receivables |
| 2,516,969 |
| 1,254,303 |
|
Accounts receivables from related companies |
| 39,517,364 |
| 14,127,085 |
|
Inventories |
| 4,928,358 |
| — |
|
Current tax assets |
| 9,628,948 |
| 10,324,894 |
|
Total current assets other than assets classified as held for sale and discontinued operations |
| 119,477,247 |
| 53,149,085 |
|
|
|
|
|
|
|
Non-current assets classified as held for sale and discontinued operations |
| 2,756,706 |
| 2,756,706 |
|
|
|
|
|
|
|
TOTAL CURRENT ASSETS |
| 122,233,953 |
| 55,905,791 |
|
|
|
|
|
|
|
NON-CURRENT ASSETS |
|
|
|
|
|
Other non-current financial assets |
| 29,461,230 |
| 24,548,711 |
|
Non-current receivables |
| 146,500,704 |
| 170,085,874 |
|
Investments in subsidiaries and associates companies |
| 2,563,742,088 |
| 2,563,247,088 |
|
Intangible assets other than goodwill |
| 1,225,648 |
| 1,381,864 |
|
Property, plant and equipment, net |
| 7,186,515 |
| 7,350,117 |
|
Deferred tax assets |
| 42,203,457 |
| 36,645,752 |
|
|
|
|
|
|
|
TOTAL NON-CURRENT ASSETS |
| 2,790,319,642 |
| 2,803,259,406 |
|
|
|
|
|
|
|
TOTAL ASSETS |
| 2,912,553,595 |
| 2,859,165,197 |
|
ENERSIS S.A.
Separate Statement of Financial Position as of December 31, 2010 and 2009
(In thousands of Chilean pesos - ThCh$)
|
| 12-31-2010 |
| 12-31-2009 |
|
LIABILITIES AND EQUITY |
| ThCh$ |
| ThCh$ |
|
|
|
|
|
|
|
CURRENT LIABILITIES |
|
|
|
|
|
Other current financial liabilities |
| 11,755,506 |
| 11,360,807 |
|
Trade and other current payables |
| 63,408,992 |
| 48,193,308 |
|
Accounts payable to related companies |
| 111,156,625 |
| 85,896,724 |
|
Other short-term provisions |
| 14,443,439 |
| 10,801,883 |
|
Current tax liabilities |
| 194,195 |
| 1,651,039 |
|
Current provisions for employee benefits |
| — |
| 107,310 |
|
Other current non-financial liabilities |
| 156,045 |
| 39,938 |
|
Total current liabilities other than liabilities associated with non-current assets classified as held for sale and discontinued operations |
| 201,114,802 |
| 158,051,009 |
|
|
|
|
|
|
|
Liabilities associated with non-current assets classified as held for sale and discontinued operations |
| — |
| — |
|
|
|
|
|
|
|
TOTAL CURRENT LIABILITIES |
| 201,114,802 |
| 158,051,009 |
|
|
|
|
|
|
|
NON-CURRENT LIABILITIES |
|
|
|
|
|
Other non-current financial liabilities |
| 550,938,961 |
| 541,309,872 |
|
Deferred tax liabilities |
| 2,092,367 |
| 2,282,936 |
|
Non-current provisions for employee benefits |
| 5,229,738 |
| 4,765,781 |
|
|
|
|
|
|
|
TOTAL NON-CURRENT LIABILITIES |
| 558,261,066 |
| 548,358,589 |
|
TOTAL LIABILITIES |
| 759,375,868 |
| 706,409,598 |
|
|
|
|
|
|
|
EQUITY |
|
|
|
|
|
Issued capital |
| 2,824,882,835 |
| 2,824,882,835 |
|
Retained earnings |
| 484,432,183 |
| 683,486,893 |
|
Share premium |
| 158,759,648 |
| 158,759,648 |
|
Other reserves |
| (1,314,896,939 | ) | (1,514,373,777 | ) |
|
|
|
|
|
|
Total Equity |
| 2,153,177,727 |
| 2,152,755,599 |
|
|
|
|
|
|
|
TOTAL LIABILITIES AND EQUITY |
| 2,912,553,595 |
| 2,859,165,197 |
|
ENERSIS S.A.
Separate Statement of Comprehensive Income for the years ended December 31, 2010, 2009 and 2008
(In thousands of Chilean pesos - ThCh$)
|
| 2010 |
| 2009 |
| 2008 |
|
STATEMENT OF COMPREHENSIVE INCOME |
| ThCh$ |
| ThCh$ |
| ThCh$ |
|
|
|
|
|
|
|
|
|
Dividends from a subsidiaries and Associates |
| 249,037,939 |
| 204,489,046 |
| 238,122,146 |
|
Other operating income, total |
| 15,184,438 |
| 14,987,498 |
| 12,857,747 |
|
Total Revenues |
| 264,222,377 |
| 219,476,544 |
| 250,979,893 |
|
|
|
|
|
|
|
|
|
Raw materials and consumable used |
| (3,802,716 | ) | — |
| — |
|
Contrinution Margin |
| 260,419,661 |
| 219,476,544 |
| 250,979,893 |
|
|
|
|
|
|
|
|
|
Employee benefits expense |
| (16,829,950 | ) | (14,061,411 | ) | (11,476,027 | ) |
Depreciation and amortization expense |
| (933,976 | ) | (1,118,649 | ) | (1,399,630 | ) |
Other miscellaneous operating expenses |
| (13,734,299 | ) | (12,595,192 | ) | (17,086,178 | ) |
Operating Income |
| 228,921,436 |
| 191,701,292 |
| 221,018,058 |
|
|
|
|
|
|
|
|
|
Gain(Loss) on derecognition of available-for-sale financial assets |
| — |
| 15,997,454 |
| — |
|
Financial cost |
| (30,590,442 | ) | (25,661,743 | ) | (16,366,238 | ) |
Foreign currency exchange differences |
| (13,591,211 | ) | (55,209,234 | ) | 70,497,207 |
|
Gain (loss) for indexed assets and liabilities |
| (12,195,357 | ) | 12,192,704 |
| (43,900,465 | ) |
Net Income Before Tax |
| 172,544,426 |
| 139,020,473 |
| 231,248,562 |
|
Income Tax |
| (6,031,074 | ) | (33,886,710 | ) | 18,035,962 |
|
Net Income After Tax from Continuing Operations |
| 178,575,500 |
| 172,907,183 |
| 213,212,600 |
|
Net Income from discontinued operations |
| — |
| — |
| — |
|
Net Income |
| 178,575,500 |
| 172,907,183 |
| 213,212,600 |
|
|
|
|
|
|
|
|
|
Statement of Other Comprehensive Income |
|
|
|
|
|
|
|
Net Income |
| 178,575,500 |
| 172,907,183 |
| 213,212,600 |
|
|
|
|
|
|
|
|
|
Components of other comprehensive income, before tax |
|
|
|
|
|
|
|
Gains (losses) on cash flow hedge |
| 1,695,814 |
| (39,016,540 | ) | 56,709,797 |
|
Actuarial gain (loss) on defined benefit pension plans |
| 73,634 |
| (974,288 | ) | (545,974 | ) |
Total components of other comprehensive income, before tax |
| 1,769,448 |
| (39,990,828 | ) | 56,163,823 |
|
|
|
|
|
|
|
|
|
Income tax relating to cash flow hedge of other comprehensive income |
| (288,289 | ) | 6,610,405 |
| (9,640,665 | ) |
Income tax relating to defined benefit plans of other comprehensive income |
| (12,518 | ) | 165,629 |
| 92,815 |
|
Total income tax |
| (300.807 | ) | 6,776,034 |
| (9,547,850 | ) |
|
|
|
|
|
|
|
|
Total Other Comprehensive Income |
| 1,468,641 |
| (33,214,794 | ) | 46,615,973 |
|
Total Comprehensive Income |
| 180,044,141 |
| 139,692,389 |
| 259,828,573 |
|
ENERSIS S.A.
Separate Statement of Changes in Equity for the years anded December 31, 2010, 2009 and 2008
(In thousands of Chilean pesos - ThCh$)
|
|
|
|
|
| Changes in others reserves |
|
|
|
|
|
|
| ||||
Statement of Changes in Equity, Net |
| Issued capital |
| Share |
| Reserve of |
| Reserve of actuarial |
| Other |
| Other reserves |
| Retained earnings |
| Total Equity |
|
Equity at beginning of period 01/01/2010 |
| 2,824,882,835 |
| 158,759,648 |
| (29,727,171 | ) | — |
| (1,286,577,293 | ) | (1,316,304,464 | ) | 485,417,580 |
| 2,152,755,599 |
|
Changes in equity |
|
|
|
|
|
|
|
|
|
|
|
|
|
|
| — |
|
Comprehensive income |
| — |
| — |
| 1,407,525 |
| 61,116 |
| — |
| 1,468,641 |
| 178,575,500 |
| 180,044,141 |
|
Net income |
|
|
|
|
|
|
|
|
|
|
|
|
| 178,575,500 |
| 178,575,500 |
|
Other comprehensive income |
|
|
|
|
| 1,407,525 |
| 61,116 |
|
|
| 1,468,641 |
|
|
| 1,468,641 |
|
Comprehensive Income |
|
|
|
|
|
|
|
|
|
|
|
|
|
|
| — |
|
Dividends |
|
|
|
|
|
|
|
|
|
|
|
|
| (179,622,013 | ) | (179,622,013 | ) |
Increase (decrease) through transfers and other changes |
|
|
|
|
|
|
| (61,116 | ) |
|
| (61,116 | ) | 61,116 |
| — |
|
Total changes in equity |
| — |
| — |
| 1,407,525 |
| — |
| — |
| 1,407,525 |
| (985,397 | ) | 422,128 |
|
Endings Balance at 12/31/2010 |
| 2,824,882,835 |
| 158,759,648 |
| (28,319,646 | ) | — |
| (1,286,577,293 | ) | (1,314,896,939 | ) | 484,432,183 |
| 2,153,177,727 |
|
|
|
|
|
|
| Changes in others reserves |
|
|
|
|
|
|
| ||||
Statement of Changes in Equity, Net |
| Issued capital |
| Share |
| Reserve of |
| Reserve of actuarial |
| Other |
| Other reserves |
| Retained earnings |
| Total Equity |
|
Equity at beginning of period 01/01/2009 |
| 2,824,882,835 |
| 158,759,648 |
| 2,678,964 |
| — |
| (1,286,577,293 | ) | (1,283,898,329 | ) | 541,249,381 |
| 2,240,993,535 |
|
Changes in equity |
|
|
|
|
|
|
|
|
|
|
|
|
|
|
| — |
|
Comprehensive income |
| — |
| — |
| (32,406,135 | ) | (808,659 | ) | — |
| (33,214,794 | ) | 172,907,183 |
| 139,692,389 |
|
Net income |
|
|
|
|
|
|
|
|
|
|
|
|
| 172,907,183 |
| 172,907,183 |
|
Other comprehensive income |
|
|
|
|
| (32,406,135 | ) | (808,659 | ) |
|
| (33,214,794 | ) |
|
| (33,214,794 | ) |
Comprehensive Income |
|
|
|
|
|
|
|
|
|
|
|
|
|
|
| — |
|
Dividends |
|
|
|
|
|
|
|
|
|
|
|
|
| (227,842,344 | ) | (227,842,344 | ) |
Increase (decrease) through transfers and other changes |
|
|
|
|
|
|
| 808,659 |
| — |
| 808,659 |
| (896,640 | ) | (87,981 | ) |
Total changes in equity |
| — |
| — |
| (32,406,135 | ) | — |
| — |
| (32,406,135 | ) | (55,831,801 | ) | (88,237,936 | ) |
Endings Balance at 12/31/2009 |
| 2,824,882,835 |
| 158,759,648 |
| (29,727,171 | ) | — |
| (1,286,577,293 | ) | (1,316,304,464 | ) | 485,417,580 |
| 2,152,755,599 |
|
ENERSIS S.A.
Separate Statement of Changes in Equity for the years anded December 31, 2010, 2009 and 2008
(In thousands of Chilean pesos - ThCh$)
|
|
|
|
|
| Changes in others reserves |
|
|
|
|
|
|
| ||||
Statement of Changes in Equity, Net |
| Issued capital |
| Share |
| Reserve of cash |
| Reserve of actuarial |
| Other |
| Other reserves |
| Retained earnings |
| Total Equity |
|
Equity at beginning of period 01/01/2008 |
| 2,594,015,459 |
| 158,759,648 |
| (44,390,168 | ) | — |
| (641,512,476 | ) | (685,902,644 | ) | 153,151,727 |
| 2,220,024,190 |
|
Changes in equity |
|
|
|
|
|
|
|
|
|
|
|
|
|
|
| — |
|
Comprehensive income |
| — |
| — |
| 47,069,132 |
| (453,159 | ) | — |
| 46,615,973 |
| 213,212,600 |
| 259,828,573 |
|
Net income |
|
|
|
|
|
|
|
|
|
|
|
|
| 213,212,600 |
| 213,212,600 |
|
Other comprehensive income |
|
|
|
|
| 47,069,132 |
| (453,159 | ) |
|
| 46,615,973 |
|
|
| 46,615,973 |
|
Comprehensive Income |
|
|
|
|
|
|
|
|
|
|
|
|
|
|
| — |
|
Dividends |
|
|
|
|
|
|
|
|
|
|
|
|
| (242,980,591 | ) | (242,980,591 | ) |
Increase (decrease) through transfers and other changes |
| 230,867,376 |
|
|
|
|
| 453,159 |
| (645,064,817 | ) | (644,611,658 | ) | 417,865,645 |
| 4,121,363 |
|
Total changes in equity |
| 230,867,376 |
| — |
| 47,069,132 |
| — |
| (645,064,817 | ) | (597,995,685 | ) | 388,097,654 |
| 20,969,345 |
|
Endings Balance at 12/31/2008 |
| 2,824,882,835 |
| 158,759,648 |
| 2,678,964 |
| — |
| (1,286,577,293 | ) | (1,283,898,329 | ) | 541,249,381 |
| 2,240,993,535 |
|
ENERSIS S.A.
Separate Statement of Cash Flows for the years anded December 31, 2010, 2009 and 2008
(In thousands of Chilean pesos - ThCh$)
|
| 2010 |
| 2009 |
| 2008 |
|
Indirect Statement of Cash Flow |
| ThCh$ |
| ThCh$ |
| ThCh$ |
|
Cash flows from (used in) operating activities |
|
|
|
|
|
|
|
|
|
|
|
|
|
|
|
Net Income |
| 178,575,500 |
| 172,907,183 |
| 213,212,600 |
|
|
|
|
|
|
|
|
|
Adjustments to reconcile net income |
|
|
|
|
|
|
|
Dividend income |
| (244,247,700 | ) | (204,489,046 | ) | (238,122,146 | ) |
Adjustments for income tax expense |
| (6,031,074 | ) | (33,886,710 | ) | 18,035,962 |
|
Adjustments for depreciation and amortization expense |
| 933,976 |
| 1,118,649 |
| 1,399,630 |
|
Loss (gain) on sales of non-current assets not held for sale |
| — |
| (15,997,454 | ) | — |
|
Adjustments for decrease (increase) in trade accounts receivable |
| 2,215,824 |
| (1,420,929 | ) | (876,823 | ) |
Adjustments for decrease (increase) in other operating receivables |
| 6,145,572 |
| 32,600,464 |
| (98,201,673 | ) |
Adjustments for increase (decrease) in trade accounts payable |
| (3,043,769 | ) | (32,444,127 | ) | (11,687,332 | ) |
Adjustments for increase (decrease) in other operating payables |
| 15,155,991 |
| 20,146,477 |
| 99,787,059 |
|
|
|
|
|
|
|
|
|
Total adjustments to reconcile net income |
| (228,871,180 | ) | (234,372,676 | ) | (229,665,323 | ) |
|
|
|
|
|
|
|
|
Net cash flows provided by (used in) other operating activities |
| (18,450,371 | ) | (15,213,356 | ) | 18,161,775 |
|
Income taxes refund (paid) |
| 419,096 |
| 629,778 |
| 7,470,971 |
|
Other inflows (outflows) of cash |
| (18,869,467 | ) | (15,843,134 | ) | 10,690,804 |
|
|
|
|
|
|
|
|
|
Net cash flows from (used in) operating activities |
| (68,746,051 | ) | (76,678,849 | ) | 1,709,052 |
|
ENERSIS S.A.
Separate Statement of Cash Flows for the years anded December 31, 2010, 2009 and 2008
(In thousands of Chilean pesos - ThCh$)
Continued.
|
| 2010 |
| 2009 |
| 2008 |
|
Indirect Statement of Cash Flow |
| ThCh$ |
| ThCh$ |
| ThCh$ |
|
Cash flows from (used in) investing activities |
|
|
|
|
|
|
|
Proceeds from sales of Other Financial Assets |
| — |
| 27,081,403 |
| — |
|
Other cash flows provided by (used in) investing activities |
| 17,031,549 |
| 89,147,305 |
| 233,136,374 |
|
Proceeds from dividends received classified for investing purposes |
| 211,194,885 |
| 289,576,311 |
| 188,653,571 |
|
Purchase of property, plant and equipment |
| (236,768 | ) | (499,384 | ) | (258,554 | ) |
Investments in subsidiaries |
| — |
| (81,549,336 | ) | — |
|
Loans to related companies |
| (821,636 | ) | (4,074,609 | ) | — |
|
Other investment disbursements |
| (6,356,992 | ) | (28,801,680 | ) | — |
|
Net cash flows from (used in) investing activities |
| 220,811,038 |
| 290,880,010 |
| 421,531,391 |
|
|
|
|
|
|
|
|
|
Net Cash Flows provided by (used in) Financing Activities |
|
|
|
|
|
|
|
Proceeds from loans obtained |
| — |
| 36,500,000 |
| 33,500,000 |
|
Proceeds from loans from related companies |
| 5,536,031 |
| 9,363,881 |
| — |
|
Repayments of borrowings |
| (1,585,498 | ) | (148,935,949 | ) | (107,794,043 | ) |
Payments of finance lease liabilities |
| — |
| (7,895,140 | ) | (145,673,288 | ) |
Dividends paid to Non-controlling interests |
| (59,198,027 | ) | (89,894,294 | ) | (63,603,889 | ) |
Dividend paid to shareholders of the parent |
| (61,446,535 | ) | (102,539,559 | ) | (83,347,000 | ) |
Net cash flows from (used in) financing activities |
| (116,694,029 | ) | (303,401,061 | ) | (366,918,220 | ) |
|
|
|
|
|
|
|
|
Net Increase (Decrease) in Cash and Cash Equivalents |
| 35,370,958 |
| (89,199,900 | ) | 56,322,223 |
|
|
|
|
|
|
|
|
|
Beginning balance of cash and cash equivalents, statement of cash flows |
| 27,325,320 |
| 116,525,220 |
| 60,202,997 |
|
Ending balance of cash and cash equivalents, statement of cash flows |
| 62,696,278 |
| 27,325,320 |
| 116,525,220 |
|
Additional information:
1. Basis of Presentation
Enersis S.A. (“the Parent”) is a holding company that conducts substantially all of its business operations through its subsidiaries. It is important to consider that for purposes of preparing separate financial statements under International Financial Reporting Standards, the Parent records its investments in subsidiaries and associates at its cost. Dividends received from a subsidiary and associate are recognized in profit or loss in the Parent’s separate financial statements when its right to receive such dividend is established. The information described bellow should be read in conjunction with the consolidated financial statements of Enersis S.A. . The basis of presentation and accounting principles used in the preparation of these separate financial statements are described in notes 2 and 3 of the consolidated financial statements except for notes 2.4.1, 2.4.2, 2.4.3, 2.5 and 3.c which relates to the consolidation process.
2. Restricted Net Assets
Certain assets of the Parent’s subsidiaries totaling approximately ThCh$1,629,203,369 constitute restricted net assets, as there are contractual, legal or regulatory limitations on transferring such assets outside of the countries where the respective assets are located, or because they constitute undistributed earnings of affiliates of the Parent recorded under the equity method of accounting. As of December 31, 2010 all of the restricted net assets of the Parent’s subsidiaries currently exceed 25% of the consolidated net assets of the Parent and its subsidiaries, thus requiring this Schedule I, “Condensed Financial Information of the Registrant.”