
FOR IMMEDIATE RELEASE
For further information, please contact Enersis:
Ricardo Alvial | Susana Rey, srm@e.enersis.cl |
ENERSIS ANNOUNCES CONSOLIDATED RESULTS FOR THE FIRST HALF
ENDED JUNE 30, 2003
HIGHLIGHTS FOR THE FIRST HALF 2003
• | The Company raised US$ 663 million from minority shareholders, as part of the capital increase approved at the Extraordinary Shareholders Meeting held on March 31st. Additionally, Endesa (NYSE:ELE), capitalized its intercompany loan for the amount of US$ 1.4 billion. |
• | Enersis refinanced liabilities by US$ 2,330 million, through two syndicated loans, US$ 1,587 million granted to Enersis and US$ 743 million granted to Endesa Chile (NYSE:EOC), with a 30 month of grace period and also removing rating triggers. |
• | Enersis registered profits of US$ 57 million, basically due to, among others, lower net financial expenses. |
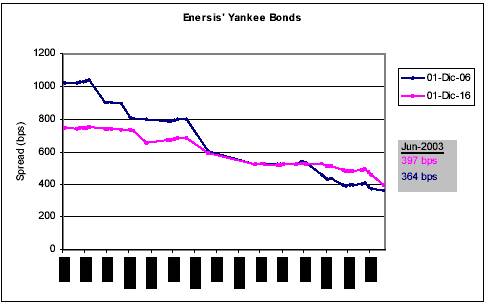
• | In the context of the Strengthening Financial Plan launched by the Company on October 2002, Enersis carried out successful financial operations by US$ 5 billion. |
• | Labor Productivity continued in a positive trend, increasing a 3.4%, from 1,361 up to 1,407 clients per employee. |
• | Total financial debt reduction was US$ 1,624 million, contributing to reduce financial expenses in fact, net financial income improved by US$ 30 million, equivalent to 11.1% |
• | Clients increased in 219 thousand new customers, equivalent to 2.2% |
• | Energy losses decreased in all our subsidiaries, but in Edesur. |
• | Physical sales on distribution increased from 23,434 GWh to 24,479 GWh, which suggest better trend in terms of economic activity. |
6
7
(Santiago, Chile, July 31st, 2003) Enersis (NYSE: ENI), today announced consolidated financial results for the second quarter ended June 30th, 2003. All figures are in both, US$, and Ch$, and in accordance to Chilean Generally Accepted Accounting Principles (GAAP) as seen in the standardized form required by Chilean authorities (FECU). Variations refer to June 30th, 2002, and figures have been adjusted by the CPI variation between both periods, equal to 3.5%.
For the purpose of converting Chilean pesos (Ch$) into US dollars (US$), we have used the exchange rate prevailing as of June 30th, 2003, equal to US$ 1 = Ch$ 699.12.
The consolidation includes the following investment vehicles and companies,
a) | In Chile: Endesa Chile (NYSE: EOC), Chilectra, Synapsis, CAM Ltd. and Inm. Manso de Velasco. |
b) | Outside Chile: Distrilima (Perú), Cerj and Investluz (Brazil), Edesur (Argentina), Luz de Bogotá (Colombia). |
In the following pages you will find a detailed analysis of Financial Statements, explanation for most of variations, and comments about the main items of Income Statement and Cash Flow Statement compared to the information booked as of June 30th, 2002.
Below you will find a graph showing the risk market perception before an after the US$ 5 billion financing operations.
8
CONSOLIDATED INCOME STATEMENT
(Under Chilean GAAP, thousand US$)
Table 1.1
Thousand US$ |
| 1H 03 |
| 1H 02 |
| Var 03-02 |
| Chg % |
| ||||
|
|
|
|
| |||||||||
Revenues from Generation |
|
| 677,293 |
|
| 655,993 |
|
| 21,300 |
|
| 3.2 | % |
Revenues from Distribution |
|
| 1,232,930 |
|
| 1,360,683 |
|
| (127,753 | ) |
| (9.4 | %) |
Revenues from Other Businesses |
|
| 119,932 |
|
| 125,202 |
|
| (5,269 | ) |
| (4.2 | %) |
Consolidation Adjustments |
|
| (231,249 | ) |
| (227,033 | ) |
| (4,217 | ) |
| (1.9 | %) |
|
|
|
|
|
| ||||||||
Operating Revenues |
|
| 1,798,906 |
|
| 1,914,846 |
|
| (115,940 | ) |
| (6.1 | %) |
|
|
|
|
|
| ||||||||
Op. Expenses from Generation |
|
| (399,147 | ) |
| (390,273 | ) |
| (8,874 | ) |
| (2.3 | %) |
Op. Expenses from Distribution |
|
| (972,415 | ) |
| (1,025,073 | ) |
| 52,658 |
|
| 5.1 | % |
Op.Expenses from Other Businesses |
|
| (91,654 | ) |
| (92,189 | ) |
| 535 |
|
| 0.6 | % |
Consolidation Adjustments |
|
| 211,782 |
|
| 213,875 |
|
| (2,093 | ) |
| (1.0 | %) |
|
|
|
|
|
| ||||||||
Operating Expenses |
|
| (1,251,435 | ) |
| (1,293,660 | ) |
| 42,225 |
|
| 3.3 | % |
|
|
|
|
|
| ||||||||
Operating Margin |
|
| 547,471 |
|
| 621,186 |
|
| (73,715 | ) |
| (11.9 | %) |
|
|
|
|
|
| ||||||||
SG&A from Generation |
|
| (21,882 | ) |
| (20,769 | ) |
| (1,113 | ) |
| (5.4 | %) |
SG&A from Distribution |
|
| (104,084 | ) |
| (131,637 | ) |
| 27,553 |
|
| 20.9 | % |
SG&A from Other Businesses |
|
| (21,710 | ) |
| (24,910 | ) |
| 3,200 |
|
| 12.8 | % |
Consolidation Adjustments |
|
| 19,344 |
|
| 17,077 |
|
| 2,267 |
|
| 13.3 | % |
|
|
|
|
|
| ||||||||
Selling and Administrative Expenses |
|
| (128,331 | ) |
| (160,239 | ) |
| 31,908 |
|
| 19.9 | % |
|
|
|
|
|
| ||||||||
Operating Income |
|
| 419,140 |
|
| 460,947 |
|
| (41,807 | ) |
| (9.1 | %) |
|
|
|
|
|
| ||||||||
Interest Income |
|
| 54,951 |
|
| 51,838 |
|
| 3,113 |
|
| 6.0 | % |
Interest Expense |
|
| (296,144 | ) |
| (323,069 | ) |
| 26,924 |
|
| 8.3 | % |
Net Financial Income (Expenses) |
|
| (241,194 | ) |
| (271,231 | ) |
| 30,037 |
|
| 11.1 | % |
Equity Gains from Related Companies |
|
| 28,956 |
|
| 3,520 |
|
| 25,435 |
|
| 722.6 | % |
Equity Losses from Related Companies |
|
| (397 | ) |
| (10,743 | ) |
| 10,346 |
|
| 96.3 | % |
Net Income from Related Companies |
|
| 28,559 |
|
| (7,223 | ) |
| 35,782 |
|
| 495.4 | % |
Other Non Operating Income |
|
| 190,510 |
|
| 257,477 |
|
| (66,967 | ) |
| (26.0 | %) |
Other Non Operating Expenses |
|
| (250,034 | ) |
| (181,889 | ) |
| (68,145 | ) |
| (37.5 | %) |
Net other Non Operating Income (Expenses) |
|
| (59,524 | ) |
| 75,589 |
|
| (135,112 | ) |
| 178.7 | % |
Price Level Restatement |
|
| (11,519 | ) |
| (5,583 | ) |
| (5,936 | ) |
| (106.3 | %) |
Foreign Exchange Effect |
|
| 11,885 |
|
| (15,569 | ) |
| 27,454 |
|
| 176.3 | % |
Net of Monetary Exposure |
|
| 366 |
|
| (21,152 | ) |
| 21,517 |
|
| 101.7 | % |
Positive Goodwill Amortization |
|
| (38,509 | ) |
| (59,282 | ) |
| 20,773 |
|
| 35.0 | % |
|
|
|
|
|
| ||||||||
Non Operating Income |
|
| (310,302 | ) |
| (283,299 | ) |
| (27,002 | ) |
| (9.5 | %) |
|
|
|
|
|
| ||||||||
Net Inc b. Taxes, Min Int and Neg Goodwill Amort. |
|
| 108,838 |
|
| 177,647 |
|
| (68,809 | ) |
| (38.7 | %) |
|
|
|
|
|
| ||||||||
Extraordianary Items |
|
| — |
|
| — |
|
| — |
|
| N/A |
|
Income Tax |
|
| (82,252 | ) |
| (35,712 | ) |
| (46,540 | ) |
| (130.3 | %) |
Minority Interest |
|
| (32,314 | ) |
| (142,789 | ) |
| 110,475 |
|
| 77.4 | % |
Negative Goodwill Amortization |
|
| 62,777 |
|
| 35,875 |
|
| 26,902 |
|
| 75.0 | % |
|
|
|
|
|
| ||||||||
NET INCOME |
|
| 57,049 |
|
| 35,022 |
|
| 22,028 |
|
| 62.9 | % |
|
|
|
|
|
| ||||||||
R.A.I.I.D.A.I.E. |
|
| 839,015 |
|
| 812,264 |
|
| 26,751 |
|
| 3.3 | % |
|
|
|
|
|
| ||||||||
RAIIDAIE: Net income before taxes, interest, depreciation, amortization and extraordinary items (as defined by local SEC).
9
CONSOLIDATED INCOME STATEMENT
(Under Chilean GAAP, million Ch$)
Table 1.2
Millions Ch$ |
| 1H 03 |
| 1H 02 |
| Var 03-02 |
| Chg % |
| ||||
|
|
|
|
| |||||||||
Revenues from Generation |
|
| 473,509 |
|
| 458,618 |
|
| 14,891 |
|
| 3.2 | % |
Revenues from Distribution |
|
| 861,966 |
|
| 951,281 |
|
| (89,315 | ) |
| (9.4 | %) |
Revenues from Other Businesses |
|
| 83,847 |
|
| 87,531 |
|
| (3,684 | ) |
| (4.2 | %) |
Consolidation Adjustments |
|
| (161,671 | ) |
| (158,723 | ) |
| (2,948 | ) |
| (1.9 | %) |
|
|
|
|
|
| ||||||||
Operating Revenues |
|
| 1,257,651 |
|
| 1,338,707 |
|
| (81,056 | ) |
| (6.1 | %) |
|
|
|
|
|
| ||||||||
Op. Expenses from Generation |
|
| (279,052 | ) |
| (272,848 | ) |
| (6,204 | ) |
| (2.3 | %) |
Op. Expenses from Distribution |
|
| (679,835 | ) |
| (716,649 | ) |
| 36,814 |
|
| 5.1 | % |
Op.Expenses from Other Businesses |
|
| (64,077 | ) |
| (64,451 | ) |
| 374 |
|
| 0.6 | % |
Consolidation Adjustments |
|
| 148,061 |
|
| 149,524 |
|
| (1,463 | ) |
| (1.0 | %) |
|
|
|
|
|
| ||||||||
Operating Expenses |
|
| (874,903 | ) |
| (904,424 | ) |
| 29,520 |
|
| 3.3 | % |
|
|
|
|
|
| ||||||||
Operating Margin |
|
| 382,748 |
|
| 434,284 |
|
| (51,536 | ) |
| (11.9 | %) |
|
|
|
|
|
| ||||||||
SG&A from Generation |
|
| (15,298 | ) |
| (14,520 | ) |
| (778 | ) |
| (5.4 | %) |
SG&A from Distribution |
|
| (72,767 | ) |
| (92,030 | ) |
| 19,263 |
|
| 20.9 | % |
SG&A from Other Businesses |
|
| (15,178 | ) |
| (17,415 | ) |
| 2,237 |
|
| 12.8 | % |
Consolidation Adjustments |
|
| 13,524 |
|
| 11,939 |
|
| 1,585 |
|
| 13.3 | % |
|
|
|
|
|
| ||||||||
Selling and Administrative Expenses |
|
| (89,719 | ) |
| (112,026 | ) |
| 22,308 |
|
| 19.9 | % |
|
|
|
|
|
| ||||||||
Operating Income |
|
| 293,029 |
|
| 322,257 |
|
| (29,228 | ) |
| (9.1 | %) |
|
|
|
|
|
| ||||||||
Interest Income |
|
| 38,417 |
|
| 36,241 |
|
| 2,176 |
|
| 6.0 | % |
Interest Expense |
|
| (207,041 | ) |
| (225,864 | ) |
| 18,823 |
|
| 8.3 | % |
Net Financial Income (Expenses) |
|
| (168,623 | ) |
| (189,623 | ) |
| 21,000 |
|
| 11.1 | % |
Equity Gains from Related Companies |
|
| 20,243 |
|
| 2,461 |
|
| 17,782 |
|
| 722.6 | % |
Equity Losses from Related Companies |
|
| (277 | ) |
| (7,511 | ) |
| 7,233 |
|
| 96.3 | % |
Net Income from Related Companies |
|
| 19,966 |
|
| (5,050 | ) |
| 25,016 |
|
| 495.4 | % |
Other Non Operating Income |
|
| 133,190 |
|
| 180,008 |
|
| (46,818 | ) |
| (26.0 | %) |
Other Non Operating Expenses |
|
| (174,804 | ) |
| (127,162 | ) |
| (47,642 | ) |
| (37.5 | %) |
Net other Non Operating Income (Expense) |
|
| (41,614 | ) |
| 52,846 |
|
| (94,460 | ) |
| 178.7 | % |
Price Level Restatement |
|
| (8,053 | ) |
| (3,903 | ) |
| (4,150 | ) |
| (106.3 | %) |
Foreign Exchange Effect |
|
| 8,309 |
|
| (10,884 | ) |
| 19,193 |
|
| 176.3 | % |
Net of Monetary Exposure |
|
| 256 |
|
| (14,788 | ) |
| 15,043 |
|
| 101.7 | % |
Positive Goodwill Amortization |
|
| (26,922 | ) |
| (41,446 | ) |
| 14,523 |
|
| 35.0 | % |
|
|
|
|
|
| ||||||||
Non Operating Income |
|
| (216,938 | ) |
| (198,060 | ) |
| (18,878 | ) |
| (9.5 | %) |
|
|
|
|
|
| ||||||||
Net Income b. Taxes, Min Int and Neg Goodwill Amort. |
|
| 76,091 |
|
| 124,197 |
|
| (48,106 | ) |
| (38.7 | %) |
|
|
|
|
|
| ||||||||
Extraordinary Items |
|
| — |
|
| — |
|
| — |
|
| N/A |
|
Income Tax |
|
| (57,504 | ) |
| (24,967 | ) |
| (32,537 | ) |
| (130.3 | %) |
Minority Interest |
|
| (22,591 | ) |
| (99,826 | ) |
| 77,235 |
|
| 77.4 | % |
Negative Goodwill Amortization |
|
| 43,889 |
|
| 25,081 |
|
| 18,808 |
|
| 75.0 | % |
|
|
|
|
|
| ||||||||
NET INCOME |
|
| 39,884 |
|
| 24,484 |
|
| 15,400 |
|
| 62.9 | % |
|
|
|
|
|
| ||||||||
R.A.I.I.D.A.I.E. |
|
| 586,572 |
|
| 567,870 |
|
| 18,702 |
|
| 3.3 | % |
|
|
|
|
|
| ||||||||
RAIIDAIE: Net income before taxes, interest, depreciation, amortization and extraordinary items (as defined by local SEC).
10
OPERATING INCOME, BREAKDOWN BY SUBSIDIARY
(Under Chilean GAAP, thousand US$ and million Ch$)
Operating income and expenses, as well as administrative and selling expenses, by subsidiary, for the periods ended June 2003 and 2002, are shown below:
Table 2.1
|
| 1H 03 |
| 1H 02 |
| ||||||||||||
|
|
|
| ||||||||||||||
Thousand US$ |
| Operating |
| Operating |
| SG & A |
| Operating |
| Operating |
| Operating |
| SG & A |
| Operating |
|
|
|
|
|
|
|
|
|
| |||||||||
Endesa S.A. |
| 694,341 |
| (413,062 | ) | (22,623 | ) | 258,657 |
| 684,548 |
| (410,021 | ) | (22,225 | ) | 252,301 |
|
Chilectra S.A. |
| 295,108 |
| (206,976 | ) | (20,756 | ) | 67,376 |
| 284,805 |
| (199,281 | ) | (22,930 | ) | 62,594 |
|
Río Maipo S.A. |
| — |
| — |
| — |
| — |
| 40,407 |
| (30,965 | ) | (2,588 | ) | 6,854 |
|
Edesur S.A. |
| 149,065 |
| (131,942 | ) | (22,620 | ) | (5,497 | ) | 159,027 |
| (128,896 | ) | (23,798 | ) | 6,332 |
|
Distrilima |
| 149,239 |
| (111,260 | ) | (13,583 | ) | 24,396 |
| 143,107 |
| (104,168 | ) | (14,256 | ) | 24,682 |
|
Cerj |
| 260,600 |
| (214,139 | ) | (7,715 | ) | 38,746 |
| 311,496 |
| (238,199 | ) | (18,415 | ) | 54,882 |
|
Investluz |
| 159,737 |
| (115,202 | ) | (21,510 | ) | 23,025 |
| 178,133 |
| (122,945 | ) | (30,119 | ) | 25,069 |
|
Luz de Bogotá |
| 219,181 |
| (192,897 | ) | (17,892 | ) | 8,392 |
| 243,708 |
| (200,618 | ) | (19,530 | ) | 23,560 |
|
CAM Ltda. |
| 61,510 |
| (48,501 | ) | (4,826 | ) | 8,183 |
| 56,058 |
| (44,569 | ) | (4,636 | ) | 6,853 |
|
Inmobiliaria Manso de Velasco Ltda |
| 7,125 |
| (7,192 | ) | (990 | ) | (1,057 | ) | 4,474 |
| (2,241 | ) | (930 | ) | 1,303 |
|
Synapsis Soluciones y Servicios IT Ltda. |
| 31,116 |
| (21,237 | ) | (4,573 | ) | 5,307 |
| 33,012 |
| (24,867 | ) | (4,373 | ) | 3,772 |
|
Enersis Holding and other investment vehicles |
| 3,133 |
| (810 | ) | (10,588 | ) | (8,265 | ) | 3,102 |
| (764 | ) | (13,516 | ) | (11,177 | ) |
Consolidation Adjustments |
| (231,249 | ) | 211,782 |
| 19,344 |
| (123 | ) | (227,030 | ) | 213,873 |
| 17,077 |
| 3,921 |
|
|
|
|
|
|
|
|
|
|
| ||||||||
Total Consolidation |
| 1,798,906 |
| (1,251,435 | ) | (128,331 | ) | 419,140 |
| 1,914,846 |
| (1,293,661 | ) | (160,239 | ) | 460,947 |
|
|
|
|
|
|
|
|
|
|
| ||||||||
Table 2.2
|
| 1H 03 |
| 1H 02 |
| ||||||||||||
|
|
|
| ||||||||||||||
Million Ch$ |
| Operating |
| Operating |
| SG & A |
| Operating |
| Operating |
| Operating |
| SG & A |
| Operating |
|
|
|
|
|
|
|
|
|
| |||||||||
Endesa S.A. |
| 485,428 |
| (288,780 | ) | (15,816 | ) | 180,832 |
| 478,581 |
| (286,654 | ) | (15,538 | ) | 176,389 |
|
Chilectra S.A. |
| 206,316 |
| (144,701 | ) | (14,511 | ) | 47,104 |
| 199,113 |
| (139,321 | ) | (16,031 | ) | 43,761 |
|
Río Maipo S.A. |
| — |
| — |
| — |
| — |
| 28,249 |
| (21,648 | ) | (1,809 | ) | 4,792 |
|
Edesur S.A. |
| 104,214 |
| (92,243 | ) | (15,814 | ) | (3,843 | ) | 111,179 |
| (90,114 | ) | (16,638 | ) | 4,427 |
|
Distrilima |
| 104,336 |
| (77,784 | ) | (9,496 | ) | 17,056 |
| 100,049 |
| (72,826 | ) | (9,967 | ) | 17,256 |
|
Cerj |
| 182,191 |
| (149,709 | ) | (5,394 | ) | 27,088 |
| 217,773 |
| (166,530 | ) | (12,874 | ) | 38,369 |
|
Investluz |
| 111,675 |
| (80,540 | ) | (15,038 | ) | 16,097 |
| 124,536 |
| (85,953 | ) | (21,057 | ) | 17,526 |
|
Luz de Bogotá |
| 153,234 |
| (134,858 | ) | (12,509 | ) | 5,867 |
| 170,381 |
| (140,256 | ) | (13,654 | ) | 16,471 |
|
CAM Ltda. |
| 43,003 |
| (33,908 | ) | (3,374 | ) | 5,721 |
| 39,191 |
| (31,159 | ) | (3,241 | ) | 4,791 |
|
Inmobiliaria Manso de Velasco Ltda. |
| 4,981 |
| (5,028 | ) | (692 | ) | (739 | ) | 3,128 |
| (1,567 | ) | (650 | ) | 911 |
|
Synapsis Soluciones y Servicios IT Ltda. |
| 21,754 |
| (14,847 | ) | (3,197 | ) | 3,710 |
| 23,079 |
| (17,385 | ) | (3,057 | ) | 2,637 |
|
Enersis Holding and other investment vehicles |
| 2,190 |
| (566 | ) | (7,402 | ) | (5,778 | ) | 2,169 |
| (534 | ) | (9,449 | ) | (7,814 | ) |
Consolidation Adjustments |
| (161,671 | ) | 148,061 |
| 13,524 |
| (86 | ) | (158,721 | ) | 149,523 |
| 11,939 |
| 2,741 |
|
|
|
|
|
|
|
|
|
|
| ||||||||
Total Consolidation |
| 1,257,651 |
| (874,903 | ) | (89,719 | ) | 293,029 |
| 1,338,707 |
| (904,424 | ) | (112,026 | ) | 322,257 |
|
|
|
|
|
|
|
|
|
|
| ||||||||
11
CONSOLIDATED INCOME STATEMENT ANALYSIS
(As seen in the FECU)
As of June 2003, Enersis registered a net profit of US$ 57 million. This amount is equivalent to an increase of 62.9% compared to June 2002.
Operating Income for the period amounted to US$ 419 million, which represents a decrease of US$ 42 million, equivalent to 9%. This decrease is mainly explained by lower operating results in Edesur, derived from the economic downturn of Argentina, and also due to the deconsolidation of Río Maipo and Infraestructura 2000, both companies divested. This negative effect was partially compensated by better operating results of Endesa Chile and Chilectra. If we compare June 2003 with June 2002 without Río Maipo and Infraestructura 2000, Operating Income would have decreased only 6%.
Generation business, the operating income of Endesa Chile amounted to US$ 259 million, which represents a 2.5% increase or US$ 6 million. This increase is mainly due to better profits arising from our operations in Chile, Argentina and Colombia related to better hydrological and market conditions, positively impacting the operating margin. This was partially compensated by lower profits in Brazil and Peru.
In Chile, operating income was US$ 116 million, or a 3.1% reduction. Adjusting the first half results in a proforma manner, excluding 2001 operating income related to the infraestructure company that we just sold, operating income would have increase by 2.5%. On the other hand, revenues coming from energy sales in Chile grew by 2.5 % mainly due to a 10.6% higher hydro generation associated to an improvement in dam levels during the first half of the year 2003. This higher generation allowed a reduction of US$ 6 million in energy purchase costs.
In Argentina, operating income was US$ 18 million, increasing in 388.3%. This increase is due to US$ 7 million of higher operating income in Central Costanera, mainly explained by the higher income coming from power payment from contracts held in the second interconnection line with Brazil, as well as from lower costs in fuel and energy purchase. On the other hand, the low energy prices in southern Brazil because of the high dam levels meant no dispatch from CIEN interconnection line during first half 2003. In Chocón, the operating income improved by US$ 7 million, basically due to higher energy sales in the spot market. These higher sales were possible as a consequence of higher levels on water reservoirs, consumption growth, and better prices resulted from the Argentinean peso revaluation.
In Colombia, operating income increased 6.3%, amounting US$ 66 million, basically due to higher sales prices in the spot market related to lower water availability in the country. Dam regulation and lower energy sales have partially compensated the higher income mentioned above.
In Brazil, operating income of Cachoeira Dourada decreased 35.4%, down to US$ 10 million, mainly due to a decrease of 19.8% in average energy sale prices. These lower prices are explained by the apreciation of the real versus the dollar in the first half of the year 2003 compared to the same period 2002. Also, by a drop of 10% in the contract with Companhia Elétrica do Estado de Goiás S.A. (CELG), since September of the year 2002.
12
In Peru, operating income decreased by 5.5%, amounting to US$ 48 million, mainly explained by a 3% decrease in average energy and power sale prices of and also by higher cost in energy transportation. This has been partially compensated by the better hydrological conditions that allowed increasing hydraulic generation by 9.8%.
DISTRIBUTION INCOME STATEMENTS
Table 3
|
| Thousand US$ |
| Million Ch$ |
| ||||||||||||
|
|
|
| ||||||||||||||
CHILECTRA |
| 1H 03 |
| 1H 02 |
| Var 03-02 |
| Chg % |
| 1H 03 |
| 1H 02 |
| Var 03-02 |
| Chg % |
|
|
|
|
|
|
|
|
|
| |||||||||
Revenues from Sales |
| 285,725 |
| 274,244 |
| 11,481 |
| 4.2 | % | 199,756 |
| 191,729 |
| 8,027 |
| 4.2 | % |
Other Operating Revenues |
| 9,383 |
| 10,562 |
| (1,180 | ) | -11.2 | % | 6,560 |
| 7,384 |
| (825 | ) | -11.2 | % |
|
|
|
|
|
|
|
|
|
| ||||||||
Operating Revenues |
| 295,108 |
| 284,806 |
| 10,301 |
| 3.6 | % | 206,316 |
| 199,114 |
| 7,202 |
| 3.6 | % |
|
|
|
|
|
|
|
|
|
| ||||||||
Energy Purchases |
| (178,932 | ) | (171,255 | ) | (7,677 | ) | -4.5 | % | (125,095 | ) | (119,728 | ) | (5,367 | ) | -4.5 | % |
Other Operating Cost |
| (28,044 | ) | (28,026 | ) | (17 | ) | -0.1 | % | (19,606 | ) | (19,594 | ) | (12 | ) | -0.1 | % |
|
|
|
|
|
|
|
|
|
| ||||||||
Operating Expenses |
| (206,976 | ) | (199,282 | ) | (7,694 | ) | -3.9 | % | (144,701 | ) | (139,322 | ) | (5,379 | ) | -3.9 | % |
|
|
|
|
|
|
|
|
|
| ||||||||
Selling and Administrative Expenses |
| (20,757 | ) | (22,930 | ) | 2,174 |
| 9.5 | % | (14,511 | ) | (16,031 | ) | 1,520 |
| 9.5 | % |
|
|
|
|
|
|
|
|
|
| ||||||||
Operating Income |
| 67,375 |
| 62,594 |
| 4,781 |
| 7.6 | % | 47,103 |
| 43,761 |
| 3,342 |
| 7.6 | % |
|
|
|
|
|
|
|
|
|
| ||||||||
Interest Income |
| 988 |
| 13,111 |
| (12,123 | ) | -92.5 | % | 691 |
| 9,166 |
| (8,475 | ) | -92.5 | % |
Interest Expenses |
| (28,986 | ) | (35,003 | ) | 6,017 |
| 17.2 | % | (20,265 | ) | (24,472 | ) | 4,207 |
| 17.2 | % |
Net Financial Income (Expenses) |
| (27,998 | ) | (21,892 | ) | (6,106 | ) | -27.9 | % | (19,574 | ) | (15,306 | ) | (4,268 | ) | -27.9 | % |
Equity Gains from Related Company |
| 3,283 |
| 56,790 |
| (53,508 | ) | -94.2 | % | 2,295 |
| 39,703 |
| (37,408 | ) | -94.2 | % |
Equity Losses from Related Company |
| (66,172 | ) | (526 | ) | (65,646 | ) | -12480.0 | % | (46,262 | ) | (368 | ) | (45,895 | ) | -12480.0 | % |
Net Income from Related Companies |
| (62,889 | ) | 56,264 |
| (119,154 | ) | -211.8 | % | (43,967 | ) | 39,336 |
| (83,303 | ) | -211.8 | % |
Other Non Operating Income |
| 22,957 |
| 26,954 |
| (3,997 | ) | -14.8 | % | 16,049 |
| 18,844 |
| (2,795 | ) | -14.8 | % |
Other Non Operating Expenses |
| (8,436 | ) | (44,363 | ) | 35,927 |
| 81.0 | % | (5,898 | ) | (31,015 | ) | 25,117 |
| 81.0 | % |
Net other Non Operating Income (Expenses) |
| 14,521 |
| (17,409 | ) | 31,930 |
| 183.4 | % | 10,151 |
| (12,171 | ) | 22,322 |
| 183.4 | % |
Price Level Restatement |
| 1,940 |
| (18,082 | ) | 20,022 |
| 110.7 | % | 1,356 |
| (12,641 | ) | 13,998 |
| 110.7 | % |
Foreign Exchange Effect |
| 0 |
| 0 |
| 0 |
| 0.0 | % | 0 |
| 0 |
| 0 |
| 0.0 | % |
Net of Monetary Exposure |
| 1,940 |
| (18,082 | ) | 20,022 |
| 110.7 | % | 1,356 |
| (12,641 | ) | 13,998 |
| 110.7 | % |
Possitive Goodwill Amortization |
| (262 | ) | (9,890 | ) | 9,628 |
| 97.4 | % | (183 | ) | (6,914 | ) | 6,731 |
| 97.4 | % |
|
|
|
|
|
|
|
|
|
| ||||||||
Non Operating Income |
| (74,689 | ) | (11,008 | ) | (63,680 | ) | -578.5 | % | (52,216 | ) | (7,696 | ) | (44,520 | ) | -578.5 | % |
|
|
|
|
|
|
|
|
|
| ||||||||
Net Income b. Taxes, Min Int and Neg Goodwill Amort. |
| (7,314 | ) | 51,586 |
| (58,900 | ) | -114.2 | % | (5,113 | ) | 36,065 |
| (41,178 | ) | -114.2 | % |
|
|
|
|
|
|
|
|
|
| ||||||||
Extraordinary Items |
| 0 |
| 0 |
| 0 |
| 0.0 | % | 0 |
| 0 |
| 0 |
| 0.0 | % |
Income Tax |
| (7,003 | ) | (1,531 | ) | (5,472 | ) | -357.3 | % | (4,896 | ) | (1,071 | ) | (3,825 | ) | -357.3 | % |
Minority Interest |
| 13,463 |
| 5,840 |
| 7,623 |
| 130.5 | % | 9,413 |
| 4,083 |
| 5,330 |
| 130.5 | % |
Negative Goodwill Amortization |
| 18,485 |
| 52 |
| 18,433 |
| 35698.0 | % | 12,923 |
| 36 |
| 12,887 |
| 35698.0 | % |
|
|
|
|
|
|
|
|
|
| ||||||||
NET INCOME |
| 17,632 |
| 55,947 |
| (38,315 | ) | -68.5 | % | 12,327 |
| 39,113 |
| (26,787 | ) | -68.5 | % |
|
|
|
|
|
|
|
|
|
| ||||||||
|
| Thousand US$ |
| Million Ch$ |
| ||||||||||||
|
|
|
| ||||||||||||||
EDESUR |
| 1H 03 |
| 1H 02 |
| Var 03-02 |
| Chg % |
| 1H 03 |
| 1H 02 |
| Var 03-02 |
| Chg % |
|
|
|
|
|
|
|
|
|
| |||||||||
Revenues from Sales |
| 137,859 |
| 145,986 |
| (8,127 | ) | -5.6 | % | 96,380 |
| 102,062 |
| (5,682 | ) | -5.6 | % |
Other Operating Revenues |
| 11,206 |
| 13,039 |
| (1,833 | ) | -14.1 | % | 7,834 |
| 9,117 |
| (1,283 | ) | -14.1 | % |
|
|
|
|
|
|
|
|
|
| ||||||||
Operating Revenues |
| 149,065 |
| 159,025 |
| (9,960 | ) | -6.3 | % | 104,214 |
| 111,178 |
| (6,964 | ) | -6.3 | % |
|
|
|
|
|
|
|
|
|
| ||||||||
Energy Purchases |
| (63,826 | ) | (60,705 | ) | (3,121 | ) | -5.1 | % | (44,622 | ) | (42,440 | ) | (2,182 | ) | -5.1 | % |
Other Operating Cost |
| (68,115 | ) | (68,191 | ) | 76 |
| 0.1 | % | (47,621 | ) | (47,674 | ) | 53 |
| 0.1 | % |
|
|
|
|
|
|
|
|
|
| ||||||||
Operating Expenses |
| (131,941 | ) | (128,897 | ) | (3,044 | ) | -2.4 | % | (92,243 | ) | (90,114 | ) | (2,128 | ) | -2.4 | % |
|
|
|
|
|
|
|
|
|
| ||||||||
Selling and Administrative Expenses |
| (22,620 | ) | (23,797 | ) | 1,177 |
| 4.9 | % | (15,814 | ) | (16,638 | ) | 824 |
| 4.9 | % |
|
|
|
|
|
|
|
|
|
| ||||||||
Operating Income |
| (5,497 | ) | 6,332 |
| (11,829 | ) | -186.8 | % | (3,843 | ) | 4,426 |
| (8,269 | ) | -186.8 | % |
|
|
|
|
|
|
|
|
|
| ||||||||
Interest Income |
| 6,620 |
| 10,142 |
| (3,522 | ) | -34.7 | % | 4,629 |
| 7,091 |
| (2,462 | ) | -34.7 | % |
Interest Expenses |
| (10,563 | ) | (28,988 | ) | 18,425 |
| 63.6 | % | (7,384 | ) | (20,266 | ) | 12,882 |
| 63.6 | % |
Net Financial Income (Expenses) |
| (3,943 | ) | (18,846 | ) | 14,903 |
| 79.1 | % | (2,755 | ) | (13,175 | ) | 10,420 |
| 79.1 | % |
Equity Gains from Related Company |
| 40 |
| 18 |
| 22 |
| 122.0 | % | 28 |
| 13 |
| 15 |
| 122.0 | % |
Equity Losses from Related Company |
| 0 |
| 0 |
| 0 |
| 0.0 | % | 0 |
| 0 |
| 0 |
| 0.0 | % |
Net Income from Related Companies |
| 40 |
| 18 |
| 22 |
| 122.0 | % | 28 |
| 13 |
| 15 |
| 122.0 | % |
Other Non Operating Income |
| 317 |
| 37,729 |
| (37,412 | ) | -99.2 | % | 222 |
| 26,377 |
| (26,156 | ) | -99.2 | % |
Other Non Operating Expenses |
| (6,063 | ) | (2,447 | ) | (3,616 | ) | -147.7 | % | (4,239 | ) | (1,711 | ) | (2,528 | ) | -147.7 | % |
Net other Non Operating Income (Expenses) |
| (5,746 | ) | 35,282 |
| (41,028 | ) | -116.3 | % | (4,017 | ) | 24,667 |
| (28,683 | ) | -116.3 | % |
Price Level Restatement |
| 0 |
| 0 |
| 0 |
| 0.0 | % | 0 |
| 0 |
| 0 |
| 0.0 | % |
Foreign Exchange Effect |
| 0 |
| 0 |
| 0 |
| 0.0 | % | 0 |
| 0 |
| 0 |
| 0.0 | % |
Net of Monetary Exposure |
| 0 |
| 0 |
| 0 |
| 0.0 | % | 0 |
| 0 |
| 0 |
| 0.0 | % |
Possitive Goodwill Amortization |
| 0 |
| 0 |
| 0 |
| 0.0 | % | 0 |
| 0 |
| 0 |
| 0.0 | % |
|
|
|
|
|
|
|
|
|
| ||||||||
Non Operating Income |
| (9,648 | ) | 16,454 |
| (26,102 | ) | -158.6 | % | (6,745 | ) | 11,504 |
| (18,249 | ) | -158.6 | % |
|
|
|
|
|
|
|
|
|
| ||||||||
Net Income b. Taxes, Min Int and Neg Goodwill Amort. |
| (15,145 | ) | 22,786 |
| (37,931 | ) | -166.5 | % | (10,588 | ) | 15,930 |
| (26,518 | ) | -166.5 | % |
|
|
|
|
|
|
|
|
|
| ||||||||
Extraordinary Items |
| 0 |
| 0 |
| 0 |
| 0.0 | % | 0 |
| 0 |
| 0 |
| 0.0 | % |
Income Tax |
| (18,943 | ) | 6,646 |
| (25,589 | ) | -385.0 | % | (13,244 | ) | 4,647 |
| (17,891 | ) | -385.0 | % |
Minority Interest |
| 0 |
| 0 |
| 0 |
| 0.0 | % | 0 |
| 0 |
| 0 |
| 0.0 | % |
Negative Goodwill Amortization |
| 0 |
| 0 |
| 0 |
| 0.0 | % | 0 |
| 0 |
| 0 |
| 0.0 | % |
|
|
|
|
|
|
|
|
|
| ||||||||
NET INCOME |
| (34,088 | ) | 29,432 |
| (63,520 | ) | -215.8 | % | (23,832 | ) | 20,577 |
| (44,408 | ) | -215.8 | % |
|
|
|
|
|
|
|
|
|
| ||||||||
13
Cont. Table 3
|
| Thousand US$ |
| Million Ch$ |
| ||||||||||||
|
|
|
| ||||||||||||||
EDELNOR |
| 1H 03 |
| 1H 02 |
| Var 03-02 |
| Chg % |
| 1H 03 |
| 1H 02 |
| Var 03-02 |
| Chg % |
|
|
|
|
|
|
|
|
|
| |||||||||
Revenues from Sales |
| 144,668 |
| 137,596 |
| 7,072 |
| 5.1 | % | 101,140 |
| 96,196 |
| 4,944 |
| 5.1 | % |
Other Operating Revenues |
| 4,571 |
| 5,511 |
| (940 | ) | -17.1 | % | 3,196 |
| 3,853 |
| (657 | ) | -17.1 | % |
|
|
|
|
|
|
|
|
|
| ||||||||
Operating Revenues |
| 149,238 |
| 143,107 |
| 6,131 |
| 4.3 | % | 104,336 |
| 100,049 |
| 4,287 |
| 4.3 | % |
|
|
|
|
|
|
|
|
|
| ||||||||
Energy Purchases |
| (92,652 | ) | (86,975 | ) | (5,677 | ) | -6.5 | % | (64,775 | ) | (60,806 | ) | (3,969 | ) | -6.5 | % |
Other Operating Cost |
| (18,607 | ) | (17,193 | ) | (1,414 | ) | -8.2 | % | (13,009 | ) | (12,020 | ) | (989 | ) | -8.2 | % |
|
|
|
|
|
|
|
|
|
| ||||||||
Operating Expenses |
| (111,259 | ) | (104,168 | ) | (7,091 | ) | -6.8 | % | (77,784 | ) | (72,826 | ) | (4,958 | ) | -6.8 | % |
|
|
|
|
|
|
|
|
|
| ||||||||
Selling and Administrative Expenses |
| (13,582 | ) | (14,255 | ) | 673 |
| 4.7 | % | (9,496 | ) | (9,966 | ) | 470 |
| 4.7 | % |
|
|
|
|
|
|
|
|
|
| ||||||||
Operating Income |
| 24,397 |
| 24,684 |
| (287 | ) | -1.2 | % | 17,056 |
| 17,257 |
| (201 | ) | -1.2 | % |
|
|
|
|
|
|
|
|
|
| ||||||||
Interest Income |
| 1,558 |
| 1,862 |
| (304 | ) | -16.3 | % | 1,090 |
| 1,302 |
| (212 | ) | -16.3 | % |
Interest Expenses |
| (4,766 | ) | (5,078 | ) | 312 |
| 6.2 | % | (3,332 | ) | (3,550 | ) | 218 |
| 6.2 | % |
Net Financial Income (Expenses) |
| (3,208 | ) | (3,216 | ) | 8 |
| 0.3 | % | (2,242 | ) | (2,248 | ) | 6 |
| 0.3 | % |
Equity Gains from Related Company |
| 0 |
| 0 |
| 0 |
| 0.0 | % | 0 |
| 0 |
| 0 |
| 0.0 | % |
Equity Losses from Related Company |
| 0 |
| 0 |
| 0 |
| 0.0 | % | 0 |
| 0 |
| 0 |
| 0.0 | % |
Net Income from Related Companies |
| 0 |
| 0 |
| 0 |
| 0.0 | % | 0 |
| 0 |
| 0 |
| 0.0 | % |
Other Non Operating Income |
| 2,794 |
| 5,171 |
| (2,377 | ) | -46.0 | % | 1,954 |
| 3,615 |
| (1,662 | ) | -46.0 | % |
Other Non Operating Expenses |
| (3,926 | ) | (906 | ) | (3,020 | ) | -333.5 | % | (2,745 | ) | (633 | ) | (2,111 | ) | -333.5 | % |
Net other Non Operating Income (Expenses) |
| (1,131 | ) | 4,266 |
| (5,397 | ) | -126.5 | % | (791 | ) | 2,982 |
| (3,773 | ) | -126.5 | % |
Price Level Restatement |
| 0 |
| 0 |
| 0 |
| 0.0 | % | 0 |
| 0 |
| 0 |
| 0.0 | % |
Foreign Exchange Effect |
| 0 |
| 0 |
| 0 |
| 0.0 | % | 0 |
| 0 |
| 0 |
| 0.0 | % |
Net of Monetary Exposure |
| 0 |
| 0 |
| 0 |
| 0.0 | % | 0 |
| 0 |
| 0 |
| 0.0 | % |
Possitive Goodwill Amortization |
| 0 |
| 0 |
| 0 |
| 0.0 | % | 0 |
| 0 |
| 0 |
| 0.0 | % |
|
|
|
|
|
|
|
|
|
| ||||||||
Non Operating Income |
| (4,338 | ) | 1,050 |
| (5,388 | ) | -513.3 | % | (3,033 | ) | 734 |
| (3,767 | ) | -513.3 | % |
|
|
|
|
|
|
|
|
|
| ||||||||
Net Income b. Taxes, Min Int and Neg Goodwill Amort. |
| 20,059 |
| 25,734 |
| (5,675 | ) | -22.1 | % | 14,023 |
| 17,991 |
| (3,968 | ) | -22.1 | % |
|
|
|
|
|
|
|
|
|
| ||||||||
Extraordinary Items |
| 0 |
| 0 |
| 0 |
| 0.0 | % | 0 |
| 0 |
| 0 |
| 0.0 | % |
Income Tax |
| (7,201 | ) | (8,269 | ) | 1,068 |
| 12.9 | % | (5,034 | ) | (5,781 | ) | 747 |
| 12.9 | % |
Minority Interest |
| 0 |
| 0 |
| 0 |
| 0.0 | % | 0 |
| 0 |
| 0 |
| 0.0 | % |
Negative Goodwill Amortization |
| 0 |
| 0 |
| 0 |
| 0.0 | % | 0 |
| 0 |
| 0 |
| 0.0 | % |
|
|
|
|
|
|
|
|
|
| ||||||||
NET INCOME |
| 12,858 |
| 17,465 |
| (4,607 | ) | -26.4 | % | 8,989 |
| 12,210 |
| (3,221 | ) | -26.4 | % |
|
|
|
|
|
|
|
|
|
| ||||||||
|
| Thousand US$ |
| Million Ch$ |
| ||||||||||||
|
|
|
| ||||||||||||||
CERJ |
| 1H 03 |
| 1H 02 |
| Var 03-02 |
| Chg % |
| 1H 03 |
| 1H 02 |
| Var 03-02 |
| Chg % |
|
|
|
|
|
|
|
|
|
| |||||||||
Revenues from Sales |
| 242,361 |
| 303,954 |
| (61,593 | ) | -20.3 | % | 169,439 |
| 212,501 |
| (43,062 | ) | -20.3 | % |
Other Operating Revenues |
| 18,241 |
| 7,542 |
| 10,699 |
| 141.9 | % | 12,752 |
| 5,273 |
| 7,480 |
| 141.9 | % |
|
|
|
|
|
|
|
|
|
| ||||||||
Operating Revenues |
| 260,601 |
| 311,496 |
| (50,895 | ) | -16.3 | % | 182,192 |
| 217,774 |
| (35,582 | ) | -16.3 | % |
|
|
|
|
|
|
|
|
|
| ||||||||
Energy Purchases |
| (135,779 | ) | (141,415 | ) | 5,636 |
| 4.0 | % | (94,926 | ) | (98,866 | ) | 3,940 |
| 4.0 | % |
Other Operating Cost |
| (78,360 | ) | (96,785 | ) | 18,425 |
| 19.0 | % | (54,783 | ) | (67,664 | ) | 12,881 |
| 19.0 | % |
|
|
|
|
|
|
|
|
|
| ||||||||
Operating Expenses |
| (214,140 | ) | (238,200 | ) | 24,060 |
| 10.1 | % | (149,709 | ) | (166,530 | ) | 16,821 |
| 10.1 | % |
|
|
|
|
|
|
|
|
|
| ||||||||
Selling and Administrative Expenses |
| (7,715 | ) | (18,416 | ) | 10,701 |
| 58.1 | % | (5,394 | ) | (12,875 | ) | 7,481 |
| 58.1 | % |
|
|
|
|
|
|
|
|
|
| ||||||||
Operating Income |
| 38,746 |
| 54,880 |
| (16,134 | ) | -29.4 | % | 27,088 |
| 38,369 |
| (11,281 | ) | -29.4 | % |
|
|
|
|
|
|
|
|
|
| ||||||||
Interest Income |
| 10,960 |
| 635 |
| 10,325 |
| 1625.8 | % | 7,662 |
| 444 |
| 7,218 |
| 1625.8 | % |
Interest Expenses |
| (33,783 | ) | (35,041 | ) | 1,258 |
| 3.6 | % | (23,619 | ) | (24,498 | ) | 879 |
| 3.6 | % |
Net Financial Income (Expenses) |
| (22,823 | ) | (34,406 | ) | 11,583 |
| 33.7 | % | (15,957 | ) | (24,054 | ) | 8,097 |
| 33.7 | % |
Equity Gains from Related Company |
| 0 |
| 0 |
| 0 |
| 0.0 | % | 0 |
| 0 |
| 0 |
| 0.0 | % |
Equity Losses from Related Company |
| (3,487 | ) | (1,840 | ) | (1,647 | ) | -89.6 | % | (2,438 | ) | (1,286 | ) | (1,152 | ) | -89.6 | % |
Net Income from Related Companies |
| (3,487 | ) | (1,840 | ) | (1,647 | ) | -89.6 | % | (2,438 | ) | (1,286 | ) | (1,152 | ) | -89.6 | % |
Other Non Operating Income |
| 3,937 |
| 120,778 |
| (116,841 | ) | -96.7 | % | 2,753 |
| 84,438 |
| (81,686 | ) | -96.7 | % |
Other Non Operating Expenses |
| (128,724 | ) | (32,150 | ) | (96,574 | ) | -300.4 | % | (89,994 | ) | (22,477 | ) | (67,517 | ) | -300.4 | % |
Net other Non Operating Income (Expenses) |
| (124,787 | ) | 88,628 |
| (213,415 | ) | -240.8 | % | (87,241 | ) | 61,962 |
| (149,203 | ) | -240.8 | % |
Price Level Restatement |
| 0 |
| 0 |
| 0 |
| 0.0 | % | 0 |
| 0 |
| 0 |
| 0.0 | % |
Foreign Exchange Effect |
| 0 |
| 0 |
| 0 |
| 0.0 | % | 0 |
| 0 |
| 0 |
| 0.0 | % |
Net of Monetary Exposure |
| 0 |
| 0 |
| 0 |
| 0.0 | % | 0 |
| 0 |
| 0 |
| 0.0 | % |
Possitive Goodwill Amortization |
| 0 |
| 0 |
| 0 |
| 0.0 | % | 0 |
| 0 |
| 0 |
| 0.0 | % |
|
|
|
|
|
|
|
|
|
| ||||||||
Non Operating Income |
| (151,097 | ) | 52,382 |
| (203,479 | ) | -388.4 | % | (105,635 | ) | 36,622 |
| (142,257 | ) | -388.4 | % |
|
|
|
|
|
|
|
|
|
| ||||||||
Net Income b. Taxes, Min Int and Neg Goodwill Amort. |
| (112,351 | ) | 107,262 |
| (219,613 | ) | -204.7 | % | (78,547 | ) | 74,991 |
| (153,538 | ) | -204.7 | % |
|
|
|
|
|
|
|
|
|
| ||||||||
Extraordinary Items |
| 0 |
| 0 |
| 0 |
| 0.0 | % | 0 |
| 0 |
| 0 |
| 0.0 | % |
Income Tax |
| (1,448 | ) | 17,838 |
| (19,286 | ) | -108.1 | % | (1,012 | ) | 12,471 |
| (13,483 | ) | -108.1 | % |
Minority Interest |
| 0 |
| 0 |
| 0 |
| 0.0 | % | 0 |
| 0 |
| 0 |
| 0.0 | % |
Negative Goodwill Amortization |
| 0 |
| 0 |
| 0 |
| 0.0 | % | 0 |
| 0 |
| 0 |
| 0.0 | % |
|
|
|
|
|
|
|
|
|
| ||||||||
NET INCOME |
| (113,798 | ) | 125,100 |
| (238,898 | ) | -191.0 | % | (79,559 | ) | 87,462 |
| (167,021 | ) | -191.0 | % |
|
|
|
|
|
|
|
|
|
| ||||||||
14
Cont. Table 3
|
| Thousand US$ |
| Million Ch$ |
| ||||||||||||
|
|
|
| ||||||||||||||
COELCE |
| 1H 03 |
| 1H 02 |
| Var 03-02 |
| Chg % |
| 1H 03 |
| 1H 02 |
| Var 03-02 |
| Chg % |
|
|
|
|
|
|
|
|
|
| |||||||||
Revenues from Sales |
| 157,057 |
| 174,813 |
| (17,756 | ) | -10.2 | % | 109,802 |
| 122,215 |
| (12,414 | ) | -10.2 | % |
Other Operating Revenues |
| 2,679 |
| 3,320 |
| (641 | ) | -19.3 | % | 1,873 |
| 2,321 |
| (448 | ) | -19.3 | % |
|
|
|
|
|
|
|
|
|
| ||||||||
Operating Revenues |
| 159,737 |
| 178,133 |
| (18,397 | ) | -10.3 | % | 111,675 |
| 124,537 |
| (12,862 | ) | -10.3 | % |
|
|
|
|
|
|
|
|
|
| ||||||||
Energy Purchases |
| (62,077 | ) | (71,776 | ) | 9,699 |
| 13.5 | % | (43,399 | ) | (50,180 | ) | 6,781 |
| 13.5 | % |
Other Operating Cost |
| (53,125 | ) | (51,169 | ) | (1,956 | ) | -3.8 | % | (37,141 | ) | (35,773 | ) | (1,368 | ) | -3.8 | % |
|
|
|
|
|
|
|
|
|
| ||||||||
Operating Expenses |
| (115,202 | ) | (122,945 | ) | 7,743 |
| 6.3 | % | (80,540 | ) | (85,953 | ) | 5,413 |
| 6.3 | % |
|
|
|
|
|
|
|
|
|
| ||||||||
Selling and Administrative Expenses |
| (23,498 | ) | (30,104 | ) | 6,606 |
| 21.9 | % | (16,428 | ) | (21,046 | ) | 4,618 |
| 21.9 | % |
|
|
|
|
|
|
|
|
|
| ||||||||
Operating Income |
| 21,037 |
| 25,084 |
| (4,049 | ) | -16.1 | % | 14,707 |
| 17,538 |
| (2,831 | ) | -16.1 | % |
|
|
|
|
|
|
|
|
|
| ||||||||
Interest Income |
| 18,589 |
| 13,901 |
| 4,688 |
| 33.7 | % | 12,996 |
| 9,718 |
| 3,278 |
| 33.7 | % |
Interest Expenses |
| (26,667 | ) | (20,661 | ) | (6,006 | ) | -29.1 | % | (18,643 | ) | (14,445 | ) | (4,199 | ) | -29.1 | % |
Net Financial Income (Expenses) |
| (8,078 | ) | (6,760 | ) | (1,318 | ) | -19.5 | % | (5,647 | ) | (4,726 | ) | (921 | ) | -19.5 | % |
Equity Gains from Related Company |
| 0 |
| 0 |
| 0 |
| 0.0 | % | 0 |
| 0 |
| 0 |
| 0.0 | % |
Equity Losses from Related Company |
| 0 |
| 0 |
| 0 |
| 0.0 | % | 0 |
| 0 |
| 0 |
| 0.0 | % |
Net Income from Related Companies |
| 0 |
| 0 |
| 0 |
| 0.0 | % | 0 |
| 0 |
| 0 |
| 0.0 | % |
Other Non Operating Income |
| 1,242 |
| 13,834 |
| (12,592 | ) | -91.0 | % | 868 |
| 9,672 |
| (8,803 | ) | -91.0 | % |
Other Non Operating Expenses |
| (29,419 | ) | (2,054 | ) | (27,364 | ) | -1332.0 | % | (20,567 | ) | (1,436 | ) | (19,131 | ) | -1332.0 | % |
Net other Non Operating Income (Expenses) |
| (28,177 | ) | 11,779 |
| (39,956 | ) | -339.2 | % | (19,699 | ) | 8,235 |
| (27,934 | ) | -339.2 | % |
Price Level Restatement |
| 0 |
| 0 |
| 0 |
| 0.0 | % | 0 |
| 0 |
| 0 |
| 0.0 | % |
Foreign Exchange Effect |
| 0 |
| 0 |
| 0 |
| 0.0 | % | 0 |
| 0 |
| 0 |
| 0.0 | % |
Net of Monetary Exposure |
| 0 |
| 0 |
| 0 |
| 0.0 | % | 0 |
| 0 |
| 0 |
| 0.0 | % |
Possitive Goodwill Amortization |
| 0 |
| 0 |
| 0 |
| 0.0 | % | 0 |
| 0 |
| 0 |
| 0.0 | % |
|
|
|
|
|
|
|
|
|
| ||||||||
Non Operating Income |
| (36,255 | ) | 5,019 |
| (41,274 | ) | -822.4 | % | (25,346 | ) | 3,509 |
| (28,855 | ) | -822.4 | % |
|
|
|
|
|
|
|
|
|
| ||||||||
Net Income b. Taxes, Min Int and Neg Goodwill Amort. |
| (15,218 | ) | 30,105 |
| (45,323 | ) | -150.6 | % | (10,639 | ) | 21,047 |
| (31,686 | ) | -150.6 | % |
|
|
|
|
|
|
|
|
|
| ||||||||
Extraordinary Items |
| 0 |
| 0 |
| 0 |
| 0.0 | % | 0 |
| 0 |
| 0 |
| 0.0 | % |
Income Tax |
| (3,953 | ) | (9,711 | ) | 5,758 |
| 59.3 | % | (2,764 | ) | (6,789 | ) | 4,026 |
| 59.3 | % |
Minority Interest |
| 0 |
| 0 |
| 0 |
| 0.0 | % | 0 |
| 0 |
| 0 |
| 0.0 | % |
Negative Goodwill Amortization |
| 0 |
| 0 |
| 0 |
| 0.0 | % | 0 |
| 0 |
| 0 |
| 0.0 | % |
|
|
|
|
|
|
|
|
|
| ||||||||
NET INCOME |
| (19,171 | ) | 20,393 |
| (39,564 | ) | -194.0 | % | (13,403 | ) | 14,257 |
| (27,660 | ) | -194.0 | % |
|
|
|
|
|
|
|
|
|
| ||||||||
|
| Thousand US$ |
| Million Ch$ |
| ||||||||||||
|
|
|
| ||||||||||||||
CODENSA |
| 1H 03 |
| 1H 02 |
| Var 03-02 |
| Chg % |
| 1H 03 |
| 1H 02 |
| Var 03-02 |
| Chg % |
|
|
|
|
|
|
|
|
|
| |||||||||
Revenues from Sales |
| 185,582 |
| 216,349 |
| (30,767 | ) | -14.2 | % | 129,744 |
| 151,254 |
| (21,510 | ) | -14.2 | % |
Other Operating Revenues |
| 33,600 |
| 27,358 |
| 6,241 |
| 22.8 | % | 23,490 |
| 19,127 |
| 4,364 |
| 22.8 | % |
|
|
|
|
|
|
|
|
|
| ||||||||
Operating Revenues |
| 219,181 |
| 243,707 |
| (24,526 | ) | -10.1 | % | 153,234 |
| 170,381 |
| (17,147 | ) | -10.1 | % |
|
|
|
|
|
|
|
|
|
| ||||||||
Energy Purchases |
| (113,745 | ) | (123,974 | ) | 10,230 |
| 8.3 | % | (79,521 | ) | (86,673 | ) | 7,152 |
| 8.3 | % |
Other Operating Cost |
| (82,145 | ) | (76,643 | ) | (5,503 | ) | -7.2 | % | (57,429 | ) | (53,582 | ) | (3,847 | ) | -7.2 | % |
|
|
|
|
|
|
|
|
|
| ||||||||
Operating Expenses |
| (195,890 | ) | (200,617 | ) | 4,727 |
| 2.4 | % | (136,950 | ) | (140,255 | ) | 3,305 |
| 2.4 | % |
|
|
|
|
|
|
|
|
|
| ||||||||
Selling and Administrative Expenses |
| (14,745 | ) | (19,312 | ) | 4,567 |
| 23.6 | % | (10,309 | ) | (13,501 | ) | 3,192 |
| 23.6 | % |
|
|
|
|
|
|
|
|
|
| ||||||||
Operating Income |
| 8,546 |
| 23,777 |
| (15,231 | ) | -64.1 | % | 5,975 |
| 16,625 |
| (10,650 | ) | -64.1 | % |
|
|
|
|
|
|
|
|
|
| ||||||||
Interest Income |
| 5,047 |
| 9,592 |
| (4,545 | ) | -47.4 | % | 3,528 |
| 6,706 |
| (3,178 | ) | -47.4 | % |
Interest Expenses |
| (2,817 | ) | (1,421 | ) | (1,395 | ) | -98.1 | % | (1,969 | ) | (994 | ) | (976 | ) | -98.1 | % |
Net Financial Income (Expenses) |
| 2,230 |
| 8,171 |
| (5,941 | ) | -72.7 | % | 1,559 |
| 5,712 |
| (4,153 | ) | -72.7 | % |
Equity Gains from Related Company |
| 0 |
| 0 |
| 0 |
| 0.0 | % | 0 |
| 0 |
| 0 |
| 0.0 | % |
Equity Losses from Related Company |
| 0 |
| 0 |
| 0 |
| 0.0 | % | 0 |
| 0 |
| 0 |
| 0.0 | % |
Net Income from Related Companies |
| 0 |
| 0 |
| 0 |
| 0.0 | % | 0 |
| 0 |
| 0 |
| 0.0 | % |
Other Non Operating Income |
| 593 |
| 1,407 |
| (814 | ) | -57.9 | % | 414 |
| 983 |
| (569 | ) | -57.9 | % |
Other Non Operating Expenses |
| (3,580 | ) | (6,697 | ) | 3,117 |
| 46.5 | % | (2,503 | ) | (4,682 | ) | 2,179 |
| 46.5 | % |
Net other Non Operating Income (Expenses) |
| (2,988 | ) | (5,290 | ) | 2,303 |
| 43.5 | % | (2,089 | ) | (3,699 | ) | 1,610 |
| 43.5 | % |
Price Level Restatement |
| 0 |
| 0 |
| 0 |
| 0.0 | % | 0 |
| 0 |
| 0 |
| 0.0 | % |
Foreign Exchange Effect |
| 0 |
| 0 |
| 0 |
| 0.0 | % | 0 |
| 0 |
| 0 |
| 0.0 | % |
Net of Monetary Exposure |
| 0 |
| 0 |
| 0 |
| 0.0 | % | 0 |
| 0 |
| 0 |
| 0.0 | % |
Possitive Goodwill Amortization |
| 0 |
| 0 |
| 0 |
| 0.0 | % | 0 |
| 0 |
| 0 |
| 0.0 | % |
|
|
|
|
|
|
|
|
|
| ||||||||
Non Operating Income |
| (758 | ) | 2,880 |
| (3,638 | ) | -126.3 | % | (530 | ) | 2,014 |
| (2,543 | ) | -126.3 | % |
|
|
|
|
|
|
|
|
|
| ||||||||
Net Income b. Taxes, Min Int and Neg Goodwill Amort. |
| 7,789 |
| 26,660 |
| (18,871 | ) | -70.8 | % | 5,445 |
| 18,639 |
| (13,193 | ) | -70.8 | % |
|
|
|
|
|
|
|
|
|
| ||||||||
Extraordinary Items |
| 0 |
| 0 |
| 0 |
| 0.0 | % | 0 |
| 0 |
| 0 |
| 0.0 | % |
Income Tax |
| (9,885 | ) | (12,445 | ) | 2,560 |
| 20.6 | % | (6,911 | ) | (8,701 | ) | 1,790 |
| 20.6 | % |
Minority Interest |
| 0 |
| 0 |
| 0 |
| 0.0 | % | 0 |
| 0 |
| 0 |
| 0.0 | % |
Negative Goodwill Amortization |
| 0 |
| 0 |
| 0 |
| 0.0 | % | 0 |
| 0 |
| 0 |
| 0.0 | % |
|
|
|
|
|
|
|
|
|
| ||||||||
NET INCOME |
| (2,097 | ) | 14,215 |
| (16,311 | ) | -114.7 | % | (1,466 | ) | 9,938 |
| (11,404 | ) | -114.7 | % |
|
|
|
|
|
|
|
|
|
| ||||||||
15
Distribution business, in Chile, Chilectra, and mainly as consequence of the accounting effects from applying the Technical Bulletin 64, recorded a Net Income of US$ 18 million, compared to the Net Income of US$ 56 million obtained during the same period of year 2002. Main variations are described as follows:
• | Higher Operating Income of US$ 5 million, due to higher energy sales of US$ 10 million, and lower SG&A expenses of US$ 2 million, compensated by higher energy cost of US$ 8 million. |
• | Lower Non-Operating Income of US$ 64 million, mainly due to higher net losses from related companies of US$ 119 million from Cerj, Edesur, Distrilec Inversora, Luz de Bogotá, and Inversiones Distrilima, and higher net financial expenses of US$ 6 million. This was partially compensated by Brazilian and Argentinean contingency provisions accounted in 2002 of USS$ 39 million, and higher price level restatement of US$ 20 million. |
• | Higher Tax payment of US$ 5 million. |
• | Higher positive Minority Interest of US$ 8 million. |
• | Higher negative goodwill amortization of US$ 18 million, related to the acquisition of Cerj’s shares during the month of June. This negative goodwill accounted from Cerj was completely amortized during this period. |
In Argentina, Edesur booked a Net Loss of US$ 34 million; this is US$ 64 million lower than the same period of last year. This lower result is basically due to the economic downturn of the country, and mainly explained by:
• | Higher Operating Losses of US$ 12 million, mainly due to lower revenues on Energy Sales and services of US$ 10 million and higher energy purchases of US$ 3 million, compensated by lower SG&A expenses of US$ 1 million. |
• | Higher Non-Operating Losses of US$ 26 million, basically explained by higher negative conversion effect of US$ 38 million as result of the Argentinean Peso appreciation due to the Technical Bulletin N°64 of Chilean Accounting Principles. This was partially compensated by lower net financial expenses of US$ 15 million. |
• | Higher Tax payment of US$ 26 million. |
In Peru, our subsidiary Edelnor registered a Net Income of US$ 13 million, this is US$ 5 million lower compared to June 2002. This result can be mainly explained by:
• | Lower Operating Income of US$ 0.3 million, related to higher energy sales of 7 million, compensated by higher energy purchases of US$ 6 million. |
• | Lower Non-Operating Income of US$ 5 million, related to higher negative conversion effect as a result of the Peruvian Peso depreciation due to Technical Bulletin N°64 of Chilean Accounting Principles. |
• | Lower tax payment of US$ 1 million. |
In Brazil, Cerj recorded a Net Loss of US$ 114 million as of June 30, 2003, US$ 239 million lower than June 2002. This is primarily due to:
• | Lower Operating Income of US$ 16 million. This mainly related to a negative effect of US$ 62 million coming from applying technical bulletin 64. Compensated through: |
• | Higher electric grid maintenance revenues of US$ 11 million |
• | Lower SG&A expenses of US$ 11 million |
16
• | Lower operating and maintenance cost and third party services of US$ 8 million |
• | Lower labor cost of US$ 6 million |
• | Lower energy purchases of US$ 6 million, and |
• | Lower depreciation and amortization expenses of US$ 4 million. |
• | Lower Non-Operating Income of US$ 203 million, mainly due to higher negative conversion effect as result of the Brazilian Reais apreciation due to Technical Bulletin N°64 of Chilean Accounting Principles of US$ 187 million. This line was also affected by higher costs made by the adjustment of Cerj’s contract with Cien – Enertrade set by the authority in US$ 10 million. Another factor was a adjustment related to brazilian UFIR (fiscal reference unit), accounted for US$ 9 million, and higher legal contingency and suits provisions of US$ 7 million. This figure was partially compensated by lower net financial expenses of US$ 12 million. |
• | Higher tax payment of US$ 19 million. |
In the case of Coelce, this subsidiary registered a Net Loss of US$ 19 million as of June 2003, that is US$ 40 million lower than the June 2002. This result, is mainly due to:
• | Lower Operating Income of US$ 4 million, mainly due to lower energy sales of US$ 18 million, and higher depreciation and amortization expenses of US$ 2 million. This figure was partially compensated by lower energy purchases of US$ 10 million, and lower SG&A expenses of US$ 7 million. |
• | Lower Non-Operating Income of US$ 41 million, mainly explained by higher negative conversion effect as a result of the Brazilian Reais apreciation due to Technical Bulletin N°64 of Chilean Accounting Principles of US$ 39 million. |
• | Lower Tax payment of US$ 6 million. |
In Colombia, Codensa registered a Net Loss of US$ 2 million for the first half ended June 30, 2003. This figure represents US$ 16 million reduction compare to year 2002. This is primarily attributable to:
• | Lower Operating Income of US$ 15 million, primarily explained by lower energy sales of US$ 31 million, higher depreciation and amortization expenses of US$ 3 million, and higher labor cost of US$ 2 million. Lower energy purchases of US$ 10 million, higher electric grid maintenance revenues of US$ 6 million and lower SG&A expenses of US$ 5 million compensated this figure. |
• | Lower Non-Operating Income of US$ 4 million, higher negative conversion effect registered as a result of the Colombian Peso depreciation basically due to Technical Bulletin N°64 of Chilean Accounting Principles of US$ 3 million. |
• | Lower Tax payment of US$ 3 million. |
17
Non operating income registered a loss of US$ 310 million, which represents a higher loss of US$ 27 million over the US$ 283 million booked as of June 2002.
This is mainly explained by the recognition of losses due to the conversion under the Technical Bulletin 64 corresponding to our subsidiaries in Argentina and Brazil. This was originated by the appreciation of the Argentinean Peso and the Brazilian Real against the US dollar. This was, somewhat compensated by higher profits from investments in related companies, specifically in CIEN. Additionally compensated by lower financial expenses due to lower indebtedness, decrease in the amortization of goodwill, as consequence of the write off carried out in December on our investments in Argentina and Brazil and also better net profits from the exchange differences and the price level restatement in the period.
Net Financial Result shows a decrease of US$ 30 million, going from a net expenditure of US$ 271 million down to a net expenditure of US$ 241 million, last June. This 11% decrease is the combined result of debt decrease and lower interest rates in the international markets.
Profit on Investments in Related Companies increased by US$ 36 million. This is mainly due to profits of our related company CIEN, in which a higher profit for US$ 24 million is recognized, as well as the effects derived from exchange rate variation in related companies of our subsidiary Endesa Chile.
Positive Goodwill Amortization shows a 35% of lower loss equivalent to US$ 21 million. This lower loss is a result of the write off carried out in December of 2002, corresponding to the total positive goodwill of our investments located in Argentina and Brazil.
Net Other Non-operating Income shows a negative variation of US$ 135 million. The main reasons of this variation are:
• | Higher losses for US$ 258 million from the conversion adjustment to Chilean regulations, originated by the application of the Technical Bulletin N°64, mainly of the subsidiaries in Brazil and Argentina. This has resulted from the appreciation of the Brazilian Real and the Argentinean Peso against the US dollar and their impact in the monetary assets and liabilities structure. |
• | Higher expenses for taxes and fines, US$ 8 million. |
• | Expenditure for updating of pensions and taxes COMF Brazil, US$ 10 million |
• | Lower profit in forwards, US$ 1 million. |
This was partially compensated by:
• | Profits before taxes made on sales of Río Maipo and Infraestructura 2000 for US$ 127 million. |
• | Lower provisions for contingencies and suits, US$ 38 million. |
• | Profit for re-liquidating power in the SIC (Chile), US$ 5 million. |
18
Price-level Restatement and Exchange Differences show a US$ 22 million net profit. This is basically related to the effects of the nominal valuation of the Chilean peso against the dollar by 2.7% at June 30, 2003, compared to the nominal devaluation of 5.1% as of June 2002. These effects were compensated to a large extent by the company exchange insurance contracts.
Income Tax and Deferred Taxes increased by US$ 47 million. This is mainly explained by an increase of US$ 10 million Income Tax and a loss due to the effect of deferred taxes for US$ 37 million. In the income tax variation, the sale of Río Maipo for US$ 23 million is compensated by the tax decrease in Cerj and Coelce.
Negative Goodwill Amortization shows a higher benefit of US$ 27 million that corresponds to the speeding up the higher value generated by the investment carried out in January of the year 2003 in Cerj for US$ 49 million. This was partially compensated by lower amortization as result of the write off made in the Positive goodwill of our investments located in Argentina and Brazil.
As of March 31, 2003, in consolidated terms, a 33% of the total debt was referred to variable indexes (mainly Libor US$ and Chilean TAB), while a 67% had a fixed and protected debt. As of June 30, 2003, debt linked to variable rate was 29% of the total debt, while the fixed and protected debt represented a 71%.
During this quarter, there were interest rate swaps operations for a total amount of US$ 290 million.
The company manages the interest rate risk leading its debt structure in the long term, towards a convenient combination of debts with fixed and variable interest rates.
Specifically in Argentina, most of the debt is linked to Libor. Within the context of constant fall that such rate has experienced, it was decided to keep a high percentage of variable debt, despite the same rate could have been kept to have an important reduction in financial expenses. In Brazil, given the fact that tariffs are updated in agreement with a price index that is correlated with the local interest rate evolution, it was decided to keep most of the debt with a variable interest rate.
The exchange rate risk exposure of the company is derived from the assets and liabilities denominated in foreign currency, most of which are in dollars.
At closing on March 31 of the year 2003, Enersis had in consolidated terms a 70% of its total debt expressed in dollars. Having in mind the forwards position Dollar/CLP, the debt in dollars weight was a 63%.
At of June 30, 2003, the proportion of the debt denominated in US dollars was 82%. Considering the forwards policy Dollar/CLP mentioned later on, this percentage is reduced to 77%.
The fact that most of our debt is expressed in US dollars is because an important part of our income is linked to that currency, either directly or indirectly. So, the tariffs in most of the countries in which we operate are linked in an important proportion to the dollar evolution, in which Chile and Peru are outstanding. In countries where indexation is lower, our companies take financing with a larger proportion in local currency.
19
In the case of Generation subsidiaries, concerning the operating income, a large amount of Central Costanera’s income come from exports to Brazil with contracts that are indexed to the dollar. Cachoeira Dourada (in Brazil) does not have tariffs indexed to the dollar, so its income is in local currency indexed to inflation. On the other hand, although the contracts of El Chocón are expressed in dollars, they are currently paid in Argentinean pesos. In Colombia, contracts are to the spot market and short term, which follow the exchange fluctuation of the dollar to a large extent. In Chile and Peru, the tariff process and the contracts are indexed to the dollar exchange rate.
In Argentina, Costanera has been benefited by the export contracts in dollars through the related company CIEN, which minimizes the risk in front of new devaluation in such country. On the other hand in Brazil, since the income and costs are in local currency, without indexing to foreign currency and the company does not have a significant debt (which would cause it financial expenses in dollars), there is no significant risk regarding the type of change. In Chile, operating costs have not been affected by variations of the exchange rate due to the high generation of hydraulic energy in the last two years. Concerning our subsidiaries abroad, they behave similarly considering that they are mainly hydraulic plants. Even though, Costanera in Argentina, is a thermal company, the Natural Gas input is currently expressed in Argentinean pesos.
For Distribution subsidiaries, Edesur, in Argentina, among other distributors, are under contract established in dollars and indexed to indicators of American inflation. However, the Emergency Law issued in January 2002, turned the tariffs into pesos and has kept them frozen, being this reason why the companies have had to absorb the effects of devaluation and inflation without any compensation. Within the framework of the re-negotiation process that is taking place among the government and the companies, the conditions under which the tariffs will be ruled in the future must be established. In Brazil, tariffs are indexed to the General Index of Market Prices. In Colombia the Distribution Added Tax (DAT) is adjusted according to the Price Index to the Producer every time this generates any variation that goes beyond 3% in any of its components.
Currently, the exchange rate risk is managed under a consolidated basis. The policy of the company is to hedge between 70 to 85% of our accounting exposure.
In the case of Chile, the risk to exposure depends upon the fluctuation of the exchange rates in which assets and liabilities of the company are kept. For accounting purposes our results are also affected by the Technical Bulletin N° 64 contents. Under this Chilean accounting standard, debts in foreign currency that financed investments in countries that were “unstable in currency” are fit with their corresponding investments, and the variations of the dollar against the Chilean peso of such fit debts are not reflected in profits.
The exchange exposure present between the Chilean peso and the dollar is managed by means of the use of financial derived instruments, basically forwards Dollar/CLP, with which the exchange risk is covered.
At closing of June 30 of the year 2003, in consolidated terms Forward Dollar/CLP were contracted for US$ 376 million, while at March 31 of the year 2003 such exposure amounted to US$ 626 million. This decrease is basically explained by the accounting and financial exposure decrease because an important part of the funds coming from the enhancement of capital and the assets sales have been kept in USD, which will be vested for debt prepayment.
In Argentina, the generation subsidiaries have their debts in dollars, since their operative flows are related to that currency in a high percentage. The Edesur partnership has its debts mainly in dollars, since until the issuance of the emergency law its tariffs were indexed to such currency. From that moment on, the restrictions present and the volatility in the local financial market have prevented a foreign currency risk management, so that it keeps its exposure to dollar up to date. On the other hand in Brazil, our generation subsidiary does not have dollar exposure because of its small debt, which is in Reales. In the Distribution subsidiaries, the companies have originally indebted with third parties in local currency. Only Cerj has received cross-company financing in dollars, therefore a policy of foreign currency coverage was established, leading to establishing a dollar exposure around 20% of its total debt.
20
MAIN OPERATING FIGURES IN THE GENERATION BUSINESS
Table 4
|
|
|
| GWh Sold |
|
|
|
|
| Market Share |
| ||||
|
|
|
|
|
|
|
|
|
| ||||||
Country |
| Market |
| 1H 03 |
| 1H 02 |
| Var 03-02 |
| Chg% |
| 1H 03 |
| 1H 02 |
|
|
|
|
|
|
|
|
| ||||||||
Chile |
| SIC&SING |
| 9,290 |
| 8,677 |
| 613 |
| 7.1 | % | 44.2 | % | 42.6 | % |
|
|
|
|
|
|
|
|
| |||||||
Argentina |
| SIN |
| 4,244 |
| 4,046 |
| 198 |
| 4.9 | % | 9.2 | % | 8.7 | % |
|
|
|
|
|
|
|
|
| |||||||
Chocón |
|
|
| 2,434 |
| 1,291 |
| 1,143 |
| 88.5 | % |
|
|
|
|
Costanera |
|
|
| 1,810 |
| 2,755 |
| (945 | ) | (34.3 | %) |
|
|
|
|
|
|
|
|
|
|
|
|
| |||||||
Perú |
| SICN |
| 2,409 |
| 2,161 |
| 248 |
| 11.5 | % | 23.6 | % | 22.9 | % |
|
|
|
|
|
|
|
|
| |||||||
Edegel |
|
|
| 2,409 |
| 2,161 |
| 248 |
| 11.5 | % |
|
|
|
|
|
|
|
|
|
|
|
|
| |||||||
Colombia |
| SIN |
| 7,017 |
| 7,713 |
| (696 | ) | (9.0 | %) | 21.0 | % | 24.3 | % |
|
|
|
|
|
|
|
|
| |||||||
Betania |
|
|
| 1,198 |
| 1,171 |
| 27 |
| 2.3 | % |
|
|
|
|
Emgesa |
|
|
| 5,819 |
| 6,542 |
| (723 | ) | (11.1 | %) |
|
|
|
|
|
|
|
|
|
|
|
|
|
|
| |||||
Brazil |
| SICN |
| 1,679 |
| 1,777 |
| (98 | ) | (5.5 | %) | 1.1 | % | 0.6 | % |
|
|
|
|
|
|
|
|
| |||||||
Cachoeira |
|
|
| 1,679 |
| 1,777 |
| (98 | ) | (5.5 | %) |
|
|
|
|
|
|
|
|
|
|
|
|
|
|
|
| ||||
Total |
|
|
| 24,639 |
| 24,374 |
| 265 |
| 1.1 | % |
|
|
|
|
|
|
|
|
|
|
|
|
|
|
|
| ||||
Table 5
|
| GWh produced |
|
|
|
|
| ||
|
|
|
|
|
|
| |||
Company |
| 1H 03 |
| 1H 02 |
| Var 03-02 |
| Chg % |
|
|
|
|
|
| |||||
Chilean Companies |
| 8,534 |
| 7,874 |
| 660 |
| 8.4 | % |
Chocón |
| 2,113 |
| 1,263 |
| 850 |
| 67.3 | % |
Costanera |
| 1,433 |
| 2,301 |
| (868 | ) | (37.7 | %) |
Edegel |
| 2,444 |
| 2,223 |
| 221 |
| 9.9 | % |
Betania |
| 697 |
| 843 |
| (146 | ) | (17.3 | %) |
Emgesa |
| 4,380 |
| 4,530 |
| (150 | ) | (3.3 | %) |
Cachoeira |
| 1,028 |
| 1,014 |
| 14 |
| 1.4 | % |
|
|
|
|
|
| ||||
TOTAL |
| 20,629 |
| 20,048 |
| (581 | ) | (2.9 | %) |
|
|
|
|
|
| ||||
21
MAIN OPERATING FIGURES IN THE DISTRIBUTION BUSINESS
Table 6
Company |
| Customers (Th) |
| Customers (Th) |
| Var 03-02 |
| Chg % |
|
|
|
|
|
| |||||
Chilectra |
| 1,325 |
| 1,301 |
| 24 |
| 1.8 | % |
Cerj |
| 1,757 |
| 1,757 |
| — |
| 0.0 | % |
Coelce |
| 2,210 |
| 2,107 |
| 103 |
| 4.9 | % |
Codensa |
| 1,940 |
| 1,879 |
| 61 |
| 3.2 | % |
Edelnor |
| 886 |
| 866 |
| 20 |
| 2.3 | % |
Edesur |
| 2,101 |
| 2,090 |
| 11 |
| 0.5 | % |
|
|
|
|
|
| ||||
Total |
| 10,219 |
| 10,000 |
| 219 |
| 2.2 | % |
|
|
|
|
|
|
Company |
| GWh sold |
| GWh sold |
| Var 03-02 |
| Chg % |
|
|
|
|
|
| |||||
Chilectra |
| 5,103 |
| 4,840 |
| 263 |
| 5.4 | % |
Cerj |
| 3,854 |
| 3,553 |
| 301 |
| 8.5 | % |
Coelce |
| 2,802 |
| 2,589 |
| 213 |
| 8.2 | % |
Codensa |
| 4,512 |
| 4,456 |
| 56 |
| 1.3 | % |
Edelnor |
| 1,977 |
| 1,925 |
| 52 |
| 2.7 | % |
Edesur |
| 6,231 |
| 6,071 |
| 160 |
| 2.6 | % |
|
|
|
|
|
| ||||
Total |
| 24,479 |
| 23,434 |
| 1,045 |
| 4.5 | % |
|
|
|
|
|
|
Company |
| Clients/Employee |
| Clients/Employee |
| Var 03-02 |
| Chg % |
|
|
|
|
|
| |||||
Chilectra |
| 1,818 |
| 1,815 |
| 3 |
| 0.2 | % |
Cerj |
| 1,167 |
| 1,216 |
| (48 | ) | (4.0 | %) |
Coelce |
| 1,600 |
| 1,488 |
| 112 |
| 7.5 | % |
Codensa |
| 2,307 |
| 2,291 |
| 15 |
| 0.7 | % |
Edelnor |
| 1,574 |
| 1,424 |
| 149 |
| 10.5 | % |
Edesur |
| 935 |
| 925 |
| 11 |
| 1.2 | % |
|
|
|
|
|
| ||||
Total |
| 1,407 |
| 1,361 |
| 46 |
| 3.4 | % |
|
|
|
|
|
|
22
Cont. Table 6
Company |
| Energy Losses % (*) |
| Energy Losses % (*) |
| Var 03-02 |
|
|
|
|
| ||||
Chilectra (%) |
| 5.6 | % | 5.8 | % | (0.002 | ) |
Chilectra (GWh) |
| 610 |
| 593 |
| 17 |
|
|
|
|
|
| |||
Cerj (%) |
| 23.1 | % | 23.9 | % | (0.008 | ) |
Cerj (GWh) |
| 2,189 |
| 1,999 |
| 190 |
|
|
|
|
|
| |||
Coelce (%) |
| 12.9 | % | 13.6 | % | (0.007 | ) |
Coelce (GWh) |
| 860 |
| 795 |
| 65 |
|
|
|
|
|
| |||
Codensa (%) |
| 10.3 | % | 10.6 | % | (0.003 | ) |
Codensa (GWh) |
| 1,047 |
| 1,056 |
| (9 | ) |
|
|
|
|
| |||
Edelnor (%) |
| 8.4 | % | 8.7 | % | (0.003 | ) |
Edelnor (GWh) |
| 360 |
| 360 |
| — |
|
|
|
|
|
| |||
Edesur (%) |
| 11.8 | % | 10.6 | % | 0.012 |
|
Edesur (GWh) |
| 1,653 |
| 1,465 |
| 188 |
|
|
|
|
|
| |||
Weighted Average Losses |
| 12.1 | % | 12.0 | % | 0.001 |
|
|
|
|
|
|
(*) | Energy Losses calculated Trailing Twelve Month (TTM) |
23
Distribution Business in Latin America shows important increases in its key factors, like physical sales, new clients and labor productivity. Consolidated physical sales increased by 4.5% reaching 24,479 GWh. In customers, this first half 2003, number of new clients increased by 219 thousand or 2.2%, totaling 10.2 million customers. In terms of labor productivity, the group improved by 3.4%, from 1,361 up to 1,407 clients per employee. Finally, in the case of energy losses, it is worth mentioning that all our subsidiaries decreased its energy losses, with the only exception of Edesur. That is why in consolidated terms, we can see a slightly increase from 12% to 12.1%. You have to consider that our consolidated ratios improved, despite the sale of Rio Maipo.
In Argentina, Edesur increased customers by 11 thousand new clients, or 0.5%. In terms of physical sales, this subsidiary improved in 160 GWh, equivalent to 2.6%. Labor productivity increased in 1.2%. Finally, energy losses increased from 10.6% as of June 2002, up to 11.8%, this is mainly explained by increase in theft due to the economic downturn still in place in Argentina.
In Peru, Edelnor increased it clients based in 20 thousand new customers. Also, increased physical sales by 2.7%. Labor productivity registered the better performance, compare to the other distribution subsidiaries, reaching 1,424 clients per employee, equivalent to 10.5% improvement respect to the previous year. Energy losses decreased from 8.7% as of June 2002, down to 8.4% this period.
In Brazil, Cerj did not changed significantly it clients based, however registered the higher improvement in physical energy sales, increasing in 8.5% respect to June 2002. In terms of labor productivity, it shows a decrease of 4%. Finally, energy losses decreased from 23.9% to 23.1% this period.
Coelce, increased the client base in 103 thousand new clients, meaning a 4.9% increase. In terms of physical sales, improved by 8.2%. Also labor productivity increased by 7.5%. Energy losses showed a good performance, being reduced from 13.6% as of June 2002, down to 12.9% this period. The improvement in energy losses in our Brazilian subsidiaries is a consequence of the big effort that the management is applying in that companies.
In Colombia, Codensa showed an increase in 3.2% or 61 thousand new clients. Also improved in 1.3% physical sales, while labor productivity slightly increased by 0.7%. Finally, energy losses decreased from 10.6% as of June 2002 down to 10.3%.
Finally, in Chile, Chilectra increased in 24 thousand new clients, meaning 1.8%. In terms of physical sales, it showed an improvement of 5.4% compared to June 2002. And labor productivity also improved by 0.2%. Energy losses decreased from 5.8% as of June 2002, down to 5.6%.
24
CONSOLIDATED BALANCE SHEET ASSETS
(Under Chilean GAAP, thousand US$)
Table 7.1
ASSETS – (thousand US$) |
| 1H 03 |
| 1H 02 |
|
|
|
| |||
|
|
|
|
|
|
CURRENT ASSETS |
|
|
|
|
|
Cash |
| 519,597 |
| 45,901 |
|
Time deposits |
| 491,589 |
| 318,712 |
|
Marketable securities |
| 18,338 |
| 799 |
|
Accounts receivable |
| 747,803 |
| 667,213 |
|
Notes receivable |
| 7,174 |
| 8,484 |
|
Other accounts receivable |
| 149,989 |
| 174,105 |
|
Amounts due from related companies |
| 275,038 |
| 28,855 |
|
Inventories |
| 83,217 |
| 109,512 |
|
Income taxes to be recovered |
| 109,105 |
| 85,451 |
|
Prepaid expenses |
| 28,576 |
| 15,610 |
|
Deferred income taxes |
| 91,828 |
| 61,560 |
|
Other current assets |
| 162,727 |
| 261,451 |
|
Net of long-term leasing contracts |
| — |
| — |
|
Net of assets for leasing |
| — |
| — |
|
|
|
|
| ||
Total currrent assets |
| 2,684,981 |
| 1,777,654 |
|
|
|
|
| ||
PROPERTY, PLANT AND EQUIPMENT |
|
|
|
|
|
Property |
| 181,186 |
| 235,851 |
|
Buildings and infraestructure |
| 15,831,659 |
| 16,417,114 |
|
Plant and equipment |
| 2,930,217 |
| 2,752,946 |
|
Other assets |
| 625,651 |
| 806,663 |
|
Technical re-appraisal |
| 1,035,581 |
| 1,028,429 |
|
Sub - Total |
| 20,604,295 |
| 21,241,002 |
|
Accumulated depreciation |
| (7,394,477 | ) | (6,977,397 | ) |
|
|
|
| ||
Total property, plant and equipment |
| 13,209,818 |
| 14,263,606 |
|
|
|
|
| ||
OTHER ASSETS |
|
|
|
|
|
Investments in related companies |
| 295,545 |
| 264,289 |
|
Investments in other companies |
| 224,317 |
| 225,764 |
|
Positive goodwill |
| 1,166,670 |
| 1,878,712 |
|
Negative goodwill |
| (119,042 | ) | (240,142 | ) |
Long-term receivables |
| 219,754 |
| 197,433 |
|
Amounts due from related companies |
| 4,353 |
| 248,988 |
|
Deferred income taxes |
| — |
| — |
|
Intangibles |
| 127,232 |
| 108,356 |
|
Accumulated amortization |
| (60,160 | ) | (41,297 | ) |
Others |
| 387,212 |
| 324,233 |
|
Net of long-term leasing contracts |
| — |
| — |
|
|
|
|
| ||
Total other assets |
| 2,245,882 |
| 2,966,336 |
|
|
|
|
| ||
TOTAL ASSETS |
| 18,140,681 |
| 19,007,595 |
|
|
|
|
|
25
CONSOLIDATED BALANCE SHEET ASSETS
(Under Chilean GAAP, thousand US$)
Table 7.2
ASSETS - (millon Ch$) |
| 1H 03 |
| 1H 02 |
|
|
|
| |||
|
|
|
|
|
|
CURRENT ASSETS |
|
|
|
|
|
Cash |
| 363,261 |
| 32,090 |
|
Time deposits |
| 343,679 |
| 222,818 |
|
Marketable securities |
| 12,821 |
| 559 |
|
Accounts receivable |
| 522,804 |
| 466,462 |
|
Notes receivable |
| 5,015 |
| 5,932 |
|
Other accounts receivable |
| 104,860 |
| 121,720 |
|
Amounts due from related companies |
| 192,285 |
| 20,173 |
|
Inventories |
| 58,179 |
| 76,562 |
|
Income taxes to be recovered |
| 76,277 |
| 59,741 |
|
Prepaid expenses |
| 19,978 |
| 10,913 |
|
Deferred income taxes |
| 64,199 |
| 43,038 |
|
Other current assets |
| 113,766 |
| 182,786 |
|
Net of long-term leasing contracts |
| — |
| — |
|
Net of assets for leasing |
| — |
| — |
|
|
|
|
| ||
Total currrent assets |
| 1,877,124 |
| 1,242,793 |
|
|
|
|
| ||
PROPERTY, PLANT AND EQUIPMENT |
|
|
|
|
|
Property |
| 126,671 |
| 164,888 |
|
Buildings and infraestructure |
| 11,068,230 |
| 11,477,532 |
|
Plant and equipment |
| 2,048,574 |
| 1,924,640 |
|
Other assets |
| 437,405 |
| 563,954 |
|
Technical re-appraisal |
| 723,995 |
| 718,996 |
|
Sub - Total |
| 14,404,875 |
| 14,850,010 |
|
Accumulated depreciation |
| (5,169,627 | ) | (4,878,038 | ) |
|
|
|
| ||
Total property, plant and equipment |
| 9,235,248 |
| 9,971,972 |
|
|
|
|
| ||
OTHER ASSETS |
|
|
|
|
|
Investments in related companies |
| 206,621 |
| 184,770 |
|
Investments in other companies |
| 156,824 |
| 157,836 |
|
Positive goodwill |
| 815,643 |
| 1,313,445 |
|
Negative goodwill |
| (83,225 | ) | (167,888 | ) |
Long-term receivables |
| 153,635 |
| 138,029 |
|
Amounts due from related companies |
| 3,043 |
| 174,072 |
|
Deferred income taxes |
| — |
| — |
|
Intangibles |
| 88,951 |
| 75,754 |
|
Accumulated amortization |
| (42,059 | ) | (28,871 | ) |
Others |
| 270,708 |
| 226,678 |
|
Net of long-term leasing contracts |
| — |
| — |
|
|
|
|
| ||
Total other assets |
| 1,570,141 |
| 2,073,825 |
|
|
|
|
| ||
TOTAL ASSETS |
| 12,682,513 |
| 13,288,590 |
|
|
|
|
|
26
CONSOLIDATED BALANCE SHEET LIABILITIES AND SHAREHOLDER EQUITY
(Under Chilean GAAP, thousand US$)
Table 8.1
LIABILITIES AND SHAREHOLDER’S EQUITY - (thousand US$) |
| 1H 03 |
| 1H 02 |
| ||
|
|
| |||||
CURRENT LIABILITIES |
|
|
|
|
|
|
|
Due to banks and financial institutions (short-term) |
|
| 465,757 |
|
| 628,135 |
|
Due to banks and financial institutions (short-term portion of long term) |
|
| 227,956 |
|
| 638,142 |
|
Commercial paper equivalent |
|
| 8,973 |
|
| 53,477 |
|
Bonds payable (short-term) |
|
| 574,129 |
|
| 278,254 |
|
Long-term liabilities maturing before one year |
|
| 50,427 |
|
| 45,375 |
|
Dividends payable |
|
| 8,833 |
|
| 36,028 |
|
Accounts payable |
|
| 322,691 |
|
| 363,634 |
|
Notes payable |
|
| 44,077 |
|
| 5,314 |
|
Miscellaneous payables |
|
| 135,636 |
|
| 92,760 |
|
Accounts payable to related companies |
|
| 21,793 |
|
| 66,935 |
|
Provisions |
|
| 110,737 |
|
| 106,508 |
|
Withholdings |
|
| 98,615 |
|
| 69,320 |
|
Income tax |
|
| 59,573 |
|
| 69,247 |
|
Anticipated income |
|
| 20,970 |
|
| 15,497 |
|
Deferred taxes |
|
| — |
|
| — |
|
Reinbursable financial contribution |
|
| 4,024 |
|
| 5,205 |
|
Other current liabilities |
|
| 76,739 |
|
| 219,376 |
|
|
|
|
|
|
|
|
|
|
|
|
| ||||
Total current liabilities |
|
| 2,230,928 |
|
| 2,693,206 |
|
|
|
|
| ||||
|
|
|
|
|
|
|
|
LONG-TERM LIABILITIES |
|
|
|
|
|
|
|
Due to banks and financial institutions |
|
| 3,051,442 |
|
| 2,688,767 |
|
Bonds payable |
|
| 2,825,383 |
|
| 3,418,656 |
|
Notes payable |
|
| 295,665 |
|
| 307,825 |
|
Miscellaneous payables |
|
| 29,356 |
|
| 42,359 |
|
Amounts payable to related companies |
|
| 1,281 |
|
| 1,441,942 |
|
Provisions |
|
| 425,546 |
|
| 384,451 |
|
Deferred taxes |
|
| 62,949 |
|
| 39,997 |
|
Reinbursable financial contribution |
|
| 16,667 |
|
| 18,628 |
|
Other long-term liabilities |
|
| 106,447 |
|
| 45,995 |
|
|
|
|
|
|
|
|
|
|
|
|
| ||||
Total long-term liabilities |
|
| 6,814,737 |
|
| 8,388,619 |
|
|
|
|
| ||||
|
|
|
|
|
|
|
|
Minority interest |
|
| 5,502,607 |
|
| 6,119,750 |
|
|
|
|
|
|
|
|
|
SHAREHOLDERS’ EQUITY |
|
|
|
|
|
|
|
Paid-in capital, no par value |
|
| 2,985,605 |
|
| 1,079,721 |
|
Reserve to equity revaluation |
|
| 11,820 |
|
| 6,478 |
|
Additional paid-in capital-share premium |
|
| 236,817 |
|
| 48,251 |
|
Other reserves |
|
| 50,621 |
|
| 56,143 |
|
Total capital and reserves |
|
| 3,284,863 |
|
| 1,190,594 |
|
Future dividends reserve |
|
| — |
|
| — |
|
Retained earnings |
|
| 252,025 |
|
| 582,434 |
|
Retained losses |
|
| — |
|
| — |
|
Net income |
|
| 57,049 |
|
| 35,022 |
|
Interim dividends |
|
| — |
|
| — |
|
Development subsidaries deficits |
|
| (1,528 | ) |
| (2,030 | ) |
Total retained earnings |
|
| 307,546 |
|
| 615,427 |
|
|
|
|
|
|
|
|
|
|
|
|
| ||||
Total shareholder’s equity |
|
| 3,592,409 |
|
| 1,806,021 |
|
|
|
|
| ||||
|
|
|
|
|
|
|
|
TOTAL LIABILITIES AND SHAREHOLDER’S EQUITY |
|
| 18,140,681 |
|
| 19,007,595 |
|
|
|
|
| ||||
27
CONSOLIDATED BALANCE SHEET LIABILITIES AND SHAREHOLDER EQUITY
(Under Chilean GAAP, Million Ch$)
Table 8.2
LIABILITIES AND SHAREHOLDER’S EQUITY - (millon Ch$) |
| 1H 03 |
| 1H 02 |
| ||
|
|
| |||||
CURRENT LIABILITIES |
|
|
|
|
|
|
|
Due to banks and financial institutions (short-term) |
|
| 325,620 |
|
| 439,142 |
|
Due to banks and financial institutions (short-term portion of long term) |
|
| 159,369 |
|
| 446,138 |
|
Commercial paper equivalent |
|
| 6,273 |
|
| 37,387 |
|
Bonds payable (short-term) |
|
| 401,385 |
|
| 194,533 |
|
Long-term liabilities maturing before one year |
|
| 35,255 |
|
| 31,722 |
|
Dividends payable |
|
| 6,175 |
|
| 25,188 |
|
Accounts payable |
|
| 225,600 |
|
| 254,223 |
|
Notes payable |
|
| 30,815 |
|
| 3,715 |
|
Miscellaneous payables |
|
| 94,826 |
|
| 64,851 |
|
Accounts payable to related companies |
|
| 15,236 |
|
| 46,796 |
|
Provisions |
|
| 77,418 |
|
| 74,462 |
|
Withholdings |
|
| 68,943 |
|
| 48,463 |
|
Income tax |
|
| 41,649 |
|
| 48,412 |
|
Anticipated income |
|
| 14,660 |
|
| 10,834 |
|
Deferred taxes |
|
| — |
|
| — |
|
Reinbursable financial contribution |
|
| 2,813 |
|
| 3,639 |
|
Other current liabilities |
|
| 53,650 |
|
| 153,370 |
|
|
|
|
|
|
|
|
|
|
|
|
| ||||
Total current liabilities |
|
| 1,559,686 |
|
| 1,882,874 |
|
|
|
|
| ||||
|
|
|
|
|
|
|
|
LONG-TERM LIABILITIES |
|
|
|
|
|
|
|
Due to banks and financial institutions |
|
| 2,133,324 |
|
| 1,879,771 |
|
Bonds payable |
|
| 1,975,282 |
|
| 2,390,051 |
|
Notes payable |
|
| 206,706 |
|
| 215,206 |
|
Miscellaneous payables |
|
| 20,523 |
|
| 29,614 |
|
Amounts payable to related companies |
|
| 896 |
|
| 1,008,090 |
|
Provisions |
|
| 297,508 |
|
| 268,777 |
|
Deferred taxes |
|
| 44,009 |
|
| 27,962 |
|
Reinbursable financial contribution |
|
| 11,652 |
|
| 13,023 |
|
Other long-term liabilities |
|
| 74,419 |
|
| 32,156 |
|
|
|
|
|
|
|
|
|
|
|
|
| ||||
Total long-term liabilities |
|
| 4,764,319 |
|
| 5,864,652 |
|
|
|
|
| ||||
|
|
|
|
|
|
|
|
Minority interest |
|
| 3,846,983 |
|
| 4,278,440 |
|
|
|
|
|
|
|
|
|
SHAREHOLDERS’ EQUITY |
|
|
|
|
|
|
|
Paid-in capital, no par value |
|
| 2,087,296 |
|
| 754,855 |
|
Reserve to equity revaluation |
|
| 8,263 |
|
| 4,529 |
|
Additional paid-in capital-share premium |
|
| 165,563 |
|
| 33,733 |
|
Other reserves |
|
| 35,390 |
|
| 39,251 |
|
Total capital and reserves |
|
| 2,296,513 |
|
| 832,368 |
|
Future dividends reserve |
|
| — |
|
| — |
|
Retained earnings |
|
| 176,196 |
|
| 407,192 |
|
Retained losses |
|
| — |
|
| — |
|
Net income |
|
| 39,884 |
|
| 24,484 |
|
Interim dividends |
|
| — |
|
| — |
|
Development subsidaries deficits |
|
| (1,068 | ) |
| (1,419 | ) |
Total retained earnings |
|
| 215,012 |
|
| 430,257 |
|
|
|
|
|
|
|
|
|
|
|
|
| ||||
Total shareholder’s equity |
|
| 2,511,525 |
|
| 1,262,625 |
|
|
|
|
| ||||
|
|
|
|
|
|
|
|
|
| ||||||
TOTAL LIABILITIES AND SHAREHOLDER’S EQUITY |
|
| 12,682,513 |
|
| 13,288,590 |
|
|
|
|
| ||||
28
EVOLUTION OF KEY FINANCIAL RATIOS
Table 9
Indicator |
| Unit |
| 1H 03 |
| 1H 02 |
| Var 03-02 |
| Chg % |
|
|
|
|
|
|
| ||||||
Liquidity |
| Times |
| 1.20 |
| 0.66 |
| 0.54 |
| 81.8 | % |
Acid ratio test * |
| Times |
| 1.20 |
| 0.65 |
| 0.55 |
| 84.6 | % |
Working capital |
| million Ch$ |
| 317,438 |
| (640,081 | ) | 957,519 |
| 149.6 | % |
Working capital |
| thousands US$ |
| 454,054 |
| (915,552 | ) | 1,369,606 |
| 149.6 | % |
Leverage ** |
| Times |
| 0.99 |
| 1.40 |
| (0.41 | ) | (29.3 | %) |
Short-term debt |
| % |
| 0.25 |
| 0.24 |
| 0.01 |
| 4.2 | % |
Long-term debt |
| % |
| 0.75 |
| 0.76 |
| (0.01 | ) | (1.3 | %) |
Interest Coverage*** |
| Times |
| 2.83 |
| 2.51 |
| 0.32 |
| 12.7 | % |
EBITDA**** |
| th. US$ |
| 748,265 |
| 781,689 |
| (33,424 | ) | (4.3 | %) |
ROE |
| % |
| 1.59 | % | 1.94 | % | (0.00 | ) | (18.0 | %) |
ROA |
| % |
| 0.31 | % | 0.18 | % | 0.00 |
| 72.2 | % |
* | Current assets net of inventories and pre-paid expenses |
** | Using the ratio = Total debt / (equity + minority interest) |
*** | EBITDAEI/Interest expenses = (Earnings before taxes+Fin exp+Net non operating income+depreciation+Positive Goodwill)/Interest expenses |
**** | EBITDA: Operating Income+Depreciation |
29
CONSOLIDATED FINANCIAL DEBT MATURITY SCHEDULE BEFORE REFINANCING AND CAPITAL INCREASE (Debt with third parties)
Table 10.1
|
| FINANCIAL DEBT MATURITY |
|
|
| ||||||||||
|
|
|
|
| |||||||||||
Thousand US$ |
| 2003 |
| 2004 |
| 2005 |
| 2006 |
| 2007 |
| Balance |
| TOTAL |
|
|
|
|
|
|
|
|
| ||||||||
Chile |
| 586,947 |
| 134,233 |
| 518,276 |
| 1,436,021 |
| 865,246 |
| 2,099,199 |
| 5,639,922 |
|
|
|
|
|
|
|
|
|
| |||||||
Enersis |
| 155,484 |
| 11,418 |
| 276,630 |
| 843,071 |
| 545,062 |
| 592,789 |
| 2,424,452 |
|
Chilectra |
| 0 |
| 18,871 |
| 0 |
| 0 |
| 0 |
| 0 |
| 18,871 |
|
Otras |
| 3,393 |
| 30,323 |
| 0 |
| 0 |
| 0 |
| 0 |
| 33,716 |
|
Endesa |
| (*) 428.071 |
| 73,621 |
| 241,646 |
| 592,950 |
| 320,184 |
| 1,506,411 |
| 3,162,883 |
|
|
|
|
|
|
|
|
|
| |||||||
Argentina |
| 140,767 |
| 189,618 |
| 32,044 |
| 35,870 |
| 21,056 |
| 82,636 |
| 501,991 |
|
|
|
|
|
|
|
|
|
| |||||||
Edesur |
| 92,108 |
| 82,575 |
| 1,100 |
| 8,250 |
| 0 |
| 0 |
| 184,034 |
|
Costanera |
| 48,659 |
| 107,042 |
| 30,944 |
| 27,620 |
| 21,056 |
| 82,636 |
| 317,958 |
|
|
|
|
|
|
|
|
|
| |||||||
Perú |
| 70,805 |
| 84,902 |
| 64,515 |
| 81,843 |
| 65,349 |
| 0 |
| 367,414 |
|
|
|
|
|
|
|
|
|
| |||||||
Edelnor |
| 12,235 |
| 41,267 |
| 0 |
| 51,843 |
| 5,349 |
| 0 |
| 110,694 |
|
Edegel |
| 58,570 |
| 43,635 |
| 64,515 |
| 30,000 |
| 60,000 |
| 0 |
| 256,720 |
|
|
|
|
|
|
|
|
|
| |||||||
Brasil |
| 121,779 |
| 95,953 |
| 63,531 |
| 43,118 |
| 36,539 |
| 153,830 |
| 514,751 |
|
|
|
|
|
|
|
|
|
| |||||||
Coelce |
| 66,805 |
| 18,796 |
| 33,274 |
| 17,100 |
| 19,563 |
| 104,831 |
| 260,368 |
|
Cerj |
| 54,173 |
| 75,189 |
| 27,674 |
| 22,627 |
| 12,526 |
| 48,132 |
| 240,321 |
|
Cachoeira |
| 801 |
| 1,969 |
| 2,584 |
| 3,391 |
| 4,451 |
| 867 |
| 14,063 |
|
|
|
|
|
|
|
|
|
| |||||||
Colombia |
| 93,332 |
| 4,526 |
| 21,706 |
| 80,869 |
| 20,705 |
| 110,614 |
| 331,751 |
|
|
|
|
|
|
|
|
|
| |||||||
Codensa |
| 64,876 |
| 0 |
| 0 |
| 0 |
| 0 |
| 0 |
| 64,876 |
|
Emgesa |
| 28,455 |
| 4,526 |
| 1,001 |
| 60,164 |
| 0 |
| 110,614 |
| 204,759 |
|
Betania |
| 0 |
| 0 |
| 20,705 |
| 20,705 |
| 20,705 |
| 0 |
| 62,116 |
|
|
|
|
|
|
|
|
|
| |||||||
TOTAL |
| 1,013,630 |
| 509,231 |
| 700,072 |
| 1,677,721 |
| 1,008,895 |
| 2,446,280 |
| 7,355,830 |
|
|
|
|
|
|
|
|
|
| |||||||
Note: US$ 381 millions of EOC’s EMTN were paid on July 24.
Table 10.2
|
| FINANCIAL DEBT MATURITY |
|
|
| ||||||||||
|
|
|
|
| |||||||||||
Million Ch$ |
| 2003 |
| 2004 |
| 2005 |
| 2006 |
| 2007 |
| Balance |
| TOTAL |
|
|
|
|
|
|
|
|
| ||||||||
Chile |
| 410,347 |
| 93,845 |
| 362,337 |
| 1,003,951 |
| 604,911 |
| 1,467,592 |
| 3,942,982 |
|
|
|
|
|
|
|
|
|
| |||||||
Enersis |
| 108,702 |
| 7,982 |
| 193,397 |
| 589,408 |
| 381,063 |
| 414,431 |
| 1,694,983 |
|
Chilectra |
| 0 |
| 13,193 |
| 0 |
| 0 |
| 0 |
| 0 |
| 13,193 |
|
Otras |
| 2,372 |
| 21,200 |
| 0 |
| 0 |
| 0 |
| 0 |
| 23,572 |
|
Endesa |
| (*) 299.273 |
| 51,470 |
| 168,940 |
| 414,543 |
| 223,847 |
| 1,053,162 |
| 2,211,234 |
|
|
|
|
|
|
|
|
|
| |||||||
Argentina |
| 98,413 |
| 132,565 |
| 22,403 |
| 25,077 |
| 14,721 |
| 57,773 |
| 350,952 |
|
|
|
|
|
|
|
|
|
| |||||||
Edesur |
| 64,395 |
| 57,730 |
| 769 |
| 5,768 |
| 0 |
| 0 |
| 128,662 |
|
Costanera |
| 34,018 |
| 74,836 |
| 21,634 |
| 19,310 |
| 14,721 |
| 57,773 |
| 222,291 |
|
|
|
|
|
|
|
|
|
| |||||||
Perú |
| 49,501 |
| 59,356 |
| 45,104 |
| 57,218 |
| 45,686 |
| 0 |
| 256,866 |
|
|
|
|
|
|
|
|
|
| |||||||
Edelnor |
| 8,554 |
| 28,851 |
| 0 |
| 36,245 |
| 3,739 |
| 0 |
| 77,388 |
|
Edegel |
| 40,948 |
| 30,506 |
| 45,104 |
| 20,974 |
| 41,947 |
| 0 |
| 179,478 |
|
|
|
|
|
|
|
|
|
| |||||||
Brasil |
| 85,138 |
| 67,083 |
| 44,416 |
| 30,145 |
| 25,545 |
| 107,546 |
| 359,873 |
|
|
|
|
|
|
|
|
|
| |||||||
Coelce |
| 46,705 |
| 13,140 |
| 23,262 |
| 11,955 |
| 13,677 |
| 73,290 |
| 182,028 |
|
Cerj |
| 37,874 |
| 52,566 |
| 19,347 |
| 15,819 |
| 8,757 |
| 33,650 |
| 168,013 |
|
Cachoeira |
| 560 |
| 1,376 |
| 1,807 |
| 2,371 |
| 3,112 |
| 606 |
| 9,832 |
|
|
|
|
|
|
|
|
|
| |||||||
Colombia |
| 65,250 |
| 3,164 |
| 15,175 |
| 56,537 |
| 14,475 |
| 77,332 |
| 231,934 |
|
|
|
|
|
|
|
|
|
| |||||||
Codensa |
| 45,356 |
| 0 |
| 0 |
| 0 |
| 0 |
| 0 |
| 45,356 |
|
Emgesa |
| 19,894 |
| 3,164 |
| 700 |
| 42,062 |
| 0 |
| 77,332 |
| 143,151 |
|
Betania |
| 0 |
| 0 |
| 14,475 |
| 14,475 |
| 14,475 |
| 0 |
| 43,426 |
|
|
|
|
|
|
|
|
|
| |||||||
TOTAL |
| 708,649 |
| 356,013 |
| 489,435 |
| 1,172,929 |
| 705,339 |
| 1,710,243 |
| 5,142,608 |
|
|
|
|
|
|
|
|
|
| |||||||
Note: Ch$ 266.365 millions of EOC’s EMTN were paid on July 24.
30
CONSOLIDATED CASH FLOW
(Under Chilean GAAP, thousand US$)
Table 11.1
Thousand US$ |
| 1H 03 |
| 1H 02 |
|
|
|
| |||
CASH FLOWS ORIGINATED FROM OPERATING ACTIVITIES |
|
|
|
|
|
|
|
|
| ||
Net income (loss) for the year |
| 57,049 |
| 35,022 |
|
|
|
|
| ||
Profit (losses) from sales of assets: |
|
|
|
|
|
(Profit) loss on sale of fixed assets |
| (117,152 | ) | (4,894 | ) |
Charges (credits) which do not represent cash flows: |
|
|
|
|
|
Depreciation |
| 329,125 |
| 320,742 |
|
Amortization of intangibles |
| 6,874 |
| 7,112 |
|
Write-offs and accrued expenses |
| 26,688 |
| 39,373 |
|
Accrued profit from related companies (less) |
| (28,956 | ) | (3,520 | ) |
Accrued losses from related companies |
| 397 |
| 10,743 |
|
Amortization of positive goodwill |
| 38,509 |
| 59,282 |
|
Amortization of negative goodwill (less) |
| (62,777 | ) | (35,875 | ) |
Net, price-level restatement |
| 11,519 |
| 5,583 |
|
Net, foreign exchange effect |
| (11,885 | ) | 15,569 |
|
Other credits which do not represent cash flow (less) |
| (16,312 | ) | (354,735 | ) |
Other charges which do not represent cash flow |
| 133,452 |
| 116,877 |
|
Assets variations which affect cash flow: |
|
|
|
|
|
Decrease in receivables accounts |
| (172,298 | ) | 210,490 |
|
Decrease (increase) in inventory |
| 732 |
| (2,656 | ) |
Decrease (increase) in other assets |
| (21,868 | ) | 25,786 |
|
Liabilities variations which affect cash flow: |
|
|
|
|
|
(Decreased) increase in payable accounts related to operating income |
| (73,538 | ) | (28,645 | ) |
Increase of payable interest |
| 8,849 |
| 30,626 |
|
Net increase (decrease) of payable income tax |
| 14,451 |
| (48,475 | ) |
Increase (decrease) of other payable accounts related to non-operating income |
| 71,126 |
| (137,938 | ) |
Net (decrease) of payable value added tax and other taxes |
| 89,207 |
| (70,488 | ) |
Profit related to minority interest |
| 32,314 |
| 142,789 |
|
|
|
|
| ||
NET POSITIVE CASH FLOW ORIGINATED FROM OPERATING ACTIVITIES |
| 315,507 |
| 332,768 |
|
|
|
|
|
31
Cont. Table 11.1
Thousand US$ |
| 1H 03 |
| 1H 02 |
|
|
|
| |||
CASH FLOWS ORIGINATED FROM FINANCING ACTIVITIES |
|
|
|
|
|
Shares issued and suscribed |
| 666,014 |
| 2,671 |
|
Proceeds from loans hired |
| 609,890 |
| 832,329 |
|
Proceeds from debt issuance |
| 46,789 |
| 176,329 |
|
Proceeds from loans obtained from related companies |
| — |
| — |
|
Proceeds from other loans obtained from related companies |
| — |
| — |
|
Other sources of financing |
| 10,133 |
| 34 |
|
Dividends paid |
| (88,969 | ) | (99,427 | ) |
Capital paid |
| (14,234 | ) | (5,776 | ) |
Loans, debt amortization (less) |
| (661,611 | ) | (901,939 | ) |
Issuance debt amortization (less) |
| (199,194 | ) | (28,482 | ) |
Amortization of loans obtained from related companies |
| (6,403 | ) | (13,301 | ) |
Amortization of other loans obtained from related companies |
| — |
| — |
|
Expenses paid related to debt issuance (less) |
| (139 | ) | (13,843 | ) |
Other disbursements related to financing (less) |
| (111,595 | ) | (4,550 | ) |
|
|
|
| ||
NET (NEGATIVE) CASH FLOW ORIGINATED FROM FINANCING ACTIVITIES |
| 250,680 |
| (55,953 | ) |
|
|
|
| ||
CASH FLOWS ORIGINATED FROM INVESTING ACTIVITIES |
|
|
|
|
|
Sale of fixed assets |
| 229,889 |
| 21,662 |
|
Sale of other investments |
| 171,579 |
| — |
|
Collection upon other loans to related companies |
| 10,811 |
| 6,970 |
|
Other income on investments |
| 71,420 |
| 3,535 |
|
Additions to fixed assets (less) |
| (210,073 | ) | (160,807 | ) |
Long-term investments (less) |
| (35 | ) | (24,108 | ) |
Investment in financing instruments |
| — |
| (21,907 | ) |
Other loans to related companies (less) |
| (296 | ) | — |
|
Other investment disbursements (less) |
| (10,055 | ) | (13,894 | ) |
|
|
|
| ||
NET (NEGATIVE) CASH FLOW ORIGINATED FROM INVESTMENT ACTIVITIES |
| 263,240 |
| (188,549 | ) |
|
|
|
| ||
NET POSITIVE CASH FLOW FOR THE PERIOD |
| 829,427 |
| 88,266 |
|
|
|
|
| ||
EFFECT OF PRICE-LEVEL RESTATEMENT UPON CASH AND CASH EQUIVALENT |
| (76,932 | ) | (22,822 | ) |
|
|
|
| ||
NET VARIATION OF CASH AND CASH EQUIVALENT |
| 752,495 |
| 65,444 |
|
|
|
|
| ||
INITIAL BALANCE OF CASH AND CASH EQUIVALENT |
| 319,866 |
| 314,965 |
|
|
|
|
| ||
FINAL BALANCE OF CASH AND CASH EQUIVALENT |
| 1,072,361 |
| 380,409 |
|
|
|
|
|
32
CONSOLIDATED CASH FLOW
(Under Chilean GAAP, million Ch$)
Table 11.2
Million Ch$ |
| 1H 03 |
| 1H 02 |
|
|
|
| |||
CASH FLOWS ORIGINATED FROM OPERATING ACTIVITIES |
|
|
|
|
|
|
|
|
| ||
Net income (loss) for the year |
| 39,884 |
| 24,484 |
|
|
|
|
| ||
Profit (losses) from sales of assets: |
|
|
|
|
|
(Profit) loss on sale of fixed assets |
| (81,903 | ) | (3,421 | ) |
Charges (credits) which do not represent cash flows: |
|
|
|
|
|
Depreciation |
| 230,098 |
| 224,237 |
|
Amortization of intangibles |
| 4,806 |
| 4,972 |
|
Write-offs and accrued expenses |
| 18,658 |
| 27,527 |
|
Accrued profit from related companies (less) |
| (20,243 | ) | (2,461 | ) |
Accrued losses from related companies |
| 277 |
| 7,511 |
|
Amortization of positive goodwill |
| 26,922 |
| 41,446 |
|
Amortization of negative goodwill (less) |
| (43,889 | ) | (25,081 | ) |
Net, price-level restatement |
| 8,053 |
| 3,903 |
|
Net, foreign exchange effect |
| (8,309 | ) | 10,884 |
|
Other credits which do not represent cash flow (less) |
| (11,404 | ) | (248,002 | ) |
Other charges which do not represent cash flow |
| 93,299 |
| 81,711 |
|
Assets variations which affect cash flow: |
|
|
|
|
|
Decrease in receivables accounts |
| (120,457 | ) | 147,158 |
|
Decrease (increase) in inventory |
| 512 |
| (1,857 | ) |
Decrease (increase) in other assets |
| (15,289 | ) | 18,028 |
|
Liabilities variations which affect cash flow: |
|
|
|
|
|
(Decreased) increase in payable accounts related to operating income |
| (51,412 | ) | (20,026 | ) |
Increase of payable interest |
| 6,187 |
| 21,411 |
|
Net increase (decrease) of payable income tax |
| 10,103 |
| (33,890 | ) |
Increase (decrease) of other payable accounts related to non-operating income |
| 49,726 |
| (96,435 | ) |
Net (decrease) of payable value added tax and other taxes |
| 62,367 |
| (49,280 | ) |
Profit related to minority interest |
| 22,591 |
| 99,826 |
|
|
|
|
| ||
NET POSITIVE CASH FLOW ORIGINATED FROM OPERATING ACTIVITIES |
| 220,577 |
| 232,645 |
|
|
|
|
|
33
Cont. Table 11.2
Million Ch$ |
| 1H 03 |
| 1H 02 |
|
|
|
| |||
CASH FLOWS ORIGINATED FROM FINANCING ACTIVITIES |
|
|
|
|
|
Shares issued and suscribed |
| 465,624 |
| 1,867 |
|
Proceeds from loans hired |
| 426,386 |
| 581,898 |
|
Proceeds from debt issuance |
| 32,711 |
| 123,275 |
|
Proceeds from loans obtained from related companies |
| — |
| — |
|
Proceeds from other loans obtained from related companies |
| — |
| — |
|
Other sources of financing |
| 7,084 |
| 24 |
|
Dividends paid |
| (62,200 | ) | (69,511 | ) |
Capital paid |
| (9,952 | ) | (4,038 | ) |
Loans, debt amortization (less) |
| (462,546 | ) | (630,564 | ) |
Issuance debt amortization (less) |
| (139,260 | ) | (19,912 | ) |
Amortization of loans obtained from related companies |
| (4,476 | ) | (9,299 | ) |
Amortization of other loans obtained from related companies |
| — |
| — |
|
Expenses paid related to debt issuance (less) |
| (98 | ) | (9,678 | ) |
Other disbursements related to financing (less) |
| (78,018 | ) | (3,181 | ) |
|
|
|
| ||
NET (NEGATIVE) CASH FLOW ORIGINATED FROM FINANCING ACTIVITIES |
| 175,255 |
| (39,118 | ) |
|
|
|
| ||
CASH FLOWS ORIGINATED FROM INVESTING ACTIVITIES |
|
|
|
|
|
Sale of fixed assets |
| 160,720 |
| 15,144 |
|
Sale of other investments |
| 119,954 |
| — |
|
Collection upon other loans to related companies |
| 7,558 |
| 4,873 |
|
Other income on investments |
| 49,931 |
| 2,471 |
|
Additions to fixed assets (less) |
| (146,866 | ) | (112,423 | ) |
Long-term investments (less) |
| (25 | ) | (16,854 | ) |
Investment in financing instruments |
| — |
| (15,316 | ) |
Other loans to related companies (less) |
| (207 | ) | — |
|
Other investment disbursements (less) |
| (7,030 | ) | (9,714 | ) |
|
|
|
| ||
NET (NEGATIVE) CASH FLOW ORIGINATED FROM INVESTMENT ACTIVITIES |
| 184,037 |
| (131,818 | ) |
|
|
|
| ||
NET POSITIVE CASH FLOW FOR THE PERIOD |
| 579,869 |
| 61,709 |
|
|
|
|
| ||
EFFECT OF PRICE-LEVEL RESTATEMENT UPON CASH AND CASH EQUIVALENT |
| (53,785 | ) | (15,955 | ) |
|
|
|
| ||
NET VARIATION OF CASH AND CASH EQUIVALENT |
| 526,085 |
| 45,753 |
|
|
|
|
| ||
INITIAL BALANCE OF CASH AND CASH EQUIVALENT |
| 223,625 |
| 220,198 |
|
|
|
|
| ||
FINAL BALANCE OF CASH AND CASH EQUIVALENT |
| 749,709 |
| 265,952 |
|
|
|
|
|
34
CONSOLIDATED CASH FLOW ANALYSIS
(Under Chilean GAAP)
During the period, the Company generated a net cash flow of US$ 829 million, explained as follows:
Table 12.1
Effective Cash Flow (thousand US$) |
| 1H 03 |
| 1H 02 |
| Var 03-02 |
| Chg % |
|
|
|
|
|
| |||||
Operating |
| 315,507 |
| 332,767 |
| (17,260 | ) | (5.2 | %) |
Financing |
| 250,679 |
| (55,953 | ) | 306,633 |
| 548.0 | % |
Investment |
| 263,241 |
| (188,548 | ) | 451,789 |
| 239.6 | % |
|
|
|
|
|
| ||||
Net cash flow of the period |
| 829,427 |
| 88,265 |
| 741,162 |
| 839.7 | % |
|
|
|
|
|
|
Table 12.2
Effective Cash Flow (million Ch$) |
| 1H 03 |
| 1H 02 |
| Var 03-02 |
| Chg % |
|
|
|
|
|
| |||||
Operating |
| 220,577 |
| 232,644 |
| (12,067 | ) | (5.2 | %) |
Financing |
| 175,255 |
| (39,118 | ) | 214,373 |
| 548.0 | % |
Investment |
| 184,037 |
| (131,818 | ) | 315,855 |
| 239.6 | % |
|
|
|
|
|
| ||||
Net cash flow of the period |
| 579,869 |
| 61,708 |
| 518,161 |
| 839.7 | % |
|
|
|
|
|
|
The operating activities generated US$ 316 million of positive cash flow, which is practically similar to the cash flow at same date of the previous year. This flow is mainly composed of US$ 57 million profits of the period, plus net charges to profits that do not represent cash flow for US$ 551 million. The latter amount mainly corresponds to the Depreciation of the period for US$ 329 million, penalties and provisions for US$ 27 million, amortization of goodwill for US$ 39 million and the other charges that do not represent flow for US$ 133 million. Additionally, it considers the effect for conversion to BT 64 for US$ 111 million increased by the liabilities increase that affect the cash flow for US$ 110 million. The latter was partially compensated by:
• | Assets increase that impact the operating flow for US$ 193 million |
• | Debtors for sales increase in Argentina and Brazil, |
• | Amortization of negative goodwill for US$ 63 million, and |
• | Other credits which do not represent cash flow for US$ 16 million, out of which US$ 13 million correspond to the effect of the positive conversion of the subsidiaries abroad. |
The financing activities originated a positive cash flow for US$ 251 million, mainly originated by the placement of payment stock for US$ 666 million, the granting of loans for US$ 610 million and the placement of bonds for US$ 47 million. The latter is partially compensated by loan payments for US$ 662 million, dividend payments for US$ 89 million, payment of obligations with public for US$ 199 million and other investment disbursement for US$ 129 million.
Investment activities generated a positive net flow of US$ 263 million which mainly corresponds to the sales of Fixed Assets, Canutillar and Transmission Lines, for US$ 230 million, the investment sales by US$ 172 million, Río Maipo, and to other investment income by US$ 71 million, partially compensated by the incorporation of fixed assets by US$ 210 million, in which it outstands the investment that is being made by Endesa in the Central Ralco, which for this period adds up to US$ 108 million, and other disbursement by US$ 10 million.
35
ADDITIONAL CASH FLOW INFORMATION
Table 13.1 Cash Flow Received from Foreign Companies
|
| Interest Received |
| Dividends Received |
| Management Fee |
| Other |
| Total |
| ||||||||||
|
|
|
|
|
|
| |||||||||||||||
Thousand US$ |
| 1H 03 |
| 1H 02 |
| 1H 03 |
| 1H 02 |
| 1H 03 |
| 1H 02 |
| 1H 03 |
| 1H 02 |
| 1H 03 |
| 1H 02 |
|
|
|
|
|
|
|
|
|
|
|
| |||||||||||
Argentina |
| 9,529 |
| 17,015 |
| 0 |
| 0 |
| 0 |
| 1,500 |
| 0 |
| 40,000 |
| 9,529 |
| 58,515 |
|
Peru |
| 0 |
| 0 |
| 7,015 |
| 7,341 |
| 0 |
| 0 |
| 8,658 |
| 0 |
| 15,673 |
| 7,341 |
|
Brazil |
| 3,257 |
| 13,904 |
| 0 |
| 17,352 |
| 0 |
| 0 |
| 0 |
| 0 |
| 3,257 |
| 31,256 |
|
Colombia |
| 18,059 |
| 10,982 |
| 14,175 |
| 0 |
| 0 |
| 0 |
| 11,200 |
| 49,682 |
| 43,434 |
| 60,664 |
|
|
|
|
|
|
|
|
|
|
|
|
| ||||||||||
Total |
| 30,845 |
| 41,901 |
| 21,190 |
| 24,694 |
| 0 |
| 1,500 |
| 19,858 |
| 89,682 |
| 71,893 |
| 157,777 |
|
|
|
|
|
|
|
|
|
|
|
|
| ||||||||||
Table 13.2
|
| Interest Received |
| Dividends Received |
| Management Fee |
| Other |
| Total |
| ||||||||||
|
|
|
|
|
|
| |||||||||||||||
Millions Ch$ |
| 1H 03 |
| 1H 02 |
| 1H 03 |
| 1H 02 |
| 1H 03 |
| 1H 02 |
| 1H 03 |
| 1H 02 |
| 1H 03 |
| 1H 02 |
|
|
|
|
|
|
|
|
|
|
|
| |||||||||||
Argentina |
| 6,662 |
| 11,895 |
| 0 |
| 0 |
| 0 |
| 1,049 |
| 0 |
| 27,965 |
| 6,662 |
| 40,909 |
|
Peru |
| 0 |
| 0 |
| 4,904 |
| 5,133 |
| 0 |
| 0 |
| 6,053 |
| 0 |
| 10,957 |
| 5,133 |
|
Brazil |
| 2,277 |
| 9,721 |
| 0 |
| 12,131 |
| 0 |
| 0 |
| 0 |
| 0 |
| 2,277 |
| 21,852 |
|
Colombia |
| 12,625 |
| 7,678 |
| 9,910 |
| 0 |
| 0 |
| 0 |
| 7,830 |
| 34,734 |
| 30,365 |
| 42,412 |
|
|
|
|
|
|
|
|
|
|
|
|
| ||||||||||
Total |
| 21,564 |
| 29,294 |
| 14,814 |
| 17,264 |
| 0 |
| 1,049 |
| 13,883 |
| 62,699 |
| 50,262 |
| 110,305 |
|
|
|
|
|
|
|
|
|
|
|
|
| ||||||||||
Table 14.1
|
| Payments for additions of fixed |
| Depreciation |
| ||||
|
|
|
| ||||||
Thousand US$ |
| 1H 03 |
| 1H 02 |
| 1H 03 |
| 1H 02 |
|
|
|
|
|
| |||||
Endesa S.A. |
| 119,852 |
| 46,342 |
| 150,259 |
| 138,567 |
|
Chilectra S.A. |
| 17,389 |
| 11,316 |
| 8,927 |
| 8,847 |
|
Río Maipo S.A. |
| — |
| 4,585 |
| — |
| 1,321 |
|
Edesur S.A. |
| 16,930 |
| 13,038 |
| 45,054 |
| 46,289 |
|
Edelnor S.A. |
| 7,102 |
| 12,261 |
| 12,876 |
| 12,085 |
|
Cerj |
| 26,375 |
| 23,115 |
| 35,572 |
| 39,150 |
|
Coelce |
| 14,444 |
| 32,629 |
| 31,173 |
| 29,416 |
|
Codensa S.A. |
| 7,301 |
| 16,821 |
| 42,709 |
| 42,382 |
|
Cam Ltda. |
| 499 |
| 28 |
| 881 |
| 853 |
|
Inmobiliaria Manso de Velasco Ltda. |
| — |
| 637 |
| 169 |
| 147 |
|
Synapsis Soluciones y Servicios Ltda. |
| 182 |
| 36 |
| 727 |
| 953 |
|
Holding Enersis |
| — |
| — |
| 778 |
| 733 |
|
|
|
|
|
|
| ||||
Total |
| 210,073 |
| 160,808 |
| 329,125 |
| 320,742 |
|
|
|
|
|
|
| ||||
Table 14.2
|
| Payments for additions of fixed |
| Depreciation |
| ||||
|
|
|
| ||||||
Million Ch$ |
| 1H 03 |
| 1H 02 |
| 1H 03 |
| 1H 02 |
|
|
|
|
|
| |||||
Endesa S.A. |
| 83,791 |
| 32,399 |
| 105,049 |
| 96,875 |
|
Chilectra S.A. |
| 12,157 |
| 7,912 |
| 6,241 |
| 6,185 |
|
Río Maipo S.A. |
| — |
| 3,205 |
| — |
| 923 |
|
Edesur S.A. |
| 11,836 |
| 9,115 |
| 31,498 |
| 32,361 |
|
Edelnor S.A. |
| 4,965 |
| 8,572 |
| 9,002 |
| 8,449 |
|
Cerj |
| 18,439 |
| 16,160 |
| 24,869 |
| 27,371 |
|
Coelce |
| 10,098 |
| 22,811 |
| 21,794 |
| 20,565 |
|
Codensa S.A. |
| 5,104 |
| 11,760 |
| 29,859 |
| 29,630 |
|
Cam Ltda. |
| 349 |
| 20 |
| 616 |
| 596 |
|
Inmobiliaria Manso de Velasco Ltda. |
| — |
| 445 |
| 118 |
| 102 |
|
Synapsis Soluciones y Servicios Ltda. |
| 127 |
| 25 |
| 508 |
| 667 |
|
Holding Enersis |
| — |
| — |
| 544 |
| 512 |
|
|
|
|
|
|
| ||||
Total |
| 146,866 |
| 112,424 |
| 230,098 |
| 224,237 |
|
|
|
|
|
|
| ||||
36
PARENT COMPANY INCOME STATEMENT
(Under Chilean GAAP, thousand US$)
Table 15.1
Th. US$ |
| 1H 03 |
| 1H 02 |
| Var 03-02 |
| Chg % |
|
|
|
|
|
| |||||
Operating Revenues |
| 3,132 |
| 3,103 |
| 29 |
| 0.9 | % |
Operating Expenses |
| (810 | ) | (764 | ) | (46 | ) | -6.1 | % |
|
|
|
|
|
| ||||
Operating Margin |
| 2,322 |
| 2,339 |
| (17 | ) | -0.7 | % |
|
|
|
|
|
| ||||
Selling and Administrative Expenses |
| (10,582 | ) | (13,510 | ) | 2,928 |
| 21.7 | % |
|
|
|
|
|
| ||||
Operating Income |
| (8,260 | ) | (11,171 | ) | 2,911 |
| 26.1 | % |
|
|
|
|
|
| ||||
Interest Income |
| 28,985 |
| 40,923 |
| (11,938 | ) | -29.2 | % |
Interest Expense |
| (88,493 | ) | (105,310 | ) | 16,817 |
| 16.0 | % |
Net Financial Income (Expenses) |
| (59,508 | ) | (64,387 | ) | 4,879 |
| 7.6 | % |
Equity Gains from Related Companies |
| 67,167 |
| 179,331 |
| (112,163 | ) | -62.5 | % |
Equity Losses from Related Companies |
| (45,856 | ) | (832 | ) | (45,024 | ) | -5409.1 | % |
Net Income from Related Companies |
| 21,311 |
| 178,498 |
| (157,187 | ) | -88.1 | % |
Other Non Operating Income |
| 136,778 |
| 14,684 |
| 122,095 |
| 831.5 | % |
Other Non Operating Expenses |
| (20,641 | ) | (40,613 | ) | 19,972 |
| 49.2 | % |
Net other Non Operating Income (Expense) |
| 116,137 |
| (25,930 | ) | 142,067 |
| 547.9 | % |
Price Level Restatement |
| (13,305 | ) | 201 |
| (13,506 | ) | -6718.7 | % |
Foreign Exchange Effect |
| 17,384 |
| (14,839 | ) | 32,223 |
| 217.2 | % |
Net of Monetary Exposure |
| 4,079 |
| (14,638 | ) | 18,717 |
| 127.9 | % |
Positive Goodwill Amortization |
| (35,723 | ) | (38,849 | ) | 3,127 |
| 8.0 | % |
|
|
|
|
|
| ||||
Non Operating Income |
| 46,297 |
| 34,694 |
| 11,602 |
| 33.4 | % |
|
|
|
|
|
| ||||
Net Inc b. Taxes, Min Int and Neg Goodwill Amort |
| 38,037 |
| 23,523 |
| 14,513 |
| 61.7 | % |
|
|
|
|
|
| ||||
Income Tax |
| (11,908 | ) | 11,441 |
| (23,348 | ) | -204.1 | % |
Negative Goodwill Amortization |
| 30,920 |
| 58 |
| 30,862 |
| 53372.9 | % |
|
|
|
|
|
| ||||
NET INCOME |
| 57,049 |
| 35,022 |
| 22,028 |
| 62.9 | % |
|
|
|
|
|
|
37
PARENT COMPANY INCOME STATEMENT
(Under Chilean GAAP, million Ch$)
Table 15.2
Million Ch$ |
| 1H 03 |
| 1H 02 |
| Var 03-02 |
| Chg % |
|
|
|
|
|
| |||||
Operating Revenues |
| 2,190 |
| 2,169 |
| 21 |
| 0.9 | % |
Operating Expenses |
| (566 | ) | (534 | ) | (32 | ) | -6.1 | % |
|
|
|
|
|
| ||||
Operating Margin |
| 1,623 |
| 1,635 |
| (12 | ) | -0.7 | % |
|
|
|
|
|
| ||||
Selling and Administrative Expenses |
| (7,398 | ) | (9,445 | ) | 2,047 |
| 21.7 | % |
|
|
|
|
|
| ||||
Operating Income |
| (5,775 | ) | (7,810 | ) | 2,035 |
| 26.1 | % |
|
|
|
|
|
| ||||
Interest Income |
| 20,264 |
| 28,610 |
| (8,346 | ) | -29.2 | % |
Interest Expense |
| (61,867 | ) | (73,624 | ) | 11,757 |
| 16.0 | % |
Net Financial Income (Expenses) |
| (41,603 | ) | (45,014 | ) | 3,411 |
| 7.6 | % |
Equity Gains from Related Companies |
| 46,958 |
| 125,374 |
| (78,416 | ) | -62.5 | % |
Equity Losses from Related Companies |
| (32,059 | ) | (582 | ) | (31,477 | ) | -5409.1 | % |
Net Income from Related Companies |
| 14,899 |
| 124,792 |
| (109,893 | ) | -88.1 | % |
Other Non Operating Income |
| 95,624 |
| 10,266 |
| 85,359 |
| 831.5 | % |
Other Non Operating Expenses |
| (14,431 | ) | (28,393 | ) | 13,963 |
| 49.2 | % |
Net other Non Operating Income (Expense) |
| 81,194 |
| (18,128 | ) | 99,322 |
| 547.9 | % |
Price Level Restatement |
| (9,302 | ) | 141 |
| (9,442 | ) | -6718.7 | % |
Foreign Exchange Effect |
| 12,154 |
| (10,374 | ) | 22,528 |
| 217.2 | % |
Net of Monetary Exposure |
| 2,852 |
| (10,234 | ) | 13,086 |
| 127.9 | % |
Positive Goodwill Amortization |
| (24,974 | ) | (27,160 | ) | 2,186 |
| 8.0 | % |
|
|
|
|
|
| ||||
Non Operating Income |
| 32,367 |
| 24,256 |
| 8,111 |
| 33.4 | % |
|
|
|
|
|
| ||||
Net Income b. Taxes, Min Int and Neg Goodwill Amort |
| 26,592 |
| 16,446 |
| 10,147 |
| 61.7 | % |
|
|
|
|
|
| ||||
Income Tax |
| (8,325 | ) | 7,998 |
| (16,323 | ) | -204.1 | % |
Negative Goodwill Amortization |
| 21,617 |
| 40 |
| 21,577 |
| 53372.9 | % |
|
|
|
|
|
| ||||
NET INCOME |
| 39,884 |
| 24,484 |
| 15,400 |
| 62.9 | % |
|
|
|
|
|
|
38
PARTIALLY CONSOLIDATED INCOME STATEMENT
(Thousand US$)
Table 16.1
|
|
|
|
|
| Enersis S.A. |
|
|
|
|
|
|
|
2Q 03 |
| 2Q 02 |
| Var % |
| (in thousand US$ of 1H03) |
| 1H 03 |
| 1H 02 |
| Var % |
|
|
|
|
|
|
|
| |||||||
1,165 |
| 1,117 |
| 4.3 | % | Gross Operating Margin |
| 2,322 |
| 2,339 |
| -0.7 | % |
(5,573 | ) | (7,914 | ) | -29.6 | % | S&A Expenses |
| (10,582 | ) | (13,510 | ) | 21.7 | % |
|
|
|
|
|
|
|
| ||||||
-4,408 |
| -6,797 |
| -35.1 | % | Operating Income |
| -8,260 |
| -11,171 |
| 26.1 | % |
|
|
|
|
|
|
|
| ||||||
20,378 |
| 16,816 |
| 21.2 | % | Endesa |
| 41,098 |
| 32,017 |
| 28.4 | % |
61,999 |
| (20,862 | ) | -397.2 | % | Chilectra |
| 79,104 |
| (177 | ) | 44684.2 | % |
(4,016 | ) | 3,209 |
| -225.1 | % | Río Maipo |
| — |
| 6,918 |
| -100.0 | % |
(7,851 | ) | 17,118 |
| -145.9 | % | Edesur |
| (22,074 | ) | 19,042 |
| -215.9 | % |
3,524 |
| 4,029 |
| -12.5 | % | Edelnor |
| 5,813 |
| 7,634 |
| -23.9 | % |
(57,283 | ) | 63,979 |
| -189.5 | % | Cerj |
| (81,626 | ) | 72,664 |
| -212.3 | % |
173 |
| (648 | ) | -126.6 | % | Coelce |
| (2,473 | ) | (1,303 | ) | -89.7 | % |
(1,187 | ) | 474 |
| -350.4 | % | Codensa |
| (2,656 | ) | 1,665 |
| -259.5 | % |
1,811 |
| 2,477 |
| -26.9 | % | CAM LTDA |
| 3,427 |
| 3,703 |
| -7.5 | % |
395 |
| 1,436 |
| -72.5 | % | Inm Manso de Velasco |
| 591 |
| 1,521 |
| -61.1 | % |
1,859 |
| 1,706 |
| 8.9 | % | Synapsis |
| 3,362 |
| 3,380 |
| -0.5 | % |
(149 | ) | (42 | ) | 257.5 | % | Others |
| (171 | ) | (44 | ) | -291.6 | % |
|
|
|
|
|
|
|
| ||||||
19,652 |
| 89,693 |
| -78.1 | % | Net Income from Related Companies |
| 24,394 |
| 147,019 |
| -83.4 | % |
|
|
|
|
|
|
|
| ||||||
20,312 |
| 25,771 |
| -21.2 | % | Interest Income |
| 42,067 |
| 51,932 |
| -19.0 | % |
(43,018 | ) | (50,742 | ) | -15.2 | % | Interest Expense |
| (88,534 | ) | (101,654 | ) | 12.9 | % |
(22,706 | ) | (24,971 | ) | -9.1 | % | Net Financial Income (Expenses) |
| (46,467 | ) | (49,722 | ) | 6.5 | % |
133,589 |
| 4,842 |
| 2658.8 | % | Other Non Operating Income |
| 136,791 |
| 15,066 |
| 807.9 | % |
(15,662 | ) | (36,182 | ) | -56.7 | % | Other Non Operating Expenses |
| (20,644 | ) | (40,748 | ) | 49.3 | % |
117,927 |
| (31,340 | ) | -476.3 | % | Net other Non Operating Income (Expenses) |
| 116,147 |
| (25,681 | ) | 552.3 | % |
(17,673 | ) | (155 | ) | 11297.6 | % | Price Level Restatement |
| (14,528 | ) | (515 | ) | -2721.7 | % |
4,701 |
| 1,709 |
| 175.0 | % | Foreign Exchange Effect |
| 2,473 |
| 2,506 |
| -1.3 | % |
(12,973 | ) | 1,554 |
| -934.7 | % | Net Monetary Exposure |
| (12,055 | ) | 1,991 |
| -705.5 | % |
(17,631 | ) | (19,513 | ) | -9.6 | % | Positive Goodwill Amortization |
| (35,723 | ) | (38,912 | ) | 8.2 | % |
|
|
|
|
|
|
|
| ||||||
84,270 |
| 15,423 |
| 14725.8 | % | Non Operating Income |
| 46,296 |
| 34,694 |
| 33.4 | % |
|
|
|
|
|
|
|
| ||||||
79,862 |
| 8,626 |
| 825.8 | % | Net Income before (1), (2) & (3) |
| 38,036 |
| 23,523 |
| 61.7 | % |
|
|
|
|
|
|
|
| ||||||
(15,916 | ) | 2,459 |
| -747.2 | % | Income Tax (1) |
| (11,908 | ) | 11,441 |
| -204.1 | % |
30,903 |
| 34 |
| 90351.4 | % | Negative Goodwill Amortization (2) |
| 30,920 |
| 58 |
| 53372.9 | % |
— |
| — |
| NA |
| Minority Interest (3) |
| — |
| — |
| NA |
|
|
|
|
|
|
|
|
| ||||||
94,849 |
| 11,120 |
| 753.0 | % | NET INCOME |
| 57,049 |
| 35,021 |
| 62.9 | % |
|
|
|
|
|
|
|
| ||||||
2.18 |
| 0.94 |
|
|
| EPS (Ch$) |
| 1.31 |
| 2.95 |
|
|
|
0.16 |
| 0.07 |
|
|
| EPADS (US$) |
| 0.09 |
| 0.21 |
|
|
|
30,404,284 |
| 8,291,020 |
|
|
| Common Shares Outstanding (MM) |
| 30,404,284 |
| 8,291,020 |
|
|
|
|
|
|
|
|
|
|
|
|
|
39
PARTIALLY CONSOLIDATED INCOME STATEMENT
(Million Ch$)
Table 16.2
|
|
|
|
|
| Enersis S.A. |
|
|
|
|
|
|
|
2Q 03 |
| 2Q 02 |
| Var % |
| (in million Ch$ of 1H03) |
| 1H 03 |
| 1H 02 |
| Var % |
|
|
|
|
|
|
|
| |||||||
814 |
| 781 |
| 4.3 | % | Gross Operating Margin |
| 1,623 |
| 1,635 |
| -0.7 | % |
(3,896 | ) | (5,533 | ) | -29.6 | % | S&A Expenses |
| (7,398 | ) | (9,445 | ) | 21.7 | % |
|
|
|
|
|
|
|
| ||||||
-3,082 |
| -4,752 |
| -35.1 | % | Operating Income |
| -5,775 |
| -7,810 |
| 26.1 | % |
|
|
|
|
|
|
|
| ||||||
14,247 |
| 11,756 |
| 21.2 | % | Endesa |
| 28,733 |
| 22,384 |
| 28.4 | % |
43,345 |
| (14,585 | ) | -397.2 | % | Chilectra |
| 55,303 |
| (124 | ) | 44684.2 | % |
(2,808 | ) | 2,244 |
| -225.1 | % | Río Maipo |
| — |
| 4,837 |
| -100.0 | % |
(5,489 | ) | 11,968 |
| -145.9 | % | Edesur |
| (15,432 | ) | 13,312 |
| -215.9 | % |
2,464 |
| 2,817 |
| -12.5 | % | Edelnor |
| 4,064 |
| 5,337 |
| -23.9 | % |
(40,048 | ) | 44,729 |
| -189.5 | % | Cerj |
| (57,066 | ) | 50,801 |
| -212.3 | % |
121 |
| (453 | ) | -126.6 | % | Coelce |
| (1,729 | ) | (911 | ) | -89.7 | % |
(830 | ) | 331 |
| -350.4 | % | Codensa |
| (1,857 | ) | 1,164 |
| -259.5 | % |
1,266 |
| 1,731 |
| -26.9 | % | CAM LTDA |
| 2,396 |
| 2,589 |
| -7.5 | % |
276 |
| 1,004 |
| -72.5 | % | Inm Manso de Velasco |
| 413 |
| 1,063 |
| -61.1 | % |
1,299 |
| 1,193 |
| 8.9 | % | Synapsis |
| 2,351 |
| 2,363 |
| -0.5 | % |
(104 | ) | (29 | ) | 257.5 | % | Other |
| (120 | ) | (31 | ) | -291.6 | % |
|
|
|
|
|
|
|
| ||||||
13,739 |
| 62,706 |
| -78.1 | % | Net Income from Related Companies |
| 17,055 |
| 102,784 |
| -83.4 | % |
|
|
|
|
|
|
|
| ||||||
14,201 |
| 18,017 |
| -21.2 | % | Interest Income |
| 29,410 |
| 36,307 |
| -19.0 | % |
(30,075 | ) | (35,475 | ) | -15.2 | % | Interest Expense |
| (61,896 | ) | (71,069 | ) | 12.9 | % |
(15,874 | ) | (17,458 | ) | -9.1 | % | Net Financial Income (Expenses) |
| (32,486 | ) | (34,762 | ) | 6.5 | % |
93,395 |
| 3,385 |
| 2658.8 | % | Other Non Operating Income |
| 95,633 |
| 10,533 |
| 807.9 | % |
(10,949 | ) | (25,296 | ) | -56.7 | % | Other Non Operating Expenses |
| (14,432 | ) | (28,488 | ) | 49.3 | % |
82,445 |
| (21,910 | ) | -476.3 | % | Net other Non Operating Income (Expenses) |
| 81,201 |
| (17,954 | ) | 552.3 | % |
(12,356 | ) | (108 | ) | 11297.6 | % | Price Level Restatement |
| (10,157 | ) | (360 | ) | -2721.7 | % |
3,286 |
| 1,195 |
| 175.0 | % | Foreign Exchange Effect |
| 1,729 |
| 1,752 |
| -1.3 | % |
(9,070 | ) | 1,087 |
| -934.7 | % | Net Monetary Exposure |
| (8,428 | ) | 1,392 |
| -705.5 | % |
(12,326 | ) | (13,642 | ) | -9.6 | % | Positive Goodwill Amortization |
| (24,974 | ) | (27,204 | ) | 8.2 | % |
|
|
|
|
|
|
|
| ||||||
58,915 |
| 10,783 |
| 446.4 | % | Non Operating Income |
| 32,367 |
| 24,255 |
| 33.4 | % |
|
|
|
|
|
|
|
| ||||||
55,833 |
| 6,031 |
| 825.8 | % | Net Income before (1), (2) & (3) |
| 26,592 |
| 16,445 |
| 61.7 | % |
|
|
|
|
|
|
|
| ||||||
(11,127 | ) | 1,719 |
| -747.2 | % | Income Tax (1) |
| (8,325 | ) | 7,998 |
| -204.1 | % |
21,605 |
| 24 |
| 90351.4 | % | Negative Goodwill Amortization (2) |
| 21,617 |
| 40 |
| 53372.9 | % |
— |
| — |
| NA |
| Minority Interest (3) |
| — |
| — |
| NA |
|
|
|
|
|
|
|
|
| ||||||
66,311 |
| 7,774 |
| 753.0 | % | NET INCOME |
| 39,884 |
| 24,484 |
| 62.9 | % |
|
|
|
|
|
|
|
| ||||||
2.18 |
| 0.94 |
|
|
| EPS (Ch$) |
| 1.31 |
| 2.95 |
|
|
|
0.16 |
| 0.07 |
|
|
| EPADS (US$) |
| 0.09 |
| 0.21 |
|
|
|
30,404,284 |
| 8,291,020 |
|
|
| Common Shares Outstanding (MM) |
| 30,404,284 |
| 8,291,020 |
|
|
|
|
|
|
|
|
|
|
|
|
|
40
OWNERSHIP OF THE COMPANY AS OF JUNE 30th, 2003
TOTAL SHAREHOLDERS: 10.330
CONFERENCE CALL INVITATION
Enersis is pleased to inform you that it will hold a conference call to review its results for the
period, on Friday, August 1st, 2003, at 12:00 noon (New York time). To participate, please dial
+1 (973) 317-5319
or (800) 915-4836 (toll free USA), approximately 10 minutes prior to the scheduled start time.
The phone replay will be available since August 1st, at 14:00 pm, until August 8th, at 11:59 am,
dialing
+1 (973) 709-2089 or (800) 428-6051 (toll free USA) Passcode ID: 301965.
To access the call online, or to access the replay, go to http://www.enersis.com
This Press Release contains statements that could constitute forward-looking statements within the meaning of the Private Securities Litigation Reform Act of 1995. These statements appear in a number of places in this announcement and include statements regarding the intent, belief or current expectations of Enersis and its management with respect to, among other things: (1) Enersis’ business plans; (2) Enersis’ cost-reduction plans; (3) trends affecting Enersis’ financial condition or results of operations, including market trends in the electricity sector in Chile or elsewhere; (4) supervision and regulation of the electricity sector in Chile or elsewhere; and (5) the future effect of any changes in the laws and regulations applicable to Enersis’ or its affiliates. Such forward-looking statements are not guarantees of future performance and involve risks and uncertainties. Actual results may differ materially from those in the forward-looking statements as a result of various factors. These factors include a decline in the equity capital markets of the United States or Chile, an increase in the market rates of interest in the United States or elsewhere, adverse decisions by government regulators in Chile or elsewhere and other factors described in Enersis’ Annual Report on Form 20-F. Readers are cautioned not to place undue reliance on those forward-looking statements, which state only as of their dates. Enersis undertakes no obligation to release publicly the result of any revisions to these forward-looking statements.
41