Exhibit 1 ENERSIS ANNOUNCES CONSOLIDATED RESULTS FOR NINE MONTHS |
| › | Net Income increased 46.3% compared to the same period last year, US$ 12.2 million of higher profits. |
| › | Total financial debt decreased by US$ 2,297 million as of September 2003. |
| › | Enersis prepaid debt by US$ 582 million of the syndicated loan. |
| › | Our generation subsidiary, Endesa Chile, prepaid debt by US$ 262 million of the syndicated loan signed last May 2003 and totally paid US$ 381 EMTN bond. |
| › | The second preemptive rights offering period of the Capital Increase will take place between November 20 and December 20, 2003. |
| › | Labor productivity in distribution business continued in a positive trend, increasing 3.1%, from 1,367 up to 1,409 clients per employee. |
| › | Clients increased in 210 thousand new customers, equivalent to 2.0%. |
| › | Physical sales on distribution increased from 35,484 to 37,243 GWh, representing a 5.0% increase, confirming the better trend of economic activity. |
| › | Physical sales in generation business increased from 36,293 to 38,495 GWh, representing an increase of 6.1%. |
| › | Operating Income increased 2.6% respect the same period of 2002 but eliminating foreign exchange effect and deconsolidations of Rio Maipo and Infraestructura 2000. |
| › | Share price increased since July 1 to September 30, 2003 in 14.1% and to 32.3% as of October 21, 2003. |
| › | Risk perception of the company continues improving. |
| www.enersis.cl | Santa Rosa 76, Santiago, CHILE Phone: 56 (2) 353 4682 | Pg. 4 |
| PRESS RELEASE | |
| Results for Nine Months Ended September 2003 | |
TABLE OF CONTENTS |
| www.enersis.cl | Santa Rosa 76, Santiago, CHILE Phone: 56 (2) 353 4682 | Pg. 5 |
| PRESS RELEASE | |
| Results for Nine Months Ended September 2003 | |
| www.enersis.cl | Santa Rosa 76, Santiago, CHILE Phone: 56 (2) 353 4682 | Pg. 6 |
| PRESS RELEASE | |
| Results for Nine Months Ended September 2003 | |
| a) | In Chile: Endesa Chile (NYSE: EOC), Chilectra, Synapsis, CAM Ltd. and Inm. Manso de Velasco. |
| b) | Outside Chile: Distrilima (Peru), Cerj and Investluz (Brazil), Edesur (Argentina), Luz de Bogotá (Colombia). |

| www.enersis.cl | Santa Rosa 76, Santiago, CHILE Phone: 56 (2) 353 4682 | Pg. 7 |
| PRESS RELEASE | |
| Results for Nine Months Ended September 2003 | |
RISK RATING CLASSIFICATIONInternational risk rating classification: |
| INVESTMENT GRADE | STANDARD & POOR’S | FITCH | MOODY’S | |||
| Top quality; | AAA | AAA | Aaa | |||
| “Gilt-edged” High Grade; | AA+ | AA+ | Aa1 | |||
| Very Strong | AA | AA | Aa2 | |||
| Strong | AA- | AA- | Aa3 | |||
| Upper Medium Grade; | A+ | A+ | A1 | |||
| Strong | A | A | A2 | |||
| A- | A- | A3 | ||||
| Medium Grade; | BBB+ | BBB+ | Baa1 | |||
| Adequate | BBB | BBB | Baa2 | |||
| BBB-/Stable | BBB-/Stable | Baa3 | ||||
| NON INVESTMENT GRADE | ||||||
| Speculative elements; | BB+ | BB+ | Ba1 | |||
| Major uncertainties | BB | BB | Ba2 | |||
| BB- | BB- | Ba3/Stable | ||||
| Not Desirable; | B+ | B+ | B1 | |||
| Impaired Ability to Meet Obligations | B | B | B2 | |||
| B- | B- | B3 | ||||
Local risk rating classification: |
| FELLER RATE | FITCH | HUMPHREY’S | |||||
| 1st Class Level 1 | 1st Class Level 1 | 1st Class Level 1 | |||||
| Shares | 1st Class Level 2 | 1st Class Level 2 | 1st Class Level 2 | ||||
| 1st Class Level 3 | 1st Class Level 3 | 1st Class Level 3 | |||||
| A+ | A+ | A+ | |||||
| A | A | A | |||||
| Bonds | A- | A- | A- | ||||
| BBB+ | BBB+ | BBB+ | |||||
| BBB | BBB | BBB | |||||
| BBB- | BBB- | BBB- | |||||
| www.enersis.cl | Santa Rosa 76, Santiago, CHILE Phone: 56 (2) 353 4682 | Pg. 8 |
| PRESS RELEASE | |
| Nine Months 2003 - Market Information | |
| Bolsa de Comercio de Santiago (BCS) | New York Stock Exchange (NYSE) | |
| Stock price variation v/s Local Stock Index | Stock price variation v/s Local Stock Index | |
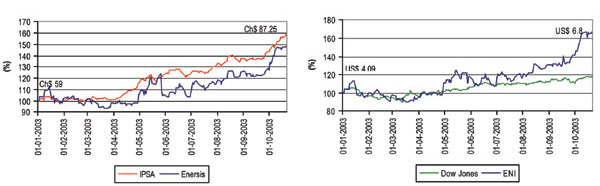 | ||
| Monthly Average Transactions Volume | Monthly Average Transactions Volume | |
 | ||
| Source: Bloomberg | ||
| www.enersis.cl | Santa Rosa 76, Santiago, CHILE Phone: 56 (2) 353 4682 | Pg. 9 |
| PRESS RELEASE | |
| Nine Months 2003 - Market Information | |
| Bolsa de Comercio de Madrid (Latibex) |
| Stock price variation v/s Local Stock Index |
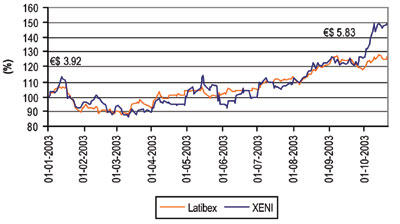 |
| Monthly Average Transactions Volume |
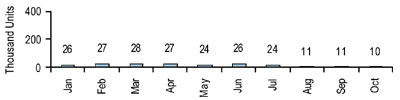 |
| Source: Bloomberg |
MARKET PERCEPTIONThe latest research published during the last term on Enersis, shows the following target prices for the ADR. Table 1 |
| Date of Publication | Company | Main Analyst | Target Price US$ (*) | Recomendation | |||||
| October 17, 2003 | Bear Stearns | Rowe Michaels | 7.30 | Outperform | |||||
| October 15, 2003 | Santander Inv. | Raimundo Valdés | 8.05 | Buy | |||||
| October 6, 2003 | Merrill Lynch | Frank McGann | 7.60 | Buy | |||||
| September 10, 2003 | BBVA | Mariela Iturriaga | 5.75 | Hold | |||||
| September 4, 2003 | Larrain Vial | Jorge Astaburuaga | 5.45 | — | |||||
| September 2, 2003 | ING | Ricardo Fernández | 10.90 | Strong Buy | |||||
| September 1, 2003 | CSFB | Emerson Leite | 6.40 | Neutral | |||||
| July 28, 2003 | BCI | Paulina Barahona | 4.95 | Buy | |||||
(*) Each research uses a different exchange rate. On average the target price is US$ 7.05 per ADR. |
| www.enersis.cl | Santa Rosa 76, Santiago, CHILE Phone: 56 (2) 353 4682 | Pg. 10 |
| PRESS RELEASE | |
| Nine Months 2003 - Market Information | |
DEBT MARKETBelow you will find a graph showing the risk perception measured over Enersis’ Yankee Bonds prices. |
| Enersis Yankee Bonds |
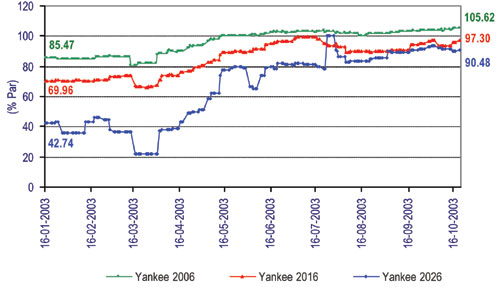 |
| Source: Bloomberg |
| www.enersis.cl | Santa Rosa 76, Santiago, CHILE Phone: 56 (2) 353 4682 | Pg. 11 |
| PRESS RELEASE | |
| Nine Months 2003 - Capital Increase | |

| Available Shares after Local Bond Exchange | Prorrata Factor (New shares per share) | ||||
| 1 - No Local Bond Exchange | 2,269,730,428 | 0.2140 | |||
| 2 - Full Local Bond Exchange (Aprox.) | 964,392,301 | 0.0809 | |||
| www.enersis.cl | Santa Rosa 76, Santiago, CHILE Phone: 56 (2) 353 4682 | Pg. 12 |
| PRESS RELEASE | |
| Nine Months 2003 - Consolidated Income Statement | |
CONSOLIDATED INCOME STATEMENTUNDER CHILEAN GAAP, THOUSAND US$Table 3 |
| Thousand US$ | 9M 03 | 9M 02 | Chg % | ||||
| Revenues from Generation | 1,081,138 | 1,068,014 | 1.2 | % | |||
| Revenues from Distribution | 1,915,697 | 2,180,399 | (12.1 | %) | |||
| Revenues from Other Businesses | 189,089 | 211,837 | (10.7 | %) | |||
| Consolidation Adjustments | (371,433 | ) | (372,645 | ) | 0.3 | % | |
| Operating Revenues | 2,814,492 | 3,087,606 | (8.8 | %) | |||
| Op. Expenses from Generation | (639,123 | ) | (633,045 | ) | (1.0 | %) | |
| Op. Expenses from Distribution | (1,528,237 | ) | (1,702,985 | ) | 10.3 | % | |
| Op.Expenses from Other Businesses | (144,332 | ) | (159,193 | ) | 9.3 | % | |
| Consolidation Adjustments | 340,102 | 349,131 | (2.6 | %) | |||
| Operating Expenses | (1,971,591 | ) | (2,146,094 | ) | 8.1 | % | |
| Operating Margin | 842,901 | 941,512 | (10.5 | %) | |||
| SG&A from Generation | (34,445 | ) | (36,052 | ) | 4.5 | % | |
| SG&A from Distribution | (159,953 | ) | (200,415 | ) | 20.2 | % | |
| SG&A from Other Businesses | (34,436 | ) | (38,466 | ) | 10.5 | % | |
| Consolidation Adjustments | 33,284 | 31,145 | 6.9 | % | |||
| Selling and Administrative Expenses | (195,549 | ) | (243,787 | ) | 19.8 | % | |
| Operating Income | 647,352 | 697,725 | (7.2 | %) | |||
| Interest Income | 81,660 | 97,711 | (16.4 | %) | |||
| Interest Expense | (491,395 | ) | (517,559 | ) | 5.1 | % | |
| Net Financial Income (Expenses) | (409,735 | ) | (419,848 | ) | 2.4 | % | |
| Equity Gains from Related Companies | 31,826 | 7,406 | 329.7 | % | |||
| Equity Losses from Related Companies | (189 | ) | (7,319 | ) | 97.4 | % | |
| Net Income from Related Companies | 31,638 | 88 | — | ||||
| Other Non Operating Income | 249,390 | 489,982 | (49.1 | %) | |||
| Other Non Operating Expenses | (281,383 | ) | (305,954 | ) | 8.0 | % | |
| Net other Non Operating Income (Expenses) | (31,993 | ) | 184,028 | (117.4 | %) | ||
| Price Level Restatement | (11,021 | ) | 10,395 | (206.0 | %) | ||
| Foreign Exchange Effect | (749 | ) | (26,836 | ) | 97.2 | % | |
| Net of Monetary Exposure | (11,769 | ) | (16,441 | ) | 28.4 | % | |
| Positive Goodwill Amortization | (60,920 | ) | (97,175 | ) | 37.3 | % | |
| Non Operating Income | (482,781 | ) | (349,347 | ) | (38.2 | %) | |
| Net Inc b. Taxes, Min Int and Neg Goodwill Amort. | 164,572 | 348,378 | (52.8 | %) | |||
| Extraordinary Items | — | (36,666 | ) | 100.0 | % | ||
| Income Tax | (117,116 | ) | (126,340 | ) | 7.3 | % | |
| Minority Interest | (81,194 | ) | (221,132 | ) | 63.3 | % | |
| Negative Goodwill Amortization | 72,373 | 62,172 | 16.4 | % | |||
| NET INCOME | 38,635 | 26,413 | 46.3 | % | |||
| R.A.I.I.D.A.I.E. | 1,253,703 | 1,334,608 | (6.1 | %) | |||
RAIIDAIE: Net income before taxes, interest, depreciation, amortization and extraordinary items (as defined by local SEC). |
| www.enersis.cl | Santa Rosa 76, Santiago, CHILE Phone: 56 (2) 353 4682 | Pg. 13 |
| PRESS RELEASE | |
| Nine Months 2003 - Consolidated Income Statement | |
UNDER CHILEAN GAAP, MILLION CH$Table 3.1 |
| Million Ch$ | 9M 03 | 9M 02 | Chg % | ||||
| Revenues from Generation | 714,600 | 705,925 | 1.2 | % | |||
| Revenues from Distribution | 1,266,218 | 1,441,178 | (12.1 | %) | |||
| Revenues from Other Businesses | 124,982 | 140,018 | (10.7 | %) | |||
| Consolidation Adjustments | (245,506 | ) | (246,307 | ) | 0.3 | % | |
| Operating Revenues | 1,860,295 | 2,040,815 | (8.8 | %) | |||
| Op. Expenses from Generation | (422,441 | ) | (418,424 | ) | (1.0 | %) | |
| Op. Expenses from Distribution | (1,010,119 | ) | (1,125,622 | ) | 10.3 | % | |
| Op. Expenses from Other Businesses | (95,399 | ) | (105,222 | ) | 9.3 | % | |
| Consolidation Adjustments | 224,797 | 230,765 | (2.6 | %) | |||
| Operating Expenses | (1,303,162 | ) | (1,418,503 | ) | 8.1 | % | |
| Operating Margin | 557,132 | 622,311 | (10.5 | %) | |||
| SG&A from Generation | (22,767 | ) | (23,829 | ) | 4.5 | % | |
| SG&A from Distribution | (105,724 | ) | (132,468 | ) | 20.2 | % | |
| SG&A from Other Businesses | (22,761 | ) | (25,425 | ) | 10.5 | % | |
| Consolidation Adjustments | 22,000 | 20,586 | 6.9 | % | |||
| Selling and Administrative Expenses | (129,252 | ) | (161,136 | ) | 19.8 | % | |
| Operating Income | 427,880 | 461,175 | (7.2 | %) | |||
| Interest Income | 53,975 | 64,584 | (16.4 | %) | |||
| Interest Expense | (324,797 | ) | (342,091 | ) | 5.1 | % | |
| Net Financial Income (Expenses) | (270,823 | ) | (277,507 | ) | 2.4 | % | |
| Equity Gains from Related Companies | 21,036 | 4,895 | 329.7 | % | |||
| Equity Losses from Related Companies | (125 | ) | (4,837 | ) | 97.4 | % | |
| Net Income from Related Companies | 20,911 | 58 | — | ||||
| Other Non Operating Income | 164,839 | 323,864 | (49.1 | %) | |||
| Other Non Operating Expenses | (185,986 | ) | (202,226 | ) | 8.0 | % | |
| Net other Non Operating Income (Expense) | (21,146 | ) | 121,637 | (117.4 | %) | ||
| Price Level Restatement | (7,284 | ) | 6,870 | (206.0 | %) | ||
| Foreign Exchange Effect | (495 | ) | (17,737 | ) | 97.2 | % | |
| Net of Monetary Exposure | (7,779 | ) | (10,867 | ) | 28.4 | % | |
| Positive Goodwill Amortization | (40,267 | ) | (64,230 | ) | 37.3 | % | |
| Non Operating Income | (319,103 | ) | (230,908 | ) | (38.2 | %) | |
| Net Income b. Taxes, Min Int and Neg Goodwill Amort. | 108,777 | 230,267 | (52.8 | %) | |||
| Extraordinary Items | — | (24,235 | ) | 100.0 | % | ||
| Income Tax | (77,410 | ) | (83,507 | ) | 7.3 | % | |
| Minority Interest | (53,666 | ) | (146,161 | ) | 63.3 | % | |
| Negative Goodwill Amortization | 47,836 | 41,094 | 16.4 | % | |||
| NET INCOME | 25,537 | 17,458 | 46.3 | % | |||
| R.A.I.I.D.A.I.E. | 828,660 | 882,136 | (6.1 | %) | |||
RAIIDAIE: Net income before taxes, interest, depreciation, amortization and extraordinary items (as defined by local SEC). |
| www.enersis.cl | Santa Rosa 76, Santiago, CHILE Phone: 56 (2) 353 4682 | Pg. 14 |
| PRESS RELEASE | |
| Nine Months 2003 - Consolidated Income Statement Analysis | |
| 9M 03 | 9M 02 | |||||||||||||||
| Thousand US$ | Operating Revenues | Operating Expenses | SG & A | Operating Income | Operating Revenues | Operating Expenses | SG & A | Operating Income | ||||||||
| Endesa S.A. | 1,108,102 | (661,711 | ) | (35,433 | ) | 410,958 | 1,113,819 | (665,392 | ) | (38,342 | ) | 410,085 | ||||
| Chilectra S.A. | 482,644 | (337,999 | ) | (36,407 | ) | 108,238 | 458,785 | (317,001 | ) | (35,339 | ) | 106,445 | ||||
| Rio Maipo S.A. | — | — | — | — | 65,032 | (48,636 | ) | (4,180 | ) | 12,215 | ||||||
| Edesur S.A. | 228,865 | (203,779 | ) | (34,413 | ) | (9,327 | ) | 250,856 | (215,589 | ) | (37,938 | ) | (2,672 | ) | ||
| Edelnor | 222,310 | (166,256 | ) | (20,458 | ) | 35,596 | 245,412 | (181,023 | ) | (23,174 | ) | 41,215 | ||||
| Cerj | 390,606 | (337,283 | ) | (12,365 | ) | 40,958 | 453,488 | (395,522 | ) | (18,114 | ) | 39,852 | ||||
| Coelce | 249,193 | (186,511 | ) | (33,812 | ) | 28,870 | 296,535 | (205,153 | ) | (49,860 | ) | 41,522 | ||||
| Codensa S.A. | 342,078 | (296,408 | ) | (22,497 | ) | 23,172 | 410,292 | (340,062 | ) | (31,796 | ) | 38,434 | ||||
| CAM Ltda. | 99,534 | (78,320 | ) | (6,796 | ) | 14,418 | 98,756 | (79,010 | ) | (7,763 | ) | 11,984 | ||||
| Inmobiliaria Manso de Velasco Ltda. | 8,170 | (7,899 | ) | (1,878 | ) | (1,607 | ) | 6,533 | (3,695 | ) | (1,708 | ) | 1,130 | |||
| Synapsis Soluciones y Servicios IT Ltda. | 49,441 | (34,238 | ) | (7,114 | ) | 8,090 | 55,818 | (42,916 | ) | (7,002 | ) | 5,900 | ||||
| Enersis Holding and other investment vehicles | 4,982 | (1,289 | ) | (17,660 | ) | (13,967 | ) | 4,926 | (1,227 | ) | (19,716 | ) | (16,017 | ) | ||
| Consolidation Adjustments | (371,433 | ) | 340,102 | 33,284 | 1,953 | (372,646 | ) | 349,131 | 31,145 | 7,630 | ||||||
| Total Consolidation | 2,814,491 | (1,971,590 | ) | (195,549 | ) | 647,352 | 3,087,606 | (2,146,094 | ) | (243,787 | ) | 697,725 | ||||
Table 4.1 |
| 9M 03 | 9M 02 | |||||||||||||||
| Million Ch$ | Operating Revenues | Operating Expenses | SG & A | Operating Income | Operating Revenues | Operating Expenses | SG & A | Operating Income | ||||||||
| Endesa S.A. | 732,422 | (437,371 | ) | (23,420 | ) | 271,631 | 736,201 | (439,804 | ) | (25,343 | ) | 271,054 | ||||
| Chilectra S.A. | 319,013 | (223,407 | ) | (24,064 | ) | 71,542 | 303,243 | (209,528 | ) | (23,358 | ) | 70,357 | ||||
| Rio Maipo S.A. | — | — | — | — | 42,984 | (32,147 | ) | (2,763 | ) | 8,074 | ||||||
| Edesur S.A. | 151,273 | (134,692 | ) | (22,746 | ) | (6,165 | ) | 165,808 | (142,498 | ) | (25,076 | ) | (1,766 | ) | ||
| Edelnor | 146,940 | (109,890 | ) | (13,522 | ) | 23,528 | 162,210 | (119,651 | ) | (15,317 | ) | 27,242 | ||||
| Cerj | 258,179 | (222,934 | ) | (8,173 | ) | 27,072 | 299,742 | (261,428 | ) | (11,973 | ) | 26,341 | ||||
| Coelce | 164,709 | (123,278 | ) | (22,349 | ) | 19,082 | 196,001 | (135,600 | ) | (32,956 | ) | 27,445 | ||||
| Codensa S.A. | 226,103 | (195,917 | ) | (14,870 | ) | 15,316 | 271,191 | (224,771 | ) | (21,016 | ) | 25,404 | ||||
| CAM Ltda | 65,789 | (51,767 | ) | (4,492 | ) | 9,530 | 65,275 | (52,223 | ) | (5,131 | ) | 7,921 | ||||
| Inmobiliaria Manso de Velasco Ltda. | 5,400 | (5,221 | ) | (1,241 | ) | (1,062 | ) | 4,318 | (2,442 | ) | (1,129 | ) | 747 | |||
| Synapsis Soluciones y Servicios IT Ltda. | 32,679 | (22,630 | ) | (4,702 | ) | 5,347 | 36,894 | (28,366 | ) | (4,628 | ) | 3,900 | ||||
| Enersis Holding and other investment vehicles | 3,293 | (852 | ) | (11,673 | ) | (9,232 | ) | 3,256 | (811 | ) | (13,032 | ) | (10,587 | ) | ||
| Consolidation Adjustments | (245,506 | ) | 224,797 | 22,000 | 1,291 | (246,308 | ) | 230,765 | 20,586 | 5,043 | ||||||
| Total Consolidation | 1,860,294 | (1,303,162 | ) | (129,252 | ) | 427,880 | 2,040,815 | (1,418,504 | ) | (161,136 | ) | 461,175 | ||||
Operating Income for the period ended September 2003 amounted to US$ 647.4 million, which represents a decrease of US$ 50.4 million, or 7.2%, respect to the same period of 2002. This decrease is due principally to the lower results obtained from our distribution subsidiaries, Codensa, Edesur, Cerj and Coelce, in addition to the deconsolidation of Río Maipo and Infraestructura 2000, partially compensated by improvement in the operating results shown by Endesa, Chilectra, Synapsis and CAM. If we compare this period with that of the year 2002 without Río Maipo and Infraestructura 2000, the reduction in the operating income would be only 2.8% (remember that these two companies were sold). |
| www.enersis.cl | Santa Rosa 76, Santiago, CHILE Phone: 56 (2) 353 4682 | Pg. 15 |
| PRESS RELEASE | |
| Nine Months 2003 - Consolidated Income Statement Analysis | |
| Enersis Financial Debt Maturity with Third Parties Total Enersis: US$ 1,846 million Total Enersis Cons.: US$ 6,696 million |
 |
Non-Operating Income registered a loss of US$ 482.8 million, which represents an increase of US$ 133.4 million respect to losses of US$ 349.4 million for the same period of the previous year. This is mainly explained by accounting losses of the subsidiaries in Argentina and Brazil derived from the application of the Technical Bulletin 64 and as result of the appreciation of the Argentine Peso and the Brazilian Real respect to the US Dollar. Partially compensated by improved results obtained from investments in related companies, specifically CIEN; a reduction in financial expenses due to the smaller financial debt; lower amortization of the negative goodwill of investments resulting from the write-off carried out in December 2002 and at the same time, due to improved net results from exchange differences and from price-level restatement during the period. The Net Financial Incomeshows a reduction of US$ 6.3 million from US$ 419.9 million as of September 2002 to US$ 409.7 million in the current period, a fall of 1.5%. The decrease in expenses is the result of a reduction in debts and lower interest rates on the international markets with respect to the previous period. Investments in Related Companies show an increase of US$ 31.6 million, from a net profit of US$ 0.1 million as of September 2002 to a net profit of US$ 31.6 million as of September 2003. Primarily due to the result of the related company, CIEN, from which a rise of US$ 9 million in profit was registered, together with the positive effects of the exchange rates during the period on the related companies, Gas Atacama Generación, Gasoducto Atacama Argentina, Inversiones Eléctrica Quillota, Inversiones Electrogas and Atacama Finance Co. for whom the following improved results have been recorded: US$ 9.3, US$ 4.4, US$ 2.8, US$ 2.8 and US$ 1.8 million, respectively. |
| www.enersis.cl | Santa Rosa 76, Santiago, CHILE Phone: 56 (2) 353 4682 | Pg. 16 |
| PRESS RELEASE | |
| Nine Months 2003 - Consolidated Income Statement Analysis | |
Positive Goodwill Amortizationshows a reduction of US$ 36.2 million or 37.3% compared to the amortization of US$ 60.9 million as of September 2003. The lower amortization is consequence of the writes off performed in December 2002 of the entire balance of negative and positive goodwill of companies established in Argentina and Brazil. Net Other Non-Operating Incomeregistered a loss of US$ 216.0 million, from a profit of US$ 184.0 million registered as of September 2002 to a loss of US$ 32 million. The main reasons that explain this variation are detailed as follows: |
| › | Increase of US$ 414.1 million in by applying the norms contained in Technical Bulletin Nº 64, particularly in respect of the subsidiaries in Brazil and Argentina. This was principally due to the revaluations of the Brazilian Real and the Argentine Peso against the US Dollar and their impact on the structure of the monetary assets and liabilities. |
| › | Reduction of US$ 51.5 million in income due to adjustments related to previous years. |
| › | Increase of US$ 24.6 million in expenses on taxes and tax fines. |
| › | Expenses of US$ 9.2 million on updating pensions and UFIR Brazil taxes. |
| › | Loss of US$ 20.6 million on sale of materials. |
| › | Reduction of US$ 13.5 million in profit from forward operations. |
The above were partially compensated by: |
| › | Profits before tax, of US$ 134.2 million due to the sale of Río Maipo and Infraestructura 2000. |
| › | Reduction of US$ 118.2 million on provisions on contingencies and lawsuits. |
| › | Indemnities and commissions for US$ 12.9 million received. |
| › | Recovery of expenses for US$ 8 million. |
| › | Profit of US$ 4 million on recalculation of Power at the Central Interconnected System. |
Price-level Restatement and Exchange Differencesshow a net positive variation of US$ 4.7 million improving from a loss of US$ 16.4 million as of September 30, 2002, down to a loss of US$ 11.7 million during this period. This principally due to the effects of the nominal appreciation of the Chilean Peso against the US Dollar of 8.0% as of September 30, 2003 compared to the nominal devaluation of 14.3% as of the same date of the previous year. These effects were compensated to a large extent by the exchange hedging mechanisms the company maintains in place. |
| www.enersis.cl | Santa Rosa 76, Santiago, CHILE Phone: 56 (2) 353 4682 | Pg. 17 |
| PRESS RELEASE | |
| Nine Months 2003 - Consolidated Income Statement Analysis | |
| www.enersis.cl | Santa Rosa 76, Santiago, CHILE Phone: 56 (2) 353 4682 | Pg. 18 |
| PRESS RELEASE | |
| Nine Months 2003 - Consolidated Income Statement Analysis | |
EVOLUTION OF KEY FINANCIAL RATIOSTable 5 |
| Indicator | Unit | 9M 03 | 9M 02 | Var 03-02 | Chg % | ||||||
| Liquidity | Times | 1.06 | 0.60 | 0.46 | 76.7 | % | |||||
| Acid ratio test* | Times | 1.05 | 0.59 | 0.46 | 78.0 | % | |||||
| Working capital | million Ch$ | 64,659 | (966,146 | ) | 1,030,805 | 106.7 | % | ||||
| Working capital | thousands US$ | 97,824 | (1,461,709 | ) | 1,559,534 | 106.7 | % | ||||
| Leverage** | Times | 0.89 | 1.39 | (0.50 | ) | 36.0 | % | ||||
| Short-term debt | % | 0.21 | 0.30 | (0.09 | ) | (30.0 | %) | ||||
| Long-term debt | % | 0.79 | 0.70 | 0.09 | 12.9 | % | |||||
| Interest Coverage*** | Times | 2.55 | 2.58 | (0.03 | ) | (1.2 | %) | ||||
| EBITDA**** | th. US$ | 1,141,494 | 1,240,612 | (99,119 | ) | (8.0 | %) | ||||
| ROE | % | 1.03 | % | 1.36 | % | (0.00 | ) | (24.3 | %) | ||
| ROA | % | 0.22 | % | 0.13 | % | 0.00 | 69.2 | % | |||
| * | Current assets net of inventories and pre-paid expenses |
| ** | Using the ratio = Total debt / (equity + minority interest) |
| *** | EBITDAEI/Interest expenses = (Earnings before taxes+Fin exp+Net non operating income+depreciation+Positive Goodwill) /Interest expenses |
| **** | EBITDA: Operating Income+Depreciation |
Liquidity ratio as of September 2003 was 1.06 reflecting an improvement of 76.7% respect to the same date of the previous year. This improvement is due to cash flows collected from the capital increase of US$ 663 million, the sale of Rio Maipo for US$ 170 million, the sale of Canutillar for US$ 174 million and the transfer to long term of obligations with banks that were in the short term, following the conclusion of the negotiations in May 2003. Debt ratio as of September 30, 2003 was 0.89 times. When compared to the same period of the year 2002, there is a decrease of 0.50 points. The reduction is principally due to the capitalization of the debt from Elesur, as part of the capital increase, as well as the contribution made by minority shareholders and to the effect of the exchange rate, given that a large part of the debt is US Dollar denominated. On the other hand, the return on equity closed at 1.03%. As of the same date of the previous year, this was 1.36%. This reduction in the return was caused by the fact that, despite the increase in the profit for the period, the growth in equity was greater. Return on assets fell from 0.13% in September 2002 to 0.22% as of September 2003. This is basically the result of the increase in profits for the period and decrease in total assets. |
| www.enersis.cl | Santa Rosa 76, Santiago, CHILE Phone: 56 (2) 353 4682 | Pg. 19 |
| PRESS RELEASE | |
| Nine Months 2003 - Consolidated Balance Sheet | |
CONSOLIDATED BALANCE SHEETASSETS UNDER CHILEAN GAAP, THOUSAND US$Table 6 |
| ASSETS - (thousand US$) | 9M 03 | 9M 02 | Chg % | ||||
| CURRENT ASSETS | |||||||
| Cash | 42,098 | 70,970 | (40.7 | %) | |||
| Time deposits | 488,046 | 298,854 | 63.3 | % | |||
| Marketable securities | 18,701 | 146 | 12,675.2 | % | |||
| Accounts receivable | 735,482 | 650,811 | 13.0 | % | |||
| Notes receivable | 7,409 | 9,154 | (19.1 | %) | |||
| Other accounts receivable | 140,786 | 96,573 | 45.8 | % | |||
| Amounts due from related companies | 21,886 | 312,246 | (93.0 | %) | |||
| Inventories | 83,757 | 109,503 | (23.5 | %) | |||
| Income taxes to be recovered | 102,054 | 91,149 | 12.0 | % | |||
| Prepaid expenses | 26,267 | 12,506 | 110.0 | % | |||
| Deferred income taxes | 108,209 | 61,612 | 75.6 | % | |||
| Other current assets | 80,485 | 458,880 | (82.5 | %) | |||
| Net of long-term leasing contracts | — | — | — | ||||
| Net of assets for leasing | — | — | — | ||||
| Total currrent assets | 1,855,180 | 2,172,405 | (14.6 | %) | |||
| PROPERTY, PLANT AND EQUIPMENT | |||||||
| Property | 184,520 | 262,212 | (29.6 | %) | |||
| Buildings and infraestructure | 16,160,826 | 18,430,621 | (12.3 | %) | |||
| Plant and equipment | 2,938,598 | 3,176,887 | (7.5 | %) | |||
| Other assets | 665,278 | 911,888 | (27.0 | %) | |||
| Technical re-appraisal | 1,038,571 | 1,171,188 | (11.3 | %) | |||
| Sub - Total | 20,987,793 | 23,952,797 | (12.4 | %) | |||
| Accumulated depreciation | (7,678,351 | ) | (7,971,216 | ) | (3.7 | %) | |
| Total property, plant and equipment | 13,309,442 | 15,981,581 | (16.7 | %) | |||
| OTHER ASSETS | |||||||
| Investments in related companies | 300,027 | 310,821 | (3.5 | %) | |||
| Investments in other companies | 224,735 | 258,091 | (12.9 | %) | |||
| Positive goodwill | 1,210,528 | 2,022,307 | (40.1 | %) | |||
| Negative goodwill | (112,309 | ) | (275,182 | ) | (59.2 | %) | |
| Long-term receivables | 213,750 | 179,161 | 19.3 | % | |||
| Amounts due from related companies | 218,259 | 1,987 | 10,882.0 | % | |||
| Deferred income taxes | — | — | — | ||||
| Intangibles | 128,376 | 124,649 | 3.0 | % | |||
| Accumulated amortization | (63,155 | ) | (50,524 | ) | 25.0 | % | |
| Others | 346,391 | 336,251 | 3.0 | % | |||
| Net of long-term leasing contracts | — | — | — | ||||
| Total other assets | 2,466,602 | 2,907,562 | (15.2 | %) | |||
| TOTAL ASSETS | 17,631,224 | 21,061,549 | (16.3 | %) | |||
| www.enersis.cl | Santa Rosa 76, Santiago, CHILE Phone: 56 (2) 353 4682 | Pg. 20 |
| PRESS RELEASE | |
| Nine Months 2003 - Consolidated Balance Sheet | |
ASSETS UNDER CHILEAN GAAP, MILLION CH$Table 6.1 |
| ASSETS - (million Ch$) | 9M 03 | 9M 02 | Chg % | ||||
| CURRENT ASSETS | |||||||
| Cash | 27,826 | 46,909 | (40.7 | %) | |||
| Time deposits | 322,584 | 197,533 | 63.3 | % | |||
| Marketable securities | 12,361 | 97 | — | ||||
| Accounts receivable | 486,132 | 430,166 | 13.0 | % | |||
| Notes receivable | 4,897 | 6,051 | (19.1 | %) | |||
| Other accounts receivable | 93,055 | 63,832 | 45.8 | % | |||
| Amounts due from related companies | 14,466 | 206,385 | (93.0 | %) | |||
| Inventories | 55,361 | 72,378 | (23.5 | %) | |||
| Income taxes to be recovered | 67,455 | 60,246 | 12.0 | % | |||
| Prepaid expenses | 17,361 | 8,266 | 110.0 | % | |||
| Deferred income taxes | 71,523 | 40,724 | 75.6 | % | |||
| Other current assets | 53,198 | 303,306 | (82.5 | %) | |||
| Net of long-term leasing contracts | — | — | |||||
| Net of assets for leasing | — | — | |||||
| Total currrent assets | 1,226,218 | 1,435,895 | (14.6 | %) | |||
| PROPERTY, PLANT AND EQUIPMENT | |||||||
| Property | 121,962 | 173,314 | (29.6 | %) | |||
| Buildings and infraestructure | 10,681,821 | 12,182,088 | (12.3 | %) | |||
| Plant and equipment | 1,942,325 | 2,099,827 | (7.5 | %) | |||
| Other assets | 439,729 | 602,731 | (27.0 | %) | |||
| Technical re-appraisal | 686,464 | 774,120 | (11.3 | %) | |||
| Sub - Total | 13,872,302 | 15,832,080 | (12.4 | %) | |||
| Accumulated depreciation | (5,075,159 | ) | (5,268,735 | ) | (3.7 | %) | |
| Total property, plant and equipment | 8,797,142 | 10,563,346 | (16.7 | %) | |||
| OTHER ASSETS | |||||||
| Investments in related companies | 198,309 | 205,443 | (3.5 | %) | |||
| Investments in other companies | 148,543 | 170,590 | (12.9 | %) | |||
| Positive goodwill | 800,122 | 1,336,684 | (40.1 | %) | |||
| Negative goodwill | (74,233 | ) | (181,887 | ) | (59.2 | %) | |
| Long-term receivables | 141,282 | 118,420 | 19.3 | % | |||
| Amounts due from related companies | 144,263 | 1,314 | — | ||||
| Deferred income taxes | — | — | — | ||||
| Intangibles | 84,853 | 82,390 | 3.0 | % | |||
| Accumulated amortization | (41,744 | ) | (33,395 | ) | 25.0 | % | |
| Others | 228,954 | 222,252 | 3.0 | % | |||
| Net of long-term leasing contracts | — | — | — | ||||
| Total other assets | 1,630,350 | 1,921,812 | (15.2 | %) | |||
| TOTAL ASSETS | 11,653,710 | 13,921,052 | (16.3 | %) | |||
| www.enersis.cl | Santa Rosa 76, Santiago, CHILE Phone: 56 (2) 353 4682 | Pg. 21 |
| PRESS RELEASE | |
| Nine Months 2003 - Consolidated Balance Sheet | |
LIABILITIES UNDER CHILEAN GAAP, THOUSAND US$Table 7 |
| LIABILITIES AND SHAREHOLDER’S EQUITY - (thousand US$) | 9M 03 | 9M 02 | Chg % | ||||
| CURRENT LIABILITIES | |||||||
| Due to banks and financial institutions (short-term) | 471,615 | 687,092 | (31.4 | %) | |||
| Due to banks and financial institutions (short-term portion of long term) | 287,391 | 1,107,358 | (74.0 | %) | |||
| Commercial paper equivalent | — | 49,491 | (100.0 | %) | |||
| Bonds payable (short-term) | 109,209 | 781,485 | (86.0 | %) | |||
| Long-term liabilities maturing before one year | 42,670 | 66,539 | (35.9 | %) | |||
| Dividends payable | 3,191 | 31,305 | (89.8 | %) | |||
| Accounts payable | 321,406 | 333,478 | (3.6 | %) | |||
| Notes payable | 35,574 | 4,618 | — | ||||
| Miscellaneous payables | 93,490 | 115,251 | (18.9 | %) | |||
| Accounts payable to related companies | 27,201 | 13,909 | 95.6 | % | |||
| Provisions | 75,823 | 115,725 | (34.5 | %) | |||
| Withholdings | 78,708 | 81,948 | (4.0 | %) | |||
| Income tax | 77,424 | 49,719 | 55.7 | % | |||
| Anticipated income | 23,903 | 17,046 | 40.2 | % | |||
| Deferred taxes | — | — | — | ||||
| Reinbursable financial contribution | 4,073 | 5,245 | (22.3 | %) | |||
| Other current liabilities | 105,678 | 173,906 | (39.2 | %) | |||
| Total current liabilities | 1,757,355 | 3,634,115 | (51.6 | %) | |||
| LONG-TERM LIABILITIES | |||||||
| Due to banks and financial institutions | 2,122,176 | 2,726,777 | (22.2 | %) | |||
| Bonds payable | 3,465,378 | 3,378,397 | 2.6 | % | |||
| Notes payable | 290,714 | 328,530 | (11.5 | %) | |||
| Miscellaneous payables | 29,425 | 35,204 | (16.4 | %) | |||
| Amounts payable to related companies | 142 | 1,542,019 | (100.0 | %) | |||
| Provisions | 439,279 | 421,522 | 4.2 | % | |||
| Deferred taxes | 93,000 | 124,815 | (25.5 | %) | |||
| Reinbursable financial contribution | 15,556 | 18,914 | (17.8 | %) | |||
| Other long-term liabilities | 96,958 | 50,292 | 92.8 | % | |||
| Total long-term liabilities | 6,552,629 | 8,626,472 | (24.0 | %) | |||
| Minority interest | 5,582,864 | 6,862,006 | (18.6 | %) | |||
| SHAREHOLDERS’ EQUITY | |||||||
| Paid-in capital, no par value | 3,157,929 | 1,135,420 | 178.1 | % | |||
| Reserve to equity revaluation | 15,660 | 14,760 | 6.1 | % | |||
| Additional paid-in capital-share premium | 234,391 | 51,093 | — | ||||
| Other reserves | 26,598 | 94,837 | (72.0 | %) | |||
| Total capital and reserves | 3,434,577 | 1,296,111 | 165.0 | % | |||
| Future dividends reserve | — | — | — | ||||
| Retained earnings | 266,842 | 616,742 | (56.7 | %) | |||
| Retained losses | — | — | — | ||||
| Net income | 38,635 | 26,413 | 46.3 | % | |||
| Interim dividends | — | — | — | ||||
| Development subsidaries deficits | (1,678 | ) | (310 | ) | — | ||
| Total retained earnings | 303,800 | 642,845 | (52.7 | %) | |||
| Total shareholder’s equity | 3,738,377 | 1,938,956 | 92.8 | % | |||
| TOTAL LIABILITIES AND SHAREHOLDER’S EQUITY | 17,631,224 | 21,061,549 | (16.3 | %) | |||
| www.enersis.cl | Santa Rosa 76, Santiago, CHILE Phone: 56 (2) 353 4682 | Pg. 22 |
| PRESS RELEASE | |
| Nine Months 2003 - Consolidated Balance Sheet | |
LIABILITIES UNDER CHILEAN GAAP, MILLION CH$Table 7.1 |
| LIABILITIES AND SHAREHOLDER’S EQUITY - (million Ch$) | 9M 03 | 9M 02 | Chg % | ||||
| CURRENT LIABILITIES | |||||||
| Due to banks and financial institutions (short-term) | 311,724 | 454,147 | (31.4 | %) | |||
| Due to banks and financial institutions (short-term portion of long term) | 189,957 | 731,931 | (74.0 | %) | |||
| Commercial paper equivalent | — | 32,712 | (100.0 | %) | |||
| Bonds payable (short-term) | 72,184 | 516,538 | (86.0 | %) | |||
| Long-term liabilities maturing before one year | 28,204 | 43,981 | (35.9 | %) | |||
| Dividends payable | 2,109 | 20,692 | (89.8 | %) | |||
| Accounts payable | 212,440 | 220,419 | (3.6 | %) | |||
| Notes payable | 23,513 | 3,052 | — | ||||
| Miscellaneous payables | 61,794 | 76,177 | (18.9 | %) | |||
| Accounts payable to related companies | 17,979 | 9,193 | 95.6 | % | |||
| Provisions | 50,117 | 76,491 | (34.5 | %) | |||
| Withholdings | 52,023 | 54,165 | (4.0 | %) | |||
| Income tax | 51,175 | 32,863 | 55.7 | % | |||
| Anticipated income | 15,799 | 11,267 | 40.2 | % | |||
| Deferred taxes | — | — | |||||
| Reinbursable financial contribution | 2,692 | 3,467 | (22.3 | %) | |||
| Other current liabilities | 69,850 | 114,947 | (39.2 | %) | |||
| Total current liabilities | 1,161,559 | 2,402,041 | (51.6 | %) | |||
| LONG-TERM LIABILITIES | |||||||
| Due to banks and financial institutions | 1,402,695 | 1,802,318 | (22.2 | %) | |||
| Bonds payable | 2,290,511 | 2,233,019 | 2.6 | % | |||
| Notes payable | 192,153 | 217,149 | (11.5 | %) | |||
| Miscellaneous payables | 19,449 | 23,269 | (16.4 | %) | |||
| Amounts payable to related companies | 94 | 1,019,229 | (100.0 | %) | |||
| Provisions | 290,351 | 278,613 | 4.2 | % | |||
| Deferred taxes | 61,470 | 82,499 | (25.5 | %) | |||
| Reinbursable financial contribution | 10,282 | 12,502 | (17.8 | %) | |||
| Other long-term liabilities | 64,086 | 33,242 | 92.8 | % | |||
| Total long-term liabilities | 4,331,091 | 5,701,839 | (24.0 | %) | |||
| Minority interest | 3,690,106 | 4,535,580 | (18.6 | %) | |||
| SHAREHOLDERS’ EQUITY | |||||||
| Paid-in capital, no par value | 2,087,296 | 750,479 | 178.1 | % | |||
| Reserve to equity revaluation | 10,351 | 9,756 | 6.1 | % | |||
| Additional paid-in capital-share premium | 154,925 | 33,771 | — | ||||
| Other reserves | 17,580 | 62,684 | (72.0 | %) | |||
| Total capital and reserves | 2,270,152 | 856,690 | 165.0 | % | |||
| Future dividends reserve | — | — | — | ||||
| Retained earnings | 176,375 | 407,648 | (56.7 | %) | |||
| Retained losses | — | — | |||||
| Net income | 25,537 | 17,458 | 46.3 | % | |||
| Interim dividends | — | — | |||||
| Development subsidaries deficits | (1,109 | ) | (205 | ) | — | ||
| Total retained earnings | 200,803 | 424,901 | (52.7 | %) | |||
| Total shareholder’s equity | 2,470,955 | 1,281,592 | 92.8 | % | |||
| TOTAL LIABILITIES AND SHAREHOLDER’S EQUITY | 11,653,710 | 13,921,052 | (16.3 | %) | |||
| www.enersis.cl | Santa Rosa 76, Santiago, CHILE Phone: 56 (2) 353 4682 | Pg. 23 |
| PRESS RELEASE | |
| Nine Months 2003 - Consolidated Cash Flow | |
| www.enersis.cl | Santa Rosa 76, Santiago, CHILE Phone: 56 (2) 353 4682 | Pg. 24 |
| PRESS RELEASE | |
| Nine Months 2003 - Consolidated Cash Flow | |
CONSOLIDATED CASH FLOWUNDER CHILEAN GAAP, THOUSAND US$Table 8 |
| Thousand US$ | 9M 03 | 9M 02 | Chg % | ||||
| CASH FLOWS ORIGINATED FROM OPERATING ACTIVITIES | |||||||
| Net income (loss) for the year | 38,635 | 26,413 | 46.3 | % | |||
| Profit (losses) from sales of assets: | |||||||
| (Profit) loss on sale of fixed assets | (124,257 | ) | (498 | ) | — | ||
| Charges (credits) which do not represent cash flows: | |||||||
| Depreciation | 494,142 | 542,888 | (9.0 | %) | |||
| Amortization of intangibles | 10,682 | 12,639 | (15.5 | %) | |||
| Write-offs and accrued expenses | 46,601 | 57,237 | (18.6 | %) | |||
| Accrued profit from related companies (less) | (31,826 | ) | (7,406 | ) | — | ||
| Accrued losses from related companies | 189 | 7,319 | (97.4 | %) | |||
| Amortization of positive goodwill | 60,920 | 97,175 | (37.3 | %) | |||
| Amortization of negative goodwill (less) | (72,373 | ) | (62,172 | ) | (16.4 | %) | |
| Net, price-level restatement | 11,021 | (10,395 | ) | 206.0 | % | ||
| Net, foreign exchange effect | 749 | 26,836 | (97.2 | %) | |||
| Other credits which do not represent cash flow (less) | (28,561 | ) | (383,050 | ) | 92.5 | % | |
| Other charges which do not represent cash flow | 189,319 | 198,251 | (4.5 | %) | |||
| Assets variations which affect cash flow: | |||||||
| Decrease in receivables accounts | (157,831 | ) | 201,771 | (178.2 | %) | ||
| Decrease (increase) in inventory | 4,209 | 3,875 | 8.6 | % | |||
| Decrease (increase) in other assets | 28,751 | (132,484 | ) | 121.7 | % | ||
| Liabilities variations which affect cash flow: | |||||||
| (Decreased) increase in payable accounts related to operating income | (42,813 | ) | (165,517 | ) | 74.1 | % | |
| Increase of payable interest | 46,463 | 154,113 | (69.9 | %) | |||
| Net increase (decrease) of payable income tax | 15,304 | (95,512 | ) | 116.0 | % | ||
| Increase (decrease) of other payable accounts related to non-operating income | 39,246 | 15,079 | 160.3 | % | |||
| Net (decrease) of payable value added tax and other taxes | (2,870 | ) | 17,111 | (116. | 8%) | ||
| Profit related to minority interest | 81,194 | 221,132 | (63.3 | %) | |||
| NET POSITIVE CASH FLOW ORIGINATED FROM OP. ACTIVITIES | 606,891 | 724,803 | (16.3 | %) | |||
| www.enersis.cl | Santa Rosa 76, Santiago, CHILE Phone: 56 (2) 353 4682 | Pg. 25 |
| PRESS RELEASE | |
| Nine Months 2003 - Consolidated Cash Flow | |
Cont. Table 8 |
| Thousand US$ | 1H 03 | 1H 02 | Chg % | ||||
| CASH FLOWS ORIGINATED FROM FINANCING ACTIVITIES | |||||||
| Shares issued and suscribed | 705,187 | 2,826 | — | ||||
| Proceeds from loans hired | 698,923 | 1,247,252 | (44.0 | %) | |||
| Proceeds from debt issuance | 713,593 | 197,293 | 261.7 | % | |||
| Proceeds from loans obtained from related companies | — | — | |||||
| Proceeds from other loans obtained from related companies | — | — | |||||
| Other sources of financing | 16,870 | 14,947 | 12.9 | % | |||
| Capital paid | (14,583 | ) | (126,203 | ) | 88.4 | % | |
| Dividends paid | (115,584 | ) | (146,897 | ) | 21.3 | % | |
| Loans, debt amortization (less) | (1,714,105 | ) | (1,335,899 | ) | (28.3 | %) | |
| Issuance debt amortization (less) | (640,749 | ) | (33,543 | ) | — | ||
| Amortization of loans obtained from related companies | (6,779 | ) | (36,625 | ) | 81.5 | % | |
| Amortization of other loans obtained from related companies | — | (173 | ) | 100.0 | % | ||
| Expenses paid related to capital variations (less) | (16,492 | ) | — | ||||
| Expenses paid related to debt issuance (less) | (7,584 | ) | (16,606 | ) | 54.3 | % | |
| Other disbursements related to financing (less) | (145,099 | ) | (18,152 | ) | — | ||
| NET (NEGATIVE) CASH FLOW ORIG. FROM FINANCING ACTIVITIES | (526,402 | ) | (251,780 | ) | (109.1 | %) | |
| CASH FLOWS ORIGINATED FROM INVESTING ACTIVITIES | |||||||
| Sale of fixed assets | 246,503 | 33,776 | — | ||||
| Sale of other investments | — | 2 | (100.0 | %) | |||
| Sale of long-term Investments | 185,962 | — | |||||
| Collection upon other loans to related companies | 37,895 | 3,883 | — | ||||
| Other income on investments | 77,098 | 1,787 | — | ||||
| Additions to fixed assets (less) | (300,911 | ) | (326,576 | ) | 7.9 | % | |
| Long-term investments (less) | (38 | ) | (35,710 | ) | 99.9 | % | |
| Investment in financing instruments | — | (21,793 | ) | 100.0 | % | ||
| Other loans to related companies (less) | (451 | ) | — | ||||
| Other investment disbursements (less) | (11,274 | ) | (6,289 | ) | (79.3 | %) | |
| NET (NEGATIVE) CASH FLOW ORIGINATED FROM INVESTMENT ACTIVITIES | 234,784 | (350,920 | ) | 166.9 | % | ||
| NET POSITIVE CASH FLOW FOR THE PERIOD | 315,273 | 122,103 | 158.2 | % | |||
| EFFECT OF PRICE-LEVEL RESTATEMENT UPON CASH AND CASH EQUIVALENT | (85,290 | ) | 4,065 | — | |||
| NET VARIATION OF CASH AND CASH EQUIVALENT | 229,982 | 126,167 | 82.3 | % | |||
| INITIAL BALANCE OF CASH AND CASH EQUIVALENT | 338,663 | 333,518 | 1.5 | % | |||
| FINAL BALANCE OF CASH AND CASH EQUIVALENT | 568,645 | 459,685 | 23.7 | % | |||
| www.enersis.cl | Santa Rosa 76, Santiago, CHILE Phone: 56 (2) 353 4682 | Pg. 26 |
| PRESS RELEASE | |
| Nine Months 2003 - Consolidated Cash Flow | |
UNDER CHILEAN GAAP, MILLION CH$Table 8.1 |
| Million Ch$ | 9M 03 | 9M 02 | Chg % | ||||
| CASH FLOWS ORIGINATED FROM OPERATING ACTIVITIES | |||||||
| Net income (loss) for the year | 25,537 | 17,458 | 46.3 | % | |||
| Profit (losses) from sales of assets: | |||||||
| (Profit) loss on sale of fixed assets | (82,130 | ) | (329 | ) | — | ||
| Charges (credits) which do not represent cash flows: | |||||||
| Depreciation | 326,613 | 358,832 | (9.0 | %) | |||
| Amortization of intangibles | 7,060 | 8,354 | (15.5 | %) | |||
| Write-offs and accrued expenses | 30,802 | 37,832 | (18.6 | %) | |||
| Accrued profit from related companies (less) | (21,036 | ) | (4,895 | ) | — | ||
| Accrued losses from related companies | 125 | 4,837 | (97.4 | %) | |||
| Amortization of positive goodwill | 40,267 | 64,230 | (37.3 | %) | |||
| Amortization of negative goodwill (less) | (47,836 | ) | (41,094 | ) | (16.4 | %) | |
| Net, price-level restatement | 7,284 | (6,870 | ) | 206.0 | % | ||
| Net, foreign exchange effect | 495 | 17,737 | (97.2 | %) | |||
| Other credits which do not represent cash flow (less) | (18,878 | ) | (253,184 | ) | 92.5 | % | |
| Other charges which do not represent cash flow | 125,134 | 131,038 | (4.5 | %) | |||
| Assets variations which affect cash flow: | |||||||
| Decrease in receivables accounts | (104,322 | ) | 133,364 | (178.2 | %) | ||
| Decrease (increase) in inventory | 2,782 | 2,561 | 8.6 | % | |||
| Decrease (increase) in other assets | 19,004 | (87,568 | ) | 121.7 | % | ||
| Liabilities variations which affect cash flow: | |||||||
| (Decreased) increase in payable accounts related to operating income | (28,298 | ) | (109,401 | ) | 74.1 | % | |
| Increase of payable interest | 30,711 | 101,864 | (69.9 | %) | |||
| Net increase (decrease) of payable income tax | 10,116 | (63,130 | ) | 116.0 | % | ||
| Increase (decrease) of other payable accounts related to non-operating income | 25,940 | 9,966 | 160.3 | % | |||
| Net (decrease) of payable value added tax and other taxes | (1,897 | ) | 11,310 | (116.8 | %) | ||
| Profit related to minority interest | 53,666 | 146,161 | (63.3 | %) | |||
| NET POSITIVE CASH FLOW ORIGINATED FROM OP. ACTIVITIES | 401,137 | 479,073 | (16.3 | %) | |||
| www.enersis.cl | Santa Rosa 76, Santiago, CHILE Phone: 56 (2) 353 4682 | Pg. 27 |
| PRESS RELEASE | |
| Nine Months 2003 - Consolidated Cash Flow | |
Cont. Table 8.1 |
| Million Ch$ | 9M 03 | 9M 02 | Chg % | ||||
| CASH FLOWS ORIGINATED FROM FINANCING ACTIVITIES | |||||||
| Shares issued and suscribed | 466,107 | 1,868 | — | ||||
| Proceeds from loans hired | 461,967 | 824,396 | (44.0 | %) | |||
| Proceeds from debt issuance | 471,664 | 130,405 | 261.7 | % | |||
| Proceeds from loans obtained from related companies | — | — | |||||
| Proceeds from other loans obtained from related companies | — | — | |||||
| Other sources of financing | 11,151 | 9,879 | 12.9 | % | |||
| Capital paid | (9,639 | ) | (83,416 | ) | 88.4 | % | |
| Dividends paid | (76,398 | ) | (97,095 | ) | 21.3 | % | |
| Loans, debt amortization (less) | (1,132,972 | ) | (882,989 | ) | (28.3 | %) | |
| Issuance debt amortization (less) | (423,516 | ) | (22,171 | ) | — | ||
| Amortization of loans obtained from related companies | (4,481 | ) | (24,208 | ) | 81.5 | % | |
| Amortization of other loans obtained from related companies | — | (114 | ) | 100.0 | % | ||
| Expenses paid related to capital variations (less) | (10,901 | ) | — | ||||
| Expenses paid related to debt issuance (less) | (5,013 | ) | (10,976 | ) | 54.3 | % | |
| Other disbursements related to financing (less) | (95,906 | ) | (11,998 | ) | — | ||
| NET (NEGATIVE) CASH FLOW ORIG. FROM FINANCING ACTIVITIES | (347,936 | ) | (166,419 | ) | (109.1 | %) | |
| CASH FLOWS ORIGINATED FROM INVESTING ACTIVITIES | |||||||
| Sale of fixed assets | 162,931 | 22,325 | — | ||||
| Sale of other investments | — | 1 | (100.0 | %) | |||
| Sale of long-term Investments | 122,915 | — | |||||
| Collection upon other loans to related companies | 25,047 | 2,566 | — | ||||
| Other income on investments | 50,959 | 1,181 | — | ||||
| Additions to fixed assets (less) | (198,893 | ) | (215,857 | ) | 7.9 | % | |
| Long-term investments (less) | (25 | ) | (23,604 | ) | 99.9 | % | |
| Investment in financing instruments | — | (14,404 | ) | 100.0 | % | ||
| Other loans to related companies (less) | (298 | ) | — | ||||
| Other investment disbursements (less) | (7,452 | ) | (4,157 | ) | (79.3 | %) | |
| NET (NEGATIVE) CASH FLOW ORIGINATED FROM INVESTMENT ACTIVITIES | 155,185 | (231,948 | ) | 166.9 | % | ||
| NET POSITIVE CASH FLOW FOR THE PERIOD | 208,386 | 80,706 | 158.2 | % | |||
| EFFECT OF PRICE-LEVEL RESTATEMENT UPON CASH AND CASH EQUIVALENT | (56,374 | ) | 2,687 | — | |||
| NET VARIATION OF CASH AND CASH EQUIVALENT | 152,012 | 83,393 | 82.3 | % | |||
| INITIAL BALANCE OF CASH AND CASH EQUIVALENT | 223,846 | 220,445 | 1.5 | % | |||
| FINAL BALANCE OF CASH AND CASH EQUIVALENT | 375,858 | 303,838 | 23.7 | % | |||
| www.enersis.cl | Santa Rosa 76, Santiago, CHILE Phone: 56 (2) 353 4682 | Pg. 28 |
| PRESS RELEASE | |
| Nine Months 2003 - Consolidated Cash Flow Analysis | |
CONSOLIDATED CASH FLOW ANALYSISDuring the period, the company generated a net cash flow of US$ 315.3 million, which is comprised of the following: Table 9 |
| Effective Cash Flow (thousand US$) | 9M 03 | 9M 02 | Chg % | ||||
| Operating | 606,890 | 724,803 | (16.3 | %) | |||
| Financing | (526,402 | ) | (251,780 | ) | (109.1 | %) | |
| Investment | 234,784 | (350,921 | ) | 166.9 | % | ||
| Net cash flow of the period | 315,271 | 122,102 | 158.2 | % | |||
Table 9.1 |
| Effective Cash Flow (million Ch$) | 9M 03 | 9M 02 | Chg % | ||||
| Operating | 401,136 | 479,073 | (16.3 | %) | |||
| Financing | (347,936 | ) | (166,419 | ) | (109.1 | %) | |
| Investment | 155,185 | (231,948 | ) | 166.9 | % | ||
| Net cash flow of the period | 208,385 | 80,706 | 158.2 | % | |||
Operating activities generated a positive cash flow of US$ 606.9 million, US$ 135.9 million less than during the same period of last year. This cash flow is comprised mainly of profits for the period of US$ 38.6 million, plus net charges to results of US$ 813.6 million that do not represent cash flow, and correspond to the Depreciation of US$ 494.1 million for the period, writes-off and provisions of US$ 46.6 million, amortization of US$ 60.9 million on the negative and positive goodwill on investments and US$ 189.3 million for other charges that do not represent cash flow, the main item of this being US$ 103.5 million for the effect of the conversion to Technical Bulletin N° 64, increased by the rise in liabilities that affect the cash flow by US$ 55.3 million. The above was partially compensated by an increase of US$ 124.9 million in assets that that affect operating cash flows, principally due to the increase in sales debtors in Argentina and Brazil, to the increase of US$ 72.4 in amortizations and US$ 28.6 million in other credits that do not represent cash flow, of which US$ 12.7 million correspond to the effect of the positive conversion of the overseas subsidiaries. Financing activitiesproduced a negative cash flow of US$ 274.6 million, explained basically by loan repayments of US$ 1,714.1 million, dividend payments for US$ 115.6 million, payments of obligations with the public for US$ 640.8 million and other disbursements on investments for US$ 145.1 million. The above is partially compensated by the issue of shares for US$ 705.2 million, new loans received for US$ 698.9 million and the placement of bonds for US$ 713.6 million. Investment activitiesgenerated a net positive cash flow of US$ 234.8 million that corresponds principally to the sale of Fixed Assets, Canutillar and Transmission Lines for US$ 246.5 million, to the sale of investments of US$ 185.9 million in Río Maipo and to other income for US$ 77.1 million, partially compensated by the incorporation of fixed assets for US$ 300.9 million, with the most important being the investment Endesa is making in the Ralco Plant that for this period amounts to US$ 142.2 million and other disbursements for US$ 11.3 million. |
| www.enersis.cl | Santa Rosa 76, Santiago, CHILE Phone: 56 (2) 353 4682 | Pg. 29 |
| PRESS RELEASE | |
| Nine Months 2003 - Consolidated Cash Flow Analysis | |
CASH FLOW RECEIVED FROM FOREIGN SUBSIDIARIES BY ENERSIS AND ENDESA CHILE.Table 10 |
| Thousand US$ | Interest Received | Dividends Received | Management Fee | Prepayment Intercompany | Others | ||||||||||||||
| 9M 03 | 9M 02 | 9M 03 | 9M 02 | 9M 03 | 9M 02 | 9M 03 | 9M 02 | 9M 03 | 9M 02 | ||||||||||
| Argentina | 12,732 | 17,024 | 0 | 0 | 1,771 | 1,483 | 0 | 40,165 | 0 | 0 | |||||||||
| Peru | 0 | 0 | 15,217 | 15,537 | 0 | 0 | 0 | 0 | 8,658 | 0 | |||||||||
| Brazil | 103 | 17,233 | 0 | 19,753 | 0 | 0 | 0 | -39,849 | 0 | 0 | |||||||||
| Colombia | 28,044 | 15,563 | 14,883 | 15 | 0 | 0 | 11,200 | 49,914 | 0 | 44,144 | |||||||||
| Chile | 7,397 | 10,549 | 0 | 0 | 0 | 0 | 34,940 | 0 | 0 | 0 | |||||||||
| Total | 48,276 | 60,369 | 30,100 | 35,305 | 1,771 | 1,483 | 46,140 | 50,230 | 8,658 | 44,144 | |||||||||
| Thousand US $ | Total Cash Received | ||||
| 9M 03 | 9M 02 | ||||
| Argentina | 14,503 | 58,672 | |||
| Peru | 23,875 | 15,537 | |||
| Brazil | 103 | -2,863 | |||
| Colombia | 54,127 | 109,636 | |||
| Chile | 42,337 | 10,549 | |||
| Total | 134,945 | 191,531 | |||
Table 10.1 |
| Million Ch$ | Interest Received | Dividends Received | Management Fee | Prepayment Intercompany | Others | ||||||||||||||
| 9M 03 | 9M 02 | 9M 03 | 9M 02 | 9M 03 | 9M 02 | 9M 03 | 9M 02 | 9M 03 | 9M 02 | ||||||||||
| Argentina | 8,415 | 11,252 | 0 | 0 | 1,171 | 980 | 0 | 26,548 | 0 | 0 | |||||||||
| Peru | 0 | 0 | 10,058 | 10,269 | 0 | 0 | 0 | 0 | 5,723 | 0 | |||||||||
| Brazil | 68 | 11,390 | 0 | 13,056 | 0 | 0 | 0 | -26,339 | 0 | 0 | |||||||||
| Colombia | 18,536 | 10,287 | 9,837 | 10 | 0 | 0 | 7,403 | 32,992 | 0 | 29,178 | |||||||||
| Chile | 4,889 | 6,973 | 0 | 0 | 0 | 0 | 23,094 | 0 | 0 | 0 | |||||||||
| Total | 31,909 | 39,902 | 19,895 | 23,335 | 1,171 | 980 | 30,497 | 33,201 | 5,723 | 29,178 | |||||||||
| Million Ch$ | Total Cash Received | ||||
| 9M 03 | 9M 02 | ||||
| Argentina | 9,586 | 38,780 | |||
| Peru | 15,781 | 10,269 | |||
| Brazil | 68 | -1,892 | |||
| Colombia | 35,776 | 72,466 | |||
| Chile | 27,983 | 6,973 | |||
| Total | 89,195 | 126,596 | |||
| www.enersis.cl | Santa Rosa 76, Santiago, CHILE Phone: 56 (2) 353 4682 | Pg. 30 |
| PRESS RELEASE | |
| Nine Months 2003 - Consolidated Cash Flow Analysis | |
CAPEX AND DEPRECIATIONTable 11 |
| Payments for Additions of Fixed assets | Depreciation | |||||||
| Thousand US$ | 9M 03 | 9M 02 | 9M 03 | 9M 02 | ||||
| Endesa S.A. | 158,113 | 141,501 | 226,028 | 231,938 | ||||
| Chilectra S.A. | 21,127 | 20,282 | 14,391 | 14,503 | ||||
| Rio Maipo S.A. | — | 6,854 | — | 2,157 | ||||
| Edesur S.A. | 27,036 | 20,825 | 66,316 | 78,731 | ||||
| Edelnor S.A. | 14,396 | 21,957 | 19,614 | 20,771 | ||||
| Cerj | 41,203 | 30,935 | 53,517 | 67,008 | ||||
| Coelce | 23,015 | 54,136 | 46,860 | 50,606 | ||||
| Codensa S.A. | 15,001 | 29,304 | 63,470 | 72,879 | ||||
| Cam Ltda. | 735 | 274 | 1,337 | 1,275 | ||||
| Inmobiliaria Manso de Velasco Ltda. | — | — | 262 | 235 | ||||
| Synapsis Soluciones y Servicios Ltda. | 286 | 507 | 1,107 | 1,610 | ||||
| Holding Enersis | — | — | 1,238 | 1,176 | ||||
| Total | 300,911 | 326,575 | 494,140 | 542,888 | ||||
Table 11.1 |
| Payments for Additions of Fixed assets | Depreciation | |||||||
| Million Ch$ | 9M 03 | 9M 02 | 9M 03 | 9M 02 | ||||
| Endesa S.A. | 104,508 | 93,528 | 149,398 | 153,304 | ||||
| Chilectra S.A. | 13,964 | 13,406 | 9,512 | 9,586 | ||||
| Rio Maipo S.A. | — | 4,530 | — | 1,426 | ||||
| Edesur S.A. | 17,870 | 13,765 | 43,833 | 52,039 | ||||
| Edelnor S.A. | 9,515 | 14,513 | 12,964 | 13,729 | ||||
| Cerj | 27,234 | 20,447 | 35,373 | 44,290 | ||||
| Coelce | 15,212 | 35,782 | 30,973 | 33,449 | ||||
| Codensa S.A. | 9,915 | 19,369 | 41,952 | 48,171 | ||||
| Cam Ltda. | 486 | 181 | 884 | 843 | ||||
| Inmobiliaria Manso de Velasco Ltda. | — | — | 173 | 155 | ||||
| Synapsis Soluciones y Servicios Ltda. | 189 | 335 | 732 | 1,064 | ||||
| Holding Enersis | — | — | 818 | 777 | ||||
| Total | 198,893 | 215,856 | 326,612 | 358,833 | ||||
| www.enersis.cl | Santa Rosa 76, Santiago, CHILE Phone: 56 (2) 353 4682 | Pg. 31 |
| PRESS RELEASE | |
| Nine Months 2003 - Generation Business | |
GENERATION BUSINESSTable 12 |
| Million US$ | Million Ch$ | |||||||||||||
| 9M 03 | 9M 02 | Chg % | 9M 03 | 9M 02 | Chg % | |||||||||
| Operating Revenues | 1,108 | 1,114 | (0.5 | %) | 732,422 | 736,202 | (0.5 | %) | ||||||
| Operating Expenses | (662 | ) | (665 | ) | 0.6 | % | (437,371 | ) | (439,804 | ) | 0.6 | % | ||
| Selling and Administrative Expenses | (35 | ) | (38 | ) | (7.6 | %) | (23,420 | ) | (25,343 | ) | (7.6 | %) | ||
| Operating Income | 411 | 410 | 0.2 | % | 271,631 | 271,055 | 0.2 | % | ||||||
| Interest Income | 17 | 16 | 7.3 | % | 11,012 | 10,265 | 7.3 | % | ||||||
| Interest Expenses | (237 | ) | (251 | ) | 5.4 | % | (156,950 | ) | (165,841 | ) | 5.4 | % | ||
| Net Financial Income (Expenses) | (221 | ) | (235 | ) | 6.2 | % | (145,938 | ) | (155,576 | ) | 6.2 | % | ||
| Equity Gains from Related Company | 32 | 7 | 326.5 | % | 21,000 | 4,923 | 326.5 | % | ||||||
| Equity Losses from Related Company | (0 | ) | (7 | ) | 97.0 | % | 142 | (4,669 | ) | 97.0 | % | |||
| Net Income from Related Companies | 32 | 0 | 8109.5 | % | 20,859 | 254 | 8109.5 | % | ||||||
| Other Non Operating Income | 49 | 117 | (57.9 | %) | 32,648 | 77,492 | (57.9 | %) | ||||||
| Other Non Operating Expenses | (62 | ) | (75 | ) | 18.2 | % | 40,702 | (49,745 | ) | 18.2 | % | |||
| Net other Non Operating Income (Expenses) | (12 | ) | 42 | (129.0 | %) | 8,054 | 27,748 | (129.0 | %) | |||||
| Price Level Restatement | 0 | 6 | (92.1 | %) | 311 | 3,943 | (92.1 | %) | ||||||
| Foreign Exchange Effect | 11 | (3 | ) | 444.4 | % | 7,091 | (2,059 | ) | 444.4 | % | ||||
| Net of Monetary Exposure | 11 | 3 | 292.8 | % | 7,402 | 1,884 | 292.8 | % | ||||||
| Possitive Goodwill Amortization | (2 | ) | (11 | ) | 82.1 | % | (1,273 | ) | 7,112 | 82.1 | % | |||
| Non Operating Income | (192 | ) | (201 | ) | 4.4 | % | 127,005 | (132,803 | ) | 4.4 | % | |||
| Net Income b. Taxes, Min Int and Neg Goodwill Amort. | 219 | 209 | 4.6 | % | 144,627 | 138,252 | 4.6 | % | ||||||
| Extraordinary Items | 0 | (18 | ) | (100.0 | %) | 0 | (11,965 | ) | (100.0 | %) | ||||
| Income Tax | (48 | ) | (82 | ) | 41.3 | % | (31,671 | ) | (53,916 | ) | 41.3 | % | ||
| Minority Interest | (88 | ) | (68 | ) | (29.3 | %) | (58,000 | ) | (44,871 | ) | (29.3 | %) | ||
| Negative Goodwill Amortization | 19 | 59 | (68.4 | %) | 12,428 | 39,318 | (68.4 | %) | ||||||
| NET INCOME | 102 | 101 | 0.8 | % | 67,383 | 66,819 | 0.8 | % | ||||||
| www.enersis.cl | Santa Rosa 76, Santiago, CHILE Phone: 56 (2) 353 4682 | Pg. 32 |
| PRESS RELEASE | |
| Nine Months 2003 - Generation Business | |
| • | US$ 14.6 million of lower net financial expenses |
| • | US$ 31.2 of higher net income from related companies, and |
| • | US$ 13.8 million of better results from exchange differences. |
These positive facts are offset by: |
| • | US$ 67.8 million of lower net other non operating income |
| www.enersis.cl | Santa Rosa 76, Santiago, CHILE Phone: 56 (2) 353 4682 | Pg. 33 |
| PRESS RELEASE | |
| Nine Months 2003 - Generation Business | |
Table 13 |
| Country | Market | GWh Sold | Var 03-02 | Chg % | Market Share | |||||||||||||||
| 9M 03 | 9M 03 | 9M 03 | 9M 03 | |||||||||||||||||
| Chile | SIC & SING | 13,962 | 13,372 | 591 | 4.4 | % | 44.1 | % | 44.7 | % | ||||||||||
| SIC | 13,248 | 12,672 | 577 | 4.5 | % | 55.4 | % | 56.0 | % | |||||||||||
| SING | 714 | 700 | 14 | 2.0 | % | 9.2 | % | 9.6 | % | |||||||||||
| Argentina | SIN | 7,215 | 5,854 | 1,361 | 23.2 | % | 10.5 | % | 9.6 | % | ||||||||||
| Chocón | 3,977 | 2,188 | 1,789 | 81.8 | % | 6.0 | % | 4.0 | % | |||||||||||
| Costanera | 3,238 | 3,666 | (428 | ) | (11.7 | %) | 4.5 | % | 5.6 | % | ||||||||||
| Peru | SICN | 3,401 | 3,021 | 380 | 12.6 | % | 22.1 | % | 20.7 | % | ||||||||||
| Edegel | 3,401 | 3,021 | 380 | 12.6 | % | 22.1 | % | 20.7 | % | |||||||||||
| Colombia | SIN | 11,136 | 11,277 | (141 | ) | (1.3 | %) | 22.2 | % | 22.4 | % | |||||||||
| Betania | 1,963 | 2,017 | (54 | ) | (2.7 | %) | 3.9 | % | 4.0 | % | ||||||||||
| Emgesa | 9,173 | 9,260 | (87 | ) | (0.9 | %) | 18.3 | % | 18.4 | % | ||||||||||
| Brazil | SICN | 2,781 | 2,769 | 12 | 0.4 | % | 1.2 | % | 1.2 | % | ||||||||||
| Cachoeira | 2,781 | 2,769 | 12 | 0.4 | % | 1.2 | % | 1.2 | % | |||||||||||
| Total | 38,495 | 36,293 | 2,202 | 6.1 | % | |||||||||||||||
| Company | GWh produced | Var 03-02 | Chg % | ||||||||
| 9M 03 | 9M 02 | ||||||||||
| Chilean Companies | 12,351 | 12,023 | 329 | 2.7 | % | ||||||
| Chocón | 3,488 | 2,151 | 1,337 | 62.2 | % | ||||||
| Costanera | 2,687 | 3,049 | (362 | ) | (11.9 | %) | |||||
| Edegel | 3,413 | 3,120 | 293 | 9.4 | % | ||||||
| Betania | 1,167 | 1,434 | (267 | ) | (18.6 | %) | |||||
| Emgesa | 6,765 | 6,625 | 140 | 2.1 | % | ||||||
| Cachoeira | 2,086 | 1,752 | 334 | 19.1 | % | ||||||
| TOTAL | 31,958 | 30,154 | 1,804 | 6.0 | % | ||||||
| Endesa Financial Debt Maturity (with third party) TOTAL: US$ 3,573 million |
 |
| www.enersis.cl | Santa Rosa 76, Santiago, CHILE Phone: 56 (2) 353 4682 | Pg. 34 |
| PRESS RELEASE | |
| Nine Months 2003 - Distribution Business | |
| Million US$ | Million Ch$ | |||||||||||||
| 9M 03 | 9M 02 | Chg % | 9M 03 | 9M 02 | Chg % | |||||||||
| Revenues from Sales | 466 | 442 | 5.4 | % | 308,263 | 292,363 | 5.4 | % | ||||||
| Other Operating Revenues | 16 | 16 | (1.2 | %) | 10,750 | 10,881 | (1.2 | %) | ||||||
| Operating Revenues | 483 | 459 | 5.2 | % | 319,013 | 303,244 | 5.2 | % | ||||||
| Energy Purchases | (291 | ) | (272 | ) | (6.9 | %) | (192,095 | ) | (179,649 | ) | (6.9 | %) | ||
| Other Operating Cost | (47 | ) | (45 | ) | (4.8 | %) | (31,313 | ) | (29,880 | ) | (4.8 | %) | ||
| Operating Expenses | (338 | ) | (317 | ) | (6.6 | %) | (223,408 | ) | (209,529 | ) | (6.6 | %) | ||
| Selling and Administrative Expenses | (36 | ) | (35 | ) | (3.0 | %) | (24,064 | ) | (23,358 | ) | (3.0 | %) | ||
| Operating Income | 108 | 106 | 1.7 | % | 71,541 | 70,357 | 1.7 | % | ||||||
| Interest Income | 2 | 16 | (88.2 | %) | 1,268 | 10,711 | (88.2 | %) | ||||||
| Interest Expenses | (45 | ) | (58 | ) | 22.6 | % | (29,910 | ) | (38,660 | ) | 22.6 | % | ||
| Net Financial Income (Expenses) | (43 | ) | (42 | ) | (2.5 | %) | (28,642 | ) | (27,949 | ) | (2.5 | %) | ||
| Equity Gains from Related Company | 5 | 90 | (94.0 | %) | 3,544 | 59,266 | (94.0 | %) | ||||||
| Equity Losses from Related Company | (83 | ) | (2 | ) | — | (54,629 | ) | (1,600 | ) | — | ||||
| Net Income from Related Companies | (77 | ) | 87 | (188.6 | %) | (51,085 | ) | 57,666 | (188.6 | %) | ||||
| Other Non Operating Income | 35 | 41 | (14.7 | %) | 22,938 | 26,899 | (14.7 | %) | ||||||
| Other Non Operating Expenses | (14 | ) | (88 | ) | 84.5 | % | (9,069 | ) | (58,382 | ) | 84.5 | % | ||
| Conversion Effect (BT 64) | 0 | 0 | — | 0 | 0 | — | ||||||||
| Net other Non Operating Income (Expenses) | 21 | (48 | ) | 144.1 | % | 13,869 | (31,483 | ) | 144.1 | % | ||||
| Price Level Restatement | 6 | (28 | ) | 121.9 | % | 4,037 | (18,454 | ) | 121.9 | % | ||||
| Foreign Exchange Effect | 0 | 0 | — | 0 | 0 | — | ||||||||
| Net of Monetary Exposure | 6 | (28 | ) | 121.9 | % | 4,037 | (18,454 | ) | 121.9 | % | ||||
| Possitive Goodwill Amortization | (0 | ) | (13 | ) | 96.8 | % | (267 | ) | (8,474 | ) | 96.8 | % | ||
| Non Operating Income | (94 | ) | (43 | ) | (116.4 | %) | (62,088 | ) | (28,694 | ) | (116.4 | %) | ||
| Net Income b. Taxes, Min Int and Neg Goodwill Amort. | 14 | 63 | (77.3 | %) | 9,453 | 41,663 | (77.3 | %) | ||||||
| Extraordinary Items | 0 | 0 | — | 0 | 0 | — | ||||||||
| Income Tax | (7 | ) | (11 | ) | 37.8 | % | (4,398 | ) | (7,071 | ) | 37.8 | % | ||
| Minority Interest | 16 | 5 | 183.6 | % | 10,305 | 3,634 | 183.6 | % | ||||||
| Negative Goodwill Amortization | 20 | 1 | — | 12,923 | 444 | — | ||||||||
| NET INCOME | 43 | 59 | (26.9 | %) | 28,283 | 38,670 | (26.9 | %) | ||||||
| www.enersis.cl | Santa Rosa 76, Santiago, CHILE Phone: 56 (2) 353 4682 | Pg. 35 |
| PRESS RELEASE | |
| Nine Months 2003 - Distribution Business | |
| Chilectra | 9M 03 | 9M 02 | Chg % | ||||||
| Customers (Th) | 1,332 | 1,310 | 1.7 | % | |||||
| GWh Sold | 7,813 | 7,400 | 5.6 | % | |||||
| Clients/Emploee | 1,781 | 1,812 | -1.7 | % | |||||
| Energy Losses GWh (TTM) | 600 | 592 | -1.4 | % | |||||
| Energy Losses % (TTM) | 5.5 | % | 5.7 | % | 0.2 | % | |||
| Chilectra Financial Debt Maturity (with third party) TOTAL: US$ 20 million |
 |
| Chilean Peso Exchange Rate |
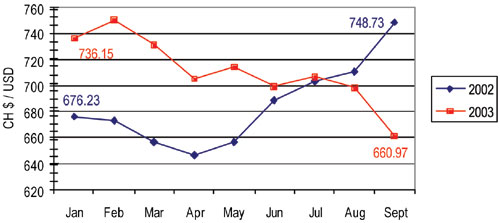 |
| www.enersis.cl | Santa Rosa 76, Santiago, CHILE Phone: 56 (2) 353 4682 | Pg. 36 |
| PRESS RELEASE | |
| Nine Months 2003 - Distribution Business | |
CERJTable 16 |
| Million US$ | Million Ch$ | |||||||||||||
| 9M 03 | 9M 02 | Chg % | 9M 03 | 9M 02 | Chg % | |||||||||
| Revenues from Sales | 367 | 441 | (16.7 | %) | 242,845 | 291,500 | (16.7 | %) | ||||||
| Other Operating Revenues | 23 | 12 | 86.1 | % | 15,334 | 8,241 | 86.1 | % | ||||||
| Operating Revenues | 391 | 453 | (13.9 | %) | 258,179 | 299,741 | (13.9 | %) | ||||||
| Energy Purchases | (218 | ) | (229 | ) | 5.0 | % | (143,942 | ) | (151,489 | ) | 5.0 | % | ||
| Other Operating Cost | (120 | ) | (166 | ) | 28.1 | % | (78,992 | ) | (109,939 | ) | 28.1 | % | ||
| Operating Expenses | (337 | ) | (396 | ) | 14.7 | % | (222,934 | ) | (261,428 | ) | 14.7 | % | ||
| Selling and Administrative Expenses | (12 | ) | (18 | ) | 31.7 | % | (8,173 | ) | (11,973 | ) | 31.7 | % | ||
| Operating Income | 41 | 40 | 2.8 | % | 27,072 | 26,340 | 2.8 | % | ||||||
| Interest Income | 17 | 18 | (7.8 | %) | 11,173 | 12,117 | (7.8 | %) | ||||||
| Interest Expenses | (51 | ) | (49 | ) | (4.1 | %) | (33,998 | ) | (32,648 | ) | (4.1 | %) | ||
| Net Financial Income (Expenses) | (35 | ) | (31 | ) | (11.2 | %) | (22,825 | ) | (20,531 | ) | (11.2 | %) | ||
| Equity Gains from Related Company | 0 | 3 | (100.0 | %) | 0 | 2,142 | (100.0 | %) | ||||||
| Equity Losses from Related Company | (4 | ) | 0 | — | (2,842 | ) | 0 | — | ||||||
| Net Income from Related Companies | (4 | ) | 3 | (232.7 | %) | (2,842 | ) | 2,142 | (232.7 | %) | ||||
| Other Non Operating Income | 9 | 8 | 20.3 | % | 6,017 | 5,000 | 20.3 | % | ||||||
| Other Non Operating Expenses | (76 | ) | (58 | ) | (31.8 | %) | (50,387 | ) | (38,241 | ) | (31.8 | %) | ||
| Conversion Effect (BT 64) | (77 | ) | 211 | (136.7 | %) | (51,082 | ) | 139,297 | (136.7 | %) | ||||
| Net other Non Operating Income (Expenses) | (144 | ) | 160 | (190.0 | %) | (95,452 | ) | 106,056 | (190.0 | %) | ||||
| Price Level Restatement | 0 | 0 | — | 0 | 0 | — | ||||||||
| Foreign Exchange Effect | 0 | 0 | — | 0 | 0 | — | ||||||||
| Net of Monetary Exposure | 0 | 0 | — | 0 | 0 | — | ||||||||
| Possitive Goodwill Amortization | 0 | 0 | — | 0 | 0 | — | ||||||||
| Non Operating Income | (183 | ) | 133 | (238.2 | %) | (121,119 | ) | 87,667 | (238.2 | %) | ||||
| Net Income b. Taxes, Min Int and Neg Goodwill Amort. | (142 | ) | 172 | (182.5 | %) | (94,047 | ) | 114,007 | (182.5 | %) | ||||
| Extraordinary Items | 0 | 0 | — | 0 | 0 | — | ||||||||
| Income Tax | (4 | ) | 9 | (141.2 | %) | (2,544 | ) | 6,177 | (141.2 | %) | ||||
| Minority Interest | 0 | 0 | — | 0 | 0 | — | ||||||||
| Negative Goodwill Amortization | 0 | 0 | — | 0 | 0 | — | ||||||||
| NET INCOME | (146 | ) | 182 | (180.4 | %) | (96,591 | ) | 120,184 | (180.4 | %) | ||||
| www.enersis.cl | Santa Rosa 76, Santiago, CHILE Phone: 56 (2) 353 4682 | Pg. 37 |
| PRESS RELEASE | |
| Nine Months 2003 - Distribution Business | |
OTHERHigher tax payment of US$ 13 million. ADITIONAL INFORMATIONTable 17 |
| Cerj | 9M 03 | 9M 02 | Chg % | ||||||
| Customers (Th) | 1,757 | 1,768 | -0.6 | % | |||||
| GWh Sold | 5,806 | 5,263 | 10.3 | % | |||||
| Clients/Emploee | 1,161 | 1,215 | -4.4 | % | |||||
| Energy Losses GWh (TTM) | 2,239 | 1,988 | -12.6 | % | |||||
| Energy Losses % (TTM) | 23.5 | % | 22.8 | % | -0.6 | % | |||
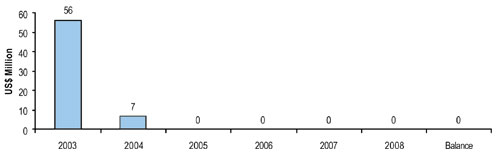
| Cerj Financial Debt Maturity (with third party) TOTAL: US$ 223 million |
 |
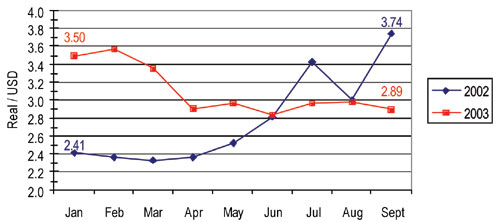
| Real Exchange Rate |
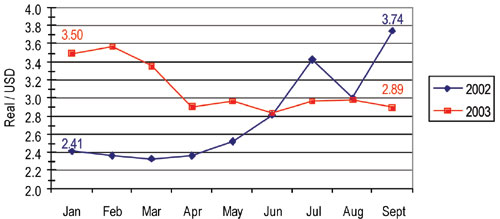 |
| www.enersis.cl | Santa Rosa 76, Santiago, CHILE Phone: 56 (2) 353 4682 | Pg. 38 |
| PRESS RELEASE | |
| Nine Months 2003 - Distribution Business | |
COELCETable 18 |
| Million US$ | Million Ch$ | |||||||||||||
| 9M 03 | 9M 02 | Chg % | 9M 03 | 9M 02 | Chg % | |||||||||
| Revenues from Sales | 245 | 291 | (15.8 | %) | 161,957 | 192,439 | (15.8 | %) | ||||||
| Other Operating Revenues | 4 | 5 | (22.7 | %) | 2,752 | 3,562 | (22.7 | %) | ||||||
| Operating Revenues | 249 | 297 | (16.0 | %) | 164,709 | 196,001 | (16.0 | %) | ||||||
| Energy Purchases | (104 | ) | (118 | ) | 11.4 | % | (68,973 | ) | (77,837 | ) | 11.4 | % | ||
| Other Operating Cost | (82 | ) | (87 | ) | 6.0 | % | (54,305 | ) | (57,762 | ) | 6.0 | % | ||
| Operating Expenses | (187 | ) | (205 | ) | 9.1 | % | (123,278 | ) | (135,599 | ) | 9.1 | % | ||
| Selling and Administrative Expenses | (34 | ) | (50 | ) | 32.0 | % | (22,339 | ) | (32,862 | ) | 32.0 | % | ||
| Operating Income | 29 | 42 | (30.7 | %) | 19,092 | 27,540 | (30.7 | %) | ||||||
| Interest Income | 28 | 26 | 9.5 | % | 18,735 | 17,111 | 9.5 | % | ||||||
| Interest Expenses | (41 | ) | (41 | ) | (0.9 | %) | (27,036 | ) | (26,804 | ) | (0.9 | %) | ||
| Net Financial Income (Expenses) | (13 | ) | (15 | ) | 14.4 | % | (8,301 | ) | (9,693 | ) | 14.4 | % | ||
| Equity Gains from Related Company | 0 | 0 | — | 0 | 0 | — | ||||||||
| Equity Losses from Related Company | 0 | 0 | — | 0 | 0 | — | ||||||||
| Net Income from Related Companies | 0 | 0 | — | 0 | 0 | — | ||||||||
| Other Non Operating Income | 1 | 1 | 33.3 | % | 949 | 712 | 33.3 | % | ||||||
| Other Non Operating Expenses | (7 | ) | (4 | ) | (65.5 | %) | (4,602 | ) | (2,781 | ) | (65.5 | %) | ||
| Conversion Effect (BT 64) | (25 | ) | 42 | (159.8 | %) | (16,772 | ) | 28,030 | (159.8 | %) | ||||
| Net other Non Operating Income (Expenses) | (31 | ) | 39 | (178.7 | %) | (20,425 | ) | 25,961 | (178.7 | %) | ||||
| Price Level Restatement | 0 | 0 | — | 0 | 0 | — | ||||||||
| Foreign Exchange Effect | 0 | 0 | — | 0 | 0 | — | ||||||||
| Net of Monetary Exposure | 0 | 0 | — | 0 | 0 | — | ||||||||
| Possitive Goodwill Amortization | 0 | 0 | — | 0 | 0 | — | ||||||||
| Non Operating Income | (43 | ) | 25 | (276.6 | %) | (28,726 | ) | 16,268 | (276.6 | %) | ||||
| Net Income b. Taxes, Min Int and Neg Goodwill Amort. | (15 | ) | 66 | (122.0 | %) | (9,634 | ) | 43,808 | (122.0 | %) | ||||
| Extraordinary Items | 0 | 0 | — | 0 | 0 | — | ||||||||
| Income Tax | (6 | ) | (10 | ) | 44.5 | % | (3,765 | ) | (6,787 | ) | 44.5 | % | ||
| Minority Interest | 0 | 0 | — | 0 | 0 | — | ||||||||
| Negative Goodwill Amortization | 0 | 0 | — | 0 | 0 | — | ||||||||
| NET INCOME | (20 | ) | 56 | (136.2 | %) | (13,399 | ) | 37,021 | (136.2 | %) | ||||
| www.enersis.cl | Santa Rosa 76, Santiago, CHILE Phone: 56 (2) 353 4682 | Pg. 39 |
| PRESS RELEASE | |
| Nine Months 2003 - Distribution Business | |
ADDITIONAL INFORMATIONTable 19 |
| Coelce | 9M 03 | 9M 02 | Chg % | ||||||
| Customers (Th) | 2,232 | 2,136 | 4.5 | % | |||||
| GWh Sold | 4,302 | 4,036 | 6.6 | % | |||||
| Clients/Emploee | 1,624 | 1,517 | 7.1 | % | |||||
| Energy Losses GWh (TTM) | 898 | 790 | -13.6 | % | |||||
| Energy Losses % (TTM) | 13.3 | % | 12.9 | % | -0.4 | % | |||
| Coelce Financial Debt Maturity (with third party) TOTAL: US$ 251 million |
 |
| Real Exchange Rate |
 |
| www.enersis.cl | Santa Rosa 76, Santiago, CHILE Phone: 56 (2) 353 4682 | Pg. 40 |
| PRESS RELEASE | |
| Nine Months 2003 - Distribution Business | |
CODENSATable 20 |
| Million US$ | Million Ch$ | |||||||||||||
| 9M 03 | 9M 02 | Chg % | 9M 03 | 9M 02 | Chg % | |||||||||
| Revenues from Sales | 286 | 365 | (21.6 | %) | 189,231 | 241,233 | (21.6 | %) | ||||||
| Other Operating Revenues | 56 | 45 | 23.1 | % | 36,872 | 29,958 | 23.1 | % | ||||||
| Operating Revenues | 342 | 410 | (16.6 | %) | 226,103 | 271,191 | (16.6 | %) | ||||||
| Energy Purchases | (177 | ) | (207 | ) | 14.4 | % | (117,144 | ) | (136,858 | ) | 14.4 | % | ||
| Other Operating Cost | (124 | ) | (136 | ) | 9.4 | % | (81,745 | ) | (90,181 | ) | 9.4 | % | ||
| Operating Expenses | (301 | ) | (343 | ) | 12.4 | % | (198,889 | ) | (227,039 | ) | 12.4 | % | ||
| Selling and Administrative Expenses | (18 | ) | (28 | ) | 36.6 | % | (11,776 | ) | (18,582 | ) | 36.6 | % | ||
| Operating Income | 23 | 39 | (39.6 | %) | 15,438 | 25,570 | (39.6 | %) | ||||||
| Interest Income | 8 | 18 | (56.1 | %) | 5,308 | 12,094 | (56.1 | %) | ||||||
| Interest Expenses | (5 | ) | (3 | ) | (36.6 | %) | (3,008 | ) | (2,202 | ) | (36.6 | %) | ||
| Net Financial Income (Expenses) | 3 | 15 | (76.7 | %) | 2,300 | 9,892 | (76.7 | %) | ||||||
| Equity Gains from Related Company | 0 | 0 | — | 0 | 0 | — | ||||||||
| Equity Losses from Related Company | 0 | 0 | — | 0 | 0 | — | ||||||||
| Net Income from Related Companies | 0 | 0 | — | 0 | 0 | — | ||||||||
| Other Non Operating Income | 1 | 2 | (37.5 | %) | 832 | 1,332 | (37.5 | %) | ||||||
| Other Non Operating Expenses | (1 | ) | (19 | ) | 97.3 | % | (343 | ) | (12,525 | ) | 97.3 | % | ||
| Conversion Effect (BT 64) | 1 | (11 | ) | 108.6 | % | 646 | (7,473 | ) | 108.6 | % | ||||
| Net other Non Operating Income (Expenses) | 2 | (28 | ) | 106.1 | % | 1,135 | (18,666 | ) | 106.1 | % | ||||
| Price Level Restatement | 0 | 0 | — | 0 | 0 | — | ||||||||
| Foreign Exchange Effect | 0 | 0 | — | 0 | 0 | — | ||||||||
| Net of Monetary Exposure | 0 | 0 | — | 0 | 0 | — | ||||||||
| Possitive Goodwill Amortization | 0 | 0 | — | 0 | 0 | — | ||||||||
| Non Operating Income | 5 | (13 | ) | 139.1 | % | 3,435 | (8,774 | ) | 139.1 | % | ||||
| Net Income b. Taxes, Min Int and Neg Goodwill Amort. | 29 | 25 | 12.4 | % | 18,873 | 16,796 | 12.4 | % | ||||||
| Extraordinary Items | 0 | 0 | — | 0 | 0 | — | ||||||||
| Income Tax | (19 | ) | (31 | ) | 37.1 | % | (12,723 | ) | (20,217 | ) | 37.1 | % | ||
| Minority Interest | 0 | 0 | — | 0 | 0 | — | ||||||||
| Negative Goodwill Amortization | 0 | 0 | — | 0 | 0 | — | ||||||||
| NET INCOME | 9 | (5 | ) | 279.8 | % | 6,150 | (3,421 | ) | 279.8 | % | ||||
| www.enersis.cl | Santa Rosa 76, Santiago, CHILE Phone: 56 (2) 353 4682 | Pg. 41 |
| PRESS RELEASE | |
| Nine Months 2003 - Distribution Business | |
ADDITIONAL INFORMATIONTable 21 |
| Codensa | 9M 03 | 9M 02 | Chg % | ||||||
| Customers (Th) | 1,956 | 1,893 | 3.3 | % | |||||
| GWh Sold | 6,869 | 6,726 | 2.1 | % | |||||
| Clients/Emploee | 2,301 | 2,278 | 1.0 | % | |||||
| Energy Losses GWh (TTM) | 1,061 | 1,017 | -4.3 | % | |||||
| Energy Losses % (TTM) | 10.4 | % | 10.2 | % | -0.2 | % | |||
| Codensa Financial Debt Maturity (with third party) TOTAL: US$ 63 million |
 |
| Col. Peso Exchange Rate |
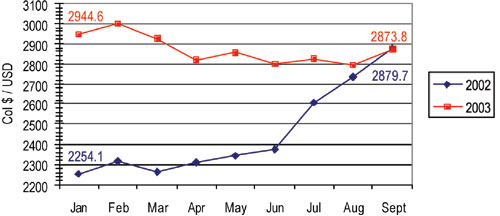 |
| www.enersis.cl | Santa Rosa 76, Santiago, CHILE Phone: 56 (2) 353 4682 | Pg. 42 |
| PRESS RELEASE | |
| Nine Months 2003 - Distribution Business | |
EDELNORTable 22 |
| Million US$ | Million Ch$ | |||||||||||||
| 9M 03 | 9M 02 | Chg % | 9M 03 | 9M 02 | Chg % | |||||||||
| Revenues from Sales | 215 | 236 | (8.9 | %) | 142,265 | 156,161 | (8.9 | %) | ||||||
| Other Operating Revenues | 7 | 9 | (22.7 | %) | 4,675 | 6,048 | (22.7 | %) | ||||||
| Operating Revenues | 222 | 245 | (9.4 | %) | 146,940 | 162,209 | (9.4 | %) | ||||||
| Energy Purchases | (138 | ) | (149 | ) | 7.4 | % | (91,333 | ) | (98,589 | ) | 7.4 | % | ||
| Other Operating Cost | (28 | ) | (32 | ) | 11.9 | % | (18,556 | ) | (21,062 | ) | 11.9 | % | ||
| Operating Expenses | (166 | ) | (181 | ) | 8.2 | % | (109,889 | ) | (119,651 | ) | 8.2 | % | ||
| Selling and Administrative Expenses | (20 | ) | (23 | ) | 11.7 | % | (13,521 | ) | (15,314 | ) | 11.7 | % | ||
| Operating Income | 36 | 41 | (13.6 | %) | 23,530 | 27,244 | (13.6 | %) | ||||||
| Interest Income | 2 | 3 | (27.2 | %) | 1,507 | 2,071 | (27.2 | %) | ||||||
| Interest Expenses | (6 | ) | (8 | ) | 24.9 | % | (4,114 | ) | (5,476 | ) | 24.9 | % | ||
| Net Financial Income (Expenses) | (4 | ) | (5 | ) | 23.4 | % | (2,607 | ) | (3,405 | ) | 23.4 | % | ||
| Equity Gains from Related Company | 0 | 0 | — | 0 | 0 | — | ||||||||
| Equity Losses from Related Company | 0 | 0 | — | 0 | 0 | — | ||||||||
| Net Income from Related Companies | 0 | 0 | — | 0 | 0 | — | ||||||||
| Other Non Operating Income | 4 | 5 | (11.4 | %) | 2,752 | 3,106 | (11.4 | %) | ||||||
| Other Non Operating Expenses | (2 | ) | (2 | ) | 9.1 | % | (1,453 | ) | (1,599 | ) | 9.1 | % | ||
| Conversion Effect (BT 64) | (2 | ) | 9 | (118.8 | %) | (1,158 | ) | 6,171 | (118.8 | %) | ||||
| Net other Non Operating Income (Expenses) | 0 | 12 | (98.2 | %) | 141 | 7,678 | (98.2 | %) | ||||||
| Price Level Restatement | 0 | 0 | — | 0 | 0 | — | ||||||||
| Foreign Exchange Effect | 0 | 0 | — | 0 | 0 | — | ||||||||
| Net of Monetary Exposure | 0 | 0 | — | 0 | 0 | — | ||||||||
| Possitive Goodwill Amortization | 0 | 0 | — | 0 | 0 | — | ||||||||
| Non Operating Income | (4 | ) | 6 | (157.7 | %) | (2,466 | ) | 4,273 | (157.7 | %) | ||||
| Net Income b. Taxes, Min Int and Neg Goodwill Amort. | 32 | 48 | (33.2 | %) | 21,064 | 31,517 | (33.2 | %) | ||||||
| Extraordinary Items | 0 | 0 | — | 0 | 0 | — | ||||||||
| Income Tax | (12 | ) | (17 | ) | 28.1 | % | (7,900 | ) | (10,994 | ) | 28.1 | % | ||
| Minority Interest | 0 | 0 | — | 0 | 0 | — | ||||||||
| Negative Goodwill Amortization | 0 | 0 | — | 0 | 0 | — | ||||||||
| NET INCOME | 20 | 31 | (35.9 | %) | 13,164 | 20,523 | (35.9 | %) | ||||||
| www.enersis.cl | Santa Rosa 76, Santiago, CHILE Phone: 56 (2) 353 4682 | Pg. 43 |
| PRESS RELEASE | |
| Nine Months 2003 - Distribution Business | |
ADDITIONAL INFORMATIONTable 23 |
| Edelnor | 9M 03 | 9M 02 | Chg % | ||||||
| Customers (Th) | 883 | 872 | 1.2 | % | |||||
| GWh Sold | 2,953 | 2,894 | 2.0 | % | |||||
| Clients/Emploee | 1,591 | 1,434 | 10.9 | % | |||||
| Energy Losses GWh (TTM) | 361 | 359 | -0.7 | % | |||||
| Energy Losses % (TTM) | 8.4 | % | 8.6 | % | 0.2 | % | |||
| Edelnor Financial Debt Maturity (with third party) TOTAL: US$ 123 million |
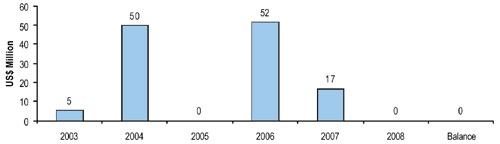 |
| Neuvo Sol Exchange Rate |
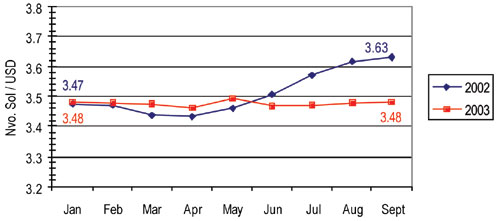 |
| www.enersis.cl | Santa Rosa 76, Santiago, CHILE Phone: 56 (2) 353 4682 | Pg. 44 |
| PRESS RELEASE | |
| Nine Months 2003 - Distribution Business | |
EDESURTable 24 |
| Million US$ | Million Ch$ | |||||||||||||
| 9M 03 | 9M 02 | Chg % | 9M 03 | 9M 02 | Chg % | |||||||||
| Revenues from Sales | 212 | 231 | (8.1 | %) | 140,278 | 152,659 | (8.1 | %) | ||||||
| Other Operating Revenues | 17 | 20 | (16.4 | %) | 10,995 | 13,149 | (16.4 | %) | ||||||
| Operating Revenues | 229 | 251 | (8.8 | %) | 151,273 | 165,808 | (8.8 | %) | ||||||
| Energy Purchases | (101 | ) | (101 | ) | 0.0 | % | (66,752 | ) | (66,778 | ) | 0.0 | % | ||
| Other Operating Cost | (103 | ) | (115 | ) | 10.3 | % | (67,941 | ) | (75,720 | ) | 10.3 | % | ||
| Operating Expenses | (204 | ) | (216 | ) | 5.5 | % | (134,693 | ) | (142,498 | ) | 5.5 | % | ||
| Selling and Administrative Expenses | (34 | ) | (38 | ) | 9.3 | % | (22,746 | ) | (25,076 | ) | 9.3 | % | ||
| Operating Income | (9 | ) | (3 | ) | (249.2 | %) | (6,166 | ) | (1,766 | ) | (249.2 | %) | ||
| Interest Income | 8 | 17 | (53.0 | %) | 5,295 | 11,256 | (53.0 | %) | ||||||
| Interest Expenses | (16 | ) | (40 | ) | 60.2 | % | (10,412 | ) | (26,183 | ) | 60.2 | % | ||
| Net Financial Income (Expenses) | (8 | ) | (23 | ) | 65.7 | % | (5,117 | ) | (14,927 | ) | 65.7 | % | ||
| Equity Gains from Related Company | 0 | 0 | 85.7 | % | 26 | 14 | 85.7 | % | ||||||
| Equity Losses from Related Company | 0 | 0 | — | 0 | 0 | — | ||||||||
| Net Income from Related Companies | 0 | 0 | 85.7 | % | 26 | 14 | 85.7 | % | ||||||
| Other Non Operating Income | 0 | 0 | 561.0 | % | 271 | 41 | 561.0 | % | ||||||
| Other Non Operating Expenses | (11 | ) | (5 | ) | (97.1 | %) | (7,065 | ) | (3,584 | ) | (97.1 | %) | ||
| Conversion Effect (BT 64) | 4 | 35 | (88.8 | %) | 2,596 | 23,282 | (88.8 | %) | ||||||
| Net other Non Operating Income (Expenses) | (6 | ) | 30 | (121.3 | %) | (4,198 | ) | 19,739 | (121.3 | %) | ||||
| Price Level Restatement | 0 | 0 | — | 0 | 0 | — | ||||||||
| Foreign Exchange Effect | 0 | 0 | — | 0 | 0 | — | ||||||||
| Net of Monetary Exposure | 0 | 0 | — | 0 | 0 | — | ||||||||
| Possitive Goodwill Amortization | 0 | 0 | — | 0 | 0 | — | ||||||||
| Non Operating Income | (14 | ) | 7 | (292.5 | %) | (9,289 | ) | 4,826 | (292.5 | %) | ||||
| Net Income b. Taxes, Min Int and Neg Goodwill Amort. | (23 | ) | 5 | — | (15,455 | ) | 3,060 | — | ||||||
| Extraordinary Items | 0 | 0 | — | 0 | 0 | — | ||||||||
| Income Tax | (18 | ) | 8 | — | (11,919 | ) | 5,322 | — | ||||||
| Minority Interest | 0 | 0 | — | 0 | 0 | — | ||||||||
| Negative Goodwill Amortization | 0 | 0 | — | 0 | 0 | — | ||||||||
| NET INCOME | (41 | ) | 13 | (426.6 | %) | (27,374 | ) | 8,382 | (426.6 | %) | ||||
| www.enersis.cl | Santa Rosa 76, Santiago, CHILE Phone: 56 (2) 353 4682 | Pg. 45 |
| PRESS RELEASE | |
| Nine Months 2003 - Distribution Business | |
ADITIONAL INFORMATIONTable 25 |
| Edesur | 9M 03 | 9M 02 | Chg % | ||||||
| Customers (Th) | 2,113 | 2,084 | 1.4 | % | |||||
| GWh Sold | 9,500 | 9,165 | 3.7 | % | |||||
| Clients/Emploee | 939 | 924 | 1.6 | % | |||||
| Energy Losses GWh (TTM) | 1,688 | 1,542 | -9.5 | % | |||||
| Energy Losses % (TTM) | 11.9 | % | 11.2 | % | -0.7 | % | |||
| Edesur Financial Debt Maturity (with third party) TOTAL: US$ 179 million |
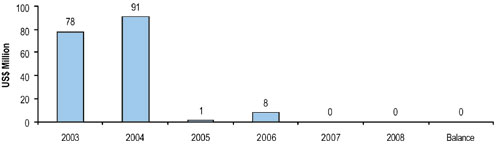 |
| Arg. Peso Exchange Rate |
 |
| www.enersis.cl | Santa Rosa 76, Santiago, CHILE Phone: 56 (2) 353 4682 | Pg. 46 |
| PRESS RELEASE | |
| Nine Months 2003 - Parent Company Income Statement | |
PARENT COMPANY INCOME STATEMENTUNDER CHILEAN GAAP, THOUSAND US$Table 26 |
| Th. US$ | 9M 03 | 9M 02 | Chg % | ||||
| Operating Revenues | 4,982 | 4,926 | 1.1 | % | |||
| Operating Expenses | (1,289 | ) | (1,227 | ) | -5.0 | % | |
| Operating Margin | 3,693 | 3,699 | -0.1 | % | |||
| Selling and Administrative Expenses | (17,661 | ) | (19,695 | ) | 10.3 | % | |
| Operating Income | (13,967 | ) | (15,996 | ) | 12.7 | % | |
| Interest Income | 47,531 | 66,316 | -28.3 | % | |||
| Interest Expense | (155,574 | ) | (169,284 | ) | 8.1 | % | |
| Net Financial Income (Expenses) | (108,043 | ) | (102,967 | ) | -4.9 | % | |
| Equity Gains from Related Companies | 118,921 | 268,252 | -55.7 | % | |||
| Equity Losses from Related Companies | (72,406 | ) | (3,658 | ) | -1879.4 | % | |
| Net Income from Related Companies | 46,515 | 264,594 | -82.4 | % | |||
| Other Non Operating Income | 148,768 | 39,304 | 278.5 | % | |||
| Other Non Operating Expenses | (24,596 | ) | (64,906 | ) | 62.1 | % | |
| Net other Non Operating Income (Expense) | 124,171 | (25,602 | ) | 585.0 | % | ||
| Price Level Restatement | (10,078 | ) | 2,509 | -501.8 | % | ||
| Foreign Exchange Effect | 22,367 | (46,045 | ) | 148.6 | % | ||
| Net of Monetary Exposure | 12,289 | (43,537 | ) | 128.2 | % | ||
| Positive Goodwill Amortization | (56,718 | ) | (62,076 | ) | 8.6 | % | |
| Non Operating Income | 18,214 | 30,411 | -40.1 | % | |||
| Net Inc b. Taxes, Min Int and Neg Goodwill Amort | 4,247 | 14,415 | -70.5 | % | |||
| Income Tax | 1,668 | 11,898 | -86.0 | % | |||
| Negative Goodwill Amortization | 32,720 | 99 | 32871.6 | % | |||
| NET INCOME | 38,635 | 26,413 | 46.3 | % | |||
| www.enersis.cl | Santa Rosa 76, Santiago, CHILE Phone: 56 (2) 353 4682 | Pg. 47 |
| PRESS RELEASE | |
| Nine Months 2003 - Parent Company Income Statement | |
UNDER CHILEAN GAAP, MILLION CH$Table 26.1 |
| Million Ch$ | 9M 03 | 9M 02 | Chg % | ||||
| Operating Revenues | 3,293 | 3,256 | 1.1 | % | |||
| Operating Expenses | (852 | ) | (811 | ) | -5.0 | % | |
| Operating Margin | 2,441 | 2,445 | -0.1 | % | |||
| Selling and Administrative Expenses | (11,673 | ) | (13,018 | ) | 10.3 | % | |
| Operating Income | (9,232 | ) | (10,573 | ) | 12.7 | % | |
| Interest Income | 31,417 | 43,833 | -28.3 | % | |||
| Interest Expense | (102,830 | ) | (111,891 | ) | 8.1 | % | |
| Net Financial Income (Expenses) | (71,413 | ) | (68,058 | ) | -4.9 | % | |
| Equity Gains from Related Companies | 78,603 | 177,306 | -55.7 | % | |||
| Equity Losses from Related Companies | (47,858 | ) | (2,418 | ) | -1879.4 | % | |
| Net Income from Related Companies | 30,745 | 174,888 | -82.4 | % | |||
| Other Non Operating Income | 98,331 | 25,979 | 278.5 | % | |||
| Other Non Operating Expenses | (16,257 | ) | (42,901 | ) | 62.1 | % | |
| Net other Non Operating Income (Expense) | 82,074 | (16,922 | ) | 585.0 | % | ||
| Price Level Restatement | (6,662 | ) | 1,658 | -501.8 | % | ||
| Foreign Exchange Effect | 14,784 | (30,434 | ) | 148.6 | % | ||
| Net of Monetary Exposure | 8,123 | (28,776 | ) | 128.2 | % | ||
| Positive Goodwill Amortization | (37,489 | ) | (41,030 | ) | 8.6 | % | |
| Non Operating Income | 12,039 | 20,101 | -40.1 | % | |||
| Net Income b. Taxes, Min Int and Neg Goodwill Amort | 2,807 | 9,528 | -70.5 | % | |||
| Income Tax | 1,102 | 7,864 | -86.0 | % | |||
| Negative Goodwill Amortization | 21,627 | 66 | 32871.6 | % | |||
| NET INCOME | 25,537 | 17,458 | 46.3 | % | |||
| www.enersis.cl | Santa Rosa 76, Santiago, CHILE Phone: 56 (2) 353 4682 | Pg. 48 |
| PRESS RELEASE | |
| Nine Months 2003 - Partially Consolidated Income Statement | |
PARTIALLY CONSOLIDATED INCOME STATEMENTUNDER CHILEAN GAAP, THOUSAND US$Table 27 |
| 3Q 03 | 3Q 02 | Var % | (in thousand US$ of 9M03) | 9M 03 | 9M 02 | Var % | ||||||||
| 1,235 | 1,223 | 1.0 | % | Gross Operating Margin | 3,693 | 3,699 | -0.1 | % | ||||||
| -6,457 | -5,391 | -19.8 | % | S&A Expenses | -17,661 | -19,695 | 10.3 | % | ||||||
| -5,222 | -4,169 | -25.3 | % | Operating Income | -13,967 | -15,996 | 12.7 | % | ||||||
| 17,634 | 26,737 | -34.0 | % | Endesa | 61,148 | 60,636 | 0.8 | % | ||||||
| 34,213 | -27,836 | 222.9 | % | Chilectra | 117,966 | -28,024 | 520.9 | % | ||||||
| 0 | 4,228 | -100.0 | % | Rio Maipo | 0 | 11,553 | -100.0 | % | ||||||
| -3,450 | -11,960 | 71.2 | % | Edesur | -26,821 | 8,201 | -427.1 | % | ||||||
| 2,818 | 5,516 | -48.9 | % | Edelnor | 8,973 | 13,598 | -34.0 | % | ||||||
| -18,398 | 35,316 | -152.1 | % | Cerj | -104,822 | 112,250 | -193.4 | % | ||||||
| -431 | 3,676 | -111.7 | % | Coelce | -3,049 | 2,296 | -232.8 | % | ||||||
| 3,493 | -7,364 | 147.4 | % | Codensa | 681 | -5,601 | 112.2 | % | ||||||
| 3,708 | 2,543 | 45.8 | % | CAM LTDA | 7,336 | 6,464 | 13.5 | % | ||||||
| -10 | 535 | -101.9 | % | Inm Manso de Velasco | 615 | 2,144 | -71.3 | % | ||||||
| 1,723 | 1,502 | 14.7 | % | Synapsis | 5,283 | 5,081 | 4.0 | % | ||||||
| 0 | -383 | 100.1 | % | Others | -181 | -429 | 57.8 | % | ||||||
| 41,301 | 32,509 | 27.0 | % | Net Income from Related Companies | 67,129 | 188,169 | -64.3 | % | ||||||
| 23,983 | 34,445 | -30.4 | % | Interest Income | 68,523 | 89,429 | -23.4 | % | ||||||
| -61,880 | -61,655 | -0.4 | % | Interest Expense | -155,618 | -169,284 | 8.1 | % | ||||||
| -37,897 | -27,210 | -39.3 | % | Net Financial Income (Expenses) | -87,095 | -79,854 | -9.1 | % | ||||||
| 3,953 | 25,093 | -84.2 | % | Other Non Operating Income | 148,783 | 41,045 | 262.5 | % | ||||||
| -2,906 | -21,907 | 86.7 | % | Other Non Operating Expenses | -24,763 | -65,050 | 61.9 | % | ||||||
| 1,047 | 3,187 | -67.1 | % | Net other Non Operating Income (Expenses) | 124,021 | -24,004 | 616.7 | % | ||||||
| 3,879 | 1,470 | 163.8 | % | Price Level Restatement | -11,504 | 925 | -1343.3 | % | ||||||
| -20,237 | 4,707 | -529.9 | % | Foreign Exchange Effect | -17,618 | 7,360 | -339.4 | % | ||||||
| -16,358 | 6,177 | -364.8 | % | Net Monetary Exposure | -29,122 | 8,285 | -451.5 | % | ||||||
| -18,895 | -20,985 | 10.0 | % | Positive Goodwill Amortization | -56,718 | -62,184 | 8.8 | % | ||||||
| -30,803 | -6,322 | -387.2 | % | Non Operating Income | 18,214 | 30,411 | -40.1 | % | ||||||
| -36,025 | -10,491 | -243.4 | % | Net Income before (1), (2) & (3) | 4,247 | 14,415 | -70.5 | % | ||||||
| 14,275 | -215 | 6745.4 | % | Income Tax (1) | 1,668 | 11,898 | -86.0 | % | ||||||
| -17 | 38 | -145.1 | % | Negative Goodwill Amortization (2) | 32,720 | 99 | 32871.6 | % | ||||||
| 0 | 0 | NA | Minority Interest (3) | 0 | 0 | NA | ||||||||
| -21,767 | -10,668 | -104.0 | % | NET INCOME | 38,635 | 26,413 | 46.3 | % | ||||||
| (0.47 | ) | (0.85 | ) | EPS (Ch$) | 0.84 | 2.11 | ||||||||
| (0.04 | ) | (0.06 | ) | EPADS (US$) | 0.06 | 0.16 | ||||||||
| 30,404,284 | 8,291,020 | Common Shares Outstanding (MM) | 30,404,284 | 8,291,020 | ||||||||||
| www.enersis.cl | Santa Rosa 76, Santiago, CHILE Phone: 56 (2) 353 4682 | Pg. 49 |
| PRESS RELEASE | |
| Nine Months 2003 - Partially Consolidated Income Statement | |
UNDER CHILEAN GAAP, MILLION CH$Table 27.1 |
| 3Q 03 | 3Q 02 | Var % | (in million Ch$ of 9M03) | 9M 03 | 9M 02 | Var % | ||||||||
| 816 | 808 | 1.0 | % | Gross Operating Margin | 2,441 | 2,445 | -0.1 | % | ||||||
| -4,268 | -3,563 | -19.8 | % | S&A Expenses | -11,673 | -13,018 | 10.3 | % | ||||||
| -3,451 | -2,755 | -25.3 | % | Operating Income | -9,232 | -10,573 | 12.7 | % | ||||||
| 11,656 | 17,672 | -34.0 | % | Endesa | 40,417 | 40,078 | 0.8 | % | ||||||
| 22,614 | -18,399 | 222.9 | % | Chilectra | 77,972 | -18,523 | 520.9 | % | ||||||
| 0 | 2,794 | -100.0 | % | Rio Maipo | 0 | 7,636 | -100.0 | % | ||||||
| -2,280 | -7,905 | 71.2 | % | Edesur | -17,728 | 5,420 | -427.1 | % | ||||||
| 1,863 | 3,646 | -48.9 | % | Edelnor | 5,931 | 8,988 | -34.0 | % | ||||||
| -12,160 | 23,342 | -152.1 | % | Cerj | -69,284 | 74,194 | -193.4 | % | ||||||
| -285 | 2,430 | -111.7 | % | Coelce | -2,016 | 1,518 | -232.8 | % | ||||||
| 2,309 | -4,868 | 147.4 | % | Codensa | 450 | -3,702 | 112.2 | % | ||||||
| 2,451 | 1,681 | 45.8 | % | CAM LTDA | 4,849 | 4,272 | 13.5 | % | ||||||
| -7 | 353 | -101.9 | % | Inm Manso de Velasco | 407 | 1,417 | -71.3 | % | ||||||
| 1,139 | 993 | 14.7 | % | Synapsis | 3,492 | 3,358 | 4.0 | % | ||||||
| 0 | -253 | 100.1 | % | Other | -120 | -284 | 57.8 | % | ||||||
| 27,298 | 21,487 | 27.0 | % | Net Income from Related Companies | 44,370 | 124,374 | -64.3 | % | ||||||
| 15,852 | 22,767 | -30.4 | % | Interest Income | 45,292 | 59,110 | -23.4 | % | ||||||
| -40,901 | -40,752 | -0.4 | % | Interest Expense | -102,859 | -111,891 | 8.1 | % | ||||||
| -25,049 | -17,985 | -39.3 | % | Net Financial Income (Expenses) | -57,567 | -52,781 | -9.1 | % | ||||||
| 2,613 | 16,586 | -84.2 | % | Other Non Operating Income | 98,341 | 27,130 | 262.5 | % | ||||||
| -1,921 | -14,480 | 86.7 | % | Other Non Operating Expenses | -16,367 | -42,996 | 61.9 | % | ||||||
| 692 | 2,106 | -67.1 | % | Net other Non Operating Income (Expenses) | 81,974 | -15,866 | 616.7 | % | ||||||
| 2,564 | 972 | 163.8 | % | Price Level Restatement | -7,604 | 612 | -1343.3 | % | ||||||
| -13,376 | 3,111 | -529.9 | % | Foreign Exchange Effect | -11,645 | 4,865 | -339.4 | % | ||||||
| -10,812 | 4,083 | -364.8 | % | Net Monetary Exposure | -19,249 | 5,476 | -451.5 | % | ||||||
| -12,489 | -13,870 | 10.0 | % | Positive Goodwill Amortization | -37,489 | -41,102 | 8.8 | % | ||||||
| -20,360 | -4,179 | -387.2 | % | Non Operating Income | 12,039 | 20,101 | -40.1 | % | ||||||
| -23,811 | -6,934 | -243.4 | % | Net Income before (1), (2) & (3) | 2,807 | 9,528 | -70.5 | % | ||||||
| 9,436 | -142 | 6745.4 | % | Income Tax (1) | 1,102 | 7,864 | -86.0 | % | ||||||
| -11 | 25 | -145.1 | % | Negative Goodwill Amortization (2) | 21,627 | 66 | 32871.6 | % | ||||||
| 0 | 0 | NA | Minority Interest (3) | 0 | 0 | NA | ||||||||
| -14,387 | -7,051 | -104.0 | % | NET INCOME | 25,537 | 17,458 | 46.3 | % | ||||||
| www.enersis.cl | Santa Rosa 76, Santiago, CHILE Phone: 56 (2) 353 4682 | Pg. 50 |
| PRESS RELEASE | |
| Nine Months 2003 - Ownership of the Company | |
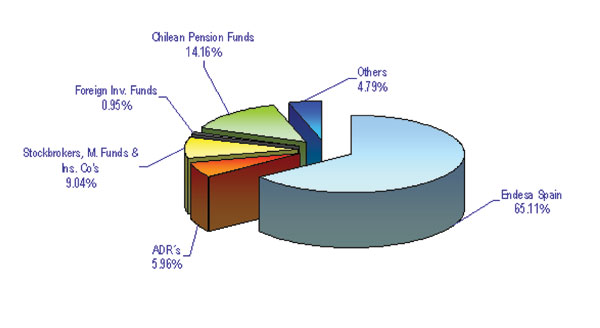
| www.enersis.cl | Santa Rosa 76, Santiago, CHILE Phone: 56 (2) 353 4682 | Pg. 51 |
| PRESS RELEASE | |
| Nine Months 2003 - Contact Information | |
CONTACT INFORMATIONFor further information, please contact Enersis: |
| Susana Rey Head of Investor Relations srm@e.enersis.cl 56 (2) 353 4554 | Pablo Lanyi-Grunfeldt Investor Relations pll@e.enersis.cl 56 (2) 353 4552 | |||
| Matías Rodríguez Investor Relations mra8@e.enersis.cl 56 (2) 353 4492 | Francisco Luco Investor Relations fjlv@e.enersis.cl 56 (2) 353 4555 |
| www.enersis.cl | Santa Rosa 76, Santiago, CHILE Phone: 56 (2) 353 4682 | Pg. 52 |