FORM 6-K
Pursuant to Rule 13a-16 or 15d-16 of
the Securities Exchange Act of 1934
For the month of January, 2007
Commission File Number: 001-12440
ENERSIS S.A.
Santa Rosa 76
Santiago, Chile
Indicate by check mark whether the registrant files or will file
annual reports under cover of Form 20-F or Form 40-F:
Form 20-F [X] Form 40-F [ ]
Indicate by check mark if the registrant is submitting the Form 6-K
in paper as permitted by Regulation S-T Rule 101(b)(1):
Yes [ ] No [X]
Indicate by check mark if the registrant is submitting the Form 6-K
in paper as permitted by Regulation S-T Rule 101(b)(7):
Yes [ ] No [X]
Indicate by check mark whether by furnishing the information
contained in this Form, the Registrant is also thereby furnishing the
information to the Commission
pursuant to Rule 12g3-2(b) under the Securities Exchange Act of 1934:
Yes [ ] No [X]
If "Yes" is marked, indicate below the file number assigned to the registrant
in connection with Rule 12g3-2(b): N/A
PRESS RELEASE | ||
ENERSIS ANNOUNCES CONSOLIDATED RESULTS FOR
THE YEAR ENDED DECEMBER 31, 2006
HIGHLIGHTS FOR THE PERIOD
[All figures in Chilean Pesos]
- Net income grew 311.8% reaching Ch$285,960 million.
- Operating Revenues increased 18.2% to Ch$3,892,064 million, as a consequence of higher operating revenues in generation and transmission business and the higher level of distribution in order to supply an increasing demand for electricity.
- Operating Margin grew 22.5% reaching Ch$1,297,620 million.
- Operating Income improved 28.9% totaling Ch$1,068,042 million, and the increase by country is as follows:
- Chile 31.4%
- Argentina 94.4%
- Brazil 52.6%
- Colombia 9.6%
- Peru 10.7%
- EBITDA grew 22.9% reaching Ch$1,490,519 million.
- Interest coverage improved 14.9% reaching to 4.2 times.
- ROE reached 9.96%.
- Physical sales continued growing, with increases of 5.5% in distribution and 19.0% in generation and transmission.
- Our client base in distribution increased more than 360 thousand new customers.
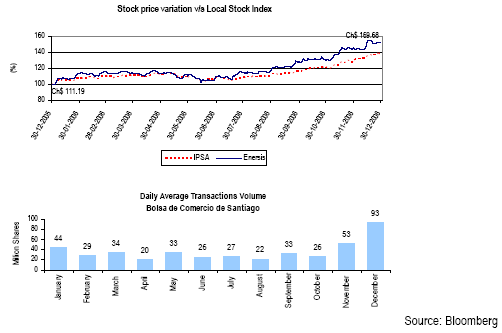
- Enersis’ Chilean stock price increased 52.6% and ADR grew 45.6%, reaching Ch$169.68 and US$16.00 respectively.
- Our market capitalization reached Ch$5,540,250 million.
- Moody’s upgraded the rating for Enersis and Endesa Chile, from Ba1 to Baa3, both with Stable Outlook, achieving investment grade category.
- Standard & Poor's Ratings placed the rating of Enersis and Endesa Chile on credit watch with positive outlook, considering their better financial profile.
Pg. 1
PRESS RELEASE | ||
TABLE OF
CONTENTS
Pg. 2
PRESS RELEASE | ||
Pg. 3
PRESS RELEASE | ||
GENERALINFORMATION
(Santiago, Chile, January 24, 2007) Enersis S.A. (NYSE: ENI), announced today its consolidated financial results for the year ended December 31, 2006. All figures are in both US$ and Ch$, under Chilean Generally Accepted Accounting Principles (Chilean GAAP), as seen in the standardized form required by Chilean authorities (FECU). Variations refer to the period between December 31, 2005 and December 31, 2006. Year 2005 figures have been adjusted by the accounting convention for CPI variation between both periods, equal to 2.1% .
For the purpose of converting Chilean pesos (Ch$) into US dollars (US$), we have used the exchange rate prevailing as of December 31, 2006 for both periods under comparison, equal to US$1 = Ch$532.39. The Chilean peso depreciated by 3.9% against the US$ comparing December 31, 2006 with December 31, 2005.
The consolidation includes the following investment vehicles and companies,
a) In Chile: Endesa Chile (NYSE: EOC), Chilectra, Synapsis, CAM and Inm. Manso de Velasco.
b) Outside Chile: Distrilima (Peru), Endesa Brasil (Brazil) [*], Edesur (Argentina) and Codensa (Colombia).
In the following pages you will find a detailed analysis of financial statements, a brief explanation for changes, and comments on main items in the Income and Cash Flow Statements compared to the information as of December 2005.
[*] Consolidated since October 2005 and includes Endesa Fortaleza, CIEN, Cachoeira Dourada, Ampla and Coelce.
Pg. 4
PRESS RELEASE | ||
SIMPLIFIEDORGANIZATIONALSTRUCTURE

Pg. 5
PRESS RELEASE | ||
MARKETINFORMATION
EQUITYMARKET
New York Stock Exchange (NYSE)
Over the last 12 months, the Enersis’ ADR stock price increased 45.6%, from US$10.99 to US$16.00, over the 16.3% increase of the Dow Jones Industrial Index. The growth of the ADR price has been higher than the Adrian Index performance1, which reached a growing rate of 24.9% .
The chart below presents the performance of Enersis stock listing in NYSE (“ENI”) against Dow Jones and the DJ Utilities benchmarks:

| _______________________________ |
| 1 ADRIAN Index is a Bolsa Electronica de Chile’s composite global index for ADRs listed in the United States. |
Pg. 6
PRESS RELEASE | ||
Bolsa de Comercio de Santiago (BCS)
Over the last 12 months, the Enersis’ Chilean stock price increased 52.6%, from Ch$111.19 to Ch$169.68. This variation is compared with the 37.1% increase on the IPSA Index.
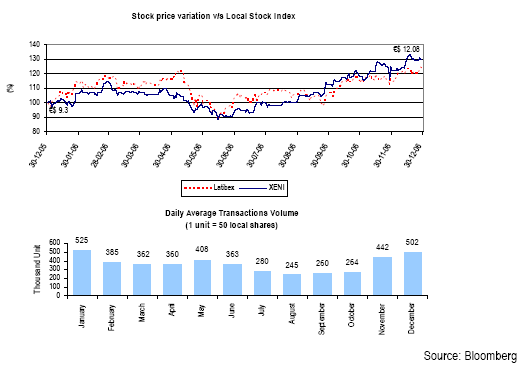
Over the last 12 months, the Enersis’ share price in the Latin American market of the Madrid Stock Exchange, (Latibex) increased from € 9.3 to € 12.08. The chart below presents the performance of XENI stock listing in the Madrid Stock Exchange against Latibex.
Pg. 7
PRESS RELEASE | ||
MARKETPERCEPTION
The research released during the period on Enersis shows the following target prices for the Company’s ADR.
| Table 1 | ||||||||
| Publication Date | Company | Main Analyst | Target Price | Recommendation | ||||
| US$ | ||||||||
| November 14, 2006 | Deutsche Bank | Marcus Sequeira | 18.0 | Buy | ||||
| November 17, 2006 | Raymond James | Ricardo Cavanagh | 17.5 | Buy | ||||
| November 27, 2006 | Larraín Vial | Cristián Ramírez | 18.1 | Overweight | ||||
| December 12, 2006 | Merrill Lynch | Frank McGann | 18.0 | Buy | ||||
| December 13, 2006 | Santander | Raimundo Valdés | 17.3 | Buy | ||||
| December 14, 2006 | Banchile | Sergio Zapata | 16.8 | Buy | ||||
| December 21, 2006 | Alfa Corredores | Rodrigo Cristi | 17.3 | Hold | ||||
| January 17, 2007 | Bear Stearn | Rowe Michels | 16 | Peer Perform | ||||
| ADR average target price (US$) | 17.4 | |||||||
Source: Bloomberg and market researches
DEBTMARKET
The following chart shows the pricing of our Yankee Bonds during the last twelve months.
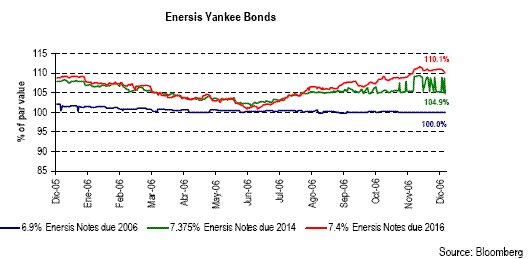
It is important to mention that, the Yankee Bond for US$ 300 million maturating 2006 was paid on December 1st, 2006.
Pg. 8
PRESS RELEASE | ||
RISKRATINGCLASSIFICATION
CORPORATE RISK RATING CLASSIFICATION:
Moody’s: Baa3 / Stable
Rationale (14/12/06)
“Moody’s upgraded its rating for Enersis and for its 60% owned subsidiary, Endesa Chile, from Ba1 to Baa3, both withStable Outlook. With this rating action, both companies achieved “investment grade” category.
Moody’s upgrade was mainly due to the companies’ higher financial flexibility and liquidity, and based also in the fact that the financial performance has raised markedly over the last two years as a result of improvements in the regulatory framework and higher demand for electricity in the countries in which the companies operate; namely, Chile, Colombia, Peru, Brazil and Argentina.
The ratings were placed onStable Outlook, reflecting the stable scenario in the region, with higher prices for electricity, better economic conditions, strong increase in electricity demand and a lower regulatory uncertainty.”
Standard & Poor’s: BBB- / Positive
Rationale (15/12/05)
Standard & Poor's Ratings placed the 'BBB-' ratings on Chile-based electricity provider Enersis on Credit Watch with positive implications due to the improvement of the company's consolidated debt service coverage ratios and financial flexibility.
Standard & Poor's expects to resolve the Credit Watch listing after completing a detailed analysis of Endesa Chile's projected cash flow for the period from 2007 to 2011, including its exposure water availability and capital expenditures.”
Fitch: BBB / Stable
Rationale (02/06/06)
“…The Risk Rating Agency upgraded Enersis’ rating from BBB- to BBB with a Stable Outlook, reflecting the sustained improvements in the Group’s finances in recent times.” Fitch “acknowledges the sustained improvement in the credit quality of the Company since the beginning of 2004, a more comfortable spread of maturities and a greater solidity presented by its operations in general”.
DOMESTIC RISK RATING CLASSIFICATION:
| Feller Rate: | Bonds: A+ / Positive | |
| Shares: 1stClass Level 1 | ||
| Fitch: | Bonds: A+ / Stable | |
| Shares: 1stClass Level 1 | ||
Pg. 9
PRESS RELEASE | ||
CONSOLIDATEDINCOMESTATEMENT
UNDERCHILEANGAAP, MILLIONCH$
Table 2
| CONS. INCOME STATEMENT - (million Ch$) | YE 05 | YE 06 | Var 06-05 | Chg % | ||||
| Revenues from Generation & Transmission | 1,199,547 | 1,622,319 | 422,772 | 35.2% | ||||
| Revenues from Distribution | 2,282,206 | 2,548,377 | 266,171 | 11.7% | ||||
| Revenues from Engineering and Real Estate | 34,051 | 49,776 | 15,725 | 46.2% | ||||
| Revenues from Other Businesses | 179,014 | 200,038 | 21,024 | 11.7% | ||||
| Consolidation Adjustments | (401,675) | (528,446) | (126,771) | (31.6%) | ||||
| Operating Revenues | 3,293,143 | 3,892,064 | 598,921 | 18.2% | ||||
| Costs from Generation | (722,503) | (986,445) | (263,942) | (36.5%) | ||||
| Costs from Distribution | (1,705,225) | (1,897,619) | (192,394) | (11.3%) | ||||
| Costs from Engineering and Real Estate | (27,484) | (36,137) | (8,653) | (31.5%) | ||||
| Costs from Other Businesses | (146,127) | (168,858) | (22,731) | (15.6%) | ||||
| Consolidation Adjustments | 367,153 | 494,615 | 127,462 | 34.7% | ||||
| Operating Costs | (2,234,186) | (2,594,444) | (360,258) | (16.1%) | ||||
| Operating Margin | 1,058,957 | 1,297,620 | 238,663 | 22.5% | ||||
| SG&A from Generation | (42,041) | (52,667) | (10,626) | (25.3%) | ||||
| SG&A from Distribution | (184,607) | (167,295) | 17,312 | 9.4% | ||||
| SG&A from Engineering and Real Estate | (3,396) | (3,773) | (377) | (11.1%) | ||||
| SG&A from Other Businesses | (33,358) | (40,791) | (7,433) | (22.3%) | ||||
| Consolidation Adjustments | 33,089 | 34,948 | 1,859 | 5.6% | ||||
| Selling and Administrative Expenses | (230,313) | (229,578) | 735 | 0.3% | ||||
| Operating Income | 828,644 | 1,068,042 | 239,398 | 28.9% | ||||
| Interest Income | 87,945 | 124,791 | 36,846 | 41.9% | ||||
| Interest Expense | (358,033) | (390,709) | (32,676) | (9.1%) | ||||
| Net Interest (Expense) | (270,088) | (265,918) | 4,170 | 1.5% | ||||
| Equity Gains from Related Companies | 14,767 | 5,164 | (9,603) | (65.0%) | ||||
| Equity Losses from Related Companies | (7,880) | (125) | 7,755 | 98.4% | ||||
| Net Income from Related Companies | 6,887 | 5,039 | (1,848) | (26.8%) | ||||
| Other Non Operating Income | 72,464 | 110,553 | 38,089 | 52.6% | ||||
| Other Non Operating Expenses | (161,394) | (209,276) | (47,882) | (29.7%) | ||||
| Net other Non Operating Income (Expense) | (88,930) | (98,723) | (9,793) | (11.0%) | ||||
| Price Level Restatement | (5,049) | 1,217 | 6,266 | N/A | ||||
| Foreign Exchange Effect | (6,373) | 5,327 | 11,700 | N/A | ||||
| Net of Monetary Exposure | (11,422) | 6,543 | 17,965 | N/A | ||||
| Positive Goodwill Amortization | (56,345) | (55,908) | 437 | 0.8% | ||||
| Non Operating Income | (419,898) | (408,966) | 10,932 | 2.6% | ||||
| Net Inc b. Taxes, Min Int and Neg Goodwill Amort. | 408,746 | 659,076 | 250,330 | 61.2% | ||||
| Extraordinary Items | - | - | - | - | ||||
| Income Tax | (182,051) | (109,408) | 72,643 | 39.9% | ||||
| Minority Interest | (173,072) | (269,786) | (96,714) | (55.9%) | ||||
| Negative Goodwill Amortization | 15,822 | 6,078 | (9,744) | (61.6%) | ||||
| NET INCOME | 69,445 | 285,960 | 216,515 | 311.8% | ||||
| EBITDA | 1,212,475 | 1,490,519 | 278,044 | 22.9% | ||||
Pg. 10
PRESS RELEASE | ||
UNDERCHILEANGAAP, THOUSANDUS$
Table 2.1
| CONS. INCOME STATEMENT - (thousand US$) | YE 05 | YE 06 | Var 06-05 | Chg % | ||||
| Revenues from Generation & Transmission | 2,253,136 | 3,047,237 | 794,101 | 35.2% | ||||
| Revenues from Distribution | 4,286,718 | 4,786,674 | 499,956 | 11.7% | ||||
| Revenues from Engineering and Real Estate | 63,959 | 93,496 | 29,537 | 46.2% | ||||
| Revenues from Other Businesses | 336,246 | 375,736 | 39,490 | 11.7% | ||||
| Consolidation Adjustments | (754,476) | (992,593) | (238,117) | (31.6%) | ||||
| Operating Revenues | 6,185,584 | 7,310,550 | 1,124,966 | 18.2% | ||||
| Costs from Generation | (1,357,094) | (1,852,862) | (495,768) | (36.5%) | ||||
| Costs from Distribution | (3,202,963) | (3,564,340) | (361,377) | (11.3%) | ||||
| Costs from Engineering and Real Estate | (51,624) | (67,877) | (16,253) | (31.5%) | ||||
| Costs from Other Businesses | (274,474) | (317,171) | (42,697) | (15.6%) | ||||
| Consolidation Adjustments | 689,631 | 929,046 | 239,415 | 34.7% | ||||
| Operating Costs | (4,196,521) | (4,873,202) | (676,681) | (16.1%) | ||||
| Operating Margin | 1,989,063 | 2,437,348 | 448,285 | 22.5% | ||||
| SG&A from Generation | (78,967) | (98,926) | (19,959) | (25.3%) | ||||
| SG&A from Distribution | (346,752) | (314,234) | 32,518 | 9.4% | ||||
| SG&A from Engineering and Real Estate | (6,379) | (7,087) | (708) | (11.1%) | ||||
| SG&A from Other Businesses | (62,657) | (76,619) | (13,962) | (22.3%) | ||||
| Consolidation Adjustments | 62,152 | 65,643 | 3,491 | 5.6% | ||||
| Selling and Administrative Expenses | (432,602) | (431,222) | 1,380 | 0.3% | ||||
| Operating Income | 1,556,460 | 2,006,126 | 449,666 | 28.9% | ||||
| Interest Income | 165,188 | 234,398 | 69,210 | 41.9% | ||||
| Interest Expense | (672,501) | (733,877) | (61,376) | (9.1%) | ||||
| Net Interest (Expense) | (507,313) | (499,479) | 7,834 | 1.5% | ||||
| Equity Gains from Related Companies | 27,738 | 9,700 | (18,038) | (65.0%) | ||||
| Equity Losses from Related Companies | (14,801) | (235) | 14,566 | 98.4% | ||||
| Net Income from Related Companies | 12,937 | 9,465 | (3,472) | (26.8%) | ||||
| Other Non Operating Income | 136,110 | 207,653 | 71,543 | 52.6% | ||||
| Other Non Operating Expenses | (303,150) | (393,088) | (89,938) | (29.7%) | ||||
| Net other Non Operating Income (Expense) | (167,040) | (185,435) | (18,395) | (11.0%) | ||||
| Price Level Restatement | (9,483) | 2,286 | 11,769 | N/A | ||||
| Foreign Exchange Effect | (11,971) | 10,005 | 21,976 | N/A | ||||
| Net of Monetary Exposure | (21,454) | 12,290 | 33,744 | N/A | ||||
| Positive Goodwill Amortization | (105,833) | (105,013) | 820 | 0.8% | ||||
| Non Operating Income | (788,703) | (768,172) | 20,531 | 2.6% | ||||
| Net Inc b. Taxes, Min Int and Neg Goodwill Amort. | 767,757 | 1,237,954 | 470,197 | 61.2% | ||||
| Extraordinary Items | - | - | - | - | ||||
| Income Tax | (341,950) | (205,503) | 136,447 | 39.9% | ||||
| Minority Interest | (325,084) | (506,744) | (181,660) | (55.9%) | ||||
| Negative Goodwill Amortization | 29,719 | 11,417 | (18,302) | (61.6%) | ||||
| NET INCOME | 130,442 | 537,124 | 406,682 | 311.8% | ||||
| EBITDA | 2,277,418 | 2,799,674 | 522,256 | 22.9% | ||||
Pg. 11
PRESS RELEASE | ||
PROFORMACONSOLIDATEDINCOMESTATEMENT
UNDERCHILEANGAAP, MILLIONCH$
Table 3
| (Million Ch$) | YE 05 | YE 05 pf* | YE 06 | Var | Var | |||||
| O6 / 05 | O6 / 05 Pf * | |||||||||
| Operating Revenues | 3,293,143 | 3,373,128 | 3,892,064 | 18.2% | 15.4% | |||||
| Operating Costs | (2,234,186) | (2,251,954) | (2,594,444) | (16.1%) | (15.2%) | |||||
| Operating Margin | 1,058,957 | 1,121,174 | 1,297,620 | 22.5% | 15.7% | |||||
| S&A Expenses | (230,313) | (233,677) | (229,578) | (0.3%) | 1.8% | |||||
| Operating Income | 828,644 | 887,498 | 1,068,042 | 28.9% | 20.3% | |||||
| Non Operating Income | (419,898) | (460,979) | (408,966) | 2.6% | 11.3% | |||||
| NI before Taxes | 408,746 | 426,518 | 659,076 | 61.2% | 54.5% | |||||
| Income Tax | (182,051) | (203,125) | (109,408) | 39.9% | 46.1% | |||||
| Minority Interest | (173,072) | (169,770) | (269,786) | (55.9%) | (58.9%) | |||||
| Negative Goodwill Amortization | 15,822 | 15,822 | 6,078 | (61.6%) | (61.6%) | |||||
| Net Income | 69,445 | 69,445 | 285,960 | 311.8% | 311.8% | |||||
| * pf: Proforma Income Statement, consolidates 9M05 of Cien and Fortaleza | ||||||||||
UNDERCHILEANGAAP, THOUSANDUS$
Table 3.1
| (Thousand US$) | YE 05 | YE 05 pf* | YE 06 | Var | Var | |||||
| O6 / 05 | O6 / 05 Pf * | |||||||||
| Operating Revenues | 6,185,584 | 6,335,821 | 7,310,550 | 18.2% | 15.4% | |||||
| Operating Costs | (4,196,521) | (4,229,895) | (4,873,202) | (16.1%) | (15.2%) | |||||
| Operating Margin | 1,989,063 | 2,105,927 | 2,437,348 | 22.5% | 15.7% | |||||
| S&A Expenses | (432,602) | (438,920) | (431,222) | 0.3% | 1.8% | |||||
| Operating Income | 1,556,460 | 1,667,007 | 2,006,128 | 28.9% | 20.3% | |||||
| Non Operating Income | (788,703) | (865,868) | (768,170) | 2.6% | 11.3% | |||||
| NI before Taxes | 767,757 | 801,139 | 1,237,956 | 61.2% | 54.5% | |||||
| Income Tax | (341,950) | (381,534) | (205,503) | 39.9% | 46.1% | |||||
| Minority Interest | (325,084) | (318,883) | (506,745) | (55.9%) | (58.9%) | |||||
| Negative Goodwill Amortization | 29,719 | 29,719 | 11,416 | (61.6%) | (61.6%) | |||||
| Net Income | 130,442 | 130,442 | 537,124 | 311.8% | 311.8% | |||||
| * pf: Proforma Income Statement, consolidates 9M05 of Cien and Fortaleza | ||||||||||
Pg. 12
PRESS RELEASE | ||
CONSOLIDATEDINCOMESTATEMENTANALYSIS
(Source in Ch$ FECU)
NETINCOME
As of December 2006, net income increased more than 311.8% up to Ch$285,960 million, which represents an increase of Ch$216,515 million. This is mainly explained by an important 28.9% improvement in operating income, and also by the recognition of the positive effect of deferred taxes due to the merger last March between Chilectra and Elesur.
Operating income as of December 2006 amounted to Ch$1,068,042 million, increasing Ch$239,398 million. This is principally due to an important improvement in operating income in generation subsidiaries in Chile and Argentina, and in distribution subsidiaries in Brazil, Peru and Colombia. Additionally, explained by the consolidation since October 2005, of some Brazilian assets under the new holding company Endesa Brasil.
Table 4 | YE05 | YE06 | ||||||||||||||
| Million Ch$ | Operating Revenues | Operating Costs | SG & A | Operating Income | Operating Revenues | Operating Costs | SG& A | Operating Income | ||||||||
| Endesa Chile | 1,146,623 | (704,081) | (39,388) | 403,154 | 1,337,121 | (793,260) | (39,386) | 504,475 | ||||||||
| Cachoeira (*) | 12,592 | (6,461) | (1,195) | 4,936 | 66,844 | (30,992) | (6,305) | 29,547 | ||||||||
| Fortaleza (**) | 30,923 | (14,758) | (480) | 15,685 | 100,193 | (46,091) | (1,571) | 52,531 | ||||||||
| Cien (**) | 28,614 | (13,957) | (1,318) | 13,339 | 143,900 | (139,072) | (5,587) | (759) | ||||||||
| Chilectra S.A. | 606,015 | (444,798) | (43,620) | 117,597 | 664,957 | (500,814) | (47,006) | 117,137 | ||||||||
| Edesur S.A. | 239,469 | (205,917) | (29,814) | 3,738 | 248,394 | (216,897) | (35,574) | (4,077) | ||||||||
| Distrilima (Edelnor) | 197,489 | (149,600) | (18,158) | 29,731 | 214,271 | (155,727) | (19,966) | 38,578 | ||||||||
| Ampla | 485,791 | (381,422) | (22,574) | 81,795 | 552,631 | (425,434) | (17,189) | 110,008 | ||||||||
| Investluz (Coelce) | 343,491 | (242,305) | (51,997) | 49,189 | 418,314 | (297,489) | (34,276) | 86,549 | ||||||||
| Codensa S.A. | 409,953 | (281,186) | (18,765) | 110,002 | 449,811 | (301,258) | (13,201) | 135,352 | ||||||||
| CAM Ltda. | 127,792 | (108,434) | (8,052) | 11,306 | 141,080 | (121,469) | (9,837) | 9,774 | ||||||||
| Inmobiliaria Manso de Velasco Ltda. | 11,356 | (8,195) | (2,103) | 1,058 | 21,659 | (11,762) | (2,626) | 7,271 | ||||||||
| Synapsis Soluciones y Servicios IT Ltda. | 46,513 | (35,424) | (7,557) | 3,532 | 54,262 | (44,992) | (10,364) | (1,094) | ||||||||
| Enersis Holding and other investment vehicles | 4,706 | (2,264) | (17,425) | (14,983) | 4,695 | (2,396) | (20,666) | (18,367) | ||||||||
| Consolidation Adjustments | (398,184) | 364,616 | 32,133 | (1,435) | (526,068) | 493,209 | 33,976 | 1,117 | ||||||||
| Total Consolidation | 3,293,143 | (2,234,186) | (230,313) | 828,644 | 3,892,064 | (2,594,444) | (229,578) | 1,068,042 | ||||||||
Table 4.1 | YE05 | YE06 | ||||||||||||||
| Thousand US$ | Operating Revenues | Operating Costs | SG & A | Operating Income | Operating Revenues | Operating Costs | SG& A | Operating Income | ||||||||
| Endesa Chile | 2,153,727 | (1,322,491) | (73,983) | 757,253 | 2,511,544 | (1,489,998) | (73,980) | 947,566 | ||||||||
| Cachoeira (*) | 23,652 | (12,135) | (2,244) | 9,273 | 125,554 | (58,212) | (11,843) | 55,499 | ||||||||
| Fortaleza (**) | 58,084 | (27,719) | (902) | 29,463 | 188,195 | (86,574) | (2,951) | 98,670 | ||||||||
| Cien (**) | 53,747 | (26,216) | (2,476) | 25,055 | 270,290 | (261,223) | (10,494) | (1,427) | ||||||||
| Chilectra S.A. | 1,138,291 | (835,474) | (81,931) | 220,886 | 1,249,004 | (940,689) | (88,292) | 220,022 | ||||||||
| Edesur S.A. | 449,800 | (386,778) | (55,999) | 7,022 | 466,564 | (407,403) | (66,819) | (7,659) | ||||||||
| Distrilima (Edelnor) | 370,948 | (280,997) | (34,106) | 55,845 | 402,470 | (292,505) | (37,503) | 72,463 | ||||||||
| Ampla | 912,472 | (716,433) | (42,400) | 153,638 | 1,038,019 | (799,103) | (32,286) | 206,630 | ||||||||
| Investluz (Coelce) | 645,187 | (455,127) | (97,667) | 92,393 | 785,728 | (558,780) | (64,381) | 162,566 | ||||||||
| Codensa S.A. | 770,024 | (528,158) | (35,246) | 206,620 | 844,889 | (565,860) | (24,796) | 254,234 | ||||||||
| CAM Ltda. | 240,035 | (203,674) | (15,125) | 21,236 | 264,993 | (228,157) | (18,477) | 18,359 | ||||||||
| Inmobiliaria Manso de Velasco Ltda. | 21,330 | (15,393) | (3,951) | 1,987 | 40,683 | (22,093) | (4,932) | 13,659 | ||||||||
| Synapsis Soluciones y Servicios IT Ltda. | 87,366 | (66,538) | (14,195) | 6,633 | 101,921 | (84,509) | (19,467) | (2,055) | ||||||||
| Enersis Holding and other investment vehicles | 8,840 | (4,253) | (32,730) | (28,142) | 8,819 | (4,500) | (38,817) | (34,498) | ||||||||
| Consolidation Adjustments | (747,919) | 684,867 | 60,356 | (2,696) | (988,125) | 926,406 | 63,818 | 2,099 | ||||||||
| Total Consolidation | 6,185,585 | (4,196,520) | (432,599) | 1,556,466 | 7,310,550 | (4,873,200) | (431,220) | 2,006,130 | ||||||||
| (*) Consolidated by Endesa Chile until September 30th, 2005. Since October 1th is consolidated by Enersis through Endesa Brasil. | ||||||||||||||||
| (**) Since October 1, 2005, these subsidiaries are consolidated by Enersis through Endesa Brasil. | ||||||||||||||||
Pg. 13
PRESS RELEASE | ||
If we compare the consolidation perimeter in homogeneous terms, the operating income would have increased by 20.3% between both periods. Now, if we add to this comparison, the 3.9% devaluation effect of the Chilean Peso against the US Dollar, the operating income would have increased 18.3% .
The company’s non-operating losses improved 2.6%, from a loss of Ch$419.898 million to a loss of Ch$408,966 million. This is mainly explained by:
Net Interest Expensesdecreasedby Ch$4,170 million or 1.5%, from Ch$270,088 million to a net expense of Ch$265,918 million, due to higher interest income from the investment of cash surplus and the reduction in net interest expenses, even though the company has consolidated the debt of two new subsidiaries and its debts in this period (CIEN and Endesa Fortaleza).
Income from investments in related companies decreased Ch$1,848 million. This is mainly explained by lower profits in Gas Atacama by Ch$3,505 million. This reductions were partially compensated with lower loss of CIEN by Ch$7,874 million and profits in CGTF of Ch$6,029 million, while both of them reached as of December 2005 a net loss of Ch$1,844 million, which during 2006, these amounts previously recognized under proportional equity value, were null considering both companies were consolidated with Enersis since October, 2005.
Amortization on positive goodwill remains with no significant variations, decreasing 0.8% .
Net other non-operating incomeworsen 11%, moving from a net loss of Ch$88,930 million to a net loss of Ch$98,723. The main reasons for this variation are,
- Write-off of accounts receivable in CIEN due to the renegotiation of its contract with Copel by Ch$30,518 million
- Higher expenses due to energy efficiency projects in the Brazilian subsidiaries by Ch$12,245 million.
- Net losses by Ch$10,118 million due to conversion adjustments to the Chilean accounting procedures, by the application of the Technical Bulletin N° 64, mainly in the subsidiaries in Colombia, Brazil and Peru.
- Higher income on the sale of fixes assets by Ch$19,181 million. Mainly due to the sale of the generation assets in Ampla.
- Lower expenses by provisions and contingencies by Ch$16,716 million.
Price-level restatementincreased by Ch$6,266 million. This is principally due to the effect of inflation of 3.6% recorded for the year ended 2005, and 2.1% for same period 2006, over non-monetary assets and liabilities and those denominated in UF.
The Foreign Exchange Effectincreased by Ch$11,700 million, due to the dollar mismatch position as of December 2006.
Income tax and Deferred taxregistered a loss of Ch$109,408 million, compared with the loss of Ch$182,051 million in December 2005, this means a positive variation of Ch$72,643 million.
Pg. 14
PRESS RELEASE | ||
The increase of Ch$116,699 million inincome tax is mainly explained by higher provisions in Coelce, Endesa, CGTF, Pehuenche, Codensa and Edelnor of Ch$25,746 million, Ch$17,240 million, Ch$16,493 million, Ch$15,093 million, Ch$10,973 million and Ch$9,804, respectively. This was partially compensated by lower expenses of Ch$5,719 million in Edesur and Ch$4,014 million in Chilectra.
Deferred taxes, which do not constitute cash flow, registered a positive variation of Ch$189,342 million. This increase was mainly explained by Ch$129,771 million from Chilectra due to the one time effect recognized in this company for Ch$107,170 million as consequence of the merger between Elesur and Chilectra. This merger implied, for Elesur, an adjustment in the provisions on valuations upon accumulated tax losses, as booked in previous exercises. This result occurs together with the positive effect of CIEN by Ch$28,835 million, Ampla by Ch$17,329 million, Coelce by Ch$14,106 million, Emgesa by Ch$12,586 million, Pehuenche by Ch$11,021 million and Codensa by Ch$10,348 million. That was partially compensated by variations in Edegel, Enersis and Endesa by Ch$12,916 million, Ch$9,398 million and Ch$5,282 million respectively.
Amortization on negative goodwill decreased Ch$9,744 million, explained by the final amortization of Edegel and the purchase of the first stake in Betania, which effect is a lower amortization of Ch$3,735 million and Ch$5,802 million respectively.
EVOLUTIONOFKEYFINANCIALRATIOS
| Table 5 | ||||||||||
| Indicator | Unit | YE05 | YE06 | Var 06-05 | Chg % | |||||
| Liquidity | Times | 0.87 | 1.17 | 0.30 | 34.5% | |||||
| Acid ratio test * | Times | 0.80 | 1.09 | 0.29 | 36.3% | |||||
| Working capital | million Ch$ | (191,320) | 241,882 | 433,202 | N/A | |||||
| Working capital | th. US$ | (359,361) | 454,333 | 813,693 | N/A | |||||
| Leverage ** | Times | 0.90 | 0.93 | 0.03 | 3.3% | |||||
| Short-term debt | % | 0.31 | 0.26 | (0.05) | (16.1%) | |||||
| Long-term debt | % | 0.69 | 0.74 | 0.05 | 7.2% | |||||
| Interest Coverage*** | Times | 3.62 | 4.16 | 0.54 | 14.9% | |||||
| EBITDA**** | th. US$ | 2,277,418 | 2,799,674 | 522,256 | 22.9% | |||||
| ROE | % | 2.62% | 9.96% | 7.34% | 280.2% | |||||
| ROA | % | 0.66% | 2.58% | 1.92% | 290.9% | |||||
| * Current assets net of inventories and pre-paid expenses | ||||||||||
| ** Using the ratio = Total debt / (equity + minority interest) | ||||||||||
| ***EBITDAEI/Interest expenses = (Earnings before taxes+Fin exp+Net non operating income+depreciation+Positive Goodwill) /Interest expenses | ||||||||||
| ****EBITDA: Operating Income+Depreciation+Amortization | ||||||||||
Liquidity ratioincreased to 1.17 times, which represents an improvement of 34.5% . This means that the company is showing stronger liquidity.
Leverage reached 0.93 times, maintaining the same level as in the last year, increasing 3.3% .
ROE reached 9.96%, improving significantly respect the 2.62% seen as of December 2005, mainly explained by the higher net income.
Interest Coverage improved 14.9% to 4.16 times, mainly due to the increase in operating results in all our subsidiaries throughout Latin America.
Pg. 15
PRESS RELEASE | ||
CONSOLIDATEDBALANCESHEET
ASSETSUNDERCHILEANGAAP,MILLIONCH$
| Table 6 | ||||||||
| ASSETS - (million Ch$) | YE 05 | YE 06 | Var 06-05 | Chg % | ||||
| CURRENT ASSETS | ||||||||
| Cash | 72,874 | 99,794 | 26,920 | 36.9% | ||||
| Time deposits | 265,352 | 282,125 | 16,773 | 6.3% | ||||
| Marketable securities | 5,422 | 9,114 | 3,692 | 68.1% | ||||
| Accounts receivable, net | 648,183 | 839,114 | 190,932 | 29.5% | ||||
| Notes receivable, net | 3,644 | 7,468 | 3,824 | - | ||||
| Other accounts receivable, net | 64,189 | 102,349 | 38,160 | 59.5% | ||||
| Amounts due from related companies | 11,520 | 13,565 | 2,045 | 17.8% | ||||
| Inventories | 72,098 | 65,909 | (6,190) | (8.6%) | ||||
| Income taxes recoverable | 51,786 | 42,272 | (9,513) | (18.4%) | ||||
| Prepaid expenses | 35,854 | 51,443 | 15,589 | 43.5% | ||||
| Deferred income taxes | 55,124 | 61,556 | 6,432 | 11.7% | ||||
| Other current assets | 42,770 | 66,656 | 23,886 | 55.8% | ||||
| Total currrent assets | 1,328,816 | 1,641,367 | 312,551 | 23.5% | ||||
| PROPERTY, PLANT AND EQUIPMENT | ||||||||
| Land | 129,843 | 132,604 | 2,761 | 2.1% | ||||
| Buildings and infraestructure and works in progress | 10,561,484 | 10,935,963 | 374,478 | 3.5% | ||||
| Machinery and equipment | 1,757,852 | 1,987,188 | 229,336 | 13.0% | ||||
| Other plant and equipment | 438,828 | 607,486 | 168,658 | 38.4% | ||||
| Technical appraisal | 183,407 | 186,062 | 2,656 | 1.4% | ||||
Sub - Total | 13,071,415 | 13,849,304 | 777,890 | 6.0% | ||||
| Accumulated depreciation | (5,264,658) | (5,761,867) | (497,209) | (9.4%) | ||||
| Total property, plant and equipment | 7,806,757 | 8,087,437 | 280,680 | 3.6% | ||||
| OTHER ASSETS | 100,968 | 115,267 | 14,299 | 14.2% | ||||
| Investments in related companies | 41,511 | 24,092 | (17,420) | (42.0%) | ||||
| Investments in other companies | 716,132 | 655,062 | (61,070) | (8.5%) | ||||
| Positive goodwill, net | (37,461) | (37,016) | 444 | 1.2% | ||||
| Negative goodwill, net | 144,623 | 137,480 | (7,144) | (4.9%) | ||||
| Long-term receivables | 91,713 | 90,524 | (1,189) | (1.3%) | ||||
| Amounts due from related companies | - | 12,249 | 12,249 | - | ||||
| Deferred income taxes | 83,534 | 90,759 | 7,226 | 8.7% | ||||
| Intangibles | (49,440) | (54,801) | (5,361) | (10.8%) | ||||
| Accumulated amortization | 253,851 | 299,990 | 46,138 | 18.2% | ||||
| Others assets | ||||||||
| Total other assets | 1,345,432 | 1,333,605 | (11,827) | (0.9%) | ||||
| TOTAL ASSETS | 10,481,005 | 11,062,409 | 581,404 | 5.5% | ||||
Pg. 16
PRESS RELEASE | ||
ASSETSUNDERCHILEANGAAP,THOUSANDUS$
| Table 6.1 | ||||||||
| ASSETS - (thousand US$) | YE 05 | YE 06 | Var 06-05 | Chg % | ||||
| CURRENT ASSETS | ||||||||
| Cash | 136,880 | 187,446 | 50,566 | 36.9% | ||||
| Time deposits | 498,417 | 529,922 | 31,505 | 6.3% | ||||
| Marketable securities | 10,184 | 17,119 | 6,935 | 68.1% | ||||
| Accounts receivable, net | 1,217,496 | 1,576,127 | 358,631 | 29.5% | ||||
| Notes receivable, net | 6,845 | 14,028 | 7,183 | - | ||||
| Other accounts receivable, net | 120,567 | 192,244 | 71,677 | 59.5% | ||||
| Amounts due from related companies | 21,637 | 25,479 | 3,842 | 17.8% | ||||
| Inventories | 135,424 | 123,798 | (11,626) | (8.6%) | ||||
| Income taxes recoverable | 97,270 | 79,401 | (17,869) | (18.4%) | ||||
| Prepaid expenses | 67,346 | 96,627 | 29,281 | 43.5% | ||||
| Deferred income taxes | 103,541 | 115,623 | 12,082 | 11.7% | ||||
| Other current assets | 80,336 | 125,202 | 44,866 | 55.8% | ||||
| Total currrent assets | 2,495,944 | 3,083,015 | 587,071 | 23.5% | ||||
| PROPERTY, PLANT AND EQUIPMENT | ||||||||
| Land | 243,887 | 249,074 | 5,187 | 2.1% | ||||
| Buildings and infraestructure and works in progres | 19,837,871 | 20,541,263 | 703,392 | 3.5% | ||||
| Machinery and equipment | 3,301,813 | 3,732,580 | 430,767 | 13.0% | ||||
| Other plant and equipment | 824,261 | 1,141,055 | 316,794 | 38.4% | ||||
| Technical appraisal | 344,497 | 349,485 | 4,988 | 1.4% | ||||
Sub - Total | 24,552,329 | 26,013,457 | 1,461,128 | 6.0% | ||||
| Accumulated depreciation | (9,888,724) | (10,822,643) | (933,919) | (9.4%) | ||||
| Total property, plant and equipment | 14,663,605 | 15,190,814 | 527,209 | 3.6% | ||||
| OTHER ASSETS | ||||||||
| Investments in related companies | 189,651 | 216,509 | 26,858 | 14.2% | ||||
| Investments in other companies | 77,972 | 45,252 | (32,720) | (42.0%) | ||||
| Positive goodwill, net | 1,345,127 | 1,230,418 | (114,709) | (8.5%) | ||||
| Negative goodwill, net | (70,363) | (69,529) | 834 | 1.2% | ||||
| Long-term receivables | 271,649 | 258,231 | (13,418) | (4.9%) | ||||
| Amounts due from related companies | 172,267 | 170,033 | (2,234) | (1.3%) | ||||
| Deferred income taxes | - | 23,008 | 23,008 | - | ||||
| Intangibles | 156,903 | 170,475 | 13,572 | 8.7% | ||||
| Accumulated amortization | (92,865) | (102,935) | (10,070) | (10.8%) | ||||
| Others assets | 476,814 | 563,477 | 86,663 | 18.2% | ||||
| Total other assets | 2,527,155 | 2,504,941 | (22,214) | (0.9%) | ||||
| TOTAL ASSETS | 19,686,704 | 20,778,770 | 1,092,066 | 5.5% | ||||
Pg. 17
PRESS RELEASE | ||
LIABILITIES ANDSHAREHOLDERSEQUITYUNDERCHILEANGAAP,MILLIONCH$
| Table 7 | ||||||||
| LIABILITIES AND SHAREHOLDER´S EQUITY - (million Ch$) | YE 05 | YE 06 | Var 06-05 | Chg % | ||||
| CURRENT LIABILITIES | ||||||||
| Short-term debt due to banks and financial institutions | 112,817 | 134,259 | 21,441 | 19.0% | ||||
| Current portion of long-term debt due to banks and financial institutions | 120,044 | 98,482 | (21,562) | (18.0%) | ||||
| Current portion of bonds payable | 526,349 | 113,208 | (413,142) | (78.5%) | ||||
| Current portion of long-term notes payable | 30,733 | 34,023 | 3,290 | 10.7% | ||||
| Dividends payable | 17,869 | 74,687 | 56,818 | - | ||||
| Accounts payable | 289,488 | 369,730 | 80,243 | 27.7% | ||||
| Short-term notes payable | 14,665 | 15,727 | 1,062 | 7.2% | ||||
| Miscellaneous payables | 86,511 | 111,387 | 24,877 | 28.8% | ||||
| Accounts payable to related companies | 48,465 | 29,863 | (18,603) | (38.4%) | ||||
| Accrued expenses | 75,536 | 79,351 | 3,815 | 5.0% | ||||
| Withholdings | 75,498 | 99,987 | 24,489 | 32.4% | ||||
| Income taxes payable | 68,102 | 142,911 | 74,810 | - | ||||
| Anticipated income | 4,157 | 5,020 | �� | 863 | 20.8% | |||
| Reinbursable financial contribution | 1,744 | 1,049 | (695) | (39.8%) | ||||
| Other current liabilities | 48,158 | 89,802 | 41,644 | 86.5% | ||||
| Total current liabilities | 1,520,136 | 1,399,485 | (120,651) | (7.9%) | ||||
| LONG-TERM LIABILITIES | ||||||||
| Due to banks and financial institutions | 565,456 | 905,943 | 340,487 | 60.2% | ||||
| Bonds payable | 2,044,245 | 2,195,521 | 151,276 | 7.4% | ||||
| Long -term notes payable | 107,817 | 112,389 | 4,572 | 4.2% | ||||
| Accounts payables | 48,841 | 153,786 | 104,945 | - | ||||
| Amounts payable to related companies | 13,520 | 11,250 | (2,270) | (16.8%) | ||||
| Accrued expenses | 408,708 | 324,947 | (83,761) | (20.5%) | ||||
| Deferred income taxes | 87,433 | - | (87,433) | - | ||||
| Reinbursable financial contribution | 4,079 | 2,952 | (1,126) | (27.6%) | ||||
| Other long-term liabilities | 171,545 | 216,291 | 44,747 | 26.1% | ||||
| Total long-term liabilities | 3,451,643 | 3,923,079 | 471,436 | 13.7% | ||||
| Minority interest | 2,858,841 | 2,869,963 | 11,122 | 0.4% | ||||
| SHAREHOLDERS´ EQUITY | ||||||||
| Paid-in capital, no par value | 2,415,284 | 2,415,284 | - | 0.0% | ||||
| Additional paid-in capital | - | - | - | - | ||||
| Additional paid-in capital (share premium) | 172,124 | 172,124 | (0) | (0.0%) | ||||
| Other reserves | (241,699) | (238,342) | 3,356 | (1.4%) | ||||
Total capital and reserves | 2,345,710 | 2,349,066 | 3,356 | 0.1% | ||||
| Retained earnings | 235,230 | 271,280 | 36,050 | 15.3% | ||||
| Net income for the period | 69,445 | 285,960 | 216,515 | - | ||||
| Interim dividends | - | (36,243) | (36,243) | - | ||||
| Deficits of subsidaries in development stage | - | (182) | (182) | - | ||||
Total retained earnings | 304,675 | 520,816 | 216,141 | 70.9% | ||||
| Total shareholder´s equity | 2,650,385 | 2,869,882 | 219,497 | 8.3% | ||||
| TOTAL LIABILITIES AND SHAREHOLDER´S EQUITY | 10,481,005 | 11,062,409 | 581,404 | 5.5% | ||||
Pg. 18
PRESS RELEASE | ||
LIABILITIES ANDSHAREHOLDERSEQUITYUNDERCHILEANGAAP,THOUSANDUS$
| Table 7.1 | ||||||||
| LIABILITIES - (thousand US$) | YE 05 | YE 06 | Var 06-05 | Chg % | ||||
| CURRENT LIABILITIES | ||||||||
| Short-term debt due to banks and financial institutions | 211,908 | 252,182 | 40,274 | 19.0% | ||||
| Current portion of long-term debt due to banks and financial in | 225,481 | 184,981 | (40,500) | (18.0%) | ||||
| Current portion of bonds payable | 988,654 | 212,640 | (776,014) | (78.5%) | ||||
| Current portion of long-term notes payable | 57,727 | 63,906 | 6,179 | 10.7% | ||||
| Dividends payable | 33,563 | 140,285 | 106,722 | - | ||||
| Accounts payable | 543,751 | 694,473 | 150,722 | 27.7% | ||||
| Short-term notes payable | 27,545 | 29,540 | 1,995 | 7.2% | ||||
| Miscellaneous payables | 162,495 | 209,221 | 46,726 | 28.8% | ||||
| Accounts payable to related companies | 91,034 | 56,091 | (34,943) | (38.4%) | ||||
| Accrued expenses | 141,881 | 149,046 | 7,165 | 5.0% | ||||
| Withholdings | 141,809 | 187,807 | 45,998 | 32.4% | ||||
| Income taxes payable | 127,917 | 268,434 | 140,517 | - | ||||
| Anticipated income | 7,809 | 9,430 | 1,621 | 20.8% | ||||
| Reinbursable financial contribution | 3,275 | 1,971 | (1,304) | (39.8%) | ||||
| Other current liabilities | 90,456 | 168,678 | 78,222 | 86.5% | ||||
| Total current liabilities | 2,855,305 | 2,628,685 | (226,620) | (7.9%) | ||||
| LONG-TERM LIABILITIES | ||||||||
| Due to banks and financial institutions | 1,062,108 | 1,701,652 | 639,544 | 60.2% | ||||
| Bonds payable | 3,839,751 | 4,123,896 | 284,145 | 7.4% | ||||
| Long -term notes payable | 202,514 | 211,102 | 8,588 | 4.2% | ||||
| Accounts payables | 91,739 | 288,860 | 197,121 | - | ||||
| Amounts payable to related companies | 25,395 | 21,132 | (4,263) | (16.8%) | ||||
| Accrued expenses | 767,685 | 610,355 | (157,330) | (20.5%) | ||||
| Deferred income taxes | 164,228 | - | (164,228) | - | ||||
| Reinbursable financial contribution | 7,661 | 5,545 | (2,116) | (27.6%) | ||||
| Other long-term liabilities | 322,216 | 406,265 | 84,049 | 26.1% | ||||
| Total long-term liabilities | 6,483,297 | 7,368,807 | 885,510 | 13.7% | ||||
| Minority interest | 5,369,826 | 5,390,715 | 20,889 | 0.4% | ||||
| SHAREHOLDERS´ EQUITY | ||||||||
| Paid-in capital, no par value | 4,536,683 | 4,536,683 | - | 0.0% | ||||
| Additional paid-in capital | - | - | - | - | ||||
| Additional paid-in capital (share premium) | 323,305 | 323,305 | - | (0.0%) | ||||
| Other reserves | (453,988) | (447,684) | 6,304 | (1.4%) | ||||
Total capital and reserves | 4,405,999 | 4,412,304 | 6,305 | 0.1% | ||||
| Retained earnings | 441,837 | 509,551 | 67,714 | 15.3% | ||||
| Net income for the period | 130,441 | 537,126 | 406,685 | - | ||||
| Interim dividends | - | (68,076) | (68,076) | - | ||||
| Deficits of subsidaries in development stage | - | (341) | (341) | - | ||||
Total retained earnings | 572,277 | 978,260 | 405,983 | 70.9% | ||||
| Total shareholder´s equity | 4,978,277 | 5,390,563 | 412,286 | 8.3% | ||||
| TOTAL LIABILITIES AND SHAREHOLDER´S EQUITY | 19,686,704 | 20,778,770 | 1,092,066 | 5.5% | ||||
Pg. 19
PRESS RELEASE | ||
CONSOLIDATEDBALANCESHEETANALYSIS
The Company’sTotal Assets increased Ch$581,404 million. This was due to:
| • | Current Assets increased by Ch$312,551 million, equivalent to a 23.5%, mainly due to: | |
| • | An increase in accounts receivable Ch$190,932 million, principally due to a rise in billing from distribution subsidiaries Codensa Ch$61,179 million, Ampla Ch$25,302 million, CIEN Ch$18,549 million, Cachoeira Dourada Ch$14,038 million, Chilectra Ch$13,897 million, Edegel Ch$12,490 million, Costanera Ch$10,433, Endesa Chile Ch$10,042 million and Emgesa Ch$6,716 million. | |
| • | An increase in other accounts receivable by Ch$38,160 million due mainly to increases in Chilean generation produced by tolls reliquidation Ch$9,380 million, Codensa Ch$8,678 million and Endesa Chile Ch$4,844 million. | |
| • | An increase in another current assets by Ch$23,886 million, principally due to an increment in of sell back instruments in Endesa Chile of Ch$27,428 million. | |
| • | An increase of Ch$16,773 million in time deposits, mainly due to cash surplus at the subsidiaries Emgesa of Ch$31,079 million, Cono Sur of Ch$15,173 million and Enersis of Ch$6,950 million principally offset by withdrawals in Betania of Ch$15,122 million, Codensa of Ch$9,124 million, and Costanera of Ch$4,119 million. | |
| • | Fixed Assetsincreased by Ch$280,680 million, equivalent to 3.6% explained mainly by new fixed assets addition of near Ch$520,000 million, fixed assets inclusion due to consolidation of Etevensa of Ch$126,807 million and the real exchange rate effect on foreign companies’ effects as result of the policy settled in Technical Bulletin N°64 related to keep in historical USD non monetary assets belonging to subsidiaries located in unstable countries by Ch$91,502 million. The previous mentioned is partially offset by fixed asset depreciation for around Ch$415.000 million and fixed asset sales of Ch$44,550 million. | |
Total Liabilities increased by Ch$581,404 million, due to:
| • | Short-term liabilitiesincreased Ch$120,651 million or 7.9% as a result of: | |
| • | Decrease in bonds payable of Ch$413,142 million due to payments for Enersis od Ch$157,881 million, Endesa Chile of Ch$112,916 million, Endesa Chile Internacional Ch$79,902 million and Emgesa Ch$41,786 million. | |
| • | Increase in payable accounts of Ch$80,243 million due to the increase in Codensa by Ch$18,923 million, CIEN by Ch$18,369 million, Endesa Chile by Ch$15,572, Coelce by Ch$9,720 and Chilectra by Ch$7,889 million. | |
| • | Increase in payable dividend of Ch$56,818 million, principally due to Codensa of Ch$21,180 million, and Endesa Internacional of Ch$22,794 million (Distrilima, Codensa, Emgesa and Endesa Brasil). | |
| • | Increase in miscellaneous payable accounts of Ch$24,877 million as result of increases in Coelce of Ch$15,441 million and Edegel of Ch$12.843 million respectively. | |
| • | Increase in income taxes of Ch$74,810 million, where highlights Ampla with a rise of Ch$53,761 million, Edelnor of Ch$7,987 million and Codensa Ch$5,858 million. | |
Pg. 20
PRESS RELEASE | ||
| • | Long term liabilitiesincreased of Ch$471,436 million or 13.7% due to: | |
| • | Increase of Ch$340,487 million in bank liabilities corresponding increase in Enersis by Ch$123,226 million, CGTF of Ch$60,519 million, Betania Ch$59,168 million, Chocón Ch$53,239 million, CIEN Ch$37,216 million and Edesur Ch$36,897 million. The above mentioned is partially compensated with decrease in Ampla of Ch$23,922 million, Endesa Chile Ch$18,496 million and Pehuenche Ch$13,082 million. | |
| • | Increase of Ch$151,276 million in the long term portion of bonds payable, due to new issuances in Ampla Ch$93,018 million, Edelnor Ch$27,103 million, Betania Ch$23,690 and Emgesa Ch$9,512 million. | |
| • | Increase in miscellaneous payable accounts of Ch$104,945 million, due to rise in Edegel Ch$58.846 million, Endesa Brasil Ch$27,647 million, and CIEN Ch$11,709 million. | |
| • | Decrease of provisions of Ch$83,761 million, explained by lower provisions of labor contingencies and third parties of CGTF, Ampla, Coelce and CIEN Ch$87,468 million. | |
Minority interestreached Ch$2,869,963 million, without significant changes near to 0.4% equal to Ch$11,122 million.
Shareholders’ Equity increased by Ch$219,497 million. This variation is mainly explained by the increase of Ch$36,050 million in retained earnings and the increase of Ch$216,515 million in net income, partially offset by the distribution of interim dividends of Ch$36.243.
Pg. 21
PRESS RELEASE | ||
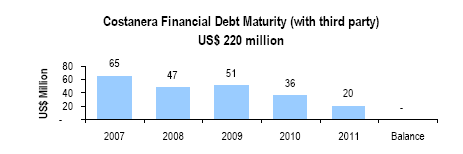
DEBTMATURITY WITHTHIRDPARTIES,MILLIONCH$
Table 8
| TOTAL | |||||||
| Million Ch$ | 2007 | 2008 | 2009 | 2010 | 2011 | Balance | |
Chile | 28,828 | 392,897 | 337,821 | 127,790 | 16,800 | 1,001,829 | 1,905,966 |
| Enersis | 1,625 | 169,423 | 1,704 | 1,716 | 1,814 | 434,280 | 610,562 |
| Chilectra | - | - | - | - | - | - | - |
| Other (*) | 22,360 | 5,410 | 1,215 | 537 | - | - | 29,522 |
| Endesa Chile (**) | 4,843 | 218,063 | 334,902 | 125,538 | 14,986 | 567,550 | 1,265,882 |
Argentina | 55,532 | 61,139 | 66,605 | 40,472 | 32,703 | - | 256,451 |
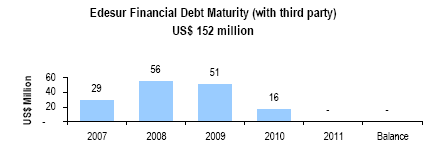
| Edesur | 15,560 | 29,640 | 27,120 | 8,694 | - | - | 81,014 |
| Costanera | 34,862 | 25,287 | 27,062 | 19,356 | 10,521 | - | 117,088 |
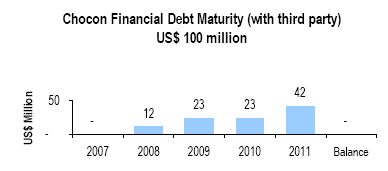
| Chocon | - | 6,211 | 12,422 | 12,422 | 22,183 | - | 53,239 |
| Hidroinvest | 5,110 | - | - | - | - | - | 5,110 |
| CTM | - | - | - | - | - | - | - |
| Tesa | - | - | - | - | - | - | - |
Perú | 91,704 | 79,346 | 50,639 | 23,585 | 19,960 | 86,117 | 351,350 |
| Edelnor | 34,061 | 4,996 | 12,365 | 4,996 | 7,476 | 34,533 | 98,427 |
| Edegel | 57,643 | 74,350 | 38,274 | 18,589 | 12,484 | 51,584 | 252,924 |
Brazil | 42,257 | 116,459 | 73,454 | 122,158 | 121,938 | 185,032 | 661,298 |
| Endesa Brasil | - | - | - | - | - | - | - |
| Coelce | 25,984 | 25,112 | 22,203 | 13,447 | 13,712 | 33,644 | 134,101 |
| Ampla | 6,381 | 83,198 | 43,571 | 50,858 | 49,964 | 61,338 | 295,310 |
| Cachoeira | 2,815 | 819 | - | - | - | - | 3,634 |
| Cien | 2,579 | 2,505 | 2,505 | 52,303 | 52,311 | 51,034 | 163,238 |
| Fortaleza | 4,498 | 4,825 | 5,174 | 5,550 | 5,952 | 39,017 | 65,017 |
Colombia | 104,380 | - | 87,047 | 9,513 | 133,169 | 191,433 | 525,541 |
| Codensa | 47,425 | - | 11,890 | - | 47,561 | 59,451 | 166,326 |
| Emgesa | 43,081 | - | 75,156 | - | - | 59,451 | 177,688 |
| Betania | 13,874 | - | - | 9,513 | 85,608 | 72,532 | 181,527 |
TOTAL | 322,701 | 649,841 | 615,565 | 323,517 | 324,571 | 1,464,412 | 3,700,606 |
| (*) Includes: CAM | |||||||
| (**) Includes: Endesa Chile Internacional, Pangue, Pehuenche, San Isidro, Celta and Tunel El Melon. | |||||||
DEBTMATURITY WITHTHIRDPARTIES,THOUSANDUS$
Table 8.1
| TOTAL | |||||||
| Thousand US$ | 2007 | 2008 | 2009 | 2010 | 2011 | Balance | |
Chile | 54,149 | 737,988 | 634,536 | 240,031 | 31,557 | 1,881,758 | 3,580,018 |
| Enersis | 3,052 | 318,232 | 3,200 | 3,223 | 3,408 | 815,717 | 1,146,831 |
| Chilectra | - | - | - | - | - | - | - |
| Other (*) | 42,000 | 10,162 | 2,282 | 1,008 | - | - | 55,452 |
| Endesa Chile (**) | 9,097 | 409,594 | 629,054 | 235,800 | 28,149 | 1,066,041 | 2,377,734 |
Argentina | 104,307 | 114,838 | 125,106 | 76,019 | 61,428 | - | 481,697 |
| Edesur | 29,226 | 55,673 | 50,941 | 16,329 | - | - | 152,170 |
| Costanera | 65,482 | 47,498 | 50,831 | 36,356 | 19,761 | - | 219,929 |
| Chocon | - | 11,667 | 23,333 | 23,333 | 41,667 | - | 100,000 |
| Hidroinvest | 9,599 | - | - | - | - | - | 9,599 |
| CTM | - | - | - | - | - | - | - |
| Tesa | - | - | - | - | - | - | - |
Peru | 172,249 | 149,038 | 95,116 | 44,300 | 37,491 | 161,756 | 659,949 |
| Edelnor | 63,978 | 9,384 | 23,225 | 9,384 | 14,042 | 64,865 | 184,877 |
| Edegel | 108,271 | 139,654 | 71,891 | 34,916 | 23,449 | 96,891 | 475,072 |
Brazil | 79,372 | 218,747 | 137,971 | 229,452 | 229,039 | 347,551 | 1,242,132 |
| Endesa Brasil | - | - | - | - | - | - | - |
| Coelce | 48,806 | 47,168 | 41,704 | 25,257 | 25,755 | 63,194 | 251,884 |
| Ampla | 11,985 | 156,272 | 81,841 | 95,528 | 93,848 | 115,212 | 554,687 |
| Cachoeira | 5,287 | 1,539 | - | - | - | - | 6,826 |
| Cien | 4,845 | 4,706 | 4,706 | 98,242 | 98,256 | 95,858 | 306,613 |
| Fortaleza | 8,449 | 9,062 | 9,719 | 10,424 | 11,181 | 73,287 | 122,122 |
Colombia | 196,059 | - | 163,501 | 17,868 | 250,134 | 359,573 | 987,136 |
| Codensa | 89,079 | - | 22,333 | - | 89,334 | 111,667 | 312,414 |
| Emgesa | 80,920 | - | 141,168 | - | - | 111,667 | 333,755 |
| Betania | 26,060 | - | - | 17,868 | 160,800 | 136,238 | 340,966 |
TOTAL | 606,136 | 1,220,610 | 1,156,230 | 607,669 | 609,648 | 2,750,638 | 6,950,931 |
| (*) Includes: CAM | |||||||
| (**) Includes: Endesa Chile Internacional, Pangue, Pehuenche, San Isidro, Celta and Tunel El Melon. | |||||||
Pg. 22
PRESS RELEASE | ||
CONSOLIDATEDCASHFLOW
UNDERCHILEANGAAP, MILLIONCH$
Table 9
| Million Ch$ | YE 05 | YE 06 | Var 06-05 | Chg % |
| CASH FLOWS PROVIDED BY OPERATING ACTIVITIES | ||||
| Net income (loss) for the year | 69,445 | 285,960 | 216,515 | |
| Gain (losses) from sales of assets: | ||||
| Losses (gain) on sale of property, plant and equipment | 841 | (18,844) | (19,685) | N/A |
| Charges (credits) to income which do not represent cash flows: | ||||
| Depreciation | 375,344 | 414,617 | 39,273 | 10.5% |
| Amortization of intangibles | 8,487 | 7,859 | (628) | (7.4%) |
| Write-offs and accrued expenses | 56,940 | 26,064 | (30,876) | (54.2%) |
| Equity in income of related companies | (14,767) | (5,164) | 9,603 | 65.0% |
| Equity in losses of related companies | 7,880 | 125 | (7,755) | - |
| Amortization of positive goodwill | 56,345 | 55,908 | (437) | (0.8%) |
| Amortization of negative goodwill | (15,822) | (6,078) | 9,744 | 61.6% |
| Price-level restatement, net | 5,049 | (1,217) | (6,266) | N/A |
| Exchange difference, net | 6,373 | (5,328) | (11,701) | N/A |
| Other credits to income which do not represent cash flows | (27,094) | (15,191) | 11,903 | 43.9% |
| Other charges to income which do not represent cash flows | 87,538 | 68,811 | (18,727) | (21.4%) |
| Changes in assets which affect cash flows: | - | 0.0% | ||
| Decrease (increase) in trade receivables | (79,263) | (180,592) | (101,329) | (127.8%) |
| Decrease (increase) in inventory | (20,295) | 4,667 | 24,962 | N/A |
| Decrease (increase) in other assets | 27,645 | (97,172) | (124,817) | N/A |
| Changes in liabilities which affect cash flow: | ||||
| Decreased (increase) in payable accounts associated with operating results | 18,135 | 146,133 | 127,998 | - |
| Decreased (increase) of payable interest | 36,918 | 27,925 | (8,993) | (24.4%) |
| Decreased (increase) in income tax payable | 45,717 | (30,614) | (76,331) | N/A |
| Decreased (increase) in other accounts payable associated with non-operating results | 42,470 | (36,931) | (79,401) | N/A |
| Decreased (increase) in value added tax and other similar taxes payable, net | (23,808) | (48,316) | (24,508) | (102.9%) |
| Income (loss) attributable to minority interest | 173,073 | 269,786 | 96,713 | 55.9% |
| NET CASH FLOW PROVIDED BY OPERATING ACTIVITIES | 837,148 | 862,408 | 25,260 | 3.0% |
Pg. 23
PRESS RELEASE | ||
Cont. Table 9
| Million Ch$ | YE 05 | YE 06 | Var 06-05 | Chg % |
| CASH FLOWS FROM FINANCING ACTIVITIES | ||||
| Proceeds from issuance of shares issued to minorities | - | - | - | - |
| Proceeds from debt issuance | 409,208 | 1,274,208 | 865,000 | - |
| Proceeds from bond issuance | 170,583 | 166,645 | (3,938) | (2.3%) |
| Proceeds from loans obtained from related companies | - | - | - | - |
| Proceeds from other loans obtained from related companies | - | - | - | - |
| Other sources of financing | 691 | - | (691) | (100.0%) |
| Capital paid | (281,707) | (85,523) | 196,184 | 69.6% |
| Dividends paid | (123,960) | (178,608) | (54,648) | (44.1%) |
| Payment of debt | (804,953) | (989,097) | (184,144) | (22.9%) |
| Payment of bonds | (112,873) | (468,853) | (355,980) | - |
| Payments of loans obtained from related companies | (2,633) | (8,078) | (5,445) | - |
| Payments of other loans obtained from related companies | - | - | - | - |
| Payments of shares issuance costs | - | - | - | - |
| Payments of bonds issuance costs | (917) | (500) | 417 | 45.5% |
| Other disbursements for financing | (17,700) | (7,284) | 10,416 | 58.8% |
| NET CASH FLOW FROM FINANCING ACTIVITIES | (764,261) | (297,090) | 467,171 | 61.1% |
| CASH FLOWS FROM INVESTING ACTIVITIES | ||||
| Proceeds from sale of property, plant and equipment | 6,222 | 44,551 | 38,329 | - |
| Sale of investment | 1,704 | 49 | (1,655) | - |
| Other loans received from related companies | 8,038 | 2,791 | (5,247) | (65.3%) |
| Other receipts from investments | 7,243 | 1,912 | (5,331) | (73.6%) |
| Additions to property, plant and equipment | (324,116) | (517,768) | (193,652) | (59.7%) |
| Long-term investments | (33,838) | (22,550) | 11,288 | 33.4% |
| Investment in financing instruments | - | - | - | - |
| Other loans granted to related companies | - | - | - | - |
| Other investment disbursements | (2,920) | (12,544) | (9,624) | - |
| NET CASH FLOW FROM INVESTMENT ACTIVITIES | (337,667) | (503,559) | (165,892) | (49.1%) |
| NET CASH FLOW FOR THE PERIOD | (264,780) | 61,759 | 326,539 | 123.3% |
| EFFECT OF PRICE-LEVEL RESTATEMENT ON CASH AND CASH EQUIVALENT | (21,406) | 10,458 | 31,864 | 148.9% |
| NET VARIATION ON CASH AND CASH EQUIVALENT | (286,186) | 72,216 | 358,402 | 125.2% |
| CASH AND CASH EQUIVALENT AT THE BEGINNING OF THE YEAR | 654,060 | 367,874 | (286,186) | (43.8%) |
| CASH AND CASH EQUIVALENT AT THE END OF THE PERIOD | 367,874 | 440,090 | 72,216 | 19.6% |
Pg. 24
PRESS RELEASE | ||
UNDERCHILEANGAAP,THOUSANDUS$
Table 9.1
| Thousand US$ | YE 05 | YE 06 | Var 06-05 | Chg % |
| CASH FLOWS PROVIDED BY OPERATING ACTIVITIES | ||||
| Net income (loss) for the year | 130,440 | 537,126 | 406,686 | - |
| Gain (losses) from sales of assets: | ||||
| Losses (gain) on sale of property, plant and equipment | 1,579 | (35,395) | (36,974) | N/A |
| Charges (credits) to income which do not represent cash flows: | ||||
| Depreciation | 705,017 | 778,784 | 73,767 | 10.5% |
| Amortization of intangibles | 15,941 | 14,762 | (1,179) | (7.4%) |
| Write-offs and accrued expenses | 106,951 | 48,957 | (57,994) | (54.2%) |
| Equity in income of related companies | (27,738) | (9,700) | 18,038 | 65.0% |
| Equity in losses of related companies | 14,801 | 235 | (14,566) | - |
| Amortization of positive goodwill | 105,833 | 105,013 | (820) | (0.8%) |
| Amortization of negative goodwill | (29,719) | (11,416) | 18,303 | 61.6% |
| Price-level restatement, net | 9,483 | (2,286) | (11,769) | N/A |
| Exchange difference, net | 11,971 | (10,007) | (21,978) | N/A |
| Other credits to income which do not represent cash flows | (50,891) | (28,534) | 22,357 | 43.9% |
| Other charges to income which do not represent cash flows | 164,424 | 129,249 | (35,175) | (21.4%) |
| Changes in assets which affect cash flows: | ||||
| Decrease (increase) in trade receivables | (148,881) | (339,211) | (190,330) | (127.8%) |
| Decrease (increase) in inventory | (38,121) | 8,765 | 46,886 | N/A |
| Decrease (increase) in other assets | 51,927 | (182,520) | (234,447) | N/A |
| Changes in liabilities which affect cash flow: | ||||
| Decreased (increase) in payable accounts associated with operating results | 34,064 | 274,484 | 240,420 | - |
| Decreased (increase) of payable interest | 69,343 | 52,453 | (16,890) | (24.4%) |
| Decreased (increase) in income tax payable | 85,871 | (57,503) | (143,374) | N/A |
| Decreased (increase) in other accounts payable associated with non-operating results | 79,772 | (69,368) | (149,140) | N/A |
| Decreased (increase) in value added tax and other similar taxes payable, net | (44,719) | (90,753) | (46,034) | (102.9%) |
| Income (loss) attributable to minority interest | 325,086 | 506,745 | 181,659 | 55.9% |
| NET CASH FLOW PROVIDED BY OPERATING ACTIVITIES | 1,572,434 | 1,619,881 | 47,447 | 3.0% |
Pg. 25
PRESS RELEASE | ||
Cont. Table 9.1
| Thousand US$ | YE 05 | YE 06 | Var 06-05 | Chg % |
| CASH FLOWS FROM FINANCING ACTIVITIES | ||||
| Proceeds from issuance of shares issued to minorities | - | - | - | - |
| Proceeds from debt issuance | 768,625 | 2,393,373 | 1,624,748 | - |
| Proceeds from bond issuance | 320,410 | 313,013 | (7,397) | (2.3%) |
| Proceeds from loans obtained from related companies | - | - | - | - |
| Proceeds from other loans obtained from related companies | - | - | - | - |
| Other sources of financing | 1,298 | - | (1,298) | (100.0%) |
| Capital paid | (529,137) | (160,639) | 368,498 | 69.6% |
| Dividends paid | (232,837) | (335,484) | (102,647) | (44.1%) |
| Payment of debt | (1,511,961) | (1,857,842) | (345,881) | (22.9%) |
| Payment of bonds | (212,012) | (880,658) | (668,646) | - |
| Payments of loans obtained from related companies | (4,946) | (15,173) | (10,227) | - |
| Payments of other loans obtained from related companies | - | - | - | - |
| Payments of shares issuance costs | - | - | - | - |
| Payments of bonds issuance costs | (1,722) | (939) | 783 | 45.5% |
| Other disbursements for financing | (33,246) | (13,681) | 19,565 | 58.8% |
| NET CASH FLOW FROM FINANCING ACTIVITIES | (1,435,528) | (558,031) | 877,497 | 61.1% |
| CASH FLOWS FROM INVESTING ACTIVITIES | ||||
| Proceeds from sale of property, plant and equipment | 11,687 | 83,680 | 71,993 | - |
| Sale of investment | 3,201 | 93 | (3,108) | - |
| Other loans received from related companies | 15,098 | 5,242 | (9,856) | (65.3%) |
| Other receipts from investments | 13,605 | 3,592 | (10,013) | (73.6%) |
| Additions to property, plant and equipment | (608,794) | (972,536) | (363,742) | (59.7%) |
| Long-term investments | (63,559) | (42,357) | 21,202 | 33.4% |
| Investment in financing instruments | - | - | - | - |
| Other loans granted to related companies | - | - | - | - |
| Other investment disbursements | (5,485) | (23,562) | (18,077) | - |
| NET CASH FLOW FROM INVESTMENT ACTIVITIES | (634,247) | (945,848) | (311,601) | (49.1%) |
| NET CASH FLOW FOR THE PERIOD | (497,342) | 116,003 | 613,345 | 123.3% |
| EFFECT OF PRICE-LEVEL RESTATEMENT ON CASH AND CASH EQUIVALENT | (40,207) | 19,643 | 59,850 | 148.9% |
| NET VARIATION ON CASH AND CASH EQUIVALENT | (537,549) | 135,646 | 673,195 | 125.2% |
| CASH AND CASH EQUIVALENT AT THE BEGINNING OF THE YEAR | 1,228,536 | 690,986 | (537,550) | (43.8%) |
| CASH AND CASH EQUIVALENT AT THE END OF THE PERIOD | 690,987 | 826,632 | 135,645 | 19.6% |
Pg. 26
PRESS RELEASE | ||
CONSOLIDATEDCASHFLOWANALYSIS
During the period, the Company generated a positive net cash flow of Ch$61,758 million, comprised by the following activities:
Table 10
| Effective Cash Flow (million Ch$) | YE05 | YE06 | Var 06-05 | Chg % |
| Operating | 837,148 | 862,408 | 25,260 | 3.0% |
| Financing | (764,261) | (297,090) | 467,171 | (61.1%) |
| Investment | (337,667) | (503,559) | (165,892) | 49.1% |
Net cash flow of the period | (264,780) | 61,759 | 326,539 | (123.3%) |
Table 10.1
| Effective Cash Flow (thousand US$) | YE05 | YE06 | Var 06-05 | Chg % |
| Operating | 1,572,434 | 1,619,881 | 47,447 | 3.0% |
| Financing | (1,435,528) | (558,031) | 877,497 | (61.1%) |
| Investment | (634,247) | (945,846) | (311,599) | 49.1% |
Net cash flow of the period | (497,341) | 116,004 | 613,345 | (123.3%) |
Operating activities generated a net positive cash flow of Ch$862,408 million, which represent an increase of Ch$25,260 million due to excellent operating results registered by our subsidiaries. The operating cash flow is comprised mainly of:
| • | Net income for the period amounting to Ch$285,960 million, plus: | |
| • | Charges of Ch$540,407 million to the income statement that do not represent cash flow and correspond mainly to the Depreciation of the period for Ch$414,617 million, write-offs and provisions for Ch$26,064 million, amortizations of positive goodwill of Ch$55,908 million, amortization of intangibles of Ch$7,859 million, losses in long term investments of Ch$125 million and other charges that do not represent cash flow for Ch$68,810 million, which includes the Ch$47,155 million negative conversion effect of the application of the Technical Bulletin N°64 over foreign subsidiaries. | |
| • | The variation of net liabilities that affect cash flow of Ch$58,196 million. | |
| • | The above was partially compensated by: | |
| • | Non-cash credits for Ch$15,191 million that do not represent cash flows, of which Ch$11,645 million correspond to the positive effect of the conversion of the overseas subsidiaries. | |
| • | Net profits on assets sale of Ch$18,844 million. | |
| • | Profit on investment in related companies of Ch$5,164 million. | |
| • | Negative goodwill amortization of Ch$6,078 million. | |
| • | Variation in net assets that affect operating cash flow of Ch$273,098 million. | |
Pg. 27
PRESS RELEASE | ||
Financing activities resulted in a negative cash flow of Ch$297,090 million mainly due to the payment of loans for a value of Ch$989,097 million, payments to the public for Ch$468,853 million, dividend payments of Ch$178,608 million, and capital distributions of subsidiaries for Ch$85,523 million. The above is partly compensated by loans obtained for Ch$1,274,208 million and bonds issued for Ch$166,645 million.
Investment activitieshad a net negative cash flow of Ch$503,560 million that correspond mainly to the addition of fixed assets for Ch$517,768 million, other long term investments for Ch$22,550 million and other disbursements of Ch$12,544 million, partially compensated by the sale of fixed assets of Ch$44,551 million and other investment revenues of Ch$1,912million.
CASHFLOWRECEIVEDFROMFOREIGNSUBSIDIARIES BYENERSIS,CHILECTRA ANDENDESACHILE
| Table 11 | ||||||||||
| Millions Ch$ | Interest Received | Dividends Received | Management Fee | Prepayment intercompany | Capital Reductions | |||||
| YE05 | YE06 | YE05 | YE06 | YE05 | YE06 | YE05 | YE06 | YE05 | YE06 | |
| Argentina | 7,234 | 5,632 | - | - | - | 284 | - | 63,887 | - | - |
| Peru | - | - | 9,980 | 10,128 | - | - | - | - | 19,314 | 5,236 |
| Brazil | 3,533 | 1,739 | 19,226 | 23,119 | - | - | - | 33,130 | - | - |
| Colombia | - | 19,280 | 8,291 | 2,731 | - | - | 22,685 | 92,277 | 46,530 | 19,390 |
| Chile | - | - | - | - | - | - | - | - | - | - |
| Total | 10,766 | 26,651 | 37,498 | 35,978 | - | 284 | 22,685 | 189,294 | 65,844 | 24,626 |
| Millions Ch$ | Total Cash Received | |
| YE05 | YE06 | |
| Argentina | 7,234 | 69,803 |
| Peru | 29,293 | 15,364 |
| Brazil | 22,759 | 57,988 |
| Colombia | 77,507 | 133,678 |
| Chile | - | - |
| Total | 136,793 | 276,833 |
| Table 11.1 | ||||||||||
| Thousand US$ | Interest Received | Dividends Received | Management Fee | Prepayment Intercompany | Capital Reductions | |||||
| YE05 | YE06 | YE05 | YE06 | YE05 | YE06 | YE05 | YE06 | YE05 | YE06 | |
| Argentina | 13,587 | 10,579 | - | - | - | 533 | - | 120,000 | - | - |
| Peru | - | - | 18,745 | 19,023 | - | - | - | - | 36,277 | 9,835 |
| Brazil | 6,635 | 3,267 | 36,113 | 43,425 | - | - | - | 62,229 | - | - |
| Colombia | - | 36,214 | 15,574 | 5,130 | - | - | 42,611 | 173,325 | 87,399 | 36,420 |
| Total | 20,223 | 50,060 | 70,433 | 67,578 | - | 533 | 42,611 | 355,554 | 123,676 | 46,255 |
| Thousand US$ | Total Cash Received | |
| YE05 | YE06 | |
| Argentina | 13,587 | 131,113 |
| Peru | 55,022 | 28,858 |
| Brazil | 42,749 | 108,921 |
| Colombia | 145,583 | 251,089 |
| Total | 256,942 | 519,981 |
Source: Internal Financial Report
Pg. 28
PRESS RELEASE | ||
CAPEX ANDDEPRECIATION
Table 12
Payments for Additions of | Depreciation | |||
Fixed assets | ||||
| Million Ch$ | YE05 | YE06 | YE05 | YE06 |
| Endesa | 60,014 | 170,085 | 174,053 | 175,307 |
| Cachoeira (*) | 864 | 1,683 | 3,374 | 15,168 |
| Fortaleza (**) | 1,000 | 2,257 | 1,096 | 4,996 |
| Cien (**) | 329 | 1,894 | 2,743 | 13,468 |
| Chilectra S.A. | 53,958 | 57,265 | 16,788 | 17,966 |
| Edesur S.A. | 29,386 | 35,167 | 43,573 | 43,349 |
| Edelnor S.A. | 16,230 | 19,949 | 16,145 | 17,096 |
| Ampla | 92,813 | 107,152 | 39,798 | 42,741 |
| Coelce | 56,498 | 73,478 | 34,183 | 37,003 |
| Codensa S.A. | 7,177 | 42,857 | 39,639 | 41,509 |
| Cam Ltda. | 1,360 | 1,459 | 1,018 | 2,156 |
| Inmobiliaria Manso de Velasco Ltda. | 867 | 1,119 | 367 | 343 |
| Synapsis Soluciones y Servicios Ltda. | 3,470 | 2,970 | 1,445 | 2,218 |
| Holding Enersis | 150 | 433 | 1,122 | 1,297 |
| Total | 324,115 | 517,768 | 375,344 | 414,617 |
Table 12.1
Payments for Additions of | Depreciation | |||
Fixed assets | ||||
| Thousand US$ | YE05 | YE06 | YE05 | YE06 |
| Endesa | 112,725 | 319,474 | 326,928 | 329,283 |
| Cahoeira (*) | 1,623 | 3,161 | 6,337 | 28,491 |
| Fortaleza (**) | 1,878 | 4,239 | 2,059 | 9,385 |
| Cien (**) | 618 | 3,557 | 5,152 | 25,297 |
| Chilectra S.A. | 101,351 | 107,561 | 31,533 | 33,746 |
| Edesur S.A. | 55,196 | 66,055 | 81,844 | 81,423 |
| Edelnor S.A. | 30,484 | 37,470 | 30,326 | 32,112 |
| Ampla | 174,333 | 201,267 | 74,753 | 80,280 |
| Coelce | 106,122 | 138,015 | 64,207 | 69,504 |
| Codensa S.A. | 13,480 | 80,500 | 74,455 | 77,967 |
| Cam Ltda. | 2,554 | 2,741 | 1,912 | 4,050 |
| Inmobiliaria Manso de Velasco Ltda. | 1,628 | 2,102 | 689 | 644 |
| Synapsis Soluciones y Servicios Ltda. | 6,519 | 5,578 | 2,714 | 4,166 |
| Holding Enersis | 283 | 813 | 2,107 | 2,436 |
| Total | 608,794 | 972,532 | 705,017 | 778,785 |
| (*) Consolidated by Endesa Chile until September 30th, 2005. Since October 1th is consolidated by Enersis through Endesa Brasil. | ||||
| (**) Since October 1th, 2005 is consolidated by Enersis through Endesa Brasil. | ||||
Pg. 29
PRESS RELEASE | ||
ANALYSISOFTHEEXCHANGERISKANDTHEINTERESTRATE
The company has a high percentage of its loans in US Dollars considering that an important part of its sales, in the different markets where it operates, are mainly indexed to that currency. However, the Brazilian, Argentine and Colombian markets are indexed to the US Dollar to a lower extent and, therefore, subsidiaries in those markets have most of their liabilities in local currency. In the case of Argentina, the company has chosen to replace US$ denominated debt with local currency debt, when market financial conditions better allow it.
In a scenario of a high exchange rate risk, the company has continued with its policy of partly covering its liabilities in dollars in order to mitigate the effects of the fluctuations in the exchange rate upon results. Considering the important reduction in the accounting mismatch in recent years, the company has modified its policy on Dollar-Peso hedging in order to establish a policy of covering cash flows, together with a maximum permissible accounting mismatch, on which hedging operations will be performed.
As of December 31, 2006, the company has hedged in Chile, by means of USD/UF Swap operations, an amount of US$600 million on a consolidated basis and holds US$125 million in US$/Ch$ swap operations, allowing an adequate managing of the hedging policy. A year ago, the company had already contracted US$700 million of the total Swap Dollar-UF as part of the establishment of the new hedging policy and there were US$100 million that mature during the year 2006.
Regarding to interest rate risk, the company has, on a consolidated basis, a proportion of its indebtedness at a fixed rate/variable rate ratio of approximately 70.8% / 29.2% fixed / variable as of December 31, 2006. The percentage of its indebtedness at a fixed rate has decreased compared with the 81.8% / 18.2% ratio as of the same date in the previous year. This is due some subsidiaries refinanced its maturities from fix to variable rate. Nevertheless, the risk levels had maintained in the range of the coverage policies establish by the Group.
Pg. 30
PRESS RELEASE | ||

ARGENTINA
GENERATION
Endesa Costanera increases its Operating Income due to the higher sales and prices, offset by higher Operating Costs, as consequence of the recognition of higher energy costs in the system.
Our subsidiary Chocón also increased its Operating Income mainly due to a better mix of generation-purchases as consequence of the better hydrology and higher sales.
Let us highlight that during 2006 our subsidiaries registered maximums historical in generation, reaching 8.709 GWh and 5.041 GWh, respectively.
COSTANERA
Operating Income
| Table 13 | |||||||
| Million US$ | Million Ch$ | ||||||
| YE 05 | YE 06 | YE 05 | YE 06 | Chg % | |||
| Operating Revenues | 225 | 326 | 119,732 | 173,732 | 45.1% | ||
| Operating Costs | (225) | (313) | (119,956) | (166,616) | (38.9%) | ||
| Operating Margin | (0) | 13 | (224) | 7,116 | - | ||
| Selling and Administrative Expenses | (4) | (4) | (1,908) | (2,223) | (16.5%) | ||
| Operating Income | (4) | 9 | (2,132) | 4,893 | - | ||
* Please take note that these figures could differ from those accounted under Argentine GAAP
Additional Information
Table 14
| Costanera | YE05 | YE06 | Var 06-05 | Chg % |
| GWh Produced | 8,402 | 8,709 | 307 | 3.7% |
| GWh Sold | 8,466 | 8,816 | 350 | 3.2% |
| Market Share | 9.6% | 8.9% | - | (7.5%) |
Pg. 31
PRESS RELEASE | ||
CHOCÓN
Operating Income
| Table 15 | |||||||
| Million US$ | Million Ch$ | ||||||
| YE 05 | YE 06 | YE 05 | YE 06 | Chg % | |||
| Operating Revenues | 76 | 116 | 40,356 | 61,684 | 52.9% | ||
| Operating Costs | (47) | (57) | (25,019) | (30,324) | (21.2%) | ||
| Operating Margin | 29 | 59 | 15,337 | 31,360 | 104.5% | ||
| Selling and Administrative Expenses | (2) | (2) | (871) | (1,050) | (20.6%) | ||
| Operating Income | 27 | 57 | 14,466 | 30,309 | 109.5% | ||
* Please take note that these figures could differ from those accounted under Argentine GAAP.
Additional Information
Table 16
| Chocón | YE05 | YE06 | Var 06-05 | Chg % |
| GWh Produced | 3,931 | 5,041 | 1,111 | 28.3% |
| GWh Sold | 4,113 | 5,191 | 1,078 | 26.2% |
| Market Share | 4.7% | 5.3% | - | 13.2% |
Pg. 32
PRESS RELEASE | ||
DISTRIBUTION
Edesur reported a 5.8% increase in energy sales as a consequence of the higher demand in the country, a significant reduction in energy losses, and more than 30 thousand new customers. These are all positive and structural elements for a distribution company. Nevertheless, Operating Income decreased mainly explained by higher Operating Costs and Selling and Administrative Expenses.
Let me remind you that the Company in September 2006, under conservative accounting criteria, reversed revenues proceeding from the VAD increased announced by the authorities. In this respect, let us inform you that the “Acta Acuerdo” was already signed be the President and the regulatory entity must release the details in the short term.
EDESUR
Operating Income
| Table 17 | |||||||
| Million US$ | Million Ch$ | ||||||
| YE 05 | YE 06 | YE 05 | YE 06 | Chg % | |||
| Revenues from Sales | 416 | 434 | 221,640 | 230,860 | 4.2% | ||
| Other Operating Revenues | 33 | 33 | 17,828 | 17,533 | (1.7%) | ||
| Operating Revenues | 450 | 467 | 239,469 | 248,394 | 3.7% | ||
| Energy Purchases | (246) | (268) | (130,915) | (142,944) | (9.2%) | ||
| Other Operating Cost | (141) | (139) | (75,002) | (73,954) | 1.4% | ||
| Operating Costs | (387) | (407) | (205,917) | (216,897) | (5.3%) | ||
| Selling and Administrative Expenses | (56) | (67) | (29,814) | (35,574) | (19.3%) | ||
| Operating Income | 7 | (8) | 3,738 | (4,077) | - | ||
* Please take note that these figures could differ from those accounted under Argentine GAAP.
Additional Information
Table 18
| Edesur | YE05 | YE06 | Var 06-05 | Chg % |
| Customers (Th) | 2,165 | 2,196 | 31 | 1.4% |
| GWh Sold | 14,018 | 14,837 | 819 | 5.8% |
| Clients/Employee | 926 | 912 | (14) | (1.5%) |
| Energy Losses % (12M) | 11.4% | 10.5% | - | (7.1%) |
Pg. 33
PRESS RELEASE | ||

BRAZIL
ENDESABRASIL
| Table 19 | ||||
| Million US$ | Million Ch$ | |||
| YE 05 | YE 06 | YE 05 | YE 06 | |
| Revenues from Sales | 466 | 2,044 | 248,055 | 1,088,212 |
| Other Operating Revenues | 20 | 70 | 10,824 | 37,517 |
| Operating Revenues | 486 | 2,114 | 258,879 | 1,125,729 |
| Energy Purchases | (203) | (966) | (108,303) | (514,436) |
| Other Operating Cost | (110) | (506) | (58,695) | (269,565) |
| Operating Costs | (314) | (1,473) | (166,998) | (784,001) |
| Selling and Administrative Expenses | (69) | (129) | (36,887) | (68,741) |
| Operating Income | 103 | 513 | 54,994 | 272,987 |
| Interest Income | 43 | 180 | 22,673 | 95,945 |
| Interest Expense | (57) | (281) | (30,520) | (149,545) |
| Net Financial Income (Expenses) | (15) | (101) | (7,847) | (53,601) |
| Equity Gains from Related Companies | - | - | - | - |
| Equity Losses from Related Companies | - | - | - | - |
| Net Income from Related Companies | - | - | - | - |
| Other Non Operating Income | 6 | 122 | 3,295 | 65,077 |
| Other Non Operating Expenses | 0 | (232) | 236 | (123,632) |
| Net other Non Operating Income (Expense) | 7 | (110) | 3,532 | (58,555) |
| Price Level Restatement | - | - | - | - |
| Foreign Exchange Effect | - | - | - | - |
| Net of Monetary Exposure | - | - | - | - |
| Positive Goodwill Amortization | - | - | - | - |
| Non Operating Income | (8) | (211) | (4,315) | (112,156) |
| Net Inc b. Taxes, Min Int and Neg Goodwill Amort. | 95 | 302 | 50,679 | 160,831 |
| Extraordinary Items | - | - | - | - |
| Income Tax | (7) | (43) | (3,777) | (22,951) |
| Minority Interest | (27) | (86) | (14,450) | (45,655) |
| Negative Goodwill Amortization | - | - | - | - |
| NET INCOME | 61 | 173 | 32,452 | 92,225 |
(*) Since October 1th is consolidated by Enersis.
GENERATION
Cachoeira increased its Operating Income, mainly due to higher physical sales as a consequence of the better hydrology in central region, thus reducing its purchasing needs for energy and power.
Fortaleza reduced lightly its Operating Income due to lower average sales price despite the slight increase in physical sales.
CIEN registered an Operating Loss, basically explained by lower physical sales derived from the lack of energy supply coming from Argentina. Considering the energy situation of Argentina and Brasil, CIEN is redesigning its business in order to become independent from energy availability. Consequently, on December CIEN reduced its energy supply contract with Copel to 175 MW for the year 2007.
Pg. 34
PRESS RELEASE | ||
CACHOEIRA
Operating Income (*)
| Table 20 | |||||
| Million US$ | Million Ch$ | ||||
| YE 05 | YE 06 | YE 05 | YE 06 | ||
| Operating Revenues | 24 | 126 | 12,592 | 66,844 | |
| Operating Costs | (12) | (58) | (6,461) | (30,992) | |
| Operating Margin | 12 | 67 | 6,131 | 35,851 | |
| Selling and Administrative Expenses | (2) | (12) | (1,195) | (6,305) | |
| Operating Income | 9 | 55 | 4,936 | 29,547 | |
Please take note that these figures could differ from those accounted under Brazilian GAAP.
(*) Consolidated by Endesa Chile until September 30th, 2005. Since October 1th is consolidated by Enersis through Endesa Brasil.
Additional Information
Table 21
| Cachoeira | YE05 | YE06 | Var 06-05 | Chg % |
| GWh Produced | 3,559 | 4,241 | 682 | 19.2% |
| GWh Sold | 3,867 | 4,177 | 310 | 8.0% |
| Market Share | 0.9% | 1.2% | - | 33.3% |
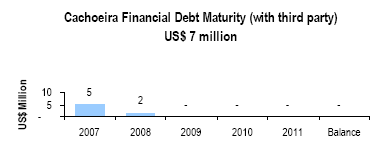
FORTALEZA
Operating Income (*)
| Table 22 | |||||
| Million US$ | Million Ch$ | ||||
| YE 05 | YE 06 | YE 05 | YE 06 | ||
| Operating Revenues | 58 | 188 | 30,923 | 100,193 | |
| Operating Costs | (28) | (87) | (14,758) | (46,091) | |
| Operating Margin | 30 | 102 | 16,166 | 54,102 | |
| Selling and Administrative Expenses | (1) | (3) | (480) | (1,571) | |
| Operating Income | 29 | 99 | 15,685 | 52,531 | |
(*) Since October 1, 2005, this subsidiary is consolidated by Enersis through Endesa Brasil.
Pg. 35
PRESS RELEASE | ||
Additional Information
Table 23| Fortaleza | 4Q05 | YE06 | Var 06-05 | Chg % |
| GWh Produced | 347 | 248 | -99 | (28.4%) |
| GWh Sold | 678 | 2,705 | 2,027 | 299.0% |
| Market Share | 0.1% | 0.8% | - | - |
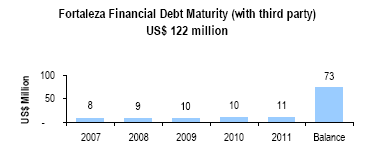
TRANSMISSION
CIEN
Operating Income (*)
| Table 24 | |||||
| Million US$ | Million Ch$ | ||||
| YE 05 | YE 06 | YE 05 | YE 06 | ||
| Operating Revenues | 54 | 270 | 28,614 | 143,900 | |
| Operating Costs | (26) | (261) | (13,957) | (139,072) | |
| Operating Margin | 28 | 9 | 14,657 | 4,829 | |
| Selling and Administrative Expenses | (2) | (10) | (1,318) | (5,587) | |
| Operating Income | 25 | (1) | 13,339 | (759) | |
Additional Information
Table 25
| CIEN | 4Q05 | YE06 | Var 06-05 | Chg % |
| GWh Produced | - | - | - | - |
| GWh Sold | 1,467 | 6,394 | 4,927 | 335.8% |
| Market Share | 0.3% | 1.8% | - | - |
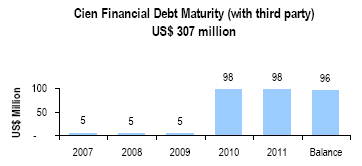
Pg. 36
PRESS RELEASE | ||
DISTRIBUTION
Ampla increased by 34,5% its Operating Income, basically as a consequence of higher energy sales, the incorporation of 100 thousand new costumers and better margins derived from the 2.9% tariff adjustment occurred on March 2006. Additionally, thanks to the technical solutions being applied, we reflected an important reduction in energy losses. In this respect, let us tell you that as December we have more than 360 thousand clients connected.
Coelce also increased its Operating Income by 75,9%, as a consequence of the incorporation of more than 100 thousand clients, higher energy sales, lower energy losses and better margins due to 10% tariff adjustment on April 2006. It is important to highlight that Coelce will face its next tariff revision on April 22, 2007.
Let us highlight that the third auction of new energy was held in October 2006, for a total amount of 1.104 MW at R$120,86 for hydroelectric generators (30 years) and R$137,44 for thermoelectric generators (15 years) beginning on 2011.
AMPLA
Operating Income
| Table 26 | |||||||
| Million US$ | Million Ch$ | ||||||
| YE 05 | YE 06 | YE 05 | YE 06 | Chg % | |||
| Revenues from Sales | 871 | 1,002 | 463,740 | 533,503 | 15.0% | ||
| Other Operating Revenues | 41 | 36 | 22,051 | 19,128 | (13.3%) | ||
| Operating Revenues | 912 | 1,038 | 485,791 | 552,631 | 13.8% | ||
| Energy Purchases | (432) | (467) | (230,229) | (248,739) | (8.0%) | ||
| Other Operating Cost | (284) | (332) | (151,193) | (176,695) | (16.9%) | ||
| Operating Costs | (716) | (799) | (381,422) | (425,434) | (11.5%) | ||
| Selling and Administrative Expenses | (42) | (32) | (22,574) | (17,189) | 23.9% | ||
| Operating Income | 154 | 207 | 81,795 | 110,008 | 34.5% | ||
Additional Information
Table 27
| Ampla | YE05 | YE06 | Var 06-05 | Chg % |
| Customers (Th) | 2,216 | 2,316 | 100 | 4.5% |
| GWh Sold | 8,175 | 8,668 | 493 | 6.0% |
| Clients/Employee | 1,671 | 1,639 | (32) | (1.9%) |
| Energy Losses % (12M) | 22.4% | 21.9% | - | (2.5%) |
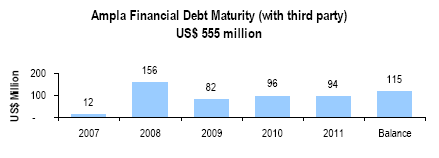
Pg. 37
PRESS RELEASE | ||
COELCE
Operating Income
| Table 28 | |||||||
| Million US$ | Million Ch$ | ||||||
| YE 05 | YE 06 | YE 05 | YE 06 | Chg % | |||
| Revenues from Sales | 624 | 766 | 332,464 | 407,846 | 22.7% | ||
| Other Operating Revenues | 21 | 20 | 11,027 | 10,467 | (5.1%) | ||
| Operating Revenues | 645 | 786 | 343,491 | 418,314 | 21.8% | ||
| Energy Purchases | (309) | (357) | (164,687) | (190,287) | (15.5%) | ||
| Other Operating Cost | (146) | (201) | (77,617) | (107,202) | (38.1%) | ||
| Operating Costs | (455) | (559) | (242,305) | (297,489) | (22.8%) | ||
| Selling and Administrative Expenses | (98) | (64) | (51,997) | (34,276) | 34.1% | ||
| Operating Income | 92 | 163 | 49,189 | 86,549 | 75.9% | ||
Additional Information
Table 29
| Coelce | YE05 | YE06 | Var 06-05 | Chg % |
| Customers (Th) | 2,438 | 2,543 | 105 | 4.3% |
| GWh Sold | 6,580 | 6,769 | 190 | 2.9% |
| Clients/Employee | 1,848 | 1,937 | 88 | 4.8% |
| Energy Losses % (12M) | 14.0% | 13.0% | - | (7.4%) |

Pg. 38
PRESS RELEASE | ||

CHILE
GENERATION
Operating Income for the Chilean operations increased 74,3%. This positive variation is the result of higher sale price as a consequence of the increase in electricity demand and the restrictions of natural gas coming from Argentina.
On January 2007, the new node price was published. It increased 7.76% reaching US$67.31 per MWh.
Regarding the first energy auction, Endesa Chile achieved 6.395 GWh per year at an average price of US$65,0 MWh. The second auction will take place on August 2007.
ENDESACHILE
Consolidated Income Statement
| Table 30 | |||||||
| Million US$ | Million Ch$ | ||||||
| YE05 | YE06 | YE05 | YE06 | Chg % | |||
| Operating Revenues | 2,154 | 2,512 | 1,146,623 | 1,337,121 | 16.6% | ||
| Operating Costs | (1,322) | (1,490) | (704,081) | (793,260) | (12.7%) | ||
| Selling and Administrative Expenses | (74) | (74) | (39,388) | (39,386) | 0.0% | ||
| Operating Income | 757 | 948 | 403,154 | 504,475 | 25.1% | ||
| Interest Income | 30 | 28 | 15,878 | 14,818 | (6.7%) | ||
| Interest Expenses | (343) | (323) | (182,549) | (171,919) | 5.8% | ||
| Net Financial Income (Expenses) | (313) | (295) | (166,670) | (157,101) | 5.7% | ||
| Equity Gains from Related Company | 41 | 80 | 21,823 | 42,470 | 94.6% | ||
| Equity Losses from Related Company | (15) | (0) | (7,968) | (125) | 98.4% | ||
| Net Income from Related Companies | 26 | 80 | 13,854 | 42,345 | - | ||
| Other Non Operating Income | 64 | 56 | 33,979 | 29,968 | (11.8%) | ||
| Other Non Operating Expenses | (103) | (82) | (54,712) | (43,568) | 20.4% | ||
| Net other Non Operating Income (Expenses) | (39) | (26) | (20,733) | (13,600) | 34.4% | ||
| Price Level Restatement | 3 | 3 | 1,345 | 1,487 | 10.5% | ||
| Foreign Exchange Effect | 29 | 7 | 15,214 | 3,608 | (76.3%) | ||
| Net of Monetary Exposure | 31 | 10 | 16,559 | 5,095 | (69.2%) | ||
| Positive Goodwill Amortization | (3) | (2) | (1,395) | (943) | 32.4% | ||
| Non Operating Income | (297) | (233) | (158,385) | (124,204) | 21.6% | ||
| Net Income b. Taxes, Min Int and Neg Goodwill Amort. | 460 | 714 | 244,769 | 380,271 | 55.4% | ||
| Extraordinary Items | - | - | - | - | - | ||
| Income Tax | (176) | (246) | (93,885) | (130,856) | (39.4%) | ||
| Minority Interest | (101) | (124) | (53,570) | (65,911) | (23.0%) | ||
| Negative Goodwill Amortization | 29 | 11 | 15,632 | 6,037 | (61.4%) | ||
| NET INCOME | 212 | 356 | 112,946 | 189,541 | 67.8% | ||
Pg. 39
PRESS RELEASE | ||
Table 31
| Chilean Companies | YE05 | YE06 | Var 06-05 | Chg % |
| GWh Produced | 18,764 | 19,973 | 1,209 | 6.4% |
| GWh Sold | 20,731 | 20,923 | 192 | 0.9% |
| Market Share | 43.7% | 41.6% | - | (4.8%) |
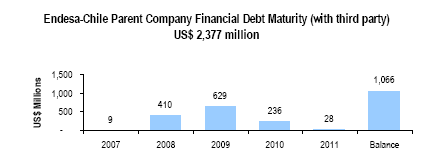
Chilectra reported a 4.4% increase in energy sales as a consequence of the higher demand in the country, reduction in energy losses, and more than 30 thousand new customers. Nevertheless, Operating Income decreased mainly explained by higher Operating Costs and Selling and Administrative Expenses.
It’s important to mention, that as a consequence of the higher node price, average tariffs to final clients will increase. This new tariff will be applied retroactively from November 1, 2006.
Regarding the first energy auction, Chilectra bid 4,500 GWh per year for the period 2010-2022, at an average price of US$53.59 MWh.
Pg. 40
 | PRESS RELEASE | |
CHILECTRA
Income Statement
| Table 32 | |||||||
| Million US$ | Million Ch$ | ||||||
| YE 05 | YE 06 | YE 05 | YE 06 | Chg % | |||
| Revenues from Sales | 1,052 | 1,157 | 560,134 | 615,902 | 10.0% | ||
| Other Operating Revenues | 86 | 92 | 45,881 | 49,056 | 6.9% | ||
| Operating Revenues | 1,138 | 1,249 | 606,015 | 664,957 | 9.7% | ||
| Energy Purchases | (723) | (816) | (384,814) | (434,475) | (12.9%) | ||
| Other Operating Cost | (113) | (125) | (59,984) | (66,338) | (10.6%) | ||
| Operating Costs | (835) | (941) | (444,798) | (500,814) | (12.6%) | ||
| Selling and Administrative Expenses | (82) | (88) | (43,620) | (47,006) | (7.8%) | ||
| Operating Income | 221 | 220 | 117,597 | 117,137 | (0.4%) | ||
| Interest Income | 6 | 8 | 3,136 | 4,290 | 36.8% | ||
| Interest Expenses | (54) | (48) | (28,782) | (25,376) | 11.8% | ||
| Net Financial Income (Expenses) | (48) | (40) | (25,645) | (21,087) | 17.8% | ||
| Equity Gains from Related Company | 28 | 54 | 14,828 | 28,892 | 94.8% | ||
| Equity Losses from Related Company | (24) | (15) | (12,791) | (7,977) | 37.6% | ||
| Net Income from Related Companies | 4 | 39 | 2,037 | 20,915 | - | ||
| Other Non Operating Income | 11 | 11 | 5,996 | 6,103 | 1.8% | ||
| Other Non Operating Expenses | (9) | (8) | (4,867) | (4,075) | 16.3% | ||
| Conversion Effect (BT 64) | - | - | - | - | |||
| Net other Non Operating Income (Expenses) | 2 | 4 | 1,129 | 2,027 | 79.5% | ||
| Price Level Restatement | 7 | 0 | 3,726 | 263 | (93.0%) | ||
| Foreign Exchange Effect | - | - | - | - | |||
| Net of Monetary Exposure | 7 | 0 | 3,726 | 263 | (93.0%) | ||
| Positive Goodwill Amortization | (1) | (1) | (588) | (595) | (1.1%) | ||
| Non Operating Income | (36) | 3 | (19,341) | 1,524 | 107.9% | ||
| Net Income b. Taxes, Min Int and Neg Goodwill Amort. | 185 | 223 | 98,256 | 118,661 | 20.8% | ||
| Extraordinary Items | - | - | - | - | |||
| Income Tax | (41) | 212 | (21,854) | 113,118 | - | ||
| Minority Interest | (3) | 0 | (1,437) | 258 | 118.0% | ||
| Negative Goodwill Amortization | - | - | - | - | |||
| NET INCOME | 141 | 436 | 74,966 | 232,037 | 210% | ||
Additional Information
Table 33
| Chilectra | YE05 | YE06 | Var 06-05 | Chg % |
| Customers (Th) | 1,404 | 1,437 | 33 | 2.4% |
| GWh Sold | 11,851 | 12,377 | 526 | 4.4% |
| Clients/Employee | 1,972 | 2,030 | 58 | 2.9% |
| Energy Losses % (12M) | 5.5% | 5.4% | - | (1.3%) |
Pg. 41
| PRESS RELEASE | |
![]()
COLOMBIA
GENERATION
Emgesa increased its generation by 6.1%, basically due to the good hydrology during the first half 2006. Nevertheless, this higher production derived in lower market prices and thus lower margins, trend that reverted on last quarter 2006.
Even though Betania increased 4.9% its production of energy and 11.6 its physical sales, reported a slight reduction in Operating Income by 3.0% .
EMGESA
Operating Income
| Table 36 | |||||||
| Million US$ | Million Ch$ | ||||||
| YE 05 | YE 06 | YE 05 | YE 06 | Chg % | |||
| Operating Revenues | 422 | 445 | 224,488 | 237,103 | 5.6% | ||
| Operating Costs | (213) | (233) | (113,512) | (124,150) | (9.4%) | ||
| Operating Margin | 208 | 212 | 110,976 | 112,953 | 1.8% | ||
| Selling and Administrative Expenses | (9) | (7) | (4,823) | (3,876) | 19.6% | ||
| Operating Income | 199 | 205 | 106,153 | 109,077 | 2.8% | ||
Additional Information
Table 37
| Emgesa | YE05 | YE06 | Var 06-05 | Chg % |
| GWh Produced | 9,763 | 10,360 | 596 | 6.1% |
| GWh Sold | 12,358 | 12,311 | -48 | (0.7%) |
| Market Share | 17.9% | 17.4% | - | (2.8%) |
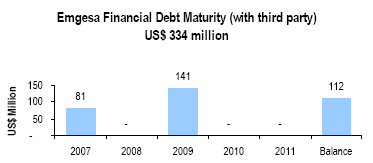
Pg. 42
| PRESS RELEASE | |
BETANIA
Operating Income
| Table 34 | |||||||
| Million US$ | Million Ch$ | ||||||
| YE 05 | YE 06 | YE 05 | YE 06 | Chg % | |||
| Operating Revenues | 75 | 69 | 39,922 | 36,722 | (8.0%) | ||
| Operating Costs | (42) | (45) | (22,528) | (23,760) | (5.5%) | ||
| Operating Margin | 33 | 24 | 17,394 | 12,962 | (25.5%) | ||
| Selling and Administrative Expenses | (1) | (1) | (467) | (710) | (51.9%) | ||
| Operating Income | 32 | 23 | 16,927 | 12,252 | (27.6%) | ||
Additional Information
Table 35
| Betania | YE05 | YE06 | Var 06-05 | Chg % |
| GWh Produced | 2,101 | 2,204 | 103 | 4.9% |
| GWh Sold | 2,737 | 3,054 | 317 | 11.6% |
| Market Share | 4.0% | 4.3% | - | 9.2% |
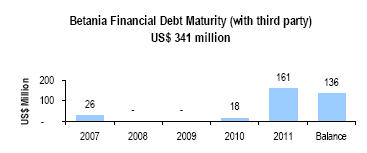
Pg. 43
| PRESS RELEASE | |
DISTRIBUTION
Codensa registered a 23,0% increase in Operating Income, basically associated to 6.5% increase in physical sales, 66 thousand new customers and lower energy losses. Also it reflected better operating margins as a consequence of lower operating cost due to the good hydrology.
CODENSA
Operating Income
| Table 38 | |||||||
| Million US$ | Million Ch$ | ||||||
| YE 05 | YE 06 | YE 05 | YE 06 | Chg % | |||
| Revenues from Sales | 588 | 631 | 312,993 | 335,742 | 7.3% | ||
| Other Operating Revenues | 182 | 214 | 96,960 | 114,068 | 17.6% | ||
| Operating Revenues | 770 | 845 | 409,953 | 449,811 | 9.7% | ||
| Energy Purchases | (339) | (360) | (180,381) | (191,532) | (6.2%) | ||
| Other Operating Cost | (189) | (206) | (100,806) | (109,726) | (8.8%) | ||
| Operating Costs | (528) | (566) | (281,186) | (301,258) | (7.1%) | ||
| Selling and Administrative Expenses | (35) | (25) | (18,765) | (13,201) | 29.6% | ||
| Operating Income | 207 | 254 | 110,002 | 135,352 | 23.0% | ||
Additional Information
Table 39
| Codensa | YE05 | YE06 | Var 06-05 | Chg % |
| Customers (Th) | 2,073 | 2,138 | 66 | 3.2% |
| GWh Sold | 10,094 | 10,755 | 661 | 6.5% |
| Clients/Employee | 2,239 | 2,289 | 50 | 2.2% |
| Energy Losses % (12M) | 9.4% | 8.9% | - | (5.3%) |
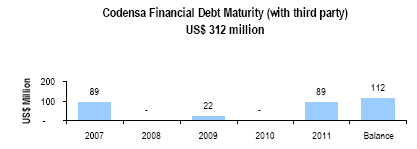
Pg. 44
| PRESS RELEASE | |
![]()
PERU
GENERATION
Edegel, reported a higher Operating Revenue mostly due to higher 47.1% in physical sales, partially offset by a decreased of 4.2% in average sales price as a result of the availability of natural gas from Camisea and the increase in operating costs due to higher production in Central Ventanilla.
On December 18, energy auctions for the period 2007-2010 were successfully developed for Luz del Sur and Distriluz. Edegel signed contracts for 113 MW and 31 MW, respectively.
The merger between Edegel and Etevensa was completed on June 1, 2006 and will be accounted since January 1, 2007. This merger increases the balance between the company’s thermal and hydroelectric capacity, thus improving the generation mix.
EDEGELOperating Income
| Table 40 | |||||||
| Million US$ | Million Ch$ | ||||||
| YE 05 | YE 06 | YE 05 | YE 06 | Chg % | |||
| Operating Revenues | 226 | 316 | 120,134 | 168,182 | 40.0% | ||
| Operating Costs | (106) | (189) | (56,569) | (100,804) | (78.2%) | ||
| Operating Margin | 119 | 127 | 63,565 | 67,378 | 6.0% | ||
| Selling and Administrative Expenses | (16) | (22) | (8,612) | (11,843) | (37.5%) | ||
| Operating Income | 103 | 104 | 54,954 | 55,536 | 1.1% | ||
Additional Information
Table 41
| Edegel | YE05 | YE06 | Var 06-05 | Chg % |
| GWh Produced | 4,516 | 6,662 | 2,146 | 47.5% |
| GWh Sold | 4,600 | 6,767 | 2,168 | 47.1% |
| Market Share | 23.6% | 30.4% | - | 28.9% |
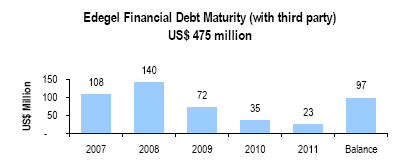
Pg. 45
| PRESS RELEASE | |
DISTRIBUTION
Edelnor increased its operating income by 29,8%, as a consequence of higher sales and better margins due to the lower market prices as consequence of the good hydrology. As a matter of fact, our company increased its physical sales by 7.6% prompted by the higher demand in the country, along with lower energy losses.
In addition, the number of clients increased in almost 27 thousand new customers.
EDELNOR
Operating Income
| Table 42 | |||||||
| Million US$ | Million Ch$ | ||||||
| YE 05 | YE 06 | YE 05 | YE 06 | Chg % | |||
| Revenues from Sales | 360 | 383 | 191,536 | 204,098 | 6.6% | ||
| Other Operating Revenues | 11 | 19 | 5,953 | 10,173 | 70.9% | ||
| Operating Revenues | 371 | 402 | 197,489 | 214,271 | 8.5% | ||
| Energy Purchases | (238) | (242) | (126,923) | (129,002) | (1.6%) | ||
| Other Operating Cost | (43) | (50) | (22,678) | (26,725) | (17.8%) | ||
| Operating Costs | (281) | (293) | (149,600) | (155,727) | (4.1%) | ||
| Selling and Administrative Expenses | (34) | (38) | (18,158) | (19,966) | (10.0%) | ||
| Operating Income | 56 | 72 | 29,731 | 38,578 | 29.8% | ||
Additional Information
Table 43
| Edelnor | YE05 | YE06 | Var 06-05 | Chg % |
| Customers (Th) | 925 | 952 | 27 | 2.9% |
| GWh Sold | 4,530 | 4,874 | 344 | 7.6% |
| Clients/Employee | 1,726 | 1,737 | 11 | 0.6% |
| Energy Losses % (12M) | 8.6% | 8.2% | - | (4.5%) |

Pg. 46
| PRESS RELEASE | |
PARTIALLYCONSOLIDATEDINCOMESTATEMENT
(Parent Company Year Ended 2006 Earnings Report)
UNDERCHILEANGAAP,MILLIONCH$
Table 44 | ||||||||||||
4Q 06 | 4Q 05 | Var % | (in million Ch$ of YE06) | YE 06 | YE 05 | Var % | ||||||
| 843 | 844 | (0.1%) | Gross Operating Margin | 3,376 | 3,516 | (4.0%) | ||||||
| (4,215) | (5,370) | 21.5% | S&A Expenses | (16,853) | (17,406) | 3.2% | ||||||
(3,373) | (4,526) | 25.5% | Operating Income | (13,477) | (13,890) | 3.0% | ||||||
| 28,293 | 18,933 | 49.4% | Endesa | 113,689 | 67,746 | 67.8% | ||||||
| 15,057 | 14,579 | 3.3% | Chilectra | 209,966 | 76,116 | 175.9% | ||||||
| (4,289) | 1,110 | (486.4%) | Edesur | (15,252) | (11,604) | (31.4%) | ||||||
| 1,058 | 2,342 | (54.8%) | Edelnor | 3,301 | 7,570 | (56.4%) | ||||||
| 4,162 | 7,279 | (42.8%) | Ampla | 13,114 | (11,188) | 217.2% | ||||||
| - | (10) | (100.0%) | Coelce | - | 807 | (100.0%) | ||||||
| 4,604 | 4,191 | 9.9% | Codensa | 18,937 | 14,764 | 28.3% | ||||||
| (72) | (269) | (73.2%) | CAM LTDA | 2,741 | 2,443 | 12.2% | ||||||
| 1,438 | 851 | 69.1% | Inm Manso de Velasco | 3,983 | 2,545 | 56.5% | ||||||
| (2,322) | 246 | (1042.3%) | Synapsis | (2,320) | 2,606 | (189.0%) | ||||||
| 9,094 | 10,021 | (9.3%) | Endesa Brasil | 28,560 | 10,021 | 185.0% | ||||||
| - | (76) | (100.0%) | CGTF | - | 6,029 | (100.0%) | ||||||
| 1,689 | (61) | (2860.4%) | Other | - | (4,550) | 100.0% | ||||||
58,712 | 59,136 | (0.7%) | Net Income from Related Companies | 376,719 | 163,304 | 130.7% | ||||||
| 8,873 | 10,179 | (12.8%) | Interest Income | 40,546 | 48,621 | (16.6%) | ||||||
| (12,836) | (16,070) | 20.1% | Interest Expense | (57,421) | (68,034) | 15.6% | ||||||
(3,963) | (5,891) | 32.7% | Net Financial Income (Expenses) | (16,875) | (19,413) | 13.1% | ||||||
| 1,829 | 2,397 | (23.7%) | Other Non Operating Income | 6,595 | 13,110 | (49.7%) | ||||||
| 5,285 | (781) | (776.4%) | Other Non Operating Expenses | (3,193) | (3,430) | 6.9% | ||||||
7,114 | 1,615 | 340.5% | Net other Non Operating Income (Expenses) | 3,401 | 9,680 | (64.9%) | ||||||
| 649 | (1,148) | 156.5% | Price Level Restatement | (1,364) | (2,549) | 46.5% | ||||||
| (2,755) | (7,091) | 61.1% | Foreign Exchange Effect | 1,864 | (28,147) | 106.6% | ||||||
(2,106) | (8,239) | 74.4% | Net Monetary Exposure | 500 | (30,696) | 101.6% | ||||||
(13,593) | (13,537) | (0.4%) | Positive Goodwill Amortization | (54,365) | (54,356) | (0.0%) | ||||||
46,164 | 33,084 | 39.5% | Non Operating Income | 309,379 | 68,518 | 351.5% | ||||||
42,791 | 28,558 | 49.8% | Net Income before (1), (2) & (3) | 295,902 | 54,628 | 441.7% | ||||||
627 | 2,367 | (73.5%) | Income Tax (1) | (9,981) | 14,777 | (167.5%) | ||||||
10 | 9 | 14.5% | Negative Goodwill Amortization (2) | 40 | 40 | 1.0% | ||||||
- | - | NA | Minority Interest (3) | - | - | |||||||
43,429 | 30,933 | 40.4% | NET INCOME | 285,960 | 69,445 | 311.8% | ||||||
| 1.33 | 0.95 | EPS (Ch$) | 8.76 | 2.13 | 311.8% | |||||||
| 0.12 | 0.09 | EPADS (US$) | 0.82 | 0.20 | 311.8% | |||||||
| 32,651,166 | 32,651,166 | Common Shares Outstanding (Th) | 32,651,166 | 32,651,166 | 0.0% | |||||||
Pg. 47
| PRESS RELEASE | |
UNDERCHILEANGAAP,THOUSANDUS$
| Table 44.1 | ||||||||||||
| 4Q 06 | 4Q 05 | Var % | (in thousand US$ of YE06) | YE 06 | YE 05 | Var % | ||||||
| 1,583 | 1,584 | (0.1%) | Gross Operating Margin | 6,341 | 6,604 | (4.0%) | ||||||
| (7,918) | (10,086) | 21.5% | S&A Expenses | (31,655) | (32,694) | 3.2% | ||||||
| (6,335) | (8,502) | 25.5% | Operating Income | (25,314) | (26,090) | 3.0% | ||||||
| 53,144 | 35,562 | 49.4% | Endesa | 213,544 | 127,249 | 67.8% | ||||||
| 28,282 | 27,384 | 3.3% | Chilectra | 394,384 | 142,970 | 175.9% | ||||||
| (8,057) | 2,085 | (486.4%) | Edesur | (28,649) | (21,796) | (31.4%) | ||||||
| 1,988 | 4,398 | (54.8%) | Edelnor | 6,201 | 14,218 | (56.4%) | ||||||
| 7,817 | 13,672 | (42.8%) | Ampla | 24,632 | (21,014) | 217.2% | ||||||
| - | (19) | (100.0%) | Coelce | - | 1,515 | (100.0%) | ||||||
| 8,648 | 7,872 | 9.9% | Codensa | 35,569 | 27,732 | 28.3% | ||||||
| (135) | (506) | (73.2%) | CAM LTDA | 5,149 | 4,588 | 12.2% | ||||||
| 2,701 | 1,598 | 69.1% | Inm Manso de Velasco | 7,481 | 4,780 | 56.5% | ||||||
| (4,362) | 463 | (1042.3%) | Synapsis | (4,357) | 4,894 | (189.0%) | ||||||
| 17,081 | 18,823 | (9.3%) | Endesa Brasil | 53,645 | 18,823 | 185.0% | ||||||
| - | (142) | (100.0%) | CGTF | - | 11,325 | (100.0%) | ||||||
| 3,172 | (115) | (2860.4%) | Others | - | (8,547) | 100.0% | ||||||
| 110,280 | 111,076 | (0.7%) | Net Income from Related Companies | 707,599 | 306,738 | 130.7% | ||||||
| 16,666 | 19,120 | (12.8%) | Interest Income | 76,158 | 91,325 | (16.6%) | ||||||
| (24,111) | (30,184) | 20.1% | Interest Expense | (107,855) | (127,790) | 15.6% | ||||||
| (7,444) | (11,064) | 32.7% | Net Financial Income (Expenses) | (31,698) | (36,464) | 13.1% | ||||||
| 3,436 | 4,502 | (23.7%) | Other Non Operating Income | 12,387 | 24,626 | (49.7%) | ||||||
| 9,928 | (1,468) | (776.4%) | Other Non Operating Expenses | (5,998) | (6,443) | 6.9% | ||||||
| 13,363 | 3,034 | 340.5% | Net other Non Operating Income (Expenses) | 6,388 | 18,183 | (64.9%) | ||||||
| 1,219 | (2,157) | 156.5% | Price Level Restatement | (2,563) | (4,788) | 46.5% | ||||||
| (5,176) | (13,319) | 61.1% | Foreign Exchange Effect | 3,501 | (52,870) | 106.6% | ||||||
| (3,956) | (15,476) | 74.4% | Net Monetary Exposure | 939 | (57,658) | 101.6% | ||||||
| (25,533) | (25,426) | (0.4%) | Positive Goodwill Amortization | (102,115) | (102,098) | (0.0%) | ||||||
| 86,711 | 62,143 | 39.5% | Non Operating Income | 581,113 | 128,700 | 351.5% | ||||||
| 80,376 | 53,641 | 49.8% | Net Income before (1), (2) & (3) | 555,799 | 102,610 | 441.7% | ||||||
| 1,179 | 4,445 | (73.5%) | Income Tax (1) | (18,748) | 27,756 | (167.5%) | ||||||
| 19 | 16 | 14.5% | Negative Goodwill Amortization (2) | 75 | 75 | 1.0% | ||||||
| - | - | NA | Minority Interest (3) | - | - | 0.0% | ||||||
| 81,573 | 58,103 | 40.4% | NET INCOME | 537,126 | 130,442 | 311.8% | ||||||
| 1.33 | 0.95 | EPS (Ch$) | 8.76 | 2.13 | 311.8% | |||||||
| 0.12 | 0.09 | EPADS (US$) | 0.82 | 0.20 | 311.8% | |||||||
| 32,651,166 | 32,651,166 | Common Shares Outstanding (Th) | 32,651,166 | 32,651,166 | 0.0% | |||||||
Pg. 48
| PRESS RELEASE | |
OWNERSHIP OF THECOMPANY AS OFDECEMBER31,2006

CONFERENCE CALL INVITATION
Enersis is pleased to inform you that it will hold a conference call to review its results for the period, on Friday, January 26, 2007, at 11:00 AM EST (Eastern Standard Time) (1:00 pm Chilean time). To participate, please dial +1 (617) 213-8856 or +1 (866) 831-6247 (toll free USA), approximately 10 minutes prior to the scheduled start time, Passcode ID: 98317796.
The phone replay will be available between January 26, 2007, and February 02, 2007, dialing +1 (617) 801-6888 or +1 (888) 286-8010 (toll free USA) Passcode ID: 17082185.
To access the call online, or to access the replay, go to:http://www.enersis.com Investor Relations, the conference will be complemented by a Power Point “slides presentation”.
Pg. 49
| PRESS RELEASE | |
CONTACTINFORMATION
For further information, please contact us:
| Susana Rey Head of Investor Relations srm@e.enersis.cl 56 (2) 353 4554 |
| Ignacio Gonzalez | Marcela Muñoz | Denisse Labarca | Carmen Poblete | |||
| Investor Relations | Investor Relations | Investor Relations | Investor Relations | |||
| Representative | Representative | Representative | Representative | |||
| ijgr@e.enersis.cl | mml1@e.enersis.cl | dla@e.enersis.cl | cpt@e.enersis.cl | |||
| 56 (2) 353 4552 | 56 (2) 353 4555 | 56 (2) 353 4492 | 56 (2) 353 4447 |
| Maria Luz Muñoz Investor Relations Assistant mlmr@e.enersis.cl 56 (2) 353 4682 |
DISCLAIMER
This Press Release contains statements that could constitute forward-looking statements within the meaning of the Private Securities Litigation Reform Act of 1995. These statements appear in a number of places in this announcement and include statements regarding the intent, belief or current expectations of Enersis and its management with respect to, among other things: (1) Enersis’ business plans; (2) Enersis’ cost-reduction plans; (3) trends affecting Enersis’ financial condition or results of operations, including market trends in the electricity sector in Chile or elsewhere; (4) supervision and regulation of the electricity sector in Chile or elsewhere; and (5) the future effect of any changes in the laws and regulations applicable to Enersis’ or its affiliates. Such forward-looking statements are not guarantees of future performance and involve risks and uncertainties. Actual results may differ materially from those in the forward-looking statements as a result of various factors. These factors include a decline in the equity capital markets of the United States or Chile, an increase in the market rates of interest in the United States or elsewhere, adverse decisions by government regulators in Chile or elsewhere and other factors described in Enersis’ Annual Report on Form 20-F. Readers are cautioned not to place undue reliance on those forward-looking statements, which state only as of their dates. Enersis undertakes no obligation to release publicly the result of any revisions to these forward-looking statements.
Pg. 50
SIGNATURES
Pursuant to the requirements of the Securities Exchange Act of 1934, as amended, the Registrant has duly caused this report to be signed on its behalf by the undersigned, thereunto duly authorized.
| ENERSIS S.A. | |
| By: /s/ Ignacio Antoñanzas | |
| -------------------------------------------------- | |
| Name: Ignacio Antoñanzas | |
| Title: Chief Executive Officer |
Date: Jan. 26, 2007