FORM 6-K
Pursuant to Rule 13a-16 or 15d-16 of
the Securities Exchange Act of 1934
For the month of October, 2009
Commission File Number: 001-12440
ENERSIS S.A.
Santa Rosa 76
Santiago, Chile
Indicate by check mark whether the registrant files or will file
annual reports under cover of Form 20-F or Form 40-F:
Form 20-F [X] Form 40-F [ ]
Indicate by check mark if the registrant is submitting the Form 6-K
in paper as permitted by Regulation S-T Rule 101(b)(1):
Yes [ ] No [X]
Indicate by check mark if the registrant is submitting the Form 6-K
in paper as permitted by Regulation S-T Rule 101(b)(7):
Yes [ ] No [X]
Indicate by check mark whether by furnishing the information
ontained in this Form, the Registrant is also thereby furnishing the
information to the Commission
pursuant to Rule 12g3-2(b) under the Securities Exchange Act of 1934:
Yes [ ] No [X]
If °;Yes” is marked, indicate below the file number assigned to the registrant
in connection with Rule 12g3-2(b): N/A
 | PRESS RELEASE | |
ENERSIS
ANNOUNCES CONSOLIDATED RESULTS
FOR NINE MONTH ENDED SEPTEMBER 30th, 2009
These Financial Statements have been prepared under IFRS.
There are important changes in the accounting principles used for these financial statements,
which have been authorized by the Superintendence of Securities and Insurance
as part of the migration from Chilean Generally Accepted Accounting Principles to IFRS.
Figures as of September 2008 have been reconciled under IFRS for comparable purposes.
HIGHLIGHTS FOR THE PERIOD
SUMMARY
For the nine months ended on September 30th, 2009, Enersis’ Net Income attributable to shareholders was Ch$534.776 million, an increase of 45.0% with respect to the same period in 2008.
This better outcome is mainly explained by the increase in energy sales and lower purchases of fuel and other operating expenses, which implied a 14.8% higher Gross Income (before SG&A expenses).
This higher operating profitability has been achieved in the context of a medium term strategy consistently applied to shorter term specific policies. Enersis has been quickly adapting itself to an unstable, challenging and still recessive environment.
As a consequence of the strategy and the goals settled, the analysis can be breakdown as follows:
1.- Improve profitability:
Management has required all subsidiaries to optimize the use of funds through the correct implementation of commercial and operating policies, with the goal of confronting adequately the market conditions. The results are as follows:
- Operating Revenues increased 5.4% higher, an increase of Ch$242,715 million, amounting to Ch$4,744,183 million.
- EBITDA increased by 17.7% or Ch$278,427 million, amounting to Ch$1,853,986 million.
- Operating Income rose 20.7%, or Ch$261,224 million up to Ch$ 1,522,698 million, basically explained by the performance of the Generation and Transmission Businesses.
2.- Maintain a solid financial position:
Enersis continues to tightly supervise and control its subsidiaries in the five countries in which it operates. In this current economic scenario, the goal is to count with enough liquidity, and with the ability to confront challenges and opportunities in the region. In this context, it is noteworthy to highlight the following indicators:
Pg. 1
| PRESS RELEASE | |
| • | Interest Coverage increased 40.7%, to 5.4 times. | ||
| • | Liquidity also increased. Working capital was 254.6% higher, Acid ratio was 27.6% higher and current liquidity was 28.4% higher. | ||
| 3.- | Provide the best service quality in Latin-America: | ||
| • | During the first nine months of 2009, we have been reducing the number of interruptions and length of service shortages. We continue applying a sound investment and maintenance program in our grids and systems, focusing in assuring the electric service supply. | ||
| • | Additionally, in order to promote a better and more stable service, we have been investing important resources in clean solutions or new renewable generation projects. During the remaining 2009, Canela II will start its operations with 60 MW. | ||
| • | Other important initiative, in which the Enersis Group has been participating, is the diversification of the country energy matrix. Through our subsidiary Endesa Chile, Enersis is participating in the LNG project, located in Quintero. Its commercial operations started on September 4th. | ||
| 4.- | Add value to our shareholders: | ||
| • | Enersis Share price increased 22.1% YTD from Ch$164.7 to Ch$201.1. | ||
| • | Enersis ADR price increased 44.8% YTD from US$12.7 to US$18.5, showing a better performance over local market major indexes. | ||
| • | Annualized ROE increased from 16.0% as of September 30th2008 to 20.3% as of September 30th 2009. | ||
| GENERATION AND TRANSMISSION BUSINESSES | |||
| • | Operating Revenues grew 2.8%, equivalent to Ch$56,896 million. | ||
| • | Operating Income increased 34.0% equivalent to Ch$243,235 million, mainly explained by the performance of the operations in Chile and to a lower degree, Colombia and Peru. | ||
| • | Operating Costs registered a 14.0% decrease, equivalent to Ch$186,339 million. | ||
| • | Physical sales increased by 4.6%, amounting 49,786 GWh. | ||
Pg. 2
| PRESS RELEASE | |
| DISTRIBUTION BUSINESS | |||||||
| • | Operating Revenues grew 10.3%, equivalent to Ch$279,523 million. | ||||||
| • | Operating Income increased by Ch$10,356 million, or 1.9%, to Ch$564,206 million, as a result of improved Operating Income in Peru and Colombia. | ||||||
| • | Consolidated physical sales were in line with the previous period, amounting to 47,142 GWh. | ||||||
| • | There were 376 thousand new clients over the last twelve months. This is equivalent to add a new mid size distribution company every year. The breakdown is as follows: | ||||||
| • Brazil | 3.7% or 193 thousand new clients | ||||||
| • Colombia | 3.4% or 77 thousand new clients | ||||||
| • Chile | 2.6% or 39 thousand new clients | ||||||
| • Argentina | 1.6% or 35 thousand new clients | ||||||
| • Peru | 3.1% or 32 thousand new clients | ||||||
| FINANCIALS | |||||||
| • | Liquidity, a key consideration in our financial management, continues to be in a very solid position, as shown below: | ||||||
| • Credit Lines for US$ 460 million available in the aggregate for Enersis and Endesa Chile in the Chilean capital markets. | |||||||
| • Additional US$ 800 million in undrawn revolving debt facilities in the international | |||||||
| • Cash and Cash Equivalents amount to US$2,416 million, a 69.2% increase over December 2008. | |||||||
| • | Debt maturities are properly spread out, as can be seen in the following schedule: | ||||||
| Million US$ | TOTAL | |||||||||||||||
| 2009 | 2010 | 2011 | 2012 | 2013 | 2014 | Balance | ||||||||||
| Chile | 164 | 415 | 219 | 39 | 421 | 705 | 1,652 | 3,616 | ||||||||
| Argentina | 61 | 140 | 107 | 34 | 25 | 14 | 0 | 382 | ||||||||
| Peru | 19 | 81 | 124 | 185 | 97 | 95 | 176 | 777 | ||||||||
| Brazil | 72 | 348 | 486 | 452 | 167 | 88 | 61 | 1,770 | ||||||||
| Colombia | 184 | 293 | 184 | 173 | 82 | 200 | 722 | 1,838 | ||||||||
| TOTAL | 501 | 1,277 | 1,121 | 881 | 793 | 1,102 | 2,611 | 8,383 | ||||||||
| * Includes accrued interest of financial debt only. | ||||||||||||||||
| • Coverage and Protection |
| Enersis continued applying a rigorous control over its liquidity for all its subsidiaries. In that respect, and in addition to strict internal rules to protect our cash flows, balance sheet, and liquidity, we currently have: |
Pg. 3
| PRESS RELEASE | |
| • | Cross Currency Swaps for a total amount of US$ 900 million to match currency in which cash flows are originated and their associated debt. | ||
| • | Interest Rate Swaps for US$ 201 million, in order to provide protection against variations. | ||
| • | Collars, for a value of US$ 110 million, intended to provide additional protection. | ||
| • | Forwards, for US$ 185 million, to protect against foreign exchange rate variations. | ||
The aforementioned financial tools are being permanently evaluated and adjusted to the changing macroeconomic scenario, in order to achieve the most efficient levels of protection. These instruments, however, do not replace the most important reason behind our solid liquidity position: the very stable nature of our business. | |||
| MARKET SUMMARY | |||
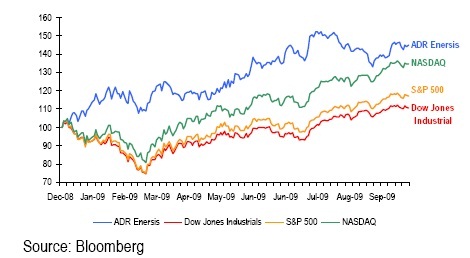
| • In the chart below we show the evolution of the Enersis ADR price versus Dow Jones Industrial Index (red), Nasdaq Index (green) and Standard & Poor´s 500 Index (orange), three indicators that reflect the evolution of stock prices in the U.S. markets. | |||
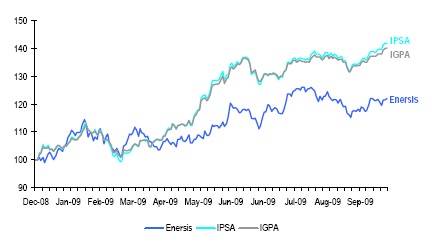
- Regarding the stock price variations in the local market during the first nine months of 2009, Enersis continued the positive trend following the Chilean market.
Pg. 4
| PRESS RELEASE | |
- In addition, during this year, Enersis and its subsidiary Endesa Chile continued to be among the most traded companies at the Santiago Stock Exchange.
| Top Ten Traded Santiago Stock Exchange, Jan - Sep 2009 | ||
| Amounts in Ch$ million | ||
| D&S | 2,278,729 | |
| SQM-B | 1,893,939 | |
| CAP | 877,835 | |
| ENDESA | 796,736 | |
| ENERSIS | 655,475 | |
| ORO BLANCO | 639,294 | |
| CENCOSUD | 619,030 | |
| CALICHERA | 526,553 | |
| LA POLAR | 497,047 | |
| COPEC | 472,112 | |
| Source: Santiago Stock Exchange | ||
RISK RATING CLASSIFICATION INFORMATION
During these nine months of 2009, the work with Rating Agencies has been focused on liquidity situation at a consolidated and single subsidiaries level, maturities, refinancing strategy, credit facilities availability, etc.
In a current complex scenario, Enersis ratified its solid commercial, financial and operating position.
The current risk classifications are:
• International Ratings:
| Enersis | S&P | Moody’s | Fitch |
| Corporate | BBB, Stable | Baa3, Stable | BBB, Stable |
• Domestic Ratings (for securities issued in Chile):
| Enersis | Feller Rate | Fitch |
| Shares | 1stClass Level 1 | 1stClass Level 1 |
| Bonds | AA-, Stable | AA-, Stable |
Pg. 5
| PRESS RELEASE | |
TABLE OF CONTENTS
| HIGHLIGHTS FOR THE PERIOD | 1 | |
| Summary | 1 | |
| Generation and Transmission Businesses | 2 | |
| Distribution Business | 3 | |
| Financials | 3 | |
| Market Summary | 4 | |
| Risk Rating Classification Information | 5 | |
| TABLE OF CONTENTS | 6 | |
| GENERAL INFORMATION | 8 | |
| SIMPLIFIED ORGANIZATIONAL STRUCTURE | 8 | |
| MARKET INFORMATION | 9 | |
| EQUITY MARKET | 9 | |
| DEBT MARKET | 11 | |
| RISK RATING CLASSIFICATION | 12 | |
| CONSOLIDATED INCOME STATEMENT ANALYSIS | 13 | |
| NET INCOME | 13 | |
| UNDER IFRS | 13 | |
| OPERATING INCOME | 14 | |
| FINANCIAL RESULT | 16 | |
| TAXES | 16 | |
| CONSOLIDATED BALANCE SHEET ANALYSIS | 17 | |
| ASSETS UNDER IFRS | 17 | |
| LIABILITIES AND SHAREHOLDERS EQUITY UNDER IFRS | 18 | |
| DEBT MATURITY WITH THIRD PARTIES, MILLION CH$ | 22 | |
| DEBT MATURITY WITH THIRD PARTIES, THOUSAND US$ | 22 | |
| EVOLUTION OF KEY FINANCIAL RATIOS | 23 | |
| CONSOLIDATED STATEMENTS OF CASH FLOWS ANALYSIS | 24 | |
| CASH FLOW RECEIVED FROM FOREIGN SUBSIDIARIES BY ENERSIS, CHILECTRA AND ENDESA CHILE | 26 | |
| CAPEX AND DEPRECIATION | 26 | |
| THE PRINCIPAL RISKS ASSOCIATED TO THE ACTIVITIES OF THE ENERSIS GROUP | 27 | |
| BOOK VALUE AND ECONOMIC VALUE OF ASSETS | 32 | |
Pg. 6
| PRESS RELEASE | |
| ARGENTINA | 33 | |
| GENERATION | 33 | |
| Endesa Costanera | 33 | |
| Chocón | 34 | |
| DISTRIBUTION | 35 | |
| Edesur | 35 | |
| BRAZIL | 36 | |
| GENERATION | 36 | |
| Cachoeira | 36 | |
| Endesa Fortaleza | 36 | |
| TRANSMISSION | 37 | |
| CIEN | 37 | |
| DISTRIBUTION | 38 | |
| Ampla | 38 | |
| Coelce | 39 | |
| CHILE | 40 | |
| GENERATION | 40 | |
| Endesa Chile | 40 | |
| DISTRIBUTION | 41 | |
| Chilectra | 41 | |
| COLOMBIA | 43 | |
| GENERATION | 43 | |
| Emgesa | 43 | |
| DISTRIBUTION | 44 | |
| Codensa | 44 | |
| PERU | 45 | |
| GENERATION | 45 | |
| Edegel | 45 | |
| DISTRIBUTION | 46 | |
| Edelnor | 46 | |
| CONFERENCE CALL INVITATION | 47 | |
| CONTACT INFORMATION | 48 | |
| DISCLAIMER | 48 |
Pg. 7
| PRESS RELEASE | |
GENERAL INFORMATION
(Santiago, Chile, Wednesday 28th, September 2009) Enersis S.A. (NYSE: ENI), announced today its consolidated financial results for nine months ended on September 30th, 2009. All figures are in Ch$, under International Financial Reporting Standards (IFRS). Variations of Income Statements and cash flows refer to September 30th, 2008 and September 30th, 2009, while variations of balance sheet accounts are disclosed between the periods of December 31st, 2008 and September 30th, 2009.
Figures as of September 30th, 2009 are additionally translated into US$, merely as a convenience translation, using the exchange rate of US$1 = Ch$550.36 (September 30, 2009).
The consolidation includes the following investment vehicles and companies,
a) In Chile: Endesa Chile (NYSE: EOC)*, Chilectra, Synapsis, CAM, and Inmobiliaria Manso de Velasco.
b) Outside Chile: Distrilima (Peru), Endesa Brasil (Brazil)**, Edesur (Argentina) and Codensa (Colombia).
In the following pages you will find a detailed analysis of financial statements, a brief explanation for most important variations and comments on main items in the P&L and Cash Flow Statements compared to the information as of September 30th, 2008.
* Includes Endesa Chile Chilean subsidiaries (Celta, Pangue, Pehuenche, San Isidro, Túnel El Melón), non Chilean subsidiaries (Costanera, El Chocón, Edegel and Emgesa) and jointly controlled companies or associates companies (Gas Atacama, Trasquillota and HidroAysén).
** Includes Endesa Fortaleza, CIEN, Cachoeira Dourada, Ampla and Coelce.
Pg. 8
| PRESS RELEASE | |
MARKET INFORMATION
EQUITY MARKET
New York Stock Exchange (NYSE)
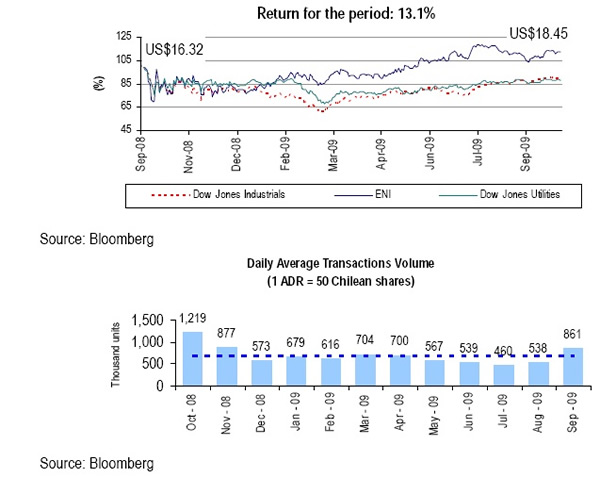
The chart below shows the performance of Enersis’ ADR (“ENI”) price at the NYSE, compared to the Dow Jones Industrials and the Dow Jones Utilities indexes over the last 12 months:
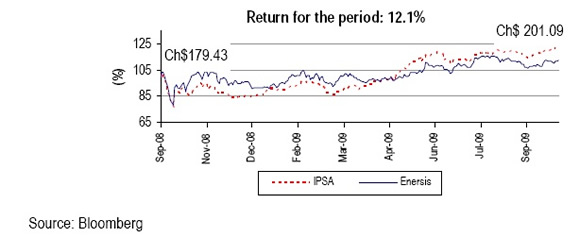
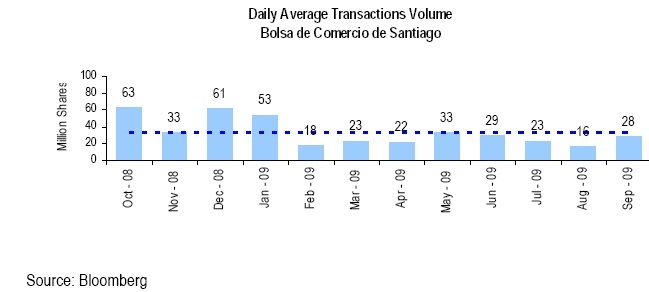
Santiago Stock Exchange (BCS)
The chart below shows the performance of Enersis’ Chilean stock price over the last 12 months compared to the selective Chilean selective Stock Index (IPSA):
Pg. 9
| PRESS RELEASE | |
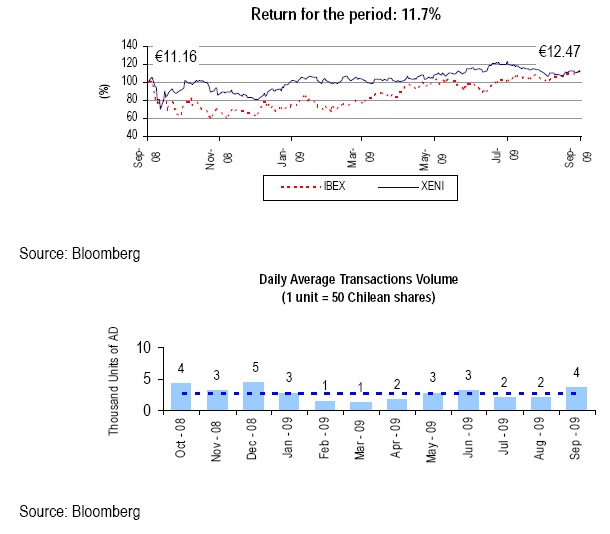
Madrid Stock Exchange (Latibex) - Spain
The chart below, shows Enersis’ share price (“XENI”) at the Latibex over the last 12 months compared to the Local Stock Index (IBEX):
Pg. 10
| PRESS RELEASE | |
DEBT MARKET
Yankee Bonds Price Evolution
The following chart shows the pricing of our Yankee Bonds over the last twelve months compared to the Ishares Iboxx Investment Grade Corporate Bond Fund Index:

(*) IShares Iboxx Corporate Investment Grade Bonds Fund is an exchange traded fund incorporated in the U.S.A. The Index measures the performance of a fixed number of investment grade corporate bonds.
Pg. 11
| PRESS RELEASE | |
RISK RATING CLASSIFICATION
Fitch: BBB / Stable
Rationale (April 15, 2009); “Relevant classification factors are: (i) Geographical diversification in Latin America, which provides natural protection against different regulatory frameworks and weather conditions. In summary, Enersis’ subsidiaries are financially strong and they count on leadership positions within their markets; (ii) Stable Cash Flows from Distribution segment: this business benefits from a healthy and organic growth in annual terms, being Chilectra the most predictable one; (iii) Volatility of business is offset: Contractual position of the Company reduces risk related to dryer hydrological conditions, meanwhile diversified generation matrix and geographical diversity provide natural protection.”
Standard & Poor’s: BBB / Stable
Rationale (December 30, 2008); “The 'BBB' ratings on Chile-based electricity provider Enersis S.A. reflects its satisfactory business risk profile resulting from the strong creditworthiness of its Chilean investments, its solid competitive position in the countries where it operates (Argentina, Brazil, Chile, Colombia, and Peru), and the favorable economic conditions and growing demand for power in the region. These factors are partly offset by the higher risk of its non-Chilean investments and the exposure of its 60%-owned subsidiary, Empresa Nacional de Electricidad S.A. (Endesa Chile; BBB/Stable/--) to droughts. In addition, the ratings reflect Enersis' intermediate financial risk profile resulting from its moderate leverage, adequate debt service coverage, manageable interest rate and foreign exchange risks, and adequate liquidity and financial flexibility.”
Moody’s: Baa3 / Stable
Rationale (December 19, 2008); “Enersis' Baa3 senior unsecured rating reflects the benefits of the group's activities in both the generation and distribution businesses, which offsets to some degree overall business risk. The rating also considers Enersis' significant exposure to the Chilean electricity market, where it benefits from stable macroeconomic conditions (A2 Foreign Currency, A1 Local Currency rating) as well as a transparent and favorable regulatory framework for its distribution and generation activities. The rating also incorporates the geographic and operational diversification of its subsidiaries' operations in four other Latin American countries, where (as in Chile) growing demand is expected amid tighter supply and improving macroeconomic and regulatory conditions.”
Feller Rate:Bonds: AA- / Stable - Shares: 1st Class Level 1
Rationale (July 7, 2009); “Ratings assigned to solvency, bonds and shares of Enersis reflect the good business’ structure of the company, which combined participations in generation and distribution with an important presence in several countries in Latin America, maintaining a higher proportion of its cash flow generation capacity in Chile. Likewise, the rating considers its current financial profile with debt coverage indicators and leverage at a consolidated level which have been strengthened over time.”
Fitch Chile:Bonds: AA- / Stable - Shares: 1st Class Level 1
Rationale (April 15, 2009); “Relevant classification factors are: (i) Geographical diversification in Latin America, which provides natural protection against different regulatory frameworks and weather conditions. In summary, Enersis’ subsidiaries are financially strong and they count on leadership positions within their markets; (ii) Stable Cash Flows from Distribution segment: this business benefits from a healthy and organic growth in annual terms, being Chilectra the most predictable one; (iii) Volatility of business is offset: Contractual position of the Company reduces risk related to dryer hydrological conditions, meanwhile diversified generation matrix and geographical diversity provide natural protection.”
Pg. 12
| PRESS RELEASE | |
CONSOLIDATED INCOME STATEMENT ANALYSIS
(Figures in Ch$)
NET INCOME
Enersis’ Net Income attributable to parent company for the nine months as of September 2009 was Ch$534,776 million, representing a 45.0% increase over the previous year, which was Ch$368,872 million.
UNDER IFRS
| Table 2 | |||||||||
| CONS. INCOME STATEMENT | Million Ch$ | Thousand US$ | |||||||
| 3Q08 | 3Q09 | 9M 08 | 9M 09 | Var 08-09 | Chg % | 9M 09 | |||
| Sales | 1,414,157 | 1,531,358 | 4,396,902 | 4,618,278 | 221,376 | 5.0% | 8,391,376 | ||
| Sales of Energy | 1,247,117 | 1,385,806 | 4,000,839 | 4,206,372 | 205,533 | 5.1% | 7,642,947 | ||
| Other Sales | 21,453 | 14,207 | 44,460 | 36,795 | (7,665) | (17.2%) | 66,856 | ||
| Other services supply | 145,587 | 131,345 | 351,604 | 375,111 | 23,507 | 6.7% | 681,574 | ||
| Other Operating Revenues | 18,533 | 36,178 | 104,566 | 125,905 | 21,339 | 20.4% | 228,769 | ||
| Operating Revenues | 1,432,690 | 1,567,536 | 4,501,468 | 4,744,183 | 242,715 | 5.4% | 8,620,145 | ||
| Energy purchases | (352,852) | (389,268) | (1,194,626) | (1,223,870) | (29,244) | (2.4%) | (2,223,763) | ||
| Fuel procurement costs | (181,410) | (146,987) | (647,559) | (503,315) | 144,244 | 22.3% | (914,519) | ||
| Transmission expenses | (57,766) | (66,514) | (197,241) | (205,803) | (8,562) | (4.3%) | (373,943) | ||
| Other purchases and services | (118,692) | (142,090) | (346,723) | (383,851) | (37,128) | (10.7%) | (697,455) | ||
| Purchases and Services | (710,719) | (744,860) | (2,386,149) | (2,316,839) | 69,310 | 2.9% | (4,209,680) | ||
| Gross Income | 721,971 | 822,676 | 2,115,320 | 2,427,344 | 312,024 | 14.8% | 4,410,465 | ||
| Work Performed by the entity and capitalized | 6,270 | 6,229 | 21,539 | 20,705 | (834) | (3.9%) | 37,622 | ||
| Personnel expenses | (72,911) | (87,642) | (236,437) | (265,111) | (28,674) | (12.1%) | (481,705) | ||
| Other fixed operating expenses | (117,768) | (100,848) | (324,862) | (328,951) | (4,089) | (1.3%) | (597,702) | ||
| Gross Operating Income (EBITDA) | 537,563 | 640,415 | 1,575,559 | 1,853,986 | 278,427 | 17.7% | 3,368,679 | ||
| Depreciations & Amortizations | (100,684) | (110,292) | (314,085) | (331,288) | (17,203) | (5.5%) | (601,948) | ||
| Operating Income | 436,879 | 530,123 | 1,261,474 | 1,522,699 | 261,225 | 20.7% | 2,766,732 | ||
| Financial Result | (123,344) | (56,535) | (275,219) | (212,669) | 62,550 | 22.7% | (386,418) | ||
| Interest Revenues | 62,612 | 63,324 | 131,877 | 127,828 | (4,049) | (3.1%) | 232,263 | ||
| Interest Expenses | (134,747) | (124,979) | (366,929) | (342,804) | 24,125 | 6.6% | (622,873) | ||
| Income for Readjustment items | (21,550) | 4,572 | (42,023) | 25,918 | 67,941 | 161.7% | 47,092 | ||
| Exchange Gains (Losses) | (29,658) | 547 | 1,857 | (23,611) | (25,468) | - | (42,900) | ||
| Positive | (19,414) | 13,350 | 39,733 | 47,649 | 7,916 | 19.9% | 86,579 | ||
| Negative | (10,244) | (10,893) | (34,589) | (67,690) | (33,101) | (95.7%) | (122,992) | ||
| Effect of Derivatives in Exchange | |||||||||
| Gains (Losses) | - | (1,910) | (3,287) | (3,570) | (283) | (8.6%) | (6,487) | ||
| Share of profit of associates | 995 | 496 | 2,309 | 2,261 | (48) | (2.1%) | 4,109 | ||
| Income from Other Investments | (175) | (112) | (210) | 1,548 | 1,758 | - | 2,813 | ||
| Income from asset sales | 5,626 | 191 | 6,614 | 393 | (6,221) | (94.1%) | 714 | ||
| Net Income before Taxes | 319,981 | 474,162 | 994,969 | 1,314,232 | 319,263 | 32.1% | 2,387,950 | ||
| Income Tax | (83,213) | (123,272) | (244,024) | (272,335) | (28,311) | (11.6%) | (494,831) | ||
| NET INCOME | 236,768 | 350,890 | 750,945 | 1,041,897 | 290,952 | 38.7% | 1,893,119 | ||
| Parent Company | 121,630 | 173,870 | 368,872 | 534,776 | 165,904 | 45.0% | 971,683 | ||
| Minority Holders | 115,139 | 177,020 | 382,073 | 507,122 | 125,049 | 32.7% | 921,436 | ||
| Earning per Share | 3.7 | 5.3 | 11.3 | 16.4 | 5.0 | 45.0% | 0.030 | ||
| Earning per Share ADR | 186.3 | 266.3 | 564.9 | 818.9 | 254 | 45.0% | 1.488 | ||
Pg. 13
| PRESS RELEASE | |
OPERATING INCOME
Operating Income for the period ending September 30, 2009 increased by Ch$261,224 million, from Ch$1,261,474 million to Ch$ 1,522,699 million as of September 2009, representing an increase of 20.7% . Likewise, the EBITDA increased by Ch$278,427 million or 17.7%, amounting to Ch$1,853,986 million; the above is mainly due to good results of generation business.
Operating Revenues and costs, broken down by business line for the periods ending September 30, 2008 and 2009 are:
Table 3
| Operating Income by Businesses | Generation and Transmission | Distribution | |||||||||||||
| Million Ch$ | Chg% | Thousand US$ | Million Ch$ | Chg% | Thousand US$ | ||||||||||
| 9M 08 | 9M 09 | 9M 09 | 9M 08 | 9M 09 | 9M 09 | ||||||||||
| Operating Revenues | 2.045.541 | 2.102.436 | 2,8% | 3.820.110 | 2.711.671 | 2.991.194 | 10,3% | 5.434.977 | |||||||
| Operating Costs | (1.329.858) | (1.143.519) | -14,0% | (2.077.765) | (2.157.821) | (2.426.988) | 12,5% | (4.409.819) | |||||||
| Operating Income | 715.682 | 958.917 | 34,0% | 1.742.345 | 553.850 | 564.206 | 1,9% | 1.025.159 | |||||||
| Operating Income by Businesses | Eliminations and Others | Consolidated | |||||||||||||
| Million Ch$ | Chg% | Thousand US$ | Million Ch$ | Chg% | Thousand US$ | ||||||||||
| 9M 08 | 9M 09 | 9M 09 | 9M 08 | 9M 09 | 9M 09 | ||||||||||
| Operating Revenues | (255.743) | (349.447) | 36,6% | (634.943) | 4.501.468 | 4.744.183 | 5,4% | 8.620.145 | |||||||
| Operating Costs | 247.685 | 349.022 | 40,9% | 634.171 | (3.239.994) | (3.221.484) | -0,6% | (5.853.413) | |||||||
| Operating Income | (8.059) | (425) | -94,7% | (772) | 1.261.474 | 1.522.699 | 20,7% | 2.766.732 | |||||||
Generation and Transmission Businesses increased its operating income of Ch$243,235 million, equivalent to 34.0%, and totaling Ch$958,917. Physical sales increased 4.6% amounting to 49,786 GWh as of September 2009 (47,609 GWh, in September 2008).
Operating income for Generation and Transmission business line, by country in the following table:
| Table 4 | ||||||||||||||||||||||||
| Generation & Transmission | Chile | Argentina | Brazil | |||||||||||||||||||||
| Million Ch$ | Chg% | Thousand US$ | Million Ch$ | Chg% | Thousand US$ | Million Ch$ | Chg% | Thousand US$ | ||||||||||||||||
| 9M 08 | 9M 09 | 9M 09 | 9M 08 | 9M 09 | 9M 09 | 9M 08 | 9M 09 | 9M 09 | ||||||||||||||||
| Operating Revenues | 1.145.388 | 1.070.213 | -6,6% | 1.944.568 | 222.696 | 254.365 | 14,2% | 462.180 | 246.636 | 243.897 | -1,1% | 443.159 | ||||||||||||
| % of consolidated | 56% | 51% | 51% | 11% | 12% | 12% | 12% | 12% | 12% | |||||||||||||||
| Operating Costs | (770.697) | (537.634) | -30,2% | (976.878) | (193.453) | (218.584) | 13,0% | (397.166) | (112.826) | (111.540) | -1,1% | (202.667) | ||||||||||||
| % of consolidated | 58% | 47% | 47% | 15% | 19% | 19% | 8% | 10% | 10% | |||||||||||||||
| Operating Income | 374.691 | 532.578 | 42,1% | 967.691 | 29.243 | 35.781 | 22,4% | 65.014 | 133.810 | 132.357 | -1,1% | 240.491 | ||||||||||||
| Generation & Transmission | Peru | Colombia | Consolidated | |||||||||||||||||||||
| Million Ch$ | Chg% | Thousand US$ | Million Ch$ | Chg% | Thousand US$ | Million Ch$ | Chg% | Thousand US$ | ||||||||||||||||
| 9M 08 | 9M 09 | 9M 09 | 9M 08 | 9M 09 | 9M 09 | 9M 08 | 9M 09 | 9M 09 | ||||||||||||||||
| Operating Revenues | 140.707 | 159.865 | 13,6% | 290.473 | 290.493 | 374.771 | 29,0% | 680.956 | 2.045.541 | 2.102.436 | 2,8% | 3.820.110 | ||||||||||||
| % of consolidated | 7% | 8% | 8% | 14% | 18% | 18% | ||||||||||||||||||
| Operating Costs | (109.734) | (100.874) | -8,1% | (183.287) | (143.527) | (175.561) | 22,3% | (318.992) | (1.329.858) | (1.143.519) | -14,0% | (2.077.765) | ||||||||||||
| % of consolidated | 8% | 9% | 9% | 11% | 15% | 15% | ||||||||||||||||||
| Operating Income | 30.973 | 58.991 | 90,5% | 107.187 | 146.966 | 199.210 | 35,5% | 361.963 | 715.682 | 958.917 | 34,0% | 1.742.345 | ||||||||||||
Pg. 14
| PRESS RELEASE | |
Distribution businessincreased its operating income by Ch$10,353 million, equivalent to 1.9% and totaling Ch$564,206 million.
Physical sales amounted to 47,142 GWh, representing an increase of 273 GWh, equivalent to 0.6% variation. Number of customers increased by 376 thousand, amounting 12,689 thousand customer base.
Operating income for Distribution line of business, detailed by country, as follows:
| Table 5 | ||||||||||||||||||||||||
| Distribution | Chile | Argentina | Brazil | |||||||||||||||||||||
| Million Ch$ | Chg% | Thousand US$ | Million Ch$ | Chg% | Thousand US$ | Million Ch$ | Chg% | Thousand US$ | ||||||||||||||||
| 9M 08 | 9M 09 | 9M 09 | 9M 08 | 9M 09 | 9M 09 | 9M 08 | 9M 09 | 9M 09 | ||||||||||||||||
| Operating Revenues | 753.416 | 846.016 | 12,3% | 1.537.205 | 223.526 | 252.188 | 12,8% | 458.223 | 1.077.453 | 1.116.223 | 3,6% | 2.028.169 | ||||||||||||
| % of consolidated | 28% | 28% | 28% | 8% | 8% | 8% | 40% | 37% | 37% | |||||||||||||||
| Operating Costs | (639.644) | (734.533) | 14,8% | (1.334.640) | (194.480) | (220.915) | 13,6% | (401.400) | (852.399) | (901.048) | 5,7% | (1.637.197) | ||||||||||||
| % of consolidated | 30% | 30% | 30% | 9% | 9% | 9% | 40% | 37% | 37% | |||||||||||||||
| Operating Income | 113.771 | 111.484 | -2,0% | 202.565 | 29.046 | 31.273 | 7,7% | 56.823 | 225.054 | 215.176 | -4,4% | 390.973 | ||||||||||||
| Distribution | Peru | Colombia | Consolidated | |||||||||||||||||||||
| Million Ch$ | Chg% | Thousand US$ | Million Ch$ | Chg% | Thousand US$ | Million Ch$ | Chg% | Thousand US$ | ||||||||||||||||
| 9M 08 | 9M 09 | 9M 09 | 9M 08 | 9M 09 | 9M 09 | 9M 08 | 9M 09 | 9M 09 | ||||||||||||||||
| Operating Revenues | 175.309 | 227.437 | 29,7% | 413.251 | 481.969 | 549.330 | 14,0% | 998.129 | 2.711.671 | 2.991.194 | 10,3% | 5.434.977 | ||||||||||||
| % of consolidated | 6% | 8% | 8% | 18% | 18% | 18% | 100% | 100% | 100% | |||||||||||||||
| Operating Costs | (137.817) | (179.132) | 30,0% | (325.482) | (333.481) | (391.361) | 17,4% | (711.100) | (2.157.821) | (2.426.988) | 12,5% | (4.409.819) | ||||||||||||
| % of consolidated | 6% | 7% | 7% | 15% | 16% | 16% | 100% | 100% | 100% | |||||||||||||||
| Operating Income | 37.492 | 48.305 | 28,8% | 87.770 | 148.487 | 157.969 | 6,4% | 287.029 | 553.850 | 564.206 | 1,9% | 1.025.159 | ||||||||||||
Summary of operating revenues, operating costs and operating income of all Enersis’ subsidiaries, for the periods ended in September 2008 and September 2009, detailed as follows:
| Table 6 | |||||||
| 9M 08 | 9M 09 | ||||||
| Million Ch$ | Operating | Operating | Operating | Operating | Operating | Operating | |
| Revenues | Costs | Income | Revenues | Costs | Income | ||
| Endesa Chile (*) | 1,818,249 | (1,242,388) | 575,861 | 1,879,052 | (1,050,387) | 828,665 | |
| Cachoeira (**) | 114,758 | (30,534) | 84,224 | 64,691 | (27,233) | 37,458 | |
| Fortaleza (***) | 84,749 | (64,194) | 20,555 | 100,079 | (64,022) | 36,057 | |
| Cien (**) | 52,213 | (19,380) | 32,832 | 84,192 | (21,631) | 62,561 | |
| Chilectra | 753,416 | (639,644) | 113,771 | 846,016 | (734,533) | 111,484 | |
| Edesur | 223,526 | (194,480) | 29,046 | 252,188 | (220,915) | 31,273 | |
| Distrilima (Edelnor) | 175,309 | (137,817) | 37,492 | 227,437 | (179,132) | 48,305 | |
| Ampla | 630,582 | (504,876) | 125,706 | 638,654 | (524,044) | 114,610 | |
| Investluz (Coelce) | 446,871 | (347,523) | 99,348 | 477,569 | (377,003) | 100,566 | |
| Codensa | 481,969 | (333,481) | 148,487 | 549,330 | (391,361) | 157,969 | |
| CAM Ltda. | 122,032 | (118,226) | 3,806 | 112,749 | (111,604) | 1,145 | |
| Inmobiliaria Manso de Velasco Ltda. | 10,000 | (8,482) | 1,518 | 3,075 | (3,063) | 12 | |
| Synapsis Soluciones y Servicios IT Ltda. | 46,564 | (40,704) | 5,860 | 53,195 | (47,374) | 5,821 | |
| Enersis Holding and other investment vehicles | 9,196 | (21,962) | (12,767) | 9,251 | (21,583) | (12,332) | |
| Consolidation Adjustments | (467,962) | 463,698 | (4,264) | (553,297) | 552,402 | (894) | |
| Total Consolidation | 4,501,468 | (3,239,994) | 1,261,474 | 4,744,183 | (3,221,484) | 1,522,699 | |
Pg. 15
| PRESS RELEASE | |
| 9M 09 | ||||||
| Thousand US$ | Operating | Operating | Operating | |||
| Revenues | Costs | Income | ||||
| Endesa Chile (*) | 3,414,223 | (1,908,545) | 1,505,677 | |||
| Cachoeira (**) | 117,543 | (49,483) | 68,061 | |||
| Fortaleza (***) | 181,843 | (116,328) | 65,515 | |||
| Cien (**) | 152,977 | (39,304) | 113,673 | |||
| Chilectra | 1,537,205 | (1,334,640) | 202,565 | |||
| Edesur | 458,223 | (401,400) | 56,823 | |||
| Distrilima (Edelnor) | 413,251 | (325,482) | 87,770 | |||
| Ampla | 1,160,429 | (952,184) | 208,245 | |||
| Investluz (Coelce) | 867,740 | (685,012) | 182,727 | |||
| Codensa | 998,129 | (711,100) | 287,029 | |||
| CAM Ltda. | 204,865 | (202,784) | 2,081 | |||
| Inmobiliaria Manso de Velasco Ltda. | 5,588 | (5,566) | 22 | |||
| Synapsis Soluciones y Servicios IT Ltda. | 96,656 | (86,079) | 10,577 | |||
| Enersis Holding and other investment vehicles | 16,809 | (39,216) | (22,407) | |||
| Consolidation Adjustments | (1,005,336) | 1,003,711 | (1,625) | |||
| Total Consolidation | 8,620,145 | (5,853,413) | 2,766,732 | |||
| (*) Since January 1st, 2009, includes Gas Atacama, Transqullota e HydroAysén | ||||||
| (**) Consolidated by Endesa Chile until September 30th, 2005. Since October 1st, 2005 is consolidated by Enersis through Endesa Brasil. | ||||||
| (***) Since October 1st, 2005, these subsidiaries are consolidated by Enersis through Endesa Brasil | ||||||
FINANCIAL RESULT
As of September 30th, 2009, the company recorded a financial result of Ch$212,669 million loss, representing a 22.7% of lower losses. This variation is mainly explained by a higher Income for Readjustment items which increased Ch$67,941 million explained by changes on the Inflation Index Unit – UF (Unidades de Fomento) and its impact on Chile’s UF denominated debt. In fact, during the first nine months of the year 2009 the UF decreased 2.9% value compared to an increase of 7.0% experienced during the first nine months of the last year. Additionally, net interest expenses decreased Ch$20,076 million, primarily due a lower average debt and lower interest rates during the period.
The above was partially offset by a loss of Ch$25,467 million effect of exchange rate differences variation, mainly in Chile and Argentina. In Chile, during this period the Chilean peso appreciated more than 14%, compared to the 11% devaluation in the previous year. In Argentina, the Argentine peso devaluated by 11% during the current period, compared to 0.4% devaluation last year.
TAXES
Income Tax increased Ch$28,311 million. The latter is mostly explained by increases in: Enersis Ch$33,792 million, San Isidro Ch$5,814 million, Endesa Chile Ch$4,934 million and Costanera Ch$4,385. This negative effect was partially offset by lower income tax in Gas Atacama Ch$17,151 million, Emgesa Ch$16,599 million, Cien Ch$10,571 million, Chilectra Ch$9,218 million and Edegel Ch$6,738 million.
Pg. 16
| PRESS RELEASE | |
CONSOLIDATED BALANCE SHEET ANALYSIS
ASSETS UNDER IFRS
| Table 7 | |||||||
| ASSETS | Million Ch$ | Thousand US$ | |||||
| 2007 | 2008 | 9M 09 | Var 08-09 | Chg % | 9M 09 | ||
| CURRENT ASSETS | |||||||
| Cash and Cash Equivalents | 588,877 | 1,318,062 | 1,329,662 | 11,600 | 0.9% | 2,415,986 | |
| Financial assets in reasonable value with | |||||||
| change in results | - | - | 92 | 92 | 0.0% | 167 | |
| Financial assets available for sale | - | - | 20,059 | 20,059 | - | 36,448 | |
| Other Financial Assets | - | - | 119 | 119 | - | 216 | |
| Accounts receivable, net | 1,159,931 | 1,313,582 | 1,389,968 | 76,386 | 5.8% | 2,525,561 | |
| Amounts due from related companies | 52,579 | 24,747 | 19,781 | (4,965) | (20.1%) | 35,942 | |
| Inventories | 96,743 | 99,400 | 99,852 | 452 | 0.5% | 181,431 | |
| Assets for Hedging | - | - | - | - | - | - | |
| Prepaid expenses | 10,916 | 8,973 | 15,995 | 7,021 | 78.2% | 29,062 | |
| Income taxes recoverable | 146,791 | 131,788 | 140,873 | 9,084 | 6.9% | 255,965 | |
| Other current assets | 15,847 | 28,876 | 24,228 | (4,648) | (16.1%) | 44,022 | |
| Total currrent assets | 2,071,685 | 2,925,428 | 3,040,629 | 115,201 | 3.9% | 5,524,799 | |
| OTHER ASSETS | |||||||
| Financial Assets available for sale | 22,501 | 22,495 | 2,513 | (19,982) | (88.8%) | 4,566 | |
| Other Financial Assets | 25,635 | 1,746 | 24,051 | 22,304 | - | 43,700 | |
| Long-term receivables | 232,406 | 295,032 | 224,185 | (70,848) | (24.0%) | 407,342 | |
| Amounts due from related companies | 505 | 641 | 601 | (40) | (6.3%) | 1,092 | |
| Investments in associates | 12,455 | 37,833 | 23,816 | (14,018) | (37.1%) | 43,273 | |
| Intangibles | 1,467,885 | 1,459,390 | 1,494,040 | 34,650 | 2.4% | 2,714,659 | |
| Land, plant and equipment, net | 7,589,675 | 8,579,345 | 8,690,127 | 110,782 | 1.3% | 15,789,896 | |
| Investment Property | 28,504 | 26,364 | 27,042 | 678 | 2.6% | 49,135 | |
| Deferred income taxes | 541,265 | 516,854 | 494,585 | (22,270) | (4.3%) | 898,657 | |
| Assets for Hedging | 1,036 | 2,487 | 35 | (2,452) | (98.6%) | 63 | |
| Prepaid expenses | 1,386 | 1,203 | 855 | (348) | (28.9%) | 1,553 | |
| Others assets | 70,737 | 72,215 | 98,704 | 26,489 | 36.7% | 179,344 | |
| Total other assets | 9,993,988 | 11,015,605 | 11,080,552 | 64,946 | 0.6% | 20,133,279 | |
| TOTAL ASSETS | 12,065,673 | 13,941,034 | 14,121,180 | 180,146 | 1.3% | 25,658,079 | |
Total Assetsincreased Ch$180,146 million, and mainly due to:
• Ch$115,201 million increase in Current Assets, equal to 3.9%, as a result of:
- An increase in commercial receivables and other receivables for Ch$76,386 million, primarily due to the transfer from long-term to short-term of receivable accounts in Gas Atacama for Ch$45.940 million, and increase of receivable accounts in Cien for Ch$35,235 million, El Chocón for Ch$19,087 million, Coelce for Ch$17,661 million, Emgesa for Ch$15,080 million and Celta by Ch$11,028 million. The former positive change was partially compensated by decreases in Edegel for Ch$25,520 millones, Edesur for Ch$21,652 million, Costanera Ch$9,277 million, and Endesa Chile for Ch$8,539 million.
- An increase in financial assets available for sale by Ch$20,059 million, due to transferring EEB shares available for sale from long-term to short-term.
Pg. 17
| PRESS RELEASE | |
- Ch$11,600 million increase in cash and cash equivalent, primarily explained by increases in times deposits in Emgesa for Ch$133,914 million, in CGTF for Ch$43,739 million, Cien for Ch$38,917 million, Endesa Brazil for Ch$36,192 million and Ampla for Ch$20,429 million. This increase in cash and cash equivalent was partially diminished by decreases in time deposits in Endesa Chile for Ch$226,678 million used to prepay debt and dividends, and in Enersis by Ch$35,836 million used to pay dividends.
• Increase in Non-Current Assets for Ch$64,946 million representing a 0.6%, mainly due to:
- Increase in Lands, Plants and Equipment, by Ch$110,782 million as consequence of additions in the period by Ch$490,449 million, partially offset with depreciation by Ch$321,244 million and conversion effect to Chilean pesos from subsidiaries with a functional currency different to the Chilean peso, by approximately Ch$58,000 million.
- Increase in other financial assets by Ch$22,304 million primarily due to the guarantee deposit of Enersis for Swaps of Ch$18,712 million, and the pension funds surplus in Coelce by Ch$4,176 million.
- Increase in other assets by Ch$26,489 million due to more guaranties given in Ampla and Coelce in Brazil.
The above is partially offset by:
- Decrease in long term commercial receivables by Ch$70,848 million mainly due to the transfer to the short term of the Atacama Finance accounts receivables for Ch$45,940 million, and the decrease of Foninvemen by Ch$20,492 million due to the conversion effect.
- Decrease in long term financial assets available for sale by Ch$20,059 million, due to the transfer from the long-term to the short-term of EEB shares.
Pg. 18
| PRESS RELEASE | |
LIABILITIES AND SHAREHOLDERS EQUITY UNDER IFRS
| Table 8 | |||||||
| LIABILITIES AND SHAREHOLDER´S EQUITY | Million Ch$ | Thousand US$ | |||||
| 2007 | 2008 | 9M 09 | Var 08-09 | Chg % | 9M 09 | ||
| CURRENT LIABILITIES | |||||||
| Loans that acrue interests | 719,737 | 1,244,976 | 767,274 | (477,702) | (38.4%) | 1,394,131 | |
| Other financial liabilities | - | - | 421 | 421 | - | 764 | |
| Sundry Creditors and other Accounts payable | 794,038 | 982,939 | 930,092 | (52,847) | (5.4%) | 1,689,970 | |
| Accounts payable to related companies | 69,458 | 115,993 | 146,882 | 30,889 | 26.6% | 266,884 | |
| Provisions | 78,638 | 107,398 | 87,279 | (20,119) | (18.7%) | 158,585 | |
| Income taxes payable | 102,642 | 178,700 | 199,758 | 21,058 | 11.8% | 362,958 | |
| Other current liabilities | 20,733 | 30,457 | 20,219 | (10,238) | (33.6%) | 36,739 | |
| Defererd liabilities | 14,223 | 12,180 | 12,608 | 427 | 3.5% | 22,908 | |
| Employee Benefits | 14,474 | 5,211 | 4,916 | (294) | (5.7%) | 8,933 | |
| Liabilities from Hedge | 10,854 | 4,269 | 8,490 | 4,221 | 98.9% | 15,426 | |
| Accumulated Liabilities (or acrued), total | - | - | - | - | - | - | |
| Total current liabilities | 1,824,797 | 2,682,123 | 2,177,938 | (504,185) | (18.8%) | 3,957,297 | |
| NON-CURRENT LIABILITIES | |||||||
| Loans that acrue interests | 3,366,743 | 3,821,828 | 3,703,042 | (118,786) | (3.1%) | 6,728,399 | |
| Other non-current financial liabilities | 2,832 | 2,429 | 11,128 | 8,699 | 358.1% | 20,220 | |
| Sundry Creditors and other Accounts payable | 43,071 | 49,492 | 63,337 | 13,845 | 28.0% | 115,084 | |
| Accounts payable to related companies | 8,162 | 8,978 | 5,218 | (3,760) | (41.9%) | 9,480 | |
| Provisions | 200,023 | 212,383 | 246,518 | 34,135 | 0.0% | 447,921 | |
| Deferred income taxes | 589,953 | 641,378 | 596,668 | (44,710) | (0) | 1,084,142 | |
| Other long-term liabilities | 31,468 | 34,484 | 38,957 | 4,473 | 13.0% | 70,784 | |
| Defererd liabilities | 144,366 | 178,973 | 205,732 | 26,759 | 15.0% | 373,814 | |
| Employee Benefits | 135,274 | 175,783 | 198,008 | 22,226 | 12.6% | 359,779 | |
| Liabilities from Hedge | 213,419 | 104,053 | 192,781 | 88,728 | 85.3% | 350,281 | |
| Total long-term liabilities | 4,735,311 | 5,229,780 | 5,261,389 | 31,609 | 0.6% | 9,559,904 | |
| SHAREHOLDERS´ EQUITY | |||||||
| Paid-in capital | 2,752,775 | 2,983,642 | 2,983,642 | - | 0.0% | 5,421,256 | |
| Shares owned by the parent's company | - | - | - | - | - | - | |
| Other reserves | (723,745) | (1,403,037) | (1,358,802) | 44,235 | (3.2%) | (2,468,934) | |
| Retained earnings | 502,274 | 1,003,120 | 1,358,072 | 354,952 | 35.4% | 2,467,607 | |
| Net income for the period | 369,827 | 507,590 | 534,776 | 27,186 | 5.4% | 971,683 | |
| Total shareholder's equity aributable to the Parent's company | 2,901,131 | 3,091,315 | 3,517,688 | 426,373 | 13.8% | 6,391,613 | |
| Minority Interest | 2,604,433 | 2,937,816 | 3,164,165 | 226,349 | 7.7% | 5,749,265 | |
| Total shareholder´s equity | 5,505,564 | 6,029,131 | 6,681,854 | 652,722 | 10.8% | 12,140,878 | |
| TOTAL LIABILITIES AND SHAREHOLDER´S EQUITY | 12,065,673 | 13,941,034 | 14,121,180 | 180,146 | 1.3% | 25,658,079 | |
Pg. 19
| PRESS RELEASE | |
The company’sTotal Liabilitiesincreased by Ch$180,146 million from the period ended on December 2008, largely due to the increase in Net Equity by Ch$652,722 million and the decrease in current liabilities by Ch$472,575 million. The detail is explained as follows:
• Decrease inCurrent Liabilitiesof Ch$504,185 million, a 18.8%, due to:
- Accruing loans declining by Ch$477,702 million primarily in Endesa Chile for Ch$413,119 million, for the payment of bonds and the effect of a lower exchange rate and the decrease in the value of the UF, in Edegel for Ch$47,092 million for the payment of loans and bonds, in Emgesa for Ch$41,408 million, in Edelnor for Ch$20,165 million, Chilectra for Ch$12,026 million and Enersis for Ch$11,784 million, partially compensated by the increase in Gas Atacama for Ch$39,195 million for the transfer from long term debt and in Endesa Brazil by Ch$22,117 million.
- Reduction in trade creditors totalling Ch$52,847 million primarily due to the decrease energy and fuel purchase in Endesa Chile for Ch$63,744 million, Edegel for Ch$24,886 million, Costanera for Ch$18,188 million, Endesa Eco for Ch$14,364 million and Celta for Ch$8,385 million, the previous partially compensated by the increase of dividends payment to minority interest for Ch$41,905 million and the increase or accounts receivable in Cien for Ch$24,114 million and in Emgesa for Ch$16,056 million.
- Decrease in current provisions by Ch$20,119 million due to lower liabilities as a consequence of the conversion effect and contingencies payments (Endesa Chile).
Partially offset by:
- Increase in accounts receivable for current taxes for Ch$21,058 million which mainly corresponds to a higher tax.
•Non Current Liabilitiesincreased by Ch$31,609 million, equal to a 0.6%, mainly to:
- Increase in hedge liabilities in Ch$88,728 million, basically due to the increase in the Mark to Market of derivatives in Enersis for Ch$77,026 million.
- Increase in provisions for Ch$34,135 million principally in Brazil due to higher legal claims and the conversion effect.
- Increase in post employment obligations in Ch$22,225 million as a consequence of the increase in pension liabilities for Ch$21,202 million, Brazil and Colombia, and pensions and post retirement obligations for years of labor work by Ch$1,200 million.
Pg. 20
| PRESS RELEASE | |
The above is partially offset by:
- Decrease in loans who bear interest in Ch$118,786 million primarily in Endesa Chile for Ch$121,452 million, due to the effect of lower exchange rate and the UF, in Enersis for Ch$58,061 million, Gas Atacama for Ch$54,380 million, Codensa for Ch$47,377 million, du to the transfer of bonds to the short term and the conversion effect, Costanera for Ch$29,517 million and El Chocón for Ch$15,471 million, partially compensated by the increase in debt at Emgesa for Ch$178,184 due to loans in local currency, Grupo Endesa Brazil for Ch$37,203 million and in Edelnor for Ch$16,529 million basically by the conversion effect.
- Decrease of liabilities due to deffered taxes in Ch$44,710 million as a consequence of the conversion effect in foreign subsidiaries for Ch$28,546 million and higher deffered taxes in Codensa for Ch$10,802 million, Edelnor for Ch$8,556 million, Pangue for Ch$6,241 million, Edesur for Ch$ 4,475 million, San Isidro by Ch$3,771 million and in Celta for Ch$2,428 million, partially compensated by increases in Endesa Brazil for Ch$8,540 millions, Gas Atacama for Ch$6,926 million and Chilectra for Ch$2,873 million.
Net Shareholders’ equityincreased by Ch$652,722 million with respect to December 2008. The Parent Company equity increased by Ch$426,373 million which is explained mainly by the Ch$534,775 million period result, the increase of Retained Earnings in the amount of Ch$53,774 million, the increase of conversion reserve over investments and purchase appreciation in the amount of Ch$39,995 million, the decrease of other reserves by Ch$8,241 million, the decrease of the interim dividend accounting in 2008 for Ch$29,773 million and the accounting of the minimum dividend for 2009 by Ch$160,433 million.
The minorities participation increase in Ch$226,349 million, as a consequence of the conversion net effects, minimum dividend, coverage derivatives reserves and minorities net income.
Pg. 21
| PRESS RELEASE | |
DEBT MATURITY WITH THIRD PARTIES, MILLION CH$
| Table 9 | ||||||||||||||||
| TOTAL | ||||||||||||||||
| Million Ch$ | 2009 | 2010 | 2011 | 2012 | 2013 | 2014 | Balance | |||||||||
| Chile | 90,515 | 228,277 | 120,589 | 21,355 | 231,946 | 388,274 | 909,108 | 1,990,063 | ||||||||
| Enersis | 83,497 | 30,736 | 2,081 | 2,201 | 2,327 | 269,940 | 223,101 | 613,883 | ||||||||
| Chilectra | 405 | - | - | - | - | - | - | 405 | ||||||||
| Other (*) | 5,065 | 2,950 | 167 | - | 1,290 | - | - | 9,473 | ||||||||
| Endesa Chile (**) | 1,547 | 194,590 | 118,341 | 19,154 | 228,329 | 118,334 | 686,007 | 1,366,303 | ||||||||
| Argentina | 33,521 | 77,269 | 59,006 | 18,440 | 14,030 | 7,836 | - | 210,102 | ||||||||
| Edesur | 105 | 26,888 | 13,355 | 5,195 | 415 | 269 | - | 46,227 | ||||||||
| Costanera | 19,785 | 33,658 | 22,719 | 13,245 | 13,615 | 7,567 | - | 110,589 | ||||||||
| Chocon | 13,631 | 16,723 | 22,932 | - | - | - | - | 53,286 | ||||||||
| Hidroinvest | - | - | - | - | - | - | - | - | ||||||||
| CTM | - | - | - | - | - | - | - | - | ||||||||
| Tesa | - | - | - | - | - | - | - | - | ||||||||
| Peru | 10,550 | 44,440 | 68,499 | 101,618 | 53,356 | 52,152 | 96,808 | 427,422 | ||||||||
| Edelnor | 314 | 10,419 | 36,694 | 31,992 | 27,347 | 27,846 | 38,094 | 172,706 | ||||||||
| Edegel | 10,236 | 34,021 | 31,805 | 69,625 | 26,009 | 24,306 | 58,714 | 254,717 | ||||||||
| Brazil | 93,433 | 191,608 | 267,439 | 248,536 | 91,727 | 48,262 | 33,339 | 974,344 | ||||||||
| Endesa Brasil | 53,538 | - | - | - | - | - | - | 53,538 | ||||||||
| Coelce | 6,336 | 41,217 | 70,330 | 57,262 | 47,057 | 39,645 | 9,672 | 271,520 | ||||||||
| Ampla | 30,346 | 81,379 | 126,975 | 122,133 | 37,123 | 538 | 2,228 | 400,721 | ||||||||
| Cachoeira | - | - | - | - | - | - | - | - | ||||||||
| Cien | 1,336 | 63,703 | 63,546 | 62,089 | - | - | - | 190,674 | ||||||||
| Fortaleza | 1,877 | 5,310 | 6,589 | 7,051 | 7,547 | 8,079 | 21,439 | 57,893 | ||||||||
| Colombia | 101,307 | 161,220 | 101,153 | 95,176 | 45,238 | 110,048 | 397,541 | 1,011,683 | ||||||||
| Codensa | 11,239 | 93,785 | 56,196 | 9,475 | 45,238 | 70,245 | 132,482 | 418,659 | ||||||||
| Emgesa | 90,068 | 67,435 | 44,957 | 85,701 | - | 39,804 | 265,059 | 593,023 | ||||||||
| TOTAL | 329,325 | 702,814 | 616,685 | 485,125 | 436,297 | 606,573 | 1,436,797 | 4,613,614 | ||||||||
DEBT MATURITY WITH THIRD PARTIES, THOUSAND US$
| Table 9.1 | ||||||||||||||||
| TOTAL | ||||||||||||||||
| Thousand US$ | 2009 | 2010 | 2011 | 2012 | 2013 | 2014 | Balance | |||||||||
| Chile | 164,465 | 414,777 | 219,109 | 38,802 | 421,444 | 705,490 | 1,651,843 | 3,615,930 | ||||||||
| Enersis | 151,714 | 55,848 | 3,781 | 3,998 | 4,228 | 490,479 | 405,373 | 1,115,421 | ||||||||
| Chilectra | 735 | - | - | - | - | - | - | 735 | ||||||||
| Other (*) | 9,204 | 5,361 | 304 | - | 2,343 | - | - | 17,212 | ||||||||
| Endesa Chile (**) | 2,811 | 353,568 | 215,024 | 34,803 | 414,872 | 215,011 | 1,246,470 | 2,482,562 | ||||||||
| Argentina | 60,907 | 140,397 | 107,213 | 33,506 | 25,493 | 14,238 | - | 381,754 | ||||||||
| Edesur | 190 | 48,855 | 24,266 | 9,440 | 754 | 488 | - | 83,994 | ||||||||
| Costanera | 35,949 | 61,156 | 41,280 | 24,066 | 24,738 | 13,750 | - | 200,940 | ||||||||
| Chocon | 24,768 | 30,385 | 41,667 | - | - | - | - | 96,820 | ||||||||
| Hidroinvest | - | - | - | - | - | - | - | - | ||||||||
| CTM | - | - | - | - | - | - | - | - | ||||||||
| Tesa | - | - | - | - | - | - | - | - | ||||||||
| Peru | 19,169 | 80,747 | 124,462 | 184,638 | 96,947 | 94,760 | 175,899 | 776,623 | ||||||||
| Edelnor | 570 | 18,932 | 66,672 | 58,130 | 49,689 | 50,596 | 69,216 | 313,805 | ||||||||
| Edegel | 18,599 | 61,815 | 57,790 | 126,509 | 47,258 | 44,164 | 106,683 | 462,818 | ||||||||
| Brazil | 169,766 | 348,151 | 485,934 | 451,588 | 166,668 | 87,692 | 60,577 | 1,770,376 | ||||||||
| Endesa Brasil | 97,277 | - | - | - | - | - | - | 97,277 | ||||||||
| Coelce | 11,513 | 74,892 | 127,788 | 104,044 | 85,503 | 72,036 | 17,574 | 493,349 | ||||||||
| Ampla | 55,138 | 147,864 | 230,712 | 221,916 | 67,451 | 977 | 4,049 | 728,107 | ||||||||
| Cachoeira | - | - | - | - | - | - | - | - | ||||||||
| Cien | 2,428 | 115,747 | 115,462 | 112,816 | - | - | - | 346,452 | ||||||||
| Fortaleza | 3,410 | 9,648 | 11,972 | 12,812 | 13,713 | 14,680 | 38,955 | 105,191 | ||||||||
| Colombia | 184,074 | 292,936 | 183,793 | 172,934 | 82,197 | 199,957 | 722,329 | 1,838,220 | ||||||||
| Codensa | 20,421 | 170,407 | 102,107 | 17,215 | 82,197 | 127,634 | 240,718 | 760,701 | ||||||||
| Emgesa | 163,652 | 122,529 | 81,686 | 155,719 | - | 72,323 | 481,610 | 1,077,519 | ||||||||
| TOTAL | 598,381 | 1,277,008 | 1,120,512 | 881,468 | 792,748 | 1,102,138 | 2,610,649 | 8,382,903 | ||||||||
| (*) Includes: CAM (**) Includes: Endesa Chile, Pangue, Pehuenche, San Isidro, Celta and Túnel El Melón. | ||||||||||||||||
Pg. 22
| PRESS RELEASE | |
EVOLUTION OF KEY FINANCIAL RATIOS
| Table 10 | ||||||||||
| Indicator | Unit | 2008 | 9M 09 | Var 08-09 | Chg % | |||||
| Liquidity | Times | 1.09 | 1.40 | 0.31 | 28.4% | |||||
| Acid ratio test * | Times | 1.05 | 1.34 | 0.29 | 27.6% | |||||
| Working capital | million Ch$ | 243,306 | 862,691 | 619,385 | 254.6% | |||||
| Working capital | th. US$ | 442,084 | 1,567,503 | 1,125,418 | 254.6% | |||||
| Leverage ** | Times | 1.31 | 1.11 | (0.20) | (15.3%) | |||||
| Short-term debt | % | 33.9 | 29.3 | (4.62) | (13.6%) | |||||
| Long-term debt | % | 66.1 | 70.7 | 4.62 | 7.0% | |||||
| * Current assets net of inventories and pre-paid expenses ** Using the ratio = Total debt / (equity + minority interest) | ||||||||||
| Indicator | Unit | 9M 08 | 9M 09 | Var 08-09 | Chg % | |||||
| Financial Expense Coverage*** | Times | 3.87 | 5.45 | 1.58 | 40.7% | |||||
| Op.Income / Op.Rev. | % | 28.0 | 32.1 | 4.07 | 14.5% | |||||
| ROE | % | 16.0 | 20.3 | 4.28 | 26.8% | |||||
| ROA | % | 7.8 | 9.8 | 2.05 | 26.4% | |||||
| ***EBITDA/Interest Expenses | ||||||||||
Liquidity index as of September, 2009 was 1.40, an improvement of 0.31 or an equivalent of 28.4% compared to December, 2008. This shows a company that continually presents a strong liquidity position, maintaining its bank borrowings and financing its investments with its cash surpluses and having a satisfactory debt maturity pattern.
Leverage ratio was 1.11, reflecting a reduction of 0.20 regarding December, 2008.
Financial expense coverage increased 1.58 times or an equivalent 40.7%, going from 3.87 in September 2008 to 5.45 for the current period. The above is the result of a significant increase in EBITDA achieved by the company over the current period and to the stabilization of debt service costs, mainly due to a positive UF effect.
Operating Income over Operating Revenues profitability increased 14.5%, reaching a 32.1% in September, 2009.
The annualROE of the Parent Company increase from 16.0% to 20.3% in September, 2009. This increase is derived from higher results from the period despite an increase in Parent Company equity.
AnnualROA went from 7.8% as of September 2008 to 9.8% in September 2009, situation which also reflects the improved current period result, together with a decline in assets.
Pg. 23
| PRESS RELEASE | |
CONSOLIDATED STATEMENTS OF CASH FLOWS ANALYSIS
UNDER IFRS
| Table 11 | ||||||
| CASH FLOW | Million Ch$ | Thousand US$ | ||||
| 9M 08 | 9M 09 | Var 08-09 | Chg % | 9M09 | ||
| CASH FLOWS PROVIDED BY OPERATING ACTIVITIES | ||||||
| Net income (loss) for the year | 750,945 | 1,041,897 | 290,952 | 38.7% | 1,893,119 | |
| Adjustments to reconcile with the gain (loss) of the operations, total | 518,747 | 457,333 | (61,414) | (11.8%) | 830,971 | |
| Net cash from operating activities before non monetary adjustment | 1,269,691 | 1,499,230 | 229,539 | 18.1% | 2,724,090 | |
| Depreciation | 307,495 | 321,244 | 13,749 | 4.5% | 583,698 | |
| Amortization of intangibles | 6,590 | 10,044 | 3,454 | 52.4% | 18,250 | |
| Foreign Exchange losses | (1,857) | 23,611 | 25,468 | - | 42,900 | |
| Gain (loss) for decrease in the non current assets account not available for sale | (6,614) | (393) | 6,221 | 94.1% | (714) | |
| Participation in Gain (loss) of Investments | 254 | 251 | (3) | (1.4%) | 456 | |
| Provisions | 27,305 | 46,837 | 19,532 | 71.5% | 85,102 | |
| Reversal of not used provision | (2,541) | (10,075) | (7,534) | - | (18,306) | |
| Provisions used | (19,566) | (19,920) | (354) | (1.8%) | (36,195) | |
| Increase (decrease) on assets for deferred taxes | (11,014) | 6,669 | 17,683 | 160.6% | 12,118 | |
| Increase (decrease) on liabilities for deferred taxes | (2,639) | (8,911) | (6,272) | - | (16,191) | |
| Other non monetary adjustments | (248) | (13,082) | (12,834) | - | (23,769) | |
| Total Non monetary adjustments: | 297,164 | 356,274 | 59,110 | 19.9% | 647,348 | |
| Net cash from operating activities before changes in working capital | 1,566,856 | 1,855,505 | 288,649 | 18.4% | 3,371,438 | |
| Increase (decrease) in inventory | (123) | (6,054) | (5,931) | - | (10,999) | |
| Increase (decrease) in sundry debtors and other accounts receivable | (62,243) | (2,841) | 59,402 | 95.4% | (5,162) | |
| Increase (decrease) in prepaid expenses | 794 | (2,450) | (3,244) | - | (4,452) | |
| Decrease (increase) in other assets | 60,565 | 129,166 | 68,601 | 113.3% | 234,694 | |
| Increase (decrease) in sundry creditors and other accounts payable | (11,808) | (200,355) | (188,547) | - | (364,043) | |
| Increase (decrease) on deferred income | 22,496 | 7,221 | (15,275) | (67.9%) | 13,121 | |
| Increase (decrease) on acruances | (2,886) | (5,302) | (2,416) | (83.8%) | (9,634) | |
| Decreased (increase) in income tax payable | (181,144) | (297,402) | (116,258) | (64.2%) | (540,377) | |
| Decreased (increase) in employee benefits | 29,478 | 11,079 | (18,399) | (62.4%) | 20,131 | |
| Decreased (increase) in other disbursements | (5,232) | 12,419 | 17,651 | - | 22,565 | |
| Changes in working capital | (150,104) | (354,518) | (204,414) | (136.2%) | (644,156) | |
| Payments of Dividends classified as operational | (4,350) | (12,516) | (8,166) | (187.8%) | (22,742) | |
| Interest received | 4,158 | 1,421 | (2,737) | (65.8%) | 2,581 | |
| Interest paid | (34,983) | (27,127) | 7,856 | 22.5% | (49,290) | |
| Income taxes received | 3,263 | 195 | (3,068) | (94.0%) | 354 | |
| Income taxes paid | (20,274) | (44,551) | (24,277) | (119.7%) | (80,949) | |
| Other gains (losses) from other operating activities | (659) | (467) | 192 | 29.1% | (849) | |
| Cash generated by the operating activities | (52,844) | (83,046) | (30,202) | (57.2%) | (150,895) | |
| NET CASH FLOW FROM OPERATING ACTIVITIES | 1,363,908 | 1,417,941 | 54,033 | 4.0% | 2,576,387 | |
Pg. 24
| PRESS RELEASE | |
UNDER IFRS
| Cont. Table 11 | ||||||
| NET CASH FLOW FROM OPERATING ACTIVITIES | 1,363,908 | 1,417,941 | 54,033 | 4.0% | 2,576,387 | |
| CASH FLOWS PROVIDED BY INVESTING ACTIVITIES | - | |||||
| Proceeds from the sale of plant and equipment | 7,872 | 13,918 | 6,046 | 76.8% | 25,290 | |
| Proceeds from the sale of intangible assets | - | 756 | 756 | - | 1,374 | |
| Proceeds from the sale of other financial assets | 7,731 | - | (7,731) | (100.0%) | - | |
| Other cash flows from investment activities | 100,520 | 17,559 | (82,961) | (82.5%) | 31,905 | |
| Dividends received | 2,298 | 2,672 | 374 | 16.3% | 4,855 | |
| Interest received | 1,127 | 2,444 | 1,317 | 116.9% | 4,440 | |
| Acquisition of property, plant and equipment | (515,568) | (495,446) | 20,122 | 3.9% | (900,221) | |
| Payments for the acquisition of property, plant and equipment | (203) | (92) | 111 | 54.8% | (167) | |
| Acquisition of pintangible assets | (5,351) | (4,557) | 794 | 14.8% | (8,279) | |
| Payments for the acquisition of associates | - | (23,744) | (23,744) | - | (43,143) | |
| Provided loans to related companies | (27,299) | (6,285) | 21,014 | 77.0% | (11,421) | |
| Other cash flows from investing activities | (3,639) | (22,110) | (18,471) | - | (40,174) | |
| NET CASH FLOW FROM INVESTING ACTIVITIES | (432,513) | (514,884) | (82,025) | (19.0%) | (935,541) | |
| CASH FLOWS PROVIDED BY FINANCING ACTIVITIES | - | |||||
| Proceeds from the issuance of equity | - | - | - | - | - | |
| Proceeds from loans | 765,529 | 519,458 | (246,071) | (32.1%) | 943,851 | |
| Proceeds from the issue of other financial liabilities | 9,221 | 155,184 | 145,963 | - | 281,968 | |
| Proceeds from other financial sources | 19,973 | 21,310 | 1,337 | 6.7% | 38,720 | |
| Repayment/ drawing of borrowings | (665,279) | (635,373) | 29,906 | 4.5% | (1,154,468) | |
| Repayment/ drawing of other financial liabilitites | (259,793) | (355,885) | (96,092) | (37.0%) | (646,640) | |
| Repayment of finance lease liabilities | (5,253) | (2,928) | 2,325 | 44.3% | (5,320) | |
| Loans repayments to related companies | (1,515) | (1,475) | 40 | 2.6% | (2,681) | |
| Interest paid classified as financial | (196,184) | (162,844) | 33,340 | 17.0% | (295,887) | |
| Dividends paid | (293,174) | (331,902) | (38,728) | (13.2%) | (603,064) | |
| Other cash flows from financing activities | (94,779) | (26,248) | 68,531 | 72.3% | (47,693) | |
| NET CASH FLOW FROM FINANCING ACTIVITIES | (721,253) | (820,704) | 99,451 | (13.8%) | (1,491,214) | |
| Net increase (decrease) in cash and cash equivalents | 210,142 | 82,352 | (127,790) | (60.8%) | 149,633 | |
| Effects of exchange rate fluctuations on cash held | (13,007) | (70,751) | (57,744) | - | (128,555) | |
| Effects of consolidation adjustments on cash held | - | - | - | - | - | |
| Cash and cash equivalents at begining of period | 588,877 | 1,318,062 | 729,185 | 123.8% | 2,394,908 | |
| Cash and cash equivalents at end of period | 786,012 | 1,329,662 | 543,650 | 69.2% | 2,415,986 | |
The company generated a positive cash flow of Ch$82,352 million for the period, which can be broken down as follows:
Operating activities generated a positive net cash flow of Ch$1,417,941 million that represents an increase of 4.0% regarding last year’s. This cash flow is composed primarily with net income of the period for Ch$1,041,897 million, adjustments to reconcile the operating flow for Ch$457,333 million, adjustments that do not affect the cash flow for Ch$356,274 million mainly for fixed asset depreciation, the decrease in working capital for Ch$354,517 million and the utilization of flows in other operating activities for Ch$83,046 million.
Investment activitiesgenerated a net negative cash flow of Ch$514,884 million, that compared to the same period of the preceding year represents a decrease of 19.0% or Ch$ 82,371 million. This outflame corresponds primarily to the incorporation of fixed assets and intangibles for Ch$500,094 million, investments in related companies for Ch$23,744 million, other disposal in investments for Ch$22,110 million and payments to other companies for Ch$6,285 million, the above offset by investments related flows for Ch$22,675 million and fixed assets and intangible sales for Ch$14,674 million.
Financing activities originated a negative cash flow of Ch$820,704 million, due to loans payments for Ch$635.373 million, dividends payments for $331,902 million, interest payments for Ch$162,844 million and other financing disposal for Ch$386,537 million. The previous was partially compensated for new loans for Ch$519,458 million and bonds issuance for Ch$155,184 million and other sources of financing for $21,309 million.
Pg. 25
| PRESS RELEASE | |
CASH FLOW RECEIVED FROM FOREIGN SUBSIDIARIES BY ENERSIS, CHILECTRA AND ENDESA CHILE
| Table 13 | ||||||||||||||||||
| Interest Received | Dividends Received | Total Cash Received | ||||||||||||||||
| Millions Ch$ | Thousand US$ | Millions Ch$ | Thousand US$ | Millions Ch$ | Thousand US$ | |||||||||||||
| 9M 08 | 9M 09 | 9M 09 | 9M 08 | 9M 09 | 9M 09 | 9M 08 | 9M 09 | 9M 09 | ||||||||||
| Argentina | 585 | 594 | 1,080 | 184 | 4,480 | 8,140 | 769 | 5,074 | 9,220 | |||||||||
| Peru | - | - | - | 8,055 | 12,646 | 22,978 | 8,055 | 12,646 | 22,978 | |||||||||
| Brazil | - | 6,529 | 11,864 | 29,729 | 16,851 | 30,619 | 29,729 | 23,381 | 42,483 | |||||||||
| Colombia | - | - | - | 30,074 | 34,509 | 62,703 | 30,074 | 34,509 | 62,703 | |||||||||
| Chile | - | - | - | - | - | - | - | |||||||||||
| Total | 585 | 7,124 | 12,944 | 68,043 | 68,487 | 124,440 | 68,627 | 75,611 | 137,384 | |||||||||
| Source: Internal Financial Report | ||||||||||||||||||
CAPEX AND DEPRECIATION
| Table 14 | |||||||||||
| Payments for Additions of Fixed assets | Depreciation | ||||||||||
| Million Ch$ | Thousand US$ | Million Ch$ | Thousand US$ | ||||||||
| Million Ch$ | 9M 08 | 9M 09 | 9M 09 | 9M 08 | 9M 09 | 9M 09 | |||||
| Endesa Chile | 181,956 | 234,599 | 426,264 | 142,122 | 144,052 | 261,741 | |||||
| Cachoeira (*) | - | 814 | 1,479 | 5,210 | 5,086 | 9,241 | |||||
| Endesa Fortaleza (**) | 844 | - | - | 5,492 | 5,627 | 10,224 | |||||
| Cien (**) | 0 | - | - | 10,653 | 12,985 | 23,594 | |||||
| Chilectra S.A. | 43,982 | 16,571 | 30,110 | 15,016 | 14,886 | 27,047 | |||||
| Edesur S.A. | 46,572 | 41,229 | 74,913 | 12,105 | 12,251 | 22,260 | |||||
| Edelnor S.A. | 23,189 | 26,194 | 47,595 | 13,750 | 14,888 | 27,052 | |||||
| Ampla | 77,353 | 71,493 | 129,902 | 33,851 | 36,492 | 66,306 | |||||
| Coelce | 98,232 | 60,900 | 110,654 | 26,507 | 30,239 | 54,944 | |||||
| Codensa S.A. | 36,993 | 38,314 | 69,616 | 38,393 | 40,441 | 73,480 | |||||
| Cam Ltda. | 1,618 | 2,019 | 3,669 | 1,363 | 1,349 | 2,452 | |||||
| Inmobiliaria Manso de Velasco Ltda. | 1,400 | 675 | 1,227 | 188 | 184 | 334 | |||||
| Synapsis Soluciones y Servicios Ltda. | 2,283 | 2,108 | 3,831 | 2,008 | 1,911 | 3,471 | |||||
| Holding Enersis y sociedades de Inversión | 1,146 | 529 | (1,111) | 839 | 853 | 1,550 | |||||
| Total | 515,568 | 495,446 | 898,149 | 307,495 | 321,244 | 583,698 | |||||
| (*) Consolidated by Enersis through Endesa Brasil since October 1st, 2005. | |||||||||||
Pg. 26
| PRESS RELEASE | |
THE PRINCIPAL RISKS ASSOCIATED TO THE ACTIVITIES OF THE ENERSIS GROUP
The Group’s activities are subject to a broad range of governmental standards, and any modification of such standards may affect the Group’s activities, economic situation and operating results.
The Group’s operating subsidiaries are subject to a broad range of rules regarding tariffs and other issues that govern their activities, both in Chile and other countries in which we operate. As a result, the introduction of new laws and regulations, such as amendments to current laws and standards, could impact our activities, economic situation and operating results.
On occasions, these new laws and standards modify aspects of the regulations that can affect existing rights which, in such event, could have adverse effects on future Group accounts.
The Group’s activities are subject to broad environmental regulations that Enersis has complied permanently. Eventual modifications to these issues could affect activities, the economic situation and operating results.
Enersis and its operating subsidiaries are subject to environmental standards that, among others, require that environmental impact studies should be carried out regarding future projects, together with the acquisition of licenses, permits and other mandatory approvals as well as compliance with all the requirements provided for in such licenses, permits and standards. As with any other regulated company, Enersis cannot guarantee:
- - That the public authorities will approve such environmental impact studies;
- - That public opposition will not lead to delays and modifications of any submitted project;
- - That the laws and standards will not be amended or interpreted in such a way that could increase compliance expense or that operation, plants and plans of the companies in which the Group participates are affected.
The Group’s commercial policies have been planned so that eventual impacts arising from changes in hydrological conditions are reduced.
The Enersis Group’s operations include hydroelectric generation and therefore depend at all times on the existing hydrological conditions in the broad geographic zones in which the Group’s hydroelectric generating plants are located. If hydrological conditions produce drought or other conditions that negatively influence, the results of these hydroelectric generation activities, results could be adversely impacted. Thus Enersis has decided, as part of its commercial policy, not to commit its total capacity. Moreover, the electricity business has been impacted by atmospheric conditions that could condition consumption. Depending on the weather conditions, differences in the business margins can occur.
The financial situation and operating results can be impacted adversely if exposure to risks such as interest rates, the price of commodities and the exchange rate are not managed efficiently.
Pg. 27
| PRESS RELEASE | |
Interest Rate Risk
Interest rate variations modify the reasonable value of those assets and liabilities that accrue a fixed interest rate, as well as the future flow of assets and liabilities pegged to a variable interest rate.
The purpose of interest rate exposure management is to achieve an adequate balance in debt structures, thereby minimizing debt costs with reduced volatility on financial results.
Consistent with current interest rate hedging policy, the portion of fixed and/or secured debt rate over the total net debt was 39% as of September, 2009.
Depending on the Group’s forecasts and debt structure objectives, hedging transactions take place through contracted derivatives that mitigate these risks. The instruments currently used to comply with this policy are collars, that ensure the Libor rate within a specific band, or simply interest rate swaps that from variable to fixed rates.
The Enersis Group’s financial debt structure according to fixed, secured or variable rate, after contracted derivatives, is the following:
Net position:
| 12/31/2008 | 09/30/2009 | |||
| Fixed interest rate | 46% | 36% | ||
| Protected interest rate | 3% | 3% | ||
| Variable interest rate | 51% | 61% | ||
| Total | 100% | 100% |
Exchange rate risks:
The exchange rate risks are mainly related to the following transactions:
- - Foreign currency debts contracted by Group’s companies.
- - Payments made on international markets for the acquisition of projects related materials.
- - Group companies incomes directly linked to the evolution of the dollar.
- - Cash flows from subsidiary companies to headquarters in Chile are exposed to exchange rate fluctuations.
In order to mitigate exchange rate risks, the Enersis Group’s exchange rate hedging policy is based on cash flows and it strives to maintain a balance between the flows indexed to United States dollar and the asset and liability levels in such currency.
Currency swaps and exchange rate forwards are the instruments currently used in compliance with this policy. Likewise, the policy strives to refinance debts in each company’s functional currency.
Pg. 28
| PRESS RELEASE | |
Commodities Risks:
The Enersis Group is exposed to price fluctuation risks on some commodities, basically through:
- - Fuel purchases for the electrical power generating process.
- - Energy buying-selling transactions on local markets.
The Company has not executed commodity derivates transactions aimed to managing fuel fluctuations. However, the Company is always analyzing and verifying the convenience of this kind of hedges, so we cannot discard this kind of transactions can be performed in the future.
With the objective of reducing risks in extreme drought situations, the company has designed a trading policy that defines sales commitment levels consistent with its generating plants’ sound energy capacity in a dry year and includes risk mitigation clauses in some contracts with non regulated clients.
Liquidity Risks:
In engaging committed long term borrowing facilities and short term financial investments the Group maintains a consistent liquidity policy, for the adequate amounts required to support projected needs for the period, contingent with the situation and the expectations of the debt and equity markets.
The aforementioned projected needs include net financial debt maturities that are after including financial derivatives. For further detail on the characteristics and conditions of these financial derivatives, see note 19 to the Consolidated Financial Statements.
As of September, 2009, the Enersis Group held liquidity in the amount of Ch$ 1,329,662 million in cash and cash equivalent and Ch$110,072 million in available credit lines. As of December 31, 2008, the Group’s liquidity totaling was Ch$1,318,062 million in cash and cash equivalent and Ch$ 127,290 million in available credit lines.
Credit Risks
Given the current economic climate, the Group has been carefully following the credit risk standing.
- - Trade Accounts Receivable:
Credit risk in accounts receivable, originating from trading activities, is historically very limited given that the short collection term conditions to customer doesn’t allows them to individually accumulate significant amounts. Additionally, in the case of the so called “unregulated clients” of our electricity generation and distribution business, a formal procedure is applied to control the credit risk, using a systematic evaluation of our counterparties, index definition and credit risk factors by virtue of which the contracts are approved or additional guarantee demands are defined.
Furthermore, in our electricity generating business line, in the event of non-payment, some countries allow power supply cut-offs, and in almost all contracts such lack of payment is established as cause for contract termination. To this end, credit risks are constantly monitored and the maximum amounts exposed to payment risks are measured, which, as has been said, are limited.
Pg. 29
| PRESS RELEASE | |
In turn, in our electricity distribution business line, the energy supply cut-off is, in all cases, a power held by our companies when faced with default by our customers, applied in accordance with the regulation in force in each country, enabling the credit risk evaluation and control process, which in fact is also limited.
- - Financial Assets:
Surplus cash flow investments are placed in prime national and foreign financial entities (with an investment grade equivalent risk rating) with established limits set for each entity (not more than 30% per entity).
In the selection of banks for investment, consideration is given to those that hold two investment grade classifications, considering the three main international risk agencies (Moody’s, S&P and Fitch).
Positions are backed up by treasury bonds from the country of operations and instruments issued by the most reputable banks, favoring, wherever possible, the first ones.
Derivatives are engaged through highly solvent entities such that about 90% of operations are carried out with entities that hold an A or higher rating.
Risk Measurement
The Enersis Group measures the Value at Risk of its debt and financial derivatives positions with a view to guaranteeing that the risk taken by the company remains consistent with the risk exposure defined by Management, thus restricting the volatility of its financial results.
The positions portfolio used in the calculations of the current Value at Risk is comprised of:
- - Debt
- - Financial Derivatives
The calculated Value at Risk represents the possible value loss of the aforementioned positions portfolio over one day time horizon with 95% probability. To this end the volatility of the risk variables that affect the value of the positions portfolio has been studied, including:
- - The U.S. dollar Libor interest rate.
- - The usual banking local indexes for debts, and taking into account the different currencies our companies operate under.
- - The exchange rates of the different currencies involved in the calculation.
The Value at Risk calculation, using the Montecarlo methods, is based on generating possible future scenarios (on a one-day time horizon) of the risk variables of the market values (both spot and timed). The number of scenarios generated ensures observance of the simulation’s convergence criteria. In the simulated scenarios of future prices the volatilities matrix and the correlations between the different risk variables calculated on historic price logarithmic returns are applied.
Pg. 30
| PRESS RELEASE | |
Once the price scenarios have been generated, the portfolio’s reasonable value is calculated for each one of the scenarios, generating an allotment of possible one-day values. The one-day Risk Value, calculated with a 95% of confidence, is rated as a 5% percentile of the possible increases of the portfolio’s reasonable value for one day.
The valuation of the diverse debt and financial derivative positions in the calculation has been consistent with the economic equity calculation method reported to Management.
In view of the aforementioned hypothesis, the Value at Risk of the positions mentioned above, broken down by type of position, is detailed in the following table:
| Financial positions: | 31/12/2008 | 30/09/2009 | ||
| Th Ch$ | Th Ch$ | |||
| Interest rates | 23,540,519 | 25,278,706 | ||
| Exchange rates | 4,895,885 | 3,428,717 | ||
| Correlations | (5,437,842) | (9,071,962) | ||
| Total | 22,998,562 | 19,635,461 |
Value at Risk positions have evolved during the 1st semester of 2009, as a function of the expiration/initiation of operations throughout the period.
Other Risks
A portion of Enersis and Endesa Chile’s debt is subject to cross default provisions. If certain defaults in debt of certain specific subsidiaries are not remedied within specified grace periods, a cross default could affect Endesa Chile and Enersis, and under certain scenarios, debts at the holding company level could be accelerated.
Nonpayment – after any applicable grace period – of the debts of Enersis and Endesa Chile, or their so-called Relevant Subsidiaries, with an individual principal amount outstanding in excess of US$ 50 million dollars (or its equivalent in other currencies), and with a missed payment also in excess of US$ 50 million dollars, could give rise to a cross default of several bank revolving debt facilities at the Endesa Chile and Enersis levels. Furthermore, some of these debt facilities are also subject to cross acceleration provisions in the event of a default in other Relevant Subsidiary debt, for reasons other than payment default, for events such as bankruptcy, insolvency proceedings, and materially adverse governmental or legal actions, in all cases for amounts in excess of US$ 50 million dollars.
Similarly, nonpayment – after any given applicable grace period - of the debts of these companies or any of their Chilean subsidiaries, in single indebtedness in default with a principal in excess of US$ 30 million dollars, could potentially give rise to a cross default of Enersis and Endesa Chile Yankee bonds.
There are no clauses in the credit agreements by which changes in the corporate or debt classification of these companies from risk classification agencies could trigger prepayments. Nevertheless, a modification in the Standard & Poor’s (S&P) debt risk classification in foreign currency could trigger a change in the margin applicable to determine the interest rate, in the credit loans issued in 2004 and 2006.
Pg. 31
| PRESS RELEASE | |
BOOK VALUE AND ECONOMIC VALUE OF ASSETS
Regarding the more important assets, the following should be mentioned:
Properties, Plants and Equipment are valued at their purchase cost, net of the corresponding accumulated depreciation and impairment loss they have been subject to. Properties, Plants and Equipment, net of their residual value, if applicable, are depreciated by linearly distributing the cost of their different elements along the estimated years of useful life, which is the period that the companies expect to use them. The useful life is reviewed regularly.
The capital gain (lower investments or goodwill value) generated by consolidation represents the acquisition cost surplus on the Group’s share in terms of the reasonable value of assets and liabilities, including the identifiable contingent liabilities of a Subsidiary at the time of acquisition. Capital gain is not amortized, rather at the closing of each accounting period an assessment is made of whether any impairment has occurred during the period that could reduce its recoverable value to an amount below the registered net cost, proceeding in this event to make a timely impairment adjustment (See Note 3.d to the Consolidated Financial Statements).
Throughout the fiscal year and in particular at the date of closing, an assessment is made as to any indication of possible loss due to the impairment of any asset. In the event of any such indication, an estimate of the recoverable sum of said asset is made to determine, if applicable, the depreciated amount. If this involves identifiable assets that do not originate independent cash flows, the recoverability of the Cash Generating Unit that the asset belongs to is estimated, understanding as such the smaller Group of identifiable assets that generate independent cash incomes. As a result of this assessment, it has been determined that there is no impairment associated to businesses acquired, with the exception of the investment of our joint subsidiary Gas Atacama Holding Ltda., whose proof of depreciation determined that during 2007 the value recovered from said investment was in fact lower than its book value, thereby making provision for such.
Assets expressed in foreign currency are submitted at the prevalent exchange rate at the closing of the period.
Notes and accounts receivable from related companies are classified according to their short and long term maturities. These operations are adjusted according to prevalent market equity conditions.
In summary, assets are valued according to the International Financial Reporting Standards, whose criteria are expressed in Note 3 of the Consolidated Financial Statements.
Pg. 32
| PRESS RELEASE | |

ARGENTINA
GENERATION
ENDESA COSTANERA
Operating Income decrease mainly due to higher operating costs explained by higher fuel costs, partially offset by higher energy sales.
| Table 15 | |||||||||
| Endesa Costanera | Million Ch$ | Thousand US$ | |||||||
| 9M 08 | 9M 09 | Var 08-09 | Chg % | 9M 09 | |||||
| Operating Revenues | 189,711 | 201,586 | 11,875 | 6.3% | 366,280 | ||||
| Operating Costs | (151,758) | (169,174) | (17,416) | (11.5%) | (307,387) | ||||
| Gross Profit | 37,953 | 32,412 | (5,541) | (14.6%) | 58,892 | ||||
| Other Costs | (10,246) | (13,513) | (3,267) | (31.9%) | (24,552) | ||||
| Gross Operating Income (EBITDA) | 27,707 | 18,899 | (8,808) | (31.8%) | 34,340 | ||||
| Depreciation and Amortization | (12,222) | (14,477) | (2,256) | (18.5%) | (26,305) | ||||
| Operating Income | 15,486 | 4,422 | (11,064) | (71.4%) | 8,035 | ||||
| Figures may differ from those accounted under Argentine GAAP. | |||||||||
Additional Information
| Table 16 | ||||||||
| Endesa Costanera | 9M 08 | 9M 09 | Var 08-09 | Chg % | ||||
| GWh Produced | 6.245 | 6.715 | 470 | 7,5% | ||||
| GWh Sold | 6.246 | 6.745 | 499 | 8,0% | ||||
| Market Share | 7,9% | 8,6% | - | 9,3% | ||||
Pg. 33
| PRESS RELEASE | |
EL CHOCÓN
Operating Income increase due to improved dam levels providing better water availability increasing GWh sold.
| Table 17 | |||||||||
| El Chocón | Million Ch$ | Thousand US$ | |||||||
| 9M 08 | 9M 09 | Var 08-09 | Chg % | 9M 09 | |||||
| Operating Revenues | 27,999 | 47,810 | 19,811 | 70.8% | 86,870 | ||||
| Operating Costs | (12,833) | (13,726) | (893) | (7.0%) | (24,939) | ||||
| Gross Profit | 15,166 | 34,084 | 18,918 | 124.7% | 61,931 | ||||
| Other Costs | (2,789) | (3,840) | (1,051) | (37.7%) | (6,977) | ||||
| Gross Operating Income (EBITDA) | 12,377 | 30,244 | 17,868 | 144.4% | 54,954 | ||||
| Depreciation and Amortization | (2,420) | (2,604) | (184) | (7.6%) | (4,732) | ||||
| Operating Expenses | (18,042) | (20,170) | (2,128) | (11.8%) | (36,648) | ||||
| Operating Income | 9,957 | 27,640 | 17,683 | 177.6% | 50,222 | ||||
| Figures may differ from those accounted under Argentine GAAP. | |||||||||
Additional Information
| Table 18 | ||||||||
| El Chocón | 9M 08 | 9M 09 | Var 08-09 | Chg % | ||||
| GWh Produced | 1.107 | 2.628 | 1.520 | 137,3% | ||||
| GWh Sold | 1.652 | 2.904 | 1.252 | 75,8% | ||||
| Market Share | 2,1% | 3,7% | - | 78,0% | ||||
Pg. 34
| PRESS RELEASE | |
DISTRIBUTION
EDESUR
Operating income increased mainly due to higher average sale prices as a consequence of tariffs adjustments applied in July 2008.
| Table 19 | |||||||||
| Edesur | Million Ch$ | Thousand US$ | |||||||
| 9M 08 | 9M 09 | Var 08-09 | Chg % | 9M 09 | |||||
| Operating Revenues | 223,526 | 252,188 | 28,662 | 12.8% | 458,223 | ||||
| Operating Costs | (109,979) | (120,257) | (10,278) | (9.3%) | (218,506) | ||||
| Gross Profit | 113,546 | 131,931 | 18,384 | 16.2% | 239,717 | ||||
| Other Costs | (72,396) | (88,019) | (15,624) | (21.6%) | (159,931) | ||||
| Gross Operating Income (EBITDA) | 41,151 | 43,911 | 2,761 | 6.7% | 79,787 | ||||
| Depreciation and Amortization | (12,105) | (12,638) | (534) | (4.4%) | (22,964) | ||||
| Operating Income | 29,046 | 31,273 | 2,227 | 7.7% | 56,823 | ||||
| Figures may differ from those accounted under Argentine GAAP. | |||||||||
Additional Information
| Table 20 | ||||||||
| Edesur | 9M 08 | 9M 09 | Var 08-09 | Chg % | ||||
| Customers (Th) | 2,253 | 2,288 | 36 | 1.6% | ||||
| GWh Sold | 12,148 | 12,099 | (49) | (0.4%) | ||||
| Clients/Employee | 861 | 862 | 2 | 0.2% | ||||
| Energy Losses % | 10.6% | 10.5% | (0.1%) | (0.9%) | ||||
Pg. 35
| PRESS RELEASE | |

BRAZIL
GENERATION
CACHOEIRA
Operating Income decreased due to lower market sales prices mainly explained by better hydrological conditions in Brazil compared to higher prices in 2008.
| Table 21 | |||||||||
| Cachoeira | Million Ch$ | Thousand US$ | |||||||
| 9M 08 | 9M 09 | Var 08-09 | Chg % | 9M 09 | |||||
| Operating Revenues | 114,758 | 64,691 | (50,067) | (43.6%) | 117,543 | ||||
| Operating Costs | (20,935) | (17,263) | 3,673 | 17.5% | (31,366) | ||||
| Gross Profit | 93,822 | 47,429 | (46,394) | (49.4%) | 86,177 | ||||
| Other Costs | (4,349) | (4,859) | (510) | (11.7%) | (8,829) | ||||
| Gross Operating Income (EBITDA) | 89,473 | 42,570 | (46,904) | (52.4%) | 77,349 | ||||
| Depreciation and Amortization | (5,250) | (5,112) | 138 | 2.6% | (9,288) | ||||
| Operating Income | 84,224 | 37,458 | (46,766) | (55.5%) | 68,061 | ||||
| Figures may differ from those accounted under Brazilian GAAP. | |||||||||
Additional Information
| Table 22 | ||||||||
| Cachoeira | 9M 08 | 9M 09 | Var 08-09 | Chg % | ||||
| GWh Produced | 2,616 | 2,194 | (423) | (16.2%) | ||||
| GWh Sold | 3,154 | 2,769 | (385) | (12.2%) | ||||
| Market Share | 1.0% | 1.0% | - | (5.0%) | ||||
FORTALEZA (CGTF)
Operating Income increased mainly due to lower energy purchased costs, as a consequence of lower market prices.
| Table 23 | |||||||||
| Fortaleza | Million Ch$ | Thousand US$ | |||||||
| 9M 08 | 9M 09 | Var 08-09 | Chg % | 9M 09 | |||||
| Operating Revenues | 84,749 | 100,079 | 15,330 | 18.1% | 181,843 | ||||
| Operating Costs | (53,066) | (51,578) | 1,489 | 2.8% | (93,717) | ||||
| Gross Profit | 31,682 | 48,501 | 16,819 | 53.1% | 88,126 | ||||
| Other Costs | (5,635) | (6,817) | (1,182) | (21.0%) | (12,387) | ||||
| Gross Operating Income (EBITDA) | 26,047 | 41,684 | 15,637 | 60.0% | 75,739 | ||||
| Depreciation and Amortization | (5,492) | (5,627) | (135) | (2.5%) | (10,224) | ||||
| Operating Income | 20,555 | 36,057 | 15,502 | 75.4% | 65,515 | ||||
| Figures may differ from those accounted under Brazilian GAAP. | |||||||||
Pg. 36
| PRESS RELEASE | |
Additional Information
| Table 24 | ||||||||
| Fortaleza | 9M 08 | 9M 09 | Var 08-09 | Chg % | ||||
| GWh Produced | 72 | 251 | 178 | 245.7% | ||||
| GWh Sold | 2,014 | 2,329 | 315 | 15.6% | ||||
| Market Share | 0.7% | 0.8% | - | 17.8% | ||||
TRANSMISSION
CIEN
Operating Income increased mainly due to contracts sign to export energy to Uruguay and Argentina, initiating this activity in February, compared to the previous year when exports to Argentina only started in April.
| Table 25 | |||||||||
| Cien | Million Ch$ | Thousand US$ | |||||||
| 9M 08 | 9M 09 | Var 08-09 | Chg % | 9M 09 | |||||
| Operating Revenues | 52,213 | 84,192 | 31,980 | 61.2% | 152,977 | ||||
| Operating Costs | (1,997) | (1,522) | 475 | 23.8% | (2,766) | ||||
| Gross Profit | 50,215 | 82,670 | 32,454 | 64.6% | 150,211 | ||||
| Other Costs | (6,712) | (7,095) | (382) | (5.7%) | (12,891) | ||||
| Gross Operating Income (EBITDA) | 43,503 | 75,575 | 32,072 | 73.7% | 137,320 | ||||
| Depreciation and Amortization | (10,671) | (13,014) | (2,343) | (22.0%) | (23,647) | ||||
| Operating Income | 32,832 | 62,561 | 29,729 | 90.5% | 113,673 | ||||
| Figures may differ from those accounted under Brazilian GAAP. | |||||||||
Pg. 37
| PRESS RELEASE | |
Additional Information
DISTRIBUTION
AMPLA
Operating Income decrease mainly due to lower energy purchase-sales margin partially compensated by higher energy sales.
| Table 26 | |||||||||
| Ampla | Million Ch$ | Thousand US$ | |||||||
| 9M 08 | 9M 09 | Var 08-09 | Chg % | 9M 09 | |||||
| Operating Revenues | 630,582 | 638,654 | 8,072 | 1.3% | 1,160,429 | ||||
| Operating Costs | (370,829) | (385,557) | (14,728) | (4.0%) | (700,554) | ||||
| Gross Profit | 259,753 | 253,097 | (6,656) | (2.6%) | 459,875 | ||||
| Other Costs | (99,604) | (100,948) | (1,344) | (1.3%) | (183,422) | ||||
| Gross Operating Income (EBITDA) | 160,148 | 152,149 | (7,999) | (5.0%) | 276,453 | ||||
| Depreciation and Amortization | (34,442) | (37,539) | (3,097) | (9.0%) | (68,208) | ||||
| Operating Income | 125,706 | 114,610 | (11,096) | (8.8%) | 208,245 | ||||
| Figures may differ from those accounted under Brazilian GAAP. | |||||||||
Additional Information
| Table 27 | ||||||||
| Ampla | 9M 08 | 9M 09 | Var 08-09 | Chg % | ||||
| Customers (Th) | 2,449 | 2,511 | 62 | 2.5% | ||||
| GWh Sold | 6,816 | 6,895 | 79 | 1.2% | ||||
| Clients/Employee | 1,838 | 1,974 | 136 | 7.4% | ||||
| Energy Losses % | 20.3% | 20.9% | 0.6% | 3.2% | ||||
Pg. 38
| PRESS RELEASE | |
COELCE
Operating Income increase mainly due to higher energy purchase-sales margin, VAD, physical sales and lower energy losses.
| Table 28 | |||||||||
| Coelce | Million Ch$ | Thousand US$ | |||||||
| 9M 08 | 9M 09 | Var 08-09 | Chg % | 9M 09 | |||||
| Operating Revenues | 446,871 | 477,569 | 30,699 | 6.9% | 867,740 | ||||
| Operating Costs | (260,962) | (282,228) | (21,266) | (8.1%) | (512,806) | ||||
| Gross Profit | 185,909 | 195,342 | 9,433 | 5.1% | 354,934 | ||||
| Other Costs | (59,269) | (63,759) | (4,490) | (7.6%) | (115,850) | ||||
| Gross Operating Income (EBITDA) | 126,640 | 131,583 | 4,942 | 3.9% | 239,085 | ||||
| Depreciation and Amortization | (27,292) | (31,017) | (3,724) | (13.6%) | (56,357) | ||||
| Operating Income | 99,348 | 100,566 | 1,218 | 1.2% | 182,727 | ||||
| Figures may differ from those accounted under Brazilian GAAP. | |||||||||
Additional Information
| Table 29 | ||||||||
| Coelce | 9M 08 | 9M 09 | Var 08-09 | Chg % | ||||
| Customers (Th) | 2,803 | 2,934 | 132 | 4.7% | ||||
| GWh Sold | 5,505 | 5,706 | 201 | 3.6% | ||||
| Clients/Employee | 2,198 | 2,291 | 92 | 4.2% | ||||
| Energy Losses % | 11.8% | 11.5% | (0.3%) | (2.5%) | ||||

Pg. 39
| PRESS RELEASE | |

CHILE
GENERATION
ENDESA CHILE
Consolidated Income Statement of Endesa Chile
| Table 30 | |||||||||
| Endesa Chile | Million Ch$ | Thousand US$ | |||||||
| 9M 08 | 9M 09 | Var 08-09 | Chg % | 9M 09 | |||||
| Operating Revenues | 1.818.249 | 1.879.052 | 60.803 | 3,3% | 3.414.223 | ||||
| Operating Costs | (966.934) | (773.507) | 193.427 | 20,0% | (1.405.456) | ||||
| Gross Profit | 851.315 | 1.105.545 | 254.230 | 29,9% | 2.008.767 | ||||
| Other Costs | (130.561) | (130.255) | 306 | 0,2% | (236.672) | ||||
| Gross Operating Income (EBITDA) | 720.754 | 975.290 | 254.537 | 35,3% | 1.772.095 | ||||
| Depreciations and Amortizations | (144.893) | (146.626) | (1.733) | (1,2%) | (266.418) | ||||
| Operating Income | 575.861 | 828.665 | 252.804 | 43,9% | 1.505.677 | ||||
| Financial Result | (125.493) | (130.420) | (4.927) | (3,9%) | (236.972) | ||||
| Interest Income | 22.093 | 23.664 | 1.571 | 7,1% | 42.997 | ||||
| Interest Expenses | (139.196) | (141.137) | (1.941) | (1,4%) | (256.444) | ||||
| Income for Readjustment Items | (9.606) | 11.363 | 20.969 | 218,3% | 20.646 | ||||
| Exchange gains (losses) | 1.215 | (24.310) | (25.525) | (2100,3%) | (44.170) | ||||
| Positive | 12.664 | 16.016 | 3.352 | 26,5% | 29.101 | ||||
| Negative | (11.448) | (40.326) | (28.877) | (252,2%) | (73.272) | ||||
| Net Income from financial Items | (97.178) | (130.420) | (33.242) | (34,2%) | (237) | ||||
| Share of profit of associates | 66.014 | 69.495 | 3.481 | 5,3% | 126.272 | ||||
| Income from Other Investments | (210) | (251) | (41) | (19,3%) | (456) | ||||
| Income from asset sales | (170) | 34 | 204 | 120,0% | 62 | ||||
| Net Income before Taxes | 516.001 | 767.523 | 251.522 | 48,7% | 1.394.583 | ||||
| Income Tax | (118.527) | (143.438) | (24.911) | (21,0%) | (260.626) | ||||
| Net Income before gains (losses) from discounted operations, net from taxes | 397.474 | 624.085 | 226.610 | 57,0% | 1.133.957 | ||||
| NET INCOME | 397.474 | 624.085 | 226.610 | 57,0% | 1.133.957 | ||||
| Parent Company | 315.616 | 509.184 | 193.568 | 61,3% | 925.184 | ||||
| Minority Holders | 81.858 | 114.901 | 33.043 | 40,4% | 208.774 | ||||
| *Includes generation subsidiaries in Chile, Argentina, Colombia and Peru. | |||||||||
Chilean Operations
The Operating Income in Chile reached an important increase. This growth is mainly explained by a drop in operating costs, resulting from improved hydrological conditions which result in lower fuel consumption and less energy purchases.
Pg. 40
| PRESS RELEASE | |
| Table 31 | |||||||||
| Chilean Operations | Million Ch$ | Thousand US$ | |||||||
| 9M 08 | 9M 09 | Var 08-09 | Chg % | 9M 09 | |||||
| Operating Revenues | 1,145,388 | 1,070,213 | (75,175) | (6.6%) | 1,944,568 | ||||
| Operating Costs | (640,167) | (414,345) | 225,822 | 35.3% | (752,861) | ||||
| Gross Profit | 505,221 | 655,868 | 150,647 | 29.8% | 1,191,707 | ||||
| Other Costs | (59,745) | (51,402) | 8,342 | 14.0% | (93,398) | ||||
| Gross Operating Income (EBITDA) | 445,476 | 604,466 | 158,989 | 35.7% | 1,098,309 | ||||
| Depreciation and Amortization | 374,691 | 532,578 | 157,888 | 42.1% | 967,691 | ||||
| Operating Income | 374,691 | 532,578 | 157,888 | 42.1% | 967,691 | ||||
Additional Information
| Table 32 | ||||||||
| Chilean Companies | 9M 08 | 9M 09 | Var 08-09 | Chg % | ||||
| GWh Produced | 15,667 | 16,068 | 401 | 2.6% | ||||
| GWh Sold | 15,882 | 16,071 | 189 | 1.2% | ||||
| Market Share | 37.0% | 40.6% | - | 9.8% | ||||
DISTRIBUTION
CHILECTRA
Operating Income decreased mainly due to lower physical energy sales and VAD index as a result of the November 2008 tariff setting.
Pg. 41
| PRESS RELEASE | |
| Table 33 | |||||||||
| Chilectra | Million Ch$ | Thousand US$ | |||||||
| 9M 08 | 9M 09 | Var 08-09 | Chg % | 9M 09 | |||||
| Operating Revenues | 753,416 | 846,016 | 92,601 | 12.3% | 1,537,205 | ||||
| Operating Costs | (565,141) | (654,091) | (88,950) | (15.7%) | (1,188,479) | ||||
| Gross Profit | 188,274 | 191,925 | 3,651 | 1.9% | 348,727 | ||||
| Other Costs | (59,431) | (63,469) | (4,038) | (6.8%) | (115,323) | ||||
| Gross Operating Income (EBITDA) | 128,843 | 128,456 | (387) | (0.3%) | 233,404 | ||||
| Depreciation and Amortization | (15,072) | (16,973) | (1,900) | (12.6%) | (30,839) | ||||
| Operating Income | 113,771 | 111,484 | (2,288) | (2.0%) | 202,565 | ||||
| Financial Result | (8,973) | (283) | 8,690 | 96.9% | (513) | ||||
| Interest Income | 12,042 | 11,832 | (210) | (1.7%) | 21,499 | ||||
| Interest Expense | (16,090) | (13,695) | 2,395 | 14.9% | (24,884) | ||||
| Income for Readjustment items | (2,814) | (55) | 2,759 | 98.0% | (100) | ||||
| Exchange gains (losses) | (2,111) | 1,635 | 3,746 | 177.5% | 2,971 | ||||
| Positive | 1,990 | 3,080 | 1,090 | 54.8% | 5,597 | ||||
| Negative | (4,101) | (1,445) | 2,656 | 64.8% | (2,625) | ||||
| Share of profit of associates | 58,366 | 57,873 | (493) | (0.8%) | 105,155 | ||||
| Income from Other Investments | - | 759 | 759 | - | 1,378 | ||||
| Income from assets sales | - | (331) | (331) | - | (602) | ||||
| Net Income before Taxes | 163,165 | 169,502 | 6,337 | 3.9% | 307,983 | ||||
| Income Tax | (9,705) | (18,923) | (9,218) | (95.0%) | (34,383) | ||||
| Net Income before gains (losses) from discounted operations, net from taxes | 153,460 | 150,579 | (2,881) | (1.9%) | 273,600 | ||||
| NET INCOME | 153,460 | 150,579 | (2,881) | (1.9%) | 273,600 | ||||
| Parent Company | 153,491 | 148,668 | (4,823) | (3.1%) | 270,129 | ||||
| Minority Holders | (31) | 1,910 | 1,942 | 6201.0% | 3,471 | ||||
Additional Information
| Table 34 | ||||||||
| Chilectra | 9M 08 | 9M 09 | Var 08-09 | Chg % | ||||
| Customers (Th) | 1,524 | 1,563 | 39 | 2.6% | ||||
| GWh Sold | 9,418 | 9,390 | (28) | (0.3%) | ||||
| Clients/Employee | 2,056 | 2,141 | 85 | 4.1% | ||||
| Energy Losses % | 6.0% | 6.0% | 0.0% | 0.0% | ||||
Pg. 42
| PRESS RELEASE | |

COLOMBIA
GENERATION
EMGESA
Operating Income increase explained by higher energy sale prices partially offset by higher energy purchases and fuel consumption. Despite of the less water availability generated energy increased 3.3% .
| Table 35 | |||||||||
| Emgesa | Million Ch$ | Thousand US$ | |||||||
| 9M 08 | 9M 09 | Var 08-09 | Chg % | 9M 09 | |||||
| Operating Revenues | 290,493 | 374,771 | 84,278 | 29.0% | 680,956 | ||||
| Operating Costs | (93,742) | (126,407) | (32,665) | (34.8%) | (229,681) | ||||
| Gross Profit | 196,751 | 248,364 | 51,613 | 26.2% | 451,275 | ||||
| Other Costs | (17,966) | (22,023) | (4,057) | (22.6%) | (40,016) | ||||
| Gross Operating Income (EBITDA) | 178,785 | 226,341 | 47,556 | 26.6% | 411,259 | ||||
| Depreciation and Amortization | (31,819) | (27,130) | 4,689 | 14.7% | (49,296) | ||||
| Operating Income | 146,966 | 199,210 | 52,244 | 35.5% | 361,963 | ||||
| * Please notice that these figures could differ from those accounted under Colombian GAAP. | |||||||||
Additional Information
| Table 36 | ||||||||
| Emgesa | 9M 08 | 9M 09 | Var 08-09 | Chg % | ||||
| GWh Produced | 9,602 | 9,922 | 320 | 3.3% | ||||
| GWh Sold | 12,362 | 12,790 | 428 | 3.5% | ||||
| Market Share | 22.2% | 21.1% | - | (5.0%) | ||||
Pg. 43
| PRESS RELEASE | |
DISTRIBUTION
CODENSA
Operating Income increase, mainly explained by higher purchase-sales margins due to an increase in tariffs.
| Table 37 | |||||||||
| Codensa | Million Ch$ | Thousand US$ | |||||||
| 9M 08 | 9M 09 | Var 08-09 | Chg % | 9M 09 | |||||
| Operating Revenues | 481,969 | 549,330 | 67,361 | 14.0% | 998,129 | ||||
| Operating Costs | (238,491) | (284,398) | (45,907) | (19.2%) | (516,750) | ||||
| Gross Profit | 243,477 | 264,932 | 21,454 | 8.8% | 481,379 | ||||
| Other Costs | (55,590) | (64,921) | (9,331) | (16.8%) | (117,960) | ||||
| Gross Operating Income (EBITDA) | 187,887 | 200,011 | 12,123 | 6.5% | 363,418 | ||||
| Depreciation and Amortization | (39,400) | (42,042) | (2,642) | (6.7%) | (76,390) | ||||
| Operating Income | 148,487 | 157,969 | 9,482 | 6.4% | 287,029 | ||||
| * Please notice that these figures could differ from those accounted under Colombian GAAP. | |||||||||
Additional Information
| Table 38 | ||||||||
| Codensa | 9M 08 | 9M 09 | Var 08-09 | Chg % | ||||
| Customers (Th) | 2,266 | 2,343 | 76 | 3.4% | ||||
| GWh Sold | 8,813 | 8,813 | (0) | (0.0%) | ||||
| Clients/Employee | 2,416 | 2,538 | 122 | 5.0% | ||||
| Energy Losses % | 8.1% | 8.2% | 0.1% | 1.2% | ||||
Pg. 44
| PRESS RELEASE | |

PERU
GENERATION
EDEGEL
Operating Income increased mainly due to a better generation mix which allowed a reduction in costs.
| Table 39 | |||||||||
| Edegel | Million Ch$ | Thousand US$ | |||||||
| 9M 08 | 9M 09 | Var 08-09 | Chg % | 9M 09 | |||||
| Operating Revenues | 140,707 | 159,865 | 19,158 | 13.6% | 290,473 | ||||
| Operating Costs | (68,426) | (49,853) | 18,572 | 27.1% | (90,583) | ||||
| Gross Profit | 72,281 | 110,012 | 37,731 | 52.2% | 199,891 | ||||
| Other Costs | (16,284) | (22,478) | (6,193) | (38.0%) | (40,842) | ||||
| Gross Operating Income (EBITDA) | 55,997 | 87,534 | 31,537 | 56.3% | 159,049 | ||||
| Depreciation and Amortization | (25,024) | (28,543) | (3,519) | (14.1%) | (51,862) | ||||
| Operating Income | 30,973 | 58,991 | 28,018 | 90.5% | 107,187 | ||||
| * Please notice that these figures could differ from those accounted under Peruvian GAAP. | |||||||||
Additional Information
| Table 40 | ||||||||
| Edegel | 9M 08 | 9M 09 | Var 08-09 | Chg % | ||||
| GWh Produced | 6,070 | 6,029 | (41) | (0.7%) | ||||
| GWh Sold | 6,300 | 6,179 | (121) | (1.9%) | ||||
| Market Share | 31.3% | 30.6% | - | (2.2%) | ||||
Pg. 45
| PRESS RELEASE | |
DISTRIBUTION
EDELNOR
Operating Income increased mainly due to higher purchase-sales margins, energy sales and a reduction on energy losses.
| Table 41 | |||||||||
| Edelnor | Million Ch$ | Thousand US$ | |||||||
| 9M 08 | 9M 09 | Var 08-09 | Chg % | 9M 09 | |||||
| Operating Revenues | 175,309 | 227,437 | 52,128 | 29.7% | 413,251 | ||||
| Operating Costs | (101,950) | (138,739) | (36,790) | (36.1%) | (252,088) | ||||
| Gross Profit | 73,359 | 88,698 | 15,339 | 20.9% | 161,163 | ||||
| Other Costs | (21,397) | (24,903) | (3,506) | (16.4%) | (45,248) | ||||
| Gross Operating Income (EBITDA) | 51,962 | 63,795 | 11,833 | 22.8% | 115,915 | ||||
| Depreciation and Amortization | (14,470) | (15,490) | (1,020) | (7.1%) | (28,145) | ||||
| Operating Income | 37,492 | 48,305 | 10,813 | 28.8% | 87,770 | ||||
| * Please notice that these figures could differ from those accounted under Peruvian GAAP. | |||||||||
Additional Information
| Table 42 | ||||||||
| Edelnor | 9M 08 | 9M 09 | Var 08-09 | Chg % | ||||
| Customers (Th) | 1,018 | 1,050 | 33 | 3.2% | ||||
| GWh Sold | 4,168 | 4,239 | 71 | 1.7% | ||||
| Clients/Employee | 1,798 | 1,753 | (45) | (2.5%) | ||||
| Energy Losses % | 8.2% | 8.1% | (0.1%) | (1.2%) | ||||
Pg. 46
| PRESS RELEASE | |
OWNERSHIP OF THE COMPANY AS OF SEPTEMBER 30, 2009
CONFERENCE CALL INVITATION
Enersis is pleased to invite you to participate in aConference Call with the management to review the results for the period,on Monday, November 2nd, 2009, 9:00 a.m. Eastern Time (11:00 a.m. noon Chilean Time). There will be a question and answer session following management's comments. Representing ENERSIS will be Mr. Alfredo Ergas, Chief Financial Officer, Mr. Ricardo Alvial, Investment & Risks Director and Ms. Susana Rey, Head of Investor Relations.
To participate, please dial +1 (617) 213-4850 or +1 (888) 679-8038 (toll free USA), approximately 10 minutes prior to the scheduled start time, Passcode ID: 38739353
To access the phone replay, please dial +1 (617) 801-6888 or +1 (888) 286-8010 (toll free USA) Passcode ID: 33866802.
For this Conference Call you can access before to the pre-registration site athttps://www.theconferencingservice.com/prereg/key.process?key=P4NY7KNYR and make your registration quicker. If not, please connect approximately 15 minutes prior to the scheduled start time. You can also access to the live conference call and its replay through our website athttp://phx.corporate-ir.net/phoenix.zhtml?p=irol-eventDetails&c=83615&eventID=2502866
Pg. 47
| PRESS RELEASE | |
CONTACT INFORMATION
For further information, please contact us:
Susana Rey
Head of Investor Relations
srm@e.enersis.cl
56 (2) 353 4554
| Carmen Poblete | Denisse Labarca | Bárbara López | Cristián Del Sante | |||
| Shares Department | Investor Relations | Investor Relations | Investor Relations | |||
| Representative | Representative | Representative | Representative | |||
| cpt@e.enersis.cl | dla@e.enersis.cl | bllf@e.enersis.cl | cdb@e.enersis.cl | |||
| 56 (2) 353 4447 | 56 (2) 353 4492 | 56 (2) 353 4552 | 56 (2) 353 4555 |
María Luz Muñoz
Investor Relations Assistant
mlmr@e.enersis.cl
56 (2) 353 4682
DISCLAIMER
This Press Release contains statements that could constitute forward-looking statements within the meaning of the Private Securities Litigation Reform Act of 1995. These statements appear in a number of places in this announcement and include statements regarding the intent, belief or current expectations of Enersis and its management with respect to, among other things: (1) Enersis’ business plans; (2) Enersis’ cost-reduction plans; (3) trends affecting Enersis’ financial condition or results of operations, including market trends in the electricity sector in Chile or elsewhere; (4) supervision and regulation of the electricity sector in Chile or elsewhere; and (5) the future effect of any changes in the laws and regulations applicable to Enersis’ or its subsidiaries. Such forward-looking statements are not guarantees of future performance and involve risks and uncertainties. Actual results may differ materially from those in the forward-looking statements as a result of various factors. These factors include a decline in the equity capital markets of the United States or Chile, an increase in the market rates of interest in the United States or elsewhere, adverse decisions by government regulators in Chile or elsewhere and other factors described in Enersis’ Annual Report on Form 20-F. Readers are cautioned not to place undue reliance on those forward-looking statements, which state only as of their dates. Enersis undertakes no obligation to release publicly the result of any revisions to these forward-looking statements.
Pg. 48
SIGNATURES
Pursuant to the requirements of the Securities Exchange Act of 1934, as amended, the Registrant has duly caused this report to be signed on its behalf by the undersigned, thereunto duly authorized.
| ENERSIS S.A. | |
| By: /s/ Ignacio Antoñanzas | |
| -------------------------------------------------- | |
| Title: Chief Executive Officer |
Date: October 29, 2009