FORM 6-K
Pursuant to Rule 13a-16 or 15d-16 of
the Securities Exchange Act of 1934
For the month of January, 2010
Commission File Number: 001-12440
ENERSIS S.A.
Santa Rosa 76
Santiago, Chile
Indicate by check mark whether the registrant files or will file
annual reports under cover of Form 20-F or Form 40-F:
Form 20-F [X] Form 40-F [ ]
Indicate by check mark if the registrant is submitting the Form 6-K
in paper as permitted by Regulation S-T Rule 101(b)(1):
Yes [ ] No [X]
Indicate by check mark if the registrant is submitting the Form 6-K
in paper as permitted by Regulation S-T Rule 101(b)(7):
Yes [ ] No [X]
Indicate by check mark whether by furnishing the information
ontained in this Form, the Registrant is also thereby furnishing the
information to the Commission
pursuant to Rule 12g3-2(b) under the Securities Exchange Act of 1934:
Yes [ ] No [X]
If °;Yes” is marked, indicate below the file number assigned to the registrant
in connection with Rule 12g3-2(b): N/A
 | PRESS RELEASE | |
ENERSIS
ANNOUNCES CONSOLIDATED RESULTS
FOR YEAR ENDED DECEMBER 31st, 2009
Highlights for the Period |
SUMMARY
• For the year ended on December 31st, 2009, Enersis’ Net Income attributable to the Parent Company was Ch$660,231 million, an increase of 30% with respect to the same period in 2008.
• Despite the recent tightening environment as consequence of the global economic recession, we registered an increase of 3.4% in physical sales in generation, and 1% increase in physical sales in distribution. This confirms the stability of our business.
• Adequate commercial and operating policies applied within the Group and the efficiency achieved across our companies allowed a continuous improvement in profitability even in a difficult economic scenario.
• Our flexible investment plan has been adapted to the new market conditions, always maintaining our commitment to provide the best service quality to our clients and to keep our liquidity at optimal levels.
Consolidated figures are detailed as follows:
• Operating Costs decreased 3.6% amounting to Ch$4,525,252 million.
• EBITDA (Gross Operating Income) increased 7.2% to Ch$2,444,934.
• Operating Income grew 3.3% up to Ch$ 1,924,636 million, as a result of the better performance of the Generation and Transmission Businesses.
• The relative contribution of the two lines of business is as follows:
• Generation and Transmission 61%
• Distribution 39%
GENERATION ANDTRANSMISSIONBUSINESSES
Consolidated results figures for the Generation and Transmission Businesses are detailed as follows:
• Operating Costs decreased 15.3% .
• EBITDA increased 16.2%, amounting to Ch$1,462,993 million.
• Operating Income increased 14.2% amounting to Ch$1,192,408 million, mainly explained by the performance of the operations in Chile, Colombia and Peru.
Factors that impacted these results are:
Pg. 1
| PRESS RELEASE | |
• Consolidated physical sales level grew by 3.4% .
• Hydro generation showed an 5.8% overall increase.
• During 2009, WTI reached an average price of US$ 68.2/barrel, representing a 32% average annual drop.
In Chile, Contribution margin increased 17%, which is explained mainly by the following:
• Lower liquid fuel prices and purchases.
• Better purchase-production mix due to higher hydrology.
• Higher gas availability improving efficiency.
In Colombia, Contribution margin increased 16%, which is explained mainly by the following:
• Higher sales prices, partially explained by the “El niño” phenomenon.
• Higher sale volume of contracted energy.
In Peru, Contribution margin increased 29%, as a result of:
• Better purchase-production mix due to higher hydrology, and
• Lower purchase costs in the spot market.
In Argentina, Contribution margin increased 11%, as a result of:
• Better purchase-production mix due to higher hydrology.
In Brazil, Contribution margin increased 8%, as a result of:
• Lower energy purchase costs.
DISTRIBUTIONBUSINESS
Consolidated figures for the Distribution Business are detailed as follows:
• Operating Revenues increased 4.1%, amounting Ch$ 4,218,450 million.
• Operating income decreased by 7.5% amounting to Ch$761,417 million, mainly explained by Chilectra’s tariffs revisions, partially offset by positive performance of Ampla, Coelce, and Edelnor.
Factors that influenced these results are the following:
• Lower sales-purchase margins, partially compensated by:
• Consolidated physical sales grew by 1.0% with respect to 2008, mainly explained by demand growth in our subsidiaries in Brazil and Peru.
• Addition of 375 thousand new clients. This is equivalent to the incorporation of a new mid size Distribution Company every year.
In Chile, Contribution margin decreased 23%, which is explained mainly by the following:
• Lower sales-purchase margins resulting from lower VAD index as a result of the November 2008 tariff setting and Subtransmission decree which apply since January 2009.
Pg. 2
| PRESS RELEASE | |
• Higher energy losses.
In Argentina, Contribution margin decreased 2%, as a result of:
• Lower sales-puchase margin, due to different clients’ mix.
In Brazil, Contribution margin increased 11%, as a result of:
• Higher average sales prices and tolls in Ampla,
• Higher average sales prices and lower energy losses in Coelce.
In Colombia, Contribution margin increased 6%, which is explained mainly by the following:
• Higher sales-purchase margins derived from lower hydrology in the system.
In Peru, Contribution margin increased 12%, as a result of:
• Higher sales-purchase margins
• Lower energy losses
FINANCIALSUMMARY
• Consent solicitation approval for the Yankee Bonds of Enersis and Endesa Chile, restricting the cross default and insolvency clause only to the Issuer and its Chilean subsidiaries cross default and insolvency clauses. A default in our subsidiaries outside Chile no longer affects our yankee bonds.
• The average interest rate, a major cost factor, fell from 8.7% to 7.9%, a positive development for the overall Group.
• Liquidity, a key consideration in our financial management, continues to be in a very solid position, as shown below:
• Non committed credit lines: US$ 550 million available in the aggregate for Enersis and Endesa Chile in the local markets, and committed credit lines for US$ 300 million in undrawn revolving debt facilities in the international markets and US$200 in the local markets.
• Cash and cash equivalents amount to US $2,238 million.
• Coverage and Protection: In order to mitigate exchange rate and interest rate risks, Enersis has established strict internal rules to protect our cash flows and balance sheet from variations in these variables. As a complement to these policies, we have contracted not-speculative-derivative instruments.
• Exchange rate policy is based on cash flows and it strives to maintain a balance between the flows indexed to US dollars and the assets and liabilities in such currency. In addition to this policy, we have contracted Cross currency swaps for a total amount of US$ 976 million and Forwards, for US$ 118 million.
• In order to reduce volatility on financial results due to changes in market rate, we attempt to maintain an adequate balance in debt structures. Additionally, we have contracted Interest rate swaps for US$ 382 million and Collars, for a value of US$ 40 million.
Pg. 3
| PRESS RELEASE | |
The aforementioned financial tools are being permanently evaluated and adjusted to the changing macroeconomic scenario, in order to achieve the most efficient levels of protection.
Enersis Debt management and Coverage and Protection internal policies explain the most important reason behind our solid liquidity position: thevery stable nature of our business.
MARKETSUMMARY
During 2009, Chile’s Stock market showed a high relative performance compared to other world stock markets and continue showing strength having high exposure to sectors commonly considered as defensive. The IPSA registered the highest annual performance over the last 16 years, outperforming other world benchmarks: Dow Jones Industrials: +18.8%, S&P 500: +23.5%, UKX: +22.1%, FTSE 250: +46.3% and IBEX: +29.8% .
Enersis shares showed high performance in both of the markets where they are traded. Enersis’ ADRs outperformed representative US stock market indexes, showing a positive return of 79.4% . Following the Chilean Stock market, Enersis Share price increased 40.2% YTD from Ch$164.7 to Ch$230.9.
In addition, during this year, Enersis continued to be among the most traded companies at the Santiago Stock Exchange, with an average trading volume of US$ 7.8 million in 2009.
| Top Five Daily Average Traded Amount at SSE in 2009 | ||
| Thousand US$ | ||
| SQM-B | 17,608 | |
| D&S | 16,289 | |
| ENDESA CHILE | 8,468 | |
| ENERSIS | 7,840 | |
| CAP | 7,582 | |
| Source: Santiago Stock Exchange | ||
RISKRATINGCLASSIFICATIONINFORMATION
Enersis credit profile has continued to strengthen in 2009, with improvements in the liquidity position and reduction of leverage levels. The positive perspective of the operational and credit profile of Enersis has been reflected in the very recent upgrade made by Fitch Ratings to our Foreign and Local Currency Issuer Default Ratings and Enersis Yankee Bonds to “BBB+” from “BBB”. Similarly, it made an upgrade of our Domestic Ratings to AA from AA-.
The new ratings are further supported by its diversified asset portfolio, strong credit metrics, adequate debt composition and ample liquidity. Enersis' geographic diversification through Latin America provides a hedge to different regulations and weather conditions and, its operating subsidiaries are financially strong and have leading market positions.
The current risk classifications are:
• International Ratings:
| Enersis | S&P | Moody’s | Fitch |
| Corporate | BBB, Stable | Baa3, Stable | BBB+, Stable |
• Domestic Ratings (for securities issued in Chile):
Pg. 4
| PRESS RELEASE | |
| Enersis | Feller Rate | Fitch |
| Shares | 1stClass Level 1 | 1stClass Level 1 |
| Bonds | AA-, Stable | AA, Stable |
Risk classification of the countries where Enersis has its operations also experienced positive changes during 2009. Moody's upgraded Peru's and Brazil’s foreign currency ratings to Investment grade level.
Pg. 5
| PRESS RELEASE | |
TABLE OFCONTENTS
| Summary | 1 | |
| Generation and Transmission Businesses | 1 | |
| Distribution Business | 2 | |
| Financial Summary | 3 | |
| Market Summary | 4 | |
| Risk Rating Classification Information | 4 | |
| TABLE OF CONTENTS | 6 | |
| GENERAL INFORMATION | 8 | |
| SIMPLIFIED ORGANIZATIONAL STRUCTURE | 9 | |
| MARKET INFORMATION | 10 | |
| EQUITY MARKET | 10 | |
| DEBT MARKET | 12 | |
| CONSOLIDATED INCOME STATEMENT ANALYSIS | 12 | |
| NET INCOME | 12 | |
| UNDER IFRS | 13 | |
| OPERATING INCOME | 14 | |
| NET FINANCIAL INCOME | 15 | |
| TAXES | 15 | |
| CONSOLIDATED BALANCE SHEET ANALYSIS | 16 | |
| ASSETS UNDER IFRS | 16 | |
| BOOK VALUE AND ECONOMIC VALUE OF ASSETS | 18 | |
| LIABILITIES AND SHAREHOLDERS’ EQUITY UNDER IFRS | 19 | |
| DEBT MATURITY WITH THIRD PARTIES, MILLION CH$ | 21 | |
| DEBT MATURITY WITH THIRD PARTIES, THOUSAND US$ | 22 | |
| EVOLUTION OF KEY FINANCIAL RATIOS | 22 | |
| CONSOLIDATED STATEMENTS OF CASH FLOWS ANALYSIS | 24 | |
| UNDER IFRS | 24 | |
| UNDER IFRS | 25 | |
| CASH FLOW RECEIVED FROM FOREIGN SUBSIDIARIES BY ENERSIS, CHILECTRA AND ENDESA CHILE | 26 | |
| CAPEX AND DEPRECIATION | 27 | |
| THE PRINCIPAL RISKS ASSOCIATED TO THE ACTIVITIES OF THE ENERSIS GROUP | 27 | |
| ARGENTINA | 30 | |
| GENERATION | 30 | |
| Endesa Costanera | 30 | |
| El Chocón | 30 | |
| DISTRIBUTION | 31 | |
| Edesur | 31 | |
| BRAZIL | 32 | |
| ENDESA BRASIL | 32 | |
| GENERATION | 32 | |
| Cachoeira | 32 | |
Pg. 6
| PRESS RELEASE | |
| Fortaleza (cgtf) | 33 | |
| TRANSMISSION | 33 | |
| CIEN | 33 | |
| DISTRIBUTION | 34 | |
| Ampla | 34 | |
| Coelce | 34 | |
| CHILE | 35 | |
| GENERATION | 35 | |
| Endesa Chile | 35 | |
| DISTRIBUTION | 36 | |
| Chilectra | 36 | |
| COLOMBIA | 38 | |
| GENERATION | 38 | |
| Emgesa | 38 | |
| DISTRIBUTION | 38 | |
| Codensa | 38 | |
| PERU | 39 | |
| GENERATION | 39 | |
| Edegel | 39 | |
| DISTRIBUTION | 39 | |
| Edelnor | 39 | |
| OPERATING INCOME BY SUBSIDIARY | 40 | |
| CONFERENCE CALL INVITATION | 42 | |
| CONTACT INFORMATION | 43 | |
| DISCLAIMER | 43 |
Pg. 7
| PRESS RELEASE | |
GENERALINFORMATION
(Santiago, Chile, Wednesday 27th, January 2010) Enersis S.A. (NYSE: ENI), announced today its consolidated financial results for year ended on December 31st, 2009. All figures are in Ch$, under International Financial Reporting Standards (IFRS). Variations refer to the period between December 31st, 2008 and December 31st, 2009.
Figures as of December 31st, 2009 are additionally translated into US$, merely as a convenience translation, using the exchange rate of US$1 = Ch$507.10 as of December 31st, 2009 for the Balance Sheet, and 2009 average exchange rate of US$1 = Ch$559.66 for the Income Statement, Cash Flow Statements, Capex and Depreciation.
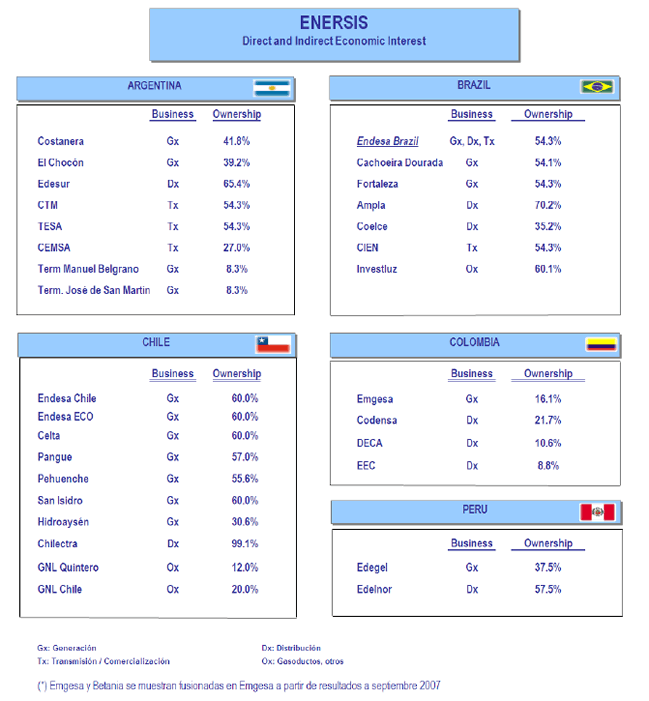
The consolidation includes the following investment vehicles and companies,
a) In Chile: Endesa Chile (NYSE: EOC)*, Chilectra, Synapsis, CAM, and Inmobiliaria Manso de Velasco.
b) Outside Chile: Distrilima (Peru), Endesa Brasil (Brazil)**, Edesur (Argentina) and Codensa (Colombia).
In the following pages you will find a detailed analysis of financial statements, a brief explanation for most important variations and comments on main items in the P&L and Cash Flow Statements compared to the information as of December 31st, 2008.
* Includes Endesa Chile Chilean subsidiaries (Celta, Pangue, Pehuenche, San Isidro, Túnel El Melón), non Chilean subsidiaries (Costanera, El Chocón, Edegel and Emgesa) and jointly controlled companies or associates companies (Gas Atacama, Trasquillota and HidroAysén).
** Includes Endesa Fortaleza, CIEN, Cachoeira Dourada, Ampla and Coelce.
Pg. 8
| PRESS RELEASE | |
SIMPLIFIEDORGANIZATIONALSTRUCTURE
Pg. 9
| PRESS RELEASE | |
MARKETINFORMATION
EQUITYMARKET
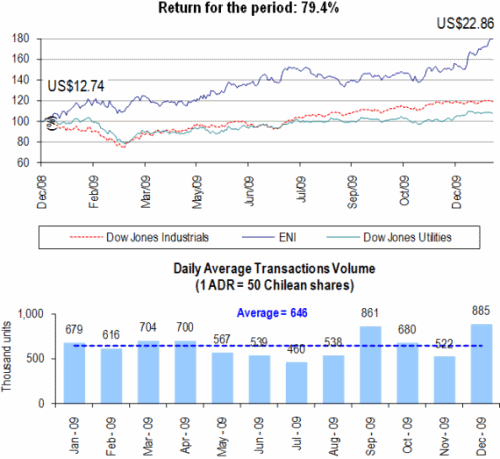
New York Stock Exchange (NYSE)
The chart below shows the performance of Enersis’ ADR (“ENI”) price at the NYSE, compared to the Dow Jones Industrials and the Dow Jones Utilities indexes over the last 12 months:
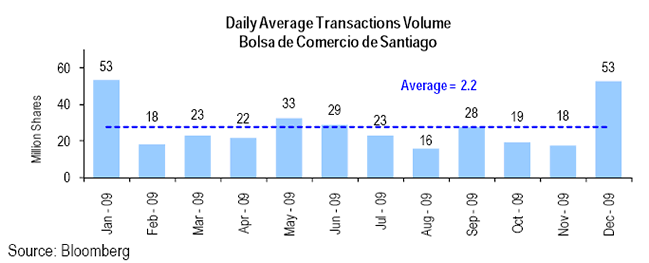
Santiago Stock Exchange (BCS)
The chart below shows the performance of Enersis’ Chilean stock price over the last 12 months compared to the selective Chilean selective Stock Index (IPSA):

Pg. 10
| PRESS RELEASE | |
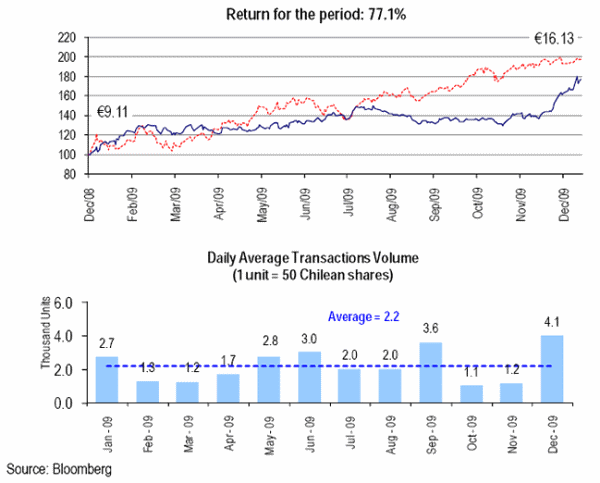
Madrid Stock Exchange (Latibex) - Spain
The chart below, shows Enersis’ share price (“XENI”) at the Latibex over the last 12 months compared to the Local Stock Index (IBEX):
Pg. 11
| PRESS RELEASE | |
DEBTMARKET
Yankee Bonds Price Evolution
The following chart shows the pricing of our two of our Yankee Bonds over the last twelve months compared to the Ishares Iboxx Investment Grade Corporate Bond Fund Index:
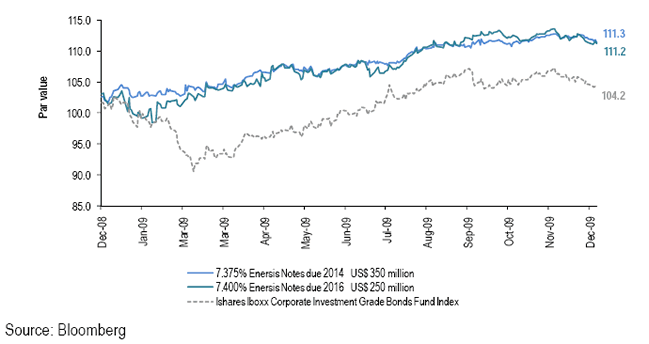
(*) IShares Iboxx Corporate Investment Grade Bonds Fund is an exchange traded fund incorporated in the U.S.A. The Index measures the performance of a fixed number of investment grade corporate bonds.
CONSOLIDATEDINCOMESTATEMENTANALYSIS
NETINCOME
Enersis’ Net Income attributable to parent company for the year 2009 was Ch$660,231 million, representing a 30.1% increase over the previous year, which was Ch$507,590 million.
Pg. 12
| PRESS RELEASE | |
UNDERIFRS
| Table 1 | ||||||
| CONS. INCOME STATEMENT | Million Ch$ | Thousand US$ | ||||
| 2008 | 2009 | Var 08-09 | Chg % | 2009 | ||
| Sales | 6,080,511 | 6,076,108 | (4,403) | (0.1%) | 10,856,715 | |
| Energy sales | 5,542,099 | 5,559,765 | 17,666 | 0.3% | 9,934,119 | |
| Other sales | 44,694 | 53,899 | 9,205 | 20.6% | 96,306 | |
| Other services | 493,718 | 462,444 | (31,274) | (6.3%) | 826,289 | |
| Other operating income | 479,080 | 373,781 | (105,299) | (22.0%) | 667,867 | |
| Revenues | 6,559,591 | 6,449,888 | (109,703) | (1.7%) | 11,524,582 | |
| Power purchased | (1,624,239) | (1,559,449) | 64,790 | 4.0% | (2,786,404) | |
| Cost of fuel consumed | (847,411) | (580,238) | 267,173 | 31.5% | (1,036,761) | |
| Transportation expenses | (294,860) | (277,037) | 17,823 | 6.0% | (495,006) | |
| Other variable procurements and services | (776,441) | (789,127) | (12,686) | (1.6%) | (1,410,003) | |
| Procurements and Services | (3,542,952) | (3,205,851) | 337,101 | 9.5% | (5,728,176) | |
| Contribution Margin | 3,016,640 | 3,244,037 | 227,397 | 7.5% | 5,796,406 | |
| Work on non-current assets | 32,600 | 33,731 | 1,131 | 3.5% | 60,269 | |
| Employee expenses | (322,628) | (370,402) | (47,774) | (14.8%) | (661,831) | |
| Other fixed operating expenses | (445,250) | (462,432) | (17,182) | (3.9%) | (826,267) | |
| Gross Operating Income (EBITDA) | 2,281,361 | 2,444,934 | 163,573 | 7.2% | 4,368,578 | |
| Depreciation and amortization | (417,710) | (520,297) | (102,587) | (24.6%) | (929,661) | |
| Operating Income | 1,863,651 | 1,924,636 | 60,985 | 3.3% | 3,438,917 | |
| Net Financial Income | (419,330) | (309,118) | 110,212 | 26.3% | (552,329) | |
| Financial income | 181,753 | 159,670 | (22,083) | (12.1%) | 285,297 | |
| Financial expenses | (515,108) | (482,473) | 32,635 | 6.3% | (862,076) | |
| Income (Loss) for indexed assets and liabilities | (62,378) | 21,781 | 84,159 | 134.9% | 38,919 | |
| Foreign currency exchange differences, net | (23,633) | (8,235) | 15,398 | 65.2% | (14,715) | |
| Gains | 74,524 | 77,957 | 3,433 | 4.6% | 139,292 | |
| Losses | (98,157) | (80,481) | 17,676 | 18.0% | (143,803) | |
| Effect of Derivatives in Exchange | ||||||
| Gains (Losses) | 3,944 | (5,711) | (9,655) | - | (10,203) | |
| Net Income from Related Comp. Cons. By the Prop. | ||||||
| Eq. Method | 3,261 | 2,236 | (1,025) | (31.4%) | 3,995 | |
| Net Income from other investments | 36 | 138 | 102 | - | 246 | |
| Net Income from sales of assets | 2,503 | 53,311 | 50,808 | - | 95,256 | |
| Net Income Before Taxes | 1,450,085 | 1,671,065 | 220,980 | 15.2% | 2,985,839 | |
| Income Tax | (415,903) | (359,738) | 56,165 | 13.5% | (642,775) | |
| Continued Operations Result | 1,034,182 | 1,311,328 | 277,146 | 26.8% | 2,343,064 | |
| Gain (Loss) from discontinued operations, Net | ||||||
| from taxes | - | - | - | - | - | |
| Dicontinued Operations Result | 1,034,182 | 1,311,328 | 277,146 | 26.8% | 2,343,064 | |
| NET INCOME | 1,034,182 | 1,311,328 | 277,146 | 26.8% | 2,343,064 | |
| Net Income Attributable to Owners of the | 507,590 | 660,231 | 152,641 | 30.1% | 1,179,693 | |
| Company | ||||||
| Net Income Attributable to Minority Interest | 526,592 | 651,097 | 124,505 | 23.6% | 1,163,371 | |
| Ch$ /share | US$ / ADR | |||||
| 2008 | 2009 | Var 08-09 | Chg % | 2009 | ||
| Earning per share | 15.5 | 20.2 | 4.7 | 30.1% | 1.8 | |
Pg. 13
| PRESS RELEASE | |
OPERATINGINCOME
Operating Income for the period ending December 31, 2009 increased by Ch$60,656 million, from Ch$1,863,651 million to Ch$ 1,924,636 million as of December 2009, representing an increase of 3.3% . Likewise, the EBITDA increased by Ch$163,573 million or 7.2%, amounting to Ch$2,444,934 million; the above is mainly due to good operating policies under a complex economic scenario.
Operating Revenues and costs, broken down by business line for the years ending December 31st, 2008 and 2009 are:
| Table 2 | ||||||||||||||
| Operating Income by Businesses | Generation and Transmission | Distribution | ||||||||||||
| Million Ch$ | Chg% | Thousand US$ | Million Ch$ | Chg% | Thousand US$ | |||||||||
| 2008 | 2009 | 2009 | 2008 | 2009 | 2009 | |||||||||
| Operating Revenues | 2,833,397 | 2,708,358 | -4.4% | 4,839,260 | 4,051,041 | 4,218,450 | 4.1% | 7,537,475 | ||||||
| Operating Costs | (1,789,663) | (1,515,949) | -15.3% | (2,708,680) | (3,227,459) | (3,457,033) | 7.1% | (6,176,984) | ||||||
| Operating Income | 1,043,734 | 1,192,408 | 14.2% | 2,130,580 | 823,582 | 761,417 | -7.5% | 1,360,491 | ||||||
| Operating Income by Businesses | Eliminations and Others | Consolidated | ||||||||||||
| Million Ch$ | Chg% | Thousand US$ | Million Ch$ | Chg% | Thousand US$ | |||||||||
| 2008 | 2009 | 2009 | 2008 | 2009 | 2009 | |||||||||
| Operating Revenues | (324,847) | (476,919) | 46.8% | (852,153) | 6,559,591 | 6,449,888 | -1.7% | 11,524,582 | ||||||
| Operating Costs | 321,181 | 447,730 | 39.4% | 799,999 | (4,695,941) | (4,525,252) | -3.6% | (8,085,665) | ||||||
| Operating Income | (3,665) | (29,189) | 696.4% | (52,154) | 1,863,651 | 1,924,636 | 3.3% | 3,438,917 | ||||||
Generation and Transmission Businesses increased its operating income by Ch$148,674 million, equivalent to 14.2%, and totaling Ch$1,192,408 million. Physical sales increased 3.4% amounting to 66,728 GWh as of December 2009 (64,551 GWh, in December 2008).
Operating income for Generation and Transmission business line, by country in the following table:
| Table 3 | ||||||||||||||||||||||||
| Generation & Transmission | Chile | Argentina | Brazil | |||||||||||||||||||||
| Million Ch$ | Chg% | Thousand US$ | Million Ch$ | Chg% | Thousand US$ | Million Ch$ | Chg% | Thousand US$ | ||||||||||||||||
| 2008 | 2009 | 2009 | 2008 | 2009 | 2009 | 2008 | 2009 | 2009 | ||||||||||||||||
| Operating Revenues | 1,609,158 | 1,373,231 | -14.7% | 2,453,672 | 291,376 | 303,112 | 4.0% | 541,597 | 322,896 | 318,322 | -1.4% | 568,774 | ||||||||||||
| % of consolidated | 57% | 51% | 51% | 10% | 11% | 11% | 11% | 12% | 12% | |||||||||||||||
| Operating Costs | (1,041,422) | (733,191) | -29.6% | (1,310,056) | (248,526) | (255,376) | 2.8% | (456,302) | (159,277) | (140,550) | -11.8% | (251,134) | ||||||||||||
| % of consolidated | 58% | 48% | 48% | 14% | 17% | 17% | 9% | 9% | 9% | |||||||||||||||
| Operating Income | 567,737 | 640,040 | 12.7% | 1,143,616 | 42,851 | 47,737 | 11.4% | 85,295 | 163,618 | 177,772 | 8.7% | 317,640 | ||||||||||||
| Generation & Transmission | Peru | Colombia | Consolidated | |||||||||||||||||||||
| Million Ch$ | Chg% | Thousand US$ | Million Ch$ | Chg% | Thousand US$ | Million Ch$ | Chg% | Thousand US$ | ||||||||||||||||
| 2008 | 2009 | 2009 | 2008 | 2009 | 2009 | 2008 | 2009 | 2009 | ||||||||||||||||
| Operating Revenues | 208,497 | 213,625 | 2.5% | 381,702 | 401,470 | 500,964 | 24.8% | 895,117 | 2,833,397 | 2,708,358 | -4.4% | 4,839,260 | ||||||||||||
| % of consolidated | 7% | 8% | 8% | 14% | 18% | 18% | ||||||||||||||||||
| Operating Costs | (156,551) | (137,576) | -12.1% | (245,820) | (184,652) | (250,153) | 35.5% | (446,970) | (1,789,663) | (1,515,949) | -15.3% | (2,708,680) | ||||||||||||
| % of consolidated | 9% | 9% | 9% | 10% | 17% | 17% | ||||||||||||||||||
| Operating Income | 51,946 | 76,049 | 46.4% | 135,883 | 216,818 | 250,811 | 15.7% | 448,147 | 1,043,734 | 1,192,408 | 14.2% | 2,130,580 | ||||||||||||
Pg. 14
| PRESS RELEASE | |
Distribution businessdecreased its operating income by Ch$62,165 million, equivalent to 7.5% and totaling Ch$761,417 million.
Physical sales amounted to 63,417 GWh, representing an increase of 612 GWh, equivalent to 1.0% variation. Our customers increased by 375 thousand, amounting 12,792 thousand customer base.
Operating income for Distribution line of business, detailed by country, as follows:
| Table 4 | ||||||||||||||||||||||||
| Distribution | Chile | Argentina | Brazil | |||||||||||||||||||||
| Million Ch$ | Chg% | Thousand US$ | Million Ch$ | Chg% | Thousand US$ | Million Ch$ | Chg% | Thousand US$ | ||||||||||||||||
| 2008 | 2009 | 2009 | 2008 | 2009 | 2009 | 2008 | 2009 | 2009 | ||||||||||||||||
| Operating Revenues | 1,078,280 | 1,084,346 | 0.6% | 1,937,497 | 333,266 | 324,518 | -2.6% | 579,844 | 1,724,688 | 1,767,754 | 2.5% | 3,158,601 | ||||||||||||
| % of consolidated | 27% | 26% | 26% | 8% | 8% | 8% | 43% | 42% | 42% | |||||||||||||||
| Operating Costs | (864,657) | (955,314) | 10.5% | (1,706,944) | (287,639) | (292,642) | 1.7% | (522,889) | (1,416,280) | (1,429,554) | 0.9% | (2,554,309) | ||||||||||||
| % of consolidated | 27% | 28% | 28% | 9% | 8% | 8% | 44% | 41% | 41% | |||||||||||||||
| Operating Income | 213,623 | 129,032 | -39.6% | 230,553 | 45,627 | 31,876 | -30.1% | 56,955 | 308,408 | 338,200 | 9.7% | 604,292 | ||||||||||||
| Distribution | Peru | Colombia | Consolidated | |||||||||||||||||||||
| Million Ch$ | Chg% | Thousand US$ | Million Ch$ | Chg% | Thousand US$ | Million Ch$ | Chg% | Thousand US$ | ||||||||||||||||
| 2008 | 2009 | 2009 | 2008 | 2009 | 2009 | 2008 | 2009 | 2009 | ||||||||||||||||
| Operating Revenues | 253,652 | 301,472 | 18.9% | 538,667 | 661,154 | 740,360 | 12.0% | 1,322,866 | 4,051,041 | 4,218,450 | 4.1% | 7,537,475 | ||||||||||||
| % of consolidated | 6% | 7% | 7% | 16% | 18% | 18% | 100% | 100% | 100% | |||||||||||||||
| Operating Costs | (200,708) | (239,047) | 19.1% | (427,127) | (458,174) | (540,475) | 18.0% | (965,715) | (3,227,459) | (3,457,033) | 7.1% | (6,176,984) | ||||||||||||
| % of consolidated | 6% | 7% | 7% | 14% | 16% | 16% | 100% | 100% | 100% | |||||||||||||||
| Operating Income | 52,944 | 62,425 | 17.9% | 111,540 | 202,980 | 199,885 | -1.5% | 357,151 | 823,582 | 761,417 | -7.5% | 1,360,491 | ||||||||||||
NETFINANCIALINCOME
The company’s net financial income as of December 31st, 2009 was negative Ch$309,118 million, representing a 26.3% improvement over the last year’s figures. This variation is mainly explained by a higher Income for Readjustment items which increased Ch$84,159 million due to changes on the Inflation Index Unit – UF (Unidades de Fomento) and its impact on Chile’s UF denominated debt. During year 2009 the UF decreased 0.3% compared to an increase of 9.0% experienced during prior year. Additionally, net interest expenses decreased Ch$10,553 million, primarily due a lower average debt and lower interest rates during the period.
During the year 2009, variations in exchange rates had a negative effect in results, mainly explained by the Chilean peso appreciation relative to foreign currencies of the countries in which Enersis operates Foreign currency exchange differences improved in Ch$15,398 million from 2008’s figure.
TAXES
Income Tax decreased Ch$56,165 million. The latter is mostly explained by decreases in: Enersis Ch$60,196 million, Coelce Ch$21,477 million, Pehuenche Ch$12,538 million and San Isidro Ch$6,019. This effect was partially offset by higher income taxes in Gas Atacama Ch$16,507 million, Emgesa Ch$12,338 million, Edegel Ch$6,997 million, Cachoeira Dourada Ch$4,774 million and Pangue Ch$4,114 million.
Pg. 15
| PRESS RELEASE | |
CONSOLIDATEDBALANCESHEETANALYSIS
ASSETSUNDERIFRS
| Table 5 | ||||||
| ASSETS | Million Ch$ | Thousand US$ | ||||
| 2008 | 2009 | Var 08-09 | Chg % | 2009 | ||
| CURRENT ASSETS | ||||||
| Cash and cash equivalents | 1,318,062 | 1,134,901 | (183,161) | (13.9%) | 2,238,022 | |
| Financial assets at fair value with changes | ||||||
| through net income | - | 1,493 | 1,493 | 0.0% | 2,945 | |
| Available-for-sale financial assets | - | - | - | - | - | |
| Other financial assets | - | 43 | 43 | - | 84 | |
| Trade accounts receivable and other | ||||||
| receivables, net | 1,313,067 | 1,138,647 | (174,420) | (13.3%) | 2,245,408 | |
| Accounts receivable from related companies | 24,747 | 19,014 | (5,732) | (23.2%) | 37,496 | |
| Inventories | 96,975 | 56,319 | (40,656) | (41.9%) | 111,061 | |
| Hedging instruments | - | - | - | - | - | |
| Prepayments | 8,894 | 11,559 | 2,665 | 30.0% | 22,795 | |
| Current tax receivable | 152,700 | 112,176 | (40,525) | (26.5%) | 221,211 | |
| Other assets | 28,276 | 26,942 | (1,333) | (4.7%) | 53,130 | |
| Non-current assets (or disposal groups) | ||||||
| classified as held for sale | - | 70,361 | 70,361 | - | 138,751 | |
| Total currrent assets | 2,942,721 | 2,571,456 | (371,265) | (12.6%) | 5,070,904 | |
| OTHER ASSETS | ||||||
| Available-for-sale financial assets | 22,495 | 2,513 | (19,982) | (88.8%) | 4,955 | |
| Other financial assets | 1,746 | 25,746 | 24,000 | - | 50,771 | |
| Trade accounts receivable and other | ||||||
| receivables, net | 319,284 | 194,977 | (124,306) | (38.9%) | 384,495 | |
| Accounts receivable from related companies | 641 | - | (641) | (100.0%) | - | |
| Investments in associates accounted for | ||||||
| using the equity method | 37,834 | 21,281 | (16,552) | (43.7%) | 41,967 | |
| Intangibles assets, net | 2,626,894 | 2,947,474 | 320,580 | 12.2% | 5,812,412 | |
| Property, plant and equipment, net | 7,215,792 | 6,864,071 | (351,721) | (4.9%) | 13,535,932 | |
| Investment properties | 26,369 | 31,232 | 4,863 | 18.4% | 61,589 | |
| Deferred tax assets | 511,301 | 454,897 | (56,404) | (11.0%) | 897,055 | |
| Hedging instruments | 2,487 | 2,238 | (249) | (10.0%) | 4,413 | |
| Prepayments | 1,203 | 834 | (368) | (30.6%) | 1,645 | |
| Other assets | 72,410 | 93,421 | 21,011 | 29.0% | 184,226 | |
| Total other assets | 10,838,455 | 10,638,685 | (199,771) | (1.8%) | 20,979,461 | |
| TOTAL ASSETS | 13,781,177 | 13,210,140 | (571,037) | (4.1%) | 26,050,365 | |
Total Assets decreased Ch$571,037 million, and mainly due to:
• Ch$371,265 million decrease in Current Assets, equal to 12.6%, as a result of:
• Decrease in Trade accounts receivable and other receivables for Ch$174,420 million, primarily due to a reduction in trade account receivable in Codensa Ch$94,889 million, CAM Ch$32,309 million reclassified as held for sale, Edegel Ch$ 29,440 million, Edesur Ch$ 21,144 million, Gas Atacama Ch$19,486 million, Chilectra Ch$19,350 million, Costanera Ch$6,274 million, Edelnor Ch$5,828 million and Pehuenche Ch$5,566 million. The former negative changes were partially compensated by increases in El Chocón for Ch$26,657 million and Ampla for Ch$23,517 million.
Pg. 16
| PRESS RELEASE | |
• Decrease in Inventories by Ch$40,656 million, due to the decrease of CAM by Ch$24,600 million, which were transferred to assets held for sale, in Endesa Chile by Ch$8,962 million, Codensa Ch$5,135 million and Edelnor Ch$2,437 million.
• Decrease in Current tax receivable by Ch$40,525 million, mainly in Coelce Ch$12,401 million, Edesur Ch$8,405 million, Endesa Chile for Ch$7,998 million, Ampla in Ch$6,622 million and CAM in Ch$3,703 million.
• Ch$183,161 million decrease in cash and cash equivalent, primarily explained by decreases in times deposits in Endesa Chile for Ch$305,403 million used to pay debt and dividends and Enersis for Ch$89,200 million. This decrease in cash and cash equivalent was partially offset by increases in time deposits in Codensa for Ch$130,177 million, Cien for Ch$47,030 million, Emgesa for Ch$27,013 million and CGTF for Ch$18,367 million.
The above is partially offset by the increase in Non-current assets (or disposal groups) classified as held for sale by Ch$70,361 million (CAM).
• Decrease in Non-Current Assets in Ch$199,771 million equal to 1.8%, mainly due to:
• Decrease in Property, plants and equipment, by Ch$351,721 million as consequence of Ch$396,451 million in depreciation and impairment loss of the period and conversion effect to Chilean pesos from subsidiaries with a functional currency different to the Chilean peso, by approximately Ch$553,883 million, partially offset by additions in the period by Ch$614,264 million.
• Decrease in Trade accounts receivable and other receivables, net by Ch$124,306 million mainly due to the transfer to the short term of the Atacama Finance accounts receivables for Ch$54,801 million, in Codensa for Ch$59,903 million due to the sale of “Codensa Hogar” credit portfolio and the decrease of Foninvemen by Ch$29,850 million due to the conversion effect.
• Decrease in Deferred tax assets by Ch$56,404 million mainly due to the decrease of assets generated for deferred taxes derived from fiscal losses.
• Decrease in Available-for-sale financial assets in Ch$19,982 million due to the sale of EEB shares.
The above is partially offset by:
• Increase in Intangible Assets, net by Ch$ 320,580 million due to the increases in goodwill for Ch$140,068 million and the increase in concessions intangibles assets for Ch$173,493 million.
• Increase in other financial assets by Ch$24,000 million due to deposits in guaranty hold by Enersis as a backup of swaps.
• Increase in other assets by Ch$21,011 million due to more guaranties given in Ampla and Coelce in Brazil.
Pg. 17
| PRESS RELEASE | |
BOOKVALUE ANDECONOMICVALUE OFASSETS
Regarding the more important assets, the following should be mentioned:
Properties, Plants and Equipment are valued at their purchase cost, net of the corresponding accumulated depreciation and impairment loss they have been subject to. Properties, Plants and Equipment, net of their residual value, if applicable, are depreciated by linearly distributing the cost of their different elements along the estimated years of useful life, which is the period that the companies expect to use them. The useful life is reviewed regularly.
The capital gain (lower investments or goodwill value) generated by consolidation represents the acquisition cost surplus on the Group’s share in terms of the reasonable value of assets and liabilities, including the identifiable contingent liabilities of a Subsidiary at the time of acquisition.
Capital gain is not amortized. Instead, at the closing of each accounting period an assessment is made of whether any impairment has occurred during the period that could reduce its recoverable value to an amount below the registered net cost, proceeding in this event to make a timely impairment adjustment (See Note 3.d to the Consolidated Financial Statements).
Throughout the fiscal year and in particular at the date of closing, an assessment is made as to any indication of possible loss due to the impairment of any asset. In the event of any such indication, an estimate of the recoverable sum of said asset is made to determine, if applicable, the depreciated amount. If this involves identifiable assets that do not originate independent cash flows, the recoverability of the Cash Generating Unit that the asset belongs to is estimated, understanding as such the smaller Group of identifiable assets that generate independent cash incomes. As a result of this assessment, it has been determined that there is no impairment associated to businesses acquired, with the exception of the investment of our joint subsidiary Gas Atacama Holding Ltda., whose proof of depreciation determined that during 2007 the value recovered from said investment was in fact lower than its book value, thereby making provision for such.
Assets expressed in foreign currency are submitted at the prevalent exchange rate at the closing of the period.
Notes and accounts receivable from related companies are classified according to their short and long term maturities. These operations are adjusted according to prevalent market equity conditions.
In summary, assets are valued according to the International Financial Reporting Standards, whose criteria are expressed in Note 3 of the Consolidated Financial Statements.
Pg. 18
| PRESS RELEASE | |
LIABILITIES ANDSHAREHOLDERS’EQUITYUNDERIFRS
| Table 6 | ||||||
| LIABILITIES AND SHAREHOLDERS' EQUITY | Million Ch$ | Thousand US$ | ||||
| 2008 | 2009 | Var 08-09 | Chg % | 2009 | ||
| CURRENT LIABILITIES | ||||||
| Interest-bearing loans | 1,272,965 | 721,511 | (551,454) | (43.3%) | 1,422,819 | |
| Other financial liabilities | - | 697 | 697 | - | 1,374 | |
| Trade accounts payable and other payables | 949,309 | 976,506 | 27,198 | 2.9% | 1,925,668 | |
| Accounts payable to related companies | 116,022 | 111,956 | (4,066) | (3.5%) | 220,777 | |
| Provisions | 109,532 | 100,024 | (9,507) | (8.7%) | 197,248 | |
| Current tax payable | 201,275 | 185,286 | (15,990) | (7.9%) | 365,383 | |
| Other liabilities | 32,081 | 29,880 | (2,201) | (6.9%) | 58,923 | |
| Deferred revenues | 12,180 | 5,520 | (6,661) | (54.7%) | 10,885 | |
| Post-employment benefit obligations | 5,147 | 4,915 | (232) | (4.5%) | 9,693 | |
| Hedging instruments | 4,269 | 8,442 | 4,173 | 97.8% | 16,647 | |
| Liabilities (or disposal groups) classified as held for | - | 50,650 | 50,650 | - | 99,882 | |
| sale | ||||||
| Total current liabilities | 2,702,780 | 2,195,388 | (507,393) | (18.8%) | 4,329,299 | |
| NON-CURRENT LIABILITIES | ||||||
| Interest-bearing loans | 3,825,346 | 3,323,906 | (501,440) | (13.1%) | 6,554,735 | |
| Other financial liabilities | - | - | - | - | - | |
| Trade accounts payable and other payables | 49,134 | 58,728 | 9,594 | 19.5% | 115,810 | |
| Accounts payable to related companies | 8,978 | 3,557 | (5,421) | (60.4%) | 7,014 | |
| Provisions | 212,960 | 250,287 | 37,327 | 0.0% | 493,565 | |
| Deferred tax liabilities | 635,013 | 573,049 | (61,964) | (0) | 1,130,052 | |
| Other liabilities | 33,824 | 35,050 | 1,226 | 3.6% | 69,118 | |
| Deferred revenues | 4,420 | 3,552 | (867) | (19.6%) | 7,005 | |
| Post-employment benefit obligations | 175,537 | 182,689 | 7,152 | 4.1% | 360,262 | |
| Hedging instruments | 104,053 | 206,931 | 102,878 | 98.9% | 408,068 | |
| Total long-term liabilities | 5,049,265 | 4,637,749 | (411,516) | (8.2%) | 9,145,630 | |
| SHAREHOLDERS´ EQUITY | ||||||
| Issued share capital | 2,983,642 | 2,983,642 | - | 0.0% | 5,883,736 | |
| Reserves | (1,403,037) | (1,481,430) | (78,393) | 5.6% | (2,921,376) | |
| Retained earnings | 1,003,120 | 1,356,036 | 352,916 | 35.2% | 2,674,099 | |
| Net income for the period | 507,590 | 660,231 | 152,641 | 30.1% | 1,301,974 | |
| Total shareholders' equity attributable to | ||||||
| the Parent's company | 3,091,315 | 3,518,480 | 427,165 | 13.8% | 6,938,433 | |
Minority Interest | 2,937,816 | 2,858,524 | (79,292) | (2.7%) | 5,637,003 | |
| Total shareholders' equity | 6,029,131 | 6,377,004 | 347,872 | 5.8% | 12,575,436 | |
| TOTAL LIABILITIES AND SHAREHOLDERS' EQUITY | 13,781,176 | 13,210,140 | (571,036) | (4.1%) | 26,050,365 | |
Pg. 19
| PRESS RELEASE | |
The company’sTotal Liabilities decreased by Ch$571,036 million from the period ended on December 2008, largely due to the Ch$347,872 million increase in Shareholders’ Equity and the decrease in current plus non-current liabilitites in Ch$918,909 million. The detail is explained as follows:
• Decrease inCurrent Liabilities of Ch$507,393 million, a 18.8%, due to:
• Loans that accrue interest declining by Ch$551,454 million primarily in Endesa Chile for Ch$280,101 million, for the payment of bonds and the effect of a lower exchange rate and the decrease in the value of the UF, in Enersis for Ch$130,940 million for the payment of loans, in Emgesa for Ch$91,389 million, in Edegel for Ch$38,139 million, in Edelnor for Ch$15,325 million, Chilectra Ch$12,319 million and Edesur Ch$5,081 million; partially compensated by the increase in Gas Atacama for Ch$34,637 million for the transfer from long term debt, in Endesa Brazil Ch$6,799 million and in Codensa Ch$5,947 million.
• Decrease in Current tax payable for Ch$15,990 million which mainly corresponds to a lower Value Added Tax (“IVA”).
• Decrease in current provisions in Ch$9,507 million due to lower liabilities as a consequence of lower energy purchases provisions (Endesa Chile).
Partially offset by:
• Increase in trade accounts payable and other payables in Ch$27,198 million, primarily due to the increases in energy suppliers and dividends payable to third parties, partially compensated by a decrease in accounts payable to services suppliers.
• Non Current Liabilities decreased by Ch$411,516 million, equal to an 8.2%, mainly to:
• Decrease in Loans that accrue interest in Ch$501,440 million primarily in Endesa Chile for Ch$310,440 million, due to the effect of lower exchange rate and the UF, Codensa for Ch$111,437 million, due to the transfer of bonds to the short term and the conversion effect Enersis for Ch$80,805 million, Gas Atacama for Ch$54,675 million, Edegel for Ch$38,374 million, Costanera for Ch$24,416 million and El Chocón for Ch$7,429 million, partially compensated by the increase in debt at Emgesa for Ch$83,709 million due to loans in local currency, Group Endesa Brazil for Ch$36,986 million, Endesa ECO for Ch$9,524 million and in Edelnor for Ch$5,508 million.
• Decrease of Deferred tax liabilities for Ch$61,964 million as a consequence of the conversion effect in foreign subsidiaries for Ch$41,220 million and lower deferred taxes in Endesa Chile Ch$15,273 million, Edelnor Ch$13,711 million, Edesur Ch$ 5,149 million, San Isidro Ch$4,057 million and in Celta for Ch$2,936 million, partially compensated by increases in Edegel for Ch$9,192 millions, Codensa for Ch$6,024 million, Gas Atacama for Ch$5,703 million and Chilectra for Ch$2,793 million.
The above is partially offset by:
• Increase in Hedging instruments for Ch$102,878 million, basically due to the increase in the Mark to Market of derivatives in Enersis for Ch$105,988 million.
• Increase in provisions for Ch$37,327 million principally in Brazil due to higher legal claims and the conversion effect.
Net Shareholders’ equity increased by Ch$347,873 million with respect to December 2008. The Total shareholders' equity attributable to the Parent's company increased in Ch$427,165 million which is explained mainly by the Ch$660,231 million period result, the increase in coverage derivatives reserves for Ch$92,118 million, diminish in the reserves of conversion over investments and capital gains purchased for Ch$80,352 million, decrease derived from the register of the 2008 definitive dividend complement for Ch$29,773 million and the register of minimum dividend of the year 2009 for Ch$198,069 million.
Pg. 20
| PRESS RELEASE | |
The minorities participation decreased in Ch$79,292 million, as a consequence of the conversion net effects, minimum dividend, coverage derivatives reserves and minorities net income.
DEBTMATURITY WITHTHIRDPARTIES,MILLIONCH$
| Table 7 | ||||||||||||||||
| TOTAL | ||||||||||||||||
| Million Ch$ | 2010 | 2011 | 2012 | 2013 | 2014 | 2015 | Balance | |||||||||
Chile | 181,056 | 111,484 | 21,437 | 213,095 | 378,239 | 2,591 | 880,153 | 1,788,056 | ||||||||
| Enersis | 1,960 | 2,072 | 2,191 | 2,317 | 268,811 | 2,591 | 219,552 | 499,494 | ||||||||
| Chilectra | 113 | - | - | - | - | - | - | 113 | ||||||||
| Other (*) | 875 | - | - | - | - | - | - | 875 | ||||||||
| Endesa Chile (**) | 178,109 | 109,411 | 19,246 | 210,778 | 109,428 | - | 660,601 | 1,287,574 | ||||||||
| Argentina | 62,211 | 68,739 | 34,516 | 12,930 | 14,524 | - | - | 192,920 | ||||||||
| Edesur | 10,581 | 17,240 | 14,905 | 385 | 249 | - | - | 43,361 | ||||||||
| Costanera | 36,456 | 23,964 | 13,205 | 12,545 | 14,274 | - | - | 100,444 | ||||||||
| Chocon | 15,035 | 27,535 | 6,405 | - | - | - | - | 48,975 | ||||||||
| Hidroinvest | 139 | - | - | - | - | - | - | 139 | ||||||||
| CTM | - | - | - | - | - | - | - | - | ||||||||
| Tesa | - | - | - | - | - | - | - | - | ||||||||
Peru | 51,438 | 63,450 | 95,282 | 49,547 | 48,415 | 10,460 | 80,144 | 398,737 | ||||||||
| Edelnor | 14,886 | 33,975 | 29,549 | 25,259 | 25,707 | 10,460 | 24,641 | 164,476 | ||||||||
| Edegel | 36,552 | 29,475 | 65,733 | 24,289 | 22,709 | - | 55,503 | 234,261 | ||||||||
Brazil | 242,172 | 255,563 | 271,882 | 102,293 | 60,712 | 2,447 | 43,888 | 978,956 | ||||||||
| Endesa Brasil | 55,497 | - | - | - | - | - | - | 55,497 | ||||||||
| Coelce | 42,578 | 68,047 | 56,331 | 46,587 | 39,443 | - | 10,136 | 263,121 | ||||||||
| Ampla | 78,318 | 120,747 | 149,535 | 48,638 | 13,689 | 1,831 | 13,694 | 426,451 | ||||||||
| Cachoeira | - | - | - | - | - | 616 | (616) | - | ||||||||
| Cien | 60,668 | 60,624 | 59,427 | - | - | - | - | 180,719 | ||||||||
| Fortaleza | 5,112 | 6,144 | 6,590 | 7,068 | 7,580 | - | 20,674 | 53,168 | ||||||||
| Colombia | 122,489 | 109,148 | 84,027 | 39,938 | 97,157 | 3,223 | 347,748 | 803,730 | ||||||||
| Codensa | 82,799 | 49,613 | 8,365 | 39,938 | 62,016 | 3,223 | 113,740 | 359,693 | ||||||||
| Emgesa | 39,690 | 59,535 | 75,662 | - | 35,141 | - | 234,009 | 444,037 | ||||||||
TOTAL | 659,366 | 608,383 | 507,144 | 417,803 | 599,047 | 18,721 | 1,351,934 | 4,162,398 | ||||||||
| (*) Includes: Endesa Chile, Pangue, Pehuenche, San Isidro, Celta and Túnel El Melón. | ||||||||||||||||
Pg. 21
| PRESS RELEASE | |
DEBTMATURITY WITHTHIRDPARTIES,THOUSANDUS$
| Table 7.1 | ||||||||||||||||
| TOTAL | ||||||||||||||||
| Thousand US$ | 2010 | 2011 | 2012 | 2013 | 2014 | 2015 | Balance | |||||||||
Chile | 357,042 | 219,845 | 42,274 | 420,223 | 745,886 | 5,110 | 1,735,660 | 3,526,042 | ||||||||
| Enersis | 3,864 | 4,086 | 4,321 | 4,570 | 530,094 | 5,110 | 432,956 | 985,002 | ||||||||
| Chilectra | 222 | - | - | - | - | - | - | 222 | ||||||||
| Other | 1,725 | - | - | - | - | - | - | 1,725 | ||||||||
| Endesa Chile (*) | 351,231 | 215,759 | 37,953 | 415,653 | 215,792 | - | 1,302,704 | 2,539,093 | ||||||||
Argentina | 122,680 | 135,553 | 68,065 | 25,498 | 28,641 | - | - | 380,437 | ||||||||
| Edesur | 20,866 | 33,997 | 29,393 | 760 | 492 | - | - | 85,508 | ||||||||
| Costanera | 71,890 | 47,257 | 26,040 | 24,738 | 28,149 | - | - | 198,075 | ||||||||
| Chocon | 29,649 | 54,298 | 12,632 | - | - | - | - | 96,579 | ||||||||
| Hidroinvest | 275 | - | - | - | - | - | - | 275 | ||||||||
| CTM | - | - | - | - | - | - | - | - | ||||||||
| Tesa | - | - | - | - | - | - | - | - | ||||||||
Peru | 101,436 | 125,124 | 187,896 | 97,707 | 95,475 | 20,627 | 158,044 | �� | 786,308 | |||||||
| Edelnor | 29,355 | 66,999 | 58,270 | 49,810 | 50,694 | 20,627 | 48,592 | 324,346 | ||||||||
| Edegel | 72,081 | 58,124 | 129,626 | 47,897 | 44,782 | - | 109,452 | 461,962 | ||||||||
Brazil | 477,562 | 503,969 | 536,151 | 201,721 | 119,725 | 4,825 | 86,547 | 1,930,499 | ||||||||
| Endesa Brasil | 109,440 | - | - | - | - | - | - | 109,440 | ||||||||
| Coelce | 83,964 | 134,188 | 111,084 | 91,870 | 77,781 | - | 19,987 | 518,875 | ||||||||
| Ampla | 154,442 | 238,112 | 294,882 | 95,913 | 26,995 | 3,611 | 27,005 | 840,961 | ||||||||
| Cachoeira | - | - | - | - | - | 1,214 | (1,214) | - | ||||||||
| Cien | 119,637 | 119,551 | 117,189 | - | - | - | - | 356,377 | ||||||||
| Fortaleza | 10,080 | 12,117 | 12,995 | 13,938 | 14,948 | - | 40,769 | 104,847 | ||||||||
Colombia | 241,548 | 215,240 | 165,700 | 78,758 | 191,593 | 6,355 | 685,759 | 1,584,953 | ||||||||
| Codensa | 163,279 | 97,836 | 16,495 | 78,758 | 122,295 | 6,355 | 224,294 | 709,314 | ||||||||
| Emgesa | 78,269 | 117,404 | 149,205 | - | 69,297 | - | 461,465 | 875,640 | ||||||||
TOTAL | 1,300,269 | 1,199,731 | 1,000,086 | 823,907 | 1,181,320 | 36,917 | 2,666,010 | 8,208,240 | ||||||||
| (*) Includes: Endesa Chile, Pangue, Pehuenche, San Isidro, Celta and Túnel El Melón. | ||||||||||||||||
EVOLUTIONOFKEYFINANCIALRATIOS
| Table 8 | ||||||||||
| Indicator | Unit | 2008 | 2009 | Var 08-09 | Chg % | |||||
| Liquidity | Times | 1.09 | 1.17 | 0.08 | 7.3% | |||||
| Acid ratio test * | Times | 1.05 | 1.14 | 0.09 | 8.6% | |||||
| Working capital | million Ch$ | 239,941 | 376,068 | 136,127 | 56.7% | |||||
| Working capital | th. US$ | 428,723 | 671,954 | 243,230 | 56.7% | |||||
| Leverage ** | Times | 1.29 | 1.07 | (0.22) | (17.1%) | |||||
| Short-term debt | % | 35.0 | 32.0 | (2.94) | (8.6%) | |||||
| Long-term debt | % | 65.0 | 68.0 | 2.94 | 4.6% | |||||
| * Current assets net of inventories and prepaid expenses | ||||||||||
| ** Using the ratio = Total debt / (equity + minority interest) | ||||||||||
| Indicator | Unit | 2008 | 2009 | Var 08-09 | Chg % | |||||
| Financial Expenses Coverage*** | Times | 3.80 | 5.21 | 1.42 | 37.6% | |||||
| Op.Income / Op.Rev. | % | 28.4 | 29.8 | 1.43 | 5.0% | |||||
| ROE | % | 16.4 | 18.8 | 2.34 | 14.3% | |||||
| ROA | % | 7.5 | 9.9 | 2.42 | 32.3% | |||||
| ***EBITDA/Financial Costs | ||||||||||
Liquidity index as of December, 2009 was 1.17, an improvement of 0.08 or an equivalent of 7.3% compared to December, 2008. This situation reflects a persistent strong liquidity position, maintaining its bank borrowings and financing its investments with its cash surpluses and having a satisfactory debt maturity pattern.
Leverage ratio was 1.07, a reduction of 0.22 compared to December, 2008, mainly explained by the decrease in Total Liabilities as a consequence of the variations in the UF that affected UF-denominated
Pg. 22
| PRESS RELEASE | |
debt and the decrease in the company’s debt stock as a result of the maturity of certain debts which were repaid using internally generated cash flow. Additionally, the improvement in the Leverage ratio is the consequence of the increase in Total Shareholder’s Equity.
Financial Expenses Coverage increased 1.42 times or an equivalent 37.6%, going from 3.80 in December 2008 to 5.21 for the current period. The aforementioned is the result of a significant increase in EBITDA generation and the positive impact in financial expenses as a result of the decrease in UF over UF-denominated debt.
Operating Income over Operating Revenues profitability increased 5.0%, reaching a 29.8% in December, 2009.
The annualROE of the Parent Company increase from 16.4% to 18.8% in December, 2009. This increase is derived from higher results from the period despite an increase in Parent Company equity.
AnnualROA increased from 7.5% as of December 2008 to 9.9% in December 2009, reflecting the improving in 2009’s results and also a decrease in Total Assets.
Pg. 23
| PRESS RELEASE | |
CONSOLIDATEDSTATEMENTS OFCASHFLOWSANALYSIS
UNDERIFRS
| Table 9 | ||||||
| CASH FLOW | Million Ch$ | Thousand US$ | ||||
| 2008 | 2009 | Var 08-09 | Chg % | 2009 | ||
| CASH FLOWS PROVIDED BY (USED IN) OPERATIONS | ||||||
| Net income (loss) for the year | 1,034,182 | 1,311,328 | 277,146 | 26.8% | 2,343,064 | |
| Adjustments to Reconcile to Operating Income | 831,008 | 638,507 | (192,501) | (23.2%) | 1,140,876 | |
| Adjustments to Reconcile to Operating Income | - | - | - | - | - | |
| Financial expenses | 577,487 | 460,691 | (116,796) | (20.2%) | 823,158 | |
| Financial income | (181,753) | (159,670) | 22,083 | 12.1% | (285,297) | |
| Dividend income | (36) | (138) | (102) | - | (246) | |
| Income tax | 415,903 | 359,738 | (56,165) | (13.5%) | 642,775 | |
| Share of the (profit) loss of associates accounted for using the equity method, | (3,261) | (2,236) | 1,025 | 31.4% | (3,995) | |
| net of cash distributions received | ||||||
| Other (Increases) decreases to Reconcile to Operating Income | 22,669 | (19,878) | (42,547) | (187.7%) | (35,518) | |
| Operating Income | 1,865,190 | 1,949,834 | 84,644 | 4.5% | 3,483,940 | |
| Non monetary adjustments: | - | - | ||||
| Depreciation | 330,545 | 346,588 | 16,043 | 4.9% | 619,278 | |
| Amortization of intangibles | 87,165 | 107,782 | 20,617 | 23.7% | 192,584 | |
| (Reversal of) Impairment losses | - | 65,927 | 65,927 | - | 117,798 | |
| Unrealized foreign currency exchange differences, net | - | - | - | - | - | |
| Change in the value of Investment Property | - | - | - | - | - | |
| Non realized Gain (loss) on the fair value of hedging instruments | - | - | - | - | - | |
| (Gain) loss on sale of non-current assets not held for sale | (1,539) | (25,198) | (23,659) | - | (45,023) | |
| Gain (loss) on the sale of other assets and financial liabilities | - | - | - | - | - | |
| Participation in (profits) loss of investments | - | - | - | - | - | |
| Increase in provisions | 34,290 | 104,172 | 69,882 | - | 186,133 | |
| Reversal of unused provisions | (29,414) | (49,448) | (20,034) | (68.1%) | (88,354) | |
| Used provisions | (27,282) | (38,287) | (11,005) | (40.3%) | (68,411) | |
| (Increase) decrease in deferred tax Assets | (1,805) | (6,786) | (4,981) | (276.0%) | (12,125) | |
| Increase (decrease) in deferred tax Liabilities | (3,008) | (3,092) | (84) | (2.8%) | (5,524) | |
| Other non-monetary adjustments | 8,924 | 7,679 | (1,245) | (14.0%) | 13,720 | |
| Total Non monetary adjustments: | 397,876 | 509,337 | 111,461 | 28.0% | 910,077 | |
| Increase (Decrease) in Working Capital in: | ||||||
| Increase (decrease) in non current assets and Disposal Groups | ||||||
| available for sale | - | (92,277) | (92,277) | - | (164,879) | |
| Inventories | 8,249 | 31,683 | 23,434 | - | 56,610 | |
| Trade accounts receivable and other receivables, net | (168,320) | 112,512 | 280,832 | 166.8% | 201,036 | |
| Prepayments | (18,692) | (4,620) | 14,072 | 75.3% | (8,254) | |
| Other assets | 40,485 | 140,620 | 100,135 | 247.3% | 251,259 | |
| Trade accounts payable and other payables | (55,137) | (218,629) | (163,492) | - | (390,644) | |
| Deferred revenues | 1,493 | (4,037) | (5,530) | - | (7,214) | |
| Accruals | (7,954) | (13,316) | (5,362) | (67.4%) | (23,794) | |
| Taxes Payable | (81,059) | (134,097) | (53,038) | (65.4%) | (239,604) | |
| Post-employment benefit obligations | 19,622 | 10,385 | (9,237) | (47.1%) | 18,557 | |
| Other liabilities | (10,250) | (15,480) | (5,230) | (51.0%) | (27,659) | |
| Increase (Decrease) in Working Capital | (271,561) | (187,256) | 84,305 | 31.0% | (334,586) | |
| Cash Flows provided by (used in) Other Operating Activities | ||||||
| Proceeds from Dividends classified as operational | - | - | - | - | - | |
| Payments of dividends classified as operating | - | - | - | - | - | |
| Proceeds from interest received classified as operating | - | - | - | - | - | |
| Payments of interest classified as operating | - | - | - | - | - | |
| Proceeds from refunded income tax | 3,980 | 195 | (3,785) | (95.1%) | 348 | |
| Payments of income tax | (83,099) | (233,884) | (150,785) | (181.5%) | (417,901) | |
| Other inflows (outflows) from other operating activities | (1,189) | 103 | 1,292 | 108.7% | 185 | |
| Net cash flows provided by (used in) operating activities | (80,307) | (233,586) | (153,279) | (190.9%) | (417,368) | |
| NET CASH FLOW FROM OPERATING ACTIVITIES | 1,911,197 | 2,038,330 | 127,133 | 6.7% | 3,642,063 | |
Pg. 24
| PRESS RELEASE | |
UNDERIFRS
| Cont. Table 9 | ||||||
| NET CASH FLOW FROM OPERATING ACTIVITIES | 1,911,197 | 2,038,330 | 127,133 | 6.7% | 3,642,063 | |
| CASH FLOWS PROVIDED BY (USED IN) INVESTING ACTIVITIES | - | |||||
| Proceeds from sales of property, plant and equipment | 14,139 | 7,559 | (6,580) | (46.5%) | 13,507 | |
| Proceeds from sales of intangible assets | - | 5,292 | 5,292 | - | 9,456 | |
| Proceeds from sales of other financial assets | 7,731 | 190,167 | 182,436 | - | 339,788 | |
| Proceeds from the sale of other assets | - | - | - | - | - | |
| Other cash flows provided by (used in) investing activities | 86,576 | 9,848 | (76,728) | (88.6%) | 17,596 | |
| Proceeds from dividends classified for investing purposes | 5,826 | 2,676 | (3,150) | (54.1%) | 4,781 | |
| Proceeds from interest received classified for investing purposes | 11,043 | 4,346 | (6,697) | (60.6%) | 7,766 | |
| Purchase of property, plant and equipment | (496,751) | (526,522) | (29,771) | (6.0%) | (940,783) | |
| Acquisitions of investment properties | (50) | (13) | 37 | 74.9% | (23) | |
| Acquisitions of intangible assets | (284,741) | (209,940) | 74,801 | 26.3% | (375,118) | |
| Acquisitions of subsidiaries, net of cash acquired | - | - | - | - | - | |
| Acquisitions of associates | - | - | - | - | - | |
| Acquisitions of joint ventures, net of cash acquired | - | (19,912) | (19,912) | - | (35,579) | |
| Loans to related companies | (27,299) | (8,615) | 18,684 | 68.4% | (15,393) | |
| Other investment disbursements | (23,576) | (322,154) | (298,578) | - | (575,620) | |
| NET CASH FLOW FROM INVESTING ACTIVITIES | (707,101) | (867,267) | (160,166) | (22.7%) | (1,549,621) | |
| CASH FLOWS PROVIDED BY (USED IN) FINANCING ACTIVITIES | - | |||||
| Loans obtained | 1,091,907 | 578,126 | (513,781) | (47.1%) | 1,032,988 | |
| Proceeds from issuance of other financial liabilities | 332,344 | 248,314 | (84,030) | (25.3%) | 443,685 | |
| Proceeds from loans from related companies | 412 | - | (412) | (100.0%) | - | |
| Revenue from other financing sources | 470 | 8 | (462) | (98.2%) | 15 | |
| Payments of loans | (893,390) | (807,136) | 86,254 | 9.7% | (1,442,181) | |
| Repayment of other financial liabilities | (329,637) | (476,216) | (146,579) | (44.5%) | (850,896) | |
| Repayments of liabilities for financial leases | (6,996) | (3,172) | 3,824 | 54.7% | (5,667) | |
| Payments of loans to related parties | (14,160) | (16,987) | (2,827) | (20.0%) | (30,351) | |
| Payments of interest classified for financing purposes | (230,037) | (252,737) | (22,700) | (9.9%) | (451,587) | |
| Dividends paid to minority interest | (311,148) | (356,030) | (44,882) | (14.4%) | (636,150) | |
| Dividends paid to shareholders of the company | (149,062) | (222,577) | (73,515) | (49.3%) | (397,698) | |
| Other cash flows provided by (used in) financing activities | - | - | - | - | - | |
| CASH FLOWS PROVIDED BY (USED IN) FINANCING ACTIVITIES | (509,297) | (1,308,406) | (799,109) | (156.9%) | (2,337,844) | |
| Net Increase (Decrease) in Cash and Cash Equivalents | 694,799 | (137,343) | (832,142) | (119.8%) | (245,403) | |
| Effects of foreign exchange rate variations on cash and cash equivalents | 34,386 | (45,818) | (80,204) | - | (81,867) | |
| Effect of changes in scope of consolidation on cash and cash equivalents | - | - | - | - | - | |
| Beginning balance of cash and cash equivalents, statement of cash flows | 588,877 | 1,318,062 | 729,185 | 123.8% | 2,355,097 | |
| Ending Balance of Cash and Cash Equivalents, Statement of Cash Flows | 1,318,062 | 1,134,901 | (183,161) | (13.9%) | 2,027,827 | |
The company generated a negative cash flow of Ch$137,343 million for the period, which can be broken down as follows:
Operating activities generated a positive net cash flow of Ch$2,038,330 million that represents an increase of 6.7% regarding last year’s. This cash flow is composed primarily with net income of the period for Ch$1,311,328 million, adjustments to reconcile to operating income for Ch$638,507 million, non monetary adjustments for Ch$ 509,337 million mainly for fixed asset amortization and depreciation for Ch$520,297 million, provisions for Ch$104,172 million, partially compensated by the reversal of provisions for Ch$87,736 million.
In addition, variations in working capital show a Ch$187,256 million decrease for and the utilization of flows in other operating activities for Ch$233,586 million, being tax paid the principal amount for Ch$233,884.
Investment activitiesgenerated a net negative cash flow of Ch$867,267 million, which compared whith the same period of the preceding year represents a decrease of 22.7% or Ch$160,166 million. This flow corresponds primarily to the incorporation of fixed assets for Ch$526,522 million, intangibles purchases
Pg. 25
| PRESS RELEASE | |
for Ch$209,940 million mainly attributable to Edegel and Edelnor, investments in related companies for Ch$310,384 million (Edegel, Edelnor and Cundinamarca), other disposal in investments for Ch$31,682 million. The former is partially compensated by proceeds for sale of financial assets by Ch$190,167 million (Codensa Hogar and Empresa Eléctrica de Bogotá) and fixed assets and intangible sales for Ch$12,852 million.
Financing activities originated a negative cash flow of Ch$ 1,275,788 million, due to repayments of loans for Ch$ 807,136 million, dividends paid for Ch$578,607 million, interests paid for Ch$220,119 million and other financial payments for Ch$476,216 million. The aforementioned was partially compensated for Loans obtained for Ch$578,126 million and Proceeds from issuance of bonds for Ch$248,314 million.
CASHFLOWRECEIVEDFROMFOREIGNSUBSIDIARIES BYENERSIS,CHILECTRA ANDENDESACHILE
| Table 10 | ||||||||||||||||||
| Interest Received | Dividends Received | Others | ||||||||||||||||
| Millions Ch$ | Thousand US$ | Millions Ch$ | Thousand US$ | Millions Ch$ | Thousand US$ | |||||||||||||
| 2008 | 2009 | 2009 | 2008 | 2009 | 2009 | 2008 | 2009 | 2009 | ||||||||||
| Argentina | 1,072 | 812 | 1,452 | 187 | 4,719 | 8,432 | - | - | - | |||||||||
| Peru | - | - | - | 13,825 | 24,670 | 44,080 | - | - | - | |||||||||
| Brazil | 14,610 | 6,640 | 11,864 | 57,105 | 175,916 | 314,324 | - | - | - | |||||||||
| Colombia | - | - | - | 59,588 | 54,512 | 97,401 | - | 47,914 | 85,612 | |||||||||
| Chile | - | - | - | - | - | - | ||||||||||||
| Total | 15,683 | 7,452 | 13,316 | 130,706 | 259,817 | 464,238 | - | 47,914 | 85,612 | |||||||||
| Total Cash Received | ||||||
| Millions Ch$ | Thousand US$ | |||||
| 2008 | 2009 | 2009 | ||||
| Argentina | 1,259 | 5,532 | 9,884 | |||
| Peru | 13,825 | 24,670 | 44,080 | |||
| Brazil | 71,715 | 182,556 | 326,188 | |||
| Colombia | 59,588 | 102,426 | 183,014 | |||
| Chile | - | - | - | |||
| Total | 146,388 | 315,183 | 563,166 | |||
| Source: Internal Financial Report | ||||||
Pg. 26
| PRESS RELEASE | |
CAPEX ANDDEPRECIATION
| Table 11 | |||||||||
| Payments for Additions of Fixed assets | Depreciation | ||||||||
| Million Ch$ | Thousand US$ | Million Ch$ | Thousand US$ | ||||||
| Million Ch$ | 2008 | 2009 | 2009 | 2008 | 2009 | 2009 | |||
| Endesa Chile | 254,225 | 314,067 | 561,171 | 182,631 | 192,773 | 344,444 | |||
| Cachoeira | 1,938 | 2,922 | 5,221 | 6,903 | 7,218 | 12,898 | |||
| Endesa Fortaleza | 1,357 | 3,653 | 6,527 | 7,735 | 7,646 | 13,661 | |||
| Cien | 1,263 | - | - | 17,033 | 18,060 | 32,269 | |||
| Chilectra S.A. | 61,805 | 43,846 | 78,343 | 17,284 | 20,276 | 36,229 | |||
| Edesur S.A. | 71,127 | 46,997 | 83,974 | 16,430 | 16,006 | 28,600 | |||
| Edelnor S.A. | 34,569 | 37,708 | 67,377 | 18,667 | 19,696 | 35,192 | |||
| Ampla (*) | 127,334 | 107,203 | 191,548 | 46,053 | 55,496 | 99,160 | |||
| Coelce (*) | 148,251 | 93,291 | 166,691 | 34,271 | 40,991 | 73,243 | |||
| Codensa S.A. | 58,166 | 68,834 | 122,991 | 51,745 | 55,084 | 98,424 | |||
| Cam Ltda. | 2,931 | 3,004 | 5,368 | 2,029 | 1,742 | 3,113 | |||
| Inmobiliaria Manso de Velasco Ltda. | 2,197 | 705 | 1,259 | 253 | 253 | 452 | |||
| Synapsis Soluciones y Servicios Ltda. | 5,491 | 3,906 | 6,979 | 3,126 | 2,851 | 5,095 | |||
| Holding Enersis y sociedades de Inversión | 1,681 | 880 | (1,147) | 1,090 | 1,169 | 2,088 | |||
| Total | 772,335 | 727,015 | 1,296,303 | 405,248 | 439,260 | 784,867 | |||
| (*) Includes concessions intangible assets. | |||||||||
THEPRINCIPALRISKS ASSOCIATED TO THE ACTIVITIES OF THEENERSISGROUP
Commercial and Regulatory Risk
The Group’s activities are subject to a broad range of governmental standards and environmental regulations. Any modification of such standards and issues may affect the Group’s activities, economic situation and operating results.
The Group’s distribution activity is subject to a broad range of rules regarding tariffs and other issues that govern their activities in each of the countries where it operates and which could modify distribution subsidiaries operating results.
The Group’s generation activity requires environmental impact studies, acquisition of licenses, permits and other mandatory approvals as well as to be in compliance with all the requirements provided for in such licenses, permits and standards.
The Group’s generation activity is subject to existing hydrological and atmospheric conditions in the broad geographic zones in which the Group’s hydroelectric generating plants are located. Commercial policies have been planned in order to moderate the possible impact of changes in these variables.
Interest Rate Risk
Interest rate variations modify the reasonable value of those assets and liabilities that accrue a fixed interest rate, as well as the future flow of assets and liabilities pegged to a variable interest rate.
Consistent with current interest rate hedging policy, the portion of fixed and/or hedged debt rate to the total gross debt was 36.0% as of December 2009 on a consolidated basis.
Pg. 27
| PRESS RELEASE | |
Depending on the Group’s forecasts and debt structure objectives, hedging transactions take place through contracted derivatives that mitigate these risks.
Exchange Rate Risk
The exchange rate risk is mainly related to the following transactions: Foreign currency debts contracted by Group’s companies, payments made on international markets for the acquisition of projects related materials, group companies’ incomes directly linked to the evolution of the dollar and Cash flows from subsidiary companies to headquarters in Chile are exposed to exchange rate fluctuations.
In order to mitigate exchange rate risks, Enersis’ exchange rate hedging policy is based on cash flows and it strives to maintain a balance between the flows indexed to dollar and the asset and liability levels in such currency. Currency swaps and exchange rate forwards are the instruments currently used in compliance with this policy. Likewise, the policy strives to refinance debts in each company’s functional currency.
Commodities Risk
Enersis is exposed to the price fluctuation risk on some commodities, basically of fuel purchases for the electricity generation and also of energy transactions in the local markets.
With the objective of reducing risks in extreme drought situations, the company has designed a trading policy that defines sales commitment levels consistent with its generating plants’ sound energy capacity in a dry year and includes risk mitigation clauses in some contracts with non regulated clients.
Liquidity Risk
In engaging committed long term borrowing facilities and short term financial investments the Group maintains a consistent liquidity policy, for the adequate amounts required to support projected needs for the period, contingent with the situation and the expectations of the debt and equity markets.
As of December, 2009, the Enersis Group held liquidity in the amount of Ch$ 1,134,900 million in cash and cash equivalent and Ch$235,550 million in available credit lines. As of December, 2008, the Enersis Group held liquidity in the amount of Ch$ 1,318,062 million in cash and cash equivalent and Ch$127,290 million in available credit lines.
Credit Risk
Credit risk in accounts receivable, originating from trading activities, is historically very limited given that the short term collection conditions to customer doesn’t allow them to individually accumulate significant amounts. Additionally, in the case of the so called “unregulated clients” of our electricity generation and distribution business, a formal procedure is applied to control the credit risk, using a systematic evaluation of our counterparties, index definition and credit risk factors by virtue of which the contracts are approved or additional guarantee demands are defined.
Furthermore, in our electricity generating business line, in the event of non-payment, some countries allow power supply cut-offs, and in almost all contracts such lack of payment is established as cause for contract termination. To this end, credit risks are constantly monitored and the maximum amounts exposed to payment risks are measured, which, as has been said, are limited.
In turn, in our electricity distribution business line, the energy supply cut-off is, in all cases, a power held by our companies when faced with default by our customers, applied in accordance with the regulation in force in each country, enabling the credit risk evaluation and control process, which in fact is also limited.
Pg. 28
| PRESS RELEASE | |
Surplus cash flow investments are placed in prime national and foreign financial entities (with an investment grade equivalent risk rating) with established limits set for each entity (not more than 30% per entity).
In the selection of banks for investment, consideration is given to those that hold two investment grade classifications, considering the three main international risk agencies (Moody’s, S&P and Fitch).
Positions are backed up by treasury bonds from the country of operations and instruments issued by the most reputable banks, favoring, wherever possible, the first ones.
Derivatives are engaged through highly solvent entities such that about 90% of operations are carried out with entities that hold an A or higher rating.
Risk Measurement
The Enersis Group measures the Value at Risk of its debt and financial derivatives positions with a view to guaranteeing that the risk taken by the company remains consistent with the risk exposure defined by Management, thus restricting the volatility of its financial results. The positions portfolio used in the calculations of the current Value at Risk is comprised of debt and financial derivatives.
The calculated Value at Risk represents the possible value loss of the aforementioned positions portfolio over one day time horizon with 95% probability. To this end the volatility of the risk variables that affect the value of the positions portfolio has been studied, including: The U.S. dollar Libor interest rate, the usual banking local indexes for debts, and taking into account the different currencies our companies operate under and the exchange rates of the different currencies involved in the calculation.
Other Risks
A portion of Enersis and Endesa Chile’s debt is subject to cross default provisions. If certain defaults in debt of certain specific subsidiaries are not remedied within specified grace periods, a cross default could affect Endesa Chile and Enersis, and under certain scenarios, debts at the holding company level could be accelerated.
Nonpayment – after any applicable grace period – of the debts of Enersis and Endesa Chile, or their so-called Relevant Subsidiaries, with an individual principal amount outstanding in excess of US$ 50 million dollars (or its equivalent in other currencies), and with a missed payment also in excess of US$ 50 million dollars, could give rise to a cross default of several bank revolving debt facilities at the Endesa Chile and Enersis levels. Furthermore, some of these debt facilities are also subject to cross acceleration provisions in the event of a default in other Relevant Subsidiary debt, for reasons other than payment default, for events such as bankruptcy, insolvency proceedings, and materially adverse governmental or legal actions, in all cases for amounts in excess of US$ 50 million dollars.
Similarly, nonpayment – after any given applicable grace period - of the debts of these companies or any of their Chilean subsidiaries, in single indebtedness in default with a principal in excess of US$ 30 million dollars, could potentially give rise to a cross default of Enersis and Endesa Chile Yankee bonds.
There are no clauses in the credit agreements by which changes in the corporate or debt classification of these companies from risk classification agencies could trigger prepayments. Nevertheless, a modification in the Standard & Poor’s (S&P) debt risk classification in foreign currency could trigger a change in the margin applicable to determine the interest rate, in the credit loans issued in 2004 and 2006.
Pg. 29
| PRESS RELEASE | |

ARGENTINA
GENERATION
ENDESACOSTANERA
Operating income amounted to Ch$ 4,380 million, 76% below the level of the same period of 2008. The above is explained by lower physical sales, an increase in Procurements and Services costs due to higher fuel consumption and negative conversion effect from local currency to Chilean pesos, which reduced 7.9% the year 2009 results compared to last year’s figure.
| Table 12 | ||||||
| Endesa Costanera | Million Ch$ | Thousand US$ | ||||
| 2008 | 2009 | Var 08-09 | Chg % | 2009 | ||
| Total Revenues | 240,087 | 231,422 | (8,666) | (3.6%) | 413,501 | |
| Procurements and Services | (188,737) | (190,815) | (2,078) | (1.1%) | (340,946) | |
| Contribution Margin | 51,350 | 40,606 | (10,744) | (20.9%) | 72,555 | |
| Other Costs | (15,690) | (17,368) | (1,678) | (10.7%) | (31,032) | |
| Gross Operating Income (EBITDA) | 35,661 | 23,239 | (12,422) | (34.8%) | 41,522 | |
| Depreciation and Amortization | (17,236) | (18,859) | (1,623) | (9.4%) | (33,696) | |
| Operating Income | 18,425 | 4,380 | (14,045) | (76.2%) | 7,826 | |
| Figures may differ from those accounted under Argentine GAAP. | ||||||
Table 16
| Endesa Costanera | 2008 | 2009 | Var 08-09 | Chg % |
| GWh Produced | 8,540 | 8,172 | (368) | (4.3%) |
| GWh Sold | 8,543 | 8,284 | (260) | (3.0%) |
| Market Share | 8.1% | 7.9% | (0.1%) | - |
ELCHOCÓN
Showed higher reservoir water levels accumulated in the early months of the year, thus providing greater hydroelectric generation. With this, El Chocón improved its operating income to Ch$ 38,700 million as of December 2009, with physical sales increasing by 61.4% compared to the same period of 2008. Negative conversion effect from local currency to Chilean pesos reduced 7.9% the year 2009 results compared to last year’s figure.
| Table 13 | ||||||
| El Chocón | Million Ch$ | Thousand US$ | ||||
| 2008 | 2009 | Var 08-09 | Chg % | 2009 | ||
| Total Revenues | 44,141 | 65,298 | 21,158 | 47.9% | 116,674 | |
| Procurements and Services | (17,503) | (17,724) | (221) | (1.3%) | (31,669) | |
| Contribution Margin | 26,638 | 47,574 | 20,936 | 78.6% | 85,005 | |
| Other Costs | (4,158) | (5,191) | (1,033) | (24.8%) | (9,275) | |
| Gross Operating Income (EBITDA) | 22,480 | 42,383 | 19,904 | 88.5% | 75,730 | |
| Depreciation and Amortization | (3,449) | (3,683) | (234) | (6.8%) | (6,581) | |
| Operating Income | 19,031 | 38,700 | 19,670 | 103.4% | 69,149 | |
| Figures may differ from those accounted under Argentine GAAP. | ||||||
Pg. 30
| PRESS RELEASE | |
Table 14
| El Chocón | 2008 | 2009 | Var 08-09 | Chg % |
| GWh Produced | 1,940 | 3,783 | 1,843 | 95.0% |
| GWh Sold | 2,554 | 4,122 | 1,567 | 61.4% |
| Market Share | 2.4% | 3.9% | 1.5% | - |
DISTRIBUTION
EDESUR
Operating income decreased mainly due to decrease in physical sales and higher employee expenses and other fixed operating expenses, situation related with higher inflation costs, partially compensated by payments from regulator through the MMC and PUREE. Negative conversion effect from local currency to Chilean pesos reduced 7.9% the year 2009 results compared to last year’s figure.
| Table 15 | ||||||
| Edesur | Million Ch$ | Thousand US$ | ||||
| 2008 | 2009 | Var 08-09 | Chg % | 2009 | ||
| Total Revenues | 333,266 | 324,518 | (8,749) | (2.6%) | 579,844 | |
| Procurements and Services | (159,169) | (153,917) | 5,252 | 3.3% | (275,016) | |
| Contribution Margin | 174,098 | 170,601 | (3,497) | (2.0%) | 304,828 | |
| Other Costs | (111,437) | (122,210) | (10,772) | (9.7%) | (218,362) | |
| Gross Operating Income (EBITDA) | 62,660 | 48,391 | (14,269) | (22.8%) | 86,465 | |
| Depreciation and Amortization | (17,033) | (16,516) | 517 | 3.0% | (29,510) | |
| Operating Income | 45,627 | 31,876 | (13,751) | (30.1%) | 56,955 | |
| Figures may differ from those accounted under Argentine GAAP. | ||||||
Table 16
| Edesur | 2008 | 2009 | Var 08-09 | Chg % |
| Customers (Th) | 2,262 | 2,305 | 43 | 1.9% |
| GWh Sold | 16,160 | 16,026 | (134) | (0.8%) |
| Clients/Employee | 873 | 877 | 4 | 0.4% |
| Energy Losses % | 10.6% | 10.5% | (0.2%) | (1.6%) |
Pg. 31
| PRESS RELEASE | |

BRAZIL
ENDESABRASIL
| Table 17 | ||||||
| Endesa Brasil | Million Ch$ | Thousand US$ | ||||
| 2008 | 2009 | Var 08-09 | Chg % | 2009 | ||
| Total Revenues | 1,939,140 | 1,958,614 | 19,474 | 1.0% | 3,862,383 | |
| Procurements and Services | (1,119,726) | (1,057,983) | 61,743 | (5.5%) | (2,086,341) | |
| Contribution Margin | 819,414 | 900,631 | 81,217 | 9.9% | 1,776,042 | |
| Other Costs | (238,083) | (255,151) | (17,068) | 7.2% | (503,156) | |
| Gross Operating Income (EBITDA) | 581,331 | 645,480 | 64,149 | 11.0% | 1,272,886 | |
| Depreciation and Amortization | (114,465) | (131,888) | (17,423) | 15.2% | (260,084) | |
| Operating Income | 466,866 | 513,592 | 46,726 | 10.0% | 1,012,802 | |
| Net Financial Income | (113,816) | (59,969) | 53,848 | (47.3%) | (118,258) | |
| Financial income | 118,860 | 100,509 | (18,351) | (15.4%) | 198,203 | |
| Financial expenses | (198,955) | (185,208) | 13,747 | (6.9%) | (365,229) | |
| Income (Loss) for indexed assets and liabilities | - | - | - | - | - | |
| Foreign currency exchange differences, net | (33,722) | 24,730 | 58,452 | (173.3%) | 48,768 | |
| Gains | 59,906 | 46,431 | (13,475) | (22.5%) | 91,561 | |
| Losses | (93,627) | (21,700) | 71,927 | (76.8%) | (42,793) | |
| Net Income from Related Comp. Cons. By the | - | - | - | - | - | |
| Prop. Eq. Method | ||||||
| Net Income from Other Investments | - | - | - | - | - | |
| Net Income from asset sales | 401 | 276 | (125) | (31.1%) | 544 | |
| Net Income before Taxes | 353,450 | 453,899 | 100,449 | 28.4% | 895,088 | |
| Income Tax | (66,187) | (106,585) | (40,398) | 61.0% | (210,185) | |
| Continued Operations Result | 287,263 | 347,314 | 60,051 | 20.9% | 684,903 | |
| Gain (Loss) from discontinued operations, | - | - | - | - | - | |
| Net from taxes | ||||||
| Dicontinued Operations Result | 287,263 | 347,314 | 60,051 | 20.9% | 684,903 | |
| NET INCOME | 287,263 | 347,314 | 60,051 | 20.9% | 684,903 | |
| Net Income Attributable to Owners of the | ||||||
| Company | 194,650 | 237,684 | 43,033 | 22.1% | 468,711 | |
| Net Income Attributable to Minority Interest | ||||||
| 92,613 | 109,631 | 17,018 | 18.4% | 216,192 | ||
GENERATION
CACHOEIRA
Operating Income decreased due to lower market sales prices mainly explained by better hydrological conditions in Brazil compared to higher prices in 2008. Negative conversion effect from local currency to Chilean pesos reduced 6.5% the year 2009 results compared to last year’s figure.
| Table 18 | ||||||
| Cachoeira | Million Ch$ | Thousand US$ | ||||
| 2008 | 2009 | Var 08-09 | Chg % | 2009 | ||
| Total Revenues | 147,105 | 88,300 | (58,805) | (40.0%) | 157,773 | |
| Procurements and Services | (39,270) | (23,600) | 15,670 | 39.9% | (42,168) | |
| Contribution Margin | 107,835 | 64,700 | (43,135) | (40.0%) | 115,605 | |
| Other Costs | (6,103) | (6,820) | (718) | (11.8%) | (12,187) | |
| Gross Operating Income (EBITDA) | 101,732 | 57,880 | (43,853) | (43.1%) | 103,419 | |
| Depreciation and Amortization | (6,951) | (7,250) | (300) | (4.3%) | (12,955) | |
| Operating Income | 94,782 | 50,629 | (44,153) | (46.6%) | 90,464 | |
| Figures may differ from those accounted under Brazilian GAAP. | ||||||
Pg. 32
| PRESS RELEASE | |
Table 19
| Cachoeira | 2008 | 2009 | Var 08-09 | Chg % |
| GWh Produced | 3,308 | 2,820 | (488) | (14.8%) |
| GWh Sold | 4,403 | 3,862 | (541) | (12.3%) |
| Market Share | 1.1% | 1.0% | (0.1%) | - |
FORTALEZA(CGTF)
Operating Income increased mainly due to lower energy purchased costs, as a consequence of lower market prices. Negative conversion effect from local currency to Chilean pesos reduced 6.5% the year 2009 results compared to last year’s figure.
| Table 20 | ||||||
| Fortaleza | Million Ch$ | Thousand US$ | ||||
| 2008 | 2009 | Var 08-09 | Chg % | 2009 | ||
| Total Revenues | 110,163 | 138,595 | 28,432 | 25.8% | 247,640 | |
| Procurements and Services | (65,587) | (38,643) | 26,944 | 41.1% | (69,047) | |
| Contribution Margin | 44,576 | 99,952 | 55,376 | 124.2% | 178,592 | |
| Other Costs | (8,010) | (8,351) | (340) | (4.2%) | (14,921) | |
| Gross Operating Income (EBITDA) | 36,566 | 91,601 | 55,035 | 150.5% | 163,671 | |
| Depreciation and Amortization | (8,056) | (7,675) | 381 | 4.7% | (13,714) | |
| Operating Income | 28,510 | 83,926 | 55,416 | 194.4% | 149,957 | |
| Figures may differ from those accounted under Brazilian GAAP. | ||||||
Table 21
| Fortaleza | 2008 | 2009 | Var 08-09 | Chg % |
| GWh Produced | 71 | 499 | 429 | 604.6% |
| GWh Sold | 2,690 | 3,007 | 317 | 11.8% |
| Market Share | 0.7% | 0.8% | 0.1% | - |
TRANSMISSION
CIEN
Operating Income increased mainly due to contracts signed to export energy to Uruguay and Argentina, initiating this activity in February, while in 2008, commercialization activities started on April. The latter was partially affected by negative conversion effect from local currency to Chilean pesos.
| Table 22 | ||||||
| Cien | Million Ch$ | Thousand US$ | ||||
| 2008 | 2009 | Var 08-09 | Chg % | 2009 | ||
| Total Revenues | 72,777 | 97,961 | 25,185 | 34.6% | 175,036 | |
| Procurements and Services | (290) | (20,025) | (19,735) | - | (35,780) | |
| Contribution Margin | 72,487 | 77,936 | 5,450 | 7.5% | 139,256 | |
| Other Costs | (9,665) | (11,842) | (2,177) | (22.5%) | (21,159) | |
| Gross Operating Income (EBITDA) | 62,821 | 66,095 | 3,273 | 5.2% | 118,097 | |
| Depreciation and Amortization | (17,099) | (18,102) | (1,002) | (5.9%) | (32,344) | |
| Operating Income | 45,722 | 47,993 | 2,271 | 5.0% | 85,753 | |
| Figures may differ from those accounted under Brazilian GAAP. | ||||||
Pg. 33
| PRESS RELEASE | |
DISTRIBUTION
AMPLA
Operating Income increased mainly due to increasing demand and the higher average sales prices and tolls, partially compensated by the increase in the energy purchase costs, higher energy losses and a negative conversion effect due to Real depreciation relative to the Chilean peso.
Tariff Review for the period 2009-2014 was held on March 2009 and the ANEEL set an adjustment of 0.82% to the final tariffs. Additionally, the annual revision designed to protect the company versus uncontrollable costs increases and inflation, set an adjustment of 10.95% in the final tariffs.
| Table 23 | ||||||
| Ampla | Million Ch$ | Thousand US$ | ||||
| 2008 | 2009 | Var 08-09 | Chg % | 2009 | ||
| Total Revenues | 964,909 | 1,001,031 | 36,122 | 3.7% | 1,788,629 | |
| Procurements and Services | (624,626) | (619,675) | 4,951 | 0.8% | (1,107,227) | |
| Contribution Margin | 340,283 | 381,356 | 41,073 | 12.1% | 681,402 | |
| Other Costs | (124,999) | (137,765) | (12,766) | (10.2%) | (246,157) | |
| Gross Operating Income (EBITDA) | 215,283 | 243,591 | 28,308 | 13.1% | 435,245 | |
| Depreciation and Amortization | (46,817) | (56,566) | (9,749) | (20.8%) | (101,072) | |
| Operating Income | 168,466 | 187,025 | 18,559 | 11.0% | 334,174 | |
| Figures may differ from those accounted under Brazilian GAAP. | ||||||
Table 24
| Ampla | 2008 | 2009 | Var 08-09 | Chg % |
| Customers (Th) | 2,466 | 2,522 | 55 | 2.2% |
| GWh Sold | 9,119 | 9,394 | 275 | 3.0% |
| Clients/Employee | 1,900 | 2,042 | 142 | 7.5% |
| Energy Losses % | 20.2% | 21.2% | 1.0% | 5.1% |
COELCE
Operating Income increased mainly due to higher energy average sales prices, higher physical sales and lower energy losses. The latter was partially offset by the negative conversion effect from local currency to Chilean pesos.
Tariff Review for the period 2007-2011 was held on March 2009 and the ANEEL set an adjustment of 11.25% to the final tariffs. Additionally, the annual revision designed to protect the company versus uncontrollable costs increases and inflation, set an adjustment of 11.95% in the final tariffs.
| Table 25 | ||||||
| Coelce | Million Ch$ | Thousand US$ | ||||
| 2008 | 2009 | Var 08-09 | Chg % | 2009 | ||
| Total Revenues | 759,779 | 766,723 | 6,944 | 0.9% | 1,369,972 | |
| Procurements and Services | (505,546) | (490,036) | 15,509 | 3.1% | (875,591) | |
| Contribution Margin | 254,234 | 276,687 | 22,453 | 8.8% | 494,381 | |
| Other Costs | (78,931) | (83,481) | (4,551) | (5.8%) | (149,163) | |
| Gross Operating Income (EBITDA) | 175,303 | 193,206 | 17,903 | 10.2% | 345,218 | |
| Depreciation and Amortization | (35,361) | (42,031) | (6,670) | (18.9%) | (75,100) | |
| Operating Income | 139,942 | 151,175 | 11,233 | 8.0% | 270,118 | |
| Figures may differ from those accounted under Brazilian GAAP. | ||||||
Pg. 34
| PRESS RELEASE | |
Table 26
| Coelce | 2008 | 2009 | Var 08-09 | Chg % |
| Customers (Th) | 2,842 | 2,965 | 124 | 4.4% |
| GWh Sold | 7,571 | 7,860 | 289 | 3.8% |
| Clients/Employee | 2,224 | 2,285 | 61 | 2.7% |
| Energy Losses % | 11.7% | 11.6% | (0.1%) | (1.3%) |
CHILE

GENERATION
ENDESACHILE
Consolidated Income Statement of Endesa Chile
| Table 27 | ||||||
| Endesa Chile | Million Ch$ | Thousand US$ | ||||
| 2008 | 2009 | Var 08-09 | Chg % | 2009 | ||
| Total Revenues | 2,536,388 | 2,418,919 | (117,469) | (4.6%) | 4,322,095 | |
| Procurements and Services | (1,304,453) | (976,146) | 328,307 | 25.2% | (1,744,166) | |
| Contribution Margin | 1,231,935 | 1,442,773 | 210,838 | 17.1% | 2,577,930 | |
| Other Costs | (171,167) | (185,701) | (14,534) | (8.5%) | (331,809) | |
| Gross Operating Income (EBITDA) | 1,060,768 | 1,257,072 | 196,304 | 18.5% | 2,246,121 | |
| Depreciations and Amortizations | (186,605) | (240,142) | (53,537) | (28.7%) | (429,082) | |
| Operating Income | 874,164 | 1,016,931 | 142,767 | 16.3% | 1,817,039 | |
| Net Financial Income | (188,895) | (170,794) | 18,101 | 9.6% | (305,173) | |
| Financial income | 34,323 | 25,316 | (9,007) | (26.2%) | 45,234 | |
| Financial expenses | (198,440) | (188,368) | 10,071 | 5.1% | (336,574) | |
| Income (Loss) for indexed assets and liabilities | (18,950) | 9,275 | 28,226 | 148.9% | 16,573 | |
| Foreign currency exchange differences, net | (5,828) | (17,017) | (11,189) | (192.0%) | (30,406) | |
| Gains | 42,223 | 31,785 | (10,437) | (24.7%) | 56,794 | |
| Losses | (48,052) | (48,803) | (751) | (1.6%) | (87,200) | |
| Net Income from Related Comp. Cons. By the Prop. Eq. | 82,132 | 98,458 | 16,326 | 19.9% | 175,923 | |
| Method | ||||||
| Net Income from Other Investments | 1,016 | (90) | (1,107) | (108.9%) | (161) | |
| Net Income from asset sales | (708) | 65 | 773 | 109.2% | 116 | |
| Net Income before Taxes | 767,708 | 944,569 | 176,860 | 23.0% | 1,687,744 | |
| Income Tax | (210,178) | (172,468) | 37,709 | 17.9% | (308,164) | |
| Continued Operations Result | 557,531 | 772,100 | 214,570 | 38.5% | 1,379,579 | |
| Gain (Loss) from discontinued operations, Net from | - | - | - | - | - | |
| taxes | ||||||
| Dicontinued Operations Result | 557,531 | 772,100 | 214,570 | 38.5% | 1,379,579 | |
| NET INCOME | 557,531 | 772,100 | 214,570 | 38.5% | 1,379,579 | |
| Net Income Attributable to Owners of the | ||||||
| Company | 433,177 | 627,053 | 193,876 | 44.8% | 1,120,411 | |
| Net Income Attributable to | ||||||
| Minority Interest | 124,354 | 145,047 | 20,693 | 16.6% | 259,168 | |
| *Includes generation subsidiaries in Chile, Argentina, Colombia and Peru. | ||||||
Chilean Operations
The Operating Income in Chile reached an important increase due to a drop in operating costs. This growth is mainly explained by the decrease in liquid fuel prices, improved hydrological conditions which result in lower fuel consumption and less energy purchases, a decrease in toll costs and higher availability of gas.
Pg. 35
| PRESS RELEASE | |
| Table 28 | ||||||
| Chilean Operations | Million Ch$ | Thousand US$ | ||||
| 2008 | 2009 | Var 08-09 | Chg % | 2009 | ||
| Total Revenues | 1,609,158 | 1,373,231 | (235,927) | (14.7%) | 2,453,672 | |
| Procurements and Services | (871,056) | (511,522) | 359,534 | 41.3% | (913,981) | |
| Contribution Margin | 738,102 | 861,709 | 123,607 | 16.7% | 1,539,691 | |
| Other Costs | (74,405) | (81,484) | (7,079) | (9.5%) | (145,595) | |
| Gross Operating Income (EBITDA) | 663,697 | 780,225 | 116,528 | 17.6% | 1,394,096 | |
| Depreciation and Amortization | (95,960) | (140,185) | (44,225) | (46.1%) | (250,481) | |
| Operating Income | 567,737 | 640,040 | 72,304 | 12.7% | 1,143,616 | |
Table 29
| Chilean Companies | 2008 | 2009 | Var 08-09 | Chg % |
| GWh Produced | 21,267 | 22,239 | 972 | 4.6% |
| GWh Sold | 21,532 | 22,327 | 795 | 3.7% |
| Market Share | 40.8% | 42.1% | 1.3% | - |
DISTRIBUTION
CHILECTRA
Operating Income decreased due to lower energy purchase-sales margin resulting from lower VAD index as a result of the November 2008 tariff setting and Subtransmission decree which applied since January 2009.
Pg. 36
| PRESS RELEASE | |
| Table 30 | ||||||
| Chilectra | Million Ch$ | Thousand US$ | ||||
| 2008 | 2009 | Var 08-09 | Chg % | 2009 | ||
| Sales | 1,023,839 | 1,061,071 | 37,232 | 3.6% | 1,895,909 | |
| Other operating income | 54,442 | 23,275 | (31,166) | (57.2%) | 41,588 | |
| Total Revenues | 1,078,280 | 1,084,346 | 6,066 | 0.6% | 1,937,497 | |
| Procurements and Services | (762,601) | (840,654) | (78,054) | (10.2%) | (1,502,071) | |
| Contribution Margin | 315,680 | 243,692 | (71,988) | (22.8%) | 435,426 | |
| Other Costs | (82,927) | (91,544) | (8,617) | (10.4%) | (163,569) | |
| Gross Operating Income (EBITDA) | 232,753 | 152,148 | (80,605) | (34.6%) | 271,857 | |
| Depreciation and Amortization | (19,130) | (23,116) | (3,986) | (20.8%) | (41,304) | |
| Operating Income | 213,623 | 129,032 | (84,591) | (39.6%) | 230,553 | |
| Net Financial Income | (24,721) | 2,907 | 27,628 | 111.8% | 5,194 | |
| Financial income | 15,332 | 14,892 | (440) | (2.9%) | 26,609 | |
| Financial expenses | (23,194) | (17,385) | 5,810 | 25.0% | (31,063) | |
| Income (Loss) for indexed assets and liabilities | (3,049) | 458 | 3,507 | 115.0% | 819 | |
| Foreign currency exchange differences, net | (13,810) | 4,941 | 18,752 | 135.8% | 8,829 | |
| Gains | 55 | 8,283 | 8,228 | 15030.2% | 14,800 | |
| Losses | (13,865) | (3,342) | 10,523 | 75.9% | (5,971) | |
| Net Income from Related Comp. Cons. By the | 74,875 | 82,757 | 7,882 | 147,869 | ||
| Prop. Eq. Method | 10.5% | |||||
| Net Income from Other Investments | - | 83 | 83 | - | 148 | |
| Net Income from assets sales | (303) | 12,051 | 12,354 | 4072.9% | 21,532 | |
| Net Income before Taxes | 263,473 | 226,829 | (36,644) | (13.9%) | 405,295 | |
| Income Tax | (37,443) | (21,064) | 16,379 | 43.7% | (37,638) | |
| Continued Operations Result | 226,030 | 205,765 | (20,265) | (9.0%) | 405,767 | |
| Gain (Loss) from discontinued operations, Net | - | - | - | - | - | |
| from taxes | ||||||
| Dicontinued Operations Result | 226,030 | 205,765 | (20,265) | (9.0%) | 405,767 | |
| NET INCOME | 226,030 | 205,765 | (20,265) | (9.0%) | 367,658 | |
| Net Income Attributable to Owners | 236,700 | 203,309 | (33,390) | (14.1%) | 363,270 | |
| of the Company | ||||||
| Net Income Attributable to | (10,670) | 2,455 | 13,125 | 123.0% | 4,387 | |
| Minority Interest | ||||||
Table 31
| Chilectra | 2008 | 2009 | Var 08-09 | Chg % |
| Customers (Th) | 1,534 | 1,579 | 45 | 2.9% |
| GWh Sold | 12,535 | 12,585 | 49 | 0.4% |
| Clients/Employee | 2,139 | 2,160 | 21 | 1.0% |
| Energy Losses % | 5.9% | 6.1% | 0.2% | 2.8% |
Pg. 37
| PRESS RELEASE | |

COLOMBIA
GENERATION
EMGESA
Operating income of our generation business in Colombia reached Ch$ 250,811 million through December 2009, 15.7% higher than the same period in 2008. This improvement is mainly explained by an increase of average prices measured in local currency given lower hydrology conditions during the period as well as an increase of physical sales of 2.7% over 2008. This situation led to a weaker production mix, thus a 43% growth of procurements and services, in which energy purchases increased as well as fuel consumption for thermal generation. EBITDA, or gross operating income, increased 16.1% in the period, reaching Ch$ 287,328 million through December 2009.
In addition, Negative conversion effect from local currency to Chilean pesos reduced 5.6% the year 2009 results compared to last year’s figure.
| Table 32 | ||||||
| Emgesa | Million Ch$ | Thousand US$ | ||||
| 2008 | 2009 | Var 08-09 | Chg % | 2009 | ||
| Total Revenues | 401,470 | 500,964 | 99,494 | 24.8% | 895,117 | |
| Procurements and Services | (128,688) | (184,067) | (55,379) | (43.0%) | (328,890) | |
| Contribution Margin | 272,782 | 316,897 | 44,115 | 16.2% | 566,228 | |
| Other Costs | (25,403) | (29,569) | (4,166) | (16.4%) | (52,834) | |
| Gross Operating Income (EBITDA) | 247,378 | 287,328 | 39,949 | 16.1% | 513,393 | |
| Depreciation and Amortization | (30,560) | (36,516) | (5,956) | (19.5%) | (65,247) | |
| Operating Income | 216,818 | 250,811 | 33,993 | 15.7% | 448,147 | |
| * Please notice that these figures could differ from those accounted under Colombian GAAP. | ||||||
Table 33
| Emgesa | 2008 | 2009 | Var 08-09 | Chg % |
| GWh Produced | 12,905 | 12,674 | (232) | (1.8%) |
| GWh Sold | 16,368 | 16,806 | 438 | 2.7% |
| Market Share | 21.9% | 20.5% | (1.4%) | - |
DISTRIBUTION
CODENSA
Operating Income decrease is mainly explained by the negative conversion effect from local currency to Chilean pesos and the increase in operating expenses, partially compensated by higher purchase-sales margins.
| Table 34 | ||||||
| Codensa | Million Ch$ | Thousand US$ | ||||
| 2008 | 2009 | Var 08-09 | Chg % | 2009 | ||
| Total Revenues | 661,154 | 740,360 | 79,206 | 12.0% | 1,322,866 | |
| Procurements and Services | (334,349) | (393,206) | (58,857) | (17.6%) | (702,576) | |
| Contribution Margin | 326,805 | 347,154 | 20,349 | 6.2% | 620,290 | |
| Other Costs | (70,101) | (88,302) | (18,201) | (26.0%) | (157,777) | |
| Gross Operating Income (EBITDA) | 256,704 | 258,852 | 2,147 | 0.8% | 462,513 | |
| Depreciation and Amortization | (53,725) | (58,967) | (5,243) | (9.8%) | (105,362) | |
| Operating Income | 202,980 | 199,885 | (3,095) | (1.5%) | 357,151 | |
| * Please notice that these figures could differ from those accounted under Colombian GAAP. | ||||||
Pg. 38
| PRESS RELEASE | |
Table 35
| Codensa | 2008 | 2009 | Var 08-09 | Chg % |
| Customers (Th) | 2,285 | 2,361 | 76 | 3.3% |
| GWh Sold | 11,822 | 11,837 | 15 | 0.1% |
| Clients/Employee | 2,452 | 2,321 | (130) | (5.3%) |
| Energy Losses % | 8.1% | 8.2% | 0.1% | 1.6% |

PERU
GENERATION
EDEGEL
Operating income was Ch$ 76,049 million, an increase of Ch$ 24,276 million over December 2008. This is mainly explained by a better production mix given the positive hydrology conditions during the year. This situation allowed procurements and services costs to reduce by 26.9% compared to 2008, with lower fuel consumption and costs of energy purchases.
| Table 36 | ||||||
| Edegel | Million Ch$ | Thousand US$ | ||||
| 2008 | 2009 | Var 08-09 | Chg % | 2009 | ||
| Total Revenues | 208,497 | 213,625 | 5,128 | 2.5% | 381,702 | |
| Procurements and Services | (98,453) | (72,014) | 26,439 | 26.9% | (128,673) | |
| Contribution Margin | 110,044 | 141,611 | 31,567 | 28.7% | 253,029 | |
| Other Costs | (22,038) | (27,350) | (5,312) | (24.1%) | (48,868) | |
| Gross Operating Income (EBITDA) | 88,006 | 114,262 | 26,256 | 29.8% | 204,161 | |
| Depreciation and Amortization | (36,233) | (38,213) | (1,980) | (5.5%) | (68,278) | |
| Operating Income | 51,772 | 76,049 | 24,276 | 46.9% | 135,883 | |
| * Please notice that these figures could differ from those accounted under Peruvian GAAP. | ||||||
Table 37
| Edegel | 2008 | 2009 | Var 08-09 | Chg % |
| GWh Produced | 8,102 | 8,163 | 61 | 0.8% |
| GWh Sold | 8,461 | 8,321 | (140) | (1.7%) |
| Market Share | 31.6% | 30.7% | (0.9%) | - |
DISTRIBUTION
EDELNOR
Operating Income increased due to higher purchase-sales margins, an increase in physical sales and a reduction on energy losses.
Pg. 39
| PRESS RELEASE | |
| Table 38 | |||||||||
| Edelnor | Million Ch$ | Thousand US$ | |||||||
| 2008 | 2009 | Var 08-09 | Chg % | 2009 | |||||
| Total Revenues | 253,652 | 301,472 | 47,820 | 18.9% | 538,667 | ||||
| Procurements and Services | (149,816) | (185,707) | (35,890) | (24.0%) | (331,818) | ||||
| Contribution Margin | 103,836 | 115,766 | 11,930 | 11.5% | 206,849 | ||||
| Other Costs | (31,090) | (32,831) | (1,742) | (5.6%) | (58,663) | ||||
| Gross Operating Income (EBITDA) | 72,746 | 82,934 | 10,188 | 14.0% | 148,186 | ||||
| Depreciation and Amortization | (19,802) | (20,509) | (707) | (3.6%) | (36,646) | ||||
| Operating Income | 52,944 | 62,425 | 9,481 | 17.9% | 111,540 | ||||
| * Please notice that these figures could differ from those accounted under Peruvian GAAP. | |||||||||
Table 39
| Edelnor | 2008 | 2009 | Var 08-09 | Chg % | ||||
| Customers (Th) | 1,028 | 1,061 | 33 | 3.2% | ||||
| GWh Sold | 5,599 | 5,716 | 117 | 2.1% | ||||
| Clients/Employee | 1,800 | 1,782 | (18) | (1.0%) | ||||
| Energy Losses % | 8.2% | 8.1% | (0.1%) | (1.2%) | ||||
OPERATINGINCOME BYSUBSIDIARY
Summary of operating revenues, operating costs (including procurements, services and other costs) and operating income of all Enersis’ subsidiaries, for the years ended in December 2008 and December 2009, detailed as follows:
Table 40
| 2008 | 2009 | |||||||
| Million Ch$ | Operating | Operating | Operating | Operating | Operating | Operating | ||
| Revenues | Costs | Income | Revenues | Costs | Income | |||
| Endesa Chile (*) | 2,536,388 | (1,662,225) | 874,164 | 2,418,919 | (1,401,989) | 1,016,931 | ||
| Cachoeira (**) | 147,105 | (52,323) | 94,782 | 88,300 | (37,671) | 50,629 | ||
| Fortaleza (***) | 110,163 | (81,653) | 28,510 | 138,595 | (54,669) | 83,926 | ||
| Cien (**) | 72,777 | (27,055) | 45,722 | 97,961 | (49,969) | 47,993 | ||
| Chilectra | 1,078,280 | (864,657) | 213,623 | 1,084,346 | (955,314) | 129,032 | ||
| Edesur | 333,266 | (287,639) | 45,627 | 324,518 | (292,642) | 31,876 | ||
| Distrilima (Edelnor) | 253,652 | (200,708) | 52,944 | 301,472 | (239,047) | 62,425 | ||
| Ampla | 964,909 | (796,443) | 168,466 | 1,001,031 | (814,006) | 187,025 | ||
| Investluz (Coelce) | 759,779 | (619,837) | 139,942 | 766,723 | (615,548) | 151,175 | ||
| Codensa | 661,154 | (458,174) | 202,980 | 740,360 | (540,475) | 199,885 | ||
| CAM Ltda. | 180,696 | (174,306) | 6,390 | 155,736 | (153,447) | 2,289 | ||
| Inmobiliaria Manso de Velasco Ltda. | 14,712 | (12,145) | 2,568 | 10,464 | (4,103) | 6,361 | ||
| Synapsis Soluciones y Servicios IT Ltda. | 69,804 | (60,680) | 9,124 | 74,312 | (66,520) | 7,792 | ||
| Enersis Holding and other investment vehicles | 13,292 | (40,906) | (27,613) | 14,987 | (34,931) | (19,943) | ||
| Consolidation Adjustments | (636,386) | 642,810 | 6,424 | (767,837) | 735,079 | (32,758) | ||
| Total Consolidation | 6,559,591 | (4,695,941) | 1,863,651 | 6,449,888 | (4,525,252) | 1,924,636 | ||
Pg. 40
| PRESS RELEASE | |
| 2009 | ||||
| Thousand US$ | Operating | Operating | Operating | |
| Revenues | Costs | Income | ||
| Endesa Chile (*) | 4,322,095 | (2,505,056) | 1,817,039 | |
| Cachoeira (**) | 157,773 | (67,309) | 90,464 | |
| Fortaleza (***) | 247,640 | (97,682) | 149,957 | |
| Cien (**) | 175,036 | (89,284) | 85,753 | |
| Chilectra | 1,937,497 | (1,706,944) | 230,553 | |
| Edesur | 579,844 | (522,889) | 56,955 | |
| Distrilima (Edelnor) | 538,667 | (427,127) | 111,540 | |
| Ampla | 1,788,629 | (1,454,456) | 334,174 | |
| Investluz (Coelce) | 1,369,972 | (1,099,854) | 270,118 | |
| Codensa | 1,322,866 | (965,715) | 357,151 | |
| CAM Ltda. | 278,268 | (274,178) | 4,090 | |
| Inmobiliaria Manso de Velasco Ltda. | 18,697 | (7,332) | 11,365 | |
| Synapsis Soluciones y Servicios IT Ltda. | 132,780 | (118,857) | 13,923 | |
| Enersis Holding and other investment vehicles | 26,779 | (62,414) | (35,635) | |
| Consolidation Adjustments | (1,371,962) | 1,313,431 | (58,531) | |
| Total Consolidation | 11,524,582 | (8,085,665) | 3,438,917 | |
| (*) Since January 1st, 2009, includes Gas Atacama, Transqullota e HydroAysén | ||||
| (**) Consolidated by Endesa Chile until September 30th, 2005. Since October 1st, 2005 is consolidated by Enersis through Endesa Brasil. | ||||
| (***) Since October 1st, 2005, these subsidiaries are consolidated by Enersis through Endesa Brasil | ||||
Pg. 41
| PRESS RELEASE | |
OWNERSHIP OF THECOMPANY AS OFDECEMBER31ST,2009
CONFERENCECALLINVITATION
Enersis is pleased to invite you to participate in aConference Call with the management to review the results for the period,on Thursday, January 28th, 2010, 9:30 a.m. Eastern Time (11:30 a.m. Chilean Time). There will be a question and answer session following management's comments. Representing Enersis will be Mr. Alfredo Ergas, Chief Financial Officer and Mr. Ricardo Alvial, Risk Management & I.R. Director.
To participate, please dial +1 (617) 213-4850 or +1 (888) 679-8038 (toll free USA), approximately 10 minutes prior to the scheduled start time, Passcode ID: 35689692
To access the phone replay, please dial +1 (617) 801-6888 or +1 (888) 286-8010 (toll free USA) Passcode ID: 47884403.
For this Conference Call you can access previously to the pre-registration site athttps://www.theconferencingservice.com/prereg/key.process?key=RBGDFXNE3 and make your registration quicker. If not, please connect approximately 15 minutes prior to the scheduled start time. You can also access to the conference call replay through our website athttp://phx.corporate-ir.net/phoenix.zhtml?p=irol-eventDetails&c=83615&eventID=2679201.
Pg. 42
| PRESS RELEASE | |
CONTACTINFORMATION
For further information, please contact us:
| Ricardo Alvial | ||||||
| Risk Management and IR Director | ||||||
| ram@e.enersis.cl | ||||||
| 56 (2) 353 4682 | ||||||
| Carmen Poblete | Denisse Labarca | Bárbara López | Cristián Del Sante | |||
| Shares Department | Investor Relations | Investor Relations | Investor Relations | |||
| Associate | Associate | Associate | Associate | |||
| cpt@e.enersis.cl | dla@e.enersis.cl | bllf@e.enersis.cl | cdb@e.enersis.cl | |||
| 56 (2) 353 4447 | 56 (2) 353 4492 | 56 (2) 353 4552 | 56 (2) 353 4555 | |||
| María Luz Muñoz | ||||||
| Investor Relations | ||||||
| Assistant | ||||||
| mlmr@e.enersis.cl | ||||||
| 56 (2) 353 4682 | ||||||
DISCLAIMER
This Press Release contains statements that could constitute forward-looking statements within the meaning of the Private Securities Litigation Reform Act of 1995. These statements appear in a number of places in this announcement and include statements regarding the intent, belief or current expectations of Enersis and its management with respect to, among other things: (1) Enersis’ business plans; (2) Enersis’ cost-reduction plans; (3) trends affecting Enersis’ financial condition or results of operations, including market trends in the electricity sector in Chile or elsewhere; (4) supervision and regulation of the electricity sector in Chile or elsewhere; and (5) the future effect of any changes in the laws and regulations applicable to Enersis’ or its subsidiaries. Such forward-looking statements are not guarantees of future performance and involve risks and uncertainties. Actual results may differ materially from those in the forward-looking statements as a result of various factors. These factors include a decline in the equity capital markets of the United States or Chile, an increase in the market rates of interest in the United States or elsewhere, adverse decisions by government regulators in Chile or elsewhere and other factors described in Enersis’ Annual Report on Form 20-F. Readers are cautioned not to place undue reliance on those forward-looking statements, which state only as of their dates. Enersis undertakes no obligation to release publicly the result of any revisions to these forward-looking statements.
Pg. 43
SIGNATURES
Pursuant to the requirements of the Securities Exchange Act of 1934, as amended, the Registrant has duly caused this report to be signed on its behalf by the undersigned, thereunto duly authorized.
| ENERSIS S.A. | |
| By: /s/ Ignacio Antoñanzas | |
| -------------------------------------------------- | |
| Title: Chief Executive Officer |
Date: January 28, 2010