FORM 6-K
SECURITIES AND EXCHANGE COMMISSION
Washington, D.C. 20549
Report of Foreign Issuer
Pursuant to Rule 13a-16 or 15d-16 of
the Securities Exchange Act of 1934
For the month of July, 2012
Commission File Number: 001-12440
ENERSIS S.A.
(Translation of Registrant’s Name into English)
Santa Rosa 76
Santiago, Chile
(Address of principal executive office)
Indicate by check mark whether the registrant files or will file
annual reports under cover of Form 20-F or Form 40-F:
Form 20-F [X] Form 40-F [ ]
Indicate by check mark if the registrant is submitting the Form 6-K
in paper as permitted by Regulation S-T Rule 101(b)(1):
Yes [ ] No [X]
Indicate by check mark if the registrant is submitting the Form 6-K
in paper as permitted by Regulation S-T Rule 101(b)(7):
Yes [ ] No [X]
Indicate by check mark whether by furnishing the information
ontained in this Form, the Registrant is also thereby furnishing the
information to the Commission
pursuant to Rule 12g3-2(b) under the Securities Exchange Act of 1934:
Yes [ ] No [X]
If °;Yes” is marked, indicate below the file number assigned to the registrant
in connection with Rule 12g3-2(b): N/A
PRESS RELEASE |
ENERSIS
ANNOUNCES CONSOLIDATED RESULTS
FOR THE PERIOD ENDED ON JUNE 30, 2012
Highlights for the Period
Ø Operating revenues increased 2.9%, reaching Ch$ 3,295,704 million, mainly due to higher energy sales by Ch$ 95,992 million, in line with important increases in demand for electricity, as follows,
· Argentina 6.3%
· Brazil 5.9%
· Chile 5.9%
· Colombia 4.1%
· Peru 3.8%
Ø Physical sales in distribution increased 1,582 GWh, or 4.6%, reaching 35,902 GWh. While in generation, the production reached 28,541 GWh, increasing 1,817 GWh, equivalent to 6.8%.
Ø Another positive factor which contributes to understand this better result, corresponds to the addition of 377 thousand new clients during the last twelve months, mostly related to natural growth.
Ø Operating costs increased 5.5%, reaching Ch$ 1,899,987 million, due to higher energy purchases of Ch$ 89,382 million, increased transportation cost of
Ch$ 33,291 million, and higher fuel consumption by Ch$ 19,928 million. As largely informed, these higher costs are heavily influenced by more than two years of sustained drought in Chile, however, this situation has been slightly improving since June 2012.
Ø EBITDA of the Company increased 3.2% up to Ch$ 954,815 million, in a solid proof of the benefits of being properly diversified.
Ø Financial result was Ch$ 162,269 million losses, 18.5% higher thanthe first half of 2011. This negative behavior is mainly due to the effect of the appreciation of the Brazilian real against the Chilean peso, as well as because of higher interest expenses.
Ø Net Income before taxes decreased 5.2% or Ch$ 31,181 million.
Ø Taxes decreased by Ch$ 3,422 million, equivalent to 1.9%, due to lower tax effects over companies.
Ø Net income decreased 6,7% or Ch$ 27,759 million.
Ø Net income of the parent company decreased 19,4% or Ch$ 39,135 million.
Ø The diversified portfolio of Enersis Group, allowed us to maintain a well balanced contribution to our EBITDA, by business segment,
• Generation and Transmission: 48%
• Distribution: 52%
Pg.1
PRESS RELEASE |
Generation and Transmission Business
Ø Operating revenues remained almost constant reaching Ch$ 1,324,631 million, due to a lower average energy sale price.
Ø Procurement and services costs increased by 4.2% to Ch$ 746,220 million as result of higher transportation expenses of Ch$ 25,861 million and higher fuel consumption of Ch$ 19,926 million.
Ø EBITDA decreased 0.3%, amounting to Ch$ 462,478 million.
Ø Consolidated electricity generation grew 6.8%, reaching 28,541 GWh, basically explained by better performances of Colombia and Brazil.
Ø Consolidated physical sales increased 3.0% to 32,542 GWh, mainly because of Colombia and Brazil.
EBITDA in the Generation business, by country, behaved as follows:
In Argentina, EBITDA decreased by Ch$ 10,658 million due to:
Ø Lower operation revenues of Ch$ 19,799 as a consequence of a reduction in average energy sale prices, partly explained by the non-renewal of regulatory improvements obtained in 2010, and a decrease of 4.4% in physical sales due to lower thermal generation.
Ø Higher personnel expenses of Ch$ 2,954 million.
Ø This was partially offset by lower fuel consumption cost of Ch$ 11,183 million.
In Brazil, EBITDA increased by Ch$ 21,239 million due to:
Ø Higher revenues on energy sales of Ch$ 40,517 million, explained by higher demand and average sale price in Central Fortaleza, as well as higher hydroelectric availability and average sale price in Cachoeira Dourada.
Ø The above is partially offset by higher energy purchases costs of Ch$ 15,260, both, in Central Fortaleza and Cachoeira Dourada.
In Chile, EBITDA decreased Ch$ 70,290 million, mainly due to:
Ø Lower operating revenues of Ch$ 61,192 million due to a 13.0% reduction in average energy sale prices, even though physical sales increased a 2.4% as a consequence of higher hydro generation.
Ø This was partially offset by a reduction of Ch$ 3,086 million in operating costs, mainly due to lower energy purchases of Ch$ 32,759 million.
In Colombia, EBITDA grew by Ch$ 61,480 million, mainly due to,
Ø Non-recurring effect of the equity tax imposed by the Colombian government, which implied booking on the first quarter of 2011 the full amount payable in the period 2011-2014. This had an impact in other fixed operating costs.
Ø Increase in operating revenues of Ch$ 39,784 million due to a 10.0% increase in the average energy sale price and a 6.9% increase in physical sales due to higher hydro generation.
Ø This was partially offset by a higher fuel consumption cost of Ch$ 10,251 million.
In Peru, EBITDA decreased by Ch$ 2,989 million due to:
Ø Increase of Ch$ 13,965 million in personnel expenses due to a non-recurring effect registered in June 2011, which implied to reclassify a provision that originated a one-time benefit in personnel expenses.
Pg.2
PRESS RELEASE |
Ø Higher fuel consumption of Ch$ 6,487 million partly due to higher diesel generation.
Ø The latter was partially offset by a 23.1% grow in operating revenues mainly explained by a 20.7% increase in average sale energy price and higher physical sales of 1.9%.
Distribution Business
Consolidated figures for the distribution businesses are detailed as follows:
Ø Operating revenues rose 4.6% to Ch$ 2,278,990 million.
Ø Procurement and service costs were Ch$ 1,469,147 million, 4.4% higher than for the same period of 2011.
Ø EBITDA inthe first half of 2012 amounted to Ch$ 497,338 million, 6.4% higher thanthe first half of 2011.
Ø Energy sales by clients´segment in each of our distribution companies:
% Physical Sales | Chile | Argentina | Peru | Brazil | Colombia | TOTAL | ||||||||
6M 2012 | Chilectra |
| Edesur |
| Edelnor |
| Ampla |
| Coelce |
| Codensa |
|
|
|
| 6M 2011 | 6M 2012 | 6M 2011 | 6M 2012 | 6M 2011 | 6M 2012 | 6M 2011 | 6M 2012 | 6M 2011 | 6M 2012 | 6M 2011 | 6M 2012 | 6M 2011 | 6M 2012 |
Residential | 25% | 25% | 41% | 41% | 37% | 37% | 39% | 41% | 34% | 34% | 35% | 35% | 35% | 35% |
Industrial | 23% | 22% | 8% | 8% | 20% | 19% | 11% | 9% | 15% | 12% | 7% | 7% | 13% | 12% |
Commercial | 29% | 29% | 27% | 27% | 22% | 22% | 18% | 20% | 19% | 19% | 16% | 16% | 22% | 23% |
Others | 23% | 24% | 25% | 25% | 22% | 22% | 32% | 30% | 32% | 34% | 42% | 42% | 30% | 29% |
TOTAL | 100% | 100% | 100% | 100% | 100% | 100% | 100% | 100% | 100% | 100% | 100% | 100% | 100% | 100% |
EBITDA in the Distribution business, by country, behaved as follows:
In Argentina, EBITDA decreased by Ch$ 16,320 million, mainly explained by:
Ø Increase of Ch$ 20,176 million in procurements and services costs, mainly due to higher energy purchases.
Ø Increase in personnel expenses explained by salary increases under union agreements.
Ø Increase of Ch$ 15,794 million in other fixed operating costs due to higher costs in inputs and services used for grid repair.
Ø This was partially offset by higher revenues of Ch$ 21,515, due to a higher demand for electricity and higher average sale price.
In Brazil, EBITDA decreased by Ch$ 10,802 million as result of:
Ø Lower other operating revenues of Ch$ 20,967 million in Ampla and Coelce, mainly explained by the conversion from Brazilian Real to Chilean Pesos, due to the appreciation from the Real against the Peso.
Ø Decrease of Ch$ 6,152 million in other operating services in Ampla and Coelce, also explained mainly by the appreciation from the Brazilian Real against the Chilean peso.
Ø This was partially compensated by Ch$18,685 million higher energy sales due to higher demand and higher sale prices due to Ampla’s tariff readjustment.
In Chile, EBITDA grew by Ch$ 6,404 million, mainly explained by:
Ø Higher operating margin of Ch$ 3,972 million, due to a better mix of clients and higher demand of 5.9%, as a consequence of an increase in economic activity.
In Colombia, EBITDA increased by Ch$ 52,298 million, mostly as result of:
Pg.3
PRESS RELEASE |
Ø The lower comparison base, due to the effect of the Colombian government equity tax reform, which implied recording in 2011 the entire tax payable during the period 2011-2014.
Ø Higher energy sales income of Ch$ 48,110 million, a 14.9% increase, explained by a 3.4% increase in demand.
In Peru, EBITDA decreased Ch$ 1,594 million as result of:
Ø Personnel expenses increased by Ch $ 6,326 explained by the recognition of a one-time provision reversal in personnel expenses registered the first half 2011.
Ø Higher other operating costs of Ch$ 4,619 million due to higher labor costs for grid movements as well as connections and reconnections.
Ø It should be noted that in terms of business fundamentals, they remained strong, partially offsetting this with a 11.3% increase in the contribution margin, mainly due an increase of 5.2% in demand and higher average sale prices.
Financial Summary
Ø The average nominal interest rate decreased from 9.6% to 8.9%, influenced by the rate´s decreasing trend in the countries where we operate.
Ø Liquidity, a key consideration in our financial management, continues to be in a very solid position, as shown below on a consolidated basis for Enersis,
· Cash and cash equivalents US$ 1,459 million
· Committed credit lines available US$ 887 million
· Non-committed credit lines available US$ 1,861 million
Ø Coverage and protection: In order to mitigate exchange rate and interest rate risks, Enersis has established strict internal rules to protect our cash flows and balance sheet from fluctuations in these variables.
· Our exchange rate policy is based on cash flows and we strive to maintain a balance between US dollar indexed flows, and assets and liabilities in such currencies. In addition to this policy, we have contracted cross currency swaps for a total amount of US$ 1,416 million and forwards for US$ 159 million.
· In order to reduce financial results volatility due to changes in market interest rates, we seek to maintain an adequate balance in our debt structure. Thus, we have contracted interest rate swaps (from variable to fixed rates) for US$ 305 million.
Pg.4
PRESS RELEASE |
Market Summary
Ø Since July 2011, the Chilean Stock Exchange’s main index, IPSA, showed a decrease of -8.2%, reflecting the uncertainty prevailing in the international stock markets due to global economic scenario. This performance was aligned with the main markets in the region, excepting for Peru who continues showing positive variations.
Ø This situation can be seen in the behavior of some Latin America markets, as follows:
BOVESPA (Brazil): -12.9%
MERVAL (Argentina): -30.2%
COLCAP (Colombia): -3.6%
ISBVL (Peru): 14.0%
Ø In Europe, main stock exchanges showed poor results,
IBEX: -31.4%
UKX: -6.3%
FTSE 250: -8.4%
On the other hand, USA indexes showed a good performance; S&P 500: 3.1% and Dow Jones Industrial: 3.8%. All these stock performances are calculated in their domestic currency and are, therefore, non comparable.
Ø Enersis’ share price fell from $215.7 in June 30, 2011 to $188.4 in June 30, 2012, which represents a -12.6% decrease for the period. This change is mainly attributable to the negative global economic scenario, the poor hydrology in Chile during the last 12 months, and the expected impact of tariff revision process in Coelce (already done).
Ø Enersis’ ADR also showed a negative variation during the last 12 months. The price fell from US$ 23.1 on June 30, 2011, to US$ 18.7 on June 30, 2012. The global economic situation, as well as the drought affecting Chile and the possible impact of tariff revision processes, affected the equity’s value.
Ø During the last twelve months, Enersis was, again, among the most actively traded companies in the local market (Santiago Stock Exchange and Chilean Electronic Exchange), with a daily average trading volume of US$ 7.2 million.
Source: Bloomberg
Pg.5
PRESS RELEASE |
Risk Rating Classification Information
The key considerations, among others, released by the Rating Agencies to maintain a stable Outlook of the Company, are:
· its well diversified asset portfolio
· strong credit metrics
· adequate debt structure, and
· solid liquidity.
The Company’s geographic diversification in Latin America provides a natural hedge against different regulations and weather conditions. Most of Enersis’ operating subsidiaries are financially strong and have leading market positions in the countries where Enersis operates.
Among the main events of 2011 and 2012, we can highlight the following:
Ø Fitch Ratings (January 5, 2012) and Standard & Poor’s (May 2, 2012) affirmed the international credit risk rating for Enersis on “BBB+”, with stable outlook.
Ø On June 18, 2012, Moody's affirmed the “Baa2 with stable outlook” senior unsecured rating of Enersis.
Ø Moreover, on July 11, 2012, Feller Rate ratified the “AA” local rating of Enersis bonds, shares and commercial papers program.
Current international risk ratings are:
Enersis | S&P | Moody’s | Fitch |
Corporate | BBB+ / Stable | Baa2 / Stable | BBB+ / Stable |
Local ratings (for securities issued in Chile):
Enersis | Feller Rate | Fitch |
Shares | 1st Class Level 1 | 1stClass Level 1 |
Bonds | AA / Stable | AA / Stable |
Pg.6
PRESS RELEASE |
Table ofContents
| Distribution Business | 1 |
| Generation and Transmission Business | 2 |
| Financial Summary | 4 |
| Market Summary | 5 |
| Risk Rating Classification Information | 6 |
| TABLE OF CONTENTS | 7 |
| GENERAL INFORMATION | 9 |
| SIMPLIFIED ORGANIZATIONAL STRUCTURE | 10 |
| CONSOLIDATED INCOME STATEMENT ANALYSIS | 11 |
| NET INCOME | 11 |
| NET FINANCIAL INCOME | 13 |
| SALE OF ASSETS | 13 |
| TAXES | 13 |
| CONSOLIDATED BALANCE SHEET ANALYSIS | 14 |
| ASSETS UNDER IFRS | 14 |
| BOOK VALUE AND ECONOMIC VALUE OF ASSETS | 16 |
| LIABILITIES AND SHAREHOLDERS’ EQUITY UNDER IFRS | 17 |
| DEBT MATURITY WITH THIRD PARTIES, THOUSAND US$ | 19 |
| DEBT MATURITY WITH THIRD PARTIES, MILLION CH$ | 19 |
| EVOLUTION OF KEY FINANCIAL RATIOS | 20 |
| UNDER IFRS | 21 |
| CASH FLOW RECEIVED FROM FOREIGN SUBSIDIARIES BY ENERSIS, CHILECTRA AND ENDESA CHILE | 22 |
| THE PRINCIPAL RISKS ASSOCIATED TO THE ACTIVITIES OF THE ENERSIS | |
| GROUP | 23 |
| ARGENTINA | 28 |
| GENERATION | 28 |
| Endesa Costanera | 28 |
| El Chocón | 29 |
| DISTRIBUTION | 30 |
| Edesur | 30 |
| BRAZIL | 31 |
| ENDESA BRASIL | 31 |
| GENERATION | 31 |
| Cachoeira Dourada | 31 |
| Fortaleza (cgtf) | 32 |
| TRANSMISSION | 33 |
| CIEN | 33 |
| DISTRIBUTION | 34 |
| Ampla | 34 |
| Coelce | 35 |
| CHILE | 36 |
| GENERATION | 36 |
Pg.7
PRESS RELEASE |
| Endesa Chile | 36 |
| DISTRIBUTION | 37 |
| Chilectra | 37 |
| COLOMBIA | 39 |
| GENERATION | 39 |
| Emgesa | 39 |
| DISTRIBUTION | 40 |
| Codensa | 40 |
| GENERATION | 41 |
| Edegel | 41 |
| DISTRIBUTION | 42 |
| Edelnor | 42 |
| MARKET INFORMATION | 44 |
| EQUITY MARKET | 44 |
| DEBT MARKET | 47 |
| CONFERENCE CALL INVITATION | 48 |
| DISCLAIMER | 49 |
Pg.8
PRESS RELEASE |
General Information
(Santiago, Chile, Wednesday, July 25, 2012.) Enersis S.A. (NYSE: ENI), announced today its consolidated financial results for the first half of 2012. All figures are in Chilean pesos (Ch$) and in accordance with International Financial Reporting Standards (IFRS). Variations refer to the period between June 30, 2011 and June 30, 2012.
Figures as of June 30, 2012 are additionally translated into US$, merely as a convenience translation, using the exchange rate of US$ 1 = Ch$ 501.84 for the Balance Sheet, and the average exchange rate for the period of US$ 1 = Ch$ 492.75 for the Income Statement, Cash Flow Statements, Capex and Depreciation values.
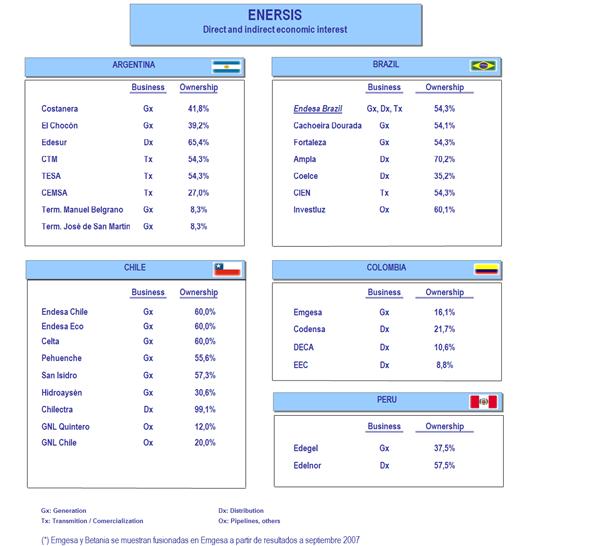
The consolidation includes the following investment vehicles and companies:
a) In Chile: Endesa Chile (NYSE: EOC)*, Chilectra, and Inmobiliaria Manso de Velasco.
b) Others than Chile: Distrilima (Peru), Endesa Brasil (Brazil)**, Edesur (Argentina) and Codensa (Colombia).
* Includes Endesa Chile Chilean subsidiaries (Endesa Eco, Celta, Pehuenche, San Isidro, merger between San Isidro and Pangue, and Tunel El Melón), non Chilean subsidiaries (Endesa Costanera, El Chocón, Edegel and Emgesa) and jointly controlled companies (GasAtacama, Transquillota and HidroAysén.)
** Includes Endesa Fortaleza, CIEN, Cachoeira Dourada, Ampla and Coelce.
Pg.9
PRESS RELEASE |
Simplified Organizational Structure
Pg.10
PRESS RELEASE |
Consolidated Income Statement Analysis
Net Income
Enersis’ Net Income attributable to the owners of the controller for the cumulative period as of June 30, 2012 reached Ch$ 162,621 million, representing a 19.4% decrease over the same period 2011, which was Ch$ 201,756 million.
Under IFRS
Table 1 |
|
|
|
|
|
|
CONSOLIDATED INCOME STATEMENT | (Million Ch$) |
|
|
|
| (Thousand US$) |
| 1H 2011 | 1H 2012 | Var 2011-2012 | Chg % |
| 1H 2012 |
Sales | 3,057,656 | 3,177,505 | 119,850 | 3.9% |
| 6,448,514 |
Energy sales | 2,856,048 | 2,952,040 | 95,992 | 3.4% |
| 5,990,949 |
Other sales | 21,327 | 15,246 | (6,081) | (28.5%) |
| 30,941 |
Other services | 180,281 | 210,219 | 29,938 | 16.6% |
| 426,624 |
Other operating income | 144,066 | 118,198 | (25,868) | (18.0%) |
| 239,875 |
Revenues | 3,201,722 | 3,295,704 | 93,982 | 2.9% |
| 6,688,389 |
|
|
|
|
|
|
|
Energy purchases | (888,399) | (977,781) | (89,382) | (10.1%) |
| (1,984,335) |
Fuel consumption | (370,347) | (390,275) | (19,928) | (5.4%) |
| (792,035) |
Transportation expenses | (194,243) | (227,534) | (33,291) | (17.1%) |
| (461,764) |
Other variable costs | (347,506) | (304,397) | 43,109 | 12.4% |
| (617,751) |
Procurements and Services | (1,800,495) | (1,899,987) | (99,492) | (5.5%) |
| (3,855,884) |
|
|
|
|
|
|
|
Contribution Margin | 1,401,227 | 1,395,717 | (5,510) | (0.4%) |
| 2,832,504 |
|
|
|
|
|
|
|
Other work performed by entity and capitalized | 22,554 | 23,449 | 894 | 4.0% |
| 47,587 |
Employee benefits expense | (173,397) | (207,060) | (33,663) | (19.4%) |
| (420,213) |
Other fixed operating expenses | (325,098) | (257,290) | 67,809 | 20.9% |
| (522,151) |
Gross Operating Income (EBITDA) | 925,286 | 954,815 | 29,530 | 3.2% |
| 1,937,728 |
Depreciation and amortization | (206,023) | (217,976) | (11,952) | (5.8%) |
| (442,366) |
Reversal of impairment profit (impairment loss) recognized in profit or loss | 15,802 | (17,490) | (33,292) | (210.7%) |
| (35,494) |
Operating Income | 735,065 | 719,350 | (15,714) | (2.1%) |
| 1,459,868 |
|
|
|
|
|
|
|
Net Financial Income | (136,887) | (162,269) | (25,382) | (18.5%) |
| (329,314) |
Financial income | 93,169 | 89,454 | (3,715) | (4.0%) |
| 181,541 |
Financial costs | (217,623) | (234,331) | (16,708) | (7.7%) |
| (475,557) |
Gain (Loss) for indexed assets and liabilities | (13,102) | (7,865) | 5,237 | 40.0% |
| (15,962) |
Foreign currency exchange differences, net | 669 | (9,527) | (10,196) | (1524.7%) |
| (19,335) |
Gains | 16,283 | 24,949 | 8,666 | 53.2% |
| 50,632 |
Losses | (15,614) | (34,476) | (18,862) | (120.8%) |
| (69,967) |
Share of profit (loss) of associates accounted for using the equity method | 4,322 | 5,337 | 1,014 | 23.5% |
| 10,830 |
Net Income From Other Investments | 182 | 399 | 217 | 119.6% |
| 810 |
Net Income From Sale of Assets | (7,336) | 1,348 | 8,684 | 118.4% |
| 2,736 |
|
|
|
|
|
|
|
Net Income Before Taxes | 595,346 | 564,165 | (31,181) | (5.2%) |
| 1,144,931 |
Income Tax | (178,628) | (175,206) | 3,422 | 1.9% |
| (355,569) |
NET INCOME ATTRIBUTABLE TO: | 416,717 | 388,958 | (27,759) | (6.7%) |
| 789,362 |
Owners of parent | 201,756 | 162,621 | (39,135) | (19.4%) |
| 330,027 |
Non-controlling interest | 214,961 | 226,337 | 11,376 | 5.3% |
| 459,335 |
|
|
|
|
|
|
|
Earning per share (Ch$ /share and US$ / ADR) | 6.2 | 5.0 | (1.2) | (19.4%) |
| 0.5 |
Operating income decreased by Ch$ 15,715 million, 2.1% lower than first half of 2011.
Operating revenues and costs breakdown by business line for the period ending on June 30, 2011 and June 30, 2012 are:
Pg.11
PRESS RELEASE |
Table 2 |
|
|
|
|
|
|
|
|
|
|
|
|
|
|
Operating Income by Businesses | Generation and Transmission | Distribution |
| |||||||||||
| Million Ch$ |
| Chg% |
| Th. US$ |
| Million Ch$ |
| Chg% |
| Th. US$ |
| ||
| 1H 2011 | 1H 2012 |
|
|
| 1H 2012 |
| 1H 2011 | 1H 2012 |
|
|
| 1H 2012 |
|
Operating Revenues | 1,327,158 | 1,324,631 |
| (0.2%) |
| 2,688,242 |
| 2,179,500 | 2,278,990 |
| 4.6% |
| 4,625,044 |
|
Operating Costs | (937,831) | (968,426) |
| 3.3% |
| (1,965,350) |
| (1,826,935) | (1,909,761) |
| 4.5% |
| (3,875,720) |
|
Operating Income | 389,327 | 356,205 |
| (8.5%) |
| 722,893 |
| 352,566 | 369,229 |
| 4.7% |
| 749,323 |
|
|
|
|
|
|
|
|
|
|
|
|
|
|
|
|
Operating Income by Businesses | Eliminations and Others |
| Consolidated |
| ||||||||||
| Million Ch$ |
| Chg% |
| Th. US$ |
| Million Ch$ |
| Chg% |
| Th. US$ |
| ||
| 1H 2011 | 1H 2012 |
|
|
| 1H 2012 |
| 1H 2011 | 1H 2012 |
|
|
| 1H 2012 |
|
Operating Revenues | (304,937) | (307,918) |
| 1.0% |
| (624,897) |
| 3,201,722 | 3,295,704 |
| 2.9% |
| 6,688,389 |
|
Operating Costs | 298,109 | 301,834 |
| 1.2% |
| 612,550 |
| (2,466,657) | (2,576,354) |
| 4.4% |
| (5,228,521) |
|
Operating Income | (6,828) | (6,084) |
| (10.9%) |
| (12,347) |
| 735,065 | 719,350 |
| (2.1%) |
| 1,459,868 |
|
Generation and transmission businessevidenced an operating income of Ch$ 356,205 million, representing a Ch$ 33,122 million decrease from the same period of 2011. Physical sales increased 3.0%, amounting to 32,542 GWh in this period.
Operating income for generation and transmission business line, detailed by country is presented in the following table:
Table 3 | 4 | 3 |
|
|
|
|
| 6 | 5 |
|
|
|
|
| 8 | 7 |
|
|
|
|
Generation & Transmission | Chile |
| Argentina |
| Brazil | |||||||||||||||
| Million Ch$ |
| Chg% |
| Th. US$ |
| Million Ch$ |
| Chg% |
| Th. US$ |
| Million Ch$ |
| Chg% |
| Th. US$ | |||
| 1H 2011 | 1H 2012 |
|
|
| 1H 2012 |
| 1H 2011 | 1H 2012 |
|
|
| 1H 2012 |
| 1H 2011 | 1H 2012 |
|
|
| 1H 2012 |
Operating Revenues | 615,186 | 553,995 |
| (9.9%) |
| 1,124,291 |
| 204,079 | 184,281 |
| (9.7%) |
| 373,984 |
| 134,926 | 172,907 |
| 28.1% |
| 350,902 |
% of consolidated | 46% | 42% |
|
|
| 42% |
| 15% | 14% |
|
|
| 14% |
| 10% | 13% |
|
|
| 13% |
Operating Costs | (489,906) | (498,512) |
| 1.8% |
| (1,011,695) |
| (186,340) | (181,446) |
| (2.6%) |
| (368,232) |
| (44,963) | (85,190) |
| 89.5% |
| (172,887) |
% of consolidated | 52% | 51% |
|
|
| 51% |
| 20% | 19% |
|
|
| 19% |
| 5% | 9% |
|
|
| 9% |
|
|
|
|
|
|
|
|
|
|
|
|
|
|
|
|
|
|
|
|
|
Operating Income | 125,280 | 55,482 |
| (55.7%) |
| 112,597 |
| 17,739 | 2,834 |
| (84.0%) |
| 5,752 |
| 89,963 | 87,717 |
| (2.5%) |
| 178,016 |
| 12 | 11 |
|
|
|
|
| 10 | 9 |
|
|
|
|
|
|
|
|
|
|
|
Generation & Transmission | Peru |
| Colombia |
| Consolidated | |||||||||||||||
| Million Ch$ |
| Chg% |
| Th. US$ |
| Million Ch$ |
| Chg% |
| Th. US$ |
| Million Ch$ |
| Chg% |
| Th. US$ | |||
| 1H 2011 | 1H 2012 |
|
|
| 1H 2012 |
| 1H 2011 | 1H 2012 |
|
|
| 1H 2012 |
| 1H 2011 | 1H 2012 |
|
|
| 1H 2012 |
Operating Revenues | 115,117 | 141,754 |
| 23.1% |
| 287,679 |
| 232,228 | 272,012 |
| 17.1% |
| 552,028 |
| 1,327,158 | 1,324,631 |
| (0.2%) |
| 2,688,242 |
% of consolidated | 9% | 11% |
|
|
| 11% |
| 17% | 21% |
|
|
| 21% |
| 100% | 100% |
|
|
|
|
Operating Costs | (57,610) | (89,239) |
| 54.9% |
| (181,104) |
| (133,391) | (114,355) |
| (14.3%) |
| (232,074) |
| (937,831) | (968,426) |
| 3.3% |
| (1,965,350) |
% of consolidated | 6% | 9% |
|
|
| 9% |
| 14% | 12% |
|
|
| 12% |
| 100% | 100% |
|
|
|
|
|
|
|
|
|
|
|
|
|
|
|
|
|
|
|
|
|
|
|
|
|
Operating Income | 57,508 | 52,515 |
| (8.7%) |
| 106,575 |
| 98,836 | 157,657 |
| 59.5% |
| 319,953 |
| 389,327 | 356,205 |
| (8.5%) |
| 722,893 |
Distribution businessshowed a Ch$ 16,663 million higher operating income, totaling Ch$ 369,229 million. Physical sales amounted to 35,902 GWh, representing an increase of 1,582 GWh, or 4.6%. Our clients base increased by 377 thousand of new clients approximately, amounting over 13.8 million customers.
Operating Income for distribution business line, detailed by country, is as follows:
Table 4 | 4 | 3 |
|
|
|
|
| 6 | 5 |
|
|
|
|
| 8 | 7 |
|
|
|
|
Distribution | Chile |
| Argentina |
| Brazil | |||||||||||||||
| Million Ch$ |
| Chg% |
| Th. US$ |
| Million Ch$ |
| Chg% |
| Th. US$ |
| Million Ch$ |
| Chg% |
| Th. US$ | |||
| 1H 2011 | 1H 2012 |
|
|
| 1H 2012 |
| 1H 2011 | 1H 2012 |
|
|
| 1H 2012 |
| 1H 2011 | 1H 2012 |
|
|
| 1H 2012 |
Operating Revenues | 504,214 | 494,323 |
| (2.0%) |
| 1,003,193 |
| 139,425 | 165,014 |
| 18.4% |
| 334,883 |
| 989,326 | 980,892 |
| (0.9%) |
| 1,990,648 |
% of consolidated | 23% | 22% |
|
|
| 22% |
| 6% | 7% |
|
|
| 7% |
| 45% | 43% |
|
|
| 43% |
Operating Costs | (440,432) | (426,607) |
| (3.1%) |
| (865,768) |
| (147,656) | (190,068) |
| 28.7% |
| (385,730) |
| (802,939) | (810,834) |
| 1.0% |
| (1,645,527) |
% of consolidated | 24% | 22% |
|
|
| 22% |
| 8% | 10% |
|
|
| 10% |
| 44% | 42% |
|
|
| 42% |
|
|
|
|
|
|
|
|
|
|
|
|
|
|
|
|
|
|
|
|
|
Operating Income | 63,782 | 67,716 |
| 6.2% |
| 137,425 |
| (8,232) | (25,054) |
| 204.4% |
| (50,846) |
| 186,387 | 170,058 |
| (8.8%) |
| 345,120 |
| 12 | 11 |
|
|
|
|
| 10 | 9 |
|
|
|
|
|
|
|
|
|
|
|
Distribution | Peru |
| Colombia |
| Consolidated | |||||||||||||||
| Million Ch$ |
| Chg% |
| Th. US$ |
| Million Ch$ |
| Chg% |
| Th. US$ |
| Million Ch$ |
| Chg% |
| Th. US$ | |||
| 1H 2011 | 1H 2012 |
|
|
| 1H 2012 |
| 1H 2011 | 1H 2012 |
|
|
| 1H 2012 |
| 1H 2011 | 1H 2012 |
|
|
| 1H 2012 |
Operating Revenues | 158,417 | 194,265 |
| 22.6% |
| 394,247 |
| 388,119 | 444,496 |
| 14.5% |
| 902,073 |
| 2,179,500 | 2,278,990 |
| 4.6% |
| 4,625,044 |
% of consolidated | 7% | 9% |
|
|
| 9% |
| 18% | 20% |
|
|
| 20% |
| 100% | 100% |
|
|
|
|
Operating Costs | (120,109) | (158,925) |
| 32.3% |
| (322,526) |
| (315,798) | (323,327) |
| 2.4% |
| (656,169) |
| (1,826,935) | (1,909,761) |
| 4.5% |
| (3,875,720) |
% of consolidated | 7% | 8% |
|
|
| 8% |
| 17% | 17% |
|
|
| 17% |
| 100% | 100% |
|
|
|
|
|
|
|
|
|
|
|
|
|
|
|
|
|
|
|
|
|
|
|
|
|
Operating Income | 38,308 | 35,340 |
| (7.7%) |
| 71,721 |
| 72,320 | 121,169 |
| 67.5% |
| 245,903 |
| 352,566 | 369,229 |
| 4.7% |
| 749,323 |
Pg.12
PRESS RELEASE |
Net Financial Income
The Company’s net financial income as of June 31, 2012 totaled a loss of Ch$ 162,269 million, 18.5% higher than for the same period of 2011. The latter is mainly explained by:
Higher financial expense of Ch$ 16,708 million, mainly due to increases in Coelce of Ch$17,713 million, in Edegel of Ch$ 7,810 million by updating a contingency and in Edesur of Ch$ 3,971 million for higher average debt. This was partially offset by decreases in Cien of Ch$ 11,731 million, due to lower average debt.
Higher exchange rate expense of Ch$ 10,196 million, mainly explained by losses due to exchange rate variation in cash and cash equivalent of Ch$ 8,235 million and in commercial accounts and other accounts payable of Ch$ 4,729 million. This was partially offset by gains in debtors and other accounts receivable of Ch$ 2,389 million.
Lower financial revenues of Ch$ 3,715 million as a result of lower revenues from pension plans’ assets in Brazil by Ch$ 4,468 million, lower revenues from issues of Ch$ 2,141 million, partially offset by increased income from other financial assets of Ch $ 2,894 million.
The latter was partially offset by:
Lower adjustment units expenses of Ch$ 5,237 million due to the effect of the UF (“Unidad de Fomento” in Spanish) change mainly over UF denominated debt in some companies in Chile. This as a result of the first half of 2012 the UF increased its value by 1.6% compared with an increase of 2.1% occurred in the same period last year.
Sale of Assets
The net income from sale of assets registered an increase of Ch$ 8,684 million, explained by the recognition in 2011 of the loss generated due to the sale of CAM.
Taxes
Income tax net expense decreased by Ch$ 3,423 million at the end of June 2012. This is explained by decreases in: Endesa Chile by Ch$ 22,148 million, Ampla by Ch$ 4,422 million, Enersis by Ch$ 2,499 million, Pehuenche by Ch$ 2,037 million, Endesa Brazil by Ch$ 1,903 million, Cien by Ch$ 1,128 million, Manso de Velasco by Ch$ 573 million and Túnel El Melon by Ch$ 473 million. This was partially offset by increases in Emgesa by Ch$ 13,504 million, Codensa by Ch$ 6,834 million, Edesur by Ch$ 2,804 million, Chilectra by Ch$ 2,289 million, Edegel by Ch$ 2,018 million, San Isidro by Ch$ 1,810 million, Celta by Ch$ 1,523 million, Coelce by Ch$ 1,415 and Endesa Eco by Ch$ 842 million.
Pg.13
PRESS RELEASE |
Consolidated Balance Sheet Analysis
Assets Under IFRS
Table 5 |
|
|
|
|
|
|
ASSETS | (Million Ch$) |
| (Thousand US$) | |||
| As of Dec 31, 2011 | As of June 30, 2012 | Var 2011-2012 | Chg % |
| As of June 30, 2012 |
|
|
|
|
|
|
|
CURRENT ASSETS |
|
|
|
|
|
|
Cash and cash equivalents | 1,219,921 | 731,224 | (488,697) | (40.1%) |
| 1,457,086 |
Other current financial assets | 939 | 1,029 | 89 | 9.5% |
| 2,050 |
Other current non-financial assets | 72,466 | 96,171 | 23,704 | 32.7% |
| 191,636 |
Trade and other current receivables | 977,602 | 942,866 | (34,736) | (3.6%) |
| 1,878,819 |
Accounts receivable from related companies | 35,283 | 30,651 | (4,632) | (13.1%) |
| 61,077 |
Inventories | 77,926 | 94,957 | 17,031 | 21.9% |
| 189,217 |
Current tax assets | 141,828 | 193,693 | 51,865 | 36.6% |
| 385,965 |
Non-current assets (or disposal groups) classified as held for sale | - | - | - |
|
| - |
Total Current Assets | 2,525,965 | 2,090,590 | (435,375) | (17.2%) |
| 4,165,850 |
|
|
|
|
|
|
|
NON-CURRENT ASSETS |
|
|
|
|
|
|
Other non-current financial assets | 37,355 | 52,774 | 15,419 | 41.3% |
| 105,161 |
Other non-current non-financial assets | 109,501 | 122,475 | 12,974 | 11.8% |
| 244,053 |
Trade accounts receivables and other receivables, net | 443,328 | 498,065 | 54,737 | 12.3% |
| 992,478 |
Investment accounted for using equity method | 13,193 | 12,313 | (880) | (6.7%) |
| 24,535 |
Intangible assets other than goodwill | 1,467,398 | 1,178,425 | (288,973) | (19.7%) |
| 2,348,208 |
Goodwill | 1,476,404 | 1,424,775 | (51,629) | (3.5%) |
| 2,839,102 |
Property, plant and equipment, net | 7,242,731 | 7,287,566 | 44,835 | 0.6% |
| 14,521,692 |
Investment properties | 38,056 | 38,356 | 300 | 0.8% |
| 76,430 |
Deferred tax assets | 379,939 | 402,109 | 22,171 | 5.8% |
| 801,270 |
Total Non-Current Assets | 11,207,906 | 11,016,858 | (191,048) | (1.7%) |
| 21,952,928 |
|
|
|
|
|
|
|
TOTAL ASSETS | 13,733,871 | 13,107,448 | (626,423) | (4.6%) |
| 26,118,778 |
Total Assets decreased Ch$ 626,423 million, mainly due to:
Ø Ch$ 435,375 million decrease in current assets, equivalent to 17.2%, as a result of:
v Decrease in cash and cash equivalents of Ch$ 488,697 million mainly due to: in Enersis, dividend payment of Ch$ 187,734 million and interest payments associated to dollar denominated bonds of Ch$ 11,275 million and other payments of Ch$ 39,000 million; in Endesa Chile, payment of UF bonds series F and K of Ch $ 121,210 million and dividend payment to third parties by Ch$ 88,467 million; in Emgesa, dividend payment of Ch$ 44,731 million and income taxes of Ch$ 45,309 million. Partially offset by increases in Edegel and Edelnor of Ch$ 34,000 million as a result of higher revenues from customers.
v Decrease in trade receivables of Ch$ 33,736 million, due to decreases in Endesa Costanera of Ch$ 13,710 million, due to the reduction of the account receivable to CAMMESA; in Endesa Chile of Ch$ 12,282 million, due to lower customer billing; in Pehuenche of Ch$ 12,196 million due to lower customer billing and in Ampla of Ch$ 10,481 million due to less revenue. This was partially offset by increase in San Isidro of Ch$ 17,342 million for the billing of the amendment of the contract with YPF.
The latter was partially compensated by:
v Increase in assets for current tax of Ch $ 51,865 million, primarily due to increases in Endesa Chile of Ch$ 34,222 million, due to largest remnant of IVA credit and Provisional Monthly Payments (PPM in its Spanish acronym) of the year; in Emgesa of Ch$ 13,571 million, due tohigher recoverable income tax and in Codensa of Ch$ 5,154 million due to higher recoverable income tax.
Pg.14
PRESS RELEASE |
Ø Ch$ 191,048 million decrease in non-current assets equivalent to 1.7%, mainly due to:
v Decrease in non-tangible assets other than goodwill of Ch$ 288,973 million, mainly explained by the effect of the reclassification of accounts receivable of Ch$ 115,391 million, because in the second quarter of 2012 the Brazilian electricity regulator, amended the period which rewards investment in assets assigned to the respective electricity distribution concessions, the decrease of Ch$ 47,143 million, due to amortization of the period, and the conversion effect of Ch$ 169,153 million. This was partially offset by new investments of Ch$ 73,251 million.
v Reduction of goodwill of Ch$ 51,629 million, corresponding mainly to the effect of conversion from local currencies to the Chilean peso.
This was partially offset by:
v Increase in non-current fees receivable Ch$ 54,737 million, mainly due to the transfer from Intangibles of Ch $ 115,391 million, for modification in the payback period, partially offset by decrease in Endesa Cachoeira of Ch$ 18,225 million, due to transfers to short-term, decrease in Costanera by Ch$ 4,863 million and the conversion effect of Ch$ 26,400 million.
v Increase in property, plant and equipment of Ch$ 44,834 million, mainly due to increases in Emgesa of Ch$ 70,083 million for the Quimbo project; in Endesa Chile of Ch$ 32,529 million; in Codensa of Ch$ 26,751 million; in Edesur of Ch$ 22,300 million; in Edelnor of Ch$ 20,934 million due to grid expansion; in Chilectra of Ch$ 15,830 million; in Costanera of Ch$ 10,927 million for combined cycles; in Edegel of Ch$ 6,550 million; in San Isidro of Ch$ 2,579 million; in Celta of Ch$ 2,118 million and in Fortaleza of Ch$ 1,526 million. This was partially offset by the effect of the depreciation for the period of Ch$ 170,833 million and the effect of converting to Chilean pesos subsidiaries whose functional currency is not the Chilean peso by approximately Ch$ 2,946 million.
v Increase in deferred tax assets of Ch$ 22,171 million primarily from increases in Endesa Chile of Ch$ 10,755 million; Enersis of Ch$ 6,908 million and Emgesa of Ch$ 3,507 million.
v Increase in other non-current financial assets of Ch$ 15,419 million, mainly by the increase in Endesa Chile of Ch$ 11,138 million, for the derivatives MTM and an increase in Enersis of Ch$ 4,072 million for security deposits.
Pg.15
PRESS RELEASE |
Book Value and Economic Value of Assets
Regarding the more important assets, the following should be mentioned:
Properties, Plants and Equipment are valued at their purchase cost, net of the corresponding accumulated depreciation and impairment loss they have been subject to. Properties, Plants and Equipment, net of their residual value, if applicable, are linearly depreciated by distributing the cost of their different elements along the estimated years of useful life, which is the period that the companies expect to use them. The useful life is reviewed regularly.
The goodwill value generated by consolidation represents the acquisition cost surplus on the Group’s stake in terms of the reasonable value of assets and liabilities, including the identifiable contingent liabilities of a subsidiary at the time of acquisition. Goodwill is not amortized. Instead, at the closing of each accounting period an assessment is made of whether any impairment has occurred during the period that could reduce its recoverable value to an amount below the registered net cost, proceeding in this event to make a timely impairment adjustment (See Note 3.e to the Consolidated Financial Statements).
Throughout the fiscal year and in particular at the date of closing, an assessment is made as to any indication of possible loss due to the impairment of any asset. In the event of any such indication, an estimate of the recoverable sum of said asset is made to determine, if applicable, the depreciated amount. If this involves identifiable assets that do not originate independent cash flows, the recoverability of the Cash Generating Unit that the asset belongs to is estimated, understanding as such the smaller group of identifiable assets that generate independent cash incomes.
Assets expressed in foreign currency are expressed at the prevalent exchange rate at the closing of the period.
Notes and accounts receivable from related companies are classified according to their short and long term maturities. These operations are adjusted according to prevalent market equity conditions.
In summary, assets are valued according to the International Financial Reporting Standards, whose criteria are expressed in Note 3 of the Consolidated Financial Statements.
Pg.16
PRESS RELEASE |
Liabilities and Shareholders’ Equity Under IFRS
Table 6 |
|
|
|
|
|
|
LIABILITIES AND SHAREHOLDERS' EQUITY | (Million Ch$) |
| (Thousand US$) | |||
| As of Dec 31, 2011 | As of June 30, 2012 | Var 2011-2012 | Chg % |
| As of June 30, 2012 |
|
|
|
|
|
|
|
CURRENT LIABILITIES |
|
|
|
|
|
|
Other current financial liabilities | 672,082 | 496,395 | (175,687) | (26.1%) |
| 989,151 |
Trade and other current payables | 1,235,064 | 1,133,321 | (101,743) | (8.2%) |
| 2,258,332 |
Accounts payable to related companies | 157,178 | 116,162 | (41,015) | (26.1%) |
| 231,473 |
Other short-term provisions | 99,703 | 91,052 | (8,651) | (8.7%) |
| 181,435 |
Current tax liabilities | 235,853 | 118,888 | (116,965) | (49.6%) |
| 236,905 |
Current provisions for employee benefits | - | - | - |
|
| - |
Other current non-financial liabilities | 60,653 | 69,645 | 8,992 | 14.8% |
| 138,780 |
Liabilities (or disposal groups) classified as held for sale | - | - | - |
|
| - |
Total Current Liabilities | 2,460,534 | 2,025,464 | (435,069) | (17.7%) |
| 4,036,076 |
|
|
|
|
|
|
|
NON-CURRENT LIABILITIES |
|
|
|
|
|
|
Other non-current financial liabilities | 3,271,355 | 3,251,766 | (19,590) | (0.6%) |
| 6,479,686 |
Non-current payables | 14,305 | 13,716 | (588) | (4.1%) |
| 27,332 |
Accounts payable to related companies | - | - | - |
|
| - |
Other-long term provisions | 202,574 | 211,989 | 9,416 | 4.6% |
| 422,424 |
Deferred tax liabilities | 508,438 | 528,805 | 20,366 | 4.0% |
| 1,053,731 |
Non-current provisions for employee benefits | 277,526 | 261,082 | (16,444) | (5.9%) |
| 520,249 |
Other non-current non-financial liabilities | 102,985 | 84,611 | (18,375) | (17.8%) |
| 168,601 |
Total Non-Current Liabilities | 4,377,183 | 4,351,968 | (25,215) | (0.6%) |
| 8,672,023 |
|
|
|
|
|
|
|
SHAREHOLDERS' EQUITY |
|
|
|
|
|
|
Issued capital | 2,824,883 | 2,824,883 | (0) | (0.0%) |
| 5,629,051 |
Retained earnings (losses) | 2,232,969 | 2,271,547 | 38,578 | 1.7% |
| 4,526,437 |
Share premium | 158,760 | 158,760 | - | 0.0% |
| 316,355 |
Other equity changes | - | - | - |
|
| - |
Reserves | (1,320,883) | (1,441,760) | (120,877) | (9.2%) |
| (2,872,947) |
|
|
| - |
|
|
|
Equity Attributable to Shareholders of the Company | 3,895,729 | 3,813,430 | (82,299) | (2.1%) |
| 7,598,896 |
Equity Attributable to Minority Interest | 3,000,425 | 2,916,585 | (83,840) | (2.8%) |
| 5,811,784 |
Total Shareholders' Equity | 6,896,154 | 6,730,015 | (166,139) | (2.4%) |
| 13,410,679 |
|
|
|
|
|
|
|
TOTAL LIABILITIES AND SHAREHOLDERS' EQUITY | 13,733,871 | 13,107,448 | (626,423) | (4.6%) |
| 26,118,778 |
The Company’s total liabilities and shareholders’ equity decreased by Ch$ 626,423 million, compared to the period ended on December 31, 2011, due to Ch$ 435,070 million decrease in current liabilities, Ch$166,138 million in shareholders’ equity and Ch$ 25,215 in non-current liabilities.
Ø Current liabilities decreased by Ch$ 435,070 million, equivalent to 17.7%, mainly due to:
v Decrease in other current liabilities of Ch$ 175,687 million due to decreases in Emgesa of Ch$ 94,614 million caused by long term refinancing and interest payments; in Endesa Chile of Ch$ 33,638 million, for bond payment, offset by long term transfer; in Ampla of Ch$ 31,886 million, for loans payment; in Cien of Ch$ 30,667 million, due to loans repayment and in Coelce of Ch$ 13,139 million for loan repayment. This was partially offset by increases in Codensa of Ch$ 13,241 million for transfer from the long term; in Edelnor of Ch$ 9,677 million and in Edegel of Ch$ 8,403 million, both by transfer from the long term.
v Decrease in current tax liabilities of Ch$ 116,965 million due mainly to declining in Emgesa of Ch$ 23,790 million; Codensa of Ch$ 22,071 million, Coelce of Ch$ 17,115 million; Cachoeira of Ch$ 14,106 million; Chilectra of Ch$ 11,394 million, Edegel for Ch$ 8,419 million; Pehuenche of Ch$ 8,246 million and Endesa Chile of Ch $ 4,770 million.
v Decrease in trade and other current payables by Ch$ 101,743 million due to decreases in accounts payable for goods and services of Ch$ 133,591 million, dividends payable to third parties of Ch$ 16,892 million, liabilities for social programs of Ch$ 10.093 million , and accounts payable at fiscal institutions of Ch$ 7,154 million. The above was partially offset by increases inpower purchase providers of Ch$ 37,485 million, fuel suppliers of Ch$ 19,314 million in other accounts payable of Ch$ 3,234 million.
Pg.17
PRESS RELEASE |
v Decrease in accounts payable to related companies of Ch$ 41,015 million, due to lower accounts payable to Endesa Latinoamérica of Ch$ 27,576 million, mainly dividends, by the decrease in accounts payable to Cemsa in Ch$ 10,695 million and Carboex of Ch$ 5,580 million, partially offset by higher accounts payable with Endesa Generation of Ch$ 3,347 million and GNL Quintero of Ch$ 1,927 million.
Ø Non-Current liabilities decreased by Ch$ 25,215 million, equivalent to 0,6%, mainly explained by the following changes:
v Decrease in other financial liabilities (financial debt and derivatives) of Ch$ 19,590 million, mainly in Endesa Chile of Ch$ 107,553 million for transferring UF-nominated Bond to the short term and to exchange rate effect; in Coelce of Ch $ 39,485 million due to transfers to short-term and conversion effect; in Edegel of Ch$ 21,885 million for the transfer to the short term; in Codensa of Ch$ 9,074 million as the result of conversion effect and transfer to the short term; in Chocón of Ch$ 8,424 million for conversion effect and transfer to the short term; in Edesur of Ch$ 6,700 million for conversion effect and transfer to the short term: in Fortaleza of Ch$ 5,292 million and in Edelnor of Ch$ 3,599 million for transfer to short-term and for new loan. This is partially offset by increases in Emgesa of Ch$ 107,557 million for the refinancing loan from short term to long term and Ampla of Ch$ 72,217 million for the issuance of new bond and bank loan.
v Decrease in other non-current non-financial liabilities of Ch$ 18,375 million, mainly due to the decreases in Emgesa of Ch$ 6,843 million; in Codensa of Ch$ 2,824 million; in Cien of Ch$ 2,622 million; in Cachoeira of Ch$ 1,328 million; in Ampla of Ch$ 1.109 million; in Investluz of Ch$ 766 million; in Fortaleza of Ch$ 682 million and in Coelce of Ch$ 536 million.
Equity decreased by Ch$166,138 million with respect to the first half of 2011:
v The equity attributable to shareholders of the Company decreased by Ch$82,299 million, mainly explained by the effect of the comprehensive result for the period of Ch$ 42,828 million, primarily driven by the result of the parent of Ch$ 162,621 million, negative conversion reserves of Ch$ 134,906 million, positive hedge reserve of Ch$ 14,949 million and other reserves of Ch$ 1 million, less dividends of the period of Ch$ 123,879 million.
v Non-controlling interest decreased by Ch$ 83,839 million, mainly explained by the effect of the comprehensive result for the period of Ch$ 173,582 million, principally driven by the result for the period of the non-controllers of Ch$ 226,337 million, negative other comprehensive results of the period of Ch$ 52,756 million, and by the reduction in other equity movements of Ch$ 257,422 million.
Pg.18
PRESS RELEASE |
Debt Maturity with Third Parties, Thousand US$
Table 7 |
|
|
|
|
|
|
|
(Thousand US$) | 2012 | 2013 | 2014 | 2015 | 2016 | Balance | TOTAL |
Chile | 34,628.8 | 424,394.5 | 743,421.9 | 224,642.3 | 447,704.2 | 949,106.9 | 2,823,898.5 |
Enersis | 2,676.6 | 4,989.1 | 578,733.6 | 5,579.3 | 432,704.8 | 39,923.1 | 1,064,606.6 |
Chilectra | 2.1 | - | - | - | - | - | 2.1 |
Endesa Chile | 31,950.1 | 419,405.4 | 164,688.3 | 219,063.0 | 14,999.3 | 909,183.8 | 1,759,289.9 |
Argentina | 108,827.4 | 125,646.8 | 65,991.6 | 34,904.9 | 34,267.1 | - | 369,637.8 |
Edesur | 19,658.7 | 56,628.9 | 6,643.8 | - | - | - | 82,931.4 |
Costanera | 66,612.3 | 41,362.3 | 34,899.6 | 27,410.0 | 34,267.1 | - | 204,551.3 |
Chocón | 22,288.2 | 27,655.6 | 24,448.2 | 7,494.9 | - | - | 81,886.8 |
Hidroinvest | 268.3 | - | - | - | - | - | 268.3 |
CTM | - | - | - | - | - | - | - |
TESA | - | - | - | - | - | - | - |
Peru | 76,005.3 | 112,753.6 | 111,021.6 | 84,227.7 | 89,261.7 | 260,207.8 | 733,477.9 |
Edelnor | 35,623.7 | 60,660.5 | 60,576.5 | 50,509.2 | 31,898.2 | 131,037.1 | 370,305.1 |
Edegel | 40,381.6 | 52,093.1 | 50,445.1 | 33,718.5 | 57,363.5 | 129,170.8 | 363,172.7 |
Brazil | 340,525.0 | 216,885.4 | 156,887.4 | 131,631.7 | 204,053.4 | 435,492.6 | 1,485,475.6 |
Endesa Brasil | - | - | - | - | - | - | - |
Coelce | 67,492.1 | 92,345.8 | 90,426.3 | 36,060.2 | 86,462.1 | 135,349.3 | 508,135.7 |
Ampla | 216,184.5 | 110,377.1 | 51,272.5 | 79,282.4 | 109,922.4 | 287,969.2 | 855,008.1 |
Cachoeira | - | - | - | - | - | - | - |
Cien | 50,130.1 | - | - | - | - | - | 50,130.1 |
Fortaleza | 6,718.3 | 14,162.5 | 15,188.6 | 16,289.1 | 7,669.0 | 12,174.1 | 72,201.7 |
Colombia | 3,404.0 | 135,044.3 | 219,466.5 | 162,875.0 | 104,038.3 | 1,190,892.5 | 1,815,720.5 |
Codensa | 3,404.0 | 135,044.3 | 140,087.4 | - | 81,250.7 | 264,204.9 | 623,991.2 |
Emgesa | - | - | 79,379.1 | 162,875.0 | 22,787.6 | 926,687.6 | 1,191,729.2 |
TOTAL | 563,390.5 | 1,014,724.6 | 1,296,789.1 | 638,281.57 | 879,324.7 | 2,835,699.8 | 7,228,210.4 |
Debt Maturity with Third Parties, Million Ch$
Table 7.1 |
|
|
|
|
|
|
|
(Million Ch$) | 2012 | 2013 | 2014 | 2015 | 2016 | Balance | TOTAL |
Chile | 17,378 | 212,978 | 373,079 | 112,734 | 224,676 | 476,300 | 1,417,145 |
Enersis | 1,343 | 2,504 | 290,432 | 2,800 | 217,149 | 20,035 | 534,262 |
Chilectra | 1 | - | - | - | - | - | 1 |
Endesa Chile | 16,034 | 210,474 | 82,647 | 109,935 | 7,527 | 456,265 | 882,882 |
Argentina | 54,614 | 63,055 | 33,117 | 17,517 | 17,197 | - | 185,499 |
Edesur | 9,866 | 28,419 | 3,334 | - | - | - | 41,618 |
Costanera | 33,429 | 20,757 | 17,514 | 13,755 | 17,197 | - | 102,652 |
Chocón | 11,185 | 13,879 | 12,269 | 3,761 | - | - | 41,094 |
Hidroinvest | 135 | - | - | - | - | - | 135 |
CTM | - | - | - | - | - | - | - |
TESA | - | - | - | - | - | - | - |
Peru | 38,143 | 56,584 | 55,715 | 42,269 | 44,795 | 130,583 | 368,089 |
Edelnor | 17,877 | 30,442 | 30,400 | 25,348 | 16,008 | 65,760 | 185,834 |
Edegel | 20,265 | 26,142 | 25,315 | 16,921 | 28,787 | 64,823 | 182,255 |
Brazil | 170,889 | 108,842 | 78,732 | 66,058 | 102,402 | 218,548 | 745,471 |
Endesa Brasil | - | - | - | - | - | - | - |
Coelce | 33,870 | 46,343 | 45,380 | 18,096 | 43,390 | 67,924 | 255,003 |
Ampla | 108,490 | 55,392 | 25,731 | 39,787 | 55,163 | 144,514 | 429,077 |
Cachoeira | - | - | - | - | - | - | - |
Cien | 25,157 | - | - | - | - | - | 25,157 |
Fortaleza | 3,372 | 7,107 | 7,622 | 8,175 | 3,849 | 6,109 | 36,234 |
Colombia | 1,708 | 67,771 | 110,137 | 81,737 | 52,211 | 597,637 | 911,201 |
Codensa | 1,708 | 67,771 | 70,301 | - | 40,775 | 132,589 | 313,144 |
Emgesa | - | - | 39,836 | 81,737 | 11,436 | 465,049 | 598,057 |
TOTAL | 282,732 | 509,229 | 650,781 | 320,315 | 441,280 | 1,423,068 | 3,627,405 |
Pg.19
PRESS RELEASE |
Evolution Of Key Financial Ratios
Table 8 |
|
|
|
|
| |||
Indicator | Unit | As of Dec 31, 2011 | As of June 30, 2012 | Var 2011-2012 | Chg % | |||
Liquidity | Times | 1.03 | 1.03 | - | 0.0% | |||
Acid ratio test * | Times | 0.99 | 0.98 | (0.01) | (1.0%) | |||
Working capital | Million Ch$ | 65,431 | 65,126 | (306) | (0.5%) | |||
Working capital | Thousand US$ | 130,383 | 129,774 | (609) | (0.5%) | |||
Leverage ** | Times | 0.99 | 0.95 | (0.04) | (4.0%) | |||
Short-term debt | % | 36.0 | 32.0 | (4.00) | (11.1%) | |||
Long-term debt | % | 64.0 | 68.0 | 4.00 | 6.3% | |||
* (Current assets net of inventories and prepaid expenses) / Current liabilities |
|
| ||||||
** Total debt / (equity + minority interest) |
|
|
|
| ||||
|
|
|
|
|
| |||
Table 8.1 |
|
|
|
|
| |||
Indicator | Unit | 1H 2011 | 1H 2012 | Var 2011-2012 | Chg % | |||
Financial expenses coverage * | Times | 4.0 | 3.8 | (0.23) | (6%) | |||
Op. income / Op. rev. | % | 23.0 | 21.8 | (1.1) | (4.9%) | |||
ROE ** | % | 12.9 | 8.7 | (4.2) | (24.2%) | |||
ROA ** | % | 7.9 | 6.4 | (1.5) | (18.9%) | |||
* EBITDA / Financial costs |
|
|
|
|
| |||
** Annualized figures |
|
|
|
|
| |||
The liquidity ratio at June 30, 2012 was 1.03 times, showing no variation with respect to December 31, 2012. This reflects a stable company with a solid liquidity position, fulfilling its financial liabilities, financing its investments with cash generation and a comfortable debt maturity structure.
The leverage ratio is 0.95 times as of June 30, 2012, reducing by 4.0% compared to December 31, 2011.
The financial expenses coverage shows a fall of 0.23 times, equivalent to 5.6%, moving from 4.02:1 as of June 30, 2011 to 3.79 times as of June 30, 2012. This is the result of the increase in the company’s financial cost in this period, partially offset by increase in EBITDA.
The profitability indicator, operating income over operating revenues, fell 4.9% to 21.8% as of June 30, 2012.
On the other hand, the annualized return on equity of the shareholders of the Company is 8.7%, with a fall of 32.3% with respect to June 30, 2011 when it was 12.9%. This was consequence of the lower result reported for the annualized period, compensated by the increase of the equity of the owners.
The annualized return on assets passed from 7.9% as of June 30, 2011 to 6.4% in June 30, 2012 as a result of the decline in the result for the annualized present period.
Pg.20
PRESS RELEASE |
Consolidated Statements of Cash Flows Analysis
Under IFRS
CASH FLOW | (Million Ch$) |
|
|
| (Thousand US$) | |
| 1H 2011 | 1H 2012 | Var 2011-2012 | Chg % |
| 1H 2012 |
|
|
|
|
|
|
|
Collection classes provided by operating activities |
|
|
|
|
|
|
Proceeds from sales of goods and services | 3,786,708 | 3,954,849 | 168,141 | 4.4% |
| 8,026,077 |
Cash receipts from royalties, fees, commissions and other revenue | 41,247 | 39,236 | (2,011) | (4.9%) |
| 79,627 |
Receipts from contracts held for purposes of dealing or trading | - | - | - |
|
| - |
Receipts from premiums and claims, annuities and other benefits from policies written | 203 | 1,675 | 1,472 | 726.8% |
| 3,399 |
Other cash receipts from operating activities | 173,720 | 164,540 | (9,179) | (5.3%) |
| 333,922 |
Types of payments |
|
|
|
|
|
|
Payments to suppliers for goods and services | (2,109,183) | (2,179,369) | (70,186) | (3.3%) |
| (4,422,870) |
Payments from contracts held for dealing or trading | - | - | - |
|
| - |
Payments to and on behalf of employees | (190,531) | (222,464) | (31,932) | (16.8%) |
| (451,474) |
Payments for premiums and claims, annuities and other policy benefits underwritten | (1,455) | (3,070) | (1,615) | (111.0%) |
| (6,231) |
Other payments for operating activities | (770,734) | (766,295) | 4,439 | 0.6% |
| (1,555,139) |
Dividends paid | (0) | (0) | (0) | (67.3%) |
| (0) |
Dividends received | - | - | - |
|
| - |
Payments of interest classified as operating | - | 0 |
|
|
|
|
Proceeds of interest received classified as operating | - | 0 | 0 |
|
| 0 |
Income taxes refund (paid) | (246,102) | (333,183) | (87,082) | (35.4%) |
| (676,171) |
Other inflows (outflows) of cash | (76,394) | (108,685) | (32,291) | (42.3%) |
| (220,568) |
Net cash flows from (used in) operating activities | 607,479 | 547,234 | (60,245) | (9.9%) |
| 1,110,572 |
|
|
|
|
|
|
|
Cash flows from (used in) investing activities |
|
|
|
|
|
|
Cash flows from losing control of subsidiaries or other businesses | 15,367 | - | (15,367) | (100.0%) |
| - |
Cash flows used for control of subsidiaries or other businesses | - | - | - |
|
| - |
Acquisitions of associates | - | - | - |
|
| - |
Other cash receipts from sales of equity or debt instruments of other entities | - | - | - |
|
| - |
Other payments to acquire equity or debt instruments of other entities | - | - | - |
|
| - |
Other proceeds from the sale of interests in joint ventures | - | - | - |
|
| - |
Cash flows used for the purchase of non-controlling | - | - | - |
|
| - |
Loans to related companies | - | 0 | 0 |
|
| 0 |
Proceeds from sales of property, plant and equipment | 2,566 | 422 | (2,144) | (83.6%) |
| 856 |
Purchase of property, plant and equipment | (241,562) | (238,792) | 2,770 | 1.1% |
| (484,610) |
Proceeds from sales of intangible assets | 7,348 | - | (7,348) | (100.0%) |
| - |
Acquisitions of intangible assets | (91,475) | (96,354) | (4,879) | (5.3%) |
| (195,543) |
Proceeds from other long term assets. | - | - | - |
|
| - |
Purchase of other long-term assets | - | (1,776) | (1,776) |
|
| (3,604) |
Other inflows (outflows) of cash | - | - | - |
|
| - |
Prepayments and third party loans | (1,269) | (4,545) | (3,276) | (258.1%) |
| (9,224) |
Proceeds from prepayments reimbursed and third party loans | - | - | - |
|
| - |
Payments arising from futures contracts, forwards, options and swap | - | - | - |
|
| - |
Cash receipts from futures contracts, forwards, options and swap | - | 32 | 32 |
|
| 64 |
Proceeds from related | - | 0 | 0 |
|
| 0 |
Dividends received | 2,430 | 2,929 | 499 | 20.5% |
| 5,945 |
Proceeds of interest received classified as operating | 11,898 | 33,410 | 21,512 | 180.8% |
| 67,803 |
Income taxes refund (paid) | - | - | - |
|
| - |
Other inflows (outflows) of cash | (4,030) | (35) | 3,995 | 99.1% |
| (71) |
Net cash flows from (used in) investing activities | (298,728) | (304,708) | (5,980) | (2.0%) |
| (618,383) |
Proceeds from shares issue | ||||||
Proceeds from issuance of other equity instruments | - | - | - |
|
| - |
Payments to acquire or redeem the shares of the entity | - | - | - |
|
| - |
Payments for other equity interests | - | - | - |
|
| - |
Total loan amounts from | 322,720 | 300,976 | (21,744) | (6.7%) |
| 610,809 |
Proceeds from term loans | 227,546 | 223,625 | (3,920) | (1.7%) |
| 453,831 |
Proceeds from short-term loans | 95,174 | 77,351 | (17,824) | (18.7%) |
| 156,978 |
Repayments of borrowings | 0 | 11,985 | 11,985 | - |
| 24,322 |
Payments of loans | (307,050) | (422,186) | (115,136) | (37.5%) |
| (856,795) |
Payments of finance lease liabilities | (5,812) | (2,542) | 3,270 | 56.3% |
| (5,158) |
Repayment of loans to related companies | - | (1,064) | (1,064) |
|
| (2,159) |
Proceeds from government grants | - | - | - |
|
| - |
Dividends paid | (503,450) | (427,426) | 76,024 | 15.1% |
| (867,430) |
Payments of interest classified as operating | (104,064) | (136,780) | (32,716) | (31.4%) |
| (277,586) |
Income taxes refund (paid) | - | - | - |
|
| - |
Other inflows (outflows) of cash | (4,222) | (22,511) | (18,290) | (433.2%) |
| (45,685) |
Net cash flows from (used in) financing activities | (601,877) | (699,548) | (97,671) | (16.2%) |
| (1,419,681) |
|
|
|
|
|
|
|
Net increase (decrease) in cash and cash equivalents, before the effect of changes in the exchange rate | (293,126) | (457,022) | (163,896) | (55.9%) |
| (927,492) |
|
|
|
|
|
|
|
Effect of exchange rate changes on cash and cash equivalents | 98,416 | (31,675) | (130,092) | (132.2%) |
| (64,283) |
|
|
|
|
|
|
|
Increase (decrease) in cash and cash equivalents | (194,709) | (488,697) | (293,988) | (151.0%) |
| (991,775) |
|
|
|
|
|
|
|
Cash and cash equivalents at beginning of period | 961,355 | 1,219,921 | 258,566 | 26.9% |
| 2,475,741 |
|
|
|
|
|
|
|
Cash and cash equivalents at end of period | 766,646 | 731,224 | (35,422) | (4.6%) |
| 1,483,966 |
Pg.21
PRESS RELEASE |
The company generated a negative net cash flow during the period of Ch$ 457,022 million, compounded by the following:
Operating activities for this period generated a net positive flow of Ch$ 547,234 million, a fall of 9.9% compared to the same period of the previous year. This flow is mainly composed of cash receipts from sales and royalties of Ch$ 3,994,085 million and other operating flows of Ch$ 166,215 million, offset by payments to suppliers of Ch$ 2,179,369 million, payment to employees of Ch$ 222,464 million and other operation payments of Ch$ 1,211,233 million.
Investment activities generated a negative net cash flow of Ch$ 304,708 million, a decrease in cash of 2.0% or Ch$ 5,980 million compared to the same period of 2011. These disbursements relate mainly to the acquisition of properties, plant and equipment of Ch$ 238,370 million, the incorporation of intangible assets (IFRIC 12 in Brazil) of Ch$ 96,354 million, and other investment disbursements of Ch$ 46,354 million, partially compensated by interests received of Ch$ 33,410 million and other investment amounts of Ch$ 2,961 million.
Financing activities generated a net negative cash flow of Ch$ 699,548 million, mainly for the payment of dividends of Ch$ 427,426 million, loan payments of Ch$ 422,186 million, interest payments of Ch$ 136,780 and other financing disbursements of Ch$ 26,117 million. This was partially offset by loan drawings of Ch$ 312,961 million.
Cash Flow Received From Foreign Subsidiaries by Enersis, Chilectra and Endesa Chile
Table 10 |
|
|
|
|
|
|
|
|
|
|
Cash Flow | Interest Received | Dividends Received | Capital Reductions | Others |
| Total Cash Received | ||||
(Thousand US$) |
|
|
|
|
|
|
|
|
|
|
| 1H 2011 | 1H 2012 | 1H 2011 | 1H 2012 | 1H 2011 | 1H 2012 | 1H 2011 | 1H 2012 | 1H 2011 | 1H 2012 |
Argentina | 101.8 | - | - | - | - | - | - | - | 101.8 | - |
Peru | - | - | 26,330.2 | 8,341.3 | - | - | - | - | 26,330.2 | 8,341.3 |
Brazil | - | - | - | - | - | - | - | - | - | - |
Colombia | - | - | 15,833.0 | 27,754.5 | - | - | - | - | 15,833.0 | 27,754.5 |
Others | - | - | - | - | - | - | - | - | - | - |
Total | 101.8 | - | 42,163.2 | 36,095.8 | - | - | - | - | 42,265.0 | 36,095.8 |
Source: Internal Financial Report
Pg.22
PRESS RELEASE |
Table 11 |
|
|
|
|
|
|
|
|
| ||||||||
| Payments for Additions of Fixed Assets |
| Depreciation | ||||||||||||||
|
|
|
|
|
|
|
|
|
| ||||||||
| Million Ch$ |
| Thousand US$ | Million Ch$ |
| Thousand US$ | |||||||||||
| 1H 2011 | 1H 2012 |
| 1H 2012 |
| 1H 2011 | 1H 2012 |
| 1H 2012 | ||||||||
Endesa Chile | 147,625 | 118,884 |
| 241,266 |
| 83,330 | 91,266 |
| 185,218 | ||||||||
Cachoeira | 1,514 | 2,959 |
| 6,005 |
| 3,828 | 3,198 |
| 6,490 | ||||||||
Endesa Fortaleza | 1,532 | 1,694 |
| 3,438 |
| 4,074 | 3,545 |
| 7,194 | ||||||||
Cien | 66 | 1,549 |
| 3,144 |
| 3,783 | 7,351 |
| 14,918 | ||||||||
Chilectra S.A. | 16,802 | 3,508 |
| 7,119 |
| 8,845 | 10,688 |
| 21,691 | ||||||||
Edesur | 33,924 | 54,862 |
| 111,338 |
| 6,420 | 7,010 |
| 14,226 | ||||||||
Edelnor | 13,871 | 19,333 |
| 39,235 |
| 9,686 | 10,967 |
| 22,257 | ||||||||
Ampla (*) | 59,088 | 55,719 |
| 113,078 |
| 28,574 | 26,440 |
| 53,658 | ||||||||
Coelce (*) | 31,501 | 40,529 |
| 82,251 |
| 20,112 | 16,712 |
| 33,916 | ||||||||
Codensa | 23,971 | 30,623 |
| 62,147 |
| 29,514 | 32,584 |
| 66,127 | ||||||||
Cam Ltda.(**) | 46 | - |
| - |
| 294 | - |
| - | ||||||||
Inmobiliaria Manso de Velasco Ltda. | 670 | 1,493 |
| 3,030 |
| 133 | 123 |
| 250 | ||||||||
Synapsis (***) | 488 |
|
| - |
| 478 | - |
| - | ||||||||
Enersis holding and investment companies | 581 | 722 |
| 1,465 |
| 569 | 663 |
| 1,346 | ||||||||
Total | 331,679 | 331,875 |
| 673,516 |
| 199,640 | 210,547 |
| 427,290 | ||||||||
(*) Includes concessions intangible assets. |
|
|
|
|
|
|
|
| |||||||||
The Principal Risks associated to the activities of the Enersis Group
Commercial and Regulatory Risk
The Group’s activities are subject to a broad range of governmental standards and environmental regulations. Any modification of such standards and regulations may affect the Group’s activities, economic situation and operating results.
The Group’s distribution activity is subject to a wide range of rules regarding tariffs and other issues that govern their activities in each of the countries where it operates and which could modify distribution subsidiaries operating results.
The Group’s generation activity is subject to existing hydrological and weather conditions in the geographic zones in which the Group’s hydroelectric generating plants are located. Commercial policies have been planned in order to moderate the possible impact of changes in these variables.
Group’s activities are subject to certain environmental regulation which Enersis fulfills constantly. Modifications applied on such regulations may affect the operations, economic condition or the results of these operations.
Enersis and its operating subsidiaries are subject to environmental regulations which, among other things, require the company to conduct environmental impact studies for future projects, obtaining permits, licenses and other authorizations and the fulfillment of all requirements of those licenses, permits and norms. As any other regulated company, Enersis cannot guarantee:
· The approval from regulators of environmental impact studies.
· That public opposition may not cause delays or modifications to any proposed project and
Pg.23
PRESS RELEASE |
· That laws or regulations may not change or be interpreted in a manner that could adversely affect the operations or the plans for companies in which Enersis or its subsidiaries hold investments.
The group’s commercial activity has been planned to moderate possible impacts resulting from changes in hydrological conditions.
Enersis group’s operations include hydroelectric generation and therefore depend on the hydrological conditions at any time in the broad geographical zones where its hydroelectric generation installations are located. If hydrological conditions produce droughts or other conditions that negatively affect hydroelectric generation, the results could be adversely affected. Enersis has therefore defined as an essential part of its commercial policy not to contract 100% of its total capacity. The electricity business is also affected by atmospheric conditions like average temperatures which govern consumption. The different weather conditions can produce differences in the margin obtained by the business.
Financial situation and the results from operations could be adversely affected if risk exposure weren’t efficiently managed in regards to interest rates, prices of commodities, and exchange rates.
Interest Rate Risk
Interest rate variations modify the fair value of those assets and liabilities that accrue a fixed interest rate, as well as the future flows of assets and liabilities pegged to a variable interest rate.
In compliance with our current interest rate hedging policy, the portion of fixed and/or hedged debt to the total net debt was 54% as of June 30, 2012 on a consolidated basis.
Depending on the Group’s estimates and debt structure objectives, hedging transactions take place hiring derivatives that mitigate these risks. Instruments currently used to accomplish the policy, are interest rate swaps.
The structure of Enersis’ financial debt sort by fixed, protected and variable interest rate, and after derivatives, is as follows:
Net Position:
| June 30 2012 | Dec. 31 2011 |
% | % | |
Fixed Interest Rate | 54% | 62% |
Variable Interest Rate | 46% | 38% |
Total | 100% | 100% |
Exchange Rate Risk
The exchange rate risks are mainly related to the following transactions:
- Foreign currency debts raised by Group’s companies.
- Payments to be made on international markets for the acquisition of projects related materials.
- Group companies’ incomes directly linked to the evolution of the dollar, and
- Incoming cash flows from our subsidiaries abroad exposed to exchange rate fluctuations.
Pg.24
PRESS RELEASE |
In order to mitigate exchange rate risks, Enersis’ exchange rate hedging policy is based on cash flows and it strives to maintain a balance between dollar indexed flows and the asset and liability levels in such currency. Crosscurrency swaps and exchange rate forwards are the instruments currently used in compliance with this policy. Likewise, the policy looks to refinance debts in each company’s functional currency.
Commodities Risk
Enersis is exposed to price fluctuation risk on some commodities, basically through
- Fuel purchases for the electricity generation and also,
- Energy transactions in the local markets.
In order to reduce risks in extreme drought conditions, the company has designed a trading policy that defines sales commitment levels consistent with its generating plants’ firm energy in a dry year, including risk mitigation clauses in some unregulated clients’ contracts.
In view of the operative conditions by the electricity generation market in Chile has experienced, like extreme drought and rising oil prices, the company has decided to hire a derivative to place a cap on the Brent price for consumption. As of March 31, 2012 there are no outstanding coverage instruments and instruments taken in the past have been specific and for no considerable monetary amounts. Market and operative conditions will be constantly analyzed to adjust the volume hedged or take new hedges for the following months.
Liquidity Risk
In engaging committed long term credit facilities and short term financial investments the Group maintains a consistent liquidity policy, for the amounts required to support projected needs for the period, contingent with the situation and the expectations in the debt and capital markets.
As of March 31, 2012, the Enersis Group held liquidity in the amount of Ch$ 1,114,788 million in Cash and Cash Equivalent and Ch$ 248,910 million in committed long term credit lines. As of December 31st, 2011, the Enersis Group held liquidity in the amount of Ch$ 1,219,921 million in Cash and Cash Equivalent and Ch$ 238,832 million in committed long term credit lines.
Credit Risk
Credit risk in accounts receivable, originating from trading activities, has been historically very limited given that the short term collection conditions with customers doesn’t allow them to individually accumulate significant amounts. Additionally, in the case of the so-called “unregulated clients” of our electricity generation and distribution business, a formal procedure is applied to control the credit risk, using a systematic evaluation of our counterparties, index definition and credit risk factors by virtue of which the contracts are approved or additional guarantee requirements are defined.
Furthermore, in our electricity generating business, in the event of non-payment, some countries allow power supply cut-offs, and in almost all contracts a lack of payment is established as cause for contract termination. For this purpose, credit risks are constantly monitored and the maximum amounts exposed to payment risks are measured, which are limited.
Pg.25
PRESS RELEASE |
In turn, in our electricity distribution business, the energy supply cut-off is a power held by our companies in case of default by our customers, applied in accordance with the applicable regulation in each country, enabling the credit risk evaluation and control process, which is also limited.
Surplus cash flow investments are placed in prime national and foreign financial entities (with an investment grade equivalent risk rating) with limits established for each entity.
In the selection of banks for investment, the Group considers those that hold two investment grade classifications, according to the three main international rating agencies (Moody’s, S&P and Fitch Ratings).
Positions are backed up by treasury bonds from the country of operations and instruments issued by the most reputable banks, favoring, wherever possible, the first ones.
Derivatives are engaged with highly solvent entities; about 80% of operations are conducted with entities that hold an A- or higher rating.
Risk Measurement
The Enersis Group measures the Value at Risk (VaR) of its debt and financial derivatives positions in order to guarantee that the risk taken by the company remains consistent with the risk exposure defined by Management, thus restricting the volatility of its financial results.
The positions portfolio used in the calculations of the current Value at Risk is comprised of debt and financial derivatives.
The calculated Value at Risk represents the possible value loss of the aforementioned positions portfolio over one day time horizon with 95% of confidence.
The volatility of the risk variables that affect the value of the positions portfolio has been studied, including:
- The U.S. dollar Libor interest rate.
- The usual banking local indexes for debts, taking into account the different currencies our companies operate under, and
- The exchange rates of the different currencies involved in the calculation.
The calculation of VaR is based on generating possible future scenarios (at one day) of market values (both spot and term) for the risk variables, using Bootstrapping methodology. The number of scenarios generated ensures compliance with the simulation convergence criteria. A matrix of volatilities and correlations between the various risk variables calculated based on the historical values of the logarithmic price return, has been applied to simulate the future price scenario.
Once the price scenarios have been obtained, the fair value of the portfolio is calculated using such scenarios, obtaining a distribution of possible values at one day. The one-day 95% confidence VaR number is calculated as the 5% percentile of the potential increases in the fair value of the portfolio in one day.
The various debt positions and financial derivatives included in the calculation have been valued consistently using the financial capital calculation methodology reported to Management.
Pg.26
PRESS RELEASE |
Taking in consideration the above mentioned hypotheses, the breakdown for VaR in every mentioned type of positions is the following:
Financial Positions | June 30 2012 | Dec. 31 2011 |
Th Ch$ | Th Ch$ | |
Interest Rate | 32,111,357 | 41,560,004 |
Exchange Rate | 4,236,469 | 3,602,591 |
Correlation | (688,098) | (310,050) |
Total | 35,659,728 | 44,852,545 |
Other Risks
A portion of Enersis and Endesa Chile’s debt is subject to cross default provisions. If certain defaults in debt of certain specific subsidiaries are not remedied within specified grace periods, a cross default could affect Endesa Chile and Enersis, and under certain scenarios, debts at the holding company level could be accelerated.
Nonpayment – after any applicable grace period – of the debts of Enersis and Endesa Chile, and in the case of Enersis, its subsidiaries Endesa Chile and Chilectra, with an individual principal amount outstanding in excess of US$ 50 million (or its equivalent in other currencies), and with a missed payment also in excess of US$ 50 million, could give rise to a cross default of several bank revolving debt facilities at the Endesa Chile and Enersis levels. Furthermore, some of these debt facilities are also subject to cross acceleration provisions in the event of a default in other debt of the companies mentioned above, for reasons other than payment default, for events such as bankruptcy, insolvency proceedings, and materially adverse governmental or legal actions, in all cases for amounts in excess of US$ 50 million.
Similarly, nonpayment – after any given applicable grace period - of the debts of Enersis and Endesa Chile or any of their Chilean subsidiaries, in single indebtedness in default with a principal in excess of US$ 30 million, could potentially give rise to a cross default of Enersis and Endesa Chile Yankee bonds.
Finally, in the case of local bonds of Enersis and Endesa Chile, prepayment is triggered only as a result of a default of the Issuer.
There are no clauses in the credit agreements by which changes in the corporate or debt classification of these companies from risk rating agencies could trigger prepayments. Nevertheless, a modification in the Feller Rate and Fitch Ratings Chile local debt risk classification could trigger a change in the applicable margin to determine the interest rate, in the local committed credit lines executed in 2009.
Pg.27
PRESS RELEASE |
Argentina

Generation
In Argentina, the first half of 2012 operating result amounted to Ch$ 2,835 million, representing a 84.0% drop in relation to the first half of 2011. This is primarily explained because of lower operating income of Ch$19,799, due to a 4.4% reduction in energy sales. The foregoing was partially offset by a reduction in operating costs, explained mainly by a decrease of 9.2% in energy purchases and 7.5% decrease in fuel consumption.
EBITDA of the operations in Argentina amounted to Ch$ 15,205 million; namely, 41.2% lower with respect to that recorded inthe first half of 2011.
Endesa Costanera
Endesa Costanera’s operating result decreased by Ch$ 19,188 million, showing a negative result of Ch$ 11,490 million in the first half of 2012. This is explained by a 12.7% reduction in operating revenues, due to lower physical sales of Ch$ 22,891 million -coupled with lower average selling prices- and Ch$ 2,668 million higher personnel expenses. This was partially offset by a 7.5% reduction in fuel consumption and Ch$ 1,179 million of lower transportation costs . Physical sales reached 4,536.7 GWh, 7.8% lower than same period last year.
The effect of converting these financial statements from Argentine peso to the Chilean peso in both periods was to generate a 4.5% reduction in Chilean pesos in June 2012 when compared to June 2011.
Table 12 |
|
|
|
|
|
| ||||
Endesa Costanera | Million Ch$ |
|
| Thousand US$ | ||||||
| 1H 2011 | 1H 2012 | Var 2011-2012 | Chg% |
| 1H 2012 | ||||
Operating Revenues | 180,888 | 157,992 | (22,896) | (12.7%) |
| 320,634 | ||||
Procurement and Services | (156,963) | (144,119) | 12,844 | 8.2% |
| (292,480) | ||||
Contribution Margin | 23,925 | 13,873 | (10,052) | (42.0%) |
| 28,154 | ||||
Other Costs | (9,803) | (14,622) | (4,820) | (49.2%) |
| (29,675) | ||||
Gross Operating Income (EBITDA) | 14,122 | (749) | (14,871) | (105.3%) |
| (1,520) | ||||
Depreciation and Amortization | (6,425) | (10,741) | (4,316) | (67.2%) |
| (21,798) | ||||
Operating Income | 7,698 | (11,490) | (19,188) | (249.3%) |
| (23,318) | ||||
Figures may differ from those accounted under Argentine GAAP. |
|
|
|
| ||||||
|
|
|
|
|
|
| ||||
Table 12.1 |
|
|
|
|
|
| ||||
Endesa Costanera | 1H 2011 | 1H 2012 | Var 2011-2012 | Chg% |
|
| ||||
GWh Produced | 4,885 | 4,462 | (423) | (8.7%) |
|
| ||||
GWh Sold | 4,919 | 4,537 | (382) | (7.8%) |
|
| ||||
Market Share | 8.5% | 7.6% | (1.0) pp. |
|
|
| ||||
Pg.28
PRESS RELEASE |
El Chocón
El Chocón’s operating result reached Ch$ 12,596 million in this first half, reflecting a 17.0% increase compared to the same period of 2011. This result is mainly explained by 5.9% higher energy sales and a 20.6% decrease in energy purchases.
The effect of converting these financial statements from Argentine peso to the Chilean peso in both periods was to generate a 4.5% reduction in Chilean pesos in June 2012 when compared to June 2011.
Table 13 |
|
|
|
|
|
|
El Chocón | Million Ch$ |
|
| Thousand US$ | ||
| 1H 2011 | 1H 2012 | Var 2011-2012 | Chg% |
| 1H 2012 |
Operating Revenues | 23,183 | 24,538 | 1,355 | 5.8% |
| 49,798 |
Procurement and Services | (8,748) | (7,057) | 1,691 | 19.3% |
| (14,322) |
Contribution Margin | 14,435 | 17,481 | 3,046 | 21.1% |
| 35,475 |
Other Costs | (2,253) | (3,529) | (1,276) | (56.6%) |
| (7,162) |
Gross Operating Income (EBITDA) | 12,182 | 13,952 | 1,770 | 14.5% |
| 28,314 |
Depreciation and Amortization | (1,413) | (1,356) | 57 | 4.0% |
| (2,751) |
Operating Income | 10,769 | 12,596 | 1,827 | 17.0% |
| 25,562 |
Figures may differ from those accounted under Argentine GAAP. |
|
|
|
| ||
|
|
|
|
|
|
|
Table 13.1 |
|
|
|
|
|
|
El Chocón | 1H 2011 | 1H 2012 | Var 2011-2012 | Chg% |
|
|
GWh Produced | 1,132 | 1,295 | 163 | 14.4% |
|
|
GWh Sold | 1,395 | 1,498 | 103 | 7.4% |
|
|
Market Share | 2.4% | 2.5% | 0.1 pp. |
|
|
|
Pg.29
PRESS RELEASE |
Distribution
Edesur
Our distribution subsidiary, Edesur, showed an increase in operating result losses, moving from a negative result of Ch$ 8,232 million in first half 2011 to a negative result of Ch$ 25,054 million in first half 2012. The negative evolution of the company results are consequence of increased operating costs derived from the country’s inflation rate , without the corresponding tariff increases because of the delay in fulfiling certain clauses of the Minutes of Agreement executed with the National Government of Argentina, especially the semi-annual recognition of tariff adjustments incorporated into the Cost Monitoring Mechanism (MMC, in its Spanish acronym) and the implementation of an Integral Tariff Review (RTI, in its Spanish acronym) as provided in such Minutes, all of which is heavily impacting Edesur’s financial balance.
Regarding the rest of the operating evolution, operating revenues increased by Ch$ 25,589, a 18,4% higher compared to same period last year. This is mainly explained by a 16.2% increase in energy sales. The latter was offset by a Ch$ 21,170 million increase in energy purchases and a Ch$15,794 increase in other operation fixed costs.
Physical sales increased by 1.6% reaching 8,672 GWh inthe first half of 2012. The loss of energy in this period was 10.6% and the number of clients grew 1.0%, exceeding 2.39 million.
The effect of converting these financial statements from Argentine peso to the Chilean peso in both periods was to generate a 4.5% reduction in Chilean pesos in June 2012 when compared to June 2011.
Table 14 |
|
|
|
|
|
| ||||
Edesur | Million Ch$ |
|
| Thousand US$ | ||||||
| 1H 2011 | 1H 2012 | Var 2011-2012 | Chg% |
| 1H 2012 | ||||
Operating Revenues | 139,425 | 165,014 | 25,589 | 18.4% |
| 334,883 | ||||
Procurement and Services | (69,645) | (89,821) | (20,176) | (29.0%) |
| (182,285) | ||||
Contribution Margin | 69,779 | 75,193 | 5,414 | 7.8% |
| 152,598 | ||||
Other Costs | (70,684) | (92,418) | (21,733) | (30.7%) |
| (187,555) | ||||
Gross Operating Income (EBITDA) | (905) | (17,225) | (16,320) | (1803.6%) |
| (34,956) | ||||
Depreciation and Amortization | (7,327) | (7,830) | (503) | (6.9%) |
| (15,890) | ||||
Operating Income | (8,232) | (25,054) | (16,823) | (204.4%) |
| (50,846) | ||||
Figures may differ from those accounted under Argentine GAAP. |
|
|
|
| ||||||
|
|
|
|
|
|
| ||||
Table 14.1 |
|
|
|
|
|
| ||||
Edesur | 1H 2011 | 1H 2012 | Var 2011-2012 | Chg% |
|
| ||||
Customers (Th) | 2,366 | 2,391 | 24 | 1.0% |
|
| ||||
GWh Sold | 8,539 | 8,672 | 133 | 1.6% |
|
| ||||
Clients/Employee | 835 | 841 | 6 | 0.7% |
|
| ||||
Energy Losses % | 10.5% | 10.6% | 0.1% |
|
|
| ||||
Pg.30
PRESS RELEASE |
Brazil

Endesa Brasil
Operating Income amounted to Ch$ 256,557 million, 5.8% lower than the Ch$ 272,235 million reported inthe first half of 2011.
Table 15 |
|
|
|
|
|
|
Endesa Brasil | (Million Ch$) |
|
|
| (Thousand US$) | |
| 1H 2011 | 1H 2012 | Var 2011-2012 | Chg % |
| 1H 2012 |
Sales | 968,933 | 1,021,469 | 52,536 | 5.4% |
| 2,072,996 |
Other operating income | 99,405 | 75,894 | (23,511) | (23.7%) |
| 154,022 |
Total Revenues | 1,068,338 | 1,097,363 | 29,025 | 2.7% |
| 2,227,019 |
Procurements and Services | (601,757) | (642,182) | (40,425) | (6.7%) |
| (1,303,261) |
Contribution Margin | 466,581 | 455,181 | (11,400) | (2.4%) |
| 923,757 |
Other Costs | (153,338) | (128,624) | 24,715 | 16.1% |
| (261,032) |
Gross Operating Income (EBITDA) | 313,243 | 326,558 | 13,315 | 4.3% |
| 662,725 |
Depreciation and Amortization | (60,588) | (57,527) | 3,062 | 5.1% |
| (116,746) |
Reversal of impairment profit (loss) recognized in profit or loss | 19,580 | (12,474) | (32,054) | (163.7%) |
| (25,316) |
Operating Income | 272,235 | 256,557 | (15,678) | (5.8%) |
| 520,663 |
Net Financial Income | (27,350) | (48,486) | (21,136) | (77.3%) |
| (98,399) |
Financial income | 69,186 | 56,725 | (12,461) | (18.0%) |
| 115,118 |
Financial expenses | (98,223) | (103,012) | (4,789) | (4.9%) |
| (209,055) |
Income (Loss) for indexed assets and liabilities | - | - | - |
|
| - |
Foreign currency exchange differences, net | 1,687 | (2,199) | (3,886) | (230.4%) |
| (4,463) |
Gains | 5,047 | 2,641 | (2,406) | (47.7%) |
| 5,360 |
Losses | (3,360) | (4,840) | (1,481) | (44.1%) |
| (9,823) |
Net Income from Related Comp. Cons. by the Prop. Eq. Method | - | 0 | 0 |
|
| 0 |
Net Income from Other Investments | - | - | - |
|
| - |
Net Income from Sales of Assets | - | - | - |
|
| - |
Net Income before Taxes | 244,885 | 208,070 | (36,815) | (15.0%) |
| 422,264 |
Income Tax | (52,735) | (46,874) | 5,862 | 11.1% |
| (95,127) |
NET INCOME | 192,150 | 161,197 | (30,953) | (16.1%) |
| 327,137 |
Net Income Attributable to Owners of the Company | 129,481 | 117,709 | (11,772) | (9.1%) |
| 238,881 |
Net Income Attributable to Minority Interest | 62,669 | 43,488 | (19,181) | (30.6%) |
| 88,256 |
Generation
In Brazil, the operating result of our subsidaries amounted to Ch$ 87,717 million, 2.5% lower than forthe first half of 2011, when operating results amounted to Ch$ 89,963 million.
Cachoeira Dourada
The operating result of Cachoeira Dourada was Ch$ 46,850 million, 17.5% higher than forthe first half of 2011. This is mainly explained by 21.7% higher energy sales, reaching Ch$ 72,195 million and 2,145.3 GWh. This was partially offset by an increase in energy purchases of Ch$4,906 million and in transportation costs of Ch$ 6,295 million.
The effect of converting these financial statements from Brazilian reals to Chilean pesos in both periods was to generate a 9.3% reduction in Chilean pesos in June 2012 when compared to June 2011.
Pg.31
PRESS RELEASE |
Table 16 |
|
|
|
|
|
| ||||
Cachoeira | Million Ch$ |
|
| Thousand US$ | ||||||
| 1H 2011 | 1H 2012 | Var 2011-2012 | Chg% |
| 1H 2012 | ||||
Operating Revenues | 59,300 | 72,195 | 12,895 | 21.7% |
| 146,514 | ||||
Procurement and Services | (12,608) | (18,969) | (6,361) | (50.5%) |
| (38,496) | ||||
Contribution Margin | 46,692 | 53,226 | 6,534 | 14.0% |
| 108,018 | ||||
Other Costs | (2,982) | (3,137) | (154) | (5.2%) |
| (6,365) | ||||
Gross Operating Income (EBITDA) | 43,710 | 50,089 | 6,379 | 14.6% |
| 101,653 | ||||
Depreciation and Amortization | (3,831) | (3,240) | 591 | 15.4% |
| (6,575) | ||||
Operating Income | 39,879 | 46,850 | 6,971 | 17.5% |
| 95,078 | ||||
Figures may differ from those accounted under Brazilian GAAP. |
|
|
|
| ||||||
|
|
|
|
|
|
| ||||
Table 16.1 |
|
|
|
|
|
| ||||
Cachoeira | 1H 2011 | 1H 2012 | Var 2011-2012 | Chg% |
|
| ||||
GWh Produced | 1,137 | 1,880 | 743 | 65.3% |
|
| ||||
GWh Sold | 1,792 | 2,145 | 353 | 19.7% |
|
| ||||
Market Share | 0.9% | 1.0% | 0.1 pp. |
|
|
| ||||
Fortaleza (cgtf)
The operating result of Endesa Fortaleza (CGTF) amounted to Ch$ 23,926 million, evidencing a 0.4% increase as compared to the same period of the previous year. This is mainly due to higher energy sales of 12.1% and a 6.9% increase in average energy sale prices. This was offset by 66.0% higher energy purchases. Physical sales of the period reached 1,398.5 GWh, a 4.8% more than same period last year.
The effect of converting these financial statements from Brazilian reals to Chilean pesos in both periods was to generate a 9.3% reduction in Chilean pesos in June 2012 when compared to June 2011.
Table 17 |
|
|
|
|
|
| ||||
Fortaleza | Million Ch$ |
|
| Thousand US$ | ||||||
| 1H 2011 | 1H 2012 | Var 2011-2012 | Chg% |
| 1H 2012 | ||||
Operating Revenues | 61,169 | 65,715 | 4,546 | 7.4% |
| 133,364 | ||||
Procurement and Services | (29,440) | (34,261) | (4,820) | (16.4%) |
| (69,529) | ||||
Contribution Margin | 31,728 | 31,454 | (274) | (0.9%) |
| 63,834 | ||||
Other Costs | (3,821) | (3,945) | (123) | (3.2%) |
| (8,006) | ||||
Gross Operating Income (EBITDA) | 27,907 | 27,510 | (397) | (1.4%) |
| 55,829 | ||||
Depreciation and Amortization | (4,087) | (3,583) | 504 | 12.3% |
| (7,272) | ||||
Operating Income | 23,819 | 23,926 | 107 | 0.4% |
| 48,556 | ||||
Figures may differ from those accounted under Brazilian GAAP. |
|
|
|
| ||||||
|
|
|
|
|
|
| ||||
Table 17.1 |
|
|
|
|
|
| ||||
Fortaleza | 1H 2011 | 1H 2012 | Var 2011-2012 | Chg% |
|
| ||||
GWh Produced | 215 | 491 | 276 | 128.1% |
|
| ||||
GWh Sold | 1,334 | 1,398 | 64 | 4.8% |
|
| ||||
Market Share | 0.7% | 0.6% | (0.0) pp. |
|
|
| ||||
Pg.32
PRESS RELEASE |
Transmission
CIEN
Our transmission subsidiary, CIEN, showed a decrease in operating income of Ch$ 9,449 million, reaching Ch$ 18,670 million. This is explained by an increase in depreciation and amortization of Ch$ 24,567 million, due to a reversion made in May 2011 caused by a change in the depreciation method, which was accelerated until 2010, and since April 2011, when CIEN was recognized as a transmission regulated asset, depreciation had to be made according to ANEEL rates. The reversion of the January-April period was made in May 2011, deriving in a positive result of Ch$ 17,188 in amortization and depreciation together with reversal of impairment for the first half 2011, which compared to the negative amount of Ch$ 7,379 in the first half 2012, explains the decrease of 142.9%.
Operating revenues increased Ch$ 20,598 million, due to the registration of toll charges during the first half of 2012 (RAP – Permitted Annual Remuneration) of Ch$ 37,644 million.
The effect of converting these financial statements from Brazilian reals to Chilean pesos in both periods was to generate a 9.3% reduction in Chilean pesos in June 2012 when compared to June 2011.
Table 18 |
|
|
|
|
|
| ||||
Cien (*) | Million Ch$ |
|
| Thousand US$ | ||||||
| 1H 2011 | 1H 2012 | Var 2011-2012 | Chg% |
| 1H 2012 | ||||
Operating Revenues | 17,047 | 37,644 | 20,598 | 120.8% |
| 76,397 | ||||
Procurement and Services | (2,591) | (7,368) | (4,777) | (184.4%) |
| (14,953) | ||||
Contribution Margin | 14,456 | 30,277 | 15,821 | 109.4% |
| 61,444 | ||||
Other Costs | (3,526) | (4,228) | (702) | (19.9%) |
| (8,580) | ||||
Gross Operating Income (EBITDA) | 10,930 | 26,049 | 15,118 | 138.3% |
| 52,864 | ||||
Depreciation and Amortization | (3,806) | (7,379) | (3,573) | (93.9%) |
| (14,975) | ||||
Reversal of impairment profit (loss) recognized in profit or loss | 20,994 | - | (20,994) | (100.0%) |
| - | ||||
Operating Income | 28,119 | 18,670 | (9,449) | (33.6%) |
| 37,889 | ||||
Figures may differ from those accounted under Brazilian GAAP. |
|
|
|
| ||||||
Pg.33
PRESS RELEASE |
Distribution
In Brazil, the operating result of our distribution subsidiaries amounted to Ch$ 170,058 million, which is 8.8% lower than that obtained inthe same period of theprevious year.
Ampla
Ampla’s operating result amounted to Ch$ 86,406 million, which compared to previous year, represents a decrease of Ch$ 11.6%. This lower result is mostly due to higher energy purchases of Ch$ 19,839, partially offset by a Ch$ 10,028 million increase in energy sales. Physical sales grew by 3.2%, reaching 5,386 GWh. Energy losses dropped by 0.5 p.p., going from 19.9% to 19.5%. The number of Ampla’s clients increased by 60 thousand, thus exceeding 2.66 million clients.
The effect of converting these financial statements from Brazilian reals to Chilean pesos in both periods was to generate a 9.3% reduction in Chilean pesos in June 2012 when compared to June 2011.
Table 19 |
|
|
|
|
|
| ||||
Ampla | Million Ch$ |
|
| Thousand US$ | ||||||
| 1H 2011 | 1H 2012 | Var 2011-2012 | Chg% |
| 1H 2012 | ||||
Operating Revenues | 561,888 | 559,722 | (2,166) | (0.4%) |
| 1,135,915 | ||||
Procurement and Services | (367,915) | (374,319) | (6,404) | (1.7%) |
| (759,652) | ||||
Contribution Margin | 193,973 | 185,403 | (8,570) | (4.4%) |
| 376,262 | ||||
Other Costs | (66,744) | (63,746) | 2,998 | 4.5% |
| (129,367) | ||||
Gross Operating Income (EBITDA) | 127,229 | 121,657 | (5,572) | (4.4%) |
| 246,895 | ||||
Depreciation and Amortization | (28,574) | (26,440) | 2,134 | 7.5% |
| (53,657) | ||||
Reversal of impairment profit (loss) recognized in profit or loss | (949) | (8,812) | (7,863) | (829.0%) |
| (17,883) | ||||
Operating Income | 97,707 | 86,406 | (11,301) | (11.6%) |
| 175,354 | ||||
Figures may differ from those accounted under Brazilian GAAP. |
|
|
|
| ||||||
|
|
|
|
|
|
| ||||
Table 19.1 |
|
|
|
|
|
| ||||
Ampla | 1H 2011 | 1H 2012 | Var 2011-2012 | Chg% |
|
| ||||
Customers (Th) | 2,605 | 2,665 | 60 | 2.3% |
|
| ||||
GWh Sold | 5,217 | 5,386 | 169 | 3.2% |
|
| ||||
Clients/Employee | 2,171 | 2,239 | 68 | 3.1% |
|
| ||||
Energy Losses % | 19.9% | 19.5% | (0.5) pp. |
|
|
| ||||
Pg.34
PRESS RELEASE |
Coelce
Coelce’s operating result decreased by 5.7% reaching Ch$ 83,652 million inthe first half of 2012. This performance is mostly due to a 38.8% decrease in other operating revenues and higher energy purchases of Ch$ 9,364 million, partially offset by higher energy sales of Ch$ 8,657 million. Physical sales increased by 11.7%, amounting to 4,753 GWh. Energy losses increased by 0.3 p.p. up to 12.2% inthe first half of 2012. Coelce’s number of clients expanded by 134 thousand, reaching 3.29 million clients.
The effect of converting these financial statements from Brazilian reals to Chilean pesos in both periods was to generate a 9.3% reduction in Chilean pesos in June 2012 when compared to June 2011.
Table 20 |
|
|
|
|
|
| ||||
Coelce | Million Ch$ |
|
| Thousand US$ | ||||||
| 1H 2011 | 1H 2012 | Var 2011-2012 | Chg% |
| 1H 2012 | ||||
Operating Revenues | 427,438 | 421,170 | (6,268) | (1.5%) |
| 854,733 | ||||
Procurement and Services | (273,795) | (267,752) | 6,043 | 2.2% |
| (543,383) | ||||
Contribution Margin | 153,643 | 153,418 | (225) | (0.1%) |
| 311,350 | ||||
Other Costs | (44,385) | (49,391) | (5,005) | (11.3%) |
| (100,234) | ||||
Gross Operating Income (EBITDA) | 109,258 | 104,027 | (5,231) | (4.8%) |
| 211,115 | ||||
Depreciation and Amortization | (20,578) | (20,375) | 203 | 1.0% |
| (41,349) | ||||
Operating Income | 88,680 | 83,652 | (5,028) | (5.7%) |
| 169,766 | ||||
Figures may differ from those accounted under Brazilian GAAP. |
|
|
|
| ||||||
|
|
|
|
|
|
| ||||
Table 20.1 |
|
|
|
|
|
| ||||
Coelce | 1H 2011 | 1H 2012 | Var 2011-2012 | Chg% |
|
| ||||
Customers (Th) | 3,157 | 3,291 | 134 | 4.3% |
|
| ||||
GWh Sold | 4,257 | 4,753 | 496 | 11.7% |
|
| ||||
Clients/Employee | 2,462 | 2,524 | 61 | 2.5% |
|
| ||||
Energy Losses % | 11.9% | 12.2% | 0.3 pp. |
|
|
| ||||
Pg.35
PRESS RELEASE |
Chile
Generation
Endesa Chile
Consolidated Income Statement of Endesa Chile
Table 21 |
|
|
|
|
|
|
Endesa Chile | (Million Ch$) |
|
|
|
| (Thousand US$) |
| 1H 2011 | 1H 2012 | Var 2011-2012 | Chg % |
| 1H 2012 |
Sales | 1,162,664 | 1,152,859 | (9,805) | (0.8%) |
| 2,339,643 |
Other operating income | 13,513 | 2,563 | (10,950) | (81.0%) |
| 5,202 |
Total Revenues | 1,176,178 | 1,155,422 | (20,756) | (1.8%) |
| 2,344,844 |
Procurements and Services | (671,445) | (686,385) | (14,940) | (2.2%) |
| (1,392,968) |
Contribution Margin | 504,733 | 469,037 | (35,695) | (7.1%) |
| 951,876 |
Other Costs | (117,136) | (105,056) | 12,080 | 10.3% |
| (213,204) |
Gross Operating Income (EBITDA) | 387,597 | 363,981 | (23,616) | (6.1%) |
| 738,673 |
Depreciation and Amortization | (85,175) | (93,179) | (8,004) | (9.4%) |
| (189,100) |
Reversal of impairment profit (loss) recognized in profit or loss | 200 | 23 | (177) | (88.6%) |
| 46 |
Operating Income | 302,621 | 270,825 | (31,796) | (10.5%) |
| 549,619 |
Net Financial Income | (62,278) | (69,059) | (6,781) | (10.9%) |
| (140,150) |
Financial income | 8,336 | 11,266 | 2,930 | 35.2% |
| 22,863 |
Financial expenses | (67,476) | (75,981) | (8,505) | (12.6%) |
| (154,198) |
Income (Loss) for indexed assets and liabilities | (2,939) | (985) | 1,954 | 66.5% |
| (2,000) |
Foreign currency exchange differences, net | (198) | (3,359) | (3,160) | (1593.2%) |
| (6,816) |
Gains | 9,544 | 10,486 | 942 | 9.9% |
| 21,280 |
Losses | (9,742) | (13,845) | (4,102) | (42.1%) |
| (28,096) |
Net Income from Related Comp. Cons. by the Prop. Eq. Method | 56,656 | 52,790 | (3,866) | (6.8%) |
| 107,133 |
Net Income from Other Investments | 182 | 298 | 116 | 63.9% |
| 605 |
Net Income from Sales of Assets | 542 | 15 | (528) | (97.3%) |
| 29 |
Net Income before Taxes | 297,723 | 254,868 | (42,855) | (14.4%) |
| 517,236 |
Income Tax | (85,950) | (80,449) | 5,501 | 6.4% |
| (163,266) |
NET INCOME | 211,772 | 174,419 | (37,354) | (17.6%) |
| 353,970 |
Net Income Attributable to Owners of the Company | 161,726 | 101,443 | (60,283) | (37.3%) |
| 205,871 |
Net Income Attributable to Minority Interest | 50,046 | 72,976 | 22,930 | 45.8% |
| 148,099 |
*Includes generation subsidiaries in Chile, Argentina, Colombia and Peru.
Chilean Operations
The operating result in Chile forthe first half of 2012 amounted to Ch$ 270,825 million, a decrease of 10.5% compared tothe first half of 2011. This is mostly explained by a decrease in energy sales of 2%, a reduction of Ch$ 10,950 million (-81%) in other operational revenues, an increase of Ch$ 19,706 million and Ch$ 19,506 million in fuel consumption and transportation cost respectively. This was partially offset by a reduction of 14.1% in energy purchases.
The foregoing was also affected by a 3.6% reduction in the average energy sales price expressed in Chilean pesos. Physical sales grew 2.4% reaching 10,409 GWh.
EBITDA of the business in Chile, or gross operating result, was Ch$ 363,981 million in this period, which represents a 6.1% decrease when compared tothe first half of 2011.
Pg.36
PRESS RELEASE |
Table 22 |
|
|
|
|
|
|
Chilean Electricity Business | Million Ch$ |
|
| Thousand US$ | ||
| 1H 2011 | 1H 2012 | Var 2011-2012 | Chg% |
| 1H 2012 |
Operating Revenues | 615,186 | 553,995 | (61,192) | (9.9%) |
| 1,124,291 |
Procurement and Services | (405,528) | (402,441) | 3,086 | 0.8% |
| (816,725) |
Contribution Margin | 209,659 | 151,553 | (58,106) | (27.7%) |
| 307,566 |
Other Costs | (43,170) | (55,355) | (12,184) | (28.2%) |
| (112,338) |
Gross Operating Income (EBITDA) | 166,489 | 96,199 | (70,290) | (42.2%) |
| 195,228 |
Depreciation and Amortization | (41,208) | (40,716) | 492 | 1.2% |
| (82,631) |
Operating Income | 125,280 | 55,482 | (69,798) | (55.7%) |
| 112,597 |
|
|
|
|
|
|
|
|
|
|
|
|
|
|
Table 22.1 |
|
|
|
|
|
|
Chilean Electricity Business | 1H 2011 | 1H 2012 | Var 2011-2012 | Chg% |
|
|
GWh Produced | 9,188 | 9,554 | 366 | 4.0% |
|
|
GWh Sold | 10,169 | 10,409 | 241 | 2.4% |
|
|
Market Share | 35.4% | 34.2% | (1.2) pp. |
|
|
|
Pg.37
PRESS RELEASE |
Distribution
Chilectra
In Chile, our subsidary Chilectra showed an operating result of Ch$ 67,716 million, which represents an increase of 6.2% compared tothe first half of 2012. Such increment is mostly explained by Ch$ 20,969 lower energy purchases. The above was partially offset by a decrease in operating revenues of Ch$ 9,891, a 2.0% less than in 2011, which is explained by a 2.6% decrease in energy sales.
Energy losses were 5.4%, a decrease of 0.2 p.p. Physical energy sales expanded by 5.9%, reaching 7,121 GWh as of June 2012.
The number of clients expanded by 28 thousand clients, reaching almost 1.65 million during the present period.
Table 23 |
|
|
|
|
|
| |
Chilectra | (Million Ch$) |
|
|
| (Thousand US$) | ||
| 1H 2011 | 1H 2012 | Var 2011-2012 | Chg % |
| 1H 2012 | |
Sales | 498,381 | 489,586 | (8,795) | (1.8%) |
| 993,580 | |
Other operating income | 5,833 | 4,737 | (1,096) | (18.8%) |
| 9,614 | |
Total Revenues | 504,214 | 494,323 | (9,891) | (2.0%) |
| 1,003,193 | |
Procurements and Services | (382,130) | (368,267) | 13,862 | 3.6% |
| (747,371) | |
Contribution Margin | 122,085 | 126,056 | 3,972 | 3.3% |
| 255,822 | |
Other Costs | (43,618) | (41,186) | 2,433 | 5.6% |
| (83,583) | |
Gross Operating Income (EBITDA) | 78,466 | 84,871 | 6,404 | 8.2% |
| 172,239 | |
Depreciation and Amortization | (12,708) | (13,756) | (1,049) | (8.3%) |
| (27,918) | |
Reversal of impairment profit (loss) recognized in profit or loss | (1,976) | (3,398) | (1,422) | (71.9%) |
| (6,896) | |
Operating Income | 63,782 | 67,716 | 3,934 | 6.2% |
| 137,425 | |
Net Financial Income | 5,073 | 5,901 | 828 | 16.3% |
| 11,975 | |
Financial income | 8,620 | 5,558 | (3,061) | (35.5%) |
| 11,280 | |
Financial expenses | (3,556) | (738) | 2,818 | 79.2% |
| (1,498) | |
Income (Loss) for indexed assets and liabilities | 97 | 939 | 842 | 866.3% |
| 1,905 | |
Foreign currency exchange differences, net | (87) | 142 | 229 | 262.5% |
| 288 | |
Gains | 623 | 587 | (36) | (5.8%) |
| 1,191 | |
Losses | (710) | (445) | 265 | 37.4% |
| (903) | |
Net Income from Related Comp. Cons. by the Prop. Eq. Method | 34,808 | 23,575 | (11,233) | (32.3%) |
| 47,844 | |
Net Income from Other Investments | - | - | - |
|
| - | |
Net Income from Sales of Assets | 2 | (75) | (77) | (3828.3%) |
| (153) | |
Net Income before Taxes | 103,666 | 97,117 | (6,549) | (6.3%) |
| 197,092 | |
Income Tax | (11,200) | (13,490) | (2,289) | (20.4%) |
| (27,376) | |
NET INCOME | 92,466 | 83,627 | (8,838) | (9.6%) |
| 169,716 | |
Net Income Attributable to Owners of the Company | 92,465 | 83,627 | (8,838) | (9.6%) |
| 169,715 | |
Net Income Attributable to Minority Interest | - | - | - | - |
| - | |
| |||||||
| |||||||
Table 23.1 |
|
|
|
|
|
| |
Chilectra | 1H 2011 | 1H 2012 | Var 2011-2012 | Chg% |
|
| |
Customers (Th) | 1,620 | 1,647 | 28 | 1.7% |
|
| |
GWh Sold | 6,726 | 7,121 | 395 | 5.9% |
|
| |
Clients/Employee | 2,278 | 2,269 | (9) | (0.4%) |
|
| |
Energy Losses % | 5.6% | 5.4% | (0.3) pp. |
|
|
| |
Pg.38
PRESS RELEASE |
Colombia
Generation
Emgesa
The operating result of our operation in Colombia amounted to Ch$ 157,657 million in this period, increasing by Ch$ 58,821 million or by the equivalent of 59.5% compared to the same period of 2011. The main effect comes from the impact of the one-time effect of the Equity Tax, which entailed registering –on January 1, 2011- the total amount payable under this concept during the entire 2011-2014 periods.
The good results were also caused by higher operating income of Ch$ 39,784, due to a 17.5% increase in energy sales. This was partially offset by a Ch$ 18,656 increase inprocurement and services costs, 31.4% higher than for the same period of the last year, mainly due to higher fuel consumption of Ch$10,251 million, representing a 143.8% increase compared tothe first half of2012.
Physical energy sales grew by 6.9% reaching 7,719 GWh and EBITDA in Colombia grew by 53.0% inthe first half of 2012, reaching Ch$ 177,464 million.
The effect of converting these financial statements from Colombian to Chilean pesos in both periods was to generate a 6.1% increase in Chilean pesos in June 2012 when compared to June 2011.
Table 24 |
|
|
|
|
|
| ||||
Emgesa | Million Ch$ |
|
| Thousand US$ | ||||||
| 1H 2011 | 1H 2012 | Var 2011-2012 | Chg% |
| 1H 2012 | ||||
Operating Revenues | 232,228 | 272,012 | 39,784 | 17.1% |
| 552,028 | ||||
Procurement and Services | (59,460) | (78,116) | (18,656) | (31.4%) |
| (158,531) | ||||
Contribution Margin | 172,767 | 193,895 | 21,128 | 12.2% |
| 393,496 | ||||
Other Costs | (56,783) | (16,431) | 40,352 | 71.1% |
| (33,345) | ||||
Gross Operating Income (EBITDA) | 115,984 | 177,464 | 61,480 | 53.0% |
| 360,151 | ||||
Depreciation and Amortization | (17,148) | (19,807) | (2,660) | (15.5%) |
| (40,198) | ||||
Operating Income | 98,836 | 157,657 | 58,821 | 59.5% |
| 319,953 | ||||
Figures may differ from those accounted under Colombian GAAP. |
|
|
|
| ||||||
|
|
|
|
|
|
| ||||
Table 24.1 |
|
|
|
|
|
| ||||
Emgesa | 1H 2011 | 1H 2012 | Var 2011-2012 | Chg% |
|
| ||||
GWh Produced | 5,510 | 6,396 | 887 | 16.1% |
|
| ||||
GWh Sold | 7,224 | 7,719 | 495 | 6.9% |
|
| ||||
Market Share | 18.6% | 18.5% | (0.1) pp. |
|
|
| ||||
Pg.39
PRESS RELEASE |
Distribution
Codensa
In Colombia, Codensa’s operating result during this period was Ch$ 121,165 million, an increase of Ch$ 48,845 million, equivalent to 67.5%. The main effect arose from the impact of the reform on Equity Taxes, which entailed registering –on January 1, 2011- the total amount payable under this concept during the entire 2011-2014 period. Additionally, during the period operating income increased in Ch$ 56,377 million, explained by a 14.9% growth in energy sales reaching Ch$ 370,123 million.
The latter was partially offset by higher operating costs, mainly explained by a 14.2% increase in energy purchases.
Physical sales grew by 3.4%, reaching 6,522 GWh in the period. Energy losses dropped by 0.4 p.p. to 7.9% and the number of clients increased by 82 thousand, exceeding 2.6 million as of June 2012.
The effect of converting these financial statements from Colombian to Chilean pesos in both periods was to generate a 6.1% increase in Chilean pesos in June 2012 when compared to June 2011.
Table 25 |
|
|
|
|
|
| ||||
Codensa | Million Ch$ |
|
| Thousand US$ | ||||||
| 1H 2011 | 1H 2012 | Var 2011-2012 | Chg% |
| 1H 2012 | ||||
Operating Revenues | 388,119 | 444,496 | 56,377 | 14.5% |
| 902,073 | ||||
Procurement and Services | (215,550) | (242,390) | (26,841) | (12.5%) |
| (491,914) | ||||
Contribution Margin | 172,569 | 202,106 | 29,537 | 17.1% |
| 410,159 | ||||
Other Costs | (68,251) | (45,493) | 22,758 | 33.3% |
| (92,324) | ||||
Gross Operating Income (EBITDA) | 104,318 | 156,613 | 52,295 | 50.1% |
| 317,835 | ||||
Depreciation and Amortization | (31,998) | (35,448) | (3,450) | (10.8%) |
| (71,939) | ||||
Operating Income | 72,320 | 121,165 | 48,845 | 67.5% |
| 245,896 | ||||
Figures may differ from those accounted under Colombian GAAP. |
|
|
|
| ||||||
|
|
|
|
|
|
| ||||
Table 25.1 |
|
|
|
|
|
| ||||
Codensa | 1H 2011 | 1H 2012 | Var 2011-2012 | Chg% |
|
| ||||
Customers (Th) | 2,580 | 2,662 | 81 | 3.2% |
|
| ||||
GWh Sold | 6,305 | 6,522 | 217 | 3.4% |
|
| ||||
Clients/Employee | 2,363 | 2,360 | (3) | (0.1%) |
|
| ||||
Energy Losses % | 8.3% | 7.9% | (0.4) pp. |
|
|
| ||||
Pg.40
PRESS RELEASE |
Peru
Generation
Edegel
In Peru, the operating result amounted to Ch$ 52,515 million inthe first half of 2012, a 8.7% decrease compared to that registered inthe first half of 2011. This lower result is explained mainly by an increase in payroll expenses of Ch$13,965 million, due to a provision reversion made on June 2011 which caused a positive result of Ch$ 7,529 million in payroll expenses in first half 2011, compared to the negative result of Ch$6,435 million in this period. The provision reversion was due to the transition to IFRS.
Operating revenues showed a 23.1% growth compared to first half 2011, mainly due to a Ch$ 25,757 million increase in energy sales. This was partially offset by higher energy purchases of Ch$ 4,544 million and higher fuel consumption of Ch$ 6,487 million.
Physical sales grew by 1.9% reaching 4,835.5 GWh as of June 2012. EBITDA of the business in Peru amounted to Ch$ 71,965 million in this period, representing a decrease of 4.0% when comparing it to the same period of 2011.
The effect of converting these financial statements from Peruvian sol to Chilean pesos in both periods was to generate a 7.8% increase in Chilean pesos in June 2012, when compared to June 2011.
Table 26 |
|
|
|
|
|
| ||||
Edegel | Million Ch$ |
|
| Thousand US$ | ||||||
| 1H 2011 | 1H 2012 | Var 2011-2012 | Chg% |
| 1H 2012 | ||||
Operating Revenues | 115,117 | 141,754 | 26,636 | 23.1% |
| 287,679 | ||||
Procurement and Services | (40,721) | (54,701) | (13,980) | (34.3%) |
| (111,012) | ||||
Contribution Margin | 74,396 | 87,052 | 12,656 | 17.0% |
| 176,667 | ||||
Other Costs | 557 | (15,087) | (15,644) | (2806.3%) |
| (30,618) | ||||
Gross Operating Income (EBITDA) | 74,954 | 71,965 | (2,989) | (4.0%) |
| 146,049 | ||||
Depreciation and Amortization | (17,446) | (19,451) | (2,004) | (11.5%) |
| (39,474) | ||||
Operating Income | 57,508 | 52,515 | (4,993) | (8.7%) |
| 106,575 | ||||
Figures may differ from those accounted under Peruvian GAAP. |
|
|
|
| ||||||
|
|
|
|
|
|
| ||||
Table 26.1 |
|
|
|
|
|
| ||||
Edegel | 1H 2011 | 1H 2012 | Var 2011-2012 | Chg% |
|
| ||||
GWh Produced | 4,657 | 4,463 | (195) | (4.2%) |
|
| ||||
GWh Sold | 4,746 | 4,835 | 89 | 1.9% |
|
| ||||
Market Share | 30.0% | 29.1% | (0.9) pp. |
|
|
| ||||
Pg.41
PRESS RELEASE |
Distribution
Edelnor
In Peru, our subsidiary Edelnor showed an operating result of Ch$ 35,340 million, 7.7% lower than same period in 2011. Just as in the case of Edegel, this is mainly explained by an increase in payroll expenses, due to a provision reversion made on June 2011, making payroll expenses to pass from Ch$ 2,187 million in first half 2011 to Ch$ 8,513 in this period, which is an increase of 289.3%.
Operating revenues showed a 22.6% growth compared to first half 2011, mainly due to a Ch$ 33,537 million increase in energy sales. This was partially offset by higher energy purchases of Ch$ 24,378 million.
Energy losses decreased by 0.1 p.p. reaching 8.2% in the current year. The number of clients expanded by 49 thousand, exceeding 1.17 million clients.
The effect of converting these financial statements from Peruvian sol to Chilean pesos in both periods was to generate a 7.8% increase in Chilean pesos in June 2012, when compared to June 2011.
Table 27 |
|
|
|
|
|
| ||||
Edelnor | Million Ch$ |
|
| Thousand US$ | ||||||
| 1H 2011 | 1H 2012 | Var 2011-2012 | Chg% |
| 1H 2012 | ||||
Operating Revenues | 158,417 | 194,265 | 35,848 | 22.6% |
| 394,247 | ||||
Procurement and Services | (97,601) | (126,598) | (28,997) | (29.7%) |
| (256,921) | ||||
Contribution Margin | 60,816 | 67,667 | 6,851 | 11.3% |
| 137,326 | ||||
Other Costs | (11,833) | (20,278) | (8,445) | (71.4%) |
| (41,152) | ||||
Gross Operating Income (EBITDA) | 48,983 | 47,390 | (1,593) | (3.3%) |
| 96,174 | ||||
Depreciation and Amortization | (10,676) | (12,050) | (1,374) | (12.9%) |
| (24,455) | ||||
Operating Income | 38,307 | 35,340 | (2,967) | (7.7%) |
| 71,719 | ||||
Figures may differ from those accounted under Peruvian GAAP. |
|
|
|
| ||||||
|
|
|
|
|
|
| ||||
Table 27.1 |
|
|
|
|
|
| ||||
Edelnor | 1H 2011 | 1H 2012 | Var 2011-2012 | Chg% |
|
| ||||
Customers (Th) | 1,121 | 1,170 | 49 | 4.4% |
|
| ||||
GWh Sold | 3,276 | 3,448 | 171 | 5.2% |
|
| ||||
Clients/Employee | 2,020 | 1,980 | (40) | (2.0%) |
|
| ||||
Energy Losses % | 8.3% | 8.2% | (0.1) pp. |
|
|
| ||||
Pg.42
PRESS RELEASE |
Operating Income by Subsidiary
Summary of operating revenues, operating costs (including procurements, services and other costs) and operating income of all Enersis’ subsidiaries, for the period ended in June 30, 2011 and March 30, 2012, detailed as follows:
Table 28 |
|
|
|
|
|
| |
| 1H 2011 |
|
| 1H 2012 |
|
| |
Million Ch$ | Operating Revenues | Operating Costs | Operating Income | Operating Revenues | Operating Costs | Operating Income | |
Endesa Chile (*) | 1,176,178 | (873,556) | 302,621 | 1,155,422 | (884,597) | 270,825 | |
Cachoeira (**) | 59,300 | (19,421) | 39,879 | 72,195 | (25,345) | 46,850 | |
Fortaleza (***) | 61,169 | (37,350) | 23,819 | 65,715 | (41,789) | 23,926 | |
Cien (**) | 17,047 | 11,072 | 28,119 | 37,644 | (18,975) | 18,670 | |
Chilectra | 504,214 | (440,432) | 63,782 | 494,323 | (426,607) | 67,716 | |
Edesur | 139,425 | (147,656) | (8,232) | 165,014 | (190,068) | (25,054) | |
Distrilima (Edelnor) | 158,417 | (120,110) | 38,307 | 194,265 | (158,926) | 35,340 | |
Ampla | 561,888 | (464,181) | 97,707 | 559,722 | (473,316) | 86,406 | |
Coelce | 427,438 | (338,758) | 88,680 | 421,170 | (337,517) | 83,652 | |
Codensa | 388,119 | (315,798) | 72,320 | 444,496 | (323,331) | 121,165 | |
CAM Ltda. | 15,739 | (17,179) | (1,439) | - | - | - | |
Inmobiliaria Manso de Velasco Ltda. | 2,135 | (2,281) | (146) | 3,751 | (2,534) | 1,216 | |
Synapsis Soluciones y Servicios IT Ltda. | 6,693 | (6,556) | 137 | - | - | - | |
ICT | 2,647 | (2,598) | 49 | 2,632 | (2,808) | (176) | |
Enersis Holding and other investment vehicles | 18,237 | (26,093) | (7,857) | 17,478 | (26,381) | (8,903) | |
Consolidation Adjustments | (336,923) | 334,240 | (2,683) | (338,124) | 335,837 | (2,287) | |
Total Consolidation | 3,201,722 | (2,466,657) | 735,065 | 3,295,703 | (2,576,353) | 719,350 | |
Table 28.1 |
|
|
|
|
|
| |
| 1H 2012 |
|
|
|
|
| |
Thousand US$ | Operating Revenues | Operating Costs | Operating Income |
|
| ||
Endesa Chile (*) | 2,344,844 | (1,795,225) | 549,619 |
|
|
| |
Cachoeira (**) | 146,514 | (51,436) | 95,078 |
|
|
| |
Fortaleza (***) | 133,364 | (84,808) | 48,556 |
|
|
| |
Cien (**) | 76,397 | (38,507) | 37,889 |
|
|
| |
Chilectra | 1,003,193 | (865,768) | 137,425 |
|
|
| |
Edesur | 334,883 | (385,730) | (50,846) |
|
|
| |
Distrilima (Edelnor) | 394,247 | (322,528) | 71,719 |
|
|
| |
Ampla | 1,135,915 | (960,561) | 175,354 |
|
|
| |
Investluz (Coelce) | 854,733 | (684,967) | 169,766 |
|
|
| |
Codensa | 902,073 | (656,176) | 245,896 |
|
|
| |
CAM Ltda. | - | - | - |
|
|
| |
Inmobiliaria Manso de Velasco Ltda. | 7,612 | (5,143) | 2,469 |
|
|
| |
Synapsis Soluciones y Servicios IT Ltda. | - | - | - |
|
|
| |
ICT | 5,341 | (5,698) | (356) |
|
|
| |
Enersis Holding and other investment vehicles | 35,470 | (53,538) | (18,068) |
|
|
| |
Consolidation Adjustments | (686,197) | 681,556 | (4,641) |
|
|
| |
Total Consolidation | 6,688,389 | (5,228,528) | 1,459,861 |
|
|
| |
(*) Since January 1st, 2009, includes Gas Atacama, Transquillota and HydroAysén
(**) Consolidated by Endesa Chile until September 30th, 2005. Since October 1st, 2005 is
consolidated by Enersis through Endesa Brasil.
(***) Since October 1st, 2005, these subsidiaries are consolidated by Enersis through Endesa Brasil.
Pg.43
PRESS RELEASE |
Market Information
Equity Market
New York Stock Exchange (NYSE)
The charts below show the performance of Enersis’ ADS (“ENI”) price at the NYSE, compared to the Dow Jones Industrials and the Dow Jones Utilities indexes over the last 12 months, as well as the trading volume, both in the NYSE.
Source: Bloomberg
Pg.44
PRESS RELEASE |
Santiago Stock Exchange (BCS)
The charts below show the performance of Enersis’ Chilean stock price over the last 12 months compared to the Chilean Selective Stock Index (IPSA), as well as the daily average aggregate trading volume in the Santiago and Chilean Electronic Stock Exchange:
Source: Bloomberg
Pg.45
PRESS RELEASE |
Madrid Stock Exchange (Latibex) - Spain
The charts below show Enersis’ share price (“XENI”) at the Latibex over the last 12 months compared to the local stock index (IBEX), as well as the daily average trading volume in the Latibex.
Pg.46
PRESS RELEASE |
Debt Market
Yankee Bonds Price Evolution
The following chart shows the pricing of two of our Yankee Bonds over the last 12 months compared to the Ishares Iboxx Investment Grade Corporate Bond Fund Index:
Source: Bloomberg
(*) Ishares Iboxx Investment Grade Corporate Bond Fund Index is an exchange traded fund incorporated in the U.S.A. The Index measures the performance of a fixed number of investment grade corporate bonds.
Pg.47
PRESS RELEASE |
Ownership of the Company as of June 30, 2012
TOTAL SHAREHOLDERS: 7,389
Conference Call Invitation
Enersis is pleased to invite you to participate in aConference Call with the management to review the results for the period, on Thursday, July 26th, 2012, at 12:00 noon ET (12:00 noon Local Chile Time).There will be a question and answer session following management's comments. Representing Enersis will be Mr. Alfredo Ergas, Chief Financial Officer and the Investor Relations Team.
To participate, please dial+1 (334) 323 7224or+1 (800) 311 9401(toll free USA), approximately 10 minutes prior to the scheduled start time,Passcode ID: 4622.
To access the phone replay, please dial+1 (334) 323 7226(International) or+1 (877) 919 4059(toll free USA)Passcode ID: 70108616.
You can also access to the conference call replay through our Investor Relations website at http://www.enersis.cl.
Pg.48
PRESS RELEASE |
Contact Information
For further information, please contact us:
Ricardo Alvial Investments and Risks Director mlmr@enersis.cl (56-2) 353 4682 | Denisse Labarca Head of InvestorRelations denisse.labarca@enersis.cl (56-2) 353 4576 | Melissa Vargas Investor Relations Associate emvb@enersis.cl (56-2) 353 4555 |
Javier Hernández Investor Relations Associate jaha@enersis.cl (56-2) 353 4492
| Jorge Velis InvestorRelations Associate jgve@enersis.cl (56-2) 353 4552 | Carmen Poblete Shares Department Representative cpt@enersis.cl (56-2) 353 4447
|
Maria Luz Muñoz Investor Relations Assistant mlmr@enersis.cl (56-2) 353 4682 | ||
Disclaimer
This Press Release contains statements that could constitute forward-looking statements within the meaning of the Private Securities Litigation Reform Act of 1995. These statements appear in a number of places in this announcement and include statements regarding the intent, belief or current expectations of Enersis and its management with respect to, among other things: (1) Enersis’ business plans; (2) Enersis’ cost-reduction plans; (3) trends affecting Enersis’ financial condition or results of operations, including market trends in the electricity sector in Chile or elsewhere; (4) supervision and regulation of the electricity sector in Chile or elsewhere; and (5) the future effect of any changes in the laws and regulations applicable to Enersis’ or its subsidiaries. Such forward-looking statements are not guarantees of future performance and involve risks and uncertainties. Actual results may differ materially from those in the forward-looking statements as a result of various factors. These factors include a decline in the equity capital markets of the United States or Chile, an increase in the market rates of interest in the United States or elsewhere, adverse decisions by government regulators in Chile or elsewhere and other factors described in Enersis’ Annual Report on Form 20-F. Readers are cautioned not to place undue reliance on those forward-looking statements, which state only as of their dates. Enersis undertakes no obligation to release publicly the result of any revisions to these forward-looking statements.
Pg.49
SIGNATURES
Pursuant to the requirements of the Securities Exchange Act of 1934, as amended, the Registrant has duly caused this report to be signed on its behalf by the undersigned, thereunto duly authorized.
| ENERSIS S.A. | |
| By: /s/ Ignacio Antoñanzas Alvear | |
| -------------------------------------------------- | |
| Title: Chief Executive Officer |
Date: July 31, 2012