FORM 6-K
SECURITIES AND EXCHANGE COMMISSION
Washington, D.C. 20549
Report of Foreign Issuer
Pursuant to Rule 13a-16 or 15d-16 of
the Securities Exchange Act of 1934
For the month of July, 2013
Commission File Number: 001-12440
ENERSIS S.A.
(Translation of Registrant’s Name into English)
Santa Rosa 76
Santiago, Chile
(Address of principal executive office)
Indicate by check mark whether the registrant files or will file
annual reports under cover of Form 20-F or Form 40-F:
Form 20-F [X] Form 40-F [ ]
Indicate by check mark if the registrant is submitting the Form 6-K
in paper as permitted by Regulation S-T Rule 101(b)(1):
Yes [ ] No [X]
Indicate by check mark if the registrant is submitting the Form 6-K
in paper as permitted by Regulation S-T Rule 101(b)(7):
Yes [ ] No [X]
Indicate by check mark whether by furnishing the information
ontained in this Form, the Registrant is also thereby furnishing the
information to the Commission
pursuant to Rule 12g3-2(b) under the Securities Exchange Act of 1934:
Yes [ ] No [X]
If °;Yes” is marked, indicate below the file number assigned to the registrant
in connection with Rule 12g3-2(b): N/A
![]()
ENERSIS
ANNOUNCES CONSOLIDATED RESULTS
FOR THE PERIOD ENDED ON JUNE 30, 2013
Highlights for the Period
Ø A special development in Argentina, the incorporation of the Cono Sur in kind assets in the context of our capital increase, and the generation business segment led to a 98.2% increase in our net income when comparing 1H13 to 1H12.
Ø Resolution SE N°250/13 of the Secretariat of Energy of the Argentine Ministry of Federal Planning, Public Investment and Services, positively affected the accounts of our Argentine subsidiary, Edesur, during the second quarter, which largely explained our improvement in EBITDA and net income.
Ø The addition of the assets of Cono Sur, (the company through which Endesa Spain made the in kind contribution in the latest capital increase) generated an additional 20% of Net Income in the second quarter.
Ø The customer base in the distribution business segment rose by 454 thousand to over 14 million customers.
Ø Procurement and service costs decreased Ch$ 266,076 million while operating revenues decreased Ch$ 93,703 million, equivalent to a 2.9% drop reaching Ch$ 3,157,601 million as a consequence of lower revenues in generation business of Ch$ 85,034 million, mainly due to the drought affecting Chile and lower distribution segment revenues of Ch$ 28,966 million. In generation, this is mainly explained by decreases in Chile, Argentina and Peru, partially offset by Colombia and Brazil. In distribution, lower revenues are attributable to Brazil, Colombia and Peru, partially offset by Argentina and Chile.
Ø Demand for electricity grew less than expected, because of fewer working days, and milder temperatures, both of which are transitory factors. However, our subsidiaries in Chile, Colombia and Brazil grew more than their peers in each country. Demand for electricity, in each one of our markets, was as follows:
· Peru 5.7%
· Chile 3.1%
· Colombia 2.7%
· Argentina 1.1%
· Brazil 0.9%
Ø Physical sales in the distribution segment increased 1,221 GWh, or 3.4%, reaching 36,957 GWh, while in generation, physical sales decreased by 0.8%, or 245 GWh due to lower hydro availability, partially offset by higher thermal generation at lower costs compared to the the same period in 2012.
Ø Procurement and Service Costs decreased by 14.1%, reaching Ch$ 1,620,930 million, as a consequence of lower fuel consumption expenses of Ch$ 77,466 million, lower energypurchase costs of Ch$ 65,180 million and lower transportation costs of Ch$ 39,986 million. This operating cost reductions are mainly explained by the commissioning of Bocamina II, and were partially offset by:
1
![]()
o The drought affecting Brazil, which increased energy prices, and the fact that until now part of the incremental energy purchase costs has not been recognized in the distribution tariffs.
o Salaries in Edesur were increased by government mandate by 5%, retroactive to January 2013, thereby increasing operating costs significantly.
Ø The Company’s EBITDA amounted to Ch$ 1,087,175 million during this first semester, 16.2% higher when compared to the same period in 2012. This good performance is mainly due to the one time effect in Edesur, in relation to the recognition of pending higher costs (MMC), and to lower operating cost due to the start up of Bocamina II and lower LNG purchase costs. The effect of the incorporation of Cono Sur into Enersis as of the second quarter of 2013, as a consequence of the capital increase operation ended on March 2013, was a positive impact on EBITDA of Ch$ 4,608 million.
Ø The net financial result was a Ch$ 64,878 million loss, 60% better than for the first half of 2012, mainly explained by higher interest income of Ch$ 52,787 million as a consequence of higher cash availability due to the capital increase operation, and lower interest expense of Ch$ 28,084 million.
Ø Net Income before taxes reached Ch$ 818,586 million, a 46.1% increase.
Ø The diversified portfolio of the Enersis Group allowed us to maintain a well balanced contribution to our EBITDA by business segment,
• Distribution: 57%
• Generation and Transmission: 43%
Ø The effect of increasing the ownership in some of the companies that Enersis already consolidated, as well as the incorporation of new assets, both as a consequence of the recent capital increase, led to a positive impact in net income attributable to the owners of the Company of Ch$ 52,531 million, or US$ 110 million, in the second quarter of 2013. On an annualized basis, this figure surpasses the initially estimated positive impact of the in‑kind contribution of US$ 366 million.
Generation and Transmission Business
Ø Operating revenues decreased 6.6%, reaching Ch$ 1,211,672 million, primarily due to a lower average energy sale price expressed in Chilean pesos and the slight decrease on physical sales.
Ø Procurement and services costs decreased 15.9% to Ch$ 621,597 million because of the reduction in fuel consumption costs of Ch$ 77,462 million, energy purchases costs of Ch$ 23,042 million and transportation expenses of Ch$ 19,686 million.
Ø EBITDA amounted to Ch$ 475,266 million, equivalent to an increase of 6.2%.
Ø Consolidated electricity generation decreased by1,9% to 27,293 GWh, mainly explained by Peru and Argentina.
2
![]()
Ø Consolidated physical sales decreased 0.8% to 32,042 GWh, explained basically by decreases in Chile, Perú and Brasil, partially offset by increases in Argentina and Colombia.
EBITDA in the Generation business, by country, was as follows:
In Chile, EBITDA increased by Ch$ 13,888 million, mainly due to:
Ø Lower energy purchases cost of Ch$ 49,204 million due to higher thermal generation as a result of the start up of Bocamina II operation, added to lower fuel consumption costs of Ch$ 55,345 million and lower transportation cost of Ch$ 17,790 million.
Ø This was partially offset by lower energy sale revenues of Ch$ 102,591 million due to lower average energy sale prices and lower physical sales as a result of reduced contracts indexed to marginal cost and the expiration of some contracts with non regulated customers.
In Argentina, EBITDA increased by Ch$ 3,897 million due to:
Ø Lower procurement and service cost of Ch$ 28,191 million because of lower fuel consumption cost due to lower thermal generation.
Ø This was partially offset by lower operation revenues of Ch$ 20,622 million, as a consequence of a reduction in the average energy sale prices expressed in Chilean peso terms and lower physical sales due to a reduction in hydro generation as a result of lower reservoir levels.
In Brazil, EBITDA decreased by Ch$ 11,229 million basically because of:
Ø Higher procurement and services costs of Ch$ 18,402 million, mainly explained by higher energy purchases costs of Ch$ 3,137 million, primarly in Central Fortaleza.
Ø Higher fuel consumption cost of Ch$ 11,030 million, also explained by higher generation in Endesa Fortaleza.
Ø This was partially offset by higher energy sale revenues of Ch$ 9,352 million, due to higher thermal generation in Fortaleza at higher average sale prices, that compensated the lower hydro availability in Cachoeira Dourada.
In Colombia, EBITDA grew by Ch$ 20,220 million, mostly in connection with,
Ø Increase in operating revenues of Ch$ 38,326 million explained by 10.6% increase in the average energy sale price in Chilean peso terms, in line with a higher market price in Colombia, and 3.2% increase in physical sales due to higher demand.
Ø This was partially offset by higher energy purchases costs of Ch$ 20,894 million mainly due to a lower hydro availability.
In Peru, EBITDA increased Ch$ 953 million due to:
Ø Lower procurement and service cost of Ch$ 4,086 million mainly explained by lower fuel consumption as a result of lower thermal dispatch.
Ø The latter was partially offset by a reduction in operating revenues of Ch$ 2,683 million due to lower average energy sale price in Chilean peso terms and lower physical sales.
3
![]()
Distribution Business
Consolidated figures for the distribution businesses are detailed as follows:
Ø Operating revenues reduced by 1.3% compared to the first half 2012, reaching Ch$ 2,231,771 million. This is explained mainly by the tariff revision process in Coelce and Chilectra which resulted in tariff reductions.
Ø Procurement and service costs reached Ch$ 1,291,392 million, 11.6% lower than in first half 2012. This is mainly explained by reductions in energy purchases cost, other procurement and service cost and transportation cost.
Ø Energy sales by customers’ segment for each of our distribution companies were the following:
% Physical Sales | Chile | Argentina | Peru | Brazil | Colombia | TOTAL | ||||||||
1H 2013 | Chilectra | Edesur | Edelnor | Ampla | Coelce | Codensa |
| |||||||
| 1H 2013 | 1H 2012 | 1H 2013 | 1H 2012 | 1H 2013 | 1H 2012 | 1H 2013 | 1H 2012 | 1H 2013 | 1H 2012 | 1H 2013 | 1H 2012 | 1H 2013 | 1H 2012 |
Residential | 25% | 25% | 41% | 41% | 38% | 37% | 42% | 41% | 35% | 34% | 34% | 35% | 36% | 35% |
Industrial | 20% | 22% | 8% | 8% | 18% | 19% | 8% | 9% | 11% | 12% | 6% | 7% | 11% | 12% |
Commercial | 31% | 29% | 25% | 27% | 22% | 22% | 20% | 20% | 18% | 19% | 16% | 16% | 23% | 23% |
Others | 23% | 24% | 25% | 25% | 22% | 22% | 30% | 30% | 36% | 34% | 44% | 42% | 30% | 29% |
TOTAL | 100% | 100% | 100% | 100% | 100% | 100% | 100% | 100% | 100% | 100% | 100% | 100% | 100% | 100% |
Ø EBITDA in 2013 amounted to Ch$ 620,246 million, 25.8% higher than in same period last year.
EBITDA in the Distribution business, by country, was as follows:
In Chile, EBITDA increased by Ch$ 1,016 million, mainly attributable to:
Ø Lower procurement and service costs of Ch$ 26,036 million mainly explained by lower energy purchase costs as a result of the absence of marginal cost indexation in contracts with generators.
Ø Higher other services of Ch$ 4,137 million.
Ø The above was partially offset by lower energy sales revenues of Ch$ 28,805 million due to lower average energy sale price, explained by the tariff revision process in Chilectra since November 2012.
In Argentina, EBITDA increased by Ch$ 166,161 million, mostly explained by:
Ø MMC effect, mentioned above
Ø This was partially offset by an increase of Ch$ 12,335 million in personnel expenses, due to salary increases because of union agreements.
Ø Increase of Ch$ 7,251 million in other fixed operating costs because of higher costs in inputs and services hired to repair the grid.
Ø Reduction of Ch$ 6,847 million in energy sales revenues, due to lower demand as a result of the decrease in industrial and commercial activity.
In Brazil, EBITDA decreased by Ch$ 29,993 million mainly as a consequence of the drought affecting Brazil, that has pushed up the energy price. Also, because until today a part of the incremental energy purchase costs has not been recognized yet in the distribution companies tariffs. In addition to this:
Ø Lower energy sales revenues in Coelce of Ch$ 79,981 million and in Ampla of Ch$ 73,513 million, due to lower average energy sale price expressed in Chilean peso terms as a result of Colece’s tariff revision process, partially offset by higher physical sales in both companies.
Ø This was partially offset by a decrease of Ch$ 132,894 million in other procurement and service costs.
4
![]()
In Colombia, EBITDA decreased by Ch$ 8,159 million, mainly in connection with:
Ø Lower energy sales revenues of Ch$ 13,859 million, a 3.9% decrease, explained by a 7.0% decrease in energy sales price expressed in Chilean peso terms, partially offset by a 3.3% increase in physical sales.
Ø This was partially offset by Ch$ 6,353 million of lower procurement and services costs.
In Peru, EBITDA decreased by Ch$ 1,952 million as consequence of:
Ø Reduction in other operating revenues of Ch$ 3,901 million and higher energy purchase cost of Ch$3,376 million.
Ø This was partially offset by an increase of Ch$ 2,582 million in energy sales revenues, due to higher physical sales.
Financial Summary
Ø Average nominal interest rate decreased from 8.9% down to 8.1%, mainly explained by a lower inflation rate in Chile and better rate conditions in the countries where we operate.
Ø Liquidity, a key consideration in our financial management, continues to be in a very solid position, as shown below on a consolidated basis for Enersis,
· Cash and cash equivalents US$ 2,298 million
· Cash and cash equivalents + Long term Cash Investment US$ 3,723 million
· Committed credit lines available US$ 769 million
· Non-committed credit lines available US$ 956 million
Ø Hedge and protection: In order to mitigate exchange rate and interest rate risks, Enersis has established strict internal rules to protect our cash flows and balance sheet from fluctuations in these variables.
· Our exchange rate policy is based on cash flows and we strive to maintain a balance between US dollar indexed flows, and assets and liabilities in such currencies. In addition to this policy, we have contracted cross currency swaps for a total amount of US$ 1,412 million and forwards for US$ 742 million as of June 30, 2013.
· In order to reduce financial results volatility due to changes in market interest rates, we seek to maintain an adequate balance in our debt structure. Thus, as of June 30, 2013, we have contracted interest rate swaps (from variable to fixed rates) for US$ 440 million.
5
![]()
Market Summary
Ø During the period from July 2012 to June 2013, the Chilean Stock Exchange’s index for the most important 40 shares, “IPSA”, showed a decrease of -8.4%. The markets where the Company operates recorded mixed performance, as follows:
· BOVESPA (Brazil): -13.2%
· Merval (Argentina): 25.6%
· COLCAP (Colombia): -1.5%, and
· ISBVL (Peru) : -21.0%.
In Europe, the main Stock Exchanges showed positive performances over the last 12 months: IBEX: 9.0%, UKX: 10.2% and FTSE 250: 24.4%. U.S. market also performed positively in line with its economic recovery: S&P 500: 17.6% and Dow Jones Industrial: 15.8% (all yields measured in local currency).
Ø Enersis’ share price decreased -11.4% over the past 12 months. This change is mainly attributable to the global economic scenario, especially in the European zone and also due to the drought affecting Chile for the last three consecutive years. Closing price for the period was Ch$ 166.9
Ø On the other hand, Enersis` ADS value decreased -13.0% reaching a price of US$16.4, while its share price in the Madrid Stock Exchange decreased 13.9% reaching € 0.248 as of June 30, 2013.
Ø During the last twelve months, Enersis continued to be among the most actively traded companies in the local stock market (Santiago Stock Exchange and Chilean Electronic Exchange), with a daily average trading volume of US$ 12.8 million.
Source: Bloomberg
6
![]()
Risk Rating Classification Information
Key considerations, among others, for current risk rating of Enersis, are:
· Its well diversified asset portfolio
· Strong credit metrics
· Adequate debt structure
· Solid liquidity
The Company’s geographic diversification in South America provides a natural hedge against different regulations and weather conditions. Most of Enersis’ operating subsidiaries are financially strong and have leading market positions in the countries where Enersis operates.
Among the main events of the last months, we can highlight the following:
Ø On July 12, 2013, Standard & Poor's confirmed the international credit risk rating for Enersis of "BBB+" with stable Outlook, a positive sign in the middle of a difficult macroeconomic scenario prevailing in international markets. This took place on the occasion of the reviews of both Enel SpA and Endesa Spain in previous days, in which both credit risk ratings were downgraded.
Ø On January 15, 2013, Feller Rate ratified the “AA” local rating of Enersis’ bonds, shares and commercial papers program, also confirming the stable outlook.
Ø On December 19, 2012, Fitch Ratings affirmed both ratings in local and foreign currency of Enersis of "BBB+", as well as its long-term rating on the national scale at 'AA (cl)'. The outlook is "stable".
Ø On September 26, 2012, Humphreys assigned “AA” to Enersis local bonds, “AA/Level 1+” to the commercial papers program and “First Class Level 1” to the company’s shares.
Ø On June 18, 2012, Moody's affirmed the “Baa2 with stable outlook” senior unsecured rating of Enersis.
Current international risk ratings are:
Enersis | S&P | Moody’s | Fitch |
Corporate | BBB+ / Stable | Baa2 / Stable | BBB+ / Stable |
Local ratings (for securities issued in Chile):
Enersis | Feller Rate | Fitch | Humphrey’s |
Shares | 1st Class Level 1 | 1stClass Level 1 | 1stClass Level 1 |
Bonds | AA / Stable | AA / Stable | AA / Stable |
7
![]()
Disclaimer:
As a result of applying IFRS 11 "Joint Arrangements”, since January 1, 2013, the jointly controlled companies, which until the financial statements submitted as of December 31, 2012, were consolidated on a proportional basis, should be recorded under the equity method, as required by the new standard for “Joint Arrangements” that qualify as Joint Ventures.
Companies considered are Centrales Hidroeléctricas de Aysén S.A. and subsidiaries, Inversiones Gas Atacama Holding Ltda. and subsidiaries, Distribuidora Eléctrica de Cundinamarca S.A. and subsidiary, and Transmisora Eléctrica de Quillota Ltda.
Having in mind that application of the IFRS 11 "Joint Arrangements” is retroactive, these consolidated financial statements include modifications to certain comparative figures, and the related explanatory notes, which in turn were approved by Enersis’ governing bodies.
These changes do not affect the income attributable to the owners of the parent company.
8
![]()
Table of Contents
| Generation and Transmission Business | 2 |
| Distribution Business | 4 |
| Financial Summary | 5 |
| Market Summary | 5 |
| Risk Rating Classification Information | 6 |
| TABLE OF CONTENTS | 9 |
| GENERAL INFORMATION | 11 |
| Simplified Organizational Structure * | 12 |
| Consolidated Income Statement Analysis | 13 |
| Net Income | 13 |
| Net Financial Income | 15 |
| Sale of Assets | 16 |
| Taxes | 16 |
| Consolidated Balance Sheet Analysis | 16 |
| Assets Under IFRS | 16 |
| BOOK VALUE AND ECONOMIC VALUE OF ASSETS | 18 |
| LIABILITIES AND SHAREHOLDERS’ EQUITY UNDER IFRS | 19 |
| Debt Maturity with Third Parties, Thousand US$ | 21 |
| Debt Maturity with Third Parties, Million Ch$ | 22 |
| Evolution Of Key Financial Ratios | 22 |
| Under IFRS | 24 |
| Cash Flow Received From Foreign Subsidiaries by Enersis, Chilectra and Endesa Chile | 25 |
| THE MAIN RISKS ASSOCIATED TO THE ACTIVITIES OF THE ENERSIS GROUP | 26 |
| ARGENTINA | 31 |
| Generation | 31 |
| Endesa Costanera | 31 |
| El Chocón | 32 |
| Dock Sud | 33 |
| Distribution | 34 |
| Edesur | 34 |
| BRAZIL | 35 |
| Endesa Brasil | 35 |
| Generation | 35 |
| Cachoeira Dourada | 35 |
| Fortaleza (cgtf) | 36 |
| Transmission | 37 |
| CIEN | 37 |
9
![]()
| Ampla | 37 |
| Coelce | 38 |
| CHILE | 39 |
| Generation | 39 |
| Endesa Chile | 39 |
| Distribution | 40 |
| Chilectra | 40 |
| COLOMBIA | 42 |
| Generation | 42 |
| Emgesa | 42 |
| Distribution | 43 |
| Codensa | 43 |
| PERU | 44 |
| Generation | 44 |
| Edegel | 44 |
| Eepsa | 44 |
| Distribution | 45 |
| Edelnor | 45 |
| MARKET INFORMATION | 48 |
| Equity Market | 48 |
| CONFERENCE CALL INVITATION | 52 |
| Disclaimer | 53 |
10
![]()
General Information
(Santiago, Chile, Wednesday, July 24, 2013.) Enersis S.A. (NYSE: ENI), announced today its consolidated financial results for the period ended on June 30, 2013. All figures are in Chilean pesos (Ch$) and in accordance with International Financial Reporting Standards (IFRS). Variations refer to the period between June 30, 2012 and June 30, 2013.
Figures as of June 30, 2013 are additionally translated into US$, merely as a convenience translation, using the exchange rate of US$ 1 = Ch$ 507.16 for the Balance Sheet, and the average exchange rate for the period of US$ 1 = Ch$ 478.71 for the Income Statement, Cash Flow Statements, Capex and Depreciation values.
The consolidation includes the following investment vehicles and companies,
a) In Chile: Endesa Chile (NYSE: EOC)¹, Chilectra, and Inmobiliaria Manso de Velasco.
b) Others than Chile: Distrilima (Peru), Piura (Peru), Endesa Brasil² (Brazil), Edesur (Argentina), Docksud (Argentina), and Codensa (Colombia).
¹ Endesa Chile includes
Chilean subsidiaries
Endesa Eco
Celta
Pehuenche
San Isidro, merged between San Isidro and Pangue, and
Túnel El Melón
non Chilean subsidiaries
Endesa Costanera
El Chocón
Edegel and
Emgesa
² Endesa Brazil includes
Endesa Fortaleza
CIEN
Cachoeira Dourada
Ampla and,
Coelce
11
![]()
Simplified Organizational Structure *
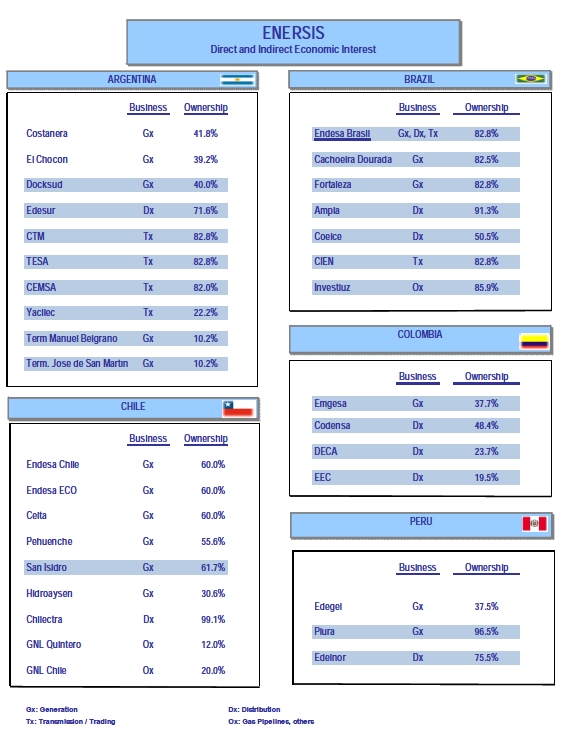
* Due to the capital increase operation, the ownership structure of the highlighted companies has changed when compared to the last period. Also three new operative companies have been incorporated to Enersis’ Ownership Structure: Piura, Docksud and Yacilec. Yacilec is not consolidated by Enersis.
12
![]()
Consolidated Income Statement Analysis
Net Income
Enersis’ Net Income attributable to the owners of the controller as of June 30, 2013 reached Ch$ 322,356 million, representing a 98.2% increase compared to first half 2012, which was Ch$ 162,621 million.
Under IFRS
Table 1 | ||||||
CONSOLIDATED INCOME STATEMENT | (Million Ch$) | (Thousand US$) | ||||
| 1H 2013 | 1H 2012 | Var 2012-2013 | Chg % | 1H 2013 | |
Sales | 2,845,647 | 3,135,102 | (289,456) | (9.2%) | 5,944,407 | |
Energy sales | 2,647,590 | 2,916,319 | (268,729) | (9.2%) | 5,530,675 | |
Other sales | 12,282 | 9,030 | 3,252 | 36.0% | 25,656 | |
Other services | 185,776 | 209,754 | (23,978) | (11.4%) | 388,075 | |
Other operating income | 311,954 | 116,201 | 195,752 | 168.5% | 651,655 | |
Revenues | 3,157,601 | 3,251,304 | (93,703) | (2.9%) | 6,596,061 | |
Energy purchases | (909,489) | (974,678) | 65,190 | 6.7% | (1,899,874) | |
Fuel consumption | (300,975) | (378,441) | 77,466 | 20.5% | (628,721) | |
Transportation expenses | (190,112) | (230,097) | 39,986 | 17.4% | (397,133) | |
Other variable costs | (220,355) | (303,789) | 83,434 | 27.5% | (460,310) | |
Procurements and Services | (1,620,930) | (1,887,006) | 266,076 | 14.1% | (3,386,037) | |
|
|
|
|
|
| |
Contribution Margin | 1,536,671 | 1,364,298 | 172,372 | 12.6% | 3,210,024 | |
Other work performed by entity and capitalized | 27,903 | 23,335 | 4,567 | 19.6% | 58,287 | |
Employee benefits expense | (229,999) | (203,619) | (26,380) | (13.0%) | (480,457) | |
Other fixed operating expenses | (247,398) | (248,316) | 918 | 0.4% | (516,802) | |
Gross Operating Income (EBITDA) | 1,087,175 | 935,698 | 151,477 | 16.2% | 2,271,052 | |
Depreciation and amortization | (205,615) | (213,781) | 8,166 | 3.8% | (429,519) | |
Reversal of impairment profit (impairment loss) recognized in profit or loss | (15,931) | (17,490) | 1,559 | 8.9% | (33,278) | |
Operating Income | 865,630 | 704,427 | 161,203 | 22.9% | 1,808,255 | |
Net Financial Income | (64,879) | (162,089) | 97,210 | 60.0% | (135,528) | |
Financial income | 142,110 | 89,322 | 52,788 | 59.1% | 296,861 | |
Financial costs | (205,410) | (233,494) | 28,084 | 12.0% | (429,092) | |
Gain (Loss) for indexed assets and liabilities | (164) | (7,912) | 7,748 | 97.9% | (342) | |
Foreign currency exchange differences, net | (1,414) | (10,005) | 8,590 | 85.9% | (2,955) | |
Gains | 46,081 | 24,463 | 21,618 | 88.4% | 96,260 | |
Losses | (47,495) | (34,468) | (13,027) | (37.8%) | (99,215) | |
Share of profit (loss) of associates accounted for using the equity method | 10,396 | 16,249 | (5,853) | (36.0%) | 21,717 | |
Net Income From Other Investments | 860 | 298 | 562 | 188.7% | 1,797 | |
Net Income From Sale of Assets | 6,578 | 1,491 | 5,088 | 341.3% | 13,742 | |
Net Income Before Taxes | 818,586 | 560,375 | 258,211 | 46.1% | 1,709,983 | |
Income Tax | (256,280) | (171,660) | (84,620) | (49.3%) | (535,355) | |
NET INCOME ATTRIBUTABLE TO: | 562,306 | 388,715 | 173,591 | 44.7% | 1,174,628 | |
Owners of parent | 322,356 | 162,621 | 159,735 | 98.2% | 673,385 | |
Non-controlling interest | 239,950 | 226,094 | 13,856 | 6.1% | 501,243 | |
Earning per share (Ch$ /share and US$ / ADR) | 6.6 | 5.0 | 1.6 | 31.8% | 1.0 | |
Operating income increased by Ch$ 161,203 million, 22.9% higher than same period in 2012. The breakdown by business line for the period ended June 30, 2013 and June 30, 2012 is as follow:
13
![]()
Table 2 |
|
|
|
|
|
|
|
|
|
|
|
|
|
|
Operating Income by Businesses | Generation and Transmission | Distribution | ||||||||||||
Million Ch$ |
| Chg% |
| Th. US$ |
| Million Ch$ |
| Chg% |
| Th. US$ |
| |||
1H 2013 | 1H 2012 |
|
|
| 1H 2013 |
| 1H 2013 | 1H 2012 |
|
|
| 1H 2013 |
| |
Operating Revenues | 1,211,672 | 1,296,706 |
| (6.6%) |
| 2,531,119 |
| 2,231,771 | 2,260,737 | (1.3%) |
| 4,662,052 |
| |
Operating Costs | (844,377) | (952,068) |
| (11.3%) |
| (1,763,859) |
| (1,723,969) | (1,894,479) | (9.0%) |
| (3,601,281) |
| |
Operating Income | 367,295 | 344,638 |
| 6.6% |
| 767,260 |
| 507,802 | 366,258 |
| 38.6% |
| 1,060,771 |
|
|
|
|
|
|
|
|
|
|
|
|
|
|
|
|
Operating Income by Businesses | Eliminations and Others |
| Consolidated |
| ||||||||||
Million Ch$ |
| Chg% |
| Th. US$ |
| Million Ch$ |
| Chg% |
| Th. US$ |
| |||
1H 2013 | 1H 2012 |
|
|
| 1H 2013 |
| 1H 2013 | 1H 2012 |
|
|
| 1H 2013 |
| |
Operating Revenues | (285,842) | (306,139) |
| (6.6%) |
| (597,110) |
| 3,157,601 | 3,251,304 | (2.9%) |
| 6,596,061 |
| |
Operating Costs | 276,376 | 299,671 |
| (7.8%) |
| 577,334 |
| (2,291,971) | (2,546,877) | (10.0%) |
| (4,787,806) |
| |
Operating Income | (9,467) | (6,469) |
| 46.3% |
| (19,776) |
| 865,630 | 704,427 |
| 22.9% |
| 1,808,255 |
|
Generation and transmission businessregistered an operating income of Ch$ 367,295 million, representing a Ch$ 22,657 million increase as compared to the first half 2012. Physical sales decreased 5.0%, amounting to 30,674 GWh in this period.
Operating income for generation and transmission business line, detailed by country is shown, in the following table:
Table 3 |
|
|
|
|
|
|
|
|
|
|
|
|
|
|
|
|
|
|
|
|
Generation & Transmission | Chile |
| Argentina |
| Brazil | |||||||||||||||
Million Ch$ |
| Chg% |
| Th. US$ |
| Million Ch$ |
| Chg% |
| Th. US$ |
| Million Ch$ |
| Chg% |
| Th. US$ | ||||
1H 2013 | 1H 2012 |
|
|
| 1H 2013 |
| 1H 2013 | 1H 2012 |
|
|
| 1H 2013 |
| 1H 2013 | 1H 2012 |
|
|
| 1H 2013 | |
Operating Revenues | 419,742 | 526,070 |
| (20.2%) |
| 876,819 |
| 163,659 | 184,281 |
| (11.2%) |
| 341,874 |
| 179,104 | 172,907 |
| 3.6% |
| 374,140 |
% of consolidated | 35% | 41% |
|
|
| 35% |
| 14% | 14% |
|
|
| 14% |
| 15% | 13% |
|
|
| 15% |
Operating Costs | (369,771) | (482,155) |
| (23.3%) |
| (772,433) |
| (156,339) | (181,446) |
| (13.8%) |
| (326,584) |
| (101,529) | (85,190) |
| 19.2% |
| (212,089) |
% of consolidated | 44% | 51% |
|
|
| 44% |
| 19% | 19% |
|
|
| 19% |
| 12% | 9% |
|
|
| 12% |
|
|
|
|
|
|
|
|
|
|
|
|
|
|
|
|
|
|
|
|
|
Operating Income | 49,970 | 43,915 |
| 13.8% |
| 104,386 |
| 7,320 | 2,834 |
| 158.3% |
| 15,290 |
| 77,575 | 87,717 |
| (11.6%) |
| 162,051 |
|
|
|
|
|
|
|
|
|
|
|
|
|
|
|
|
|
|
|
|
|
Generation & Transmission | Peru |
| Colombia |
| Consolidated | |||||||||||||||
Million Ch$ |
| Chg% |
| Th. US$ |
| Million Ch$ |
| Chg% |
| Th. US$ |
| Million Ch$ |
| Chg% |
| Th. US$ | ||||
1H 2013 | 1H 2012 |
|
|
| 1H 2013 |
| 1H 2013 | 1H 2012 |
|
|
| 1H 2013 |
| 1H 2013 | 1H 2012 |
|
|
| 1H 2013 | |
Operating Revenues | 139,071 | 141,754 |
| (1.9%) |
| 290,511 |
| 310,338 | 272,012 |
| 14.1% |
| 648,279 |
| 1,211,672 | 1,296,706 |
| (6.6%) |
| 2,531,119 |
% of consolidated | 11% | 11% |
|
|
| 11% |
| 26% | 21% |
|
|
| 26% |
| 100% | 100% |
|
|
|
|
Operating Costs | (85,650) | (89,239) |
| (4.0%) |
| (178,918) |
| (131,329) | (114,355) |
| 14.8% |
| (274,340) |
| (844,377) | (952,068) |
| (11.3%) |
| (1,763,859) |
% of consolidated | 10% | 9% |
|
|
| 10% |
| 16% | 12% |
|
|
| 16% |
| 100% | 100% |
|
|
|
|
|
|
|
|
|
|
|
|
|
|
|
|
|
|
|
|
|
|
|
|
|
Operating Income | 53,421 | 52,515 |
| 1.7% |
| 111,593 |
| 179,009 | 157,657 |
| 13.5% |
| 373,939 |
| 367,295 | 344,638 |
| 6.6% |
| 767,260 |
Distribution businessshowed a Ch$ 141,544 million higher operating income, totaling Ch$ 507,802 million. Physical sales amounted to 36,957 GWh, representing an increase of 1,221 GWh, or 3.4%. Our customers base increased by 454 thousand of new customers, amounting over 14.1 million customers.
Operating Income for distribution business line, detailed by country, is as follows:
14
![]()
Table 4 |
|
|
|
|
|
|
|
|
|
|
|
|
|
|
|
|
|
|
|
|
Distribution | Chile |
| Argentina |
| Brazil | |||||||||||||||
Million Ch$ |
| Chg% |
| Th. US$ |
| Million Ch$ |
| Chg% |
| Th. US$ |
| Million Ch$ |
| Chg% |
| Th. US$ | ||||
1H 2013 | 1H 2012 |
|
|
| 1H 2013 |
| 1H 2013 | 1H 2012 |
|
|
| 1H 2013 |
| 1H 2013 | 1H 2012 |
|
|
| 1H 2013 | |
Operating Revenues | 471,267 | 494,323 |
| (4.7%) |
| 984,453 |
| 343,754 | 165,014 |
| 108.3% |
| 718,083 |
| 811,481 | 980,892 |
| (17.3%) |
| 1,695,141 |
% of consolidated | 21% | 22% |
|
|
| 21% |
| 15% | 7% |
|
|
| 15% |
| 36% | 43% |
|
|
| 36% |
Operating Costs | (401,717) | (426,607) |
| (5.8%) |
| (839,167) |
| (202,070) | (190,068) |
| 6.3% |
| (422,114) |
| (661,114) | (810,834) |
| (18.5%) |
| (1,381,033) |
% of consolidated | 23% | 23% |
|
|
| 23% |
| 12% | 10% |
|
|
| 12% |
| 38% | 43% |
|
|
| 38% |
|
|
|
|
|
|
|
|
|
|
|
|
|
|
|
|
|
|
|
|
|
Operating Income | 69,550 | 67,716 |
| 2.7% |
| 145,286 |
| 141,683 | (25,054) |
| (665.5%) |
| 295,969 |
| 150,367 | 170,058 |
| (11.6%) |
| 314,108 |
|
|
|
|
|
|
|
|
|
|
|
|
|
|
|
|
|
|
|
|
|
Distribution | Peru |
| Colombia |
| Consolidated | |||||||||||||||
Million Ch$ |
| Chg% |
| Th. US$ |
| Million Ch$ |
| Chg% |
| Th. US$ |
| Million Ch$ |
| Chg% |
| Th. US$ | ||||
1H 2013 | 1H 2012 |
|
|
| 1H 2013 |
| 1H 2013 | 1H 2012 |
|
|
| 1H 2013 |
| 1H 2013 | 1H 2012 |
|
|
| 1H 2013 | |
Operating Revenues | 192,946 | 194,265 |
| (0.7%) |
| 403,054 |
| 412,323 | 426,243 |
| (3.3%) |
| 861,321 |
| 2,231,771 | 2,260,737 |
| (1.3%) |
| 4,662,052 |
% of consolidated | 9% | 9% |
|
|
| 9% |
| 18% | 19% |
|
|
| 18% |
| 100% | 100% |
|
|
|
|
Operating Costs | (159,649) | (158,925) |
| 0.5% |
| (333,499) |
| (299,418) | (308,045) |
| (2.8%) |
| (625,469) |
| (1,723,969) | (1,894,479) |
| (9.0%) |
| (3,601,281) |
% of consolidated | 9% | 8% |
|
|
| 9% |
| 17% | 16% |
|
|
| 17% |
| 100% | 100% |
|
|
|
|
|
|
|
|
|
|
|
|
|
|
|
|
|
|
|
|
|
|
|
|
|
Operating Income | 33,297 | 35,340 |
| (5.8%) |
| 69,555 |
| 112,905 | 118,197 |
| (4.5%) |
| 235,852 |
| 507,802 | 366,258 |
| 38.6% |
| 1,060,771 |
Net Financial Income
As of June 30, 2013 the Company’s net financial income totaled a loss of Ch$ 64,879 million, 60.0% better than in the first semester 2012. The latter is mainly explained by:
Higher financial revenues of Ch$ 52,788 million, as a consequence of the actualization in Brazil of unamortized assets at the end of the concession in Ampla and Coelce in Brazil to new replacement value depreciated by Ch$ 32,744 million, higher revenues in Edesur of Ch$ 27,044 million due to financial effects of the application of resolution 250/13, higher revenues in Enersis of Ch$ 11,584 million due to investments regarding the capital increase operation. This was partially offset by lower revenues by financing and conventions of Ch$ 6,440 million, lower cash deposits of Ch$ 4,476 million, lower revenues by juditial deposits reversal in Brazil of Ch$ 4,516, lower extraordinary financial revenue by ESSALUD received in 2012 in Edelnor of Ch$ 1,650 million and lower other revenues of Ch$ 1,502 million.
Lower financial expenses of Ch$ 28,084 million as a result of lower contingencies actualization of Ch$ 19,331 million and a decrease in financial costs of loans and bonds of Ch$ 11,789 million. This was partially offset by higher other financial expenses of Ch$ 2,562 million and higher expenses for derivatives valuation of Ch$ 474 million.
Lower adjustment units expenses of Ch$ 7,748 million due to the effect of the UF1 change mainly over UF denominated debt in some companies in Chile. This as a result that in this period the UF increased its value by 0.1% compared with the 1.5% increase during same period last year.
Lower exchange rate expense of Ch$ 8,590 million, mainly explained by revenues due to exchange rate variation in cash and cash equivalent of Ch$ 6,289 million and in debtors and other accounts receivable in US dollars of Ch$ 16,276 million and losses in liabilities in US dollars of Ch$ 13,963 million.
1Unidad de Fomento: Chilean inflation-indexed, peso-denominated monetary unit
15
![]()
Sale of Assets
Net income from sales of assets presented a positive variation of Ch$ 5,650 million, due to the earnings obtained from the transmission line sale by Ch$ 2,532 million, land sale by Ch$ 2,247 million and other sales by Ch$ 871 million.
Taxes
Income tax on companies expense increased by Ch$ 84,620 million mainly due to increases in Enersis of Ch$ 40,042 million, Edesur of Ch$ 21,725 million, Ampla of Ch$ 15,275 million, Endesa Chile of Ch$ 6,843 million, Chilectra of Ch$ 5,298 million, Pehuenche of Ch$ 3,751 million and Edegel of Ch$ 960 million. This was partially offset by a decrease in Coelce of Ch$ 9,288 million.
Consolidated Balance Sheet Analysis
Assets Under IFRS
Table 5 |
|
|
|
|
|
|
ASSETS | (Million Ch$) |
| (Thousand US$) | |||
| As of June 30, 2013 | As of Dec 31, 2012 | Var 2012-2013 | Chg % | As of June 30, 2013 | |
|
|
|
|
|
| |
CURRENT ASSETS |
|
|
|
|
|
|
Cash and cash equivalents | 1,168,103 | 815,832 | 352,271 | 43.2% |
| 2,303,224 |
Other current financial assets | 749,747 | 194,501 | 555,246 | 285.5% |
| 1,478,325 |
Other current non-financial assets | 118,581 | 103,377 | 15,205 | 14.7% |
| 233,814 |
Trade and other current receivables | 879,174 | 846,791 | 32,383 | 3.8% |
| 1,733,523 |
Accounts receivable from related companies | 41,657 | 47,570 | (5,914) | (12.4%) |
| 82,137 |
Inventories | 69,319 | 76,563 | (7,244) | (9.5%) |
| 136,681 |
Current tax assets | 212,034 | 205,555 | 6,480 | 3.2% |
| 418,082 |
Non-current assets (or disposal groups) classified as held for sale | - | - | - |
|
| - |
Total Current Assets | 3,238,616 | 2,290,189 | 948,427 | 41.4% |
| 6,385,787 |
|
|
|
| |||
NON-CURRENT ASSETS |
|
|
|
|
|
|
Other non-current financial assets | 471,332 | 439,018 | 32,314 | 7.4% |
| 929,355 |
Other non-current non-financial assets | 92,115 | 87,788 | 4,326 | 4.9% |
| 181,628 |
Trade accounts receivables and other receivables, net | 242,684 | 202,900 | 39,784 | 19.6% |
| 478,516 |
Accounts receivable from related companies | - | - | - |
|
| - |
Investment accounted for using equity method | 223,326 | 214,517 | 8,809 | 4.1% |
| 440,346 |
Intangible assets other than goodwill | 1,217,357 | 1,202,003 | 15,355 | 1.3% |
| 2,400,341 |
Goodwill | 1,381,498 | 1,391,674 | (10,176) | (0.7%) |
| 2,723,988 |
Property, plant and equipment, net | 7,129,159 | 7,049,924 | 79,236 | 1.1% |
| 14,057,022 |
Investment properties | 46,698 | 46,923 | (225) | (0.5%) |
| 92,077 |
Deferred tax assets | 229,438 | 321,556 | (92,119) | (28.6%) |
| 452,397 |
Total Non-Current Assets | 11,033,606 | 10,956,303 | 77,302 | 0.7% |
| 21,755,671 |
|
|
|
|
|
|
|
TOTAL ASSETS | 14,272,222 | 13,246,492 | 1,025,729 | 7.7% |
| 28,141,458 |
Total Assets increased Ch$ 1,025,730 million, mainly due to:
Ø Ch$ 948,427 million increase in current assets, equivalent to 41.4%, as a result of:
v Increase in other financial assets of Ch$ 555,246 million, because of increases in Enersis of Ch$ 534,943 million due to investments of part of the cash receibed from the capital increased mainly in deposits whith maturity over 90 days, , in Endesa Brasil of Ch$ 54,129 million for investments in financial instruments, and in Endesa Chile of Ch$ 11,662 million for the valuation at fair value of Forwards. This was partially offset by decreases in Codensa and Emgesa of Ch$ 49,472 million due to liquidation of deposits with maturity over 90 days
16
![]()
v Ch$ 352,271 million increase in cash and cash equivalents mainly due to increases in: Enersis of Ch$ 444,892 million due to the capital increase operation ended on March 2013, in Cachoeira Dourada of Ch$ 15,233 million due to higher cash generation, in Coelce of Ch$ 14,060 for energy overcost collection and higher cash generation, in Endesa Brasil of Ch$ 9,062 million for loan payment of CIEN, increase for the incorporation in the consolidated financial statements of the companies included in Enersis’ capital increase operation which include balances at Dock Sud of Ch$ 7,469 million, Empresa Eléctrica de Piura of Ch$ 4,549 million and Cemsa of Ch$ 3,944 million. This was partially offset by reductions in Codensa of Ch$ 70,973 million due to dividend payment and non-guaranteed obligations and Emgesa of Ch$ 73,535 million due to dividend payment.
v Increase in Commercial debtors of Ch$ 32,383 million, mainly explained by an increase in Edesur of Ch$ 116,982 million due to the impact of resolution 250/13, in San Isidro of Ch$ 20,050 million for billing to YPF, in Emgesa of 12,920 million due to higher billing, in Celta of Ch$ 2,850 million and the increase for the incorporation in the consolidated financial statements of the companies included in Enersis’ capital increase operation which include balances in Dock Sud of Ch$ 19,801 million, Cemsa of Ch$ 3,857 million and Empresa Eléctrica de Piura of Ch$ 3,532 million. This was partially offset by decreases in Endesa Chile of Ch$ 102,157 million due to Bocamina II insurance’s payment and lower billing in this period, in Coelce of Ch$ 18,214 million for lower tariffs to customers and low income subsidies, in Ampla of Ch$ 16,292 million for lower residential tariffs and in Peguenche of Ch$ 11,272 million.
v Increase in other current non-financial assets of Ch$ 15,204 million, mainly due to the increase in Endesa Chile of Ch$ 5,833 million, in Ampla of Ch$ 2,243 million due to advanced payments, both in Coelce of Ch$ 2,222 million and in CIEN of Ch$1,029 million and the incorporation of Empresa Eléctrica Piura of Ch$ 2,939 million.
v The latter was partially offset by:
v Decrease of Ch$ 7,243 million in Inventory due to decreases in Endesa Chile of Ch$ 13,670 million for higher oil and coal consumption, in Emgesa of Ch$ 3,575 million for higher coal consumption, partially offset by the incorporation of Sociedad Eléctrica Piura of Ch$ 7,463 million, increases in Edelnor of Ch$ 1,083 million, in Chilectra of Ch$ 536 million and in Edesur of Ch$ 699 million.
Ø Ch$ 77,303 million increase in non-current assets equivalent to 0.7%, mainly due to:
v Increase in property, plant and equipment of Ch$ 79,236 million mainly explained by new investments of Ch$ 239,340 million, the incorporation of the companies included in Enersis’ capital increase operation of Ch$ 114,175 million and others of Ch$ 9,240 million. This was partially offset by decrease because of the conversion effect, due to the different currencies used by the Company of Ch$ 112,488 million, amortization of the period of Ch$ 166,732 million and disposal of Ch$ 4,298 million.
v Increase in trade account receivables and other receivables of Ch$ 39,7834 million, due mainly to the incorporation on the financiel statements of Dock Sud of Ch$ 34,299 million due to account receivables with Foninvemem, increases in CIEN of Ch$ 5,114 million and in Ampla of Ch$ 5,340 million, partially offset by reductions in El Chocón of Ch$ 4,082 million due to Foninvemem payments.
17
![]()
v Increase in other non-current financial assets of Ch$ 32,314 million due to increases in Ampla of Ch$ 31,002 million, in Enersis of Ch$ 10,104 million and in Coelce of Ch$ 2,690 million, partially offset by reductions in Endesa Chile of Ch$ 7,554 million due to the valuation at fair value of derivatives, and in Edelnor of Ch$ 3,184 million.
v Increase in non-tangible assets other than goodwill of Ch$ 15,355 million, mainly explained by new investments of Ch$ 74,778 million, and by the incorporation of the new companies in Enersis consolidation of Ch$ 2,875 million. This was partially offset by reduction of Ch$ 38,883 million for period amortization, convertion effect of Ch$ 20,503 million and by retirements or disposal of Ch$ 1,465 million.
v This was partially offset by:
v Decrease in Deferred tax assets of Ch$ 92,119 million due to compensation of deferred tax assets and liabilities from the Brazilian subsidiaries Ampla, Coelce, and CIEN of Ch$ 87,237 million, plus decrases in Enersis of Ch$ 3,119 million and Codensa of Ch$ 3,642 million.
Book Value and Economic Value of Assets
Regarding the more important assets, the following should be mentioned:
Properties, Plants and Equipment are valued at their purchase cost, net of the corresponding accumulated depreciation and impairment loss Properties, Plants and Equipment, net of their residual value, if applicable, are linearly depreciated by distributing the cost of their different elements along the estimated years of useful life, which is the period that the companies expect to use them. The useful life is reviewed regularly.
The goodwill value generated by consolidation represents the acquisition cost surplus on the Group’s stake in terms of the reasonable value of assets and liabilities, including the identifiable contingent liabilities of a subsidiary at the time of acquisition. Goodwill is not amortized. Instead, at the closing of each accounting period an assessment is made of whether any impairment has occurred during the period that could reduce its recoverable value to an amount below the registered net cost, proceeding in this event to make a timely impairment adjustment (See Note 3.e to the Consolidated Financial Statements).
Throughout the fiscal year and in particular at the date of closing, an assessment is made as to any indication of possible loss due to the impairment of any asset. In the event of any such indication, an estimate of the recoverable sum of said asset is made to determine, if applicable, the depreciated amount. If this involves identifiable assets that do not originate independent cash flows, the recoverability of the Cash Generating Unit that the asset belongs to is estimated, understanding as such the smaller group of identifiable assets that generate independent cash incomes.
Assets expressed in foreign currency are expressed at the prevalent exchange rate at the closing of the period.
Notes and accounts receivable from related companies are classified according to their short and long term maturities. These operations are adjusted according to prevalent market equity conditions.
18
![]()
In summary, assets are valued according to the International Financial Reporting Standards, whose criteria are expressed in Note 3 of the Consolidated Financial Statements.
Liabilities and Shareholders’ Equity Under IFRS
Table 6 |
|
|
|
|
|
|
LIABILITIES AND SHAREHOLDERS' EQUITY | (Million Ch$) |
| (Thousand US$) | |||
| As of June 30, 2013 | As of Dec 31, 2012 | Var 2012-2013 | Chg % | As of June 30, 2013 | |
|
|
|
|
|
|
|
CURRENT LIABILITIES |
|
|
|
|
|
|
Other current financial liabilities | 1,162,700 | 658,423 | 504,276 | 76.6% |
| 2,292,569 |
Trade and other current payables | 1,120,335 | 1,194,852 | (74,517) | (6.2%) |
| 2,209,036 |
Accounts payable to related companies | 80,968 | 150,260 | (69,292) | (46.1%) |
| 159,649 |
Other short-term provisions | 87,898 | 89,731 | (1,833) | (2.0%) |
| 173,314 |
Current tax liabilities | 143,593 | 169,546 | (25,952) | (15.3%) |
| 283,132 |
Current provisions for employee benefits | - | - | - |
|
| - |
Other current non-financial liabilities | 75,285 | 83,920 | (8,635) | (10.3%) |
| 148,445 |
Liabilities (or disposal groups) classified as held for sale | - | - | - |
|
| - |
Total Current Liabilities | 2,670,778 | 2,346,731 | 324,048 | 13.8% |
| 5,266,145 |
|
|
|
|
|
|
|
NON-CURRENT LIABILITIES |
|
|
|
|
|
|
Other non-current financial liabilities | 2,437,843 | 2,928,120 | (490,277) | (16.7%) |
| 4,806,851 |
Non-current payables | 18,648 | 14,257 | 4,391 | 30.8% |
| 36,769 |
Accounts payable to related companies | - | - | - |
|
| - |
Other-long term provisions | 193,116 | 176,575 | 16,541 | 9.4% |
| 380,780 |
Deferred tax liabilities | 405,966 | 501,128 | (95,162) | (19.0%) |
| 800,469 |
Non-current provisions for employee benefits | 247,678 | 256,161 | (8,483) | (3.3%) |
| 488,363 |
Other non-current non-financial liabilities | 70,231 | 65,313 | 4,918 | 7.5% |
| 138,480 |
Total Non-Current Liabilities | 3,373,482 | 3,941,555 | (568,072) | (14.4%) |
| 6,651,712 |
|
|
|
|
|
|
|
SHAREHOLDERS' EQUITY |
|
|
|
|
|
|
Issued capital | 5,669,281 | 2,824,883 | 2,844,398 | 100.7% |
| 11,178,486 |
Retained earnings (losses) | 2,668,281 | 2,421,279 | 247,002 | 10.2% |
| 5,261,222 |
Share premium | 158,760 | 158,760 | - | 0.0% |
| 313,037 |
Other equity changes | - | - | - |
|
| - |
Reserves | (2,438,343) | (1,511,123) | (927,220) | (61.4%) |
| (4,807,837) |
|
|
| - |
|
|
|
Equity Attributable to Shareholders of the Company | 6,057,979 | 3,893,799 | 2,164,180 | 55.6% |
| 11,944,907 |
Equity Attributable to Minority Interest | 2,169,982 | 3,064,408 | (894,426) | (29.2%) |
| 4,278,694 |
Total Shareholders' Equity | 8,227,961 | 6,958,207 | 1,269,754 | 18.2% |
| 16,223,600 |
|
|
|
|
|
|
|
TOTAL LIABILITIES AND SHAREHOLDERS' EQUITY | 14,272,222 | 13,246,492 | 1,025,729 | 7.7% |
| 28,141,458 |
The Company’s total liabilities and shareholders’ equity increased by Ch$ 1,025,730 million, compared to the period ended on June 30, 2012. This is mainly explained by an increase of Ch$ 1,269,754 million in shareholders’ equity and an increase of Ch$ 324,047 million in current liabilities, partially offset by a Ch$ 568,071 million decrease in non-current liabilities
Ø Current liabilities increased by Ch$ 324,047 million, equivalent to 13.8%, mainly due to:
v Increase of other current financial liabilities of Ch$ 504,276 million, due to increases in Enersis of Ch$ 301,741 million because of transference of debt to short-term, in Endesa Chile of Ch$ 99,956 million, in Codensa of Ch$ 42,528 million, in Edelnor of Ch$ 9,094 million in addition tothe incorporation in the consolidated financial statements of the companies included in Enersis’ capital increase operation which include balances in Dock Sud of Ch$ 48,032 million, and Empresa Eléctrica de Piura of Ch$ 3,538 million.
19
![]()
Partially offset by:
v Decrease in trade and other current payables of Ch$ 74,517 million mainly due to the decrease in goods and services account payables of Ch$ 123,756 million including Ch$ 91,594 million for the impact of the 250/13 resolution in Edesur. This was partially offset by increases in dividends payments of Ch$ 19,781 million, increase payments to fuel and gas suppliers of Ch$ 15,929 million and other accounts payables of Ch$ 14,394 million.
v Decrease in accounts payable to related companies of Ch$ 69,292 million mainly due to dividend payment to Endesa Latinoamérica of Ch$ 87,275 million, reduction in account payable to Cemsa of Ch$ 27,831 million due that currently Enersis consolidates it, and lower gas purchase to GNL Quintero of Ch$ 4,021 million. This was partially offset by the increase in loans with Endesa Latinoamérica due to the incorporation of Dock Sud to Enersis of Ch$ 50,837 million.
v Decrease of current tax liabilities of Ch$ 25,952 million due to the deacrease in tax payments in Emgesa of Ch$ 25,885 million, in Codensa of Ch$ 26,703 million, in Pehuenche of Ch$ 13,297 million and in Coelce of Ch$ 4,797 million, partially offset by increases in Enersis of Ch$ 23,173 million due to convertion effect in foreign investments and in Edesur of Ch$ 21,966 million due to resolution 250/13 effects.
Ø Non-Current liabilities decreased by Ch$ 568,071 million, equivalent to 14.4%, mainly explained by:
v Decrease in other non-current financial liabilities (borrowings and derivatives) of Ch$ 490,277 million, mainly in Enersis of Ch$ 301,741 million, due to transfer to the short-term of US$ denominated bond and and swap derivative, in Endesa Chile of Ch$ 99,956 million due to transfer to the short-term, in Codensa of Ch$ 72,445 million due to transfer to the short-term and conversion effect, in Emgesa of Ch$ 33,723 million due to transfer to the short-term and conversion effect, in Coelce of Ch$ 17,073 million due to transfer to the short-term and conversion effect. This was partially offset by the incorporation of Empresa Eléctrica de Piura of Ch$ 41,902 million.
v Decrease of deferred tax liabilities of Ch$ 95,162 million mainly due to compensation of deferred taxes of assets and liabilities of Brazilian subsidiaries Ampla, Coelce and CIEN of Ch$ 87,237 million and decreases in Endesa Chile of Ch$ 5,463 million and in Edegel of Ch$ 4,863 million.
This was partially offset by:
Increase in other long term provisions of Ch$ 16,541 million mainly due to legal claims provisions in Coelce of Ch$ 5,655 million, incorporation of Dock Sud of Ch$ 4,835 million, Edesur Ch$ 2,013 million, Ampla Ch$ 1,824 million and increases in dismantling provisions of Ch$ 1,958 million.
Equity increased by Ch$ 1,269,754 million when compared to the same period of 2012:
v The equity attributable to shareholders of the Company increased by Ch$ 2,164,180 million, explained mainly to the increase in issued capital of Ch$ 2,844,398 million, to the net income ofthe period of Ch 322,356 million, partially offset by final dividend of Ch$ 75,470 million and negative reserves of Ch$ 927,104 million. The variation in reserves is explained mainly by the effect on reserves of the difference between the book value and the value of the assets contributed in the capital increase operation of Ch$ 855,970 million, conversion differences in the period of Ch$ 37,897 million, capital increase expenses of Ch 13,100 million net from the overprice obtained in the shares auction and positive hedge reserves of Ch$ 20,251 million.
20
![]()
v Non-controlling interest decreased by Ch$ 894,426 million, explained mainly by the reduction of minority part due to the contribution in kind of the capital increase operation of Ch$ 1,073,521 million, partially offset by the comprehensive result of the period of Ch$ 179,095 million.
Debt Maturity with Third Parties, ThousandUS$
Table 7 |
|
|
|
|
|
|
|
(Thousand US$) | 2013 | 2014 | 2015 | 2016 | 2017 | Balance | TOTAL |
Chile | 418,641.2 | 743,331.2 | 224,629.2 | 447,420.5 | 18,356.9 | 930,364.9 | 2,782,744.0 |
Enersis | 2,527.8 | 578,365.0 | 5,575.8 | 432,429.1 | 6,235.4 | 33,662.8 | 1,058,796.0 |
Chilectra | 1.3 | - | - | - | - | - | 1.3 |
Endesa Chile | 416,112.1 | 164,966.1 | 219,053.4 | 14,991.4 | 12,121.5 | 896,702.1 | 1,723,946.7 |
Argentina | 255,098.1 | 171,061.5 | 18,812.7 | 9,704.3 | - | - | 454,676.6 |
Edesur | 25,626.4 | 11,042.4 | 4,454.3 | - | - | - | 41,123.1 |
Costanera | 173,625.8 | 21,558.5 | 468.1 | - | - | - | 195,652.4 |
Endesa Argentina | 1,837.4 | - | - | - | - | - | 1,837.4 |
Docksud | 43,033.7 | 119,778.5 | - | - | - | - | 162,812.2 |
Cemsa | - | - | - | - | - | - | - |
Chocón | 10,974.9 | 18,407.5 | 13,890.2 | 9,704.3 | - | - | 52,976.8 |
Hidroinvest | - | 274.6 | - | - | - | - | 274.6 |
Peru | 36,428.9 | 121,326.8 | 93,587.2 | 99,675.8 | 89,494.1 | 295,630.8 | 736,143.5 |
Edelnor | 19,780.1 | 60,896.0 | 48,685.5 | 30,625.4 | 30,099.3 | 163,646.2 | 353,732.6 |
Edegel | 14,668.3 | 52,223.6 | 36,218.5 | 59,863.5 | 49,675.2 | 81,248.7 | 293,897.9 |
Piura | 1,980.5 | 8,207.1 | 8,683.1 | 9,186.8 | 9,719.6 | 50,735.9 | 88,513.0 |
Brazil | 149,012.6 | 153,906.1 | 129,985.0 | 199,021.1 | 197,390.7 | 238,180.1 | 1,067,495.7 |
Endesa Brasil | - | - | - | - | - | - | - |
Coelce | 59,259.8 | 88,462.2 | 37,909.4 | 87,070.9 | 63,231.8 | 79,011.7 | 414,945.8 |
Ampla | 82,616.6 | 50,400.4 | 75,942.0 | 104,281.2 | 125,861.9 | 155,291.4 | 594,393.4 |
Cachoeira | - | - | - | - | - | - | - |
Cien | - | - | - | - | - | - | - |
Fortaleza | 7,136.2 | 15,043.5 | 16,133.6 | 7,669.0 | 8,297.1 | 3,877.0 | 58,156.5 |
Ctm | - | - | - | - | - | - | - |
Tesa | - | - | - | - | - | - | - |
Colombia | 83,462.9 | 203,037.8 | 150,682.6 | 96,250.2 | 312,165.2 | 1,048,781.8 | 1,894,380.5 |
Codensa | 83,462.9 | 129,600.8 | - | 75,168.5 | 202,954.9 | 41,472.3 | 532,659.4 |
Emgesa | - | 73,437.0 | 150,682.6 | 21,081.7 | 109,210.3 | 1,007,309.5 | 1,361,721.1 |
TOTAL | 942,644 | 1,392,663 | 617,697 | 852,072 | 617,407 | 2,512,958 | 6,935,440 |
21
![]()
Debt Maturity with Third Parties, Million Ch$
Table 7.1 |
|
|
|
|
|
|
|
(Million Ch$) | 2013 | 2014 | 2015 | 2016 | 2017 | Balance | TOTAL |
Chile | 212,318 | 376,988 | 113,923 | 226,914 | 9,310 | 471,844 | 1,411,296 |
Enersis | 1,282 | 293,324 | 2,828 | 219,311 | 3,162 | 17,072 | 536,979 |
Chilectra | 1 | - | - | - | - | - | 1 |
Endesa Chile | 211,035 | 83,664 | 111,095 | 7,603 | 6,148 | 454,771 | 874,317 |
Argentina | 129,376 | 86,756 | 9,541 | 4,922 | - | - | 230,594 |
Edesur | 12,997 | 5,600 | 2,259 | - | - | - | 20,856 |
Costanera | 88,056 | 10,934 | 237 | - | - | - | 99,227 |
Endesa Argentina | 932 | - | - | - | - | - | 932 |
Docksud | 21,825 | 60,747 | - | - | - | - | 82,572 |
Cemsa | - | - | - | - | - | - | - |
Chocón | 5,566 | 9,336 | 7,045 | 4,922 | - | - | 26,868 |
Hidroinvest | - | 139 | - | - | - | - | 139 |
Peru | 18,475 | 61,532 | 47,464 | 50,552 | 45,388 | 149,932 | 373,343 |
Edelnor | 10,032 | 30,884 | 24,691 | 15,532 | 15,265 | 82,995 | 179,399 |
Edegel | 7,439 | 26,486 | 18,369 | 30,360 | 25,193 | 41,206 | 149,053 |
Piura | 1,004 | 4,162 | 4,404 | 4,659 | 4,929 | 25,731 | 44,890 |
Brazil | 75,573 | 78,055 | 65,923 | 100,936 | 100,109 | 120,795 | 541,391 |
Endesa Brasil | - | - | - | - | - | - | - |
Coelce | 30,054 | 44,864 | 19,226 | 44,159 | 32,069 | 40,072 | 210,444 |
Ampla | 41,900 | 25,561 | 38,515 | 52,887 | 63,832 | 78,758 | 301,453 |
Cachoeira | - | - | - | - | - | - | - |
Cien | - | - | - | - | - | - | - |
Fortaleza | 3,619 | 7,629 | 8,182 | 3,889 | 4,208 | 1,966 | 29,495 |
Ctm | - | - | - | - | - | - | - |
Tesa | - | - | - | - | - | - | - |
Colombia | 42,329 | 102,973 | 76,420 | 48,814 | 158,318 | 531,900 | 960,754 |
Codensa | 42,329 | 65,728 | - | 38,122 | 102,931 | 21,033 | 270,144 |
Emgesa | - | 37,244 | 76,420 | 10,692 | 55,387 | 510,867 | 690,610 |
TOTAL | 478,071 | 706,303 | 313,271 | 432,137 | 313,124 | 1,274,472 | 3,517,378 |
Evolution Of Key Financial Ratios
Table 8 |
|
|
|
|
|
Indicator | Unit | As of June 30, 2013 | As of Dec 31, 2012 | Var 2012-2013 | Chg % |
Liquidity | Times | 1.21 | 0.98 | 0.23 | 23.5% |
Acid ratio test * | Times | 1.19 | 0.94 | 0.25 | 26.6% |
Working capital | Million Ch$ | 567,838 | (56,542) | 624,379 | 1104.3% |
Working capital | Thousand US$ | 1,119,642 | (111,487) | 1,231,129 | 1104.3% |
Leverage ** | Times | 0.73 | 0.90 | (0.17) | (18.9%) |
Short-term debt | % | 44.2 | 37.3 | 6.87 | 18.4% |
Long-term debt | % | 55.8 | 62.7 | (6.87) | (11.0%) |
* (Current assets net of inventories and prepaid expenses) / Current liabilities | |||||
** Total debt / (equity + minority interest) | |||||
|
|
|
|
|
|
Table 8.1 |
|
|
|
|
|
Indicator | Unit | 1H 2013 | 1H 2012 | Var 2012-2013 | Chg % |
Financial expenses coverage * | Times | 5.3 | 3.7 | 1.53 | 41.1% |
Op. income / Op. rev. | % | 27.4 | 21.7 | 5.7 | 26.5% |
ROE ** | % | 10.9 | 8.7 | 2.1 | 24.5% |
ROA ** | % | 7.8 | 6.4 | 1.4 | 21.7% |
* EBITDA / Financial costs ** Annualized figures |
|
| |||
|
| ||||
22
![]()
The liquidity ratio as of June 30, 2013 was 1.21 times, showing a 23.5% increase compared to June 30, 2012. This reflects the cash received in the capital increase operation ended on March 28, 2013 which leaves the company in an excellent liquidity position.
The leverage ratio is 0.73 times as of June 30, 2013, reducing by 18.9% compared to June 30, 2012, which is a consequence of the equity increase due to the capital increase operation.
The financial expenses coverage shows an increase of 1.53 times, equivalent to 41.2%, moving from 3.72 times as of June 30, 2012 to 5.25 times as of June 30, 2013. This is the result of the increase in EBITDA and the decrease in the company’s financial cost in this period.
The profitability indicator, operating income over operating revenues, increased 26.5% to 27.4% as of June 30, 2013.
On the other hand, the annualized return on equity of the shareholders of the Company is 10.9%, with a 24.5% increase compared to June 30, 2012 when it was 8.7%. This was a consequence of the increase in shareholder’s equity due to the capital increase operaion, and the better results of the period.
The annualized return on assets moved from 6.4% as of June 30, 2012 to 7.8% in June 30, 2013 as a result of the increase of the company’s assets mainly due to the capital increase operation, and to the better result obtained this period.
23
![]()
Consolidated Statements of Cash Flows Analysis
Under IFRS
Table 9 | ||||||
CASH FLOW | (Million Ch$) |
| (Thousand US$) | |||
| 1H 2013 | 1H 2012 | Var 2012-2013 | Chg % | 1H 2013 | |
Collection classes provided by operating activities | ||||||
Proceeds from sales of goods and services | 3,403,040 | 3,901,455 | (498,415) | (12.8%) | 7,108,772 | |
Cash receipts from royalties, fees, commissions and other revenue | 54,000 | 39,315 | 14,684 | 37.4% | 112,802 | |
Receipts from contracts held for purposes of dealing or trading | - | - | - | - | ||
Receipts from premiums and claims, annuities and other benefits from policies written | 565 | 1,675 | (1,110) | (66.3%) | 1,180 | |
Other cash receipts from operating activities | 355,791 | 163,380 | 192,412 | 117.8% | 743,230 | |
Types of payments | ||||||
Payments to suppliers for goods and services | (1,887,887) | (2,146,488) | 258,602 | 12.0% | (3,943,696) | |
Payments from contracts held for dealing or trading | - | - | - | - | ||
Payments to and on behalf of employees | (238,500) | (217,802) | (20,698) | (9.5%) | (498,214) | |
Payments for premiums and claims, annuities and other policy benefits underwritten | (151) | (2,137) | 1,986 | 92.9% | (315) | |
Other payments for operating activities | (618,050) | (765,908) | 147,858 | 19.3% | (1,291,074) | |
Dividends paid | - | - | - | - | ||
Dividends received | - | - | - | - | ||
Payments of interest classified as operating | - | - | ||||
Proceeds of interest received classified as operating | - | - | - | - | ||
Income taxes refund (paid) | (267,481) | (328,957) | 61,476 | 18.7% | (558,753) | |
Other inflows (outflows) of cash | (116,787) | (108,278) | (8,508) | (7.9%) | (243,961) | |
Net cash flows from (used in) operating activities | 684,541 | 536,255 | 148,287 | 27.7% |
| 1,429,970 |
Cash flows from (used in) investing activities | ||||||
Cash flows from losing control of subsidiaries or other businesses | - | - | - | - | ||
Cash flows used for control of subsidiaries or other businesses | (1,362) | (4,590) | 3,228 | 70.3% | (2,845) | |
Acquisitions of associates | - | - | - | - | ||
Other cash receipts from sales of equity or debt instruments of other entities | 89,311 | - | 89,311 | 186,566 | ||
Other payments to acquire equity or debt instruments of other entities | (629,659) | - | (629,659) | (1,315,325) | ||
Other proceeds from the sale of interests in joint ventures | - | - | - | - | ||
Cash flows used for the purchase of non-controlling | - | - | - | - | ||
Loans to related companies | (2,397) | - | (2,397) | (5,007) | ||
Proceeds from sales of property, plant and equipment | 5,046 | 422 | 4,624 | 1095.8% | 10,541 | |
Purchase of property, plant and equipment | (297,827) | (237,641) | (60,187) | (25.3%) | (622,146) | |
Proceeds from sales of intangible assets | - | - | - | - | ||
Acquisitions of intangible assets | (81,126) | (96,345) | 15,219 | 15.8% | (169,468) | |
Proceeds from other long term assets. | - | - | - | - | ||
Purchase of other long-term assets | (1,772) | (1,776) | 4 | 0.2% | (3,702) | |
Other inflows (outflows) of cash | - | - | - | - | ||
Prepayments and third party loans | - | - | - | - | ||
Proceeds from prepayments reimbursed and third party loans | - | - | - | - | ||
Payments arising from futures contracts, forwards, options and swap | - | - | - | - | ||
Cash receipts from futures contracts, forwards, options and swap | - | - | - | - | ||
Proceeds from related | - | - | - | - | ||
Dividends received | 4,238 | 2,929 | 1,309 | 44.7% | 8,854 | |
Proceeds of interest received classified as operating | 38,985 | 33,412 | 5,574 | 16.7% | 81,438 | |
Income taxes refund (paid) | - | - | - | - | ||
Other inflows (outflows) of cash | (568) | (12) | (556) | (4696.2%) | (1,187) | |
Net cash flows from (used in) investing activities | (877,130) | (303,600) | (573,530) | (188.9%) |
| (1,832,279) |
Proceeds from shares issue | 1,142,754 | - | 1,142,754 | 2,387,152 | ||
Proceeds from issuance of other equity instruments | - | - | - | - | ||
Payments to acquire or redeem the shares of the entity | - | - | - | - | ||
Payments for other equity interests | - | - | - | - | ||
Total loan amounts from | 74,984 | 299,278 | (224,295) | (74.9%) | 156,637 | |
Proceeds from term loans | 45,001 | 221,927 | (176,927) | (79.7%) | 94,004 | |
Proceeds from short-term loans | 29,983 | 77,351 | (47,368) | (61.2%) | 62,632 | |
Repayments of borrowings | 693 | 11,985 | (11,292) | (94%) | 1,448 | |
Payments of loans | (145,664) | (421,912) | 276,248 | 65.5% | (304,283) | |
Payments of finance lease liabilities | (14,337) | (2,542) | (11,795) | (464.1%) | (29,949) | |
Repayment of loans to related companies | - | - | - | - | ||
Proceeds from government grants | - | - | - | - | ||
Dividends paid | (367,600) | (427,426) | 59,826 | 14.0% | (767,897) | |
Payments of interest classified as operating | (108,589) | (136,322) | 27,733 | 20.3% | (226,837) | |
Income taxes refund (paid) | - | - | - | - | ||
Other inflows (outflows) of cash | (23,339) | (21,948) | (1,391) | (6.3%) | (48,754) | |
Net cash flows from (used in) financing activities | 558,901 | (698,887) | 1,257,789 | 180.0% |
| 1,167,516 |
Net increase (decrease) in cash and cash equivalents, before the effect of changes in the exchange rate | 366,312 | (466,233) | 832,545 | 178.6% |
| 765,207 |
Effect of exchange rate changes on cash and cash equivalents | (14,041) | (30,924) | 16,883 | 54.6% | (29,331) | |
Increase (decrease) in cash and cash equivalents | 352,271 | (497,157) | 849,428 | 170.9% |
| 735,876 |
Cash and cash equivalents at beginning of period | 815,832 | 1,187,684 | (371,852) | (31.3%) | 1,704,230 | |
Cash and cash equivalents at end of period | 1,168,103 | 690,527 | 477,576 | 69.2% | 2,440,106 | |
24
![]()
The Company generated a positive net cash flow during the period of Ch$ 684,541 million, a 27.7% increase compared to first half 2012. This is mainly composed of cash receipts from sales and royalties of Ch$ 3,457,040 million and other operating flows of Ch$ 356,356 million, partially offset by payments to suppliers of Ch$ 1,887,887 million, other operation payments of Ch$ 1,002,468 million and payment to employees of Ch$ 238,500 million.
Investment activities generated a negative net cash flow of Ch$ 877,130 million, a decrease in cash of 188.9% or Ch$ 573,530 million compared to the first half 2012. These disbursements relate mainly to investments in deposits over 90 or more days of Ch$540,348 million, the acquisition of properties, plant and equipment of Ch$ 297,827 million, the incorporation of intangible assets (IFRIC 12) of Ch$ 81,126 million, offset in part by interests received of Ch$ 38,985 million and other cash inflows of Ch$ 3,186 million.
Financing activities generated a net positive cash flow of Ch$ 558,901 million, mainly due to the issuance of new shares of Ch$ 1,142,754 million and loan suscriptions of Ch$ 74,984 million. This was partially offset by dividends payment of Ch$ 367,600 million, loan payments of Ch$ 160,001 million, interest payments of Ch$ 108,589 million and other financing disbursements of Ch$ 22,646 million.
Cash Flow Received From Foreign Subsidiaries by Enersis, Chilectra and EndesaChile
Table 10 |
|
|
|
|
|
|
|
|
|
|
Cash Flow | Interest Received | Dividends Received | Capital Reductions | Others | Total Cash Received | |||||
(Thousand US$) | ||||||||||
| 1H 2013 | 1H 2012 | 1H 2013 | 1H 2012 | 1H 2013 | 1H 2012 | 1H 2013 | 1H 2012 | 1H 2013 | 1H 2012 |
Argentina | - | - | - | - | - | - | - | - | - | - |
Peru | - | - | 5,921.3 | 8,341.3 | - | - | - | - | 5,921.3 | 8,341.3 |
Brazil | - | - | - | - | - | - | - | - | - | - |
Colombia | - | - | 14,008.3 | 27,754.5 | - | - | - | - | 14,008.3 | 27,754.5 |
Others | - | - | - | - | - | - | - | - | - | - |
Total | - | - | 19,929.6 | 36,095.8 | - | - | - | - | 19,929.6 | 36,095.8 |
Source: Internal Financial Report
25
![]()
Table 11 |
|
|
|
|
|
|
|
|
|
| Payments for Additions of Fixed Assets |
| Depreciation | ||||||
|
|
|
|
|
|
|
|
|
|
| Million Ch$ |
| Thousand US$ |
| Million Ch$ |
| Thousand US$ | ||
| 1H 2013 | 1H 2012 |
| 1H 2013 |
| 1H 2013 | 1H 2012 |
| 1H 2013 |
Endesa Chile | 150,249 | 116,450 | 313,862 | 93,821 | 90,571 | 195,987 | |||
Cachoeira | 3,032 | 2,959 | 6,334 | 3,007 | 3,198 | 6,281 | |||
Endesa Fortaleza | 5,997 | 1,694 | 12,527 | 3,080 | 3,545 | 6,434 | |||
Cien | 3,176 | 1,452 | 6,634 | 6,980 | 7,631 | 14,581 | |||
Chilectra S.A. | 20,743 | 3,508 | 43,331 | 12,333 | 12,855 | 25,763 | |||
Edesur | 56,001 | 54,862 | 116,983 | 6,556 | 7,335 | 13,695 | |||
Edelnor | 22,809 | 19,333 | 47,647 | 11,650 | 10,967 | 24,336 | |||
Ampla (*) | 53,297 | 55,719 | 111,335 | 19,610 | 26,440 | 40,964 | |||
Coelce (*) | 27,829 | 40,626 | 58,133 | 14,022 | 16,712 | 29,291 | |||
Codensa | 33,826 | 30,623 | 70,661 | 31,216 | 33,741 | 65,209 | |||
Inmobiliaria Manso de Velasco Ltda. | 49 | 1,493 | 102 | 122 | 123 | 255 | |||
Enersis holding and investment companies | 1,945 | 722 | 4,063 | 735 | 663 | 1,535 | |||
Cemsa | - | - | - | 11 | - | 23 | |||
Dock Sud | - | - | - | 1,849 | - | 3,862 | |||
Piura | - | - | - | 623 | - | 1,301 | |||
Total | 378,953 | 329,441 |
| 791,613 |
| 205,615 | 213,781 |
| 429,519 |
(*) includes intangible assets concessions | |||||||||
The Main Risks associated to the activities of the Enersis Group
Commercial and Regulatory Risk
The Group’s activities are subject to a broad range of governmental standards and environmental regulations. Any modification of such standards and regulations may affect the Group’s activities, economic situation and operating results.
The Group’s distribution activity is subject to a wide range of rules regarding tariffs and other issues that govern their activities in each of the countries where it operates and which could modify distribution subsidiaries operating results.
The Group’s generation activity is subject to existing hydrological and weather conditions in the geographic zones in which the Group’s hydroelectric generating plants are located. Commercial policies have been planned in order to moderate the possible impact of changes in these variables.
Group’s activities are subject to certain environmental regulation which Enersis fulfills constantly. Modifications applied on such regulations may affect the operations, economic condition or the results of these operations.
Enersis and its operating subsidiaries are subject to environmental regulations which, among other things, require the company to conduct environmental impact studies for future projects, obtaining permits, licenses and other authorizations and the fulfillment of all requirements of those licenses, permits and norms. As any other regulated company, Enersis cannot guarantee:
· The approval from regulators of environmental impact studies.
· That public opposition may not cause delays or modifications to any proposed project and
26
![]()
· That laws or regulations may not change or be interpreted in a manner that could adversely affect the operations or the plans for companies in which Enersis or its subsidiaries hold investments.
The group’s commercial activity has been planned to moderate possible impacts resulting from changes in hydrological conditions.
Enersis group’s operations include hydroelectric generation and therefore depend on the hydrological conditions at any time in the broad geographical zones where its hydroelectric generation installations are located. If hydrological conditions produce droughts or other conditions that negatively affect hydroelectric generation, the results could be adversely affected. Enersis has therefore defined as an essential part of its commercial policy not to contract 100% of its total capacity. The electricity business is also affected by atmospheric conditions like average temperatures which govern consumption. The different weather conditions can produce differences in the margin obtained by the business.
Financial situation and the results from operations could be adversely affected if risk exposure weren’t efficiently managed in regards to interest rates, prices of commodities, and exchange rates.
Interest Rate Risk
Interest rate variations modify the fair value of those assets and liabilities that accrue a fixed interest rate, as well as the future flows of assets and liabilities pegged to a variable interest rate.
In compliance with our current interest rate hedging policy, the portion of fixed and/or hedged debt to the total net debt was 64% as of June 30, 2013 on a consolidated basis.
Depending on the Group’s estimates and debt structure objectives, hedging transactions take place hiring derivatives that mitigate these risks. Instruments currently used to accomplish the policy, are interest rate swaps.
The structure of Enersis’ financial debt sort by fixed, protected and variable interest rate, and after derivatives, is as follows:
Net Position:
| June. 30 2013 | Dic. 31 2012 |
% | % | |
Fixed Interest Rate | 64% | 60% |
Variable Interest Rate | 36% | 40% |
Total | 100% | 100% |
Exchange Rate Risk
The exchange rate risks are mainly related to the following transactions:
- Foreign currency debts raised by the Group
- Payments for the acquisition of projects related materials to be made on international markets.
- Group‘s’ incomes directly linked to the evolution of the dollar, and
- Cash flows from our foreign subsidiaries exposed to exchange rate fluctuations.
27
![]()
In order to mitigate exchange rate risks, Enersis’ exchange rate hedging policy is based on cash flows and it strives to maintain a balance between dollar indexed flows and the asset and liability levels in such currency. Crosscurrency swaps and exchange rate forwards are the instruments currently used in compliance with this policy. Likewise, the policy looks to refinance debts in each company’s functional currency.
Commodities Risk
Enersis is exposed to price fluctuation risk on some commodities, basically through
- Fuel purchases for the electricity generation and also,
- Energy transactions in the local markets.
In order to reduce risks in extreme drought conditions, the company has designed a trading policy that defines sales commitment levels consistent with its generating plants’ firm energy in a dry year, including risk mitigation clauses in some unregulated clients’ contracts.
In view of the operative conditions by the electricity generation market in Chile has experienced, like extreme drought and rising oil prices, the company has decided to hire a derivative to place a cap on the Brent price for consumption. As of June 30, 2013 there are no outstanding coverage instruments and instruments taken in the past have been specific and for no considerable monetary amounts. Market and operative conditions will be constantly analyzed to adjust the volume hedged or take new hedges for the following months.
Liquidity Risk
In engaging committed long term credit facilities and short term financial investments the Group maintains a consistent liquidity policy, for the amounts required to support projected needs for the period, contingent with the situation and the expectations in the debt and capital markets.
As of June 30, 2013, the Enersis Group held liquidity in the amount of Ch$ 1,168,103 million in Cash and Cash Equivalent and Ch$ 214,805 million in committed long term credit lines. As of December 31, 2012, the Enersis Group held liquidity in the amount of Ch$ 815,832 million in Cash and Cash Equivalent and Ch$ 240,680 million in committed long term credit lines.
Credit Risk
Credit risk in accounts receivable, originating from trading activities, has been historically very limited given that the short term collection conditions with customers doesn’t allow them to individually accumulate significant amounts. Additionally, in the case of the so-called “unregulated customers” of our electricity generation and distribution business, a formal procedure is applied to control the credit risk, using a systematic evaluation of our counterparties, index definition and credit risk factors by virtue of which the contracts are approved or additional guarantee requirements are defined.
Furthermore, in our electricity generating business, in the event of non-payment, some countries allow power supply cut-offs, and in almost all contracts a lack of payment is established as cause for contract termination. For this purpose, credit risks are constantly monitored and the maximum amounts exposed to payment risks are measured, which are limited.
In turn, in our electricity distribution business, the energy supply cut-off is a power held by our companies in case of default by our customers, applied in accordance with the applicable regulation in each country, enabling the credit risk evaluation and control process, which is also limited.
28
![]()
Surplus cash flow investments are placed in prime national and foreign financial entities (with an investment grade equivalent risk rating) with limits established for each entity.
In the selection of banks for investment, the Group considers those that hold two investment grade classifications, according to the three main international rating agencies (Moody’s, S&P and Fitch Ratings).
Positions are backed up by treasury bonds from the country of operations and instruments issued by the most reputable banks, favoring, wherever possible, the first ones.
Derivatives are engaged with highly solvent entities; about 80% of operations are conducted with entities that hold an A- or higher rating.
Risk Measurement
The Enersis Group measures the Value at Risk (VaR) of its debt and financial derivatives positions in order to guarantee that the risk taken by the company remains consistent with the risk exposure defined by Management, thus restricting the volatility of its financial results.
The positions portfolio used in the calculations of the current Value at Risk is comprised of debt and financial derivatives.
The calculated Value at Risk represents the possible value loss of the aforementioned positions portfolio over one day time horizon with 95% of confidence.
The volatility of the risk variables that affect the value of the positions portfolio has been studied, including:
- The U.S. dollar Libor interest rate.
- The usual banking local indexes for debts, taking into account the different currencies our companies operate under, and
- The exchange rates of the different currencies involved in the calculation.
The calculation of VaR is based on generating possible future scenarios (at one day) of market values (both spot and term) for the risk variables, using Bootstrapping methodology. The number of scenarios generated ensures compliance with the simulation convergence criteria. A matrix of volatilities and correlations between the various risk variables calculated based on the historical values of the logarithmic price return, has been applied to simulate the future price scenario.
Once the price scenarios have been obtained, the fair value of the portfolio is calculated using such scenarios, obtaining a distribution of possible values at one day. The one-day 95% confidence VaR number is calculated as the 5% percentile of the potential increases in the fair value of the portfolio in one day.
The various debt positions and financial derivatives included in the calculation have been valued consistently using the financial capital calculation methodology reported to Management.
Taking in consideration the above mentioned hypotheses, the breakdown for VaR in every mentioned type of positions is the following:
29
![]()
Financial Positions | June. 30 2013 | Dec. 31 2012 |
Th Ch$ | Th Ch$ | |
Interest Rate | 19,745,371 | 15,933,808 |
Exchange Rate | 4,101,720 | 2,346,380 |
Correlation | (932,656) | (468,249) |
Total | 22,914,526 | 17,811,939 |
Other Risks
A portion of Enersis and Endesa Chile’s debt is subject to cross default provisions. If certain defaults in debt of certain specific subsidiaries are not remedied within specified grace periods, a cross default could affect Endesa Chile and Enersis, and under certain scenarios, debts at the holding company level could be accelerated.
Nonpayment – after any applicable grace period – of the debts of Enersis and Endesa Chile, and in the case of Enersis, its subsidiaries Endesa Chile and Chilectra, with an individual principal amount outstanding in excess of US$ 50 million (or its equivalent in other currencies), and with a missed payment also in excess of US$ 50 million, could give rise to a cross default of several bank revolving debt facilities at the Endesa Chile and Enersis levels. Furthermore, some of these debt facilities are also subject to cross acceleration provisions in the event of a default in other debt of the companies mentioned above, for reasons other than payment default, for events such as bankruptcy, insolvency proceedings, and materially adverse governmental or legal actions, in all cases for amounts in excess of US$ 50 million.
Similarly, nonpayment – after any given applicable grace period - of the debts of Enersis and Endesa Chile or any of their Chilean subsidiaries, in single indebtedness in default with a principal in excess of US$ 30 million, could potentially give rise to a cross default of Enersis and Endesa Chile Yankee bonds.
Finally, in the case of local bonds of Enersis and Endesa Chile, prepayment is triggered only as a result of a default of the Issuer.
There are no clauses in the credit agreements by which changes in the corporate or debt classification of these companies from risk rating agencies could trigger prepayments
30
![]()
Argentina

Generation
In Argentina, the operating income for the period amounted to Ch$ 7,320 million, representing an increase of Ch$ 4,485 million when compared to the first half 2012. This is primarily explained by a Ch$ 28,191 million decrease in procurement and service costs, mainly explained by lower fuel consumption cost of Ch$ 32,758 million. This was partially offset by lower energy sales revenues of Ch$ 29,497 million
EBITDA from operations in Argentina amounted to Ch$ 19,101 million.
Endesa Costanera
Endesa Costanera’s operating income increased by Ch$ 9,713 million, showing a lower negative result of Ch$ 1,777 million in the second quarter of 2013. This is mainly explained by a 26.1% reduction in fuel consumption cost, partially offset by a 21.7% reduction in energy sales revenues.
Physical sales reached 3,898 GWh, 14.1% lower than in the same period of 2012.
The net effect of translating the financial statements from Argentine pesos to Chilean pesos in both periods led to a 16.8% decrease in Chilean pesos in June 2013, when compared to June 2012.
Table 12 |
|
|
|
|
|
|
Endesa Costanera | Million Ch$ |
|
| Thousand US$ | ||
| 1H 2013 | 1H 2012 | Var 2012-2013 | Chg% |
| 1H 2013 |
Operating Revenues | 133,089 | 157,992 | (24,903) | (15.8%) |
| 278,017 |
Procurement and Services | (111,528) | (144,119) | 32,592 | 22.6% |
| (232,975) |
Contribution Margin | 21,562 | 13,873 | 7,689 | 55.4% |
| 45,041 |
Other Costs | (14,785) | (14,622) | (163) | (1.1%) |
| (30,885) |
Gross Operating Income (EBITDA) | 6,777 | (749) | 7,526 | 1004.5% |
| 14,156 |
Depreciation and Amortization | (8,554) | (10,741) | 2,187 | 20.4% |
| (17,868) |
Operating Income | (1,777) | (11,490) | 9,713 | 84.5% |
| (3,712) |
Figures may differ from those accounted under Argentine GAAP. |
|
|
| |||
|
|
|
|
|
| |
Table 12.1 |
|
|
|
|
|
|
Endesa Costanera | 1H 2013 | 1H 2012 | Var 2012-2013 | Chg% |
|
|
GWh Produced | 3,644 | 4,424 | (780) | (17.6%) |
|
|
GWh Sold | 3,898 | 4,537 | (639) | (14.1%) |
|
|
Market Share | 6.4% | 7.6% | (1.1) pp. |
|
|
|
31
![]()
El Chocón
El Chocón’s operating income reached Ch$ 5,251 million, a 58.3% decrease when compared to the first half of 2013. This result is mainly explained by a 31.4% decline in energy sales revenues, slightly offset by lower other procurement and service costs of 39.0%.
Physical sales decreased 7.5%, reaching 1,386 GWh.
The net effect of translating the financial statements from Argentine pesos to Chilean pesos in both periods led to a 16.8% decrease in Chilean pesos in June 2013, when compared to June 2012.
Table 13 |
|
|
|
|
|
|
El Chocón | Million Ch$ |
|
| Thousand US$ | ||
| 1H 2013 | 1H 2012 | Var 2012-2013 | Chg% |
| 1H 2013 |
Operating Revenues | 16,821 | 24,538 | (7,717) | (31.4%) |
| 35,138 |
Procurement and Services | (6,639) | (7,057) | 418 | 5.9% |
| (13,869) |
Contribution Margin | 10,182 | 17,481 | (7,299) | (41.8%) |
| 21,269 |
Other Costs | (3,792) | (3,529) | (263) | (7.5%) |
| (7,921) |
Gross Operating Income (EBITDA) | 6,390 | 13,952 | (7,562) | (54.2%) |
| 13,348 |
Depreciation and Amortization | (1,139) | (1,356) | 217 | 16.0% |
| (2,378) |
Operating Income | 5,251 | 12,596 | (7,345) | (58.3%) |
| 10,969 |
Figures may differ from those accounted under Argentine GAAP. |
|
|
| |||
|
|
|
|
|
|
|
Table 13.1 |
|
|
|
|
|
|
El Chocón | 1H 2013 | 1H 2012 | Var 2012-2013 | Chg% |
|
|
GWh Produced | 837 | 1,295 | (459) | (35.4%) |
|
|
GWh Sold | 1,386 | 1,498 | (112) | (7.5%) |
|
|
Market Share | 2.3% | 2.5% | (0.2) pp. |
|
|
|
32
![]()
Dock Sud
Since the second quarter of 2013, Dock Sud is consolidated by Enersis as a consequence of the incorporporation of Cono Sur assets to the company after the capital increase operation.
Considering only the second quarter of this year, Operating Income of the company was Ch$ 2,610 million while Ebitda reached Ch$ 4,496 million.
Table 14 |
|
|
|
|
|
|
Dock Sud | Million Ch$ |
|
| Thousand US$ | ||
| 2Q 2013 |
| Var 2012-2013 | Chg% |
| 1H 2013 |
Operating Revenues | 13,376 |
|
|
|
| 27,942 |
Procurement and Services | (6,302) |
|
|
|
| (13,165) |
Contribution Margin | 7,074 |
|
|
|
| 14,777 |
Other Costs | (2,615) |
|
|
|
| (5,463) |
Gross Operating Income (EBITDA) | 4,459 |
|
|
|
| 9,314 |
Depreciation and Amortization | (1,849) |
|
|
|
| (3,863) |
Operating Income | 2,610 |
|
|
|
| 5,451 |
Figures may differ from those accounted under Argentine GAAP. |
|
|
| |||
|
|
|
|
|
| |
Table 14.1 |
|
|
|
|
|
|
Dock Sud | 2Q 2013 |
|
| Chg% |
|
|
GWh Produced | 1,024 |
|
|
|
|
|
GWh Sold | 1,176 |
|
|
|
|
|
Market Share | 1.9% |
|
|
|
|
|
33
![]()
Distribution
Edesur
On May 7, 2013, was approved the resolution 250/2013 of the Secretariat of energy, which recognizes the revenues of costs not transferred to tariff since 2007 regarding the application of the cost monitoring mechanism (MMC, in its Spanish acronym). These revenues were compensated with the amounts already collected by the Company from the rational use of electric energy program (PUREE, in its Spanish acronym) and with other obligations with CAMMESA. This revenues amounted to Ch$ 193,798 million, which primary explains the Ch$ 166,161 million increase in Ebitda and the Ch$ 171,793 million increase in Net Income.
Procurement and service costs decreased by Ch$ 6,467, mainly explained by lower energy purchases costs of Ch$ 7,034 million.
Physical sales decreased by 0.2% reaching 8,686 GWh. The energy losses in this period were 10.7%, 0.1 p/p higher than 1H 2012, and the number of customers increased by 39 thousand new customers, exceeding 2.4 million.
The net effect of translating the financial statements from Argentine pesos to Chilean pesos in both periods led to a 16.8% decrease in Chilean pesos in June 2013, when compared to June 2012.
Table 15 |
|
|
|
|
|
|
Edesur | Million Ch$ |
|
| Thousand US$ | ||
| 1H 2013 | 1H 2012 | Var 2012-2013 | Chg% |
| 1H 2013 |
Operating Revenues | 343,754 | 165,014 | 178,740 | 108.3% |
| 718,083 |
Procurement and Services | (83,354) | (89,821) | 6,467 | 7.2% |
| (174,122) |
Contribution Margin | 260,399 | 75,193 | 185,207 | 246.3% |
| 543,961 |
Other Costs | (111,464) | (92,418) | (19,046) | (20.6%) |
| (232,842) |
Gross Operating Income (EBITDA) | 148,936 | (17,225) | 166,161 | 964.7% |
| 311,119 |
Depreciation and Amortization | (7,252) | (7,830) | 577 | 7.4% |
| (15,150) |
Operating Income | 141,683 | (25,054) | 166,738 | 665.5% |
| 295,969 |
Figures may differ from those accounted under Argentine GAAP. |
|
| ||||
|
|
|
|
|
|
|
Table 15.1 |
|
|
|
|
|
|
Edesur | 1H 2013 | 1H 2012 | Var 2012-2013 | Chg% |
| |
Customers (Th) | 2,430 | 2,391 | 39 | 1.6% |
|
|
GWh Sold | 8,686 | 8,672 | 14 | 0.2% |
|
|
Clients/Employee | 825 | 839 | (15) | (1.8%) |
|
|
Energy Losses % | 10.7% | 10.6% | 0.1% |
|
|
|
34
![]()
Brazil

Endesa Brasil
Operating Income amounted to Ch$ 227,206 million, 11.4% lower than the Ch$ 256,557 million reported in same period 2012.
Table 16 |
|
|
|
|
|
|
Endesa Brasil | (Million Ch$) |
|
| (Thousand US$) | ||
| 1H 2013 | 1H 2012 | Var 2012-2013 | Chg % |
| 1H 2013 |
Sales | 858,430 | 1,021,469 | (163,039) | (16.0%) |
| 1,793,215 |
Other operating income | 76,836 | 75,894 | 942 | 1.2% |
| 160,506 |
Total Revenues | 935,266 | 1,097,363 | (162,097) | (14.8%) |
| 1,953,722 |
Procurements and Services | (528,840) | (642,182) | 113,342 | 17.6% |
| (1,104,720) |
Contribution Margin | 406,426 | 455,181 | (48,756) | (10.7%) |
| 849,002 |
Other Costs | (120,697) | (128,624) | 7,927 | 6.2% |
| (252,130) |
Gross Operating Income (EBITDA) | 285,729 | 326,558 | (40,829) | (12.5%) |
| 596,872 |
Depreciation and Amortization | (46,830) | (57,527) | 10,697 | 18.6% |
| (97,825) |
Reversal of impairment profit (loss) recognized in profit or loss | (11,693) | (12,474) | 781 | 6.3% |
| (24,426) |
Operating Income | 227,206 | 256,557 | (29,351) | (11.4%) |
| 474,621 |
Net Financial Income | (3,417) | (48,486) | 45,069 | 93.0% |
| (7,138) |
Financial income | 79,756 | 56,725 | 23,031 | 40.6% |
| 166,606 |
Financial expenses | (82,344) | (103,012) | 20,668 | 20.1% |
| (172,012) |
Income (Loss) for indexed assets and liabilities | - | - | - |
|
| - |
Foreign currency exchange differences, net | (829) | (2,199) | 1,370 | 62.3% |
| (1,732) |
Gains | 2,092 | 2,641 | (549) | (20.8%) |
| 4,370 |
Losses | (2,921) | (4,840) | 1,919 | 39.6% |
| (6,102) |
Net Income from Related Comp. Cons. by the Prop. Eq.Method | - | 0 | (0) | (100.0%) |
| - |
Net Income from Other Investments | 0 | - | 0 |
|
| 0 |
Net Income from Sales of Assets | - | - | - |
|
| - |
Net Income before Taxes | 223,789 | 208,070 | 15,718 | 7.6% |
| 467,483 |
Income Tax | (51,151) | (46,874) | (4,277) | (9.1%) |
| (106,851) |
NET INCOME | 172,638 | 161,197 | 11,441 | 7.1% |
| 360,632 |
Net Income Attributable to Owners of the Company | 120,266 | 117,709 | 2,557 | 2.2% |
| 251,229 |
Net Income Attributable to Minority Interest | 52,372 | 43,488 | 8,884 | 20.4% |
| 109,403 |
Generation
In Brazil, the operating income of our subsidiaries amounted to Ch$ 77,575 million, 11.6% lower than in same period of last year, when operating results amounted to Ch$ 87,717 million.
Cachoeira Dourada
The operating income of Cachoeira Dourada was Ch$ 40,152 million, 14.3% lower than in first half 2012. This is mainly explained by lower energy sales revenues of Ch$ 10,122 million, equivalent to 14.0% decrease. This was partially offset by decreases of 24.2% and 28.7% in transportation costs and other procurement and service cost respectively.
Physical sales showed a decrease of 15.4%, reaching 1,814 Gwh in the period.
The effect of converting these financial statements from Brazilian reals to Chilean pesos in both periods was a 10.9% reduction in Chilean peso terms in June 2013 when compared to June 2012.
35
![]()
Table 17 |
|
|
|
|
|
|
Cachoeira | Million Ch$ |
|
| Thousand US$ | ||
| 1H 2013 | 1H 2012 | Var 2012-2013 | Chg% |
| 1H 2013 |
Operating Revenues | 62,070 | 72,195 | (10,125) | (14.0%) |
| 129,661 |
Procurement and Services | (15,854) | (18,969) | 3,115 | 16.4% |
| (33,118) |
Contribution Margin | 46,216 | 53,226 | (7,010) | (13.2%) |
| 96,543 |
Other Costs | (3,058) | (3,137) | 79 | 2.5% |
| (6,388) |
Gross Operating Income (EBITDA) | 43,159 | 50,089 | (6,931) | (13.8%) |
| 90,156 |
Depreciation and Amortization | (3,007) | (3,240) | 233 | 7.2% |
| (6,281) |
Operating Income | 40,152 | 46,850 | (6,698) | (14.3%) |
| 83,875 |
Figures may differ from those accounted under Brazilian GAAP. |
|
|
|
| ||
|
|
|
|
|
|
|
Table 17.1 |
|
|
|
|
|
|
Cachoeira | 1H 2013 | 1H 2012 | Var 2012-2013 | Chg% |
|
|
GWh Produced | 936 | 1,879 | (943) | (50.2%) |
|
|
GWh Sold | 1,814 | 2,145 | (331) | (15.4%) |
|
|
Market Share | 0.8% | 1.0% | (0.2) pp. |
|
|
|
Fortaleza (cgtf)
The operating income of Endesa Fortaleza (CGTF) amounted to Ch$ 22,478 million, evidencing a 6.1% decrease as compared to the same period in previous year. This is mainly explained by increases in fuel purchases costs of Ch$ 11,032 million and in other procurement and service costs of Ch$ 8,720 million. This was partially offset by an increase in operating revenues of Ch$ 19,474 million, due to a 29.6% increase in energy sales revenues.
Physical sales of the period reached 1,623 GWh, 16.0% higher than in the first half of 2012.
The effect of converting these financial statements from Brazilian reals to Chilean pesos in both periods was a 10.9% reduction in Chilean peso terms in June 2013 when compared to June 2012.
Table 18 |
|
|
|
|
|
|
Fortaleza | Million Ch$ |
|
| Thousand US$ | ||
| 1H 2013 | 1H 2012 | Var 2012-2013 | Chg% |
| 1H 2013 |
Operating Revenues | 85,189 | 65,715 | 19,474 | 29.6% |
| 177,955 |
Procurement and Services | (56,589) | (34,261) | (22,329) | (65.2%) |
| (118,212) |
Contribution Margin | 28,599 | 31,454 | (2,855) | (9.1%) |
| 59,743 |
Other Costs | (3,041) | (3,945) | 904 | 22.9% |
| (6,352) |
Gross Operating Income (EBITDA) | 25,559 | 27,510 | (1,951) | (7.1%) |
| 53,391 |
Depreciation and Amortization | (3,080) | (3,583) | 503 | 14.0% |
| (6,435) |
Operating Income | 22,478 | 23,926 | (1,448) | (6.1%) |
| 46,956 |
Figures may differ from those accounted under Brazilian GAAP. |
|
|
|
| ||
|
|
|
|
|
|
|
Table 18.1 |
|
|
|
|
|
|
Fortaleza | 1H 2013 | 1H 2012 | Var 2012-2013 | Chg% |
|
|
GWh Produced | 1,280 | 482 | 798 | 165.5% |
|
|
GWh Sold | 1,623 | 1,398 | 224 | 16.0% |
|
|
Market Share | 0.7% | 0.6% | 0.1 pp. |
|
|
|
36
![]()
Transmission
CIEN
Our transmission subsidiary, CIEN, showed a decrease in operating income of Ch$ 2,198 million, reaching Ch$ 16,472 million . This is explained by a decrease of 9.3% in sales revenues, partially offset by decreases of 16.3% and 7.9% in energy purchases costs and other procurement and service costs respectively.
The effect of converting these financial statements from Brazilian reals to Chilean pesos in both periods was a 10.9% reduction in Chilean peso terms in June 2013 when compared to June 2012.
Table 19 |
|
|
|
|
|
|
Cien (*) | Million Ch$ |
|
| Thousand US$ | ||
| 1H 2013 | 1H 2012 | Var 2012-2013 | Chg% |
| 1H 2013 |
Operating Revenues | 34,131 | 37,644 | (3,513) | (9.3%) |
| 71,298 |
Procurement and Services | (6,519) | (7,368) | 849 | 11.5% |
| (13,618) |
Contribution Margin | 27,612 | 30,277 | (2,664) | (8.8%) |
| 57,680 |
Other Costs | (4,160) | (4,228) | 68 | 1.6% |
| (8,689) |
Gross Operating Income (EBITDA) | 23,452 | 26,049 | (2,596) | (10.0%) |
| 48,991 |
Depreciation and Amortization | (6,980) | (7,379) | 399 | 5.4% |
| (14,582) |
Reversal of impairment profit (loss) recognized in profit or loss | - | - | - |
|
| - |
Operating Income | 16,472 | 18,670 | (2,198) | (11.8%) |
| 34,409 |
Figures may differ from those accounted under Brazilian GAAP. |
|
|
| |||
Distribution
In Brazil, the operating income of our distribution subsidiaries amounted to Ch$ 150,367 million, which is 11.6% lower than that obtained inthe first half of 2012.
Ampla
Ampla’s operating income amounted to Ch$ 104,041 million, which compared to same period in previous year represents an increase of 20.4%. This is due to a decrease in procurement and services costs of Ch$ 95,376 million, explained by Ch$ 52,903 million lower other procurement and services costs and a Ch$ 40,462 million reduction in energy purchases cost. This was partially offset by lower operating revenues of Ch$86,570 million, mainly due to lower energy sales revenues of Ch$ 73,513 million.
Physical sales grew by 2.8%, reaching 5,538 GWh. Energy losses increased by 0.4 p.p., from 19.5% to 19.9%. The number of Ampla’s customers increased by 88 thousand, reaching almost 2.8 million customers.
The effect of converting these financial statements from Brazilian reals to Chilean pesos in both periods was a 10.9% reduction in Chilean peso terms in June 2013 when compared to June 2012.
37
![]()
Table 20 |
|
|
|
|
|
|
Ampla | Million Ch$ |
|
| Thousand US$ | ||
| 1H 2013 | 1H 2012 | Var 2012-2013 | Chg% |
| 1H 2013 |
Operating Revenues | 473,152 | 559,722 | (86,570) | (15.5%) |
| 988,389 |
Procurement and Services | (278,942) | (374,319) | 95,376 | 25.5% |
| (582,696) |
Contribution Margin | 194,209 | 185,403 | 8,806 | 4.7% |
| 405,693 |
Other Costs | (61,174) | (63,746) | 2,572 | 4.0% |
| (127,789) |
Gross Operating Income (EBITDA) | 133,035 | 121,657 | 11,378 | 9.4% |
| 277,904 |
Depreciation and Amortization | (19,610) | (26,440) | 6,830 | 25.8% |
| (40,965) |
Reversal of impairment profit (loss) recognized in profit or loss | (9,384) | (8,812) | (572) | (6.5%) |
| (19,603) |
Operating Income | 104,041 | 86,406 | 17,635 | 20.4% |
| 217,337 |
Figures may differ from those accounted under Brazilian GAAP. |
|
|
| |||
|
|
|
|
|
|
|
Table 20.1 |
|
|
|
|
|
|
Ampla | 1H 2013 | 1H 2012 | Var 2012-2013 | Chg% |
|
|
Customers (Th) | 2,752 | 2,665 | 88 | 3.3% |
|
|
GWh Sold | 5,538 | 5,386 | 152 | 2.8% |
|
|
Clients/Employee | 2,417 | 2,239 | 177 | 7.9% |
|
|
Energy Losses % | 19.9% | 19.5% | 0.4 pp. |
|
|
|
Coelce
Coelce’s operating income decreased by 44.6% reaching Ch$ 46,325 million. This performance is mostly due to a Ch$ 82,840 million decrease in operating revenues, mainly due to lower energy sales revenues of Ch$ 79,981 million. This was partially offset by a Ch$ 31,387 million reduction in other procurement and services costs.
Physical sales amounted to 5,189 GWh, a 9.2% higher than in 1H 2012. Energy losses increased by 0.3 p.p. up to 12.5%. Coelce’s number of customers expanded by 137 thousand, reaching more than 3.4 million customers.
The effect of converting these financial statements from Brazilian reals to Chilean pesos in both periods was a 10.9% reduction in Chilean peso terms in June 2013 when compared to June 2012.
Table 21 |
|
|
|
|
|
|
Coelce | Million Ch$ |
|
| Thousand US$ | ||
| 1H 2013 | 1H 2012 | Var 2012-2013 | Chg% |
| 1H 2013 |
Operating Revenues | 338,329 | 421,170 | (82,840) | (19.7%) |
| 706,752 |
Procurement and Services | (230,235) | (267,752) | 37,517 | 14.0% |
| (480,948) |
Contribution Margin | 108,094 | 153,418 | (45,323) | (29.5%) |
| 225,804 |
Other Costs | (45,438) | (49,391) | 3,952 | 8.0% |
| (94,918) |
Gross Operating Income (EBITDA) | 62,656 | 104,027 | (41,371) | (39.8%) |
| 130,886 |
Depreciation and Amortization | (16,331) | (20,375) | 4,044 | 19.8% |
| (34,114) |
Operating Income | 46,325 | 83,652 | (37,327) | (44.6%) |
| 96,771 |
Figures may differ from those accounted under Brazilian GAAP. |
|
|
| |||
|
|
|
|
|
|
|
Table 21.1 |
|
|
|
|
|
|
Coelce | 1H 2013 | 1H 2012 | Var 2012-2013 | Chg% |
|
|
Customers (Th) | 3,427 | 3,291 | 137 | 4.1% |
|
|
GWh Sold | 5,189 | 4,753 | 436 | 9.2% |
|
|
Clients/Employee | 2,676 | 2,524 | 152 | 6.0% |
|
|
Energy Losses % | 12.5% | 12.2% | 0.3 pp. |
|
|
|
38
![]()
Chile

Generation
Endesa Chile
Consolidated Income Statement of Endesa Chile
Table 22 |
|
|
|
|
|
|
Endesa Chile | (Million Ch$) |
|
| (Thousand US$) | ||
| 1H 2013 | 1H 2012 | Var 2012-2013 | Chg % |
| 1H 2013 |
Sales | 1,004,213 | 1,126,363 | (122,150) | (10.8%) |
| 2,097,749 |
Other operating income | 11,583 | 1,134 | 10,450 | 921.9% |
| 24,197 |
Total Revenues | 1,015,797 | 1,127,497 | (111,700) | (9.9%) |
| 2,121,946 |
Procurements and Services | (532,591) | (679,683) | 147,092 | 21.6% |
| (1,112,555) |
Contribution Margin | 483,206 | 447,814 | 35,392 | 7.9% |
| 1,009,392 |
Other Costs | (100,810) | (98,788) | (2,022) | (2.0%) |
| (210,587) |
Gross Operating Income (EBITDA) | 382,396 | 349,026 | 33,370 | 9.6% |
| 798,805 |
Depreciation and Amortization | (93,856) | (90,177) | (3,679) | (4.1%) |
| (196,060) |
Reversal of impairment profit (loss) recognized in profit or loss | 38 | 23 | 16 | 68.7% |
| 80 |
Operating Income | 288,578 | 258,871 | 29,707 | 11.5% |
| 602,825 |
Net Financial Income | (65,557) | (69,147) | 3,589 | 5.2% |
| (136,946) |
Financial income | 5,743 | 11,244 | (5,501) | (48.9%) |
| 11,997 |
Financial expenses | (71,939) | (75,529) | 3,590 | 4.8% |
| (150,276) |
Income (Loss) for indexed assets and liabilities | (165) | (1,032) | 868 | 84.1% |
| (344) |
Foreign currency exchange differences, net | 803 | (3,829) | 4,632 | 121.0% |
| 1,678 |
Gains | 20,282 | 10,010 | 10,272 | 102.6% |
| 42,368 |
Losses | (19,479) | (13,840) | (5,639) | (40.7%) |
| (40,690) |
Net Income from Related Comp. Cons. by the Prop. Eq.Method | 59,655 | 62,520 | (2,864) | (4.6%) |
| 124,617 |
Net Income from Other Investments | 816 | 298 | 518 | 173.9% |
| 1,705 |
Net Income from Sales of Assets | 2,515 | 17 | 2,499 | 14989.9% |
| 5,255 |
Net Income before Taxes | 286,008 | 252,559 | 33,449 | 13.2% |
| 597,456 |
Income Tax | (90,240) | (78,152) | (12,088) | (15.5%) |
| (188,506) |
NET INCOME | 195,768 | 174,407 | 21,361 | 12.2% |
| 408,950 |
Net Income Attributable to Owners of the Company | 100,115 | 101,443 | (1,329) | (1.3%) |
| 209,134 |
Net Income Attributable to Minority Interest | 95,654 | 72,964 | 22,689 | 31.1% |
| 199,816 |
*Includes generation subsidiaries in Chile, Argentina, Colombia and Peru.
Chilean Operations
Operating income in Chile registered a 13.8% growth to reach Ch$ 49,970 million, while EBITDA increased by 17.1% totaling Ch$ 95,146 million as of June 2013. These better results in Chilean business were a consequence of lower fuel costs of Ch$ 55,345 million due to lower LNG price and higher coal generation. Additionnaly, lower energy purchases costs were recorded by Ch$ 49,204 million due to greater thermal generation related to the commissioning of Bocamina II power plant (+1,202 GWh), which allowed to compensate lower hydroelectric generation (drought) and to reduce physical energy purchases on the spot market. In addition, there were lower transportation costs of Ch$ 17,790 million.
The latter was partially offset by lower operating revenues of Ch$ 106,328 million owing to a 14.9% reduction in average energy sale price related to less contracts indexed to marginal cost. In addition, it is worth mentioning that in March 2012, a one-time extraordinary income of Ch$ 29,217 million was booked due to the agreement with CMPC in that period. Finally, we booked higher payroll expenses of Ch$ 7,060 million due to a staff increase and inflation salaries readjustment.
39
![]()
Table 23 |
|
|
|
|
|
|
Chilean Electricity Business | Million Ch$ |
|
| Thousand US$ | ||
| 1H 2013 | 1H 2012 | Var 2012-2013 | Chg% |
| 1H 2013 |
Operating Revenues | 419,742 | 526,070 | (106,328) | (20.2%) |
| 876,819 |
Procurement and Services | (272,893) | (395,740) | 122,846 | 31.0% |
| (570,060) |
Contribution Margin | 146,848 | 130,330 | 16,519 | 12.7% |
| 306,759 |
Other Costs | (51,702) | (49,072) | (2,631) | (5.4%) |
| (108,004) |
Gross Operating Income (EBITDA) | 95,146 | 81,258 | 13,888 | 17.1% |
| 198,755 |
Depreciation and Amortization | (45,175) | (37,343) | (7,832) | (21.0%) |
| (94,369) |
Operating Income | 49,970 | 43,915 | 6,056 | 13.8% |
| 104,386 |
|
|
|
|
|
|
|
|
|
|
|
|
|
|
Table 23.1 |
|
|
|
|
|
|
Chilean Electricity Business | 1H 2013 | 1H 2012 | Var 2012-2013 | Chg% |
|
|
GWh Produced | 9,109 | 9,030 | 79 | 0.9% |
|
|
GWh Sold | 9,543 | 10,157 | (614) | (6.0%) |
|
|
Market Share | 30.4% | 33.4% | (2.9) pp. |
|
|
|
Distribution
Chilectra
In Chile, our subsidiary Chilectra showed an operating income of Ch$ 69,550 million, which represents an increase of 2.7% when compared to 1H 2012. This performance is mainly due to a decrease of Ch$ 26,036 million in procurement and service costs, explained by a reduction of Ch$ 25,101 million in energy purchase costs. The latter was partially offset by a reduction of 4.7% in operating revenues, explained by Ch$ 28,205 milion lower energy sales revenues.
Energy losses were 5.4%, the same as in first half 2012. Physical energy sales increased by 4.6%, reaching 3,666 GWh.
The number of customers expanded by 29 thousand new customers, reaching almost 1.7 million during the present period.
40
![]()
Table 24 |
|
|
|
|
|
|
Chilectra | (Million Ch$) |
|
| (Thousand US$) | ||
| 1H 2013 | 1H 2012 | Var 2012-2013 | Chg % |
| 1H 2013 |
Sales | 465,905 | 489,586 | (23,681) | (4.8%) |
| 973,251 |
Other operating income | 5,362 | 4,737 | 625 | 13.2% |
| 11,202 |
Total Revenues | 471,267 | 494,323 | (23,056) | (4.7%) |
| 984,453 |
Procurements and Services | (342,232) | (368,267) | 26,036 | 7.1% |
| (714,904) |
Contribution Margin | 129,036 | 126,056 | 2,979 | 2.4% |
| 269,549 |
Other Costs | (43,149) | (41,186) | (1,963) | (4.8%) |
| (90,135) |
Gross Operating Income (EBITDA) | 85,887 | 84,871 | 1,016 | 1.2% |
| 179,413 |
Depreciation and Amortization | (13,422) | (13,756) | 334 | 2.4% |
| (28,039) |
Reversal of impairment profit (loss) recognized in profit or loss | (2,915) | (3,398) | 483 | 14.2% |
| (6,089) |
Operating Income | 69,550 | 67,716 | 1,834 | 2.7% |
| 145,286 |
Net Financial Income | 1,469 | 5,901 | (4,432) | (75.1%) |
| 3,069 |
Financial income | 3,820 | 5,558 | (1,738) | (31.3%) |
| 7,981 |
Financial expenses | (3,150) | (738) | (2,412) | (326.8%) |
| (6,581) |
Income (Loss) for indexed assets and liabilities | 254 | 939 | (685) | (72.9%) |
| 531 |
Foreign currency exchange differences, net | 545 | 142 | 403 | 283.9% |
| 1,138 |
Gains | 1,424 | 587 | 838 | 142.8% |
| 2,975 |
Losses | (879) | (445) | (435) | (97.7%) |
| (1,837) |
Net Income from Related Comp. Cons. by the Prop. Eq.Method | 90,649 | 23,575 | 67,073 | 284.5% |
| 189,360 |
Net Income from Other Investments | - | - | - |
|
| - |
Net Income from Sales of Assets | (7) | (75) | 69 | 91.1% |
| (14) |
Net Income before Taxes | 161,661 | 97,117 | 64,544 | 66.5% |
| 337,701 |
Income Tax | (18,190) | (13,490) | (4,701) | (34.8%) |
| (37,998) |
NET INCOME | 143,471 | 83,627 | 59,843 | 71.6% |
| 299,703 |
Net Income Attributable to Owners of the Company | 143,471 | 83,627 | 59,843 | 71.6% |
| 299,702 |
Net Income Attributable to Minority Interest | - | - | - | - |
| - |
Table 24.1 |
|
|
|
| ||
Chilectra | 1H 2013 | 1H 2012 | Var 2012-2013 | Chg% | ||
Customers (Th) | 1,676 | 1,647 | 29 | 1.7% | ||
GWh Sold | 7,452 | 7,121 | 331 | 4.6% | ||
Clients/Employee | 2,271 | 2,278 | (7) | (0.3%) | ||
Energy Losses % | 5.4% | 5.4% | 0.1 pp. |
| ||
41
![]()
Colombia

Generation
Emgesa
The operating income of our generation subsidiary in Colombia amounted to Ch$ 179,047 million in this period, increasing by Ch$ 21,383 million or by the equivalent of 13.6% compared to first half 2012. This is mainly explained by a 14.1% increase in energy sales revenues, partially offset by higher energy purchases costs of Ch$ 20,894 million.
Physical energy sales grew by 3.2% reaching 7.965 GWh and EBITDA in Emgesa grew by 11.4% inthe period, reaching Ch$ 197,737 million
The net effect of translating the financial statements from Colombian pesos to Chilean pesos in both periods was negative, resulting in a 4.6% decline in Chilean peso term in June 2013, when compared to June 2012.
Table 25 |
|
|
|
|
|
|
Emgesa | Million Ch$ |
|
| Thousand US$ | ||
| 1H 2013 | 1H 2012 | Var 2012-2013 | Chg% |
| 1H 2013 |
Operating Revenues | 310,338 | 272,012 | 38,326 | 14.1% |
| 648,279 |
Procurement and Services | (96,919) | (78,116) | (18,802) | (24.1%) |
| (202,458) |
Contribution Margin | 213,419 | 193,895 | 19,524 | 10.1% |
| 445,821 |
Other Costs | (15,734) | (16,431) | 697 | 4.2% |
| (32,868) |
Gross Operating Income (EBITDA) | 197,685 | 177,464 | 20,220 | 11.4% |
| 412,953 |
Depreciation and Amortization | (18,676) | (19,807) | 1,131 | 5.7% |
| (39,013) |
Operating Income | 179,009 | 157,657 | 21,352 | 13.5% |
| 373,939 |
Figures may differ from those accounted under Colombian GAAP. |
|
|
| |||
|
|
|
|
|
|
|
Table 25.1 |
|
|
|
|
|
|
Emgesa | 1H 2013 | 1H 2012 | Var 2012-2013 | Chg% |
|
|
GWh Produced | 6,311 | 6,333 | (21) | (0.3%) |
|
|
GWh Sold | 7,965 | 7,719 | 246 | 3.2% |
|
|
Market Share | 18.5% | 18.5% | 0.0 pp. |
|
|
|
42
![]()
Distribution
Codensa
In Colombia, Codensa’s operating income during this period was Ch$ 112,905 million, a decrease of Ch$ 5,291 million, equivalent to 4.7%. This was mainly explained by a reduction of Ch$ 13,920 million in operating revenues, due to a 3.9% decrease in energy sales revenues. This was partially offset by lower procurement and service costs, mainly explained by a Ch$ 3,529 million decrease in transportation costs, and a Ch$ 2,843 million decrease in energy purchases costs.
Physical sales grew by 3.3%, reaching 6,567 GWh in the period. Energy losses dropped by 0.5 p.p. to 7.1% and the number of customers increased by 101 thousand, reaching more than 2.6 million customers.
The net effect of translating the financial statements from Colombian pesos to Chilean pesos in both periods was negative, resulting in a 4.6% decline in Chilean peso term in June 2013, when compared to June 2012.
Table 26 |
|
|
|
|
|
|
Codensa | Million Ch$ |
|
| Thousand US$ | ||
| 1H 2013 | 1H 2012 | Var 2012-2013 | Chg% |
| 1H 2013 |
Operating Revenues | 412,323 | 426,243 | (13,920) | (3.3%) |
| 861,321 |
Procurement and Services | (227,979) | (234,332) | 6,353 | 2.7% |
| (476,235) |
Contribution Margin | 184,345 | 191,911 | (7,566) | (3.9%) |
| 385,086 |
Other Costs | (40,051) | (39,460) | (591) | (1.5%) |
| (83,665) |
Gross Operating Income (EBITDA) | 144,293 | 152,451 | (8,158) | (5.4%) |
| 301,421 |
Depreciation and Amortization | (31,389) | (34,255) | 2,867 | 8.4% |
| (65,569) |
Operating Income | 112,905 | 118,196 | (5,291) | (4.5%) |
| 235,852 |
Figures may differ from those accounted under Colombian GAAP. |
|
|
| |||
|
|
|
|
|
|
|
Table 26.1 |
|
|
|
|
|
|
Codensa | 1H 2013 | 1H 2012 | Var 2012-2013 | Chg% |
| |
Customers (Th) | 2,640 | 2,539 | 101 | 4.0% |
|
|
GWh Sold | 6,567 | 6,356 | 211 | 3.3% |
|
|
Clients/Employee | 2,551 | 2,507 | 44 | 1.8% |
|
|
Energy Losses % | 7.1% | 7.6% | (0.5) pp. |
|
|
|
43
![]()
Peru

Generation
Edegel
In Peru, the operating income of our generation subsidiary Edegel amounted to Ch$ 52,895 million in this period, a 0.9% increase when compared to the first half 2012. This result is explained mainly by a decrease in procurement and service costs of Ch$ 10,022 million, mainly due to Ch$ 5,753 million lower energy purchase cost and Ch$ 5,577 million lower fuel consumption cost. Tha above was partially offset by lower operating revenues, explained by a 9.4% decrease in energy sales revenues.
Physical sales decreased by 8.0% reaching 4,446 GWh. EBITDA of the business in Edegel amounted to Ch$ 71,770 million in this period, representing a decrease of 0.2% when comparing it to the first half 2012.
The net effect of translating the financial statements from Peruvian sol to Chilean peso in both periods resulted in a 0.7% increase in Chilean peso terms in June 2013, when compared to June 2012.
Table 27 |
|
|
|
|
|
|
Edegel | Million Ch$ |
|
| Thousand US$ | ||
| 1H 2013 | 1H 2012 | Var 2012-2013 | Chg% |
| 1H 2013 |
Operating Revenues | 130,643 | 141,754 | (11,110) | (7.8%) |
| 272,907 |
Procurement and Services | (44,679) | (54,701) | 10,022 | 18.3% |
| (93,332) |
Contribution Margin | 85,965 | 87,052 | (1,088) | (1.2%) |
| 179,575 |
Other Costs | (14,195) | (15,171) | 976 | 6.4% |
| (29,653) |
Gross Operating Income (EBITDA) | 71,770 | 71,882 | (112) | (0.2%) |
| 149,923 |
Depreciation and Amortization | (18,874) | (19,451) | 576 | 3.0% |
| (39,427) |
Operating Income | 52,895 | 52,431 | 464 | 0.9% |
| 110,495 |
Figures may differ from those accounted under Peruvian GAAP. |
|
|
| |||
|
|
|
|
|
|
|
Table 27.1 |
|
|
|
|
|
|
Edegel | 1H 2013 | 1H 2012 | Var 2012-2013 | Chg% |
|
|
GWh Produced | 4,141 | 4,367 | (227) | (5.2%) |
|
|
GWh Sold | 4,446 | 4,835 | (389) | (8.0%) |
|
|
Market Share | 25.3% | 29.1% | (3.8) pp. |
|
|
|
Eepsa
Since the second quarter of 2013, Empresa Eléctrica de Piura is consolidated by Enersis as a consequence of the incorporporation of Cono Sur assets to the company after the capital increase operation.
Considering only the second quarter of this year, operating income of the company was Ch$ 465 million while Ebitda reached Ch$ 1,088 million
44
![]()
Table 28 |
|
|
|
|
|
|
EEPSA | Million Ch$ |
|
| Thousand US$ | ||
| 2Q 2013 |
| Var 2012-2013 | Chg% |
| 1H 2013 |
Operating Revenues | 8,823 |
|
|
|
| 18,431 |
Procurement and Services | (6,352) |
|
|
|
| (13,268) |
Contribution Margin | 2,472 |
|
|
|
| 5,163 |
Other Costs | (1,384) |
|
|
|
| (2,890) |
Gross Operating Income (EBITDA) | 1,088 |
|
|
|
| 2,273 |
Depreciation and Amortization | (623) |
|
|
|
| (1,302) |
Operating Income | 465 |
|
|
|
| 971 |
Figures may differ from those accounted under Argentine GAAP. |
|
|
| |||
|
|
|
|
|
| |
Table 28.1 |
|
|
|
|
|
|
EEPSA | 2Q 2013 |
|
| Chg% |
|
|
GWh Produced | 12 |
|
|
|
|
|
GWh Sold | 195 |
|
|
|
|
|
Market Share | 1.1% |
|
|
|
|
|
Distribution
Edelnor
Our subsidiary Edelnor registered an operating income of Ch$ 33,297 million, 5.8% lower than in same period last year. This was mainly explained by a increase of 1.6% in procurement and services costs, due to a Ch$ 3,376 million increase in energy purchases cost, and a reduction of Ch$ 3,901 million, or 37.6%, in other operating revenues. The latter was partially offset by an increase of Ch$ 2,788 million in energy sales revenues.
Energy losses showed a reduction of 0.1 p/p when compared to the first quarter 2012,, reaching 8.1% in the current period. The number of customers expanded by 60 thousand, exceeding 1.2 million customers.
The net effect of translating the financial statements from Peruvian sol to Chilean peso in both periods resulted in a 0.7% increase in Chilean peso terms in June 2013, when compared to June 2012.
45
![]()
Table 29 |
|
|
|
|
|
|
Edelnor | Million Ch$ |
|
| Thousand US$ | ||
| 1H 2013 | 1H 2012 | Var 2012-2013 | Chg% |
| 1H 2013 |
Operating Revenues | 192,946 | 194,265 | (1,319) | (0.7%) |
| 403,054 |
Procurement and Services | (128,650) | (126,598) | (2,052) | (1.6%) |
| (268,744) |
Contribution Margin | 64,296 | 67,667 | (3,372) | (5.0%) |
| 134,310 |
Other Costs | (18,857) | (20,278) | 1,420 | 7.0% |
| (39,392) |
Gross Operating Income (EBITDA) | 45,438 | 47,390 | (1,951) | (4.1%) |
| 94,918 |
Depreciation and Amortization | (12,142) | (12,050) | (92) | (0.8%) |
| (25,363) |
Operating Income | 33,297 | 35,340 | (2,043) | (5.8%) |
| 69,555 |
Figures may differ from those accounted under Peruvian GAAP. |
|
| ||||
|
|
|
|
|
|
|
Table 29.1 |
|
|
|
|
|
|
Edelnor | 1H 2013 | 1H 2012 | Var 2012-2013 | Chg% |
| |
Customers (Th) | 1,230 | 1,170 | 60 | 5.1% |
|
|
GWh Sold | 3,526 | 3,448 | 78 | 2.3% |
|
|
Clients/Employee | 2,030 | 1,980 | 50 | 2.5% |
|
|
Energy Losses % | 8.1% | 8.2% | (0.1) pp. |
|
|
|
![]()
Operating Income by Subsidiary
Summary of operating revenues, operating costs (including procurements, services and other costs) and operating income of all Enersis’ subsidiaries, for the period ended on June 30, 2013 and June 30, 2012, detailed as follows:
Table 30 |
|
|
|
|
|
|
1H 2013 | 1H 2012 | |||||
Million Ch$ | Operating Revenues | Operating Costs | Operating Income | Operating Revenues | Operating Costs | Operating Income |
Endesa Chile (*) | 1,015,797 | (727,218) | 288,579 | 1,127,497 | (868,626) | 258,871 |
Cachoeira (**) | 62,070 | (21,918) | 40,152 | 72,195 | (25,345) | 46,850 |
Fortaleza (***) | 85,188 | (62,710) | 22,478 | 65,715 | (41,789) | 23,926 |
Cien (**) | 34,131 | (17,659) | 16,472 | 37,644 | (18,975) | 18,669 |
Chilectra | 471,267 | (401,717) | 69,550 | 494,323 | (426,607) | 67,716 |
Edesur | 343,753 | (202,070) | 141,683 | 165,014 | (190,068) | (25,054) |
Distrilima (Edelnor) | 192,946 | (159,650) | 33,296 | 194,265 | (158,925) | 35,340 |
Ampla | 473,152 | (369,111) | 104,041 | 559,722 | (473,316) | 86,406 |
Coelce | 338,329 | (292,004) | 46,325 | 421,170 | (337,518) | 83,652 |
Codensa | 412,323 | (299,418) | 112,905 | 426,242 | (308,046) | 118,196 |
ICT | 2,980 | (3,497) | (517) | 2,632 | (2,808) | (176) |
Dock Sud | 13,376 | (10,766) | 2,610 | - | - | - |
EE Piura | 8,823 | (8,358) | 465 | - | - | - |
Enersis Holding and other investment vehicles | 18,073 | (28,985) | (10,912) | 17,478 | (26,381) | (8,903) |
Consolidation Adjustments | (319,729) | 316,558 | (3,171) | (336,344) | 334,061 | (2,283) |
Total Consolidation | 3,157,601 | (2,291,971) | 865,630 | 3,251,304 | (2,546,877) | 704,427 |
Table 30.1 |
|
|
| |||
1H 2013 | ||||||
Thousand US$ | Operating Revenues | Operating Costs | Operating Income | |||
Endesa Chile | 2,121,946 | (1,519,120) | 602,826 | |||
Cachoeira (*) | 129,661 | (45,786) | 83,875 | |||
Fortaleza (**) | 177,953 | (130,998) | 46,955 | |||
Cien (*) | 71,298 | (36,889) | 34,409 | |||
Chilectra | 984,452 | (839,166) | 145,286 | |||
Edesur | 718,082 | (422,114) | 295,968 | |||
Distrilima (Edelnor) | 403,054 | (333,500) | 69,554 | |||
Ampla | 988,390 | (771,053) | 217,336 | |||
Investluz (Coelce) | 706,751 | (609,981) | 96,770 | |||
Codensa | 861,321 | (625,468) | 235,853 | |||
ICT | 6,225 | (7,305) | (1,080) | |||
Dock Sud | 27,942 | (22,490) | 5,452 | |||
Piura | 18,431 | (17,459) | 971 | |||
Enersis Holding and other investment vehicles | 37,754 | (60,548) | (22,795) | |||
Consolidation Adjustments | (667,897) | 661,273 | (6,624) | |||
Total Consolidation | 6,596,062 | (4,787,807) | 1,808,256 | |||
(*) Consolidated by Endesa Chile until September 30th, 2005. Since October 1st, 2005 is consolidated by Enersis through Endesa Brasil.
(**) Since October 1st, 2005, these subsidiaries are consolidated by Enersis through Endesa Brasil.
47
![]()
Market Information
Equity Market
New York Stock Exchange (NYSE)
The charts below show the performance of Enersis’ ADS (“ENI”) price at the NYSE, compared to the Dow Jones Industrials and the Dow Jones Utilities indexes over the last 12 months, as well as the trading volume, both in the NYSE.
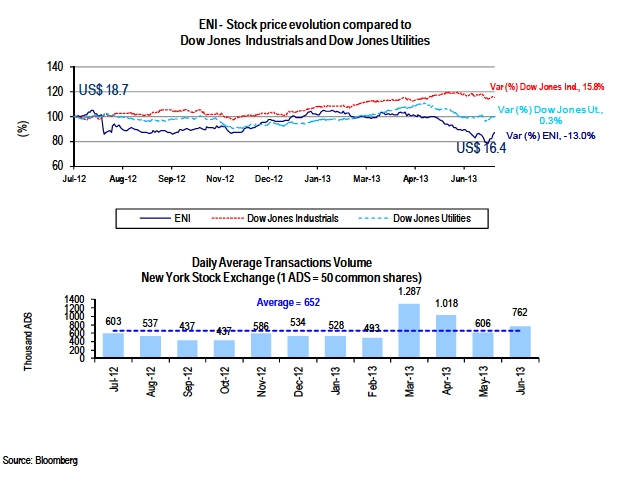
48
![]()
Santiago Stock Exchange (BCS)
The charts below show the performance of Enersis’ Chilean stock price over the last 12 months compared to the Chilean Selective Stock Index (IPSA), as well as the daily average aggregate trading volume in the Santiago and Chilean Electronic Stock Exchanges:
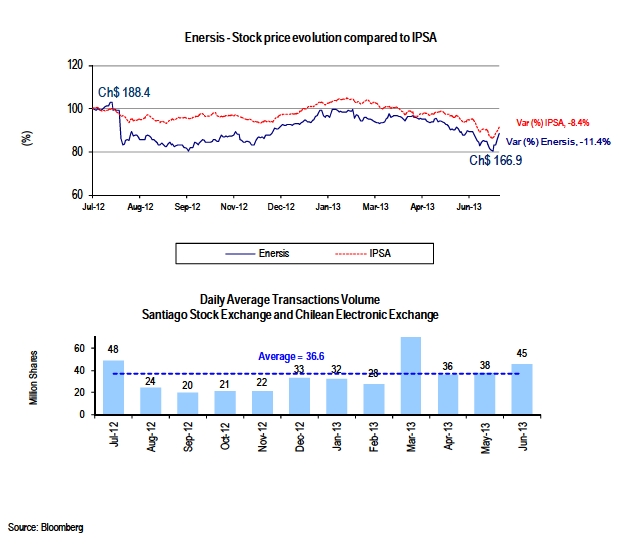
49
![]()
Madrid Stock Exchange (Latibex) - Spain
The charts below show Enersis’ share price (“XENI”) at the Latibex over the last 12 months compared to the local stock index (IBEX), as well as the daily average trading volume in the Latibex.
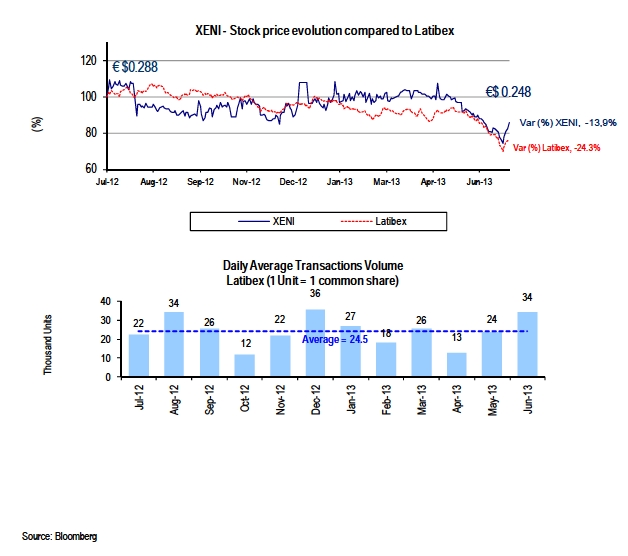
50
![]()
Debt Market
Yankee Bonds Price Evolution
The following chart shows the pricing of our five Yankee Bonds over the last twelve months compared to the iShares iBoxx Investment Grade Corporate Bond Fund Index:
![]()
(*) IShares Iboxx Investment Grade Corporate Bonds Fund Index is an exchange traded fund incorporated in the United States. The Index measures the performance of certain investment grade corporate bonds.
51
![]()
Ownership of the Company as of June 30, 2013
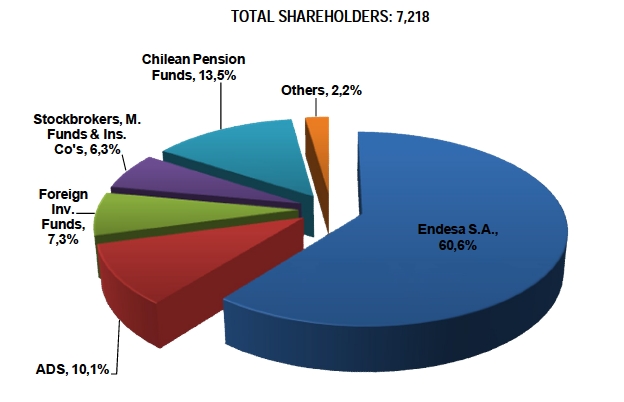
Conference Call Invitation
Enersis is pleased to invite you to participate in aConference Call with the management to review the results for the period, on Wednesday, July 25, 2013, at 12:00 pm ET (12:00 pm Local Chile Time).There will be a question and answer session following management's comments. Representing Enersis will be Mr. Eduardo Escaffi, Chief Financial Officer and the Investor Relations Team.
To participate, please dial+1 (877) 415 3184or+1 (857) 244 7327(toll free USA), approximately 10 minutes prior to the scheduled start time,Passcode ID: 34332774.
To access the phone replay, please dial+1 (617) 801 6888(International) or+1 (888) 286 8010(toll free USA)Passcode ID: 65422268.
You can also access to the conference call replay through our Investor Relations website at http://www.enersis.cl.
52
![]()
Contact Information
For further information, please contact us:
Pedro Cañamero IR Director mlmr@enersis.cl (56-2) 2353 4682 | Denisse Labarca Head of InvestorRelations denisse.labarca@enersis.cl (56-2) 2353 4576 |
Nicolás Donoso Investor Relations Associate ndo@enersis.cl (56-2) 2353 4492
| Jorge Velis InvestorRelations Associate jgve@enersis.cl (56-2) 2353 4552 | Carmen Poblete Shares Department Representative cpt@enersis.cl (56-2) 2353 4447
| |
Maria Luz Muñoz Investor Relations Assistant mlmr@enersis.cl (56-2) 2353 4682 |
| ||
Disclaimer
This Press Release contains statements that could constitute forward-looking statements within the meaning of the Private Securities Litigation Reform Act of 1995. These statements appear in a number of places in this announcement and include statements regarding the intent, belief or current expectations of Enersis and its management with respect to, among other things: (1) Enersis’ business plans; (2) Enersis’ cost-reduction plans; (3) trends affecting Enersis’ financial condition or results of operations, including market trends in the electricity sector in Chile or elsewhere; (4) supervision and regulation of the electricity sector in Chile or elsewhere; and (5) the future effect of any changes in the laws and regulations applicable to Enersis’ or its subsidiaries. Such forward-looking statements are not guarantees of future performance and involve risks and uncertainties. Actual results may differ materially from those in the forward-looking statements as a result of various factors. These factors include a decline in the equity capital markets of the United States or Chile, an increase in the market rates of interest in the United States or elsewhere, adverse decisions by government regulators in Chile or elsewhere and other factors described in Enersis’ Annual Report on Form 20-F. Readers are cautioned not to place undue reliance on those forward-looking statements, which state only as of their dates. Enersis undertakes no obligation to release publicly the result of any revisions to these forward-looking statements.
SIGNATURES
Pursuant to the requirements of the Securities Exchange Act of 1934, as amended, the Registrant has duly caused this report to be signed on its behalf by the undersigned, thereunto duly authorized.
| ENERSIS S.A. | |
| By: /s/ Ignacio Antoñanzas Alvear | |
| -------------------------------------------------- | |
| Title: Chief Executive Officer |
Date: July 25, 2013