FORM 6-K
SECURITIES AND EXCHANGE COMMISSION
Washington, D.C. 20549
Report of Foreign Issuer
Pursuant to Rule 13a-16 or 15d-16 of
the Securities Exchange Act of 1934
For the month of November, 2016
Commission File Number: 001-12440
Enersis Américas S.A.
(Translation of Registrant’s Name into English)
Santa Rosa 76
Santiago, Chile
(Address of principal executive office)
Indicate by check mark whether the registrant files or will file
annual reports under cover of Form 20-F or Form 40-F:
Form 20-F [X] Form 40-F [ ]
Indicate by check mark if the registrant is submitting the Form 6-K
in paper as permitted by Regulation S-T Rule 101(b)(1):
Yes [ ] No [X]
Indicate by check mark if the registrant is submitting the Form 6-K
in paper as permitted by Regulation S-T Rule 101(b)(7):
Yes [ ] No [X]
Indicate by check mark whether by furnishing the information
ontained in this Form, the Registrant is also thereby furnishing the
information to the Commission
pursuant to Rule 12g3-2(b) under the Securities Exchange Act of 1934:
Yes [ ] No [X]
If °;Yes” is marked, indicate below the file number assigned to the registrant
in connection with Rule 12g3-2(b): N/A
![]()
ENERSIS AMÉRICAS ANNOUNCES CONSOLIDATED RESULTS
FOR THE PERIOD ENDED ON SEPTEMBER 30, 2016
§ Revenues decreased 2.6% compared to the same period of the previous year, amounting to Ch$ 3,822,043 million, which is explained by the devaluation of foreign currencies against the Chilean peso and by lower physical sales of energy in generation, partially offset by greater sales in distribution.
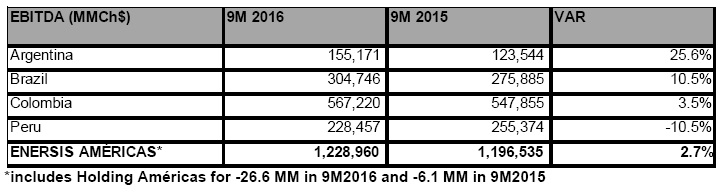
§ EBITDA increased by 2.7%, explained by better results in Argentina, Brazil and Colombia, partially offset by Peru due to the write off of Curibamba project of Ch$ 13,770 million. Isolating the foreign exchange impact, the EBITDA would have increased by 16%.
§ The Operating Income (EBIT) increased by 0.7% with respect to the same period in 2015, reaching Ch$ 935,355 million.
§ Profit after taxes, before discontinued operations, amounted to Ch$ 508,361 million, 10.7% higher than during the same period of the previous year, despite the one-time impact of fines in Edesur of Ch$ 46,056 million.
§ Net financial debt amounted to USD 1.71 billion, 4.7% lower that as of December 31, 2015, mostly explained by a USD 696 million increase in consolidated cash.
§ As of September 2016, CAPEX amounted to Ch$ 606,219 million, 42% lower than during the same period of the previous year, mostly as a result of the completion of the “El Quimbo” 400 MW hydroelectric power plant in Colombia towards the end 2015.
•1•
![]()
SUMMARY BY BUSINESS
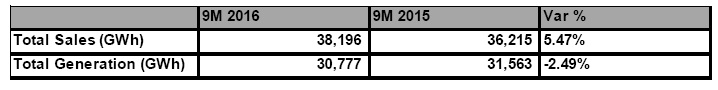
Generation
§ Generation EBITDA increased slightly by 0.8%, amounting to Ch$ 659,353 million. This is explained by the better income obtained in Colombia, Brazil and Argentina.
Physical data
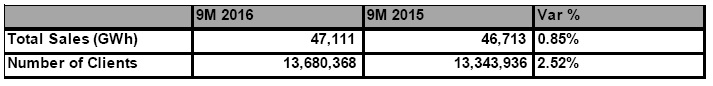
Distribution
§ Distribution EBITDA was 8.7% higher than during the same period of the previous year, amounting to Ch$ 616,850 million, explained by a better performance in the four countries in which we operate. The number of clients continues showing an important organic growth, increasing in 336,432 new clients.
Physical data
FINANCIAL SUMMARY
Ø The Company’s available liquidity has remained solid, as shown below:
• Cash and cash equivalents | US$ 2,368 million |
• Cash and cash equiv. + 90-day cash investments | US$ 2,418 million |
• Available committed lines of credit | US$ 258 million |
Ø The average nominal rate of interest in September 2016 increased to 10.3% from 9.4% during the same period of the previous year, primarily influenced by worse inflation conditions in Colombia and worse interest rate conditions in Brazil.
Hedging and protection:
In order to mitigate the financial risks associated to foreign exchange rate and interest rate fluctuations, Enersis Américas S.A. (the continuing company of the former Enersis S.A.) has enacted policies and procedures aimed at hedging its financial statements against the volatility of these variables.
•2•
![]()
• The foreign-exchange-rate risk hedging policy of Enersis Américas S.A. (consolidated), establishes that there must be equilibrium between the index currency of the flows generated by each company and the currency in which they assume debt. Because of this, Enersis Américas has contracted, including discontinued operations, cross currency swaps of US$ 579 million and forwards of US$ 226 million.
• In order to reduce volatility in the financial statements because of interest rate changes, Enersis Américas S.A. (consolidated) keeps an adequate debt structure balance. Because of this, we have interest rate swaps contracted totaling US$ 96 million.
•3•
![]()
RELEVANT INFORMATION FOR THE ANALYSIS OF THESE FINANCIAL STATEMENTS
As stated in Note 5 of the current financial statements as of September 30, 2016: on December 18, 2015 the Shareholders’ Meeting of Enersis S.A. decided to approve the separation of the Company subject to compliance with certain conditions precedent. This consists of dividing Enersis and its subsidiaries, Endesa Chile and Chilectra in a manner such as to separate, the generation and distribution businesses in Chile on the one hand and the activities outside of Chile on the other.
On March 1, 2016, having met the conditions precedent, the split of Enersis Chile and its subsidiaries Endesa Chile and Chilectra was materialized and the subsidiaries Enersis Américas (the continuing company of the former Enersis S.A.), Enel Chile S.A. (formerly Enersis Chile S.A.), Endesa Américas and Chilectra Américas began to exist legally.
Considering the above-mentioned and pursuant to the provisions of the International Financial Reporting Standards (IFRS), all revenues and expenses corresponding to the generation and distribution businesses in Chile for the 2-month period ended February 29, 2016, are considered discontinued operations and are shown under the item “Profit (loss) stemming from discontinued operations” of the integral consolidated income statement.
For comparative purposes, this presentation method has also been applied to income corresponding as of September 2015, thereby restating the integral consolidated income statement of the previous year.
At an Extraordinary Shareholders’’ Agreement held on September 8, 2016, the corresponding shareholders of Enersis Américas, Endesa Américas and Chilectra Américas, voted and approved the merger of Endesa Américas and Chilectra Américas with over two-thirds approval of the voting shares of each of the entities, in which merger would be carried out without liquidation, and with Enersis Américas succeeding them in their rights and obligations.
For additional information, see Note 5.1 of Enersis Américas’ consolidated financial statements of Enersis Américas as of September 30, 2016.
In line with what has been described above and in order to enable a better interpretation of the businesses and income of the nine-month periods ending as of September 30, 2016 and 2015, we prepared tables to show the discontinued operations apart from the continued operations, resulting from the split and thus explain the businesses and their incomes more clearly.
•4•
![]()
MARKETS IN WHICH THE COMPANY OPERATES
Enersis Américas’ business activities are carried out through subsidiary companies that operate the different businesses in the four countries in which the Company operates. The most relevant businesses for Enersis are electricity generation and distribution.
The following tables show some key indicators, as of September 30, 2016 and 2015, of the companies in the different countries in which they operate.
.
The generation business
Company | Markets | Energy Sales | Market | ||
in which | (GWh) | Share | |||
operates | Sep-16 | Sep-15 | Sep-16 | Sep-15 | |
|
|
|
|
|
|
Endesa Chile(1) | SIC & SING Chile | 17,962 | 17,311 | 35.0% | 35.0% |
Costanera | SIN Argentina | 4,763 | 6,225 | 4.7% | 6.3% |
El Chocón | SIN Argentina | 2,083 | 2,887 | 2.1% | 2.9% |
Dock Sud | SIN Argentina | 3,557 | 2,497 | 3.5% | 2.5% |
Edegel consolidated | SICN Peru | 6,750 | 6,501 | 20.8% | 22.1% |
EE. Piura | SICN Peru | 530 | 478 | 1.6% | 1.6% |
Emgesa | SIN Colombia | 13,825 | 12,845 | 21.9% | 19.5% |
Cachoeira Dourada | SICN Brazil | 4,398 | 2,343 | 1.3% | 0.7% |
Fortaleza | SICN Brazil | 2,289 | 2,438 | 0.7% | 0.7% |
Total |
| 56,158 | 53,525 |
|
|
Discontinued operations (1) | (17,962) | (17,311) | |||
|
|
|
| ||
Total |
| 38,196 | 36,215 |
|
|
(1) includes Endesa Chile and its generation subsidiaries in Chile.As of September 30, 2016 and 2015, corresponds to discontinued operations. | |||||
•5•
![]()
The distribution business
| Energy Sales | Energy Losses | Clients | Clients / Employees | ||||
Company | (GWh) ( * ) | (%) | (thousand) |
| ||||
| Sep-16 | Sep-15 | Sep-16 | Sep-15 | Sep-16 | Sep-15 | Sep-16 | Sep-15 |
Chilectra (**) | 12,009 | 11,960 | 5.3% | 5.0% | 1,814 | 1,773 | 2,626 | 2,600 |
Edesur | 14,203 | 14,004 | 12.1% | 12.4% | 2,495 | 2,477 | 586 | 600 |
Edelnor | 5,824 | 5,710 | 8.0% | 7.7% | 1,360 | 1,329 | 2,193 | 2,162 |
Ampla | 8,410 | 8,226 | 19.6% | 19.0% | 3,035 | 2,972 | 2,832 | 2,475 |
Coelce | 8,569 | 8,342 | 13.0% | 12.0% | 3,859 | 3,722 | 3,382 | 3,141 |
Codensa | 10,105 | 10,430 | 7.3% | 7.2% | 2,931 | 2,844 | 2,674 | 2,592 |
Total | 59,120 | 58,673 | 10.8% | 10.5% | 15,495 | 15,116 | 1,745 | 1,696 |
Discontinued operations (**) | (12,009) | (11,960) | (1,814) | (1,773) | ||||
Total Continuing Operations | 47,111 | 46,713 | 10.8% | 10.5% | 13,681 | 13,343 | 1,745 | 1,696 |
(*) Includes final customer sales and tolls. | ||||||||
(**) Consolidated data. As of September 30, 2016 and 2015, corresponds to discontinued operations. | ||||||||
The following table shows a breakdown of energy sales revenues by business line and type of customer as of September 30, 2016 and 2015 of the companies in the different countries in which we operate. This information includes continued operations.
Energy Sales Revenues | |||||||||||||||
Generation and Distribution | |||||||||||||||
(Figures in million Ch$) | |||||||||||||||
Country | Argentina | Brazil | Colombia | Peru | Total Segments | Structure and adjustments | Total | ||||||||
| Sep-16 | Sep-15 | Sep-16 | Sep-15 | Sep-16 | Sep-15 | Sep-16 | Sep-15 | Sep-16 | Sep-15 | Sep-16 | Sep-15 | Sep-16 | Sep-15 | |
Energy Sales Revenues |
|
|
|
|
|
|
|
|
|
|
|
| |||
|
|
|
|
|
|
|
|
|
|
|
|
|
|
| |
Generation | 75,851 | 85,618 | 232,641 | 189,147 | 602,903 | 518,967 | 271,144 | 260,490 | 1,182,539 | 1,054,222 | (331,565) | (209,314) | 850,974 | 844,908 | |
Regulated customers | 13 | - | 143,792 | 110,844 | - | - | 166,266 | 151,401 | 310,071 | 262,245 | (226,415) | (158,335) | 83,656 | 103,910 | |
Non regulated customers | 1,960 | 4,345 | 97,215 | 46,964 | 453,131 | 400,082 | 89,341 | 84,336 | 641,647 | 535,727 | (105,149) | (50,960) | 536,498 | 484,767 | |
Spot Market | 27,238 | 54,553 | (8,366) | 31,339 | 149,772 | 118,885 | 4,190 | 10,633 | 172,834 | 215,410 | - | - | 172,834 | 215,410 | |
Other Clients | 46,640 | 26,720 | - | - | - | - | 11,347 | 14,120 | 57,987 | 40,840 | (1) | (19) | 57,986 | 40,821 | |
|
|
|
|
|
|
|
|
|
|
|
|
|
|
| |
Distribution | 446,695 | 200,566 | 907,114 | 1,192,745 | 553,724 | 539,145 | 418,714 | 386,000 | 2,326,247 | 2,318,456 | (149) | (188) | 2,326,098 | 2,318,268 | |
Residential | 74,708 | 67,316 | 432,340 | 604,164 | 285,007 | 284,459 | 201,923 | 185,848 | 993,978 | 1,141,787 | (1) | - | 993,977 | 1,141,787 | |
Commercial | 188,049 | 82,647 | 271,518 | 255,311 | 135,763 | 133,712 | 86,425 | 79,545 | 681,755 | 551,215 | (34) | (60) | 681,721 | 551,155 | |
Industrial | 57,284 | 22,473 | 98,675 | 94,978 | 58,622 | 56,348 | 56,893 | 52,364 | 271,474 | 226,163 | - | - | 271,474 | 226,163 | |
Other | 126,654 | 28,130 | 104,581 | 238,292 | 74,332 | 64,626 | 73,473 | 68,243 | 379,040 | 399,291 | (114) | (128) | 378,926 | 399,163 | |
Less: Consolidation adjustments | (24) | (19) | (143,807) | (99,067) | (105,263) | (51,088) | (82,620) | (59,328) | (331,714) | (209,502) | 331,714 | 209,502 | - | - | |
|
|
|
|
|
|
|
|
|
|
|
|
|
|
| |
Energy Sales Revenues | 522,522 | 286,165 | 995,948 | 1,282,825 | 1,051,364 | 1,007,024 | 607,238 | 587,162 | 3,177,072 | 3,163,176 | - | - | 3,177,072 | 3,163,176 | |
•6•
![]()
I. - ANALYSIS OF THE FINANCIAL STATEMENTS
1. Analysis of the Income Statement
The net Income attributable to the controlling shareholders of Enersis Américas as of September 30, 2016 amounted to Ch$ 362,582 million; which represents a 10.6% reduction compared to the same period of the previous year, which showed a profit of Ch$ 405,425 million.
Following is an item-by-item comparison of the income statement of the continued operations as of September 30, 2016 and 2015:
•7•
![]()
CONSOLIDATED INCOME STATEMENT (Continuing Operations) (million Ch$) | Sep-16 | Sep-15 | Change | % Change |
Revenues | 3,822,043 | 3,924,407 | (102,364) | (2.6%) |
Sales | 3,540,267 | 3,484,132 | 56,135 | 1.6% |
Other operating income | 281,776 | 440,275 | (158,499) | (36.0%) |
Procurements and Services | (1,914,358) | (2,035,857) | 121,499 | 6.0% |
Energy purchases | (1,226,577) | (1,398,992) | 172,415 | 12.3% |
Fuel consumption | (197,888) | (171,043) | (26,845) | (15.7%) |
Transportation expenses | (194,844) | (186,599) | (8,245) | (4.4%) |
Other variable costs | (295,049) | (279,223) | (15,826) | (5.7%) |
Contribution Margin | 1,907,685 | 1,888,550 | 19,135 | 1.0% |
Personnel costs | (271,984) | (314,120) | 42,136 | 13.4% |
Other fixed operating expenses | (406,741) | (377,895) | (28,846) | (7.6%) |
Gross Operating Income (EBITDA) | 1,228,960 | 1,196,535 | 32,425 | 2.7% |
Depreciation and amortization | (236,677) | (236,261) | (416) | (0.2%) |
Reversal of impairment profit (impairment loss) recognized in profit or loss | (56,928) | (31,636) | (25,292) | (80.0%) |
Operating Income | 935,355 | 928,638 | 6,717 | 0.7% |
Net Financial Income | (242,967) | (96,706) | (146,261) | (151.2%) |
Financial income | 151,289 | 191,487 | (40,198) | (21.0%) |
Financial costs | (406,407) | (271,583) | (134,824) | (49.6%) |
Gain (Loss) for indexed assets and liabilities | (584) | (6,418) | 5,834 | 90.9% |
Foreign currency exchange differences, net | 12,735 | (10,192) | 22,927 | 225.0% |
Other Non Operating Income | 2,259 | 4,583 | (2,324) | (50.7%) |
Net Income From Sale of Assets | 666 | 721 | (55) | (7.6%) |
Share of profit (loss) of associates accounted for using the equity method | 1,593 | 3,862 | (2,269) | (58.8%) |
Net Income Before Taxes | 694,647 | 836,515 | (141,868) | (17.0%) |
Income Tax | (186,286) | (377,182) | 190,896 | 50.6% |
Net Income from Continuing Operations | 508,361 | 459,333 | 49,028 | 10.7% |
Net income (Loss) from discontinued operations after taxes | 115,130 | 233,693 | (118,563) | 50.7% |
NET INCOME | 623,491 | 693,026 | (69,535) | (10.0%) |
|
|
|
|
|
NET INCOME | 623,491 | 693,026 | (69,535) | (10.0%) |
Net Income attributable to owners of parent | 362,582 | 405,425 | (42,843) | (10.6%) |
Net income attributable to non-controlling interest | 260,909 | 287,601 | (26,692) | (9.3%) |
Earning per share from continuing operations (Ch$ /share) | 5.80 | 4.46 | 1.34 | 30.1% |
Earning per share from discontinued operations (Ch$ /share) | 1.59 | 3.80 | (2.21) | (58.1%) |
Earning per share (Ch$ /share) | 7.39 | 8.26 | (0.87) | (10.4%) |
(*) As of September 30, 2016 and 2015 the average number of paid and subscribed shares were 49,092,772,762 | ||||
What follows is an item-by-item comparison of the income statement as of September 30, 2016 and 2015 of the discontinued operations carried out in Chile, including the 7-month income of the new company (Enersis Chile), in order to facilitate a comparion with the same period of the previous year.
•8•
![]()
Enersis Chile | Enersis Chile | Enersis Chile | Enersis Chile | |||
2 months | 7 months | Total | Total | |||
CONSOLIDATED INCOME STATEMENT (Discontinued Operations)(million Ch$) | Sep-16 | Sep-16 | Sep-16 | Sep-15 | Change | % Change |
Revenues | 405,372 | 1,533,433 | 1,938,805 | 1,760,971 | 177,834 | 10.1% |
Sales | 402,810 | 1,523,993 | 1,926,803 | 1,752,672 | 174,131 | 9.9% |
Other operating income | 2,562 | 9,440 | 12,002 | 8,299 | 3,703 | 44.6% |
Procurements and Services | (236,672) | (924,363) | (1,161,035) | (1,151,827) | (9,208) | -0.8% |
Energy purchases | (155,835) | (537,315) | (693,150) | (642,368) | (50,782) | -7.9% |
Fuel consumption | (34,794) | (217,636) | (252,430) | (289,425) | 36,995 | 12.8% |
Transportation expenses | (37,339) | (114,308) | (151,647) | (129,577) | (22,070) | -17.0% |
Other variable costs | (8,704) | (55,104) | (63,808) | (90,457) | 26,649 | 29.5% |
Contribution Margin | 168,700 | 609,070 | 777,770 | 609,144 | 168,626 | 27.7% |
Personnel costs | (12,732) | (66,637) | (79,369) | (86,220) | 6,851 | 8.0% |
Other fixed operating expenses | (16,591) | (110,321) | (126,912) | (82,470) | (44,442) | -53.9% |
Gross Operating Income (EBITDA) | 139,377 | 432,112 | 571,489 | 440,454 | 131,035 | 29.8% |
Depreciation and amortization | - | (94,747) | (94,747) | (112,391) | 17,644 | 15.7% |
Reversal of impairment profit (impairment loss) recognized in profit or loss | (969) | (4,097) | (5,066) | (4,918) | (148) | -3.0% |
Operating Income | 138,408 | 333,268 | 471,676 | 323,145 | 148,531 | 46.0% |
Net Financial Income | (5,807) | (8,755) | (14,562) | (46,133) | 31,571 | 68.4% |
Financial income | 2,563 | 12,323 | 14,886 | 11,075 | 3,811 | 34.4% |
Financial costs | (8,617) | (35,017) | (43,634) | (48,004) | 4,370 | 9.1% |
Gain (Loss) for indexed assets and liabilities | 268 | 595 | 863 | 3,320 | (2,457) | 74.0% |
Foreign currency exchange differences, net | (21) | 13,344 | 13,323 | (12,524) | 25,847 | 206.4% |
Other Non Operating Income | 1,294 | 126,991 | 128,285 | 14,177 | 114,108 | 804.9% |
Net Income From Sale of Assets | - | 121,440 | 121,440 | 6,694 | 114,746 | 1714.2% |
Share of profit (loss) of associates accounted for using the equity method | 1,294 | 5,551 | 6,845 | 7,483 | (638) | -8.5% |
Net Income Before Taxes | 133,894 | 451,504 | 585,398 | 291,189 | 294,209 | 101.0% |
Income Tax | (18,764) | (85,395) | (104,159) | (57,496) | (46,663) | -81.2% |
NET INCOME | 115,130 | 366,109 | 481,239 | 233,693 | 247,546 | 105.9% |
Net Income attributable to owners of parent | 77,880 | 248,356 | 326,236 | 186,332 | 139,904 | 75.1% |
Net income attributable to non-controlling interest | 37,250 | 117,753 | 155,003 | 47,361 | 107,642 | 227.3% |
| - | - | - | - | - | 0.0% |
Earning per share (Ch$ /share) | 1.59 | 5.06 | 6.65 | 3.80 | 2.85 | 75.1% |
|
|
|
|
|
| |
(*) As of September 30, 2016 and 2015 the average number of paid and subscribed shares were 49,092,772,762 | ||||||
The following is an item-by-item comparison of each item of the income statement as of September 30, 2016 and 2015, including the discontinued operations in Chile as if the operation had not been performed:
•9•
![]()
Enersis Américas + 2 months of Enersis Chile | Enersis Chile 7 months | Total | Total | |||
CONSOLIDATED INCOME STATEMENT (including discontinued operations) (million Ch$) | Sep-16 | Sep-16 | Sep-16 | Sep-15 | Change | % Change |
Revenues | 4,227,415 | 1,533,433 | 5,760,848 | 5,685,378 | 75,470 | 1.3% |
Sales | 3,943,077 | 1,523,993 | 5,467,070 | 5,236,804 | 230,266 | 4.4% |
Other operating income | 284,338 | 9,440 | 293,778 | 448,574 | (154,796) | -34.5% |
Procurements and Services | (2,151,030) | (924,363) | (3,075,393) | (3,187,684) | 112,291 | 3.5% |
Energy purchases | (1,382,412) | (537,315) | (1,919,727) | (2,041,359) | 121,632 | 6.0% |
Fuel consumption | (232,682) | (217,636) | (450,318) | (460,468) | 10,150 | 2.2% |
Transportation expenses | (232,183) | (114,308) | (346,491) | (316,176) | (30,315) | -9.6% |
Other variable costs | (303,753) | (55,104) | (358,857) | (369,681) | 10,824 | 2.9% |
Contribution Margin | 2,076,385 | 609,070 | 2,685,455 | 2,497,694 | 187,761 | 7.5% |
Personnel costs | (284,716) | (66,637) | (351,353) | (400,339) | 48,986 | 12.2% |
Other fixed operating expenses | (423,332) | (110,321) | (533,653) | (460,366) | (73,287) | -15.9% |
Gross Operating Income (EBITDA) | 1,368,337 | 432,112 | 1,800,449 | 1,636,989 | 163,460 | 10.0% |
Depreciation and amortization | (236,677) | (94,747) | (331,424) | (348,652) | 17,228 | 4.9% |
Reversal of impairment profit (impairment loss) recognized in profit or loss | (57,897) | (4,097) | (61,994) | (36,554) | (25,440) | -69.6% |
Operating Income | 1,073,763 | 333,268 | 1,407,031 | 1,251,783 | 155,248 | 12.4% |
Net Financial Income | (248,774) | (8,755) | (257,529) | (142,839) | (114,690) | -80.3% |
Financial income | 153,852 | 12,323 | 166,175 | 202,562 | (36,387) | -18.0% |
Financial costs | (415,024) | (35,017) | (450,041) | (319,588) | (130,453) | -40.8% |
Gain (Loss) for indexed assets and liabilities | (316) | 595 | 279 | (3,097) | 3,376 | 109.0% |
Foreign currency exchange differences, net | 12,714 | 13,344 | 26,058 | (22,716) | 48,774 | 214.7% |
Other Non Operating Income | 3,553 | 126,991 | 130,544 | 18,760 | 111,784 | 595.9% |
Net Income From Sale of Assets | 666 | 121,440 | 122,106 | 7,415 | 114,691 | 1546.7% |
Share of profit (loss) of associates accounted for using the equity method | 2,887 | 5,551 | 8,438 | 11,345 | (2,907) | -25.6% |
Net Income Before Taxes | 828,541 | 451,504 | 1,280,045 | 1,127,704 | 152,341 | 13.5% |
Income Tax | (205,050) | (85,395) | (290,445) | (434,678) | 144,233 | 33.2% |
Net Income from Continuing Operations | 623,491 | 366,109 | 989,600 | 693,026 | 296,574 | 42.8% |
Net income (Loss) from discontinued operations after taxes | - | - | - | - | - | 0.0% |
NET INCOME | 623,491 | 366,109 | 989,600 | 693,026 | 296,574 | 42.8% |
| - | - | - | - | - | 0.0% |
NET INCOME | 623,491 | 366,109 | 989,600 | 693,026 | 296,574 | 42.8% |
Net Income attributable to owners of parent | 362,582 | 248,356 | 610,938 | 405,425 | 205,513 | 50.7% |
Net income attributable to non-controlling interest | 298,159 | 117,753 | 415,912 | 287,601 | 128,311 | 44.6% |
- | - | - | - | - | 0.0% | |
Earning per share from continuing operations (Ch$ /share) | 7.39 | 5.06 | 12.44 | 8.26 | 4.19 | 50.7% |
(*) As of September 30, 2016 and 2015 the average number of paid and subscribed shares were 49,092,772,762 | ||||||
•10•
![]()
Operating income:
The operating income as of September 30, 2016 from continuing activities increased by Ch$ 6,717 million, equivalent to an increase of 0.7%, going from Ch$ 928,638 million as of September, 2015 to Ch$ 935,455 million in the present year.
The following is a breakdown of operating revenues and expenses for continuing operations, broken down by business line for the periods ended September 30, 2016 and 2015:
OPERATING INCOME | ||||||||
BY BUSINESS LINES (Continuing Operations) | ||||||||
(Figures in million Ch$) | ||||||||
| Generation & Transmission | Distribution | Adjustments | Total | ||||
| Sep-16 | Sep-15 | Sep-16 | Sep-15 | Sep-16 | Sep-15 | Sep-16 | Sep-15 |
Operating Revenues | 1,400,550 | 1,222,358 | 2,783,612 | 2,938,373 | (362,119) | (236,324) | 3,822,043 | 3,924,407 |
Operating Costs | (847,806) | (675,244) | (2,352,765) | (2,532,512) | 313,882 | 211,986 | (2,886,688) | (2,995,770) |
|
|
|
|
|
|
|
|
|
Operating Income | 552,745 | 547,114 | 430,847 | 405,861 | (48,237) | (24,338) | 935,355 | 928,638 |
Change in million Ch$ and % | 5,630 | 1.0% | 24,986 | 6.2% | (23,899) | (98.2%) | 6,717 | 0.7% |
The following is a breakdown of operating revenues and costs for discontinued operations by business line for the periods ended September 30, 2016 and 2015:
OPERATING INCOME | ||||||||
BY BUSINESS LINES (Discontinued Operations) | ||||||||
(Figures in million Ch$) | ||||||||
| Generation & Transmission | Distribution | Adjustments | Total | ||||
| Sep-16 | Sep-15 | Sep-16 | Sep-15 | Sep-16 | Sep-15 | Sep-16 | Sep-15 |
Operating Revenues | 1,276,246 | 1,131,407 | 994,087 | 930,399 | (331,528) | (300,835) | 1,938,805 | 1,760,971 |
Operating Costs | (914,565) | (902,055) | (872,629) | (818,318) | 320,066 | 282,547 | (1,467,129) | (1,437,826) |
| -914565 | -902055 |
|
|
|
|
|
|
Operating Income | 361,681 | 229,352 | 121,458 | 112,081 | (11,462) | (18,288) | 471,676 | 323,145 |
Change in million Ch$ and % | 132,329 | 57.7% | 9,377 | 8.4% | 6,826 | (37.3%) | 148,531 | 46.0% |
•11•
![]()
The operating income as of September 30, 2016, includes discontinued activities as if the operation had not been performed, shows an increase of Ch$ 155,248 million, equivalent to 12.4%, totaling Ch$ 1,407,031 million as of September 2016.
OPERATING INCOME | ||||||||
BY BUSINESS LINES (Discontinued Operations) | ||||||||
(Figures in million Ch$) | ||||||||
| Generation & Transmission | Distribution | Adjustments | Total | ||||
| Sep-16 | Sep-15 | Sep-16 | Sep-15 | Sep-16 | Sep-15 | Sep-16 | Sep-15 |
Operating Revenues | 2,676,796 | 2,353,765 | 3,777,699 | 3,868,772 | (693,647) | (537,159) | 5,760,848 | 5,685,378 |
Operating Costs | (1,762,371) | (1,577,299) | (3,225,394) | (3,350,830) | 633,948 | 494,533 | (4,353,816) | (4,433,596) |
| -914565 | -902055 |
|
|
|
|
|
|
Operating Income | 914,426 | 776,466 | 552,305 | 517,942 | (59,699) | (42,626) | 1,407,032 | 1,251,783 |
Change in million Ch$ and % | 137,959 | 17.8% | 34,363 | 6.6% | (17,073) | (40.1%) | 155,249 | 12.4% |
The operating income for the generation and transmission lines of business includes discontinued operations as if the operation had not been performed is shown by country in the following table for the periods as of September 30, 2016 and 2015. Physical sales which includes discontinued activities increased by 4.9%, reaching 56,158 GWh (53,858 GWh in 2015).
OPERATING INCOME BY COUNTRY | |||||||||||||||
Generation & Transmission | |||||||||||||||
(Figures in million Ch$) | |||||||||||||||
Discontinued | Continuing Operations | ||||||||||||||
| Chile | Argentina | Brazil | Colombia | Peru | Total Continuing | Total | ||||||||
| Sep-16 | Sep-15 | Sep-16 | Sep-15 | Sep-16 | Sep-15 | Sep-16 | Sep-15 | Sep-16 | Sep-15 | Sep-16 | Sep-15 | Sep-16 | Sep-15 | |
Operating Revenues | 1,276,246 | 1,131,407 | 156,854 | 147,995 | 282,436 | 233,324 | 615,816 | 525,191 | 345,443 | 316,727 | 1,400,550 | 1,222,358 | 2,676,796 | 2,353,765 | |
|
|
|
|
|
|
|
|
|
|
|
|
|
|
| |
Operating Costs | (914,565) | (902,055) | (118,429) | (118,042) | (160,952) | (133,620) | (305,525) | (225,756) | (262,898) | (198,704) | (847,806) | (675,244) | (1,762,371) | (1,577,299) | |
|
|
|
|
|
|
|
|
|
|
|
|
|
|
| |
Operating Income | 361,681 | 229,352 | 38,426 | 29,953 | 121,484 | 99,704 | 310,291 | 299,434 | 82,544 | 118,023 | 552,745 | 547,114 | 914,426 | 776,466 | |
Change in million Ch$ and % | 132,329 | 57.7% | 8,472 | 28.3% | 21,780 | 21.8% | 10,857 | 3.6% | (35,478) | (30.1%) | 5,630 | 1.0% | 137,959 | 17.8% | |
a) Continuing operations:
Argentina
The operating income of our generation subsidiaries in Argentina reached Ch$ 38,426 million, Ch$ 8,472 million more than during the same period of the previous year.
The operating income ofEndesa Costanera reached Ch$ 17,862 million, Ch$ 3,925 million higher than the same period of the previous year due to lower operating costs of Ch$ 9,348 million, mostly explained by lower depreciation and impairment expenses of Ch$ 3,548 million which includes theconversion effects of converting Argentinean pesos to Chilean pesos of Ch$ 5,537 million, offset by increases depreciation costs of Ch$ 1,989 million and lower personnel expenses of Ch$ 6,172 million, principally because of the conversion effects of converting Argentinean pesos to Chilean pesos of Ch$ 10,265 million, offset by greater personnel expenses of Ch$ 4,093, because of increased salary increases of Ch$ 3,889 million with respect to the previous year and to layoffs of Ch$ 794 million.
•12•
![]()
On the other hand, the Ch$ 5,423 million in lower operating income is principally attributable to lower income from energy sales of Ch$ 7,786 million because of the effect of converting Argentinean pesos to Chilean pesos of Ch$ 12,092 million, offset by greater sales income resulting from the application of Resolution N°22 of March 30, 2016 of Ch$ 4,306 million. The mentioned resolution, issued by the Electric Energy Secretary of the Ministry of Energy and Mining, updated the revenue values of Resolution SEN° 482/2015 charged by generators. Additionally, greater other operating income of Ch$ 2,593 million corresponding to accruals of the Availability Contract with CAMMESA of Ch$ 14,538 million, offset by the effects of converting Argentinean pesos to Chilean pesos of Ch$ 12,766 million and by greater other services provided of Ch$ 821 million.
The operating income ofEl Chocón amounted to Ch$ 12,692 million, which is Ch$ 4,975 million less than the same period of the previous year, because of lower operating income of Ch$ 8,085 million, principally due to the effect of converting Argentinean pesos into Chilean pesos of Ch$ 10,452 million, 804 GWh less physical sales because of contract expirations, lower generation of Ch$ 1,513 million and greater income resulting from the application of Resolution N° 22 of Ch$ 3,953 million because of lower prices. Operating costs dropped by Ch$ 3,110 million, principally because of the effects of converting Argentinean pesos into Chilean pesos of Ch$ 3,876 million.
The operating income ofDock Sud amounted to Ch$ 7,310 million, Ch$ 8,731 million greater than the same period of the previous year, because of greater operating income of Ch$ 22,591 million principally because of greater income of Ch$ 25,004 million resulting from a greater consumption of its own fuel as compared to the year 2015, lower generation because of plant stoppages, offset by the effects of converting Argentinean pesos into Chilean pesos of Ch$ 8,532 million and lower physical sales of 1,060 GWh of Ch$ 13,152 million because of the lower generation during the same period of 2015, offset by the effects of converting Argentinean pesos into Chilean pesos of Ch$ 7,047 million.
Operating costs increased by Ch$ 14,220 million principally because of greater fuel consumption of Ch$ 24,015 million, offset by the effects of converting Argentinean pesos into Chilean pesos of Ch$ 8,220 million and by greater depreciation and impairment costs of Ch$ 1,698 million resulting from greater capitalizations with respect to 2015 of Ch$ 4,117 million, offset by the effects of converting Argentinean pesos into Chilean pesos of Ch$ 2,419 million; in addition to lower expenses on account of other Variable Procurements and Services of Ch$ 2,981 million because of the effects of converting Argentinean pesos into Chilean pesos Ch$ 1,690 million and of lower variable expenses of Ch$ 1,291 million.
The effect of converting the financial statements from Argentinean pesos into Chilean pesos in both periods generated a decrease in Chilean pesos of 34.6% as of September 2016 with respect to September 2015.
Brazil
The operating income of our subsidiaries in Brazil totaled Ch$ 121,484 million, Ch$ 21,780 million higher with respect to the same period of the previous year, when operating income totaled Ch$ 99,704 million.
•13•
![]()
The operating income of our subsidiary,Cachoeira Dourada, increased by Ch$ 7,109 million as a result of a greater operating income of Ch$ 60,093 million mostly attributable to greater energy sales to free customers of 2,055 GWh with respect to the same period of the previous year for Ch$ 63,777 million, offset by the effects of converting Brazilian reals into Chilean pesos of Ch$ 3,756 million. On the other hand, operating costs increased by Ch$ 52,984 million, principally because of increased purchases from free and spot customers to cover the demand of a lower generation because of the lower capacity of the reservoirs of Ch$ 52,376 million. Physical sales amounted to 4,398 GWh during the present period (2,343 GWh on 2015).
The operating income ofCentral Fortaleza (CGTF) reached Ch$ 38,311 million, Ch$ 17,737 million greater than the previous year, because of a lower operating income of Ch$ 275 million, principally because of lower energy sales in spot markets of Ch$ 11,956 million, which includes the effects of converting Brazilian reals into Chilean pesos of Ch$ 6,183 million, offset by greater other income of Ch$11,680 million, mainly due to the acknowledgment of the Provin (Industrial Incentive & Development Program) benefit of Ch$ 8,467 million and the acknowledgement of the effects by operative derivatives of the MTM appraisal of Ch$ 3,213 million. On the other hand, operating costs diminished by Ch$ 18,012 million, mostly because of lower energy purchases of Ch$ 17,196 million due to lower purchasing prices with respect to the previous period of Ch 14,508 million, the effects of converting Brazilian reals into Chilean pesos of Ch$ 2,082 million and lower energy purchases of Ch$ 606 million, and due to lower fuel consumption of Ch$ 5,229 million, principally because of less volume of purchased gas of Ch$ 2,982 million plus the effects of converting Brazilian reals into Chilean pesos of Ch$ 2,266 million. The foregoing was offset by greater expenses incurred by other variable procurements and services of Ch$ 5,039 million, mostly in relation to the MTM of the underlyingitem covered by Ch$ 4,980 million. Physical sales during the present period amounted to 2,289 GWh, which is 149 GWh lower that the same period of the previous year, when they totaled 2,438 GWh
CIEN shows a decreased operating income of Ch$ 3,208 million, as a result of lower operating income Ch$ 6,986 million, principally attributable the effects of converting Brazilian reals into Chilean pesos of Ch$ 2,334 million plus the decrease in the Permitted Annual Income (RAP, in its Brazilian acronym), according to regulator dispatches of Ch$ 4,277 million. On the other hand, operating costs dropped by Ch$ 3,778 million, mostly because of lower personnel expenses of Ch$ 2,402 million for lower effects of bonds and salaries of Ch$ 2,099 million and the effects of converting Brazilian reals into Chilean pesos of Ch$ 303 million, lower energy purchases of Ch$ 880 million, lower depreciation and impairment costs of Ch$ 627 million, lower other variable procurements and services of Ch$ 13 million, offset by greater other expenses caused by nature of Ch$ 144 million; whereas all the above-indicated effects were due principally to the effects of converting Brazilian reals into Chilean pesos.
The effect of converting the financial statements from Brazilian reals into Chilean pesos in both periods generated a reduction in Chilean pesos of 5.3% as of September 2016 with respect to September 2015.
Colombia
The operating income in Colombia increased by 3.6% or Ch$ 10,857 million, totaling Ch$ 310,291 million in 2016 (Ch$ 299,434 million as of the same period of 2015).
Emgesa’s operating income increased by Ch$ 90,625 million, which is mostly attributable to greater energy sales of Ch$ 83,936 million that include the period’s greater physical sales of 980 GWh and the better average sale prices obtained when compared to the previous year of Ch$ 86,516 million, inaddition to the greater generation as a result of the operational start-up of El Quimbo of Ch$ 40,832 million, whereas the foregoing was partially offset by the effect of converting Colombian pesos into Chilean pesos of Ch$ 43,412 million. Moreover, greater gas purchases of Ch$ 2,546 million, offset by the effects of converting Colombian pesos into Chilean pesos of Ch$ 413 million and by greater other operating income of Ch$ 4,523 million that correspond mainly to casualty indemnities of Ch$ 3,312 million and to greater secondary market income with respect to that of 2015 of Ch$ 1,263 million.
•14•
![]()
On the other hand, the greater operating costs of Ch$ 79,768 million are mostly attributable to greater energy purchases of Ch$ 50,827 million resulting from higher average physical purchase prices Ch$ 55,967 million, offset by the effects of converting Colombian pesos into Chilean pesos of Ch$ 5,140 million, greater fuel consumption of Ch$ 8,804 million resulting from greater liquid fuels of Ch$ 11,559 million, offset by the effects of converting Colombian pesos into Chilean pesos of Ch$ 2,755 million, greater transportation costs of Ch$ 5,087 million resulting from tariff hikes of Ch$ 6,648 million and greater expenses of Ch$ 2,485 million, offset by the effects of converting Colombian pesos into Chilean pesos of Ch$ 4,046 million, greater other variable procurements and services of Ch$ 5,892 million mostly attributable to tax effects associated to the generation of thermal energy of Ch$ 7,772 million, offset by the effects of converting Colombian pesos into Chilean pesos of Ch$1,880 million, greater depreciation and impairment costs of Ch$ 5,437 million due to greater capitalizations with respect to the previous year, principally because of theEl Quimbo Project of Ch$ 7,691 million, offset by the effects of converting Colombian pesos into Chilean pesos of Ch$ 2,254 million, greater personnel expenses of Ch$ 1,171 million because of lower capitalizations for the Quimbo Project and greater other expenses caused by nature of Ch$ 2,551 million, principally because of increased maintenance to thermal and hydraulic centrals of Ch$ 2,304 million, increased litigation and sanctions of Ch$ 1,407 million, offset by the effects of converting Colombian pesos into Chilean pesos.
The effect of converting the financial statements from Colombian pesos into Chilean pesos in both nine-month periods generated an 8.4% drop in Chilean pesos as of September 2016 with respect to September 2015.
Peru
The operating income of our subsidiaries in Peru totaled Ch$ 82,544 million in 2016; a decrease of Ch$ 35,478 million with respect to the same period of the previous year, whose operating income then reached Ch$ 118,023 million.
Edegel’s operating income reached Ch$ 64,894 million; namely, a reduction of Ch$ 39,694 million as compared with the same period of the previous year, because of greater operating income of Ch$ 21,417 million, principally because of energy sales of Ch$ 6,496 million, greater physical sales of 249 GWh and better average sales prices and greater other tolling income of Ch$ 14,923 million on account of new energy supply reliability charges and price updates.
Operating costs increased by Ch$ 61,111 million, principally because of greater energy purchases of Ch$ 7,378 million on spot markets and provisions, because of customer claims totaling Ch$ 28,287 million, other greater expenses caused by nature of Ch$ 14,816 million, principally caused by the withdrawal theCuribamba Project of Ch$ 13,770 million since it was not a long-term competitive project in a scenario of prolonged downward prices, because of greater fuel consumption of Ch$ 5,450 million, greater thermal generation and maintenance operations to the gas transportation pipeline, greater other variable procurements and services of Ch$ 3,828 million, greater offsets from renewable energies, greater transportation expenses of Ch$ 3,438 million that correspond to new unit charges associated to the principal tolling, and to greater personnel costs of Ch$ 596 million attributable togreater worker benefits. All of the foregoing was offset by lower depreciation and impairment expenses of Ch$ 2,682 million, mostly because of assets that have already completed their useful lives.
•15•
![]()
The subsidiary,Empresa Eléctrica de Piura, increased its operating income by Ch$ 4,213 million as compared to the same period of the previous year, principally because of a greater operating income of Ch$ 7,604 million, mostly attributable to greater energy sales of Ch$ 4,461 million as a result of greater physical sales of 52 GWh and other greater sales totaling Ch$ 3.219 million corresponding to greater gas sales. Operating costs, however, increased by Ch$ 3,391 million, principally because of greater fuel consumption of Ch$ 2,338 million, the operational start-up of the T-G5 Turbine (cold reserve), greater transportation costs of Ch$ 882 million, increased energy demand and greater tolling unit prices, greater personnel costs of Ch$ 314 million, greater expenses in energy purchases of Ch$ 156 million, greater depreciation and impairment expenses of Ch$ 86 million, other variable procurements and services totaling Ch$ 63 million; whereas, the foregoing was offset by lower other expenses caused by nature totaling Ch$ 448 million.
The effect of converting the financial statements from Peruvian soles to Chilean pesos in both fiscal years generated a 1.1% reduction in Chilean pesos as of September 2016 with respect to September 2015.
b) Discontinued operations:
Chile
The operating income in Chile increased by Ch$ 132,329 million upon going from Ch$ 229,352 million as of September 2015 to Ch$ 361,681 million this present year, principally because of greater operating income of Ch$ 144,848 million. Such better results were the consequence of greater physical sales (+ 651 GWh) mostly to regulated customers for increased demand and of better average energy sales prices stated in pesos.
On the other hand, operating costs increased by Ch$ 12,519 million as compared to the same period of the previous year, mainly because of lower costs on account of fuel consumption of Ch$ 36,994 million, explained mostly because of better fuel unit prices given the drop in international commodity prices and the substitution of GNL thermal dispatches instead of coal, mostly attributable to the better availability of the Bocamina complex, to lower expenses in other procurements and services of Ch$ 13,878 million, principally because of lower costs associated to the agreement executed with AES Gener, which permitted using Enel Generación Chile’s available GNL in Nueva Renca’s combined cycle of Ch$ 14,840 million, lower personnel costs of Ch$ 5,608 million, mostly because of a smaller payroll and lower capitalization of expenses to projects and; finally, because of lower expenses on account of depreciation and impairment of Ch$ 13,337 million, principally because of a 2-month-stoppage-depreciation caused by organizational restructuring pursuant to IFRS rules.
The foregoing is offset partially by greater other expenses caused by nature of Ch$ 35,817 million, which is mostly explained by asset write-offs related to the Bardón, Chillan 1, Chillan 2, Futaleufú, Hechún and Puelo projects. Such write-offs amounted to Ch$ 35,834 million and arose as a consequence of the Company’s decision to waive its water use rights associated to these projects, considering, among other aspects evaluated: the high annual cost implied in maintaining such water rights without using them; that these projects were not technically or economically feasible to execute; and, that they did not have sufficient support from the local communities. Greater energy purchases of Ch$ 23,410 million, explained mostly by greater physical sales (+694 GWh). It should be noted, however, among other factors, that replacing GNL for coal in thermal dispatches meant that, onaverage, marginal costs dropped with respect to 2015; which, in turn, enabled to partly offset the greater volume of spot purchases carried out during 2016. Additionally, the greater transportation and other costs of Ch$ 23,101 million, are owed mainly to greater tolling services related to greater sales.
•16•
![]()
The distribution line of business, including discontinued operations as if such operations would not have been performed by the Enersis Américas Group,increased its operating income during the period by Ch$ 34,363 million, equivalent to 6.6% as compared to the same period of the previous year, reaching Ch$ 552,305 million. Physical sales increased by 447 GWh, equivalent to an 0,8% variation with respect to the same period of the previous year, reaching 59,120 GWh The number of customers increased by 377 thousand, reaching 15.49 million, that is 2,5 % more than last year.
The operating income for the distribution line of business, broken down on a country-by-country basis and including discontinued operations as if the operation would not have been performed, is shown in the following table, which compares the incomes between the years 2016 and 2015.
OPERATING INCOME BY COUNTRY | |||||||||||||||
Distribution | |||||||||||||||
(Figures in million Ch$) | |||||||||||||||
Discontinued | Continuing Operations | ||||||||||||||
COUNTRY | Chile | Argentina | Brazil | Colombia | Peru | Total Continuing | Total | ||||||||
| Sep-16 | Sep-15 | Sep-16 | Sep-15 | Sep-16 | Sep-15 | Sep-16 | Sep-15 | Sep-16 | Sep-15 | Sep-16 | Sep-15 | Sep-16 | Sep-15 | |
Operating Revenues | 994,087 | 930,399 | 499,360 | 448,747 | 1,167,935 | 1,422,255 | 671,930 | 658,013 | 444,386 | 409,358 | 2,783,612 | 2,938,373 | 3,777,699 | 3,868,772 | |
|
|
|
|
|
|
|
|
|
|
|
|
|
|
| |
Operating Costs | (872,629) | (818,318) | (418,233) | (390,873) | (1,085,261) | (1,328,061) | (490,921) | (481,655) | (358,349) | (331,923) | (2,352,765) | (2,532,512) | (3,225,394) | (3,350,830) | |
|
|
|
|
|
|
|
|
|
|
|
|
|
|
| |
Operating Income | 121,458 | 112,081 | 81,127 | 57,874 | 82,674 | 94,194 | 181,009 | 176,358 | 86,037 | 77,435 | 430,847 | 405,861 | 552,305 | 517,942 | |
Change in million Ch$ and % | 9,377 | 8.4% | 23,252 | (40.2%) | (11,520) | (12.2%) | 4,651 | 2.6% | 8,602 | 11.1% | 24,986 | 6.2% | 34,363 | 6.6% | |
a) Continuing operations:
Argentina
In Argentina, our Edesur subsidiary increased its operating income by Ch$ 23,252 million, upon going from Ch$ 57,874 million in 2015, to a profit of Ch$ 81,127 million during the present month of September of this year; mostly because:
Operating revenues increased by Ch$ 50,613 million, mostly because of the following effects: greater revenues have been acknowledged as a result of the application of Resolution N° 1/2016 dated January 29, 2016 issued by the ENRE that approved Edesur’s price schedule in effect as of the invoicing corresponding to the meter reading subsequent to zero hours of February 1, 2016. The acknowledged effects of this resolution in the present period totaled Ch$ 315,450 million, corresponding to greater energy sales, which included an increment in physical sales of 199 GWh, offset by the effects of converting Argentinean pesos into Chilean pesos Ch$ 69.322 million and by lower rebates to customers on account of quality-of-service penalties of Ch$ 6,741 million. All of the foregoing was offset by lower operating revenues of Ch$ 212,245 million as a result of the application of ENRE Resolution N° 2/2016 dated January 29, 2016 putting an end -as of January 31, 2016- to the current scheme of application of ENRE’s Resolution N° 347/2012 and Resolution 32/2015 that governs the conversions of Argentinean pesos into Chilean pesos of Ch$ 81,151 million, as well as the deliveryof other services of Ch$ 21,467 million, mainly higher tolling services, offset with the effects of converting Argentinean pesos into Chilean pesos of Ch$ 21,467 million.
•17•
![]()
Operating costs increased by Ch$ 27,360 million, mainly because of higher energy purchases to the local regulator of Ch$ 128,492 million, offset by the effect of converting Argentinean pesos into Chilean pesos of Ch$ 42,560 million plus greater expenses on account of bad debt provisions of Ch$ 3,899 million, greater depreciation expenses of Ch$ 1,630 million, offset by the effect of converting Argentinean pesos into Chilean pesos of Ch$ 3,859 million. The foregoing was partially offset by lower other expenses caused by nature of Ch$ 25,329 million, mainly attributable to increased maintenance and the renewal of grids, transformers and other expenses totaling Ch$ 12,135 million, offset by the effects of converting Argentinean pesos into Chilean pesos of Ch$ 37,464 million and lower personnel expenses of Ch$ 34,379 million, principally because of a Ch$ 50,599 million conversion effect offset by greater expenses of Ch$ 50,599 million, offset, in turn, by greater expenses of Ch$ 16,220 million due to increased salaries, indemnifications, retirements and social contributions.
Energy losses dropped 0.3 p.p. reaching 12.1% as of September 2016 and the number of Edesur customers increased by 18,000, exceeding 2.49 million customers.
The effect of converting the financial statements from Argentinean pesos to Chilean pesos in both years produced a 34.6% drop in Chilean pesos as of S 2016 compared to September 2015.
Brazil
In Brazil, the operating income of our distribution subsidiaries reached Ch$ 82,674 million; a drop of 12.2%, that is Ch$ 11.520 million, with respect to the same period of the year 2015.
The operating income ofAmpla reached Ch$ 6,904 million; which, when compared to the Ch$ 8,615 million of the previous year, it represents a drop of Ch$ 1,711 million. This is explained by the diminishing operating revenues that dropped by Ch$ 186,142 million because of lower income revenues from energy sales of Ch$ 198,526 million, mostly attributed to a lower income because of the effect of converting Brazilian reals into Chilean pesos of Ch$ 33.548 million, lower income for the net effects of regulatory assets and liabilities of Ch$ 179,929 million, offset by greater income of Ch$ 20,643 million, principally Pis/Cofins taxes, and by greater energy sales of 184 GWh and tariff adjustments totaling Ch$ 61,946 million and lower income from other sales and other services of Ch$ 2,687 million, mostly because of the effects of converting Brazilian reals into Chilean pesos. The foregoing, offset by greater other operating revenues of Ch$ 15,071 million, among which are the effects of the IFRIC 12 construction costs amounting Ch$ 4,190 million, increases in equipment and other leases of Ch$ 5,604 million, income on account of penalties levied on customers of Ch$ 7,550 million and other income on public lighting rates and other income of Ch$ 3,349 million, offset by the effects of converting Brazilian reals into Chilean pesos of Ch$ 5,622 million.
On the other hand, operating costs dropped by Ch$ 184,431 million, which are principally explained by lower energy purchase costs of energy contracted in non-regulated environments of Ch$ 203,851 million, impacted by the effects of converting Brazilian reals into Chilean pesos of Ch$ 24,777 million, lower transportation expenses of Ch$ 4,199 million, mostly attributable to the effects of converting Brazilian reals into Chilean pesos of Ch$ 1,944 million and lower costs because of a lower demand of Ch$ 2,255 million and lower personnel expenses of Ch$ 3,742 million, mostly because of the effects of converting Ch$ 1,413 million and greater capitalized personnel costs of Ch$ 2,329 million. The foregoing, offset by greater other expenses caused by nature of Ch$ 15,631 million, principally forcollection and measurement services of Ch$ 12,979 million and the effects of decommissioned (offset) fixed assets of Ch$ 6,611 million, offset by the effects of converting Brazilian reals into Chilean pesos of Ch$ 3,959 million and by greater depreciation and impairment costs of Ch$ 11,768 million, mostly because of greater registers of non-recoverable debtors (bad debt) of Ch$ 10,625 million.
•18•
![]()
Physical sales increased by 184 GWh reaching 8,410 GWh as of September 2016. Energy losses increased by 0.6 p.p., going from 19.0% to 19.6%, as of September 2016. Ampla expanded its customer base by 63 thousand, thereby now exceeding 3.03 million customers.
OurCoelce subsidiary decreased its operating income by Ch$ 9,809 million, amounting Ch$ 75,770 million.
This is explained by operating revenues diminishing by Ch$ 68,177 million, because of lower income on account of energy sales of Ch$ 87,104 million, principally because of lower income for the effects of converting Brazilian reals into Chilean pesos of Ch$ 29,129 million, lower income for the net effects of regulatory assets and liabilities of Ch$ 86,659 million, lower income because of a lower cost recovery for hydrological risks of Ch$ 50,412 million, lower income on account of metered energy and low-rent subsidies of Ch$ 41,280 million, offset by greater income of Ch$ 8,579 million, principally attributable to Pis/Cofins taxes, and greater energy sales of 227 GWh, and tariff adjustments of Ch$ 111,783 million, and lower income from other sales and other services of Ch$ 1,610 million, principally because of the effects of converting Brazilian reals into Chilean pesos. The foregoing was offset by greater other operating revenues of Ch$ 20,538 million, among which are the effects of the IFRIC 12 construction costs of Ch$ 9,949 million, increases in equipment and other leases of Ch$ 5,406 million, income on account of penalties levied to customers of Ch$ 7,881 million, offset by the effects of converting Brazilian reals into Chilean pesos of Ch$ 2,698 million.
On the other hand, operating costs dropped by Ch$ 58,369 million, on account of lower energy purchases of Ch$ 79,136 million, which includes the effects of converting Brazilian reals into Chilean pesos of Ch$ 19,623 million, and lower real purchases of Ch$ 59,513 million of energy contracted in non-regulated environments, lower transportation costs of Ch$ 540 million, lower personnel expenses of Ch$ 2,785 million, capitalizations of Ch$ 1,945 million plus the effects of converting Brazilian reals into Chilean pesos of Ch$ 840 million. The foregoing, offset by greater other variable procurements and services of Ch$ 6,584 million, principally because of the effects of the IFRIC 12 construction of Ch$ 9,949 million net of the conversion effects of Ch$ 3,087 million, greater other expenses caused by nature of Ch$ 6,670 million, third-party collection and measuring service contracts amounting to Ch$ 8,971 million, offset by the effects of converting Brazilian reals into Chilean pesos of Ch$ 2,301 million and by greater depreciation and impairment costs of Ch$ 10,838 million, principally because of greater registers of non-recoverable debtors (bad debt) of Ch$ 10,414 million
Physical sales increased by 227 GWh, reaching 8,569 GWh in 2016. Energy losses increased by 1.0 p.p. reaching 13.0% as of September 2016, and the number of Coelce’s customers increased by 137 thousand, exceeding 3.85 million customers.
The effect of converting the financial statements from Brazilian reals into Chilean pesos in both periods caused a 5.3% reduction of Chilean pesos as of September 2016 with respect to September 2015.
Colombia
In Colombia,Codensa’s operating income reached Ch$ 181,009 million, reflecting an increase Ch$ 4,651 million with respect to the previous year. This is explained because operating revenues increased by Ch$ 13,917 million, principally because of greater income related to better average salesprices of Ch$ 1,526 million and greater demand in the regulated market of Ch$ 58,153 million, offset by the effect of converting Colombian pesos into Chilean pesos Ch$ 45,101 million, lower other services provided by Ch$ 1,005 million because of the effect of converting Colombian pesos into Chilean pesos of Ch$ 9,664 million net of greater income on account of the leasing of grids and posts and the maintenance of public lighting infrastructure of Ch$ 8,659 million, lower other sales of Ch$ 89 million offset by greater other operating revenues of Ch$ 433 million.
•19•
![]()
On the other hand, operating costs also increased by Ch$ 9,266 million, principally because of greater energy purchases of Ch$ 11,889 million, whose effects were greater purchases of Ch$ 35,065 million, offset by the effect of converting Colombian pesos into Chilean pesos of Ch$ 23,176 million, greater transportation costs of Ch$ 3,209 million, mainly because of increased tariffs for the use of grids of Ch$ 8,400 million, offset by the effect of converting Colombian pesos into Chilean pesos Ch$ 5,191 million and other variable procurement and service expenses of Ch$ 1,143 million, mostly attributable to maintenance costs of Ch$ 2,056 million, contributions and taxes of Ch$ 1,604 million, offset by the effects of converting Colombian pesos into Chilean pesos of Ch$ 2,517 million. In addition to lower other expenses caused by nature of Ch$ 4,356 million, lower depreciation and impairment costs of Ch$ 1,604 million and lower personnel expenses of Ch$ 1,015 million, all of it because of the effects of converting Colombian pesos into Chilean pesos.
Physical sales dropped by 325 GWh reaching 10,105 GWh in 2016. Energy losses increased by 0.1 p.p. reaching 7.3% as of September 2016 and the number of Codensa customers increased by 87 thousand, exceeding 2.93 million customers.
The effect of converting the financial statements from Colombian pesos into Chilean pesos in both fiscal years caused an 8.4% drop in Chilean pesos as of September 2016 with respect to September 2015.
Peru
In Peru, the operating income in ourEdelnor subsidiary amounted to Ch$ 86,037 million, showing an increase of Ch$ 8,602 million with respect to that of the same period of the previous year, which is mostly explained by increased operating revenues of Ch$ 35,028 million, mostly attributable to greater physical sales during the period of 114 GWh of Ch$ 36,975 million, offset by the effects of converting Peruvian soles into Chilean pesos of Ch$ 4,261 million, greater other services provided of Ch$ 5,222 million, principally because of the movement of grids and other works, offset by lower other sales of Ch$ 2,145 million inMundo Hogar and lower other spending revenues of Ch$ 763 million. Greater operating costs of Ch$ 26,426 million, mostly because of greater energy purchases of Ch$ 27,694 million from regulated and free markets in order to meet a greater demand from customers totaling Ch$ 30,518 million, offset by the effect of converting Peruvian soles into Chilean pesos of Ch$ 2,824 million, greater depreciation and impairment expenses of Ch$ 1,873 million on account of greater capitalizations in low and high-tension distribution lines and lower personnel expenses of Ch$ 1,229 million because of greater allowances and bonds offsetting greater expenses in other variable procurements and services of Ch$ 3,835 million from overhead maintenance costs and lower other expenses caused by nature of Ch$ 535 million.
Physical sales increased by 114 GWh, reaching 5,824 GWh as of September 2016. Energy losses increased by 0.3 p.p. reaching 8.0% as of September 2016. The number of customers increased by 31 thousand, exceeding 1.36 million customers.
•20•
![]()
The effect of converting the financial statements from new Peruvian soles into Chilean pesos in both fiscal years produced a reduction in Chilean pesos of 1.1 % as of September 2016 as compared to September 2015.
b) Discontinued operations:
Chile
In Chile, the operating income of our Chilectra subsidiary amounted to Ch$ 121,458 million, increasing by Ch$ 9,377 million with respect to the same period of the previous year or equivalent to 8.4%.
Such variation is principally explained by greater operating revenues of Ch$ 63,688 million, as a consequence of increased energy sales of Ch$ 64,885 million both because of greater physical sales of 49 GWh as because of increased tariffs to regulated customers and the greater acknowledgment of the non-applied re-liquidation of Average Node Price Decrees (Decretos de Precio Nudo Promedio) and other greater sales of Ch$ 683 million, offset by diminished revenues from other services provided totaling Ch$ 402 million, mostly attributable to lower transmission tolls with generators and lower other operating revenues of Ch$ 1,478 million caused by diminishing offsets and late payments. The greater operating costs of Ch$ 54,311 million are the result of increased energy purchases of Ch$ 62,026 million caused by greater physical purchases and higher purchasing prices, as compared to those of the same period of the previous year, by greater personnel expenses of Ch$ 1,584 million because of higher indemnifications and life insurance policies and greater transportation costs of Ch$ 973 million, offset by lower other expenses caused by nature of Ch$ 5,551 million due to lower transmission line lease rentals, lower procurement and service expenses of Ch$ 859 million, lower service costs and lower other depreciation and impairment costs of Ch$ 3,862 million, mostly attributable to the depreciation of the 2-month organizational restructuring depreciation pursuant to IFRS rules.
Energy losses increased by 0.3 p.p. reaching 5.3% as of September 2016. Physical energy sales grew by 49 GWh reaching 12,009 GWh during the current period. The number of customers increased by 41 mil, reaching 1.81 million.
Following is a summary of the revenues, operating costs and operating income of the subsidiaries of the Enersis Américas Group, for the fiscal periods ending as of September 2016 and 2016 of the continuing operations:
•21•
![]()
Operating Income Detail (Continuing Operations) | ||||||
(Figures in million Ch$) | ||||||
| Sep-16 | Sep-15 | ||||
#REF! | Operating Revenues | Operating Costs | Operating Income | Operating Revenues | Operating Costs | Operating Income |
Endesa Américas consolidated | 1,002,012 | (600,789) | 401,223 | 905,918 | (468,609) | 437,309 |
Cachoeira Dourada | 131,587 | (73,364) | 58,223 | 71,494 | (20,380) | 51,114 |
CGTF | 117,389 | (79,078) | 38,311 | 117,665 | (97,090) | 20,575 |
Cien | 39,804 | (14,014) | 25,790 | 46,790 | (17,792) | 28,998 |
Edesur S.A. | 499,360 | (418,233) | 81,127 | 448,747 | (390,873) | 57,874 |
Edelnor S.A. | 444,386 | (358,353) | 86,033 | 409,358 | (331,926) | 77,432 |
Ampla | 605,905 | (599,001) | 6,904 | 792,047 | (783,432) | 8,615 |
Coelce | 562,030 | (486,260) | 75,770 | 630,208 | (544,629) | 85,579 |
Codensa S.A. | 671,930 | (490,921) | 181,009 | 658,013 | (481,655) | 176,358 |
Cemsa | 1,456 | (1,695) | (239) | 590 | (2,626) | (2,036) |
Dock Sud | 67,665 | (60,355) | 7,310 | 45,073 | (46,134) | (1,061) |
EE Piura | 49,446 | (31,809) | 17,637 | 41,842 | (28,418) | 13,424 |
Holding Enersis y soc. inversión | 14,647 | (57,319) | (42,672) | 4,173 | (31,404) | (27,231) |
Consolidation Adjustments | (385,574) | 384,503 | (1,071) | (247,511) | 249,199 | 1,688 |
Total | 3,822,043 | (2,886,688) | 935,355 | 3,924,407 | (2,995,769) | 928,638 |
(1) Company merged in 2015 by Servicios Informaticos e Inmobiliarios Ltda.(ex ICT) | ||||||
The following table shows non-operating results of continuing operations for the periods ended as of September 2016 and 2015:
FINANCIAL RESULT | ||||
(Figures in million Ch$) | ||||
CONSOLIDATED INCOME STATEMENT (million Ch$) | Sep-16 | Sep-15 | Change | % Change |
Net Financial Income | (242,967) | (96,706) | (146,261) | (151.2%) |
Financial Income | 151,289 | 191,487 | (40,198) | (21.0%) |
Financial Costs | (406,407) | (271,583) | (134,824) | (49.6%) |
Gain (Loss) for indexed assets and liabilities | (584) | (6,418) | 5,834 | 90.9% |
Foreign currency exchange differences, net | 12,735 | (10,192) | 22,927 | 225.0% |
Other Non Operating Income | 2,259 | 4,583 | (2,324) | (50.7%) |
Net Income From Sale of Assets | 666 | 721 | (55) | (7.6%) |
Share of profit (loss) of associates accounted for using the equity method | 1,593 | 3,862 | (2,269) | (58.8%) |
|
|
|
|
|
Net Income Before Taxes | 694,647 | 836,515 | (141,868) | (17.0%) |
Income Tax | (186,286) | (377,182) | 190,896 | 50.6% |
Net Income | 508,361 | 459,333 | 49,028 | 10.7% |
•22•
![]()
Financial income
Thefinancial income of the continuing operations amounted to an expense of Ch$ 242,967 million, representing Ch$ 146,261 million more than that of the same period of the year 2015. The foregoing is mostly explained by:
Lowerfinancial revenues of Ch$ 40,198 million due mostly to lower revenues in Edesur of Ch$ 31,993 million as a result of CAMMESA’s remission of interest payments pursuant to Note E 1208/2015 recorded in 2015 and to lower financial revenues in Brazil of Ch$ 12,763 million, principally in Ampla and Coelce, because of lower revenues from regulatory assets, offset by increased financial capitalizations pursuant to IFRIC 12 amounting to Ch$ 6,480 million.
Greater financial expenses of Ch$ 134,824 million, principally because of greater financial expenses inEdesur of Ch$ 46,056 million, as a consequence of the financial capitalization of quality-of-service penalties, greater expenses incurred in the Argentinean subsidiaries:Edesur,Dock Sud andEndesa Costanera totaling Ch$ 21,421 million, mostly because of a greater debt with CAMMESA and greater financial expenses inEmgesa, our Colombian subsidiaries totaling Ch$ 60,236 million, principally because of the lower capitalization of financial expenses in the construction of theEl Quimbo central that began operating in November 2015, plus the financial expenses accrued from financial loans.
Higher expenses on account of indexed units of Ch$ 5,834 million, principally because of the lower effects of UF-denominated financial debt owned by certain Chilean subsidiaries.
Lower expenses on account of exchange rate differences of Ch$ 22,927 million, principally because of positive foreign exchange differences brought about by the dollarization ofVOSA’s accounts receivable totaling Ch$ 32,198 million, offset by negative effects inAmpla caused by foreign-exchange-denominated financial debt of Ch$ 10,214 million.
Corporate taxes
Corporate gains tax expenses dropped by Ch$ 190,896 million,which is principally explained because of lower taxes in Brazil, because of a lower taxable base as compared with that of the previous year of Ch$ 34,108 million, lower taxes in Enersis Américas resulting from foreign exchange conversions of foreign investments of Ch$ 183,901 million, lower taxes in Colombia of Ch$ 8,581 million, in Peru of Ch$ 5,373 million, offset by higher taxes in Argentina of Ch$ 23,125 million because of the expiration ofEdesur’s credit tax losses and greater costs of Ch$ 17,944 million for registering the deferred taxes of the tax badwill caused by the merger (absorption) of Chilectra Américas.
•23•
![]()
ANALYSIS OF THE FINANCIAL SITUATION
Assets (million Ch$) | Sep-16 | Dec-15 | Change | % Change |
SVS | ||||
Current Assets | 2,988,832 | 2,589,626 | 399,206 | 15.4% |
Non Current Assets | 7,926,594 | 7,535,593 | 391,002 | 5.2% |
Discontinued Operations | - | 5,323,936 | (5,323,936) | (100.0%) |
Total Assets | 10,915,426 | 15,449,154 | (4,533,728) | (29.3%) |
The Company’s total assets, including those to be distributed to its property owners, present, as of September 2016, a drop of Ch$ 4,533,728 million with respect to those of December 2015, principally as a consequence of:
Ø Current assets increased by Ch$ 399,206 million, equivalent to 15.4%, explained by:
· Increased cash and cash equivalent totaling Ch$ 374,287 million, an increase in Enel Brazil of Ch$ 131,286 million, basically from operating collections, the reimbursement of related loans and dividends received from subsidiaries, an increase in Emgesa of Ch$ 134,866 million because of new loans and operating collections, an increase in Edesur of Ch$ 57,803 million on account of immediate-liquidity time deposits and from Edegel and Piura totaling Ch$ 54,354 million on account of greater operating collections.
· Increased other current financial assets of Ch$ 20,286 million, explained principally because of Enersis Américas’ increased time deposits of Ch$ 15,137 million, Codensa’s increased time deposits of Ch$ 11,009 million, offset by a drop of Ch$ 5,005 million in Grupo Enel Brazil’s 90-day time-deposit redemptions and others totaling Ch$ 855 million.
· Decreased commercial accounts receivable and other sundry accounts receivable totaling Ch$ 401 million, mostly explained by increased accounts receivable from energy sales to free and regulated customers in Edesur totaling Ch$ 26,094 million, in Codensa totaling Ch$ 12,244 million, in Enel Brazil’s Group totaling Ch$ 17,868 million, offset by drops in Dock Sud totaling Ch$ 21,672 million, in EE Piura totaling Ch$ 6,572 million and in Emgesa totaling Ch$ 28,134 million.
· Increased accounts receivable from currently related companies totaling Ch$ 4,247 million, principally from accounts receivable from Enel Chile totaling Ch$ 4,484 million.
· Reduced stock inventories of Ch$ 22,738 million, principally in Edesur of Ch$ 27,954 million, as a result of a greater consumption of materials, in Edelnor of Ch$ 3,473 million from a greater consumption of electric materials, offset by Ch$ 9,079 from Codensa corresponding to the purchase of infrastructure and grid materials.
· Increased assets from current taxes amounting to Ch$ 40,001 million, principally in: Endesa Américas, Enersis Américas and Chilectra Américas for the acknowledgment of recoverable tax rebates of tax credits on dividends received from foreign subsidiaries totaling Ch$ 22,928 million, the greater effects of PPM monthly tax payments and Endesa Brazil’s new fiscal credits totaling Ch$13,042 million.
•24•
![]()
· Reduced assets included in asset groups for divestiture classified as kept for sale or maintained to be distributed to property owners totaling Ch$5.323.936million, resulting from the application of NIFF 5 in December 2015 on account of the organizational restructuring approved by the Shareholders’ Meeting of December 18, 2015.
Ø Increased non-current assets of Ch$ 391.002 million equivalent to 5.2%, mostly attributable to:
· An increase of real estate properties, plants and equipment totaling Ch$2,142million, mostly corresponding to new investments during the year amounting to Ch$356.192million, offset by a yearly depreciation of Ch$174,809 million, with asset redemptions of Ch$18,009 million, conversion effects from the various functional currencies of the companies totaling Ch$152,249million, plus the negative impact of other movements totaling Ch$8,983million.
· Reduced commercial accounts receivable and other non-current receivables of Ch$54,005million mainly corresponding to Endesa Brazil of Ch$34,873million for diminished acknowledgements of sector assets, a Ch$19,132million reduction on account of the dollarization of the accounts receivable of the Argentinean regulator for the construction ofCentral de Vuelta Obligado (VOSA) in: Endesa Costanera, Central Dock Sud and Hidroeléctrica El Chocón, due mostly to currency conversion effects.
· Increased intangible assets other than goodwill of Ch$ 181,125 million, principally from the new investments of the period of Ch$ 176,915 million, plus the effects of converting the various functional currencies of the companies amounting to Ch$ 121,317 million, partially offset by the period’s depreciation and impairment of Ch$ 61,867 million, asset redemptions totaling Ch$ 12,423 million, transfers to financial assets pursuant to IFRIC 12 rules, and Coelce of Ch$ 38,236 million, and other negative movements totaling Ch$ 4,581 million.
· Increased assets on account of deferred taxes of Ch$ 78,805 million, explained principally by temporary differences in the Enel Brazil Group of Ch$ 23,501 million, that include acknowledging contingency provisions of Ch$ 5,957 million, financial instruments of Ch$ 3,954 million, currency conversion effects of Ch$ 6,670 million, and others such as employment benefits and sundry provisions of Ch$ 5,032 million. The Ch$ 55,304 million difference corresponds, principally, to the acknowledgment of fiscal losses attributable to foreign investments and to the effects of converting the various functional currencies of the companies.
· Increased other non-current assets totaling Ch$ 147,925 million, mostly attributable to the effects of converting Brazilian reals into Chilean pesos for the account receivable upon expiration of the IFRIC 12 concession in the Brazilian distributors Ampla and Coelce; additionally, it includes the period’s increased capitalizations.
Total liabilities, including those to be distributed to property owners, in addition to the Company’s total shareholders’ equity, dropped by Ch$ 4,533,728 million as compared to December 2015. This is mostly explained because of a drop in current assets of Ch$ 46,384 million, to a reduction of shareholders’ equity of Ch$ 2,792,223 million, a reduction of the liabilities included in asset groups kept for distribution to property owners of Ch$ 1,945,652 million and increased non-current liabilities totaling Ch$ 250.530 million.
•25•
![]()
Liabilities (million Ch$) | Sep-16 | Dec-15 | Change | % Change |
SVS | ||||
Current Liabilities | 2,513,345 | 2,559,729 | (46,384) | (1.8%) |
Non Current Liabilities | 3,004,495 | 2,753,965 | 250,530 | 9.1% |
Discontinued Operations | - | 1,945,652 | (1,945,652) | (100.0%) |
Total Shareholders' Equity | 5,397,586 | 8,189,808 | (2,792,223) | (34.1%) |
Attributable to shareholders of the company | 3,796,393 | 6,026,149 | (2,229,756) | (37.0%) |
Attributable to minority interest | 1,601,192 | 2,163,659 | (562,467) | (26.0%) |
Total Liabilities and Shareholders' equity | 10,915,426 | 15,449,154 | (4,533,728) | (29.3%) |
Ø Non-current liabilities increased by Ch$ 250,530 million, equivalent to a 9.1% variation, mostly explained by:
· Increased other non-current liabilities (financial debt and derivatives) totaling Ch$ 181,662 million, mainly because of an increase in Ampla Energía of Ch$ 62,311 million upon it taking a loan from Santander Chile bank of Ch$ 51,724 million, plus the effects of converting Brazilian reals into Chilean pesos and transfers to short-term in Emgesa of Ch$ 134,336 million, including the conversion effect of Ch$ 22,336 million that is mostly explained by the placement of bonds totaling Ch$ 183,173 million, offset by transfers from long-term to short-term of Ch$ 48,837 million, a reduction in Edegel of Ch$ 18,698 million on account of transferring to the short-term of a portion of Leasing Scotiabank’s Ch$18,697 million including a currency conversion totaling Ch$ 3,221 million.
· Increased other non-current provisions of Ch$ 46,715 million, principally because of the capitalization of legal claims in Brazil of Ch$ 33,935 million, increased environmental provisions in Emgesa of Ch$ 9,724 million and increased civil and labor provisions in Codensa of Ch$ 2,573 million.
· Increased provisions on account of non-current employee benefits of Ch$ 16,034 million, explained principally by the capitalization of actuarial liabilities.
Ø Current liabilities dropped by Ch$ 46,384 million, equivalent to a 1.8% variation, explained mostly by:
· Increased other non-current financial liabilities (financial debt and derivatives) of Ch$ 159,861 million, principally because of an increase in Ampla Energía of Ch$ 51,509 million for transferring bank debt (BNDS) to short-term plus the effects of converting Brazilian reals into Chilean pesos and transfers to short-term in Emgesa totaling Ch$ 46,502 million, principally the transfer to the short-term of bonds with an expiration of under one year, offset by the transfer to the short-term of bank bonds and loans totaling Ch$ 71,123 million, offset by bank credit payments amounting to Ch$ 24,621 million, an increase in Coelce of Ch$ 19,700 million because of a transfer to short-term of bank loans (BNDS), increases in Codensa totaling Ch$58,347 million explained by transfers from the long-term to the short-term of bonds expiring within less than one year totaling Ch$ 86,924 million, offset by bond payments totaling Ch$ 32,194 million, offset by a reduction in Edegel of Ch$ 19,056 million, explained by the payment of 2nd issue bonds totaling Ch$ 6.810 million and the payment of Scotiabank loans amounting to Ch$ 12,108 million.
•26•
![]()
· A drop in commercial accounts and other current accounts payable of Ch$ 96,598 million; whose variation corresponds to drops in energy purchases in Codensa of Ch$ 18,427 million, in Edelnor of Ch$ 21,953 million and in Ampla of Ch$ 92,655 million, a drop in Colpatria Bank accounts payable by Codensa Hogar of Ch$ 21,538 million, offset by the effects of converting foreign currencies into Chilean pesos totaling Ch$ 57,975 million.
· Reduced liabilities on account of current taxes of Ch$ 38,400 million, mostly due to income tax payments of the previous year in Enersis Américas and Endesa Américas of Ch$ 37,212 million.
· Reduced accounts payable to related entities of Ch$63.069million, mostly attributable to dividend payments to companies of the group.
· Reduced other current provisions of Ch$ 4,438 million, principally for using provisions in the environmental project of El Quimbo central in Colombia of Ch$ 36,179 million, offset by increased quality-of-service penalty provisions in Edesur of Ch$ 29,931 million.
· Reduced Liabilities included in asset groups for divestiture classified as kept for sale or maintained to be distributed to property owners of Ch$ 1,945,652 million, resulting from the application of NIFF 5 on December 2015 on account of the organizational restructuring approved by the shareholders’ meeting of December 18, 2015.
Ø Total Shareholders’ Equity dropped by Ch$ 2,792,222 million with respect to December 2015.
· The portion attributable to the property owners of the controller diminished by Ch$ 2,229,756 million, explained by the year’s result of Ch$ 362,582 million, the increase in other integral results of Ch$ 114,573 million, mostly due to conversion differences of the year amounting to Ch$ 119.061 million, plus cash flow hedging totaling Ch$ 1,409 million, minus loss reserves for pension plan benefits totaling Ch$ 4,342 million and minus other reserves of Ch$ 1,555 million, in addition to dividend payments totaling Ch$ 81,950 million. Additionally, as a result of the companies’ spin-off process, Ch$ 2,229,109 million of capital and of other positive sundry reserves totaling Ch$ 1,019,002 million were been transferred over to Enersis Chile and a reduction of accumulated profits totaling Ch$ 1,414,853 million.
· Non-controlling shareholdings dropped by Ch$ 562,467 million, mostly explained by the year’s result of Ch$ 260,909 million, increased by other integral results of Ch$ $ 6,004 million, offset by the distribution of dividends to minority shareholders totaling Ch$ 189,584 million and the effects of the companies’ spin-off process of Ch$ 639,796 million.
•27•
![]()
The evolution of the main financial indicators of continuing operations is the following:
Indicator | Unit | Sep-16 | Dec-15 | Sep-15 | Change | % Change | |
Liquidity | Current liquidity | Times | 1.19 | 1.01 | - | 0.18 | 17.8% |
| Acid ratio test (1) | Times | 1.16 | 0.97 | - | 0.19 | 19.6% |
| Working Capítal | MMCh$ | 475,487 | 29,897 | - | 445,590 | 1490.4% |
Leverage | Leverage | Times | 1.02 | 0.65 | - | 0.37 | 56.9% |
| Short Term Debt | % | 45.6% | 48.2% | - | (2.7%) | (5.5%) |
| Long Term Debt | % | 54.5% | 51.8% | - | 2.7% | 5.1% |
| Financial Expenses Coverage (2) | Times | 3.12 | - | 4.15 | (1.04) | (24.9%) |
Profitability | Operating Income/Operating Revenues | % | 24.5% | - | 23.7% | 0.8% | 3.4% |
| ROE (annualized) | % | 12.6% | - | 12.1% | 0.5% | 4.3% |
| ROA (annualized) | % | 8.3% | - | 7.8% | 0.5% | 6.6% |
(1) Current assets net from inventories and advanced payments | |||||||
(2) Considers EBITDA divided by financial expenses | |||||||
Theliquidity index as of September 2016 reached 1.19 times, showing a 17.8% variation as compared to December 2015. The Company indeed enjoys an excellent liquidity position as a result of its available cash.
Theleverage ratio was 1.02 times as of September 30, 2016, increasing by 56.9% with respect to December 31, 2015, mainly because of greater non-current liabilities as compared to December 31, 2015.
Thehedging of financial costs shows a drop of 1.04 times or the equivalent of 24.9%, going from 4.15 times, in September 2015, to 3.12 times during the current year, mostly due to increased financial costs during the period with respect to the previous year compared to the increase in EBITDA.
Theprofitability index, measured in terms of operating income over operating revenues increased by 3.4%, reaching 24.5% as of September 2016.
On the other hand, thereturn on equity of the controller’s property owners (controller) reached 12.6%, with an increase of 4.3% with respect to the previous year.
Thereturn on assets increased from 7.8%, as of December 2015, to 8.3% during the current year, mostly because of the remittal of assets out of Chile with respect to 2015.
•28•
![]()
MAIN CASH FLOWS
During this year, the Company generated a positive net cash flow of Ch$ 239,923 million; broken down by following main items:
Cash Flow (million Ch$) | Sep-16 | Sep-15 | Change | % Change |
From Operating Activities | 1,157,973 | 1,223,495 | (65,522) | (5.4%) |
From Investing Activities | (358,411) | (964,314) | 605,903 | (62.8%) |
From Financing Activities | (559,639) | (880,480) | 320,841 | (36.4%) |
Net Cash Flow | 239,923 | (621,299) | 861,222 | (138.6%) |
* Includes continuing and discontinued operations | ||||
As of September 30, 2016, the activities of the operation generated a net cash flow of Ch$ 1,157,973 million, showing a 5.4% drop as compared to the same period of the previous year. This cash flow is mainly comprised of sale collection proceeds and other revenues of Ch$ 5,433,666 million, collections of other operating revenues of Ch$ 304,508, offset by supplier payments totaling Ch$ 2,638,313 million, payments to employees of Ch$ 347,639 million, profit tax payments of Ch$ 327,783 and other operating payments of Ch$ 1,266,736 million.
Theinvestment activities generated a negative cash flow of Ch$ 358,411 million, which is mostly explained by disbursements on account of the incorporation of real estate and plant and equipment of Ch$ 438,502 million, the incorporation of intangible IFRIC 12 assets worth Ch$ 167,717 million, payment of derivatives of futures and financial swap contracts of Ch$ 3,980 million, +90-day investments of Ch$ 340,525 million, and other cash disbursements of Ch$ 15,867 million, the foregoing offset by +90-day investment redemptions (retrievals) of Ch$ 356,308 million, collections on futures contracts, option terminations and financial swaps of Ch$ 6,547 million, collections on futures contracts, option terminations and financial swaps of Ch$ 6.547 million, revenue on account of the sale of real estate property of Ch$ 15,230 million, interest payments received amounting to Ch$ 61,478 million, dividends received totaling Ch$ 1,167 million and collections from related entities totaling Ch$ 167,450 million on account of the payment of an Enel Generación Chile S.A.’s structured loan.
Thefinancing activities generated a net negative cash flow of Ch$ 559,639 million, mostly from loan payments of Ch$ 380,412 million, dividend payments of Ch$ 374.800 million for interest payments of Ch$ 176,911 million, payments to minority shareholders on account of Pehuenche’s equity capital reduction of Ch$ 1,805 million, payment of liabilities for leases of Ch$ 15,068 million and other cash disbursements of Ch$ 208,873 million resulting mainly from the splitting of cash and cash equivalent by the Company’s restructuring process, offset by the taking of loans totaling Ch$ 598,230 million.
•29•
![]()
The following table shows disbursements on account of the incorporation of property, plant and equipment and their depreciation, of continuing operations, for the years ended on September 2016 and 2015:
PROPERTY, PLANTS AND EQUIPMENT INFORMATION BY COMPANY | ||||
(million Ch$) | ||||
Company | Payments for additions of Property, plant and equipment | Depreciation | ||
Sep-16 | Sep-15 | Sep-16 | Sep-15 | |
Endesa Chile | 48,519 | 432,301 | - | - |
Endesa Américas | 120,173 | - | 77,303 | 78,847 |
Cachoeira Dourada | 2,358 | 2,713 | 3,577 | 3,912 |
CGTF | 5,557 | 12,492 | 4,051 | 4,413 |
CIEN | 774 | 636 | 7,697 | 8,625 |
Chilectra S.A. | 11,502 | 32,526 | - | - |
Edesur S.A. | 62,751 | 155,374 | 7,883 | 9,556 |
Edelnor S.A. | 64,899 | 89,189 | 22,839 | 21,242 |
Ampla (*) | 106,759 | 117,571 | 34,922 | 31,276 |
Coelce (*) | 60,958 | 60,266 | 23,361 | 22,555 |
Codensa S.A. | 110,929 | 93,839 | 42,313 | 45,062 |
Servicios Informaticos e Inmobiliarios Ltda (ex ICT) | 51 | 77 | - | - |
Holding Enersis and investment companies | 2,728 | 4,592 | (168) | (343) |
Cemsa | 100 | 96 | 29 | 30 |
Dock Sud | 3,704 | 38,575 | 8,697 | 6,999 |
EE Piura | 4,457 | 4,321 | 4,173 | 4,087 |
Total | 606,219 | 1,044,568 | 236,677 | 236,261 |
(*) Includes intangible assets concessions | ||||
•30•
![]()
PRINCIPALES RIESGOS ASOCIADOS A LA ACTIVIDAD DEL GRUPOENERSIS AMÉRICAS
The Group’s operations are subject to a broad set of governmental regulations, and any changes introduced in them could affect their operations, economic situation and operating income.
The Group’s operative subsidiaries are subject to a wide range of tariff regulations and other aspects that govern their operations, both in Chile as well as in the other countries in which they operate. Consequently, the introduction of new laws or regulations, such as the modification of laws or regulations currently in effect, could impact their operations, economic situation and operating results
Such new laws or regulations, on occasion, modify regulatory aspects that may affect existing entitlements; which, as the case might be, may adversely affect the group’s future results.
The Group’s operations are subject to wide-ranging environmental regulations that Enersis Américas continuously meets. Eventual modifications introduced to such regulations could impact its operations, economic situation and operating income.
Enersis Américas and its operative subsidiaries are subject to environmental regulations; which, among other things, require preparing and submitting Environmental Impact Studies for projects under study, obtaining licenses, permits and other mandatory authorizations and complying with all the requirements imposed by such licenses, permits and regulations. Just as with any regulated company, Enersis Américas cannot guarantee that:
· Public authorities will approve such environmental impact studies;
· Public opposition will not derive in delays or modifications to any proposed project;
· Laws or regulations will not be modified or interpreted in a manner such as to increase expenses or affect the Group’s operations, plants or plans.
The Group’s commercial operations have been planned in a manner such as to mitigate eventual impacts derived from altered hydrological conditions.
The operations of the Enersis Américas Group include hydroelectric generation and, therefore, they depend from the hydrological conditions that exist at each moment in the broad geographical areas where the Group’s hydroelectric generation facilities are located. If the hydrological conditions generate droughts or other conditions that may negatively impact hydroelectric generation, then, the outcome will be adversely affected, reason why Enersis has established -as an essential part of its commercial policy - to refrain from contractually committing 100% of its generation capacity. The electric business, in turn, is also affected by atmospheric conditions such as mean temperatures that condition consumption. Depending on weather conditions, differences may be generated on the margins obtained by the business.
The financial situation and result of the operations may be adversely affected if the exposure to interest rate fluctuations, commodity prices and foreign exchange rates are not effectively managed.
•31•
![]()
Rate of interest risk.
Interest rate fluctuations modify the fair value of those assets and liabilities that accrue a fixed rate of interest, as well as the future flows of assets and liabilities indexed at a variable rate of interest.
The objective of managing the interest rate risk is to reach a debt structure equilibrium that would enable minimizing debt costs while reducing Income Statement volatility.
Depending on the Group’s estimates and on the objectives of its debt structure, various hedging operations are performed by contracting derivatives to mitigate such risks. The instruments currently used are rate swaps of variable rates to fixed rates.
The comparative structure of the financial debt of the Enersis Group, according to fixed and/or protected and variable rates of interest over total gross debt, after the derivative contracts, is the following:
Gross position:

21.1 Foreign exchange rate risk.
Foreign exchange rate risks are primarily inherent to the following transactions:
· Debt contracted by Group companies denominated in currencies other than those in which their cash flows are indexed.
· Payments to be made for material purchases associated to projects and payment of corporate insurance policy premiums in currencies other than those in which their cash flows are indexed.
· Income of Group companies directly linked to the fluctuation of currencies other than those of its own cash flows.
· Cash flows from foreign subsidiaries to parent companies in Chile exposed to foreign exchange rate variations.
In order to mitigate the foreign exchange rate risk, the hedging policy of the Enersis Group regarding foreign exchange rates is based on cash flows and aims at maintaining a balance between USD-indexed flows and the level of assets and liabilities in such currency. The objective is to minimize the exposure of cash flows to foreign exchange rate variations.
The instruments currently used in compliance with the policy are: cross-currency swaps and foreign exchange rate forwards. Similarly, the policy seeks to refinance debt in each company’s operating currency.
•32•
![]()
21.1 Commodities risk.
The Enersis Américas Group is exposed to the risk of price variations of certain commodities, primarily through:
Fuel purchases in the process of electric energy generation.
Spot energy purchases in local markets.
In order to reduce the risk under extreme drought conditions, the Group has designed a commercial policy that defines sale commitment levels in line with the capacity of its generating centrals during a dry year, by including risk mitigation clauses in some contracts with free clients. In the case of regulated clients subject to long-term tender processes, indexing polynomials are determined in order to reduce commodity exposure.
In consideration of the operative conditions confronted by Chile’s electric generation market, plus the drought and commodity price volatility in international markets, the Company is continuously checking the convenience of hedging the impact of these price variations in its income. As of March 31, 2016 and December 31, 2015, there were no commodities hedging operations in effect.
21.2 Liquidity risk.
The Group maintains a liquidity policy that consists in contracting long-term credit commitment facilities and temporary financial investments for amounts sufficient to support the projected needs of a given period; which, in turn, is a function of the overall situation and expectations of the debt and capital markets.
The above-mentioned projected needs include maturities of net financial debt; namely, after financial derivatives. For additional information regarding the characteristics and the terms and conditions of such financial debt and financial derivatives (see notes 19, 21 and Annex 4 hereunder).
As of September 30, 2016 the Enersis Américas Group had a liquidity position of M$ 1,559,450,200 in cash and cash equivalents and of M$ 40,896,629 in unconditionally-available long-term lines of credit. As of December 31, 2015, the Enersis Américas Group’s liquidity position amounted to M$ 1,185,163,344 in cash and cash equivalent and M$ 34,332,376 in unconditionally-available long-term lines of credit.
21.3 Credit risk.
The Enersis Américas Group monitors its credit risks continuously and in detail.
Commercial accounts receivable:
Compared to the credit risks of accounts receivable from commercial activities, this is a risk that has been historically quite limited since the short collection term afforded our clients prevents significant individual accumulation. The foregoing is applied to both our electricity generation and distribution lines of business.
•33•
![]()
In our electricity generation line of business, in certain countries, when confronted to payment defaults it is possible to cut off supply, and almost every contract establishes non-payment as a cause for contract termination. To that effect, we continuously monitor the credit risk and measure the maximum amounts exposed to payment risk; which, as said earlier, are quite limited.
Our electricity distribution companies are authorized, in all cases, to cut off supply to non-performing customers, which is applied in line with the current regulations of each country; all of which facilitates the credit risk evaluation and control process; which, to be sure, is just as limited.
Assets of a financial nature:
Cash surpluses are invested in top domestic and foreign financial institutions (inasmuch as possible with a risk classification of investment grade or equivalent) with pre-established limits per institution.
In our selection of banks for investments, we consider those ranked with investment grade according to the three top international risk classification agencies (Moody’s, S&P and Fitch).
Our placements may be backed up with treasury bonds of those countries in which we operate and/or bank notes issued by top banks, preferring the latter since they offer better returns (always framed within current placement policies).
Derivatives are contracted with highly solvent entities, so that all operations are contracted with institutions with investment grade credit rating.
Risk Management.
The Enersis Américas Group prepares a Value at Risk (VaR) measurement for its own debt positions and financial derivatives, with the purpose of monitoring the risk assumed by the company, thus circumscribing Income Statement volatility.
The portfolio of the positions included for the purposes of calculating the present Value at Risk, is comprised of:
· Financial debt.
· Derivatives for hedging Debt, Dividends and Projects.
The calculated Value at Risk represents the possible value variation of the above-described positions portfolio within one day and with 95% certainty. To that effect we have studied the volatility of the risk variables that affect the value of the positions portfolio; which includes:
· The USD Libor rate of interest.
· The various currencies in which our companies operate, the habitual local indices of bank practices.
· The exchange rates of the different currencies implied in the calculation.
•34•
![]()
The Value at Risk calculation is based on the extrapolation of future market value scenarios (one quarter out) of the risk variables based on real observations for the same period (quarter) through a 5-year period.
The Value at Risk for the next quarter, with 95% confidence level, is calculated as the percentile of the most adverse 5% of the possible quarterly changes.
Taking into account the aforementioned hypotheses, the Value at Risk of the above-discussed positions one quarter out is: Ch$ 100,724,274million.
This value represents the potential increment of the debt and derivatives portfolio; therefore, this value at risk is intrinsically linked, among other factors, to the value of the portfolio at the end of each quarter.
Other risks.
As is the habitual practice in bank credits and capital market operations, a portion of the financial indebtedness of Enersis and its subsidiary Endesa Chile is subject to cross-default provisions. If certain defaults (non-complying) are not indeed remedied, they may result in a cross default situation and certain liabilities of these companies may eventually become callable.
Non-payment of debt of these companies, following any applicable grace period of any debt of Enersis Américas without reference to its foreign subsidiaries, of a capital amount in excess of U$ 30 million, or its equivalent in other currencies, may lead to the forced acceleration of the Yankee Bonds.
Finally, in September 2016 in the case of local bonds, credit lines and international syndicated loan of Enersis Américas, the early payment of these debts, it triggered only by breach of the issuer or debtor, ie Enersis Américas not referring to their foreign subsidiaries. In the case of local bonds, the cross default may be triggered in cases where the amount in arrears exceeding 3% of Total Consolidated Assets, either on an individual debt or debt at the aggregate level. In the case of local lines and international syndicated loan, the default cross is triggered if the amount in default on a debt exceeds US $ 50 million for local line and US $ 150 million for the syndicated loan, or its equivalent in other currencies and also additional conditions such as the expiration of grace periods are met. These lines have not been paid.
There are no provisions in the credit agreements by means of which changes in the corporate classification of the debt of these companies by risk classification agencies may generate an obligation to make debt prepayments.
BOOK VALUE AND ECONOMIC VALUE OF ASSETS
Compared to the assets of higher importance, we should mention the following:
Real estate properties, plant and equipment are valued at their purchasing cost, net of their corresponding accumulated depreciation and losses experienced on account of depreciation. Real estate properties, plant and equipment, net of their residual value, as the case might be, are depreciated lineally by distributing the cost of their different integral elements over their estimateduseful life, which is the period during which the companies expect to use them. Such useful life estimate is reviewed periodically.
•35•
![]()
The goodwill (lower value of investments or commercial funds) generated in the consolidation exercise represents the excess acquisition cost over the group’s participation in the fair value of assets and liabilities, including contingent liabilities and any non-controlling shareholdings identifiable in a subsidiary company as of the date of acquisition. Goodwill is not amortized, but rather, at the closing of each fiscal year it is estimated whether it has been the subject of any depreciation that might reduce its recoverable value for an amount below its registered net cost, in which case its value is restated accordingly. (See Note 3.e of the Financial Statements).
Throughout the year and, primarily at its closing date, an evaluation is performed to determine whether there is any indication that any given asset would have possibly suffered a loss due to impairment. Should there be such an indication, we estimate the recoverable amount of such asset in order to determine, as the case might be, the amount of such impairment. If these are identifiable assets that do not generate independent cash flows, we then estimate the recoverability of the cash generating unit to which such asset belongs, understanding as such the smallest identifiable group of assets that generates independent cash inflows.
Foreign-currency-denominated assets are shown at their rate of exchange at the closing of the period.
Notes and accounts receivable from related companies are classified according to their short and long-term maturities. Operations adhere to fair conditions similar to those that prevail in the market.
In sum, assets are valued pursuant to the International Financial Reporting Standards (IFRS), whose criteria are set forth in Notes N°2 and 3 of these financial statements.
•36•
SIGNATURES
Pursuant to the requirements of the Securities Exchange Act of 1934, as amended, the Registrant has duly caused this report to be signed on its behalf by the undersigned, thereunto duly authorized.
| Enersis Américas S.A. | |
| By: /s/ Luca D'Agnese | |
| -------------------------------------------------- | |
| Title: Chief Executive Officer |
Date: November 7, 2016