Exhibit 99.1
Exhibit 99.1
CYTEC DELIVERING TECHNOLOGY BEYOND OUR CUSTOMERS’ IMAGINATION TM
2013 Investor Day
CYTEC DELIVERING TECHNOLOGY BEYOND OUR CUSTOMERS’ IMAGINATION TM
Jodi Allen
Director Investor Relations
Welcome and Agenda
Forward Looking Statements
During the course of this meeting we may make forward-looking statements. All statements that address expectations or projections about the future are forward-looking statements.
Some of these statements include words such as “expects”, “anticipates,” “plans,”
“intends,” “projects,” and “outlook.” Although they reflect our current expectations, these statements are not guarantees of future performance because they involve a number of risks, uncertainties, and assumptions.
We recommend that you review Cytec’s SEC filings for a discussion of some of the factors which could cause actual results to differ materially from its expectations and projections. This and other Cytec information may be accessed at www.cytec.com.
In sections of this presentation certain “non-GAAP” measures are provided and identified as such. We believe that the “non-GAAP” measures can more accurately reflect comparisons of year to year trends and is consistent with how we review the information. Reconciliation of “non-GAAP” measures to the applicable GAAP measure are provided on our website and SEC filings.
Agenda
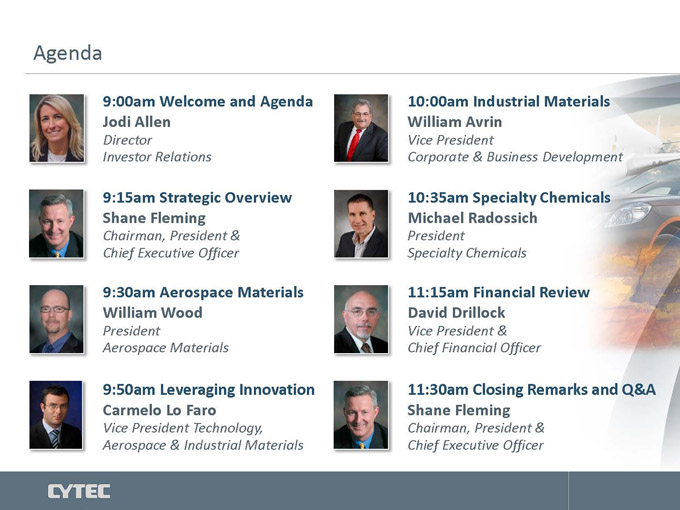
9:00am Welcome and Agenda 10:00am Industrial Materials Jodi Allen William Avrin
Director Vice President
Investor Relations Corporate & Business Development
9:15am Strategic Overview 10:35am Specialty Chemicals Shane Fleming Michael Radossich
Chairman, President & President
Chief Executive Officer Specialty Chemicals
9:30am Aerospace Materials 11:15am Financial Review William Wood David Drillock
President Vice President & Aerospace Materials Chief Financial Officer
9:50am Leveraging Innovation 11:30am Closing Remarks and Q&A
Carmelo Lo Faro Shane Fleming
Vice President Technology, Chairman, President & Aerospace & Industrial Materials Chief Executive Officer

CYTEC DELIVERING TECHNOLOGY BEYOND OUR CUSTOMERS’ IMAGINATION TM
Shane Fleming
Chairman, President & Chief Executive Officer
Strategic Overview

Growth Strategy Focused on Long-Term Value Creation
Refocused portfolio on growth strategy
Centered on secular growth in attractive end markets
Winning share with differentiated technology offerings
Common approach to development and commercialization
Accelerating growth and strengthening Cytec through an evolved enterprise model
Delivering profitable growth through leading market positions
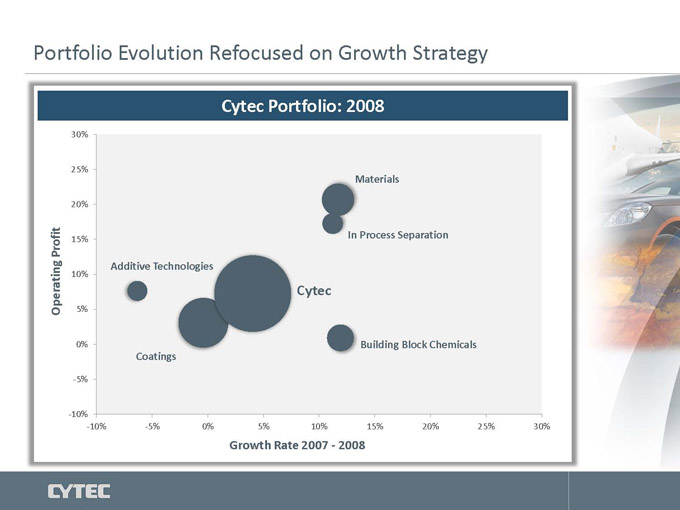
Portfolio Evolution Refocused on Growth Strategy
Cytec Portfolio: 2008
30%
25%
Materials
20%
Profit 15% In Process Separation
Additive Technologie
10%
Cytec
Operating 5%
0% Building Block Chemicals
Coatings
-5%
-10%
-10% -5% 0% 5% 10% 15% 20% 25% 30%
Growth Rate 2007—2008
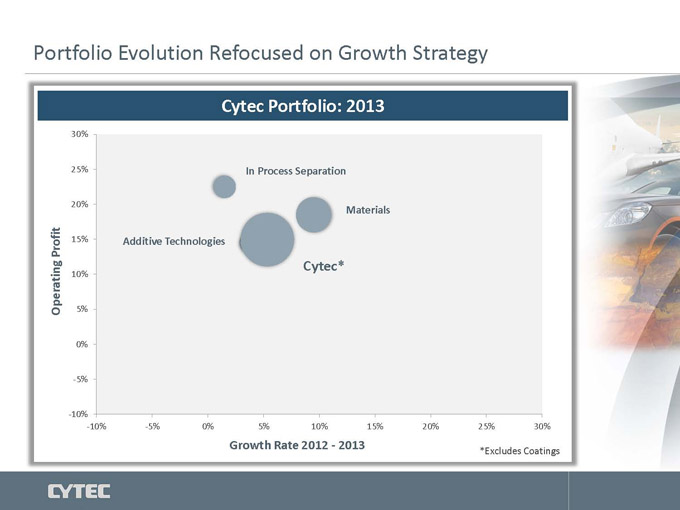
Portfolio Evolution Refocused on Growth Strategy
Cytec Portfolio: 2013
30%
25% In Process Separation
20%
Materials
Profit 15% Additive Technologies
Cytec*
10%
Operating 5%
0%
-5%
-10%
-10% -5% 0% 5% 10% 15% 20% 25% 30%
Growth Rate 2012—2013 *Excludes Coatings
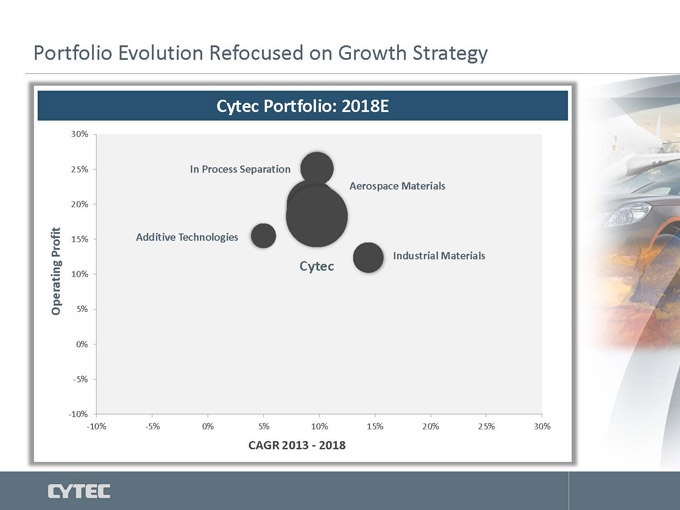
Portfolio Evolution Refocused on Growth Strategy
Cytec Portfolio: 2018E
30%
25% In Process Separation
Aerospace Materials
20%
Profit 15% Additive Technologies
Industrial Materials
Cytec
10%
Operating 5%
0%
-5%
-10%
-10% -5% 0% 5% 10% 15% 20% 25% 30%
CAGR 2013—2018
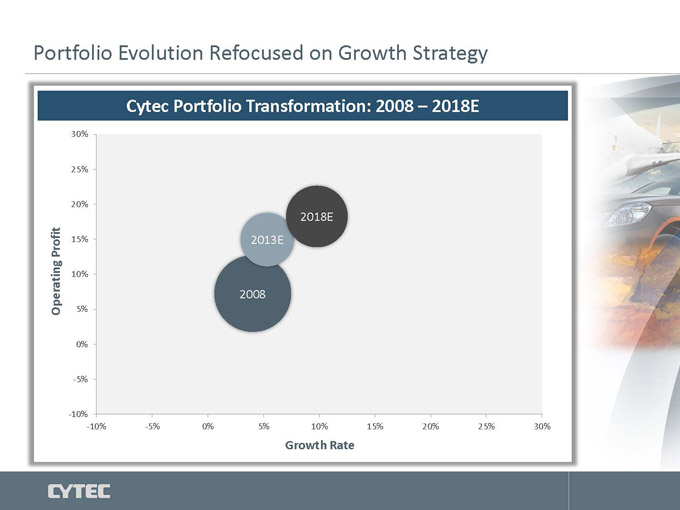
Portfolio Evolution Refocused on Growth Strategy
Cytec Portfolio Transformation: 2008 – 2018E
30%
25%
20%
2018E
Profit 15% 2013E
10%
2008
Operating 5%
0%
-5%
-10%
-10% -5% 0% 5% 10% 15% 20% 25% 30%
Growth Rate
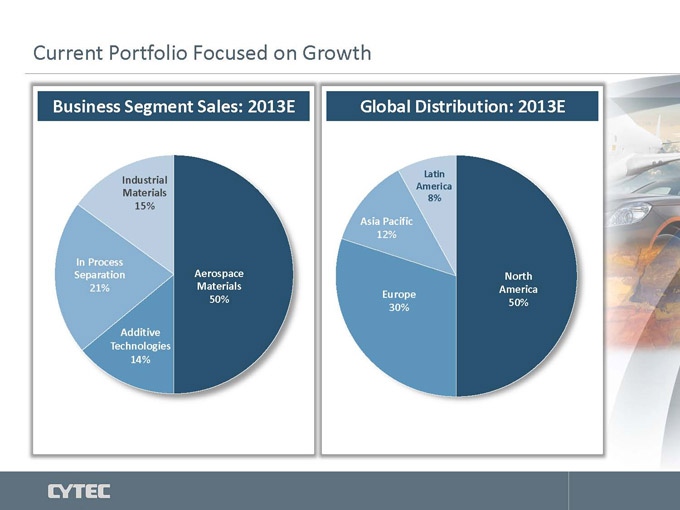
Current Portfolio Focused on Growth
Business Segment Sales: 2013E Global Distribution: 2013E
Industrial Latin
America
Materials 8%
15%
Asia Pacific
12%
In Process
Separation Aerospace North
21% Materials America
Europe
50% 50%
30%
Additive
Technologies
14%
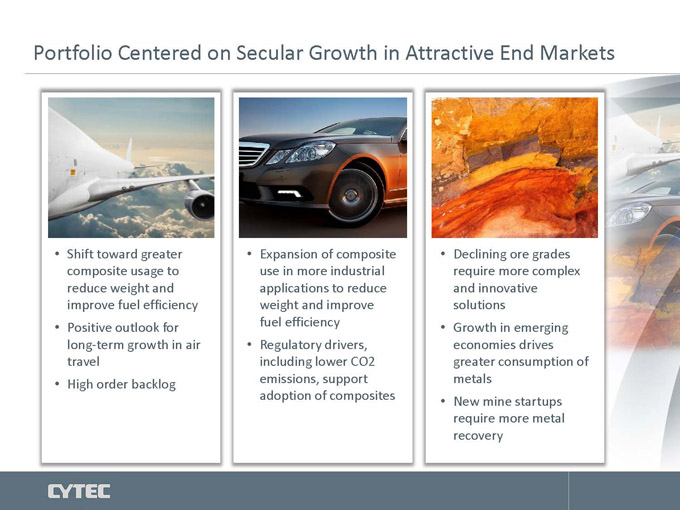
Portfolio Centered on Secular Growth in Attractive End Markets
Shift toward greater Expansion of composite Declining ore grades
composite usage to use in more industrial require more complex
reduce weight and applications to reduce and innovative
improve fuel efficiency weight and improve solutions
Positive outlook for fuel efficiency Growth in emerging
long-term growth in air • Regulatory drivers, economies drives
travel including lower CO2 greater consumption of
High order backlog emissions, support metals
adoption of composites • New mine startups
require more metal
recovery
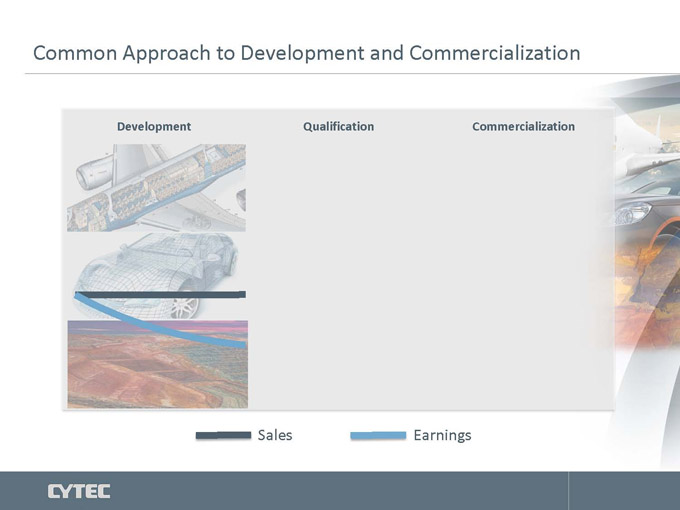
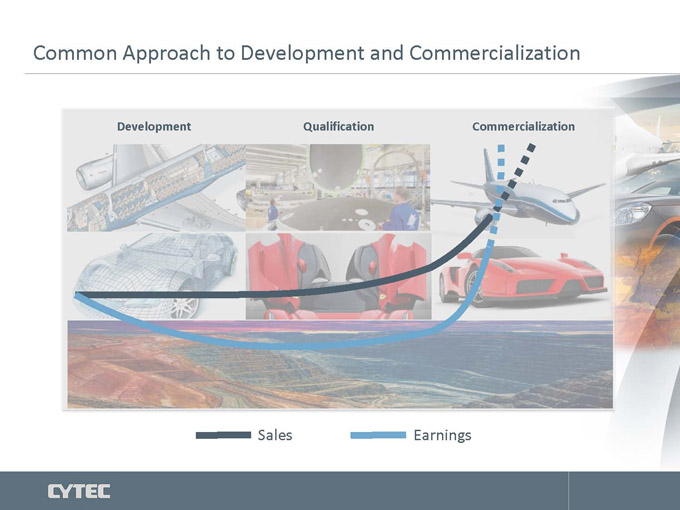
Common Approach to Development and Commercialization
Development Qualification Commercialization
Sales Earnings
Common Approach to Development and Commercialization
Development Qualification Commercialization
Sales Earnings
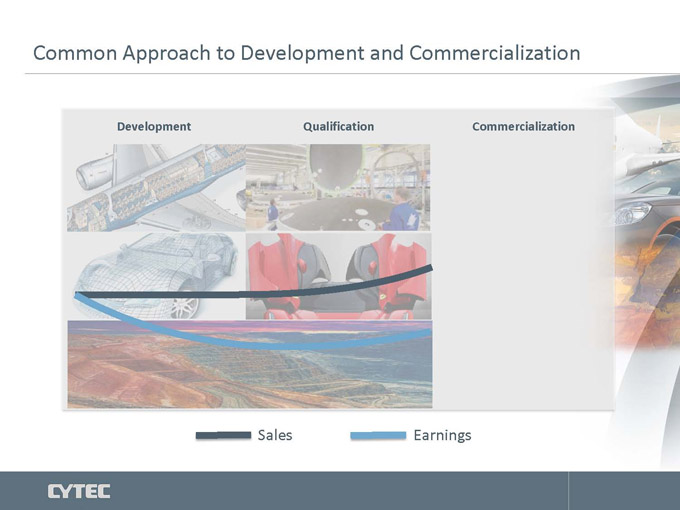
Common Approach to Development and Commercialization
Development Qualification Commercialization
Sales Earnings
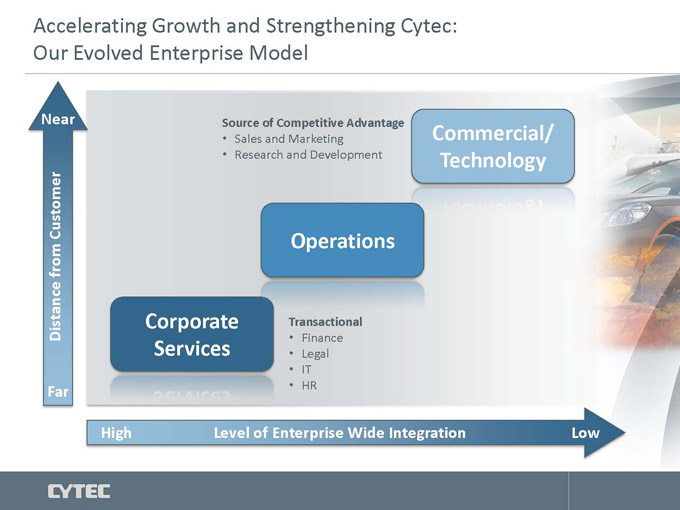
Accelerating Growth and Strengthening Cytec:
Our Evolved Enterprise Model
Near Source of Competitive Advantage
• Sales and Marketing Commercial/
• Research and Development Technology
Customer Operations
from
Distance Corporate Transactional
• Finance
Services • Legal
• IT
Far • HR
High Level of Enterprise Wide Integration Low
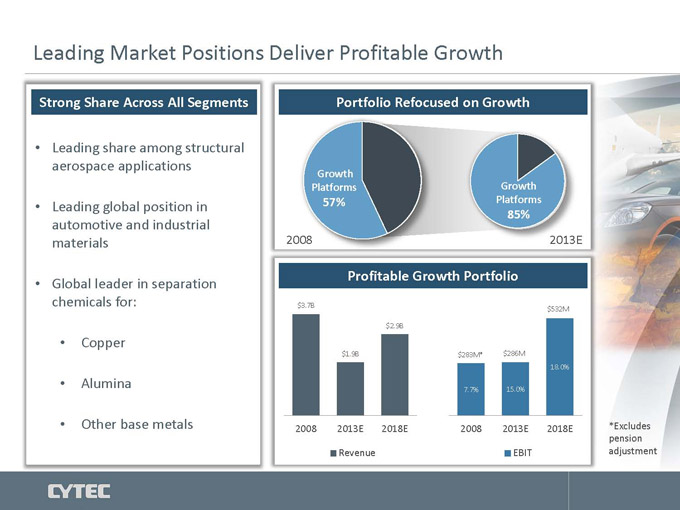
Leading Market Positions Deliver Profitable Growth
Strong Share Across All Segments Portfolio Refocused on Growth
Leading share among structural
aerospace applications
Growth
Platforms Growth
Leading global position in 57% Platforms
85%
automotive and industrial
materials 2008 2013E
Global leader in separation Profitable Growth Portfolio
chemicals for: $3.7B $532M
$2.9B
• Copper
$1.9B $283M* $286M
18.0%
• Alumina 7.7% 15.0%
• Other base metals 2008 2013E 2018E 2008 2013E 2018E *Excludes
pension
Revenue EBIT adjustment
CYTEC DELIVERING TECHNOLOGY BEYOND OUR CUSTOMERS’ IMAGINATION TM
William Wood
President Aerospace Materials
Aerospace Materials
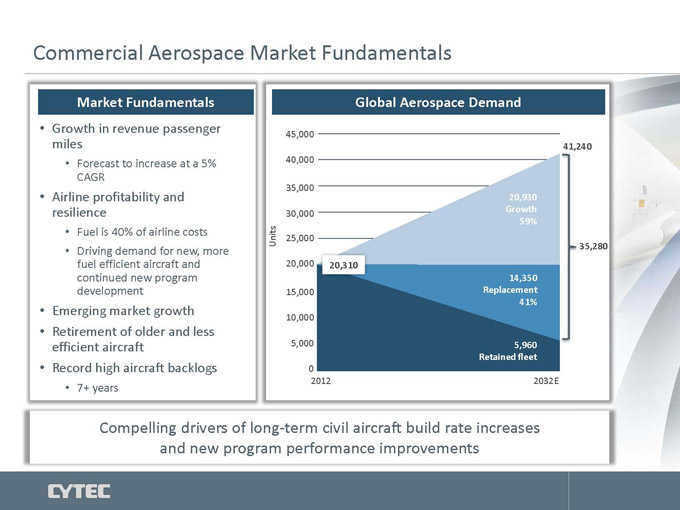
Commercial Aerospace Market Fundamentals
Market Fundamentals Global Aerospace Demand
Growth in revenue passenger 45,000
miles 41,240
• Forecast to increase at a 5% 40,000
CAGR
35,000
Airline profitability and 20,930
resilience 30,000 Growth
59%
• Fuel is 40% of airline costs Units 25,000
• Driving demand for new, more 35,280
fuel efficient aircraft and 20,000 20,310
continued new program 14,350
development 15,000 Replacement
41%
Emerging market growth 10,000
Retirement of older and less
efficient aircraft 5,000 5,960
Retained fleet
Record high aircraft backlogs 0
• 7+ years 2012 2032E
Compelling drivers of long-term civil aircraft build rate increases
and new program performance improvements
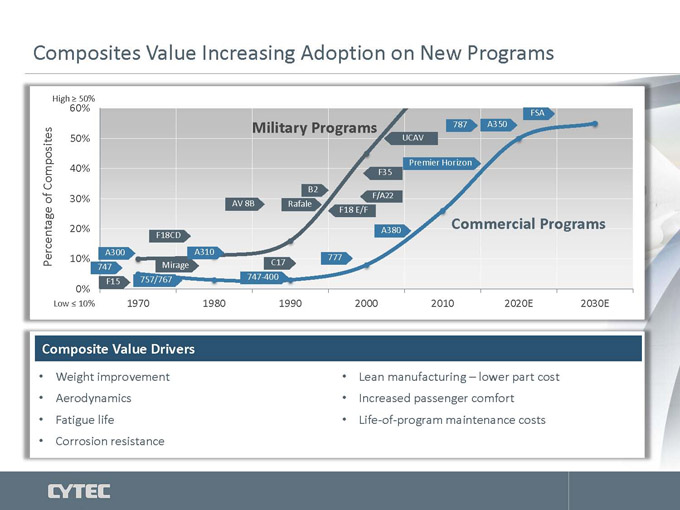
Composites Value Increasing Adoption on New Programs
High ? 50%
60% FSA
Military Programs 787 A350
50% UCAV
Premier Horizon
Composites 40% F35
B2
of 30% AV 8B Rafale F/A22
F18 E/F
20% A380 Commercial Programs
F18CD
A300 A310
Percentage 10% C17 777
747 Mirage
F15 757/767 747-400
0%
Low ? 10% 1970 1980 1990 2000 2010 2020E 2030E
Composite Value Drivers
Weight improvement Lean manufacturing – lower part cost
Aerodynamics Increased passenger comfort
Fatigue life Life-of-program maintenance costs
Corrosion resistance
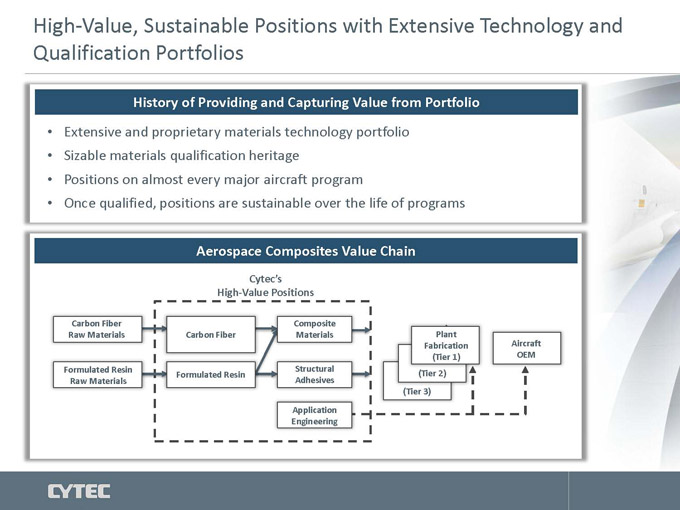
High-Value, Sustainable Positions with Extensive Technology and
Qualification Portfolios
History of Providing and Capturing Value from Portfolio
Extensive and proprietary materials technology portfolio
Sizable materials qualification heritage
Positions on almost every major aircraft program
Once qualified, positions are sustainable over the life of programs
Aerospace Composites Value Chain
Cytec’s
High-Value Positions
Carbon Fiber Composite
Raw Materials Carbon Fiber Materials Plant
Fabrication Aircraft
(Tier 1) OEM
Formulated Resin Structural
Formulated Resin (Tier 2)
Raw Materials Adhesives
(Tier 3)
Application
Engineering
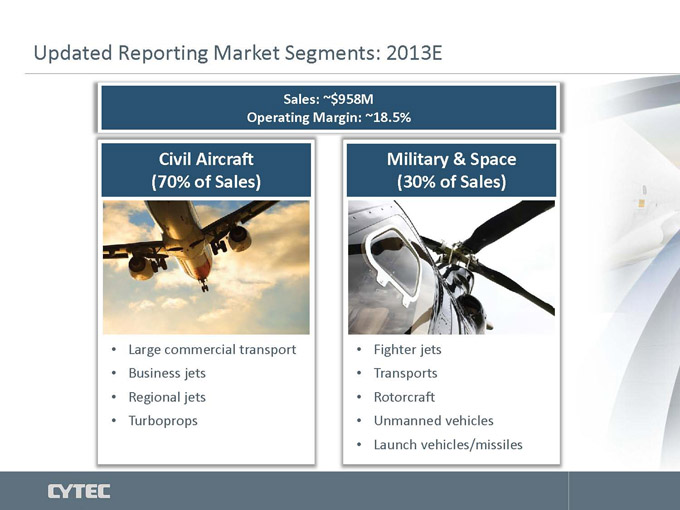
Updated Reporting Market Segments: 2013E
Sales: ~$958M
Operating Margin: ~18.5%
Civil Aircraft Military & Space
(70% of Sales) (30% of Sales)
Large commercial transport Fighter jets
Business jets Transports
Regional jets Rotorcraft
Turboprops Unmanned vehicles
• Launch vehicles/missiles
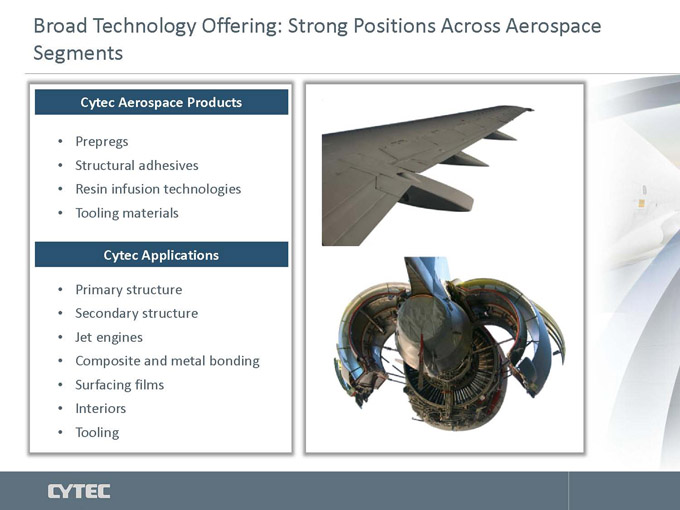
Broad Technology Offering: Strong Positions Across Aerospace
Segments
Cytec Aerospace Products
Prepregs
Structural adhesives
Resin infusion technologies
Tooling materials
Cytec Applications
Primary structure
Secondary structure
Jet engines
Composite and metal bonding
Surfacing films
Interiors
Tooling
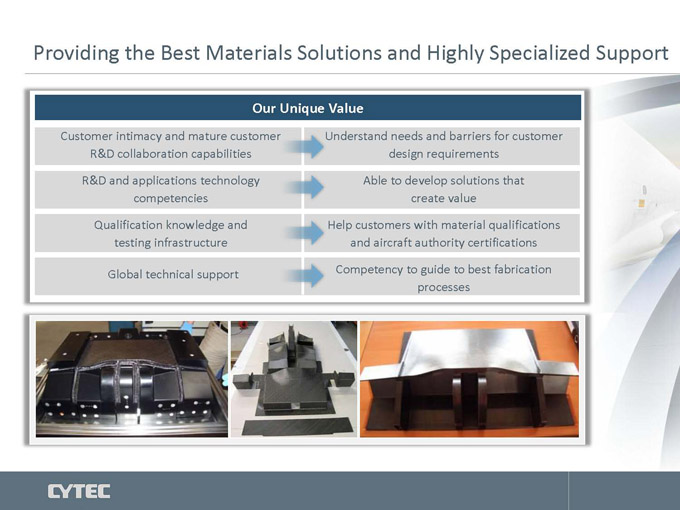
Providing the Best Materials Solutions and Highly Specialized Support
Our Unique Value
Customer intimacy and mature customer Understand needs and barriers for customer
R&D collaboration capabilities design requirements
R&D and applications technology Able to develop solutions that
competencies create value
Qualification knowledge and Help customers with material qualifications
testing infrastructure and aircraft authority certifications
Global technical support Competency to guide to best fabrication
processes
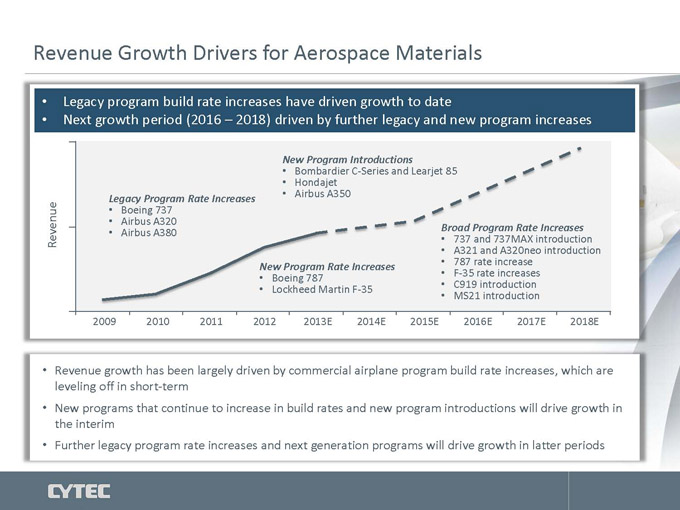
Revenue Growth Drivers for Aerospace Materials
Legacy program build rate increases have driven growth to date
Next growth period (2016 – 2018) driven by further legacy and new program increases
New Program Introductions
• Bombardier C-Series and Learjet 85
• Hondajet
Legacy Program Rate Increases • Airbus A350
• Boeing 737
• Airbus A320
• Airbus A380 Broad Program Rate Increases
Revenue • 737 and 737MAX introduction
• A321 and A320neo introduction
New Program Rate Increases • 787 rate increase
• Boeing 787 • F-35 rate increases
• Lockheed Martin F-35 • C919 introduction
• MS21 introduction
2009 2010 2011 2012 2013E 2014E 2015E 2016E 2017E 2018E
Revenue growth has been largely driven by commercial airplane program build rate increases, which are
leveling off in short-term
New programs that continue to increase in build rates and new program introductions will drive growth in
the interim
Further legacy program rate increases and next generation programs will drive growth in latter periods
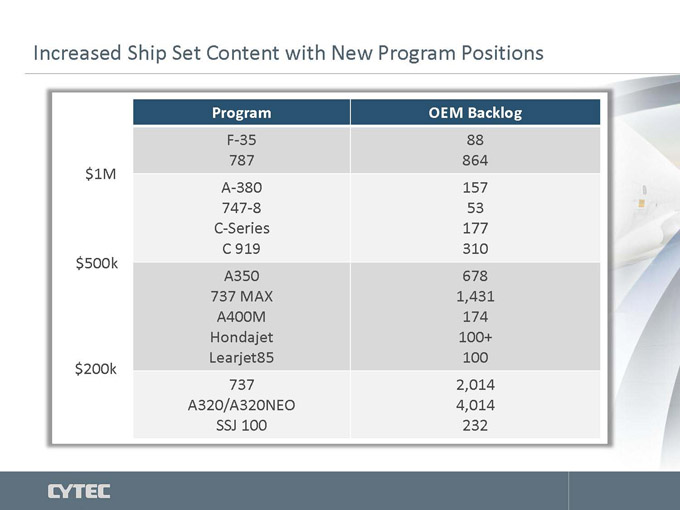
Increased Ship Set Content with New Program Positions
Program OEM Backlog
F-35 88
787 864
$1M
A-380 157
747-8 53
C-Series 177
C 919 310
$500k
A350 678
737 MAX 1,431
A400M 174
Hondajet 100+
Learjet85 100
$200k
737 2,014
A320/A320NEO 4,014
SSJ 100 232
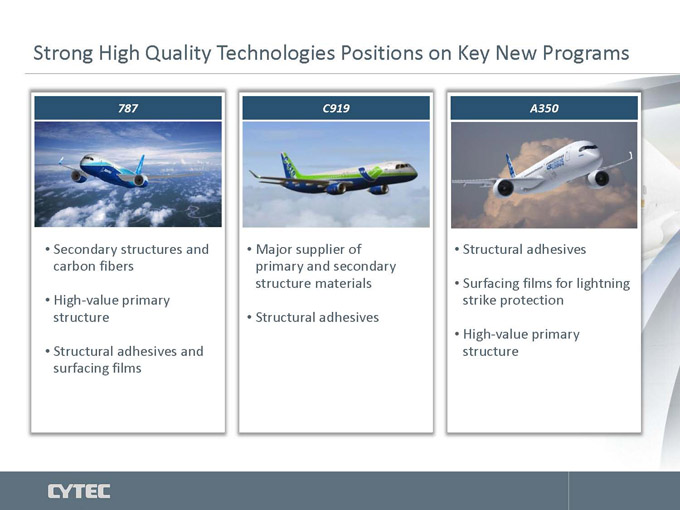
Strong High Quality Technologies Positions on Key New Programs
787 C919 A350
Secondary structures and Major supplier of Structural adhesives
carbon fibers primary and secondary
structure materials • Surfacing films for lightning
High-value primary strike protection
structure • Structural adhesives
• High-value primary
Structural adhesives and structure
surfacing films
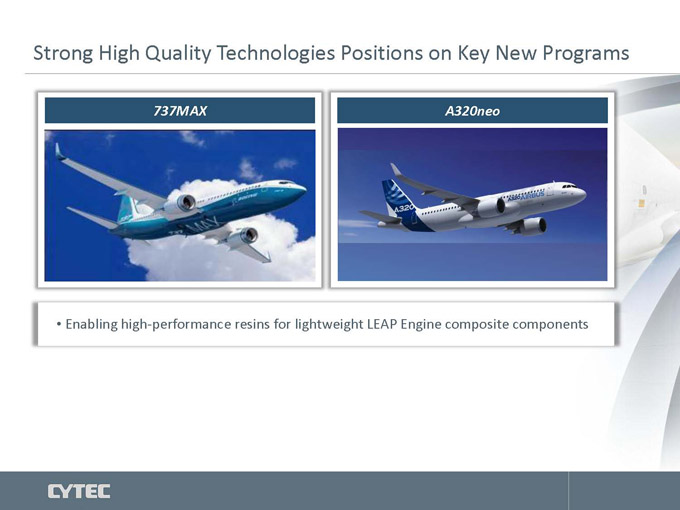
Strong High Quality Technologies Positions on Key New Programs
737MAX A320neo
Enabling high-performance resins for lightweight LEAP Engine composite components
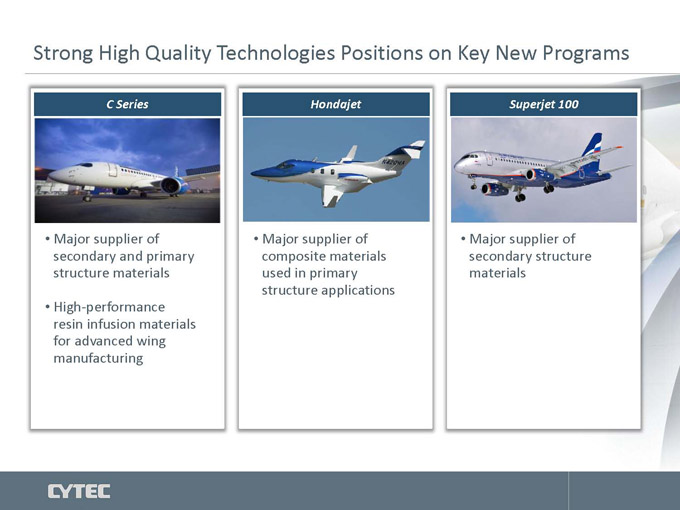
Strong High Quality Technologies Positions on Key New Programs
C Series Hondajet Superjet 100
Major supplier of Major supplier of Major supplier of
secondary and primary composite materials secondary structure
structure materials used in primary materials
structure applications
High-performance
resin infusion materials
for advanced wing
manufacturing
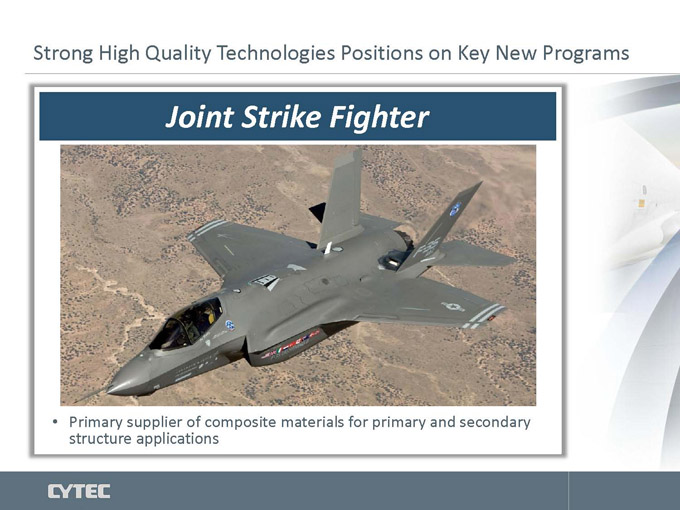
Strong High Quality Technologies Positions on Key New Programs
Joint Strike Fighter
Primary supplier of composite materials for primary and secondary
structure applications
Future Programs Provide Significant Opportunity for Composite
Materials
• Actively engaged on new programs
with legacy customers and new
customers in emerging regions
• New programs represent a range of
opportunities with both mid- and
long-term entry
• Continuing to invest in materials and
applications research
• Greater vertical integration of Cytec
carbon fibers required on certain new
programs
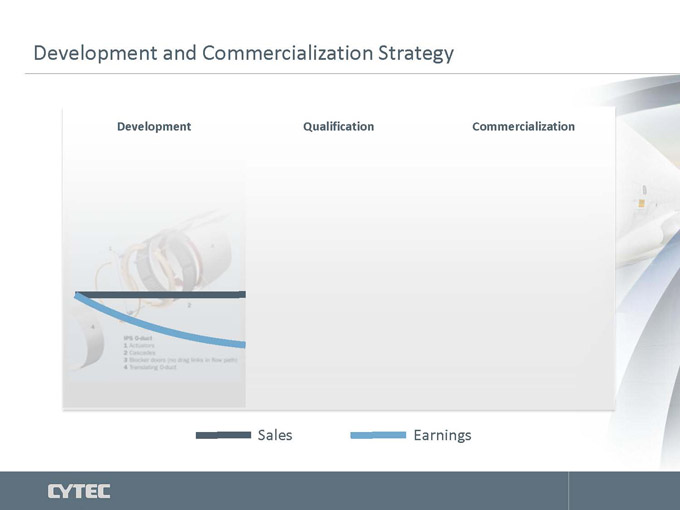
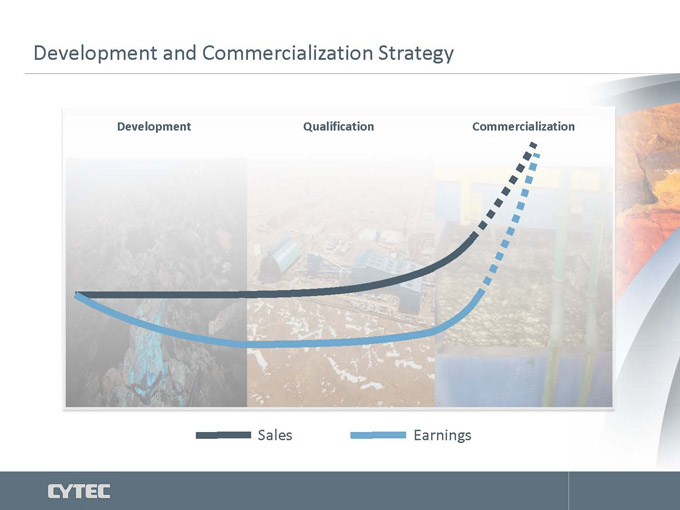
Development and Commercialization Strategy
Development Qualification Commercialization
Sales Earnings
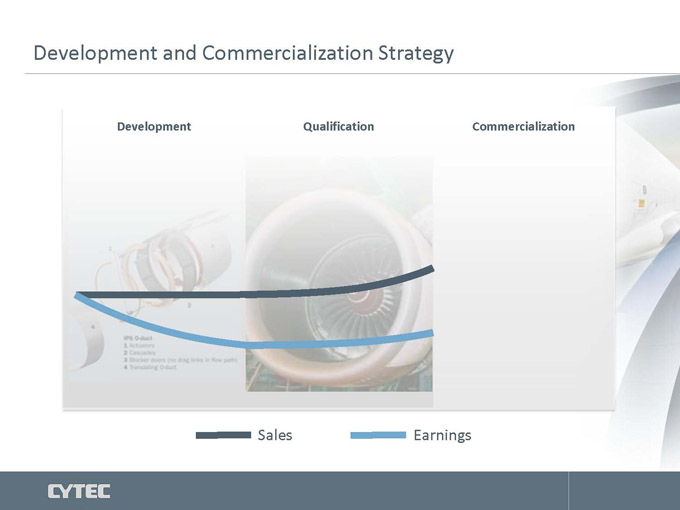
Development and Commercialization Strategy
Development Qualification Commercialization
Sales Earnings
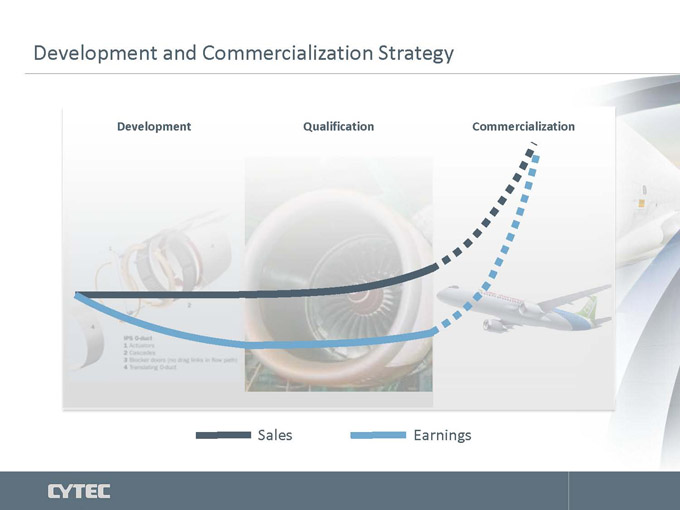
Development and Commercialization Strategy
Development Qualification Commercialization
Sales Earnings
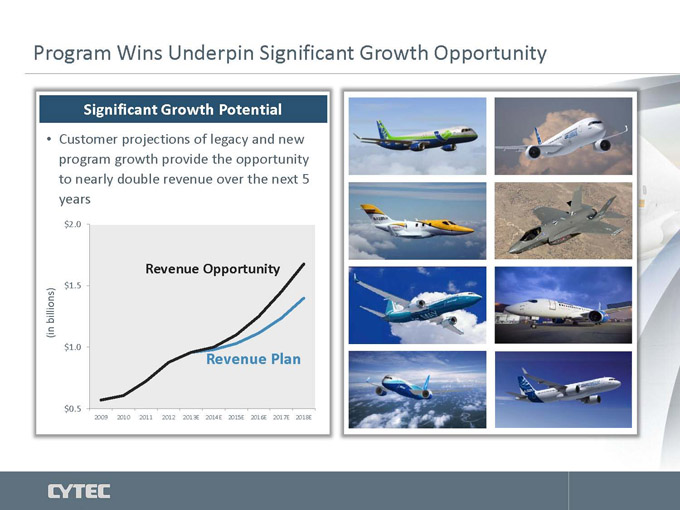
Program Wins Underpin Significant Growth Opportunity
Significant Growth Potential
Customer projections of legacy and new
program growth provide the opportunity
to nearly double revenue over the next 5
years
$ 2.0
Revenue Opportunity
$ 1.5
billions)
(in
$ 1.0
Revenue Plan
$ 0.5
2009 2010 2011 2012 2013E 2014E 2015E 2016E 2017E 2018E
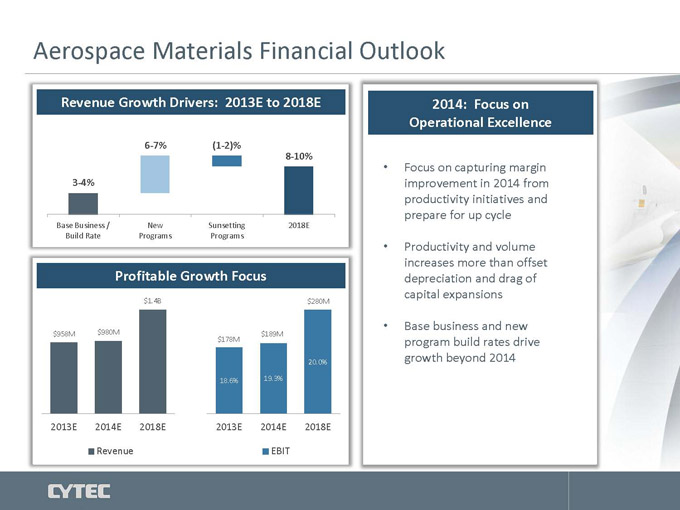
Aerospace Materials Financial Outlook
Revenue Growth Drivers: 2013E to 2018E 2014: Focus on
Operational Excellence
6-7% (1-2)%
8-10%
• Focus on capturing margin
3-4% improvement in 2014 from
productivity initiatives and
prepare for up cycle
Base Business / New Sunsetting 2018E
Build Rate Programs Programs
• Productivity and volume
increases more than offset
Profitable Growth Focus depreciation and drag of
capital expansions
$1.4B $280M
• Base business and new
$958M $980M $189M
$178M program build rates drive
20.0% growth beyond 2014
18.6% 19.3%
2013E 2014E 2018E 2013E 2014E 2018E
Revenue EBIT
CYTEC DELIVERING TECHNOLOGY BEYOND OUR CUSTOMERS’ IMAGINATION TM
Carmelo Lo Faro
Vice President Technology, Aerospace & Industrial Materials
Leveraging Innovation
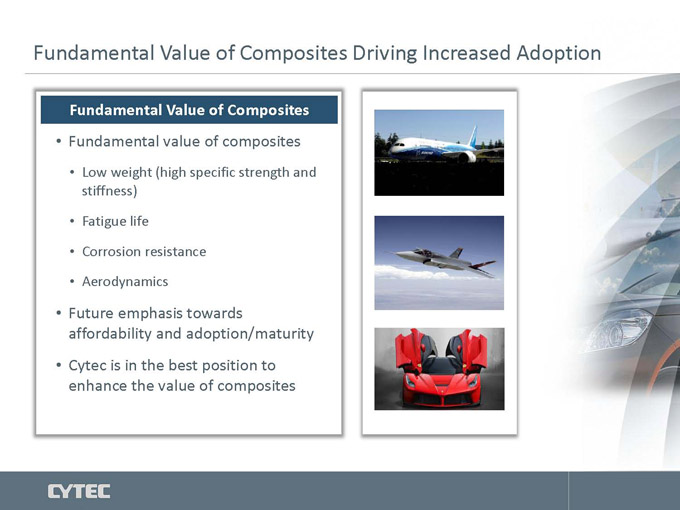
Fundamental Value of Composites Driving Increased Adoption
Fundamental Value of Composites
Fundamental value of composites
• Low weight (high specific strength and
stiffness)
• Fatigue life
• Corrosion resistance
• Aerodynamics
Future emphasis towards
affordability and adoption/maturity
Cytec is in the best position to
enhance the value of composites
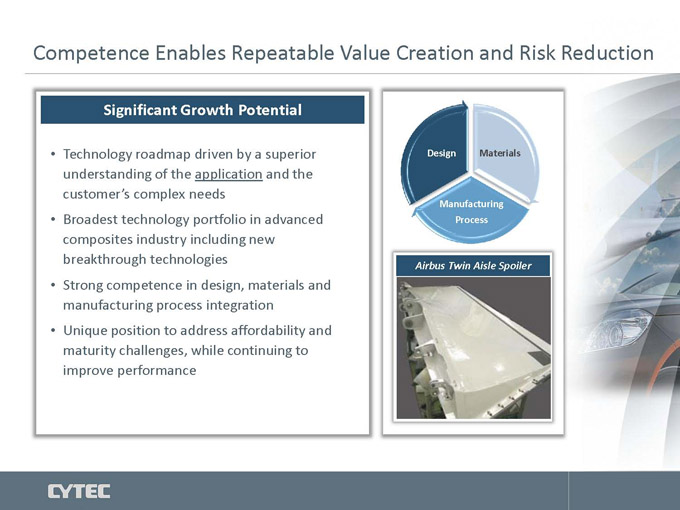
Competence Enables Repeatable Value Creation and Risk Reduction
Significant Growth Potential
Technology roadmap driven by a superior
understanding of the application and the
customer’s complex needs
Broadest technology portfolio in advanced
composites industry including new
breakthrough technologies Airbus Twin Aisle Spoiler
Strong competence in design, materials and
manufacturing process integration
Unique position to address affordability and
maturity challenges, while continuing to
improve performance
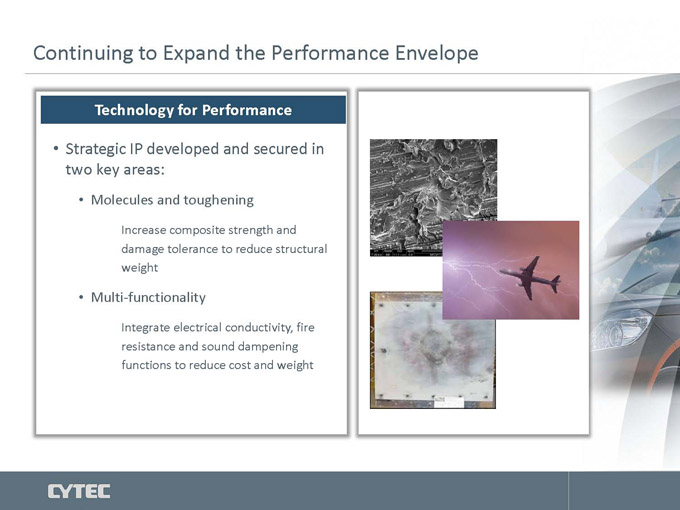
Continuing to Expand the Performance Envelope
Technology for Performance
Strategic IP developed and secured in
two key areas:
Molecules and toughening
Increase composite strength and
damage tolerance to reduce structural
weight
Multi-functionality
Integrate electrical conductivity, fire
resistance and sound dampening
functions to reduce cost and weight
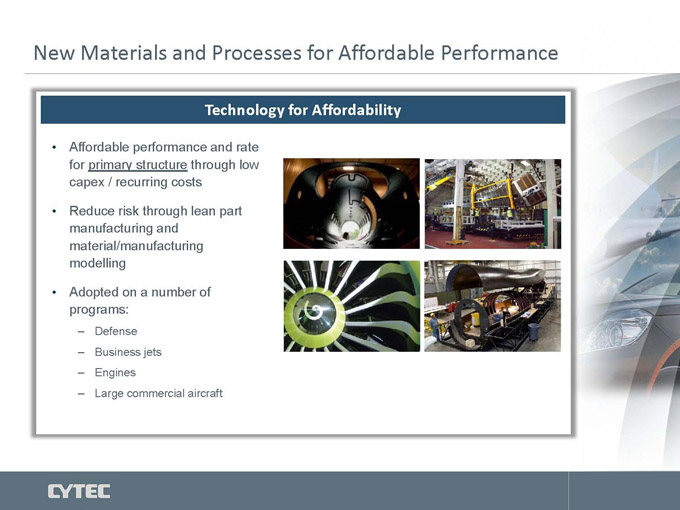
New Materials and Processes for Affordable Performance
Technology for Affordability
Affordable performance and rate
for primary structure through low
capex / recurring costs
Reduce risk through lean part
manufacturing and
material/manufacturing
modelling
Adopted on a number of
programs:
? Defense
? Business jets
? Engines
? Large commercial aircraft
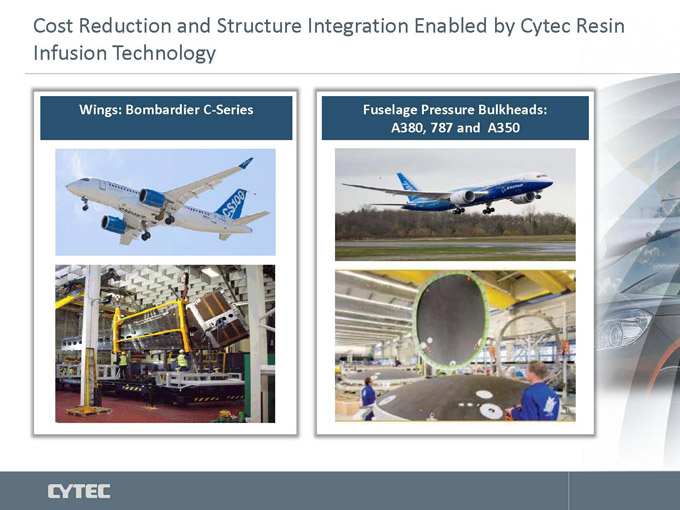
Cost Reduction and Structure Integration Enabled by Cytec Resin
Infusion Technology
Wings: Bombardier C-Series Fuselage Pressure Bulkheads:
A380, 787 and A350
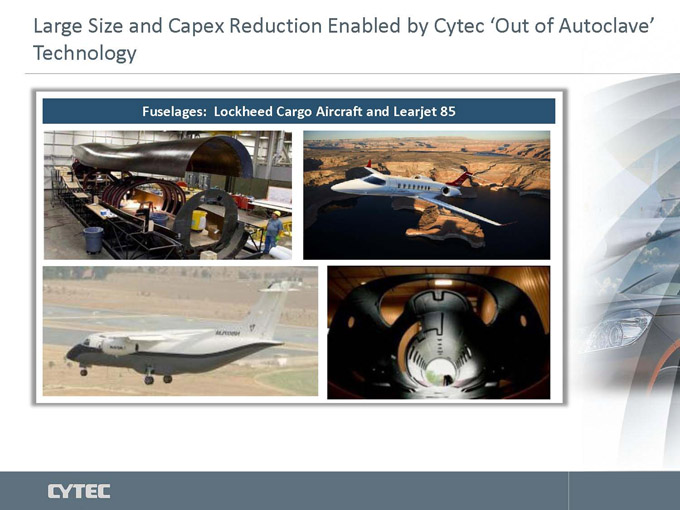
Large Size and Capex Reduction Enabled by Cytec ‘Out of Autoclave’
Technology
Fuselages: Lockheed Cargo Aircraft and Learjet 85
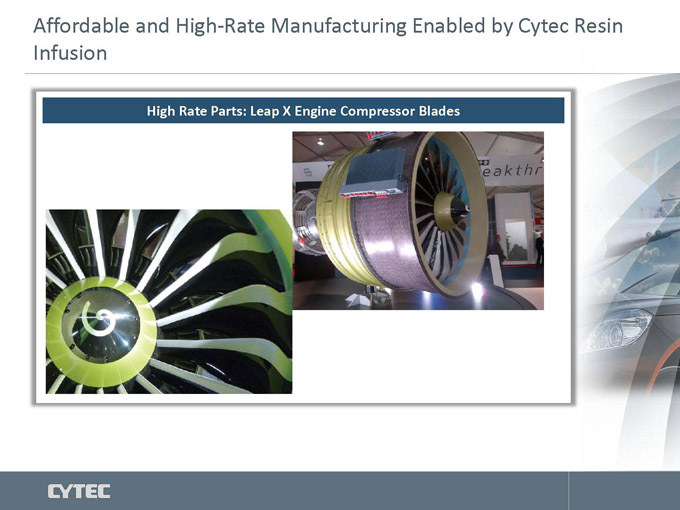
Affordable and High-Rate Manufacturing Enabled by Cytec Resin
Infusion
High Rate Parts: Leap X Engine Compressor Blades
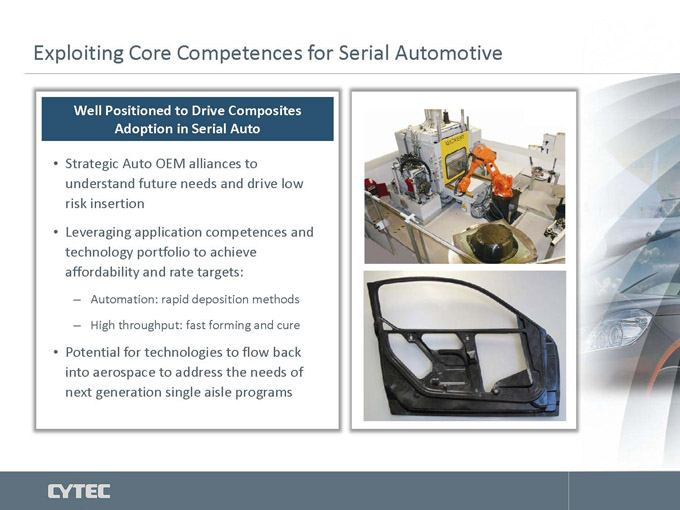
Exploiting Core Competences for Serial Automotive
Well Positioned to Drive Composites
Adoption in Serial Auto
Strategic Auto OEM alliances to
understand future needs and drive low
risk insertion
Leveraging application competences and
technology portfolio to achieve
affordability and rate targets:
– Automation: rapid deposition methods
– High throughput: fast forming and cure
Potential for technologies to flow back
into aerospace to address the needs of
next generation single aisle programs
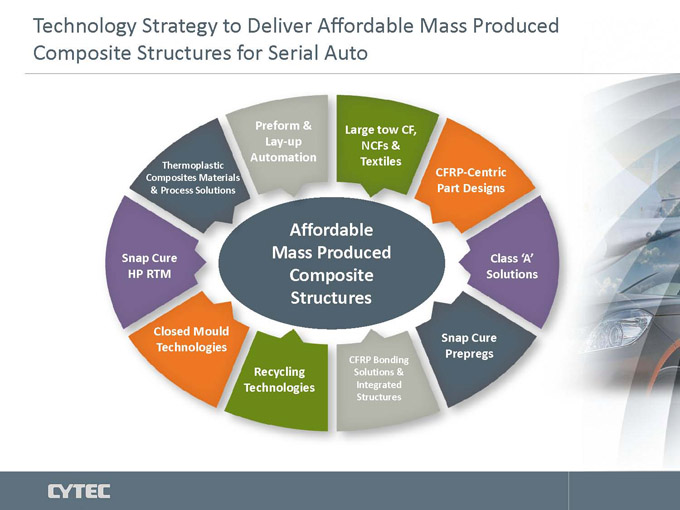
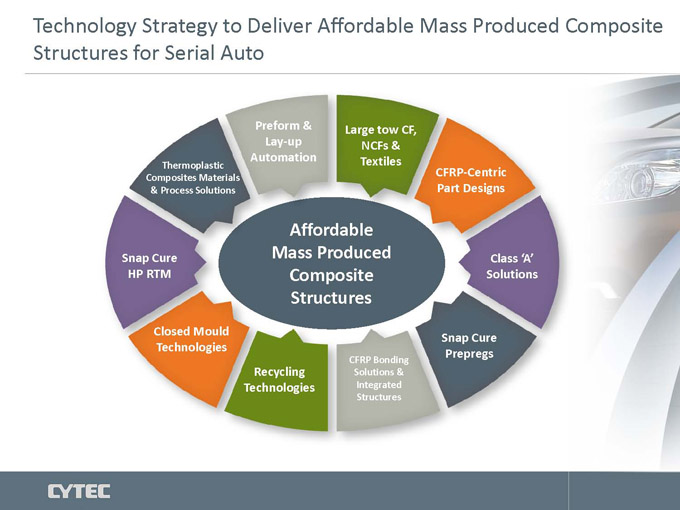
Technology Strategy to Deliver Affordable Mass Produced
Composite Structures for Serial Auto
Preform & Large tow CF,
Lay-up NCFs &
Automation Textiles
Thermoplastic
Composites Materials CFRP-Centric
& Process Solutions Part Designs
Affordable
Snap Cure Mass Produced Class ‘A’
HP RTM Composite Solutions
Structures
Closed Mould Snap Cure
Technologies Prepregs
CFRP Bonding
Recycling Solutions &
Technologies Integrated
Structures
CYTEC DELIVERING TECHNOLOGY BEYOND OUR CUSTOMERS’ IMAGINATION TM
William Avrin
Vice President
Corporate & Business Development
Industrial Materials
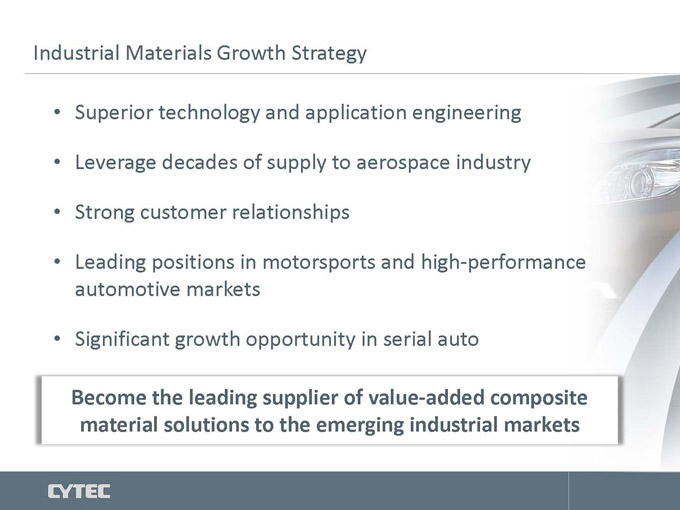
Industrial Materials Growth Strategy
Superior technology and application engineering
Leverage decades of supply to aerospace industry
Strong customer relationships
Leading positions in motorsports and high-performance
automotive markets
Significant growth opportunity in serial auto
Become the leading supplier of value-added composite
material solutions to the emerging industrial markets
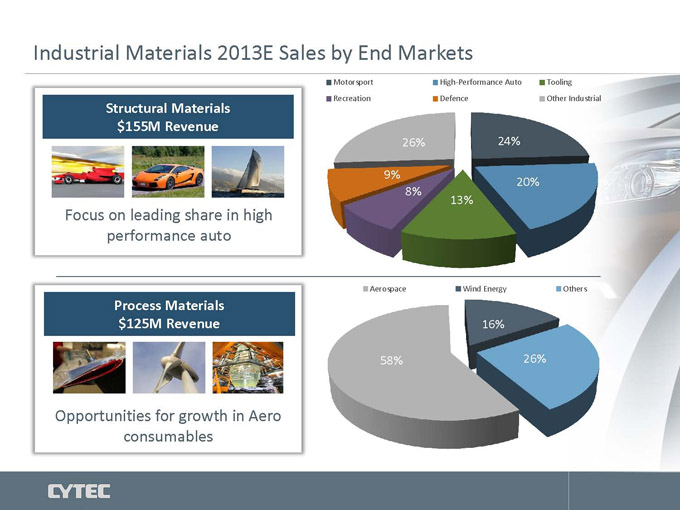
Industrial Materials 2013E Sales by End Markets
Motorsport High-Performance Auto Tooling
Recreation Defence Other Industrial
Structural Materials
$155M Revenue
26% 24%
9% 20%
8%
13%
Focus on leading share in high
performance auto
Aerospace Wind Energy Others
Process Materials
$125M Revenue 16%
58% 26%
Opportunities for growth in Aero
consumables
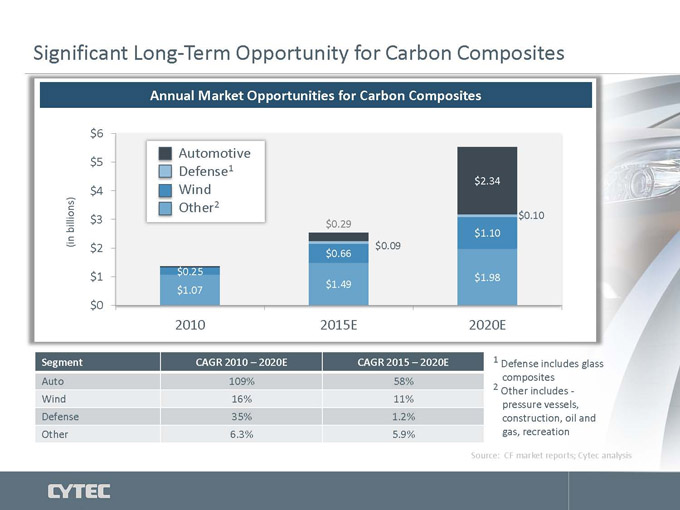
Significant Long-Term Opportunity for Carbon Composites Annual Market Opportunities for Carbon Composites
$ 6 Automotive $ 5
Defense1 $ 2.34 $ 4 Wind Other 2 $ 3 $ 0.10
billions) $ 0.29
$ 1.10
(in $ 2 $ 0.09
$ 0.66
$ 1 $ 0.25 $ 1.98
$ 1.07 $ 1.49
$ 0
2010 2015E 2020E
Segment CAGR 2010 – 2020E CAGR 2015 – 2020E 1 Defense includes glass
Auto 109% 58% composites
2 Other includes -
Wind 16% 11% pressure vessels,
Defense 35% 1.2% construction, oil and
Other 6.3% 5.9% gas, recreation
Source: CF market reports; Cytec analysis
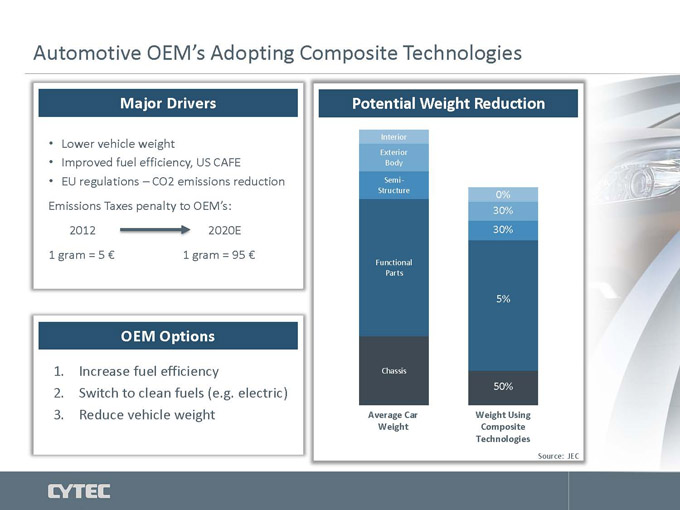
Automotive OEM’s Adopting Composite Technologies
Major Drivers Potential Weight Reduction
Lower vehicle weight Interior
Exterior
Improved fuel efficiency, US CAFE Body
EU regulations – CO2 emissions reduction Semi-
Structure 0%
Emissions Taxes penalty to OEM’s: 30%
2012 2020E 30%
1 gram = 5 € 1 gram = 95 €
Functional
Parts
5%
OEM Options
1. Increase fuel efficiency Chassis
2. Switch to clean fuels (e.g. electric) 50%
3. Reduce vehicle weight Average Car Weight Using
Weight Composite
Technologies
Source: JEC
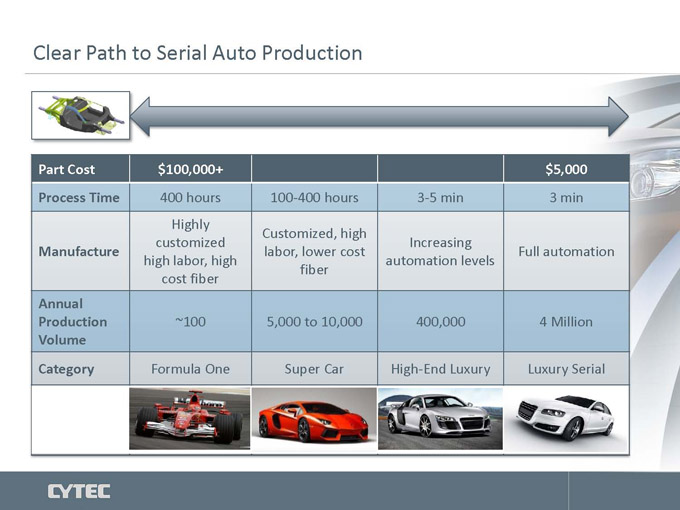
Clear Path to Serial Auto Production
Part Cost $100,000+ $5,000
Process Time 400 hours 100-400 hours 3-5 min 3 min
Highly
Customized, high
customized Increasing
Manufacture labor, lower cost Full automation
high labor, high automation levels
fiber
cost fiber
Annual
Production ~100 5,000 to 10,000 400,000 4 Million
Volume
Category Formula One Super Car High-End Luxury Luxury Serial
Technology Strategy to Deliver Affordable Mass Produced Composite
Structures for Serial Auto
Preform & Large tow CF,
Lay-up NCFs &
Automation Textiles
Thermoplastic
Composites Materials CFRP-Centric
& Process Solutions Part Designs
Affordable
Snap Cure Mass Produced Class ‘A’
HP RTM Composite Solutions
Structures
Closed Mould Snap Cure
Technologies Prepregs
CFRP Bonding
Recycling Solutions &
Technologies Integrated
Structures
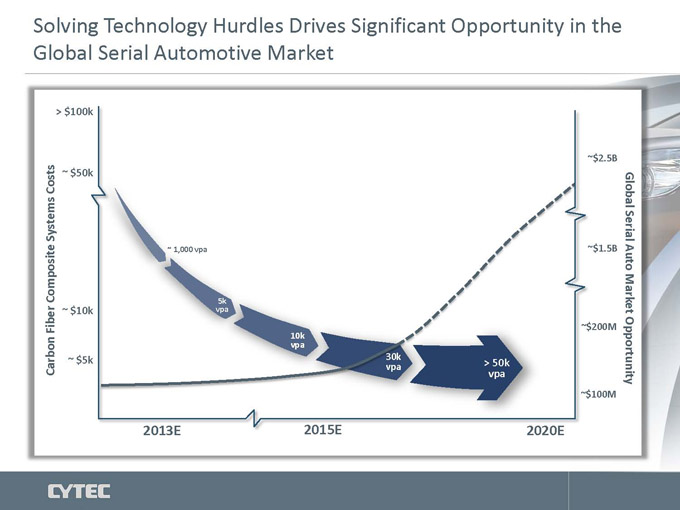
Solving Technology Hurdles Drives Significant Opportunity in the
Global Serial Automotive Market
> $100k
$ 2.5B
Costs ~ $50k Global
Systems Serial
Composite $ 1.5B Market Auto
~ $10k
Fiber 200M
Carbon ~ $5k Opportunity
100M
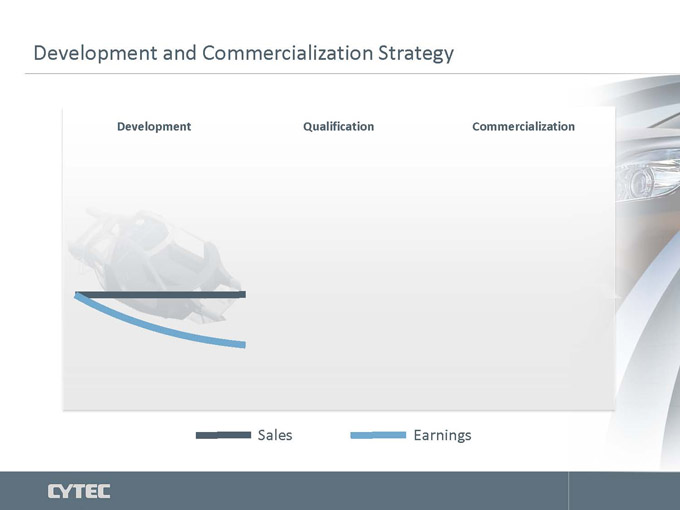
Development and Commercialization Strategy
Development Qualification Commercialization
Sales Earnings
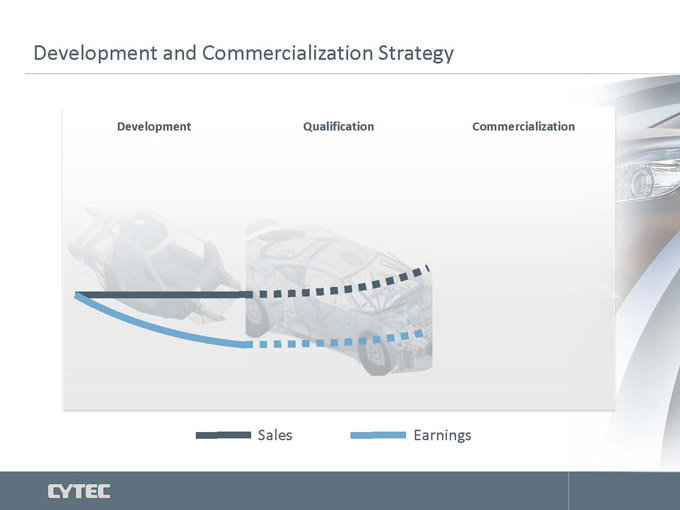
Development and Commercialization Strategy
Development Qualification Commercialization
Sales Earnings
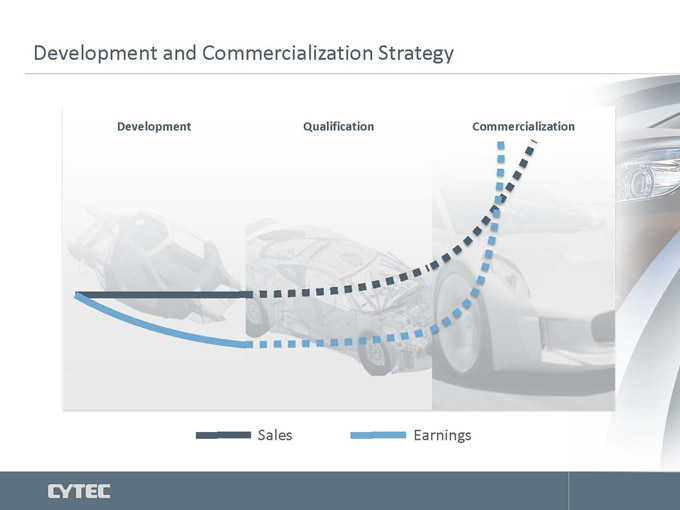
Development and Commercialization Strategy
Development Qualification Commercialization
Sales Earnings
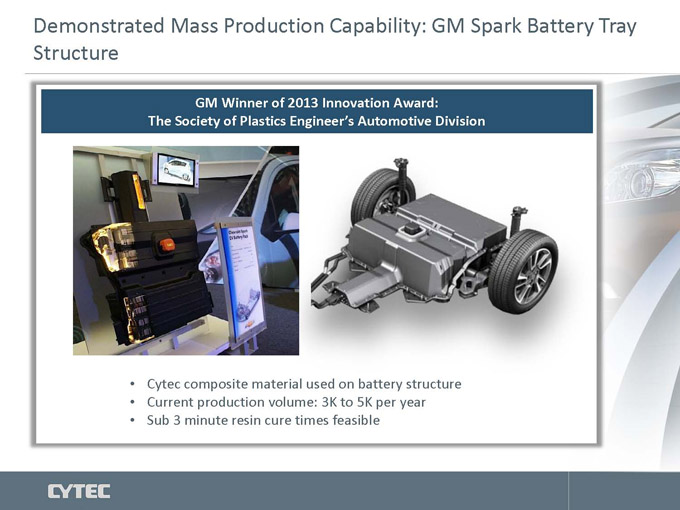
Demonstrated Mass Production Capability: GM Spark Battery Tray
Structure
GM Winner of 2013 Innovation Award:
The Society of Plastics Engineer’s Automotive Division
Cytec composite material used on battery structure
Current production volume: 3K to 5K per year
Sub 3 minute resin cure times feasible
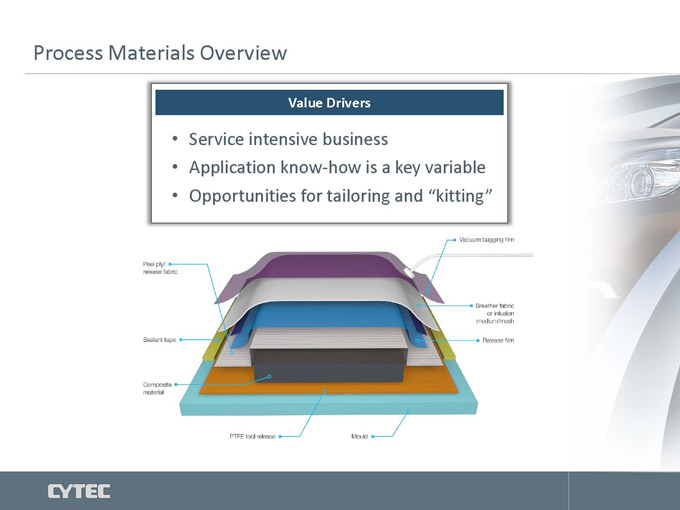
Process Materials Overview
Value Drivers
• Service intensive business
• Application know-how is a key variable
• Opportunities for tailoring and “kitting”
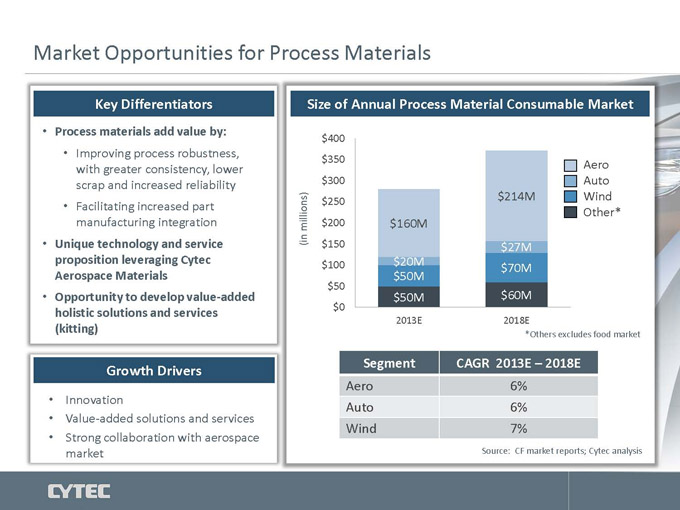
Market Opportunities for Process Materials
Key Differentiators Size of Annual Process Material Consumable Market
Process materials add value by: $400
• Improving process robustness,
with greater consistency, lower $350 Aero
scrap and increased reliability $300 Auto
$214M Wind
• Facilitating increased part $250 Other*
manufacturing integration millions) $200 $160M
Unique technology and service (in $150 $27M
proposition leveraging Cytec $100 $20M $70M
Aerospace Materials $50M
$50
Opportunity to develop value-added $50M $60M
holistic solutions and services $0
2013E 2018E
(kitting) *Others excludes food market
Growth Drivers Segment CAGR 2013E – 2018E
Aero 6%
Innovation Auto 6%
Value-added solutions and services
Strong collaboration with aerospace Wind 7%
market Source: CF market reports; Cytec analysis
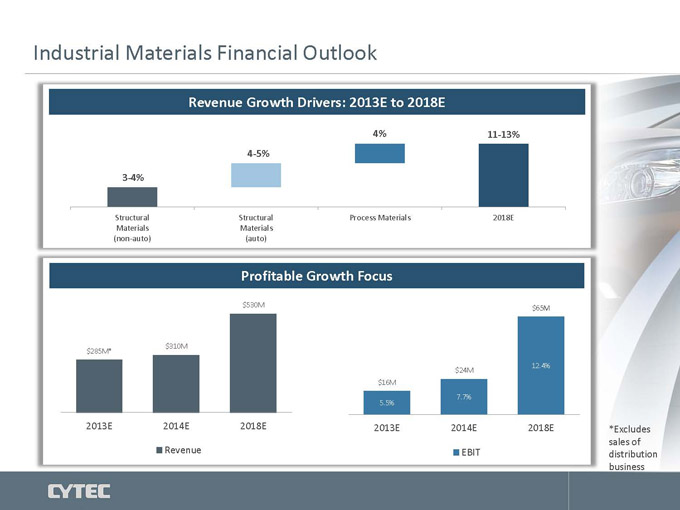
Industrial Materials Financial Outlook
Revenue Growth Drivers: 2013E to 2018E
4% 11-13%
4-5%
3-4%
Structural Structural Process Materials 2018E
Materials Materials
(non-auto) (auto)
Profitable Growth Focus
$530M $65M
$310M
$285M*
$24M 12.4%
$16M
7.7%
5.5%
2013E 2014E 2018E 2013E 2014E 2018E *Excludes
sales of
Revenue EBIT distribution
business
CYTEC DELIVERING TECHNOLOGY BEYOND OUR CUSTOMERS’ IMAGINATION TM
Michael Radossich
President Specialty Chemicals
Specialty Chemicals
In Process Separation Growth Journey
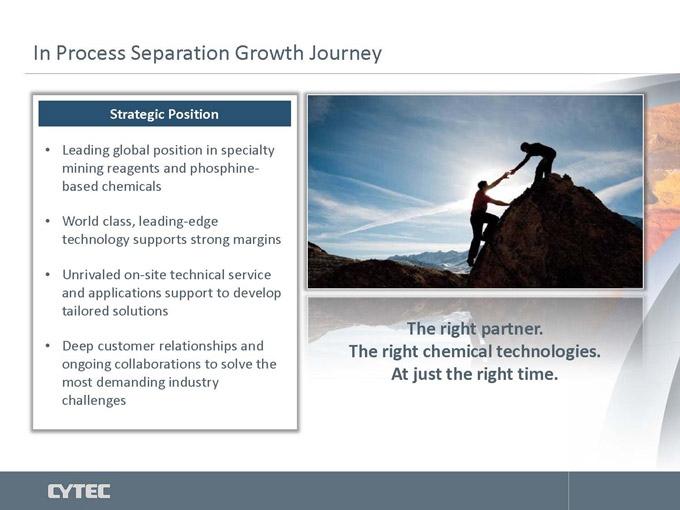
Strategic Position
Leading global position in specialty
mining reagents and phosphine-
based chemicals
World class, leading-edge
technology supports strong margins
Unrivaled on-site technical service
and applications support to develop
tailored solutions
The right partner.
Deep customer relationships and The right chemical technologies.
ongoing collaborations to solve the
most demanding industry At just the right time.
challenges
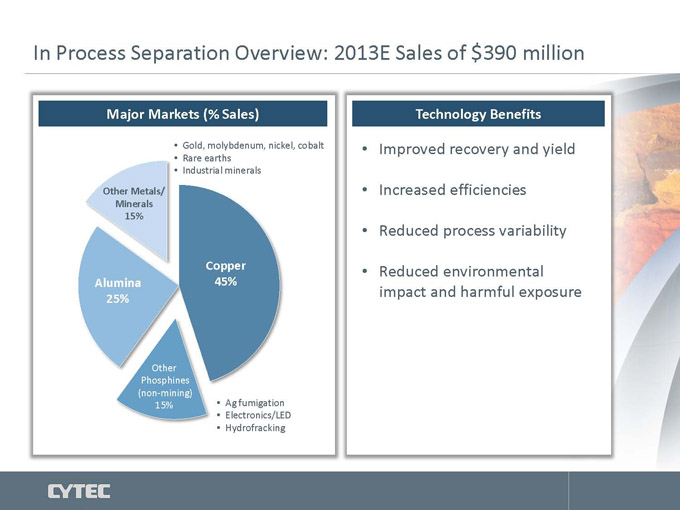
In Process Separation Overview: 2013E Sales of $390 million
Major Markets (% Sales) Technology Benefits
Gold, molybdenum, nickel, cobalt Improved recovery and yield
Rare earths
Industrial minerals
Other Metals/ • Increased efficiencies
Minerals
15%
• Reduced process variability
Copper • Reduced environmental
Alumina 45%
25% impact and harmful exposure
Other
Phosphines
(non-mining)
15% • Ag fumigation
• Electronics/LED
• Hydrofracking
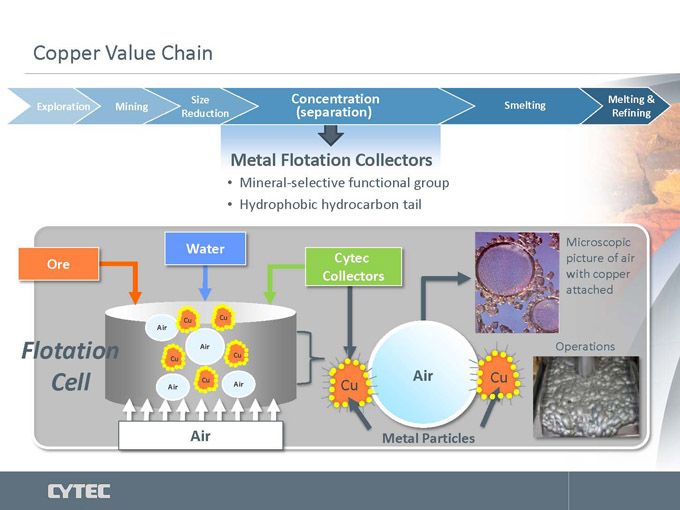
Copper Value Chain
Size Concentration Melting &
Exploration Mining Reduction (separation) Smelting Refining
Metal Flotation Collectors
• Mineral-selective functional group
• Hydrophobic hydrocarbon tail
Water Microscopic
Ore Cytec picture of air
Collectors with copper
attached
Cu Cu
Air
Air Operations
Flotation Cu
Cu
Cell Cu Cu Air Cu
Air Metal Particles

In Process Separation Business Drivers
Declining quality of copper ore requires improved technology and higher
reagent consumption
New product introductions that address customer needs drive strong growth
at high margins
New mines and brownfield expansions deliver volume growth
Adjacent applications in both mining and other non-mining phosphine
markets offers significant opportunities
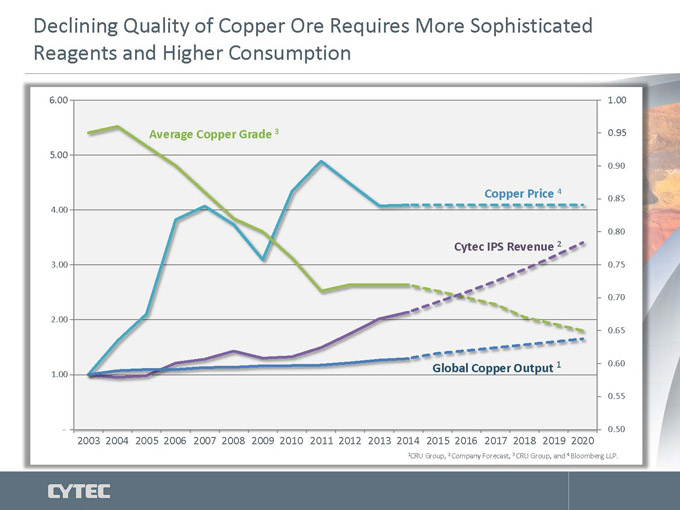
Declining Quality of Copper Ore Requires More Sophisticated
Reagents and Higher Consumption
6.00 1.00
Average Copper Grade 3 0.95
5.00
0.90
Copper Price 4 0.85
4.00
0.80
Cytec IPS Revenue 2
3.00 0.75
0.70
2.00
0.65
Global Copper Output 1 0.60
1.00
0.55
- 0.50
2003 2004 2005 2006 2007 2008 2009 2010 2011 2012 2013 2014 2015 2016 2017 2018 2019 2020
(1)CRU Group, (2)Company Forecast, (3)CRU Group, and (4)Bloomberg LLP.
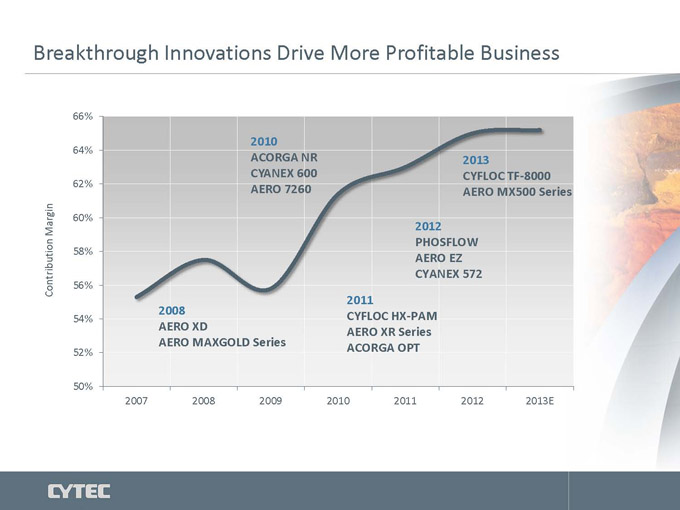
Breakthrough Innovations Drive More Profitable Business
66%
2010
64%
ACORGA NR 2013
CYANEX 600 CYFLOC TF-8000
62% AERO 7260 AERO MX500 Series
60%
Margin 2012
PHOSFLOW
58% AERO EZ
CYANEX 572
Contribution 56%
2011
2008
54% CYFLOC HX-PAM
AERO XD AERO XR Series
AERO MAXGOLD Series ACORGA OPT
52%
50%
2007 2008 2009 2010 2011 2012 2013E
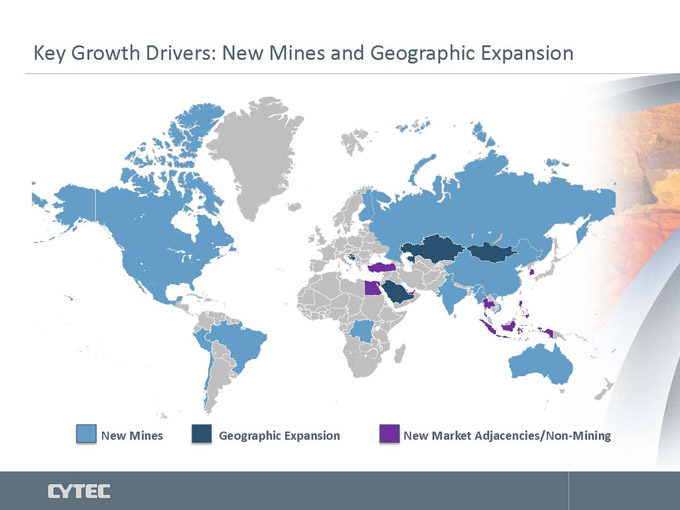
Key Growth Drivers: New Mines and Geographic Expansion
New Mines Geographic Expansion New Market Adjacencies/Non-Mining
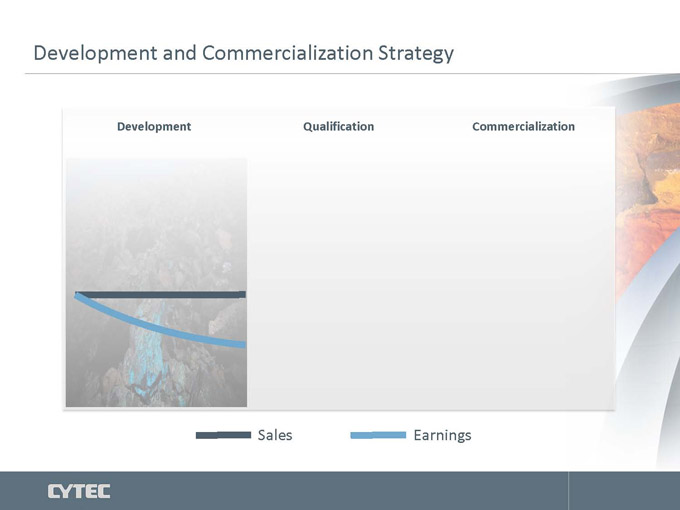
Development and Commercialization Strategy
Development Qualification Commercialization
Sales Earnings
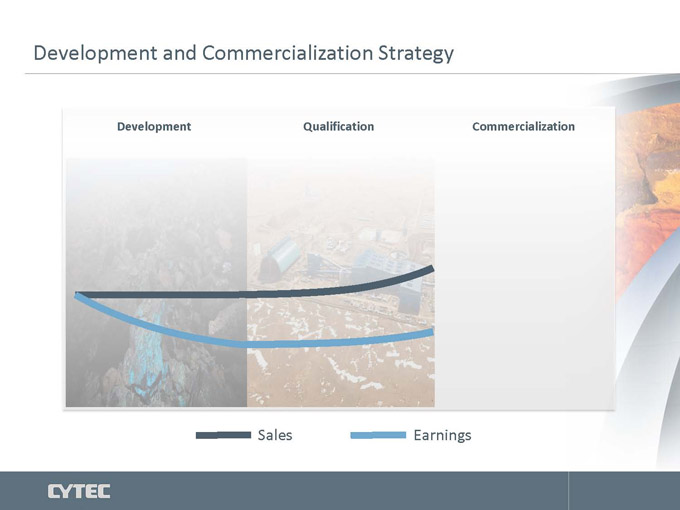
Development and Commercialization Strategy
Development Qualification Commercialization
Sales Earnings
Development and Commercialization Strategy
Development Qualification Commercialization
Sales Earnings
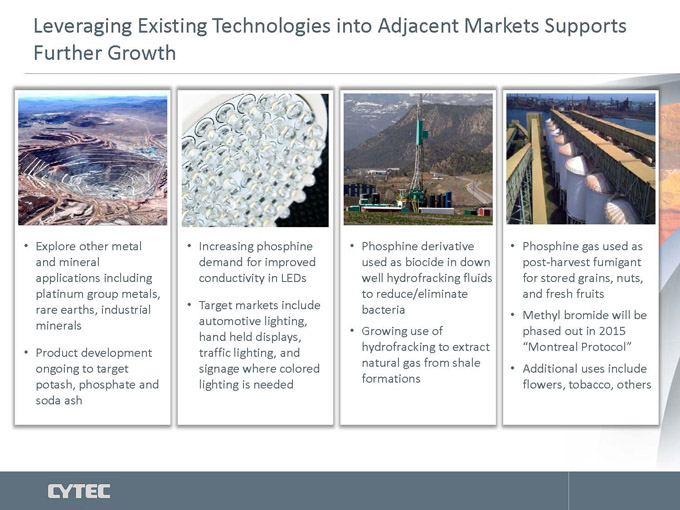
Leveraging Existing Technologies into Adjacent Markets Supports
Further Growth
Explore other metal Increasing phosphine Phosphine derivative Phosphine gas used as
and mineral demand for improved used as biocide in down post-harvest fumigant
applications including conductivity in LEDs well hydrofracking fluids for stored grains, nuts,
platinum group metals, to reduce/eliminate and fresh fruits
rare earths, industrial • Target markets include bacteria
• Methyl bromide will be
minerals automotive lighting, • Growing use of phased out in 2015
hand held displays,
Product development traffic lighting, and hydrofracking to extract “Montreal Protocol”
ongoing to target signage where colored natural gas from shale • Additional uses include
formations
potash, phosphate and lighting is needed flowers, tobacco, others
soda ash
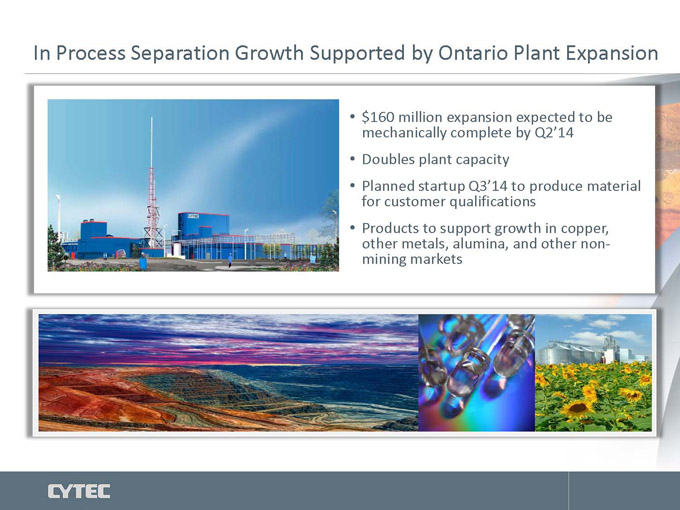
In Process Separation Growth Supported by Ontario Plant Expansion
• $160 million expansion expected to be
mechanically complete by Q2’14
• Doubles plant capacity
• Planned startup Q3’14 to produce material
for customer qualifications
• Products to support growth in copper,
other metals, alumina, and other non-
mining markets
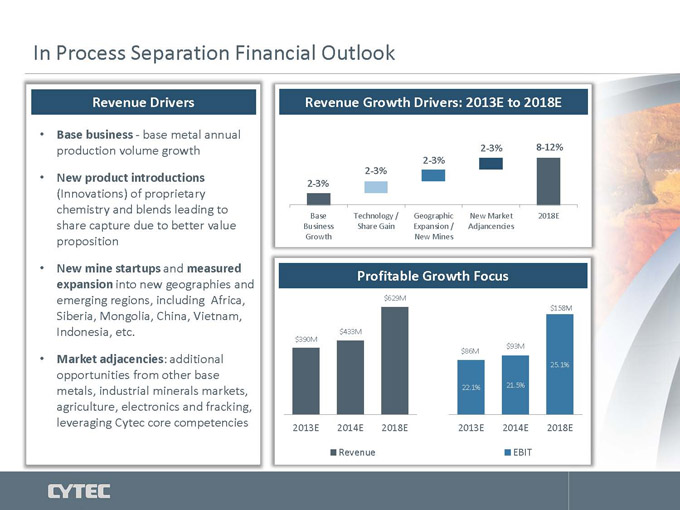
In Process Separation Financial Outlook
Revenue Drivers Revenue Growth Drivers: 2013E to 2018E
Base business—base metal annual
production volume growth 2-3% 8-12%
2-3%
New product introductions 2-3%
2-3%
(Innovations) of proprietary
chemistry and blends leading to Base Technology / Geographic New Market 2018E
share capture due to better value Business Share Gain Expansion / Adjancencies
proposition Growth New Mines
New mine startups and measured Profitable Growth Focus
expansion into new geographies and
emerging regions, including Africa, $629M
$158M
Siberia, Mongolia, China, Vietnam,
Indonesia, etc. $433M
$390M
$93M
$86M
Market adjacencies: additional 25.1%
opportunities from other base
metals, industrial minerals markets, 22.1% 21.5%
agriculture, electronics and fracking,
leveraging Cytec core competencies 2013E 2014E 2018E 2013E 2014E 2018E
Revenue EBIT
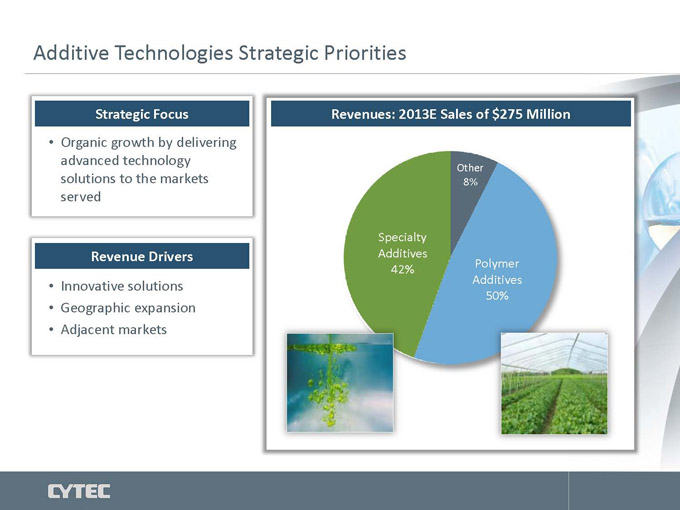
Additive Technologies Strategic Priorities
Strategic Focus Revenues: 2013E Sales of $275 Million
Organic growth by delivering
advanced technology Other
solutions to the markets 8%
served
Specialty
Revenue Drivers Additives
42% Polymer
Innovative solutions Additives
50%
Geographic expansion
Adjacent markets
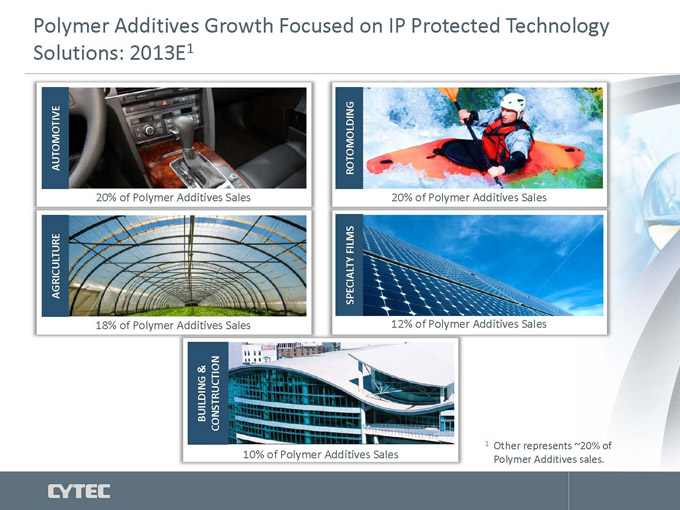
Polymer Additives Growth Focused on IP Protected Technology
Solutions: 2013E 1
AUTOMOTIVE ROTOMOLDING
20% of Polymer Additives Sales 20% of Polymer Additives Sales
FILMS
AGRICULTURE SPECIALTY
18% of Polymer Additives Sales 12% of Polymer Additives Sales
BUILDING & CONSTRUCTION
1 Other represents ~20% of
10% of Polymer Additives Sales Polymer Additives sales.
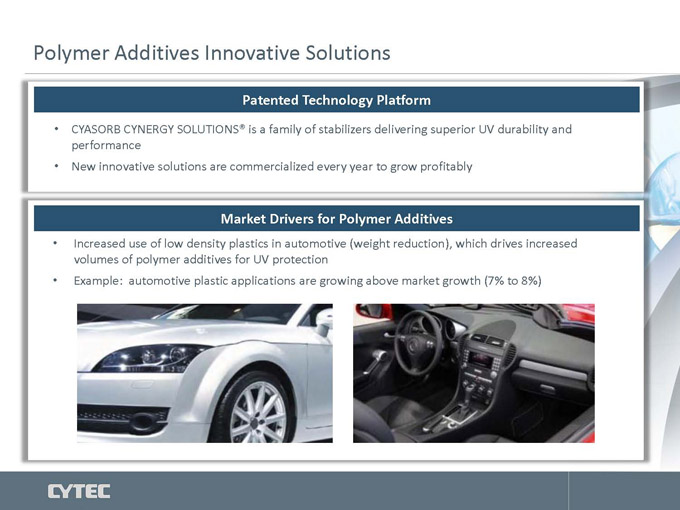
Polymer Additives Innovative Solutions
Patented Technology Platform
CYASORB CYNERGY SOLUTIONS® is a family of stabilizers delivering superior UV durability and
performance
New innovative solutions are commercialized every year to grow profitably
Market Drivers for Polymer Additives
Increased use of low density plastics in automotive (weight reduction), which drives increased
volumes of polymer additives for UV protection
Example: automotive plastic applications are growing above market growth (7% to 8%)
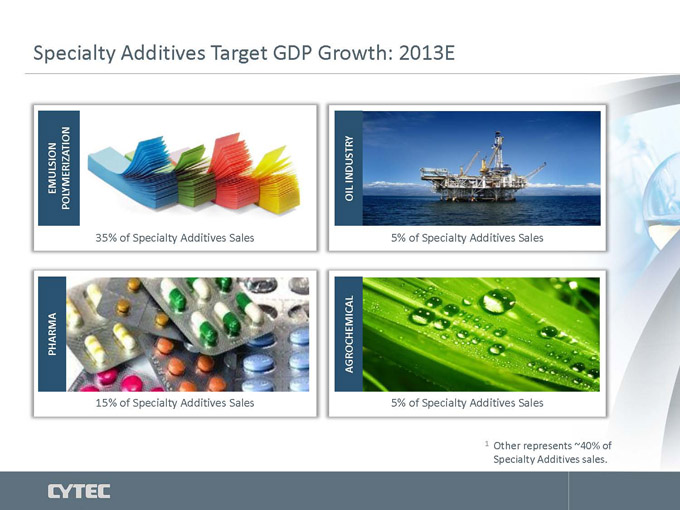
Specialty Additives Target GDP Growth: 2013E
EMULSION POLYMERIZATION OIL INDUSTRY
35% of Specialty Additives Sales 5% of Specialty Additives Sales
PHARMA AGROCHEMICAL
15% of Specialty Additives Sales 5% of Specialty Additives Sales
1 Other represents ~40% of
Specialty Additives sales.
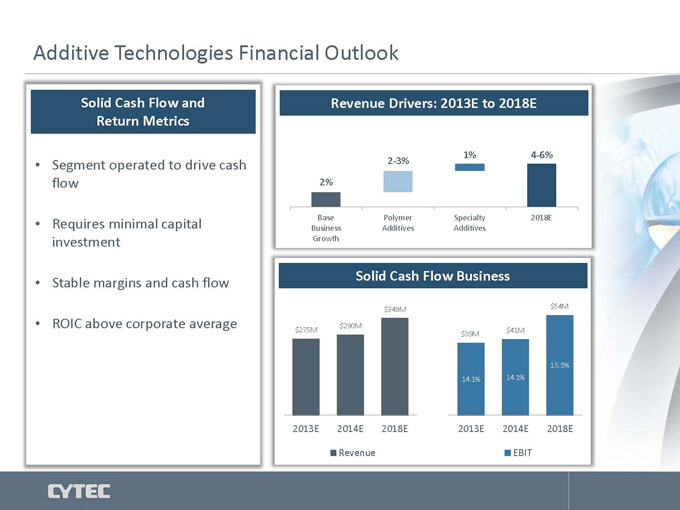
Additive Technologies Financial Outlook
Solid Cash Flow and Revenue Drivers: 2013E to 2018E
Return Metrics
1% 4-6%
Segment operated to drive cash 2-3%
flow 2%
Requires minimal capital Base Polymer Specialty 2018E
Business Additives Additives
investment Growth
Stable margins and cash flow Solid Cash Flow Business
$349M $54M
ROIC above corporate average $290M
$275M $41M
$39M
15.5%
14.1% 14.1%
2013E 2014E 2018E 2013E 2014E 2018E
Revenue EBIT
CYTEC DELIVERING TECHNOLOGY BEYOND OUR CUSTOMERS’ IMAGINATION TM
David Drillock
Vice President & Chief Financial Officer
Financial Review
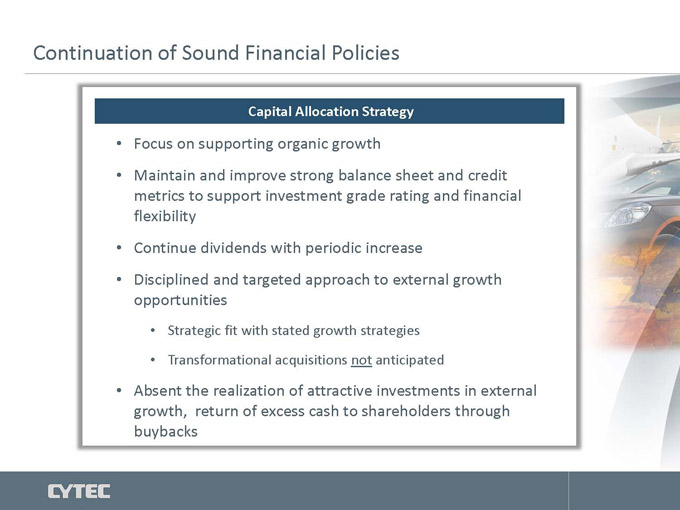
Continuation of Sound Financial Policies
Capital Allocation Strategy
Focus on supporting organic growth
Maintain and improve strong balance sheet and credit
metrics to support investment grade rating and financial
flexibility
Continue dividends with periodic increase
Disciplined and targeted approach to external growth
opportunities
• Strategic fit with stated growth strategies
• Transformational acquisitions not anticipated
Absent the realization of attractive investments in external
growth, return of excess cash to shareholders through
buybacks
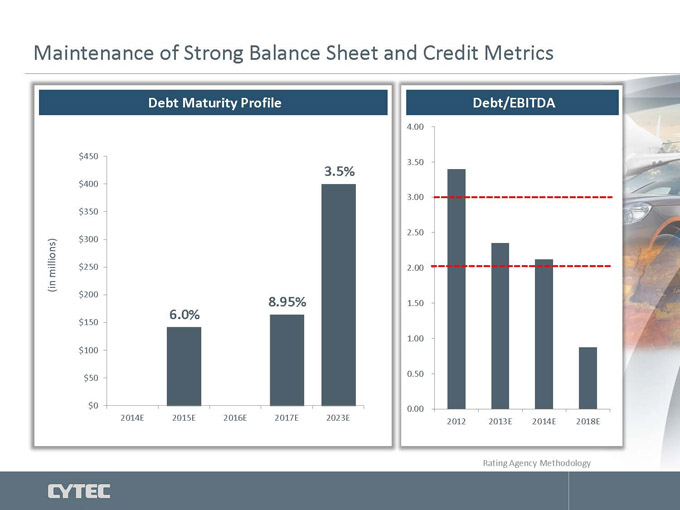
Maintenance of Strong Balance Sheet and Credit Metrics
Debt Maturity Profile Debt/EBITDA
4.00
$450
3.50
3.5%
$400
3.00
$350
2.50
$300
millions) $250 2.00
(in
$200
8.95% 1.50
6.0%
$150
1.00
$100
$50 0.50
$0 0.00
2014E 2015E 2016E 2017E 2023E 2012 2013E 2014E 2018E
Rating Agency Methodology
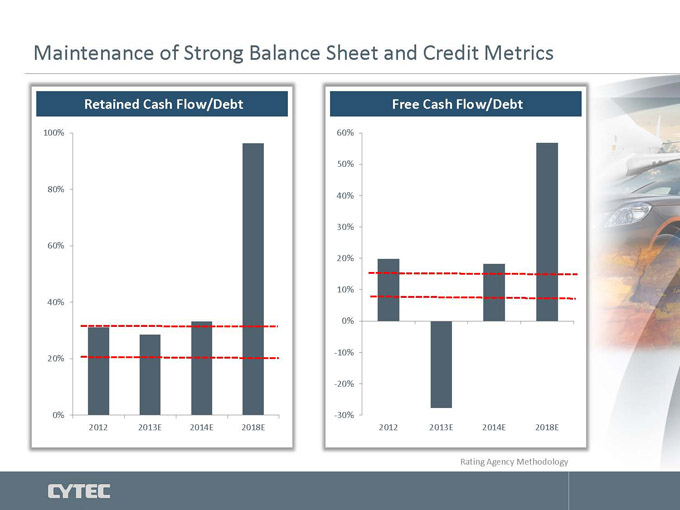
Maintenance of Strong Balance Sheet and Credit Metrics
Retained Cash Flow/Debt Free Cash Flow/Debt
100% 60%
50%
80%
40%
30%
60%
20%
10%
40%
0%
-10%
20%
-20%
0% -30%
2012 2013E 2014E 2018E 2012 2013E 2014E 2018E
Rating Agency Methodology
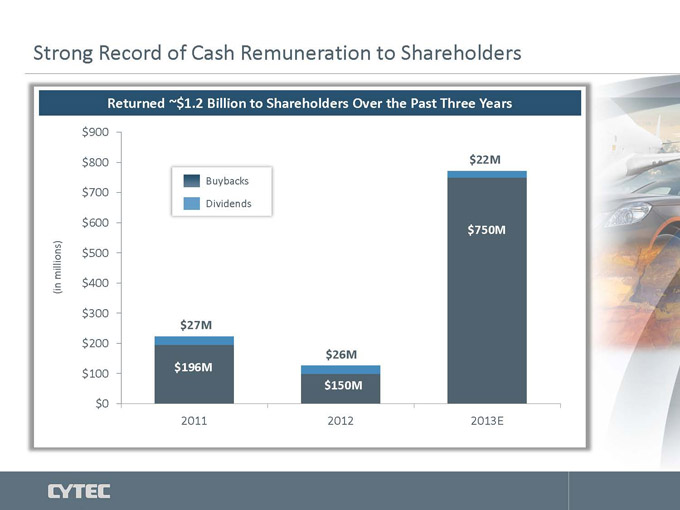
Strong Record of Cash Remuneration to Shareholders
Returned ~$1.2 Billion to Shareholders Over the Past Three Years
$900
$800 $22M
Buybacks
$700
Dividends
$600 $750M
millions) $500
(in $400
$300
$27M
$200
$26M
$100 $196M
$150M
$0
2011 2012 2013E
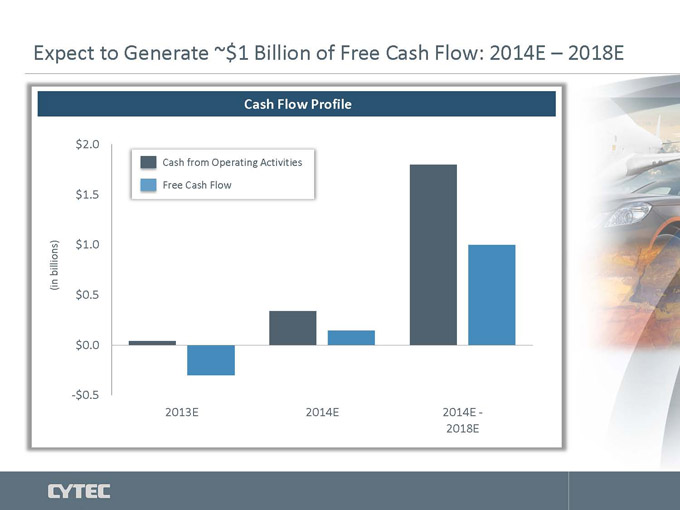
Expect to Generate ~$ 1 Billion of Free Cash Flow: 2014E – 2018E
Cash Flow Profile
$ 2.0
Cash from Operating Activities
Free Cash Flow
$ 1.5
$ 1.0
billions)
(in
$ 0.5
$ 0.0
-$ 0.5
2013E 2014E 2014E—
2018E
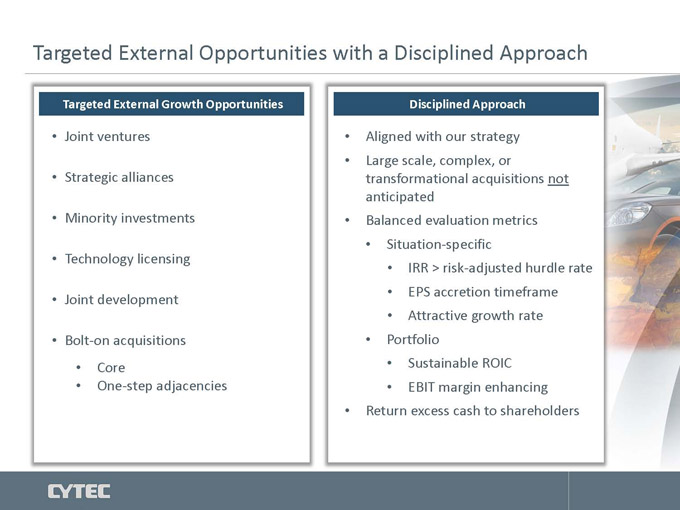
Targeted External Opportunities with a Disciplined Approach
Targeted External Growth Opportunities Disciplined Approach
Joint ventures Aligned with our strategy
• Large scale, complex, or
Strategic alliances transformational acquisitions not
anticipated
Minority investments Balanced evaluation metrics
• Situation-specific
Technology licensing IRR > risk-adjusted hurdle rate
Joint development EPS accretion timeframe
• Attractive growth rate
Bolt-on acquisitions Portfolio
• Core • Sustainable ROIC
• One-step adjacencies • EBIT margin enhancing
• Return excess cash to shareholders
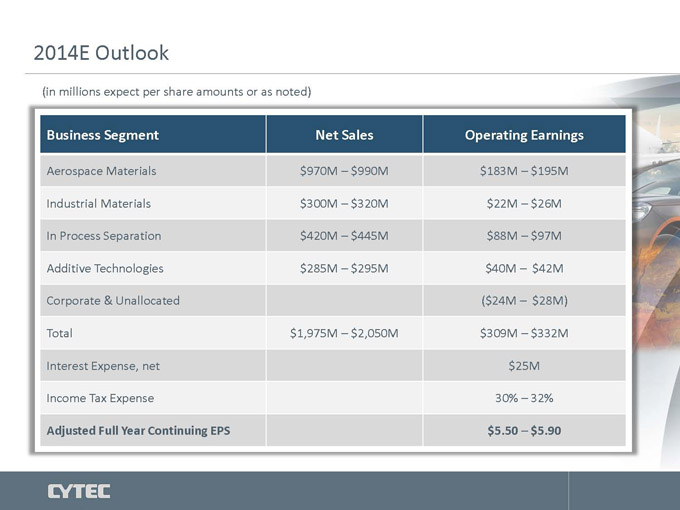
2014E Outlook
(in millions expect per share amounts or as noted)
Business Segment Net Sales Operating Earnings
Aerospace Materials $970M – $ 990M $183M – $195M
Industrial Materials $300M – $ 320M $22M – $26M
In Process Separation $420M – $ 445M $88M – $97M
Additive Technologies $285M – $ 295M $40M – $42M
Corporate & Unallocated ($24M – $28M)
Total $1,975M – $ 2,050M $309M – $332M
Interest Expense, net $25M
Income Tax Expense 30% – 32%
Adjusted Full Year Continuing EPS $5.50 – $5.90
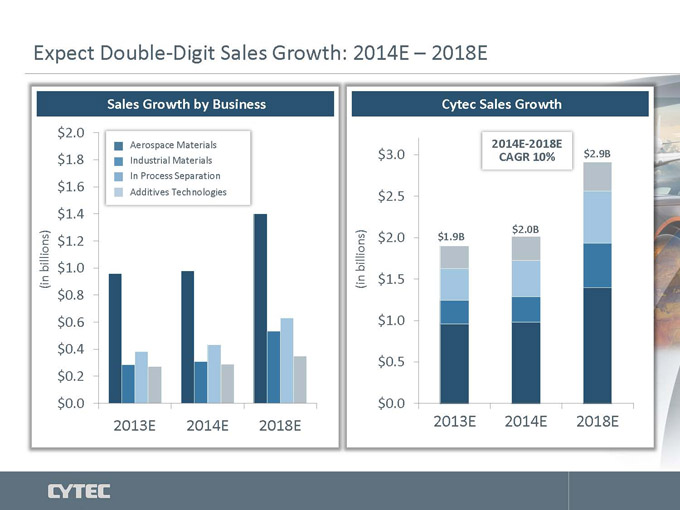
Expect Double-Digit Sales Growth: 2014E – 2018E
Sales Growth by Business Cytec Sales Growth
$ 2.0
Aerospace Materials 2014E-2018E
$ 1.8 Industrial Materials $ 3.0 CAGR 10% $2.9B
In Process Separation
$ 1.6
Additives Technologies $ 2.5
$ 1.4
$2.0B
billions) $ 1.2 billions) $ 2.0 $1.9B
$ 1.0
(in (in $ 1.5
$ 0.8
$ 0.6 $ 1.0
$ 0.4
$ 0.5
$ 0.2
$ 0.0 $ 0.0
2013E 2014E 2018E 2013E 2014E 2018E
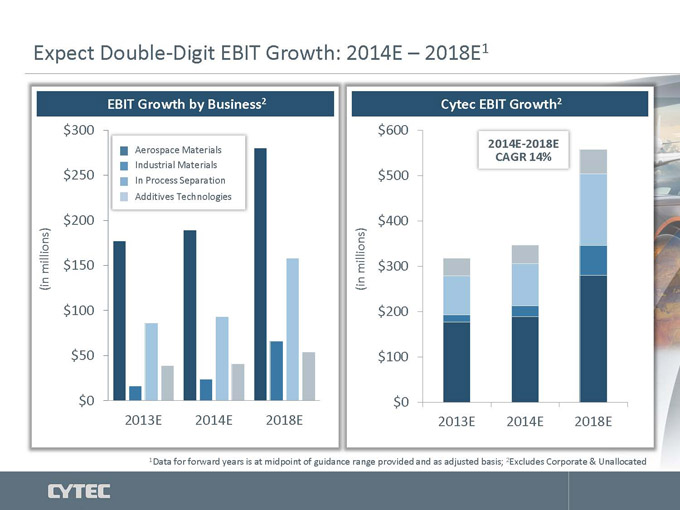
Expect Double-Digit EBIT Growth: 2014E – 2018E 1
EBIT Growth by Business 2 Cytec EBIT Growth 2
$300 $600
Aerospace Materials 2014E-2018E
CAGR 14%
Industrial Materials
$250 In Process Separation $500
Additives Technologies
$200 $400
millions) $150 millions) $300
(in (in
$100 $200
$50 $100
$0 $0
2013E 2014E 2018E 2013E 2014E 2018E
1 Data for forward years is at midpoint of guidance range provided and as adjusted basis; 2 Excludes Corporate & Unallocated
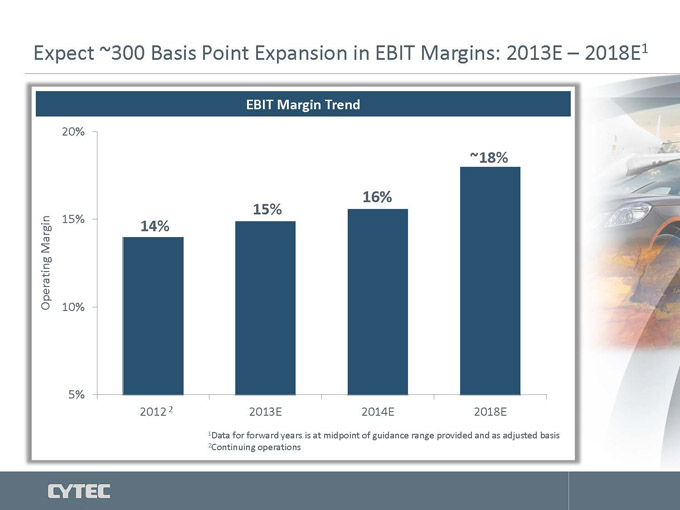
Expect ~300 Basis Point Expansion in EBIT Margins: 2013E – 2018E(1)
EBIT Margin Trend
20%
~18%
16%
15%
Margin15% 14%
Operating 10%
5%
2012 (2) 2013E 2014E 2018E
(1)Data for forward years is at midpoint of guidance range provided and as adjusted basis
(2)Continuing operations
CYTEC DELIVERING TECHNOLOGY BEYOND OUR CUSTOMERS’ IMAGINATION TM
Shane Fleming
Chairman, President & Chief Executive Officer
Closing Remarks and Q&A
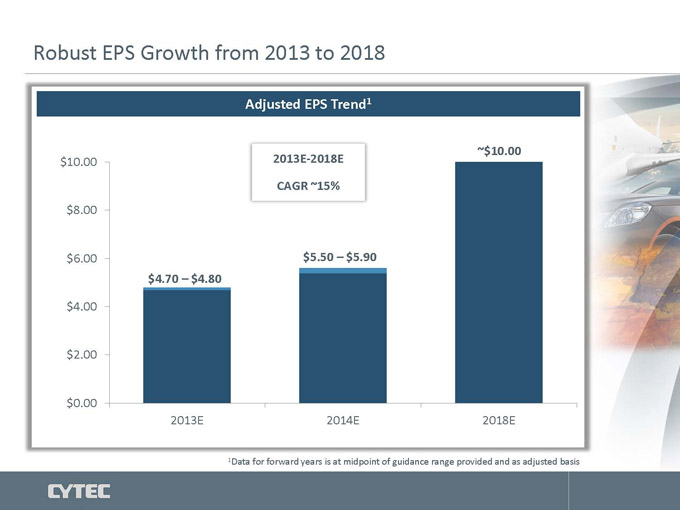
Robust EPS Growth from 2013 to 2018
Adjusted EPS Trend(1)
~$10.00
$10.00 2013E-2018E
CAGR ~15%
$8.00
$6.00 $5.50 – $5.90
$4.70 – $4.80
$4.00
$2.00
$0.00
2013E 2014E 2018E
(1)Data for forward years is at midpoint of guidance range provided and as adjusted basis
Closing Remarks
Refocused portfolio on growth strategy
Centered on secular growth in attractive end markets
Winning share with differentiated technology offerings
Common approach to development and commercialization
Accelerating growth and strengthening Cytec through our evolved enterprise model
Delivering profitable growth through leading market positions

CYTEC DELIVERING TECHNOLOGY BEYOND OUR CUSTOMERS’ IMAGINATION TM
Thank you