File No. 333-
As filed with the SEC on April 15, 2011
U.S. SECURITIES AND EXCHANGE COMMISSION
Washington, DC 20549
FORM N-14
REGISTRATION STATEMENT
UNDER
THE SECURITIES ACT OF 1933
Pre-Effective Amendment No.
Post-Effective Amendment No.
(Check appropriate box or boxes)
FEDERATED INSURANCE SERIES
(Exact Name of Registrant as Specified in Charter)
1-800-341-7400
(Area Code and Telephone Number)
4000 Ericsson Drive
Warrendale, Pennsylvania 15086-7561
(Address of Principal Executive Offices)
John W. McGonigle, Esquire
Federated Investors Tower
1001 Liberty Avenue
Pittsburgh, Pennsylvania 15222-3779
(Name and Address of Agent for Service)
Copies to:
Clair E. Pagnano, Esquire
K&L Gates LLP
State Street Financial Center
One Lincoln Street
Boston, MA 02111-2950
Acquisition of the assets of
MONEY MARKET PORTFOLIO
HIGH GRADE BOND PORTFOLIO
STRATEGIC YIELD PORTFOLIO
MANAGED PORTFOLIO
VALUE GROWTH PORTFOLIO
BLUE CHIP PORTFOLIO
portfolios of EquiTrust Variable Insurance Series Fund
By and in exchange for Primary Shares, Service Shares and undesignated shares of beneficial interest of
FEDERATED PRIME MONEY FUND II
FEDERATED QUALITY BOND FUND II
FEDERATED CAPITAL INCOME FUND II
FEDERATED CAPITAL APPRECIATION FUND II
portfolios of Federated Insurance Series Trust
Approximate Date of Proposed Public Offering: As soon as
practicable after this Registration Statement becomes effective
under the Securities Act of 1933, as amended.
Title of Securities Being Registered: Primary Shares, Service Shares and undesignated shares of beneficial interest
without par value, of Federated Prime Money Fund II, Federated Quality Bond Fund II, Federated Capital Income
Fund II and Federated Capital Appreciation Fund II
It is proposed that this filing will become effective on May 16, 2011 pursuant to Rule 488.
No filing fee is due because Registrant is relying on Section 24(f) of the Investment Company Act of 1940, as amended.
EQUITRUST VARIABLE INSURANCE SERIES FUND
5400 University Avenue
West Des Moines, Iowa 50266
[May 16], 2011
Dear Contractholder:
We are pleased to announce that, after extensive review and consideration, EquiTrust Variable Insurance Series Fund’s board of trustees has approved a recommendation to merge the Fund’s portfolios with funds managed by Federated Investors, Inc., a highly respected leader in cash management, fixed income and equity strategies. Federated Investors has provided asset management services for institutional and individual investors since 1955 and has more than [$355] billion in assets under management.
We believe this merger will be extremely favorable for Contractholders who maintain investments in the EquiTrust Variable Insurance Series Fund through a variable annuity contract or certificate and/or variable life insurance policy that participates in the Fund. It will allow you to leverage Federated Investors’ core competencies in mutual fund administration and asset management as you plan for your financial security.
The merger will have no impact on your relationship with your agent. He or she can continue to assist you with your subaccount investment(s), including those in the Federated funds.
Although the merger has been approved by the board of trustees, it is subject to shareholder approval. Information about the proposed merger and benefits to our Contractholders is enclosed, along with proxy materials to make it easy for you to vote your shares. If the merger is approved, the portfolios of EquiTrust Variable Insurance Series Fund will merge into Federated funds on or about [July 15], 2011.
Additional information about how the EquiTrust Variable Insurance Series Fund will be reorganized into comparable Federated funds is included in this mailing. Please take the time to read and understand all of the materials enclosed, and if we can answer questions or assist you with the Prospectus/Proxy Statement, please contact the Fund at 1-877-860-2904.
The Board of Trustees recommends that you vote in favor of this merger. After reviewing the contents of this mailing, we believe you’ll agree that the fund options available through Federated Investors will continue to help you achieve your financial goals and objectives.
Sincerely,
James E. Hohmann, Chief Executive Officer
FBL Financial Group, Inc.
Questions and Answers Regarding This Prospectus/Proxy Statement
EquiTrust Variable Insurance Series Fund, an open-end diversified management investment company consisting of six portfolios and managed by EquiTrust Investment Management Services, Inc., will hold a special meeting of shareholders on [July 14], 2011. It is important that you vote on the proposal outlined in this Prospectus/Proxy Statement. Please read the Prospectus/Proxy Statement in its entirety to ensure your full understanding of the proposal.
The information that follows summarizes the proposal and the voting process.
| A | EquiTrust Investment Management Services, Inc. (the “Adviser”), the investment adviser of the EquiTrust Variable Insurance Series Fund (the “Fund”), has recommended – and the Board of Trustees has approved – a proposal to reorganize and merge the Fund’s portfolios into funds managed by Federated Investors, Inc. or its affiliates (“Federated Investors”). |
| Q | What issue am I being asked to vote on? |
| A | You are being asked to approve a proposal to merge your investment(s) in the Fund’s portfolio(s) through a variable annuity contract or certificate and/or variable life insurance policy into a fund managed by Federated Investors, Inc. or its affiliates. The Fund’s Board of Trustees unanimously recommends that you vote in favor of this proposal. |
| Q | Why the Federated family of funds? |
| A | Federated Investors is one of the largest investment management organizations in the United States. They advise 135 funds and manage more than [$355] billion in assets. Federated has provided asset management services for institutional and individual investors since 1955. |
| Q | Why has this proposal been made? |
| A | Given the Fund’s assets and prospects for growth, the Adviser sought and recommended to the Board an organization whose core competencies include cash management, fixed income and equity strategies, as well as extensive mutual fund administration capabilities. The Board of Trustees believes it is in the best interests of the Fund to proceed with this merger. (Please refer to page 1 of the attached Prospectus/Proxy Statement for more discussion about the proposed reorganization.) |
| A | The reorganization of each Fund portfolio into a corresponding Federated fund will provide the Fund portfolios’ Contractholders with the following: |
| | • | | the opportunity to retain shares in a fund with a similar investment objective(s); |
| | • | | an investment in a larger combined fund with increased long-term growth prospects, which can spread relative fixed costs over a larger asset base; |
| | • | | an investment in a family of mutual funds managed by an investment adviser with extensive investment management resources; and |
| | • | | ongoing access to your current agent who can continue to assist you with your variable annuity contract or certificate and/or variable life insurance policy investment(s). |
| Q | What will happen to my EquiTrust Variable Insurance Series Fund investment(s)? |
| A | As part of the merger, the Fund portfolios will be closed and your investment(s) will be transferred to the corresponding Federated fund. This will happen automatically according to the mapping plan outlined below, and no action by you is required. Your account value will not change, but because the Federated funds will have different NAVs (net asset values) than the EquiTrust Variable Insurance Series Fund portfolios (with the exception of the Money Market Portfolio reorganization), it’s likely that the number of shares you hold will change as a result of the merger. |
| Q | Which Federated fund(s) will the Fund portfolios merge into upon approval of this proposal? |
| A | At merger, the EquiTrust Variable Insurance Series Fund portfolios will map to the Federated Funds as follows: |
| | |
EquiTrust Variable Insurance Series Fund | | Federated Investors |
Blue Chip and Value Growth Portfolios | | Capital Appreciation Fund II |
Managed Portfolio | | Capital Income Fund II |
High Grade Bond and Strategic Yield Portfolios | | Quality Bond Fund II |
Money Market Portfolio | | Prime Money Fund II |
| Q | When will the merger take place? |
| A | With shareholder approval, the portfolio(s) of the EquiTrust Variable Insurance Series Fund will merge into Federated Funds on or about [July 15], 2011. |
| Q | Will the merger cause me to have to pay any taxes? |
| A | No, this merger will be a tax-free event. |
| Q | Can I continue to work with my current agent? |
| A | Absolutely. Your current agent can continue to help you with all of the products and services you’ve relied on in the past – including contributions and redemptions for your variable annuity contract or certificate and/or variable life insurance policy. |
| Q | Will I still have access to historical information about my Fund investment(s)? |
| A | Yes. Because your investment(s) in the Fund is the result of owning a variable annuity contract or certificate and/or variable life insurance policy through an insurance company that utilized the Fund as an investment vehicle, all records related to your investment(s) in the Fund are maintained by the insurance company. |
| Q | Who will pay for the merger? |
| A | All fees and expenses incurred as a direct result of the merger will be paid by the Adviser, Federated’s advisers, and/or their affiliates. None of the costs of the reorganization transactions will be borne by the Fund’s contractholders. |
| Q | How do I vote my shares? |
| A | You may vote your Fund shares through one of the following methods: |
1) by phone, using the special toll-free number provided in the proxy materials;
2) online, using the instructions provided in the proxy materials;
3) at the special meeting of shareholders scheduled to be held on Thursday, July 14; or
4) by mailing the enclosed Proxy Card.
| Q | Who do I call with questions about the Proxy/Prospectus Statement? |
| A | Please contact your agent or you may call EquiTrust Variable Insurance Series Fund at 1-877-860-2904. |
Money Market Portfolio
High Grade Bond Portfolio
Strategic Yield Portfolio
Managed Portfolio
Value Growth Portfolio
Blue Chip Portfolio
portfolios of EQUITRUST VARIABLE INSURANCE SERIES FUND
5400 University Avenue
West Des Moines, Iowa 50266
NOTICE OF SPECIAL MEETING OF SHAREHOLDERS
TO BE HELD [July 14], 2011
A special meeting of the shareholders of each Portfolio of EquiTrust Variable Insurance Series Fund (the “Fund”) listed above will be held at the offices of EquiTrust Investment Management Services, Inc., 5400 University Avenue, West Des Moines, Iowa 50266, on [July 14], 2011 for the following purposes:
| | 1. | For shareholders of Money Market Portfolio, to approve an Agreement and Plan of Reorganization pursuant to which Federated Prime Money Fund II, a portfolio of Federated Insurance Series, would acquire substantially all of the assets of Money Market Portfolio in exchange for shares of Federated Prime Money Fund II to be distributed pro rata by Money Market Portfolio to its holders of Initial and Service Class Shares, in complete liquidation and termination of Money Market Portfolio; |
| | 2. | For shareholders of High Grade Bond Portfolio, to approve an Agreement and Plan of Reorganization pursuant to which Federated Quality Bond Fund II, a portfolio of Federated Insurance Series, would acquire substantially all of the assets of High Grade Bond Portfolio in exchange for Primary Shares of Federated Quality Bond Fund II to be distributed pro rata by High Grade Bond Portfolio to its holders of Initial Class Shares, and for Primary Shares of Federated Quality Bond Fund II to be distributed pro rata by High Grade Bond Portfolio to its holders of Service Class Shares, in complete liquidation and termination of High Grade Bond Portfolio; |
| | 3. | For shareholders of Managed Portfolio, to approve an Agreement and Plan of Reorganization pursuant to which Federated Capital Income Fund II, a portfolio of Federated Insurance Series, would acquire substantially all of the assets of Managed Portfolio in exchange for shares of Federated Capital Income Fund II to be distributed pro rata by Managed Portfolio to its holders of Initial Class and Service Class Shares, in complete liquidation and termination of Managed Portfolio; |
| | 4. | For shareholders of Strategic Yield Portfolio, to approve an Agreement and Plan of Reorganization pursuant to which Federated Quality Bond Fund II, a portfolio of Federated Insurance Series, would acquire substantially all of the assets of Strategic Yield Portfolio in exchange for Primary Shares of Federated Quality Bond Fund II to be distributed pro rata by Strategic Yield Portfolio to its holders of Initial Class Shares, and for Primary Shares of Federated Quality Bond Fund II to be distributed pro rata by Strategic Yield Portfolio to its holders of Service Class Shares, in complete liquidation and termination of Strategic Yield Portfolio; |
| | 5. | For shareholders of Value Growth Portfolio, to approve an Agreement and Plan of Reorganization pursuant to which Federated Capital Appreciation Fund II, a portfolio of Federated Insurance Series, would acquire substantially all of the assets of Value Growth Portfolio in exchange for Primary Shares of Federated Capital Appreciation Fund II to be |
| | distributed pro rata by Value Growth Portfolio to its holders of Initial Class Shares, and for Primary Shares of Federated Capital Appreciation Fund II to be distributed pro rata by Value Growth Portfolio to its holders of Service Class Shares, in complete liquidation and termination of Value Growth Portfolio; |
| | 6. | For shareholders of Blue Chip Portfolio, to approve an Agreement and Plan of Reorganization pursuant to which Federated Capital Appreciation Fund II, a portfolio of Federated Insurance Series, would acquire substantially all of the assets of Blue Chip Portfolio in exchange for Primary Shares of Federated Capital Appreciation Fund II to be distributed pro rata by Blue Chip Portfolio to its holders of Initial Class Shares, and for Primary Shares of Federated Capital Appreciation Fund II to be distributed pro rata by Blue Chip Portfolio to its holders of Service Class Shares, in complete liquidation and termination of Blue Chip Portfolio; and |
| | 7. | To transact such other business as may properly come before the special meeting or any adjournment thereof. |
Each Portfolio of the Fund listed above is referred to individually as an “Acquired Fund” and collectively as the “Acquired Funds.”
Please note that owners of variable life insurance policies or variable annuity contracts or certificates (the “Contractholders”) issued by Farm Bureau Life Insurance Company, EquiTrust Life Insurance Company, American Equity Investment Life Insurance Company, Modern Woodmen of America, and COUNTRY Investors Life Assurance Company (each, an “Insurance Company”) who have invested in shares of the Acquired Funds through the investment divisions of a separate account or accounts of an Insurance Company will be given the opportunity, to the extent required by law, to provide the applicable Insurance Company with voting instructions on the above proposals.
The Board of Trustees has fixed [May 16,] 2011, as the record date for determination of shareholders entitled to vote at the special meeting.
|
| By Order of the Board of Trustees, |
|
/s/ Craig A. Lang |
| Craig A. Lang |
| President and Trustee |
| EquiTrust Variable Insurance Series Fund |
[May 16], 2011
YOU CAN HELP AVOID THE NECESSITY AND EXPENSE OF SENDING FOLLOW-UP LETTERS TO ENSURE A QUORUM BY PROMPTLY SIGNING AND RETURNING THE ENCLOSED PROXY CARD. IF YOU ARE UNABLE TO ATTEND THE MEETING, PLEASE MARK, SIGN, DATE AND RETURN THE ENCLOSED PROXY CARD SO THAT THE NECESSARY QUORUM MAY BE REPRESENTED AT THE SPECIAL MEETING. THE ENCLOSED ENVELOPE REQUIRES NO POSTAGE IF MAILED IN THE UNITED STATES.
PROSPECTUS/PROXY STATEMENT
[May 16], 2011
Acquisition of the assets of:
MONEY MARKET PORTFOLIO
HIGH GRADE BOND PORTFOLIO
STRATEGIC YIELD PORTFOLIO
MANAGED PORTFOLIO
VALUE GROWTH PORTFOLIO
BLUE CHIP PORTFOLIO
each a portfolio of EQUITRUST VARIABLE INSURANCE SERIES FUND
5400 University Avenue
West Des Moines, Iowa 50266
Telephone No: 1-877-860-2904
By and in exchange for Shares of:
FEDERATED PRIME MONEY FUND II
FEDERATED QUALITY BOND FUND II
FEDERATED CAPITAL INCOME FUND II
or
FEDERATED CAPITAL APPRECIATION FUND II
each a portfolio of:
FEDERATED INSURANCE SERIES
4000 Ericsson Drive
Warrendale, Pennsylvania 15086-7561
Telephone No: 1-800-341-7400
1
This Combined Prospectus and Proxy Statement (the “Prospectus/Proxy Statement”) is being furnished to owners of variable life insurance policies or variable annuity contracts or certificates (the “Contracts”) (the “Contractholders”) issued by Farm Bureau Life Insurance Company, EquiTrust Life Insurance Company, American Equity Investment Life Insurance Company, Modern Woodmen of America, and COUNTRY Investors Life Assurance Company (each, an “Insurance Company” and together, the “Insurance Companies”) who, as of [May 16], 2011, had net premiums or contributions allocated to the investment divisions of an Insurance Company’s separate accounts (the “Separate Accounts”) that are invested in shares of beneficial interest in one or more of the following Portfolios: Money Market Portfolio, High Grade Bond Portfolio, Managed Portfolio, Strategic Yield Portfolio, Value Growth Portfolio and Blue Chip Portfolio (collectively, the “Acquired Funds”), each a series of EquiTrust Variable Insurance Series Fund (the “EquiTrust Variable Fund”). This Prospectus/Proxy Statement also is being furnished to the Insurance Companies as the record owners of shares that were invested in one or more of the Acquired Funds as of [May 16], 2011. Contractholders are being provided the opportunity to instruct the applicable Insurance Company to approve or disapprove the proposals contained in this Proxy Statement/Prospectus in connection with the solicitation by the Board of Trustees of the EquiTrust Variable Fund (the “EquiTrust Variable Board”) of proxies to be used at the Special Meeting of Shareholders of the Acquired Funds to be held at the offices of EquiTrust Investment Management Services, Inc., 5400 University Avenue, West Des Moines, Iowa 50266, on [July 14], 2011, or any adjournment or adjournments thereof (the “Special Meeting”).
This Prospectus/Proxy Statement describes the proposals for the reorganizations (the “Reorganizations”) pursuant to six separate Agreements and Plans of Reorganization (the “Plans”), pursuant to which certain portfolios (each, an “EquiTrust Variable Portfolio”) of the EquiTrust Variable Fund as described in the chart below would transfer substantially all their assets to certain corresponding portfolios (each, a “Federated Insurance Fund” or an “Acquiring Fund”) of Federated Insurance Series (the “Federated Insurance Trust”) in exchange for shares and classes of the respective Federated Insurance Funds as set forth in the chart:
| | |
| Acquired Fund | | Acquiring Fund |
| Money Market Portfolio | | Federated Prime Money Fund II |
Initial Class Shares | | This Fund offers a single un-designated class of shares. |
Service Class Shares | |
| High Grade Bond Portfolio | | Federated Quality Bond Fund II |
Initial Class Shares | | Primary Shares |
Service Class Shares | | Primary Shares |
| Strategic Yield Portfolio | | Federated Quality Bond Fund II |
Initial Class Shares | | Primary Shares |
Service Class Shares | | Primary Shares |
| Managed Portfolio | | Federated Capital Income Fund II |
Initial Class Shares | | This Fund offers a single un-designated class of shares. |
Service Class Shares | |
| Value Growth Portfolio | | Federated Capital Appreciation Fund II |
Initial Class Shares | | Primary Shares |
Service Class Shares | | Primary Shares |
| Blue Chip Portfolio | | Federated Capital Appreciation Fund II |
Initial Class Shares | | Primary Shares |
Service Class Shares | | Primary Shares |
The designated shares of the respective Federated Insurance Funds will be distributed pro rata by each corresponding EquiTrust Variable Portfolio to its shareholders in complete liquidation and dissolution of the EquiTrust Variable Portfolio. As a result of the Reorganizations, each owner of shares of an EquiTrust Variable Portfolio will become the owner of shares of the corresponding Federated Insurance Fund having a total net asset value (“NAV”) equal to the total NAV of his or her holdings in the applicable EquiTrust Variable Portfolio on the date of the Reorganizations (the “Closing Date”), subject to the following: at the time of Reorganizations, the value
2
of the assets of each EquiTrust Variable Portfolio will be determined in accordance with the corresponding Federated Insurance Fund’s valuation procedures (although it is not anticipated that the use of Federated’s valuation procedures will result in a material revaluation of an EquiTrust Variable Portfolio’s assets at the time of the Reorganizations). Similarly, each Contractholder whose Contract values are invested in shares of one or more of the Acquired Funds would become an indirect owner of shares of the corresponding Acquiring Fund. Each such Contractholder would indirectly hold, immediately after the Closing Date, un-designated class shares or Primary Shares, as indicated in this Prospectus/Proxy Statement, of the applicable Acquiring Fund having an aggregate value equal to the aggregate value of the Initial Class or Service Class Acquired Fund Shares, as applicable, that were indirectly held by the Contractholder as of the Closing Date. With respect to the Money Market Portfolio Reorganization, because both Money Market Portfolio and Federated Prime Money Fund II value their shares at an NAV of $1.00 per share, each Contractholder whose Contract values are invested in shares of the Portfolio would indirectly hold the same number of shares of the Federated Fund as are currently held of the Portfolio. The separate Plans are substantially identical, and forms of such Plans are attached as Annex A-1 (for the money market fund Reorganization described in the chart above) and Annex A-2 (for one of the non-money market fund Reorganizations described in the chart above).
Each Contractholder whose Contract values are invested in shares of one or more of the Acquired Funds as of [May 16], 2011 may instruct the Insurance Company on how to vote the shares of the EquiTrust Variable Portfolios attributable to their Contract. The Insurance Company will vote all shares of the EquiTrust Variable Portfolios issued to it in proportion to the voting instructions with respect to the Portfolios timely received from the Contractholders.
For a comparison of the investment policies of the EquiTrust Variable Portfolios and the Federated Insurance Funds, see “Summary-Comparison of Investment Objectives, Policies, and Risks- Investment Limitations.” Information concerning shares of the Federated Insurance Funds, as compared to shares of the EquiTrust Variable Portfolios, is included in this Prospectus/Proxy Statement in the sections entitled “Summary-Comparative Fee Tables” and “Information About the Reorganizations-Description of the Federated Insurance Fund Share Classes and Capitalization.”
This Prospectus/Proxy Statement should be retained for further reference. It sets forth concisely the information about each Federated Insurance Fund that a shareholder should know before voting on the Reorganizations. This Prospectus/Proxy Statement is accompanied by the applicable Prospectus of the Federated Insurance Funds as follows: Federated Insurance Series Prime Money Fund II, Federated Insurance Series Quality Bond Fund II – Primary Shares, Federated Insurance Series Capital Income Fund II, and Federated Insurance Series Capital Appreciation Fund II – Primary Shares, each dated [April 30, 2011] and each of which is incorporated herein by reference (the “Incorporated Federated Insurance Fund Prospectuses”). A Statement of Additional Information (“SAI”) relating to this Prospectus/Proxy Statement dated [May 16], 2011, as well as the SAI for the Federated Insurance Funds, dated [April 30, 2011], containing additional information, have been filed with the Securities and Exchange Commission (the “SEC”) and are incorporated herein by reference.
Further information about each Federated Insurance Fund’s performance is contained in the Annual Report of the Federated Insurance Trust for the fiscal year ended December 31, 2010, which is incorporated herein by reference.
A Prospectus and SAI for the EquiTrust Variable Fund, dated [May 1, 2011], have been filed with the SEC and are incorporated herein by reference.
Further information regarding each EquiTrust Variable Portfolio’s performance is contained in EquiTrust Variable Fund’s Annual Report for the fiscal year ended December 31, 2010, which is incorporated herein by reference. Copies of these materials and other information about the Federated Insurance Funds and the EquiTrust Variable Fund may be obtained without charge by writing or by calling the Federated Insurance Funds or EquiTrust Variable Fund, as applicable, at the address and telephone number shown on the previous pages.
|
| THE SECURITIES AND EXCHANGE COMMISSION HAS NOT APPROVED OR DISAPPROVED THESE SECURITIES, OR PASSED UPON THE ACCURACY OR ADEQUACY OF THIS PROSPECTUS/PROXY STATEMENT. ANY REPRESENTATION TO THE CONTRARY IS A CRIMINAL OFFENSE. |
3
|
NO PERSON HAS BEEN AUTHORIZED TO GIVE ANY INFORMATION OR TO MAKE ANY REPRESENTATIONS OTHER THAN THOSE CONTAINED IN THIS PROSPECTUS/PROXY STATEMENT AND IN THE MATERIALS EXPRESSLY INCORPORATED HEREIN BY REFERENCE AND, IF GIVEN OR MADE, SUCH OTHER INFORMATION OR REPRESENTATIONS MUST NOT BE RELIED UPON AS HAVING BEEN AUTHORIZED BY THE FUNDS. |
| |
THE SHARES OFFERED BY THIS PROSPECTUS/PROXY STATEMENT ARE NOT DEPOSITS OR OBLIGATIONS OF, OR GUARANTEED OR ENDORSED BY, ANY BANK. THESE SHARES ARE NOT FEDERALLY INSURED BY, GUARANTEED BY, OBLIGATIONS OF OR OTHERWISE SUPPORTED BY THE U.S. GOVERNMENT, THE FEDERAL DEPOSIT INSURANCE CORPORATION, THE FEDERAL RESERVE BOARD OR ANY OTHER GOVERNMENTAL AGENCY. INVESTMENT IN THESE SHARES INVOLVES INVESTMENT RISKS, INCLUDING POSSIBLE LOSS OF PRINCIPAL AMOUNT INVESTED. |
|
4
TABLE OF CONTENTS
5
SUMMARY
This summary is qualified in its entirety by reference to the additional information contained elsewhere in this Prospectus/Proxy Statement, or incorporated herein by reference into this Prospectus/Proxy Statement. A copy of a form of the Plan to be used in connection with the Money Market Portfolio Reorganization is attached to this Prospectus/Proxy Statement as Annex A-1. A copy of a form of Plan to be used in connection with the Reorganizations of High Grade Bond Portfolio, Strategic Yield Portfolio, Managed Portfolio, Value Growth Portfolio, and Blue Chip Portfolio (each a “non-money market fund”) is attached to this Prospectus/Proxy Statement as Annex A-2. For more complete information, please read the prospectuses of the applicable Federated Insurance Fund and EquiTrust Variable Fund (collectively the “Funds” or individually a “Fund”) and the SAI relating to this Prospectus/Proxy Statement. A copy of the prospectus for each applicable Federated Insurance Fund accompanies this Prospectus/Proxy Statement.
In the event that one or more of the proposed Reorganizations is not approved by shareholders of the relevant EquiTrust Variable Portfolio(s), including the proposed reorganizations of the series of another investment company managed by the Portfolios’ investment adviser, it is possible that none of the proposed Reorganizations will take place. See “Agreement Among Federated, EquiTrust and FBL Financial Group, Inc.” below.
REASONS FOR THE PROPOSED REORGANIZATIONS
In 2009, EquiTrust began reviewing and discussing the future of the EquiTrust Variable Fund with the EquiTrust Variable Board, following an operational assessment conducted by FBL Financial Group, Inc., EquiTrust’s parent (“FBL”), of its mutual fund business. EquiTrust noted that, given the EquiTrust Variable Fund’s asset size, further expected reductions in assets and lack of economies of scale, along with FBL’s determination that the mutual fund business is not a core business for FBL, EquiTrust did not believe the EquiTrust Variable Fund was a viable investment option going forward. After further discussions with the EquiTrust Variable Board, EquiTrust sought and recommended to the EquiTrust Variable Board an organization that is positioned to manage and administer the EquiTrust Variable Fund’s assets, gather additional assets and continue to provide services to shareholders of the EquiTrust Variable Fund. In particular, rather than propose liquidating the EquiTrust Variable Fund, EquiTrust proposed to the EquiTrust Variable Board the Reorganizations of the EquiTrust Variable Portfolios with Federated Insurance Funds that are similar from an investment objective standpoint.
On April 11, 2011, EquiTrust and Federated made presentations to the EquiTrust Variable Board regarding the Reorganizations and EquiTrust formally proposed and the Board, including the independent Trustees, approved the terms of the Reorganizations. The Board has also agreed to recommend that the Reorganizations be approved by the shareholders of each EquiTrust Variable Portfolio.
In determining to recommend that shareholders of each EquiTrust Variable Portfolio approve its proposed Reorganization, the Board considered the factors described below:
| | • | | The asset size of the EquiTrust Variable Fund and lack of expected asset growth; |
| | • | | The investment performance of the Federated Insurance Funds relative to that of the corresponding EquiTrust Variable Portfolios, and in particular, that each Federated Insurance Fund’s performance over one-, three-, five- and ten-year periods ended February 28, 2011, as applicable, was generally comparable to that of the corresponding EquiTrust Variable Portfolio, and in some cases, better than that of the corresponding EquiTrust Variable Portfolio |
| | • | | The investment objective, policies and restrictions of the Federated Insurance Funds are similar to the corresponding EquiTrust Variable Portfolios; |
| | • | | The size and financial stability of Federated and its experience managing mutual funds; |
| | • | | The fees and expenses of the Federated Insurance Funds relative to those of the corresponding EquiTrust Variable Portfolios, and in particular, that in all cases, except for the Service Class |
6
| | Shares of the Strategic Yield and Money Market Portfolios, the Federated Portfolio’s net expenses were higher than those of the corresponding EquiTrust Variable Portfolio. However, the Board noted that, at its November 2010 meeting, it had reviewed each EquiTrust Variable Portfolio’s total expense ratios (net of expense reimbursements, where applicable) with other registered funds pursuing broadly similar strategies as included in reports prepared by EquiTrust, which showed that each class of each EquiTrust Variable Portfolio’s expense ratios with the exception of Initial Class Shares of the Value Growth Portfolio were below average compared to similar mutual funds. The Board also noted Federated’s agreement to waive fees and/or reimburse expenses for each Federated Insurance Fund until the later of May 31, 2012 or the date of the Federated Insurance Fund’s next effective Prospectus; |
| | • | | The tax consequences of each Reorganization on the EquiTrust Variable Portfolio and its shareholders, and in particular, that the Reorganization would be a tax-free reorganization for federal tax purposes; |
| | • | | EquiTrust, Federated or their affiliates would bear all costs associated with the Reorganizations; |
| | • | | The terms and conditions of each Reorganization were fair and reasonable and generally consistent with industry practices; and |
| | • | | The services available to shareholders after the Reorganizations. |
Based on all of the above, the EquiTrust Variable Board concluded that each EquiTrust Variable Portfolio’s participation in the proposed Reorganization would be in the best interests of the EquiTrust Variable Fund. The EquiTrust Variable Board, including the independent Trustees, unanimously recommend that shareholders of each EquiTrust Variable Portfolio approve its proposed Reorganization.
FEDERAL INCOME TAX CONSEQUENCES
As a condition of the Reorganizations, the EquiTrust Variable Fund and the Federated Insurance Funds will receive opinions of counsel that the Reorganizations will be considered tax-free “reorganizations” under applicable provisions of the Internal Revenue Code of 1986, as amended (the “Code”), so that no gain or loss will be recognized directly as a result of the Reorganizations by the EquiTrust Variable Fund or the Federated Insurance Funds or by the EquiTrust Variable Funds’ shareholders. The aggregate tax basis of the Federated Insurance Fund shares received by a shareholder of the corresponding EquiTrust Variable Fund will be the same as the aggregate tax basis of the EquiTrust Variable Fund shares previously held by such shareholder, and the holding period of the Federated Insurance Fund shares received generally will include the holding period of the EquiTrust Variable Fund shares surrendered in exchange. Each EquiTrust Variable Portfolio will distribute to shareholders any previously undistributed investment company taxable income (determined without regard to the deduction for dividends paid), net tax-exempt interest and realized net capital gains (after reduction by any available capital loss carryforwards) accumulated prior to the Reorganizations. This is not expected to be a taxable event for federal income tax purposes for variable annuity or variable life insurance contract owners.
COMPARISON OF INVESTMENT OBJECTIVES, POLICIES AND RISKS
This section will help you compare the investment objectives, policies and risks of each EquiTrust Variable Portfolio with its corresponding Federated Insurance Fund.
The investment objective of each EquiTrust Variable Portfolio is fundamental and can be changed only with shareholder approval. The investment objective of Federated Capital Appreciation Fund II is non-fundamental and can be changed by the Fund’s Board without shareholder approval. The investment objective of each other Federated Fund is fundamental and can be changed only with shareholder approval.
Please be aware that this is only a brief discussion. More complete information may be found in the EquiTrust
7
Variable Fund’s and Federated Insurance Funds’ prospectuses.
MONEY MARKET PORTFOLIO – FEDERATED PRIME MONEY FUND II
Each Fund’s investment objective is to provide current income consistent with stability of principal and liquidity.
Money Market Portfolio invests exclusively in U.S. dollar-denominated money market securities maturing in thirteen months or less from the date of purchase, including those issued by U.S. financial institutions, corporate issuers, the U.S. Government and its agencies, instrumentalities and municipalities. At least 97% of the Portfolio’s assets must be rated in the highest short-term category by a nationally recognized statistical rating organization (“NRSRO”) (e.g., P-1 by Moody’s Investors Service, Inc. (“Moody’s”) or A-1 by Standard & Poor’s Corporation (“S&P”)) (or its unrated equivalent), and 100% of its assets must be invested in securities rated in the two highest rating categories by an NRSRO (P-1/P-2 by Moody’s or A-1/A-2 by S&P). The Portfolio maintains a dollar-weighted average portfolio maturity of 60 days or less.
Federated Prime Money Fund II, on the other hand, invests primarily in a portfolio of high-quality, fixed-income securities issued by banks, corporations and the U.S. government, maturing in 397 days or less. Certain of the securities in which the Fund invests pay interest at a rate that is periodically adjusted (“Adjustable Rate Securities”). The Fund’s adviser actively manages the Fund’s portfolio, seeking to limit the credit risk taken by the Fund and to select investments with enhanced yields.
Federated Prime Money Fund II’s adviser performs a fundamental credit analysis to develop an approved list of issuers and securities that meet its standard for minimal credit risk. The Fund’s adviser monitors the credit risks of all portfolio securities on an ongoing basis by reviewing periodic financial data and ratings of NRSROs.
Federated Prime Money Fund II’s adviser monitors the credit risks of all portfolio securities by reviewing periodic financial data and ratings of NRSROs designated by Fund’s Board (“Designated NRSROs”). The Fund targets a dollar-weighted average portfolio maturity (“DWAM”) range based upon its interest rate outlook. The Fund formulates its interest rate outlook by analyzing a variety of factors, such as current and expected U.S. economic growth; current and expected interest rates and inflation; and the Federal Reserve Board’s monetary policy. The Fund’s adviser structures the portfolio by investing primarily in variable rate instruments and commercial paper to achieve a limited barbell structure. In this structure, the maturities of the Fund’s investments tend to be concentrated towards the shorter and longer ends of the maturity range of Fund’s investments, rather than evenly spread across the range. The Fund’s adviser generally adjusts the DWAM by increasing or decreasing the maturities of the investments at the longer end of the barbell. The Fund’s adviser generally shortens the DWAM when it expects interest rates to rise and extends the DWAM when it expects interest rates to fall. This strategy seeks to enhance the returns from favorable interest rate changes and reduce the effect of unfavorable changes.
Federated Prime Money Fund II: (1) maintains a DWAM of 60 days or less; and (2) maintains a weighted average life (“WAL”) of 120 days or less. For purposes of calculating DWAM, the maturity of an Adjustable Rate Security generally will be the period remaining until its next interest rate adjustment. For purposes of calculating WAL, the maturity of an Adjustable Rate Security will be its stated final maturity, without regard to interest rate adjustments; accordingly, the 120-day WAL limitation could serve to limit the Fund’s ability to invest in Adjustable Rate Securities.
Because Money Market Portfolio and Federated Prime Money Fund II have similar investment objectives and policies, their principal risks will be similar. All mutual funds take investment risks. Therefore, it is possible to lose money by investing in either Fund.
The following summarizes some of the more significant risk factors relating to both Funds. References to “Fund” are to both Money Market Portfolio and Federated Prime Money Fund II.
| | • | | Issuer Credit Risk. There is a possibility that issuers of securities in which the Fund may invest may default on the payment of interest or principal on the securities when due, which would cause the Fund to lose money. |
8
| | • | | Interest Rate Risk. Prices of fixed-income securities generally fall when interest rates rise. Interest rate changes have a greater effect on the price of fixed-income securities with longer maturities. |
| | • | | Risk Associated with Investing Share Purchase Proceeds. On days where there are net purchases of shares, the Fund must invest the proceeds at prevailing market yields or hold cash. If the yield of the securities purchased is less than that of the securities already in the Fund’s portfolio, or if the Fund holds cash, the Fund’s yield will likely decrease. Conversely, net purchases on days on which short-term yields rise will cause the Fund’s yield to increase. In the event of significant changes in short-term yields or significant net purchases, the Fund retains the discretion to close to new investments. However, the Fund is not required to close, and no assurance can be given that this will be done in any given circumstance. |
| | • | | Risk Associated with the Use of Amortized Cost. In the unlikely event that the Fund’s Board were to determine pursuant to Rule 2a-7 that the extent of the deviation between the Fund’s amortized cost per share and its market-based NAV per share may result in material dilution or other unfair results to shareholders, the Board will cause the Fund to take such action as it deems appropriate to eliminate or reduce to the extent practicable such dilution or unfair results. |
| | • | | Changing Distribution Levels Risk. There is no guarantee that the Fund will provide a certain level of income or that any such income will exceed the rate of inflation. |
| | • | | Short Term Trading. The Funds may sell portfolio securities prior to maturity to realize gains or losses to shorten the funds’ average maturity and may reduce or withhold dividends if they deem such actions appropriate to maintain a stable net asset value. In addition, the Funds may attempt, from time to time, to increase their yield by trading to take advantage of variations in the markets for short-term money market instruments. |
Because Federated Prime Money Fund II may invest in commercial paper, demand instruments, bank instruments, asset-backed securities, insurance contracts, foreign securities, securities that have credit enhancement, repurchase agreements, other investment companies and other permissible investments as a principal strategy, it is also subject to the following additional principal risks:
| | • | | Prepayment Risk. The Fund may invest in asset-backed and mortgage-backed securities, which may be subject to prepayment risk. If interest rates fall, and unscheduled prepayments on such securities accelerate, the Fund will be required to reinvest the proceeds at the lower interest rates then available. |
| | • | | Risk of Foreign Investing. Because the Fund invests in securities issued by foreign companies, the Fund may be more affected by foreign economic and political conditions, taxation policies and accounting and auditing standards than would otherwise be the case. |
| | • | | Counterparty Credit Risk. Counterparty credit risk includes the possibility that a party to a transaction involving the Fund will fail to meet its obligations. This could cause the Fund to lose the benefit of the transaction or prevent the Fund from selling or buying other securities to implement its investment strategies. |
| | • | | Sector Risk. A substantial part of the Fund’s portfolio may be comprised of securities issued by companies in the financial services industry. As a result, the Fund will be more susceptible to any economic, business, political or other developments which generally affect these companies. |
| | • | | Credit Enhancement Risk. The securities in which the Fund invests may be subject to credit enhancement (for example, guarantees, letters of credit or bond insurance). If the credit quality of the credit enhancement provider (for example, a bank) is downgraded, the rating on a security credit enhanced by such credit enhancement provider also may be downgraded. Having multiple securities credit enhanced by the same credit enhancement provider will increase the adverse effects on the Fund that are likely to result from a downgrading of, or a default by, such a credit enhancement provider. |
9
| | • | | Risk Associated with Investing Share Purchase Proceeds. On days where there are net purchases of Shares, the Fund must invest the proceeds at prevailing market yields or hold cash. If the yield of the securities purchased is less than that of the securities already in the Fund’s portfolio, or if the Fund holds cash, the Fund’s yield will likely decrease. Conversely, net purchases on days on which short-term yields rise will cause the Fund’s yield to increase. In the event of significant changes in short-term yields or significant net purchases, the Fund retains the discretion to close to new investments. However, the Fund is not required to close, and no assurance can be given that this will be done in any given circumstance. |
HIGH GRADE BOND PORTFOLIO AND STRATEGIC YIELD PORTFOLIO – FEDERATED QUALITY BOND FUND II
High Grade Bond Portfolio’s investment objective is to generate as high a level of current income as is consistent with investments in a diversified portfolio of high grade income-bearing debt securities. Strategic Yield Portfolio’s investment objective is to seek as high a level of current income as is consistent with an investment in a diversified portfolio of lower-rated, higher-yielding income-bearing securities. Strategic Yield Portfolio also seeks capital appreciation, but only when consistent with its primary investment objective. Federated Quality Bond Fund II’s investment objective is to provide current income by investing in a diversified portfolio of investment-grade, fixed-income securities.
Each of High Grade Bond Portfolio and Federated Quality Bond Fund II normally invests at least 80% of its net assets, plus the amount of any borrowings for investment purposes, in high grade bonds.
High Grade Bond Portfolio intends to maintain an intermediate (typically 2-7 years) average portfolio duration. High grade bonds are debt securities rated, at the time of purchase, in the three highest rating categories by an NRSRO (e.g., A or higher by either Moody’s or S&P) or unrated securities that the Portfolio’s investment adviser determines are of comparable quality. It may invest in a broad range of debt securities of domestic corporate and government issuers. The corporate securities in which it may invest include debt securities of various types and maturities, e.g., debentures, notes, mortgage-backed securities, capital securities and other collateralized or asset-backed securities, as well as “junk” bonds. (Junk bonds are those rated, at the time of purchase, below the fourth credit grade by an NRSRO (e.g., Ba/BB or below by Moody’s/S&P) or unrated securities that the Portfolio’s adviser determines are of comparable quality.) The Portfolio may invest up to 20% of its total assets in unrated debt securities or debt securities rated lower than the three highest grades of S&P or Moody’s; or in convertible or non-convertible preferred stocks rated within the three highest grades of S&P or Moody’s. The Portfolio will not directly purchase common stocks. However, it may retain up to 10% of the value of its assets in common stocks acquired either by conversion of debt securities or by the exercise of warrants attached to debt securities. It may also invest up to 25% of its net assets in debt securities of foreign issuers as consistent with its investment objective.
Strategic Yield Portfolio pursues its investment objective by investing primarily (i.e., at least 65% of total assets) in fixed-income securities, including convertible and non-convertible debt securities and preferred stock, rated Baa/BBB or lower by Moody’s/S&P (and their unrated equivalents) including “junk” bonds; or in other high-yielding/high-risk securities that its investment adviser believes offer attractive risk/return characteristics. The remaining assets may be held in cash or investment-grade commercial paper, obligations of banks and savings institutions, U.S. Government securities, government agency securities and repurchase agreements. The Portfolio may also invest in mortgage-backed securities, capital securities and other collateralized or asset-backed securities. It may invest up to 25% of its net assets in debt securities of foreign issuers as consistent with its investment objective.
Federated Quality Bond Fund II invests in a diversified portfolio of investment-grade, fixed-income securities consisting primarily of corporate debt securities, U.S. government and privately issued mortgage-backed securities, and U.S. Treasury and agency securities. The Fund’s adviser seeks to enhance performance by allocating relatively more of its portfolio to the security type that the Fund’s adviser expects to offer the best balance between current income and risk. Some of the corporate debt securities in which the Fund invests are considered to be “foreign securities.” The foreign securities in which the Fund invests will be predominately denominated in U.S. dollars. The Fund may invest in derivative contracts and/or hybrid instruments to implement elements of its investment strategy as more fully described in the Fund’s prospectus.
10
Although the value of Federated Quality Bond Fund II’s shares will fluctuate, the Fund’s adviser will seek to manage the magnitude of fluctuation by limiting, under normal market conditions, the Fund’s dollar-weighted average maturity to between three and ten years and dollar-weighted average duration to between three and seven years. Maturity reflects the time until a fixed-income security becomes payable. Duration measures the price sensitivity of a fixed-income security to changes in interest rates.
Federated Quality Bond Fund II intends to invest in the securities of U.S. government-sponsored entities (GSEs), including GSE securities that are not backed by the full faith and credit of the U.S. government, such as those issued by the Federal Home Loan Mortgage Corporation, the Federal National Mortgage Association, and the Federal Home Loan Bank System. These entities are, however, supported through federal subsidies, loans or other benefits. The Fund may also invest in GSE securities that are supported by the full faith and credit of the U.S. government, such as those issued by the Government National Mortgage Association. Finally, Federated Quality Bond Fund II may invest in a few GSE securities that have no explicit financial support, but which are regarded as having implied support because the federal government sponsors their activities. Such securities include those issued by the Farm Credit System and the Financing Corporation.
While Strategic Yield Portfolio may invest up to 65% of its assets in non-investment grade securities, Federated Quality Bond Fund II does not invest in such securities.
Because High Grade Bond Portfolio, Strategic Yield Portfolio and Federated Quality Bond Fund II have similar investment objectives and policies, their principal risks will be similar. All mutual funds take investment risks. Therefore, it is possible to lose money by investing in any of these Funds.
The following summarizes some of the more significant risk factors relating to all three Funds. References to “Fund” are to High Grade Bond Portfolio, Strategic Yield Portfolio and Federated Quality Bond Fund II.
| | • | | Interest Rate Risk. Prices of fixed-income securities generally fall when interest rates rise. Interest rate changes have a greater effect on the price of fixed-income securities with longer durations. |
| | • | | Credit Risk. There is a possibility that issuers of securities in which a Fund may invest may default in the payment of interest or principal on the securities when due, which would cause the Fund to lose money. |
| | • | | Call and Prepayment Risk. A Fund’s performance may be adversely affected by the possibility that an issuer of a security held by the Fund may redeem the security prior to maturity at a price below its current market value. For instance, when homeowners prepay their mortgages in response to current interest rates, a Fund will be required to reinvest the proceeds at the current interest rates available. Also, when interest rates fall, the price of mortgage-backed securities may not rise to as great an extent as that of other fixed-income securities. |
| | • | | Risk of Foreign Investing. Because each Fund invests in securities issued by foreign companies, the Fund’s share price may be more affected by foreign economic and political conditions, taxation policies and accounting and auditing standards than could otherwise be the case. |
| | • | | Liquidity Risk. The fixed-income securities in which each Fund invests may be less readily marketable and may be subject to greater fluctuation in price than other securities. Liquidity risk also refers to the possibility that a Fund may not be able to sell a security or close out a derivative contract when it wants to. |
Because Federated Quality Bond Fund II may invest in complex collateralized mortgage obligations (“CMOs”), derivatives contracts and other hybrid instruments as a principal strategy, it is also subject to the following additional risks:
| | • | | Risk Associated with CMOs. CMOs with complex or highly variable prepayment terms, such as companion classes, IOs, POs, inverse floaters and residuals, generally entail greater market, prepayment and liquidity risks than other mortgage-backed securities. For example, their prices are more volatile and their trading market may be more limited. |
11
| | • | | Risk of Investing in Derivative Contracts and Hybrid Instruments. Please see important discussion below. |
| | • | | Leverage Risk. Leverage risk is created when an investment exposes the Fund to a level of risk that exceeds the amount invested. |
Strategic Yield Portfolio also is subject to the following risk:
| | • | | Risk Associated with Noninvestment-Grade Securities. The Portfolio may invest a significant portion of its assets in securities rated below investment grade (which are also known as junk bonds), which may be subject to greater credit, interest rate and liquidity risks than investment-grade securities. |
MANAGED PORTFOLIO – FEDERATED CAPITAL INCOME FUND II
Managed Portfolio’s investment objective is to seek the highest level of total return through income and capital appreciation. Federated Capital Income Fund II’s investment objective is to achieve high current income and moderate capital appreciation.
Managed Portfolio pursues its objective through a fully managed investment policy consisting of investment in the following three market sectors: (1) common stocks and other equity securities, (2) high grade debt securities and (3) money market instruments. It invests in both securities of companies that its investment adviser believes have a potential to earn a high return on capital and/or are undervalued by the market (i.e., “value stocks”) and securities of those companies that display more traditional growth characteristics such as established records of growth in sales and earnings. The Portfolio also invests in high grade bonds and money market securities. There are no restrictions as to the proportion of one or another type of security that it may hold. Accordingly, at any given time, it may be substantially invested in equity securities, debt securities or money market instruments. The Portfolio may also invest in mortgage-backed securities, capital securities, and other collateralized or asset-backed securities. It may invest up to 25% of its net assets in equity securities of foreign issuers as consistent with its investment objective.
Federated Capital Income Fund II, on the other hand, pursues its investment objective by investing in both equity and fixed-income securities that have high relative income potential. The Fund’s adviser’s process for selecting equity investments attempts to identify mature, mid- to large-cap value companies with high relative dividend yields that are likely to maintain and increase their dividends. The Fund’s adviser selects fixed-income investments that offer high current yields. The Fund’s adviser expects that these fixed-income investments will primarily be investment-grade debt issues, domestic non-investment-grade debt securities (also known as “junk bonds” or “high-yield bonds”) and foreign investment-grade and non-investment-grade fixed-income securities, including emerging market debt securities. The Fund’s adviser continuously analyzes a variety of economic and market indicators, considers the expected performance and risks unique to these categories of fixed-income investments, and attempts to strategically allocate among the categories to achieve strong income across changing business cycles. The Fund’s adviser does not target an average maturity or duration for the Fund’s portfolio and may invest in bonds of any maturity range. The Fund may buy or sell foreign currencies in lieu of or in addition to non-dollar denominated fixed-income securities in order to increase or decrease its exposure to foreign interest rate and/or currency markets.
Certain of the government securities in which Federated Capital Income Fund II invests are not backed by the full faith and credit of the U.S. government, such as those issued by the Federal Home Loan Mortgage Corporation (Freddie Mac), the Federal National Mortgage Association (Fannie Mae), and the Federal Home Loan Bank System. These entities are, however, supported through federal subsidies, loans or other benefits. The Fund may also invest in government securities that are supported by the full faith and credit of the U.S. government, such as those issued by the Government National Mortgage Association (Ginnie Mae). Finally, The Fund may invest in a few government securities that have no explicit financial support, but which are regarded as having implied support because the federal government sponsors their activities.
Federated Capital Income Fund II may use derivative contracts and/or hybrid instruments to implement elements of its investment strategy as more fully described in its Prospectus.
12
Because Managed Portfolio and Federated Capital Income Fund II have similar investment objectives and policies, their principal risks generally will be similar. All mutual funds take investment risks. Therefore, it is possible to lose money by investing in either fund.
The following summarizes some of the more significant risk factors relating to both Funds. References to “Fund” are to both Managed Portfolio and Federated Capital Income Fund II.
| | • | | Stock Market Risk. The value of equity securities in the Funds’ portfolio will fluctuate and, as a result, the Funds’ share price may decline suddenly or over a sustained period of time. |
| | • | | Risk Related to Investing for Value. Each Fund generally uses a “value” style of investing, so that the Fund’s share price may lag that of other funds using a different investment style. |
| | • | | Credit Risk. It is possible that issuers of fixed-income securities in which a Fund invests will fail to pay interest or principal on these securities when due, which would result in the Fund losing money. |
| | • | | Liquidity Risk. Trading opportunities are more limited for fixed-income securities that have not received any credit ratings, have received ratings below investment grade or are not widely held. Trading opportunities are more limited for collateralized mortgage obligations that have complex terms or that are not widely held. These features may make it more difficult to sell or buy a security at a favorable price or time. Consequently, a Fund may have to accept a lower price to sell a security, sell other securities to raise cash or give up an investment opportunity, any of which could have a negative effect on the Fund’s performance. Infrequent trading of securities may also lead to an increase in their price volatility. |
| | • | | Interest Rate Risk. Prices of fixed-income securities generally fall when interest rates rise. Interest rate changes have a greater effect on the price of fixed-income securities with longer maturities. |
| | • | | Prepayment Risk. When homeowners prepay their mortgages in response to lower interest rates, a Fund will be required to reinvest the proceeds at the lower interest rates available. Also, when interest rates fall, the price of mortgage-backed securities may not rise to as great an extent as that of other fixed-income securities. |
| | • | | Risk of Foreign Investing. Because either Fund may invest in securities issued by foreign companies, the Fund’s share price may be more affected by foreign economic and political conditions, taxation policies and accounting and auditing standards than could otherwise be the case. |
Because Federated Capital Income Fund II may invest in non-investment-grade securities, American Depository Receipts (“ADRs”), foreign currency-denominated securities, emerging markets, derivatives contracts, exchange traded funds (“ETFs”) and hybrid instruments as a principal strategy, it is also subject to the following additional principal risks:
| | • | | Risk Associated with Non-Investment-Grade Securities. Securities rated below investment grade may be subject to greater interest rate, credit and liquidity risks than investment-grade securities. |
| | • | | Risk of Investing in ADRs and Domestically Traded Securities of Foreign Issuers. Because the Fund may invest in ADRs and other domestically traded securities of foreign companies, the Fund’s share price may be more affected by foreign economic and political conditions, taxation policies and accounting and auditing standards than would otherwise be the case. |
| | • | | Currency Risk. Exchange rates for currencies fluctuate daily. Accordingly, a Fund may experience increased volatility with respect to the value of its shares and its returns as a result of its exposure to foreign currencies through direct holding of such currencies or holding of non-U.S. dollar denominated securities. |
| | • | | Emerging Markets Risk. Securities issued or traded in emerging markets generally entail greater risks than securities issued or traded in developed markets. Emerging market countries may have relatively |
13
| | unstable governments and may present the risk of nationalization of businesses, expropriation, confiscatory taxation or, in certain instances, reversion to closed market, centrally planned economics. |
| | • | | Risk of Investing in Derivative Contracts and Hybrid Instruments. Please see important disclosure below. |
| | • | | ETF Risk. An investment in an ETF generally presents the same primary risks as an investment in a conventional fund (i.e., one that is not exchanged traded) that has the same investment objectives, strategies and policies. |
VALUE GROWTH PORTFOLIO AND BLUE CHIP PORTFOLIO — FEDERATED CAPITAL APPRECIATION FUND II
Value Growth Portfolio investment objective is to seek capital appreciation, Blue Chip Portfolio’s investment objective is to seek long-term growth of capital and income, and Federated Capital Appreciation Fund II’s investment objective is to seek capital appreciation.
Value Growth Portfolio invests primarily (i.e., at least 65% of total assets) in equity securities of any size companies that its investment adviser believes have a potential to earn a high return on capital and/or are undervalued by the market (i.e., “value stocks”). It also may invest in “special situation” companies. (Special situation companies are ones that, in its investment adviser’s opinion, have potential for significant future earnings growth but have not performed well in the recent past. These companies may include ones with management changes, corporate or asset restructuring or significantly undervalued assets.) The Portfolio may also invest in capital securities and up to 25% of its net assets in equity securities of foreign issuers as consistent with its investment objective.
Under normal circumstances, Blue Chip Portfolio pursues its objective by investing at least 80% of net assets, plus the amount of any borrowings for investment purposes, in equity securities of well-capitalized, established companies. The Portfolio focuses on common stocks of approximately 50 large, well-known companies that its investment adviser believes to collectively comprise a representative cross-section of major industries, commonly referred to as “blue chip” companies, which are generally identified by their substantial capitalization, established history of earnings and superior management structure. Blue chip companies typically fall in the top 20% of U.S. companies by market capitalization. With respect to 25% of its total assets, the Portfolio may, from time to time, hold more than 5% of its assets in one or more such companies.
Federated Capital Appreciation Fund II pursues its investment objective by investing primarily in common stock of domestic companies with large and medium market capitalizations that offer superior growth prospects or of companies whose stock is undervalued. The Fund may also invest in common stocks of foreign issuers (including ADRs), and may also invest in convertible securities and preferred stocks of these domestic and foreign companies. The Fund may use derivative contracts and/or hybrid instruments to implement elements of its investment strategy as more fully described in the Fund’s prospectus.
Because Value Growth Portfolio, Blue Chip Portfolio and Federated Capital Appreciation Fund II have similar investment objectives and policies, their principal risks will be similar. All mutual funds take investment risks. Therefore, it is possible to lose money by investing in either fund.
The following summarizes the one significant risk factor relating to all three Funds. References to “Fund” are to Value Growth Portfolio, Blue Chip Portfolio and Federated Capital Appreciation Fund II.
| | • | | Stock Market Risk. The value of equity securities in a Fund’s portfolio will fluctuate and, as a result, the Fund’s share price may decline suddenly or over a sustained period of time. |
14
Value Growth Portfolio and Federated Capital Appreciation Fund II are subject to the following additional risks:
| | • | | Risk of Foreign Investing. Because these Funds may invest in securities issued by foreign companies, the Fund’s share price may be more affected by foreign economic and political conditions, taxation policies and accounting and auditing standards than could otherwise be the case. |
Federated Capital Appreciation Fund II also is subject to the following risks:
| | • | | Currency Risk. Exchange rates for currencies fluctuate daily. The combination of currency risk and market risk tends to make securities traded in foreign markets more volatile than securities traded exclusively in the United States. |
| | • | | Liquidity Risk. The equity securities in which the Fund invests may be less readily marketable and may be subject to greater fluctuation in price than other securities. |
| | • | | Risk Related to Company Size. Because the smaller companies in which the Fund may invest may have unproven track records, a limited product or service base and limited access to capital, they may be more likely to fail than larger companies. |
| | • | | Sector Risk. Because the Fund may allocate relatively more assets to certain industry sectors than others, the Fund’s performance may be more susceptible to any developments which affect those sectors emphasized by the Fund. |
| | • | | Custodial Services and Related Investment Costs. Custodial services and other costs relating to investment in international securities markets generally are more expensive than in the United States. Such markets have settlement and clearance procedures that differ from those in the United States. The inability of the Fund to make intended securities purchases due to settlement problems could cause the Fund to miss attractive investment opportunities. |
| | • | | Risk of Investing in Derivative Contracts and Hybrid Instruments. Please see important disclosure below. |
Value Growth Portfolio is also subject to the following additional risk:
| | • | | Risk Related to Investing for Value. The Portfolio generally uses a “value” style of investing, so that its share price may lag that of other funds using a different investment style. |
ADDITIONAL INFORMATION REGARDING DERIVATIVES STRATEGIES
As described above, certain Federated Insurance Funds may use derivative contracts and/or hybrid instruments to increase or decrease the allocation of their portfolios to securities or types of securities in which each such Federated Insurance Fund may invest directly. These Federated Insurance Funds may also, for example, use derivative contracts to:
| | • | | obtain premiums from the sale of derivative contracts; |
| | • | | realize gains from trading a derivative contract; or |
| | • | | hedge against potential losses. |
Derivative contracts are financial instruments that require payments based upon changes in the values of designated securities, commodities, currencies, indices or other assets or instruments including other derivative contracts (each a “Reference Instrument” and collectively, “Reference Instruments”). The Federated Insurance Funds’ exposure to derivative contracts and hybrid instruments (either directly or through its investment in another investment
15
company) involves risks different from, or possibly greater than, the risks associated with investing directly in securities and other traditional investments. First, changes in the value of the derivative contracts and hybrid instruments in which a Federated Insurance Fund invests may not be correlated with changes in the value of the underlying Reference Instruments or, if they are correlated, may move in the opposite direction than originally anticipated. Second, while some strategies involving derivatives may reduce the risk of loss, they may also reduce potential gains or, in some cases, result in losses by offsetting favorable price movements in portfolio holdings. Third, there is a risk that derivative contracts and hybrid instruments may be erroneously priced or improperly valued and, as a result, the Fund may need to make increased cash payments to the counterparty. Fourth, exposure to derivative contracts and hybrid instruments may have tax consequences to the Fund and its shareholders. For example, derivative contracts and hybrid instruments may cause the Fund to realize increased ordinary income or short-term capital gains (which are treated as ordinary income for federal income tax purposes) and, as a result, may increase taxable distributions to shareholders. Such distributions are not expected to be taxable for federal income tax purposes for variable annuity or variable life insurance contractowners. In addition, under certain circumstances certain derivative contracts and hybrid instruments may cause the Fund to: (a) incur an excise tax on a portion of the income related to those contracts and instruments; and/or (b) reclassify, as a return of capital, some or all of the distributions previously made to shareholders during the fiscal year as dividend income. Fifth, a common provision in over-the-counter (“OTC”) derivative contracts permits the counterparty to terminate any such contract between it and the Fund, if the value of the Fund’s total net assets declines below a specified level over a given time period. Factors that may contribute to such a decline (which usually must be substantial) include significant shareholder redemptions and/or a marked decrease in the market value of the Fund’s investments. Any such termination of the Fund’s OTC derivative contracts may adversely affect the Fund (for example, by increasing losses and/or costs, and/or preventing the Fund from fully implementing its investment strategies). Sixth, the Fund may use a derivative contract to benefit from a decline in the value of a Reference Instrument. If the value of the Reference Instrument declines during the term of the contract, the Fund makes a profit on the difference (less any payments the Fund is required to pay under the terms of the contract). Any such strategy involves risk. There is no assurance that the Reference Instrument will decline in value during the term of the contract and make a profit for the Fund. The Reference Instrument may instead appreciate in value creating a loss for the Fund. Finally, derivative contracts and hybrid instruments may also involve other risks described in this Prospectus/Proxy Statement, such as stock market, interest rate, credit, currency, liquidity and leverage risks.
The EquiTrust Variable Portfolios do not invest in derivatives contracts.
COMPARISON OF INVESTMENT LIMITATIONS
Each Fund has fundamental investment limitations that cannot be changed without shareholder approval, and non-fundamental investment limitations which may be changed with Board approval but without shareholder approval. The summary below is qualified in its entirety by the description of the fundamental limitations of each Federated Insurance Fund and each EquiTrust Variable Portfolio is set forth in Annex B to this Prospectus/ Proxy Statement. The limitations for each Federated Insurance Fund and each corresponding EquiTrust Variable Portfolio are substantially similar; however, you may want to note the following differences.
MONEY MARKET PORTFOLIO – FEDERATED PRIME MONEY FUND II
With respect to 100% of its assets, Money Market Portfolio may not purchase securities of any issuer (other than U.S. Government securities or government agency securities) if, as a result, more than 5% of the value of its assets (taken at the time of investment) would be invested in securities of that issuer. On the other hand, Federated Prime Money Fund II may not make such purchases with respect to securities comprising 75% of the value of its total assets.
Money Market Portfolio is subject to the following limitations whereas Federated Prime Money Fund II is not.
Money Market Portfolio may not:
16
| | • | | Purchase securities of other investment companies, except (i) by purchase in the open market involving only customary brokers’ commissions and only if immediately thereafter not more than 5% of its total net assets would be invested in such securities, or (ii) as part of a merger, consolidation or acquisition of assets. |
| | • | | Purchase any securities on margin (except that it may obtain such short-term credit as may be necessary for the clearance of purchases and sales of portfolio securities) or make short sales unless, by virtue of its ownership of other securities, it has the right to obtain securities equivalent in kind and amount to the securities sold and, if the right is conditional, the sale is made upon the same condition. |
| | • | | Purchase or retain the securities of any issuer if any of the officers or trustees of the EquiTrust Variable Fund or any officers or directors of its investment adviser own individually more than 0.50% of the securities of such issuer and together own more than 5% of the securities of such issuer. |
| | • | | Borrow money except from banks for temporary or emergency purposes, and in no event in excess of 5% of its total assets, or pledge or mortgage more than 15% of its total assets (Federated Prime Money Fund II may borrow money, directly or indirectly, and issue senior securities to the maximum extent permitted under the 1940 Act). |
| | • | | Participate on a joint (or a joint and several) basis in any trading account in securities (but this does not include the “bunching” of orders for the sale or purchase of the Portfolio’s securities with the other EquiTrust Variable Portfolios or with other investment company and client accounts managed by its investment adviser or its affiliates to reduce brokerage commissions or otherwise to achieve best overall execution). |
| | • | | Alone, or together with any other EquiTrust Variable Portfolios, make investments for the purpose of exercising control over, or management of, any issuer. |
| | • | | Lend its portfolio securities in excess of 20% of its net assets or in a manner inconsistent with the guidelines set forth under “Investment Objectives, Policies and Techniques” in its SAI. |
| | • | | Invest in foreign securities. |
| | • | | Write, purchase or sell puts, calls or combinations thereof, other than writing covered call options. |
HIGH GRADE BOND PORTFOLIO – FEDERATED QUALITY BOND FUND II
High Grade Bond Portfolio may not borrow money, except from banks for temporary or emergency purposes, and in no event in excess of 5% of its total assets, pledge or mortgage more than 15% of its total assets, or issue senior securities, except as appropriate to evidence indebtedness.
Federated Quality Bond Fund II will not issue senior securities except that the Fund may borrow money and engage in reverse repurchase agreements in amounts up to one-third of the value of its total assets, including the amounts borrowed. The Fund will not borrow money or engage in reverse repurchase agreements for investment leverage, but rather as a temporary, extraordinary or emergency measure to facilitate management of the portfolio by enabling the Fund to meet redemption requests when the liquidation of portfolio securities is deemed to be inconvenient or disadvantageous. The Fund will not purchase any securities while borrowings in excess of 5% of the value of its total assets are outstanding.
High Grade Bond Portfolio may not lend its portfolio securities in excess of 20% of its net assets, whereas Federated Quality Bond Fund II may lend portfolio securities up to one-third of the value of its total assets.
High Grade Bond Portfolio is subject to the following limitations whereas Federated Quality Bond Fund II is not:
17
High Grade Bond Portfolio may not:
| | • | | Purchase securities of other investment companies, except (i) by purchase in the open market involving only customary brokers’ commissions and only if immediately thereafter not more than 5% of its total net assets would be invested in such securities, or (ii) as part of a merger, consolidation or acquisition of assets. |
| | • | | Purchase any securities on margin (except that it may obtain such short-term credit as may be necessary for the clearance of purchases and sales of portfolio securities) or make short sales unless, by virtue of its ownership of other securities, it has the right to obtain securities equivalent in kind and amount to the securities sold and, if the right is conditional, the sale is made upon the same condition. |
| | • | | Purchase or retain the securities of any issuer if any of the officers or trustees of the EquiTrust Variable Fund or any officers or directors of its investment adviser own individually more than 0.50% of the securities of such issuer and together own more than 5% of the securities of such issuer. |
| | • | | Participate on a joint (or a joint and several) basis in any trading account in securities (but this does not include the “bunching” of orders for the sale or purchase of the Portfolio’s securities with the other EquiTrust Variable Portfolios or with other investment company and client accounts managed by its investment adviser or its affiliates to reduce brokerage commissions or otherwise to achieve best overall execution). |
| | • | | Alone, or together with any other EquiTrust Variable Portfolios, make investments for the purpose of exercising control over, or management of, any issuer. |
| | • | | Invest more than 25% of its net assets in foreign debt securities traded on U.S. exchanges and payable in U.S. dollars. |
| | • | | Write, purchase of sell puts, calls or combinations thereof, other than writing covered call options. |
MANAGED PORTFOLIO – FEDERATED CAPITAL INCOME FUND II
Managed Portfolio may not purchase any security, if, immediately after such purchase, more than 25% of its total net assets would be invested in issuers in the same industry. Federated Capital Income Fund II will not make investments that will result in the concentration of its investments in the securities of issuers primarily engaged in the same industry, provided that it may concentrate its investments in the securities of issuers in the utilities industry.
Managed Portfolio may not issue senior securities, except as appropriate to evidence indebtedness and may not borrow money, except from banks for temporary or emergency purposes, and in no event in excess of 5% of its total assets, or pledge or mortgage more than 15% of its total assets. Federated Capital Income Fund II may borrow money, directly or indirectly and issue senior securities to the maximum extent permitted under the 1940 Act.
Managed Portfolio may not lend its portfolio securities in excess of 20% of its net assets or in a manner inconsistent with the guidelines set forth under “Investment Objectives, Policies and Techniques” in its SAI. Federated Capital Income Fund II may not make loans, except that it is not prevented from purchasing debt obligations, entering into repurchase agreements, lending its assets to broker/dealers or institutional investors and investing in loans, including assignments and participation interests.
Managed Portfolio is subject to the following limitations whereas Federated Capital Income Fund II is not:
18
Managed Portfolio may not:
| | • | | Purchase securities of other investment companies, except (i) by purchase in the open market involving only customary brokers’ commissions and only if immediately thereafter not more than 5% of its total net assets would be invested in such securities, or (ii) as part of a merger, consolidation or acquisition of assets. |
| | • | | Purchase any securities on margin (except that it may obtain such short-term credit as may be necessary for the clearance of purchases and sales of portfolio securities) or make short sales unless, by virtue of its ownership of other securities, it has the right to obtain securities equivalent in kind and amount to the securities sold and, if the right is conditional, the sale is made upon the same condition. |
| | • | | Purchase or retain the securities of any issuer if any of the officers or trustees of the EquiTrust Variable Fund or any officers or directors of its investment adviser own individually more than 0.50% of the securities of such issuer and together own more than 5% of the securities of such issuer. |
| | • | | Participate on a joint (or a joint and several) basis in any trading account in securities (but this does not include the “bunching” of orders for the sale or purchase of the Portfolio’s securities with the other EquiTrust Variable Portfolios or with other investment company and client accounts managed by its investment adviser or its affiliates to reduce brokerage commissions or otherwise to achieve best overall execution). |
| | • | | Alone, or together with any other EquiTrust Variable Portfolios, make investments for the purpose of exercising control over, or management of, any issuer. |
| | • | | Invest more than 25% of its net assets in foreign equity and debt securities traded on U.S. exchanges and payable in U.S. dollars. |
| | • | | Write, purchase of sell puts, calls or combinations thereof, other than writing covered call options. |
STRATEGIC YIELD PORTFOLIO – FEDERATED QUALITY BOND FUND II
Strategic Yield Portfolio may not borrow money, except from banks for temporary or emergency purposes, and in no event in excess of 5% of its total assets, pledge or mortgage more than 15% of its total assets, or issue senior securities, except as appropriate to evidence indebtedness.
Federated Quality Bond Fund II will not issue senior securities except that the Fund may borrow money and engage in reverse repurchase agreements in amounts up to one-third of the value of its total assets, including the amounts borrowed. The Fund will not borrow money or engage in reverse repurchase agreements for investment leverage, but rather as a temporary, extraordinary or emergency measure to facilitate management of the portfolio by enabling the Fund to meet redemption requests when the liquidation of portfolio securities is deemed to be inconvenient or disadvantageous. The Fund will not purchase any securities while borrowings in excess of 5% of the value of its total assets are outstanding.
Federated Quality Bond Fund II will not mortgage, pledge or hypothecate any assets except to secure permitted borrowings. In those cases, it may mortgage, pledge or hypothecate assets having a market value not exceeding the lesser of the dollar amounts borrowed or 15% of the value of total assets at the time of the borrowing. For purposes of this limitation, the following are not deemed to be pledges: margin deposits for the purchase and sale of futures contracts and related options, and segregation or collateral arrangements made in connection with options activities or the purchase of securities on a when-issued basis.
Strategic Yield Portfolio may not lend its portfolio securities in excess of 20% of its net assets, whereas Federated Quality Bond Fund II may lend portfolio securities up to one-third of the value of its total assets.
19
Strategic Yield Portfolio is subject to the following limitations whereas Federated Quality Bond Fund II is not.
Strategic Yield Portfolio may not:
| | • | | Purchase securities of other investment companies, except (i) by purchase in the open market involving only customary brokers’ commissions and only if immediately thereafter not more than 5% of its total net assets would be invested in such securities, or (ii) as part of a merger, consolidation or acquisition of assets. |
| | • | | Purchase or retain the securities of any issuer if any of the officers or trustees of the EquiTrust Variable Fund or any officers or directors of its investment adviser own individually more than 0.50% of the securities of such issuer and together own more than 5% of the securities of such issuer. |
| | • | | Participate on a joint (or a joint and several) basis in any trading account in securities (but this does not include the “bunching” of orders for the sale or purchase of the Portfolio’s securities with the other EquiTrust Variable Portfolios or with other investment company and client accounts managed by its investment adviser or its affiliates to reduce brokerage commissions or otherwise to achieve best overall execution). |
| | • | | Alone, or together with any other EquiTrust Variable Portfolios, make investments for the purpose of exercising control over, or management of, any issuer. |
| | • | | Invest more than 25% of its net assets in foreign debt securities traded on U.S. exchanges and payable in U.S. dollars. |
| | • | | Write, purchase of sell puts, calls or combinations thereof, other than writing covered call options. |
VALUE GROWTH PORTFOLIO AND BLUE CHIP PORTFOLIO – FEDERATED CAPITAL APPRECIATION FUND II
Neither Value Growth Portfolio nor Blue Chip Portfolio may purchase any security, if, immediately after such purchase, more than 25% of the Portfolio’s total net assets would be invested in issuers in the same industry. Federated Capital Appreciation Fund II will not make investments that will result in the concentration of its investments in the securities of issuers primarily engaged in the same industry.
Neither Value Growth Portfolio nor Blue Chip Portfolio may issue senior securities, except as appropriate to evidence indebtedness and may not borrow money, except from banks for temporary or emergency purposes, and in no event in excess of 5% of its total assets, or pledge or mortgage more than 15% of its total assets. Federated Capital Appreciation Fund II may borrow money, directly or indirectly and issue senior securities to the maximum extent permitted under the 1940 Act.
Value Growth Portfolio and Blue Chip Portfolio are subject to the following limitations, whereas Federated Capital Appreciation Fund II is not.
Neither Value Growth Portfolio nor Blue Chip Portfolio may:
| | • | | Purchase securities of other investment companies, except (i) by purchase in the open market involving only customary brokers’ commissions and only if immediately thereafter not more than 5% of its total net assets would be invested in such securities, or (ii) as part of a merger, consolidation or acquisition of assets. |
| | • | | Purchase any securities on margin (except that it may obtain such short-term credit as may be necessary for the clearance of purchases and sales of portfolio securities) or make short sales unless, by virtue of its ownership of other securities, it has the right to obtain securities equivalent |
20
| | in kind and amount to the securities sold and, if the right is conditional, the sale is made upon the same condition. |
| | • | | Purchase or retain the securities of any issuer if any of the officers or trustees of the EquiTrust Variable Fund or any officers or directors of its investment adviser own individually more than 0.50% of the securities of such issuer and together own more than 5% of the securities of such issuer. |
| | • | | Participate on a joint (or a joint and several) basis in any trading account in securities (but this does not include the “bunching” of orders for the sale or purchase of the Portfolio’s securities with the other EquiTrust Variable Portfolios or with other investment company and client accounts managed by its investment adviser or its affiliates to reduce brokerage commissions or otherwise to achieve best overall execution). |
| | • | | Alone, or together with any other EquiTrust Variable Portfolios, make investments for the purpose of exercising control over, or management of, any issuer. |
| | • | | Invest in foreign securities, except that Value Growth Portfolio may invest up to 25% of its net assets in foreign equity and debt securities traded on U.S. exchanges and payable in U.S. dollars. |
| | • | | Write, purchase of sell puts, calls or combinations thereof, other than writing covered call options. |
21
COMPARATIVE FEE TABLES
Like all mutual funds, the EquiTrust Variable Fund and Federated Insurance Funds incur certain expenses in their operations. These expenses include management fees, as well as the cost of maintaining accounts, administration, providing shareholder liaison and distribution services and other activities. Set forth in the tables below is information regarding the fees and expenses currently incurred by each class of each EquiTrust Variable Portfolio and each corresponding class of the corresponding Federated Insurance Fund, and pro forma fees for the corresponding class of Federated Insurance Fund after giving effect to the Reorganization. In accordance with the structure of the proposed Reorganizations, as described in the chart on the first page of this Prospectus/Proxy Statement, each table reflects the Reorganization of a single EquiTrust Variable Portfolio into a single Federated Insurance Fund.
MONEY MARKET PORTFOLIO – FEDERATED PRIME MONEY FUND II
Fees and Expenses
This table describes (1) the actual fees and expenses for the Initial Class and Service Class Shares of Money Market Portfolio for the fiscal year ended December 31, 2010; (2) the actual fees and expenses for Federated Prime Money Fund II for the fiscal year ended December 31, 2010; and (3) the pro forma fees and expenses of Federated Prime Money Fund II on a combined basis after giving effect to the Reorganization.
| | | | | | | | | | | | | | | | |
| Shareholder Fees | | Money
Market
Portfolio –
Initial Class | | | Money Market Portfolio –
Service Class | | | Federated
Prime Money
Fund II | | | Federated Prime
Money Fund II Pro Forma Combined | |
Fees Paid Directly From Your Investment | | | | | | | | | | | | | | | | |
| | | | |
| Maximum Sales Charge (Load) Imposed on Purchases (as a percentage of offering price) | | | None | | | | None | | | | None | | | | None | |
| Maximum Deferred Sales Charge (Load) (as a percentage of original purchase price or redemption proceeds, as applicable) | | | None | | | | None | | | | None | | | | None | |
| Maximum Sales Charge (Load) Imposed on Reinvested Dividends (and other Distributions) (as a percentage of offering price) | | | None | | | | None | | | | None | | | | None | |
| Redemption Fee (as a percentage of amount redeemed, if applicable) | | | None | | | | None | | | | None | | | | None | |
| Exchange Fee | | | None | | | | None | | | | None | | | | None | |
| | | | |
| Annual Fund Operating Expenses | | | | | | | | | | | | | | | | |
| Expenses That are Deducted From Fund Assets (as a percentage of average net assets) | | | | | | | | | | | | | | | | |
| Management Fee | | | 0.25% | | | | 0.25% | | | | 0.50% | | | | 0.50% | |
| Distribution (12b-1) Fee | | | None | | | | 0.25% | | | | None | | | | None | |
| Other Expenses | | | 0.23% | | | | 0.23% | | | | 0.40% | | | | 0.16% | |
| Total Annual Fund Operating Expenses | | | 0.48% | | | | 0.73% | | | | 0.90% | | | | 0.66% | |
| Fee Waivers and/or Expense Reimbursements | | | None | | | | None | �� | | | 0.23%(1) | | | | 0.00%(1) | |
| Total Annual Fund Operating Expenses After Fee Waivers and/or Expense Reimbursements | | | 0.48% | | | | 0.73% | | | | 0.67% | | | | 0.66% | |
| 1 | Federated Prime Money Fund II’s adviser and its affiliates have voluntarily agreed to waive their fees and or reimburse expenses so that the total annual fund operating expenses (included Acquired Fund Fees and Expenses, if any) paid by the Fund’s Shares (after the voluntary waivers and/or reimbursements) will not exceed 0.67% (the “Fee Limit”), up to but not including the later of (the “Termination Date”): (a) May 1, 2012, or (b) the date of the Fund’s next effective prospectus. While the Fund’s adviser and its affiliates currently do not anticipate terminating or increasing these arrangements prior to the Termination Date, these arrangements may only be terminated or the Fee Limit increased prior to the Termination Date with the agreement of the Fund’s Board. If this Reorganization is approved, the Termination Date will be extended to the later of: (a) May 31, 2012; or (b) the date of the Fund’s next effective Prospectus. |
Example
This example is intended to help you compare the cost of investing in the indicated funds with the cost of investing in other mutual funds.
The Example assumes that you invest $10,000 in the funds’ shares for the time periods indicated and then redeem all of your shares at the end of those periods. The Example also assumes that your investment has a 5% return
22
each year and that each fund’s shares operating expenses are as shown in the table above and remain the same. Although your actual costs and returns may be higher or lower, based on these assumptions your costs would be:
| | | | | | | | |
| | | 1 Year | | 3 Years | | 5 Years | | 10 Years |
Money Market Portfolio, Initial Class Shares | | $49 | | $154 | | $269 | | $604 |
Money Market Portfolio, Service Class Shares | | $75 | | $233 | | $406 | | $906 |
Federated Prime Money Fund II | | $92 | | $287 | | $498 | | $1,108 |
Federated Prime Money Fund II, Pro Forma Combined | | $67 | | $211 | | $368 | | $822 |
HIGH GRADE BOND PORTFOLIO – FEDERATED QUALITY BOND FUND II
Fees and Expenses
This table describes (1) the actual fees and expenses for the Initial Class and Service Class Shares of High Grade Bond Portfolio for the fiscal year ended December 31, 2010; (2) the actual fees and expenses for the Primary Shares of Federated Quality Bond Fund II for the fiscal year ended December 31, 2010; and (3) the pro forma fees and expenses of Primary Shares of Federated Quality Bond Fund II on a combined basis after giving effect to the Reorganization.
| | | | | | | | | | | | | | | | |
| Shareholder Fees | | High Grade Bond Portfolio –
Initial Class | | | High Grade Bond Portfolio – Service Class | | | Federated Quality Bond Fund II – Primary Shares | | | Federated Quality Bond Fund II - Primary Shares Pro Forma Combined | |
Fees Paid Directly From Your Investment | | | | | | | | | | | | | | | | |
| | | | |
| Maximum Sales Charge (Load) Imposed on Purchases (as a percentage of offering price) | | | None | | | | None | | | | None | | | | None | |
| Maximum Deferred Sales Charge (Load) (as a percentage of original purchase price or redemption proceeds, as applicable) | | | None | | | | None | | | | None | | | | None | |
| Maximum Sales Charge (Load) Imposed on Reinvested Dividends (and other Distributions) (as a percentage of offering price) | | | None | | | | None | | | | None | | | | None | |
| | | | |
| Redemption Fee (as a percentage of amount redeemed, if applicable) | | | None | | | | None | | | | None | | | | None | |
| | | | |
| Exchange Fee | | | None | | | | None | | | | None | | | | None | |
| | | | |
| Annual Fund Operating Expenses | | | | | | | | | | | | | | | | |
| Expenses That are Deducted From Fund Assets (as a percentage of average net assets) | | | | | | | | | | | | | | | | |
| Management Fee | | | 0.30% | | | | 0.30% | | | | 0.60% | | | | 0.60% | |
| Distribution (12b-1) Fee | | | None | | | | 0.25% | | | | 0.25% | | | | 0.25% | |
| Other Expenses | | | 0.15% | | | | 0.15% | | | | 0.40% | | | | 0.15% | |
| | | | |
| Total Annual Fund Operating Expenses | | | 0.45% | | | | 0.70% | | | | 1.25% | | | | 1.00% | |
| Fee Waivers and/or Expense Reimbursements | | | None | | | | None | | | | 0.50%(1) | | | | 0.25(1) | |
| Total Annual Fund Operating Expenses After Fee Waivers and/or Expense Reimbursements | | | 0.45% | | | | 0.70% | | | | 0.75% | | | | 0.75% | |
| 1 | Federated Quality Bond Fund II’s adviser and its affiliates have voluntarily agreed to waive their fees and or reimburse expenses so that the total annual fund operating expenses (included Acquired Fund Fees and Expenses, if any) paid by the Fund’s Primary Shares (after the voluntary waivers and/or reimbursements) will not exceed 0.75% (the “Fee Limit”), up to but not including the later of (the “Termination Date”): (a) May 1, 2012, or (b) the date of the Fund’s next effective prospectus. While the Fund’s adviser and its affiliates currently do not anticipate terminating or increasing these arrangements prior to the Termination Date, these arrangements may only be terminated or the Fee Limit increased prior to the Termination Date with the agreement of the Fund’s Board. If this Reorganization is approved, the Termination Date will be extended to the later of: (a) May 31, 2012; or (b) the date of the Fund’s next effective Prospectus. |
Example
This example is intended to help you compare the cost of investing in the indicated funds with the cost of investing in other mutual funds.
23
The Example assumes that you invest $10,000 in the funds’ shares for the time periods indicated and then redeem all of your shares at the end of those periods. The Example also assumes that your investment has a 5% return each year and that the each fund’s shares operating expenses are as shown in the table above and remain the same. Although your actual costs and returns may be higher or lower, based on these assumptions your costs would be:
| | | | | | | | |
| | | 1 Year | | 3 Years | | 5 Years | | 10 Years |
High Grade Bond Portfolio, Initial Class Shares | | $46 | | $144 | | $252 | | $567 |
High Grade Bond Portfolio , Service Class Shares | | $72 | | $224 | | $390 | | $871 |
Federated Quality Bond Fund II – Primary Shares | | $127 | | $397 | | $686 | | $1,511 |
Federated Quality Bond Fund II – Primary Shares, Pro Forma Combined | | $102 | | $318 | | $552 | | $1,225 |
STRATEGIC YIELD PORTFOLIO – FEDERATED QUALITY BOND FUND II
Fees and Expenses
This table describes (1) the actual fees and expenses for the Initial Class and Service Class Shares of Strategic Yield Portfolio for the fiscal year ended December 31, 2010; (2) the actual fees and expenses for the Primary Shares of Federated Quality Bond Fund II for the fiscal year ended December 31, 2010; and (3) the pro forma fees and expenses of Primary Shares of Federated Quality Bond Fund II on a combined basis after giving effect to the Reorganization.
| | | | | | | | | | | | | | | | |
| Shareholder Fees | | Strategic Yield Portfolio – Initial Class | | | Strategic Yield Portfolio – Service Class | | | Federated Quality Bond Fund II – Primary Shares | | | Federated Quality Bond Fund II -Primary Shares Pro Forma Combined | |
| Fees Paid Directly From Your Investment | | | | | | | | | | | | | | | | |
| | | | |
| Maximum Sales Charge (Load) Imposed on Purchases (as a percentage of offering price) | | | None | | | | None | | | | None | | | | None | |
| Maximum Deferred Sales Charge (Load) (as a percentage of original purchase price or redemption proceeds, as applicable) | | | None | | | | None | | | | None | | | | | |
| Maximum Sales Charge (Load) Imposed on Reinvested Dividends (and other Distributions) (as a percentage of offering price) | | | None | | | | None | | | | None | | | | None | |
| Redemption Fee (as a percentage of amount redeemed, if applicable) | | | None | | | | None | | | | None | | | | None | |
| Exchange Fee | | | None | | | | None | | | | None | | | | None | |
| | | | |
| Annual Fund Operating Expenses | | | | | | | | | | | | | | | | |
| Expenses That are Deducted From Fund Assets (as a percentage of average net assets) | | | | | | | | | | | | | | | | |
| Management Fee | | | 0.45% | | | | 0.45% | | | | 0.60% | | | | 0.60% | |
| Distribution (12b-1) Fee | | | None | | | | 0.25% | | | | 0.25% | | | | 0.25% | |
| Other Expenses | | | 0.16% | | | | 0.16% | | | | 0.40% | | | | 0.17% | |
| | | | |
| Total Annual Fund Operating Expenses | | | 0.61% | | | | 0.86% | | | | 1.25% | | | | 1.02% | |
| Fee Waivers and/or Expense Reimbursements | | | None | | | | None | | | | 0.50%(1) | | | | 0.27%(1) | |
| Total Annual Fund Operating Expenses After Fee Waivers and/or Expense Reimbursements | | | 0.61% | | | | 0.86% | | | | 0.75% | | | | 0.75% | |
1 Federated Quality Bond Fund II’s adviser and its affiliates have voluntarily agreed to waive their fees and or reimburse expenses so that the total annual fund operating expenses (included Acquired Fund Fees and Expenses, if any) paid by the Fund’s Primary Shares (after the voluntary waivers and/or reimbursements) will not exceed 0.75% (the “Fee Limit”), up to but not including the later of (the “Termination Date”): (a) May 1, 2012, or (b) the date of the Fund’s next effective prospectus. While the Fund’s adviser and its affiliates currently do not anticipate terminating or increasing these arrangements prior to the Termination Date, these arrangements may only be terminated or the Fee Limit increased prior to the Termination Date with the agreement of the Fund’s Board. If this Reorganization is approved, the Termination Date will be extended to the later of: (a) May 31, 2012; or (b) the date of the Fund’s next effective Prospectus.
24
Example
This example is intended to help you compare the cost of investing in the indicated funds with the cost of investing in other mutual funds.
The Example assumes that you invest $10,000 in the funds’ shares for the time periods indicated and then redeem all of your shares at the end of those periods. The Example also assumes that your investment has a 5% return each year and that the each fund’s shares operating expenses are as shown in the table above and remain the same. Although your actual costs and returns may be higher or lower, based on these assumptions your costs would be:
| | | | | | | | |
| | | 1 Year | | 3 Years | | 5 Years | | 10 Years |
Strategic Yield Portfolio, Initial Class Shares | | $62 | | $195 | | $340 | | $762 |
Strategic Yield Portfolio, Service Class Shares | | $88 | | $274 | | $477 | | $1,061 |
Federated Quality Bond Fund II – Primary Shares | | $127 | | $397 | | $686 | | $1,511 |
Federated Quality Bond Fund II – Primary Shares, Pro Forma Combined | | $104 | | $325 | | $563 | | $1,248 |
HIGH GRADE BOND PORTFOLIO — STRATEGIC YIELD PORTFOLIO — FEDERATED QUALITY BOND FUND II
Fees and Expenses
This table describes (1) the actual fees and expenses for the Initial Class and Service Class Shares of High Grade Bond Portfolio for the fiscal year ended December 31, 2010; (2) the actual fees and expenses for the Initial Class and Service Class Shares of Strategic Yield Portfolio for the fiscal year ended December 31, 2010; (3) the actual fees and expenses for the Primary Shares of Federated Quality Bond Fund II for the fiscal year ended December 31, 2010; and (4) the pro forma fees and expenses of Primary Shares of Federated Quality Bond Fund II on a combined basis after giving effect to the Reorganizations of both High Grade Portfolio and Strategic Yield Portfolio.
| | | | | | | | | | | | |
| Shareholder Fees | | High Grade Bond Portfolio – Initial Class | | High Grade Bond Portfolio – Service Class | | Strategic Yield Portfolio – Initial Class | | Strategic Yield Portfolio – Service Class | | Federated Quality Bond Fund II – Primary Shares | | Federated Quality Bond Fund II - Primary Shares Pro Forma Combined |
| Fees Paid Directly From Your Investment | | | | | | | | | | | | |
| | |
| Maximum Sales Charge (Load) Imposed on Purchases (as a percentage of offering price) | | None | | None | | None | | None | | None | | None |
| Maximum Deferred Sales Charge (Load) (as a percentage of original purchase price or redemption proceeds, as applicable) | | None | | None | | None | | None | | None | | None |
| Maximum Sales Charge (Load) Imposed on Reinvested Dividends (and other Distributions) (as a percentage of offering price) | | None | | None | | None | | None | | None | | None |
| Redemption Fee (as a percentage of amount redeemed, if applicable) | | None | | None | | None | | None | | None | | None |
| Exchange Fee | | None | | None | | None | | None | | None | | None |
| | | | | | |
| Annual Fund Operating Expenses | | | | | | | | | | | | |
| Expenses That are Deducted From Fund Assets (as a percentage of average net assets) | | | | | | | | | | | | |
| Management Fee | | 0.30% | | 0.30% | | 0.45% | | 0.45% | | 0.60% | | 0.60% |
| Distribution (12b-1) Fee | | None | | 0.25% | | None | | 0.25% | | 0.25% | | 0.25% |
| Other Expenses | | 0.15% | | 0.15% | | 0.16% | | 0.16% | | 0.40% | | 0.15% |
| | | | | | |
| Total Annual Fund Operating Expenses | | 0.45% | | 0.70% | | 0.61% | | 0.86% | | 1.25% | | 1.01% |
| Fee Waivers and/or Expense Reimbursements | | None | | None | | None | | None | | 0.50%(1) | | 0.26%(1) |
| Total Annual Fund Operating Expenses After Fee Waivers and/or Expense Reimbursements | | 0.45% | | 0.70% | | 0.61% | | 0.86% | | 0.75% | | 0.75% |
| 1 | Federated Quality Bond Fund II’s adviser and its affiliates have voluntarily agreed to waive their fees and or reimburse expenses so that the total annual fund operating expenses (included Acquired Fund Fees and Expenses, if any) paid by the Fund’s Primary Shares (after the voluntary waivers and/or reimbursements) will not exceed 0.75% (the “Fee Limit”), up to but not including the later of (the “Termination |
25
| | Date”): (a) May 1, 2012, or (b) the date of the Fund’s next effective prospectus. While the Fund’s adviser and its affiliates currently do not anticipate terminating or increasing these arrangements prior to the Termination Date, these arrangements may only be terminated or the Fee Limit increased prior to the Termination Date with the agreement of the Fund’s Board. If this Reorganization is approved, the Termination Date will be extended to the later of: (a) May 31, 2012; or (b) the date of the Fund’s next effective Prospectus. |
Example
This example is intended to help you compare the cost of investing in the indicated funds with the cost of investing in other mutual funds.
The Example assumes that you invest $10,000 in the funds’ shares for the time periods indicated and then redeem all of your shares at the end of those periods. The Example also assumes that your investment has a 5% return each year and that the each fund’s shares operating expenses (including those of Federated Quality Bond Fund II’s Primary Shares, assuming the Reorganization of both High Grade Bond Portfolio and Strategic Yield Portfolio) are as shown in the table above and remain the same. Although your actual costs and returns may be higher or lower, based on these assumptions your costs would be:
| | | | | | | | |
| | | 1 Year | | 3 Years | | 5 Years | | 10 Years |
High Grade Bond Portfolio, Initial Class Shares | | $46 | | $144 | | $252 | | $567 |
High Grade Bond Portfolio , Service Class Shares | | $72 | | $224 | | $390 | | $871 |
Strategic Yield Portfolio, Initial Class Shares | | $62 | | $195 | | $340 | | $762 |
Strategic Yield Portfolio, Service Class Shares | | $88 | | $274 | | $477 | | $1,061 |
Federated Quality Bond Fund II – Primary Shares | | $127 | | $397 | | $686 | | $1,511 |
Federated Quality Bond Fund II – Primary Shares, Pro Forma Combined | | $103 | | $322 | | $558 | | $1,236 |
MANAGED PORTFOLIO – FEDERATED CAPITAL INCOME FUND II
Fees and Expenses
This table describes (1) the actual fees and expenses for the Initial Class and Service Class Shares of Managed Portfolio for the fiscal year ended December 31, 2010; (2) the actual fees and expenses for Federated Capital Income Fund II for the fiscal year ended December 31, 2010; and (3) the pro forma fees and expenses of Federated Capital Income Fund II on a combined basis after giving effect to the Reorganization.
| | | | | | | | | | | | | | | | |
| Shareholder Fees | | Manged Portfolio – Initial Class | | | Managed
Portfolio – Service Class | | | Federated Capital Income Fund II | | | Federated Capital Income Fund II Pro Forma Combined | |
| Fees Paid Directly From Your Investment | | | | | | | | | | | | | | | | |
| | | | |
| Maximum Sales Charge (Load) Imposed on Purchases (as a percentage of offering price) | | | None | | | | None | | | | None | | | | None | |
| Maximum Deferred Sales Charge (Load) (as a percentage of original purchase price or redemption proceeds, as applicable) | | | None | | | | None | | | | None | | | | | |
| Maximum Sales Charge (Load) Imposed on Reinvested Dividends (and other Distributions) (as a percentage of offering price) | | | None | | | | None | | | | None | | | | None | |
| Redemption Fee (as a percentage of amount redeemed, if applicable) | | | None | | | | None | | | | None | | | | None | |
| Exchange Fee | | | None | | | | None | | | | None | | | | None | |
| | | | |
| Annual Fund Operating Expenses | | | | | | | | | | | | | | | | |
| Expenses That are Deducted From Fund Assets (as a percentage of average net assets) | | | | | | | | | | | | | | | | |
| Management Fee | | | 0.45% | | | | 0.45% | | | | 0.75% | | | | 0.75% | |
| Distribution (12b-1) Fee | | | None | | | | 0.25% | | | | None | | | | None | |
| Other Expenses | | | 0.14% | | | | 0.14% | | | | 0.94% | | | | 0.30% | |
| Acquired Fund Fees and Expenses | | | None | | | | None | | | | 0.21% | | | | 0.21% | |
| Total Annual Fund Operating Expenses | | | 0.59% | | | | 0.84% | | | | 1.90% | | | | 1.26% | |
| Fee Waivers and/or Expense Reimbursements | | | None | | | | None | | | | 0.56%(1) | | | | 0.00%(1) | |
| Total Annual Fund Operating Expenses After Fee Waivers and/or Expense Reimbursements1 | | | 0.59% | | | | 0.84% | | | | 1.34% | | | | 1.26% | |
| | 1 | Federated Capital Income Fund II’s adviser and its affiliates have voluntarily agreed to waive their fees and or reimburse expenses so that the total annual fund operating expenses (included Acquired Fund Fees and Expenses, if any) paid by the Fund’s shares (after the voluntary waivers and/or reimbursements) will not exceed 1.13% (the “Fee Limit”) up to but not including the later of (the “Termination Date”): |
26
| | (a) May 1, 2012, or (b) the date of the Fund’s next effective prospectus. While the Fund’s adviser and its affiliates currently do not anticipate terminating or increasing these arrangements prior to the Termination Date, these arrangements may only be terminated or the Fee Limit increased prior to the Termination Date with the agreement of the Fund’s Board. If this Reorganization is approved, the Termination Date will be extended to the later of: (a) May 31, 2012; or (b) the date of the Fund’s next effective Prospectus. |
Example
This example is intended to help you compare the cost of investing in the indicated funds with the cost of investing in other mutual funds.
The Example assumes that you invest $10,000 in the funds’ shares for the time periods indicated and then redeem all of your shares at the end of those periods. The Example also assumes that your investment has a 5% return each year and that the each fund’s shares operating expenses are as shown in the table above and remain the same. Although your actual costs and returns may be higher or lower, based on these assumptions your costs would be:
| | | | | | | | |
| | | 1 Year | | 3 Years | | 5 Years | | 10 Years |
Managed Portfolio, Initial Class Shares | | $60 | | $189 | | $329 | | $738 |
Managed Portfolio, Service Class Shares | | $86 | | $268 | | $466 | | $1,037 |
Federated Capital Income Fund II | | $193 | | $597 | | $1,026 | | $2,222 |
Federated Capital Income Fund II, Pro Forma Combined | | $128 | | $400 | | $692 | | $1,523 |
VALUE GROWTH PORTFOLIO – FEDERATED CAPITAL APPRECIATION FUND II
Fees and Expenses
This table describes (1) the actual fees and expenses for the Initial Class and Service Class Shares of Value Growth Portfolio for the fiscal year ended December 31, 2010; (2) the actual fees and expenses of the Primary Shares of Federated Capital Appreciation Fund II for the fiscal year ended December 31, 2010; and (3) the pro forma fees and expenses of the Primary Shares of Federated Capital Appreciation Fund II on a combined basis after giving effect to the Reorganization.
| | | | | | | | | | | | | | | | |
| Shareholder Fees | | Value Growth
Portfolio – Initial Class | | | Value Growth Portfolio – Service Class | | | Federated Capital Appreciation Fund II – Primary Shares | | | Federated Capital Appreciation Fund II - Primary Shares Pro Forma Combined | |
| Fees Paid Directly From Your Investment | | | | | | | | | | | | | | | | |
| | | | |
| Maximum Sales Charge (Load) Imposed on Purchases (as a percentage of offering price) | | | None | | | | None | | | | None | | | | None | |
| Maximum Deferred Sales Charge (Load) (as a percentage of original purchase price or redemption proceeds, as applicable) | | | None | | | | None | | | | None | | | | | |
| Maximum Sales Charge (Load) Imposed on Reinvested Dividends (and other Distributions) (as a percentage of offering price) | | | None | | | | None | | | | None | | | | None | |
| Redemption Fee (as a percentage of amount redeemed, if applicable) | | | None | | | | None | | | | None | | | | None | |
| Exchange Fee | | | None | | | | None | | | | None | | | | None | |
| | | | |
| Annual Fund Operating Expenses 4 | | | | | | | | | | | | | | | | |
| Expenses That are Deducted From Fund Assets (as a percentage of average net assets) | | | | | | | | | | | | | | | | |
| Management Fee | | | 0.45% | | | | 0.45% | | | | 0.85% | | | | 0.85% | |
| Distribution (12b-1) Fee | | | None | | | | 0.25% | | | | 0.25% | | | | 0.25% | |
| Other Expenses | | | 0.15% | | | | 0.16% | | | | 0.74% | | | | 0.29% | |
| | | | |
| Total Annual Fund Operating Expenses | | | 0.60% | | | | 0.86% | | | | 1.84% | | | | 1.39% | |
| Fee Waivers and/or Expense Reimbursements | | | None | | | | None | | | | 0.66%(1) | | | | 0.21%(1) | |
| Total Annual Fund Operating Expenses After Fee Waivers and/or Expense Reimbursements | | | 0.60% | | | | 0.86% | | | | 1.18% | | | | 1.18% | |
1 Federated Capital Appreciation Fund II’s adviser and its affiliates have voluntarily agreed to waive their fees and or reimburse expenses so that the total annual fund operating expenses (included Acquired Fund Fees and Expenses, if any) paid by the Fund’s Primary Shares (after the
27
| | voluntary waivers and/or reimbursements) will not exceed 1.18% (the “Fee Limit”), up to but not including the later of (the “Termination Date”): (a) May 1, 2012, or (b) the date of the Fund’s next effective prospectus. While the Fund’s adviser and its affiliates currently do not anticipate terminating or increasing these arrangements prior to the Termination Date, these arrangements may only be terminated or the Fee Limit increased prior to the Termination Date with the agreement of the Fund’s Board. If this Reorganization is approved, the Termination Date will be extended to the later of: (a) May 31, 2012; or (b) the date of the Fund’s next effective Prospectus. |
Example
This example is intended to help you compare the cost of investing in the indicated Funds with the cost of investing in other mutual funds.
The Example assumes that you invest $10,000 in the funds’ shares for the time periods indicated and then redeem all of your shares at the end of those periods. The Example also assumes that your investment has a 5% return each year and that the each fund’s shares operating expenses are as shown in the table above and remain the same. Although your actual costs and returns may be higher or lower, based on these assumptions your costs would be:
| | | | | | | | |
| | | 1 Year | | 3 Years | | 5 Years | | 10 Years |
Value Growth Portfolio, Initial Class Shares | | $61 | | $192 | | $335 | | $750 |
Value Growth Portfolio, Service Class Shares | | $88 | | $274 | | $477 | | $1,061 |
Federated Capital Appreciation Fund II, Primary Shares | | $187 | | $579 | | $996 | | $2,159 |
Federated Capital Appreciation Fund II, Primary Shares, Pro Forma Combined | | $142 | | $440 | | $761 | | $1,669 |
BLUE CHIP PORTFOLIO – FEDERATED CAPITAL APPRECIATION FUND II
Fees and Expenses
This table describes (1) the actual fees and expenses for the Initial Class and Service Class Shares of Blue Chip Portfolio for the fiscal year ended December 31, 2010; (2) the actual fees and expenses of the Primary Shares of Federated Capital Appreciation Fund II for the fiscal year ended December 31, 2010; and (3) the pro forma fees and expenses of the Primary Shares of Federated Capital Appreciation Fund II on a combined basis after giving effect to the Reorganization.
| | | | | | | | | | | | | | | | |
| Shareholder Fees | | Blue Chip Portfolio – Initial Class | | | Blue Chip Portfolio – Service Class | | | Federated Capital Appreciation Fund II – Primary Shares | | | Federated Capital Appreciation Fund II – Primary Shares Pro Forma Combined | |
| Fees Paid Directly From Your Investment | | | | | | | | | | | | | | | | |
| | | | |
| Maximum Sales Charge (Load) Imposed on Purchases (as a percentage of offering price) | | | None | | | | None | | | | None | | | | None | |
| Maximum Deferred Sales Charge (Load) (as a percentage of original purchase price or redemption proceeds, as applicable) | | | None | | | | None | | | | None | | | | | |
| Maximum Sales Charge (Load) Imposed on Reinvested Dividends (and other Distributions) (as a percentage of offering price) | | | None | | | | None | | | | None | | | | None | |
| Redemption Fee (as a percentage of amount redeemed, if applicable) | | | None | | | | None | | | | None | | | | None | |
| Exchange Fee | | | None | | | | None | | | | None | | | | None | |
| | | | |
| Annual Fund Operating Expenses | | | | | | | | | | | | | | | | |
| Expenses That are Deducted From Fund Assets (as a percentage of average net assets) | | | | | | | | | | | | | | | | |
| Management Fee | | | 0.20% | | | | 0.20% | | | | 0.85% | | | | 0.85% | |
| Distribution (12b-1) Fee | | | None | | | | 0.25% | | | | 0.25% | | | | 0.25% | |
| Other Expenses | | | 0.14% | | | | 0.14% | | | | 0.74% | | | | 0.26% | |
| | | | |
| Total Annual Fund Operating Expenses | | | 0.34% | | | | 0.59% | | | | 1.84% | | | | 1.36% | |
| Fee Waivers and/or Expense Reimbursements | | | None | | | | None | | | | 0.66%(1) | | | | 0.18%(1) | |
| Total Annual Fund Operating Expenses After Fee Waivers and/or Expense Reimbursements | | | 0.34% | | | | 0.59% | | | | 1.18% | | | | 1.18% | |
28
1 Federated Capital Appreciation Fund II’s adviser and its affiliates have voluntarily agreed to waive their fees and or reimburse expenses so that the total annual fund operating expenses (included Acquired Fund Fees and Expenses, if any) paid by the Fund’s Primary Shares (after the voluntary waivers and/or reimbursements) will not exceed 1.18% (the “Fee Limit”), up to but not including the later of (the “Termination Date”): (a) May 1, 2012, or (b) the date of Fund’s next effective prospectus. While the Fund’s adviser and its affiliates currently do not anticipate terminating or increasing these arrangements prior to the Termination Date, these arrangements may only be terminated or the Fee Limit increased prior to the Termination Date with the agreement of the Fund’s Board. If this Reorganization is approved, the Termination Date will be extended to the later of: (a) May 31, 2012; or (b) the date of the Fund’s next effective Prospectus.
Example
This example is intended to help you compare the cost of investing in the indicated funds with the cost of investing in other mutual funds.
The Example assumes that you invest $10,000 in the funds’ shares for the time periods indicated and then redeem all of your shares at the end of those periods. The Example also assumes that your investment has a 5% return each year and that the each fund’s shares operating expenses are as shown in the table above and remain the same. Although your actual costs and returns may be higher or lower, based on these assumptions your costs would be:
| | | | | | | | |
| | | 1 Year | | 3 Years | | 5 Years | | 10 Years |
Blue Chip Portfolio, Initial Class Shares | | $35 | | $109 | | $191 | | $431 |
Blue Chip Portfolio, Service Class Shares | | $60 | | $189 | | $329 | | $738 |
Federated Capital Appreciation Fund II, Primary Shares | | $187 | | $579 | | $996 | | $2,159 |
Federated Capital Appreciation Fund II, Primary Shares, Pro Forma Combined | | $138 | | $431 | | $745 | | $1,635 |
VALUE GROWTH PORTFOLIO – BLUE CHIP PORTFOLIO — FEDERATED CAPITAL APPRECIATION FUND II
Fees and Expenses
This table describes (1) the actual fees and expenses for the Initial Class and Service Class Shares of Value Growth Portfolio for the fiscal year ended December 31, 2010; (2) the actual fees and expenses for the Initial Class and Service Class Shares of Blue Chip Portfolio for the fiscal year ended December 31, 2010; (3) the actual fees and expenses of the Primary Shares of Federated Capital Appreciation Fund II for the fiscal year ended December 31, 2010; and (4) the pro forma fees and expenses of the Primary Shares of Federated Capital Appreciation Fund II on a combined basis after giving effect to the Reorganizations of both Value Growth Portfolio and Blue Chip Portfolio.
| | | | | | | | | | | | | | | | | | | | | | | | |
| Shareholder Fees | | Value Growth Portfolio – Initial Class | | | Value Growth Portfolio – Service Class | | | Blue Chip Portfolio – Initial Class | | | Blue Chip Portfolio – Service Class | | | Federated Capital
Appreciation
Fund II –
Primary
Shares | | | Federated
Capital Appreciation Fund II - Primary Shares Pro Forma Combined | |
| Fees Paid Directly From Your Investment | | | | | | | | | | | | | | | | | | | | | | | | |
| | | | |
| Maximum Sales Charge (Load) Imposed on Purchases (as a percentage of offering price) | | | None | | | | None | | | | None | | | | None | | | | None | | | | None | |
| Maximum Deferred Sales Charge (Load) (as a percentage of original purchase price or redemption proceeds, as applicable) | | | None | | | | None | | | | None | | | | None | | | | None | | | | | |
| Maximum Sales Charge (Load) Imposed on Reinvested Dividends (and other Distributions) (as a percentage of offering price) | | | None | | | | None | | | | None | | | | None | | | | None | | | | None | |
| Redemption Fee (as a percentage of amount redeemed, if applicable) | | | None | | | | None | | | | None | | | | None | | | | None | | | | None | |
| Exchange Fee | | | None | | | | None | | | | None | | | | None | | | | None | | | | None | |
| | | | | | |
| Annual Fund Operating Expenses 4 | | | | | | | | | | | | | | | | | | | | | | | | |
| Expenses That are Deducted From Fund Assets (as a percentage of average net assets) | | | | | | | | | | | | | | | | | | | | | | | | |
| Management Fee | | | 0.45% | | | | 0.45% | | | | 0.20% | | | | 0.20% | | | | 0.85% | | | | 0.85% | |
29
| | | | | | | | | | | | |
| Shareholder Fees | | Value Growth Portfolio – Initial Class | | Value Growth Portfolio – Service Class | | Blue Chip Portfolio – Initial Class | | Blue Chip Portfolio – Service Class | | Federated Capital Appreciation Fund II – Primary Shares | | Federated Capital Appreciation Fund II - Primary Shares Pro Forma Combined |
| Distribution (12b-1) Fee | | None | | 0.25% | | None | | 0.25% | | 0.25% | | 0.25% |
| Other Expenses | | 0.15% | | 0.16% | | 0.14% | | 0.14% | | 0.74% | | 0.21% |
| | | | | | |
| Total Annual Fund Operating Expenses | | 0.60% | | 0.86% | | 0.34% | | 0.59% | | 1.84% | | 1.31% |
| Fee Waivers and/or Expense Reimbursements | | None | | None | | None | | None | | 0.66%(1) | | 0.13%(1) |
| Total Annual Fund Operating Expenses After Fee Waivers and/or Expense Reimbursements | | 0.60% | | 0.86% | | 0.34% | | 0.59% | | 1.18% | | 1.18% |
1 Federated Capital Appreciation Fund II’s adviser and its affiliates have voluntarily agreed to waive their fees and or reimburse expenses so that the total annual fund operating expenses (included Acquired Fund Fees and Expenses, if any) paid by the Fund’s Primary Shares (after the voluntary waivers and/or reimbursements) will not exceed 1.18% (the “Fee Limit”), up to but not including the later of (the “Termination Date”): (a) May 1, 2012, or (b) the date of the Fund’s next effective prospectus. While the Fund’s adviser and its affiliates currently do not anticipate terminating or increasing these arrangements prior to the Termination Date, these arrangements may only be terminated or the Fee Limit increased prior to the Termination Date with the agreement of the Fund’s Board. If this Reorganization is approved, the Termination Date will be extended to the later of: (a) May 31, 2012; or (b) the date of the Fund’s next effective Prospectus.
Example
This example is intended to help you compare the cost of investing in the indicated Funds with the cost of investing in other mutual funds.
The Example assumes that you invest $10,000 in the funds’ shares for the time periods indicated and then redeem all of your shares at the end of those periods. The Example also assumes that your investment has a 5% return each year and that the each fund’s shares operating expenses (including those of Federated Quality Bond Fund II’s Primary Shares, assuming the Reorganization of both Value Growth Portfolio and Blue Chip Portfolio) are as shown in the table above and remain the same. Although your actual costs and returns may be higher or lower, based on these assumptions your costs would be:
| | | | | | | | |
| | | 1 Year | | 3 Years | | 5 Years | | 10 Years |
Value Growth Portfolio, Initial Class Shares | | $61 | | $192 | | $335 | | $750 |
Value Growth Portfolio, Service Class Shares | | $88 | | $274 | | $477 | | $1,061 |
Blue Chip Portfolio, Initial Class Shares | | $35 | | $109 | | $191 | | $431 |
Blue Chip Portfolio, Service Class Shares | | $60 | | $189 | | $329 | | $738 |
Federated Capital Appreciation Fund II, Primary Shares | | $187 | | $579 | | $996 | | $2,159 |
Federated Capital Appreciation Fund II, Primary Shares, Pro Forma Combined | | $133 | | $415 | | $718 | | $1,579 |
COMPARISON OF POTENTIAL RISKS AND REWARDS; PERFORMANCE HISTORY
The bar charts and tables below compare the potential risks and rewards of investing in each EquiTrust Variable Portfolio and the corresponding Federated Insurance Fund. The bar charts provide an indication of the risks of investing in each Fund by showing changes in each Fund’s performance from year to year. The total returns shown in the bar charts are based upon NAV. The tables show how each Fund’s average annual total returns for the one year, five year and ten year periods (or start of performance) compare to the returns of a broad-based market index(es). The figures assume reinvestment of dividends and distributions.
30
MONEY MARKET PORTFOLIO — FEDERATED PRIME MONEY FUND II
Money Market Portfolio
The performance information shown below will help you analyze Money Market Portfolio’s investment risks in light of its historical performance. The bar chart shows the variability total returns of the Portfolio’s Initial Class shares on a calendar year-by-year basis. The Average Annual Total Return table shows returns averaged over the stated periods. The Portfolio’s performance will fluctuate, and past performance (before and after taxes) is not necessarily an indication of future results. Updated performance information for the Portfolio can be obtained by calling 1-877-860-2904.
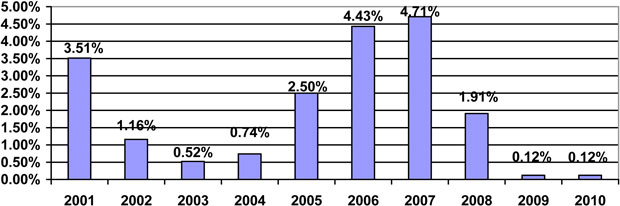
During the periods shown in the chart, the Portfolio’s Initial Class Shares’ highest quarterly return was 1.26% (quarter ended March 31, 2001) and its lowest quarterly return was 0.02% (quarter ended December 31, 2009).
Average Annual Total Return Table
The following table represents the Portfolio’s Initial Class Shares’ Average Annual Total Returns for the calendar periods ended December 31, 2010.
| | 00000000000000 | | 00000000000000 | | 00000000000000 | | 00000000000000 |
Average Annual Total Return (for periods ended December 31, 2010) | | One Year | | Five Years | | Ten Years | | Since Inception* |
Initial Class Shares | | 0.12% | | 2.24% | | 1.96% | | N/A |
Service Class Shares | | 0.12% | | N/A | | N/A | | 0.36% |
0-3 Month T-Bill Index (reflects no deduction for fees or expenses) | | 0.13% | | 2.30% | | 2.26% | | 0.43% |
* Since Inception performance is provided only for a share class with less than ten calendar years of performance. Since Inception figures for Service Class Shares are from June 1, 2008, the commencement date of the share class.
The performance figures do not reflect the fees and charges of the variable annuity contracts and variable life insurance policies that invest in the Portfolio. If these fees and charges had been reflected, the performance shown would have been less favorable.
Federated Prime Money Fund II
The performance information shown below will help you analyze Federated Prime Money Fund II’s investment risks in light of its historical performance. The bar chart shows the variability of the Fund’s total returns on a calendar year-by-year basis. The Average Annual Total Return table shows returns averaged over the stated periods.
31
The Fund’s performance will fluctuate, and past performance (before and after taxes) is not necessarily an indication of future results. Updated performance information for the Fund is available under the “Products” section at FederatedInvestors.com or by calling 1-800-341-7400.
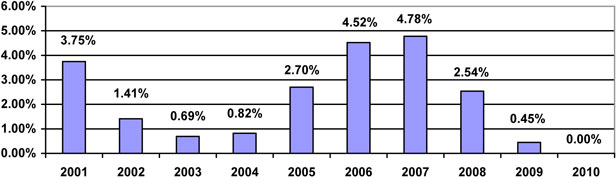
During the periods shown in the chart, the Fund’s highest quarterly return was 1.32% (quarter ended March 31, 2001) and its lowest quarterly return was 0.00% (quarter ended December 31, 2010).
Average Annual Total Return Table
The following table represents the Fund’s Average Annual Total Returns for the calendar period ended December 31, 2010.
| | | | | | |
Average Annual Total Return (for periods ended December 31, 2010) | | One Year | | Five Years | | Ten Years |
Federated Prime Money Fund II | | 0.00% | | 2.44% | | 2.15% |
The Fund’s 7-Day Net Yield as of December 31, 2010 was 0.00%. You may go to FederatedInvestors.com or call the Fund at 1-800-341-7400 for the current 7-Day Net Yield.
The performance figures do not reflect the fees and charges of the variable annuity contracts and variable life insurance policies that invest in the Fund. If these fees and charges had been reflected, the performance shown would have been less favorable.
HIGH GRADE BOND PORTFOLIO AND STRATEGIC YIELD PORTFOLIO – FEDERATED QUALITY BOND FUND II
High Grade Bond Portfolio
The performance information shown below will help you analyze High Grade Bond Portfolio’s investment risks in light of its historical performance. The bar chart shows the variability total returns of the Portfolio’s Initial Class shares on a calendar year-by-year basis. The Average Annual Total Return table shows returns averaged over the stated periods. The Portfolio’s performance will fluctuate, and past performance (before and after taxes) is not necessarily an indication of future results. Updated performance information for the Portfolio can be obtained by calling 1-877-860-2904.
32
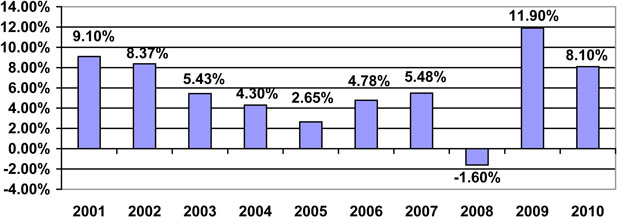
During the periods shown in the chart, the Portfolio’s Initial Class Shares’ highest quarterly return was 4.94% (quarter ended June 30, 2009) and its lowest quarterly return was (3.47)% (quarter ended September 30, 2008).
Average Annual Total Return Table
The following table represents the Fund’s Average Annual Total Returns for the calendar period ended December 31, 2010.
| | 000000000000 | | 000000000000 | | 000000000000 | | 000000000000 |
Average Annual Total Return (for periods ended December 31, 2010) | | One Year | | Five Years | | Ten Years | | Since Inception* |
| Initial Class Shares | | 8.10% | | 5.64% | | 5.79% | | N/A |
| Service Class Shares | | 7.84% | | N/A | | N/A | | 6.90% |
Barclays Capital U.S. Aggregate Index (reflects no deduction for fees, expenses or taxes) | | 6.54% | | 5.80% | | 5.84% | | 6.39% |
* Since Inception performance is only provided for a share class with less than ten calendar years of performance. Since Inception figures for the Service Class Shares and Aggregate Index are from June 1, 2008, the commencement date of the share class.
The performance figures do not reflect the fees and charges of the variable annuity contracts and variable life insurance policies that invest in the Portfolio. If these fees and charges had been reflected, the performance shown would have been less favorable.
Strategic Yield Portfolio
The performance information shown below will help you analyze Strategic Yield Portfolio’s investment risks in light of its historical performance. The bar chart shows the variability total returns of the Portfolio’s Initial Class shares on a calendar year-by-year basis. The Average Annual Total Return table shows returns averaged over the stated periods. The Portfolio’s performance will fluctuate, and past performance (before and after taxes) is not necessarily an indication of future results. Updated performance information for the Portfolio can be obtained by calling 1-877-860-2904.
33
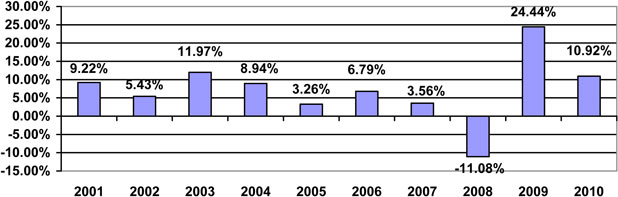
During the periods shown in the chart, the Portfolio’s Initial Class Shares’ highest quarterly return was 15.96% (quarter ended June 30, 2009) and its lowest quarterly return was (6.67)% (quarter ended December 31, 2008).
Average Annual Total Return Table
The following table represents the Portfolio’s Average Annual Total Returns for the calendar period ended December 31, 2010.
| | 0000000000000 | | 0000000000000 | | 0000000000000 | | 0000000000000 |
Average Annual Total Return (for periods ended December 31, 2010) | | One Year | | Five Years | | Ten Years | | Since Inception(1) |
| Initial Class Shares | | 10.92% | | 6.30% | | 7.01% | | N/A |
| Service Class Shares | | 10.66% | | N/A | | N/A | | 8.60% |
Barclays Capital U.S. Credit/High Yield Index (reflects no deduction for fees, expenses or taxes)(2) | | 9.70% | | 6.50% | | 7.03% | | 8.49% |
Barclays Capital U.S. Corporate High Yield Index (reflects no deduction for fees, expenses or taxes)(2) | | 15.12% | | 8.91% | | 8.88% | | 11.50% |
1. Since Inception performance is only provided for a share class with less than ten calendar years of performance. Since Inception figures for the Service Class Shares and Barclays Indices are from June 1, 2008, the commencement date of the share class.
2 The Barclays Capital U.S. Credit/High Yield and the Barclays Capital U.S. Corporate High Yield indices are widely recognized, unmanaged indices of corporate and high yield bond market performance, respectively.
The performance figures do not reflect the fees and charges of the variable annuity contracts and variable life insurance policies that invest in the Portfolio. If these fees and charges had been reflected, the performance shown would have been less favorable.
Federated Quality Bond Fund II
The bar chart and performance table below reflect historical performance data for Federated Quality Bond Fund II’s Primary Shares. The performance information shown below will help you analyze the Fund’s investment risks in light of its historical returns. The bar chart shows the variability of the Fund’s Primary Shares total returns on a calendar year-by-year basis. The Average Annual Total Return table shows returns averaged over the stated periods, and includes comparative performance information. The Fund’s performance will fluctuate, and past performance is not necessarily an indication of future results. Updated performance information for the Fund is available under the “Products” section at FederatedInvestors.com or by calling 1-800-341-7400.
34
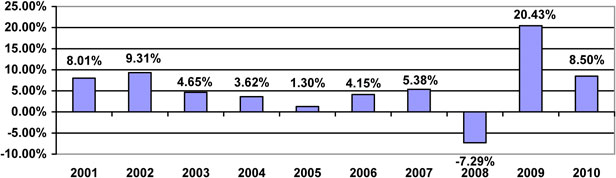
During the periods shown in the chart, the Fund’s Primary Shares’ highest quarterly return was 9.83% (quarter ended June 30, 2009) and its lowest quarterly return was (6.27)% (quarter ended September 30, 2008).
Average Annual Total Return Table
The following table represents the Fund’s Average Annual Total Returns for the calendar period ended December 31, 2010.
| | | | | | |
Average Annual Total Return (for periods ended December 31, 2010) | | One Year | | Five Years | | Ten Years |
| Primary Shares | | 8.50% | | 5.87% | | 5.60% |
| Barclays Capital U.S. Intermediate Credit Bond Index (reflects no deduction for fees, expenses or taxes)(1) | | 7.76% | | 6.03% | | 6.22% |
| Lipper Intermediate Investment Grade Debt Variable Underlying Funds Classification Average(2) | | 6.56% | | 4.09% | | 4.54% |
1 The Barclays Capital U.S. Intermediate Credit Bond Index consists of dollar-denominated, investment-grade, publicly issued securities with a maturity between one and ten years, a minimum amount outstanding of $250 million and that are issued by both corporate issuers and non-corporate issuers (supranationals, sovereigns, foreign agencies and foreign local governments).
2 Lipper figures represent the average total returns reported by all of the funds serving as underlying investment options for variable insurance contracts designated by Lipper, Inc. as falling into the category indicated. They do not reflect sales charges.
The performance figures do not reflect the fees and charges of the variable annuity contracts and variable life insurance policies that invest in the Fund. If these fees and charges had been reflected, the performance shown would have been less favorable.
MANAGED PORTFOLIO – FEDERATED CAPITAL INCOME FUND II
Managed Portfolio
The performance information shown below will help you analyze Managed Portfolio’s investment risks in light of its historical performance. The bar chart shows the variability total returns of the Portfolio’s Initial Class shares on a calendar year-by-year basis. The Average Annual Total Return table shows returns averaged over the stated periods. The Portfolio’s performance will fluctuate, and past performance (before and after taxes) is not necessarily an indication of future results. Updated performance information for the Portfolio can be obtained by calling 1-877-860-2904.
35
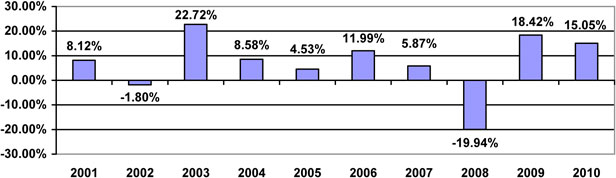
During the periods shown in the chart, the Portfolio’s Initial Class Shares’ highest quarterly return was 11.89% (quarter ended June 30, 2003) and its lowest quarterly return was (12.66)% (quarter ended December 31, 2008).
Average Annual Total Return Table
The following table represents the Portfolio’s Average Annual Total Returns for the calendar period ended December 31, 2010.
| | 000000000000000 | | 000000000000000 | | 000000000000000 | | 000000000000000 |
Average Annual Total Return (for periods ended December 31, 2010) | | One Year | | Five Years | | Ten Years | | Since Inception* |
| Initial Class Shares | | 15.05% | | 5.28% | | 6.70% | | N/A |
| Service Class Shares | | 14.79% | | N/A | | N/A | | 2.93% |
| S&P 500 Index (reflects no deduction for fees or expenses) | | 15.06% | | 2.29% | | 1.41% | | (1.84)% |
* Since Inception performance is only provided for a share class with less than ten calendar years of performance. Since Inception figures for the Service Class Shares are from June 1, 2008, the commencement date of the share class.
The performance figures do not reflect the fees and charges of the variable annuity contracts and variable life insurance policies that invest in the Portfolio. If these fees and charges had been reflected, the performance shown would have been less favorable.
Federated Capital Income Fund II
The bar chart and performance table below reflect historical data for the Federated Capital Income Fund II’s shares. The performance information shown below will help you analyze the Fund’s investment risks in light of its historical returns. The bar chart shows the variability of the Fund’s total returns on a calendar year-by-year basis. The Average Annual Total Return table shows returns averaged over the stated periods, and includes comparative performance information. The Fund’s performance will fluctuate, and past performance is not necessarily an indication of future results. Updated performance information for the Fund is available under the “Products” section at FederatedInvestors.com or by calling 1-800-341-7400.
36
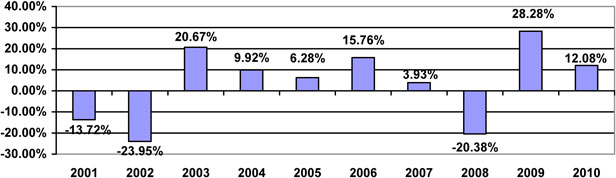
During the periods shown in the chart, the Fund’s highest quarterly return was 13.73% (quarter ended June 30, 2003) and its lowest quarterly return was (18.65)% (quarter ended September 30, 2002).
Average Annual Total Return Table
The following table represents the Fund’s Average Annual Total Returns for the calendar period ended December 31, 2010.
| | 00000000000000 | | 00000000000000 | | 00000000000000 |
Average Annual Total Return (for periods ended December 31, 2010) | | One Year | | Five Years | | Ten Years |
| Federated Capital Income Fund II | | 12.08% | | 6.61% | | 2.45% |
Standard & Poor’s 500 Index (1) (reflects no deduction for fees or expenses) | | 15.06% | | 2.29% | | 1.41% |
Russell 1000® Value Index (2) (reflects no deduction for fees, expenses or taxes) | | 15.51% | | 1.28% | | 3.26% |
| Blended Index (3) (reflects no deduction for fees or expenses) | | 12.86% | | 5.24% | | 6.39% |
| Lipper Variable Underlying Funds Mixed-Asset Target Allocation Conservative Funds (4) | | 9.61% | | 4.23% | | 2.65% |
1 Standard & Poor’s 500 Index is a broad-based market index and an unmanaged capitalization-weighted index of 500 stocks designed to measure performance of the broad domestic economy through changes in the aggregate market value of 500 stocks representing all major industries.
2 Russell 1000® Value Index is an unmanaged index that measures the performance of the 1,000 largest U.S. domiciled companies (based on total market capitalization) with lower price-to-book ratios and lower forecasted growth values.
3 The Blended Index is comprised of 40% Russell 1000 Value Index, 20% Barclays Capital Emerging Market Bond Index, 20% Barclays Capital U.S. Corporate High-Yield 2% Issuer Constrained Index and 20% Barclays Capital Mortgage-Backed Securities Index.
4 Lipper figures represent the average total returns reported by all of the funds serving as underlying investment options for variable insurance contracts designated by Lipper, Inc. as falling into the category indicated. They do not reflect sales charges.
The performance figures do not reflect the fees and charges of the variable annuity contracts and variable life insurance policies that invest in the Fund. If these fees and charges had been reflected, the performance shown would have been less favorable.
37
VALUE GROWTH PORTFOLIO AND BLUE CHIP PORTFOLIO – FEDERATED CAPITAL APPRECIATION FUND II
Value Growth Portfolio
The performance information shown below will help you analyze Value Growth Portfolio’s investment risks in light of its historical performance. The bar chart shows the variability total returns of the Portfolio’s Initial Class shares on a calendar year-by-year basis. The Average Annual Total Return table shows returns averaged over the stated periods. The Portfolio’s performance will fluctuate, and past performance (before and after taxes) is not necessarily an indication of future results. Updated performance information for the Portfolio can be obtained by calling 1-877-860-2904.
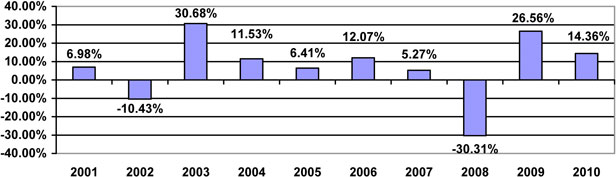
During the periods shown in the chart, the Portfolio’s Initial Class Shares’ highest quarterly return was 15.75% (quarter ended September 30, 2009) and its lowest quarterly return was (20.13)% (quarter ended December 31, 2008).
Average Annual Total Return Table
The following table represents the Portfolio’s Average Annual Total Returns for the calendar period ended December 31, 2010.
| | 000000000000 | | 000000000000 | | 000000000000 | | 000000000000 |
Average Annual Total Return (for periods ended December 31, 2010) | | One Year | | Five Years | | Ten Years | | Since Inception* |
| Initial Class Shares | | 14.36% | | 3.54% | | 5.87% | | N/A |
| Service Class Shares | | 14.07% | | N/A | | N/A | | 0.35% |
| S&P 500 Index (reflects no deduction for fees or expenses) | | 15.06% | | 2.29% | | 1.41% | | (1.84)% |
* Since Inception performance is only provided for a share class with less than ten calendar years of performance. Since Inception figures for the Service Class Shares are from June 1, 2008, the commencement date of the share class.
The performance figures do not reflect the fees and charges of the variable annuity contracts and variable life insurance policies that invest in the Portfolio. If these fees and charges had been reflected, the performance shown would have been less favorable.
38
Blue Chip Portfolio
The performance information shown below will help you analyze Blue Chip Portfolio’s investment risks in light of its historical performance. The bar chart shows the variability total returns of the Portfolio’s Initial Class shares on a calendar year-by-year basis. The Average Annual Total Return table shows returns averaged over the stated periods. The Portfolio’s performance will fluctuate, and past performance (before and after taxes) is not necessarily an indication of future results. Updated performance information for the Portfolio can be obtained by calling 1-877-860-2904.
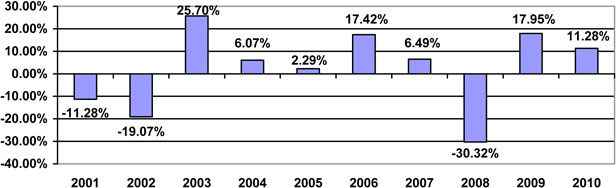
During the periods shown in the chart, the Portfolio’s Initial Class Shares’ highest quarterly return was 14.98% (quarter ended June 30, 2003) and its lowest quarterly return was (18.26)% (quarter ended September 30, 2002).
Average Annual Total Return Table
The following table represents the Portfolio’s Average Annual Total Returns for the calendar period ended December 31, 2010.
| | 0000000000 | | 0000000000 | | 0000000000 | | 0000000000 |
Average Annual Total Return (for periods ended December 31, 2010) | | One Year | | Five Years | | Ten Years | | Since
Inception* |
Initial Class Shares | | 11.28% | | 2.72% | | 1.14% | | N/A |
Service Class Shares | | 11.00% | | N/A | | N/A | | (1.73)% |
S&P 500 Index (reflects no deduction for fees or expenses) | | 15.06% | | 2.29% | | 1.41% | | (1.84)% |
* Since Inception performance is only provided for a share class with less than ten calendar years of performance. Since Inception figures for the Service Class Shares are from June 1, 2008, the commencement date of the share class.
The performance figures do not reflect the fees and charges of the variable annuity contracts and variable life insurance policies that invest in the Portfolio. If these fees and charges had been reflected, the performance shown would have been less favorable.
Federated Capital Appreciation Fund II
The bar chart and performance table below reflect historical performance data for the Federated Capital Appreciation Fund II’s shares. The performance information shown below will help you analyze the Fund’s investment risks in light of its historical returns. The bar chart shows the variability of the Fund’s Primary Shares total returns on a calendar year-by-year basis. The Average Annual Total Return table shows returns averaged over the stated periods, and includes comparative performance information. The Fund’s performance will fluctuate, and
39
past performance is not necessarily an indication of future results. Updated performance information for the Funds is available under the “Products” section at FederatedInvestors.com or by calling 1-800-341-7400.
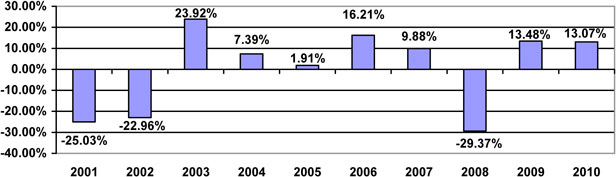
During the periods shown in the chart, the Fund’s Primary Shares’ highest quarterly return was 14.49% (quarter ended June 30, 2003) and its lowest quarterly return was (19.82)% (quarter ended March 31, 2001).
Average Annual Total Return Table
The following table represents the Fund’s Average Annual Total Returns for the calendar period ended December 31, 2010.
| | 00000000000 | | 00000000000 | | 00000000000 |
Average Annual Total Return (for periods ended December 31, 2010) | | One Year | | Five Years | | Since Inception 6/19/00 |
Primary Shares | | 13.07% | | 2.97% | | (0.98)% |
Standard & Poor’s 500 Index (reflects no deduction for fees or expenses)(1) | | 15.06% | | 2.29% | | 1.41% |
Lipper Variable Underling Funds Large Cap Core Average (2) | | 12.45% | | 0.85% | | 0.15% |
1 Standard and Poor’s 500 Index is a broad-based market index and an unmanaged capitalization-weighted index of 500 stocks designed to measure performance of the broad domestic economy through changes in the aggregate market value of 500 stocks representing all major industries.
2 Lipper figures represent the average total returns reported by all of the funds serving as underlying investment options for variable insurance contracts designated by Lipper, Inc. as falling into the category indicated. They do not reflect sales charges.
The performance figures do not reflect the fees and charges of the variable annuity contracts and variable life insurance policies that invest in the Fund. If these fees and charges had been reflected, the performance shown would have been less favorable.
40
FUND MANAGEMENT
EQUITRUST VARIABLE FUND
EquiTrust, 5400 University Avenue, West Des Moines, Iowa 50266, serves as the EquiTrust Variable Fund’s investment adviser and manager pursuant to an Investment Advisory and Management Services Agreement. This relationship has existed since the EquiTrust Variable Fund commenced operations in 1987.
EquiTrust is a wholly owned subsidiary of FBL Financial Services, Inc., which is a wholly owned subsidiary of FBL Financial Group, Inc., an Iowa corporation. At December 31, 2010, 63.9% of the outstanding voting power of FBL Financial Group, Inc. was owned in shares of various classes by Iowa Farm Bureau Federation, an Iowa not-for-profit corporation. EquiTrust also acts as the investment adviser to individuals, institutions and one other mutual fund: EquiTrust Series Fund, Inc. Personnel of EquiTrust also manage investments for the portfolios of insurance companies.
The following individuals are officers and/or directors of EquiTrust and are officers and/or trustees of the EquiTrust Variable Fund: James E. Hohmann, James P. Brannen, Richard J. Kypta, David A. McNeill, Charles T. Happel, Kristi Rojohn, Jennifer Morgan, Erika Horstmann, Sara Tamisiea and Jodi Winslow.
EquiTrust handles the investment and reinvestment of the EquiTrust Variable Fund’s assets, and is responsible for the overall management of the EquiTrust Variable Fund’s business affairs, subject to the review of the Board of Trustees.
FEDERATED INSURANCE FUNDS
The Federated Variable Trust Board of Trustees governs each of the Federated Insurance Funds. The Board selects and oversees each Fund’s investment adviser and, if applicable, its subadvisers. Federated Advisory Services Company (“FASC”), an affiliate of the Funds’ investment advisers, provides certain support services to those advisers. The fee for these services is paid to FASC by each Fund’s adviser, and not by any of the Funds.
Federated Prime Money Fund II and Federated Quality Bond Fund II
Federated Investment Management Company (“FIMCO”) serves as the investment adviser of these Funds. FIMCO manages each Fund’s assets, including buying and selling portfolio securities.
Federated Capital Appreciation Fund II
Federated Equity Management Company of Pennsylvania (“FEMCO”) serves as the investment adviser of this Fund. FEMCO manages the Fund’s assets, including buying and selling portfolio securities.
Federated Capital Income Fund II
FEMCO serves as the investment adviser of this Fund. FEMCO manages the Fund’s assets, including buying and selling portfolio securities.
FEMCO has delegated daily management of some of all of the Fund’s assets to FIMCO, who is paid by FEMCO and not by the Fund, based on the portion of securities FIMCO manages.
General Information about the Federated Insurance Funds’ Advisers and Subadvisers
The address of FIMCO, FEMCO, and FASC is Federated Investors Tower, 1001 Liberty Avenue, Pittsburgh, Pennsylvania 15222-3779.
41
FIMCO advises approximately 111 fixed-income and money market mutual funds (including sub-advised funds) and private investment companies, which totaled approximately $259.5 billion in assets as of December 31, 2010.
FEMCO advises approximately 23 equity mutual funds (including subadvised funds) which totaled approximately $15.4 billion in assets as of December 31, 2010.
The Federated Funds’ investment advisers and subadvisers, together with other subsidiaries of Federated, collectively advise approximately 136 equity, fixed-income and money market mutual funds as well as a variety of other customized separately managed accounts and private investment companies and other pooled investment vehicles (including non-U.S./offshore funds), which totaled approximately $358.2 billion in assets as of December 31, 2010. Federated was established in 1955 and is one of the largest investment managers in the United States with approximately 1,334 employees. Federated provides investment products to approximately 5,000 investment professionals and institutions.
PORTFOLIO MANAGER INFORMATION
EQUITRUST VARIABLE PORTFOLIOS
The following individuals serve as portfolio managers for the EquiTrust Variable Fund:
Bob Rummelhart, CFA; Investment Vice President, Portfolio Manager (High Grade Bond and Strategic Yield Portfolios). Mr. Rummelhart joined EquiTrust in 1987 and has been responsible for the management of these Portfolios since their inception. He received both his undergraduate and MBA degrees from the University of Iowa.
Doug Higgins, CFA; Securities Vice President, Portfolio Manager (Managed, Value Growth and Blue Chip Portfolios). Mr. Higgins joined EquiTrust in 1998 as a Security Analyst in the fixed-income department. He became Associate Portfolio Manager in 2000, and was made Lead Portfolio Manager in 2008. Mr. Higgins received his undergraduate degree from Iowa State University and his MBA from the University of Iowa.
Mark Sandbulte, CFA; Associate Portfolio (Managed, Value Growth and Blue Chip Portfolios). Mr. Sandbulte joined EquiTrust in 2000 as Assistant Research Analyst, and became Associate Portfolio Manager in 2008. Mr. Sandbulte received his undergraduate degree from Central College in Pella, Iowa, and his MBA from the University of Iowa.
The EquiTrust Variable Fund’s SAI provides additional information about each portfolio manager’s compensation, management of other accounts and ownership of securities in each EquiTrust Variable Portfolio managed by the portfolio manager.
FEDERATED INSURANCE FUNDS
The following individuals serve as portfolio managers for the Federated Insurance Funds:
Christopher J. Smith (Federated Quality Bond Fund II). Christopher J. Smith has been the Fund’s Portfolio Manager since August 2000. Mr. Smith joined Federated in 1995 as a Portfolio Manager and a Vice President of a Federated advisory subsidiary. He has been a Vice President of the Fund’s Adviser since 1997. He was an Assistant Vice President of Provident Life & Accident Insurance Company from 1987 through 1994. Mr. Smith is a Chartered Financial Analyst. He received his M.A. in Economics and Finance from the University of Kentucky.
Joseph M. Balestrino (Federated Quality Bond Fund II and Federated Capital Income Fund II). Joseph M. Balestrino has been the Funds’ Portfolio Manager since inception. Mr. Balestrino is the Fixed Income Market Strategist and Head of the Domestic High Grade Corporate Bond Group. He joined Federated in 1986 and has been a Senior Portfolio Manager and Senior Vice President of the Fund’s Adviser since 1998. He was a Portfolio Manager and a Vice President of the Fund’s Adviser from 1995 to 1998. Mr. Balestrino served as a Portfolio Manager and an Assistant Vice President of the Adviser from 1993 to 1995. Mr. Balestrino is a Chartered Financial Analyst and received his Master’s Degree in Urban and Regional Planning from the University of Pittsburgh.
42
John L. Nichol (Federated Capital Income Fund II). John L. Nichol has been a Portfolio Manager of the Fund’s equity asset class since February 2001. Mr. Nichol joined Federated in September 2000 as an Assistant Vice President/Senior Investment Analyst. He has been a Portfolio Manager since December 2000 and was named a Vice President of the Fund’s Adviser in July 2001. Mr. Nichol served as a portfolio manager and analyst for the Public Employees Retirement System of Ohio from 1992 through August 2000. Mr. Nichol is a Chartered Financial Analyst. He received his M.B.A. with an emphasis in Finance and Management and Information Science from the Ohio State University.
Linda Bakhshian (Federated Capital Income Fund II). Linda Bakhshian, Portfolio Manager, has been a portfolio manager of the Fund since November 2009. Ms. Bakhshian joined Federated in 2007 and is a Vice President of a Federated advisory subsidiary. Previously, she served as an equity research analyst with the Principal Financial Group from September 2002 to October 2007. Ms. Bakhshian has earned the Chartered Accountant designation and received her B.B. from the University of New England (Australia).
Todd A. Abraham (Federated Capital Income Fund II). Todd A. Abraham has been a Portfolio Manager of the Fund for the mortgage asset class since February 2003. Mr. Abraham has been a Portfolio Manager since 1995 and a Senior Vice President of the Fund’s Sub-Adviser since 2007. Mr. Abraham joined Federated in 1993 as an Investment Analyst and served as Assistant Vice President from 1995 to 1997. Mr. Abraham served as a Portfolio Analyst at Ryland Mortgage Co. from 1992 to 1993. Mr. Abraham is a Chartered Financial Analyst and received his M.B.A. in Finance from Loyola College.
Roberto Sanchez-Dahl (Federated Capital Income Fund II). Roberto Sanchez-Dahl has been a Portfolio Manager of the Fund for the international bond and emerging markets asset classes since January 2003. Mr. Sanchez-Dahl joined Federated in December 1997 as a Senior Investment Analyst. He was promoted to Vice President of the Fund’s Sub-Adviser in January 2000. Mr. Sanchez-Dahl served as an Associate covering Emerging Markets in the Credit Department at Goldman, Sachs & Co. from July 1994 through November 1997. Mr. Sanchez-Dahl is a Chartered Financial Analyst. He earned an M.B.A. from Columbia University with a concentration in Finance and International Business.
Carol R. Miller (Federated Capital Appreciation Fund II). Carol R. Miller has been the Fund’s Portfolio Manager since November 2005. Ms. Miller joined Federated as a Senior Vice President and Senior Portfolio Manager in November 2005. Ms. Miller was an Adjunct Professor of the Portfolio Management Course at Ohio State University from March 2005 until June 2005. From April 2003 until September 2004, Ms. Miller served as Managing Director, Growth Team Leader at Banc One Investment Advisors and from December 1999 until April 2003, she served as Director of Equity Securities at Nationwide Insurance. Ms. Miller is a Chartered Financial Analyst. She earned her B.S. in Finance and Accounting from Ohio State University and her M.B.A. in Finance from Ohio State University.
Dean J. (Constantine) Kartsonas (Federated Capital Appreciation Fund II). Dean J. (Constantine) Kartsonas has been the Fund’s Portfolio Manager since August 2007. Mr. Kartsonas joined Federated as an Investment Analyst in the High Yield department in September 1994. From March 2000 through May 2007 he has served as a Portfolio Manager and a Senior Investment Analyst in the equity department. He became a Vice President of the Fund’s Adviser in January 2004 and is a Chartered Financial Analyst. He earned his B.S. from Cornell University and his M.B.A. from the University of Pittsburgh.
The Federated Insurance Funds’ SAIs provide additional information about the portfolio managers’ compensation, management of other accounts, and ownership of securities in the Federated Insurance Funds.
43
ADVISORY FEES, SERVICE FEES, SHAREHOLDER FEES AND OTHER EXPENSES
INVESTMENT ADVISORY FEES
The annual investment advisory fee for each Federated Insurance Fund and each EquiTrust Variable Portfolio, as a percentage of each such Fund’s and Portfolio’s daily net assets, is as follows:
| | | | | | |
EquiTrust Variable Portfolios | | Advisory Fee | | Federated Insurance Funds | | Advisory Fee |
Money Market Portfolio | | 0.25% | | Federated Prime Money Fund II | | 0.50% |
High Grade Bond Portfolio Strategic Yield Portfolio | | 0.30% 0.45% | | Federated Quality Bond Fund II | | 0.60% |
Managed Portfolio | | 0.45% | | Federated Capital Income Fund II | | 0.75% |
Value Growth Portfolio Blue Chip Portfolio | | 0.45% 0.20% | | Federated Capital Appreciation Fund II | | 0.85% |
The following table shows the advisory fees paid by the Funds to their respective investment advisers during the fiscal year ended December 31, 2010, after waivers and reimbursements, expressed as an annual percentage of average daily net assets.
| | | | | | |
| EquiTrust Variable Portfolios | | Net Advisory Fee Paid | | Federated Insurance Funds | | Net Advisory Fee Paid |
Money Market Portfolio | | 0.00% | | Federated Prime Money Fund II | | 0.26% |
High Grade Bond Portfolio Strategic Yield Portfolio | | 0.30% 0.45% | | Federated Quality Bond Fund II | | 0.55% |
Managed Portfolio | | 0.45% | | Federated Capital Income Fund II | | 0.49% |
Value Growth Portfolio Blue Chip Portfolio | | 0.45% 0.20% | | Federated Capital Appreciation Fund II | | 0.73% |
A discussion of the EquiTrust Variable Fund’s Board’s review of the EquiTrust Variable Fund’s investment advisory contract is available in the Fund’s annual report dated December 31, 2010. A discussion of the Federated Insurance Fund Board’s review of each Federated Insurance Funds’ investment advisory contract is available in each Federated Insurance Fund’s semi-annual report dated June 30, 2010.
ADMINISTRATIVE FEES (FEDERATED INSURANCE FUNDS ONLY)
Federated Administrative Services (“FAS”), an affiliate of FIMCO and FEMCO, serves as administrator to the Federated Insurance Funds and provides certain administrative personnel and services as necessary. FAS provides these services at an annual rate based on the average aggregate daily net assets of the Federated Insurance Funds and most of the other Federated funds advised by FIMCO and FEMCO or their affiliates. The rate charged by FAS is based on a scale that ranges from 0.150% on the first $5 billion of average aggregate daily net assets to 0.075% on assets over $20 billion. FAS’ minimum annual administrative fee with respect to each Federated Insurance Fund is $150,000 per portfolio and $40,000 per each additional class of shares. FAS may choose voluntarily to waive a portion of its fee.
FAS also provides certain accounting and recordkeeping services with respect to the Federated Insurance Funds’ portfolio investments for a fee based on Fund assets plus out-of-pocket expenses.
44
RULE 12B-1 PLANS
EquiTrust Variable Portfolios
EquiTrust Marketing Services, LLC (“EquiTrust Marketing”), an affiliate of EquiTrust, serves as principal underwriter and sole distributor of the EquiTrust Variable Fund’s shares. Service Class Shares of each EquiTrust Variable Portfolio pay EquiTrust Marketing for distribution and shareholder services pursuant to a Distribution and Shareholder Services Plan and Agreement (the “Agreement”) under Rule 12b-1. Under the Agreement, Service Class Shares of each EquiTrust Variable Portfolio pay EquiTrust Marketing a monthly fee at the annual rate of 0.25% of average daily net assets of the Service Class Shares of such Portfolio. Because the fee is continually paid out of the EquiTrust Variable Portfolios’ Service Class Shares’ assets, over time it will increase the cost of investment and may cost more over time than other types of sales charges. Pursuant to the Agreement, EquiTrust Marketing may appoint various broker-dealer firms to assist in providing distribution and shareholder services for the Service Class Shares of each EquiTrust Variable Portfolio.
Federated Insurance Funds
Federated Quality Bond Fund II and Federated Capital Appreciation Fund II have adopted Rule 12b-1 Plans that allow them to pay marketing fees of up to 0.25% of average net assets to Federated Securities Corp. (“FSC”), a subsidiary of Federated, for the sale, distribution, administration and customer servicing of these Funds’ Primary Shares. When FSC receives Rule 12b-1 Fees, it may pay some or all of them to financial intermediaries whose customers select the shares as part of their variable contracts. Because these shares pay marketing fees on an ongoing basis, an investor’s investment cost may be higher over time than other shares with different marketing fees. Subsequent to the Closing Date, FSC may pay all or a portion of the Rule 12b-1 Fees it receives from these Funds attributable to the holdings of current EquiTrust Variable Portfolio shareholders to EquiTrust or its affiliates in connection with the customer servicing of Primary Shares of these Funds held by such shareholders.
In addition, subsequent to the Closing Date, the Federated Insurance Funds’ investment advisers, or their affiliates, may make payments from their own assets to EquiTrust or its affiliates in connection with the customer servicing of Federated Insurance Fund shares held by current EquiTrust Variable Portfolio shareholders. Such amounts will be based on the total assets of the EquiTrust Variable Portfolios merged into the applicable Federated Insurance Funds.
ACCOUNT ADMINISTRATION PLAN (FEDERATED INSURANCE FUNDS ONLY)
All classes of the Federated Insurance Funds to be issued in the Reorganizations may pay Account Administration Fees of up to 0.25% of average net assets to insurance companies for providing administrative services to the Federated Insurance Funds and shareholders.
SERVICE FEES (FEDERATED INSURANCE FUNDS ONLY)
The Federated Insurance Funds may pay Service Fees of up to 0.25% of average net assets to financial intermediaries or to Federated Shareholder Services Company, a subsidiary of Federated, for providing services to shareholders and maintaining shareholder accounts. Intermediaries that receive Service Fees may include a company affiliated with management of Federated. If a financial intermediary receives Service Fees on an account, it is not eligible to also receive Account Administration Fees on that same account.
RECORDKEEPING FEES (FEDERATED INSURANCE FUNDS ONLY)
The Federated Insurance Funds may pay Recordkeeping Fees on an average net assets basis or on a per account per year basis to financial intermediaries for providing recordkeeping services to the Federated Insurance Funds and shareholders. If a financial intermediary receives Recordkeeping Fees on an account, it is not eligible to also receive Account Administration Fees or Networking Fees on that same account.
45
NETWORKING FEES (FEDERATED INSURANCE FUNDS ONLY)
The Federated Insurance Funds may reimburse Networking Fees on a per account per year basis to financial intermediaries for providing administrative services to the Federated Insurance Funds and shareholders on certain non-omnibus accounts. If a financial intermediary receives Networking Fees on an account, it is not eligible to also receive Recordkeeping Fees on that same account.
ADDITIONAL PAYMENTS TO FINANCIAL INTERMEDIARIES
EquiTrust Variable Fund
The EquitTrust Variable Portfolios are not sold directly to the general public but instead are offered as underlying investment options for variable insurance contracts. The distributors of these contracts, the insurance companies that issue the contracts and their related companies may pay compensation to broker-dealers and other intermediaries for distribution and other services and may enter into revenue sharing arrangements with certain intermediaries. The source of funds for these payments to intermediaries may be the fees paid by the EquiTrust Variable Fund under its agreements with insurance and related companies for management, distribution and other services. Payments by insurance and related companies to intermediaries may create a conflict of interest by influencing them and their salespersons to recommend such contracts over other investments.
Federated Insurance Funds
FSC may pay out of its own resources amounts (including items of material value) to certain financial intermediaries that support the sale of Shares or provide services to Federated Insurance Fund shareholders. The amounts of these payments could be significant, and may create an incentive for the financial intermediary or its employees or associated persons to recommend or sell Shares of the Federated Insurance Fund to you. In some cases, such payments may be made by or funded from the resources of companies affiliated with the FSC (including FIMCO or FEMCO). These payments are not reflected in the fees and expenses listed in the fee table section of the Federated Insurance Funds’ prospectuses and described above because they are not paid by the Federated Insurance Funds.
These payments are negotiated and may be based on such factors as the number or value of Shares that the financial intermediary sells or may sell; the value of client assets invested; or the type and nature of services or support furnished by the financial intermediary. These payments may be in addition to payments of Rule 12b-1 Fees, Service Fees, Account Administration Fees, Recordkeeping Fees and/ Networking Fees made by the Federated Insurance Funds to the financial intermediary. In connection with these payments, the financial intermediary may elevate the prominence or profile of the Federated Insurance Funds and/or other Federated funds within the financial intermediary’s organization by, for example, placement on a list of preferred or recommended funds, and/or granting FSC preferential or enhanced opportunities to promote the funds in various ways within the financial intermediary’s organization. You can ask your financial intermediary for information about any payments it receives from the FSC or the Federated Insurance Fund and any services provided
PURCHASE, REDEMPTION AND EXCHANGE PROCEDURES; DIVIDENDS AND DISTRIBUTIONS; TAX INFORMATION; FREQUENT TRADING; PORTFOLIO HOLDINGS DISCLOSURE POLICY
EquiTrust serves as the EquiTrust Variable Fund’s dividend disbursing and transfer agent. Services provided by EquiTrust include the issuance, cancellation and transfer of the EquiTrust Variable Portfolios’ shares, and the maintenance of records regarding the ownership of such shares.
Reference is made to the EquiTrust Variable Fund’s Prospectus dated [May 1, 2011], and the Federated Insurance Funds’ Prospectus dated [April 30, 2011], each of which is incorporated herein by reference, for a complete description of the purchase, exchange and redemption procedures applicable to purchases, exchanges, and redemptions of the EquiTrust Variable Portfolios and the Federated Insurance Funds.
46
PURCHASES
There are no minimum initial and subsequent investment amounts for the Federated Insurance Funds or the EquiTrust Variable Portfolios.
REDEMPTIONS AND EXCHANGES
Redemption and exchanges of the Federated Insurance Funds and the EquiTrust Variable Portfolios may be made through an investment professional or directly from a Fund by telephone or by mailing a written request.
DIVIDENDS AND CAPITAL GAINS
The EquiTrust Variable Fund
Money Market Portfolio Distributions: On each day that the NAV per share of Money Market Portfolio is determined, net investment income will be declared, as of the close of the NYSE, as a dividend to shareholders of record prior to the declaration. Dividends are payable monthly.
High Grade Bond and Strategic Yield Portfolio Distributions: On each day that each of these EquiTrust Variable Portfolio’s NAV per share is calculated, that Portfolio’s net investment income will be declared, as of the close of the NYSE, as a dividend to shareholders of record prior to the declaration. Any net short-term and net long-term capital gains will be declared and distributed periodically, but in no event less frequently than annually.
Value Growth, Blue Chip and Managed Portfolio Distributions: Each of these EquiTrust Variable Portfolios normally follows the practice of distributing substantially all net investment income and substantially all net short-term and net long-term capital gains, if any, after the close of the EquiTrust Variable Fund’s fiscal year.
It is the EquiTrust Variable Fund’s intention to distribute substantially all the net investment income, if any, and any realized net capital gains of each EquiTrust Variable Portfolio. All distributions are reinvested in additional shares of the respective EquiTrust Variable Portfolio at NAV. Distributions of net investment income will differ between each share class of an EquiTrust Variable Portfolio due to the differences in distribution and shareholder services fees charged and average net assets of each class.
The Federated Insurance Funds
Federated Prime Money Fund II: Federated Prime Money Fund II declares any dividends daily and pays them monthly to shareholders. If shares are purchased by wire, the shareholder begins earning dividends on the day the wire is received. If shares are purchased by check, the shareholder begins earning dividends on the business day after the Fund receives the check. In either case, shareholders earn dividends through the day a redemption request is received.
Federated Quality Bond Fund II, Federated Capital Income Fund II and Federated Capital Appreciation Fund II: These Federated Insurance Funds declare and pays any dividends annually to shareholders. Dividends are paid to all shareholders invested in the Fund on the record date. The record date is the date on which a shareholder must officially own shares in order to earn a dividend.
FEDERAL INCOME TAX INFORMATION
Because the EquiTrust Variable Fund and the Federated Insurance Funds (each a “Fund”) intend to comply with the ownership restrictions of Treas. Reg. Section 1.817-5(f), Rev. Rul. 81-225, Rev. Rul. 2003-91, and Rev. Rul. 2003-92 (no direct ownership by the public), it is expected that each shareholder that is an insurance company separate account will be treated as owning (as a separate investment) its proportionate share of each asset of any Fund in which it invests, provided that the Fund qualifies as a regulated investment company. Therefore, each Fund intends to meet the additional diversification requirements that are applicable to insurance company separate accounts under Subchapter L of the Code. These requirements generally provide that no more than 55% of the value of the assets of
47
a Fund may be represented by any one investment; no more than 70% by any two investments; no more than 80% by any three investments; and no more than 90% by any four investments. For these purposes, all securities of the same issuer are treated as a single investment and each United States government agency or instrumentality is treated as a separate issuer.
If an EquiTrust Variable Portfolio or Federated Insurance Fund failed to qualify as a regulated investment company, shareholders that are insurance company separate accounts:
| • | | would be treated as owning shares of the Fund (rather than their proportionate share of the assets of such Fund) for purposes of the diversification requirements under Subchapter L of the Code, and as a result, owners of contracts with respect to such accounts might be taxed currently on the investment earnings under their contracts and thereby lose the benefit of tax deferral, and |
| • | | the Fund would incur regular corporate federal income tax on its taxable income for that year and be subject to certain distribution requirements upon requalification. |
In addition, if an EquiTrust Variable Portfolio or Federated Insurance Fund failed to comply with the diversification requirements of the regulations under Subchapter L of the Code, owners of contracts who allocate investments to the Fund might be taxed on the investment earnings under their contracts and thereby lose the benefit of tax deferral. Accordingly, compliance with the above rules is carefully monitored by the Funds’ advisers and subadvisers, as applicable, and it is intended that each Fund will comply with these rules as they exist or as they may be modified from time to time. Compliance with the federal income tax requirements described above may result in a reduction in the return of a Fund, since to comply with the above rules, the investments utilized (and the time at which such investments are entered into and closed out) may be different from what the subadvisers might otherwise believe to be desirable.
Tax-Qualified and Non-Qualified Contracts
Certain of the insurance companies that invest in the EquiTrust Variable Fund and/or the Federated Insurance Funds are taxed as life insurance companies for federal income tax purposes. Under current federal income tax law rules, they include the investment income (exclusive of capital gains) of the separate accounts in their taxable income and take deductions for investment income credited to their “policyholder reserves.” They are also required to capitalize and amortize certain costs instead of deducting those costs when they are incurred. They also claim certain tax credits or deductions relating to foreign taxes paid and dividends received by the Funds. These benefits can be material. They do not pass these benefits through to the separate accounts, principally because: (i) the deductions and credits are allowed to these insurance companies and not the Contractholders under applicable tax law; and (ii) the deductions and credits do not represent investment return on the separate account assets that is passed through to Contractholders.
These insurance companies’ contracts permit them to deduct a charge for any taxes they incur that are attributable to the operation or existence of the contracts or the separate accounts. Currently, to the knowledge of the EquiTrust Variable Fund and the Federated Insurance Funds, these insurance companies do not anticipate making any specific charge for such taxes and state and local premium taxes. If the level of the current taxes increases, however, or is expected to increase in the future, these insurance companies are understood to reserve the right to make a charge in the future.
Holders of variable annuity contracts or variable life insurance policies should consult the prospectuses of their respective contracts or policies for information on the federal income tax consequences to such holders. In addition, variable contract owners may wish to consult with their own tax advisors as to the tax consequences of investments in an EquiTrust Variable Portfolio or a Federated Insurance Fund, including the application of state and local taxes.
Foreign Investments
When investing in foreign securities or currencies, an EquiTrust Variable Portfolio or Federated Insurance Fund may incur withholding or other taxes levied by foreign governments. Foreign tax withholding from dividends and
48
interest, if any, is generally imposed at a rate between 10% and 35%. The investment yield of any Fund that invests in foreign securities or currencies will be reduced by these foreign taxes. The foreign tax credit, if any, allowable with respect to such foreign taxes will not benefit owners of variable annuity or variable life insurance contracts who allocate investments to a Fund.
Tax Implications for Insurance Contracts With Investments Allocated to an EquiTrust Variable Portfolio or Federated Insurance Fund
For information regarding the tax implications for the purchaser of a variable annuity or life insurance contract who allocates investments to an EquiTrust Variable Portfolio or Federated Insurance Fund, please refer to the prospectus for the contract.
The foregoing is a general and abbreviated summary of the applicable provisions of the Code and Treasury Regulations currently in effect. It is not intended to be a complete explanation or a substitute for consultation with individual tax advisors. The Code and Regulations are subject to change, possibly with retroactive effect. See the EquiTrust Variable Portfolio or Federated Insurance Fund SAI for additional information on federal income taxes.
FREQUENT TRADING
Frequent or short-term trading into and out of the EquiTrust Variable Portfolios and the Federated Insurance Funds can have adverse consequences for the Funds and shareholders who use the Funds as a long-term investment vehicle. Such trading in significant amounts can disrupt the Funds’ investment strategies (e.g., by requiring them to sell investments at inopportune times or maintain excessive short-term or cash positions to support redemptions), increase brokerage and administrative costs and affect the timing and amount of taxable distributions by the Funds. Investors engaged in such trading may also seek to profit by anticipating changes in a Fund’s NAV in advance of the time as of which NAV is calculated.
Both the EquiTrust Variable Fund Board and the Federated Insurance Funds Board have approved policies and procedures intended to discourage excessive frequent or short-term trading of Fund shares. These policies and procedures are similar for both the EquiTrust Variable Fund and the Federated Insurance Funds and are described in the prospectuses for the EquiTrust Variable Fund and the Federated Insurance Funds and are incorporated herein by reference into and, in the case of the Federated Insurance Funds, accompanying, this Prospectus/Proxy Statement.
PORTFOLIO HOLDINGS DISCLOSURE POLICIES
The SAI for each of the Federated Insurance Funds and the EquiTrust Variable Fund contains a description of the Funds’ policies and procedures with respect to the disclosure of their portfolio securities. The Federated Insurance Funds’ SAI is available on Federated Insurance Funds’ website, FederatedInvestors.com. The EquiTrust Variable Fund’s SAI is available on EquiTrust Variable Portfolios’ website, www.fbfs.com.
DESCRIPTION OF SHARE CLASSES AND CALCULATION OF NET ASSET VALUE
DESCRIPTION OF FEDERATED INSURANCE FUND SHARE CLASSES AND CALCULATION OF NET ASSET VALUE
Description of Federated Insurance Fund Share Classes
Shares of Federated Prime Money Fund II can be purchased or redeemed by participating insurance companies any day the New York Stock Exchange (the “NYSE”) is open. The Fund attempts to stabilize the NAV of its shares at $1.00 by valuing the portfolio securities using the amortized cost method.
Primary Shares of Federated Quality Bond Fund II, Federated Capital Appreciation Fund II and shares of Federated Capital Income Fund II can be purchased at NAV any day the NYSE is open. Each of these Funds calculates its NAV by valuing its assets, subtracting its liabilities and dividing the balance by the number of shares outstanding.
49
Shares of the Federated Insurance Funds are used solely as the investment vehicle for separate accounts of participating insurance companies offering variable annuity contracts and variable life insurance policies. The general public has access to the Federated Insurance Funds only by purchasing a variable annuity contract or variable life insurance policy (thus becoming a contract owner). Shares are not sold directly to the general public.
Purchases of shares of the Federated Insurance Funds may be made any day the NYSE is open. Purchase orders for all Federated Insurance Funds are affected at the offering price next calculated after receipt of the order.
Federated Insurance Funds’ Calculation of NAV
Federated Prime Money Fund II. The Board has decided that the best method for determining the value of portfolio instruments is amortized cost. Under the amortized cost valuation method, an investment is valued initially at its cost as determined in accordance with generally accepted accounting principles in the United States (GAAP). The Fund then adjusts the amount of interest income accrued each day over the term of the investment to account for any difference between the initial cost of their investment and the amount payable at its maturity. If the amount payable at maturity exceeds the initial cost (a discount) then the daily accrual is increased; if the initial cost exceeds the amount payable at maturity (a premium), then the daily accrual is decreased. The Fund adds the amount of the increase to (in the case of a discount), or subtracts the amount of the decrease from (in the case of a premium), the investment’s cost each day. The Fund uses this adjusted cost to value the investment.
Accordingly, neither the amount of daily income nor the NAV is affected by any unrealized appreciation or depreciation of the portfolio. In periods of declining interest rates, the indicated daily yield on shares of Federated Prime Money Fund II computed by dividing the annualized daily income on the Fund’s portfolio by the NAV computed as above may tend to be higher than a similar computation made by using a method of valuation based upon market prices and estimates. In periods of rising interest rates, the opposite may be true.
Federated Prime Money Fund II’s use of the amortized cost method of valuing portfolio instruments depends on its compliance with certain conditions in Rule 2a-7. Under Rule 2a-7, the Board must establish procedures reasonably designed to stabilize the NAV per share, as computed for purposes of distribution and redemption, at $1.00 per share, taking into account current market conditions and the Fund’s investment objective. The procedures include monitoring the relationship between the amortized cost value per share and the NAV per share based upon available indications of market value. The Board will decide what, if any, steps should be taken if there is a difference of more than 0.5 of 1% between the two values. The Board will take any steps it considers appropriate (such as redemption in-kind or shortening the average portfolio maturity) to minimize any material dilution or other unfair results arising from differences between the two methods of determining NAV.
Federated Quality Bond Fund II, Federated Capital Income Fund II and Federated Capital Appreciation Fund II. A share’s NAV is determined as of the end of regular trading on the NYSE (normally 4:00 p.m. Eastern time) each day the NYSE is open. Each of these Federated Insurance Funds calculates the NAV of each class by valuing the assets allocated to the share’s class, subtracting the liabilities allocated to the class and dividing the balance by the number of shares of the class outstanding. The NAV for each class of shares may differ due to the variance in daily net income realized by each class. Such variance will reflect only accrued net income to which the shareholders of a particular class are entitled. The NAV is calculated to the nearest whole cent per share.
In calculating its NAV, each of these Federated Insurance Funds generally values investments as follows:
| | • | | Equity securities listed on a U.S. securities exchange or traded through the U.S. national market system are valued at their last reported sale price or official closing price in their principal exchange or market. If a price is not readily available, such equity securities are valued based upon the mean of closing bid and asked quotations from one or more dealers. |
| | • | | Other equity securities traded primarily in the United States are valued based upon the mean of closing bid and asked quotations from one or more dealers. |
50
| | • | | Equity securities traded primarily through securities exchanges and regulated market systems outside the United States are valued at their last reported sale price or official closing price in their principal exchange or market. These prices may be adjusted for significant events occurring after the closing of such exchanges or market systems as described below. If a price is not readily available, such equity securities are valued based upon the mean of closing bid and asked quotations from one or more dealers. |
| | • | | Fixed-income securities and repurchase agreements acquired with remaining maturities of greater than 60 days are fair valued using price evaluations provided by a pricing service approved by the Board. The methods used by pricing services to determine such price evaluations are described below. If a price evaluation is not readily available, such fixed-income securities are fair valued based upon price evaluations from one or more dealers. |
| | • | | Fixed-income securities and repurchase agreements acquired with remaining maturities of 60 days or less are valued at their amortized cost as described below. |
| | • | | Futures contracts listed on exchanges are valued at their reported settlement price. Option contracts listed on exchanges are valued based upon the mean of closing bid and asked quotations reported by the exchange or from one or more futures commission merchants. |
| | • | | OTC derivative contracts are fair valued using price evaluations provided by various pricing services approved by the Board. The methods used by pricing services to determine such price evaluations are described below. If a price evaluation is not readily available, such derivative contracts are fair valued based upon price evaluations from one or more dealers or using a recognized pricing model for the contract. |
| | • | | Shares of other mutual funds are valued based upon their reported NAVs. The prospectuses for these mutual funds explain the circumstances under which they will use fair value pricing and the effects of using fair value pricing. |
If any price, quotation, price evaluation or other pricing source is not readily available when the NAV is calculated, the Federated Insurance Funds use the fair value of the investment determined in accordance with the procedures described below.
There can be no assurance that the Federated Insurance Funds could purchase or sell an investment at the price used to calculate the Federated Insurance Funds’ NAVs. The Federated Insurance Funds will not use a pricing service or dealer who is an affiliated person of the Funds’ investment advisers to value investments.
Noninvestment assets and liabilities are valued in accordance with Generally Accepted Accounting Principles (GAAP). The NAV calculation includes expenses, dividend income, interest income and other income through the date of the calculation. Changes in holdings of investments and in the number of outstanding Shares are included in the calculation not later than the first business day following such change. Any assets or liabilities denominated in foreign currencies are converted into U.S. dollars using an exchange rate obtained from one or more currency dealers.
Each Federated Insurance Fund follows procedures that are common in the mutual fund industry regarding errors made in the calculation of its NAV. This means that, generally, each Federated Insurance Fund will not correct errors of less than one cent per share or errors that did not result in net dilution to the Federated Insurance Fund.
Amortized Cost Values
Under the amortized cost valuation method, an investment is valued initially at its cost as determined in accordance with GAAP.
51
Each Federated Insurance Fund then adjusts the amount of interest income accrued each day over the term of the investment to account for any difference between the initial cost of the investment and the amount payable at its maturity. If the amount payable at maturity exceeds the initial cost (a discount), then the daily accrual is increased; if the initial cost exceeds the amount payable at maturity (a premium), then the daily accrual is decreased. Each Federated Insurance Fund adds the amount of the increase to (in the case of a discount), or subtracts the amount of the decrease from (in the case of a premium), the investment’s cost each day. Each Federated Insurance Fund uses this adjusted cost to value the investment.
Fair Valuation and Significant Events Procedures
The Board has ultimate responsibility for determining the fair value of investments for which market quotations are not readily available. The Board of the Federated Insurance Funds has appointed a Valuation Committee comprised of officers of the Funds and of FIMCO or FEMCO to assist in this responsibility and in overseeing the calculation of the NAV. The Board has also authorized the use of pricing services recommended by the Valuation Committee to provide price evaluations of the current fair value of certain investments for purposes of calculating the NAV.
Pricing Service Valuations. Based on the recommendations of the Valuation Committee, the Board has authorized each Federated Insurance Fund to use pricing services that provide daily fair value evaluations of the current value of certain investments, primarily fixed-income securities and OTC derivative contracts. Different pricing services may provide different price evaluations for the same security because of differences in their methods of evaluating market values. Factors considered by pricing services in evaluating an investment include the yields or prices of investments of comparable quality, coupon, maturity, call rights and other potential prepayments, terms and type, reported transactions, indications as to values from dealers and general market conditions. A pricing service may find it more difficult to apply these and other factors to relatively illiquid or volatile investments, which may result in less frequent or more significant changes in the price evaluations of these investments. If a pricing service determines that it does not have sufficient information to use its standard methodology, it may evaluate an investment based on the present value of what investors can reasonably expect to receive from the issuer’s operations or liquidation. Some pricing services provide a single price evaluation reflecting the bid-side of the market for an investment (a “bid” evaluation). Other pricing services offer both bid evaluations and price evaluations indicative of a price between the prices bid and asked for the investment (a “mid” evaluation). Each Federated Insurance Fund normally uses bid evaluations for U.S. Treasury and Agency securities, mortgage-backed securities and municipal securities. The Federated Insurance Funds normally use mid evaluations for other types of fixed-income securities and OTC derivative contracts.
Fair Valuation Procedures. The Board has established procedures for determining the fair value of investments for which price evaluations from pricing services or dealers and market quotations are not readily available. The procedures define an investment’s “fair value” as the price that a Federated Insurance Fund might reasonably expect to receive upon its current sale. The procedures assume that any sale would be made to a willing buyer in the ordinary course of trading. The procedures require consideration of factors that vary based on the type of investment and the information available. Factors that may be considered in determining an investment’s fair value include: (1) the last reported price at which the investment was traded; (2) information provided by dealers or investment analysts regarding the investment or the issuer; (3) changes in financial conditions and business prospects disclosed in the issuer’s financial statements and other reports; (4) publicly announced transactions (such as tender offers and mergers) involving the issuer; (5) comparisons to other investments or to financial indices that are correlated to the investment; (6) with respect to fixed-income investments, changes in market yields and spreads; (7) with respect to investments that have been suspended from trading, the circumstances leading to the suspension; and (8) other factors that might affect the investment’s value.
The Valuation Committee is responsible for the day-to-day implementation of these procedures. The Valuation Committee may also authorize the use of a financial valuation model to determine the fair value of a specific type of investment. The Board periodically reviews and approves the fair valuations made by the Valuation Committee and any changes made to the procedures. Using fair value to price investments may result in a value that is different from an investment’s most recent closing price and from the prices used by other mutual funds to calculate their NAVs. The fair value of an investment will generally remain unchanged in the absence of new information relating to the investment or its issuer, such as changes in the issuer’s business or financial results, or relating to external market factors, such as trends in the market values of comparable securities. This may result in less frequent, and
52
larger, changes in fair value prices as compared to prices based on market quotations or price evaluations from pricing services or dealers.
Significant Events. The Board has adopted procedures requiring an investment to be priced at its fair value whenever the Funds’ adviser determines that a significant event affecting the value of the investment has occurred between the time as of which the price of the investment would otherwise be determined and the time as of which the NAV is computed. An event is considered significant if there is both an affirmative expectation that the investment’s value will change in response to the event and a reasonable basis for quantifying the resulting change in value. Examples of significant events that may occur after the close of the principal market on which a security is traded, or the time of a price evaluation provided by a pricing service or a dealer, include:
| | • | | With respect to securities traded principally in foreign markets, significant trends in U.S. equity markets or in the trading of foreign securities index futures or options contracts; |
| | • | | With respect to price evaluations of fixed-income securities determined before the close of regular trading on the NYSE, actions by the Federal Reserve Open Market Committee and other significant trends in U.S. fixed-income markets; |
| | • | | Political or other developments affecting the economy or markets in which an issuer conducts its operations or its securities are traded; and |
| | • | | Announcements concerning matters such as acquisitions, recapitalizations or litigation developments, or a natural disaster affecting the issuer’s operations or regulatory changes or market developments affecting the issuer’s industry. |
The Valuation Committee uses a pricing service to determine the fair value of equity securities traded principally in foreign markets when the Funds’ adviser determines that there has been a significant trend in the U.S. equity markets or in index futures trading.
The pricing service uses models that correlate changes between the closing and opening price of equity securities traded primarily in non-U.S. markets to changes in prices in U.S.-traded securities and derivative contracts. The pricing service seeks to employ the model that provides the most significant correlation based on a periodic review of the results. The model uses the correlation to adjust the reported closing price of a foreign equity security based on information available up to the close of the NYSE.
For other significant events, the Federated Insurance Funds may seek to obtain more current quotations or price evaluations from alternative pricing sources. If a reliable alternative pricing source is not available, the fair value of the investment is determined using the methods discussed above in “Fair Valuation Procedures.” The Board has ultimate responsibility for any fair valuations made in response to a significant event.
DESCRIPTION OF EQUITRUST VARIABLE PORTFOLIOS’ SHARE CLASSES AND CALCULATION OF NET ASSET VALUE
Description of the EquiTrust Variable Portfolios’ Share Classes
Each EquiTrust Variable Portfolio offers two classes of shares, Initial Class Shares and Service Class Shares. Each share class represents investments in the same portfolio of securities. Service Class Shares are subject to a 0.25% Rule 12b-1 distribution and shareholder services fee.
Initial Class Shares and Service Class Shares of the EquiTrust Variable Portfolios are sold at NAV, with no sales charge. Other than shares sold to Farm Bureau Life Insurance Company to seed the EquiTrust Variable Portfolios, shares of the EquiTrust Variable Portfolios are offered only to separate accounts of certain life insurance companies (“Participating Insurance Companies”) to fund variable annuity contracts (“VA contracts”) and variable life insurance policies (“VLI policies”) issued by such life insurance companies.
53
The EquiTrust Variable Fund has entered into an agreement with each Participating Insurance Company (a “participation agreement”) setting forth the terms and conditions pursuant to which the insurer will purchase and redeem shares of the EquiTrust Variable Portfolios.
Individual VA Contractholders and VLI policyowners are not “shareholders” of the EquiTrust Variable Portfolios. Rather, the Participating Insurance Companies and their separate accounts are the shareholders, although such companies pass through voting rights to their VA Contractholders and VLI policyowners. The interest of a Contractholder or policyowner in the EquiTrust Variable Portfolios is described in his or her VA contract or VLI policy and in the current prospectus for such contract or policy.
Calculation of Net Asset Value
The NAV per share of each class of each EquiTrust Variable Portfolio is determined as of the earlier of 3:00 p.m. (Central time) or the close of regular trading on the NYSE, on each day that (i) the NYSE is open for business, and (ii) an order for purchase or redemption of shares of the Portfolio is received. The NAV per share of each class of each Portfolio is computed by dividing the total value of the Portfolio’s securities and other assets, less liabilities attributable to the class, by the total number of outstanding shares of the class of such Portfolio.
The EquiTrust Variable Fund reserves the right to calculate or estimate the NAV more frequently than once daily if deemed desirable. If the EquiTrust Variable Fund’s offices should be closed because of a weather-related or comparable type of emergency and an EquiTrust Variable Portfolio is unable to segregate orders and redemption requests received on that day, the EquiTrust Variable Fund will price those orders and redemptions at the NAV next determined for each class of such Portfolio.
Money Market Portfolio. Money Market Portfolio’s securities are valued using the amortized cost method of valuation. This involves valuing a security at cost on the date of acquisition and thereafter assuming a constant accretion of a discount or amortization of a premium to maturity. The NAV per share of each class of the Portfolio is computed by dividing the total value of its securities and other assets, less liabilities attributable to the class (including dividends payable), by the number of shares of the class outstanding. The assets are determined by valuing the portfolio securities at amortized cost, pursuant to Rule 2a-7 under the 1940 Act. The amortized cost method of valuation involves valuing a security at cost at the time of purchase and thereafter assuming a constant amortization to maturity of any discount or premium, regardless of the impact of fluctuating interest rates on the market value of the instrument.
The purpose of the amortized cost method of valuation is to attempt to maintain a constant NAV per share of $1.00. While this method provides certainty in valuation, it may result in periods during which value, as determined by amortized cost, is higher or lower than the price Money Market Portfolio would receive if it sold its portfolio securities. Under the direction of the Board of Trustees, certain procedures have been adopted to monitor and stabilize the price per share. Calculations are made to compare the value of the portfolio securities, valued at amortized cost, with market-based values. Market valuations are obtained by using actual quotations provided by market makers, estimates of market value (provided the Board has reviewed and approved the method of making such estimates), or values obtained from yield data relating to classes of money market instruments published by reputable sources at the mean between the bid and asked prices for those instruments. If a deviation of 1/2 of 1% or more between the Portfolio’s $1.00 per share NAV and the NAV calculated by reference to market based valuations were to occur, or if there were other deviations which the Board believed would result in dilution or other unfair results material to shareholders, the Board would consider what action, if any, should be initiated.
The market value of debt securities usually reflects yields generally available on securities of similar quality. When yields decline, the market value of a fund holding higher yielding securities can be expected to increase; when yields increase, the market value of a fund invested at lower yields can be expected to decline. In addition, if Money Market Portfolio has net redemptions at a time when interest rates have increased, it may be forced to sell portfolio securities prior to maturity at a price below the Portfolio’s carrying value. Also, because the Portfolio generally will be valued at amortized cost rather than market value, any yield quoted may be different from the yield that would result if all of the holdings of the Portfolio were valued at market value, since the amortized cost method does not take market fluctuation into consideration.
54
High Grade Bond Portfolio, Managed Portfolio, Strategic Yield Portfolio, Value Growth Portfolio and Blue Chip Portfolio. The NAV per share of each class of these EquiTrust Variable Portfolios is computed by dividing the total value of each such Portfolio’s securities and other assets, less liabilities attributable to the class, by the number of shares of the class of such Portfolio then outstanding. Securities traded on a national exchange are valued at the last sale price as of the close of business on the day the securities are being valued, or, lacking any sales, at the mean between closing bid and asked prices. Securities other than money market instruments traded in the over-the-counter market are valued at the mean between closing bid and asked prices or at yield equivalent as obtained from one or more dealers that make markets in the securities. Securities traded both in the over-the-counter market and on a national exchange are valued according to the broadest and most representative market, and it is expected that for debt securities this ordinarily will be the over-the-counter market. Money market instruments are valued at market value, except that debt instruments maturing in 60 days or less are valued using the amortized cost method of valuation.
The proceeds received by each EquiTrust Variable Portfolio for each issue or sale of its shares, and all income, earnings, profits and proceeds thereof, subject only to the rights of creditors, are allocated specifically to such Portfolio, and constitute the underlying assets of such Portfolio. The underlying assets of each EquiTrust Variable Portfolio are segregated on the EquiTrust Variable Fund’s books of account, and are charged with the liabilities of such Portfolio and with a share of the Portfolio’s general liabilities. Expenses with respect to any two or more EquiTrust Variable Portfolios are allocated in proportion to the net assets of the respective Portfolios except where allocations of direct expenses can otherwise be fairly made.
In certain cases, events that occur after certain markets have closed may render prices unreliable. Such events may include circumstances in which the value of the U.S. markets changes by a percentage deemed significant. When the EquiTrust Variable Fund’s investment adviser believes that a market price does not reflect a security’s true value, the relevant EquiTrust Variable Portfolio may substitute a fair value estimate through procedures established by, or under the direction of, the EquiTrust Variable Fund Board. An EquiTrust Variable Portfolio also may use these procedures to value securities that do not have a readily available current market value. Using fair value methods to price securities may result in a value that is different from the prices used by other mutual funds to calculate their NAVs. Each EquiTrust Variable Portfolio is subject to the risk that it has valued certain securities at a higher price than it can sell them.
INFORMATION ABOUT THE REORGANIZATIONS
DESCRIPTION OF THE AGREEMENTS AND PLANS OF REORGANIZATION
Each Plan provides for the Reorganization Closing Date, which is expected to be on or about [July 15], 2011. On the Closing Date, all of the assets (except for deferred or prepaid expenses, which are not expected to be material in amount) of each EquiTrust Variable Portfolio will be transferred to the corresponding Federated Insurance Fund. In exchange for these assets, each Federated Insurance Fund will simultaneously issue to the corresponding EquiTrust Variable Portfolio a number of full and fractional Primary Shares or undesignated shares of beneficial interest of the Federated Insurance Fund equal in value to the aggregate NAV of the corresponding Initial Class Shares and Service Class Shares of the EquiTrust Variable Portfolio, calculated as of 4:00 p.m., Eastern time (the “Closing Time”) on the Closing Date.
The value of each EquiTrust Variable Portfolio’s assets to be acquired by the corresponding Federated Insurance Fund shall be the value of such assets at the Closing Date of the Reorganizations using the valuation procedures set forth in the Federated Insurance Funds’ Declaration of Trust and its current Prospectus and SAI, or such other valuation procedures as the EquiTrust Variable Fund and the Federated Insurance Funds shall mutually agree. There are no material differences between the valuation procedures of the EquiTrust Variable Fund and the Federated Insurance Funds. Consequently, it is not anticipated that use of Federated Insurance Funds’ valuation procedures will result in a material revaluation of the EquiTrust Variable Fund’s assets at the time of the Reorganizations. Please see “Description of Share Classes and Calculation of Net Asset Value” above for more information regarding the Federated Insurance Funds and the EquiTrust Variable Fund’s NAV calculation policies and procedures.
55
Prior to the Reorganizations, each EquiTrust Variable Portfolio will discharge all of its liabilities and obligations as provided in the Plans. Following the transfer of its assets in exchange for Primary Shares or undesignated shares of beneficial interest of the applicable Federated Insurance Fund, each corresponding EquiTrust Variable Portfolio will distribute the Primary Shares or undesignated shares of beneficial interest of the Federated Insurance Fund pro rata to shareholders of record of the EquiTrust Variable Portfolio in complete liquidation of the EquiTrust Variable Portfolio. Shareholders of an EquiTrust Variable Portfolio owning shares on the Closing Date will receive that number of Primary Shares or undesignated shares of beneficial interest of the corresponding Federated Insurance Fund which have the same aggregate value as the shareholder held in the EquiTrust Variable Portfolio immediately before the Reorganizations. This distribution will be accomplished by the establishment of accounts in the names of the EquiTrust Variable Fund’s shareholders on the share records of the Federated Insurance Funds’ transfer agent. The Federated Insurance Funds do not issue share certificates to shareholders. Following the consummation of the Reorganizations, the EquiTrust Variable Fund will terminate its existence. The transfer of shareholder accounts from the EquiTrust Variable Portfolios to the Federated Insurance Funds will occur automatically. It is not necessary for the EquiTrust Variable Fund’s shareholders to take any action to effect the transfer.
Each Plan contains customary representations, warranties and conditions. Each Plan provides that the consummation of the Reorganization is conditioned upon, among other things: (i) approval of the Reorganization by the relevant EquiTrust Variable Portfolio’s shareholders; and (ii) the receipt by the EquiTrust Variable Fund and Federated Insurance Trust of an opinion to the effect that the Reorganization will be tax-free to the EquiTrust Variable Portfolio, its shareholders and the Federated Insurance Fund. One or more of the Plans may be terminated if, prior to the Closing Time, any of the required conditions have not been met, the representations and warranties are not true or the Board of either Fund determines that the Reorganization is not in the best interest of the shareholders of the EquiTrust Variable Fund or the Federated Insurance Funds, respectively.
All fees and expenses incurred directly in connection with the consummation of the Reorganizations and the transactions contemplated by the Plans will be borne by the investment advisers to the Federated Insurance Funds and the EquiTrust Variable Fund or their affiliates, as agreed separately among them. Reorganization expenses include, without limitation: (a) expenses associated with the preparation and filing of this Prospectus/Proxy Statement; (b) postage; (c) printing; (d) accounting fees; (e) legal fees incurred by each Fund; (f) solicitation costs of the transaction; (g) fees and expenses incurred by the EquiTrust Variable Fund’s Trustees in connection with any special Board meetings held in contemplation of the Reorganizations; (h) tail insurance coverage for the EquiTrust Variable Fund’s Trustees; and (i) other related administrative or operational costs. Notwithstanding the foregoing, fees and expenses shall in any event be paid by the party directly incurring such fees and expenses if and to the extent that the payment of such fees and expenses by the investment advisers to the Federated Insurance Funds or the EquiTrust Variable Portfolios or their affiliates would result in disqualification of such party as a regulated investment company within the meaning of Section 851 of the Code. Any brokerage charges associated with the purchase or disposition of portfolio securities by the EquiTrust Variable Portfolios prior to the Reorganizations will be borne by the EquiTrust Variable Fund.
The foregoing brief summary of the Plans is qualified in its entirely by the terms and provisions of the Plans, forms of which are attached hereto as Annex A-1 and Annex A-2 and incorporated herein by reference.
DESCRIPTION OF THE FEDERATED INSURANCE FUNDS SHARE CLASSES AND CAPITALIZATION
Primary Shares and undesignated shares of beneficial interest of the Federated Insurance Funds to be issued to shareholders of the EquiTrust Variable Portfolios under the Plans will be fully paid and non-assessable when issued, transferable without restriction and will have no preemptive or conversion rights. Reference is hereby made to the prospectus of the Primary Shares and undesignated shares of beneficial interest of the Federated Insurance Funds provided herewith for additional information about Primary Shares and undesignated shares of beneficial interest of the Federated Insurance Funds.
56
The following table sets forth the unaudited capitalization of Money Market Portfolio into Federated Prime Money Fund II as of March 15, 2011.
| | | | | | | | | | | | |
Fund | | | Total Net Assets | | | | Shares Outstanding | | |
| Net Asset Value
Per Share |
|
Money Market Portfolio- | | | | | | | | | | | | |
| | | | |
Initial Class Shares | | | $9,061,369 | | | | 9,061,369 | | | | $1.00 | |
Net Asset Adjustments1 | | | ($792) | | | | | | | | | |
Share Adjustments1 | | | | | | | (792) | | | | | |
Service Class Shares | | | $601,031 | | | | 601,031 | | | | $1.0 | |
Net Asset Adjustments1 | | | ($52) | | | | | | | | | |
Share Adjustments1 | | | | | | | (52) | | | | | |
| | | | |
Federated Prime Money Fund II | | | $201,416,636 | | | | 201,417,929 | | | | $1.00 | |
Federated Prime Money Fund II, Pro Forma Combined | | | $211,078,192 | | | | 211,079,485 | | | | $1.00 | |
| 1 | Adjustment to reflect elimination of prepaid expenses, which would not transfer into the Federated fund after the Reorganization. |
The following table sets forth the unaudited capitalization of High Grade Bond Portfolio into Federated Quality Bond Fund II as of March 15, 2011.
| | | | | | | | | | | | |
Fund | | | Total Net Assets | | | | Shares Outstanding | | |
| Net Asset Value
Per Share |
|
High Grade Bond Portfolio- | | | | | | | | | | | | |
| | | | |
Initial Class Shares | | | $44,770,732 | | | | 4,259,822 | | | | $10.51 | |
Net Asset Adjustments1 | | | ($3,810) | | | | | | | | | |
Share Adjustments2 | | | | | | | (449,871 | ) | | | | |
Service Class Shares | | | $13,703,507 | | | | 1,303,890 | | | | $10.51 | |
Net Asset Adjustments1 | | | ($1,166) | | | | | | | | | |
Share Adjustments2 | | | | | | | (137,733 | ) | | | | |
| | | | |
Federated Quality Bond Fund II – Primary Shares | | | $206,481,583 | | | | 17,578,807 | | | | $11.75 | |
Federated Quality Bond Fund II, Pro Forma Combined-Primary Shares3 | | | $264,950,846 | | | | 22,554,915 | | | | $11.75 | |
1 Adjustment to reflect elimination of prepaid expenses, which would not transfer into the Federated Fund after the Reorganization.
2 Adjustment as a result of the combination to reflect the conversion of shares of High Grade Bond Portfolio to shares of Federated Quality Bond Fund II Primary Shares based on the net asset value of Federated Quality Bond Fund II Primary Shares.
3 Does not reflect additional $62,107,278 of assets of Federated Quality Bond Fund II represented by another share class.
57
The following table sets forth the unaudited capitalization of Strategic Yield Portfolio into Federated Quality Bond Fund II as of March 15, 2011.
| | | | | | |
Fund | | Total Net Assets | | Shares Outstanding | | Net Asset Value Per Share |
Strategic Yield Portfolio- | | | | | | |
| | | | |
Initial Class Shares | | $40,295,120 | | 4,323,077 | | $9.32 |
Net Asset Adjustments1 | | ($3,414) | | | | |
Share Adjustments2 | | | | (893,996) | | |
Service Class Shares | | $1,121,627 | | 120,324 | | $9.32 |
Net Asset Adjustments1 | | ($95) | | | | |
Share Adjustments2 | | | | (24,874) | | |
| | | | |
Federated Quality Bond Fund II - Primary Shares | | $206,481,583 | | 17,578,807 | | $11.75 |
| Federated Quality Bond Fund II, Pro Forma Combined-Primary Shares3 | | $247,894,821 | | 21,103,338 | | $11.75 |
1 Adjustment to reflect elimination of prepaid expenses, which would not transfer into the Federated Fund after the Reorganization.
2 Adjustment as a result of the combination to reflect the conversion of shares of Strategic Yield Portfolio to shares of Federated Quality Bond Fund II Primary Shares based on the net asset value of Federated Quality Bond Fund II Primary Shares.
3 Does not reflect additional $62,107,278 of assets of Federated Quality Bond Fund II represented by another share class.
The following table sets forth the unaudited capitalization of High Grade Bond and Strategic Yield Portfolios into Federated Quality Bond Fund II as of March 15, 2011.
| | | | | | |
| Fund | | Total Net Assets | | Shares Outstanding | | Net Asset Value Per Share |
High Grade Bond Portfolio- | | | | | | |
| | | | |
Initial Class Shares | | $44,770,732 | | 4,259,822 | | $10.51 |
Net Asset Adjustments1 | | ($3,810) | | | | |
Share Adjustments2 | | | | (449,871) | | |
Service Class Shares | | $13,703,507 | | 1,303,890 | | $10.51 |
Net Asset Adjustments1 | | ($1,166) | | | | |
Share Adjustments2 | | | | (137,733) | | |
Strategic Yield Portfolio- | | | | | | |
| | | | |
Initial Class Shares | | $40,295,120 | | 4,323,077 | | $9.32 |
Net Asset Adjustments1 | | ($3,414) | | | | |
Share Adjustments2 | | | | (893,996) | | |
Service Class Shares | | $1,121,627 | | 120,324 | | $9.32 |
Net Asset Adjustments1 | | ($95) | | | | |
Share Adjustments2 | | | | (24,874) | | |
| | | $206,481,583 | | 17,578,807 | | $11.75 |
Federated Quality Bond Fund II – Primary Shares | | | | | | |
| Federated Quality Bond Fund II, Pro Forma Combined-Primary Shares3 | | $306,364,084 | | 26,079,446 | | $11.75 |
58
1 Adjustment to reflect elimination of prepaid expenses, which would not transfer into the Federated Fund after the Reorganization.
2 Adjustment as a result of the combination to reflect the conversion of shares of High Grade Bond and Strategic Yield Portfolios to shares of Federated Quality Bond Fund II Primary Shares based on the net asset value of Federated Quality Bond Fund II Primary Shares.
3 Does not reflect additional $62,107,278 of assets of Federated Quality Bond Fund II represented by another share class.
The following table sets forth the unaudited capitalization of Managed Portfolio into Federated Capital Income Fund II as of March 15, 2011.
| | | | | | |
| Fund | | Total Net Assets | | Shares Outstanding | | Net Asset Value Per Share |
Managed Portfolio- | | | | | | |
| | | | |
Initial Class Shares | | $78,660,056 | | 5,252,644 | | $14.98 |
Net Asset Adjustments1 | | ($6,985) | | | | |
Share Adjustments2 | | | | 3,232,045 | | |
Service Class Shares | | $1,650,854 | | 106,138 | | $15.55 |
Net Asset Adjustments1 | | ($147) | | | | |
Share Adjustments2 | | | | 71,932 | | |
| | | | |
Federated Capital Income Fund II | | $53,874,744 | | 5,811,620 | | $9.27 |
| Federated Capital Income Fund II, Pro Forma Combined | | $134,178,522 | | 14,474,379 | | $9.27 |
1 Adjustment to reflect elimination of prepaid expenses, which would not transfer into the Federated fund after the Reorganization.
2 Adjustment as a result of the combination to reflect the conversion of shares of Managed Portfolio to shares of Federated Capital Income Fund II based on the net asset value of Federated Capital Income Fund II.
The following table sets forth the unaudited capitalization of Value Growth Portfolio into Federated Capital Appreciation Fund II as of March 15, 2011.
| | | | | | |
| Fund | | Total Net Assets | | Shares Outstanding | | Net Asset Value Per Share |
Value Growth Portfolio- | | | | | | |
| | | | |
Initial Class Shares | | $54,953,645 | | 4,006,878 | | $13.71 |
Net Asset Adjustments1 | | ($4,898) | | | | |
Share Adjustments2 | | | | 4,632,862 | | |
Service Class Shares | | $742,280 | | 52,901 | | $14.03 |
Net Asset Adjustments1 | | ($66) | | | | |
Share Adjustments2 | | | | 63,799 | | |
| | | | |
Federated Capital Appreciation Fund II – Primary Shares | | $68,979,669 | | 10,850,830 | | $6.36 |
| Federated Capital Appreciation Fund II, Pro Forma Combined- Primary Shares3 | | $124,670,630 | | 19,607,270 | | $6.36 |
59
1 Adjustment to reflect elimination of prepaid expenses, which would not transfer into the Federated fund after the Reorganization.
2 Adjustment as a result of the combination to reflect the conversion of shares of Value Growth Portfolio to shares of Federated Capital Income Fund II Primary Shares based on the net asset value of Federated Capital Income Fund II Primary Shares.
3 Does not reflect additional $6,880,067 of assets of Federated Capital Appreciation Fund II represented by another share class.
The following table sets forth the unaudited capitalization of Blue Chip Portfolio into Federated Capital Appreciation Fund II as of March 15, 2011.
| | | | | | |
| Fund | | Total Net Assets | | Shares Outstanding | | Net Asset Value Per Share |
Blue Chip Portfolio- | | | | | | |
| | | | |
Initial Class Shares | | $72,123,117 | | 2,025,909 | | $35.60 |
Net Asset Adjustments1 | | ($6,469) | | | | |
Share Adjustments2 | | | | 9,313,187 | | |
Service Class Shares | | $3,903,250 | | 105,332 | | $37.06 |
Net Asset Adjustments1 | | ($350) | | | | |
Share Adjustments2 | | | | 508,332 | | |
| | | | |
Federated Capital Appreciation Fund II – Primary Shares | | $68,979,669 | | 10,850,830 | | $6.36 |
| Federated Capital Appreciation Fund II, Pro Forma Combined- Primary Shares3 | | $144,999,217 | | 22,803,590 | | $6.36 |
1 Adjustment to reflect elimination of prepaid expenses, which would not transfer into the Federated fund after the Reorganization.
2 Adjustment as a result of the combination to reflect the conversion of shares of Blue Chip Portfolio to shares of Federated Capital Income Fund II Primary Shares based on the net asset value of Federated Capital Income Fund II Primary Shares.
3 Does not reflect additional $6,880,067 of assets of Federated Capital Appreciation Fund II represented by another share class.
The following table sets forth the unaudited capitalization of both Value Growth and Blue Chip Portfolios into Federated Capital Appreciation Fund II as of March 15, 2011.
| | | | | | |
| Fund | | Total Net Assets | | Shares Outstanding | | Net Asset Value Per Share |
Value Growth Portfolio- | | | | | | |
| | | | |
Initial Class Shares | | $54,953,645 | | 4,006,878 | | $13.71 |
Net Asset Adjustments1 | | ($4,898) | | | | |
Share Adjustments2 | | | | 4,632,862 | | |
Service Class Shares | | $742,280 | | 52,901 | | $14.03 |
Net Asset Adjustments1 | | ($66) | | | | |
Share Adjustments2 | | | | 63,799 | | |
Blue Chip Portfolio- | | | | | | |
60
| | | | | | |
| Fund | | Total Net Assets | | Shares Outstanding | | Net Asset Value Per Share |
| | | | |
Initial Class Shares | | $72,123,117 | | 2,025,909 | | $35.60 |
Net Asset Adjustments1 | | ($6,469) | | | | |
Share Adjustments2 | | | | 9,313,187 | | |
Service Class Shares | | $3,903,250 | | 105,332 | | $37.06 |
Net Asset Adjustments1 | | ($350) | | | | |
Share Adjustments2 | | | | 508,332 | | |
| | | | |
Federated Capital Appreciation Fund II – Primary Shares | | $68,979,669 | | 10,850,830 | | $6.36 |
Federated Capital Appreciation Fund II, Pro Forma Combined- Primary Shares3 | | $200,690,178 | | 31,560,030 | | $6.36 |
1 Adjustment to reflect elimination of prepaid expenses, which would not transfer into the Federated fund after the Reorganization.
2 Adjustment as a result of the combination to reflect the conversion of shares of Value Growth and Blue Chip Portfolios to shares of Federated Capital Income Fund II Primary Shares based on the net asset value of Federated Capital Income Fund II Primary Shares.
3 Does not reflect additional $6,880,067 of assets of Federated Capital Appreciation Fund II represented by another share class.
FEDERAL INCOME TAX CONSEQUENCES
As a condition to each of the Reorganizations, the applicable Federated Insurance Fund and the corresponding EquiTrust Variable Portfolio will receive an opinion of counsel to the effect that, on the basis of the existing provisions of the Code, current administrative rules and court decisions, for federal income tax purposes:
| | • | | the Reorganization as set forth in the Plan will constitute a “reorganization” under section 368(a) of the Code and the Federated Insurance Fund and the EquiTrust Variable Portfolio each will be a “party to a reorganization” within the meaning of section 368(b) of the Code; |
| | • | | no gain or loss will be recognized by the Federated Insurance Fund upon its receipt of substantially all the EquiTrust Variable Portfolio’s assets solely in exchange for the shares of the Federated Insurance Fund; |
| | • | | no gain or loss will be recognized by the EquiTrust Variable Portfolio upon the transfer of substantially all its assets to the Federated Insurance Fund solely in exchange for the shares of the Federated Insurance Fund or upon the distribution of the Federated Insurance Fund shares to the EquiTrust Variable Portfolio’s shareholders in exchange for their EquiTrust Variable Portfolio shares; |
| | • | | no gain or loss will be recognized by shareholders of the EquiTrust Variable Portfolio upon exchange of their EquiTrust Variable Portfolio shares for Federated Insurance Fund shares; |
| | • | | the basis of the assets of the EquiTrust Variable Portfolio transferred to the Federated Insurance Fund in the Reorganization in the hands of the Federated Insurance Fund will be the same as the basis of such assets in the hands of the EquiTrust Variable Portfolio immediately prior to the Reorganization; |
| | • | | the aggregate basis of the Federated Insurance Fund shares received by each shareholder of the EquiTrust Variable Portfolio pursuant to the Reorganization will be the same as the aggregate basis of the shares of the EquiTrust Variable Portfolio exchanged therefor; |
61
| | — | the holding period of the assets of the EquiTrust Variable Portfolio transferred to the Federated Insurance Fund in the Reorganization in the hands of the Federated Insurance Fund will include the period during which those assets were held by the EquiTrust Variable Portfolio; and |
| | — | the holding period of the Federated Insurance Fund shares received by each shareholder of the EquiTrust Variable Portfolio will include the period during which the shares of the EquiTrust Variable Portfolio exchanged therefor were held by such shareholder, provided the shares of the EquiTrust Variable Portfolio were held by such shareholder as capital assets on the date of the Reorganization. |
The opinion provided in connection with each Reorganization shall be based on customary assumptions and such representations as K&L Gates LLP may reasonably request, and the EquiTrust Variable Fund and the Federated Insurance Funds will cooperate to make and certify the accuracy of such representations. Each opinion may state that no opinion is expressed as to the effect of the Reorganization on the applicable Federated Insurance Fund, the corresponding EquiTrust Variable Portfolio or any shareholder of such EquiTrust Variable Portfolio with respect to any asset as to which unrealized gain or loss is required to be recognized for federal income tax purposes at the end of a taxable year (or on the termination or transfer thereof) under a mark-to-market system of accounting. Notwithstanding anything herein to the contrary, the requirement that the above-described opinion be provided in connection with a Reorganization cannot be waived by either the applicable Federated Insurance Fund or the corresponding EquiTrust Variable Portfolio.
Opinions of counsel are not binding upon the Internal Revenue Service or the courts. If a Reorganization is consummated but does not qualify as a reorganization under the Code, a shareholder of the EquiTrust Variable Portfolio would recognize a taxable gain or loss equal to the difference between his or her tax basis in his or her EquiTrust Variable Portfolio shares and the fair market value of the Federated Insurance Fund shares received in exchange therefor. Shareholders of the EquiTrust Variable Fund should consult their tax advisors regarding the effect, if any, of the Reorganizations in light of their individual circumstances. In addition, because the foregoing discussion only relates to the federal income tax consequences of the Reorganizations, those shareholders also should consult their tax advisors about state and local tax consequences, if any, of the Reorganizations.
Before the Reorganizations, each EquiTrust Variable Portfolio expects to make distributions to its shareholders. Such distributions, together with all previous distributions, will have the effect of distributing to shareholders of each EquiTrust Variable Portfolio all of such EquiTrust Variable Portfolio’s investment company taxable income (computed without regard to the deduction for dividends paid), the excess of the EquiTrust Variable Portfolio’s tax-exempt interest income over its deductions disallowed under Code sections 171(a)(2) and 265, and the EquiTrust Variable Portfolio’s net capital gains, including those realized on any disposition of portfolio securities in connection with the Reorganization (after reduction by any available capital loss carryforwards), through the closing of the Reorganization. This is not expected to be a taxable event for federal income tax purposes for variable annuity or variable life insurance contract owners.
There are no plans on the part of any EquiTrust Variable Portfolio to dispose of a material portion of its portfolio securities prior to the Reorganizations nor are there any plans on the part of any Federated Insurance Fund to sell acquired portfolio securities, other than in the ordinary course of business.
In addition, because the shareholders of an EquiTrust Variable Portfolio will receive shares of the corresponding Federated Insurance Fund, the effect of any “built-in” (unrealized) gains/losses in that Federated Insurance Fund’s assets, as well as any taxable gains realized by such Federated Insurance Fund but not distributed to its shareholders prior to the Reorganization will be reflected in the NAV of the Federated Insurance Fund shares received.
As of December 31, 2010, the following Federated Insurance Funds and EquiTrust Variable Portfolios had the following built-in gains (losses) for federal income tax purposes. These figures are approximate and are likely to change by the date of the Reorganizations.
As of their respective fiscal year ends, the following respective Federated Insurance Funds and EquiTrust Variable Portfolios had unutilized capital loss carryovers in the approximate amounts set forth below (rounded to the nearest
62
thousand). The final amount of unutilized capital loss carryovers for each Fund is subject to change and will not be determined until the time of the Reorganizations:
| | | | |
| Federated Quality Bond Fund II | | $10,137,000 | | |
High Grade Bond Portfolio | | $33,000 | |
Strategic Yield Portfolio | | $2,501,000 | |
Federated Capital Income Fund II | | $11,144,000 | |
Managed Portfolio | | $4,687,000 | |
Federated Capital Appreciation Fund II | | $48,397,000 | |
Value Growth Portfolio | | $4,270,000 | |
Blue Chip Portfolio | | $5,278,000 | |
Neither Federated Prime Money Fund II nor Money Market Portfolio had any unutilized capital loss carryovers as of December 31, 2010.
It is anticipated that any capital loss carryforwards of the EquiTrust Variable Portfolios and Federated Insurance Funds which were generated prior to the Reorganizations will remain available to each respective Federated Insurance Fund following the Reorganizations, subject to any applicable limitations under the Code (including limitations that may be imposed as a result of the Reorganizations).
Generally, when ownership of a corporation with capital loss carryovers changes for federal income tax purposes in connection with a reorganization (as will be the case here), the Code imposes various limitations on the use of loss carryovers following the change in ownership. The amount of such loss carryovers that can be used each year to offset post-acquisition income would generally be determined by multiplying the “federal long-term tax-exempt rate” (the applicable rate as of February 2011 was 4.55%) by the value of the outstanding shares of a Fund having the capital loss carryovers (possibly subject to adjustment for purposes of these rules) immediately prior to the Reorganization. Additional limitations could also apply that would limit a Fund’s ability to use capital losses after the Reorganization. Furthermore, in the case of regulated investment companies, capital losses incurred in tax years beginning on or before December 22, 2010 may generally be carried forward for only eight years.
AGREEMENT AMONG FEDERATED, EQUITRUST AND FBL FINANCIAL GROUP, INC.
Federated Investors, Inc., the parent company of the Federated Insurance Funds’ investment advisers and subadvisers (“Federated”) entered into an Agreement with EquiTrust and FBL Financial Group, Inc. (“FBL”), the parent company of EquiTrust, dated April 14, 2011 (the “Purchase Agreement”) regarding the sale by FBL to Federated of certain assets relating to FBL’s business of providing investment advisory and investment management services to the EquiTrust Variable Fund, FBL’s and its affiliates’ cooperation in connection with the Reorganizations, the payment of transaction expenses, and related matters. The sale of such assets, and certain other obligations of the parties, is contingent upon shareholder approval of the Reorganizations (as well as the proposed reorganizations of the series of another investment company managed by EquiTrust) amounting to an agreed-upon minimum level of assets, among other things. Assuming shareholder approval is obtained, and the other conditions in the Purchase Agreement and the Plans are met, shareholders of the applicable EquiTrust Variable Portfolio will become shareholders of a corresponding Federated Insurance Fund. If this occurs, FBL or its affiliates expect to receive compensation under the Purchase Agreement at closing in an amount calculated on the amount of the assets of the EquiTrust Variable Portfolios.
Under the Purchase Agreement, Federated and FBL each has agreed, for the minimum time periods specified in Section 15(f) of the 1940 Act and subject to compliance with its fiduciary duties, to use commercially reasonable efforts to cause the Federated Insurance Funds Board to take (or refrain from taking, as the case may be) such actions as are necessary to ensure that: (i) at least 75% of the Federated Insurance Funds Board are not “interested persons” (as that term is defined in the 1940 Act) of the Federated Insurance Funds’ investment adviser or EquiTrust or any interested person thereof; (ii) no “unfair burden” (as that term is defined in Section 15(f)(2)(B) of the 1940 Act) is imposed as a result of the Reorganizations; and (iii) each vacancy on the Federated Insurance Funds Board is filled by a person who is not an interested person of the Federated Insurance Funds’ investment adviser or
63
EquiTrust, so as to comply with Section 15(f) of the 1940 Act and has been selected and proposed for election by a majority of the Board who are not interested persons. Federated may elect, in lieu of the covenants set forth in the preceding sentence, to apply for and obtain an exemptive order under Section 6(c) of the 1940 Act from the provisions of Section 15(f)(1)(A) of the 1940 Act, in form and substance reasonably acceptable to the Federated Insurance Funds’ investment advisers.
In addition, it is anticipated that EquiTrust or its affiliates may, under agreements with one or more subsidiaries of Federated, be eligible to receive Federated-paid shareholder/administrative services fees of up to 0.38% on the NAV of the shares of the Federated Funds that are held by shareholders.
Federated, EquiTrust and/or their affiliates have agreed to share transaction costs (as defined in the Plans) of the Reorganization, including any costs associated with preparing, filing, printing, and mailing this Proxy Statement/Prospectus and soliciting shareholder votes.
COMPARATIVE INFORMATION ON SHAREHOLDERS’ RIGHTS
Both the EquiTrust Variable Fund and the Federated Insurance Funds are open-end, diversified management investment companies registered under the 1940 Act, which continuously offer to sell shares as their current NAV.
EquiTrust Variable Insurance Series Fund was established as a business trust under the laws of the Commonwealth of Massachusetts and is made up of six portfolios. Each Federated Insurance Fund is a portfolio of Federated Insurance Series, also a Massachusetts business trust.
EquiTrust Variable Fund and the Federated Insurance Funds are governed by their respective Declarations of Trust, By-laws and Boards of Trustees. The rights of shareholders of the EquiTrust Variable Fund and shareholders of the Federated Insurance Funds as set forth in their respective Declarations of Trust, and By-Laws are substantially similar. Set forth below is a brief summary of the significant rights of shareholders of the EquiTrust Variable Fund and shareholders of the Federated Insurance Funds:
| | | | |
| CATEGORY | | EQUITRUST VARIABLE FUND | | FEDERATED INSURANCE FUNDS |
| Preemptive Rights | | None | | None |
| Preferences | | None | | None |
| Appraisal Rights | | None | | None |
| Conversion Rights | | None | | None |
| Exchange Rights (other than the right to exchange for shares of other Federated Insurance Funds or EquiTrust Variable Portfolios, as provided in the funds’ prospectuses) | | The Trustees shall have the authority to provide that the holders of Shares of any series shall have the right to exchange said Shares for Shares of one or more other series of Shares in accordance with such requirements and procedures as may be established by the Trustees. | | Same |
| Annual Meetings | | Not required | | Same |
| Right to Call Shareholder Meetings | | Special Meetings may be called by the Trustees and shall be called by the Trustees upon written notice of at least 1/10 of the outstanding shares entitled to vote at the meeting. | | Special meetings of the Shareholders may be called by the Trustees or the Chief Executive Officer of the Trust and shall be called by the Trustees upon the written request of Shareholders owning at least one-tenth of the outstanding Shares of all Series and Classes entitled to vote. |
| Notice of Meetings | | At least 15 days before the meeting to each shareholder entitled to vote. | | Same. |
64
| | | | |
| CATEGORY | | EQUITRUST VARIABLE FUND | | FEDERATED INSURANCE FUNDS |
| Record Date For Meetings | | The Trustees may fix in advance a time, which shall not be more than 60 days nor less than 15 days before the date of any meeting of shareholders | | The Trustees may fix in advance a date, not exceeding 90 days preceding the date of any meeting of Shareholders of the Trust or any Series or Class as a record date for the determination of the Shareholders entitled to notice of and to vote at any such meeting or any adjournment thereof. |
| Quorum for Meetings | | More than 50% of shares entitled to vote shall constitute a quorum at a Shareholders’ meeting, except where a larger quorum is required by law, the Bylaws or the Declaration of Trust; when any one or more series is to vote as a single class separate from the shares of any other series which are to vote on the same matters as a separate class or classes, a majority of the shares of each such series entitled to vote shall constitute a quorum at a shareholders meeting of that series. | | Except as otherwise provided by law, to constitute a quorum for the transaction of any business at any meeting of Shareholders there must be present, in person or by proxy, holders of more than 50% of the total number of outstanding Shares of all Series and Classes entitled to vote at such meeting. When any one or more Series or Classes is entitled to vote as a single Series or Class, more than 50% of the shares of each such Series or Class entitled to vote shall constitute a quorum at a Shareholder’s meeting of that Series or Class. |
| Vote Required for Election of Trustees | | A plurality of votes cast shall elect a Trustee. | | Same. |
| Adjournment of Meetings | | Any meeting of Shareholders may be adjourned from time to time by a majority of the votes properly cast upon the question, whether or not a quorum is present, and the meeting may be held as adjourned within a reasonable time after the date set for the original meeting without further notice. | | If a quorum shall not be present for the purpose of any vote that may properly come before the meeting, the shares present in person or by proxy and entitled to vote at such meeting on such matter may, by plurality vote, adjourn the meeting from time to time to such place and time without further notice than by announcement to be given at the meeting. |
| Removal of Trustees by Shareholders | | A Trustee may be removed from office at any special meeting of shareholders by a vote of two-thirds of the outstanding shares. | | Same. |
| Personal Liability of Officers and Trustees | | Trustees and officers of the Trust shall be liable for their willful misfeasance, bad faith, gross negligence or reckless disregard of the duties involved in the conduct of the office of Trustee or officer, as the case may be, and for nothing else. | | Same. |
65
| | | | |
| CATEGORY | | EQUITRUST VARIABLE FUND | | FEDERATED INSURANCE FUNDS |
| Personal Liability of Shareholders | | Under certain circumstances, shareholders may be held personally liable as partners under Massachusetts law for obligations of the Trust. In the unlikely event a shareholder is held personally liable for the Trust’s obligations, the Trust is required by the Declaration of Trust to use its property to protect or compensate the shareholder. On request, the Trust will defend any claim made and pay any judgment against a shareholder for any act or obligation of the Trust. | | Same. |
| Rights of Inspection | | Under Massachusetts law, the trustees of a Massachusetts business trust may from time to time determine whether and to what extent, and at what times and places, and under what conditions and regulations the accounts and books of the Trust maintained on behalf of each series and class of shares of the Trust or any of them may be open to the inspection of the shareholders of any series or class; and no shareholder may have right to inspect any account or book or document of the Trust except that, to the extent such account or book or document relates to the series or class in which he is a shareholder or the Trust generally, such shareholder will have such right of inspection as conferred by laws or authorized by the Trustees or by the resolution of the shareholders of the relevant series or class. | | Same. |
| Number of Authorized Shares; Par Value | | Unlimited number of shares; No par value | | Same. |
INFORMATION ABOUT THE FEDERATED INSURANCE FUNDS AND THE EQUITRUST VARIABLE FUNDS; WHERE TO FIND ADDITIONAL INFORMATION
Information about the EquiTrust Variable Fund is included in the EquiTrust Variable Fund’s Prospectus and SAI for Initial Class Shares and Service Class Shares, each dated [May 1, 2011], each of which is incorporated herein by
66
reference. Information about the Federated Insurance Funds is included in each Federated Insurance Fund’s Prospectus and SAI, each dated [April 30, 2011], each of which also is incorporated herein by reference. A copy of the applicable Federated Insurance Fund Prospectus accompanies this Prospectus/Proxy Statement. Copies of the SAI of each Federated Insurance Fund, the Prospectus and SAI of the EquiTrust Variable Fund and the SAI dated [May 16], 2011 relating to this Prospectus/Proxy Statement, all of which have been filed with the SEC, may be obtained without charge by contacting the EquiTrust Variable Fund at (877) 860-2904, or the Federated Insurance Funds at (412) 288-1900 or by writing to EquiTrust Variable Fund, 5400 University Avenue, West Des Moines, Iowa 50266, or to the Federated Insurance Funds, 4000 Ericsson Drive, Warrendale, Pennsylvania 15086-7561.
The Federated Insurance Funds and the EquiTrust Variable Fund, on behalf of the EquiTrust Variable Portfolios, are subject to the informational requirements of the Securities Act of 1933, the Securities Exchange Act of 1934, and the 1940 Act, and in accordance therewith file reports and other information with the SEC. Reports, proxy and information statements and other information filed by the Federated Insurance Trust, on behalf of the Federated Insurance Funds, and by the EquiTrust Variable Fund on behalf of the EquiTrust Variable Portfolios, can be obtained by calling or writing the funds and can also be inspected and copied by the public at the public reference facilities maintained by the SEC in Washington, DC located at Room 1580, 100 F Street, N.E., Washington, D.C. 20549. Copies of filings may be available at the following Commission regional offices: 3 World Financial Center, Suite 409, New York, NY 10281-1022; 33 Arch Street, 23rd Floor, Boston, MA 02110-1424; 701 Market Street, Philadelphia, Pennsylvania 19106-1532; 801 Brickell Ave., Suite 1800, Miami, FL 33131; 3475 Lenox Road, N.E., Suite 1000, Atlanta, GA 30326-1232; 175 W. Jackson Boulevard, Suite 900, Chicago, IL 60604; 1801 California Street, Suite 1500, Denver CO 80202-2656; Burnett Plaza, Suite 1900, 801 Cherry Street, Unit 18, Fort Worth, TX 76102; 15 W. South Temple Street, Suite 1800, Salt Lake City, UT 84101; 5670 Wilshire Boulevard, 11th Floor, Los Angeles, CA 90036-3648; and 44 Montgomery Street, Suite 2600, San Francisco, CA 94104. Copies of such material can be obtained at prescribed rates from the Public Reference Branch, Office of Consumer Affairs and Information Services, SEC, Washington DC 20549, or obtained electronically from the EDGAR database on the SEC’s website (www.sec.gov).
LEGAL PROCEEDINGS
Since February 2004, Federated and related entities (collectively, “Federated”) have been named as defendants in several lawsuits that are now pending in the United States District Court for the Western District of Pennsylvania. These lawsuits have been consolidated into a single action alleging excessive advisory fees involving one of the Federated-sponsored mutual funds (“Funds”). None of the Federated Insurance Funds is involved in this action.
Federated and its counsel have been defending this litigation. Additional lawsuits based upon similar allegations may be filed in the future. The potential impact of these lawsuits, all of which seek monetary damages, attorneys’ fees and expenses, and future potential similar suits is uncertain. Although we do not believe that these lawsuits will have a material adverse effect on the Funds, there can be no assurance that these suits, ongoing adverse publicity and/or other developments resulting from the allegations in these matters will not result in increased redemptions, or reduced sales, of shares of the Funds or other adverse consequences for the Funds.
ABOUT THE PROXY SOLICITATION AND THE SPECIAL MEETING
Proxies are being solicited by the EquiTrust Variable Fund Board on behalf of its portfolios, the EquiTrust Variable Portfolios. [The proxies will be voted at the special meeting of shareholders of the EquiTrust Variable Portfolios to be held on [July 14], 2011 at the offices of EquiTrust, at 9:00 a.m. (Central Time), (such special meeting and any adjournment or postponement thereof are referred to as the (“Special Meeting”).
Contractholders with amounts allocated to an Acquired Fund on the Record Date will be entitled to be present and give voting instructions for the Acquired Fund at the Meeting with respect to shares held indirectly as of the Record Date, to the extent required by applicable law. An Insurance Company will vote the shares for which it receives timely voting instructions from Contractholders in accordance with those instructions. An Insurance Company will vote shares attributable to Contracts for which it is the Contractholder “FOR” each proposal. Shares in each investment division of a Separate Account for which an Insurance Company receives a voting instruction card that is signed, dated and timely returned but is not marked to indicate voting instructions will be treated as an instruction to
67
vote the shares in favor of the applicable proposal. Shares in each investment division of a Separate Account for which an Insurance Company receives no timely voting instructions from Contractholders, or which are attributable to amounts retained by Farm Bureau Life Insurance Company, an affiliate of EquiTrust, as surplus or seed money, will be voted by the applicable Insurance Company “FOR” or “AGAINST” approval of the proposal, or as an abstention, in the same proportion as the shares for which Contractholders (other the Insurance Company) have provided voting instructions to the Insurance Company.
Voting instructions executed by a Contractholder may be revoked at any time prior to an Insurance Company voting the shares represented thereby by the Contractholder providing the Insurance Company with a properly executed written revocation of such voting instructions, or by the Contractholder providing the Insurance Company with proper later-dated voting instructions by voting instruction card, telephone or the Internet. In addition, any Contractholder who attends the Meeting in person may provide voting instructions by a voting instruction card at the Meeting, thereby canceling any voting instruction previously given. Proxies executed by an Insurance Company may be revoked at any time before they are exercised by a written revocation duly received, by properly executing a later-dated proxy or by attending the Meeting and voting in person.
An Insurance Company will vote as directed by the voting instruction card, but in the absence of voting instructions in any voting instruction card that is signed and returned, an Insurance Company intends to vote “FOR” the applicable proposal and may vote in its discretion with respect to other matters not now known to the Board that may be presented at the Meeting.
The cost of the solicitation, including the printing and mailing of proxy materials, will be borne by EquiTrust, FEMCO and/or FIMCO or their affiliates. In addition to solicitations through the mail, proxies may be solicited by officers, employees, and agents of EquiTrust and/or EquiTrust Marketing for their affiliates, or, if necessary, a communications firm retained for this purpose. Such solicitation may be by telephone or through the Internet. Any telephonic solicitations will follow procedures designed to ensure accuracy and prevent fraud, including requiring identifying shareholder Contractholder information, recording the Contractholder’s instructions, and confirming to the Contractholders after the fact. Contractholders who communicate proxies by telephone or by other electronic means have the same power and authority to issue, revoke, or otherwise change their voting instructions as Contractholders submitting proxies in written form. FIMCO, FEMCO and/or EquiTrust may reimburse custodians, nominees, and fiduciaries for the reasonable costs incurred by them in connection with forwarding solicitation materials to the beneficial owners of shares held of record by such persons.
The purpose of the Special Meeting is set forth in the accompanying Notice. The EquiTrust Variable Portfolios’ Trustees know of no business other than that mentioned in the Notice that will be presented for consideration at the Special Meeting. Should other business properly be brought before the Special Meeting, proxies will be voted in accordance with the best judgment of the persons named as proxies. This Prospectus/Proxy Statement and the enclosed proxy card are expected to be mailed on or about [June 1], 2011 to shareholders of record at the close of business on [May 16], 2011 (the “Record Date’).
The EquiTrust Variable Fund’s Annual Report, which includes audited financial statements for the fiscal year ended December 31, 2010, was previously mailed to shareholders of the EquiTrust Variable Fund. The EquiTrust Variable Fund will promptly provide, without charge and upon request, to each person to whom this Prospectus/Proxy Statement is delivered, a copy of its Annual Report, which may be requested by writing to the EquiTrust Variable Fund’s principal executive offices or by calling the EquiTrust Variable Fund. The principal executive office of the EquiTrust Variable Fund is located at 5400 University Avenue, West Des Moines, Iowa 50266. These documents, as well as additional information about the Fund (including portfolio holdings, performance, and distributions), are also available on the following websites, as applicable: www.FederatedInvestors.com (Federated Insurance Funds) or www.fbfs.com (EquiTrust Variable Fund).
Federated Insurance Funds’ toll-free telephone number is 1-800-341-7400 and the EquiTrust Variable Fund’s toll-free telephone number is 1-877-860-2904.
PROXIES, QUORUM AND VOTING AT THE SPECIAL MEETING
Only shareholders of record on the Record Date will be entitled to vote at the Special Meeting. Each share of each
68
EquiTrust Variable Portfolio is entitled to one vote. Fractional shares are entitled to proportionate shares of one vote. The votes of shareholders of the Federated Insurance Funds are not being solicited since their approval is not required in order to effect the Reorganization.
Any person given a proxy has the power to revoke it any time prior to its exercise by executing a superseding proxy or by submitting a written notice of revocation to the Secretary of EquiTrust Variable Portfolios. In addition, although mere attendance at the Special Meeting will not revoke a proxy, a shareholder present at the Special meeting may withdraw his or her proxy and vote in person. All properly executed and unrevoked proxies received in time for the Special Meeting will be voted in accordance with the instructions contained in the proxies. If no instruction is given on the submitted proxy, the persons named as proxies will vote the shares represented thereby in favor of approval of the Agreements and Plans of Reorganizations.
In order to hold the Special Meeting, a “quorum” of shareholders of an EquiTrust Variable Portfolio must be present. Holders of more than 50% of the total number of shares of an EquiTrust Variable Portfolio entitled to vote, present in person or by proxy, shall be required to constitute a quorum for the purpose of voting on the proposal to approve the Agreement and Plan of Reorganization for that Portfolio and for the purpose of transacting any other business that may come before the meeting.
Approval of a proposed Reorganization requires the affirmative vote of a majority of the outstanding shares of the EquiTrust Variable Portfolio entitled to vote on that Reorganization. Shares will be voted in the aggregate, without regard to class. For each EquiTrust Variable Portfolio, the term “vote of a majority of the outstanding shares entitled to vote” shall mean the vote of the lesser of:
| (1) | 67% or more of the voting securities present at such meeting, if more than 50% of the outstanding voting securities of such Portfolio are present or represented by proxy; or |
| (2) | more than 50% of the outstanding voting securities of such Portfolio. |
Shares represented by a properly executed proxy will be voted in accordance with the instructions on the proxy, or, if no instructions are provided, the shares will be voted in FAVOR of the approval of the Reorganization. Shares for which no voting instructions are received shall be voted by the Participating Insurance Companies in proportion to the shares for which voting instructions are received. As a result of proportional voting, the votes of a small number of shareholders could determine the outcome of a proposal.
If a quorum is not present, the persons named as proxies may vote those proxies that have been received to adjourn the Special Meeting from time to time without further notice other than by announcement to be given at the meting until a quorum is met. In the event that a quorum is present but sufficient votes in favor of the proposal have not been received, the persons named as proxies may propose one or more adjournments of the Special Meeting to permit further solicitations of proxies with respect to the proposal. All such adjournments will require the affirmative vote of a majority of the shares present in person or by proxy at the session of the Special Meeting to be adjourned. The persons named as proxies will vote AGAINST an adjournment those proxies that they are required to vote against the proposal, and will vote in FAVOR of such an adjournment all other proxies that they are authorized to vote.
SHARE OWNERSHIP OF THE FUNDS
As of [May 16], 2011 the EquiTrust Variable Fund had the following numbers of outstanding shares of beneficial interest:
| | | | |
EquiTrust Variable Portfolio | | Share Class | | Outstanding Shares |
| Money Market Portfolio | | Initial Class Shares Service Class Shares | | |
| High Grade Bond Portfolio | | Initial Class Shares Service Class Shares | | |
69
| | | | |
EquiTrust Variable Portfolio | | Share Class | | Outstanding Shares |
| Strategic Yield Portfolio | | Initial Class Shares Service Class Shares | | |
| Managed Portfolio | | Initial Class Shares Service Class Shares | | |
| Value Growth Portfolio | | Initial Class Shares Service Class Shares | | |
| Blue Chip Portfolio | | Initial Class Shares Service Class Shares | | |
To the knowledge of the EquiTrust Variable Fund’s management, as of April [8], 2011, the following entities held of record more than 5% of each EquiTrust Variable Portfolios’ outstanding share classes. In each case, the shareholder of record is a life insurance company separate account holding shares, representing the indirect beneficial interest of the insurance company’s Contractholders.
| | | | | | |
EquiTrust Variable Portfolio | | Share Class | | Shareholder Name and Address | | Percentage of Shares Held |
| High Grade Bond Portfolio | | Initial Class | | Farm Bureau Variable Account (VA) 5400 University Avenue West Des Moines, IA 50266 | | 6.55% |
| Strategic Yield Portfolio | | Initial Class | | Farm Bureau Variable Account (VA) 5400 University Avenue West Des Moines, IA 50266 | | 5.14% |
| Managed Portfolio | | Initial Class | | Farm Bureau Variable Account (VUL) 5400 University Avenue West Des Moines, IA 50266 | | 12.37% |
| Managed Portfolio | | Initial Class | | Farm Bureau Variable Account (VA) 5400 University Avenue West Des Moines, IA 50266 | | 9.74% |
| Value Growth Portfolio | | Initial Class | | Farm Bureau Variable Account (VUL) 5400 University Avenue West Des Moines, IA 50266 | | 11.08% |
| Value Growth Portfolio | | Initial Class | | Farm Bureau Variable Account (VA) 5400 University Avenue West Des Moines, IA 50266 | | 5.06% |
| Blue Chip Portfolio | | Initial Class | | Farm Bureau Variable Account (VUL) 5400 University Avenue West Des Moines, IA 50266 | | 12.80% |
| Blue Chip Portfolio | | Initial Class | | Farm Bureau Variable Account (VA) 5400 University Avenue West Des Moines, IA 50266 | | 7.80% |
As of April [8], 2011, the Officers and Directors of the EquiTrust Variable Fund owned less than 1% of any class of any EquiTrust Portfolio’s outstanding shares.
To the knowledge of the Federated Insurance Funds’ management, as of April 8, 2011, the following entities held of record more than 5% of each Federated Insurance Funds’ outstanding share classes. In each case, the shareholder of record is a life insurance company separate account holding shares, representing the indirect beneficial interest of the insurance company’s Contractholders.
70
| | | | | | |
| Federated Insurance Fund | | Share Class | | Shareholder Name and Address | | Percentage of Shares Held |
| Federated Prime Money Fund II | | Undesignated | | Phoenix Home Life Variable Ins Co 31 Tech Valley Dr E Greenbush, NY 12061-4134 | | 33.53% |
| Federated Prime Money Fund II | | Undesignated | | Phoenix Home Life Variable Ins Co 31 Tech Valley Dr E Greenbush, NY 12061-4134 | | 33.31% |
| Federated Prime Money Fund II | | Undesignated | | Monumental Life Insurance Company Advisors Edge Attn Mail Drop 4410 4333 Edgewood Rd NE Cedar Rapids, IA 52499-0001 | | 8.11% |
| Federated Prime Money Fund II | | Undesignated | | Allstate Life Insurance Company 3075 Sanders Rd Ste G4A Northbrook, IL 60062-7127 | | 5.29% |
| Federated Quality Bond Fund II | | Primary | | Nationwide Life Insurance Company C/O IPO Portfolio Accounting PO Box 182029 Columbus, OH 43218-2029 | | 64.09% |
| Federated Quality Bond Fund II | | Primary | | Nationwide Life Insurance Company C/O IPO Portfolio Accounting PO Box 182029 Columbus, OH 43218-2029 | | 17.47% |
| Federated Quality Bond Fund II | | Primary | | Nationwide Life Insurance Company C/O IPO Portfolio Accounting PO Box 182029 Columbus, OH 43218-2029 | | 6.02% |
| Federated Capital Income Fund II | | Undesignated | | Union Security Insurance Company UIT Operations PO Box 2999 Hartford, CT 06104-2999 | | 22.03% |
| Federated Capital Income Fund II | | Undesignated | | GE Life & Annuity Attn Variable Comp Dept 4th Fl 6610 West Broad St Richmond, VA 23230-1702 | | 17.08% |
| Federated Capital Income Fund II | | Undesignated | | ING Life Insurance and Annuity Co One Orange Way B3N Windsor, CT 06095-4773 | | 16.29% |
| Federated Capital Income Fund II | | Undesignated | | Lincoln Benefit Life Co Variable Annuity 2940 S 84th St Lincoln, NE 68506-4154 | | 6.04% |
| Federated Capital Income Fund II | | Undesignated | | Jefferson National Life Insurance Company Attn Separate Accounts 9920 Corporate Campus Dr Ste 1000 Louisville, KY 40223-4051 | | 5.24% |
71
| | | | | | |
| Federated Insurance Fund | | Share Class | | Shareholder Name and Address | | Percentage of Shares Held |
| Federated Capital Appreciation Fund II | | Primary | | Union Security Insurance Company Attn UIT Operation PO Box 2999 Hartford CT 06104-2999 | | 20.82% |
| Federated Capital Appreciation Fund II | | Primary | | GE Life & Annuity Attn Variable Comp Dept 4th Fl 6610 West Broad St Richmond, VA 23230-1702 | | 18.89% |
| Federated Capital Appreciation Fund II | | Primary | | Kansas City Life Insurance Co Attn Accounting Operations-Variable PO Box 219139 Kansas City, MO 64121-9139 | | 6.07% |
| Federated Capital Appreciation Fund II | | Primary | | Merrill Lynch Life Insurance Co 4333 Edgewood Rd NE Cedar Rapids, IA 52499-0001 | | 5.88% |
| Federated Capital Appreciation Fund II | | Primary | | ING Life Insurance And Annuity Co One Orange Way B3N Windsor, CT 06095-4773 | | 23.60% |
As of April 8, 2011, the Officers and Board Members of the Federated Insurance Funds owned less than 1% of any class of any Federated Fund’s outstanding shares.
Shareholders owning 25% or more of outstanding shares may be in control of the Fund of which they are a shareholder and be able to affect the outcome of certain matters presented for a vote of shareholders.
OTHER MATTERS AND DISCRETION OF ATTORNEYS NAMED IN THE PROXY
No business other than the matters described above is expected to come before the Special Meeting, but should any other matter requiring a vote of shareholders arise, including any question as to an adjournment or postponement of the Special Meeting, the persons named on the enclosed proxy card will vote on such matters according to their best judgment in the interests of the EquiTrust Variable Fund.
SHAREHOLDERS ARE REQUESTED TO COMPLETE, DATE AND SIGN THE ENCLOSED PROXY CARD AND RETURN IT IN THE ENCLOSED ENVELOPE, WHICH NEEDS NO POSTAGE IF MAILED IN THE UNITED STATES.
|
| /s/ Craig A. Lang |
Craig A. Lang |
President and Trustee |
EquiTrust Variable Insurance Series Fund |
72
ANNEX A-1 — FORM OF AGREEMENT AND PLAN OF REORGANIZATION, MONEY MARKET
FUNDS
THIS AGREEMENT AND PLAN OF REORGANIZATION (the “Agreement”) is made as of this [14th] day of [July], 2011, by and between Federated Insurance Series, a Massachusetts business trust, with its principal place of business at 4000 Ericsson Drive, Warrendale, Pennsylvania 15086-7561 (the “Federated Trust”), with respect to its Federated Prime Money Fund II (the “Acquiring Fund”), a series of the Federated Trust, and EquiTrust Variable Insurance Series Fund, a Massachusetts business trust, with its principal place of business at 5400 University Avenue, West Des Moines, Iowa 50266 (the “EquiTrust Variable Fund”), with respect to its Money Market Portfolio, a series of the EquiTrust Variable Fund (the “Acquired Fund” and, collectively with the Acquiring Fund, the “Funds”).
This Agreement is intended to be, and is adopted as, a plan of reorganization within the meaning of Section 368 of the United States Internal Revenue Code of 1986, as amended (the “Code”) and the Treasury Regulations promulgated thereunder. The reorganization will consist of: (i) the transfer of substantially all of the assets of the Acquired Fund to the Acquiring Fund in exchange solely for shares of beneficial interest, no par value per share, of the Acquiring Fund (“Acquiring Fund Shares”); (ii) the distribution of Acquiring Fund Shares to the holders of Initial Class and Service Class Shares of the Acquired Fund; and (iii) the liquidation of the Acquired Fund as provided herein, all upon the terms and conditions set forth in this Agreement (the “Reorganization”).
WHEREAS, the Acquiring Fund and the Acquired Fund are separate series of the Federated Trust and the EquiTrust Variable Fund, respectively, and the Federated Trust and the EquiTrust Variable Fund are open-end, registered management investment companies and the Acquired Fund owns securities that generally are assets of the character in which the Acquiring Fund is permitted to invest;
WHEREAS, the Acquiring Fund and the Acquired Fund are authorized to issue their shares of beneficial interests;
WHEREAS, the Trustees of the Federated Trust have determined that the Reorganization, with respect to the Acquiring Fund, is in the best interests of the Acquiring Fund and that the interests of the existing shareholders of the Acquiring Fund will not be diluted as a result of the Reorganization;
WHEREAS, the Trustees of EquiTrust Variable have determined that the Reorganization, with respect to the Acquired Fund, is in the best interests of the Acquired Fund;
NOW, THEREFORE, in consideration of the premises and of the covenants and agreements hereinafter set forth, the parties hereto covenant and agree as follows:
ARTICLE I
TRANSFER OF ASSETS OF THE ACQUIRED FUND IN EXCHANGE FOR ACQUIRING FUND
SHARES AND LIQUIDATION OF THE ACQUIRED FUND
1.1 THE EXCHANGE. Subject to the terms and conditions contained herein and on the basis of the representations and warranties contained herein, the Acquired Fund agrees to transfer substantially all of its assets, as set forth in paragraph 1.2, to the Acquiring Fund. In exchange, the Acquiring Fund agrees: (i) to deliver to the Acquired Fund the number of each class of full and fractional Acquiring Fund Shares, determined by (a) multiplying the shares outstanding of each class of shares of the Acquired Fund (the “Acquired Fund Shares”) by (b) the ratio computed by dividing (x) the net asset value per share of such class of Acquired Fund Shares computed in the manner and as of the time date set forth in paragraph 2.1 by (y) the net asset value per share of the corresponding class of Acquiring Fund Shares computed in the manner and as of the time and date set forth in paragraph 2.2. Holders of Initial Class and Service Class Shares of the Acquired Fund will receive Acquiring Fund Shares. Such
A1-1
transactions shall take place at the closing on the Closing Date provided for in paragraph 3.1.
1.2 ASSETS TO BE ACQUIRED. The assets of the Acquired Fund to be acquired by the Acquiring Fund shall consist of all the assets of the Acquired Fund, including, without limitation, cash, securities, commodities, interests in futures and dividends or interest receivable, owned by the Acquired Fund, other than any deferred or prepaid expenses shown as an asset on the books of the Acquired Fund on the Closing Date. Such assets not acquired by the Acquiring Fund shall be excluded from the calculation of net asset value per share of each class of the Acquired Fund Shares under this Agreement.
The Acquired Fund has provided the Acquiring Fund with its most recent audited financial statements, which contain a list of all of the Acquired Fund’s assets as of the date of such statements. The Acquired Fund hereby represents that as of the date of the execution of this Agreement, there have been no changes in its financial position as reflected in such financial statements other than those occurring in the ordinary course of business in connection with the purchase and sale of securities, the issuance and redemption of Acquired Fund Shares and the payment of normal operating expenses, dividends and capital gains distributions.
1.3 LIABILITIES TO BE DISCHARGED. The Acquired Fund will discharge all of its liabilities and obligations prior to the Closing Date.
1.4 LIQUIDATION AND DISTRIBUTION. On or as soon after the Closing Date as is conveniently practicable: (a) the Acquired Fund will distribute in complete liquidation of the Acquired Fund, pro rata to its shareholders of record, determined as of the close of business on the Closing Date (the “Acquired Fund Shareholders”), all of the Acquiring Fund Shares received by the Acquired Fund pursuant to paragraph 1.1; and (b) the Acquired Fund will thereupon proceed to dissolve and terminate as set forth in paragraph 1.8 below. Such distribution will be accomplished by the transfer of Acquiring Fund Shares credited to the account of the Acquired Fund on the books of the Acquiring Fund to open accounts on the share records of the Acquiring Fund in the name of the Acquired Fund Shareholders, and representing the respective pro rata number of Acquiring Fund Shares due such shareholders. All issued and outstanding Acquired Fund Shares will simultaneously be canceled on the books of the Acquired Fund. The Acquiring Fund shall not issue certificates representing Acquiring Fund Shares in connection with such transfer. After the Closing Date, the Acquired Fund shall not conduct any business except in connection with its termination.
1.5 OWNERSHIP OF SHARES. Ownership of Acquiring Fund Shares will be shown on the books of the Acquiring Fund’s transfer agent. Acquiring Fund Shares will be issued simultaneously to the Acquired Fund, in an amount determined under paragraph 2.3, to be distributed to Acquired Fund Shareholders.
1.6 TRANSFER TAXES. Any transfer taxes payable upon the issuance of Acquiring Fund Shares in a name other than the registered holder of the Acquired Fund Shares on the books of the Acquired Fund as of that time shall, as a condition of such issuance and transfer, be paid by the person to whom such Acquiring Fund Shares are to be issued and transferred.
1.7 REPORTING RESPONSIBILITY. Any reporting responsibility of the Acquired Fund is and shall remain the responsibility of the Acquired Fund.
1.8 TERMINATION. The Acquired Fund shall be terminated promptly following the Closing Date and the making of all distributions pursuant to paragraph 1.4.
1.9 BOOKS AND RECORDS. All books and records of the Acquired Fund, including all books and records required to be maintained under the Investment Company Act of 1940 (the “1940 Act”), and the rules and regulations thereunder, shall be available to the Acquiring Fund from and after the Closing Date and shall be turned over to the Acquiring Fund as soon as practicable following the Closing Date.
A1-2
ARTICLE II
VALUATION
2.1 VALUATION OF ACQUIRED FUND SHARES. The net asset value per share of each class of Acquired Fund Shares shall be the net asset value per share of such class of Acquired Fund Shares (excluding any assets excluded from the net asset value calculation under paragraph 2.1) computed at the closing of the Closing Date, using the valuation procedures set forth in the Federated Trust’s Declaration of Trust and the Acquiring Fund’s then current prospectus and statement of additional information, or such other valuation procedures as shall be mutually agreed upon by the parties.
2.2 VALUATION OF ACQUIRING FUND SHARES. The net asset value per share of each class of Acquiring Fund Shares shall be the net asset value per share of such class of Acquiring Fund Shares computed at the closing on the Closing Date, using the valuation procedures set forth in the Federated Trust’s Declaration of Trust and the Acquiring Fund’s then current prospectus and statement of additional information, or such other valuation procedures as shall be mutually agreed upon by the parties.
2.3 SHARES TO BE ISSUED. The number of each class of Acquiring Fund Shares to be issued (including fractional shares, if any) in exchange for the Acquired Fund’s assets, shall be determined by (a) multiplying the shares outstanding of each class of Acquired Fund Shares by (b) the ratio computed by (x) dividing the net asset value per share of such class of Acquired Fund Shares determined in accordance with paragraph 2.1 by (y) the net asset value per share of the corresponding class of Acquiring Fund Shares determined in accordance with paragraph 2.2.
2.4 DETERMINATION OF VALUE. All computations of value shall be made by State Street Bank and Trust Company, on behalf of the Acquiring Fund and the Acquired Fund.
ARTICLE III
CLOSING AND CLOSING DATE
3.1 CLOSING DATE. The closing shall occur on or about [July 15], 2011, or such other date(s) as the parties may agree to in writing (the “Closing Date”). All acts taking place at the closing shall be deemed to take place at 4:00 p.m. Eastern Time on the Closing Date unless otherwise provided herein. The closing shall be held at the offices of Federated Services Company, 1001 Liberty Avenue, Pittsburgh, Pennsylvania 15222-3779, or at such other time and/or place as the parties may agree.
3.2 CUSTODIAN’S CERTIFICATE. JP Morgan Chase Bank, N.A., as custodian for the Acquired Fund (the “Custodian”), shall deliver at the Closing a certificate of an authorized officer stating that: (a) the Acquired Fund’s portfolio securities, cash, and any other assets have been delivered in proper form to the Acquiring Fund on the Closing Date; and (b) all necessary taxes including all applicable federal and state stock transfer stamps, if any, shall have been paid, or provision for payment shall have been made, in conjunction with the delivery of portfolio securities by the Acquired Fund.
3.3 EFFECT OF SUSPENSION IN TRADING. In the event that on the scheduled Closing Date, either: (a) the NYSE or another primary exchange on which the portfolio securities of the Acquiring Fund or the Acquired Fund are purchased or sold, shall be closed to trading or trading on such exchange shall be restricted; or (b) trading or the reporting of trading on the NYSE or elsewhere shall be disrupted so that accurate appraisal of the value of the net assets of the Acquiring Fund or the Acquired Fund is impracticable, the Closing Date shall be postponed until the first Friday on which the NYSE is open following the business day on which trading is fully resumed and reporting is restored, or such other business day as the parties hereto shall agree.
3.4 TRANSFER AGENT’S CERTIFICATE. EquiTrust Investment Management Services, Inc., as transfer agent for the Acquired Fund as of the Closing Date, shall deliver at the Closing a certificate of an authorized officer stating that its records contain the names and addresses of Acquired Fund Shareholders, and the number and
A1-3
percentage ownership of outstanding shares owned by each such shareholder immediately prior to the Closing. The Acquiring Fund shall issue and deliver, or cause EquiTrust Investment Management Services, Inc., its transfer agent, to issue and deliver, a confirmation evidencing Acquiring Fund Shares to be credited on the Closing Date to the Secretary of the EquiTrust Variable Fund or provide evidence satisfactory to the Acquired Fund that the Acquiring Fund Shares have been credited to the Acquired Fund’s account on the books of the Acquiring Fund. At the Closing, each party shall deliver to the other such bills of sale, checks, assignments, share certificates, receipts and other documents, if any, as such other party or its counsel may reasonably request.
ARTICLE IV
REPRESENTATIONS AND WARRANTIES
4.1 REPRESENTATIONS OF THE ACQUIRED FUND. The EquiTrust Variable Fund, on behalf of the Acquired Fund, represents and warrants to the Federated Trust, on behalf of the Acquiring Fund, as follows:
| | a) | The Acquired Fund is a separate series of a business trust duly organized, validly existing, and in good standing under the laws of the Commonwealth of Massachusetts. The EquiTrust Variable Fund is registered as an open-end management investment company under the 1940 Act, and the Fund’s registration with the Securities and Exchange Commission (the “Commission”) as an investment company under the 1940 Act is in full force and effect. |
| | b) | The current prospectus and statement of additional information of the EquiTrust Variable Fund conform in all material respects to the applicable requirements of the Securities Act of 1933 (the “1933 Act”) and the 1940 Act, and the rules and regulations thereunder, and do not include any untrue statement of a material fact or omit to state any material fact required to be stated or necessary to make the statements therein, in light of the circumstances under which they were made, not misleading. |
| | c) | The Acquired Fund is not, and the execution, delivery, and performance of this Agreement (subject to shareholder approval) will not result, in violation of any provision of the EquiTrust Variable Fund’s Declaration of Trust or By-Laws or of any material agreement, indenture, instrument, contract, lease, or other undertaking to which the Acquired Fund is a party or by which it is bound. |
| | d) | The Acquired Fund has no material contracts or other commitments (other than this Agreement) that will be terminated with liability to it before the Closing Date, except for liabilities, if any, to be discharged as provided in paragraph 1.3 hereof. |
| | e) | Except as otherwise disclosed in writing to and accepted by the Acquiring Fund, no litigation, administrative proceeding, or investigation of or before any court or governmental body is presently pending or to its knowledge threatened against the Acquired Fund or any of its properties or assets, which, if adversely determined, would materially and adversely affect its financial condition, the conduct of its business, or the ability of the Acquired Fund to carry out the transactions contemplated by this Agreement. The Acquired Fund knows of no facts that might form the basis for the institution of such proceedings and is not a party to or subject to the provisions of any order, decree, or judgment of any court or governmental body that materially and adversely affects its business or its ability to consummate the transactions contemplated herein. |
| | f) | The audited financial statements of the Acquired Fund as of December 31, 2010, and for the fiscal year then ended have been prepared in accordance with United States generally accepted accounting principles, and such statements (copies of which have been furnished to the Acquiring Fund) fairly reflect the financial condition of the Acquired Fund as of such date, and there are no known contingent liabilities of the Acquired Fund as of such date that are not disclosed in such statements. |
| | g) | Since the date of the financial statements referred to in paragraph (f) above, there have been no material adverse changes in the Acquired Fund’s financial condition, assets, liabilities or business (other than changes occurring in the ordinary course of business), or any incurrence by the Acquired Fund of |
A1-4
| | indebtedness maturing more than one year from the date such indebtedness was incurred, except as otherwise disclosed to and accepted by the Acquiring Fund. For the purposes of this paragraph (g), a decline in the net asset value of the Acquired Fund shall not constitute a material adverse change. |
| | h) | As of the date hereof, except as previously disclosed to the Acquiring Fund in writing, and except as have been corrected as required by applicable law, and to the best of the Acquired Fund’s knowledge, there have been no material miscalculations of the net asset value of the Acquired Fund or the net asset value per share of any class of shares during the twelve-month period preceding the date hereof and preceding the Closing Date, and all such calculations have been made in accordance with the applicable provisions of the 1940 Act. |
| | i) | The minute books and other similar records of the EquiTrust Variable Fund as made available to the Acquiring Fund prior to the execution of this Agreement contain a true and complete record of all action taken at all meetings and by all written consents in lieu of meetings of the shareholders of the EquiTrust Variable Fund, the EquiTrust Variable Fund’s Board of Trustees and committees of such Board. The stock transfer ledgers and other similar records of the Acquired Fund as made available to the Acquiring Fund prior to the execution of this Agreement, and as existing on the Closing Date, accurately reflect all record transfers prior to the execution of this Agreement, or the Closing Date, as applicable, in the shares of the Acquired Fund. |
| | j) | The EquiTrust Variable Fund has maintained, or caused to be maintained on its behalf, all books and records required of a registered investment company in compliance with the requirements of Section 31 of the 1940 Act and rules thereunder. |
| | k) | All federal and other tax returns and reports of the Acquired Fund required by law to be filed, have been filed, and all federal and other taxes shown due on such returns and reports have been paid, or provision shall have been made for the payment thereof. To the best of the Acquired Fund’s knowledge, no such return is currently under audit, and no assessment has been asserted with respect to such returns. |
| | l) | All issued and outstanding shares of the Acquired Fund are duly and validly issued and outstanding, fully paid and non-assessable by the Acquired Fund. All of the issued and outstanding shares of the Acquired Fund will, at the time of the Closing Date, be held by the persons and in the amounts set forth in the records of the Acquired Fund’s transfer agent as provided in paragraph 3.4. The Acquired Fund has no outstanding options, warrants, or other rights to subscribe for or purchase any of the Acquired Fund Shares, and has no outstanding securities convertible into any of the Acquired Fund Shares. |
| | m) | At the Closing Date, the Acquired Fund will have good and marketable title to the Acquired Fund’s assets to be transferred to the Acquiring Fund pursuant to paragraph 1.2, and full right, power, and authority to sell, assign, transfer, and deliver such assets hereunder, free of any lien or other encumbrance, except those liens or encumbrances to which the Acquiring Fund has received notice, and, upon delivery and payment for such assets, and the filing of any articles, certificates or other documents under the laws of the Commonwealth of Massachusetts, the Acquiring Fund will acquire good and marketable title, subject to no restrictions on the full transfer of such assets, other than such restrictions as might arise under the 1933 Act, and other than as disclosed to and accepted by the Acquiring Fund. |
| | n) | The execution, delivery and performance of this Agreement have been duly authorized by all necessary action on the part of the Acquired Fund. Subject to approval by the Acquired Fund shareholders, this Agreement constitutes a valid and binding obligation of the Acquired Fund, enforceable in accordance with its terms, subject as to enforcement, to bankruptcy, insolvency, reorganization, moratorium, and other laws relating to or affecting creditors’ rights and to general equity principles. |
| | o) | The information to be furnished by the Acquired Fund for use in no-action letters, applications for orders, registration statements, proxy materials, and other documents that may be necessary in connection with the transactions contemplated herein shall be accurate and complete in all material respects and shall comply in all material respects with federal securities and other applicable laws and regulations. |
A1-5
| | p) | From the effective date of the Registration Statement (as defined in paragraph 5.7), through the time of the meeting of the Acquired Fund shareholders and on the Closing Date, any written information furnished by the EquiTrust Variable Fund with respect to the Acquired Fund for use in the Proxy Materials (as defined in paragraph 5.7), or any other materials provided in connection with the Reorganization, does not and will not contain any untrue statement of a material fact or omit to state a material fact required to be stated or necessary to make the statements, in light of the circumstances under which such statements were made, not misleading. |
| | q) | The Acquired Fund has qualified and elected to be treated as a “regulated investment company” under the Code (a “RIC”), as of and since its first taxable year of operations; and qualifies and will continue to qualify as a RIC under the Code for its taxable year ending upon its liquidation. |
| | r) | No governmental consents, approvals, authorizations or filings are required under the 1933 Act, the Securities Exchange Act of 1934 (the “1934 Act”), the 1940 Act or Massachusetts law for the execution of this Agreement by the EquiTrust Variable Fund, for itself and on behalf of the Acquired Fund, except for the effectiveness of the Registration Statement, and the filing of any articles, certificates or other documents that may be required under Massachusetts law, and except for such other consents, approvals, authorizations and filings as have been made or received, and such consents, approvals, authorizations and filings as may be required subsequent to the Closing Date, it being understood, however, that this Agreement and the transactions contemplated herein must be approved by the shareholders of the Acquired Fund as described in paragraph 5.2. |
4.2 REPRESENTATIONS OF THE ACQUIRING FUND. The Federated Trust, on behalf of the Acquiring Fund, represents and warrants to the EquiTrust Variable Fund, on behalf of the Acquired Fund, as follows:
| | a) | The Acquiring Fund is a separate series of a business trust, duly organized, validly existing and in good standing under the laws of the Commonwealth of Massachusetts. |
| | b) | The Federated Trust is registered as an open-end management investment company under the 1940 Act, and the Federated Trust’s registration with the Commission as an investment company under the 1940 Act is in full force and effect. |
| | c) | The current prospectus and statement of additional information of the Acquiring Fund conform in all material respects to the applicable requirements of the 1933 Act and the 1940 Act and the rules and regulations thereunder, and do not include any untrue statement of a material fact or omit to state any material fact required to be stated or necessary to make such statements therein, in light of the circumstances under which they were made, not misleading. |
| | d) | The Acquiring Fund is not, and the execution, delivery and performance of this Agreement will not result, in violation of the Federated Trust’s Declaration of Trust or By-Laws or of any material agreement, indenture, instrument, contract, lease, or other undertaking to which the Acquiring Fund is a party or by which it is bound. |
| | e) | Except as otherwise disclosed in writing to and accepted by the Acquired Fund, no litigation, administrative proceeding or investigation of or before any court or governmental body is presently pending or to its knowledge threatened against the Acquiring Fund or any of its properties or assets, which, if adversely determined, would materially and adversely affect its financial condition, the conduct of its business or the ability of the Acquiring Fund to carry out the transactions contemplated by this Agreement. The Acquiring Fund knows of no facts that might form the basis for the institution of such proceedings and it is not a party to or subject to the provisions of any order, decree, or judgment of any court or governmental body that materially and adversely affects its business or its ability to consummate the transaction contemplated herein. |
A1-6
| | f) | The financial statements of the Acquiring Fund as of December 31, 2010 and for the fiscal year then ended have been prepared in accordance with United States generally accepted accounting principles, and such statements (copies of which have been furnished to the Acquired Funds) fairly reflect the financial condition of the Acquiring Fund as of such date, and there are no known contingent liabilities of the Acquiring Fund as of such date that are not disclosed in such statements. |
| | g) | Since the date of the financial statements referred to in paragraph (f) above, there have been no material adverse changes in the Acquiring Fund’s financial condition, assets, liabilities or business (other than changes occurring in the ordinary course of business), or any incurrence by the Acquiring Fund of indebtedness maturing more than one year from the date such indebtedness was incurred, except as otherwise disclosed to and accepted by the Acquired Fund. For the purposes of this paragraph (g), a decline in the net asset value of the Acquiring Fund shall not constitute a material adverse change. |
| | h) | All federal and other tax returns and reports of the Acquiring Fund required by law to be filed, have been filed, and all federal and other taxes shown due on such returns and reports have been paid, or provision shall have been made for the payment thereof. To the best of the Acquiring Fund’s knowledge, no such return is currently under audit, and no assessment has been asserted with respect to such returns. |
| | i) | All issued and outstanding Acquiring Fund Shares are duly and validly issued and outstanding, fully paid and non-assessable by the Acquiring Fund. The Acquiring Fund has no outstanding options, warrants, or other rights to subscribe for or purchase any Acquiring Fund Shares, and there are no outstanding securities convertible into any Acquiring Fund Shares. |
| | j) | The execution, delivery and performance of this Agreement have been duly authorized by all necessary action on the part of the Acquiring Fund, and this Agreement constitutes a valid and binding obligation of the Acquiring Fund, enforceable in accordance with its terms, subject as to enforcement, to bankruptcy, insolvency, reorganization, moratorium, and other laws relating to or affecting creditors’ rights and to general equity principles. |
| | k) | Acquiring Fund Shares to be issued and delivered to the Acquired Fund for the account of the Acquired Fund Shareholders pursuant to the terms of this Agreement will, at the Closing Date, have been duly authorized. When so issued and delivered, such shares will be duly and validly issued Acquiring Fund Shares, and will be fully paid and non-assessable. |
| | l) | The information to be furnished by the Acquiring Fund for use in no-action letters, registration statements, proxy materials, and other documents that may be necessary in connection with the transactions contemplated herein shall be accurate and complete in all material respects and shall comply in all material respects with federal securities and other laws and regulations. |
| | m) | From the effective date of the Registration Statement (as defined in paragraph 5.7), through the time of the meeting of the Acquired Fund shareholders and on the Closing Date, any written information furnished by the Federated Trust with respect to the Acquiring Fund for use in the Proxy Materials (as defined in paragraph 5.7), or any other materials provided in connection with the Reorganization, does not and will not contain any untrue statement of a material fact or omit to state a material fact required to be stated or necessary to make the statements, in light of the circumstances under which such statements were made, not misleading. |
| | n) | The Acquiring Fund has qualified and elected to be treated as a RIC under the Code as of and since its first taxable year of operations; and qualifies and shall continue to qualify as a RIC under the Code for its current taxable year. |
| | o) | No governmental consents, approvals, authorizations or filings are required under the 1933 Act, the 1934 Act, the 1940 Act or Massachusetts law for the execution of this Agreement by the Federated Trust, for itself and on behalf of the Acquiring Fund, or the performance of the Agreement by the Federated Trust, for itself and on behalf of the Acquiring Fund, except for the effectiveness of the Registration Statement, and |
A1-7
| | the filing of any articles, certificates or other documents that may be required under Massachusetts law, and such other consents, approvals, authorizations and filings as have been made or received, and except for such consents, approvals, authorizations and filings as may be required subsequent to the Closing Date. |
| | p) | The Acquiring Fund agrees to use all reasonable efforts to obtain the approvals and authorizations required by the 1933 Act, the 1940 Act, and any state Blue Sky or securities laws as it may deem appropriate in order to continue its operations after the Closing Date. |
ARTICLE V
COVENANTS OF THE ACQUIRING FUND AND THE ACQUIRED FUND
5.1 OPERATION IN ORDINARY COURSE. The Acquiring Fund and the Acquired Fund will each operate its respective business in the ordinary course between the date of this Agreement and the Closing Date, it being understood that such ordinary course of business will include customary dividends and shareholder purchases and redemptions.
5.2 APPROVAL OF SHAREHOLDERS. The EquiTrust Variable Fund will call a special meeting of the Acquired Fund shareholders to consider and act upon this Agreement and to take all other appropriate action necessary to obtain approval of the transactions contemplated herein.
5.3 INVESTMENT REPRESENTATION. The Acquired Fund covenants that the Acquiring Fund Shares to be issued pursuant to this Agreement are not being acquired for the purpose of making any distribution, other than in connection with the Reorganization and in accordance with the terms of this Agreement.
5.4 ADDITIONAL INFORMATION. The Acquired Fund will assist the Acquiring Fund in obtaining such information as the Acquiring Fund reasonably requests concerning the beneficial ownership of the Acquired Fund’s shares.
5.5 FURTHER ACTION. Subject to the provisions of this Agreement, the Acquiring Fund and the Acquired Fund will each take or cause to be taken, all action, and do or cause to be done, all things reasonably necessary, proper or advisable to consummate and make effective the transactions contemplated by this Agreement, including any actions required to be taken after the Closing Date.
5.6 STATEMENT OF EARNINGS AND PROFITS. As promptly as practicable, but in any case within sixty days after the Closing Date, the Acquired Fund shall furnish the Acquiring Fund, in such form as is reasonably satisfactory to the Acquiring Fund, a statement of the earnings and profits of the Acquired Fund for federal income tax purposes that will be carried over by the Acquiring Fund as a result of Section 381 of the Code, and which will be certified by EquiTrust Variable Fund’s Treasurer.
5.7 PREPARATION OF REGISTRATION STATEMENT AND SCHEDULE 14A PROXY STATEMENT. The Federated Trust will prepare and file with the Commission a registration statement on Form N-14 relating to the Acquiring Fund Shares to be issued to shareholders of the Acquired Fund (the “Registration Statement”). The Registration Statement on Form N-14 shall include a proxy statement and a prospectus of the Acquiring Fund relating to the transaction contemplated by this Agreement. The Registration Statement shall be in compliance with the 1933 Act, the 1934 Act and the 1940 Act, as applicable. Each party will provide the other party with the materials and information necessary to prepare the registration statement on Form N-14 (the “Proxy Materials”), for inclusion therein, in connection with the meeting of the Acquired Fund’s shareholders to consider the approval of this Agreement and the transactions contemplated herein.
5.8 On or before the Closing Date, the Acquired Fund shall have declared and paid a dividend or dividends which, together with all previous such dividends, shall have the effect of distributing to its shareholders all of the Acquired Fund’s investment company taxable income (computed without regard to any deduction for dividends paid), if any, plus the excess, if any, of its interest income excludible from gross income under Section 103(a) of the Code over its deductions disallowed under Sections 265 and 171(a)(2) of the Code for all taxable
A1-8
periods or years ending on or before the Closing Date, and all of its net capital gains realized (after reduction for any capital loss carry forward), if any, in all taxable periods or years ending on or before the Closing Date.
5.9 It is the intention of the parties that the transaction will qualify as a reorganization within the meaning of Section 368(a) of the Code. None of the Federated Trust, EquiTrust, the Acquiring Fund or the Acquired Fund shall take any action or cause and action to be taken (including, without limitation, the filing of any tax return) that is inconsistent with such treatment or that results in the failure of the transaction to qualify as a reorganization within the meaning of Section 368(a) of the Code. At or prior to the Closing Date, the parties to this Agreement will take such reasonable action, or cause such action to be taken, as is reasonably necessary to enable K&L Gates LLP to render the tax opinion contemplated in this Agreement.
ARTICLE VI
CONDITIONS PRECEDENT TO OBLIGATIONS OF THE ACQUIRED FUND
The obligations of the Acquired Fund to consummate the transactions provided for herein shall be subject, at its election, to the performance by the Acquiring Fund of all the obligations to be performed by the Acquiring Fund pursuant to this Agreement on or before the Closing Date, and, in addition, subject to the following conditions:
All representations, covenants, and warranties of the Acquiring Fund contained in this Agreement shall be true and correct in all material respects as of the date hereof and as of the Closing Date, with the same force and effect as if made on and as of the Closing Date. The Acquiring Fund shall have delivered to the Acquired Fund a certificate executed in the Acquiring Fund’s name by the Federated Trust’s President or Vice President and its Treasurer, in form and substance satisfactory to the Acquired Fund and dated as of the Closing Date, to such effect and as to such other matters as the Acquired Fund shall reasonably request.
ARTICLE VII
CONDITIONS PRECEDENT TO OBLIGATIONS OF THE ACQUIRING FUND
The obligations of the Acquiring Fund to consummate the transactions provided for herein shall be subject, at its election, to the performance by the Acquired Fund of all the obligations to be performed by the Acquired Fund pursuant to this Agreement, on or before the Closing Date and, in addition, shall be subject to the following conditions:
All representations, covenants, and warranties of the Acquired Fund contained in this Agreement shall be true and correct in all material respects as of the date hereof and as of the Closing Date, with the same force and effect as if made on and as of such Closing Date. The Acquired Fund shall have delivered to the Acquiring Fund on such Closing Date a certificate executed in the Acquired Fund’s name by the EquiTrust Variable Fund’s President or Vice President and the Treasurer, in form and substance satisfactory to the Acquiring Fund and dated as of such Closing Date, to such effect and as to such other matters as the Acquiring Fund shall reasonably request.
The Acquired Fund shall have delivered to the Acquiring Fund a statement of the Acquired Fund’s assets and liabilities, together with a list of the Acquired Fund’s portfolio securities showing the tax costs of such securities by lot and the holding periods of such securities, as of the Closing Date, certified by the Treasurer of the EquiTrust Variable Fund.
ARTICLE VIII
FURTHER CONDITIONS PRECEDENT TO OBLIGATIONS OF THE
ACQUIRING FUND AND ACQUIRED FUND
If any of the conditions set forth below do not exist on or before the Closing Date with respect to the Acquired Fund or the Acquiring Fund, the other party to this Agreement shall, at its option, not be required to consummate the transactions contemplated by this Agreement:
A1-9
8.1 This Agreement and the transactions contemplated herein, with respect to the Acquired Fund, shall have been approved by the requisite vote of the holders of the outstanding shares of the Acquired Fund in accordance with applicable law and the provisions of the EquiTrust Variable Fund’s Declaration of Trust and By-Laws. Certified copies of the resolutions evidencing such approval shall have been delivered to the Acquiring Fund. Notwithstanding anything herein to the contrary, neither the Acquiring Fund nor the Acquired Fund may waive the conditions set forth in this paragraph 8.1.
8.2 On the Closing Date, the Commission shall not have issued an unfavorable report under Section 25(b) of the 1940 Act, or instituted any proceeding seeking to enjoin the consummation of the transactions contemplated by this Agreement under Section 25(c) of the 1940 Act. Furthermore, no action, suit or other proceeding shall be threatened or pending before any court or governmental agency in which it is sought to restrain or prohibit, or obtain damages or other relief in connection with this Agreement or the transactions contemplated herein.
8.3 All required consents of other parties and all other consents, orders, and permits of federal, state and local regulatory authorities (including those of the Commission and of State securities authorities, including any necessary “no-action” positions and exemptive orders from such federal and state authorities) to permit consummation of the transactions contemplated herein shall have been obtained, except where failure to obtain any such consent, order, or permit would not involve a risk of a material adverse effect on the assets or properties of the Acquiring Fund or the Acquired Fund, provided that either party hereto may waive any such conditions for itself.
8.4 The Registration Statement shall have become effective under the 1933 Act, and no stop orders suspending the effectiveness thereof shall have been issued. To the best knowledge of the parties to this Agreement, no investigation or proceeding for that purpose shall have been instituted or be pending, threatened or contemplated under the 1933 Act.
8.5 The parties shall have received an opinion of K&L Gates LLP to the effect that for federal income tax purposes:
| | a) | The transfer of substantially all of the Acquired Fund’s assets to the Acquiring Fund solely in exchange for Acquiring Fund Shares (followed by the distribution of Acquiring Fund Shares to the Acquired Fund Shareholders in dissolution and liquidation of the Acquired Fund) will constitute a “reorganization” within the meaning of Section 368(a) of the Code, and the Acquiring Fund and the Acquired Fund will each be a “party to a reorganization” within the meaning of Section 368(b) of the Code. |
| | b) | No gain or loss will be recognized by the Acquiring Fund upon the receipt of substantially all the assets of the Acquired Fund solely in exchange for Acquiring Fund Shares. |
| | c) | No gain or loss will be recognized by the Acquired Fund upon the transfer of substantially all the Acquired Fund’s assets to the Acquiring Fund solely in exchange for Acquiring Fund Shares or upon the distribution (whether actual or constructive) of Acquiring Fund Shares to Acquired Fund Shareholders in exchange for their Acquired Fund Shares. |
| | d) | No gain or loss will be recognized by any Acquired Fund Shareholder upon the exchange of its Acquired Fund Shares for Acquiring Fund Shares. |
| | e) | The aggregate basis of the Acquiring Fund Shares received by each Acquired Fund shareholder pursuant to the Reorganization will be the same as the aggregate tax basis of the Acquired Fund Shares exchanged therefor. The holding period of Acquiring Fund Shares received by each Acquired Fund Shareholder will include the period during which the Acquired Fund Shares exchanged therefor were held by such shareholder, provided the Acquired Fund Shares are held by such shareholder as capital assets at the time of the Reorganization. |
| | f) | The basis of the Acquired Fund’s assets acquired by the Acquiring Fund in the hands of the Acquiring Fund will be the same as the basis of such assets in the hands of the Acquired Fund immediately prior to |
A1-10
| | the Reorganization. The holding period of the assets of the Acquired Fund acquired by the Acquiring Fund in the hands of the Acquiring Fund will include the period during which those assets were held by the Acquired Fund. |
Such opinion shall be based on customary assumptions and such representations K&L Gates LLP may reasonably request, and the Acquired Fund and Acquiring Fund will cooperate to make and certify the accuracy of such representations. The foregoing opinion may state that no opinion is expressed as to the effect of the Reorganization on the Acquiring Fund, the Acquired Fund or any Acquired Fund Shareholder with respect to any asset as to which unrealized gain or loss is required to be recognized for federal income tax purposes at the end of a taxable year (or on the termination or transfer thereof) under a mark-to-market system of accounting. Notwithstanding anything herein to the contrary, neither the Acquiring Fund nor the Acquired Fund may waive the conditions set forth in this paragraph 8.5.
ARTICLE IX
EXPENSES
All fees and expenses associated with the Acquiring Fund’s and Acquired Fund’s participation in the Reorganization contemplated in this Agreement will be paid by Federated Investment Management Company, EquiTrust Investment Management Services, Inc. and/or their affiliates, as agreed separately among them. Reorganization expenses include, without limitation: (a) expenses associated with the preparation and filing of the Proxy Materials; (b) postage; (c) printing; (d) accounting fees; (e) legal fees incurred by each Fund; (f) solicitation costs of the transaction; (g) fees and expenses incurred by the EquiTrust Variable Fund’s Trustees in connection with any special Board meetings held in contemplation of the Reorganizations; (h) tail insurance coverage for the EquiTrust Variable Fund’s Trustees; and (i) other related administrative or operational costs. Notwithstanding the foregoing, fees and expenses shall in any event be paid by the party directly incurring such fees and expenses if and to the extent that the payment of such fees and expenses by Federated Investment Management Company, EquiTrust Investment Management Services, Inc. and/or their affiliates would result in disqualification of such party as a RIC.
ARTICLE X
ENTIRE AGREEMENT; SURVIVAL OF WARRANTIES
10.1 The Federated Trust, on behalf of the Acquiring Fund, and the EquiTrust Variable Fund, on behalf of the Acquired Fund, agree that neither party has made to the other party any representation, warranty and/or covenant not set forth herein, and that this Agreement constitutes the entire agreement between the parties.
10.2 Except as specified in the next sentence set forth in this paragraph 10.2, the representations, warranties, and covenants contained in this Agreement or in any document delivered pursuant to or in connection with this Agreement, shall not survive the consummation of the transactions contemplated hereunder. The covenants to be performed after the Closing Date, shall continue in effect beyond the consummation of the transactions contemplated hereunder.
ARTICLE XI
TERMINATION
This Agreement may be terminated by the mutual agreement of the Federated Trust and EquiTrust Variable. In addition, either the Federated Trust or the EquiTrust Variable Fund may at its option terminate this Agreement at or before the Closing Date due to:
| | a) | a breach by the other of any representation, warranty, or agreement contained herein to be performed at or before the Closing Date, if not cured within 30 days; |
A1-11
| | b) | a condition herein expressed to be precedent to the obligations of the terminating party that has not been met and it reasonably appears that it will not or cannot be met; or |
| | c) | a determination by a party’s Board, as appropriate, that the consummation of the transactions contemplated herein is not in the best interest of the EquiTrust Variable Fund or the Federated Trust, respectively, and notice given to the other party hereto. |
In the event of any such termination, in the absence of willful default, there shall be no liability for damages on the part of any of the Acquiring Fund, the Acquired Fund, the Federated Trust, the EquiTrust Variable Fund, or their respective Trustees or officers, to the other party or its Trustees or officers.
ARTICLE XII
AMENDMENTS
This Agreement may be amended, modified, or supplemented in such manner as may be mutually agreed upon in writing by the officers of the EquiTrust Variable Fund and the Federated Trust as specifically authorized by their respective Boards; provided, however, that following the meeting of the Acquired Fund shareholders called by the Acquired Fund pursuant to paragraph 5.2 of this Agreement, no such amendment may have the effect of changing the provisions for determining the number of Acquiring Fund Shares to be issued to the Acquired Fund Shareholders under this Agreement to the detriment of such shareholders without their further approval.
ARTICLE XIII
HEADINGS; COUNTERPARTS; GOVERNING LAW; ASSIGNMENT;
LIMITATION OF LIABILITY
The Article and paragraph headings contained in this Agreement are for reference purposes only and shall not affect in any way the meaning or interpretation of this Agreement.
This Agreement may be executed in any number of counterparts, each of which shall be deemed an original.
This Agreement shall be governed by and construed in accordance with the laws of the Commonwealth of Pennsylvania.
This Agreement shall bind and inure to the benefit of the parties hereto and their respective successors and assigns, but, except as provided in this paragraph, no assignment or transfer hereof or of any rights or obligations hereunder shall be made by any party without the written consent of the other party. Nothing herein expressed or implied is intended or shall be construed to confer upon or give any person, firm, or corporation, other than the parties hereto and their respective successors and assigns, any rights or remedies under or by reason of this Agreement.
It is expressly agreed that the obligations of the Acquiring Fund hereunder shall not be binding upon any of the Trustees, shareholders, nominees, officers, agents, or employees of the Federated Trust personally, but shall bind only the Federated Trust property of the Acquiring Fund, as provided in the Declaration of Trust of the Federated Trust. The execution and delivery of this Agreement have been authorized by the Trustees of the Federated Trust on behalf of the Acquiring Fund and signed by authorized officers of the Federated Trust, acting as such. Neither the authorization by such Trustees nor the execution and delivery by such officers shall be deemed to have been made by any of them individually or to impose any liability on any of them personally, but shall bind only the Federated Trust property of the Acquiring Fund as provided in the Federated Trust’s Declaration of Trust.
It is expressly agreed that the obligations of the Acquired Fund hereunder shall not be binding upon any of the Trustees, shareholders, nominees, officers, agents, or employees of the EquiTrust Variable Fund personally, but shall bind only the property of the Acquired Fund, as provided in the Declaration of Trust of the EquiTrust Variable
A1-12
Fund. The execution and delivery of this Agreement have been authorized by the Trustees of the EquiTrust Variable Fund on behalf of the Acquired Fund and signed by authorized officers of the EquiTrust Variable Fund, acting as such. Neither the authorization by such Trustees nor the execution and delivery by such officers shall be deemed to have been made by any of them individually or to impose any liability on any of them personally, but shall bind only the property of the Acquired Fund as provided in the EquiTrust Variable Fund’s Declaration of Trust.
A1-13
IN WITNESS WHEREOF, the parties have duly executed this Agreement, all as of the date first written above.
|
FEDERATED INSURANCE SERIES TRUST |
on behalf of its portfolio, |
Federated Prime Money Fund II |
|
[Signature], [Title] |
|
EQUITRUST VARIABLE INSURANCE SERIES FUND on behalf of its portfolio, |
Money Market Portfolio |
|
[Signature], [Title] |
A1-14
ANNEX A-2 — FORM OF AGREEMENT AND PLAN OF REORGANIZATION, NON-MONEY MARKET FUNDS
THIS AGREEMENT AND PLAN OF REORGANIZATION (the “Agreement”) is made as of this [14th] day of [July], 2011, by and between Federated Insurance Series, a Massachusetts business trust, with its principal place of business at 5800 Corporate Drive, Pittsburgh, Pennsylvania, 15237 (the “Federated Trust”), with respect to its Federated Quality Bond Fund II (the “Acquiring Fund”), a series of the Federated Trust, and EquiTrust Variable Insurance Series Fund, a Massachusetts business trust, with its principal place of business at 5400 University Avenue, West Des Moines, Iowa 50266 (the “EquiTrust Variable Fund” with respect to its High Grade Bond Portfolio, a series of the EquiTrust Variable Fund (the “Acquired Fund” and, collectively with the Acquiring Fund, the “Funds”).
This Agreement is intended to be, and is adopted as, a plan of reorganization within the meaning of Section 368 of the United States Internal Revenue Code of 1986, as amended (the “Code”) and the Treasury Regulations promulgated thereunder. The reorganization will consist of: (i) the transfer of substantially all of the assets of the Acquired Fund to the Acquiring Fund in exchange solely for Primary Shares, no par value per share, of the Acquiring Fund (“Acquiring Fund Shares”); (ii) the distribution of Primary Shares of the Acquiring Fund to the holders of Initial Class Shares of the Acquired Fund; (iii) the distribution of Primary Shares of the Acquiring Fund to the holders of Service Class Shares of the Acquired Fund; and (iv) the liquidation of the Acquired Fund as provided herein, all upon the terms and conditions set forth in this Agreement (the “Reorganization”).
WHEREAS, the Acquiring Fund and the Acquired Fund are separate series of the Federated Trust and the EquiTrust Variable Fund, respectively, and the Federated Trust and the EquiTrust Variable Fund are open-end, registered management investment companies and the Acquired Fund owns securities that generally are assets of the character in which the Acquiring Fund is permitted to invest;
WHEREAS, the Acquiring Fund and the Acquired Fund are authorized to issue their shares of beneficial interests;
WHEREAS, the Trustees of the Federated Trust have determined that the Reorganization, with respect to the Acquiring Fund, is in the best interests of the Acquiring Fund and that the interests of the existing shareholders of the Acquiring Fund will not be diluted as a result of the Reorganization;
WHEREAS, the Trustees of the EquiTrust Variable Fund have determined that the Reorganization, with respect to the Acquired Fund, is in the best interests of the Acquired Fund;
NOW, THEREFORE, in consideration of the premises and of the covenants and agreements hereinafter set forth, the parties hereto covenant and agree as follows:
ARTICLE I
TRANSFER OF ASSETS OF THE ACQUIRED FUND IN EXCHANGE FOR ACQUIRING FUND
SHARES AND LIQUIDATION OF THE ACQUIRED FUND
1.1 THE EXCHANGE. Subject to the terms and conditions contained herein and on the basis of the representations and warranties contained herein, the Acquired Fund agrees to transfer substantially all of its assets, as set forth in paragraph 1.2, to the Acquiring Fund. In exchange, the Acquiring Fund agrees: (i) to deliver to the Acquired Fund the number of each class of full and fractional Acquiring Fund Shares, determined by (a) multiplying the shares outstanding of each class of shares of the Acquired Fund (the “Acquired Fund Shares”) by (b) the ratio computed by dividing (x) the net asset value per share of such class of Acquired Fund Shares computed in the manner and as of the time date set forth in paragraph 2.1 by (y) the net asset value per share of the corresponding class of Acquiring Fund Shares computed in the manner and as of the time and date set forth in paragraph 2.2. Holders of Initial Class Shares of the Acquired Fund will receive Primary Shares of the Acquiring Fund. Holders of Service Class Shares of the Acquired Fund also will receive Primary Shares of the Acquiring Fund. Such transactions shall take place at the closing on the Closing Date provided for in paragraph 3.1.
A2-1
1.2 ASSETS TO BE ACQUIRED. The assets of the Acquired Fund to be acquired by the Acquiring Fund shall consist of all the assets of the Acquired Fund, including, without limitation, cash, securities, commodities, interests in futures and dividends or interest receivable, owned by the Acquired Fund, other than any deferred or prepaid expenses shown as an asset on the books of the Acquired Fund on the Closing Date. Such assets not acquired by the Acquiring Fund shall be excluded from the calculation of net asset value per share of each class of the Acquired Fund Shares under this Agreement.
The Acquired Fund has provided the Acquiring Fund with its most recent audited financial statements, which contain a list of all of the Acquired Fund’s assets as of the date of such statements. The Acquired Fund hereby represents that as of the date of the execution of this Agreement, there have been no changes in its financial position as reflected in such financial statements other than those occurring in the ordinary course of business in connection with the purchase and sale of securities, the issuance and redemption of Acquired Fund Shares and the payment of normal operating expenses, dividends and capital gains distributions.
1.3 LIABILITIES TO BE DISCHARGED. The Acquired Fund will discharge all of its liabilities and obligations prior to the Closing Date.
1.4 LIQUIDATION AND DISTRIBUTION. On or as soon after the Closing Date as is conveniently practicable: (a) the Acquired Fund will distribute in complete liquidation of the Acquired Fund, pro rata to its shareholders of record, determined as of the close of business on the Closing Date (the “Acquired Fund Shareholders”), all of the Acquiring Fund Shares received by the Acquired Fund pursuant to paragraph 1.1; and (b) the Acquired Fund will thereupon proceed to dissolve and terminate as set forth in paragraph 1.8 below. Such distribution will be accomplished by the transfer of Acquiring Fund Shares credited to the account of the Acquired Fund on the books of the Acquiring Fund to open accounts on the share records of the Acquiring Fund in the name of the Acquired Fund Shareholders, and representing the respective pro rata number of Acquiring Fund Shares due such shareholders. All issued and outstanding Acquired Fund Shares will simultaneously be canceled on the books of the Acquired Fund. The Acquiring Fund shall not issue certificates representing Acquiring Fund Shares in connection with such transfer. After the Closing Date, the Acquired Fund shall not conduct any business except in connection with its termination.
1.5 OWNERSHIP OF SHARES. Ownership of Acquiring Fund Shares will be shown on the books of the Acquiring Fund’s transfer agent. Acquiring Fund Shares will be issued simultaneously to the Acquired Fund, in an amount determined under paragraph 2.3, to be distributed to Acquired Fund Shareholders.
1.6 TRANSFER TAXES. Any transfer taxes payable upon the issuance of Acquiring Fund Shares in a name other than the registered holder of the Acquired Fund Shares on the books of the Acquired Fund as of that time shall, as a condition of such issuance and transfer, be paid by the person to whom such Acquiring Fund Shares are to be issued and transferred.
1.7 REPORTING RESPONSIBILITY. Any reporting responsibility of the Acquired Fund is and shall remain the responsibility of the Acquired Fund.
1.8 TERMINATION. The Acquired Fund shall be terminated promptly following the Closing Date and the making of all distributions pursuant to paragraph 1.4.
1.9 BOOKS AND RECORDS. All books and records of the Acquired Fund, including all books and records required to be maintained under the Investment Company Act of 1940 (the “1940 Act”), and the rules and regulations thereunder, shall be available to the Acquiring Fund from and after the Closing Date and shall be turned over to the Acquiring Fund as soon as practicable following the Closing Date.
A2-2
ARTICLE II
VALUATION
2.1 VALUATION OF ACQUIRED FUND SHARES. The net asset value per share of each class of Acquired Fund Shares shall be the net asset value per share of such class of Acquired Fund Shares (excluding any assets excluded from the net asset value calculation under paragraph 2.1) computed at the closing of the Closing Date, using the valuation procedures set forth in the Federated Trust’s Declaration of Trust and the Acquiring Fund’s then current prospectus and statement of additional information, or such other valuation procedures as shall be mutually agreed upon by the parties.
2.2 VALUATION OF ACQUIRING FUND SHARES. The net asset value per share of each class of Acquiring Fund Shares shall be the net asset value per share of such class of Acquiring Fund Shares computed at the closing on the Closing Date, using the valuation procedures set forth in the Federated Trust’s Declaration of Trust and the Acquiring Fund’s then current prospectus and statement of additional information, or such other valuation procedures as shall be mutually agreed upon by the parties.
2.3 SHARES TO BE ISSUED. The number of each class of Acquiring Fund Shares to be issued (including fractional shares, if any) in exchange for the Acquired Fund’s assets, shall be determined by (a) multiplying the shares outstanding of each class of Acquired Fund Shares by (b) the ratio computed by (x) dividing the net asset value per share of such class of Acquired Fund Shares determined in accordance with paragraph 2.1 by (y) the net asset value per share of the corresponding class of Acquiring Fund Shares determined in accordance with paragraph 2.2.
2.4 DETERMINATION OF VALUE. All computations of value shall be made by State Street Bank and Trust Company, on behalf of the Acquiring Fund and the Acquired Fund.
ARTICLE III
CLOSING AND CLOSING DATE
3.1 CLOSING DATE. The closing shall occur on or about [July 15], 2011, or such other date(s) as the parties may agree to in writing (the “Closing Date”). All acts taking place at the closing shall be deemed to take place at 4:00 p.m. Eastern Time on the Closing Date unless otherwise provided herein. The closing shall be held at the offices of Federated Services Company, 1001 Liberty Avenue, Pittsburgh, Pennsylvania 15222-3779, or at such other time and/or place as the parties may agree.
3.2 CUSTODIAN’S CERTIFICATE. JP Morgan Chase Bank, N.A., as custodian for the Acquired Fund (the “Custodian”), shall deliver at the Closing a certificate of an authorized officer stating that: (a) the Acquired Fund’s portfolio securities, cash, and any other assets have been delivered in proper form to the Acquiring Fund on the Closing Date; and (b) all necessary taxes including all applicable federal and state stock transfer stamps, if any, shall have been paid, or provision for payment shall have been made, in conjunction with the delivery of portfolio securities by the Acquired Fund.
3.3 EFFECT OF SUSPENSION IN TRADING. In the event that on the scheduled Closing Date, either: (a) the NYSE or another primary exchange on which the portfolio securities of the Acquiring Fund or the Acquired Fund are purchased or sold, shall be closed to trading or trading on such exchange shall be restricted; or (b) trading or the reporting of trading on the NYSE or elsewhere shall be disrupted so that accurate appraisal of the value of the net assets of the Acquiring Fund or the Acquired Fund is impracticable, the Closing Date shall be postponed until the first Friday on which the NYSE is open following the business day on which trading is fully resumed and reporting is restored, or such other business day as the parties hereto shall agree.
3.4 TRANSFER AGENT’S CERTIFICATE. EquiTrust Investment Management Services, Inc., as transfer agent for the Acquired Fund as of the Closing Date, shall deliver at the Closing a certificate of an authorized officer stating that its records contain the names and addresses of Acquired Fund Shareholders, and the number and
A2-3
percentage ownership of outstanding shares owned by each such shareholder immediately prior to the Closing. The Acquiring Fund shall issue and deliver, or cause EquiTrust Investment Management Services, Inc., its transfer agent, to issue and deliver, a confirmation evidencing Acquiring Fund Shares to be credited on the Closing Date to the Secretary of the EquiTrust Variable Fund or provide evidence satisfactory to the Acquired Fund that the Acquiring Fund Shares have been credited to the Acquired Fund’s account on the books of the Acquiring Fund. At the Closing, each party shall deliver to the other such bills of sale, checks, assignments, share certificates, receipts and other documents, if any, as such other party or its counsel may reasonably request.
ARTICLE IV
REPRESENTATIONS AND WARRANTIES
4.1 REPRESENTATIONS OF THE ACQUIRED FUND. The EquiTrust Variable Fund, on behalf of the Acquired Fund, represents and warrants to the Federated Trust, on behalf of the Acquiring Fund, as follows:
| | a) | The Acquired Fund is a separate series of a business trust duly organized, validly existing, and in good standing under the laws of the Commonwealth of Massachusetts. The EquiTrust Variable Fund is registered as an open-end management investment company under the 1940 Act, and the Fund’s registration with the Securities and Exchange Commission (the “Commission”) as an investment company under the 1940 Act is in full force and effect. |
| | b) | The current prospectus and statement of additional information of the EquiTrust Variable Fund conform in all material respects to the applicable requirements of the Securities Act of 1933 (the “1933 Act”) and the 1940 Act, and the rules and regulations thereunder, and do not include any untrue statement of a material fact or omit to state any material fact required to be stated or necessary to make the statements therein, in light of the circumstances under which they were made, not misleading. |
| | c) | The Acquired Fund is not, and the execution, delivery, and performance of this Agreement (subject to shareholder approval) will not result, in violation of any provision of the EquiTrust Variable Fund’s Declaration of Trust or By-Laws or of any material agreement, indenture, instrument, contract, lease, or other undertaking to which the Acquired Fund is a party or by which it is bound. |
| | d) | The Acquired Fund has no material contracts or other commitments (other than this Agreement) that will be terminated with liability to it before the Closing Date, except for liabilities, if any, to be discharged as provided in paragraph 1.3 hereof. |
| | e) | Except as otherwise disclosed in writing to and accepted by the Acquiring Fund, no litigation, administrative proceeding, or investigation of or before any court or governmental body is presently pending or to its knowledge threatened against the Acquired Fund or any of its properties or assets, which, if adversely determined, would materially and adversely affect its financial condition, the conduct of its business, or the ability of the Acquired Fund to carry out the transactions contemplated by this Agreement. The Acquired Fund knows of no facts that might form the basis for the institution of such proceedings and is not a party to or subject to the provisions of any order, decree, or judgment of any court or governmental body that materially and adversely affects its business or its ability to consummate the transactions contemplated herein. |
| | f) | The audited financial statements of the Acquired Fund as of December 31 2010, and for the fiscal year then ended have been prepared in accordance with United States generally accepted accounting principles, and such statements (copies of which have been furnished to the Acquiring Fund) fairly reflect the financial condition of the Acquired Fund as of such date, and there are no known contingent liabilities of the Acquired Fund as of such date that are not disclosed in such statements. |
| | g) | Since the date of the financial statements referred to in paragraph (f) above, there have been no material adverse changes in the Acquired Fund’s financial condition, assets, liabilities or business (other than changes occurring in the ordinary course of business), or any incurrence by the Acquired Fund of |
A2-4
| | indebtedness maturing more than one year from the date such indebtedness was incurred, except as otherwise disclosed to and accepted by the Acquiring Fund. For the purposes of this paragraph (g), a decline in the net asset value of the Acquired Fund shall not constitute a material adverse change. |
| | h) | As of the date hereof, except as previously disclosed to the Acquiring Fund in writing, and except as have been corrected as required by applicable law, and to the best of the Acquired Fund’s knowledge, there have been no material miscalculations of the net asset value of the Acquired Fund or the net asset value per share of any class of shares during the twelve-month period preceding the date hereof and preceding the Closing Date, and all such calculations have been made in accordance with the applicable provisions of the 1940 Act. |
| | i) | The minute books and other similar records of the EquiTrust Variable Fund as made available to the Acquiring Fund prior to the execution of this Agreement contain a true and complete record of all action taken at all meetings and by all written consents in lieu of meetings of the shareholders of the EquiTrust Variable Fund, the EquiTrust Variable Fund’s Board of Trustees and committees of such Board. The stock transfer ledgers and other similar records of the Acquired Fund as made available to the Acquiring Fund prior to the execution of this Agreement, and as existing on the Closing Date, accurately reflect all record transfers prior to the execution of this Agreement, or the Closing Date, as applicable, in the shares of the Acquired Fund. |
| | j) | The Acquired Fund has maintained, or caused to be maintained on its behalf, all books and records required of a registered investment company in compliance with the requirements of Section 31 of the 1940 Act and rules thereunder. |
| | k) | All federal and other tax returns and reports of the Acquired Fund required by law to be filed, have been filed, and all federal and other taxes shown due on such returns and reports have been paid, or provision shall have been made for the payment thereof. To the best of the Acquired Fund’s knowledge, no such return is currently under audit, and no assessment has been asserted with respect to such returns. |
| | l) | All issued and outstanding shares of the Acquired Fund are duly and validly issued and outstanding, fully paid and non-assessable by the Acquired Fund. All of the issued and outstanding shares of the Acquired Fund will, at the time of the Closing Date, be held by the persons and in the amounts set forth in the records of the Acquired Fund’s transfer agent as provided in paragraph 3.4. The Acquired Fund has no outstanding options, warrants, or other rights to subscribe for or purchase any of the Acquired Fund Shares, and has no outstanding securities convertible into any of the Acquired Fund Shares. |
| | m) | At the Closing Date, the Acquired Fund will have good and marketable title to the Acquired Fund’s assets to be transferred to the Acquiring Fund pursuant to paragraph 1.2, and full right, power, and authority to sell, assign, transfer, and deliver such assets hereunder, free of any lien or other encumbrance, except those liens or encumbrances to which the Acquiring Fund has received notice, and, upon delivery and payment for such assets, and the filing of any articles, certificates or other documents under the laws of the Commonwealth of Massachusetts, the Acquiring Fund will acquire good and marketable title, subject to no restrictions on the full transfer of such assets, other than such restrictions as might arise under the 1933 Act, and other than as disclosed to and accepted by the Acquiring Fund. |
| | n) | The execution, delivery and performance of this Agreement have been duly authorized by all necessary action on the part of the Acquired Fund. Subject to approval by the Acquired Fund shareholders, this Agreement constitutes a valid and binding obligation of the Acquired Fund, enforceable in accordance with its terms, subject as to enforcement, to bankruptcy, insolvency, reorganization, moratorium, and other laws relating to or affecting creditors’ rights and to general equity principles. |
| | o) | The information to be furnished by the Acquired Fund for use in no-action letters, applications for orders, registration statements, proxy materials, and other documents that may be necessary in connection with the transactions contemplated herein shall be accurate and complete in all material respects and shall comply in all material respects with federal securities and other applicable laws and regulations. |
A2-5
| | p) | From the effective date of the Registration Statement (as defined in paragraph 5.7), through the time of the meeting of the Acquired Fund shareholders and on the Closing Date, any written information furnished by the EquiTrust Variable Fund with respect to the Acquired Fund for use in the Proxy Materials (as defined in paragraph 5.7), or any other materials provided in connection with the Reorganization, does not and will not contain any untrue statement of a material fact or omit to state a material fact required to be stated or necessary to make the statements, in light of the circumstances under which such statements were made, not misleading. |
| | q) | The Acquired Fund has qualified and elected to be treated as a “regulated investment company” under the Code (a “RIC”), as of and since its first taxable year of operations; and qualifies and will continue to qualify as a RIC under the Code for its taxable year ending upon its liquidation. |
| | r) | No governmental consents, approvals, authorizations or filings are required under the 1933 Act, the Securities Exchange Act of 1934 (the “1934 Act”), the 1940 Act or Massachusetts law for the execution of this Agreement by the EquiTrust Variable Fund, for itself and on behalf of the Acquired Fund, except for the effectiveness of the Registration Statement, and the filing of any articles, certificates or other documents that may be required under Massachusetts law, and except for such other consents, approvals, authorizations and filings as have been made or received, and such consents, approvals, authorizations and filings as may be required subsequent to the Closing Date, it being understood, however, that this Agreement and the transactions contemplated herein must be approved by the shareholders of the Acquired Fund as described in paragraph 5.2. |
4.2 REPRESENTATIONS OF THE ACQUIRING FUND. The Federated Trust, on behalf of the Acquiring Fund, represents and warrants to the EquiTrust Variable Fund, on behalf of the Acquired Fund, as follows:
| | a) | The Acquiring Fund is a separate series of a business trust, duly organized, validly existing and in good standing under the laws of the Commonwealth of Massachusetts. |
| | b) | The Federated Trust is registered as an open-end management investment company under the 1940 Act, and the Federated Trust’s registration with the Commission as an investment company under the 1940 Act is in full force and effect. |
| | c) | The current prospectus and statement of additional information of the Acquiring Fund conform in all material respects to the applicable requirements of the 1933 Act and the 1940 Act and the rules and regulations thereunder, and do not include any untrue statement of a material fact or omit to state any material fact required to be stated or necessary to make such statements therein, in light of the circumstances under which they were made, not misleading. |
| | d) | The Acquiring Fund is not, and the execution, delivery and performance of this Agreement will not, result in a violation of the Federated Trust’s Declaration of Trust or By-Laws or of any material agreement, indenture, instrument, contract, lease, or other undertaking to which the Acquiring Fund is a party or by which it is bound. |
| | e) | Except as otherwise disclosed in writing to and accepted by the Acquired Fund, no litigation, administrative proceeding or investigation of or before any court or governmental body is presently pending or to its knowledge threatened against the Acquiring Fund or any of its properties or assets, which, if adversely determined, would materially and adversely affect its financial condition, the conduct of its business or the ability of the Acquiring Fund to carry out the transactions contemplated by this Agreement. The Acquiring Fund knows of no facts that might form the basis for the institution of such proceedings and it is not a party to or subject to the provisions of any order, decree, or judgment of any court or governmental body that materially and adversely affects its business or its ability to consummate the transaction contemplated herein. |
A2-6
| | f) | The financial statements of the Acquiring Fund as of December 31, 2010 and for the fiscal year then ended have been prepared in accordance with United States generally accepted accounting principles, and such statements (copies of which have been furnished to the Acquired Funds) fairly reflect the financial condition of the Acquiring Fund as of such date, and there are no known contingent liabilities of the Acquiring Fund as of such date that are not disclosed in such statements. |
| | g) | Since the date of the financial statements referred to in paragraph (f) above, there have been no material adverse changes in the Acquiring Fund’s financial condition, assets, liabilities or business (other than changes occurring in the ordinary course of business), or any incurrence by the Acquiring Fund of indebtedness maturing more than one year from the date such indebtedness was incurred, except as otherwise disclosed to and accepted by the Acquired Fund. For the purposes of this paragraph (g), a decline in the net asset value of the Acquiring Fund shall not constitute a material adverse change. |
| | h) | All federal and other tax returns and reports of the Acquiring Fund required by law to be filed, have been filed, and all federal and other taxes shown due on such returns and reports have been paid, or provision shall have been made for the payment thereof. To the best of the Acquiring Fund’s knowledge, no such return is currently under audit, and no assessment has been asserted with respect to such returns. |
| | i) | All issued and outstanding Acquiring Fund Shares are duly and validly issued and outstanding, fully paid and non-assessable by the Acquiring Fund. The Acquiring Fund has no outstanding options, warrants, or other rights to subscribe for or purchase any Acquiring Fund Shares, and there are no outstanding securities convertible into any Acquiring Fund Shares. |
| | j) | The execution, delivery and performance of this Agreement have been duly authorized by all necessary action on the part of the Acquiring Fund, and this Agreement constitutes a valid and binding obligation of the Acquiring Fund, enforceable in accordance with its terms, subject as to enforcement, to bankruptcy, insolvency, reorganization, moratorium, and other laws relating to or affecting creditors’ rights and to general equity principles. |
| | k) | Acquiring Fund Shares to be issued and delivered to the Acquired Fund for the account of the Acquired Fund Shareholders pursuant to the terms of this Agreement will, at the Closing Date, have been duly authorized. When so issued and delivered, such shares will be duly and validly issued Acquiring Fund Shares, and will be fully paid and non-assessable. |
| | l) | The information to be furnished by the Acquiring Fund for use in no-action letters, registration statements, proxy materials, and other documents that may be necessary in connection with the transactions contemplated herein shall be accurate and complete in all material respects and shall comply in all material respects with federal securities and other laws and regulations. |
| | m) | From the effective date of the Registration Statement (as defined in paragraph 5.7), through the time of the meeting of the Acquired Fund shareholders and on the Closing Date, any written information furnished by the Federated Trust with respect to the Acquiring Fund for use in the Proxy Materials (as defined in paragraph 5.7), or any other materials provided in connection with the Reorganization, does not and will not contain any untrue statement of a material fact or omit to state a material fact required to be stated or necessary to make the statements, in light of the circumstances under which such statements were made, not misleading. |
| | n) | The Acquiring Fund has qualified and elected to be treated as a RIC under the Code as of and since its first taxable year of operations; and qualifies and shall continue to qualify as a RIC under the Code for its current taxable year. |
| | o) | No governmental consents, approvals, authorizations or filings are required under the 1933 Act, the 1934 Act, the 1940 Act or Massachusetts law for the execution of this Agreement by the Federated Trust, for itself and on behalf of the Acquiring Fund, or the performance of the Agreement by the Federated Trust, for itself and on behalf of the Acquiring Fund, except for the effectiveness of the Registration Statement, and |
A2-7
| | the filing of any articles, certificates or other documents that may be required under Massachusetts law, and such other consents, approvals, authorizations and filings as have been made or received, and except for such consents, approvals, authorizations and filings as may be required subsequent to the Closing Date. |
| | p) | The Acquiring Fund agrees to use all reasonable efforts to obtain the approvals and authorizations required by the 1933 Act, the 1940 Act, and any state Blue Sky or securities laws as it may deem appropriate in order to continue its operations after the Closing Date. |
ARTICLE V
COVENANTS OF THE ACQUIRING FUND AND THE ACQUIRED FUND
5.1 OPERATION IN ORDINARY COURSE. The Acquiring Fund and the Acquired Fund will each operate its respective business in the ordinary course between the date of this Agreement and the Closing Date, it being understood that such ordinary course of business will include customary dividends and shareholder purchases and redemptions.
5.2 APPROVAL OF SHAREHOLDERS. The EquiTrust Variable Fund will call a special meeting of the Acquired Fund shareholders to consider and act upon this Agreement and to take all other appropriate action necessary to obtain approval of the transactions contemplated herein.
5.3 INVESTMENT REPRESENTATION. The Acquired Fund covenants that the Acquiring Fund Shares to be issued pursuant to this Agreement are not being acquired for the purpose of making any distribution, other than in connection with the Reorganization and in accordance with the terms of this Agreement.
5.4 ADDITIONAL INFORMATION. The Acquired Fund will assist the Acquiring Fund in obtaining such information as the Acquiring Fund reasonably requests concerning the beneficial ownership of the Acquired Fund’s shares.
5.5 FURTHER ACTION. Subject to the provisions of this Agreement, the Acquiring Fund and the Acquired Fund will each take or cause to be taken, all action, and do or cause to be done, all things reasonably necessary, proper or advisable to consummate and make effective the transactions contemplated by this Agreement, including any actions required to be taken after the Closing Date.
5.6 STATEMENT OF EARNINGS AND PROFITS. As promptly as practicable, but in any case within sixty days after the Closing Date, the Acquired Fund shall furnish the Acquiring Fund, in such form as is reasonably satisfactory to the Acquiring Fund, a statement of the earnings and profits of the Acquired Fund for federal income tax purposes that will be carried over by the Acquiring Fund as a result of Section 381 of the Code, and which will be certified by the EquiTrust Variable Fund’s Treasurer.
5.7 PREPARATION OF REGISTRATION STATEMENT AND SCHEDULE 14A PROXY STATEMENT. The Federated Trust will prepare and file with the Commission a registration statement on Form N-14 relating to the Acquiring Fund Shares to be issued to shareholders of the Acquired Fund (the “Registration Statement”). The Registration Statement on Form N-14 shall include a proxy statement and a prospectus of the Acquiring Fund relating to the transaction contemplated by this Agreement. The Registration Statement shall be in compliance with the 1933 Act, the 1934 Act and the 1940 Act, as applicable. Each party will provide the other party with the materials and information necessary to prepare the registration statement on Form N-14 (the “Proxy Materials”), for inclusion therein, in connection with the meeting of the Acquired Fund’s shareholders to consider the approval of this Agreement and the transactions contemplated herein.
5.8 On or before the Closing Date, the Acquired Fund shall have declared and paid a dividend or dividends which, together with all previous such dividends, shall have the effect of distributing to its shareholders all of the Acquired Fund’s investment company taxable income (computed without regard to any deduction for dividends paid), if any, plus the excess, if any, of its interest income excludible from gross income under Section 103(a) of the Code over its deductions disallowed under Sections 265 and 171(a)(2) of the Code for all taxable
A2-8
periods or years ending on or before the Closing Date, and all of its net capital gains realized (after reduction for any capital loss carry forward), if any, in all taxable periods or years ending on or before the Closing Date.
5.9 It is the intention of the parties that the transaction will qualify as a reorganization within the meaning of Section 368(a) of the Code. None of the Federated Trust, EquiTrust, the Acquiring Fund or the Acquired Fund shall take any action or cause and action to be taken (including, without limitation, the filing of any tax return) that is inconsistent with such treatment or that results in the failure of the transaction to qualify as a reorganization within the meaning of Section 368(a) of the Code. At or prior to the Closing Date, the parties to this Agreement will take such reasonable action, or cause such action to be taken, as is reasonably necessary to enable K&L Gates LLP to render the tax opinion contemplated in this Agreement.
ARTICLE VI
CONDITIONS PRECEDENT TO OBLIGATIONS OF THE ACQUIRED FUND
The obligations of the Acquired Fund to consummate the transactions provided for herein shall be subject, at its election, to the performance by the Acquiring Fund of all the obligations to be performed by the Acquiring Fund pursuant to this Agreement on or before the Closing Date, and, in addition, subject to the following conditions:
All representations, covenants, and warranties of the Acquiring Fund contained in this Agreement shall be true and correct in all material respects as of the date hereof and as of the Closing Date, with the same force and effect as if made on and as of the Closing Date. The Acquiring Fund shall have delivered to the Acquired Fund a certificate executed in the Acquiring Fund’s name by the Federated Trust’s President or Vice President and its Treasurer, in form and substance satisfactory to the Acquired Fund and dated as of the Closing Date, to such effect and as to such other matters as the Acquired Fund shall reasonably request.
ARTICLE VII
CONDITIONS PRECEDENT TO OBLIGATIONS OF THE ACQUIRING FUND
The obligations of the Acquiring Fund to consummate the transactions provided for herein shall be subject, at its election, to the performance by the Acquired Fund of all the obligations to be performed by the Acquired Fund pursuant to this Agreement, on or before the Closing Date and, in addition, shall be subject to the following conditions:
All representations, covenants, and warranties of the Acquired Fund contained in this Agreement shall be true and correct in all material respects as of the date hereof and as of the Closing Date, with the same force and effect as if made on and as of such Closing Date. The Acquired Fund shall have delivered to the Acquiring Fund on such Closing Date a certificate executed in the Acquired Fund’s name by the EquiTrust Variable Fund’s President or Vice President and the Treasurer, in form and substance satisfactory to the Acquiring Fund and dated as of such Closing Date, to such effect and as to such other matters as the Acquiring Fund shall reasonably request.
The Acquired Fund shall have delivered to the Acquiring Fund a statement of the Acquired Fund’s assets and liabilities, together with a list of the Acquired Fund’s portfolio securities showing the tax costs of such securities by lot and the holding periods of such securities, as of the Closing Date, certified by the Treasurer of EquiTrust Variable Fund.
ARTICLE VIII
FURTHER CONDITIONS PRECEDENT TO OBLIGATIONS OF THE
ACQUIRING FUND AND ACQUIRED FUND
If any of the conditions set forth below do not exist on or before the Closing Date with respect to the Acquired Fund or the Acquiring Fund, the other party to this Agreement shall, at its option, not be required to consummate the transactions contemplated by this Agreement:
A2-9
8.1 This Agreement and the transactions contemplated herein, with respect to the Acquired Fund, shall have been approved by the requisite vote of the holders of the outstanding shares of the Acquired Fund in accordance with applicable law and the provisions of the EquiTrust Variable Fund’s Declaration of Trust and By-Laws. Certified copies of the resolutions evidencing such approval shall have been delivered to the Acquiring Fund. Notwithstanding anything herein to the contrary, neither the Acquiring Fund nor the Acquired Fund may waive the conditions set forth in this paragraph 8.1.
8.2 On the Closing Date, the Commission shall not have issued an unfavorable report under Section 25(b) of the 1940 Act, or instituted any proceeding seeking to enjoin the consummation of the transactions contemplated by this Agreement under Section 25(c) of the 1940 Act. Furthermore, no action, suit or other proceeding shall be threatened or pending before any court or governmental agency in which it is sought to restrain or prohibit, or obtain damages or other relief in connection with this Agreement or the transactions contemplated herein.
8.3 All required consents of other parties and all other consents, orders, and permits of federal, state and local regulatory authorities (including those of the Commission and of State securities authorities, including any necessary “no-action” positions and exemptive orders from such federal and state authorities) to permit consummation of the transactions contemplated herein shall have been obtained, except where failure to obtain any such consent, order, or permit would not involve a risk of a material adverse effect on the assets or properties of the Acquiring Fund or the Acquired Fund, provided that either party hereto may waive any such conditions for itself.
8.4 The Registration Statement shall have become effective under the 1933 Act, and no stop orders suspending the effectiveness thereof shall have been issued. To the best knowledge of the parties to this Agreement, no investigation or proceeding for that purpose shall have been instituted or be pending, threatened or contemplated under the 1933 Act.
8.5 The parties shall have received an opinion of K&L Gates LLP to the effect that for federal income tax purposes:
| | a) | The transfer of substantially all of the Acquired Fund’s assets to the Acquiring Fund solely in exchange for Acquiring Fund Shares (followed by the distribution of Acquiring Fund Shares to the Acquired Fund Shareholders in dissolution and liquidation of the Acquired Fund) will constitute a “reorganization” within the meaning of Section 368(a) of the Code, and the Acquiring Fund and the Acquired Fund will each be a “party to a reorganization” within the meaning of Section 368(b) of the Code. |
| | b) | No gain or loss will be recognized by the Acquiring Fund upon the receipt of substantially all the assets of the Acquired Fund solely in exchange for Acquiring Fund Shares. |
| | c) | No gain or loss will be recognized by the Acquired Fund upon the transfer of substantially all the Acquired Fund’s assets to the Acquiring Fund solely in exchange for Acquiring Fund Shares or upon the distribution (whether actual or constructive) of Acquiring Fund Shares to Acquired Fund Shareholders in exchange for their Acquired Fund Shares. |
| | d) | No gain or loss will be recognized by any Acquired Fund Shareholder upon the exchange of its Acquired Fund Shares for Acquiring Fund Shares. |
| | e) | The aggregate basis of the Acquiring Fund Shares received by each Acquired Fund Shareholder pursuant to the Reorganization will be the same as the aggregate basis of the Acquired Fund Shares exchanged therefor. The holding period of Acquiring Fund Shares received by each Acquired Fund Shareholder will include the period during which the Acquired Fund Shares exchanged therefor were held by such shareholder, provided the Acquired Fund Shares are held by such shareholder as capital assets at the time of the Reorganization. |
| | f) | The basis of the Acquired Fund’s assets acquired by the Acquiring Fund in the hands of the Acquiring Fund will be the same as the basis of such assets in the hands of the Acquired Fund immediately prior to |
A2-10
| | the Reorganization. The holding period of the assets of the Acquired Fund acquired by the Acquiring Fund in the hands of the Acquiring Fund will include the period during which those assets were held by the Acquired Fund. |
| | | Such opinion shall be based on customary assumptions and such representations K&L Gates LLP may reasonably request, and the Acquired Fund and Acquiring Fund will cooperate to make and certify the accuracy of such representations. The foregoing opinion may state that no opinion is expressed as to the effect of the Reorganization on the Acquiring Fund, the Acquired Fund or any Acquired Fund Shareholder with respect to any asset as to which unrealized gain or loss is required to be recognized for federal income tax purposes at the end of a taxable year (or on the termination or transfer thereof) under a mark-to-market system of accounting. Notwithstanding anything herein to the contrary, neither the Acquiring Fund nor the Acquired Fund may waive the conditions set forth in this paragraph 8.5. |
ARTICLE IX
EXPENSES
All fees and expenses associated with the Acquiring Fund’s and Acquired Fund’s participation in the Reorganization contemplated in this Agreement will be paid by Federated Investment Management Company, EquiTrust Investment Management Services, Inc. and/or their affiliates, as agreed separately among them. Reorganization expenses include, without limitation: (a) expenses associated with the preparation and filing of the Proxy Materials; (b) postage; (c) printing; (d) accounting fees; (e) legal fees incurred by each Fund; (f) solicitation costs of the transaction; (g) fees and expenses incurred by the EquiTrust Variable Fund’s Trustees in connection with any special Board meetings held in contemplation of the Reorganizations; (h) tail insurance coverage for the EquiTrust Variable Fund’s Trustees; and (i) other related administrative or operational costs. Notwithstanding the foregoing, fees and expenses shall in any event be paid by the party directly incurring such fees and expenses if and to the extent that the payment of such fees and expenses by Federated Investment Management Company, EquiTrust Investment Management Services, Inc. and/or their affiliates would result in disqualification of such party as a RIC.
ARTICLE X
ENTIRE AGREEMENT; SURVIVAL OF WARRANTIES
10.1 The Federated Trust, on behalf of the Acquiring Fund, and the EquiTrust Variable Fund, on behalf of the Acquired Fund, agree that neither party has made to the other party any representation, warranty and/or covenant not set forth herein, and that this Agreement constitutes the entire agreement between the parties.
10.2 Except as specified in the next sentence set forth in this paragraph 10.2, the representations, warranties, and covenants contained in this Agreement or in any document delivered pursuant to or in connection with this Agreement, shall not survive the consummation of the transactions contemplated hereunder. The covenants to be performed after the Closing Date, shall continue in effect beyond the consummation of the transactions contemplated hereunder.
Article XI
TERMINATION
This Agreement may be terminated by the mutual agreement of the Federated Trust and the EquiTrust Variable Fund. In addition, either the Federated Trust or the EquiTrust Variable Fund may at its option terminate this Agreement at or before the Closing Date due to:
| | a) | a breach by the other of any representation, warranty, or agreement contained herein to be performed at or before the Closing Date, if not cured within 30 days; |
A2-11
| | b) | a condition herein expressed to be precedent to the obligations of the terminating party that has not been met and it reasonably appears that it will not or cannot be met; or |
| | c) | a determination by a party’s Board, as appropriate, that the consummation of the transactions contemplated herein is not in the best interest of the EquiTrust Variable Fund or the Federated Trust, respectively, and notice given to the other party hereto. |
In the event of any such termination, in the absence of willful default, there shall be no liability for damages on the part of any of the Acquiring Fund, the Acquired Fund, the Federated Trust, the EquiTrust Variable Fund, or their respective Trustees or officers, to the other party or its Trustees or officers.
ARTICLE XII
AMENDMENTS
This Agreement may be amended, modified, or supplemented in such manner as may be mutually agreed upon in writing by the officers of the EquiTrust Variable Fund and the Federated Trust as specifically authorized by their respective Board of Trustees; provided, however, that following the meeting of the Acquired Fund shareholders called by the EquiTrust Variable Fund pursuant to paragraph 5.2 of this Agreement, no such amendment may have the effect of changing the provisions for determining the number of Acquiring Fund Shares to be issued to the Acquired Fund Shareholders under this Agreement to the detriment of such shareholders without their further approval.
ARTICLE XIII
HEADINGS; COUNTERPARTS; GOVERNING LAW; ASSIGNMENT;
LIMITATION OF LIABILITY
The Article and paragraph headings contained in this Agreement are for reference purposes only and shall not affect in any way the meaning or interpretation of this Agreement.
This Agreement may be executed in any number of counterparts, each of which shall be deemed an original.
This Agreement shall be governed by and construed in accordance with the laws of the Commonwealth of Pennsylvania.
This Agreement shall bind and inure to the benefit of the parties hereto and their respective successors and assigns, but, except as provided in this paragraph, no assignment or transfer hereof or of any rights or obligations hereunder shall be made by any party without the written consent of the other party. Nothing herein expressed or implied is intended or shall be construed to confer upon or give any person, firm, or corporation, other than the parties hereto and their respective successors and assigns, any rights or remedies under or by reason of this Agreement.
It is expressly agreed that the obligations of the Acquiring Fund hereunder shall not be binding upon any of the Trustees, shareholders, nominees, officers, agents, or employees of the Federated Trust personally, but shall bind only the Federated Trust property of the Acquiring Fund, as provided in the Declaration of Trust of the Federated Trust. The execution and delivery of this Agreement have been authorized by the Trustees of the Federated Trust on behalf of the Acquiring Fund and signed by authorized officers of the Federated Trust, acting as such. Neither the authorization by such Trustees nor the execution and delivery by such officers shall be deemed to have been made by any of them individually or to impose any liability on any of them personally, but shall bind only the Federated Trust property of the Acquiring Fund as provided in the Federated Trust’s Declaration of Trust.
It is expressly agreed that the obligations of the Acquired Fund hereunder shall not be binding upon any of the Trustees, shareholders, nominees, officers, agents, or employees of the EquiTrust Variable Fund personally, but
A2-12
shall bind only the property of the Acquired Fund, as provided in the Declaration of Trust of the EquiTrust Variable Fund. The execution and delivery of this Agreement have been authorized by the Trustees of the EquiTrust Variable Fund on behalf of the Acquired Fund and signed by authorized officers of the EquiTrust Variable Fund, acting as such. Neither the authorization by such Trustees nor the execution and delivery by such officers shall be deemed to have been made by any of them individually or to impose any liability on any of them personally, but shall bind only the property of the Acquired Fund as provided in the EquiTrust Variable Fund’s Declaration of Trust.
A2-13
IN WITNESS WHEREOF, the parties have duly executed this Agreement, all as of the date first written above.
|
| FEDERATED INSURANCE SERIES TRUST |
| on behalf of its portfolio, |
| Federated Quality Bond Fund II |
|
[Signature], [Title] |
|
EQUITRUST VARIABLE INSURANCE SERIES FUND on behalf of its portfolio, |
| High Grade Bond Portfolio |
|
[Signature], [Title] |
A2-14
ANNEX B
Each Fund has fundamental investment limitations which may not be changed without shareholder approval. The following chart compares the fundamental limitations of the EquiTrust Variable Portfolios and the Federated Insurance Funds. While shareholder approval is required to change a fundamental limitation, non-fundamental limitations may be changed by a Fund’s Board.
| | |
| INVESTMENT LIMITATIONS |
| Money Market Portfolio | | Federated Prime Money Fund II |
Issuing Senior Securities (fundamental) The Portfolio may not issue senior securities, except as appropriate to evidence indebtedness which a Portfolio is permitted to incur pursuant to the borrowing of money. Borrowing (fundamental) The Portfolio may not borrow money, except from banks for temporary or emergency purposes, and in no event in excess of 5% of its total assets, or pledge or mortgage more than 15% of its total assets. | | Issuing Senior Securities and Borrowing Money (fundamental) The Fund may borrow money, directly or indirectly, and issue senior securities to the maximum extent permitted under the Investment Company Act of 1940 (1940 Act). |
Lending Cash or Securities (fundamental) The Portfolio may not lend money or securities (the making of demand deposits with banks, and the purchase of securities such as bonds, debentures, commercial paper and short-term obligations in accordance with the Portfolio’s investment objectives and policies, shall not be considered the making of a loan). The Portfolio may not lend its portfolio securities in excess of 20% of its net assets or in a manner inconsistent with the guidelines set forth under “Investment Objectives, Policies and Techniques” in the Portfolio’s Statement of Additional Information. | | Lending Cash or Securities (fundamental) The Fund may not make loans, provided that this restriction does not prevent the Fund from purchasing debt obligations, entering into repurchase agreements, lending its assets to broker/dealers or institutional investors and investing in loans, including assignments and participation interests. |
Investing in Commodities and Real Estate (fundamental) The Portfolio may not purchase or sell (although it may purchase securities of issuers which invest or deal in) interests in oil, gas or other mineral exploration or development programs, real estate, commodities or commodity contracts. | | Investing in Real Estate (fundamental) The Fund may not purchase or sell real estate, provided that this restriction does not prevent the Fund from investing in issuers which invest, deal, or otherwise engage in transactions in real estate or interests therein, or investing in securities that are secured by real estate or interests therein. The Fund may exercise its rights under agreements relating to such securities, including the right to enforce security interests and to hold real estate acquired by reason of such enforcement until that real estate can be liquidated in an orderly manner. Investing in Commodities (fundamental) The Fund may not purchase or sell physical commodities, provided that the Fund may purchase securities of companies that deal in commodities. |
Diversification of Investments (fundamental) With respect to all of its securities, the Portfolio may not purchase securities of any issuer (other than U.S. Government securities or government agency securities) if, as a result, more than 5% of the value of the Portfolio’s | | Diversification of Investments (fundamental) With respect to securities comprising 75% of the value of its total assets, the Fund will not purchase securities of any one issuer (other than cash; cash items; securities issued or guaranteed by the government of the United |
B-1
| | |
| INVESTMENT LIMITATIONS |
| Money Market Portfolio | | Federated Prime Money Fund II |
assets (taken at the time of investment) would be invested in securities of that issuer. The Portfolio may not purchase more than 10% of any class of securities of any issuer (other than U.S. Government securities or government agency securities). For the purpose of this restriction, all outstanding debt securities of an issuer shall be deemed a single class of security and all preferred stocks of an issuer shall be deemed a single class of security. | | States or its agencies or instrumentalities and repurchase agreements collateralized by such U.S. government securities; and securities of other investment companies) if, as a result, more than 5% of the value of its total assets would be invested in the securities of that issuer, or the Fund would own more than 10% of the outstanding voting securities of that issuer. |
Concentration of Investments (fundamental) The Portfolio may not purchase any security, if, immediately after such purchase, more than 25% of the Portfolio’s total net assets would be invested in issuers in the same industry. This restriction does not apply to U.S. Government securities, government agency securities, obligations of banks or savings institutions, or to instruments secured by these instruments, such as repurchase agreements for U.S. Government securities (these instruments are described in Appendix A to the Prospectus). | | Concentration of Investments (non-fundamental) The Fund may not purchase the securities of any issuer (other than securities issued or guaranteed by the U.S. Government or any of its agencies or instrumentalities) if, as a result, more than 25% of the Fund’s total assets would be invested in the securities of companies whose principal business activities are in the same industry, except that the Fund will invest more than 25% of it total assets in the financial services industry. |
Underwriting (fundamental) The Portfolio may not underwrite securities issued by others, except to the extent that it may be deemed to be a statutory underwriter in the sale of restricted securities which require registration under the Securities Act of 1933 before resale. | | Underwriting (fundamental) The Fund may not underwrite the securities of other issuers, except that the Fund may engage in transactions involving the acquisition, disposition or resale of its portfolio securities, under circumstances where it may be considered to be an underwriter under the Securities Act of 1933. |
Additional Fundamental Restrictions The Portfolio may not: Purchase any securities on margin (except that the Portfolio may obtain such short-term credit as may be necessary for the clearance of purchases and sales of portfolio securities) or make short sales unless, by virtue of its ownership of other securities, it has the right to obtain securities equivalent in kind and amount to the securities sold and, if the right is conditional, the sale is made upon the same condition. Purchase securities of other investment companies, except (i) by purchase in the open market involving only customary brokers’ commissions and only if immediately thereafter not more than 5% of such Portfolio’s total net assets would be invested in such securities, or (ii) as part of a merger, consolidation or acquisition of assets. Purchase or retain securities of any issuer if any of the | | Additional Fundamental Restrictions None |
B-2
| | |
| INVESTMENT LIMITATIONS |
| Money Market Portfolio | | Federated Prime Money Fund II |
Fund’s officers or trustees or any of the investment adviser’s officers or directors own individually more than 0.50% of the securities of such issuer and together own more than 5% of the securities of such issuer. Participate on a joint (or a joint and several) basis in any trading account in securities (but this does not include the “bunching” of orders for the sale or purchase of portfolio securities with the other Portfolios or with other investment company and client accounts managed by the Fund’s investment adviser or its affiliates to reduce brokerage commissions or otherwise to achieve best overall execution). Write, purchase or sell puts, calls or combinations thereof, other than writing covered call options. Alone, or together with any other Portfolios, make investments for the purpose of exercising control over, or management of, any issuer. Invest in foreign securities. | | |
| | |
| INVESTMENT LIMITATIONS |
| High Grade Bond and Strategic Yield Portfolios | | Federated Quality Bond Fund II |
Issuing Senior Securities and Borrowing Money (fundamental) The Portfolio may not issue senior securities, except as appropriate to evidence indebtedness which a Portfolio is permitted to incur pursuant to the borrowing of money. Borrowing (fundamental) The Portfolio may not borrow money, except from banks for temporary or emergency purposes, and in no event in excess of 5% of its total assets, or pledge or mortgage more than 15% of its total assets. | | Issuing Senior Securities and Borrowing Money (fundamental) The Fund will not issue senior securities except that the Fund may borrow money and engage in reverse repurchase agreements in amounts up to one-third of the value of its total assets, including the amounts borrowed. The Fund will not borrow money or engage in reverse repurchase agreements for investment leverage, but rather as a temporary, extraordinary or emergency measure to facilitate management of the portfolio by enabling the Fund to meet redemption requests when the liquidation of portfolio securities is deemed to be inconvenient or disadvantageous. The Fund will not purchase any securities while borrowings in excess of 5% of the value of the Fund’s total assets are outstanding. Pledging Assets (fundamental) The Fund will not mortgage, pledge or hypothecate any assets except to secure permitted borrowings. In those cases, it may mortgage, pledge or hypothecate assets having a market value not exceeding the lesser of the dollar amounts borrowed or 15% of the value of total |
B-3
| | |
| INVESTMENT LIMITATIONS |
| High Grade Bond and Strategic Yield Portfolios | | Federated Quality Bond Fund II |
| | | assets at the time of the borrowing. For purposes of this limitation, the following are not deemed to be pledges: margin deposits for the purchase and sale of futures contracts and related options, and segregation or collateral arrangements made in connection with options activities or the purchase of securities on a when-issued basis. |
Lending Cash or Securities (fundamental) The Portfolio may not lend money or securities (the making of demand deposits with banks, and the purchase of securities such as bonds, debentures, commercial paper and short-term obligations in accordance with the Portfolio’s investment objectives and policies, shall not be considered the making of a loan). The Portfolio may not lend its portfolio securities in excess of 20% of its net assets or in a manner inconsistent with the guidelines set forth under “Investment Objectives, Policies and Techniques” in the Portfolio’s Statement of Additional Information. | | Lending Cash or Securities (fundamental) The Fund will not lend any of its assets, except portfolio securities up to one-third of the value of its total assets. This shall not prevent the Fund from purchasing or holding U.S. government obligations, money market instruments, variable rate demand notes, bonds, debentures, notes, certificates of indebtedness, or other debt securities, entering into repurchase agreements, or engaging in other transactions where permitted by the Fund’s investment objective, policies or limitations. |
Investing in Commodities and Real Estate (fundamental) The Portfolio may not purchase or sell (although it may purchase securities of issuers which invest or deal in) interests in oil, gas or other mineral exploration or development programs, real estate, commodities or commodity contracts. | | Investing in Real Estate (fundamental) The Fund will not purchase or sell real estate, including limited partnership interests in real estate, although it may invest in the securities of companies whose business involves the purchase or sale of real estate or in securities which are secured by real estate or interests in real estate. Investing in Commodities (fundamental) The Fund will not purchase or sell commodities, commodity contracts or commodity futures contracts except to the extent that the Fund may engage in transactions involving futures contracts and related options. |
Diversification of Investments (fundamental) As to 75% of the value of each Portfolio’s assets, the Portfolio may not purchase securities of any issuer (other than U.S. Government securities or government agency securities) if, as a result, more than 5% of the value of the Portfolio’s assets (taken at the time of investment) would be invested in securities of that issuer. The Portfolio may not purchase more than 10% of any class of securities of any issuer (other than U.S. Government securities or government agency securities). For the purpose of this restriction, all outstanding debt securities of an issuer shall be deemed a single class of security and all preferred stocks of an issuer shall be deemed a single class of security. | | Diversification of Investments (fundamental) With respect to securities comprising 75% of the value of its total assets, the Fund will not purchase securities issued by any one issuer (other than cash, cash items or securities issued or guaranteed by the government of the United States or its agencies or instrumentalities and repurchase agreements collateralized by such securities) if as a result more than 5% of the value of its total assets would be invested in the securities of that issuer. Also, the Fund will not acquire more than 10% of the outstanding voting securities of any one issuer. |
B-4
| | |
| INVESTMENT LIMITATIONS |
| High Grade Bond and Strategic Yield Portfolios | | Federated Quality Bond Fund II |
Concentration of Investments (fundamental) The Portfolio may not purchase any security, if, immediately after such purchase, more than 25% of the Portfolio’s total net assets would be invested in issuers in the same industry. This restriction does not apply to U.S. Government securities, government agency securities, obligations of banks or savings institutions, or to instruments secured by these instruments, such as repurchase agreements for U.S. Government securities (these instruments are described in Appendix A to the Prospectus). | | Concentration of Investments (fundamental) The Fund will not invest 25% or more of the value of its total assets in any one industry except that the Fund may invest 25% or more of the value of its total assets in securities issued or guaranteed by the U.S. government, its agencies or instrumentalities, and repurchase agreements collateralized by such securities. |
Underwriting (fundamental) The Portfolio may not underwrite securities issued by others, except to the extent that it may be deemed to be a statutory underwriter in the sale of restricted securities which require registration under the Securities Act of 1933 before resale. | | Underwriting (fundamental) The Fund will not underwrite any issue of securities, except as it may be deemed to be an underwriter under the Securities Act of 1933 in connection with the sale of restricted securities which the Fund may purchase pursuant to its investment objective, policies and limitations. |
Selling Short and Buying on Margin (fundamental) The Portfolio may not purchase any securities on margin (except that the Portfolio may obtain such short-term credit as may be necessary for the clearance of purchases and sales of portfolio securities) or make short sales unless, by virtue of its ownership of other securities, it has the right to obtain securities equivalent in kind and amount to the securities sold and, if the right is conditional, the sale is made upon the same condition. | | Selling Short and Buying on Margin (fundamental) The Fund will not sell any securities short or purchase any securities on margin, but may obtain such short-term credits as may be necessary for clearance of purchases and sales of portfolio securities. The deposit or payment by the Fund of initial or variation margin in connection with futures contracts or related options transactions is not considered the purchase of a security on margin. |
Additional Fundamental Restrictions The Portfolio may not: Purchase securities of other investment companies, except (i) by purchase in the open market involving only customary brokers’ commissions and only if immediately thereafter not more than 5% of such Portfolio’s total net assets would be invested in such securities, or (ii) as part of a merger, consolidation or acquisition of assets. Purchase or retain securities of any issuer if any of the Fund’s officers or trustees or any of the investment adviser’s officers or directors own individually more than 0.50% of the securities of such issuer and together own more than 5% of the securities of such issuer. Participate on a joint (or a joint and several) basis in any trading account in securities (but this does not include the “bunching” of orders for the sale or purchase of portfolio securities with the other Portfolios or with other investment company and client accounts managed | | Additional Fundamental Restrictions None |
B-5
| | |
| INVESTMENT LIMITATIONS |
| High Grade Bond and Strategic Yield Portfolios | | Federated Quality Bond Fund II |
by the Fund’s investment adviser or its affiliates to reduce brokerage commissions or otherwise to achieve best overall execution). Write, purchase or sell puts, calls or combinations thereof, other than writing covered call options. Alone, or together with any other Portfolios, make investments for the purpose of exercising control over, or management of, any issuer. Invest more than 25% of its net assets in foreign debt securities. | | |
| | |
| INVESTMENT LIMITATIONS |
| Managed Portfolio | | Federated Capital Income Fund II |
Issuing Senior Securities (fundamental) The Portfolio may not issue senior securities, except as appropriate to evidence indebtedness which a Portfolio is permitted to incur pursuant to the borrowing of money. Borrowing (fundamental) The Portfolio may not borrow money, except from banks for temporary or emergency purposes, and in no event in excess of 5% of its total assets, or pledge or mortgage more than 15% of its total assets. | | Issuing Senior Securities and Borrowing Money (fundamental) The Fund may borrow money, directly or indirectly, and issue senior securities to the maximum extent permitted under the Investment Company Act of 1940 (1940 Act). |
Lending Cash or Securities (fundamental) The Portfolio may not lend money or securities (the making of demand deposits with banks, and the purchase of securities such as bonds, debentures, commercial paper and short-term obligations in accordance with the Portfolio’s investment objectives and policies, shall not be considered the making of a loan). The Portfolio may not lend its portfolio securities in excess of 20% of its net assets or in a manner inconsistent with the guidelines set forth under “Investment Objectives, Policies and Techniques” in the Portfolio’s Statement of Additional Information. | | Lending Cash or Securities (fundamental) The Fund may not make loans, provided that this restriction does not prevent the Fund from purchasing debt obligations, entering into repurchase agreements, lending its assets to broker/dealers or institutional investors and investing in loans, including assignments and participation interests. |
Investing in Commodities and Real Estate (fundamental) The Portfolio may not purchase or sell (although it may purchase securities of issuers which invest or deal in) interests in oil, gas or other mineral exploration or development programs, real estate, commodities or commodity contracts. | | Investing in Real Estate (fundamental) The Fund may not purchase or sell real estate, provided that this restriction does not prevent the Fund from investing in issuers which invest, deal, or otherwise engage in transactions in real estate or interests therein, or investing in securities that are secured by real estate or interests therein. The Fund may exercise its rights under agreements relating to such securities, including the right to enforce security interests and to hold real estate acquired by reason of such enforcement until that real estate can be liquidated in an orderly manner. |
B-6
| | |
| INVESTMENT LIMITATIONS |
| Managed Portfolio | | Federated Capital Income Fund II |
| | | Investing in Commodities (fundamental) The Fund may not purchase or sell physical commodities, provided that the Fund may purchase securities of companies that deal in commodities. |
Diversification of Investments (fundamental) As to 75% of the value of the Portfolio’s total assets, the Portfolio may not purchase securities of any issuer (other than U.S. Government securities or government agency securities) if, as a result, more than 5% of the value of the Portfolio’s assets (taken at the time of investment) would be invested in securities of that issuer. The Portfolio may not purchase more than 10% of any class of securities of any issuer (other than U.S. Government securities or government agency securities). For the purpose of this restriction, all outstanding debt securities of an issuer shall be deemed a single class of security and all preferred stocks of an issuer shall be deemed a single class of security. | | Diversification of Investments (fundamental) With respect to securities comprising 75% of the value of its total assets, the Fund will not purchase securities of any one issuer (other than cash; cash items; securities issued or guaranteed by the government of the United States or its agencies or instrumentalities and repurchase agreements collateralized by such U.S. government securities; and securities of other investment companies) if, as a result, more than 5% of the value of its total assets would be invested in the securities of that issuer, or the Fund would own more than 10% of the outstanding voting securities of that issuer. |
B-7
| | |
| INVESTMENT LIMITATIONS |
| Managed Portfolio | | Federated Capital Income Fund II |
Concentration of Investments (fundamental) The Portfolio may not purchase any security, if, immediately after such purchase, more than 25% of the Portfolio’s total net assets would be invested in issuers in the same industry. This restriction does not apply to U.S. Government securities, government agency securities, obligations of banks or savings institutions, or to instruments secured by these instruments, such as repurchase agreements for U.S. Government securities (these instruments are described in Appendix A to the Prospectus). | | Concentration of Investments (fundamental) The Fund will not make investments that will result in the concentration of its investments in the securities of issuers primarily engaged in the same industry, provided that the Fund may concentrate its investments in the securities of issuers in the utilities industry. Government securities, municipal securities and bank instruments will not be deemed to constitute an industry. |
Underwriting (fundamental) The Portfolio may not underwrite securities issued by others, except to the extent that it may be deemed to be a statutory underwriter in the sale of restricted securities which require registration under the Securities Act of 1933 before resale. | | Underwriting (fundamental) The Fund may not underwrite the securities of other issuers, except that the Fund may engage in transactions involving the acquisition, disposition or resale of its portfolio securities, under circumstances where it may be considered to be an underwriter under the Securities Act of 1933. |
Additional Fundamental Restrictions The Portfolio may not: Purchase any securities on margin (except that the Portfolio may obtain such short-term credit as may be necessary for the clearance of purchases and sales of portfolio securities) or make short sales unless, by virtue of its ownership of other securities, it has the right to obtain securities equivalent in kind and amount to the securities sold and, if the right is conditional, the sale is made upon the same condition. Purchase securities of other investment companies, except (i) by purchase in the open market involving only customary brokers’ commissions and only if immediately thereafter not more than 5% of such Portfolio’s total net assets would be invested in such securities, or (ii) as part of a merger, consolidation or acquisition of assets. Purchase or retain securities of any issuer if any of the Fund’s officers or trustees or any of the investment adviser’s officers or directors own individually more than 0.50% of the securities of such issuer and together own more than 5% of the securities of such issuer. Participate on a joint (or a joint and several) basis in any trading account in securities (but this does not include the “bunching” of orders for the sale or purchase of portfolio securities with the other Portfolios or with other investment company and client accounts managed by the Fund’s investment adviser or its affiliates to | | Additional Fundamental Restrictions None |
B-8
| | |
| INVESTMENT LIMITATIONS |
| Managed Portfolio | | Federated Capital Income Fund II |
reduce brokerage commissions or otherwise to achieve best overall execution). Write, purchase or sell puts, calls or combinations thereof, other than writing covered call options. Alone, or together with any other Portfolios, make investments for the purpose of exercising control over, or management of, any issuer. Invest more than 25% of its net assets in foreign equity and debt securities. | | |
| | |
| INVESTMENT LIMITATIONS |
| Value Growth and Blue Chip Portfolios | | Federated Capital Appreciation Fund II |
Issuing Senior Securities (fundamental) The Portfolio may not issue senior securities, except as appropriate to evidence indebtedness which a Portfolio is permitted to incur pursuant to the borrowing of money. Borrowing (fundamental) The Portfolio may not borrow money, except from banks for temporary or emergency purposes, and in no event in excess of 5% of its total assets, or pledge or mortgage more than 15% of its total assets. | | Issuing Senior Securities and Borrowing Money (fundamental) The Fund may borrow money, directly or indirectly, and issue senior securities to the maximum extent permitted under the Investment Company Act of 1940 (1940 Act). |
Lending Cash or Securities (fundamental) The Portfolio may not lend money or securities (the making of demand deposits with banks, and the purchase of securities such as bonds, debentures, commercial paper and short-term obligations in accordance with the Portfolio’s investment objectives and policies, shall not be considered the making of a loan). The Portfolio may not lend its portfolio securities in excess of 20% of its net assets or in a manner inconsistent with the guidelines set forth under “Investment Objectives, Policies and Techniques” in the Portfolio’s Statement of Additional Information. | | Lending Cash or Securities (fundamental) The Fund may not make loans, provided that this restriction does not prevent the Fund from purchasing debt obligations, entering into repurchase agreements, lending its assets to broker/dealers or institutional investors and investing in loans, including assignments and participation interests. |
Investing in Commodities and Real Estate (fundamental) The Portfolio may not purchase or sell (although it may purchase securities of issuers which invest or deal in) interests in oil, gas or other mineral exploration or development programs, real estate, commodities or commodity contracts. | | Investing in Real Estate (fundamental) The Fund may not purchase or sell real estate, provided that this restriction does not prevent the Fund from investing in issuers which invest, deal, or otherwise engage in transactions in real estate or interests therein, or investing in securities that are secured by real estate or interests therein. The Fund may exercise its rights under agreements relating to such securities, including the right to enforce security interests and to hold real estate acquired by reason of such enforcement until |
B-9
| | |
| INVESTMENT LIMITATIONS |
| Value Growth and Blue Chip Portfolios | | Federated Capital Appreciation Fund II |
| | | that real estate can be liquidated in an orderly manner. Investing in Commodities (fundamental) The Fund may not purchase or sell physical commodities, provided that the Fund may purchase securities of companies that deal in commodities. |
Diversification of Investments (fundamental) As to 75% of the value of the Portfolio’s total assets, the Portfolio may not purchase securities of any issuer (other than U.S. Government securities or government agency securities) if, as a result, more than 5% of the value of the Portfolio’s assets (taken at the time of investment) would be invested in securities of that issuer. The Portfolio may not purchase more than 10% of any class of securities of any issuer (other than U.S. Government securities or government agency securities). For the purpose of this restriction, all outstanding debt securities of an issuer shall be deemed a single class of security and all preferred stocks of an issuer shall be deemed a single class of security. | | Diversification of Investments (fundamental) With respect to securities comprising 75% of the value of its total assets, the Fund will not purchase securities of any one issuer (other than cash; cash items; securities issued or guaranteed by the government of the United States or its agencies or instrumentalities and repurchase agreements collateralized by such U.S. government securities; and securities of other investment companies) if, as a result, more than 5% of the value of its total assets would be invested in the securities of that issuer, or the Fund would own more than 10% of the outstanding voting securities of that issuer. |
B-10
| | |
| INVESTMENT LIMITATIONS |
| Value Growth and Blue Chip Portfolios | | Federated Capital Appreciation Fund II |
Concentration of Investments (fundamental) The Portfolio may not purchase any security, if, immediately after such purchase, more than 25% of the Portfolio’s total net assets would be invested in issuers in the same industry. This restriction does not apply to U.S. Government securities, government agency securities, obligations of banks or savings institutions, or to instruments secured by these instruments, such as repurchase agreements for U.S. Government securities (these instruments are described in Appendix A to the Prospectus). | | Concentration of Investments (fundamental) The Fund will not make investments that will result in the concentration of its investments in the securities of issuers primarily engaged in the same industry, provided that the Fund may concentrate its investments in the securities of issuers in the utilities industry. Government securities, municipal securities and bank instruments will not be deemed to constitute an industry. |
Underwriting (fundamental) The Portfolio may not underwrite securities issued by others, except to the extent that it may be deemed to be a statutory underwriter in the sale of restricted securities which require registration under the Securities Act of 1933 before resale. | | Underwriting (fundamental) The Fund may not underwrite the securities of other issuers, except that the Fund may engage in transactions involving the acquisition, disposition or resale of its portfolio securities, under circumstances where it may be considered to be an underwriter under the Securities Act of 1933. |
Additional Fundamental Restrictions The Portfolio may not: Purchase any securities on margin (except that the Portfolio may obtain such short-term credit as may be necessary for the clearance of purchases and sales of portfolio securities) or make short sales unless, by virtue of its ownership of other securities, it has the right to obtain securities equivalent in kind and amount to the securities sold and, if the right is conditional, the sale is made upon the same condition. Purchase securities of other investment companies, except (i) by purchase in the open market involving only customary brokers’ commissions and only if immediately thereafter not more than 5% of such Portfolio’s total net assets would be invested in such securities, or (ii) as part of a merger, consolidation or acquisition of assets. Purchase or retain securities of any issuer if any of the Fund’s officers or trustees or any of the investment adviser’s officers or directors own individually more than 0.50% of the securities of such issuer and together own more than 5% of the securities of such issuer. Participate on a joint (or a joint and several) basis in any trading account in securities (but this does not include the “bunching” of orders for the sale or purchase of portfolio securities with the other Portfolios or with other investment company and client accounts managed by the Fund’s investment adviser or its affiliates to | | Additional Fundamental Restrictions None |
B-11
| | |
| INVESTMENT LIMITATIONS |
| Value Growth and Blue Chip Portfolios | | Federated Capital Appreciation Fund II |
reduce brokerage commissions or otherwise to achieve best overall execution). Write, purchase or sell puts, calls or combinations thereof, other than writing covered call options. Alone, or together with any other Portfolios, make investments for the purpose of exercising control over, or management of, any issuer. Invest in foreign securities, except that Value Growth Portfolio may invest up to 25% of its net assets in foreign equity and debt securities. | | |
B-12
STATEMENT OF ADDITIONAL INFORMATION
[May 16], 2011
Acquisition of the assets of
MONEY MARKET PORTFOLIO
HIGH GRADE BOND PORTFOLIO
STRATEGIC YIELD PORTFOLIO
MANAGED PORTFOLIO
VALUE GROWTH PORTFOLIO
BLUE CHIP PORTFOLIO
portfolios of EQUITRUST VARIABLE INSURANCE SERIES FUND
5400 University Avenue
West Des Moines, Iowa 50266
Telephone No: 1-877-860-2904
By and in exchange for shares of:
FEDERATED PRIME MONEY FUND II
FEDERATED QUALITY BOND FUND II
FEDERATED CAPITAL INCOME FUND II
or
FEDERATED CAPITAL APPRECIATION FUND II
each a portfolio of:
FEDERATED INSURANCE SERIES
4000 Ericsson Drive
Warrendale, Pennsylvania, 15086-7561
Telephone No: 1-800-341-7400
This Statement of Additional Information (“SAI”) dated [May 16], 2011, is not a prospectus. A Prospectus/Proxy Statement dated [May 16], 2011, related to the above-referenced matter may be obtained from the Federated Funds, on behalf of each above-listed Fund, by writing or calling the Federated Funds at the address and telephone number shown above. This SAI should be read in conjunction with such Prospectus/Proxy Statement.
TABLE OF CONTENTS
| 1. | SAI of EquiTrust Variable Insurance Series Fund (the “EquiTrust Variable Fund”), dated May 1, 2010. |
| 2. | SAI of Federated Insurance Series (the “Federated Insurance Funds”), dated April 30, 2010. |
| 3. | Audited Financial Statements of the EquiTrust Variable Fund, dated December 31, 2010. |
| 4. | Audited Financial Statements of the Federated Insurance Funds, dated December 31, 2010. |
| 5. | Pro Forma Financial Information for the following reorganizations: |
Pursuant to Item 14(2) of Form N-14, the pro forma financial statements required by Rule 11-01 of Regulation S-X are not prepared for the following reorganization because the net asset value of the company being acquired does not exceed ten percent of the acquiring fund’s net asset value, measured at March 31, 2011:
| A. | Acquisition of Money Market Portfolio by Federated Prime Money Market Fund II. |
INFORMATION INCORPORATED BY REFERENCE
The SAI of the EquiTrust Variable Fund, dated May 1, 2010, is incorporated by reference to Post-Effective Amendment No. 32 to the Funds’ Registration Statement on Form N-1A (File No. 811-05069), which was filed with the Securities and Exchange Commission (the “SEC”) on or about April 29, 2010. A copy may be obtained from the EquiTrust Variable Fund at 5400 University Avenue, West Des Moines, Iowa 50266 or by calling 1-877-860-2904.
The SAI of the Federated Insurance Funds, dated April 30, 2010, is incorporated by reference to Post-Effective Amendment No. 55 to the Funds’ Registration Statement on Form N-1A (File No. 811-8042), which was filed with the SEC on or about April 23, 2010. A copy may be obtained from Federated Investors Funds, 4000 Ericsson Drive, Warrendale, Pennsylvania 15086-7561 or by calling 1-800-341-7400.
The audited financial statements of the EquiTrust Variable Fund, dated December 31, 2010, are incorporated by reference to the Annual Report to shareholders of the Funds that was filed with the SEC on Form N-CSR pursuant to the Investment Company Act of 1940, as amended (the “1940 Act”), on or about February 23, 2011.
2
The audited financial statements of the Federated Insurance Funds, dated December 31, 2010, are incorporated by reference to the Annual Report to shareholders of the Funds that was filed with the SEC on Form N-CSR pursuant to the 1940 Act, on or about February 24, 2011.
PRO FORMA FINANCIAL STATEMENTS
FOR THE PERIOD ENDED DECEMBER 31, 2010 (UNAUDITED)
| A. | Acquisition of High Grade Bond Portfolio by Federated Quality Bond Fund II |
INTRODUCTION
The accompanying unaudited Pro Forma Combining Portfolios of Investments, Statements of Assets and Liabilities and Statements of Operations (“Pro Forma Financial Statements”) reflect the accounts of High Grade Bond Portfolio and Federated Quality Bond Fund II (individually referred to as the “Fund” or collectively as the “Funds”), for the period ended December 31, 2010. High Grade Bond Portfolio will be reorganized into Federated Quality Bond Fund II as of the close of business on or about [July 15], 2011. For the purposes of these Pro Forma Financial Statements, the financial information covers the period from January 1, 2010 to December 31, 2010. These statements have been derived from the books and records utilized in calculating daily net asset values at December 31, 2010.
The Pro Forma Financial Statements give effect to the proposed exchange of assets of Initial Class Shares and Service Class Shares of High Grade Bond Portfolio for Primary Shares of Federated Quality Bond Fund II. Under generally accepted accounting principles, Federated Quality Bond Fund II will be the surviving entity for accounting purposes with its historical cost of investment securities and results of operations being carried forward.
The Pro Forma Financial Statements have been adjusted to reflect the anticipated advisory fee arrangement for the surviving entity. Certain other operating costs have also been adjusted to reflect anticipated expenses of the combined entity. Other costs which may change as a result of the reorganization currently are undeterminable.
[Remainder of page intentionally left blank.]
3
High Grade Bond Portfolio
Federated Quality Bond Fund II
Pro Forma Combining Portfolio of Investments
December 31, 2010 (unaudited)
| | | | | | | | | | | | | | | | | | |
High Grade Bond Portfolio | | Federated
Quality
Bond Fund II | | Federated
Quality
Bond Fund II Pro Forma
Combined | | | | High Grade
Bond
Portfolio | | | Federated
Quality
Bond Fund II | | | Federated
Quality Bond Fund II Pro Forma
Combined | |
| | | | |
| Shares or Principal Amount | | | | | | | Value | | | | |
CORPORATE BONDS – 88.0% | | | | | | | | | | | | | | |
Basic Industry - Chemicals - 3.6% | | | | | | | | | | | | | | |
$0 | | $1,970,000 | | $1,970,000 | | Albernarle Corp., Sr. Note, 5.10%, 2/1/2015 | | $ | 0 | | | $ | 2,109,607 | | | $ | 2,109,607 | |
0 | | 320,000 | | 320,000 | | Du Pont (E.I.) de Nemours & Co., 6.00%, 7/15/2018 | | | 0 | | | | 368,368 | | | | 368,368 | |
1,500,000 | | 0 | | 1,500,000 | | Du Pont (E.I.) de Nemours & Co., 4.625%, 1/15/2020 | | | 1,586,280 | | | | 0 | | | | 1,586,280 | |
0 | | 300,000 | | 300,000 | | Eastman Chemical Co., Sr. Unsecd. Not, 5.50%, 11/15/2019 | | | 0 | | | | 317,755 | | | | 317,755 | |
0 | | 410,000 | | 410,000 | | (1)(2) Incitec Pivot Finance LLC, Company Guarantee, 4.00%, 12/7/2015 | | | 0 | | | | 403,111 | | | | 403,111 | |
0 | | 800,000 | | 800,000 | | (1)(2) Incitec Pivot Finance LLC, Company Guarantee, Series 144A, 6.00%, 12/10/2019 | | | 0 | | | | 814,174 | | | | 814,174 | |
1,500,000 | | 0 | | 1,500,000 | | Merck & Co., Inc. 5.00%, 6/30/2019 | | | 1,661,295 | | | | 0 | | | | 1,661,295 | |
1,800,000 | | 0 | | 1,800,000 | | Pfizer, Inc., 5.35%, 3/15/2015 | | | 2,025,486 | | | | 0 | | | | 2,025,486 | |
0 | | 1,290,000 | | 1,290,000 | | RPM International, Inc., 6.50%, 2/15/2018 | | | 0 | | | | 1,379,353 | | | | 1,379,353 | |
0 | | 1,030,000 | | 1,030,000 | | RPM International, Inc., Sr. Unsecd. Note, 6.125%, 10/15/2019 | | | 0 | | | | 1,068,788 | | | | 1,068,788 | |
0 | | 395,000 | | 395,000 | | Rohm & Haas Co., 6.00%, 9/15/2017 | | | 0 | | | | 432,903 | | | | 432,903 | |
| | | | | | | | | | | | | | | | | | |
| | | | | | TOTAL | | | 5,273,061 | | | | 6,894,059 | | | | 12,167,120 | |
| | | | | | | | | | | | | | | | | | |
| | | | |
Basic Industry - Metals & Mining - 3.8% | | | | | | | | | | | | | | |
0 | | 100,000 | | 100,000 | | (1)(2) Anglo American Capital PLC, Company Guarantee, Series 144A, 4.45%m 9/27/2020 | | | 0 | | | | 100,418 | | | | 100,418 | |
0 | | 300,000 | | 300,000 | | Anglogold Ashanti Holdings PLC, Sr. Note, 6.50%, 4/15/2040 | | | 0 | | | | 307,693 | | | | 307,693 | |
0 | | 760,000 | | 760,000 | | ArcelorMittal, 6.125%, 6/1/2018 | | | 0 | | | | 810,979 | | | | 810,979 | |
0 | | 1,300,000 | | 1,300,000 | | ArcelorMittal, Sr. Unsecd. Note, 5.25%, 8/5/2020 | | | 0 | | | | 1,287,602 | | | | 1,287,602 | |
4
| | | | | | | | | | | | | | | | | | |
0 | | 940,000 | | 940,000 | | Barrick Gold Corp., Sr. Unsecd Note, 6.95%, 4/1/2019 | | | 0 | | | | 1,155,291 | | | | 1,155,291 | |
0 | | 1,020,000 | | 1,020,000 | | (1)(2) Gerdau S.A., Company Guarantee, Series 144A, 5.75%, 1/30/2021 | | | 0 | | | | 1,027,650 | | | | 1,027,650 | |
0 | | 700,000 | | 700,000 | | (1)(2) Gold Fields Orogen Holding BVI Ltd., Company Guarantee, Series 144Am 4.875%, 10/7/2020 | | | 0 | | | | 670,921 | | | | 670,921 | |
0 | | 1,810,000 | | 1,810,000 | | Newmont Mining Corp., Company Guarantee, 5.875%, 4/1/2035 | | | 0 | | | | 1,897,658 | | | | 1,897,658 | |
0 | | 435,000 | | 435,000 | | Rio Tinto Finance USA Ltd., Company Guarantee, 6.50%, 7/15/2018 | | | 0 | | | | 506,547 | | | | 506,547 | |
0 | | 1,000,000 | | 1,000,000 | | Rio Tinto Finance USA Ltd., Company Guarantee, 8.95%, 5/1/2014 | | | 0 | | | | 1,212,048 | | | | 1,212,048 | |
0 | | 1,430,000 | | 1,430,000 | | Worthington Industries, Inc., Sr. Unsecd. Note, 6.50%, 4/15/2020 | | | 0 | | | | 1,502,306 | | | | 1,502,306 | |
0 | | 1,000,000 | | 1,000,000 | | Xstrata Canada Corp., 6.00%, 10/15/2015 | | | 0 | | | | 1,095,925 | | | | 1,095,925 | |
0 | | 1,200,000 | | 1,200,000 | | (1)(2) Xstrata Finance Canada Ltd., Unsecd. Note, 5.50%, 11/16/2011 | | | 0 | | | | 1,235,732 | | | | 1,235,732 | |
| | | | | | | | | | | | | | | | | | |
| | | | | | TOTAL | | | 0 | | | | 12,810,770 | | | | 12,810,770 | |
| | | | | | | | | | | | | | | | | | |
Basic Industry - Paper - 1.1% | | | | | | | | | | | | |
0 | | 640,000 | | 640,000 | | International Paper Co., Bond, 7.30%, 11/15/2039 | | | 0 | | | | 732,797 | | | | 732,797 | |
0 | | 450,000 | | 450,000 | | International Paper Co., Sr. Unsecd. Note, 7.50%, 8/15/2021 | | | 0 | | | | 531,709 | | | | 531,709 | |
0 | | 460,000 | | 460,000 | | Plum Creek Timberlands LP, Sr. Unsecd. Note, 4.70%, 3/15/2021 | | | 0 | | | | 438,658 | | | | 438,658 | |
0 | | 400,000 | | 400,000 | | Westvaco Corp., 7.65%, 3/15/2027 | | | 0 | | | | 407,794 | | | | 407,794 | |
0 | | 1,500,000 | | 1,500,000 | | Westvaco Corp., Sr. Deb., 7.50%, 6/15/2027 | | | 0 | | | | 1,517,047 | | | | 1,517,047 | |
| | | | | | | | | | | | | | | | | | |
| | | | | | TOTAL | | | 0 | | | | 3,628,005 | | | | 3,628,005 | |
| | | | | | | | | | | | | | | | | | |
Capital Goods - Aerospace & Defense - 0.5% | | | | | | | | | | | | |
0 | | 500,000 | | 500,000 | | Embraer Overseas Ltd., Sr. Unsecd. Note, 6.375%, 1/24/2017 | | | 0 | | | | 526,250 | | | | 526,250 | |
0 | | 690,000 | | 690,000 | | Goodrich Corp., 4.875%, 3/1/2020 | | | 0 | | | | 722,969 | | | | 722,969 | |
0 | | 430,000 | | 430,000 | | (1)(2) Meccanica Holdings USA, Inc., Company Guarantee, Series 144A, 6.25%, 1/15/2040 | | | 0 | | | | 405,115 | | | | 405,115 | |
| | | | | | | | | | | | | | | | | | |
| | | | | | TOTAL | | | 0 | | | | 1,654,334 | | | | 1,654,334 | |
| | | | | | | | | | | | | | | | | | |
Capital Goods - Building Materials - 0.4% | | | | | | | | | | | | |
0 | | 620,000 | | 620,000 | | Masco Corp., Sr. Unsecd. Note, 7.125%, 3/15/2020 | | | 0 | | | | 651,468 | | | | 651,468 | |
5
| | | | | | | | | | | | | | | | | | |
0 | | 720,000 | | 720,000 | | Valmont Industries, Inc., Sr. Unsecd. Note, 6.625%, 4/20/2020 | | | 0 | | | | 750,305 | | | | 750,305 | |
| | | | | | | | | | | | | | | | | | |
| | | | | | TOTAL | | | 0 | | | | 1,401,773 | | | | 1,401,773 | |
| | | | | | | | | | | | | | | | | | |
Capital Goods - Diversified Manufacturing - 3.4% | | | | | | | | | | | | |
0 | | 360,000 | | 360,000 | | Avery Dennison Corp., Sr. Unsecd. Note, 5.375%, 4/15/2020 | | | 0 | | | | 376,190 | | | | 376,190 | |
0 | | 1,045,000 | | 1,045,000 | | Harsco Corp., 5.75%, 5/15/2018 | | | 0 | | | | 1,143,142 | | | | 1,143,142 | |
0 | | 1,350,000 | | 1,350,000 | | Hubbell, Inc., 5.95%, 6/1/2018 | | | 0 | | | | 1,512,566 | | | | 1,512,566 | |
0 | | 1,118,000 | | 1,118,000 | | (1)(2) Hutchison Whampoa International Ltd., 6.50%, 2/13/2013 | | | 0 | | | | 1,222,351 | | | | 1,222,351 | |
0 | | 500,000 | | 500,000 | | Ingersoll-Rand Global Holding Co. Ltd., 6.875%, 8/15/2018 | | | 0 | | | | 575,724 | | | | 575,724 | |
0 | | 1,240,000 | | 1,240,000 | | Roper Industries, Inc., 6.625%, 8/15/2013 | | | 0 | | | | 1,382,872 | | | | 1,382,872 | |
0 | | 1,910,000 | | 1,910,000 | | (1)(2) Textron Financial Corp., Jr. Sub. Note, 6.00%, 2/15/2067 | | | 0 | | | | 1,635,437 | | | | 1,635,437 | |
0 | | 400,000 | | 400,000 | | Thomas & Betts Corp., sr. Unsecd. Note, 5.625%, 11/15/2021 | | | 0 | | | | 424,370 | | | | 424,370 | |
0 | | 1,930,000 | | 1,930,000 | | Tyco Electronics Group SA, 5.95%, 1/15/2014 | | | 0 | | | | 2,133,259 | | | | 2,133,259 | |
0 | | 1,000,000 | | 1,000,000 | | Tyco International Finance SA, Note, 4.125%, 10/15/2014 | | | 0 | | | | 1,060,598 | | | | 1,060,598 | |
| | | | | | | | | | | | | | | | | | |
| | | | | | TOTAL | | | 0 | | | | 11,466,509 | | | | 11,466,509 | |
| | | | | | | | | | | | | | | | | | |
Capital Goods - Environmental - 0.4% | | | | | | | | | | | | |
0 | | 770,000 | | 770,000 | | Republic Services, Inc., Company Guarantee, series WI, 5.50%, 9/15/2019 | | | 0 | | | | 842,428 | | | | 842,428 | |
0 | | 575,000 | | 575,000 | | Waste Management, Inc., 7.375%, 3/11/2019 | | | 0 | | | | 698,182 | | | | 698,182 | |
| | | | | | | | | | | | | | | | | | |
| | | | | | TOTAL | | | 0 | | | | 1,540,610 | | | | 1,540,610 | |
| | | | | | | | | | | | | | | | | | |
Capital Goods - Packaging - 0.2% | | | | | | | | | | | | |
0 | | 650,000 | | 650,000 | | Sonoco Products Co., Sr. Unsecd. Note, 5.75%, 11/1/2040 | | | 0 | | | | 629,328 | | | | 629,328 | |
| | | | | | | | | | | | | | | | | | |
Communications - Media & Cable - 0.8% | | | | | | | | | | | | |
1,000,000 | | 0 | | 1,000,000 | | DIRECTV Holdings LLC, 6.375%, 6/15/2015 | | | 1,036,190 | | | | 0 | | | | 1,036,190 | |
0 | | 1,450,000 | | 1,450,000 | | Time Warner Cable, Inc., Sr. Unsecd. Note, 5.85%, 5/1/2017 | | | 0 | | | | 1,619,112 | | | | 1,619,112 | |
| | | | | | | | | | | | | | | | | | |
| | | | | | TOTAL | | | 1,036,190 | | | | 1,619,112 | | | | 2,655,302 | |
| | | | | | | | | | | | | | | | | | |
Communications - Media Noncable - 0.5% | | | | | | | | | | | | |
0 | | 250,000 | | 250,000 | | Discovery Communications LLC, Company Guarantee, 5.05%, 6/1/2020 | | | 0 | | | | 264,863 | | | | 264,863 | |
6
| | | | | | | | | | | | | | | | | | |
0 | | 530,000 | | 530,000 | | Moody’s Corp., Sr. Unsecd. Note, 5.50%, 9/1/2020 | | | 0 | | | | 524,621 | | | | 524,621 | |
0 | | 1,100,000 | | 1,100,000 | | (1)(2) Pearson Funding Two PLC, Sr. Unsecd. Note, Series 144A, 4.00%, 5/17/2016 | | | 0 | | | | 1,111,771 | | | | 1,111,771 | |
| | | | | | | | | | | | | | | | | | |
| | | | | | TOTAL | | | 0 | | | | 1,901,255 | | | | 1,901,255 | |
| | | | | | | | | | | | | | | | | | |
Communications - Telecom Wireless - 2.9% | | | | | | | | | | | | |
0 | | 1,800,000 | | 1,800,000 | | AT&T Wireless Services, Inc., 8.75%, 3/1/2031 | | | 0 | | | | 2,459,975 | | | | 2,459,975 | |
0 | | 1,590,000 | | 1,590,000 | | America Movil S.A.B. de C.V., Note, 5.75%, 1/15/2015 | | | 0 | | | | 1,767,881 | | | | 1,767,881 | |
0 | | 1,000,000 | | 1,000,000 | | American Tower Corp., Sr. Unsecd. Note, 4.50%, 1/15/2018 | | | 0 | | | | 992,744 | | | | 992,744 | |
0 | | 2,300,000 | | 2,300,000 | | (1)(2) Crown Castle Towers LLC, Sr. Secd. Note, Series 144A, 5.495%, 1/15/2017 | | | 0 | | | | 2,406,320 | | | | 2,406,320 | |
0 | | 720,000 | | 720,000 | | (1)(2) SBA Tower Trust, Series 144A, 5.101%, 4/15/2017 | | | 0 | | | | 742,315 | | | | 742,315 | |
0 | | 1,295,000 | | 1,295,000 | | Vodafone Group PLC, Note, 5.625%, 2/27/2017 | | | 0 | | | | 1,448,065 | | | | 1,448,065 | |
| | | | | | | | | | | | | | | | | | |
| | | | | | TOTAL | | | 0 | | | | 9,817,300 | | | | 9,817,300 | |
| | | | | | | | | | | | | | | | | | |
Communications - Telecom Wirelines - 2.3% | | | | | | | | | | | | |
0 | | 1,000,000 | | 1,000,000 | | CenturyLink, Inc., Sr. Note, 6.15%, 9/15/2019 | | | 0 | | | | 1,004,698 | | | | 1,004,698 | |
0 | | 1,000,000 | | 1,000,000 | | Deutsche Telekom International Finance BV, 4.875%, 7/8/2014 | | | 0 | | | | 1,076,413 | | | | 1,076,413 | |
0 | | 1,000,000 | | 1,000,000 | | (1)(2) KT Corp., Note, 5.875%, 6/24/2014 | | | 0 | | | | 1,076,896 | | | | 1,076,896 | |
0 | | 1,000,000 | | 1,000,000 | | Rogers Communications, Inc., Company Guarantee, 6.80%, 8/15/2018 | | | 0 | | | | 1,201,479 | | | | 1,201,479 | |
0 | | 250,000 | | 250,000 | | Telefonica SA, Company Guarantee, 7.045%, 6/20/2036 | | | 0 | | | | 257,798 | | | | 257,798 | |
0 | | 1,600,000 | | 1,600,000 | | Verizon Communications, Inc., Unsecd. Note, 6.10%, 4/15/2018 | | | 0 | | | | 1,820,964 | | | | 1,820,964 | |
0 | | 1,000,000 | | 1,000,000 | | Verizon Communications, Inc., Unsecd. Note, 6.35%, 4/1/2019 | | | 0 | | | | 1,159,190 | | | | 1,159,190 | |
| | | | | | | | | | | | | | | | | | |
| | | | | | TOTAL | | | 0 | | | | 7,597,438 | | | | 7,597,438 | |
| | | | | | | | | | | | | | | | | | |
Consumer Cyclical - Automotive - 1.0% | | | | | | | | | | | | |
0 | | 990,000 | | 990,000 | | (1)(2) Hyundai Capital Services, Inc., Note, Series 144A, 6.00%, 5/5/2015 | | | 0 | | | | 1,074,942 | | | | 1,074,942 | |
0 | | 505,000 | | 505,000 | | Johnson Controls, Inc., Sr. Unsecd. Note, 5.00%, 3/30/2020 | | | 0 | | | | 538,015 | | | | 538,015 | |
0 | | 1,860,000 | | 1,860,000 | | (1)(2) Nissan Motor Acceptance Corp., Note, 4.50%, 1/30/2015 | | | 0 | | | | 1,928,953 | | | | 1,928,953 | |
| | | | | | | | | | | | | | | | | | |
| | | | | | TOTAL | | | 0 | | | | 3,541,910 | | | | 3,541,910 | |
| | | | | | | | | | | | | | | | | | |
7
| | | | | | | | | | | | | | | | | | |
Consumer Cyclical - Entertainment - 1.2% | | | | | | | | | | | | |
0 | | 1,000,000 | | 1,000,000 | | (1) Football Trust IV, Pass Thru Cert., 5.35%, 10/5/2020 | | | 0 | | | | 1,047,529 | | | | 1,047,529 | |
0 | | 1,890,000 | | 1,890,000 | | (1)(2) NBC Universal, Inc., Sr. Unsecd. Note, Series 144A, 5.15%, 4/30/2020 | | | 0 | | | | 1,969,551 | | | | 1,969,551 | |
0 | | 450,000 | | 450,000 | | (1)(2) NBC Universal, Inc., Sr. Unsecd. Note, Series 144A, 5.95%, 4/1/2041 | | | 0 | | | | 452,437 | | | | 452,437 | |
0 | | 500,000 | | 500,000 | | Time Warner, Inc., Company Guarantee, 6.20%, 3/15/2040 | | | 0 | | | | 532,168 | | | | 532,168 | |
| | | | | | | | | | | | | | | | | | |
| | | | | | TOTAL | | | 0 | | | | 4,001,685 | | | | 4,001,685 | |
| | | | | | | | | | | | | | | | | | |
Consumer Cyclical - Lodging - 0.5% | | | | | | | | | | | | |
0 | | 950,000 | | 950,000 | | Choice Hotels International, Inc., Company Guarantee, 5.70%, 8/28/2020 | | | 0 | | | | 926,896 | | | | 926,896 | |
0 | | 930,000 | | 930,000 | | Wyndham Worldwide Corp., Sr. Unsecd. Note, 6.00%, 12/1/2016 | | | 0 | | | | 974,391 | | | | 974,391 | |
| | | | | | | | | | | | | | | | | | |
| | | | | | TOTAL | | | 0 | | | | 1,901,287 | | | | 1,901,287 | |
| | | | | | | | | | | | | | | | | | |
Consumer Cyclical - Retailers - 1.3% | | | | | | | | | | | | |
0 | | 1,150,000 | | 1,150,000 | | Best Buy Co., Inc., Sr. Unsecd. Note, 6.75%, 7/15/2013 | | | 0 | | | | 1,272,850 | | | | 1,272,850 | |
0 | | 1,543,383 | | 1,543,383 | | (1)(2) CVS Caremark Corp., Pass Thru Cert., 5.298%, 1/11/2027 | | | 0 | | | | 1,518,039 | | | | 1,518,039 | |
0 | | 935,000 | | 935,000 | | CVS Caremark Corp., Sr. Unsecd. Note, 5.75%, 6/1/2017 | | | 0 | | | | 1,045,672 | | | | 1,045,672 | |
0 | | 530,000 | | 530,000 | | JC Penny Corp., Inc., Sr. Unsecd. Note, 5.75%, 2/15/2018 | | | 0 | | | | 524,700 | | | | 524,700 | |
| | | | | | | | | | | | | | | | | | |
| | | | | | TOTAL | | | 0 | | | | 4,361,261 | | | | 4,361,261 | |
| | | | | | | | | | | | | | | | | | |
Consumer Cyclical - Services - 0.3% | | | | | | | | | | | | |
0 | | 250,000 | | 250,000 | | Boston University, 7.625%, 7/15/2097 | | | 0 | | | | 279,850 | | | | 279,850 | |
0 | | 330,000 | | 330,000 | | eBay, Inc., Sr. Unsecd. Note3.25%, 10/15/2020 | | | 0 | | | | 307,866 | | | | 307,866 | |
0 | | 350,000 | | 350,000 | | Expedia, Inc., Company Guarantee, 5.95%, 8/15/2020 | | | 0 | | | | 353,500 | | | | 353,500 | |
| | | | | | | | | | | | | | | | | | |
| | | | | | TOTAL | | | 0 | | | | 941,216 | | | | 941,216 | |
| | | | | | | | | | | | | | | | | | |
Consumer Non-Cyclical - Food/Beverage - 2.1% | | | | | | | | | | | | |
900,000 | | 0 | | 900,000 | | Archer-Daniels-Midland Co., 5.935%, 10/1/2032 | | | 993,600 | | | | 0 | | | | 993,600 | |
0 | | 900,000 | | 900,000 | | Coca-Cola Femsa S.A.B. de C.V., Sr. Unsecd. Note, 4.625%, 2/15/2020 | | | 0 | | | | 930,239 | | | | 930,239 | |
0 | | 161,000 | | 161,000 | | Diageo Capital PLC, Company Guarantee, 7.375%, 1/15/2014 | | | 0 | | | | 185,537 | | | | 185,537 | |
8
| | | | | | | | | | | | | | | | | | |
0 | | 1,140,000 | | 1,140,000 | | General Mills, Inc., Note, 5.70%, 2/15/2017 | | | 0 | | | | 1,282,971 | | | | 1,282,971 | |
0 | | 3,000,000 | | 3,000,000 | | PepsiCo, Inc., Note, 4.50%, 1/15/2020 | | | 0 | | | | 3,161,607 | | | | 3,161,607 | |
0 | | 450,000 | | 450,000 | | Ralcorp Holdings, Inc., Sr. Unsecd. Note, 6.625%, 8/15/2039 | | | 0 | | | | 467,710 | | | | 467,710 | |
| | | | | | | | | | | | | | | | | | |
| | | | | | TOTAL | | | 993,600 | | | | 6,028,064 | | | | 7,021,664 | |
| | | | | | | | | | | | | | | | | | |
Consumer Non-Cyclical - Health Care - 1.1% | | | | | | | | | | | | |
0 | | 750,000 | | 750,000 | | Boston Scientific Corp., 7.375%, 1/15/2040 | | | 0 | | | | 822,080 | | | | 822,080 | |
0 | | 910,000 | | 910,000 | | Life Technologies Corp., Sr. Note, 3.375%, 3/1/2013 | | | 0 | | | | 930,650 | | | | 930,650 | |
0 | | 370,000 | | 370,000 | | Quest Diagnostics, Inc., Sr. Unsecd. Note, 4.75%, 1/30/2020 | | | 0 | | | | 369,015 | | | | 369,015 | |
0 | | 1,310,000 | | 1,310,000 | | Thermo Electron Corp., Sr. Unsecd. Note, 5.00%, 6/1/2015 | | | 0 | | | | 1,429,628 | | | | 1,429,628 | |
| | | | | | | | | | | | | | | | | | |
| | | | | | TOTAL | | | 0 | | | | 3,551,373 | | | | 3,551,373 | |
| | | | | | | | | | | | | | | | | | |
Consumer Non-Cyclical - Pharmaceuticals - 0.3% | | | | | | | | | | | | |
0 | | 900,000 | | 900,000 | | Bio-Rad Laboratories, Inc., Sr. Unsecd. Note, 4.875%, 12/15/2020 | | | 0 | | | | 869,625 | | | | 869,625 | |
| | | | | | | | | | | | | | | | | | |
Consumer Non-Cyclical - Products - 0.9% | | | | | | | | | | | | |
0 | | 330,000 | | 330,000 | | Clorox Co., Sr. Unsecd. Note, 3.55%, 11/1/2015 | | | 0 | | | | 340,861 | | | | 340,861 | |
0 | | 510,000 | | 510,000 | | Hasbro, Inc., Sr. Unsecd. Note, 6.35%, 3/15/2040 | | | 0 | | | | 517,494 | | | | 517,494 | |
500,000 | | 0 | | 500,000 | | Steelcase, Inc., 6.50%, 8/15/2011 | | | 511,785 | | | | 0 | | | | 511,785 | |
0 | | 610,000 | | 610,000 | | Whirlpool Corp., 5.50%, 3/1/2013 | | | 0 | | | | 648,171 | | | | 648,171 | |
0 | | 870,000 | | 870,000 | | Whirlpool Corp., Note, 8.00%, 5/1/2012 | | | 0 | | | | 937,825 | | | | 937,825 | |
| | | | | | | | | | | | | | | | | | |
| | | | | | TOTAL | | | 511,785 | | | | 2,444,351 | | | | 2,956,136 | |
| | | | | | | | | | | | | | | | | | |
Consumer Non-Cyclical - Supermarkets - 0.2% | | | | | | | | | | | | |
0 | | 610,000 | | 610,000 | | Kroger Co., Bond, 6.90%, 4/15/2038 | | | 0 | | | | 700,089 | | | | 700,089 | |
| | | | | | | | | | | | | | | | | | |
Consumer Non-Cyclical - Tobacco - 0.5% | | | | | | | | | | | | |
0 | | 1,500,000 | | 1,500,000 | | Philip Morris International, Inc., 5.65%, 5/16/2018 | | | 0 | | | | 1,707,506 | | | | 1,707,506 | |
| | | | | | | | | | | | | | | | | | |
Energy - Independent - 1.9% | | | | | | | | | | | | |
0 | | 400,000 | | 400,000 | | Apache Corp., Sr. Unsecd. Note, 5.10%, 9/1/2040 | | | 0 | | | | 389,126 | | | | 389,126 | |
0 | | 2,870,000 | | 2,870,000 | | Petroleos Mexicanos, Company Guarantee, Series WI, 4.875%, 3/15/2015 | | | 0 | | | | 3,036,342 | | | | 3,036,342 | |
9
| | | | | | | | | | | | | | | | | | |
0 | | 1,520,000 | | 1,520,000 | | Petroleos Mexicanos, Company Guarantee, Series WI, 6.00%, 3/5/2020 | | | 0 | | | | 1,636,549 | | | | 1,636,549 | |
0 | | 1,900,000 | | 1,900,000 | | Talisman Energy, Inc., Sr. Unsecd. Note, 3.75%, 2/1/2021 | | | 0 | | | | 179,421 | | | | 179,421 | |
0 | | 560,382 | | 560,382 | | (1)(2) Tengizchevroil LLP, Series 144A, 6.124%, 11/15/2014 | | | 0 | | | | 589,802 | | | | 589,802 | |
0 | | 405,000 | | 405,000 | | XTO Energy, Inc., 6.75%, 8/1/2037 | | | 0 | | | | 507,368 | | | | 507,368 | |
| | | | | | | | | | | | | | | | | | |
| | | | | | TOTAL | | | 0 | | | | 6,338,608 | | | | 6,338,608 | |
| | | | | | | | | | | | | | | | | | |
Energy - Integrated - 2.7% | | | | | | | | | | | | |
0 | | 480,000 | | 480,000 | | BP Capital Markets PLC, Company Guarantee, 3.125%, 10/1/2015 | | | 0 | | | | 478,775 | | | | 478,775 | |
1,200,000 | | 0 | | 1,200,000 | | ConocoPhillips Holding Co., 6.95%, 4/15/2029 | | | 1,484,016 | | | | 0 | | | | 1,484,016 | |
0 | | 1,250,000 | | 1,250,000 | | Husky Oil Ltd., Deb., 7.55%, 11/15/2016 | | | 0 | | | | 1,468,685 | | | | 1,468,685 | |
700,000 | | 0 | | 700,000 | | NorthWestern Corp., 6.34%, 4/1/2019 | | | 754,635 | | | | 0 | | | | 754,635 | |
0 | | 1,000,000 | | 1,000,000 | | Petro-Canada, Note, 5.00%, 11/15/2014 | | | 0 | | | | 1,083,515 | | | | 1,083,515 | |
1,500,000 | | 0 | | 1,500,000 | | Public Service Co. of Colorado, 5.125%, 6/1/2019 | | | 1,634,685 | | | | 0 | | | | 1,634,685 | |
0 | | 272,440 | | 272,440 | | (1)(2) Qatar Petroleum, 5.579%, 5/30/2011 | | | 0 | | | | 276,067 | | | | 276,067 | |
1,500,000 | | 0 | | 1,500,000 | | South Carolina Electric & Gas Co., 6.50%, 11/1/2018 | | | 1,787,295 | | | | 0 | | | | 1,787,295 | |
| | | | | | | | | | | | | | | | | | |
| | | | | | TOTAL | | | 5,660,631 | | | | 3,307,042 | | | | 8,967,673 | |
| | | | | | | | | | | | | | | | | | |
Energy - Oil Field Services - 0.8% | | | | | | | | | | | | |
0 | | 280,000 | | 280,000 | | (1)(2) Nabors Industries, Inc., Company Guarantee, 5.00%, 9/15/2020 | | | 0 | | | | 271,886 | | | | 271,886 | |
0 | | 400,000 | | 400,000 | | Nabors Industries, Inc., Company Guarantee, 9.25%, 1/15/2019 | | | 0 | | | | 495,551 | | | | 495,551 | |
0 | | 450,000 | | 450,000 | | Noble Holding International Ltd., Company Guarantee, 4.90%, 8/1/2020 | | | 0 | | | | 467,753 | | | | 467,753 | |
0 | | 1,480,000 | | 1,480,000 | | Weatherford International Ltd., 6.00%, 3/15/2018 | | | 0 | | | | 1,596,353 | | | | 1,596,353 | |
| | | | | | | | | | | | | | | | | | |
| | | | | | TOTAL | | | 0 | | | | 2,831,543 | | | | 2,831,543 | |
| | | | | | | | | | | | | | | | | | |
Energy - Refining - 0.6% | | | | | | | | | | | | |
0 | | 240,000 | | 240,000 | | Valero Energy Corp., 9.375%, 3/15/2019 | | | 0 | | | | 298,039 | | | | 298,039 | |
0 | | 1,460,000 | | 1,460,000 | | Valero Energy Corp., Note, 4.75%, 4/1/2014 | | | 0 | | | | 1,549,792 | | | | 1,549,792 | |
| | | | | | | | | | | | | | | | | | |
| | | | | | TOTAL | | | 0 | | | | 1,847,831 | | | | 1,847,831 | |
| | | | | | | | | | | | | | | | | | |
10
| | | | | | | | | | | | | | | | | | |
Financial Institution - Banking - 15.0% | | | | | | | | | | | | |
0 | | 1,600,000 | | 1,600,000 | | Astoria Financial Corp., Note, 5.75%, 10/15/2012 | | | 0 | | | | 1,643,616 | | | | 1,643,616 | |
0 | | 1,000,000 | | 1,000,000 | | Bank of America Corp., Note, 4.50%, 4/1/2015 | | | 0 | | | | 1,022,476 | | | | 1,022,476 | |
0 | | 2,000,000 | | 2,000,000 | | Bank of America Corp., Sr. Note, 5.375%, 6/15/2014 | | | 0 | | | | 2,102,715 | | | | 2,102,715 | |
0 | | 1,500,000 | | 1,500,000 | | Bank of America Corp., Sr. Unsecd. Note, 3.70%, 9/1/2015 | | | 0 | | | | 1,492,242 | | | | 1,492,242 | |
0 | | 3,000,000 | | 3,000,000 | | (1)(2) Barclays Bank PLC, 5.926%, 12/31/2049 | | | 0 | | | | 2,673,750 | | | | 2,673,750 | |
0 | | 2,030,000 | | 2,030,000 | | (3) Bear Stearns Cos., Inc., Sr. Unsecd. Note, 5.70%, 11/15/2014 | | | 0 | | | | 2,230,162 | | | | 2,230,162 | |
0 | | 2,470,000 | | 2,470,000 | | Capital One Capital IV, 6.745%, 2/17/2037 | | | 0 | | | | 2,463,825 | | | | 2,463,825 | |
0 | | 725,000 | | 725,000 | | Capital One Capital V, 10.25%, 8/15/2039 | | | 0 | | | | 780,281 | | | | 780,281 | |
0 | | 1,340,000 | | 1,340,000 | | Capital One Capital VI, 8.875%, 5/15/2040 | | | 0 | | | | 1,405,325 | | | | 1,405,325 | |
0 | | 1,000,000 | | 1,000,000 | | Citigroup, Inc., Sr. Note, 5.375%, 8/9/2020 | | | 0 | | | | 1,042,220 | | | | 1,042,220 | |
0 | | 500,000 | | 500,000 | | Citigroup, Inc., Sr. Unsecd. Note, 6.00%, 12/13/2013 | | | 0 | | | | 547,527 | | | | 547,527 | |
0 | | 2,290,000 | | 2,290,000 | | Citigroup, Inc., Sr. Unsecd. Note, 6.875%, 3/5/2038 | | | 0 | | | | 2,556,382 | | | | 2,556,382 | |
0 | | 480,000 | | 480,000 | | City National Corp., Note, 5.25%, 9/15/2020 | | | 0 | | | | 473,267 | | | | 473,267 | |
1,000,000 | | 0 | | 1,000,000 | | Comerica Bank, 5.20%, 8/22/2017 | | | 1,033,090 | | | | 0 | | | | 1,033,090 | |
1,000,000 | | 0 | | 1,000,000 | | Fifth Third Bancorp, 5.45%, 1/15/2017 | | | 1,020,320 | | | | 0 | | | | 1,020,320 | |
900,000 | | 0 | | 900,000 | | Goldman Sachs Group, Inc. (The), 5.125%, 1/15/2015 | | | 969,966 | | | | 0 | | | | 969,966 | |
0 | | 250,000 | | 250,000 | | Huntington Bancshares, Inc., Sub Note, 7.00%, 12/15/2020 | | | 0 | | | | 263,696 | | | | 263,696 | |
0 | | 4,300,000 | | 4,300,000 | | JPMorgan Chase & Co., Sub. Note, 5.125%, 9/15/2014 | | | 0 | | | | 4,586,983 | | | | 4,586,983 | |
0 | | 2,440,000 | | 2,440,000 | | Manufactures & Traders Trust Co., Sub. Note, 5.629%, 12/1/2021 | | | 0 | | | | 2,297,757 | | | | 2,297,757 | |
0 | | 1,100,000 | | 1,100,000 | | Morgan Stanley, Sr. Unsecd. Note, 3.45%, 11/2/2015 | | | 0 | | | | 1,080,165 | | | | 1,080,165 | |
0 | | 2,520,000 | | 2,520,000 | | Morgan Stanley, Sr. Unsecd. Note, 4.20%, 11/20/2014 | | | 0 | | | | 2,580,142 | | | | 2,580,142 | |
0 | | 500,000 | | 500,000 | | Morgan Stanley, Sr. Unsecd. Note, 5.50%, 7/24/2020 | | | 0 | | | | 506,008 | | | | 506,008 | |
0 | | 825,000 | | 825,000 | | Morgan Stanley, Sr. Unsecd. Note, 5.95%, 12/28/2017 | | | 0 | | | | 874,107 | | | | 874,107 | |
0 | | 2,010,000 | | 2,010,000 | | Morgan Stanley, Sr. Unsecd. Note, 6.625%, 4/1/2018 | | | 0 | | | | 2,206,353 | | | | 2,206,353 | |
0 | | 800,000 | | 800,000 | | PNC Funding Corp., Sr. Unsecd. Note, 4.25%, 9/21/2015 | | | 0 | | | | 841,299 | | | | 841,299 | |
11
| | | | | | | | | | | | | | | | | | |
0 | | 450,000 | | 450,000 | | PNC Funding Corp., Sr. Unsecd. Note, 5.125%, 2/8/2020 | | | 0 | | | | 472,885 | | | | 472,885 | |
0 | | 410,000 | | 410,000 | | PNC Funding Corp., Sr. Unsecd. Note, 5.625%, 2/1/2017 | | | 0 | | | | 437,667 | | | | 437,667 | |
1,500,000 | | 0 | | 1,500,000 | | (1)(2) PNC Preferred FD, 144A, 6.517%, 12/31/2049 | | | 1,191,927 | | | | 0 | | | | 1,191,927 | |
0 | | 1,400,000 | | 1,400,000 | | (1)(2) Santander US Debt SA Unipersonal Bank Guarantee, Series 144A, 3.781%, 10/7/2015 | | | 0 | | | | 1,316,112 | | | | 1,316,112 | |
0 | | 630,000 | | 630,000 | | State Street Bank and Trust Co., Sub. Note, 5.30%, 1/15/2016 | | | 0 | | | | 689,848 | | | | 689,848 | |
0 | | 2,500,000 | | 2,500,000 | | Wachovia Bank N.A., 4.80%, 11/1/2014 | | | 0 | | | | 2,648,713 | | | | 2,648,713 | |
0 | | 1,320,000 | | 1,320,000 | | Wachovia Corp., 5.75%, 2/1/2018 | | | 0 | | | | 1,468,816 | | | | 1,468,816 | |
750,000 | | 0 | | 750,000 | | (9) Washington Mutual Bank, FA, 5.65%, 8/15/2014 | | | 938 | | | | 0 | | | | 938 | |
0 | | 1,175,000 | | 1,175,000 | | Westpac Banking Corp., Sr. Unsecd. Note, 4.875%, 11/19/2019 | | | 0 | | | | 1,237,948 | | | | 1,237,948 | |
0 | | 1,900,000 | | 1,900,000 | | Wilmington Trust Corp., Sub. Note, 8.50%, 4/2/2018 | | | 0 | | | | 2,171,844 | | | | 2,171,844 | |
| | | | | | | | | | | | | | | | | | |
| | | | | | TOTAL | | | 4,216,241 | | | | 46,114,131 | | | | 50,330,372 | |
| | | | | | | | | | | | | | | | | | |
Financial Institution -Brokerage -6.4% | | | | | | | | | | | | |
0 | | 4,480,000 | | 4,480,000 | | BlackRock, Inc., 6.25%, 9/15/2017 | | | 0 | | | | 5,065,795 | | | | 5,065,795 | |
0 | | 500,000 | | 500,000 | | (1)(2) CME Group Index Services LLC, Company Guarantee, Series 144A, 4.40%, 3/15/2018 | | | 0 | | | | 512,437 | | | | 512,437 | |
0 | | 900,000 | | 900,000 | | (1)(2) Cantor Fitzgerald LP, Bond, Series 144A, 7.875%, 10/15/2019 | | | 0 | | | | 910,983 | | | | 910,983 | |
0 | | 835,000 | | 835,000 | | Eaton Vance Corp., 6.50%, 10/2/2017 | | | 0 | | | | 952,299 | | | | 952,299 | |
0 | | 850,000 | | 850,000 | | (1)(2) FMR LLC, 4.75%, 3/1/2013 | | | 0 | | | | 890,197 | | | | 890,197 | |
0 | | 3,000,000 | | 3,000,000 | | (1)(2) FMR LLC, Bond, 7.57%, 6/15/2029 | | | 0 | | | | 3,327,289 | | | | 3,327,289 | |
0 | | 350,000 | | 350,000 | | Franklin Resources, Inc., Sr. Unsecd. Note, 4.625%, 5/20/2020 | | | 0 | | | | 364,991 | | | | 364,991 | |
0 | | 750,000 | | 750,000 | | Invesco Ltd., Sr. Unsecd. Note, 5.625%, 4/17/2012 | | | 0 | | | | 780,203 | | | | 780,203 | |
0 | | 680,000 | | 680,000 | | Janus Capital Group, Inc., Sr. Note, 6.50%, 6/15/2012 | | | 0 | | | | 735,704 | | | | 735,704 | |
0 | | 800,000 | | 800,000 | | Janus Capital Group, Inc., Sr. Note, 6.95%, 6/15/2017 | | | 0 | | | | 834,540 | | | | 834,540 | |
0 | | 635,000 | | 635,000 | | Jefferies Group, Inc., Sr. Unsecd. Note, 6.875%, 4/15/2021 | | | 0 | | | | 669,634 | | | | 669,634 | |
0 | | 1,040,000 | | 1,040,000 | | Jefferies Group, Inc., Sr. Unsecd. Note, 8.50%, 7/15/2019 | | | 0 | | | | 1,193,307 | | | | 1,193,307 | |
0 | | 2,290,000 | | 2,290,000 | | (4)(5) Lehman Brothers Holdings, Inc., 7.875%, 8/15/2011 | | | 0 | | | | 541,013 | | | | 541,013 | |
0 | | 740,000 | | 740,000 | | NASDAQ OMX Group, Inc., Sr. Unsecd. Note, 5.55%, 1/15/2020 | | | 0 | | | | 745,485 | | | | 745,485 | |
12
| | | | | | | | | | | | | | | | | | |
| 0 | | 690,000 | | 690,000 | | Nuveen Investments, 5.50%, 9/15/2015 | | | 0 | | | | 595,125 | | | | 595,125 | |
| 0 | | 1,210,000 | | 1,210,000 | | Raymond James Financial, Inc., 8.60%, 8/15/2019 | | | 0 | | | | 1,428,384 | | | | 1,428,384 | |
| 700,000 | | 0 | | 700,000 | | SunAmerica, Inc., 8.125%, 4/28/2023 | | | 715,540 | | | | 0 | | | | 715,540 | |
| 0 | | 1,225,000 | | 1,225,000 | | TD Ameritrade Holding Corp., Company Guarantee, 4.15%, 12/1/2014 | | | 0 | | | | 1,268,495 | | | | 1,268,495 | |
| | | | | | | | | | | | | | | | | | |
| | | | | | TOTAL | | | 715,540 | | | | 20,815,881 | | | | 21,531,421 | |
| | | | | | | | | | | | | | | | | | |
Financial Institution - Finance Noncaptive - 5.1% | |
| 0 | | 850,000 | | 850,000 | | American Express Co., Note, 2.75%, 9/15/2015 | | | 0 | | | | 839,552 | | | | 839,552 | |
| 0 | | 1,130,000 | | 1,130,000 | | American Express Credit Co., 5.875%, 5/2/2013 | | | 0 | | | | 1,231,445 | | | | 1,231,445 | |
| 0 | | 1,000,000 | | 1,000,000 | | American Express Credit Co., Sr. Unsecd. Note, 5.125%, 8/25/2014 | | | 0 | | | | 1,076,139 | | | | 1,076,139 | |
| 0 | | 500,000 | | 500,000 | | American International Group, Inc., Sr. Unsecd. Note, 6.40%, 12/15/2020 | | | 0 | | | | 521,875 | | | | 521,875 | |
| 0 | | 1,200,000 | | 1,200,000 | | Discover Bank, Sub. 8.70%, 11/18/2019 | | | 0 | | | | 1,414,794 | | | | 1,414,794 | |
| 0 | | 2,680,000 | | 2,680,000 | | General Electric Capital Corp., 5.625%, 5/1/2018 | | | 0 | | | | 2,923,754 | | | | 2,923,754 | |
| 0 | | 1,000,000 | | 1,000,000 | | General Electric Capital Corp., Sr. Unsecd. Note, Series MTN, 6.875%, 1/10/2039 | | | 0 | | | | 1,161,238 | | | | 1,161,238 | |
| 0 | | 4,400,000 | | 4,400,000 | | HSBC Finance Capital Trust IX, Note, 5.911%, 11/30/2035 | | | 0 | | | | 4,092,000 | | | | 4,092,000 | |
| 0 | | 1,100,000 | | 1,100,000 | | (1)(2) ILFC E-Capital Trust 1, 5.90%, 12/21/2065 | | | 0 | | | | 838,266 | | | | 838,266 | |
| 0 | | 1,000,000 | | 1,000,000 | | (1)(2) Lukoil International Finance BV, 6.356%, 6/7/2017 | | | 0 | | | | 1,050,000 | | | | 1,050,000 | |
| 0 | | 450,000 | | 450,000 | | (1)(2) Macquarie Group Ltd., Note, Series 144A, 7.625%, 8/13/2019 | | | 0 | | | | 498,760 | | | | 498,760 | |
| 0 | | 1,400,000 | | 1,400,000 | | (1)(2) Macquarie Group Ltd., Sr. Unsecd. Note, Series 144A, 6.00%, 1/14/2020 | | | 0 | | | | 1,414,159 | | | | 1,414,159 | |
| | | | | | | | | | | | | | | | | | |
| | | | | | TOTAL | | | 0 | | | | 17,061,982 | | | | 17,061,982 | |
| | | | | | | | | | | | | | | | | | |
Financial Institution - Insurance - Health - 0.6% | |
| 0 | | 555,000 | | 555,000 | | UnitedHealth Group, Inc., Sr. Unsecd. Note, 6.00%, 2/15/2018 | | | 0 | | | | 629,690 | | | | 629,690 | |
| 0 | | 1,130,000 | | 1,130,000 | | Wellpoint, Inc., Sr. Unsecd. Note, 7.00%, 2/15/2019 | | | 0 | | | | 1,328,888 | | | | 1,328,888 | |
| | | | | | | | | | | | | | | | | | |
| | | | | | TOTAL | | | 0 | | | | 1,958,578 | | | | 1,958,578 | |
| | | | | | | | | | | | | | | | | | |
Financial Institution - Insurance - Life - 2.9% | |
| 0 | | 910,000 | | 910,000 | | (1)(2) AXA Equitable Life Insurance Co., Sub., 7.70%, 12/1/2015 | | | 0 | | | | 1,011,284 | | | | 1,011,284 | |
13
| | | | | | | | | | | | | | | | | | |
| 0 | | 580,000 | | 580,000 | | Aflac, Inc., Sr. Unsecd. Note, 6.90%, 12/17/2039 | | | 0 | | | | 613,252 | | | | 613,252 | |
| 0 | | 390,000 | | 390,000 | | Aflac, Inc., Sr. Unsecd. Note, 8.50%, 5/15/2019 | | | 0 | | | | 483,899 | | | | 483,899 | |
| 0 | | 350,000 | | 350,000 | | Lincoln National Corp., Sr. Note, 7.00%, 6/15/2040 | | | 0 | | | | 382,055 | | | | 382,055 | |
| 1,700,000 | | 0 | | 1,700,000 | | MetLife, Inc., 4.75%, 2/8/2021 | | | 1,745,951 | | | | 0 | | | | 1,745,951 | |
| 0 | | 500,000 | | 500,000 | | (1)(2) New York Life Insurance Co., Sub. Note, 6.75%, 11/15/2039 | | | 0 | | | | 580,596 | | | | 580,596 | |
| 0 | | 1,300,000 | | 1,300,000 | | (1)(2) Northwestern Mutual Life Insurance Co., Sub. Note, Series 144A, 6.063%, 3/30/2040 | | | 0 | | | | 1,383,469 | | | | 1,383,469 | |
| 0 | | 350,000 | | 350,000 | | (1)(2) Penn Mutual Life Insurance Co., Sr. Note, Series 144A, 7.625%, 6/15/2040 | | | 0 | | | | 347,197 | | | | 347,197 | |
| 1,500,000 | | 0 | | 1,500,000 | | Prudential Financial, Inc., 6.10%, 6/15/2017 | | | 1,660,170 | | | | 0 | | | | 1,660,170 | |
| 0 | | 850,000 | | 850,000 | | Prudential Financial, Inc., 6.625%, 12/1/2037 | | | 0 | | | | 937,240 | | | | 937,240 | |
| 0 | | 500,000 | | 500,000 | | Prudential Financial, Inc., Sr. Unsecd. Note, 4.75%, 9/17/2015 | | | 0 | | | | 532,782 | | | | 532,782 | |
| 0 | | 250,000 | | 250,000 | | (1) Union Central Life Insurance Co., Note, 8.20%, 11/1/2026 | | | 0 | | | | 249,103 | | | | 249,103 | |
| | | | | | | | | | | | | | | | | | |
| | | | | | TOTAL | | | 3,406,121 | | | | 6,520,877 | | | | 9,926,998 | |
| | | | | | | | | | | | | | | | | | |
Financial Institution - Insurance - P&C - 2.8% | | | | | | | | | | | | |
| 0 | | 1,300,000 | | 1,300,000 | | ACE INA Holdings, Inc., 5.60%, 5/15/2015 | | | 0 | | | | 1,438,148 | | | | 1,438,148 | |
| 0 | | 1,380,000 | | 1,380,000 | | ACE INA Holdings, Inc., Sr. Note, 5.70%, 2/15/2017 | | | 0 | | | | 1,513,905 | | | | 1,513,905 | |
| 0 | | 330,000 | | 330,000 | | CNA Financial Corp., 6.50%, 8/15/2016 | | | 0 | | | | 353,813 | | | | 353,813 | |
| 0 | | 680,000 | | 680,000 | | CNA Financial Corp., Sr. Unsecd. Note, 5.875%, 8/15/2020 | | | 0 | | | | 678,288 | | | | 678,288 | |
| 0 | | 100,000 | | 100,000 | | Chubb Corp., Sr. Note, 5.75%, 5/15/2018 | | | 0 | | | | 111,391 | | | | 111,391 | |
| 0 | | 1,180,000 | | 1,180,000 | | Horace Mann Educators Corp., Sr. Note, 6.85%, 4/15/2016 | | | 0 | | | | 1,241,220 | | | | 1,241,220 | |
| 0 | | 2,200,000 | | 2,200,000 | | (1)(2) Liberty Mutual Group, Inc., Unsecd. Note, 5.75%, 3/15/2014 | | | 0 | | | | 2,289,890 | | | | 2,289,890 | |
| 0 | | 250,000 | | 250,000 | | MBIA Insurance Corp., Sr. Deb., 6.625%, 10/1/2028 | | | 0 | | | | 185,595 | | | | 185,595 | |
| 0 | | 370,000 | | 370,000 | | The Travelers Cos, Inc., Sr. Unsecd. Note, 5.50%, 12/1/2015 | | | 0 | | | | 413,914 | | | | 413,914 | |
| 0 | | 1,050,000 | | 1,050,000 | | (1)(2) ZFS Finance USA Trust II, Jr. Sub. Note, 6.45%, 12/15/2065 | | | 0 | | | | 1,036,875 | | | | 1,036,875 | |
| | | | | | | | | | | | | | | | | | |
| | | | | | TOTAL | | | 0 | | | | 9,263,039 | | | | 9,263,039 | |
| | | | | | | | | | | | | | | | | | |
14
| | | | | | | | | | | | | | | | | | |
Financial Institution - REITs - 3.4% | | | | | | | | | | | | |
| 0 | | 640,000 | | 640,000 | | AMB Property LP, 6.30%, 6/1/2013 | | | 0 | | | | 685,471 | | | | 685,471 | |
| 0 | | 1,200,000 | | 1,200,000 | | Boston Properties LP, Sr. Unsecd. Note, 5.875%, 10/15/2019 | | | 0 | | | | 1,307,915 | | | | 1,307,915 | |
| 1,700,000 | | 0 | | 1,700,000 | | CommonWealth REIT, 6.25%, 6/15/2017 | | | 1,762,407 | | | | 0 | | | | 1,762,407 | |
| 0 | | 890,000 | | 890,000 | | Equity One, Inc., Bond, 6.00%, 9/15/2017 | | | 0 | | | | 884,063 | | | | 884,063 | |
| 0 | | 200,000 | | 200,000 | | Equity One, Inc., Sr. Unsecd. Note, 6.25%, 12/15/2014 | | | 0 | | | | 211,239 | | | | 211,239 | |
| 0 | | 960,000 | | 960,000 | | Health Care REIT, Inc., Sr. Unsecd. Note, 6.125%, 4/15/2020 | | | 0 | | | | 1,012,350 | | | | 1,012,350 | |
| 0 | | 850,000 | | 850,000 | | Liberty Property LP, 6.625%, 10/1/2017 | | | 0 | | | | 968,596 | | | | 968,596 | |
| 0 | | 630,000 | | 630,000 | | Prologis, Conv. Bond, 2.25%, 4/1/2037 | | | 0 | | | | 628,154 | | | | 628,154 | |
| 0 | | 250,000 | | 250,000 | | Prologis, Sr. Note, 5.50%, 4/1/2012 | | | 0 | | | | 258,138 | | | | 258,138 | |
| 0 | | 450,000 | | 450,000 | | Prologis, Sr. Note, 6.875%, 3/15/2020 | | | 0 | | | | 478,594 | | | | 478,594 | |
| 0 | | 1,260,000 | | 1,260,000 | | Prologis, Sr. Note, 7.625%, 8/15/2014 | | | 0 | | | | 1,421,934 | | | | 1,421,934 | |
| 0 | | 470,000 | | 470,000 | | Regency Centers LP, Company Guarantee, 4.80%, 4/15/2021 | | | 0 | | | | 450,492 | | | | 450,492 | |
| 0 | | 700,000 | | 700,000 | | Tanger Properties LP, Sr. Unsecd. Note, 6.125%, 6/1/2020 | | | 0 | | | | 750,930 | | | | 750,930 | |
| 700,000 | | 0 | | 700,000 | | Washington REIT, 5.25%, 1/15/2014 | | | 735,350 | | | | 0 | | | | 735,350 | |
| | | | | | | | | | | | | | | | | | |
| | | | | | TOTAL | | | 2,497,757 | | | | 9,057,876 | | | | 11,555,633 | |
| | | | | | | | | | | | | | | | | | |
Municipal Services - 0.7% | | | | | | | | | | | | |
| 0 | | 895,000 | | 895,000 | | (1)(2) Army Hawaii Family Housing, 5.524%, 6/15/2050 | | | 0 | | | | 769,378 | | | | 769,378 | |
| 0 | �� | 1,850,000 | | 1,850,000 | | (1)(2) Camp Pendleton & Quantico Housing LLC, 5.572%, 10/1/2050 | | | 0 | | | | 1,641,431 | | | | 1,641,431 | |
| | | | | | | | | | | | | | | | | | |
| | | | | | TOTAL | | | 0 | | | | 2,410,809 | | | | 2,410,809 | |
| | | | | | | | | | | | | | | | | | |
Sovereign - 0.6% | | | | | | | | | | | | |
| 0 | | 1,120,000 | | 1,120,000 | | Corp Andina De Fomento, Sr. Unsecd. Note, 3.75%, 1/15/2016 | | | 0 | | | | 1,103,184 | | | | 1,103,184 | |
| 0 | | 900,000 | | 900,000 | | (1)(2) State of Qatar, 5.25%, 1/20/2020 | | | 0 | | | | 957,375 | | | | 957,375 | |
| | | | | | | | | | | | | | | | | | |
| | | | | | TOTAL | | | 0 | | | | 2,060,559 | | | | 2,060,559 | |
| | | | | | | | | | | | | | | | | | |
Technology - 2.9% | | | | | | | | | | | | |
| 0 | | 1,120,000 | | 1,120,000 | | Adobe Systems, Inc., Sr. Unsecd. Note, 3.25%, 2/1/2015 | | | 0 | | | | 1,142,402 | | | | 1,142,402 | |
| 0 | | 700,000 | | 700,000 | | BMC Software, Inc., 7.25%, 6/1/2018 | | | 0 | | | | 810,473 | | | | 810,473 | |
| 0 | | 670,000 | | 670,000 | | Fiserv, Inc., Sr. Note, 6.80%, 11/20/2017 | | | 0 | | | | 740,621 | | | | 740,621 | |
| 0 | | 3,400,000 | | 3,400,000 | | Harris Corp., 5.95%, 12/1/2017 | | | 0 | | | | 3,763,383 | | | | 3,763,383 | |
15
| | | | | | | | | | | | | | | | | | |
0 | | 1,085,000 | | 1,085,000 | | Hewlett-Packard Co., Note, 5.40%, 3/1/2017 | | | 0 | | | | 1,213,583 | | | | 1,213,583 | |
0 | | 1,230,000 | | 1,230,000 | | KLA-Tencor Corp., 6.90%, 5/1/2018 | | | 0 | | | | 1,355,979 | | | | 1,355,979 | |
0 | | 515,000 | | 515,000 | | Maxim Integrated Products, Inc., Note, 3.45%, 6/14/2013 | | | 0 | | | | 525,954 | | | | 525,954 | |
0 | | 285,000 | | 285,000 | | (1)(2) SAIC, Inc., Company Guarantee, Series 144A, 5.95%, 12/1/2040 | | | 0 | | | | 290,580 | | | | 290,580 | |
| | | | | | | | | | | | | | | | | | |
| | | | | | TOTAL | | | 0 | | | | 9,842,975 | | | | 9,842,975 | |
| | | | | | | | | | | | | | | | | | |
Transportation - Airlines - 0.1% | | | | | | | | | | | | |
237,395 | | 0 | | 237,395 | | Continental Airlines, Inc. - Pass-Thru Cert 1991-1 Class A, 6.545%, 8/2/2020 | | | 252,510 | | | | 0 | | | | 252,510 | |
0 | | 4,000 | | 4,000 | | Southwest Airlines Co., 6.50%, 3/1/2012 | | | 0 | | | | 4,196 | | | | 4,196 | |
| | | | | | | | | | | | | | | | | | |
| | | | | | TOTAL | | | 252,510 | | | | 4,196 | | | | 256,706 | |
| | | | | | | | | | | | | | | | | | |
Transportation - Railroads - 0.8% | | | | | | | | | | | | |
0 | | 2,020,000 | | 2,020,000 | | Burlington Northern Santa Fe Corp., 4.875%, 1/15/2015 | | | 0 | | | | 2,197,963 | | | | 2,197,963 | |
0 | | 465,000 | | 465,000 | | Burlington Northern Santa Fe Corp., Deb., 5.75%, 5/1/2040 | | | 0 | | | | 484,370 | | | | 484,370 | |
0 | | 153,378 | | 153,378 | | Burlington Northern Santa Fe Corp., Pass Thru Cert., 7.57%, 1/2/2021 | | | 0 | | | | 181,400 | | | | 181,400 | |
| | | | | | | | | | | | | | | | | | |
| | | | | | TOTAL | | | 0 | | | | 2,863,733 | | | | 2,863,733 | |
| | | | | | | | | | | | | | | | | | |
Transportation - Services - 0.8% | | | | | | | | | | | | |
0 | | 1,695,000 | | 1,695,000 | | (1)(2) Enterprise Rent-A-Car USA Finance Co., 6.375%, 10/15/2017 | | | 0 | | | | 1,888,856 | | | | 1,888,856 | |
171,994 | | 0 | | 171,994 | | FedEx Corp., Pass-Thru Cert., 7.50%, 1/15/2018 | | | 180,952 | | | | 0 | | | | 180,952 | |
0 | | 530,000 | | 530,000 | | United Parcel Service, Inc., Sr. Unsecd. Note, 3.125%, 1/15/2021 | | | 0 | | | | 494,443 | | | | 494,443 | |
| | | | | | | | | | | | | | | | | | |
| | | | | | TOTAL | | | 180,952 | | | | 2,383,299 | | | | 2,564,251 | |
| | | | | | | | | | | | | | | | | | |
Utility - Electric - 6.6% | | | | | | | | | | | | |
0 | | 930,000 | | 930,000 | | Cleveland Electric Illuminating Co., Sr. Unsecd. Note, 5.95%, 12/15/2036 | | | 0 | | | | 891,372 | | | | 891,372 | |
0 | | 1,130,000 | | 1,130,000 | | Commonwealth Edison Co., 1st Mtg. Bond, 5.80%, 3/15/2018 | | | 0 | | | | 1,269,494 | | | | 1,269,494 | |
0 | | 910,000 | | 910,000 | | Consolidated Edison Co., Sr. Unsecd. Note, 5.50%, 9/15/2016 | | | 0 | | | | 1,033,208 | | | | 1,033,208 | |
0 | | 610,000 | | 610,000 | | (1)(2) Enel Finance International SA, Company Guarantee, Series 144A, 3.875%, 10/7/2014 | | | 0 | | | | 622,558 | | | | 622,558 | |
1,975,000 | | 0 | | 1,975,000 | | Entergy Louisiana, LLC, 5.40%, 11/1/2024 | | | 2,119,550 | | | | 0 | | | | 2,119,550 | |
16
| | | | | | | | | | | | | | | | | | |
0 | | 500,000 | | 500,000 | | Exelon Generation Co., LLC, Sr. Unsecd. Note, 5.75%, 10/1/2041 | | | 0 | | | | 477,201 | | | | 477,201 | |
0 | | 620,000 | | 620,000 | | FPL Group Capital, Inc., 7.875%, 12/15/2015 | | | 0 | | | | 748,765 | | | | 748,765 | |
0 | | 570,000 | | 570,000 | | FirstEnergy Solutions Corp., Company Guarantee, 4.80%, 2/15/2015 | | | 0 | | | | 599,105 | | | | 599,105 | |
0 | | 800,000 | | 800,000 | | FirstEnergy Solutions Corp., Company Guarantee, 6.05%, 8/15/2021 | | | 0 | | | | 823,419 | | | | 823,419 | |
0 | | 1,629,330 | | 1,629,330 | | (1)(2) Great River Energy, 1st Mtg. Note, 5.829%, 7/1/2017 | | | 0 | | | | 1,830,484 | | | | 1,830,484 | |
0 | | 420,000 | | 420,000 | | KCP&L Greater Missouri Operations Co., Sr. Unsecd. Note, 11.875%, 7/1/2012 | | | 0 | | | | 476,962 | | | | 476,962 | |
0 | | 2,650,000 | | 2,650,000 | | MidAmerican Energy Holdings Co., Sr. Unsecd. Note, 5.95%, 5/15/2037 | | | 0 | | | | 2,821,750 | | | | 2,821,750 | |
0 | | 635,000 | | 635,000 | | Northern States Power Co., MN, 1st Mtg. Bond, 5.25%, 3/1/2018 | | | 0 | | | | 704,763 | | | | 704,763 | |
71,000 | | 0 | | 71,000 | | Oglethorpe Power Corp., 6.974%, 6/30/2011 | | | 72,599 | | | | 0 | | | | 72,599 | |
750,000 | | 0 | | 750,000 | | PacifiCorp, 6.90%, 11/15/2011 | | | 790,380 | | | | 0 | | | | 790,380 | |
0 | | 1,110,000 | | 1,110,000 | | PPL Energy Supply LLC, Sr. Unsecd. Note, 6.0%, 12/15/2036 | | | 0 | | | | 1,108,815 | | | | 1,108,815 | |
0 | | 1,390,000 | | 1,390,000 | | PSI Energy, Inc., Bond, 6.05%, 6/15/2016 | | | 0 | | | | 1,590,136 | | | | 1,590,136 | |
0 | | 500,000 | | 500,000 | | Southwestern Electric Power Co., Sr. Unsecd. Note, 6.20%, 3/15/2040 | | | 0 | | | | 510,851 | | | | 510,851 | |
0 | | 230,000 | | 230,000 | | TECO Finance, Inc. Company Guarantee, 5.15%, 3/15/2020 | | | 0 | | | | 238,892 | | | | 238,892 | |
0 | | 800,000 | | 800,000 | | UIL Holdings Corp., Sr. Unsecd. Note, 4.625%, 10/1/2020 | | | 0 | | | | 758,994 | | | | 758,994 | |
0 | | 1,570,000 | | 1,570,000 | | Union Electric Co., 6.00%, 4/1/2018 | | | 0 | | | | 1,740,616 | | | | 1,740,616 | |
1,000,000 | | 0 | | 1,000,000 | | Westar Energy, Inc., 5.15%, 1/1/2017 | | | 1,057,280 | | | | 0 | | | | 1,057,280 | |
| | | | | | | | | | | | | | | | | | |
| | | | | | TOTAL | | | 4,039,809 | | | | 18,247,385 | | | | 22,287,194 | |
| | | | | | | | | | | | | | | | | | |
Utilities - Natural Gas Distributor - 0.1% | | | | | | | | | | | | |
0 | | 280,000 | | 280,000 | | (1)(2) Florida Gas Transmission Co. LLC, Sr. Unsecd. Note, Series 144A, 5.45%, 7/15/2020 | | | 0 | | | | 292,707 | | | | 292,707 | |
| | | | | | | | | | | | | | | | | | |
Utility - Natural Gas Pipelines - 3.9% | | | | | | | | | | | | |
0 | | 990,000 | | 990,000 | | Consolidated Natural Gas Co., 5.00%, 12/1/2014 | | | 0 | | | | 1,082,402 | | | | 1,082,402 | |
0 | | 1,865,000 | | 1,865,000 | | Duke Capital Corp., Sr. Note, 6.25%, 2/15/2013 | | | 0 | | | | 2,023,867 | | | | 2,023,867 | |
0 | | 1,850,000 | | 1,850,000 | | Enbridge, Inc., Sr. Note, 5.60%, 4/1/2017 | | | 0 | | | | 2,075,743 | | | | 2,075,743 | |
17
| | | | | | | | | | | | | | | | | | |
0 | | 1,670,000 | | 1,670,000 | | Enterprise Products Operating LLC, Company Guarantee, Series O, 9.75%, 1/31/2014 | | | 0 | | | | 2,018,644 | | | | 2,018,644 | |
1,600,000 | | 0 | | 1,600,000 | | Kinder Morgan Energy Partners, LP, 5.30%, 9/15/2020 | | | 1,672,128 | | | | 0 | | | | 1,672,128 | |
0 | | 2,750,000 | | 2,750,000 | | Kinder Morgan Energy Partners, LP, Sr. Unsecd. Note, 5.80%, 3/15/2035 | | | 0 | | | | 2,654,359 | | | | 2,654,359 | |
0 | | 1,110,000 | | 1,110,000 | | Williams Partners LP, 5.25%, 3/15/2020 | | | 0 | | | | 1,152,722 | | | | 1,152,722 | |
0 | | 380,000 | | 380,000 | | Williams Partners LP, Sr. Unsecd. Note, 4.125%, 11/15/2020 | | | 0 | | | | 360,649 | | | | 360,649 | |
| | | | | | | | | | | | | | | | | | |
| | | | | | TOTAL | | | 1,672,128 | | | | 11,368,386 | | | | 13,040,514 | |
| | | | | | | | | | | | | | | | | | |
| | | | | | TOTAL CORPORATE BONDS (IDENTIFIED COST $283,528,886) | | | 30,456,325 | | | | 265,600,297 | | | | 296,056,622 | |
| | | | | | | | | | | | | | | | | | |
COMMERCIAL MORTGAGE PASS-THRU CERTIFICATES - 0.5% | | | | | | | | | |
1,500,000 | | 0 | | 1,500,000 | | TIAA Seasoned Commercial Mortgage Trust 2007-C4, 6.05%, 8/1/2039 (IDENTIFIED COST $1,487,179) | | | 1,537,676 | | | | 0 | | | | 1,537,676 | |
| | | | | | | | | | | | | | | | | | |
GOVERNMENT/AGENCY - 0.1% | | | | | | | | | | | | |
Sovereign - 0.1% | | | | | | | | | | | | | | |
0 | | 500,000 | | 500,000 | | Sweden, Government of, 10.25%, 11/1/2015 (IDENTIFIED COST $500,000) | | | 0 | | | | 514,590 | | | | 514,590 | |
| | | | | | | | | | | | | | | | | | |
U.S. GOVERNMENT AGENCIES - 1.2% | | | | | |
750,000 | | 0 | | 750,000 | | Federal Home Loan Bank, 0.10%, 1/7/2011 | | | 749,985 | | | | 0 | | | | 749,985 | |
1,000,000 | | 0 | | 1,000,000 | | Federal Home Loan Bank, 0.10%, 1/21/2011 | | | 999,939 | | | | 0 | | | | 999,939 | |
750,000 | | 0 | | 750,000 | | Federal Home Loan Bank, 0.14%, 1/28/2011 | | | 749,921 | | | | 0 | | | | 749,921 | |
500,000 | | 0 | | 500,000 | | Federal National Mortgage Association, 0.07%, 1/7/2011 | | | 499,993 | | | | 0 | | | | 499,993 | |
1,000,000 | | 0 | | 1,000,000 | | Federal National Mortgage Association, 0.09%, 1/12/2011 | | | 999,969 | | | | 0 | | | | 999,969 | |
| | | | | | | | | | | | | | | | | | |
| | | | | | TOTAL GOVERNMENT AGENCIES (IDENTIFIED COST $3,999,807) | | | 3,999,807 | | | | 0 | | | | 3,999,807 | |
| | | | | | | | | | | | | | | | | | |
MORTGAGE-BACKED SECURITIES - 4.9% | | | | | | | | | | | | |
Federal Home Loan Mortgage Corporation - 1.2% | | | | | | | | | | | | |
473,221 | | 0 | | 473,221 | | Federal Home Loan Mortgage Corp., 3023 Class TG, 5.50%, 8/1/2035 | | | 475,331 | | | | 0 | | | | 475,331 | |
1,952,319 | | 0 | | 1,952,319 | | Federal Home Loan Mortgage Corp., 3051 Class MY, 5.50%, 10/1/2025 | | | 2,097,732 | | | | 0 | | | | 2,097,732 | |
18
| | | | | | | | | | | | | | | | | | |
0 | | 3,513 | | 3,513 | | Federal Home Loan Mortgage Corp., Pool C01051, 8.00%, 9/1/2030 | | | 0 | | | | 3,965 | | | | 3,965 | |
0 | | 3,421 | | 3,421 | | Federal Home Loan Mortgage Corp., Pool E80411, 6.50%, 4/1/2015 | | | 0 | | | | 3,679 | | | | 3,679 | |
497,691 | | 0 | | 497,691 | | Federal Home Loan Mortgage Corp., Pool G02562, 6.00%, 1/1/2037 | | | 540,971 | | | | 0 | | | | 540,971 | |
613,665 | | 0 | | 613,665 | | Federal Home Loan Mortgage Corp., Pool G02648, 5.50%, 12/1/2036 | | | 655,976 | | | | 0 | | | | 655,976 | |
467,912 | | 0 | | 467,912 | | Federal Home Loan Mortgage Corp., Pool G03803, 5.50%, 1/1/2038 | | | 499,296 | | | | 0 | | | | 499,296 | |
| | | | | | | | | | | | | | | | | | |
| | | | | | TOTAL | | | 4,269,306 | | | | 7,644 | | | | 4,276,950 | |
| | | | | | | | | | | | | | | | | | |
Federal National Mortgage Association - 1.2% | | | | | | | | | | | | |
458 | | 0 | | 458 | | Federal National Mortgage Association, Pool 50276, 9.50%, 2/1/2020 | | | 540 | | | | 0 | | | | 540 | |
372,970 | | 0 | | 372,970 | | Federal National Mortgage Association, Pool 256103, 5.50%, 2/1/2026 | | | 401,346 | | | | 0 | | | | 401,346 | |
1,577,058 | | 0 | | 1,577,058 | | Federal National Mortgage Association, Pool 257306, 5.50%, 8/1/2038 | | | 1,689,660 | | | | 0 | | | | 1,689,660 | |
321,251 | | 0 | | 321,251 | | Federal National Mortgage Association, Pool 897144, 6.00%, 9/1/2036 | | | 350,226 | | | | 0 | | | | 350,226 | |
899,006 | | 0 | | 899,006 | | Federal National Mortgage Association, Pool 906224, 5.50%, 1/1/2037 | | | 964,120 | | | | 0 | | | | 964,120 | |
557,654 | | 0 | | 557,654 | | Federal National Mortgage Association, Pool 928570, 6.00%, 8/1/2037 | | | 606,907 | | | | 0 | | | | 606,907 | |
| | | | | | | | | | | | | | | | | | |
| | | | | | TOTAL | | | 4,012,799 | | | | 0 | | | | 4,012,799 | |
| | | | | | | | | | | | | | | | | | |
Government National Mortgage Association - 2.5% | | | | | | | | | | | | |
1,000,000 | | 0 | | 1,000,000 | | Government National Mortgage Association, 2003-1 Class PE, 5.50%, 7/1/2032 | | | 1,097,986 | | | | 0 | | | | 1,097,986 | |
1,000,000 | | 0 | | 1,000,000 | | Government National Mortgage Association, 2003-116 Class JC, 5.00%, 5/1/2030 | | | 1,022,500 | | | | 0 | | | | 1,022,500 | |
7,803 | | 0 | | 7,803 | | Government National Mortgage Association, Pool 1512, 7.50%, 12/1/2023 | | | 8,967 | | | | 0 | | | | 8,967 | |
13,032 | | 0 | | 13,032 | | Government National Mortgage Association, Pool 2631, 7.00%, 8/1/2028 | | | 14,870 | | | | 0 | | | | 14,870 | |
21,567 | | 0 | | 21,567 | | Government National Mortgage Association, Pool 2658, 6.50%, 10/1/2028 | | | 24,406 | | | | 0 | | | | 24,406 | |
19
| | | | | | | | | | | | | | | | |
28,418 | | 0 | | 28,418 | | Government National Mortgage Association, Pool 2701, 6.50%, 1/1/2029 | | | 32,160 | | | 0 | | | 32,160 | |
21,141 | | 0 | | 21,141 | | Government National Mortgage Association, Pool 2796, 7.00%, 8/1/2029 | | | 24,134 | | | 0 | | | 24,134 | |
7,541 | | 0 | | 7,541 | | Government National Mortgage Association, Pool 3039, 6.50%, 2/1/2031 | | | 8,534 | | | 0 | | | 8,534 | |
14,084 | | 0 | | 14,084 | | Government National Mortgage Association, Pool 3040, 7.00%, 2/1/2031 | | | 16,092 | | | 0 | | | 16,092 | |
44,501 | | 0 | | 44,501 | | Government National Mortgage Association, Pool 3188, 6.50%, 1/1/2032 | | | 50,347 | | | 0 | | | 50,347 | |
40,412 | | 0 | | 40,412 | | Government National Mortgage Association, Pool 3239, 6.50%, 5/1/2032 | | | 45,721 | | | 0 | | | 45,721 | |
84,115 | | 0 | | 84,115 | | Government National Mortgage Association, Pool 3261, 6.50%, 7/1/2032 | | | 95,166 | | | 0 | | | 95,166 | |
343,572 | | 0 | | 343,572 | | Government National Mortgage Association, Pool 3320, 5.50%, 12/1/2032 | | | 372,354 | | | 0 | | | 372,354 | |
287,399 | | 0 | | 287,399 | | Government National Mortgage Association, Pool 3333, 5.50%, 1/1/2033 | | | 311,377 | | | 0 | | | 311,377 | |
44,351 | | 0 | | 44,351 | | Government National Mortgage Association, Pool 3375, 5.50%, 4/1/2033 | | | 48,051 | | | 0 | | | 48,051 | |
195,442 | | 0 | | 195,442 | | Government National Mortgage Association, Pool 3390, 5.50%, 5/1/2033 | | | 211,748 | | | 0 | | | 211,748 | |
332,005 | | 0 | | 332,005 | | Government National Mortgage Association, Pool 3403, 5.50%, 6/1/2033 | | | 359,704 | | | 0 | | | 359,704 | |
337,433 | | 0 | | 337,433 | | Government National Mortgage Association, Pool 3458, 5.00%, 10/1/2033 | | | 361,171 | | | 0 | | | 361,171 | |
469,476 | | 0 | | 469,476 | | Government National Mortgage Association, Pool 3499, 5.00%, 1/1/2034 | | | 501,984 | | | 0 | | | 501,984 | |
478,494 | | 0 | | 478,494 | | Government National Mortgage Association, Pool 3556, 5.50%, 5/1/2034 | | | 517,649 | | | 0 | | | 517,649 | |
772,407 | | 0 | | 772,407 | | Government National Mortgage Association, Pool 3623, 5.00%, 10/1/2034 | | | 825,891 | | | 0 | | | 825,891 | |
20
| | | | | | | | | | | | | | | | | | |
| 0 | | 2,175 | | 2,175 | | Government National Mortgage Association, Pool 493514, 8.00%, 9/15/2030 | | | 0 | | | | 2,469 | | | | 2,469 | |
| 11,704 | | 0 | | 11,704 | | Government National Mortgage Association, Pool 22630, 6.50%, 8/1/2028 | | | 13,245 | | | | 0 | | | | 13,245 | |
| 3,091 | | 0 | | 3,091 | | Government National Mortgage Association, Pool 276337, 10.00%, 8/1/2019 | | | 3,597 | | | | 0 | | | | 3,597 | |
| 0 | | 6,588 | | 6,588 | | Government National Mortgage Association, Pool 516688, 8.00%, 8/15/2029 | | | 0 | | | | 7,517 | | | | 7,517 | |
| 673,055 | | 0 | | 673,055 | | Government National Mortgage Association, Pool 643816, 6.00%, 7/1/2025 | | | 743,467 | | | | 0 | | | | 743,467 | |
| 509,466 | | 0 | | 509,466 | | Government National Mortgage Association, Pool 704189, 5.50%, 1/1/2039 | | | 551,176 | | | | 0 | | | | 551,176 | |
| 979,651 | | 0 | | 979,651 | | Government National Mortgage Association, Pool 782604, 5.50%, 3/1/2039 | | | 1,059,855 | | | | 0 | | | | 1,059,855 | |
| | | | | | | | | | | | | | | | | | |
| | | | | | TOTAL | | | 8,322,152 | | | | 9,986 | | | | 8,332,138 | |
| | | | | | | | | | | | | | | | | | |
| | | | | | TOTAL MORTGAGE-BACKED SECURITIES (IDENTIFIED COST $15,442,950) | | | 16,604,257 | | | | 17,630 | | | | 16,621,887 | |
| | | | | | | | | | | | | | | | | | |
| U.S. TREASURY - 0.3% | |
U.S. Treasury Bill - 0.3%6 | | | | | | | | | | | | | | |
| 0 | | 1,000,000 | | 1,000,000 | | (7)United State Treasury Bill, 0.065%, 1/27/2011 (IDENTIFIED COST $999,856) | | | 0 | | | | 999,947 | | | | 999,947 | |
| | | | | | | | | | | | | | | | | | |
| COMMERCIAL PAPER - 1.4% | |
| 1,000,000 | | 0 | | 1,000,000 | | Citigroup, 0.25%, 1/14/2011 | | | 999,906 | | | | 0 | | | | 999,906 | |
| 750,000 | | 0 | | 750,000 | | Citigroup, 0.24%, 1/31/2011 | | | 749,844 | | | | 0 | | | | 749,844 | |
| 1,000,000 | | 0 | | 1,000,000 | | Chevron Corp., 0.16%, 1/25/2011 | | | 1,000,000 | | | | 0 | | | | 1,000,000 | |
| 1,000,000 | | 0 | | 1,000,000 | | General Electric Capital Corp., 0.15%, 1/19/2011 | | | 1,000,000 | | | | 0 | | | | 1,000,000 | |
| 1,000,000 | | 0 | | 1,000,000 | | General Electric Capital Corp., 0.17%, 1/27/2011 | | | 1,000,000 | | | | 0 | | | | 1,000,000 | |
| | | | | | | | | | | | | | | | | | |
| | | | | | TOTAL COMMERCIAL PAPER (IDENTIFIED COST $4,749,750) | | | 4,749,750 | | | | 0 | | | | 4,749,750 | |
| | | | | | | | | | | | | | | | | | |
| MONEY MARKET MUTUAL FUND - 0.1% | |
| 193,599 | | 0 | | 193,599 | | JP Morgan U.S. Treasury Plus Money Market Fund (COST $193,599) | | | 193,599 | | | | 0 | | | | 193,599 | |
| | | | | | | | | | | | | | | | | | |
| REPURCHASE AGREEMENT - 2.5% | |
21
| | | | | | | | | | | | | | | | | | |
| 0 | | 8,514,000 | | 8,514,000 | | Interest in $5,850,000,000 joint repurchase agreement 0.25%, dated 12/31/2010 under which Bank of America, N.A. will repurchase securities provided as collateral for $5,850,121,875 on 1/3/2011. The securities provided as collateral at the end of the period were U.S. Government Agency securities with various maturities to 4/15/2040 and the market value of those underlying securities was $5,972,500,657 (AT COST). | | | 0 | | | | 8,514,000 | | | | 8,514,000 | |
| | | | | | | | | | | | | | | | | | |
| | | | | | Total Investments (Identified Cost $318,669,387- 99.0%)(8)(9) | | | 57,541,414 | | | | 275,646,464 | | | | 333,186,940 | |
| | | | | | | | | | | | | | | | | | |
| | | | | | Other Assets and Liabilities - 1.0% (9)(10)(11) | | | 397,369 | | | | 2,960,290 | | | | 3,357,936 | |
| | | | | | | | | | | | | | | | | | |
| | | | | | Total Net Assets - 100% | | $ | 57,938,783 | | | $ | 278,606,754 | | | $ | 336,544,876 | |
| | | | | | | | | | | | | | | | | | |
Note: The categories of investments are shown as a percentage of total net assets at December 31, 2010.
At December 31, 2010, Federated Quality Bond Fund II had the following outstanding futures contracts:
| | | | | | | | | | | | | | | | |
Description | | Number of
Contracts | | | Notional
Value | | | Expiration
Date | | | Unrealized
Appreciation/
(Depreciation) | |
(4) U.S. Treasury Notes 5-Year Short Futures | | | 75 | | | $ | 8,828,906 | | | | March 2011 | | | $ | (60,514 | ) |
(4) U.S. Treasury Bonds 30-Year Short Futures | | | 320 | | | $ | 39,080,000 | | | | March 2012 | | | $ | 1,154,309 | |
| | | | | | | | | | | | | | | | |
NET UNREALIZED APPRECIATION ON FUTURES CONTRACTS | | | | | | | | | | | $ | 1,093,795 | |
Net Unrealized Appreciation on Futures Contracts is included in “Other Assets and Liabilities - Net”.
| (1) | Denotes a restricted security that either: (a) cannot be offered for public sale without first being registered, or being able to take advantage of an exemption from registration, under the Securities Act of 1933; or (b) is subject to a contractual restriction on public sales. At December 31, 2010, these restricted securities amounted to $51,797,080, which represented 15.4% of total net assets of the Pro Forma Combined. |
| (2) | Denotes a restricted security that may be resold without restriction to “qualified institutional buyers” as defined in Rule 144A under the Securities Act of 1933 and that the Fund has determined to be liquid under the criteria established by the Fund’s Board of Trustees. At December 31, 2010, these liquid restricted securities amounted to $50,500,448, which represented 15.0% of total net assets of the Pro Forma Combined. |
| (3) | JPMorgan Chase & Co. has fully and unconditionally guaranteed Bear Stearns’ outstanding debt securities. |
| (4) | Non-income producing security |
| (6) | Discount rate at time of purchase. |
| (7) | All or a portion of this security is pledged as collateral to ensure Federated Quality Bond Fund II is able to satisfy the obligations of its outstanding |
22
futures contracts.
| (8) | The cost of investment for federal tax purposes for the Pro Forma Combined amounts to $319,416,027. |
| (9) | This security will not transfer into Federated Quality Bond Fund II as a result of the reorganization and will need to be sold prior to the reorganization. Market value and identified cost of Federated Quality Bond Fund II Pro Forma Combined have been adjusted by ($938) and ($746,640), respectively to reflect the adjustment for this security. Other Assets & Liabilities has been adjusted by $938 to reflect the cash received, based on current market value, for this sale. |
| (10) | Assets, other than investments in securities, less liabilities. See Statement of Assets and Liabilities. |
| (11) | Includes an adjustment of ($661) for the Pro Forma Combined for prepaid expenses which will not transfer as a result of the reorganization. |
Various inputs are used in determining the value of each funds’ investments. These inputs are summarized in the three broad levels listed below:
Level 1 - quoted prices in active markets for identical securities
Level 2 - other significant observable inputs (including quoted prices for similar securities, interest rates, prepayment speeds, credit risks, etc.)
Level 3 - significant unobservable inputs (including each fund’s own assumptions in determining the fair value of investments)
The inputs or methodology used for valuing securities are not an indication of the risk associated with investing in those securities.
The following is a summary of the inputs used, as of December 31, 2010, in valuing each fund’s assets carried at fair value:
| | | | | | | | | | | | | | | | |
| Fund | | Valuation Inputs | |
| | | Level 1 | | | Level 2 | | | Level 3 | | | Total | |
High Grade Bond Portfolio | | | | | | | | | | | | | | | | |
Debt Securities: | | | | | | | | | | | | | | | | |
Corporate Bonds | | $ | 0 | | | $ | 30,456,325 | | | $ | 0 | | | $ | 30,456,325 | |
Commercial Mortgage Pass-Thru Agreements | | | 0 | | | | 1,537,676 | | | | 0 | | | | 1,537,676 | |
Government/Agency | | | 0 | | | | 0 | | | | 0 | | | | 0 | |
Government Agencies | | | 0 | | | | 3,999,807 | | | | 0 | | | | 3,999,807 | |
Mortgage-Backed Securities | | | 0 | | | | 16,604,257 | | | | 0 | | | | 16,604,257 | |
U.S. Treasury | | | 0 | | | | 0 | | | | 0 | | | | 0 | |
Commercial Paper | | | 0 | | | | 4,749,750 | | | | 0 | | | | 4,749,750 | |
Equity Securities: | | | | | | | | | | | | | | | | |
Preferred Stock | | | 0 | | | | 0 | | | | 0 | | | | 0 | |
Money Market Mutual Fund | | | 193,599 | | | | 0 | | | | 0 | | | | 193,599 | |
Repurchase Agreements | | | 0 | | | | 0 | | | | 0 | | | | 0 | |
| | | | | | | | | | | | | | | | |
TOTAL SECURITIES | | $ | 193,599 | | | $ | 57,347,815 | | | $ | 0 | | | $ | 57,541,414 | |
| | | | | | | | | | | | | | | | |
OTHER FINANCIAL INSTRUMENTS | | $ | 0 | | | $ | 0 | | | $ | 0 | | | $ | 0 | |
| | | | | | | | | | | | | | | | |
| | | | |
Federated Quality Bond Fund II | | | | | | | | | | | | | | | | |
Debt Securities: | | | | | | | | | | | | | | | | |
Corporate Bonds | | $ | 0 | | | $ | 265,600,297 | | | $ | 0 | | | $ | 265,600,297 | |
Commercial Mortgage Pass-Thru Agreements | | | 0 | | | | 0 | | | | 0 | | | | 0 | |
Government/Agency | | | 0 | | | | 514,590 | | | | 0 | | | | 514,590 | |
Government Agencies | | | 0 | | | | 0 | | | | 0 | | | | 0 | |
Mortgage-Backed Securities | | | 0 | | | | 17,630 | | | | 0 | | | | 17,630 | |
U.S. Treasury | | | 0 | | | | 999,947 | | | | 0 | | | | 999,947 | |
23
| | | | | | | | | | | | | | | | |
Commercial Paper | | | 0 | | | | 0 | | | | 0 | | | | 0 | |
Equity Securities: | | | | | | | | | | | | | | | | |
Preferred Stock | | | 0 | | | | 0 | | | | 0 | | | | 0 | |
Money Market Mutual Fund | | | 0 | | | | 0 | | | | 0 | | | | 0 | |
Repurchase Agreements | | | 0 | | | | 8,514,000 | | | | 0 | | | | 8,514,000 | |
| | | | | | | | | | | | | | | | |
TOTAL SECURITIES | | $ | 0 | | | $ | 275,646,464 | | | $ | 0 | | | $ | 275,646,464 | |
| | | | | | | | | | | | | | | | |
OTHER FINANCIAL INSTRUMENTS* | | $ | 1,093,795 | | | $ | 0 | | | $ | 0 | | | $ | 1,093,795 | |
| | | | | | | | | | | | | | | | |
| | | | |
Federated Quality Bond Fund II Pro Forma Combined | | | | | | | | | | | | | | | | |
Debt Securities: | | | | | | | | | | | | | | | | |
Corporate Bonds** | | $ | 0 | | | $ | 296,055,684 | | | $ | 0 | | | $ | 296,055,684 | |
Commercial Mortgage Pass-Thru Agreements | | | 0 | | | | 1,537,676 | | | | 0 | | | | 1,537,676 | |
Government/Agency | | | 0 | | | | 514,590 | | | | 0 | | | | 514,590 | |
Government Agencies | | | 0 | | | | 3,999,807 | | | | 0 | | | | 3,999,807 | |
Mortgage-Backed Securities | | | 0 | | | | 16,621,887 | | | | 0 | | | | 16,621,887 | |
U.S. Treasury | | | 0 | | | | 999,947 | | | | 0 | | | | 999,947 | |
Commercial Paper | | | 0 | | | | 4,749,750 | | | | 0 | | | | 4,749,750 | |
Equity Securities: | | | | | | | | | | | | | | | | |
Preferred Stock | | | 0 | | | | 0 | | | | 0 | | | | 0 | |
Money Market Mutual Fund | | | 193,599 | | | | 0 | | | | 0 | | | | 193,599 | |
Repurchase Agreements | | | 0 | | | | 8,514,000 | | | | 0 | | | | 8,514,000 | |
| | | | | | | | | | | | | | | | |
TOTAL SECURITIES | | $ | 193,599 | | | $ | 332,993,341 | | | $ | 0 | | | $ | 333,186,940 | |
| | | | | | | | | | | | | | | | |
OTHER FINANCIAL INSTRUMENTS* | | $ | 1,093,795 | | | $ | 0 | | | $ | 0 | | | $ | 1,093,795 | |
| | | | | | | | | | | | | | | | |
| * | Other financial instruments include futures contracts. |
| ** | Includes an adjustment of $938 for a security which cannot transfer into Federated Quality Bond Fund II as a result of the reorganization. |
The following acronyms are used throughout these portfolios:
| | |
MTN | | - Medium Term Note |
REIT | | - Real Estate Investment Trust |
24
High Grade Bond Portfolio
Federated Quality Bond Fund II
Pro Forma Combining Statements of Assets & Liabilities
December 31, 2010 (unaudited)
| | | | | | | | | | | | | | | | |
| | | High Grade
Bond
Portfolio | | | Federated Quality Bond Fund II | | | Pro Forma
Adjustment | | | Federated Quality Bond Fund II
Proforma
Combined | |
Assets: | | | | | | | | | | | | | | | | |
Investments in securities, at value | | $ | 57,541,414 | | | $ | 275,646,464 | | | ($ | 938) | (a) | | $ | 333,186,940 | |
Cash | | | 0 | | | | 927 | | | | 938 | | | | 1,865 | |
Income receivable | | | 442,008 | | | | 3,553,531 | | | | 0 | | | | 3,995,539 | |
Receivable for investments sold | | | 0 | | | | 1,288 | | | | 0 | | | | 1,288 | |
Receivable for shares sold | | | 20,081 | | | | 43,684 | | | | 0 | | | | 63,765 | |
Prepaid expenses | | | 661 | | | | 0 | | | | (661) | (b) | | | 0 | |
| | | | | | | | | | | | | | | | |
Total assets | | | 58,004,164 | | | | 279,245,894 | | | | (661) | | | | 337,249,397 | |
| | | | | | | | | | | | | | | | |
Liabilities: | | | | | | | | | | | | | | | | |
Payable for shares redeemed | | | 55,997 | | | | 202,990 | | | | 0 | | | | 258,987 | |
Income distribution payable | | | 16 | | | | 0 | | | | 0 | | | | 16 | |
Payable for daily variation margin | | | 0 | | | | 383,438 | | | | 0 | | | | 383,438 | |
Accrued expenses | | | 9,368 | | | | 52,712 | | | | 0 | | | | 62,080 | |
| | | | | | | | | | | | | | | | |
Total liabilities | | | 65,381 | | | | 639,140 | | | | 0 | | | | 704,521 | |
| | | | | | | | | | | | | | | | |
Net Assets | | $ | 57,938,783 | | | $ | 278,606,754 | | | ($ | 661) | | | $ | 336,544,876 | |
| | | | | | | | | | | | | | | | |
Net Assets Consists of: | | | | | | | | | | | | | | | | |
Paid-in capital | | $ | 56,034,883 | | | $ | 263,396,671 | | | ($ | 661) | (a)(b) | | $ | 319,430,893 | |
Net unrealized appreciation of investments and futures contracts | | | 1,936,874 | | | | 12,928,772 | | | | 745,702 | (a) | | | 15,611,348 | |
Accumulated net realized loss on investments and futures contracts | | | (32,974) | | | | (11,231,190) | | | | (745,702) | (a) | | | (12,009,866) | |
Undistributed net investment income | | | 0 | | | | 13,512,501 | | | | 0 | | | | 13,512,501 | |
| | | | | | | | | | | | | | | | |
Total Net Assets | | $ | 57,938,783 | | | $ | 278,606,754 | | | ($ | 661) | | | $ | 336,544,876 | |
| | | | | | | | | | | | | | | | |
Net Asset Value, Offering Price and Redemption Proceeds Per Share | | | | | | | | | | | | | | | | |
Primary Shares: | | | | | | | | | | | | | | | | |
Net Assets | | $ | 0 | | | $ | 214,644,427 | | | $ | 57,938,122 | (c) | | $ | 272,582,549 | |
| | | | | | | | | | | | | | | | |
Shares Outstanding | | | 0 | | | | 18,586,882 | | | | 5,016,288 | (c) | | | 23,603,170 | |
| | | | | | | | | | | | | | | | |
Shares Authorized | | | 0 | | | | unlimited | | | | | | | | unlimited | |
| | | | | | | | | | | | | | | | |
Net Asset Value, Offering Price and Redemption Proceeds Per Share | | | | | | $ | 11.55 | | | | | | | $ | 11.55 | |
| | | | | | | | | | | | | | | | |
25
| | | | | | | | | | | | | | | | | | | | |
Service Shares: | | | | | | | | | | | | | | | | | | | | |
Net Assets | | $ | 0 | | | $ | 63,962,327 | | | $ | 0 | | | | | | | $ | 63,962,327 | |
| | | | | | | | | | | | | | | | | | | | |
Shares Outstanding | | | 0 | | | | 5,563,655 | | | | 0 | | | | | | | | 5,563,655 | |
| | | | | | | | | | | | | | | | | | | | |
Shares Authorized | | | 0 | | | | unlimited | | | | | | | | | | | | unlimited | |
| | | | | | | | | | | | | | | | | | | | |
Net Asset Value, Offering Price and Redemption Proceeds Per Share | | | | | | $ | 11.50 | | | | | | | | | | | $ | 11.50 | |
| | | | | | | | | | | | | | | | | | | | |
Initial Class: | | | | | | | | | | | | | | | | | | | | |
Net Assets | | $ | 44,928,603 | | | $ | 0 | | | ($ | 44,928,603 | ) | | | (c | ) | | $ | 0 | |
| | | | | | | | | | | | | | | | | | | | |
Shares Outstanding | | | 4,292,484 | | | | 0 | | | | (4,292,484 | ) | | | (c | ) | | | 0 | |
| | | | | | | | | | | | | | | | | | | | |
Shares Authorized | | | unlimited | | | | 0 | | | | | | | | | | | �� | 0 | |
| | | | | | | | | | | | | | | | | | | | |
Net Asset Value, Offering Price and Redemption Proceeds Per Share | | $ | 10.47 | | | | | | | | | | | | | | | | | |
| | | | | | | | | | | | | | | | | | | | |
Service Class: | | | | | | | | | | | | | | | | | | | | |
Net Assets | | $ | 13,010,180 | | | $ | 0 | | | ($ | 13,010,180 | ) | | | (c | ) | | $ | 0 | |
| | | | | | | | | | | | | | | | | | | | |
Shares Outstanding | | | 1,242,971 | | | | 0 | | | | (1,242,971 | ) | | | (c | ) | | | 0 | |
| | | | | | | | | | | | | | | | | | | | |
Shares Authorized | | | unlimited | | | | 0 | | | | | | | | | | | | 0 | |
| | | | | | | | | | | | | | | | | | | | |
Net Asset Value, Offering Price and Redemption Proceeds Per Share | | $ | 10.47 | | | | | | | | | | | | | | | | | |
| | | | | | | | | | | | | | | | | | | | |
Investments, at identified cost | | $ | 55,604,540 | | | $ | 263,811,487 | | | ($ | 746,640 | ) | | | (a | ) | | $ | 318,669,387 | |
| | | | | | | | | | | | | | | | | | | | |
| (a) | Adjustment to reflect a security held by High Grade Bond Portfolio which will not transfer as a result of the reorganization. |
| (b) | Adjustment for prepaid expenses which will not transfer as a result of the reorganization. |
| (c) | Adjustment to reflect share balance as a result of the combination. |
26
High Grade Bond Portfolio
Federated Quality Bond Fund II
Pro Forma Combining Statements of Operations
For the year ended December 31, 2010 (unaudited)
| | | | | | | | | | | | | | | | | | | | |
| | | High Grade
Bond
Portfolio | | | Federated
Quality Bond Fund II | | | Pro Forma
Adjustment | | | | | | Federated
Quality Bond Fund II
Proforma
Combined | |
Investment Income: | | | | | | | | | | | | | | | | | | | | |
Dividends | | $ | 0 | | | $ | 0 | | | $ | 0 | | | | | | | $ | 0 | |
Interest | | | 2,438,937 | | | | 15,777,984 | | | | 0 | | | | | | | | 18,216,921 | |
| | | | | | | | | | | | | | | | | | | | |
Total Investment Income: | | | 2,438,937 | | | | 15,777,984 | | | | 0 | | | | | | | | 18,216,921 | |
Expenses: | | | | | | | | | | | | | | | | | | | | |
Investment adviser fee | | | 165,709 | | | | 1,780,809 | | | | 165,545 | | | | (a | ) | | | 2,112,063 | |
Administrative personnel and services fee | | | 0 | | | | 231,877 | | | | 43,043 | | | | (b | ) | | | 274,920 | |
Custodian fees | | | 7,095 | | | | 14,921 | | | | (6,319 | ) | | | (c | ) | | | 15,697 | |
Transfer and dividend disbursing agent fees and expenses | | | 0 | | | | 31,681 | | | | 60 | | | | (d | ) | | | 31,741 | |
Directors’/Trustees’ fees | | | 8,629 | | | | 1,562 | | | | (5,921 | ) | | | (e | ) | | | 4,270 | |
Professional fees | | | 26,388 | | | | 0 | | | | (26,388 | ) | | | (f | ) | | | 0 | |
Auditing fees | | | 0 | | | | 20,500 | | | | | | | | | | | | 20,500 | |
Legal fees | | | 0 | | | | 6,749 | | | | 646 | | | | (g | ) | | | 7,395 | |
Portfolio accounting fees | | | 27,618 | | | | 117,053 | | | | (16,826 | ) | | | (h | ) | | | 127,845 | |
Distribution fees | | | 25,158 | | | | 0 | | | | (25,158 | ) | | | (i | ) | | | 0 | |
Distribution services fee - Select Shares | | | 0 | | | | 172,498 | | | | | | | | | | | | 172,498 | |
Printing and postage | | | 7,030 | | | | 24,571 | | | | 34,829 | | | | (j | ) | | | 66,430 | |
Insurance premiums | | | 5,327 | | | | 4,614 | | | | (5,121 | ) | | | (k | ) | | | 4,820 | |
Miscellaneous | | | 2,776 | | | | 3,964 | | | | (2,140 | ) | | | (l | ) | | | 4,600 | |
| | | | | | | | | | | | | | | | | | | | |
Total Expenses | | | 275,730 | | | | 2,410,799 | | | | 156,250 | | | | | | | | 2,842,779 | |
| | | | | | | | | | | | | | | | | | | | |
Waivers and Reduction– | | | | | | | | | | | | | | | | | | | | |
Waiver of investment adviser fee | | | 0 | | | | (140,166 | ) | | | (41,823 | ) | | | (m | ) | | | (181,989 | ) |
Waiver of administrative personnel and services fee | | | 0 | | | | (6,011 | ) | | | (1,029 | ) | | | (n | ) | | | (7,040 | ) |
Fees paid indirectly for directed brokerage arrangements | | | (5 | ) | | | 0 | | | | 5 | | | | (o | ) | | | 0 | |
| | | | | | | | | | | | | | | | | | | | |
Total Waivers and Reimbursements | | | (5 | ) | | | (146,177 | ) | | | (42,847 | ) | | | | | | | (189,029 | ) |
| | | | | | | | | | | | | | | | | | | | |
Net Expenses | | | 275,725 | | | | 2,264,622 | | | | 113,403 | | | | | | | | 2,653,750 | |
| | | | | | | | | | | | | | | | | | | | |
Net investment income | | $ | 2,163,212 | | | $ | 13,513,362 | | | ($ | 113,403 | ) | | | | | | $ | 15,563,171 | |
| | | | | | | | | | | | | | | | | | | | |
Realized and Unrealized Gain (Loss) on Investments and Foreign Currency Transactions: | | | | | | | | | | | | | | | | | | | | |
Net realized gain (loss) on investments | | | (739 | ) | | | 6,073,392 | | | | (745,702 | ) | | | (p | ) | | | 5,326,951 | |
Net realized loss on futures contracts | | | 0 | | | | (4,339,636 | ) | | | 0 | | | | | | | | (4,339,636 | ) |
Net change in unrealized appreciation (depreciation) of investments | | | 1,954,026 | | | | 9,090,458 | | | | 745,702 | | | | (p | ) | | | 11,790,186 | |
Net change in unrealized appreciation (depreciation) of futures contracts | | | 0 | | | | 27,825 | | | | 0 | | | | | | | | 27,825 | |
| | | | | | | | | | | | | | | | | | | | |
27
| | | | | | | | | | | | | | | | |
Net realized and unrealized loss on investments and foreign currency transactions | | | 1,953,287 | | | | 10,852,039 | | | | 0 | | | | 12,805,326 | |
| | | | | | | | | | | | | | | | |
Change in net assets resulting from operations | | $ | 4,116,499 | | | $ | 24,365,401 | | | ($ | 113,403 | ) | | $ | 28,368,497 | |
| | | | | | | | | | | | | | | | |
(See Notes to Pro Forma Financial Statements)
28
High Grade Bond Portfolio
Federated Quality Bond Fund II
Notes to Pro Forma Financial Statements
For the Period Ended December 31, 2010 (unaudited)
Note 1. Description of the Funds
High Grade Bond Portfolio is a portfolio of EquiTrust Variable Insurance Series Fund, which is registered under the Investment Company Act of 1940, as amended (the “Act”), as an open-end diversified management investment company. Federated Quality Bond Fund II, a series of Federated Insurance Series, is registered under the Act, as an open-end management investment company. High Grade Bond Portfolio consists of two classes of shares: Initial Class and Service Class. Federated Quality Bond Fund II consists of two classes of shares: Primary Shares and Service Shares.
Note 2. Basis of Combination
The accompanying unaudited Pro Forma Combining Portfolios of Investments, Statements of Assets and Liabilities and Statements of Operations (Pro Forma Financial Statements) reflect the accounts of High Grade Bond Portfolio and Federated Quality Bond Fund II (individually referred to as the “Fund”, or collectively as the “Funds”), for the year ended December 31, 2010. These statements have been derived from the books and records utilized in calculating daily net asset values at December 31, 2010.
The Pro Forma Financial Statements should be read in conjunction with the historical financial statements of High Grade Bond Portfolio and Federated Quality Bond Fund II, which have been incorporated by reference in the Statement of Additional Information. The Funds follow generally accepted accounting principles in the United States of America applicable to management investment companies which are disclosed in the historical financial statements.
The Pro Forma Financial Statements give effect to the proposed exchange of assets of Initial Class Shares and Service Class Shares of High Grade Bond Portfolio for Primary Shares of Federated Quality Bond Fund II. Under generally accepted accounting principles, Federated Quality Bond Fund II will be the surviving entity for accounting purposes with its historical cost of investment securities and results of operations being carried forward.
The Pro Forma Financial Statements have been adjusted to reflect the anticipated advisory fee arrangement for the surviving entity, if necessary. Certain other operating costs have also been adjusted to reflect anticipated expenses of the combined entity. Other costs which may change as a result of the reorganization are currently undeterminable.
For the year ended December 31, 2010, High Grade Bond Portfolio and Federated Quality Bond Fund II paid investment advisory fees computed at the annual rate of 0.30% and 0.60%, respectively, as a percentage of average daily net assets.
The investment advisers of Federated Insurance Funds and the EquiTrust Variable Funds or their affiliates will pay the direct expenses and all the indirect expenses of the Reorganization.
Note 3. Portfolio Valuation
In calculating its net asset value (NAV), Federated Quality Bond Fund II generally values investments as follows:
| | • | | Fixed-income securities acquired with remaining maturities greater than 60 days are fair valued using price evaluations provided by a pricing service approved by the Board of Trustees (the “Trustees”). |
| | • | | Fixed-income securities acquired with remaining maturities of 60 days or less are valued at their cost (adjusted for the accretion of any discount or amortization of any premium). |
29
| | • | | Derivative contracts listed on exchanges are valued at their reported settlement or closing price. |
| | • | | Over-the-counter (OTC) derivative contracts are fair valued using price evaluations provided by a pricing service approved by the Trustees. |
| | • | | Shares of other mutual funds are valued based upon their reported NAVs. |
If Federated Quality Bond Fund II cannot obtain a price or price evaluation from a pricing service for an investment, the Fund may attempt to value the investment based upon the mean of bid and asked quotations or fair value the investment based on price evaluations, from one or more dealers. If any price, quotation, price evaluation or other pricing source is not readily available when the NAV is calculated, the Fund uses the fair value of the investment determined in accordance with the procedures described below. There can be no assurance that the Fund could purchase or sell an investment at the price used to calculate the Fund’s NAV.
Fair Valuation and Significant Events Procedures
The Trustees of Federated Quality Bond Fund II have authorized the use of pricing services to provide evaluations of the current fair value of certain investments for purposes of calculating the NAV. Factors considered by pricing services in evaluating an investment include the yields or prices of investments of comparable quality, coupon, maturity, call rights and other potential prepayments, terms and type, reported transactions, indications as to values from dealers, and general market conditions. Some pricing services provide a single price evaluation reflecting the bid-side of the market for an investment (a “bid” evaluation). Other pricing services offer both bid evaluations and price evaluations indicative of a price between the prices bid and asked for the investment (a “mid” evaluation). The Funds normally use bid evaluations for U.S. Treasury and Agency securities, mortgage-backed securities and municipal securities. The Funds normally use mid evaluations for other types of fixed-income securities and OTC derivative contracts. In the event that market quotations and price evaluations are not available for an investment, the fair value of the investment is determined in accordance with procedures adopted by the Trustees.
The Trustees also have adopted procedures requiring an investment to be priced at its fair value whenever the Adviser determines that a significant event affecting the value of the investment has occurred between the time as of which the price of the investment would otherwise be determined and the time as of which the NAV is computed. An event is considered significant if there is both an affirmative expectation that the investment’s value will change in response to the event and a reasonable basis for quantifying the resulting change in value. Examples of significant events that may occur after the close of the principal market on which a security is traded, or after the time of a price evaluation provided by a pricing service or a dealer, include:
| | • | | With respect to securities traded in foreign markets, significant trends in U.S. equity markets or in the trading of foreign securities index futures or options contracts; |
| | • | | With respect to price evaluations of fixed-income securities determined before the close of regular trading on the NYSE, actions by the Federal Reserve Open Market Committee and other significant trends in U.S. fixed-income markets; |
| | • | | Political or other developments affecting the economy or markets in which an issuer conducts its operations or its securities are traded; and |
| | • | | Announcements concerning matters such as acquisitions, recapitalizations, litigation developments, a natural disaster affecting the issuer’s operations or regulatory changes or market developments affecting the issuer’s industry. |
The Trustees have approved the use of a pricing service to determine the fair value of equity securities traded principally in foreign markets when the Adviser determines that there has been a significant trend in the U.S. equity markets or in index futures trading. For other significant events, the Funds may seek to obtain more current quotations or price evaluations from alternative pricing sources. If a reliable alternative pricing source is not available, the Fund will determine the fair value of the investment using another method approved by the Trustees.
With respect to High Grade Bond Portfolio, the Fund values its investment securities that are traded on any national exchange at the last sale price on the day of valuation or, lacking any sales, at the mean between the closing bid and
30
asked process. Investments traded in the over-the-counter market are valued at the mean between the closing bid and asked prices or yield equivalent. In situations where market quotations are not readily available or quoted market prices are not reliable, investments are valued at fair value in accordance with the procedures adopted by the Fund’s Board of Trustees. Money market investments are valued at market value, except that obligations maturing in 60 days or less are valued using the amortized cost method, which approximates market value. Under the amortized cost method, a security is valued at its cost on the date of purchase and thereafter is adjusted to reflect a constant amortization to maturity of the difference between the principal amount due at maturity and the cost of investment to the Fund.
Note 4. Shares of Beneficial Interest
The Pro Forma Primary Shares net asset value per share assumes the issuance of 5,016,288 Primary Shares of Federated Quality Bond Fund II in exchange for 4,292,484 Initial Class Shares and 1,242,971 Service Class Shares of High Grade Bond Portfolio, which would have been outstanding at December 31, 2010 in connection with the proposed reorganization, assuming the two Funds had been combined as of such date.
Note 5. Federal Income Taxes
Each Fund has elected to be taxed as a “regulated investment company” under the Internal Revenue Code. After the acquisition, Federated Quality Bond Fund II intends to continue to qualify as a regulated investment company, if such qualification is in the best interests of its shareholders, by complying with the Subchapter M provision of the Internal Revenue Code and to distribute to shareholders each year substantially all of its income. Accordingly, no provision for federal income tax is necessary. Federated Quality Bond Fund II complies with the provisions of Financial Accounting Standards Board (FASB) Interpretation No. 48 (FIN 48) “Accounting for Uncertainty in Income Taxes”. As of and during the year ended December 31, 2010, the Fund did not have a liability for any uncertain tax positions. The Fund recognizes interest and penalties, if any, related to tax liabilities as income tax expense in the Statement of Operations. As of December 31, 2010, tax years 2007 through 2010 remain subject to examination by the Fund’s major tax jurisdictions, which include the United States of America and the Commonwealth of Massachusetts.
The identified cost of investments for the funds is substantially the same for both financial accounting and federal income tax purposes. The tax cost of investments will remain unchanged for the combined fund.
Note 6. Other
The preparation of financial statements in conformity with GAAP requires management to make estimates and assumptions that affect the amounts of assets, liabilities, expenses and revenue reported in the financial statements. Actual results could differ from those estimated.
Note 7. Pro Forma Adjustments
| | (a) | EquiTrust Investment Management Services, Inc. is the investment adviser for High Grade Bond Portfolio. Federated Equity Management Company of Pennsylvania is the investment adviser for Federated Quality Bond Fund II. The advisory agreement between High Grade Bond Portfolio and the Adviser provides for an annual fee equal to 0.30% of the Fund’s average daily net assets. The advisory agreement between Federated Quality Bond Fund II and the Adviser provides for an annual fee equal to 0.60% of the Fund’s average daily net assets. An adjustment to the combined investment adviser fee reflects the fee structure of Federated Quality Bond Fund II based on the combined assets of Federated Quality Bond Fund II Pro Forma Combined. |
| | (b) | Federated Administrative Services (FAS), under the Administrative Services Agreement, provides each Fund with certain administrative personnel and services necessary to operate the Fund. The fee paid to FAS is based on the average aggregate daily net assets of certain Federated funds. The administrative fee received during any fiscal year shall be at least $150,000 per portfolio and $40,000 per each additional class of Shares. Under a similar plan, FAS provides The Funds with certain administrative personnel and |
31
| | services necessary to operate each Fund. An adjustment to the combined administrative personnel and services fee reflects the fee structure of Federated Quality Bond Fund II Pro Forma Combined. |
| | (c) | Adjustment to reflect custodian fees based upon the current expense structure for Federated Quality Bond Fund II Pro Forma Combined. |
| | (d) | Adjustment to reflect transfer and dividend disbursing agent fees and expenses based upon the current expense structure for Federated Quality Bond Fund II Pro Forma Combined. |
| | (e) | Adjustment to reflect Directors/Trustees fees based upon the current expense structure for Federated Quality Bond Fund II Pro Forma Combined. |
| | (f) | Adjustment to reflect removal of professional fees since the combined expenses in this category for High Grade Bond Portfolio are disclosed separately for Federated Quality Bond Fund II Pro Forma Combined. |
| | (g) | Adjustment to reflect legal fees based upon the current expense structure for Federated Quality Bond Fund II Pro Forma Combined. |
| | (h) | Adjustment to reflect portfolio accounting fees based upon the current expense structure for Federated Quality Bond Fund II Pro Forma Combined. |
| | (i) | Adjustment to reflect removal of distribution fees for High Grade Bond Portfolio from Federated Quality Bond Fund II Pro Forma Combined since Primary Shares of Federated Quality Bond Fund II do not currently incur a distribution fee. |
| | (j) | Adjustment to reflect printing and postage costs based upon the current expense structure for Federated Quality Bond Fund II Pro Forma Combined. |
| | (k) | Adjustment to reflect insurance premiums based upon the current expense structure for Federated Quality Bond Fund II Pro Forma Combined. |
| | (l) | Adjustment to reflect miscellaneous expenses based upon the current expense structure for Federated Quality Bond Fund II Pro Forma Combined. |
| | (m) | Adjustment to reflect the voluntary waiver of investment advisory fees on the average daily net assets of Federated Quality Bond Fund II Pro Forma Combined. The adviser of Federated Quality Bond Fund II and its affiliates have voluntarily agreed to waive their fees and/or reimburse expenses so that the total annual fund operating expenses (as shown in the financial highlights) paid by the Fund’s Primary Shares (after the voluntary waivers and/or reimbursements) will not exceed 0.75% through the later of (the “Termination Date”); (a) April 30, 2011; or (b) the date of the Fund’s next effective Prospectus. While the adviser and its affiliates currently do not anticipate terminating or increasing these arrangements prior to the Termination Date, these arrangements may only be terminated or increased prior to the Termination Date with the agreement of the Fund’s Trustees. |
| | (n) | Adjustment to reflect the voluntary waiver of administrative personnel and services fee on the average daily net assets of Federated Quality Bond Fund II Pro Forma Combined. |
| | (o) | Adjustment to remove fees paid indirectly for directed broker arrangements for High Grade Bond Portfolio since these Federated Quality Bond Fund II does not currently participate in these arrangements. |
| | (p) | Adjustment to reflect the sale of a security that cannot transfer over as a result of the reorganization. |
32
B. Acquisition of Managed Portfolio by Federated Capital Income Fund II
INTRODUCTION
The accompanying unaudited Pro Forma Combining Portfolios of Investments, Statements of Assets and Liabilities and Statements of Operations (“Pro Forma Financial Statements”) reflect the accounts of Managed Portfolio and Federated Capital Income Fund II (individually referred to as the “Fund” or collectively as the “Funds”), for the period ended December 31, 2010. Managed Portfolio will be reorganized into Federated Capital Income Fund II as of the close of business on or about [July 15], 2011. For the purposes of these Pro Forma Financial Statements, the financial information covers the period from January 1, 2010 to December 31, 2010. These statements have been derived from the books and records utilized in calculating daily net asset values at December 31, 2010.
The Pro Forma Financial Statements give effect to the proposed exchange of assets of Initial Class Shares and Service Class Shares of Managed Portfolio for Shares of Federated Capital Income Fund II. Under generally accepted accounting principles, Federated Capital Income Fund II will be the surviving entity for accounting purposes with its historical cost of investment securities and results of operations being carried forward.
The Pro Forma Financial Statements have been adjusted to reflect the anticipated advisory fee arrangement for the surviving entity. Certain other operating costs have also been adjusted to reflect anticipated expenses of the combined entity. Other costs which may change as a result of the reorganization currently are undeterminable.
[Remainder of page intentionally left blank.]
33
Managed Portfolio
Federated Capital Income Fund II
Pro Forma Combining Portfolio of Investments
December 31, 2010 (unaudited)
| | | | | | | | | | | | | | | | | | |
Managed Portfolio | | Federated
Capital
Income
Fund II | | Federated
Capital
Income
Fund II
Pro Forma
Combined | | | | Managed
Portfolio | | | Federated
Capital
Income
Fund II | | | Federated
Capital
Income
Fund II Pro Forma
Combined | |
| | |
| Shares or Principal Amount | | | | Value | |
COMMON STOCKS – 61.2% | |
Consumer Discretionary - 4.9% | | | | | | | | | | | | |
2,700 | | 0 | | 2,700 | | (1) AutoZone, Inc. | | $ | 735,993 | | | $ | 0 | | | $ | 735,993 | |
12,800 | | 0 | | 12,800 | | Cash America International, Inc. | | | 472,704 | | | | 0 | | | | 472,704 | |
13,590 | | 0 | | 13,590 | | Comcast Corp. - Class A | | | 298,572 | | | | 0 | | | | 298,572 | |
0 | | 3,485 | | 3,485 | | Cinemark Holdings, Inc. | | | 0 | | | | 60,081 | | | | 60,081 | |
28,000 | | 0 | | 28,000 | | (1) EZCORP, Inc. | | | 759,640 | | | | 0 | | | | 759,640 | |
9,300 | | 0 | | 9,300 | | (1) FTI Consulting, Inc. | | | 346,704 | | | | 0 | | | | 346,704 | |
13,600 | | 4,385 | | 17,985 | | Genuine Parts Co. | | | 698,224 | | | | 225,126 | | | | 923,350 | |
12,334 | | 0 | | 12,334 | | (1) Helen of Troy Ltd. | | | 366,813 | | | | 0 | | | | 366,813 | |
0 | | 8,140 | | 8,140 | | Leggett and Platt, Inc. | | | 0 | | | | 185,266 | | | | 185,266 | |
0 | | 3,115 | | 3,115 | | National CineMeida, Inc. | | | 0 | | | | 62,020 | | | | 62,020 | |
10,600 | | 0 | | 10,600 | | (1) O’Reilly Automotive, Inc. | | | 640,452 | | | | 0 | | | | 640,452 | |
0 | | 10,025 | | 10,025 | | Regal Entertainment Group | | | 0 | | | | 117,694 | | | | 117,694 | |
4,760 | | 0 | | 4,760 | | Target Corp. | | | 286,219 | | | | 0 | | | | 286,219 | |
0 | | 1,270 | | 1,270 | | Time Warner, Inc. | | | 0 | | | | 83,858 | | | | 83,858 | |
20,290 | | 0 | | 20,290 | | Wal-Mart Stores, Inc. | | | 1,094,240 | | | | 0 | | | | 1,094,240 | |
6,360 | | 0 | | 6,360 | | Walgreen Co. | | | 247,786 | | | | 0 | | | | 247,786 | |
| | | | | | | | | | | | | | | | | | |
| | | | | | TOTAL | | | 5,947,347 | | | | 734,045 | | | | 6,681,392 | |
| | | | | | | | | | | | | | | | | | |
Consumer Staples - 5.9% | | | | | | | | | | | | |
0 | | 17,125 | | 17,125 | | Altria Group, Inc. | | | 0 | | | | 421,617 | | | | 421,617 | |
0 | | 1,640 | | 1,640 | | British American Tobacco PLC, ADR | | | 0 | | | | 127,428 | | | | 127,428 | |
10,400 | | 0 | | 10,400 | | Campbell Soup Co. | | | 361,400 | | | | 0 | | | | 361,400 | |
4,330 | | 0 | | 4,330 | | Colgate-Palmolive Co. | | | 348,002 | | | | 0 | | | | 348,002 | |
0 | | 2,595 | | 2,595 | | ConAgra Foods, Inc. | | | 0 | | | | 58,595 | | | | 58,595 | |
7,200 | | 0 | | 7,200 | | Diageo PLC | | | 535,176 | | | | 0 | | | | 535,176 | |
0 | | 34,195 | | 34,195 | | Foster’s Group Ltd., Sponsored ADR | | | 0 | | | | 196,963 | | | | 196,963 | |
0 | | 6,060 | | 6,060 | | H.J. Heinz Co. | | | 0 | | | | 299,728 | | | | 299,728 | |
0 | | 3,100 | | 3,100 | | Imperial Tobacco Group PLC, ADR | | | 0 | | | | 191,425 | | | | 191,425 | |
6,115 | | 3,985 | | 10,100 | | Kimberly-Clark Corp. | | | 385,490 | | | | 251,214 | | | | 636,704 | |
15,399 | | 0 | | 15,399 | | Kraft Foods, Inc. | | | 485,222 | | | | 0 | | | | 485,222 | |
18,005 | | 0 | | 18,005 | | Procter & Gamble Co. (The) | | | 1,158,262 | | | | 0 | | | | 1,158,262 | |
12,650 | | 0 | | 12,650 | | PepsiCo, Inc. | | | 826,424 | | | | 0 | | | | 826,424 | |
9,835 | | 6,150 | | 15,985 | | Philip Morris International Inc. | | | 575,643 | | | | 359,960 | | | | 935,603 | |
0 | | 7,930 | | 7,930 | | Reynolds American, Inc. | | | 0 | | | | 258,677 | | | | 258,677 | |
34
| | | | | | | | | | | | | | | | | | |
17,085 | | 0 | | 17,085 | | Sysco Corp. | | | 502,299 | | | | 0 | | | | 502,299 | |
10,380 | | 0 | | 10,380 | | The Coca-Cola Co. | | | 682,693 | | | | 0 | | | | 682,693 | |
| | | | | | | | | | | | | | | | | | |
| | | | | | TOTAL | | | 5,860,611 | | | | 2,165,607 | | | | 8,026,218 | |
| | | | | | | | | | | | | | | | | | |
Energy - 8.3% | | | | | | | | | | | | | | |
13,700 | | 0 | | 13,700 | | Anadarko Petroleum Corp. | | | 1,043,392 | | | | 0 | | | | 1,043,392 | |
3,400 | | 0 | | 3,400 | | Apache Corp. | | | 405,382 | | | | 0 | | | | 405,382 | |
8,700 | | 0 | | 8,700 | | Baker Hughes, Inc. | | | 497,379 | | | | 0 | | | | 497,379 | |
0 | | 4,835 | | 4,835 | | Chevron Corp. | | | 0 | | | | 441,194 | | | | 441,194 | |
17,170 | | 6,580 | | 23,750 | | ConocoPhillips | | | 1,169,277 | | | | 448,098 | | | | 1,617,375 | |
6,400 | | 0 | | 6,400 | | Devon Energy Corp. | | | 502,464 | | | | 0 | | | | 502,464 | |
0 | | 5,685 | | 5,685 | | ENI S.p.A., ADR | | | 0 | | | | 248,662 | | | | 248,662 | |
6,100 | | 0 | | 6,100 | | Exxon Mobil Corp. | | | 446,032 | | | | 0 | | | | 446,032 | |
33,193 | | 0 | | 33,193 | | (1) Kinder Morgan Management, LLC | | | 2,219,948 | | | | 0 | | | | 2,219,948 | |
22,250 | | 0 | | 22,250 | | Occidental Petroleum Corp. | | | 2,182,725 | | | | 0 | | | | 2,182,725 | |
16,700 | | 0 | | 16,700 | | (1) Rowan Companies, Inc. | | | 582,997 | | | | 0 | | | | 582,997 | |
0 | | 2,220 | | 2,220 | | Repsol YPF SA, ADR | | | 0 | | | | 62,027 | | | | 62,027 | |
0 | | 3,880 | | 3,880 | | Royal Dutch Shell PLC | | | 0 | | | | 259,106 | | | | 259,106 | |
0 | | 3,940 | | 3,940 | | Ship Finance International LTD | | | 0 | | | | 84,789 | | | | 84,789 | |
0 | | 6,540 | | 6,540 | | Total SA, ADR | | | 0 | | | | 349,759 | | | | 349,759 | |
11,100 | | 0 | | 11,100 | | Valero Energy Corp. | | | 256,632 | | | | 0 | | | | 256,632 | |
| | | | | | | | | | | | | | | | | | |
| | | | | | TOTAL | | | 9,306,228 | | | | 1,893,635 | | | | 11,199,863 | |
| | | | | | | | | | | | | | | | | | |
Financials - 9.9% | | | | | | | | | | | | | | |
7,140 | | 0 | | 7,140 | | Allstate Corp. (The) | | | 227,623 | | | | 0 | | | | 227,623 | |
0 | | 4,110 | | 4,110 | | American Campus Communities, Inc. | | | 0 | | | | 130,534 | | | | 130,534 | |
17,455 | | 0 | | 17,455 | | Arthur J. Gallagher & Co. | | | 507,591 | | | | 0 | | | | 507,591 | |
17,202 | | 17,395 | | 34,597 | | Bank of America Corp. | | | 229,475 | | | | 0 | | | | 229,475 | |
12,108 | | 0 | | 12,108 | | Bank of New York Mellon Corp. (The) | | | 365,662 | | | | 0 | | | | 365,662 | |
108,505 | | 0 | | 108,505 | | BGC Partners, Inc. - Class A | | | 901,677 | | | | 0 | | | | 901,677 | |
0 | | 17,395 | | 17,395 | | Brandywine Realty Trust | | | 0 | | | | 202,652 | | | | 202,652 | |
0 | | 7,220 | | 7,220 | | CBL & Associates Properties, Inc. | | | 0 | | | | 126,350 | | | | 126,350 | |
0 | | 7,690 | | 7,690 | | Cincinnati Financial Corp. | | | 0 | | | | 243,696 | | | | 243,696 | |
0 | | 7,645 | | 7,645 | | (1) CommonWealth REIT | | | 0 | | | | 195,024 | | | | 195,024 | |
75,000 | | 0 | | 75,000 | | (1) CNO Financial Group, Inc. | | | 508,500 | | | | 0 | | | | 508,500 | |
43,593 | | 0 | | 43,593 | | EMC Insurance Group, Inc. | | | 986,946 | | | | 0 | | | | 986,946 | |
0 | | 4,095 | | 4,095 | | Entertainment Properties Trust | | | 0 | | | | 189,394 | | | | 189,394 | |
0 | | 10,850 | | 10,850 | | Equity One, Inc. | | | 0 | | | | 197,253 | | | | 197,253 | |
0 | | 7,295 | | 7,295 | | Government Properties Income Trust | | | 0 | | | | 195,433 | | | | 195,433 | |
16,600 | | 0 | | 16,600 | | Hartford Financial Services Group, Inc. (The) | | | 439,734 | | | | 0 | | | | 439,734 | |
0 | | 2,750 | | 2,750 | | Health Care REIT, Inc. | | | 0 | | | | 131,010 | | | | 131,010 | |
0 | | 16,385 | | 16,385 | | Hospitality Properties Trust | | | 0 | | | | 377,510 | | | | 377,510 | |
0 | | 21,875 | | 21,875 | | Hudson City Bancorp. Inc. | | | 0 | | | | 278,687 | | | | 278,687 | |
10,400 | | 0 | | 10,400 | | J.P. Morgan Chase & Co. | | | 441,168 | | | | 0 | | | | 441,168 | |
14,300 | | 0 | | 14,300 | | Kansas City Life Insurance Co. | | | 472,329 | | | | 0 | | | | 472,329 | |
16,700 | | 0 | | 16,700 | | Lincoln National Corp. | | | 464,427 | | | | 0 | | | | 464,427 | |
0 | | 1,480 | | 1,480 | | M & T Bank Corp. | | | 0 | | | | 128,834 | | | | 128,834 | |
0 | | 4,035 | | 4,035 | | Mack-Cali Realty Corp. | | | 0 | | | | 133,397 | | | | 133,397 | |
0 | | 5,790 | | 5,790 | | Mercury General Corp. | | | 0 | | | | 249,028 | | | | 249,028 | |
11,370 | | 0 | | 11,370 | | MetLife, Inc. | | | 505,283 | | | | 0 | | | | 505,283 | |
35
| | | | | | | | | | | | | | | | | | |
0 | | 6,350 | | 6,350 | | NYSE Euronext | | | 0 | | | | 190,373 | | | | 190,373 | |
0 | | 4,815 | | 4,815 | | National Retail Properties, Inc. | | | 0 | | | | 127,598 | | | | 127,598 | |
44,834 | | 0 | | 44,834 | | New York Community Bancorp, Inc. | | | 845,121 | | | | 0 | | | | 845,121 | |
10,625 | | 0 | | 10,625 | | Northern Trust Corp. | | | 588,731 | | | | 0 | | | | 588,731 | |
31,100 | | 13,645 | | 44,745 | | Old Republic International Corp. | | | 423,893 | | | | 185,981 | | | | 609,874 | |
0 | | 8,705 | | 8,705 | | Omega Healthcare Investors | | | 0 | | | | 195,340 | | | | 195,340 | |
0 | | 9,200 | | 9,200 | | PNC Financial Services Group | | | 0 | | | | 558,624 | | | | 558,624 | |
31,400 | | 0 | | 31,400 | | Protective Life Corp. | | | 836,496 | | | | 0 | | | | 836,496 | |
0 | | 8,895 | | 8,895 | | Senior Housing Properties Trust | | | 0 | | | | 195,156 | | | | 195,156 | |
0 | | 2,095 | | 2,095 | | Sun Life Financial Services of Canada | | | 0 | | | | 63,060 | | | | 63,060 | |
12,895 | | 0 | | 12,895 | | U.S. Bancorp | | | 347,778 | | | | 0 | | | | 347,778 | |
1,658 | | 0 | | 1,658 | | Wells Fargo & Co. | | | 51,381 | | | | 0 | | | | 51,381 | |
| | | | | | | | | | | | | | | | | | |
| | | | | | TOTAL | | | 9,143,815 | | | | 4,294,934 | | | | 13,438,749 | |
| | | | | | | | | | | | | | | | | | |
Health Care - 6.9% | | | | | | | | | | | | | | |
17,500 | | 1,105 | | 18,605 | | Abbott Laboratories | | | 838,425 | | | | 52,941 | | | | 891,366 | |
3,900 | | 0 | | 3,900 | | (1) Amgen, Inc. | | | 214,110 | | | | 0 | | | | 214,110 | |
0 | | 5,275 | | 5,275 | | AstraZeneca Group PLC, ADR | | | 0 | | | | 243,652 | | | | 243,652 | |
6,235 | | 0 | | 6,235 | | Becton, Dickinson and Co. | | | 526,982 | | | | 0 | | | | 526,982 | |
0 | | 1,640 | | 1,640 | | Bayer AG, ADR | | | 0 | | | | 120,310 | | | | 120,310 | |
0 | | 12,456 | | 12,456 | | Bristol-Myers Squibb Co. | | | 0 | | | | 329,835 | | | | 329,835 | |
0 | | 5,030 | | 5,030 | | Cardinal Health, Inc. | | | 0 | | | | 192,699 | | | | 192,699 | |
0 | | 7,905 | | 7,905 | | Eli Lilly and Co. | | | 0 | | | | 276,991 | | | | 276,991 | |
0 | | 8,400 | | 8,400 | | GlaxoSmithKline PLC, ADR | | | 0 | | | | 329,448 | | | | 329,448 | |
26,912 | | 1,955 | | 28,867 | | Johnson & Johnson | | | 1,664,507 | | | | 120,917 | | | | 1,785,424 | |
9,054 | | 11,140 | | 20,194 | | Merck & Co. | | | 326,306 | | | | 401,486 | | | | 727,792 | |
19,050 | | 0 | | 19,050 | | (1) Mylan, Inc. | | | 402,526 | | | | 0 | | | | 402,526 | |
67,084 | | 30,330 | | 97,414 | | Pfizer, Inc. | | | 1,174,641 | | | | 531,078 | | | | 1,705,719 | |
12,600 | | 0 | | 12,600 | | Quest Diagnostics, Inc. | | | 680,022 | | | | 0 | | | | 680,022 | |
5,140 | | 0 | | 5,140 | | Stryker Corp. | | | 276,018 | | | | 0 | | | | 276,018 | |
11,399 | | 0 | | 11,399 | | Teva Pharmaceutical Industries Ltd. | | | 594,230 | | | | 0 | | | | 594,230 | |
0 | | 1,800 | | 1,800 | | UnitedHealth Group, Inc. | | | 0 | | | | 64,998 | | | | 64,998 | |
| | | | | | | | | | | | | | | | | | |
| | | | | | TOTAL | | | 6,697,767 | | | | 2,664,355 | | | | 9,362,122 | |
| | | | | | | | | | | | | | | | | | |
Industrials - 6.4% | | | | | | | | | | | | |
6,535 | | | | 6,535 | | 3M Co. | | | 563,970 | | | | 0 | | | | 563,970 | |
0 | | 6,120 | | 6,120 | | BAE Systems PLC, ADR | | | 0 | | | | 127,602 | | | | 127,602 | |
0 | | 8,365 | | 8,365 | | Deluxe Corp. | | | 0 | | | | 192,562 | | | | 192,562 | |
0 | | 10,995 | | 10,995 | | Donnelley (R.R.) & Sons Co. | | | 0 | | | | 192,083 | | | | 192,083 | |
36,400 | | 0 | | 36,400 | | Federal Signal Corp. | | | 249,704 | | | | 0 | | | | 249,704 | |
106,965 | | 60,645 | | 167,610 | | General Electric Co. | | | 1,956,390 | | | | 1,109,197 | | | | 3,065,587 | |
0 | | 870 | | 870 | | Lockheed Martin Corp. | | | 0 | | | | 60,822 | | | | 60,822 | |
16,905 | | 0 | | 16,905 | | Honeywell International, Inc. | | | 898,670 | | | | 0 | | | | 898,670 | |
10,155 | | 0 | | 10,155 | | Illinois Tool Works, Inc. | | | 542,277 | | | | 0 | | | | 542,277 | |
20,634 | | 0 | | 20,634 | | Ingersoll-Rand PLC | | | 971,655 | | | | 0 | | | | 971,655 | |
10,190 | | 0 | | 10,190 | | ITT Corp. | | | 531,001 | | | | 0 | | | | 531,001 | |
0 | | 5,140 | | 5,140 | | Pitney Bowes, Inc. | | | 0 | | | | 124,285 | | | | 124,285 | |
0 | | 1,780 | | 1,780 | | United Parcel Service, Inc. | | | 0 | | | | 129,192 | | | | 129,192 | |
6,720 | | 0 | | 6,720 | | United Parcel Service, Inc. - Class B | | | 487,738 | | | | 0 | | | | 487,738 | |
15,400 | | 0 | | 15,400 | | Waste Management, Inc. | | | 567,798 | | | | 0 | | | | 567,798 | |
36
| | | | | | | | | | | | | | | | | | |
| | | | | | | | | | | | | | | | | | |
| | | | | | TOTAL | | | 6,769,203 | | | | 1,935,743 | | | | 8,704,946 | |
| | | | | | | | | | | | | | | | | | |
Information Technology - 6.2% | | | | | | | | | | | | |
4,400 | | 0 | | 4,400 | | (1) Apple, Inc. | | | 1,419,264 | | | | 0 | | | | 1,419,264 | |
11,300 | | 0 | | 11,300 | | Automatic Data Processing, Inc. | | | 522,964 | | | | 0 | | | | 522,964 | |
35,830 | | 0 | | 35,830 | | (1) Cisco Systems, Inc. | | | 724,841 | | | | 0 | | | | 724,841 | |
8,900 | | 0 | | 8,900 | | (1) eBay, Inc. | | | 247,687 | | | | 0 | | | | 247,687 | |
36,800 | | 0 | | 36,800 | | (1) EMC Corp. | | | 842,720 | | | | 0 | | | | 842,720 | |
5,460 | | 0 | | 5,460 | | Hewlett-Packard Co. | | | 229,866 | | | | 0 | | | | 229,866 | |
0 | | 1,765 | | 1,765 | | IBM Corp. | | | 0 | | | | 259,031 | | | | 259,031 | |
42,000 | | 0 | | 42,000 | | Intel Corp. | | | 883,260 | | | | 0 | | | | 883,260 | |
0 | | 5,130 | | 5,130 | | Maxim Integrated Products, Inc. | | | 0 | | | | 121,171 | | | | 121,171 | |
0 | | 3,660 | | 3,660 | | Microchip Technology, Inc. | | | 0 | | | | 125,209 | | | | 125,209 | |
59,400 | | 9,250 | | 68,650 | | Microsoft Corp. | | | 1,658,448 | | | | 258,260 | | | | 1,916,708 | |
0 | | 12,695 | | 12,695 | | Nokia Oyj, ADR, Class A | | | 0 | | | | 131,012 | | | | 131,012 | |
24,830 | | 0 | | 24,830 | | Oracle Corp. | | | 777,179 | | | | 0 | | | | 777,179 | |
0 | | 4,185 | | 4,185 | | Paychex, Inc. | | | 0 | | | | 129,358 | | | | 129,358 | |
| | | | | | | | | | | | | | | | | | |
| | | | | | TOTAL | | | 7,306,229 | | | | 1,024,041 | | | | 8,330,270 | |
| | | | | | | | | | | | | | | | | | |
Materials - 4.6% | | | | | | | | | | | | |
57,916 | | 0 | | 57,916 | | Barrick Gold Corp. | | | 3,079,973 | | | | 0 | | | | 3,079,973 | |
0 | | 12,195 | | 12,195 | | CRH PLC ADR | | | 0 | | | | 253,656 | | | | 253,656 | |
13,965 | | 0 | | 13,965 | | Dow Chemical Co. (The) | | | 476,765 | | | | 0 | | | | 476,765 | |
22,875 | | 0 | | 22,875 | | Du Pont (E.I.) de Nemours & Co., | | | 1,141,005 | | | | 0 | | | | 1,141,005 | |
0 | | 2,430 | | 2,430 | | MeadWestvaco Corp. | | | 0 | | | | 63,569 | | | | 63,569 | |
17,500 | | 0 | | 17,500 | | Newmont Mining Corp. | | | 1,075,025 | | | | 0 | | | | 1,075,025 | |
0 | | 5,910 | | 5,910 | | RPM International, Inc. | | | 0 | | | | 130,611 | | | | 130,611 | |
| | | | | | | | | | | | | | | | | | |
| | | | | | TOTAL | | | 5,772,768 | | | | 447,836 | | | | 6,220,604 | |
| | | | | | | | | | | | | | | | | | |
Telecommunication Services - 2.9% | | | | | | | | | | | | |
12,600 | | 23,989 | | 36,589 | | AT&T, Inc. | | | 370,188 | | | | 704,797 | | | | 1,074,985 | |
0 | | 12,180 | | 12,180 | | BCE Inc. | | | 0 | | | | 431,903 | | | | 431,903 | |
0 | | 10,835 | | | | CenturyLink, Inc. | | | 0 | | | | 500,252 | | | | 500,252 | |
0 | | 21,875 | | | | Deutsche Telekom AG, ADR | | | 0 | | | | 280,000 | | | | 280,000 | |
4,962 | | 0 | | 4,962 | | Frontier Communications Corp. | | | 48,280 | | | | 0 | | | | 48,280 | |
20,675 | | 14,110 | | 34,785 | | Verizon Communications, Inc. | | | 739,751 | | | | 504,856 | | | | 1,244,607 | |
0 | | 14,685 | | 14,685 | | Vodafone Group PLC, ADR | | | 0 | | | | 388,124 | | | | 388,124 | |
| | | | | | | | | | | | | | | | | | |
| | | | | | TOTAL | | | 1,158,219 | | | | 2,809,932 | | | | 3,968,151 | |
| | | | | | | | | | | | | | | | | | |
Utilities - 3.6% | | | | | | | | | | | | | | |
0 | | 4,305 | | 4,305 | | Ameren Corp. | | | 0 | | | | 121,358 | | | | 121,358 | |
22,952 | | 0 | | 22,952 | | Atmos Energy Corp. | | | 716,102 | | | | 0 | | | | 716,102 | |
0 | | 15,935 | | 15,935 | | CMS Energy Corp. | | | 0 | | | | 296,391 | | | | 296,391 | |
0 | | 8,810 | | 8,810 | | DPL, Inc. | | | 0 | | | | 226,505 | | | | 226,505 | |
0 | | 2,755 | | 2,755 | | DTE Energy Co. | | | 0 | | | | 124,857 | | | | 124,857 | |
0 | | 2,665 | | 2,665 | | Entergy Corp. | | | 0 | | | | 188,762 | | | | 188,762 | |
0 | | 1,685 | | 1,685 | | FirstEnergy Corp. | | | 0 | | | | 62,379 | | | | 62,379 | |
14,304 | | 0 | | 14,304 | | Integrys Energy Group, Inc. | | | 693,887 | | | | 0 | | | | 693,887 | |
0 | | 7,025 | | 7,025 | | National Grid PLC, ADR | | | 0 | | | | 311,769 | | | | 311,769 | |
0 | | 10,720 | | 10,720 | | NiSource, Inc. | | | 0 | | | | 188,886 | | | | 188,886 | |
37
| | | | | | | | | | | | | | | | | | |
0 | | 12,110 | | 12,110 | | Northeast Utilities Co. | | | 0 | | | | 386,067 | | | | 386,067 | |
17,790 | | 0 | | 17,790 | | Pepco Holdings, Inc. | | | 324,668 | | | | 0 | | | | 324,668 | |
24,200 | | 0 | | 24,200 | | Pinnacle West Capital Corp. | | | 1,003,090 | | | | 0 | | | | 1,003,090 | |
0 | | 10,175 | | 10,175 | | Scottish & Southern Energy PLC, ADR | | | 0 | | | | 198,311 | | | | 198,311 | |
| | | | | | | | | | | | | | | | | | |
| | | | | | TOTAL | | | 2,737,747 | | | | 2,105,285 | | | | 4,843,032 | |
| | | | | | | | | | | | | | | | | | |
Other Investment Companies and Exchange-Traded Funds - 1.6% | | | | | | | | | |
22,351 | | 0 | | 22,351 | | H&Q Life Sciences Investors | | | 240,722 | | | | 0 | | | | 240,722 | |
20,900 | | 0 | | 20,900 | | Redwood Trust, Inc. | | | 312,037 | | | | 0 | | | | 312,037 | |
56,038 | | 0 | | 56,038 | | Tortoise Energy Capital Corp. | | | 1,556,175 | | | | 0 | | | | 1,556,175 | |
| | | | | | | | | | | | | | | | | | |
| | | | | | TOTAL | | | 2,108,934 | | | | 0 | | | | 2,108,934 | |
| | | | | | | | | | | | | | | | | | |
| | | | | | TOTAL COMMON STOCKS (IDENTIFIED COST $69,211,674) | | | 62,808,868 | | | | 20,075,413 | | | | 82,884,281 | |
| | | | | | | | | | | | | | | | | | |
PREFERRED STOCKS– 3.1% | | | | | | | | | | | | |
Consumer Discretionary - 0.3% | | | | | | | | | | | | |
0 | | 6,500 | | 6,500 | | General Motors, Conv. Pfd, 4.75%, 12/1/2013 | | | 0 | | | | 351,715 | | | | 351,715 | |
| | | | | | | | | | | | | | | | | | |
Consumer Staples - 0.3% | | | | | | | | | | | | |
0 | | 5,755 | | 5,755 | | Archer-Daniels-Midland Co, Conv. Bond, 6.25%, 6/01/2011 | | | 0 | | | | 223,466 | | | | 223,466 | |
0 | | 2,000 | | 2,000 | | Bunge Ltd., Pfd., Conv. Pfd. | | | | | | | 188,000 | | | | 188,000 | |
| | | | | | | | | | | | | | | | | | |
| | | | | | TOTAL | | | 0 | | | | 411,466 | | | | 411,466 | |
| | | | | | | | | | | | | | | | | | |
Energy - 0.1% | | | | | | | | | | | | | | | | | | |
0 | | 2,900 | | 2,900 | | Apache Corp., Conv. Pfd, 6.00%, 8/1/2013 | | | 0 | | | | 192,154 | | | | 192,154 | |
| | | | | | | | | | | | | | | | | | |
Financials - 2.4% | | | | | | | | | | | | | | |
0 | | 7,125 | | 7,125 | | Citigroup, Inc., Conv. Pfd., 7.50%, 12/15/2012 | | | 0 | | | | 973,916 | | | | 973,916 | |
0 | | 7,300 | | 7,300 | | (1) Hartford Financial, Conv. Bond, 7.25%, 4/1/2013 | | | 0 | | | | 186,953 | | | | 186,953 | |
0 | | 5,400 | | 5,400 | | (1) Legg Mason, Inc., Conv. Pfd, 7.00%, 06/30/2011 | | | 0 | | | | 183,060 | | | | 183,060 | |
0 | | 3,700 | | 3,700 | | (1) New York Community Bancorp, Inc., Conv. Pfd, 6.00%, 11/01/2051 | | | 0 | | | | 194,250 | | | | 194,250 | |
0 | | 6,530 | | 6,530 | | PPL Corp., Conv. Pfd., 9.50%, 7/1/2013 | | | 0 | | | | 358,954 | | | | 358,954 | |
0 | | 200 | | 200 | | (1) Wells Fargo Co, 7.50%, Series L, PFD | | | 0 | | | | 200,110 | | | | 200,110 | |
0 | | 3,500 | | 3,500 | | (1) Wintrust Financial Corp., Conv Pfd., 7.50% 12/15/2013 | | | 0 | | | | 193,557 | | | | 193,557 | |
0 | | 29,860 | | 29,860 | | XL Capital, Ltd., Conv. Pfd, 10.75%, 8/15/2011 | | | 0 | | | | 930,438 | | | | 930,438 | |
| | | | | | | | | | | | | | | | | | |
| | | | | | TOTAL | | | 0 | | | | 3,221,238 | | | | 3,221,238 | |
| | | | | | | | | | | | | | | | | | |
| | | | | | TOTAL PREFERRED STOCKS (IDENTIFIED COST $3,941,076) | | | 0 | | | | 4,176,573 | | | | 4,176,573 | |
| | | | | | | | | | | | | | | | | | |
ADJUSTABLE RATE MORTGAGES - 0.2% | | | | | | | | | | | | |
$0 | | $149,368 | | $149,368 | | Federal Home Loan Mortgage Corp., 4.750%, 3/1/2034 | | | 0 | | | | 158,582 | | | | 158,582 | |
38
| | | | | | | | | | | | | | | | | | |
0 | | 101,995 | | 101,995 | | Federal National Mortgage Association, 5.770%, 9/1/2037 | | | 0 | | | | 108,641 | | | | 108,641 | |
| | | | | | | | | | | | | | | | | | |
| | | | | | TOTAL ADJUSTABLE RATE MORTGAGES (IDENTIFIED COST $247,615) | | | 0 | | | | 267,223 | | | | 267,223 | |
| | | | | | | | | | | | | | | | | | |
CORPORATE BONDS - 2.7% | | | | | | | | | | | | |
Banking - 0.2% | | | | | | | | | | | | | | |
0 | | 170,000 | | 170,000 | | (2)(3) Banco BMG SA, Sub., Series 144A, 8.875%, 08/05/2020 | | | 0 | | | | 174,714 | | | | 174,714 | |
0 | | 100,000 | | 100,000 | | (2)(3) Banco Credito del Peru, Sr. Note, Series 144A, 5.375%, 09/16/2020 | | | 0 | | | | 98,890 | | | | 98,890 | |
| | | | | | | | | | | | | | | | | | |
| | | | | | TOTAL | | | 0 | | | | 273,604 | | | | 273,604 | |
| | | | | | | | | | | | | | | | | | |
Broadcast Radio & TV - 0.2% | | | | | | | | | | | | |
0 | | 200,000 | | 200,000 | | Grupo Televisa S.A., Sr. Unsecd. Note, 6.625%, 01/15/2040 | | | 0 | | | | 217,632 | | | | 217,632 | |
| | | | | | | | | | | | | | | | | | |
Building Materials - 0.1% | | | | | | | | | | | | |
0 | | 150,000 | | 150,000 | | (2)(3) Rearden G Holdings EINS GmbH, Company Guarantee, Series 144A, 7.875%, 03/30/2020 | | | 0 | | | | 159,000 | | | | 159,000 | |
| | | | | | | | | | | | | | | | | | |
Cable & Wireless Television - 0.1% | | | | | | | | | | | | |
0 | | 150,000 | | 150,000 | | Net Servicos de Comunicacao SA, Company Guarantee, 7.500%, 01/27/2020 | | | 0 | | | | 172,875 | | | | 172,875 | |
| | | | | | | | | | | | | | | | | | |
Conglomerates - 0.1% | | | | | | | | | | | | |
0 | | 200,000 | | 200,000 | | Votorantim, Series REGS, 6.625%, 9/25/2019 | | | 0 | | | | 208,000 | | | | 208,000 | |
| | | | | | | | | | | | | | | | | | |
Metals & Mining - 0.1% | | | | | | | | | | | | |
0 | | 100,000 | | 100,000 | | (2)(3) Bumi Investment PTE Ltd. , Company Guarantee, Series 144A, 10.750%, 10/06/2017 | | | 0 | | | | 109,500 | | | | 109,500 | |
| | | | | | | | | | | | | | | | | | |
Mortgage Banks - 0.1% | | | | | | | | | | | | |
0 | | 150,000 | | 150,000 | | (2)(3) Credito Real, S.A. de C.V., Sr. Note, Series 144A, 10.250%, 04/14/2015 | | | 0 | | | | 158,250 | | | | 158,250 | |
| | | | | | | | | | | | | | | | | | |
Oil & Gas - 1.0% | | | | | | | | | | | | |
0 | | 200,000 | | 200,000 | | Ecopetrol SA, Note, 7.625%, 07/23/2019 | | | 0 | | | | 232,000 | | | | 232,000 | |
0 | | 92,753 | | 92,753 | | Gazprom International SA, Series regs, 7.201%, 2/01/2020 | | | 0 | | | | 98,744 | | | | 98,744 | |
0 | | 400,000 | | 400,000 | | (2)(3) Gazprom, Note, Series 144A, 8.625%, 04/28/2034 | | | 0 | | | | 481,000 | | | | 481,000 | |
0 | | 150,000 | | 150,000 | | PEMEX, Company Guarantee, Series WI, 8.000%, 5/03/2019 | | | 0 | | | | 180,811 | | | | 180,811 | |
0 | | 250,000 | | 250,000 | | Petrobras, Company Guarantee, 7.875%, 3/15/2019 | | | | | | | 296,793 | | | | 296,793 | |
| | | | | | | | | | | | | | | | | | |
| | | | | | TOTAL | | | 0 | | | | 1,289,348 | | | | 1,289,348 | |
| | | | | | | | | | | | | | | | | | |
Telecommunications & Cellular - 0.3% | | | | | | | | | | | | |
0 | | 100,000 | | 100,000 | | (2) Digicel Ltd., Sr. Note, Series 144A, 8.250%, 09/01/2017 | | | 0 | | | | 103,000 | | | | 103,000 | |
39
| | | | | | | | | | | | | | | | | | |
0 | | 200,000 | | 200,000 | | (2)(3) Qtel International Finance Ltd., Bank Guarantee, Series 144A, 5.000%, 10/19/2025 | | | 0 | | | | 189,258 | | | | 189,258 | |
0 | | 100,000 | | 100,000 | | (2)(3) Telemovil Finance Co., Ltd., Company Guarantee, Series 144A, 8.000%, 10/01/2017 | | | 0 | | | | 103,500 | | | | 103,500 | |
| | | | | | | | | | | | | | | | | | |
| | | | | | TOTAL | | | 0 | | | | 395,758 | | | | 395,758 | |
| | | | | | | | | | | | | | | | | | |
Utilities - 0.5% | | | | | | | | | | | | |
0 | | 150,000 | | 150,000 | | (2)(3) Dubai Electricity & Water, Sr. Unsecd. Note, Series 144A, 7.375%, 10/21/2020 | | | 0 | | | | 140,765 | | | | 140,765 | |
0 | | 260,000 | | 260,000 | | Majapahit Holding BV, Company Guarantee, Series REGS, 7.750%, 01/20/2020 | | | 0 | | | | 299,650 | | | | 299,650 | |
0 | | 150,000 | | 150,000 | | Power Sector Assets & Liabilities Management Corp., Company Guarantee, Series REGS, 7.390%, 12/02/2024 | | | 0 | | | | 174,394 | | | | 174,394 | |
| | | | | | | | | | | | | | | | | | |
| | | | | | TOTAL | | | 0 | | | | 614,809 | | | | 614,809 | |
| | | | | | | | | | | | | | | | | | |
| | | | | | TOTAL CORPORATE BONDS (IDENTIFIED COST $3,404,717) | | | 0 | | | | 3,598,776 | | | | 3,598,776 | |
| | | | | | | | | | | | | | | | | | |
GOVERNMENT AGENCIES - 7.5% | | | | | | | | | | | | |
Sovereign - 7.0% | | | | | | | | | | | | | | |
0 | | 650,474 | | 650,474 | | Argentina, Government of, Note, Series $dis, 8.280%, 12/31/2033 | | | 0 | | | | 603,315 | | | | 603,315 | |
0 | | 1,500,000 | | 1,500,000 | | Argentina, Government of, Note, Series $GDP, 3.169%, 12/15/2035 | | | 0 | | | | 227,250 | | | | 227,250 | |
0 | | 400,000 | | 400,000 | | Argentina, Government of, Sr. Unsecd. Note, 7.000%, 10/03/2015 | | | 0 | | | | 385,000 | | | | 385,000 | |
0 | | 70,000 | | 70,000 | | Brazil, Government of, Bond, 8.250%, 01/20/2034 | | | 0 | | | | 93,625 | | | | 93,625 | |
0 | | 1,350,000 | | 1,350,000 | | Brazil, Government of, Note, 10.000%, 01/01/2017 | | | 0 | | | | 745,488 | | | | 745,488 | |
0 | | 197,500 | | 197,500 | | Brazil, Government of, Note, 8.000%, 01/15/2018 | | | 0 | | | | 232,556 | | | | 232,556 | |
0 | | 200,000 | | 200,000 | | Brazil, Government of, Unsub., 11.000%, 08/17/2040 | | | 0 | | | | 269,500 | | | | 269,500 | |
0 | | 300,000 | | 300,000 | | Colombia, Government of, Note, 7.375%, 01/27/2017 | | | 0 | | | | 356,250 | | | | 356,250 | |
0 | | 350,000 | | 350,000 | | (2)(3) Indonesia, Government of, Series 144A, 8.5%, 10/12/2035 | | | 0 | | | | 464,625 | | | | 464,625 | |
0 | | 400,000 | | 400,000 | | Indonesia, Government of, Series REGS, 6.625%, 02/17/2037 | | | 0 | | | | 437,017 | | | | 437,017 | |
0 | | 2,925,000 | | 2,925,000 | | Mexico, Government of, Bond, Series M 20, 10.000%, 12/05/2024 | | | 0 | | | | 295,247 | | | | 295,247 | |
0 | | 400,000 | | 400,000 | | Panama, Government of, 6.700%, 01/26/2036 | | | 0 | | | | 446,203 | | | | 446,203 | |
0 | | 386,000 | | 386,000 | | Peru, Government of, 6.550%, 03/14/2037 | | | 0 | | | | 423,635 | | | | 423,635 | |
40
| | | | | | | | | | | | | | | | | | |
0 | | 250,000 | | 250,000 | | Peru, Government of, Sr. Unsecd. Note, Series REGS, 7.840%, 08/12/2020 | | | 0 | | | | 101,613 | | | | 101,613 | |
0 | | 1,136,650 | | 1,136,650 | | Russia, Government of, Unsub., Series REGS, 7.500%, 03/31/2030 | | | 0 | | | | 1,315,218 | | | | 1,315,218 | |
0 | | 100,000 | | 100,000 | | South Africa, Government of, Sr. Unsecd. Note, 6.875%, 05/27/2019 | | | 0 | | | | 117,438 | | | | 117,438 | |
0 | | 100,000 | | 100,000 | | (2)(3) Sri Lanka, Government of, Sr. Unsecd. Note, Series 144A, 6.250%, 10/04/2020 | | | 0 | | | | 101,875 | | | | 101,875 | |
0 | | 300,000 | | 300,000 | | Turkey, Government of, 14.000%, 09/26/2012 | | | 0 | | | | 215,915 | | | | 215,915 | |
0 | | 350,000 | | 350,000 | | Turkey, Government of, 7.000%, 9/26/2016 | | | 0 | | | | 405,125 | | | | 405,125 | |
0 | | 150,000 | | 150,000 | | Turkey, Government of, Note, 7.375%, 2/05/2025 | | | 0 | | | | 178,500 | | | | 178,500 | |
0 | | 500,000 | | 500,000 | | United Mexican States, Note, 5.125%, 01/15/2020 | | | 0 | | | | 522,919 | | | | 522,919 | |
0 | | 350,000 | | 350,000 | | United Mexican States, Note, 5.125%, 01/15/2020 | | | 0 | | | | 422,625 | | | | 422,625 | |
0 | | 100,000 | | 100,000 | | Uruguay, Government of, Note, 8.000%, 11/18/2022 | | | 0 | | | | 123,250 | | | | 123,250 | |
0 | | 1,100,000 | | 1,100,000 | | Venezuela, Government of, 9.375%, 01/13/2034 | | | 0 | | | | 753,500 | | | | 753,500 | |
0 | | 480,000 | | 480,000 | | Venezuela, Government of, Note, 7.65%, 4/21/2025 | | | 0 | | | | 295,824 | | | | 295,824 | |
| | | | | | | | | | | | | | | | | | |
| | | | | | TOTAL | | | 0 | | | | 9,533,513 | | | | 9,533,513 | |
| | | | | | | | | | | | | | | | | | |
U.S. Government Agencies -0.5% | |
$700,000 | | $0 | | $700,000 | | Federal Home Loan Bank, due 1/7/2011 | | | 699,986 | | | | 0 | | | | 699,986 | |
| | | | | | | | | | | | | | | | | | |
| | | | | | TOTAL GOVERNMENT AGENCIES (IDENTIFIED COST $9,070,813) | | | 699,986 | | | | 9,533,513 | | | | 10,233,499 | |
| | | | | | | | | | | | | | | | | | |
MORTGAGE-BACKED SECURITIES - 13.4% | |
Federal Home Loan Mortgage Corporation - 0.7% | |
0 | | 289,486 | | 289,486 | | Federal Home Loan Mortgage Corp. Pool A56495, 5.500%, 30 Year, 1/1/2037 | | | 0 | | | | 308,626 | | | | 308,626 | |
0 | | 128,351 | | 128,351 | | Federal Home Loan Mortgage Corp. Pool A65290, 6.500%, 30 Year, 9/1/2037 | | | 0 | | | | 142,038 | | | | 142,038 | |
0 | | 239,395 | | 239,395 | | Federal Home Loan Mortgage Corp. Pool C03517, 4.500%, 30 Year, 9/1/2040 | | | 0 | | | | 245,608 | | | | 245,608 | |
0 | | 170,174 | | 170,174 | | Federal Home Loan Mortgage Corp. Pool G04468, 5.000%, 30 Year, 7/1/2038 | | | 0 | | | | 178,431 | | | | 178,431 | |
0 | | 112,422 | | 112,422 | | Federal Home Loan Mortgage Corp. Pool G18264, 5.000%, 15 Year, 7/1/2023 | | | 0 | | | | 118,948 | | | | 118,948 | |
| | | | | | | | | | | | | | | | | | |
| | | | | | TOTAL | | | 0 | | | | 993,651 | | | | 993,651 | |
| | | | | | | | | | | | | | | | | | |
41
| | | | | | | | | | | | | | | | | | |
Federal National Mortgage Association - 0.2% | |
0 | | 304,372 | | 304,372 | | Federal National Mortgage Association Pool AD1998, 5.000%, 30 Year, 1/1/2040 | | | 0 | | | | 319,937 | | | | 319,937 | |
| | | | | | | | | | | | | | | | | | |
Government National Mortgage Association - 12.5% | |
2,250,000 | | 0 | | 2,250,000 | | Government National Mortgage Association 2003-1 Class PE, 5.50%, due, 7/1/2032 | | | 2,470,469 | | | | 0 | | | | 2,470,469 | |
2,500,000 | | 0 | | 2,500,000 | | Government National Mortgage Association 2003-11 Class QC, 5.50%, due, 2/1/2033 | | | 2,739,860 | | | | 0 | | | | 2,739,860 | |
403,551 | | 0 | | 403,551 | | Government National Mortgage Association 2003-71 Class AK, 5.00%, due, 9/1/2029 | | | 408,397 | | | | 0 | | | | 408,397 | |
1,560,000 | | 0 | | 1,560,000 | | Government National Mortgage Association 2003-116 Class JC, 5.00%, due, 5/1/2030 | | | 1,595,100 | | | | 0 | | | | 1,595,100 | |
19,931 | | 0 | | 19,931 | | Government National Mortgage Association 2004-22 Class BK, 3.47%, due, 4/1/2034 | | | 19,974 | | | | 0 | | | $ | 19,974 | |
1,248,039 | | 0 | | 1,248,039 | | Government National Mortgage Association 2004-26 Class GC, 5.00%, due, 6/1/2031 | | | 1,304,775 | | | | 0 | | | | 1,304,775 | |
500,000 | | 0 | | 500,000 | | Government National Mortgage Association 2004-72 Class DE, 5.00%, due, 7/1/2032 | | | 531,966 | | | | 0 | | | $ | 531,966 | |
594,633 | | 0 | | 594,633 | | Government National Mortgage Association 2004-76 Class VG, 5.00%, due, 9/1/2023 | | | 600,293 | | | | 0 | | | | 600,293 | |
200,305 | | 0 | | 200,305 | | Government National Mortgage Association 2004-89 Class KC, 4.00%, due, 10/1/2034 | | | 206,311 | | | | 0 | | | | 206,311 | |
2,000,000 | | 0 | | 2,000,000 | | Government National Mortgage Association 2004-105 Class VE, 5.50%, due, 5/1/2024 | | | 2,201,762 | | | | 0 | | | | 2,201,762 | |
780,000 | | 0 | | 780,000 | | Government National Mortgage Association 2004-109 Class WE, 5.00%, due, 5/1/2033 | | | 833,950 | | | | 0 | | | $ | 833,950 | |
833,914 | | 0 | | 833,914 | | Government National Mortgage Association 2005-44 Class KC, 5.00%, due, 4/1/2031 | | | 858,247 | | | | 0 | | | | 858,247 | |
1,000,000 | | 0 | | 1,000,000 | | Government National Mortgage Association 2005-80 Class VC, 5.00%, due, 5/1/2029 | | | 1,075,844 | | | | 0 | | | | 1,075,844 | |
1,448,667 | | 0 | | 1,448,667 | | Government National Mortgage Association 2006-38 Class OG, 5.00%, due, 6/1/2036 | | | 1,545,790 | | | | 0 | | | | 1,545,790 | |
31,712 | | 0 | | 31,712 | | Government National Mortgage Association Pool # 2796, 7.000%, due 8/1/2029 | | | 36,201 | | | | 0 | | | | 36,201 | |
42
| | | | | | | | | | | | | | | | | | |
17,606 | | 0 | | 17,606 | | Government National Mortgage Association Pool # 3040, 7.000%, due 2/1/2031 | | | 20,115 | | | | 0 | | | | 20,115 | |
44,501 | | 0 | | 44,501 | | Government National Mortgage Association Pool # 3188, 6.500%, due 1/1/2032 | | | 50,347 | | | | 0 | | | | 50,347 | |
67,681 | | 0 | | 67,681 | | Government National Mortgage Association Pool # 3239, 6.500%, due 5/1/2032 | | | 76,572 | | | | 0 | | | | 76,572 | |
125,737 | | 0 | | 125,737 | | Government National Mortgage Association Pool # 3333, 5.500%, due 1/1/2033 | | | 136,227 | | | | 0 | | | | 136,227 | |
104,659 | | 0 | | 104,659 | | Government National Mortgage Association Pool # 3403, 5.500%, due 6/1/2033 | | | 113,391 | | | | 0 | | | | 113,391 | |
| | | | | | | | | | | | | | | | | | |
| | | | | | TOTAL | | | 16,825,591 | | | | 0 | | | | 16,825,591 | |
| | | | | | | | | | | | | | | | | | |
| | | | | | TOTAL MORTGAGE-BACKED SECURITIES (IDENTIFIED COST $16,690,636) | | | 16,825,591 | | | | 1,313,588 | | | | 18,139,179 | |
| | | | | | | | | | | | | | | | | | |
MUTUAL FUNDS - 10.8% | |
422,441 | | 0 | | 422,441 | | JP Morgan U.S. Treasury Plus Money Market Fund | | | 422,441 | | | | 0 | | | | 422,441 | |
0 | | 2,016,405 | | 2,016,405 | | (4) Federated High Income Bond Fund II, Primary Shares | | | 0 | | | | 14,175,324 | | | | 14,175,324 | |
| | | | | | | | | | | | | | | | | | |
| | | | | | TOTAL MUTUAL FUNDS (IDENTIFIED COST $12,349,512) | | | 422,441 | | | | 14,175,324 | | | | 14,597,765 | |
| | | | | | | | | | | | | | | | | | |
REPURCHASE AGREEMENT - 0.7% | |
0 | | 906,000 | | 906,000 | | Interest in $5,850,000,000 joint repurchase agreement 0.25%, dated 12/31/2010 under which Bank of America, N.A. will repurchase securities provided as collateral for $5,850,121,875 on 1/3/2011. The securities provided as collateral at the end of the period were U.S. Government Agency securities with various maturities to 4/15/2040 and the market value of those underlying securities was $5,972,500,657 (AT COST). | | | 0 | | | | 906,000 | | | | 906,000 | |
| | | | | | | | | | | | | | | | | | |
| | | | | | Total Investments (Identified Cost $115,822,043- 99.6%)(5) | | | 80,756,886 | | | | 54,046,410 | | | | 134,803,296 | |
| | | | | | Other Assets and Liabilities - 0.4% (6)(7) | | | 88,024 | | | | 403,476 | | | | 490,533 | |
| | | | | | Total Net Assets - 100% | | $ | 80,844,910 | | | $ | 54,449,886 | | | $ | 135,293,829 | |
| | | | | | | | | | | | | | | | | | |
43
At December 31, 2010, Federated Capital Income Fund II had the following open swap contracts:
| | | | | | | | | | | | |
Credit Default Swap
Counterparty | |
| Barclays
Capital, Inc. |
| |
| Citigroup Global
Markets, Inc. |
| |
| Standard
Chartered Bank |
|
| Reference Entity | |
| CDX Index
EM Series 14 |
| |
| CDX Index
EM Series 14 |
| |
| CDX Index
EM Series 14 |
|
| Buy/Sell | | | Buy | | | | Buy | | | | Buy | |
| Pay/Receive Fixed Rate | | | 5.00 | % | | | 5.00 | % | | | 5.00 | % |
| Expiration Date | | | 12/20/2015 | | | | 12/20/2015 | | | | 12/20/2015 | |
| Implied Credit Spread at 12/31/20108 | | | 4.81 | % | | | 4.81 | % | | | 4.81 | % |
| Notional Amount | | $ | 400,000 | | | $ | 500,000 | | | $ | 400,000 | |
| Market Value | | ($ | 54,421 | ) | | ($ | 68,026 | ) | | ($ | 54,421 | ) |
| Upfront Premiums Received | | $ | 51,600 | | | $ | 64,250 | | | $ | 51,000 | |
| Unrealized Depreciation | | ($ | 2,821 | ) | | ($ | 3,776 | ) | | ($ | 3,421 | ) |
| Unrealized Depreciation on Swap Contracts is included in “Other Assets and Liabilities—Net.” | | | | | | | | | | | | |
| (1) | Non-income producing security. |
| (2) | Denotes a restricted security that either: (a) cannot be offered for public sale without first being registered, or being able to take advantage of an exemption from registration, under the Securities Act of 1933; or (b) is subject to a contractual restriction on public sales. At December 31, 2010, these restricted securities amounted to $2,284,377, which represents 1.7% of total net assets of the Pro Forma Combined. |
| (3) | Denotes a restricted security that may be resold without restriction to “qualified institutional buyers” as defined by Rule 144A under the Securities Act of 1933 and the Fund has determined to be liquid under criteria established by the Fund’s Board of Trustees. At December 31, 2010, these liquid restricted securities amounted to $2,181,377, which represents 1.6% of total net assets of the Pro Forma Combined. |
| (5) | The cost of investment for federal tax purposes for the Pro Forma Combined amounts to $116,622,988. |
| (6) | Assets, other than investments in securities, less liabilities. See Statement of Assets and Liabilities. |
| (7) | Total for Federated Capital Income Fund II Pro Forma Combined includes an adjustment of ($967) for prepaid expenses which will not transfer as a result of the reorganization. |
| (8) | Implied credit spreads, represented in absolute terms, utilized in determining the market value of credit default swap agreements serve as an indicator of the current status of the payment/performance risk and represent the likelihood or risk of default for the credit derivative. The implied credit spread of a particular referenced entity reflects the cost of buying/selling protection and may include upfront payments required to be made to enter into the agreement. Wider credit spreads represent a deterioration of the referenced entity’s credit soundness and a greater likelihood of risk of default or other credit event occurring as defined under the terms of the agreement. A credit spread identified as “Defaulted” indicates a credit event has occurred for the referenced entity or obligation. |
Note: The categories of investments are shown as a percentage of total net assets at December 31, 2010.
Various inputs are used in determining the value of each funds’ investments. These inputs are summarized in the three broad levels listed below:
Level 1 - quoted prices in active markets for identical securities
Level 2 - other significant observable inputs (including quoted prices for similar securities, interest rates, prepayment speeds, credit risks, etc.)
Level 3 - significant unobservable inputs (including each fund’s own assumptions in determining the fair value of investments)
44
The inputs or methodology used for valuing securities are not an indication of the risk associated with investing in those securities.
The following is a summary of the inputs used, as of December 31, 2010, in valuing each fund’s assets carried at fair value:
| | | | | | | | | | | | | | | | |
Fund | | | | | | | | | | | | | | | | |
| | | Level 1 | | | Level 2 | | | Level 3 | | | Total | |
Mortgage Portfolio | | | | | | | | | | | | | | | | |
Equity Securities: | | | | | | | | | | | | | | | | |
Common Stock | | | | | | | | | | | | | | | | |
Domestic | | $ | 62,808,868 | | | $ | 0 | | | $ | 0 | | | $ | 62,808,868 | |
International | | | 0 | | | | 0 | | | | 0 | | | | 0 | |
Preferred Stock | | | | | | | | | | | | | | | | |
Domestic | | | 0 | | | | 0 | | | | 0 | | | | 0 | |
International | | | 0 | | | | 0 | | | | 0 | | | | 0 | |
Debt Securities: | | | | | | | | | | | | | | | | |
Adjustable Rate Mortgages | | | 0 | | | | 0 | | | | 0 | | | | 0 | |
Corporate Bonds | | | 0 | | | | 0 | | | | 0 | | | | 0 | |
Government Agencies | | | 0 | | | | 699,986 | | | | 0 | | | | 699,986 | |
Mortgage-Backed Securities | | | 0 | | | | 16,825,591 | | | | 0 | | | | 16,825,591 | |
Mutual Funds | | | 422,441 | | | | 0 | | | | 0 | | | | 422,441 | |
Repurchase Agreements | | | 0 | | | | 0 | | | | 0 | | | | 0 | |
| | | | | | | | | | | | | | | | |
TOTAL SECURITIES | | $ | 63,231,309 | | | $ | 17,525,577 | | | $ | 0 | | | $ | 80,756,886 | |
| | | | | | | | | | | | | | | | |
OTHER FINANCIAL INSTRUMENTS | | $ | 0 | | | $ | 0 | | | $ | 0 | | | $ | 0 | |
| | | | |
Federated Capital Income Fund II | | | | | | | | | | | | | | | | |
Equity Securities: | | | | | | | | | | | | | | | | |
Common Stock | | | | | | | | | | | | | | | | |
Domestic | | $ | 15,676,406 | | | $ | 0 | | | $ | 0 | | | $ | 15,676,406 | |
International | | | 4,399,007 | | | | 0 | | | | 0 | | | | 4,399,007 | |
Preferred Stock | | | | | | | | | | | | | | | | |
Domestic | | | 3,058,135 | | | | 0 | | | | 0 | | | | 3,058,135 | |
International | | | 1,118,438 | | | | 0 | | | | 0 | | | | 1,118,438 | |
Debt Securities: | | | | | | | | | | | | | | | | |
Adjustable Rate Mortgages | | | 0 | | | | 267,223 | | | | 0 | | | | 267,223 | |
Corporate Bonds | | | 0 | | | | 3,598,776 | | | | 0 | | | | 3,598,776 | |
Government Agencies | | | 0 | | | | 9,533,513 | | | | 0 | | | | 9,533,513 | |
Mortgage-Backed Securities | | | 0 | | | | 1,313,588 | | | | 0 | | | | 1,313,588 | |
Mutual Funds | | | 14,175,324 | | | | 0 | | | | 0 | | | | 14,175,324 | |
Repurchase Agreements | | | 0 | | | | 906,000 | | | | 0 | | | | 906,000 | |
| | | | | | | | | | | | | | | | |
TOTAL SECURITIES | | $ | 38,427,310 | | | $ | 15,619,100 | | | $ | 0 | | | $ | 54,046,410 | |
| | | | | | | | | | | | | | | | |
OTHER FINANCIAL INSTRUMENTS* | | $ | 0 | | | ($ | 176,868 | ) | | $ | 0 | | | $ | (176,868 | ) |
| | | | |
* Other financial instruments include swap contracts. | | | | | | | | | | | | | | | | |
| | | | |
Federated Capital Income Fund Pro Forma Combined | | | | | | | | | | | | | | | | |
Equity Securities: | | | | | | | | | | | | | | | | |
Common Stock | | | | | | | | | | | | | | | | |
Domestic | | $ | 78,485,274 | | | $ | 0 | | | $ | 0 | | | $ | 78,485,274 | |
International | | | 4,399,007 | | | | 0 | | | | 0 | | | | 4,399,007 | |
Preferred Stock | | | | | | | | | | | | | | | | |
45
| | | | | | | | | | | | | | | | |
Domestic | | | 3,058,135 | | | | 0 | | | | 0 | | | | 3,058,135 | |
International | | | 1,118,438 | | | | 0 | | | | 0 | | | | 1,118,438 | |
Debt Securities: | | | | | | | | | | | | | | | | |
Adjustable Rate Mortgages | | | 0 | | | | 267,223 | | | | 0 | | | | 267,223 | |
Corporate Bonds | | | 0 | | | | 3,598,776 | | | | 0 | | | | 3,598,776 | |
Government Agencies | | | 0 | | | | 10,233,499 | | | | 0 | | | | 10,233,499 | |
Mortgage-Backed Securities | | | 0 | | | | 18,139,179 | | | | 0 | | | | 18,139,179 | |
Mutual Funds | | | 14,597,765 | | | | 0 | | | | 0 | | | | 14,597,765 | |
Repurchase Agreements | | | 0 | | | | 906,000 | | | | 0 | | | | 906,000 | |
| | | | | | | | | | | | | | | | |
TOTAL SECURITIES | | $ | 101,658,619 | | | $ | 33,144,677 | | | $ | 0 | | | $ | 134,803,296 | |
| | | | | | | | | | | | | | | | |
OTHER FINANCIAL INSTRUMENTS* | | $ | 0 | | | $ | (176,868 | ) | | $ | 0 | | | $ | (176,868 | ) |
| * | Other financial instruments include swap contracts. |
The following acronyms are used throughout these portfolios:
| | |
| ADR | | - American Depository Receipt |
| REIT | | - Real Estate Investment Trust |
46
Managed Portfolio
Federated Capital Income Fund II
Pro Forma Combining Statements of Assets & Liabilities
December 31, 2010 (unaudited)
| | | | | | | | | | | | | | | | | | | | |
| | | Managed
Portfolio | | | Federated
Capital Income Fund II | | | Pro Forma
Adjustment | | | | | | Federated
Capital Income Fund II
Proforma
Combined | |
Assets: | | | | | | | | | | | | | | | | | | | | |
Investments in securities, at value | | $ | 80,756,886 | | | $ | 54,046,410 | | | $ | 0 | | | | | | | $ | 134,803,296 | |
Cash | | | 0 | | | | 195,240 | | | | 0 | | | | | | | | 195,240 | |
| | | | | |
Cash denominated in foreign currencies (identified cost $90,601) | | | 0 | | | | 91,760 | | | | 0 | | | | | | | | 91,760 | |
Income receivable | | | 162,914 | | | | 403,845 | | | | 0 | | | | | | | | 566,759 | |
Receivable for investments sold | | | 0 | | | | 410,509 | | | | 0 | | | | | | | | 410,509 | |
Receivable for shares sold | | | 11,039 | | | | 17,102 | | | | 0 | | | | | | | | 28,141 | |
Prepaid expenses | | | 967 | | | | 0 | | | | (967 | ) | | | (a | ) | | | 0 | |
| | | | | | | | | | | | | | | | | | | | |
Total Assets | | | 80,931,806 | | | | 55,164,866 | | | | (967 | ) | | | | | | | 136,095,705 | |
| | | | | | | | | | | | | | | | | | | | |
Liabilities: | | | | | | | | | | | | | | | | | | | | |
Payable for investments purchased | | | 0 | | | | 473,032 | | | | 0 | | | | | | | | 473,032 | |
Payable for shares redeemed | | | 74,781 | | | | 22,304 | | | | 0 | | | | | | | | 97,085 | |
Swaps, at value (premium received $166,850) | | | 0 | | | | 176,868 | | | | 0 | | | | | | | | 176,868 | |
Payable for periodic payments to swap contracts | | | 0 | | | | 2,167 | | | | 0 | | | | | | | | 2,167 | |
Accrued expenses | | | 12,115 | | | | 40,609 | | | | 0 | | | | | | | | 52,724 | |
| | | | | | | | | | | | | | | | | | | | |
Total Liabilities | | | 86,896 | | | | 714,980 | | | | 0 | | | | | | | | 801,876 | |
| | | | | | | | | | | | | | | | | | | | |
Net Assets | | $ | 80,844,910 | | | $ | 54,449,886 | | | ($ | 967 | ) | | | | | | $ | 135,293,829 | |
| | | | | | | | | | | | | | | | | | | | |
Net Assets Consists of: | | | | | | | | | | | | | | | | | | | | |
Paid-in capital | | $ | 70,244,297 | | | $ | 58,676,036 | | | ($ | 967 | ) | | | (a | ) | | $ | 128,919,366 | |
| | | | | |
Net unrealized appreciation of investments, swap contracts and translation of assets and liabilities in foreign currency | | | 13,305,644 | | | | 5,666,364 | | | | 0 | | | | | | | | 18,972,008 | |
| | | | | |
Accumulated net realized loss on investments, written options, futures contracts, swap contracts and foreign currency transactions | | | (4,665,967 | ) | | | (11,980,202 | ) | | | 0 | | | | | | | | (16,646,169 | ) |
| | | | | |
Undistributed net investment income | | | 1,960,936 | | | | 2,087,688 | | | | 0 | | | | | | | | 4,048,624 | |
| | | | | | | | | | | | | | | | | | | | |
Total Net Assets | | $ | 80,844,910 | | | $ | 54,449,886 | | | ($ | 967 | ) | | | | | | $ | 135,293,829 | |
| | | | | | | | | | | | | | | | | | | | |
Net Asset Value, Offering Price and Redemption Proceeds Per Share | | | | | | | | | | | | | | | | | | | | |
| | | | | |
Fund Shares: | | | | | | | | | | | | | | | | | | | | |
Net Assets | | $ | 0 | | | $ | 54,449,886 | | | $ | 80,843,943 | | | | (b | ) | | $ | 135,293,829 | |
| | | | | | | | | | | | | | | | | | | | |
Shares Outstanding | | | 0 | | | | 5,950,868 | | | | 8,835,404 | | | | (b | ) | | | 14,786,272 | |
| | | | | | | | | | | | | | | | | | | | |
Shares Authorized | | | unlimited | | | | unlimited | | | | | | | | | | | | unlimited | |
| | | | | | | | | | | | | | | | | | | | |
47
| | | | | | | | | | | | | | | | | | | | |
Net Asset Value Per Share, Offering Price and Redemption Proceeds Per Share | | $ | 0.00 | | | $ | 9.15 | | | | | | | | | | | $ | 9.15 | |
| | | | | | | | | | | | | | | | | | | | |
| | | | | |
Initial Class: | | | | | | | | | | | | | | | | | | | | |
| | | | | |
Net Assets | | $ | 79,332,114 | | | $ | 0 | | | ($ | 79,332,114 | ) | | | (b | ) | | $ | 0 | |
| | | | | | | | | | | | | | | | | | | | |
Shares Outstanding | | | 5,193,817 | | | | 0 | | | | (5,193,817 | ) | | | (b | ) | | | 0 | |
| | | | | | | | | | | | | | | | | | | | |
Shares Authorized | | | unlimited | | | | unlimited | | | | | | | | | | | | | |
| | | | | | | | | | | | | | | | | | | | |
Net Asset Value Per Share, Offering Price and Redemption Proceeds Per Share | | $ | 15.27 | | | | | | | | | | | | | | | | | |
| | | | | | | | | | | | | | | | | | | | |
| | | | | |
Service Class: | | | | | | | | | | | | | | | | | | | | |
Net Assets | | $ | 1,512,796 | | | $ | 0 | | | ($ | 1,512,796 | ) | | | (b | ) | | $ | 0 | |
| | | | | | | | | | | | | | | | | | | | |
Shares Outstanding | | | 95,859 | | | | 0 | | | | (95,859 | ) | | | (b | ) | | | 0 | |
| | | | | | | | | | | | | | | | | | | | |
Shares Authorized | | | unlimited | | | | unlimited | | | | | | | | | | | | | |
| | | | | | | | | | | | | | | | | | | | |
Net Asset Value Per Share, Offering Price and Redemption Proceeds Per Share | | $ | 15.78 | | | | | | | | | | | | | | | | | |
| | | | | | | | | | | | | | | | | | | | |
Investments, at identified cost | | $ | 67,451,242 | | | $ | 48,370,801 | | | $ | 0 | | | | | | | $ | 115,822,043 | |
| | | | | | | | | | | | | | | | | | | | |
Investments in affiliated issuers | | $ | 0 | | | $ | 14,175,324 | | | $ | 0 | | | | | | | $ | 14,175,324 | |
| | | | | | | | | | | | | | | | | | | | |
| (a) | Adjustment for prepaid expenses which will not transfer as a result of the reorganization. |
| (b) | Adjustment to reflect share balance as a result of the combination. |
48
Managed Portfolio
Federated Capital Income Fund II
Pro Forma Combining Statements of Operations
For the year ended December 31, 2010 (unaudited)
| | | | | | | | | | | | | | | | | | | | | | | | |
| | | Managed
Portfolio | | | Federated
Capital
Income
Fund II | | | | | | Pro Forma
Adjustment | | | | | | Federated
Capital
Income
Fund II
Proforma
Combined | |
Investment Income: | | | | | | | | | | | | | | | | | | | | | | | | |
Dividends (net of foreign taxes withheld of $4,621 and $15,741) | | $ | 1,302,614 | | | $ | 1,635,310 | | | | * | | | $ | 0 | | | | | | | $ | 2,937,924 | |
Interest | | | 936,819 | | | | 1,200,053 | | | | | | | | 0 | | | | | | | | 2,136,872 | |
| | | | | | | | | | | | | | | | | | | | | | | | |
Total Investment Income: | | | 2,239,433 | | | | 2,835,363 | | | | | | | | 0 | | | | | | | | 5,074,796 | |
Expenses: | | | | | | | | | | | | | | | | | | | | | | | | |
Investment adviser fee | | | 347,186 | | | | 378,461 | | | | | | | | 231,457 | | | | (a | ) | | | 957,104 | |
Administrative personnel and services fee | | | 0 | | | | 150,000 | | | | | | | | 0 | | | | | | | | 150,000 | |
Custodian fees | | | 8,550 | | | | 21,696 | | | | | | | | 9,887 | | | | (b | ) | | | 40,133 | |
Transfer and dividend disbursing agent fees and expenses | | | 0 | | | | 16,384 | | | | | | | | 0 | | | | | | | | 16,384 | |
Directors’/Trustees’ fees | | | 11,858 | | | | 748 | | | | | | | | (7,852 | ) | | | (c | ) | | | 4,754 | |
Professional fees | | | 34,519 | | | | 0 | | | | | | | | (34,519 | ) | | | (d | ) | | | 0 | |
Auditing fees | | | 0 | | | | 27,298 | | | | | | | | 0 | | | | | | | | 27,298 | |
Legal fees | | | 0 | | | | 7,922 | | | | | | | | 0 | | | | | | | | 7,922 | |
Portfolio accounting fees | | | 30,000 | | | | 84,591 | | | | | | | | (17,591 | ) | | | (e | ) | | | 97,000 | |
Distribution services fee - Service Class | | | 3,306 | | | | 0 | | | | | | | | (3,306 | ) | | | (f | ) | | | 0 | |
Printing and postage | | | 10,161 | | | | 34,685 | | | | | | | | 4,365 | | | | (g | ) | | | 49,211 | |
Insurance premiums | | | 7,861 | | | | 4,295 | | | | | | | | (7,731 | ) | | | (h | ) | | | 4,425 | |
Miscellaneous | | | 4,106 | | | | 2,424 | | | | | | | | (1,730 | ) | | | (i | ) | | | 4,800 | |
| | | | | | | | | | | | | | | | | | | | | | | | |
Total Expenses | | | 457,547 | | | | 728,504 | | | | | | | | 172,980 | | | | | | | | 1,359,031 | |
| | | | | | | | | | | | | | | | | | | | | | | | |
Waivers, Reimbursement and Reduction: | | | | | | | | | | | | | | | | | | | | | | | | |
Waiver/reimbursement of investment adviser fee | | | 0 | | | | (131,343 | ) | | | | | | | (52,421 | ) | | | (j | ) | | | (183,764 | ) |
Waiver of administrative personnel and services fee | | | 0 | | | | (24,494 | ) | | | | | | | 852 | | | | (k | ) | | | (23,642 | ) |
Fees paid indirectly for directed brokerage arrangements | | | (6 | ) | | | (8,174 | ) | | | | | | | 0 | | | | | | | | (8,180 | ) |
| | | | | | | | | | | | | | | | | | | | | | | | |
Total Waivers, Reimbursement and Reduction | | | (6 | ) | | | (164,011 | ) | | | | | | | (51,569 | ) | | | | | | | (215,586 | ) |
| | | | | | | | | | | | | | | | | | | | | | | | |
Net Expenses | | | 457,541 | | | | 564,493 | | | | | | | | 121,411 | | | | | | | | 1,143,445 | |
| | | | | | | | | | | | | | | | | | | | | | | | |
Net investment income | | $ | 1,781,892 | | | $ | 2,270,870 | | | | | | | ($ | 121,411 | ) | | | | | | $ | 3,931,351 | |
| | | | | | | | | | | | | | | | | | | | | | | | |
| | | | | | |
Realized and Unrealized Gain (Loss) on Investments, Written Options, Swap Contracts and Foreign Currency Transactions: | | | | | | | | | | | | | | | | | | | | | | | | |
Net realized gain (loss) on investments and foreign currency transactions (including realized loss of $0 and $75,548, respectively on investments in an affiliated issuer) | | | (13,463 | ) | | | 3,535,439 | | | | | | | | 0 | | | | | | | | 3,521,976 | |
Net realized loss on written options | | | 0 | | | | (72,606 | ) | | | | | | | 0 | | | | | | | | (72,606 | ) |
Net realized loss on swap contracts | | | 0 | | | | (2,764 | ) | | | | | | | 0 | | | | | | | | (2,764 | ) |
Net change in unrealized appreciation of investments and translation of assets and liabilities in foreign currency | | | 9,129,628 | | | | (18,482 | ) | | | | | | | 0 | | | | | | | | 9,111,146 | |
Net change in unrealized depreciation of swap contracts | | | 0 | | | | (10,018 | ) | | | | | | | 0 | | | | | | | | (10,018 | ) |
| | | | | | | | | | | | | | | | | | | | | | | | |
Net realized and unrealized gain on investments, written options, swap contracts and foreign currency transactions | | | 9,116,165 | | | | 3,431,569 | | | | | | | | 0 | | | | | | | | 12,547,734 | |
| | | | | | | | | | | | | | | | | | | | | | | | |
Change in net assets resulting from operations | | $ | 10,898,057 | | | $ | 5,702,439 | | | | | | | ($ | 121,411 | ) | | | | | | $ | 16,479,085 | |
| | | | | | | | | | | | | | | | | | | | | | | | |
| * | Includes $905,403 received from an affiliated issuer. |
(See Notes to Pro Forma Financial Statements)
49
Managed Portfolio
Federated Capital Income Fund II
Notes to Pro Forma Financial Statements
For the Period Ended December 31, 2010 (unaudited)
Note 1. Description of the Funds
Managed Portfolio is a portfolio of EquiTrust Variable Insurance Series Fund, which is registered under the Investment Company Act of 1940, as amended (the “Act”), as an open-end diversified management investment company. Federated Capital Income Fund II, a series of Federated Insurance Series, is registered under the Act, as an open-end management investment company. Managed Portfolio consists of two classes of shares: Initial Class and Service Class.
Note 2. Basis of Combination
The accompanying unaudited Pro Forma Combining Portfolios of Investments, Statements of Assets and Liabilities and Statements of Operations (Pro Forma Financial Statements) reflect the accounts of Managed Portfolio and Federated Capital Income Fund II (individually referred to as the “Fund”, or collectively as the “Funds”), for the year ended December 31, 2010. These statements have been derived from the books and records utilized in calculating daily net asset values at December 31, 2010.
The Pro Forma Financial Statements should be read in conjunction with the historical financial statements of Managed Portfolio and Federated Capital Income Fund II, which have been incorporated by reference in the Statement of Additional Information. The Funds follow generally accepted accounting principles in the United States of America applicable to management investment companies which are disclosed in the historical financial statements.
The Pro Forma Financial Statements give effect to the proposed exchange of assets of Initial Class Shares and Service Class Shares of Managed Portfolio for Shares of Federated Capital Income Fund II. Under generally accepted accounting principles, Federated Capital Income Fund II will be the surviving entity for accounting purposes with its historical cost of investment securities and results of operations being carried forward.
The Pro Forma Financial Statements have been adjusted to reflect the anticipated advisory fee arrangement for the surviving entity, if necessary. Certain other operating costs have also been adjusted to reflect anticipated expenses of the combined entity. Other costs which may change as a result of the reorganization are currently undeterminable.
For the year ended December 31, 2010, Managed Portfolio and Federated Capital Income Fund II paid investment advisory fees computed at the annual rate of 0.45% and 0.75%, respectively, as a percentage of average daily net assets.
The investment advisers of Federated Insurance Funds and the EquiTrust Variable Funds or their affiliates will pay the direct expenses and all the indirect expenses of the Reorganization.
Note 3. Portfolio Valuation
In calculating its net asset value (NAV), Federated Capital Income Fund II generally values investments as follows:
| | • | | Equity securities listed on an exchange or traded through a regulated market system are valued at their last reported sale price or official closing price in their principal exchange or market. |
| | • | | Fixed-income securities acquired with remaining maturities greater than 60 days are fair valued using price evaluations provided by a pricing service approved by the Board of Trustees (the “Trustees”). |
50
| | • | | Fixed-income securities acquired with remaining maturities of 60 days or less are valued at their cost (adjusted for the accretion of any discount or amortization of any premium). |
| | • | | Derivative contracts listed on exchanges are valued at their reported settlement or closing price. |
| | • | | Over-the-counter (OTC) derivative contracts are fair valued using price evaluations provided by a pricing service approved by the Trustees. |
| | • | | Shares of other mutual funds are valued based upon their reported NAVs. |
If Federated Capital Income Fund II cannot obtain a price or price evaluation from a pricing service for an investment, the Fund may attempt to value the investment based upon the mean of bid and asked quotations or fair value the investment based on price evaluations, from one or more dealers. If any price, quotation, price evaluation or other pricing source is not readily available when the NAV is calculated, the Fund uses the fair value of the investment determined in accordance with the procedures described below. There can be no assurance that the Fund could purchase or sell an investment at the price used to calculate the Fund’s NAV.
Fair Valuation and Significant Events Procedures
The Trustees of Federated Capital Income Fund II have authorized the use of pricing services to provide evaluations of the current fair value of certain investments for purposes of calculating the NAV. Factors considered by pricing services in evaluating an investment include the yields or prices of investments of comparable quality, coupon, maturity, call rights and other potential prepayments, terms and type, reported transactions, indications as to values from dealers, and general market conditions. Some pricing services provide a single price evaluation reflecting the bid-side of the market for an investment (a “bid” evaluation). Other pricing services offer both bid evaluations and price evaluations indicative of a price between the prices bid and asked for the investment (a “mid” evaluation). The Funds normally use bid evaluations for U.S. Treasury and Agency securities, mortgage-backed securities and municipal securities. The Funds normally use mid evaluations for other types of fixed-income securities and OTC derivative contracts. In the event that market quotations and price evaluations are not available for an investment, the fair value of the investment is determined in accordance with procedures adopted by the Trustees.
The Trustees also have adopted procedures requiring an investment to be priced at its fair value whenever the Adviser determines that a significant event affecting the value of the investment has occurred between the time as of which the price of the investment would otherwise be determined and the time as of which the NAV is computed. An event is considered significant if there is both an affirmative expectation that the investment’s value will change in response to the event and a reasonable basis for quantifying the resulting change in value. Examples of significant events that may occur after the close of the principal market on which a security is traded, or after the time of a price evaluation provided by a pricing service or a dealer, include:
| | • | | With respect to securities traded in foreign markets, significant trends in U.S. equity markets or in the trading of foreign securities index futures or options contracts; |
| | • | | With respect to price evaluations of fixed-income securities determined before the close of regular trading on the NYSE, actions by the Federal Reserve Open Market Committee and other significant trends in U.S. fixed-income markets; |
| | • | | Political or other developments affecting the economy or markets in which an issuer conducts its operations or its securities are traded; and |
| | • | | Announcements concerning matters such as acquisitions, recapitalizations, litigation developments, a natural disaster affecting the issuer’s operations or regulatory changes or market developments affecting the issuer’s industry. |
The Trustees have approved the use of a pricing service to determine the fair value of equity securities traded principally in foreign markets when the Adviser determines that there has been a significant trend in the U.S. equity markets or in index futures trading. For other significant events, the Funds may seek to obtain more current quotations or price evaluations from alternative pricing sources. If a reliable alternative pricing source is not available, the Fund will determine the fair value of the investment using another method approved by the Trustees.
51
With respect to Managed Portfolio, the Fund values its investment securities that are traded on any national exchange at the last sale price on the day of valuation or, lacking any sales, at the mean between the closing bid and asked process. Investments traded in the over-the-counter market are valued at the mean between the closing bid and asked prices or yield equivalent. In situations where market quotations are not readily available or quoted market prices are not reliable, investments are valued at fair value in accordance with the procedures adopted by the Fund’s Board of Trustees. Money market investments are valued at market value, except that obligations maturing in 60 days or less are valued using the amortized cost method, which approximates market value. Under the amortized cost method, a security is valued at its cost on the date of purchase and thereafter is adjusted to reflect a constant amortization to maturity of the difference between the principal amount due at maturity and the cost of investment to the Fund.
Note 4. Shares of Beneficial Interest
The Pro Forma Primary Shares net asset value per share assumes the issuance of 8,835,404 Shares of Federated Capital Income Fund II in exchange for 5,193,817 Initial Class Shares and 95,859 Service Class Shares, respectively, which would have been outstanding at December 31, 2010 in connection with the proposed reorganization, assuming the two Funds had been combined as of such date.
Note 5. Federal Income Taxes
Each Fund has elected to be taxed as a “regulated investment company” under the Internal Revenue Code. After the acquisition, Federated Capital Income Fund II intends to continue to qualify as a regulated investment company, if such qualification is in the best interests of its shareholders, by complying with the Subchapter M provision of the Internal Revenue Code and to distribute to shareholders each year substantially all of its income. Accordingly, no provision for federal income tax is necessary. Federated Capital Income Fund II complies with the provisions of Financial Accounting Standards Board (FASB) Interpretation No. 48 (FIN 48) “Accounting for Uncertainty in Income Taxes”. As of and during the year ended December 31, 2010, the Fund did not have a liability for any uncertain tax positions. The Fund recognizes interest and penalties, if any, related to tax liabilities as income tax expense in the Statement of Operations. As of December 31, 2010, tax years 2007 through 2010 remain subject to examination by the Fund’s major tax jurisdictions, which include the United States of America and the Commonwealth of Massachusetts.
Each Fund may be subject to taxes imposed by governments of countries in which it invests. Such taxes are generally based on either income or gains earned or repatriated. Each Fund accrues and applies such taxes to net investment income, net realized gains and net unrealized gains as income and/or gains are earned.
The identified cost of investments for the funds is substantially the same for both financial accounting and federal income tax purposes. The tax cost of investments will remain unchanged for the combined fund.
Note 6. Other
The preparation of financial statements in conformity with GAAP requires management to make estimates and assumptions that affect the amounts of assets, liabilities, expenses and revenue reported in the financial statements. Actual results could differ from those estimated.
Note 7. Pro Forma Adjustments
| | (a) | EquiTrust Investment Management Services, Inc. is the investment adviser for Managed Portfolio. Federated Equity Management Company of Pennsylvania is the investment adviser for Federated Capital Income Fund II. The advisory agreement between Managed Portfolio and the Adviser provides for an annual fee equal to 0.45% of the Fund’s average daily net assets. The advisory agreement between Federated Capital Income Fund II and the Adviser provides for an annual fee equal to 0.75% of the Fund’s average daily net assets. An adjustment to the combined investment adviser fee reflects the fee structure of Federated Capital Income Fund II based on the combined assets of Federated Capital Income Fund II Pro Forma Combined. |
52
| | (b) | Adjustment to reflect custodian fees based upon the current expense structure for Federated Capital Income Fund II Pro Forma Combined. |
| | (c) | Adjustment to reflect Directors/Trustees fees based upon the current expense structure for Federated Capital Income Fund II Pro Forma Combined. |
| | (d) | Adjustment to reflect removal of professional fees since the combined expenses in this category for Managed Portfolio are disclosed separately for Federated Capital Income Fund II Pro Forma Combined. |
| | (e) | Adjustment to reflect portfolio accounting fees based upon the current expense structure for Federated Capital Income Fund II Pro Forma Combined. |
| | (f) | Adjustment to reflect removal of distribution fees for Managed Portfolio from Federated Capital Income Fund II Pro Forma Combined since Federated Capital Income Fund II does not currently incur a distribution fee. |
| | (g) | Adjustment to reflect printing and postage costs based upon the current expense structure for Federated Capital Income Fund II Pro Forma Combined. |
| | (h) | Adjustment to reflect insurance premiums based upon the current expense structure for Federated Capital Income Fund II Pro Forma Combined. |
| | (i) | Adjustment to reflect miscellaneous expenses based upon the current expense structure for Federated Capital Income Fund II Pro Forma Combined. |
| | (j) | Adjustment to reflect the voluntary waiver of investment advisory fees on the average daily net assets of Federated Capital Income Fund II Pro Forma Combined. The adviser of Federated Capital Income Fund II and its affiliates have voluntarily agreed to waive their fees and/or reimburse expenses so that the total annual fund operating expenses (as shown in the financial highlights) paid by the Fund’s Primary Shares (after the voluntary waivers and/or reimbursements) will not exceed 1.13% through the later of (the “Termination Date”); (a) April 30, 2011; or (b)��the date of the Fund’s next effective Prospectus. While the adviser and its affiliates currently do not anticipate terminating or increasing these arrangements prior to the Termination Date, these arrangements may only be terminated or increased prior to the Termination Date with the agreement of the Fund’s Trustees. |
| | (k) | Adjustment to reflect the voluntary waiver of administrative personnel and services fee on the average daily net assets of Federated Capital Income Fund II Pro Forma Combined. |
53
C. Acquisition of Strategic Yield Portfolio by Federated Quality Bond Fund II
INTRODUCTION
The accompanying unaudited Pro Forma Combining Portfolios of Investments, Statements of Assets and Liabilities and Statements of Operations (“Pro Forma Financial Statements”) reflect the accounts of Strategic Yield Portfolio and Federated Quality Bond Fund II (individually referred to as the “Fund” or collectively as the “Funds”), for the period ended December 31, 2010. Strategic Yield Portfolio will be reorganized into Federated Quality Bond Fund II as of the close of business on or about [July 15], 2011. For the purposes of these Pro Forma Financial Statements, the financial information covers the period from January 1, 2010 to December 31, 2010. These statements have been derived from the books and records utilized in calculating daily net asset values at December 31, 2010.
The Pro Forma Financial Statements give effect to the proposed exchange of assets of Initial Class Shares and Service Class Shares of Strategic Yield Portfolio for Primary Shares of Federated Quality Bond Fund II. Under generally accepted accounting principles, Federated Quality Bond Fund II will be the surviving entity for accounting purposes with its historical cost of investment securities and results of operations being carried forward.
The Pro Forma Financial Statements have been adjusted to reflect the anticipated advisory fee arrangement for the surviving entity. Certain other operating costs have also been adjusted to reflect anticipated expenses of the combined entity. Other costs which may change as a result of the reorganization currently are undeterminable.
[Remainder of page intentionally left blank.]
54
Strategic Yield Portfolio
Federated Quality Bond Fund II
Pro Forma Combining Portfolio of Investments
December 31, 2010 (unaudited)
| | | | | | | | | | | | | | | | | | |
Strategic Yield Portfolio | | Federated
Quality
Bond
Fund II | | Federated
Quality
Bond Fund II Pro Forma
Combined | | | | Strategic
Yield
Portfolio | | | Federated
Quality
Bond Fund II | | | Federated
Quality
Bond Fund II Pro Forma
Combined | |
| | |
| Shares or Principal Amount | | | | | |
CORPORATE BONDS – 93.2% | | | | | | | | | | | | | | |
| | | | | | | | | | | | | | | | | | |
Basic Industry - Chemicals - 2.7% | | | | | | | | | | | | |
$0 | | $1,970,000 | | $1,970,000 | | Albernarle Corp., Sr. Note, 5.10%, 2/1/2015 | | $ | 0 | | | $ | 2,109,607 | | | $ | 2,109,607 | |
0 | | 320,000 | | 320,000 | | Du Pont (E.I.) de Nemours & Co., 6.00%, 7/15/2018 | | | 0 | | | | 368,368 | | | | 368,368 | |
0 | | 300,000 | | 300,000 | | Eastman Chemical Co., Sr. Unsecd. Not, 5.50%, 11/15/2019 | | | 0 | | | | 317,755 | | | | 317,755 | |
0 | | 410,000 | | 410,000 | | (1)(2) Incitec Pivot Finance LLC, Company Guarantee, 4.00%, 12/7/2015 | | | 0 | | | | 403,111 | | | | 403,111 | |
0 | | 800,000 | | 800,000 | | (1)(2) Incitec Pivot Finance LLC, Company Guarantee, Series 144A, 6.00%, 12/10/2019 | | | 0 | | | | 814,174 | | | | 814,174 | |
750,000 | | 0 | | 750,000 | | Lubrizol Corp., 8.875%, 2/1/2019 | | | 955,380 | | | | 0 | | | | 955,380 | |
800,000 | | 0 | | 800,000 | | NOVA Chemicals Corp., 7.875%, 9/15/2025 | | | 748,600 | | | | 0 | | | | 748,600 | |
0 | | 1,290,000 | | 1,290,000 | | RPM International, Inc., 6.50%, 2/15/2018 | | | 0 | | | | 1,379,353 | | | | 1,379,353 | |
0 | | 1,030,000 | | 1,030,000 | | RPM International, Inc., Sr. Unsecd. Note, 6.125%, 10/15/2019 | | | 0 | | | | 1,068,788 | | | | 1,068,788 | |
0 | | 395,000 | | 395,000 | | Rohm & Haas Co., 6.00%, 9/15/2017 | | | 0 | | | | 432,903 | | | | 432,903 | |
| | | | | | | | | | | | | | | | | | |
| | | | | | TOTAL | | | 1,703,980 | | | | 6,894,059 | | | | 8,598,039 | |
| | | | | | | | | | | | | | | | | | |
Basic Industry - Metals & Mining - 4.4% | | | | | | | | | | | | |
0 | | 100,000 | | 100,000 | | (1)(2) Anglo American Capital PLC, Company Guarantee, Series 144A, 4.45%m 9/27/2020 | | | 0 | | | | 100,418 | | | | 100,418 | |
0 | | 300,000 | | 300,000 | | Anglogold Ashanti Holdings PLC, Sr. Note, 6.50%, 4/15/2040 | | | 0 | | | | 307,693 | | | | 307,693 | |
0 | | 760,000 | | 760,000 | | ArcelorMittal, 6.125%, 6/1/2018 | | | 0 | | | | 810,979 | | | | 810,979 | |
0 | | 1,300,000 | | 1,300,000 | | ArcelorMittal, Sr. Unsecd. Note, 5.25%, 8/5/2020 | | | 0 | | | | 1,287,602 | | | | 1,287,602 | |
0 | | 940,000 | | 940,000 | | Barrick Gold Corp., Sr. Unsecd Note, 6.95%, 4/1/2019 | | | 0 | | | | 1,155,291 | | | | 1,155,291 | |
55
| | | | | | | | | | | | | | | | | | |
1,000,000 | | 0 | | 1,000,000 | | Freeport McMoRan Copper & Gold, Inc., 8.375%, 4/1/2017 | | | 1,109,690 | | | | 0 | | | | 1,109,690 | |
0 | | 1,020,000 | | 1,020,000 | | (1)(2) Gerdau S.A., Company Guarantee, Series 144A, 5.75%, 1/30/2021 | | | 0 | | | | 1,027,650 | | | | 1,027,650 | |
0 | | 700,000 | | 700,000 | | (1)(2) Gold Fields Orogen Holding BVI Ltd., Company Guarantee, Series 144Am 4.875%, 10/7/2020 | | | 0 | | | | 670,921 | | | | 670,921 | |
0 | | 1,810,000 | | 1,810,000 | | Newmont Mining Corp., Company Guarantee, 5.875%, 4/1/2035 | | | 0 | | | | 1,897,658 | | | | 1,897,658 | |
0 | | 435,000 | | 435,000 | | Rio Tinto Finance USA Ltd., Company Guarantee, 6.50%, 7/15/2018 | | | 0 | | | | 506,547 | | | | 506,547 | |
0 | | 1,000,000 | | 1,000,000 | | Rio Tinto Finance USA Ltd., Company Guarantee, 8.95%, 5/1/2014 | | | 0 | | | | 1,212,048 | | | | 1,212,048 | |
0 | | 1,430,000 | | 1,430,000 | | Worthington Industries, Inc., Sr. Unsecd. Note, 6.50%, 4/15/2020 | | | 0 | | | | 1,502,306 | | | | 1,502,306 | |
0 | | 1,000,000 | | 1,000,000 | | Xstrata Canada Corp., 6.00%, 10/15/2015 | | | 0 | | | | 1,095,925 | | | | 1,095,925 | |
0 | | 1,200,000 | | 1,203,700 | | (1)(2) Xstrata Finance Canada Ltd., Unsecd. Note, 5.50%, 11/16/2011 | | | 0 | | | | 1,235,732 | | | | 1,235,732 | |
| | | | | | | | | | | | | | | | | | |
| | | | | | TOTAL | | | 1,109,690 | | | | 12,810,770 | | | | 13,920,460 | |
| | | | | | | | | | | | | | | | | | |
Basic Industry - Paper - 1.5% | | | | | | | | | | | | |
1,000,000 | | 0 | | 1,000,000 | | International Paper Co., 7.95%, 6/15/2018 | | | 1,193,770 | | | | 0 | | | | 1,193,770 | |
0 | | 640,000 | | 640,000 | | International Paper Co., Bond, 7.30%, 11/15/2039 | | | 0 | | | | 732,797 | | | | 732,797 | |
0 | | 450,000 | | 450,000 | | International Paper Co., Sr. Unsecd. Note, 7.50%, 8/15/2021 | | | 0 | | | | 531,709 | | | | 531,709 | |
0 | | 460,000 | | 460,000 | | Plum Creek Timberlands LP, Sr. Unsecd. Note, 4.70%, 3/15/2021 | | | 0 | | | | 438,658 | | | | 438,658 | |
0 | | 400,000 | | 400,000 | | Westvaco Corp., 7.65%, 3/15/2027 | | | 0 | | | | 407,794 | | | | 407,794 | |
0 | | 1,500,000 | | 1,500,000 | | Westvaco Corp., Sr. Deb., 7.50%, 6/15/2027 | | | 0 | | | | 1,517,047 | | | | 1,517,047 | |
| | | | | | | | | | | | | | | | | | |
| | | | | | TOTAL | | | 1,193,770 | | | | 3,628,005 | | | | 4,821,775 | |
| | | | | | | | | | | | | | | | | | |
Capital Goods - Aerospace & Defense - 0.5% | | | | | | | | | | | | |
0 | | 500,000 | | 500,000 | | Embraer Overseas Ltd., Sr. Unsecd. Note, 6.375%, 1/24/2017 | | | 0 | | | | 526,250 | | | | 526,250 | |
0 | | 690,000 | | 690,000 | | Goodrich Corp., 4.875%, 3/1/2020 | | | 0 | | | | 722,969 | | | | 722,969 | |
0 | | 430,000 | | 430,000 | | (1)(2) Meccanica Holdings USA, Inc., Company Guarantee, Series 144A, 6.25%, 1/15/2040 | | | 0 | | | | 405,115 | | | | 405,115 | |
| | | | | | | | | | | | | | | | | | |
| | | | | | TOTAL | | | 0 | | | | 1,654,334 | | | | 1,654,334 | |
| | | | | | | | | | | | | | | | | | |
56
| | | | | | | | | | | | | | | | | | |
Capital Goods - Building Materials - 1.1% | | | | | | | | | | | | |
0 | | 620,000 | | 620,000 | | Masco Corp., Sr. Unsecd. Note, 7.125%, 3/15/2020 | | | 0 | | | | 651,468 | | | | 651,468 | |
600,000 | | 0 | | 600,000 | | Owens Corning, 9.00%, 6/15/2019 | | | 708,186 | | | | 0 | | | | 708,186 | |
1,400,000 | | 720,000 | | 2,120,000 | | Valmont Industries, Inc., Sr. Unsecd. Note, 6.625%, 4/20/2020 | | | 1,458,422 | | | | 750,305 | | | | 2,208,727 | |
| | | | | | | | | | | | | | | | | | |
| | | | | | TOTAL | | | 2,166,608 | | | | 1,401,773 | | | | 3,568,381 | |
| | | | | | | | | | | | | | | | | | |
Capital Goods - Diversified Manufacturing - 3.6% | | | | | | | | | | | | |
0 | | 360,000 | | 360,000 | | Avery Dennison Corp., Sr. Unsecd. Note, 5.375%, 4/15/2020 | | | 0 | | | | 376,190 | | | | 376,190 | |
0 | | 1,045,000 | | 1,045,000 | | Harsco Corp., 5.75%, 5/15/2018 | | | 0 | | | | 1,143,142 | | | | 1,143,142 | |
0 | | 1,350,000 | | 1,350,000 | | Hubbell, Inc., 5.95%, 6/1/2018 | | | 0 | | | | 1,512,566 | | | | 1,512,566 | |
0 | | 1,118,000 | | 1,118,000 | | (1)(2) Hutchison Whampoa International Ltd., 6.50%, 2/13/2013 | | | 0 | | | | 1,222,351 | | | | 1,222,351 | |
0 | | 500,000 | | 500,000 | | Ingersoll-Rand Global Holding Co. Ltd., 6.875%, 8/15/2018 | | | 0 | | | | 575,724 | | | | 575,724 | |
0 | | 1,240,000 | | 1,240,000 | | Roper Industries, Inc., 6.625%, 8/15/2013 | | | 0 | | | | 1,382,872 | | | | 1,382,872 | |
0 | | 1,910,000 | | 1,910,000 | | (1)(2) Textron Financial Corp., Jr. Sub. Note, 6.00%, 2/15/2067 | | | 0 | | | | 1,635,437 | | | | 1,635,437 | |
0 | | 400,000 | | 400,000 | | Thomas & Betts Corp., sr. Unsecd. Note, 5.625%, 11/15/2021 | | | 0 | | | | 424,370 | | | | 424,370 | |
0 | | 1,930,000 | | 1,930,000 | | Tyco Electronics Group SA, 5.95%, 1/15/2014 | | | 0 | | | | 2,133,259 | | | | 2,133,259 | |
0 | | 1,000,000 | | 1,000,000 | | Tyco International Finance SA, Note, 4.125%, 10/15/2014 | | | 0 | | | | 1,060,598 | | | | 1,060,598 | |
| | | | | | | | | | | | | | | | | | |
| | | | | | TOTAL | | | 0 | | | | 11,466,509 | | | | 11,466,509 | |
| | | | | | | | | | | | | | | | | | |
Capital Goods - Environmental - 0.5% | | | | | | | | | | | | |
0 | | 770,000 | | 770,000 | | Republic Services, Inc., Company Guarantee, series WI, 5.50%, 9/15/2019 | | | 0 | | | | 842,428 | | | | 842,428 | |
0 | | 575,000 | | 575,000 | | Waste Management, Inc., 7.375%, 3/11/2019 | | | 0 | | | | 698,182 | | | | 698,182 | |
| | | | | | | | | | | | | | | | | | |
| | | | | | TOTAL | | | 0 | | | | 1,540,610 | | | | 1,540,610 | |
| | | | | | | | | | | | | | | | | | |
Capital Goods - Packaging - 0.2% | | | | | | | | | | | | |
0 | | 650,000 | | 650,000 | | Sonoco Products Co., Sr. Unsecd. Note, 5.75%, 11/1/2040 | | | 0 | | | | 629,328 | | | | 629,328 | |
| | | | | | | | | | | | | | | | | | |
Communications - Media & Cable - 0.8% | | | | | | | | | | | | |
0 | | 1,450,000 | | 1,450,000 | | Time Warner Cable, Inc., Sr. Unsecd. Note, 5.85%, 5/1/2017 | | | 0 | | | | 1,619,112 | | | | 1,619,112 | |
800,000 | | 0 | | 800,000 | | Time Warner, Inc., 8.375%, 3/15/2023 | | | 1,010,256 | | | | 0 | | | | 1,010,256 | |
| | | | | | | | | | | | | | | | | | |
| | | | | | TOTAL | | | 1,010,256 | | | | 1,619,112 | | | | 2,629,368 | |
| | | | | | | | | | | | | | | | | | |
57
| | | | | | | | | | | | | | | | | | |
Communications - Media Noncable - 0.6% | | | | | | | | | | | | |
0 | | 250,000 | | 250,000 | | Discovery Communications LLC, Company Guarantee, 5.05%, 6/1/2020 | | | 0 | | | | 264,863 | | | | 264,863 | |
0 | | 530,000 | | 530,000 | | Moody’s Corp., Sr. Unsecd. Note, 5.50%, 9/1/2020 | | | 0 | | | | 524,621 | | | | 524,621 | |
0 | | 1,100,000 | | 1,100,000 | | (1)(2) Pearson Funding Two PLC, Sr. Unsecd. Note, Series 144A, 4.00%, 5/17/2016 | | | 0 | | | | 1,111,771 | | | | 1,111,771 | |
| | | | | | | | | | | | | | | | | | |
| | | | | | TOTAL | | | 0 | | | | 1,901,255 | | | | 1,901,255 | |
| | | | | | | | | | | | | | | | | | |
Communications - Telecom Wireless - 3.1% | | | | | | | | | | | | |
0 | | 1,800,000 | | 1,800,000 | | AT&T Wireless Services, Inc., 8.75%, 3/1/2031 | | | 0 | | | | 2,459,975 | | | | 2,459,975 | |
0 | | 1,590,000 | | 1,590,000 | | America Movil S.A.B. de C.V., Note, 5.75%, 1/15/2015 | | | 0 | | | | 1,767,881 | | | | 1,767,881 | |
0 | | 1,000,000 | | 1,000,000 | | American Tower Corp., Sr. Unsecd. Note, 4.50%, 1/15/2018 | | | 0 | | | | 992,744 | | | | 992,744 | |
0 | | 2,300,000 | | 2,300,000 | | (1)(2) Crown Castle Towers LLC, Sr. Secd. Note, Series 144A, 5.495%, 1/15/2017 | | | 0 | | | | 2,406,320 | | | | 2,406,320 | |
0 | | 720,000 | | 720,000 | | (1)(2) SBA Tower Trust, Series 144A, 5.101%, 4/15/2017 | | | 0 | | | | 742,315 | | | | 742,315 | |
0 | | 1,295,000 | | 1,295,000 | | Vodafone Group PLC, Note, 5.625%, 2/27/2017 | | | 0 | | | | 1,448,065 | | | | 1,448,065 | |
| | | | | | | | | | | | | | | | | | |
| | | | | | TOTAL | | | 0 | | | | 9,817,300 | | | | 9,817,300 | |
| | | | | | | | | | | | | | | | | | |
Communications - Telecom Wirelines - 2.4% | | | | | | | | | | | | |
0 | | 1,000,000 | | 1,000,000 | | CenturyLink, Inc., Sr. Note, 6.15%, 9/15/2019 | | | 0 | | | | 1,004,698 | | | | 1,004,698 | |
0 | | 1,000,000 | | 1,000,000 | | Deutsche Telekom International Finance BV, 4.875%, 7/8/2014 | | | 0 | | | | 1,076,413 | | | | 1,076,413 | |
0 | | 1,000,000 | | 1,000,000 | | (1)(2) KT Corp., Note, 5.875%, 6/24/2014 | | | 0 | | | | 1,076,896 | | | | 1,076,896 | |
0 | | 1,000,000 | | 1,000,000 | | Rogers Communications, Inc., Company Guarantee, 6.80%, 8/15/2018 | | | 0 | | | | 1,201,479 | | | | 1,201,479 | |
0 | | 250,000 | | 250,000 | | Telefonica SA, Company Guarantee, 7.045%, 6/20/2036 | | | 0 | | | | 257,798 | | | | 257,798 | |
0 | | 1,600,000 | | 1,600,000 | | Verizon Communications, Inc., Unsecd. Note, 6.10%, 4/15/2018 | | | 0 | | | | 1,820,964 | | | | 1,820,964 | |
0 | | 1,000,000 | | 1,000,000 | | Verizon Communications, Inc., Unsecd. Note, 6.35%, 4/1/2019 | | | 0 | | | | 1,159,190 | | | | 1,159,190 | |
| | | | | | | | | | | | | | | | | | |
| | | | | | TOTAL | | | 0 | | | | 7,597,438 | | | | 7,597,438 | |
| | | | | | | | | | | | | | | | | | |
Consumer Cyclical - Automotive - 1.1% | | | | | | | | | | | | |
0 | | 990,000 | | 990,000 | | (1)(2) Hyundai Capital Services, Inc., Note, Series 144A, 6.00%, 5/5/2015 | | | 0 | | | | 1,074,942 | | | | 1,074,942 | |
58
| | | | | | | | | | | | | | | | | | |
0 | | 505,000 | | 505,000 | | Johnson Controls, Inc., Sr. Unsecd. Note, 5.00%, 3/30/2020 | | | 0 | | | | 538,015 | | | | 538,015 | |
0 | | 1,860,000 | | 1,860,000 | | (1)(2) Nissan Motor Acceptance Corp., Note, 4.50%, 1/30/2015 | | | 0 | | | | 1,928,953 | | | | 1,928,953 | |
| | | | | | | | | | | | | | | | | | |
| | | | | | TOTAL | | | 0 | | | | 3,541,910 | | | | 3,541,910 | |
| | | | | | | | | | | | | | | | | | |
Consumer Cyclical - Entertainment - 1.3% | | | | | | | | | | | | |
0 | | 1,000,000 | | 1,000,000 | | (1) Football Trust IV, Pass Thru Cert., 5.35%, 10/5/2020 | | | 0 | | | | 1,047,529 | | | | 1,047,529 | |
0 | | 1,890,000 | | 1,890,000 | | (1)(2) NBC Universal, Inc., Sr. Unsecd. Note, Series 144A, 5.15%, 4/30/2020 | | | 0 | | | | 1,969,551 | | | | 1,969,551 | |
0 | | 450,000 | | 450,000 | | (1)(2) NBC Universal, Inc., Sr. Unsecd. Note, Series 144A, 5.95%, 4/1/2041 | | | 0 | | | | 452,437 | | | | 452,437 | |
0 | | 500,000 | | 500,000 | | Time Warner, Inc., Company Guarantee, 6.20%, 3/15/2040 | | | 0 | | | | 532,168 | | | | 532,168 | |
| | | | | | | | | | | | | | | | | | |
| | | | | | TOTAL | | | 0 | | | | 4,001,685 | | | | 4,001,685 | |
| | | | | | | | | | | | | | | | | | |
Consumer Cyclical - Lodging - 0.6% | | | | | | | | | | | | |
0 | | 950,000 | | 950,000 | | Choice Hotels International, Inc., Company Guarantee, 5.70%, 8/28/2020 | | | 0 | | | | 926,896 | | | | 926,896 | |
0 | | 930,000 | | 930,000 | | Wyndham Worldwide Corp., Sr. Unsecd. Note, 6.00%, 12/1/2016 | | | 0 | | | | 974,391 | | | | 974,391 | |
| | | | | | | | | | | | | | | | | | |
| | | | | | TOTAL | | | 0 | | | | 1,901,287 | | | | 1,901,287 | |
| | | | | | | | | | | | | | | | | | |
Consumer Cyclical - Retailers - 1.8% | | | | | | | | | | | | |
0 | | 1,150,000 | | 1,150,000 | | Best Buy Co., Inc., Sr. Unsecd. Note, 6.75%, 7/15/2013 | | | 0 | | | | 1,272,850 | | | | 1,272,850 | |
0 | | 1,543,383 | | 1,543,383 | | (1)(2) CVS Caremark Corp., Pass Thru Cert., 5.298%, 1/11/2027 | | | 0 | | | | 1,518,039 | | | | 1,518,039 | |
0 | | 935,000 | | 935,000 | | CVS Caremark Corp., Sr. Unsecd. Note, 5.75%, 6/1/2017 | | | 0 | | | | 1,045,672 | | | | 1,045,672 | |
0 | | 530,000 | | 530,000 | | JC Penny Corp., Inc., Sr. Unsecd. Note, 5.75%, 2/15/2018 | | | 0 | | | | 524,700 | | | | 524,700 | |
1,400,000 | | 0 | | 1,400,000 | | Woolworth (FW) Corp., 8.50%, 1/15/2022 | | | 1,393,000 | | | | 0 | | | | 1,393,000 | |
| | | | | | | | | | | | | | | | | | |
| | | | | | TOTAL | | | 1,393,000 | | | | 4,361,261 | | | | 5,754,261 | |
| | | | | | | | | | | | | | | | | | |
Consumer Cyclical - Services - 0.3% | | | | | | | | | | | | |
0 | | 250,000 | | 250,000 | | Boston University, 7.625%, 7/15/2097 | | | 0 | | | | 279,850 | | | | 279,850 | |
0 | | 330,000 | | 330,000 | | eBay, Inc., Sr. Unsecd. Note3.25%, 10/15/2020 | | | 0 | | | | 307,866 | | | | 307,866 | |
0 | | 350,000 | | 350,000 | | Expedia, Inc., Company Guarantee, 5.95%, 8/15/2020 | | | 0 | | | | 353,500 | | | | 353,500 | |
| | | | | | | | | | | | | | | | | | |
| | | | | | TOTAL | | | 0 | | | | 941,216 | | | | 941,216 | |
| | | | | | | | | | | | | | | | | | |
59
| | | | | | | | | | | | | | | | | | |
Consumer Non-Cyclical - Food/Beverage - 1.9% | | | | | | | | | | | | |
0 | | 900,000 | | 900,000 | | Coca-Cola Femsa S.A.B. de C.V., Sr. Unsecd. Note, 4.625%, 2/15/2020 | | | 0 | | | | 930,239 | | | | 930,239 | |
0 | | 161,000 | | 161,000 | | Diageo Capital PLC, Company Guarantee, 7.375%, 1/15/2014 | | | 0 | | | | 185,537 | | | | 185,537 | |
0 | | 1,140,000 | | 1,140,000 | | General Mills, Inc., Note, 5.70%, 2/15/2017 | | | 0 | | | | 1,282,971 | | | | 1,282,971 | |
0 | | 3,000,000 | | 3,000,000 | | PepsiCo, Inc., Note, 4.50%, 1/15/2020 | | | 0 | | | | 3,161,607 | | | | 3,161,607 | |
0 | | 450,000 | | 450,000 | | Ralcorp Holdings, Inc., Sr. Unsecd. Note, 6.625%, 8/15/2039 | | | 0 | | | | 467,710 | | | | 467,710 | |
| | | | | | | | | | | | | | | | | | |
| | | | | | TOTAL | | | 0 | | | | 6,028,064 | | | | 6,028,064 | |
| | | | | | | | | | | | | | | | | | |
Consumer Non-Cyclical - Health Care - 1.1% | | | | | | | | | | | | |
0 | | 750,000 | | 750,000 | | Boston Scientific Corp., 7.375%, 1/15/2040 | | | 0 | | | | 822,080 | | | | 822,080 | |
0 | | 910,000 | | 910,000 | | Life Technologies Corp., Sr. Note, 3.375%, 3/1/2013 | | | 0 | | | | 930,650 | | | | 930,650 | |
0 | | 370,000 | | 370,000 | | Quest Diagnostics, Inc., Sr. Unsecd. Note, 4.75%, 1/30/2020 | | | 0 | | | | 369,015 | | | | 369,015 | |
0 | | 1,310,000 | | 1,310,000 | | Thermo Electron Corp., Sr. Unsecd. Note, 5.00%, 6/1/2015 | | | 0 | | | | 1,429,628 | | | | 1,429,628 | |
| | | | | | | | | | | | | | | | | | |
| | | | | | TOTAL | | | 0 | | | | 3,551,373 | | | | 3,551,373 | |
| | | | | | | | | | | | | | | | | | |
Consumer Non-Cyclical - Pharmaceuticals - 0.3% | | | | | | | | | | | | |
0 | | 900,000 | | 900,000 | | Bio-Rad Laboratories, Inc., Sr. Unsecd. Note, 4.875%, 12/15/2020 | | | 0 | | | | 869,625 | | | | 869,625 | |
| | | | | | | | | | | | | | | | | | |
Consumer Non-Cyclical - Products - 1.2% | | | | | | | | | | | | |
0 | | 330,000 | | 330,000 | | Clorox Co., Sr. Unsecd. Note, 3.55%, 11/1/2015 | | | 0 | | | | 340,861 | | | | 340,861 | |
0 | | 510,000 | | 510,000 | | Hasbro, Inc., Sr. Unsecd. Note, 6.35%, 3/15/2040 | | | 0 | | | | 517,494 | | | | 517,494 | |
1,300,000 | | 0 | | 1,300,000 | | Steelcase, Inc., 6.50%, 8/15/2011 | | | 1,330,641 | | | | 0 | | | | 1,330,641 | |
0 | | 610,000 | | 610,000 | | Whirlpool Corp., 5.50%, 3/1/2013 | | | 0 | | | | 648,171 | | | | 648,171 | |
0 | | 870,000 | | 870,000 | | Whirlpool Corp., Note, 8.00%, 5/1/2012 | | | 0 | | | | 937,825 | | | | 937,825 | |
| | | | | | | | | | | | | | | | | | |
| | | | | | TOTAL | | | 1,330,641 | | | | 2,444,351 | | | | 3,774,992 | |
| | | | | | | | | | | | | | | | | | |
Consumer Non-Cyclical - Supermarkets - 0.6% | | | | | | | | | | | | |
0 | | 610,000 | | 610,000 | | Kroger Co., Bond, 6.90%, 4/15/2038 | | | 0 | | | | 700,089 | | | | 700,089 | |
1,200,000 | | 0 | | 1,200,000 | | Safeway, Inc., 7.45%, 9/15/2027 | | | 1,351,422 | | | | 0 | | | | 1,351,422 | |
| | | | | | | | | | | | | | | | | | |
| | | | | | TOTAL | | | 1,351,422 | | | | 700,089 | | | | 2,051,511 | |
| | | | | | | | | | | | | | | | | | |
Consumer Non-Cyclical - Tobacco - 0.5% | | | | | | | | | | | | |
0 | | 1,500,000 | | 1,500,000 | | Philip Morris International, Inc., 5.65%, 5/16/2018 | | | 0 | | | | 1,707,506 | | | | 1,707,506 | |
| | | | | | | | | | | | | | | | | | |
60
| | | | | | | | | | | | | | | | | | |
Energy - Independent - 2.5% | | | | | | | | | | | | | | |
0 | | 400,000 | | 400,000 | | Apache Corp., Sr. Unsecd. Note, 5.10%, 9/1/2040 | | | 0 | | | | 389,126 | | | | 389,126 | |
1,471,660 | | 0 | | 1,471,660 | | Bruce Mansfield Unit 1, 6.85%, 6/1/2034 | | | 1,561,622 | | | | 0 | | | | 1,561,622 | |
0 | | 2,870,000 | | 2,870,000 | | Petroleos Mexicanos, Company Guarantee, Series WI, 4.875%, 3/15/2015 | | | 0 | | | | 3,036,342 | | | | 3,036,342 | |
0 | | 1,520,000 | | 1,520,000 | | Petroleos Mexicanos, Company Guarantee, Series WI, 6.00%, 3/5/2020 | | | 0 | | | | 1,636,549 | | | | 1,636,549 | |
0 | | 1,900,000 | | 1,900,000 | | Talisman Energy, Inc., Sr. Unsecd. Note, 3.75%, 2/1/2021 | | | 0 | | | | 179,421 | | | | 179,421 | |
0 | | 560,382 | | 560,382 | | (1)(2) Tengizchevroil LLP, Series 144A, 6.124%, 11/15/2014 | | | 0 | | | | 589,802 | | | | 589,802 | |
151,622 | | 0 | | 151,622 | | Waterford 3 Nuclear Power Plant, 8.09%, 1/2/2017 | | | 152,572 | | | | 0 | | | | 152,572 | |
0 | | 405,000 | | 405,000 | | XTO Energy, Inc., 6.75%, 8/1/2037 | | | 0 | | | | 507,368 | | | | 507,368 | |
| | | | | | | | | | | | | | | | | | |
| | | | | | TOTAL | | | 1,714,194 | | | | 6,338,608 | | | | 8,052,802 | |
| | | | | | | | | | | | | | | | | | |
Energy - Integrated - 1.8% | | | | | | | | | | | | | | |
1,400,000 | | 0 | | 1,400,000 | | Avista Corp., 5.95%, 6/1/2018 | | | 1,511,678 | | | | 0 | | | | 1,511,678 | |
0 | | 480,000 | | 480,000 | | BP Capital Markets PLC, Company Guarantee, 3.125%, 10/1/2015 | | | 0 | | | | 478,775 | | | | 478,775 | |
0 | | 1,250,000 | | 1,250,000 | | Husky Oil Ltd., Deb., 7.55%, 11/15/2016 | | | 0 | | | | 1,468,685 | | | | 1,468,685 | |
0 | | 1,000,000 | | 1,000,000 | | Petro-Canada, Note, 5.00%, 11/15/2014 | | | 0 | | | | 1,083,515 | | | | 1,083,515 | |
0 | | 272,440 | | 272,440 | | (1)(2) Qatar Petroleum, 5.579%, 5/30/2011 | | | 0 | | | | 276,067 | | | | 276,067 | |
800,000 | | 0 | | 800,000 | | South Carolina Electric & Gas Co., 6.50%, 11/1/2018 | | | 953,224 | | | | 0 | | | | 953,224 | |
| | | | | | | | | | | | | | | | | | |
| | | | | | TOTAL | | | 2,464,902 | | | | 3,307,042 | | | | 5,771,944 | |
| | | | | | | | | | | | | | | | | | |
Energy - Oil Field Services - 1.5% | | | | | | | | | | | | | | |
0 | | 280,000 | | 280,000 | | (1)(2) Nabors Industries, Inc., Company Guarantee, 5.00%, 9/15/2020 | | | 0 | | | | 271,886 | | | | 271,886 | |
700,000 | | 400,000 | | 1,100,000 | | Nabors Industries, Inc., Company Guarantee, 9.25%, 1/15/2019 | | | 867,951 | | | | 495,551 | | | | 1,363,502 | |
0 | | 450,000 | | 450,000 | | Noble Holding International Ltd., Company Guarantee, 4.90%, 8/1/2020 | | | 0 | | | | 467,753 | | | | 467,753 | |
1,000,000 | | 0 | | 1,000,000 | | Sabine Pass LNG, LP, 7.50%, 11/30/2016 | | | 942,890 | | | | 0 | | | | 942,890 | |
0 | | 1,480,000 | | 1,480,000 | | Weatherford International Ltd., 6.00%, 3/15/2018 | | | 0 | | | | 1,596,353 | | | | 1,596,353 | |
| | | | | | | | | | | | | | | | | | |
| | | | | | TOTAL | | | 1,810,841 | | | | 2,831,543 | | | | 4,642,384 | |
| | | | | | | | | | | | | | | | | | |
61
| | | | | | | | | | | | | | | | | | |
Energy - Refining - 1.2% | | | | | | | | | | | | | | |
1,600,000 | | 0 | | 1,600,000 | | NuStar Logistics, LP, 7.65%, 4/15/2018 | | | 1,849,376 | | | | 0 | | | | 1,849,376 | |
0 | | 240,000 | | 240,000 | | Valero Energy Corp., 9.375%, 3/15/2019 | | | 0 | | | | 298,039 | | | | 298,039 | |
0 | | 1,460,000 | | 1,460,000 | | Valero Energy Corp., Note, 4.75%, 4/1/2014 | | | 0 | | | | 1,549,792 | | | | 1,549,792 | |
| | | | | | | | | | | | | | | | | | |
| | | | | | TOTAL | | | 1,849,376 | | | | 1,847,831 | | | | 3,697,207 | |
| | | | | | | | | | | | | | | | | | |
Financial Institution - Banking - 14.8% | | | | | | | | | | | | |
0 | | 1,600,000 | | 1,600,000 | | Astoria Financial Corp., Note, 5.75%, 10/15/2012 | | | 0 | | | | 1,643,616 | | | | 1,643,616 | |
0 | | 1,000,000 | | 1,000,000 | | Bank of America Corp., Note, 4.50%, 4/1/2015 | | | 0 | | | | 1,022,476 | | | | 1,022,476 | |
0 | | 2,000,000 | | 2,000,000 | | Bank of America Corp., Sr. Note, 5.375%, 6/15/2014 | | | 0 | | | | 2,102,715 | | | | 2,102,715 | |
0 | | 1,500,000 | | 1,500,000 | | Bank of America Corp., Sr. Unsecd. Note, 3.70%, 9/1/2015 | | | 0 | | | | 1,492,242 | | | | 1,492,242 | |
0 | | 3,000,000 | | 3,000,000 | | (1)(2) Barclays Bank PLC, 5.926%, 12/31/2049 | | | 0 | | | | 2,673,750 | | | | 2,673,750 | |
0 | | 2,030,000 | | 2,030,000 | | (3) Bear Stearns Cos., Inc., Sr. Unsecd. Note, 5.70%, 11/15/2014 | | | 0 | | | | 2,230,162 | | | | 2,230,162 | |
0 | | 2,470,000 | | 2,470,000 | | Capital One Capital IV, 6.745%, 2/17/2037 | | | 0 | | | | 2,463,825 | | | | 2,463,825 | |
0 | | 725,000 | | 725,000 | | Capital One Capital V, 10.25%, 8/15/2039 | | | 0 | | | | 780,281 | | | | 780,281 | |
0 | | 1,340,000 | | 1,340,000 | | Capital One Capital VI, 8.875%, 5/15/2040 | | | 0 | | | | 1,405,325 | | | | 1,405,325 | |
0 | | 1,000,000 | | 1,000,000 | | Citigroup, Inc., Sr. Note, 5.375%, 8/9/2020 | | | 0 | | | | 1,042,220 | | | | 1,042,220 | |
0 | | 500,000 | | 500,000 | | Citigroup, Inc., Sr. Unsecd. Note, 6.00%, 12/13/2013 | | | 0 | | | | 547,527 | | | | 547,527 | |
0 | | 2,290,000 | | 2,290,000 | | Citigroup, Inc., Sr. Unsecd. Note, 6.875%, 3/5/2038 | | | 0 | | | | 2,556,382 | | | | 2,556,382 | |
0 | | 480,000 | | 480,000 | | City National Corp., Note, 5.25%, 9/15/2020 | | | 0 | | | | 473,267 | | | | 473,267 | |
0 | | 250,000 | | 250,000 | | Huntington Bancshares, Inc., Sub Note, 7.00%, 12/15/2020 | | | 0 | | | | 263,696 | | | | 263,696 | |
0 | | 4,300,000 | | 4,300,000 | | JPMorgan Chase & Co., Sub. Note, 5.125%, 9/15/2014 | | | 0 | | | | 4,586,983 | | | | 4,586,983 | |
0 | | 2,440,000 | | 2,440,000 | | Manufactures & Traders Trust Co., Sub. Note, 5.629%, 12/1/2021 | | | 0 | | | | 2,297,757 | | | | 2,297,757 | |
0 | | 1,100,000 | | 1,100,000 | | Morgan Stanley, Sr. Unsecd. Note, 3.45%, 11/2/2015 | | | 0 | | | | 1,080,165 | | | | 1,080,165 | |
0 | | 2,520,000 | | 2,520,000 | | Morgan Stanley, Sr. Unsecd. Note, 4.20%, 11/20/2014 | | | 0 | | | | 2,580,142 | | | | 2,580,142 | |
0 | | 500,000 | | 500,000 | | Morgan Stanley, Sr. Unsecd. Note, 5.50%, 7/24/2020 | | | 0 | | | | 506,008 | | | | 506,008 | |
62
| | | | | | | | | | | | | | | | | | |
0 | | 825,000 | | 825,000 | | Morgan Stanley, Sr. Unsecd. Note, 5.95%, 12/28/2017 | | | 0 | | | | 874,107 | | | | 874,107 | |
0 | | 2,010,000 | | 2,010,000 | | Morgan Stanley, Sr. Unsecd. Note, 6.625%, 4/1/2018 | | | 0 | | | | 2,206,353 | | | | 2,206,353 | |
0 | | 800,000 | | 800,000 | | PNC Funding Corp., Sr. Unsecd. Note, 4.25%, 9/21/2015 | | | 0 | | | | 841,299 | | | | 841,299 | |
0 | | 450,000 | | 450,000 | | PNC Funding Corp., Sr. Unsecd. Note, 5.125%, 2/8/2020 | | | 0 | | | | 472,885 | | | | 472,885 | |
0 | | 410,000 | | 410,000 | | PNC Funding Corp., Sr. Unsecd. Note, 5.625%, 2/1/2017 | | | 0 | | | | 437,667 | | | | 437,667 | |
1,500,000 | | 0 | | 1,500,000 | | (1)(2) PNC Preferred FD, 144A, 6.517%, 12/31/2049 | | | 1,191,927 | | | | 0 | | | | 1,191,927 | |
0 | | 1,400,000 | | 1,400,000 | | (1)(2) Santander US Debt SA Unipersonal Bank Guarantee, Series 144A, 3.781%, 10/7/2015 | | | 0 | | | | 1,316,112 | | | | 1,316,112 | |
0 | | 630,000 | | 630,000 | | State Street Bank and Trust Co., Sub. Note, 5.30%, 1/15/2016 | | | 0 | | | | 689,848 | | | | 689,848 | |
0 | | 2,500,000 | | 2,500,000 | | Wachovia Bank N.A., 4.80%, 11/1/2014 | | | 0 | | | | 2,648,713 | | | | 2,648,713 | |
0 | | 1,320,000 | | 1,320,000 | | Wachovia Corp., 5.75%, 2/1/2018 | | | 0 | | | | 1,468,816 | | | | 1,468,816 | |
0 | | 1,175,000 | | 1,175,000 | | Westpac Banking Corp., Sr. Unsecd. Note, 4.875%, 11/19/2019 | | | 0 | | | | 1,237,948 | | | | 1,237,948 | |
0 | | 1,900,000 | | 1,900,000 | | Wilmington Trust Corp., Sub. Note, 8.50%, 4/2/2018 | | | 0 | | | | 2,171,844 | | | | 2,171,844 | |
| | | | | | | | | | | | | | | | | | |
| | | | | | TOTAL | | | 1,191,927 | | | | 46,114,131 | | | | 47,306,058 | |
| | | | | | | | | | | | | | | | | | |
| Financial Institution - Brokerage - 6.5% | | | | | | | | | | | | |
0 | | 4,480,000 | | 4,480,000 | | BlackRock, Inc., 6.25%, 9/15/2017 | | | 0 | | | | 5,065,795 | | | | 5,065,795 | |
0 | | 500,000 | | 500,000 | | (1)(2) CME Group Index Services LLC, Company Guarantee, Series 144A, 4.40%, 3/15/2018 | | | 0 | | | | 512,437 | | | | 512,437 | |
0 | | 900,000 | | 900,000 | | (1)(2) Cantor Fitzgerald LP, Bond, Series 144A, 7.875%, 10/15/2019 | | | 0 | | | | 910,983 | | | | 910,983 | |
0 | | 835,000 | | 835,000 | | Eaton Vance Corp., 6.50%, 10/2/2017 | | | 0 | | | | 952,299 | | | | 952,299 | |
0 | | 850,000 | | 850,000 | | (1)(2) FMR LLC, 4.75%, 3/1/2013 | | | 0 | | | | 890,197 | | | | 890,197 | |
0 | | 3,000,000 | | 3,000,000 | | (1)(2) FMR LLC, Bond, 7.57%, 6/15/2029 | | | 0 | | | | 3,327,289 | | | | 3,327,289 | |
0 | | 350,000 | | 350,000 | | Franklin Resources, Inc., Sr. Unsecd. Note, 4.625%, 5/20/2020 | | | 0 | | | | 364,991 | | | | 364,991 | |
0 | | 750,000 | | 750,000 | | Invesco Ltd., Sr. Unsecd. Note, 5.625%, 4/17/2012 | | | 0 | | | | 780,203 | | | | 780,203 | |
0 | | 680,000 | | 680,000 | | Janus Capital Group, Inc., Sr. Note, 6.50%, 6/15/2012 | | | 0 | | | | 735,704 | | | | 735,704 | |
0 | | 800,000 | | 800,000 | | Janus Capital Group, Inc., Sr. Note, 6.95%, 6/15/2017 | | | 0 | | | | 834,540 | | | | 834,540 | |
0 | | 635,000 | | 635,000 | | Jefferies Group, Inc., Sr. Unsecd. Note, 6.875%, 4/15/2021 | | | 0 | | | | 669,634 | | | | 669,634 | |
0 | | 1,040,000 | | 1,040,000 | | Jefferies Group, Inc., Sr. Unsecd. Note, 8.50%, 7/15/2019 | | | 0 | | | | 1,193,307 | | | | 1,193,307 | |
63
| | | | | | | | | | | | | | | | | | |
| 0 | | 2,290,000 | | 2,290,000 | | (4)(5) Lehman Brothers Holdings, Inc., 7.875%, 8/15/2011 | | | 0 | | | | 541,013 | | | | 541,013 | |
| 0 | | 740,000 | | 740,000 | | NASDAQ OMX Group, Inc., Sr. Unsecd. Note, 5.55%, 1/15/2020 | | | 0 | | | | 745,485 | | | | 745,485 | |
| 0 | | 690,000 | | 690,000 | | Nuveen Investments, 5.50%, 9/15/2015 | | | 0 | | | | 595,125 | | | | 595,125 | |
| 0 | | 1,210,000 | | 1,210,000 | | Raymond James Financial, Inc., 8.60%, 8/15/2019 | | | 0 | | | | 1,428,384 | | | | 1,428,384 | |
| 0 | | 1,225,000 | | 1,225,000 | | TD Ameritrade Holding Corp., Company Guarantee, 4.15%, 12/1/2014 | | | 0 | | | | 1,268,495 | | | | 1,268,495 | |
| | | | | | | | | | | | | | | | | | |
| | | | | | TOTAL | | | 0 | | | | 20,815,881 | | | | 20,815,881 | |
| | | | | | | | | | | | | | | | | | |
| Financial Institution - Finance Noncaptive - 5.3% | | | | | | | | | | | | |
| 0 | | 850,000 | | 850,000 | | American Express Co., Note, 2.75%, 9/15/2015 | | | 0 | | | | 839,552 | | | | 839,552 | |
| 0 | | 1,130,000 | | 1,130,000 | | American Express Credit Co., 5.875%, 5/2/2013 | | | 0 | | | | 1,231,445 | | | | 1,231,445 | |
| 0 | | 1,000,000 | | 1,000,000 | | American Express Credit Co., Sr. Unsecd. Note, 5.125%, 8/25/2014 | | | 0 | | | | 1,076,139 | | | | 1,076,139 | |
| 0 | | 500,000 | | 500,000 | | American International Group, Inc., Sr. Unsecd. Note, 6.40%, 12/15/2020 | | | 0 | | | | 521,875 | | | | 521,875 | |
| 0 | | 1,200,000 | | 1,200,000 | | Discover Bank, Sub. 8.70%, 11/18/2019 | | | 0 | | | | 1,414,794 | | | | 1,414,794 | |
| 0 | | 2,680,000 | | 2,680,000 | | General Electric Capital Corp., 5.625%, 5/1/2018 | | | 0 | | | | 2,923,754 | | | | 2,923,754 | |
| 0 | | 1,000,000 | | 1,000,000 | | General Electric Capital Corp., Sr. Unsecd. Note, Series MTN, 6.875%, 1/10/2039 | | | 0 | | | | 1,161,238 | | | | 1,161,238 | |
| 0 | | 4,400,000 | | 4,400,000 | | HSBC Finance Capital Trust IX, Note, 5.911%, 11/30/2035 | | | 0 | | | | 4,092,000 | | | | 4,092,000 | |
| 0 | | 1,100,000 | | 1,100,000 | | (1)(2) ILFC E-Capital Trust 1, 5.90%, 12/21/2065 | | | 0 | | | | 838,266 | | | | 838,266 | |
| 0 | | 1,000,000 | | 1,000,000 | | (1)(2) Lukoil International Finance BV, 6.356%, 6/7/2017 | | | 0 | | | | 1,050,000 | | | | 1,050,000 | |
| 0 | | 450,000 | | 450,000 | | (1)(2) Macquarie Group Ltd., Note, Series 144A, 7.625%, 8/13/2019 | | | 0 | | | | 498,760 | | | | 498,760 | |
| 0 | | 1,400,000 | | 1,400,000 | | (1)(2) Macquarie Group Ltd., Sr. Unsecd. Note, Series 144A, 6.00%, 1/14/2020 | | | 0 | | | | 1,414,159 | | | | 1,414,159 | |
| | | | | | | | | | | | | | | | | | |
| | | | | | TOTAL | | | 0 | | | | 17,061,982 | | | | 17,061,982 | |
| | | | | | | | | | | | | | | | | | |
| Financial Institution - Insurance - Health - 0.6% | | | | | | | | | | | | |
| 0 | | 555,000 | | 555,000 | | UnitedHealth Group, Inc., Sr. Unsecd. Note, 6.00%, 2/15/2018 | | | 0 | | | | 629,690 | | | | 629,690 | |
| 0 | | 1,130,000 | | 1,130,000 | | Wellpoint, Inc., Sr. Unsecd. Note, 7.00%, 2/15/2019 | | | 0 | | | | 1,328,888 | | | | 1,328,888 | |
| | | | | | | | | | | | | | | | | | |
| | | | | | TOTAL | | | 0 | | | | 1,958,578 | | | | 1,958,578 | |
| | | | | | | | | | | | | | | | | | |
64
| | | | | | | | | | | | | | | | | | |
Financial Institution - Insurance - Life - 2.0% | | | | | | | | | | | | |
0 | | 910,000 | | 910,000 | | (1)(2) AXA Equitable Life Insurance Co., Sub., 7.70%, 12/1/2015 | | | 0 | | | | 1,011,284 | | | | 1,011,284 | |
0 | | 580,000 | | 580,000 | | Aflac, Inc., Sr. Unsecd. Note, 6.90%, 12/17/2039 | | | 0 | | | | 613,252 | | | | 613,252 | |
0 | | 390,000 | | 390,000 | | Aflac, Inc., Sr. Unsecd. Note, 8.50%, 5/15/2019 | | | 0 | | | | 483,899 | | | | 483,899 | |
0 | | 350,000 | | 350,000 | | Lincoln National Corp., Sr. Note, 7.00%, 6/15/2040 | | | 0 | | | | 382,055 | | | | 382,055 | |
0 | | 500,000 | | 500,000 | | (1)(2) New York Life Insurance Co., Sub. Note, 6.75%, 11/15/2039 | | | 0 | | | | 580,596 | | | | 580,596 | |
0 | | 1,300,000 | | 1,300,000 | | (1)(2) Northwestern Mutual Life Insurance Co., Sub. Note, Series 144A, 6.063%, 3/30/2040 | | | 0 | | | | 1,383,469 | | | | 1,383,469 | |
0 | | 350,000 | | 350,000 | | (1)(2) Penn Mutual Life Insurance Co., Sr. Note, Series 144A, 7.625%, 6/15/2040 | | | 0 | | | | 347,197 | | | | 347,197 | |
0 | | 850,000 | | 850,000 | | Prudential Financial, Inc., 6.625%, 12/1/2037 | | | 0 | | | | 937,240 | | | | 937,240 | |
0 | | 500,000 | | 500,000 | | Prudential Financial, Inc., Sr. Unsecd. Note, 4.75%, 9/17/2015 | | | 0 | | | | 532,782 | | | | 532,782 | |
0 | | 250,000 | | 250,000 | | (1) Union Central Life Insurance Co., Note, 8.20%, 11/1/2026 | | | 0 | | | | 249,103 | | | | 249,103 | |
| | | | | | | | | | | | | | | | | | |
| | | | | | TOTAL | | | 0 | | | | 6,520,877 | | | | 6,520,877 | |
| | | | | | | | | | | | | | | | | | |
| | | |
Financial Institution - Insurance - P&C - 3.1% | | | | | | | | | | | | |
0 | | 1,300,000 | | 1,300,000 | | ACE INA Holdings, Inc., 5.60%, 5/15/2015 | | | 0 | | | | 1,438,148 | | | | 1,438,148 | |
0 | | 1,380,000 | | 1,380,000 | | ACE INA Holdings, Inc., Sr. Note, 5.70%, 2/15/2017 | | | 0 | | | | 1,513,905 | | | | 1,513,905 | |
0 | | 330,000 | | 330,000 | | CNA Financial Corp., 6.50%, 8/15/2016 | | | 0 | | | | 353,813 | | | | 353,813 | |
0 | | 680,000 | | 680,000 | | CNA Financial Corp., Sr. Unsecd. Note, 5.875%, 8/15/2020 | | | 0 | | | | 678,288 | | | | 678,288 | |
0 | | 100,000 | | 100,000 | | Chubb Corp., Sr. Note, 5.75%, 5/15/2018 | | | 0 | | | | 111,391 | | | | 111,391 | |
0 | | 1,180,000 | | 1,180,000 | | Horace Mann Educators Corp., Sr. Note, 6.85%, 4/15/2016 | | | 0 | | | | 1,241,220 | | | | 1,241,220 | |
0 | | 2,200,000 | | 2,200,000 | | (1)(2) Liberty Mutual Group, Inc., Unsecd. Note, 5.75%, 3/15/2014 | | | 0 | | | | 2,289,890 | | | | 2,289,890 | |
0 | | 250,000 | | 250,000 | | MBIA Insurance Corp., Sr. Deb., 6.625%, 10/1/2028 | | | 0 | | | | 185,595 | | | | 185,595 | |
670,000 | | 0 | | 670,000 | | PXRE Capital Trust, 8.85%, 2/1/2027 | | | 623,100 | | | | 0 | | | | 623,100 | |
0 | | 370,000 | | 370,000 | | The Travelers Cos, Inc., Sr. Unsecd. Note, 5.50%, 12/1/2015 | | | 0 | | | | 413,914 | | | | 413,914 | |
0 | | 1,050,000 | | 1,050,000 | | (1)(2) ZFS Finance USA Trust II, Jr. Sub. Note, 6.45%, 12/15/2065 | | | 0 | | | | 1,036,875 | | | | 1,036,875 | |
| | | | | | | | | | | | | | | | | | |
| | | | | | TOTAL | | | 623,100 | | | | 9,263,039 | | | | 9,886,139 | |
| | | | | | | | | | | | | | | | | | |
65
| | | | | | | | | | | | | | | | | | |
Financial Institution - REITs - 4.8% | | | | | | | | | | | | |
0 | | 640,000 | | 640,000 | | AMB Property LP, 6.30%, 6/1/2013 | | | 0 | | | | 685,471 | | | | 685,471 | |
0 | | 1,200,000 | | 1,200,000 | | Boston Properties LP, Sr. Unsecd. Note, 5.875%, 10/15/2019 | | | 0 | | | | 1,307,915 | | | | 1,307,915 | |
1,075,000 | | 0 | | 1,075,000 | | CommonWealth REIT, 6.25%, 8/15/2016 | | | 1,128,331 | | | | 0 | | | | 1,128,331 | |
0 | | 890,000 | | 890,000 | | Equity One, Inc., Bond, 6.00%, 9/15/2017 | | | 0 | | | | 884,063 | | | | 884,063 | |
0 | | 200,000 | | 200,000 | | Equity One, Inc., Sr. Unsecd. Note, 6.25%, 12/15/2014 | | | 0 | | | | 211,239 | | | | 211,239 | |
700,000 | | 0 | | 700,000 | | First Industrial, LP, 7.60%, 7/15/2028 | | | 607,250 | | | | 0 | | | | 607,250 | |
500,000 | | 0 | | 500,000 | | First Industrial, LP, 7.75%, 4/15/2032 | | | 418,715 | | | | 0 | | | | 418,715 | |
0 | | 960,000 | | 960,000 | | Health Care REIT, Inc., Sr. Unsecd. Note, 6.125%, 4/15/2020 | | | 0 | | | | 1,012,350 | | | | 1,012,350 | |
1,300,000 | | 0 | | 1,300,000 | | Hospitality Properties Trust, 6.75%, 2/15/2013 | | | 1,361,594 | | | | 0 | | | | 1,361,594 | |
1,171,000 | | 0 | | 1,171,000 | | iStar Financial, Inc. - Series B, 5.70%, 3/1/2014 | | | 1,054,485 | | | | 0 | | | | 1,054,485 | |
0 | | 850,000 | | 850,000 | | Liberty Property LP, 6.625%, 10/1/2017 | | | 0 | | | | 968,596 | | | | 968,596 | |
0 | | 630,000 | | 630,000 | | Prologis, Conv. Bond, 2.25%, 4/1/2037 | | | 0 | | | | 628,154 | | | | 628,154 | |
0 | | 250,000 | | 250,000 | | Prologis, Sr. Note, 5.50%, 4/1/2012 | | | 0 | | | | 258,138 | | | | 258,138 | |
0 | | 450,000 | | 450,000 | | Prologis, Sr. Note, 6.875%, 3/15/2020 | | | 0 | | | | 478,594 | | | | 478,594 | |
0 | | 1,260,000 | | 1,260,000 | | Prologis, Sr. Note, 7.625%, 8/15/2014 | | | 0 | | | | 1,421,934 | | | | 1,421,934 | |
1,500,000 | | 0 | | 1,500,000 | | Realty Income Corp., 6.75%, 8/15/2019 | | | 1,699,395 | | | | 0 | | | | 1,699,395 | |
0 | | 470,000 | | 470,000 | | Regency Centers LP, Company Guarantee, 4.80%, 4/15/2021 | | | 0 | | | | 450,492 | | | | 450,492 | |
0 | | 700,000 | | 700,000 | | Tanger Properties LP, Sr. Unsecd. Note, 6.125%, 6/1/2020 | | | 0 | | | | 750,930 | | | | 750,930 | |
| | | | | | | | | | | | | | | | | | |
| | | | | | TOTAL | | | 6,269,770 | | | | 9,057,876 | | | | 15,327,646 | |
| | | | | | | | | | | | | | | | | | |
Municipal Services - 0.8% | | | | | | | | | | | | |
0 | | 895,000 | | 895,000 | | (1)(2) Army Hawaii Family Housing, 5.524%, 6/15/2050 | | | 0 | | | | 769,378 | | | | 769,378 | |
0 | | 1,850,000 | | 1,850,000 | | (1)(2) Camp Pendleton & Quantico Housing LLC, 5.572%, 10/1/2050 | | | 0 | | | | 1,641,431 | | | | 1,641,431 | |
| | | | | | | | | | | | | | | | | | |
| | | | | | TOTAL | | | 0 | | | | 2,410,809 | | | | 2,410,809 | |
| | | | | | | | | | | | | | | | | | |
Sovereign - 0.6% | | | | | | | | | | | | | | |
0 | | 1,120,000 | | 1,120,000 | | Corp Andina De Fomento, Sr. Unsecd. Note, 3.75%, 1/15/2016 | | | 0 | | | | 1,103,184 | | | | 1,103,184 | |
0 | | 900,000 | | 900,000 | | (1)(2) State of Qatar, 5.25%, 1/20/2020 | | | 0 | | | | 957,375 | | | | 957,375 | |
| | | | | | | | | | | | | | | | | | |
| | | | | | TOTAL | | | 0 | | | | 2,060,559 | | | | 2,060,559 | |
| | | | | | | | | | | | | | | | | | |
66
| | | | | | | | | | | | | | | | | | |
Technology - 3.1% | | | | | | | | | | | | | | |
0 | | 1,120,000 | | 1,120,000 | | Adobe Systems, Inc., Sr. Unsecd. Note, 3.25%, 2/1/2015 | | | 0 | | | | 1,142,402 | | | | 1,142,402 | |
0 | | 700,000 | | 700,000 | | BMC Software, Inc., 7.25%, 6/1/2018 | | | 0 | | | | 810,473 | | | | 810,473 | |
0 | | 670,000 | | 670,000 | | Fiserv, Inc., Sr. Note, 6.80%, 11/20/2017 | | | 0 | | | | 740,621 | | | | 740,621 | |
0 | | 3,400,000 | | 3,400,000 | | Harris Corp., 5.95%, 12/1/2017 | | | 0 | | | | 3,763,383 | | | | 3,763,383 | |
0 | | 1,085,000 | | 1,085,000 | | Hewlett-Packard Co., Note, 5.40%, 3/1/2017 | | | 0 | | | | 1,213,583 | | | | 1,213,583 | |
0 | | 1,230,000 | | 1,230,000 | | KLA-Tencor Corp., 6.90%, 5/1/2018 | | | 0 | | | | 1,355,979 | | | | 1,355,979 | |
0 | | 515,000 | | 515,000 | | Maxim Integrated Products, Inc., Note, 3.45%, 6/14/2013 | | | 0 | | | | 525,954 | | | | 525,954 | |
0 | | 285,000 | | 285,000 | | (1)(2) SAIC, Inc., Company Guarantee, Series 144A, 5.95%, 12/1/2040 | | | 0 | | | | 290,580 | | | | 290,580 | |
| | | | | | | | | | | | | | | | | | |
| | | | | | TOTAL | | | 0 | | | | 9,842,975 | | | | 9,842,975 | |
| | | | | | | | | | | | | | | | | | |
Transportation - Airlines - 0.3% | | | | | | | | | | | | |
822,006 | | 0 | | 822,006 | | Continental Airlines, Inc. - Pass-Thru Cert 1997-1 Class 1A, 7.461%, 10/1/2016 | | | 853,826 | | | | 0 | | | | 853,826 | |
0 | | 4,000 | | 4,000 | | Southwest Airlines Co., 6.50%, 3/1/2012 | | | 0 | | | | 4,196 | | | | 4,196 | |
| | | | | | | | | | | | | | | | | | |
| | | | | | TOTAL | | | 853,826 | | | | 4,196 | | | | 858,022 | |
| | | | | | | | | | | | | | | | | | |
Transportation -Railroads -0.9% | | | | | | | | | | | | |
0 | | 2,020,000 | | 2,020,000 | | Burlington Northern Santa Fe Corp., 4.875%, 1/15/2015 | | | 0 | | | | 2,197,963 | | | | 2,197,963 | |
0 | | 465,000 | | 465,000 | | Burlington Northern Santa Fe Corp., Deb., 5.75%, 5/1/2040 | | | 0 | | | | 484,370 | | | | 484,370 | |
0 | | 153,378 | | 153,378 | | Burlington Northern Santa Fe Corp., Pass Thru Cert., 7.57%, 1/2/2021 | | | 0 | | | | 181,400 | | | | 181,400 | |
| | | | | | | | | | | | | | | | | | |
| | | | | | TOTAL | | | 0 | | | | 2,863,733 | | | | 2,863,733 | |
| | | | | | | | | | | | | | | | | | |
Transportation - Services - 1.4% | | | | | | | | | | | | |
0 | | 1,695,000 | | 1,695,000 | | (1)(2) Enterprise Rent-A-Car USA Finance Co., 6.375%, 10/15/2017 | | | 0 | | | | 1,888,856 | | | | 1,888,856 | |
1,100,000 | | 0 | | 1,100,000 | | Overseas Shipholding Group, Inc., 8.75%, 12/1/2013 | | | 1,187,439 | | | | 0 | | | | 1,187,439 | |
976,077 | | 0 | | 976,077 | | (1)(2) Windsor Petroleum Transportation, 144A, 7.84%, 1/15/2021 | | | 855,190 | | | | 0 | | | | 855,190 | |
0 | | 530,000 | | 530,000 | | United Parcel Service, Inc., Sr. Unsecd. Note, 3.125%, 1/15/2021 | | | 0 | | | | 494,443 | | | | 494,443 | |
| | | | | | | | | | | | | | | | | | |
| | | | | | TOTAL | | | 2,042,629 | | | | 2,383,299 | | | | 4,425,928 | |
| | | | | | | | | | | | | | | | | | |
Utility - Electric - 6.2% | | | | | | | | | | | | |
0 | | 930,000 | | 930,000 | | Cleveland Electric Illuminating Co., Sr. Unsecd. Note, 5.95%, 12/15/2036 | | | 0 | | | | 891,372 | | | | 891,372 | |
67
| | | | | | | | | | | | | | | | | | |
0 | | 1,130,000 | | 1,130,000 | | Commonwealth Edison Co., 1st Mtg. Bond, 5.80%, 3/15/2018 | | | 0 | | | | 1,269,494 | | | | 1,269,494 | |
0 | | 910,000 | | 910,000 | | Consolidated Edison Co., Sr. Unsecd. Note, 5.50%, 9/15/2016 | | | 0 | | | | 1,033,208 | | | | 1,033,208 | |
0 | | 610,000 | | 610,000 | | (1)(2) Enel Finance International SA, Company Guarantee, Series 144A, 3.875%, 10/7/2014 | | | 0 | | | | 622,558 | | | | 622,558 | |
1,700,000 | | 0 | | 1,700,000 | | Entergy Gulf States, Inc., 6.18%, 3/1/2035 | | | 1,601,468 | | | | 0 | | | | 1,601,468 | |
0 | | 500,000 | | 500,000 | | Exelon Generation Co., LLC, Sr. Unsecd. Note, 5.75%, 10/1/2041 | | | 0 | | | | 477,201 | | | | 477,201 | |
0 | | 620,000 | | 620,000 | | FPL Group Capital, Inc., 7.875%, 12/15/2015 | | | 0 | | | | 748,765 | | | | 748,765 | |
0 | | 570,000 | | 570,000 | | FirstEnergy Solutions Corp., Company Guarantee, 4.80%, 2/15/2015 | | | 0 | | | | 599,105 | | | | 599,105 | |
0 | | 800,000 | | 800,000 | | FirstEnergy Solutions Corp., Company Guarantee, 6.05%, 8/15/2021 | | | 0 | | | | 823,419 | | | | 823,419 | |
0 | | 1,629,330 | | 1,629,330 | | (1)(2) Great River Energy, 1st Mtg. Note, 5.829%, 7/1/2017 | | | 0 | | | | 1,830,484 | | | | 1,830,484 | |
0 | | 420,000 | | 420,000 | | KCP&L Greater Missouri Operations Co., Sr. Unsecd. Note, 11.875%, 7/1/2012 | | | 0 | | | | 476,962 | | | | 476,962 | |
0 | | 2,650,000 | | 2,650,000 | | MidAmerican Energy Holdings Co., Sr. Unsecd. Note, 5.95%, 5/15/2037 | | | 0 | | | | 2,821,750 | | | | 2,821,750 | |
0 | | 635,000 | | 635,000 | | Northern States Power Co., MN, 1st Mtg. Bond, 5.25%, 3/1/2018 | | | 0 | | | | 704,763 | | | | 704,763 | |
0 | | 1,110,000 | | 1,110,000 | | PPL Energy Supply LLC, Sr. Unsecd. Note, 6.0%, 12/15/2036 | | | 0 | | | | 1,108,815 | | | | 1,108,815 | |
0 | | 1,390,000 | | 1,390,000 | | PSI Energy, Inc., Bond, 6.05%, 6/15/2016 | | | 0 | | | | 1,590,136 | | | | 1,590,136 | |
0 | | 500,000 | | 500,000 | | Southwestern Electric Power Co., Sr. Unsecd. Note, 6.20%, 3/15/2040 | | | 0 | | | | 510,851 | | | | 510,851 | |
0 | | 230,000 | | 230,000 | | TECO Finance, Inc. Company Guarantee, 5.15%, 3/15/2020 | | | 0 | | | | 238,892 | | | | 238,892 | |
0 | | 800,000 | | 800,000 | | UIL Holdings Corp., Sr. Unsecd. Note, 4.625%, 10/1/2020 | | | 0 | | | | 758,994 | | | | 758,994 | |
0 | | 1,570,000 | | 1,570,000 | | Union Electric Co., 6.00%, 4/1/2018 | | | 0 | | | | 1,740,616 | | | | 1,740,616 | |
| | | | | | | | | | | | | | | | | | |
| | | | | | TOTAL | | | 1,601,468 | | | | 18,247,385 | | | | 19,848,853 | |
| | | | | | | | | | | | | | | | | | |
Utilities - Natural Gas Distributor - 0.1% | | | | | | | | | | | | |
0 | | 280,000 | | 280,000 | | (1)(2) Florida Gas Transmission Co. LLC, Sr. Unsecd. Note, Series 144A, 5.45%, 7/15/2020 | | | 0 | | | | 292,707 | | | | 292,707 | |
| | | | | | | | | | | | | | | | | | |
Utility - Natural Gas Pipelines - 3.6% | | | | | | | | | | | | |
0 | | 990,000 | | 990,000 | | Consolidated Natural Gas Co., 5.00%, 12/1/2014 | | | 0 | | | | 1,082,402 | | | | 1,082,402 | |
68
| | | | | | | | | | | | | | | | | | |
0 | | 1,865,000 | | 1,865,000 | | Duke Capital Corp., Sr. Note, 6.25%, 2/15/2013 | | | 0 | | | | 2,023,867 | | | | 2,023,867 | |
0 | | 1,850,000 | | 1,850,000 | | Enbridge, Inc., Sr. Note, 5.60%, 4/1/2017 | | | 0 | | | | 2,075,743 | | | | 2,075,743 | |
0 | | 1,670,000 | | 1,670,000 | | Enterprise Products Operating LLC, Company Guarantee, Series O, 9.75%, 1/31/2014 | | | 0 | | | | 2,018,644 | | | | 2,018,644 | |
0 | | 2,750,000 | | 2,750,000 | | Kinder Morgan Energy Partners, LP, Sr. Unsecd. Note, 5.80%, 3/15/2035 | | | 0 | | | | 2,654,359 | | | | 2,654,359 | |
0 | | 1,110,000 | | 1,110,000 | | Williams Partners LP, 5.25%, 3/15/2020 | | | 0 | | | | 1,152,722 | | | | 1,152,722 | |
0 | | 380,000 | | 380,000 | | Williams Partners LP, Sr. Unsecd. Note, 4.125%, 11/15/2020 | | | 0 | | | | 360,649 | | | | 360,649 | |
| | | | | | | | | | | | | | | | | | |
| | | | | | TOTAL | | | 0 | | | | 11,368,386 | | | | 11,368,386 | |
| | | | | | | | | | | | | | | | | | |
| | | | | | TOTAL CORPORATE BONDS (IDENTIFIED COST $284,292,004) | | | 31,681,400 | | | | 265,600,297 | | | | 297,281,697 | |
| | | | | | | | | | | | | | | | | | |
GOVERNMENT/AGENCY - 0.2% | | | | | | | | | |
Sovereign - 0.2% | | | | | | | | | | | | |
0 | | 500,000 | | 500,000 | | Sweden, Government of, 10.25%, 11/1/2015 (IDENTIFIED COST $500,000) | | | 0 | | | | 514,590 | | | | 514,590 | |
| | | | | | | | | | | | | | | | | | |
SHORT-TERM INVESTMENTS - 0.8% | | | | | | | | | |
750,000 | | 0 | | 750,000 | | Federal Home Loan Bank, 0.20%, 2/25/2011 | | | 749,897 | | | | 0 | | | | 749,897 | |
750,000 | | 0 | | 750,000 | | Federal Home Loan Mortgage Corp., 0.09%, 1/10/2011 | | | 749,981 | | | | 0 | | | | 749,981 | |
1,000,000 | | 0 | | 1,000,000 | | Federal Home Loan Mortgage Corp., 0.12%, 1/18/2011 | | | 999,939 | | | | 0 | | | | 999,939 | |
| | | | | | | | | | | | | | | | | | |
| | | | | | TOTAL GOVERNMENT AGENCIES (IDENTIFIED COST $2,499,817) | | | 2,499,817 | | | | 0 | | | | 2,499,817 | |
| | | | | | | | | | | | | | | | | | |
MORTGAGE-BACKED SECURITIES - 1.3% | | | | | | | | | |
Federal Home Loan Mortgage Corporation - 0.9% | | | | | | | | | |
| 354,916 | | 0 | | 354,916 | | Federal Home Loan Mortgage Corp., 3023 Class TG, 5.50%, 8/1/2035 | | | 356,499 | | | | 0 | | | | 356,499 | |
| 1,000,000 | | 0 | | 1,000,000 | | Federal Home Loan Mortgage Corp., 3051 Class MY, 5.50%, 10/1/2025 | | | 1,074,820 | | | | 0 | | | | 1,074,820 | |
| 223,267 | | 0 | | 223,267 | | Federal Home Loan Mortgage Corp., Pool A53146, 5.50%, 10/1/2036 | | | 238,661 | | | | 0 | | | | 238,661 | |
| 471,616 | | 0 | | 471,616 | | Federal Home Loan Mortgage Corp., Pool A69436, 6.00%, 12/1/2037 | | | 511,534 | | | | 0 | | | | 511,534 | |
| 0 | | 3,513 | | 3,513 | | Federal Home Loan Mortgage Corp., Pool C01051, 8.00%, 9/1/2030 | | | 0 | | | | 3,965 | | | | 3,965 | |
| 0 | | 3,421 | | 3,421 | | Federal Home Loan Mortgage Corp., Pool E80411, 6.50%, 4/1/2015 | | | 0 | | | | 3,679 | | | | 3,679 | |
69
| | | | | | | | | | | | | | | | | | |
| 613,665 | | 0 | | 613,665 | | Federal Home Loan Mortgage Corp., Pool G02648, 5.50%, 12/1/2036 | | | 655,975 | | | | 0 | | | | 655,975 | |
| | | | | | | | | | | | | | | | | | |
| | | | | | TOTAL | | | 2,837,489 | | | | 7,644 | | | | 2,845,133 | |
| | | | | | | | | | | | | | | | | | |
Federal National Mortgage Association - 0.4% | | | | | | | | | |
| 372,970 | | 0 | | 372,970 | | Federal National Mortgage Association, Pool 256103, 5.50%, 2/1/2026 | | | 401,346 | | | | 0 | | | | 401,346 | |
| 321,251 | | 0 | | 321,251 | | Federal National Mortgage Association, Pool 897144, 6.00%, 9/1/2036 | | | 350,226 | | | | 0 | | | | 350,226 | |
| 557,654 | | 0 | | 557,654 | | Federal National Mortgage Association, Pool 928570, 6.00%, 8/1/2037 | | | 606,907 | | | | 0 | | | | 606,907 | |
| | | | | | | | | | | | | | | | | | |
| | | | | | TOTAL | | | 1,358,479 | | | | 0 | | | | 1,358,479 | |
| | | | | | | | | | | | | | | | | | |
Government National Mortgage Association - 0.0% | | | | | | | | | |
| 0 | | 2,175 | | 2,175 | | Government National Mortgage Association, Pool 493514, 8.00%, 9/15/2030 | | | 0 | | | | 2,469 | | | | 2,469 | |
| 0 | | 6,588 | | 6,588 | | Government National Mortgage Association, Pool 516688, 8.00%, 8/15/2029 | | | 0 | | | | 7,517 | | | | 7,517 | |
| | | | | | | | | | | | | | | | | | |
| | | | | | TOTAL | | | 0 | | | | 9,986 | | | | 9,986 | |
| | | | | | | | | | | | | | | | | | |
| | | | | | TOTAL MORTGAGE-BACKED SECURITIES (IDENTIFIED COST $3,903,927) | | | 4,195,968 | | | | 17,630 | | | | 4,213,598 | |
| U.S. TREASURY - 0.3% | |
| U.S. Treasury Bill - 0.3%6 | | | | | | | | | |
| 0 | | 1,000,000 | | 1,000,000 | | (7)United State Treasury Bill, 0.065%, 1/27/2011 (IDENTIFIED COST $999,856) | | | 0 | | | | 999,947 | | | | 999,947 | |
| | | | | | | | | | | | | | | | | | |
| PREFERRED STOCK - 0.2% | |
| Financial Institution - Banking - 0.2% | | | | | | | | | |
| 32,000 | | 0 | | 32,000 | | Sovereign Capital Trust V, 7.75% (IDENTIFIED COST $800,000) | | | 811,200 | | | | 0 | | | | 811,200 | |
| | | | | | | | | | | | | | | | | | |
| MONEY MARKET MUTUAL FUND - 0.2% | |
| 639,959 | | 0 | | 639,959 | | JP Morgan U.S. Treasury Plus Money Market Fund (COST $639,959) | | | 639,959 | | | | 0 | | | | 639,959 | |
| | | | | | | | | | | | | | | | | | |
70
| | | | | | | | | | | | | | | | | | |
REPURCHASE AGREEMENT - 2.7% | |
| 0 | | 8,514,000 | | 8,514,000 | | Interest in $5,850,000,000 joint repurchase agreement 0.25%, dated 12/31/2010 under which Bank of America, N.A. will repurchase securities provided as collateral for $5,850,121,875 on 1/3/2011. The securities provided as collateral at the end of the period were U.S. Government Agency securities with various maturities to 4/15/2040 and the market value of those underlying securities was $5,972,500,657 (AT COST). | | | 0 | | | | 8,514,000 | | | | 8,514,000 | |
| | | | | | | | | | | | | | | | | | |
| | | | | | Total Investments (Identified Cost $302,149,563- 98.9%)(8) | | | 39,828,344 | | | | 275,646,464 | | | | 315,474,808 | |
| | | | | | | | | | | | | | | | | | |
| | | | | | Other Assets and Liabilities - 1.1% (9)(10) | | | 566,441 | | | | 2,960,290 | | | | 3,526,218 | |
| | | | | | | | | | | | | | | | | | |
| | | | | | Total Net Assets - 100% | | $ | 40,394,785 | | | $ | 278,606,754 | | | $ | 319,001,026 | |
| | | | | | | | | | | | | | | | | | |
Note: The categories of investments are shown as a percentage of total net assets at December 31, 2010.
At December 31, 2010, Federated Quality Bond Fund II had the following outstanding futures contracts:
| | | | | | | | | | | | | | | | |
Description | | Number of
Contracts | | | Notional
Value | | | Expiration
Date | | | Unrealized
Appreciation/
(Depreciation) | |
(4) U.S. Treasury Notes 5-Year Short Futures | | | 75 | | | $ | 8,828,906 | | | | March 2011 | | | $ | (60,514 | ) |
(4) U.S. Treasury Bonds 30-Year Short Futures | | | 320 | | | $ | 39,080,000 | | | | March 2012 | | | $ | 1,154,309 | |
| | | | | | | | | | | | | | | | |
NET UNREALIZED APPRECIATION ON FUTURES CONTRACTS | | | | | | | | | | | | | | $ | 1,093,795 | |
Net Unrealized Appreciation on Futures Contracts is included in “Other Assets and Liabilities - Net”.
| (1) | Denotes a restricted security that either: (a) cannot be offered for public sale without first being registered, or being able to take advantage of an exemption from registration, under the Securities Act of 1933; or (b) is subject to a contractual restriction on public sales. At December 31, 2010, these restricted securities amounted to $52,652,270, which represented 16.5% of total net assets of the Pro Forma Combined. |
| (2) | Denotes a restricted security that may be resold without restriction to “qualified institutional buyers” as defined in Rule 144A under the Securities Act of 1933 and that the Fund has determined to be liquid under the criteria established by the Fund’s Board of Trustees. At December 31, 2010, these liquid restricted securities amounted to $51,355,638, which represented 16.1% of total net assets of the Pro Forma Combined. |
| (3) | JPMorgan Chase & Co. has fully and unconditionally guaranteed Bear Stearns’ outstanding debt securities. |
| (4) | Non-income producing security |
71
| (6) | Discount rate at time of purchase. |
| (7) | All or a portion of this security is pledged as collateral to ensure Federated Quality Bond Fund II is able to satisfy the obligations of its outstanding futures contracts. |
| (8) | The cost of investment for federal tax purposes for the Pro Forma Combined amounts to $302,149,563. |
| (9) | Assets, other than investments in securities, less liabilities. See Statement of Assets and Liabilities. |
| (10) | Includes an adjustment of ($513) for the Pro Forma Combined for prepaid expenses which will not transfer as a result of the reorganization. |
Various inputs are used in determining the value of each funds’ investments. These inputs are summarized in the three broad levels listed below:
|
Level 1 - quoted prices in active markets for identical securities |
|
Level 2 - other significant observable inputs (including quoted prices for similar securities, interest rates, prepayment speeds, credit risks, etc.) |
|
Level 3 - significant unobservable inputs (including each fund’s own assumptions in determining the fair value of investments) |
The inputs or methodology used for valuing securities are not an indication of the risk associated with investing in those securities.
The following is a summary of the inputs used, as of December 31, 2010, in valuing each fund’s assets carried at fair value:
| | | | | | | | | | | | | | | | |
| Fund | | | | | | | | | | | | |
| | | Level 1 | | | Level 2 | | | Level 3 | | | Total | |
Strategic Yield Portfolio | | | | | | | | | | | | | | | | |
Debt Securities: | | | | | | | | | | | | | | | | |
Corporate Bonds | | $ | 0 | | | $ | 31,681,400 | | | $ | 0 | | | $ | 31,681,400 | |
Government/Agency | | | 0 | | | | 0 | | | | 0 | | | | 0 | |
Government Agencies | | | 0 | | | | 2,499,817 | | | | 0 | | | | 2,499,817 | |
Mortgage-Backed Securities | | | 0 | | | | 4,195,968 | | | | 0 | | | | 4,195,968 | |
U.S. Treasury | | | 0 | | | | 0 | | | | 0 | | | | 0 | |
Equity Securities: | | | | | | | | | | | | | | | | |
Preferred Stock | | | 811,200 | | | | 0 | | | | 0 | | | | 811,200 | |
Money Market Mutual Fund | | | 639,959 | | | | 0 | | | | 0 | | | | 639,959 | |
Repurchase Agreements | | | 0 | | | | 0 | | | | 0 | | | | 0 | |
| | | | | | | | | | | | | | | | |
TOTAL SECURITIES | | $ | 1,451,159 | | | $ | 38,377,185 | | | $ | 0 | | | $ | 39,828,344 | |
| | | | | | | | | | | | | | | | |
OTHER FINANCIAL INSTRUMENTS | | $ | 0 | | | $ | 0 | | | $ | 0 | | | $ | 0 | |
| | | | | | | | | | | | | | | | |
| | | | |
Federated Quality Bond Fund II | | | | | | | | | | | | | | | | |
Debt Securities: | | | | | | | | | | | | | | | | |
Corporate Bonds | | $ | 0 | | | $ | 265,600,297 | | | $ | 0 | | | $ | 265,600,297 | |
Government/Agency | | | 0 | | | | 514,590 | | | | 0 | | | | 514,590 | |
Government Agencies | | | 0 | | | | 0 | | | | 0 | | | | 0 | |
Mortgage-Backed Securities | | | 0 | | | | 17,630 | | | | 0 | | | | 17,630 | |
U.S. Treasury | | | 0 | | | | 999,947 | | | | 0 | | | | 999,947 | |
Equity Securities: | | | | | | | | | | | | | | | | |
Preferred Stock | | | 0 | | | | 0 | | | | 0 | | | | 0 | |
Money Market Mutual Fund | | | 0 | | | | 0 | | | | 0 | | | | 0 | |
72
| | | | | | | | | | | | | | | | |
Repurchase Agreements | | | 0 | | | | 8,514,000 | | | | 0 | | | | 8,514,000 | |
| | | | | | | | | | | | | | | | |
TOTAL SECURITIES | | $ | 0 | | | $ | 275,646,464 | | | $ | 0 | | | $ | 275,646,464 | |
| | | | | | | | | | | | | | | | |
OTHER FINANCIAL INSTRUMENTS* | | $ | 1,093,795 | | | $ | 0 | | | $ | 0 | | | $ | 1,093,795 | |
| | | | | | | | | | | | | | | | |
| | | | |
Federated Quality Bond Fund II Pro Forma Combined | | | | | | | | | | | | | | | | |
Debt Securities: | | | | | | | | | | | | | | | | |
Corporate Bonds | | $ | 0 | | | $ | 297,281,697 | | | $ | 0 | | | $ | 297,281,697 | |
Government/Agency | | | 0 | | | | 514,590 | | | | 0 | | | | 514,590 | |
Government Agencies | | | 0 | | | | 2,499,817 | | | | 0 | | | | 2,499,817 | |
Mortgage-Backed Securities | | | 0 | | | | 4,213,598 | | | | 0 | | | | 4,213,598 | |
U.S. Treasury | | | 0 | | | | 999,947 | | | | 0 | | | | 999,947 | |
Equity Securities: | | | | | | | | | | | | | | | | |
Preferred Stock | | | 811,200 | | | | 0 | | | | 0 | | | | 811,200 | |
Money Market Mutual Fund | | | 639,959 | | | | 0 | | | | 0 | | | | 639,959 | |
Repurchase Agreements | | | 0 | | | | 8,514,000 | | | | 0 | | | | 8,514,000 | |
| | | | | | | | | | | | | | | | |
TOTAL SECURITIES | | $ | 1,451,159 | | | $ | 314,023,649 | | | $ | 0 | | | $ | 315,474,808 | |
| | | | | | | | | | | | | | | | |
OTHER FINANCIAL INSTRUMENTS* | | $ | 1,093,795 | | | $ | 0 | | | $ | 0 | | | $ | 1,093,795 | |
| | | | | | | | | | | | | | | | |
| * | Other financial instruments include futures contracts. |
The following acronyms are used throughout these portfolios:
| | |
MTN | | - Medium Term Note |
REIT | | - Real Estate Investment Trust |
73
Strategic Yield Portfolio
Federated Quality Bond Fund II
Pro Forma Combining Statements of Assets & Liabilities
December 31, 2010 (unaudited)
| | | | | | | | | | | | | | | | |
| | | Strategic
Yield
Portfolio | | | Federated
Quality Bond Fund II | | | Pro Forma
Adjustment | | | Federated
Quality Bond Fund II
Proforma
Combined | |
Assets: | | | | | | | | | | | | | | | | |
Investments in securities, at value | | $ | 39,828,344 | | | $ | 275,646,464 | | | $ | 0 | | | $ | 315,474,808 | |
Cash | | | 0 | | | | 927 | | | | 0 | | | | 927 | |
Income receivable | | | 609,519 | | | | 3,553,531 | | | | 0 | | | | 4,163,050 | |
Receivable for investments sold | | | 0 | | | | 1,288 | | | | 0 | | | | 1,288 | |
Receivable for shares sold | | | 6,783 | | | | 43,684 | | | | 0 | | | | 50,467 | |
Prepaid expenses | | | 513 | | | | 0 | | | | (513 | ) (a) | | | 0 | |
| | | | | | | | | | | | | | | | |
Total assets | | | 40,445,159 | | | | 279,245,894 | | | | (513 | ) | | | 319,690,540 | |
| | | | | | | | | | | | | | | | |
Liabilities: | | | | | | | | | | | | | | | | |
Payable for shares redeemed | | | 42,027 | | | | 202,990 | | | | 0 | | | | 245,017 | |
Income distribution payable | | | 23 | | | | 0 | | | | 0 | | | | 23 | |
Payable for daily variation margin | | | 0 | | | | 383,438 | | | | 0 | | | | 383,438 | |
Accrued expenses | | | 8,324 | | | | 52,712 | | | | 0 | | | | 61,036 | |
| | | | | | | | | | | | | | | | |
Total liabilities | | | 50,374 | | | | 639,140 | | | | 0 | | | | 689,514 | |
| | | | | | | | | | | | | | | | |
Net Assets | | $ | 40,394,785 | | | $ | 278,606,754 | | | ($ | 513 | ) | | $ | 319,001,026 | |
| | | | | | | | | | | | | | | | |
Net Assets Consists of: | | | | | | | | | | | | | | | | |
Paid-in capital | | $ | 41,405,723 | | | $ | 263,396,671 | | | ($ | 513 | ) (a) | | $ | 304,801,881 | |
| | | | |
Net unrealized appreciation of investments and futures contracts | | | 1,490,268 | | | | 12,928,772 | | | | 0 | | | | 14,419,040 | |
| | | | |
Accumulated net realized loss on investments and futures contracts | | | (2,501,206 | ) | | | (11,231,190 | ) | | | 0 | | | | (13,732,396 | ) |
Undistributed net investment income | | | 0 | | | | 13,512,501 | | | | 0 | | | | 13,512,501 | |
| | | | | | | | | | | | | | | | |
Total Net Assets | | $ | 40,394,785 | | | $ | 278,606,754 | | | ($ | 513 | ) | | $ | 319,001,026 | |
| | | | | | | | | | | | | | | | |
Net Asset Value, Offering Price and Redemption Proceeds Per Share | | | | | | | | | | | | | | | | |
| | | | |
Primary Shares: | | | | | | | | | | | | | | | | |
Net Assets | | $ | 0 | | | $ | 214,644,427 | | | $ | 40,394,272 | (b) | | $ | 255,038,699 | |
| | | | | | | | | | | | | | | | |
Shares Outstanding | | | 0 | | | | 18,586,882 | | | | 3,497,340 | (b) | | | 22,084,222 | |
| | | | | | | | | | | | | | | | |
Shares Authorized | | | 0 | | | | unlimited | | | | | | | | unlimited | |
| | | | | | | | | | | | | | | | |
Net Asset Value, Offering Price and Redemption Proceeds Per Share | | | | | | $ | 11.55 | | | | | | | $ | 11.55 | |
| | | | | | | | | | | | | | | | |
74
| | | | | | | | | | | | | | | | |
Service Shares: | | | | | | | | | | | | | | | | |
Net Assets | | $ | 0 | | | $ | 63,962,327 | | | $ | 0 | | | $ | 63,962,327 | |
| | | | | | | | | | | | | | | | |
Shares Outstanding | | | 0 | | | | 5,563,655 | | | | 0 | | | | 5,563,655 | |
| | | | | | | | | | | | | | | | |
Shares Authorized | | | 0 | | | | unlimited | | | | | | | | unlimited | |
| | | | | | | | | | | | | | | | |
Net Asset Value, Offering Price and Redemption Proceeds Per Share | | | | | | $ | 11.50 | | | | | | | $ | 11.50 | |
| | | | | | | | | | | | | | | | |
Initial Class: | | | | | | | | | | | | | | | | |
Net Assets | | $ | 39,357,213 | | | $ | 0 | | | ($ | 39,357,213 | ) (b) | | $ | 0 | |
| | | | | | | | | | | | | | | | |
Shares Outstanding | | | 4,304,727 | | | | 0 | | | | (4,304,727 | ) (b) | | | 0 | |
| | | | | | | | | | | | | | | | |
Shares Authorized | | | unlimited | | | | 0 | | | | | | | | 0 | |
| | | | | | | | | | | | | | | | |
Net Asset Value, Offering Price and Redemption Proceeds Per Share | | $ | 9.14 | | | | | | | | | | | | | |
| | | | | | | | | | | | | | | | |
Service Class: | | | | | | | | | | | | | | | | |
Net Assets | | $ | 1,037,572 | | | $ | 0 | | | ($ | 1,037,572 | ) (b) | | $ | 0 | |
| | | | | | | | | | | | | | | | |
Shares Outstanding | | | 113,475 | | | | 0 | | | | (113,475 | ) (b) | | | 0 | |
| | | | | | | | | | | | | | | | |
Shares Authorized | | | unlimited | | | | 0 | | | | | | | | 0 | |
| | | | | | | | | | | | | | | | |
Net Asset Value, Offering Price and Redemption Proceeds Per Share | | $ | 9.14 | | | | | | | | | | | | | |
| | | | | | | | | | | | | | | | |
Investments, at identified cost | | $ | 38,338,076 | | | $ | 263,811,487 | | | $ | 0 | | | $ | 302,149,563 | |
| | | | | | | | | | | | | | | | |
| (a) | Adjustment for prepaid expenses which will not transfer as a result of the reorganization. |
| (b) | Adjustment to reflect share balance as a result of the combination. |
75
Strategic Yield Portfolio
Federated Quality Bond Fund II
Pro Forma Combining Statements of Operations
For the year ended December 31, 2010 (unaudited)
| | | | | | | | | | | | | | | | |
| | | Strategic
Yield
Portfolio | | | Federated
Quality Bond Fund II | | | Pro Forma
Adjustment | | | Federated
Quality Bond Fund II
Proforma
Combined | |
Investment Income: | | | | | | | | | | | | | | | | |
Dividends | | $ | 62,000 | | | $ | 0 | | | $ | 0 | | | $ | 62,000 | |
Interest | | | 2,459,280 | | | | 15,777,984 | | | | 0 | | | | 18,237,264 | |
| | | | | | | | | | | | | | | | |
Total Investment Income: | | | 2,521,280 | | | | 15,777,984 | | | | 0 | | | | 18,299,264 | |
Expenses: | | | | | | | | | | | | | | | | |
Investment adviser fee | | | 182,312 | | | | 1,780,809 | | | | 60,607 | (a) | | | 2,023,728 | |
Administrative personnel and services fee | | | 0 | | | | 231,877 | | | | 31,545 | (b) | | | 263,422 | |
Custodian fees | | | 4,586 | | | | 14,921 | | | | (4,541) | (c) | | | 14,966 | |
Transfer and dividend disbursing agent fees and expenses | | | 0 | | | | 31,681 | | | | 60 | (d) | | | 31,741 | |
Directors’/Trustees’ fees | | | 6,258 | | | | 1,562 | | | | (3,775) | (e) | | | 4,045 | |
Professional fees | | | 21,915 | | | | 0 | | | | (21,915) | (f) | | | 0 | |
Auditing fees | | | 0 | | | | 20,500 | | | | | | | | 20,500 | |
Legal fees | | | 0 | | | | 6,749 | | | | 646 | (g) | | | 7,395 | |
Portfolio accounting fees | | | 20,257 | | | | 117,053 | | | | (13,195) | (h) | | | 124,115 | |
Distribution fees | | | 2,387 | | | | 0 | | | | (2,387) | (i) | | | 0 | |
Distribution services fee - Select Shares | | | 0 | | | | 172,498 | | | | | | | | 172,498 | |
Printing and postage | | | 5,332 | | | | 24,571 | | | | 34,829 | (j) | | | 64,732 | |
Insurance premiums | | | 4,143 | | | | 4,614 | | | | (3,972) | (k) | | | 4,785 | |
Miscellaneous | | | 2,138 | | | | 3,964 | | | | (1,502) | (l) | | | 4,600 | |
| | | | | | | | | | | | | | | | |
Total Expenses | | | 249,328 | | | | 2,410,799 | | | | 76,400 | | | | 2,736,527 | |
| | | | | | | | | | | | | | | | |
Waivers and Reduction— | | | | | | | | | | | | | | | | |
Waiver of investment adviser fee | | | 0 | | | | (140,166) | | | | (39,609) | (m) | | | (179,775) | |
Waiver of administrative personnel and services fee | | | 0 | | | | (6,011) | | | | (735) | (n) | | | (6,746) | |
Fees paid indirectly for directed brokerage arrangements | | | (3) | | | | 0 | | | | 3 | (o) | | | 0 | |
| | | | | | | | | | | | | | | | |
Total Waivers and Reimbursements | | | (3) | | | | (146,177) | | | | (40,341) | | | | (186,521) | |
| | | | | | | | | | | | | | | | |
Net Expenses | | | 249,325 | | | | 2,264,622 | | | | 36,059 | | | | 2,550,006 | |
| | | | | | | | | | | | | | | | |
Net investment income | | $ | 2,271,955 | | | $ | 13,513,362 | | | ($ | 36,059) | | | $ | 15,749,258 | |
| | | | | | | | | | | | | | | | |
Realized and Unrealized Gain (Loss) on Investments and Foreign Currency Transactions: | | | | | | | | | | | | | | | | |
Net realized gain on investments | | | 27,166 | | | | 6,073,392 | | | | 0 | | | | 6,100,558 | |
Net realized loss on futures contracts | | | 0 | | | | (4,339,636) | | | | 0 | | | | (4,339,636) | |
| | | | |
Net change in unrealized appreciation (depreciation) of investments | | | 1,917,867 | | | | 9,090,458 | | | | 0 | | | | 11,008,325 | |
| | | | |
Net change in unrealized appreciation (depreciation) of futures contracts | | | 0 | | | | 27,825 | | | | 0 | | | | 27,825 | |
| | | | | | | | | | | | | | | | |
76
| | | | | | | | | | | | | | | | |
Net realized and unrealized loss on investments and foreign currency transactions | | | 1,945,033 | | | | 10,852,039 | | | | 0 | | | | 12,797,072 | |
| | | | | | | | | | | | | | | | |
Change in net assets resulting from operations | | $ | 4,216,988 | | | $ | 24,365,401 | | | ($ | 36,059 | ) | | $ | 28,546,330 | |
| | | | | | | | | | | | | | | | |
(See Notes to Pro Forma Financial Statements)
77
Strategic Yield Portfolio
Federated Quality Bond Fund II
Notes to Pro Forma Financial Statements
For the Period Ended December 31, 2010 (unaudited)
Note 1. Description of the Funds
Strategic Yield Portfolio is a portfolio of EquiTrust Variable Insurance Series Fund, which is registered under the Investment Company Act of 1940, as amended (the “Act”), as an open-end diversified management investment company. Federated Quality Bond Fund II, a series of Federated Insurance Series, is registered under the Act, as an open-end management investment company. Strategic Yield Portfolio consists of two classes of shares: Initial Class and Service Class. Federated Quality Bond Fund II consists of two classes of shares: Primary Shares and Service Shares.
Note 2. Basis of Combination
The accompanying unaudited Pro Forma Combining Portfolios of Investments, Statements of Assets and Liabilities and Statements of Operations (Pro Forma Financial Statements) reflect the accounts of Strategic Yield Portfolio and Federated Quality Bond Fund II (individually referred to as the “Fund”, or collectively as the “Funds”), for the year ended December 31, 2010. These statements have been derived from the books and records utilized in calculating daily net asset values at December 31, 2010.
The Pro Forma Financial Statements should be read in conjunction with the historical financial statements of Strategic Yield Portfolio and Federated Quality Bond Fund II, which have been incorporated by reference in the Statement of Additional Information. The Funds follow generally accepted accounting principles in the United States of America applicable to management investment companies which are disclosed in the historical financial statements.
The Pro Forma Financial Statements give effect to the proposed exchange of assets of Initial Class Shares and Service Class Shares of Strategic Yield Portfolio for Primary Shares of Federated Quality Bond Fund II. Under generally accepted accounting principles, Federated Quality Bond Fund II will be the surviving entity for accounting purposes with its historical cost of investment securities and results of operations being carried forward.
The Pro Forma Financial Statements have been adjusted to reflect the anticipated advisory fee arrangement for the surviving entity, if necessary. Certain other operating costs have also been adjusted to reflect anticipated expenses of the combined entity. Other costs which may change as a result of the reorganization are currently undeterminable.
For the year ended December 31, 2010, Strategic Yield Portfolio and Federated Quality Bond Fund II paid investment advisory fees computed at the annual rate of 0.45% and 0.60%, respectively, as a percentage of average daily net assets.
The investment advisers of Federated Insurance Funds and the EquiTrust Variable Funds or their affiliates will pay the direct expenses and all the indirect expenses of the Reorganization.
Note 3. Portfolio Valuation
In calculating its net asset value (NAV), Federated Quality Bond Fund II generally values investments as follows:
| | • | | Fixed-income securities acquired with remaining maturities greater than 60 days are fair valued using price evaluations provided by a pricing service approved by the Board of Trustees (the “Trustees”). |
| | • | | Fixed-income securities acquired with remaining maturities of 60 days or less are valued at their cost (adjusted for the accretion of any discount or amortization of any premium). |
78
| | • | | Derivative contracts listed on exchanges are valued at their reported settlement or closing price. |
| | • | | Over-the-counter (OTC) derivative contracts are fair valued using price evaluations provided by a pricing service approved by the Trustees. |
| | • | | Shares of other mutual funds are valued based upon their reported NAVs. |
If Federated Quality Bond Fund II cannot obtain a price or price evaluation from a pricing service for an investment, the Fund may attempt to value the investment based upon the mean of bid and asked quotations or fair value the investment based on price evaluations, from one or more dealers. If any price, quotation, price evaluation or other pricing source is not readily available when the NAV is calculated, the Fund uses the fair value of the investment determined in accordance with the procedures described below. There can be no assurance that the Fund could purchase or sell an investment at the price used to calculate the Fund’s NAV.
Fair Valuation and Significant Events Procedures
The Trustees of Federated Quality Bond Fund II have authorized the use of pricing services to provide evaluations of the current fair value of certain investments for purposes of calculating the NAV. Factors considered by pricing services in evaluating an investment include the yields or prices of investments of comparable quality, coupon, maturity, call rights and other potential prepayments, terms and type, reported transactions, indications as to values from dealers, and general market conditions. Some pricing services provide a single price evaluation reflecting the bid-side of the market for an investment (a “bid” evaluation). Other pricing services offer both bid evaluations and price evaluations indicative of a price between the prices bid and asked for the investment (a “mid” evaluation). The Funds normally use bid evaluations for U.S. Treasury and Agency securities, mortgage-backed securities and municipal securities. The Funds normally use mid evaluations for other types of fixed-income securities and OTC derivative contracts. In the event that market quotations and price evaluations are not available for an investment, the fair value of the investment is determined in accordance with procedures adopted by the Trustees.
The Trustees also have adopted procedures requiring an investment to be priced at its fair value whenever the Adviser determines that a significant event affecting the value of the investment has occurred between the time as of which the price of the investment would otherwise be determined and the time as of which the NAV is computed. An event is considered significant if there is both an affirmative expectation that the investment’s value will change in response to the event and a reasonable basis for quantifying the resulting change in value. Examples of significant events that may occur after the close of the principal market on which a security is traded, or after the time of a price evaluation provided by a pricing service or a dealer, include:
| | • | | With respect to securities traded in foreign markets, significant trends in U.S. equity markets or in the trading of foreign securities index futures or options contracts; |
| | • | | With respect to price evaluations of fixed-income securities determined before the close of regular trading on the NYSE, actions by the Federal Reserve Open Market Committee and other significant trends in U.S. fixed-income markets; |
| | • | | Political or other developments affecting the economy or markets in which an issuer conducts its operations or its securities are traded; and |
| | • | | Announcements concerning matters such as acquisitions, recapitalizations, litigation developments, a natural disaster affecting the issuer’s operations or regulatory changes or market developments affecting the issuer’s industry. |
The Trustees have approved the use of a pricing service to determine the fair value of equity securities traded principally in foreign markets when the Adviser determines that there has been a significant trend in the U.S. equity markets or in index futures trading. For other significant events, the Funds may seek to obtain more current quotations or price evaluations from alternative pricing sources. If a reliable alternative pricing source is not available, the Fund will determine the fair value of the investment using another method approved by the Trustees.
With respect to Strategic Yield Portfolio, the Fund values its investment securities that are traded on any national exchange at the last sale price on the day of valuation or, lacking any sales, at the mean between the closing bid and
79
asked process. Investments traded in the over-the-counter market are valued at the mean between the closing bid and asked prices or yield equivalent. In situations where market quotations are not readily available or quoted market prices are not reliable, investments are valued at fair value in accordance with the procedures adopted by the Fund’s Board of Trustees. Money market investments are valued at market value, except that obligations maturing in 60 days or less are valued using the amortized cost method, which approximates market value. Under the amortized cost method, a security is valued at its cost on the date of purchase and thereafter is adjusted to reflect a constant amortization to maturity of the difference between the principal amount due at maturity and the cost of investment to the Fund.
Note 4. Shares of Beneficial Interest
The Pro Forma Primary Shares net asset value per share assumes the issuance of 3,497,340 Primary Shares of Federated Quality Bond Fund II in exchange for 4,304,727 Initial Class Shares and 113,475 Service Class Shares of Strategic Yield Portfolio, respectively, which would have been outstanding at December 31, 2010 in connection with the proposed reorganization, assuming the two Funds had been combined as of such date.
Note 5. Federal Income Taxes
Each Fund has elected to be taxed as a “regulated investment company” under the Internal Revenue Code. After the acquisition, Federated Quality Bond Fund II intends to continue to qualify as a regulated investment company, if such qualification is in the best interests of its shareholders, by complying with the Subchapter M provision of the Internal Revenue Code and to distribute to shareholders each year substantially all of its income. Accordingly, no provision for federal income tax is necessary. Federated Quality Bond Fund II complies with the provisions of Financial Accounting Standards Board (FASB) Interpretation No. 48 (FIN 48) “Accounting for Uncertainty in Income Taxes”. As of and during the year ended December 31, 2010, the Fund did not have a liability for any uncertain tax positions. The Fund recognizes interest and penalties, if any, related to tax liabilities as income tax expense in the Statement of Operations. As of December 31, 2010, tax years 2007 through 2010 remain subject to examination by the Fund’s major tax jurisdictions, which include the United States of America and the Commonwealth of Massachusetts.
The identified cost of investments for the funds is substantially the same for both financial accounting and federal income tax purposes. The tax cost of investments will remain unchanged for the combined fund.
Note 6. Other
The preparation of financial statements in conformity with GAAP requires management to make estimates and assumptions that affect the amounts of assets, liabilities, expenses and revenue reported in the financial statements. Actual results could differ from those estimated.
Note 7. Pro Forma Adjustments
| | (a) | EquiTrust Investment Management Services, Inc. is the investment adviser for Strategic Yield Portfolio. Federated Equity Management Company of Pennsylvania is the investment adviser for Federated Quality Bond Fund II. The advisory agreement between Strategic Yield Portfolio and the Adviser provides for an annual fee equal to 0.45% of the Fund’s average daily net assets. The advisory agreement between Federated Quality Bond Fund II and the Adviser provides for an annual fee equal to 0.60% of the Fund’s average daily net assets. An adjustment to the combined investment adviser fee reflects the fee structure of Federated Quality Bond Fund II based on the combined assets of Federated Quality Bond Fund II Pro Forma Combined. |
| | (b) | Federated Administrative Services (FAS), under the Administrative Services Agreement, provides each Fund with certain administrative personnel and services necessary to operate the Fund. The fee paid to FAS is based on the average aggregate daily net assets of certain Federated funds. The administrative fee received during any fiscal year shall be at least $150,000 per portfolio and $40,000 per each additional class of Shares. Under a similar plan, FAS provides The Funds with certain administrative personnel and |
80
| | services necessary to operate each Fund. An adjustment to the combined administrative personnel and services fee reflects the fee structure of Federated Quality Bond Fund II Pro Forma Combined. |
| | (c) | Adjustment to reflect custodian fees based upon the current expense structure for Federated Quality Bond Fund II Pro Forma Combined. |
| | (d) | Adjustment to reflect transfer and dividend disbursing agent fees and expenses based upon the current expense structure for Federated Quality Bond Fund II Pro Forma Combined. |
| | (e) | Adjustment to reflect Directors/Trustees fees based upon the current expense structure for Federated Quality Bond Fund II Pro Forma Combined. |
| | (f) | Adjustment to reflect removal of professional fees since the combined expenses in this category for Strategic Yield Portfolio are disclosed separately for Federated Quality Bond Fund II Pro Forma Combined. |
| | (g) | Adjustment to reflect legal fees based upon the current expense structure for Federated Quality Bond Fund II Pro Forma Combined. |
| | (h) | Adjustment to reflect portfolio accounting fees based upon the current expense structure for Federated Quality Bond Fund II Pro Forma Combined. |
| | (i) | Adjustment to reflect removal of distribution fees for Strategic Yield Portfolio from Federated Quality Bond Fund II Pro Forma Combined since Primary Shares of Federated Quality Bond Fund II do not currently incur a distribution fee. |
| | (j) | Adjustment to reflect printing and postage costs based upon the current expense structure for Federated Quality Bond Fund II Pro Forma Combined. |
| | (k) | Adjustment to reflect insurance premiums based upon the current expense structure for Federated Quality Bond Fund II Pro Forma Combined. |
| | (l) | Adjustment to reflect miscellaneous expenses based upon the current expense structure for Federated Quality Bond Fund II Pro Forma Combined. |
| | (m) | Adjustment to reflect the voluntary waiver of investment advisory fees on the average daily net assets of Federated Quality Bond Fund II Pro Forma Combined. The adviser of Federated Quality Bond Fund II and its affiliates have voluntarily agreed to waive their fees and/or reimburse expenses so that the total annual fund operating expenses (as shown in the financial highlights) paid by the Fund’s Primary Shares (after the voluntary waivers and/or reimbursements) will not exceed 0.75% through the later of (the “Termination Date”); (a) April 30, 2011; or (b) the date of the Fund’s next effective Prospectus. While the adviser and its affiliates currently do not anticipate terminating or increasing these arrangements prior to the Termination Date, these arrangements may only be terminated or increased prior to the Termination Date with the agreement of the Fund’s Trustees. |
| | (n) | Adjustment to reflect the voluntary waiver of administrative personnel and services fee on the average daily net assets of Federated Quality Bond Fund II Pro Forma Combined. |
| | (o) | Adjustment to remove fees paid indirectly for directed broker arrangements for Strategic Yield Portfolio since Federated Quality Bond Fund II does not currently participate in these arrangements. |
81
D. Acquisition of Value Growth Portfolio by Federated Capital Appreciation Fund II
INTRODUCTION
The accompanying unaudited Pro Forma Combining Portfolios of Investments, Statements of Assets and Liabilities and Statements of Operations (“Pro Forma Financial Statements”) reflect the accounts of Value Growth Portfolio and Federated Capital Appreciation Fund II (individually referred to as the “Fund” or collectively as the “Funds”), for the period ended December 31, 2010. Value Growth Portfolio will be reorganized into Federated Capital Appreciation Fund II as of the close of business on or about [July 15], 2011. For the purposes of these Pro Forma Financial Statements, the financial information covers the period from January 1, 2010 to December 31, 2010. These statements have been derived from the books and records utilized in calculating daily net asset values at December 31, 2010.
The Pro Forma Financial Statements give effect to the proposed exchange of assets of Initial Class Shares and Service Class Shares of Value Growth Portfolio for Primary Shares of Federated Capital Appreciation Fund II. Under generally accepted accounting principles, Federated Capital Appreciation Fund II will be the surviving entity for accounting purposes with its historical cost of investment securities and results of operations being carried forward.
The Pro Forma Financial Statements have been adjusted to reflect the anticipated advisory fee arrangement for the surviving entity. Certain other operating costs have also been adjusted to reflect anticipated expenses of the combined entity. Other costs which may change as a result of the reorganization currently are undeterminable.
[Remainder of page intentionally left blank.]
82
Value Growth Portfolio
Federated Capital Appreciation Fund II
Pro Forma Combining Portfolio of Investments
December 31, 2010 (unaudited)
| | | | | | | | | | | | | | | | | | |
Value Growth Portfolio | | Federated
Capital
Appreciation
Fund II | | Federated
Capital
Appreciation
Fund II Pro Forma
Combined | | | | Value Growth
Portfolio | | | Federated
Capital
Appreciation
Fund II | | | Federated
Capital
Appreciation
Fund II Pro Forma
Combined | |
| | |
| Shares or Principal Amount | | | | Value | |
COMMON STOCKS – 98.1% | | | | | | | | | | | | | | |
Consumer Discretionary - 12.0% | | | | | | | | | | | | | | |
2,700 | | 0 | | 2,700 | | (1) AutoZone, Inc. | | $ | 735,993 | | | $ | 0 | | | $ | 735,993 | |
7,010 | | 0 | | 7,010 | | (1) Bed Bath & Beyond, Inc. | | | 344,541 | | | | 0 | | | | 344,541 | |
12,800 | | 0 | | 12,800 | | Cash America International, Inc. | | | 472,704 | | | | 0 | | | | 472,704 | |
14,065 | | 0 | | 14,065 | | Comcast Corp. - Class A | | | 309,008 | | | | 0 | | | | 309,008 | |
7,000 | | 0 | | 7,000 | | (1) DIRECTV - Class A | | | 279,510 | | | | 0 | | | | 279,510 | |
28,000 | | 0 | | 28,000 | | (1) EZCORP, Inc. | | | 759,640 | | | | 0 | | | | 759,640 | |
12,400 | | 0 | | 12,400 | | (1) FTI Consulting, Inc. | | | 462,272 | | | | 0 | | | | 462,272 | |
11,700 | | 0 | | 11,700 | | (1) GameStop Corp.- Class A | | | 267,696 | | | | 0 | | | | 267,696 | |
6,200 | | 0 | | 6,200 | | Genuine Parts Co. | | | 318,308 | | | | 0 | | | | 318,308 | |
8,966 | | 0 | | 8,966 | | (1) Helen of Troy Ltd. | | | 266,649 | | | | 0 | | | | 266,649 | |
0 | | 55,800 | | 55,800 | | Johnson Controls, Inc. | | | 0 | | | | 2,131,560 | | | | 2,131,560 | |
0 | | 30,600 | | 30,600 | | (1) Kohl’s Corp. | | | 0 | | | | 1,662,804 | | | | 1,662,804 | |
2,200 | | 24,700 | | 26,900 | | McDonald’s Corp. | | | 168,872 | | | | 1,895,972 | | | | 2,064,844 | |
0 | | 42,200 | | 42,200 | | Omnicom Group, Inc. | | | 0 | | | | 1,932,760 | | | | 1,932,760 | |
10,600 | | 0 | | 10,600 | | (1) O’Reilly Automotive, Inc. | | | 640,452 | | | | 0 | | | | 640,452 | |
0 | | 28,700 | | 28,700 | | Starwood Hotels & Resorts Worldwide, Inc. | | | 0 | | | | 1,744,386 | | | | 1,744,386 | |
8,415 | | 0 | | 8,415 | | Target Corp. | | | 505,994 | | | | 0 | | | | 505,994 | |
9,796 | | 0 | | 9,796 | | Time Warner, Inc. | | | 315,137 | | | | 0 | | | | 315,137 | |
14,735 | | 0 | | 14,735 | | Wal-Mart Stores, Inc. | | | 794,659 | | | | 0 | | | | 794,659 | |
5,245 | | 0 | | 5,245 | | Walgreen Co. | | | 204,345 | | | | 0 | | | | 204,345 | |
| | | | | | | | | | | | | | | | | | |
| | | | | | TOTAL | | | 6,845,780 | | | | 9,367,482 | | | | 16,213,262 | |
| | | | | | | | | | | | | | | | | | |
Consumer Staples - 9.6% | | | | | | | | | | | | |
0 | | 34,900 | | 34,900 | | Archer-Daniels-Midland Co. | | | 0 | | | | 1,049,792 | | | | 1,049,792 | |
6,900 | | 0 | | 6,900 | | Campbell Soup Co. | | | 239,775 | | | | 0 | | | | 239,775 | |
2,605 | | 0 | | 2,605 | | Colgate-Palmolive Co. | | | 209,364 | | | | 0 | | | | 209,364 | |
83
| | | | | | | | | | | | | | | | | | |
6,100 | | 13,835 | | 19,935 | | H.J. Heinz Co. | | | 301,706 | | | | 684,278 | | | | 985,984 | |
4,020 | | 0 | | 4,020 | | Kimberly-Clark Corp. | | | 253,421 | | | | 0 | | | | 253,421 | |
12,708 | �� | 0 | | 12,708 | | Kraft Foods, Inc. | | | 400,429 | | | | 0 | | | | 400,429 | |
0 | | 48,200 | | 48,200 | | Kroger Co. | | | 0 | | | | 1,077,752 | | | | 1,077,752 | |
0 | | 30,751 | | 30,751 | | Nestle SA | | | 0 | | | | 1,801,318 | | | | 1,801,318 | |
19,425 | | 19,500 | | 38,925 | | Procter & Gamble Co. | | | 1,249,610 | | | | 1,254,435 | | | | 2,504,045 | |
5,180 | | 0 | | 5,180 | | PepsiCo, Inc. | | | 338,409 | | | | 0 | | | | 338,409 | |
8,810 | | 0 | | 8,810 | | Philip Morris International Inc. | | | 515,649 | | | | 0 | | | | 515,649 | |
14,390 | | 0 | | 14,390 | | Sysco Corp. | | | 423,066 | | | | 0 | | | | 423,066 | |
6,870 | | 37,000 | | 43,870 | | The Coca-Cola Co. | | | 451,840 | | | | 2,433,490 | | | | 2,885,330 | |
3,700 | | 0 | | 3,700 | | The Coca-Cola FEMSA, S.A.B. de C.V. | | | 304,991 | | | | 0 | | | | 304,991 | |
| | | | | | | | | | | | | | | | | | |
| | | | | | TOTAL | | | 4,688,260 | | | | 8,301,065 | | | | 12,989,325 | |
| | | | | | | | | | | | | | | | | | |
Energy - 12.3% | | | | | | | | | | | | | | | | | | |
10,200 | | 0 | | 10,200 | | Anadarko Petroleum Corp. | | | 776,832 | | | | 0 | | | | 776,832 | |
2,600 | | 11,600 | | 14,200 | | Apache Corp. | | | 309,998 | | | | 1,383,068 | | | | 1,693,066 | |
6,200 | | 0 | | 6,200 | | Baker Hughes, Inc. | | | 354,454 | | | | 0 | | | | 354,454 | |
10,300 | | 35,470 | | 45,770 | | Chevron Corp. | | | 939,875 | | | | 3,236,638 | | | | 4,176,513 | |
10,257 | | 15,300 | | 25,557 | | ConocoPhillips | | | 698,502 | | | | 1,041,930 | | | | 1,740,432 | |
4,600 | | 0 | | 4,600 | | Devon Energy Corp. | | | 361,146 | | | | 0 | | | | 361,146 | |
4,500 | | 31,300 | | 35,800 | | Exxon Mobil Corp. | | | 329,040 | | | | 2,288,656 | | | | 2,617,696 | |
14,600 | | 0 | | 14,600 | | Helmerich & Payne, Inc. | | | 707,808 | | | | 0 | | | | 707,808 | |
4,300 | | 0 | | 4,300 | | Noble Corp. | | | 153,811 | | | | 0 | | | | 153,811 | |
6,800 | | 0 | | 6,800 | | Occidental Petroleum Corp. | | | 667,080 | | | | 0 | | | | 667,080 | |
8,800 | | 0 | | 8,800 | | (1) Rowan Companies, Inc. | | | 307,208 | | | | 0 | | | | 307,208 | |
0 | | 16,600 | | 16,600 | | Schlumberger Ltd. | | | 0 | | | | 1,386,100 | | | | 1,386,100 | |
4,600 | | 0 | | 4,600 | | (1) Transocean Ltd. | | | 319,746 | | | | 0 | | | | 319,746 | |
6,300 | | 0 | | 6,300 | | Valero Energy Corp. | | | 145,656 | | | | 0 | | | | 145,656 | |
0 | | 49,517 | | 49,517 | | (1) Weatherford International Ltd. | | | 0 | | | | 1,128,988 | | | | 1,128,988 | |
| | | | | | | | | | | | | | | | | | |
| | | | | | TOTAL | | | 6,071,156 | | | | 10,465,380 | | | | 16,536,536 | |
| | | | | | | | | | | | | | | | | | |
Financials - 14.9% | | | | | | | | | | | | | | |
4,910 | | 0 | | 4,910 | | Allstate Corp. | | | 156,531 | | | | 0 | | | | 156,531 | |
29,300 | | 0 | | 29,300 | | American Equity Investment Life Holding Co. | | | 367,715 | | | | 0 | | | | 367,715 | |
12,365 | | 0 | | 12,365 | | Arthur J. Gallagher & Co. | | | 359,574 | | | | 0 | | | | 359,574 | |
0 | | 12,900 | | 12,900 | | Avalonbay Communities, Inc. | | | 0 | | | | 1,451,895 | | | | 1,451,895 | |
16,089 | | 0 | | 16,089 | | Bank of America Corp. | | | 214,627 | | | | 0 | | | | 214,627 | |
84
| | | | | | | | | | | | | | | | | | |
7,150 | | 0 | | 7,150 | | Bank of New York Mellon Corp. | | | 215,930 | | | | 0 | | | | 215,930 | |
68,775 | | 0 | | 68,775 | | BGC Partners, Inc. - Class A | | | 571,520 | | | | 0 | | | | 571,520 | |
10,400 | | 0 | | 10,400 | | CIGNA Corp. | | | 381,264 | | | | 0 | | | | 381,264 | |
0 | | 221,800 | | 221,800 | | (1) Citigroup, Inc. | | | 0 | | | | 1,049,115 | | | | 1,049,115 | |
50,000 | | 0 | | 50,000 | | (1) CNO Financial Group, Inc. | | | 339,000 | | | | 0 | | | | 339,000 | |
0 | | 26,100 | | 26,100 | | Comerica, Inc. | | | 0 | | | | 1,102,464 | | | | 1,102,464 | |
13,610 | | 0 | | 13,610 | | EMC Insurance Group, Inc. | | | 308,130 | | | | 0 | | | | 308,130 | |
0 | | 7,200 | | 7,200 | | Goldman Sachs Group, Inc. | | | 0 | | | | 1,210,752 | | | | 1,210,752 | |
11,100 | | 0 | | 11,100 | | Hartford Financial Services Group, Inc. | | | 294,039 | | | | 0 | | | | 294,039 | |
0 | | 68,493 | | 68,493 | | Invesco Ltd. | | | 0 | | | | 1,647,941 | | | | 1,647,941 | |
9,600 | | 0 | | 9,600 | | (1) Investment Technology Group, Inc. | | | 157,152 | | | | 0 | | | | 157,152 | |
6,600 | | 43,760 | | 50,360 | | J.P. Morgan Chase & Co. | | | 279,972 | | | | 1,856,299 | | | | 2,136,271 | |
9,600 | | 0 | | 9,600 | | Kansas City Life Insurance Co. | | | 317,088 | | | | 0 | | | | 317,088 | |
11,300 | | 0 | | 11,300 | | Lincoln National Corp. | | | 314,253 | | | | 0 | | | | 314,253 | |
8,705 | | 33,700 | | 42,405 | | MetLife, Inc. | | | 386,850 | | | | 1,497,628 | | | | 1,884,478 | |
23,156 | | 0 | | 23,156 | | New York Community Bancorp, Inc. | | | 436,491 | | | | 0 | | | | 436,491 | |
6,900 | | 0 | | 6,900 | | Northern Trust Corp. | | | 382,329 | | | | 0 | | | | 382,329 | |
21,200 | | 0 | | 21,200 | | Protective Life Corp. | | | 564,768 | | | | 0 | | | | 564,768 | |
22,450 | | 0 | | 22,450 | | SEI Investments Co. | | | 534,086 | | | | 0 | | | | 534,086 | |
0 | | 20,900 | | 20,900 | | State Street Corp. | | | 0 | | | | 968,506 | | | | 968,506 | |
0 | | 29,300 | | 29,300 | | SunTrust Banks, Inc. | | | 0 | | | | 864,643 | | | | 864,643 | |
9,135 | | 55,010 | | 64,145 | | U.S. Bancorp | | | 246,371 | | | | 1,483,620 | | | | 1,729,991 | |
1,981 | | 0 | | 1,981 | | Wells Fargo & Co. | | | 61,391 | | | | 0 | | | | 61,391 | |
18,200 | | 0 | | 18,200 | | Wilshire Bancorp, Inc. | | | 138,684 | | | | 0 | | | | 138,684 | |
| | | | | | | | | | | | | | | | | | |
| | | | | | TOTAL | | | 7,027,765 | | | | 13,132,863 | | | | 20,160,628 | |
| | | | | | | | | | | | | | | | | | |
Health Care - 10.6% | | | | | | | | | | | | | | |
7,600 | | 15,400 | | 23,000 | | Abbott Laboratories | | | 364,116 | | | | 737,814 | | | | 1,101,930 | |
7,000 | | 0 | | 7,000 | | (1) Agilent Technologies, Inc. | | | 290,010 | | | | 0 | | | | 290,010 | |
0 | | 17,000 | | 17,000 | | Allergen, Inc. | | | 0 | | | | 1,167,390 | | | | 1,167,390 | |
7,625 | | 0 | | 7,625 | | (1) Amgen, Inc. | | | 418,612 | | | | 0 | | | | 418,612 | |
5,326 | | 0 | | 5,326 | | Becton, Dickinson and Co. | | | 450,154 | | | | 0 | | | | 450,154 | |
3,300 | | 0 | | 3,300 | | (1) Bio-Rad Laboratories, Inc. - Class A | | | 342,705 | | | | 0 | | | | 342,705 | |
0 | | 14,350 | | 14,350 | | (1) Celgene Corp. | | | 0 | | | | 848,659 | | | | 848,659 | |
0 | | 0 | | 0 | | Eli Lilly and Co. | | | 0 | | | | 0 | | | | — | |
85
| | | | | | | | | | | | | | | | | | |
0 | | 8,400 | | 8,400 | | (1) Hospira, Inc. | | | 0 | | | | 467,796 | | | | 467,796 | |
0 | | 26,400 | | 26,400 | | (1) Humana, Inc. | | | 0 | | | | 1,445,136 | | | | 1,445,136 | |
16,700 | | 0 | | 16,700 | | Johnson & Johnson | | | 1,032,895 | | | | 0 | | | | 1,032,895 | |
8,638 | | 37,650 | | 46,288 | | Merck & Co. | | | 311,314 | | | | 1,356,906 | | | | 1,668,220 | |
3,375 | | 0 | | 3,375 | | (1) Mettler-Toledo International, Inc. | | | 510,334 | | | | 0 | | | | 510,334 | |
10,050 | | 0 | | 10,050 | | (1) Mylan, Inc. | | | 212,356 | | | | 0 | | | | 212,356 | |
17,000 | | 0 | | 17,000 | | (1) Myriad Genetics, Inc. | | | 388,280 | | | | 0 | | | | 388,280 | |
44,486 | | 59,700 | | 104,186 | | Pfizer, Inc. | | | 778,950 | | | | 1,045,347 | | | | 1,824,297 | |
7,200 | | 0 | | 7,200 | | Quest Diagnostics, Inc. | | | 388,584 | | | | 0 | | | | 388,584 | |
0 | | 11,000 | | 11,000 | | Shire Ltd., ADR | | | 0 | | | | 796,180 | | | | 796,180 | |
4,380 | | 0 | | 4,380 | | Stryker Corp. | | | 235,206 | | | | 0 | | | | 235,206 | |
9,691 | | 0 | | 9,691 | | Teva Pharmaceutical Industries Ltd. | | | 505,192 | | | | 0 | | | | 505,192 | |
3,200 | | 0 | | 3,200 | | (1) United Therapeutics Corp. | | | 202,304 | | | | 0 | | | | 202,304 | |
| | | | | | | | | | | | | | | | | | |
| | | | | | TOTAL | | | 6,431,012 | | | | 7,865,228 | | | | 14,296,240 | |
| | | | | | | | | | | | | | | | | | |
Industrials - 10.3% | | | | | | | | | | | | | | |
5,890 | | 0 | | 5,890 | | 3M Co. | | | 508,307 | | | | 0 | | | | 508,307 | |
42,700 | | 0 | | 42,700 | | (1) BigBand Networks, Inc. | | | 119,560 | | | | 0 | | | | 119,560 | |
0 | | 15,800 | | 15,800 | | Caterpillar, Inc. | | | 0 | | | | 1,479,828 | | | | 1,479,828 | |
4,800 | | 0 | | 4,800 | | Danaher Corp. | | | 226,416 | | | | 0 | | | | 226,416 | |
13,300 | | 0 | | 13,300 | | Federal Signal Corp. | | | 91,238 | | | | 0 | | | | 91,238 | |
0 | | 15,600 | | 15,600 | | Fluor Corp. | | | 0 | | | | 1,033,656 | | | | 1,033,656 | |
0 | | 16,700 | | 16,700 | | (1) Foster Wheeler AG | | | 0 | | | | 576,484 | | | | 576,484 | |
66,480 | | 35,700 | | 102,180 | | General Electric Co. | | | 1,215,919 | | | | 652,953 | | | | 1,868,872 | |
18,835 | | 0 | | 18,835 | | Honeywell International, Inc. | | | 1,001,269 | | | | 0 | | | | 1,001,269 | |
12,580 | | 0 | | 12,580 | | Illinois Tool Works, Inc. | | | 671,772 | | | | 0 | | | | 671,772 | |
13,020 | | 0 | | 13,020 | | ITT Corp. | | | 678,472 | | | | 0 | | | | 678,472 | |
0 | | 10,600 | | 10,600 | | Joy Global, Inc. | | | 0 | | | | 919,550 | | | | 919,550 | |
12,300 | | 0 | | 12,300 | | (1) Orion Marine Group, Inc. | | | 142,680 | | | | 0 | | | | 142,680 | |
0 | | 11,800 | | 11,800 | | Precision Castparts Corp. | | | 0 | | | | 1,642,678 | | | | 1,642,678 | |
3,140 | | 0 | | 3,140 | | United Pacific Corp. | | | 290,952 | | | | 0 | | | | 290,952 | |
5,675 | | 0 | | 5,675 | | United Parcel Service, Inc. - Class B | | | 411,892 | | | | 0 | | | | 411,892 | |
0 | | 26,000 | | 26,000 | | United Technologies Corp. | | | 0 | | | | 2,046,720 | | | | 2,046,720 | |
5,300 | | 0 | | 5,300 | | Waste Management, Inc. | | | 195,411 | | | | 0 | | | | 195,411 | |
| | | | | | | | | | | | | | | | | | |
| | | | | | TOTAL | | | 5,553,888 | | | | 8,351,869 | | | | 13,905,757 | |
| | | | | | | | | | | | | | | | | | |
Information Technology - 16.7% | | | | | | | | | | | | |
86
| | | | | | | | | | | | | | | | | | |
11,700 | | 0 | | 11,700 | | (1) Adobe Systems, Inc. | | | 360,126 | | | | 0 | | | | 360,126 | |
4,160 | | 7,150 | | 11,310 | | (1) Apple, Inc. | | | 1,341,850 | | | | 2,306,304 | | | | 3,648,154 | |
0 | | 48,500 | | 48,500 | | (1) Atmel Corp. | | | 0 | | | | 597,520 | | | | 597,520 | |
6,700 | | 0 | | 6,700 | | Automatic Data Processing, Inc. | | | 310,076 | | | | 0 | | | | 310,076 | |
0 | | 30,900 | | 30,900 | | Broadcom Corp., Class A | | | 0 | | | | 1,345,694 | | | | 1,345,694 | |
46,570 | | 0 | | 46,570 | | (1) Cisco Systems, Inc. | | | 942,111 | | | | 0 | | | | 942,111 | |
13,135 | | 0 | | 13,135 | | (1) eBay, Inc. | | | 365,547 | | | | 0 | | | | 365,547 | |
62,025 | | 0 | | 62,025 | | (1) EMC Corp. | | | 1,420,373 | | | | 0 | | | | 1,420,373 | |
0 | | 1,500 | | 1,500 | | (1) Google Inc., Class A | | | 0 | | | | 890,955 | | | | 890,955 | |
5,270 | | 0 | | 5,270 | | Hewlett-Packard Co. | | | 221,867 | | | | 0 | | | | 221,867 | |
0 | | 11,600 | | 11,600 | | IBM Corp. | | | 0 | | | | 1,702,416 | | | | 1,702,416 | |
17,500 | | 0 | | 17,500 | | Intel Corp. | | | 368,025 | | | | 0 | | | | 368,025 | |
0 | | 1,450,000 | | 1,450,000 | | Lenovo Group Ltd. | | | 0 | | | | 921,196 | | | | 921,196 | |
5,900 | | 0 | | 5,900 | | (1) ManTech International Corp. - Series A | | | 243,847 | | | | 0 | | | | 243,847 | |
55,255 | | 26,400 | | 81,655 | | Microsoft Corp. | | | 1,542,720 | | | | 737,088 | | | | 2,279,808 | |
6,000 | | 0 | | 6,000 | | (1) NCI, Inc. - Class A | | | 137,940 | | | | 0 | | | | 137,940 | |
46,070 | | 60,400 | | 106,470 | | Oracle Corp. | | | 1,441,991 | | | | 1,890,520 | | | | 3,332,511 | |
4,200 | | 0 | | 4,200 | | QUALCOMM, Inc. | | | 207,858 | | | | 0 | | | | 207,858 | |
11,900 | | 0 | | 11,900 | | (1) Super Micro Computer, Inc. | | | 137,326 | | | | 0 | | | | 137,326 | |
28,002 | | 0 | | 28,002 | | (1) Symantec Corp. | | | 468,753 | | | | 0 | | | | 468,753 | |
0 | | 144,800 | | 144,800 | | Xerox Corp. | | | 0 | | | | 1,668,096 | | | | 1,668,096 | |
0 | | 33,700 | | 33,700 | | Xilinx, Inc. | | | 0 | | | | 976,626 | | | | 976,626 | |
| | | | | | | | | | | | | | | | | | |
| | | | | | TOTAL | | | 9,510,410 | | | | 13,036,415 | | | | 22,546,825 | |
| | | | | | | | | | | | | | | | | | |
Materials - 5.5% | | | | | | | | | | | | | | |
2,000 | | 14,400 | | 16,400 | | Agnico Eagle Mines Ltd. | | | 153,400 | | | | 1,104,480 | | | | 1,257,880 | |
24,946 | | 0 | | 24,946 | | Barrick Gold Corp. | | | 1,326,628 | | | | 0 | | | | 1,326,628 | |
0 | | 6,400 | | 6,400 | | CF Industries Holdings, Inc. | | | 0 | | | | 864,960 | | | | 864,960 | |
5,330 | | 0 | | 5,330 | | Dow Chemical Co. | | | 181,966 | | | | 0 | | | | 181,966 | |
16,005 | | 0 | | 16,005 | | E.I. Du Pont de Nemours and Co. | | | 798,329 | | | | 0 | | | | 798,329 | |
0 | | 4,300 | | 4,300 | | Freeport-McMoran Copper & Gold, Inc. | | | 0 | | | | 516,387 | | | | 516,387 | |
0 | | 12,600 | | 12,600 | | Mosanto Co. | | | 0 | | | | 877,464 | | | | 877,464 | |
12,000 | | 0 | | 12,000 | | Newmont Mining Corp. | | | 737,160 | | | | 0 | | | | 737,160 | |
0 | | 40,200 | | 40,200 | | (1) Stillwater Mining Co. | | | 0 | | | | 858,270 | | | | 858,270 | |
| | | | | | | | | | | | | | | | | | |
| | | | | | TOTAL | | | 3,197,483 | | | | 4,221,561 | | | | 7,419,044 | |
| | | | | | | | | | | | | | | | | | |
87
| | | | | | | | | | | | | | | | | | |
Telecommunication Services - 2.7% | | | | | | | | | | | | | | |
17,660 | | 0 | | 17,660 | | AT&T, Inc. | | | 518,851 | | | | 0 | | | | 518,851 | |
3,616 | | 81,600 | | 85,216 | | Frontier Communications Corp. | | | 35,184 | | | | 793,968 | | | | 829,152 | |
0 | | 220,000 | | 220,000 | | Qwest Communications International, Inc. | | | 0 | | | | 1,674,200 | | | | 1,674,200 | |
15,065 | | 0 | | 15,065 | | Verizon Communications, Inc. | | | 539,026 | | | | 0 | | | | 539,026 | |
| | | | | | | | | | | | | | | | | | |
| | | | | | TOTAL | | | 1,093,061 | | | | 2,468,168 | | | | 3,561,229 | |
| | | | | | | | | | | | | | | | | | |
Utilities - 2.3% | | | | | | | | | | | | | | |
11,267 | | 0 | | 11,267 | | Atmos Energy Corp. | | | 351,530 | | | | 0 | | | | 351,530 | |
28,300 | | 0 | | 28,300 | | CMS Energy Corp. | | | 526,380 | | | | 0 | | | | 526,380 | |
9,886 | | 0 | | 9,886 | | Integrys Energy Group, Inc. | | | 479,570 | | | | 0 | | | | 479,570 | |
12,335 | | 0 | | 12,335 | | Pepco Holdings, Inc. | | | 225,114 | | | | 0 | | | | 225,114 | |
9,200 | | 0 | | 9,200 | | Pinnacle West Capital Corp. | | | 381,340 | | | | 0 | | | | 381,340 | |
0 | | 29,500 | | 29,500 | | Southern Co. | | | 0 | | | | 1,129,697 | | | | 1,129,697 | |
| | | | | | | | | | | | | | | | | | |
| | | | | | TOTAL | | | 1,963,934 | | | | 1,129,697 | | | | 3,093,631 | |
| | | | | | | | | | | | | | | | | | |
Other Investment Companies and Exchange-Traded Funds - 1.2% | |
71,553 | | 0 | | 71,553 | | Adams Express Co. | | | 767,048 | | | | 0 | | | | 767,048 | |
40,386 | | 0 | | 40,386 | | H&Q Life Sciences Investors | | | 434,958 | | | | 0 | | | | 434,958 | |
6,900 | | 0 | | 6,900 | | (1) ProShares UltraShort 20+Year Treasury | | | 255,645 | | | | 0 | | | | 255,645 | |
13,200 | | 0 | | 13,200 | | Redwood Trust, Inc. | | | 197,076 | | | | 0 | | | | 197,076 | |
| | | | | | | | | | | | | | | | | | |
| | | | | | TOTAL | | | 1,654,727 | | | | 0 | | | | 1,654,727 | |
| | | | | | | | | | | | | | | | | | |
| | | | | | TOTAL COMMON STOCKS (IDENTIFIED COST $110,874,949) | | | 54,037,476 | | | | 78,339,728 | | | | 132,377,204 | |
| | | | | | | | | | | | | | | | | | |
GOVERNMENT AGENCIES - 0.7% | | | | | | | | | | | | | | |
$1,000,000 | | $0 | | $1,000,000 | | Federal Home Loan Mortgage Corp., 0.09%, 1/10/2011 | | | 999,975 | | | | 0 | | | | 999,975 | |
| | | | | | | | | | | | | | | | | | |
| | | | | | TOTAL GOVERNMENT AGENCIES (IDENTIFIED COST $999,975) | | | 999,975 | | | | 0 | | | | 999,975 | |
| | | | | | | | | | | | | | | | | | |
MONEY MARKET MUTUAL FUND - 0.2% | |
301,373 | | 0 | | 301,373 | | JP Morgan U.S. Treasury Plus Money Market Fund (COST $301,373) | | | 301,373 | | | | 0 | | | | 301,373 | |
| | | | | | | | | | | | | | | | | | |
88
| | | | | | | | | | | | | | | | | | |
REPURCHASE AGREEMENT - 0.7% | |
0 | | 926,000 | | 926,000 | | Interest in $5,850,000,000 joint repurchase agreement 0.25%, dated 12/31/2010 under which Bank of America, N.A. will repurchase securities provided as collateral for $5,850,121,875 on 1/3/2011. The securities provided as collateral at the end of the period were U.S. Government Agency securities with various maturities to 4/15/2040 and the market value of those underlying securities was $5,972,500,657 (AT COST). | | | 0 | | | | 926,000 | | | | 926,000 | |
| | | | | | | | | | | | | | | | | | |
| | | | | | Total Investments (Identified Cost $113,102,297- 99.7%)(2) | | | 55,338,824 | | | | 79,265,728 | | | | 134,604,552 | |
| | | | | | | | | | | | | | | | | | |
| | | | | | Other Assets and Liabilities - 0.3% (3)(4) | | | 20,588 | | | | 350,826 | | | | 370,758 | |
| | | | | | | | | | | | | | | | | | |
| | | | | | Total Net Assets - 100% | | $ | 55,359,412 | | | $ | 79,616,554 | | | $ | 134,975,310 | |
| | | | | | | | | | | | | | | | | | |
| Note: | The categories of investments are shown as a percentage of total net assets at December 31, 2010. |
| (1) | Non-income producing security. |
| (2) | The cost of investment for federal tax purposes for the Pro Forma Combined amounts to $114,136,277. |
| (3) | Assets, other than investments in securities, less liabilities. See Statement of Assets and Liabilities. |
| (4) | Total for Federated Capital Appreciation Fund II Pro Forma Combined includes an adjustment of ($656) for prepaid expenses which will not transfer as a result of the reorganization. |
Various inputs are used in determining the value of each funds’ investments. These inputs are summarized in the three broad levels listed below:
| | |
| | Level 1 - quoted prices in active markets for identical securities |
| |
| | Level 2 - other significant observable inputs (including quoted prices for similar securities, interest rates, prepayment speeds, credit risks, etc.) |
| |
| | Level 3 - significant unobservable inputs (including each fund’s own assumptions in determining the fair value of investments) |
The inputs or methodology used for valuing securities are not an indication of the risk associated with investing in those securities.
The following is a summary of the inputs used, as of December 31, 2010, in valuing each fund’s assets carried at fair value:
89
| | | | | | | | | | | | | | | | |
Fund | | | | | | | | | | | | | | | | |
| | | Level 1 | | | Level 2 | | | Level 3 | | | Total | |
Value Growth Portfolio | | | | | | | | | | | | | | | | |
Equity Securities: | | | | | | | | | | | | | | | | |
Common Stock | | | | | | | | | | | | | | | | |
Domestic | | $ | 54,037,476 | | | $ | 0 | | | | 0 | | | $ | 54,037,476 | |
International | | | 0 | | | | 0 | | | | 0 | | | | 0 | |
Debt Securities: | | | | | | | | | | | | | | | | |
Government Agencies | | | 0 | | | | 999,975 | | | | 0 | | | | 999,975 | |
Money Market Mutual Fund | | | 301,373 | | | | 0 | | | | 0 | | | | 301,373 | |
Repurchase Agreements | | | 0 | | | | 0 | | | | 0 | | | | 0 | |
| | | | | | | | | | | | | | | | |
TOTAL SECURITIES | | $ | 54,338,849 | | | $ | 999,975 | | | | 0 | | | $ | 55,338,824 | |
Federated Capital Appreciation Fund II | | | | | | | | | | | | | | | | |
Equity Securities: | | | | | | | | | | | | | | | | |
Common Stock | | | | | | | | | | | | | | | | |
Domestic | | $ | 68,977,041 | | | $ | 0 | | | $ | 0 | | | $ | 68,977,041 | |
International | | | 6,640,173 | | | | 2,722,514 | | | | 0 | | | | 9,362,687 | |
Debt Securities: | | | | | | | | | | | | | | | | |
Government Agencies | | | 0 | | | | 0 | | | | 0 | | | | 0 | |
Money Market Mutual Fund | | | 0 | | | | 0 | | | | 0 | | | | 0 | |
Repurchase Agreements | | | 0 | | | | 926,000 | | | | 0 | | | | 926,000 | |
| | | | | | | | | | | | | | | | |
TOTAL SECURITIES | | $ | 75,617,214 | | | $ | 3,648,514 | | | $ | 0 | | | $ | 79,265,728 | |
| | | | |
Federated Capital Appreciation Fund Pro Forma Combined | | | | | | | | | | | | | | | | |
Equity Securities: | | | | | | | | | | | | | | | | |
Common Stock | | | | | | | | | | | | | | | | |
Domestic | | $ | 123,014,517 | | | $ | 0 | | | $ | 0 | | | $ | 123,014,517 | |
International | | | 6,640,173 | | | | 2,722,514 | | | | 0 | | | | 9,362,687 | |
Debt Securities: | | | | | | | | | | | | | | | | |
Government Agencies | | | 0 | | | | 999,975 | | | | 0 | | | | 999,975 | |
Money Market Mutual Fund | | | 301,373 | | | | 0 | | | | 0 | | | | 301,373 | |
Repurchase Agreements | | | 0 | | | | 926,000 | | | | 0 | | | | 926,000 | |
| | | | | | | | | | | | | | | | |
TOTAL SECURITIES | | $ | 129,956,063 | | | $ | 4,648,489 | | | $ | 0 | | | $ | 134,604,552 | |
The following acronym is used throughout these portfolios:
| | |
| ADR | | - American Depository Receipt |
90
Value Growth Portfolio
Federated Capital Appreciation Fund II
Pro Forma Combining Statements of Assets & Liabilities
December 31, 2010 (unaudited)
| | | | | | | | | | | | | | | | |
| | | Value Growth
Portfolio | | | Federated
Capital
Appreciation
Fund II | | | Pro Forma
Adjustment | | | Federated
Capital
Appreciation
Fund II
Proforma
Combined | |
Assets: | | | | | | | | | | | | | | | | |
Investments in securities, at value | | $ | 55,338,824 | | | $ | 79,265,728 | | | $ | 0 | | | $ | 134,604,552 | |
Cash | | | 0 | | | | 571 | | | | 0 | | | | 571 | |
Income receivable | | | 66,185 | | | | 81,888 | | | | 0 | | | | 148,073 | |
Receivable for investments sold | | | 0 | | | | 982,093 | | | | 0 | | | | 982,093 | |
Receivable for shares sold | | | 11680 | | | | 969 | | | | 0 | | | | 12,649 | |
Prepaid expenses | | | 656 | | | | 0 | | | | (656 | ) (a) | | | 0 | |
| | | | | | | | | | | | | | | | |
Total assets | | | 55,417,345 | | | | 80,331,249 | | | | (656 | ) | | | 135,747,938 | |
| | | | | | | | | | | | | | | | |
Liabilities: | | | | | | | | | | | | | | | | |
Payable for investments purchased | | | 0 | | | | 624,034 | | | | 0 | | | | 624,034 | |
Payable for shares redeemed | | | 47,563 | | | | 48,079 | | | | 0 | | | | 95,642 | |
Accrued expenses | | | 10,370 | | | | 42,582 | | | | 0 | | | | 52,952 | |
| | | | | | | | | | | | | | | | |
Total liabilities | | | 57,933 | | | | 714,695 | | | | 0 | | | | 772,628 | |
| | | | | | | | | | | | | | | | |
Net Assets | | $ | 55,359,412 | | | $ | 79,616,554 | | | ($ | 656 | ) | | $ | 134,975,310 | |
| | | | | | | | | | | | | | | | |
Net Assets Consists of: | | | | | | | | | | | | | | | | |
Paid-in capital | | $ | 51,606,880 | | | $ | 130,511,782 | | | ($ | 656 | ) (a) | | $ | 182,118,006 | |
Net unrealized appreciation of investments and translation of assets and liabilities in foreign currency | | | 7,428,736 | | | | 14,075,245 | | | | 0 | | | | 21,503,981 | |
Accumulated net realized loss on investments and foreign currency transactions | | | (4,311,284 | ) | | | (65,478,160 | ) | | | 0 | | | | (69,789,444 | ) |
Undistributed net investment income | | | 635,080 | | | | 507,687 | | | | 0 | | | | 1,142,767 | |
| | | | | | | | | | | | | | | | |
Total Net Assets | | $ | 55,359,412 | | | $ | 79,616,554 | | | ($ | 656 | ) | | $ | 134,975,310 | |
| | | | | | | | | | | | | | | | |
Net Asset Value, Offering Price and Redemption Proceeds Per Share | | | | | | | | | | | | | | | | |
Primary Shares: | | | | | | | | | | | | | | | | |
Net Assets | | $ | 0 | | | $ | 72,320,344 | | | $ | 55,358,756 | (b) | | $ | 127,679,100 | |
| | | | | | | | | | | | | | | | |
Shares Outstanding | | | 0 | | | | 11,297,443 | | | | 8,649,806 | (b) | | | 19,947,249 | |
| | | | | | | | | | | | | | | | |
Shares Authorized | | | 0 | | | | unlimited | | | | | | | | unlimited | |
| | | | | | | | | | | | | | | | |
Net Asset Value, Offering Price and Redemption Proceeds Per Share | | | | | | $ | 6.40 | | | | | | | $ | 6.40 | |
| | | | | | | | | | | | | | | | |
Service Shares: | | | | | | | | | | | | | | | | |
Net Assets | | $ | 0 | | | $ | 7,296,210 | | | $ | 0 | | | $ | 7,296,210 | |
| | | | | | | | | | | | | | | | |
91
| | | | | | | | | | | | | | | | |
Shares Outstanding | | | 0 | | | | 1,139,298 | | | | 0 | | | | 1,139,298 | |
| | | | | | | | | | | | | | | | |
Shares Authorized | | | 0 | | | | unlimited | | | | | | | | unlimited | |
| | | | | | | | | | | | | | | | |
Net Asset Value, Offering Price and Redemption Proceeds
Per Share | | | | | | $ | 6.40 | | | | | | | $ | 6.40 | |
| | | | | | | | | | | | | | | | |
Initial Class: | | | | | | | | | | | | | | | | |
Net Assets | | $ | 54,636,933 | | | $ | 0 | | | ($ | 54,636,933 | ) (b) | | $ | 0 | |
| | | | | | | | | | | | | | | | |
Shares Outstanding | | | 4,001,330 | | | | 0 | | | | (4,001,330 | ) (b) | | | 0 | |
| | | | | | | | | | | | | | | | |
Shares Authorized | | | unlimited | | | | 0 | | | | | | | | 0 | |
| | | | | | | | | | | | | | | | |
Net Asset Value, Offering Price and Redemption Proceeds
Per Share | | $ | 13.65 | | | | | | | | | | | | | |
| | | | | | | | | | | | | | | | |
Service Class: | | | | | | | | | | | | | | | | |
Net Assets | | $ | 722,479 | | | $ | 0 | | | ($ | 722,479 | ) (b) | | $ | 0 | |
| | | | | | | | | | | | | | | | |
Shares Outstanding | | | 51,859 | | | | 0 | | | | (51,859 | ) (b) | | | 0 | |
| | | | | | | | | | | | | | | | |
Shares Authorized | | | unlimited | | | | 0 | | | | | | | | 0 | |
| | | | | | | | | | | | | | | | |
Net Asset Value, Offering Price and Redemption Proceeds
Per Share | | $ | 13.93 | | | | | | | | | | | | | |
| | | | | | | | | | | | | | | | |
Investments, at identified cost | | $ | 47,910,088 | | | $ | 65,192,209 | | | $ | 0 | | | $ | 113,102,297 | |
| | | | | | | | | | | | | | | | |
| (a) | Adjustment for prepaid expenses which will not transfer as a result of the reorganization. |
| (b) | Adjustment to reflect share balance as a result of the combination. |
92
Value Growth Portfolio
Federated Capital Appreciation Fund II
Pro Forma Combining Statements of Operations
For the year ended December 31, 2010 (unaudited)
| | | | | | | | | | | | | | | | |
| | | Value
Growth
Portfolio | | | Federated
Capital
Appreciation
Fund II | | | Pro Forma
Adjustment | | | Federated
Capital
Appreciation
Fund II
Proforma
Combined | |
Investment Income: | | | | | | | | | | | | | | | | |
Dividends | | $ | 948,652 | * | | $ | 1,439,966 | | | $ | 0 | | | $ | 2,388,618 | |
Interest | | | 2,775 | | | | 5,754 | | | | 0 | | | | 8,529 | |
| | | | | | | | | | | | | | | | |
Total Investment Income: | | | 951,427 | | | | 1,445,720 | | | | 0 | | | | 2,397,147 | |
Expenses: | | | | | | | | | | | | | | | | |
Investment adviser fee | | | 234,253 | | | | 664,569 | | | | 204,554 | (a) | | | 1,103,376 | |
Administrative personnel and services fee | | | 0 | | | | 190,000 | | | | 0 | | | | 190,000 | |
Custodian fees | | | 6,083 | | | | 17,115 | | | | 3,400 | (b) | | | 26,598 | |
Transfer and dividend disbursing agent fees and expenses | | | 0 | | | | 31,216 | | | | 38 | (c) | | | 31,254 | |
Directors’/Trustees’ fees | | | 7,961 | | | | 936 | | | | (5,367) | (d) | | | 3,530 | |
Professional fees | | | 25,599 | | | | 0 | | | | (25,599) | (e) | | | 0 | |
Auditing fees | | | 0 | | | | 24,548 | | | | 0 | | | | 24,548 | |
Legal fees | | | 0 | | | | 5,756 | | | | 1,603 | (f) | | | 7,359 | |
Portfolio accounting fees | | | 26,028 | | | | 63,500 | | | | (25,228) | (g) | | | 64,300 | |
Distribution fees | | | 1,525 | | | | 0 | | | | (1,525) | (h) | | | 0 | |
Distribution services fee - Select Shares | | | 0 | | | | 16,575 | | | | 0 | | | | 16,575 | |
Printing and postage | | | 6,875 | | | | 44,642 | | | | (6,517) | (i) | | | 45,000 | |
Insurance premiums | | | 5,258 | | | | 4,345 | | | | (5,183) | (j) | | | 4,420 | |
Interest expense | | | 0 | | | | 1,346 | | | | 0 | | | | 1,346 | |
Miscellaneous | | | 2,769 | | | | 2,916 | | | | (2,585) | (k) | | | 3,100 | |
| | | | | | | | | | | | | | | | |
Total Expenses | | | 316,351 | | | | 1,067,464 | | | | 137,591 | | | | 1,521,406 | |
| | | | | | | | | | | | | | | | |
Waivers and Reduction— | | | | | | | | | | | | | | | | |
Waiver of investment adviser fee | | | 0 | | | | (90,281) | | | | 90,281 | (l) | | | 0 | |
Waiver of administrative personnel and services fee | | | 0 | | | | (34,218) | | | | 576 | (m) | | | (33,642) | |
Waiver of distribution services fee - Select Shares | | | 0 | | | | (700) | | | | 0 | | | | (700) | |
Fees paid indirectly for directed brokerage arrangements | | | (4) | | | | (5,965) | | | | 0 | | | | (5,969) | |
| | | | | | | | | | | | | | | | |
Total Waivers and Reimbursements | | | (4) | | | | (131,164) | | | | 90,857 | | | | (40,311) | |
| | | | | | | | | | | | | | | | |
Net Expenses | | | 316,347 | | | | 936,300 | | | | 228,448 | | | | 1,481,095 | |
| | | | | | | | | | | | | | | | |
Net investment income | | $ | 635,080 | | | $ | 509,420 | | | ($ | 228,448) | | | $ | 916,052 | |
| | | | | | | | | | | | | | | | |
Realized and Unrealized Gain (Loss) on Investments and Foreign Currency Transactions: | | | | | | | | | | | | | | | | |
Net realized gain on investments and foreign currency transactions | | | 297,511 | | | | 7,317,586 | | | | 0 | | | | 7,615,097 | |
Net change in unrealized appreciation (depreciation) of investments and translation of assets and liabilities in foreign currency | | | 6,111,781 | | | | 1,324,437 | | | | 0 | | | | 7,436,218 | |
| | | | | | | | | | | | | | | | |
Net realized and unrealized loss on investments and foreign currency transactions | | | 6,409,292 | | | | 8,642,023 | | | | 0 | | | | 15,051,315 | |
| | | | | | | | | | | | | | | | |
Change in net assets resulting from operations | | $ | 7,044,372 | | | $ | 9,151,443 | | | ($ | 228,448) | | | $ | 15,967,367 | |
| | | | | | | | | | | | | | | | |
| * | Includes $956 of foreign tax withheld. |
(See Notes to Pro Forma Financial Statements)
93
Value Growth Portfolio
Federated Capital Appreciation Fund II
Notes to Pro Forma Financial Statements
For the Period Ended December 31, 2010 (unaudited)
Note 1. Description of the Funds
Value Growth Portfolio is a portfolio of EquiTrust Variable Insurance Series Fund, which is registered under the Investment Company Act of 1940, as amended (the “Act”), as an open-end diversified management investment company. Federated Capital Appreciation Fund II, a series of Federated Insurance Series, is registered under the Act, as an open-end management investment company. Value Growth Portfolio consists of two classes of shares: Initial Class and Service Class. Federated Capital Appreciation Fund II consists of two classes of shares: Primary Shares and Service Shares.
Note 2. Basis of Combination
The accompanying unaudited Pro Forma Combining Portfolios of Investments, Statements of Assets and Liabilities and Statements of Operations (Pro Forma Financial Statements) reflect the accounts of Value Growth Portfolio and Federated Capital Appreciation Fund II (individually referred to as the “Fund”, or collectively as the “Funds”), for the year ended December 31, 2010. These statements have been derived from the books and records utilized in calculating daily net asset values at December 31, 2010.
The Pro Forma Financial Statements should be read in conjunction with the historical financial statements of Value Growth Portfolio and Federated Capital Appreciation Fund II, which have been incorporated by reference in the Statement of Additional Information. The Funds follow generally accepted accounting principles in the United States of America applicable to management investment companies which are disclosed in the historical financial statements.
The Pro Forma Financial Statements give effect to the proposed exchange of assets of Initial Class Shares and Service Class Shares of Value Growth Portfolio for Primary Shares of Federated Capital Appreciation Fund II. Under generally accepted accounting principles, Federated Capital Appreciation Fund II will be the surviving entity for accounting purposes with its historical cost of investment securities and results of operations being carried forward.
The Pro Forma Financial Statements have been adjusted to reflect the anticipated advisory fee arrangement for the surviving entity, if necessary. Certain other operating costs have also been adjusted to reflect anticipated expenses of the combined entity. Other costs which may change as a result of the reorganization are currently undeterminable.
For the year ended December 31, 2010, Value Growth Portfolio and Federated Capital Appreciation Fund II paid investment advisory fees computed at the annual rate of 0.45% and 0.85%, respectively, as a percentage of average daily net assets.
The investment advisers of Federated Insurance Funds and the EquiTrust Variable Funds or their affiliates will pay the direct expenses and all the indirect expenses of the Reorganization.
Note 3. Portfolio Valuation
In calculating its net asset value (NAV), Federated Capital Appreciation Fund II generally values investments as follows:
| | • | | Equity securities listed on an exchange or traded through a regulated market system are valued at their last reported sale price or official closing price in their principal exchange or market. |
94
| | • | | Fixed-income securities acquired with remaining maturities greater than 60 days are fair valued using price evaluations provided by a pricing service approved by the Board of Trustees (the “Trustees”). |
| | • | | Fixed-income securities acquired with remaining maturities of 60 days or less are valued at their cost (adjusted for the accretion of any discount or amortization of any premium). |
| | • | | Derivative contracts listed on exchanges are valued at their reported settlement or closing price. |
| | • | | Over-the-counter (OTC) derivative contracts are fair valued using price evaluations provided by a pricing service approved by the Trustees. |
| | • | | Shares of other mutual funds are valued based upon their reported NAVs. |
If Federated Capital Appreciation Fund II cannot obtain a price or price evaluation from a pricing service for an investment, the Fund may attempt to value the investment based upon the mean of bid and asked quotations or fair value the investment based on price evaluations, from one or more dealers. If any price, quotation, price evaluation or other pricing source is not readily available when the NAV is calculated, the Fund uses the fair value of the investment determined in accordance with the procedures described below. There can be no assurance that the Fund could purchase or sell an investment at the price used to calculate the Fund’s NAV.
Fair Valuation and Significant Events Procedures
The Trustees of Federated Capital Appreciation Fund II have authorized the use of pricing services to provide evaluations of the current fair value of certain investments for purposes of calculating the NAV. Factors considered by pricing services in evaluating an investment include the yields or prices of investments of comparable quality, coupon, maturity, call rights and other potential prepayments, terms and type, reported transactions, indications as to values from dealers, and general market conditions. Some pricing services provide a single price evaluation reflecting the bid-side of the market for an investment (a “bid” evaluation). Other pricing services offer both bid evaluations and price evaluations indicative of a price between the prices bid and asked for the investment (a “mid” evaluation). The Funds normally use bid evaluations for U.S. Treasury and Agency securities, mortgage-backed securities and municipal securities. The Funds normally use mid evaluations for other types of fixed-income securities and OTC derivative contracts. In the event that market quotations and price evaluations are not available for an investment, the fair value of the investment is determined in accordance with procedures adopted by the Trustees.
The Trustees also have adopted procedures requiring an investment to be priced at its fair value whenever the Adviser determines that a significant event affecting the value of the investment has occurred between the time as of which the price of the investment would otherwise be determined and the time as of which the NAV is computed. An event is considered significant if there is both an affirmative expectation that the investment’s value will change in response to the event and a reasonable basis for quantifying the resulting change in value. Examples of significant events that may occur after the close of the principal market on which a security is traded, or after the time of a price evaluation provided by a pricing service or a dealer, include:
| | • | | With respect to securities traded in foreign markets, significant trends in U.S. equity markets or in the trading of foreign securities index futures or options contracts; |
| | • | | With respect to price evaluations of fixed-income securities determined before the close of regular trading on the NYSE, actions by the Federal Reserve Open Market Committee and other significant trends in U.S. fixed-income markets; |
| | • | | Political or other developments affecting the economy or markets in which an issuer conducts its operations or its securities are traded; and |
| | • | | Announcements concerning matters such as acquisitions, recapitalizations, litigation developments, a natural disaster affecting the issuer’s operations or regulatory changes or market developments affecting the issuer’s industry. |
95
The Trustees have approved the use of a pricing service to determine the fair value of equity securities traded principally in foreign markets when the Adviser determines that there has been a significant trend in the U.S. equity markets or in index futures trading. For other significant events, the Funds may seek to obtain more current quotations or price evaluations from alternative pricing sources. If a reliable alternative pricing source is not available, the Fund will determine the fair value of the investment using another method approved by the Trustees.
With respect to Value Growth Portfolio, the Fund values its investment securities that are traded on any national exchange at the last sale price on the day of valuation or, lacking any sales, at the mean between the closing bid and asked process. Investments traded in the over-the-counter market are valued at the mean between the closing bid and asked prices or yield equivalent. In situations where market quotations are not readily available or quoted market prices are not reliable, investments are valued at fair value in accordance with the procedures adopted by the Fund’s Board of Trustees. Money market investments are valued at market value, except that obligations maturing in 60 days or less are valued using the amortized cost method, which approximates market value. Under the amortized cost method, a security is valued at its cost on the date of purchase and thereafter is adjusted to reflect a constant amortization to maturity of the difference between the principal amount due at maturity and the cost of investment to the Fund.
Note 4. Shares of Beneficial Interest
The Pro Forma Primary Shares net asset value per share assumes the issuance of 8,649,806 Primary Shares of Federated Capital Appreciation Fund II in exchange for 4,001,330 Initial Class Shares and 51,859 Service Class Shares of Value Growth Portfolio, respectively, which would have been outstanding at December 31, 2010 in connection with the proposed reorganization, assuming the two Funds had been combined as of such date.
Note 5. Federal Income Taxes
Each Fund has elected to be taxed as a “regulated investment company” under the Internal Revenue Code. After the acquisition, Federated Capital Appreciation Fund II intends to continue to qualify as a regulated investment company, if such qualification is in the best interests of its shareholders, by complying with the Subchapter M provision of the Internal Revenue Code and to distribute to shareholders each year substantially all of its income. Accordingly, no provision for federal income tax is necessary. Federated Capital Appreciation Fund II complies with the provisions of Financial Accounting Standards Board (FASB) Interpretation No. 48 (FIN 48) “Accounting for Uncertainty in Income Taxes”. As of and during the year ended December 31, 2010, the Fund did not have a liability for any uncertain tax positions. The Fund recognizes interest and penalties, if any, related to tax liabilities as income tax expense in the Statement of Operations. As of December 31, 2010, tax years 2007 through 2010 remain subject to examination by the Fund’s major tax jurisdictions, which include the United States of America and the Commonwealth of Massachusetts.
Each Fund may be subject to taxes imposed by governments of countries in which it invests. Such taxes are generally based on either income or gains earned or repatriated. Each Fund accrues and applies such taxes to net investment income, net realized gains and net unrealized gains as income and/or gains are earned.
The identified cost of investments for the funds is substantially the same for both financial accounting and federal income tax purposes. The tax cost of investments will remain unchanged for the combined fund.
Note 6. Other
The preparation of financial statements in conformity with GAAP requires management to make estimates and assumptions that affect the amounts of assets, liabilities, expenses and revenue reported in the financial statements. Actual results could differ from those estimated.
Note 7. Pro Forma Adjustments
| | (a) | EquiTrust Investment Management Services, Inc. is the investment adviser for Value Growth Portfolio. Federated Equity Management Company of Pennsylvania is the investment adviser for Federated Capital |
96
| | Appreciation Fund II. The advisory agreement between Value Growth Portfolio and the Adviser provides for an annual fee equal to 0.45% of the Fund’s average daily net assets. The advisory agreement between Federated Capital Appreciation Fund II and the Adviser provides for an annual fee equal to 0.85% of the Fund’s average daily net assets. An adjustment to the combined investment adviser fee reflects the fee structure of Federated Capital Appreciation Fund II based on the combined assets of Federated Capital Appreciation Fund II Pro Forma Combined. |
| | (b) | Adjustment to reflect custodian fees based upon the current expense structure for Federated Capital Appreciation Fund II Pro Forma Combined. |
| | (c) | Adjustment to reflect transfer and dividend disbursing agent fees and expenses based upon the current expense structure for Federated Capital Appreciation Fund II Pro Forma Combined. |
| | (d) | Adjustment to reflect Directors/Trustees fees based upon the current expense structure for Federated Capital Appreciation Fund II Pro Forma Combined. |
| | (e) | Adjustment to reflect removal of professional fees since the combined expenses in this category for Value Growth Portfolio are disclosed separately for Federated Capital Appreciation Fund II Pro Forma Combined. |
| | (f) | Adjustment to reflect legal fees based upon the current expense structure for Federated Capital Appreciation Fund II Pro Forma Combined. |
| | (g) | Adjustment to reflect portfolio accounting fees based upon the current expense structure for Federated Capital Appreciation Fund II Pro Forma Combined. |
| | (h) | Adjustment to reflect removal of distribution fees for Value Growth Portfolio from Federated Capital Appreciation Fund II Pro Forma Combined since Primary Shares of Federated Capital Appreciation Fund II do not currently incur a distribution fee. |
| | (i) | Adjustment to reflect printing and postage costs based upon the current expense structure for Federated Capital Appreciation Fund II Pro Forma Combined. |
| | (j) | Adjustment to reflect insurance premiums based upon the current expense structure for Federated Capital Appreciation Fund II Pro Forma Combined. |
| | (k) | Adjustment to reflect miscellaneous expenses based upon the current expense structure for Federated Capital Appreciation Fund II Pro Forma Combined. |
| | (l) | Adjustment to reflect removal of the voluntary waiver of investment advisory fees on the average daily net assets of Federated Capital Appreciation Fund II Pro Forma Combined. The adviser of Federated Capital Appreciation Fund II and its affiliates have voluntarily agreed to waive their fees and/or reimburse expenses so that the total annual fund operating expenses (as shown in the financial highlights) paid by the Fund’s Primary Shares (after the voluntary waivers and/or reimbursements) will not exceed 1.18% through the later of (the “Termination Date”); (a) April 30, 2011; or (b) the date of the Fund’s next effective Prospectus. While the adviser and its affiliates currently do not anticipate terminating or increasing these arrangements prior to the Termination Date, these arrangements may only be terminated or increased prior to the Termination Date with the agreement of the Fund’s Trustees. Based on the combined net assets of Federated Capital Appreciation Fund II Pro Forma Combined for the period ended December 31, 2010, no voluntary waiver of investment advisory fee would be required to satisfy this arrangement. |
| | (m) | Adjustment to reflect the voluntary waiver of administrative personnel and services fee on the average daily net assets of Federated Capital Appreciation Fund II Pro Forma Combined. |
97
E. Acquisition of Blue Chip Portfolio by Federated Capital Appreciation Fund II
INTRODUCTION
The accompanying unaudited Pro Forma Combining Portfolios of Investments, Statements of Assets and Liabilities and Statements of Operations (“Pro Forma Financial Statements”) reflect the accounts of Blue Chip Portfolio and Federated Capital Appreciation Fund II (individually referred to as the “Fund” or collectively as the “Funds”), for the period ended December 31, 2010. Blue Chip Portfolio will be reorganized into Federated Capital Appreciation Fund II as of the close of business on or about [July 15], 2011. For the purposes of these Pro Forma Financial Statements, the financial information covers the period from January 1, 2010 to December 31, 2010. These statements have been derived from the books and records utilized in calculating daily net asset values at December 31, 2010.
The Pro Forma Financial Statements give effect to the proposed exchange of assets of Initial Class Shares and Service Class Shares of Blue Chip Portfolio for Primary Shares of Federated Capital Appreciation Fund II. Under generally accepted accounting principles, Federated Capital Appreciation Fund II will be the surviving entity for accounting purposes with its historical cost of investment securities and results of operations being carried forward.
The Pro Forma Financial Statements have been adjusted to reflect the anticipated advisory fee arrangement for the surviving entity. Certain other operating costs have also been adjusted to reflect anticipated expenses of the combined entity. Other costs which may change as a result of the reorganization are currently undeterminable.
[Remainder of page intentionally left blank.]
98
Blue Chip Portfolio
Federated Capital Appreciation Fund II
Pro Forma Combining Portfolio of Investments
December 31, 2010 (unaudited)
| | | | | | | | | | | | | | | | | | |
Blue Chip Portfolio | | Federated
Capital
Appreciation
Fund II | | Federated
Capital
Appreciation
Fund II Pro Forma
Combined | | | | Blue Chip
Portfolio | | | Federated
Capital
Appreciation
Fund II | | | Federated
Capital
Appreciation
Fund II Pro Forma
Combined | |
| | |
Shares or Principal Amount | | | | | Value | |
COMMON STOCKS – 96.4% | | | | | | | | | | | | | | |
Consumer Discretionary - 11.8% | | | | | | | | | | | | |
33,054 | | 0 | | 33,054 | | Comcast Corp. - Class A | | $ | 726,196 | | | $ | 0 | | | $ | 726,196 | |
0 | | 55,800 | | 55,800 | | Johnson Controls, Inc. | | | 0 | | | | 2,131,560 | | | | 2,131,560 | |
0 | | 30,600 | | 30,600 | | (1) Kohl’s Corp. | | | 0 | | | | 1,662,804 | | | | 1,662,804 | |
44,467 | | 24,700 | | 69,167 | | McDonald’s Corp. | | | 3,413,287 | | | | 1,895,972 | | | | 5,309,259 | |
0 | | 42,200 | | 42,200 | | Omnicom Group, Inc. | | | 0 | | | | 1,932,760 | | | | 1,932,760 | |
0 | | 28,700 | | 28,700 | | Starwood Hotels & Resorts Worldwide, Inc. | | | 0 | | | | 1,744,386 | | | | 1,744,386 | |
11,900 | | 0 | | 11,900 | | Target Corp. | | | 715,547 | | | | 0 | | | | 715,547 | |
16,497 | | 0 | | 16,497 | | Time Warner, Inc. | | | 530,709 | | | | 0 | | | | 530,709 | |
41,773 | | 0 | | 41,773 | | Wal-Mart Stores, Inc. | | | 2,252,818 | | | | 0 | | | | 2,252,818 | |
36,092 | | 0 | | 36,092 | | Walt Disney Co. | | | 1,353,811 | | | | 0 | | | | 1,353,811 | |
| | | | | | | | | | | | | | | | | | |
| | | | | | TOTAL | | | 8,992,368 | | | | 9,367,482 | | | | 18,359,850 | |
| | | | | | | | | | | | | | | | | | |
| | | | |
Consumer Staples - 11.3% | | | | | | | | | | | | | | |
| | | | | | |
38,185 | | 0 | | 38,185 | | Altria Group, Inc. | | | 940,115 | | | | 0 | | | | 940,115 | |
0 | | 34,900 | | 34,900 | | Archer-Daniels-Midland Co. | | | 0 | | | | 1,049,792 | | | | 1,049,792 | |
6,950 | | 0 | | 6,950 | | Colgate-Palmolive Co. | | | 558,572 | | | | 0 | | | | 558,572 | |
0 | | 13,835 | | 13,835 | | H.J. Heinz Co. | | | 0 | | | | 684,278 | | | | 684,278 | |
26,424 | | 0 | | 26,424 | | Kraft Foods, Inc. | | | 832,620 | | | | 0 | | | | 832,620 | |
0 | | 48,200 | | 48,200 | | Kroger Co. | | | 0 | | | | 1,077,752 | | | | 1,077,752 | |
0 | | 30,751 | | 30,751 | | Nestle SA | | | 0 | | | | 1,801,318 | | | | 1,801,318 | |
37,642 | | 19,500 | | 57,142 | | Procter & Gamble Co. | | | 2,421,510 | | | | 1,254,435 | | | | 3,675,945 | |
15,208 | | 0 | | 15,208 | | PepsiCo, Inc. | | | 993,539 | | | | 0 | | | | 993,539 | |
24,085 | | 0 | | 24,085 | | Philip Morris International Inc. | | | 1,409,695 | | | | 0 | | | | 1,409,695 | |
31,034 | | 37,000 | | 68,034 | | The Coca-Cola Co. | | | 2,041,106 | | | | 2,433,490 | | | | 4,474,596 | |
| | | | | | | | | | | | | | | | | | |
| | | | | | TOTAL | | | 9,197,157 | | | | 8,301,065 | | | | 17,498,222 | |
| | | | | | | | | | | | | | | | | | |
99
| | | | | | | | | | | | | | | | | | |
Energy - 12.3% | | | | | | | | | | | | | | | | |
0 | | 11,600 | | 11,600 | | Apache Corp. | | | 0 | | | | 1,383,068 | | | | 1,383,068 | |
38,610 | | 35,470 | | 74,080 | | Chevron Corp. | | | 3,523,163 | | | | 3,236,638 | | | | 6,759,801 | |
0 | | 15,300 | | 15,300 | | ConocoPhillips | | | 0 | | | | 1,041,930 | | | | 1,041,930 | |
69,936 | | 31,300 | | 101,236 | | Exxon Mobil Corp. | | | 5,113,720 | | | | 2,288,656 | | | | 7,402,376 | |
0 | | 16,600 | | 16,600 | | Schlumberger Ltd. | | | 0 | | | | 1,386,100 | | | | 1,386,100 | |
0 | | 49,517 | | 49,517 | | (1) Weatherford International Ltd. | | | 0 | | | | 1,128,988 | | | | 1,128,988 | |
| | | | | | | | | | | | | | | | | | |
| | | | | | TOTAL | | | 8,636,883 | | | | 10,465,380 | | | | 19,102,263 | |
| | | | | | | | | | | | | | | | | | |
Financials - 13.2% | |
54,692 | | 0 | | 54,692 | | American Express Co. | | | 2,347,381 | | | | 0 | | | | 2,347,381 | |
10,349 | | 0 | | 10,349 | | Ameriprise Financial, Inc. | | | 595,585 | | | | 0 | | | | 595,585 | |
0 | | 12,900 | | 12,900 | | Avalonbay Communities, Inc. | | | 0 | | | | 1,451,895 | | | | 1,451,895 | |
45,666 | | 0 | | 45,666 | | Bank of America Corp. | | | 609,184 | | | | 0 | | | | 609,184 | |
48,341 | | 221,800 | | 270,141 | | (1) Citigroup, Inc. | | | 228,653 | | | | 1,049,115 | | | | 1,277,768 | |
0 | | 26,100 | | 26,100 | | Comerica, Inc. | | | 0 | | | | 1,102,464 | | | | 1,102,464 | |
0 | | 7,200 | | 7,200 | | Goldman Sachs Group, Inc. | | | 0 | | | | 1,210,752 | | | | 1,210,752 | |
0 | | 68,493 | | 68,493 | | Invesco Ltd. | | | 0 | | | | 1,647,941 | | | | 1,647,941 | |
46,325 | | 43,760 | | 90,085 | | J.P. Morgan Chase & Co. | | | 1,965,107 | | | | 1,856,299 | | | | 3,821,406 | |
0 | | 33,700 | | 33,700 | | MetLife, Inc. | | | 0 | | | | 1,497,628 | | | | 1,497,628 | |
0 | | 20,900 | | 20,900 | | State Street Corp. | | | 0 | | | | 968,506 | | | | 968,506 | |
0 | | 29,300 | | 29,300 | | SunTrust Banks, Inc. | | | 0 | | | | 864,643 | | | | 864,643 | |
0 | | 55,010 | | 55,010 | | U.S. Bancorp | | | 0 | | | | 1,483,620 | | | | 1,483,620 | |
44,074 | | 0 | | 44,074 | | Wells Fargo & Co. | | | 1,365,853 | | | | 0 | | | | 1,365,853 | |
15,320 | | 0 | | 15,320 | | Weyerhaeuser Co. | | | 290,008 | | | | 0 | | | | 290,008 | |
| | | | | | | | | | | | | | | | | | |
| | | | | | TOTAL | | | 7,401,771 | | | | 13,132,863 | | | | 20,534,634 | |
| | | | | | | | | | | | | | | | | | |
Health Care - 10.5% | | | | | | | | | | | | |
24,755 | | 15,400 | | 40,155 | | Abbott Laboratories | | | 1,186,012 | | | | 737,814 | | | | 1,923,826 | |
0 | | 17,000 | | 17,000 | | Allergen, Inc. | | | 0 | | | | 1,167,390 | | | | 1,167,390 | |
17,835 | | 0 | | 17,835 | | (1) Amgen, Inc. | | | 979,142 | | | | 0 | | | | 979,142 | |
41,053 | | 0 | | 41,053 | | Bristol-Myers Squibb Co. | | | 1,087,083 | | | | 0 | | | | 1,087,083 | |
0 | | 14,350 | | 14,350 | | (1) Celgene Corp. | | | 0 | | | | 848,659 | | | | 848,659 | |
17,662 | | 0 | | 17,662 | | Eli Lilly and Co. | | | 618,876 | | | | 0 | | | | 618,876 | |
0 | | 8,400 | | 8,400 | | (1) Hospira, Inc. | | | 0 | | | | 467,796 | | | | 467,796 | |
0 | | 26,400 | | 26,400 | | (1) Humana, Inc. | | | 0 | | | | 1,445,136 | | | | 1,445,136 | |
42,710 | | 0 | | 42,710 | | Johnson & Johnson | | | 2,641,614 | | | | 0 | | | | 2,641,614 | |
31,708 | | 37,650 | | 69,358 | | Merck & Co. | | | 1,142,756 | | | | 1,356,906 | | | | 2,499,662 | |
100
| | | | | | | | | | | | | | | | | | |
44,377 | | 59,700 | | 104,077 | | Pfizer, Inc. | | | 777,041 | | | | 1,045,347 | | | | 1,822,388 | |
0 | | 11,000 | | 11,000 | | Shire Ltd., ADR | | | 0 | | | | 796,180 | | | | 796,180 | |
| | | | | | | | | | | | | | | | | | |
| | | | | | TOTAL | | | 8,432,524 | | | | 7,865,228 | | | | 16,297,752 | |
| | | | | | | | | | | | | | | | | | |
Industrials - 11.4% | | | | | | | | | | | | |
17,453 | | 0 | | 17,453 | | 3M Co. | | | 1,506,194 | | | | 0 | | | | 1,506,194 | |
26,912 | | 0 | | 26,912 | | Boeing Co. | | | 1,756,277 | | | | 0 | | | | 1,756,277 | |
21,144 | | 15,800 | | 36,944 | | Caterpillar, Inc. | | | 1,980,347 | | | | 1,479,828 | | | | 3,460,175 | |
0 | | 15,600 | | 15,600 | | Fluor Corp. | | | 0 | | | | 1,033,656 | | | | 1,033,656 | |
0 | | 16,700 | | 16,700 | | (1) Foster Wheeler AG | | | 0 | | | | 576,484 | | | | 576,484 | |
84,256 | | 35,700 | | 119,956 | | General Electric Co. | | | 1,541,042 | | | | 652,953 | | | | 2,193,995 | |
20,054 | | 0 | | 20,054 | | Honeywell International, Inc. | | | 1,066,071 | | | | 0 | | | | 1,066,071 | |
0 | | 10,600 | | 10,600 | | Joy Global, Inc. | | | 0 | | | | 919,550 | | | | 919,550 | |
0 | | 11,800 | | 11,800 | | Precision Castparts Corp. | | | 0 | | | | 1,642,678 | | | | 1,642,678 | |
20,007 | | 26,000 | | 46,007 | | United Technologies Corp. | | | 1,574,951 | | | | 2,046,720 | | | | 3,621,671 | |
| | | | | | | | | | | | | | | | | | |
| | | | | | TOTAL | | | 9,424,882 | | | | 8,351,869 | | | | 17,776,751 | |
| | | | | | | | | | | | | | | | | | |
Information Technology - 17.1% | | | | | | | | | | | | |
0 | | 7,150 | | 7,150 | | (1) Apple, Inc. | | | 0 | | | | 2,306,304 | | | | 2,306,304 | |
23,520 | | 0 | | 23,520 | | Applied Materials, Inc. | | | 330,456 | | | | 0 | | | | 330,456 | |
0 | | 48,500 | | 48,500 | | (1) Atmel Corp. | | | 0 | | | | 597,520 | | | | 597,520 | |
61,023 | | 30,900 | | 91,923 | | (1) Cisco Systems, Inc. | | | 1,234,495 | | | | 1,345,694 | | | | 2,580,189 | |
30,585 | | 0 | | 30,585 | | (1) Dell, Inc. | | | 414,427 | | | | 0 | | | | 414,427 | |
37,308 | | 0 | | 37,308 | | (1) EMC Corp. | | | 854,353 | | | | 0 | | | | 854,353 | |
0 | | 1,500 | | 1,500 | | (1) Google Inc., Class A | | | 0 | | | | 890,955 | | | | 890,955 | |
40,454 | | 0 | | 40,454 | | Hewlett-Packard Co. | | | 1,703,113 | | | | 0 | | | | 1,703,113 | |
14,526 | | 11,600 | | 26,126 | | IBM Corp. | | | 2,131,836 | | | | 1,702,416 | | | | 3,834,252 | |
57,041 | | 0 | | 57,041 | | Intel Corp. | | | 1,199,572 | | | | 0 | | | | 1,199,572 | |
0 | | 1,450,000 | | 1,450,000 | | Lenovo Group Ltd. | | | 0 | | | | 921,196 | | | | 921,196 | |
91,883 | | 26,400 | | 118,283 | | Microsoft Corp. | | | 2,565,373 | | | | 737,088 | | | | 3,302,461 | |
37,189 | | 0 | | 37,189 | | (1) Motorola, Inc. | | | 337,304 | | | | 0 | | | | 337,304 | |
57,149 | | 60,400 | | 117,549 | | Oracle Corp. | | | 1,788,764 | | | | 1,890,520 | | | | 3,679,284 | |
26,461 | | 0 | | 26,461 | | Texas Instruments, Inc. | | | 859,983 | | | | 0 | | | | 859,983 | |
0 | | 144,800 | | 144,800 | | Xerox Corp. | | | 0 | | | | 1,668,096 | | | | 1,668,096 | |
0 | | 33,700 | | 33,700 | | Xilinx, Inc. | | | 0 | | | | 976,626 | | | | 976,626 | |
| | | | | | | | | | | | | | | | | | |
| | | | | | TOTAL | | | 13,419,676 | | | | 13,036,415 | | | | 26,456,091 | |
| | | | | | | | | | | | | | | | | | |
101
| | | | | | | | | | | | | | | | | | |
Materials - 3.8% | | | | | | | | | | | | | | | | |
0 | | 14,400 | | 14,400 | | Agnico Eagle Mines Ltd. | | | 0 | | | | 1,104,480 | | | | 1,104,480 | |
30,278 | | 0 | | 30,278 | | Alcoa, Inc. | | | 465,978 | | | | 0 | | | | 465,978 | |
0 | | 6,400 | | 6,400 | | CF Industries Holdings, Inc. | | | 0 | | | | 864,960 | | | | 864,960 | |
10,505 | | 0 | | 10,505 | | Dow Chemical Co. | | | 358,641 | | | | 0 | | | | 358,641 | |
15,756 | | 0 | | 15,756 | | E.I. Du Pont de Nemours and Co. | | | 785,909 | | | | 0 | | | | 785,909 | |
0 | | 4,300 | | 4,300 | | Freeport-McMoran Copper & Gold, Inc. | | | 0 | | | | 516,387 | | | | 516,387 | |
0 | | 12,600 | | 12,600 | | Mosanto Co. | | | 0 | | | | 877,464 | | | | 877,464 | |
0 | | 40,200 | | 40,200 | | (1) Stillwater Mining Co. | | | 0 | | | | 858,270 | | | | 858,270 | |
| | | | | | | | | | | | | | | | | | |
| | | | | | TOTAL | | | 1,610,528 | | | | 4,221,561 | | | | 5,832,089 | |
| | | | | | | | | | | | | | | | | | |
Telecommunication Services - 3.1% | | | | | | | | | | | | |
34,855 | | 0 | | 34,855 | | AT&T, Inc. | | | 1,024,040 | | | | 0 | | | | 1,024,040 | |
0 | | 81,600 | | 81,600 | | Frontier Communications Corp. | | | 0 | | | | 793,968 | | | | 793,968 | |
0 | | 220,000 | | 220,000 | | Qwest Communications International, Inc. | | | 0 | | | | 1,674,200 | | | | 1,674,200 | |
36,562 | | 0 | | 36,562 | | Verizon Communications, Inc. | | | 1,308,188 | | | | 0 | | | | 1,308,188 | |
| | | | | | | | | | | | | | | | | | |
| | | | | | TOTAL | | | 2,332,228 | | | | 2,468,168 | | | | 4,800,396 | |
| | | | | | | | | | | | | | | | | | |
Utilities - 1.9% | | | | | | | | | | | | | | |
24,105 | | 0 | | 24,105 | | Exelon Corp. | | | 1,003,732 | | | | 0 | | | | 1,003,732 | |
21,215 | | 29,500 | | 50,715 | | Southern Co. | | | 811,049 | | | | 1,129,697 | | | | 1,940,746 | |
| | | | | | | | | | | | | | | | | | |
| | | | | | TOTAL | | | 1,814,781 | | | | 1,129,697 | | | | 2,944,478 | |
| | | | | | | | | | | | | | | | | | |
| | | | | | TOTAL COMMON STOCKS (IDENTIFIED COST $120,902,169) | | | 71,262,798 | | | | 78,339,728 | | | | 149,602,526 | |
| | | | | | | | | | | | | | | | | | |
GOVERNMENT AGENCIES - 2.4% | | | | | | | | | | | | |
$1,000,000 | | $0 | | $1,000,000 | | Federal Home Loan Bank, 0.10%, 1/21/2011 | | | 999,939 | | | | 0 | | | | 999,939 | |
500,000 | | 0 | | 500,000 | | Federal Home Loan Bank, 0.12%, 1/28/2011 | | | 499,955 | | | | 0 | | | | 499,955 | |
788,000 | | 0 | | 788,000 | | Federal Home Loan Bank, 0.001%, 2/11/2011 | | | 787,910 | | | | 0 | | | | 787,910 | |
750,000 | | 0 | | 750,000 | | Federal Home Loan Mortgage Corp., 0.09%, 1/10/2011 | | | 749,981 | | | | 0 | | | | 749,981 | |
750,000 | | 0 | | 750,000 | | Federal National Mortgage Assoc., 0.15%, 2/15/2011 | | | 749,888 | | | | 0 | | | | 749,888 | |
| | | | | | | | | | | | | | | | | | |
| | | | | | TOTAL GOVERNMENT AGENCIES (IDENTIFIED COST $3,787,673) | | | 3,787,673 | | | | 0 | | | | 3,787,673 | |
| | | | | | | | | | | | | | | | | | |
MONEY MARKET MUTUAL FUND - 0.3% | | | | | | | | | | | | |
426,567 | | 0 | | 426,567 | | JP Morgan U.S. Treasury Plus Money Market Fund (IDENTIFIED COST $426,567) | | | 426,567 | | | | 0 | | | | 426,567 | |
| | | | | | | | | | | | | | | | | | |
102
| | | | | | | | | | | | | | | | | | |
REPURCHASE AGREEMENT - 0.6% | | | | | | | | | | | | |
0 | | 926,000 | | 926,000 | | Interest in $5,850,000,000 joint repurchase agreement 0.25%, dated 12/31/2010 under which Bank of America, N.A. will repurchase securities provided as collateral for $5,850,121,875 on 1/3/2011. The securities provided as collateral at the end of the period were U.S. Government Agency securities with various maturities to 4/15/2040 and the market value of those underlying securities was $5,972,500,657 (AT COST). | | | 0 | | | | 926,000 | | | | 926,000 | |
| | | | | | | | | | | | | | | | | | |
| | | | | | Total Investments (Identified Cost $126,042,409- 99.7%)(2) | | | 75,477,038 | | | | 79,265,728 | | | | 154,742,766 | |
| | | | | | | | | | | | | | | | | | |
| | | | | | Other Assets and Liabilities - 0.3% (3)(4) | | | 38,162 | | | | 350,826 | | | | 388,092 | |
| | | | | | | | | | | | | | | | | | |
| | | | | | Total Net Assets - 100% | | $ | 75,515,200 | | | $ | 79,616,554 | | | $ | 155,130,858 | |
| | | | | | | | | | | | | | | | | | |
Note: The categories of investments are shown as a percentage of total net assets at December 31, 2010.
| (1) | Non-income producing security. |
| (2) | The cost of investment for federal tax purposes for the Pro Forma Combined amounts to $127,035,037. |
| (3) | Assets, other than investments in securities, less liabilities. See Statement of Assets and Liabilities. |
| (4) | Total for Federated Capital Appreciation Fund II Pro Forma Combined includes an adjustment of ($896) for prepaid expenses which will not transfer as a result of the reorganization. |
Various inputs are used in determining the value of each funds’ investments. These inputs are summarized in the three broad levels listed below:
| | |
| | Level 1 - quoted prices in active markets for identical securities |
| |
| | Level 2 - other significant observable inputs (including quoted prices for similar securities, interest rates, prepayment speeds, credit risks, etc.) |
| |
| | Level 3 - significant unobservable inputs (including each fund’s own assumptions in determining the fair value of investments) |
The inputs or methodology used for valuing securities are not an indication of the risk associated with investing in those securities.
The following is a summary of the inputs used, as of December 31, 2010, in valuing each fund’s assets carried at fair value:
103
| | | | | | | | | | | | | | | | |
| Fund | | Valuation Inputs | |
| | | Level 1 | | | Level 2 | | | Level 3 | | | Total | |
Blue Chip Portfolio | | | | | | | | | | | | | | | | |
Equity Securities: | | | | | | | | | | | | | | | | |
Common Stock | | | | | | | | | | | | | | | | |
Domestic | | $ | 71,262,798 | | | $ | 0 | | | | 0 | | | $ | 71,262,798 | |
International | | | 0 | | | | 0 | | | | 0 | | | | 0 | |
Debt Securities: | | | | | | | | | | | | | | | | |
Government Agencies | | | 0 | | | | 3,787,673 | | | | 0 | | | | 3,787,673 | |
Money Market Mutual Fund | | | 426,567 | | | | 0 | | | | 0 | | | | 426,567 | |
Repurchase Agreements | | | 0 | | | | 0 | | | | 0 | | | | 0 | |
| | | | | | | | | | | | | | | | |
TOTAL SECURITIES | | $ | 71,689,365 | | | $ | 3,787,673 | | | | 0 | | | $ | 75,477,038 | |
Federated Capital Appreciation Fund II | | | | | | | | | | | | | | | | |
Equity Securities: | | | | | | | | | | | | | | | | |
Common Stock | | | | | | | | | | | | | | | | |
Domestic | | $ | 68,977,041 | | | $ | 0 | | | $ | 0 | | | $ | 68,977,041 | |
International | | | 6,640,173 | | | | 2,722,514 | | | | 0 | | | | 9,362,687 | |
Debt Securities: | | | | | | | | | | | | | | | | |
Government Agencies | | | 0 | | | | 0 | | | | 0 | | | | 0 | |
Money Market Mutual Fund | | | 0 | | | | 0 | | | | 0 | | | | 0 | |
Repurchase Agreements | | | 0 | | | | 926,000 | | | | 0 | | | | 926,000 | |
| | | | | | | | | | | | | | | | |
TOTAL SECURITIES | | $ | 75,617,214 | | | $ | 3,648,514 | | | $ | 0 | | | $ | 79,265,728 | |
Federated Capital Appreciation Fund Pro Forma Combined | | | | | | | | | | | | | | | | |
Equity Securities: | | | | | | | | | | | | | | | | |
Common Stock | | | | | | | | | | | | | | | | |
Domestic | | $ | 140,239,839 | | | $ | 0 | | | $ | 0 | | | $ | 140,239,839 | |
International | | | 6,640,173 | | | | 2,722,514 | | | | 0 | | | | 9,362,687 | |
Debt Securities: | | | 0 | | | | 0 | | | | | | | | | |
Government Agencies | | | 0 | | | | 3,787,673 | | | | 0 | | | | 3,787,673 | |
Money Market Mutual Fund | | | 426,567 | | | | 0 | | | | 0 | | | | 426,567 | |
Repurchase Agreements | | | 0 | | | | 926,000 | | | | 0 | | | | 926,000 | |
| | | | | | | | | | | | | | | | |
TOTAL SECURITIES | | $ | 147,306,579 | | | $ | 7,436,187 | | | $ | 0 | | | $ | 154,742,766 | |
The following acronym is used throughout these portfolios:
| | |
ADR | | -American Depository Receipt |
104
Blue Chip Portfolio
Federated Capital Appreciation Fund II
Pro Forma Combining Statements of Assets & Liabilities
December 31, 2010 (unaudited)
| | | | | | | | | | | | | | | | |
| | | Blue Chip Portfolio | | | Federated
Capital
Appreciation
Fund II | | | Pro Forma
Adjustment | | | Federated Capital
Appreciation
Fund II
Proforma
Combined | |
Assets: | | | | | | | | | | | | | | | | |
Investments in securities, at value | | $ | 75,477,038 | | | $ | 79,265,728 | | | $ | 0 | | | $ | 154,742,766 | |
Cash | | | 0 | | | | 571 | | | | 0 | | | | 571 | |
Income receivable | | | 97,383 | | | | 81,888 | | | | 0 | | | | 179,271 | |
Receivable for investments sold | | | 0 | | | | 982,093 | | | | 0 | | | | 982,093 | |
Receivable for shares sold | | | 18791 | | | | 969 | | | | 0 | | | | 19,760 | |
Prepaid expenses | | | 896 | | | | 0 | | | | (896 | ) (a) | | | 0 | |
| | | | | | | | | | | | | | | | |
Total assets | | | 75,594,108 | | | | 80,331,249 | | | | (896 | ) | | | 155,924,461 | |
| | | | | | | | | | | | | | | | |
Liabilities: | | | | | | | | | | | | | | | | |
Payable for investments purchased | | | 0 | | | | 624,034 | | | | 0 | | | | 624,034 | |
Payable for shares redeemed | | | 66,619 | | | | 48,079 | | | | 0 | | | | 114,698 | |
Accrued expenses | | | 12,289 | | | | 42,582 | | | | 0 | | | | 54,871 | |
| | | | | | | | | | | | | | | | |
Total liabilities | | | 78,908 | | | | 714,695 | | | | 0 | | | | 793,603 | |
| | | | | | | | | | | | | | | | |
Net Assets | | $ | 75,515,200 | | | $ | 79,616,554 | | | ($ | 896 | ) | | $ | 155,130,858 | |
| | | | | | | | | | | | | | | | |
Net Assets Consists of: | | | | | | | | | | | | | | | | |
Paid-in capital | | $ | 64,451,417 | | | $ | 130,511,782 | | | ($ | 896 | ) (a) | | $ | 194,962,303 | |
Net unrealized appreciation of investments and translation of assets and liabilities in foreign currency | | | 14,626,838 | | | | 14,075,245 | | | | 0 | | | | 28,702,083 | |
Accumulated net realized loss on investments and foreign currency transactions | | | (5,277,756 | ) | | | (65,478,160 | ) | | | 0 | | | | (70,755,916 | ) |
Undistributed net investment income | | | 1,714,701 | | | | 507,687 | | | | 0 | | | | 2,222,388 | |
| | | | | | | | | | | | | | | | |
Total Net Assets | | $ | 75,515,200 | | | $ | 79,616,554 | | | ($ | 896 | ) | | $ | 155,130,858 | |
| | | | | | | | | | | | | | | | |
Net Asset Value, Offering Price and Redemption Proceeds Per Share | | | | | | | | | | | | | | | | |
Primary Shares: | | | | | | | | | | | | | | | | |
Net Assets | | $ | 0 | | | $ | 72,320,344 | | | $ | 75,514,304 | (b) | | $ | 147,834,648 | |
| | | | | | | | | | | | | | | | |
Shares Outstanding | | | 0 | | | | 11,297,443 | | | | 11,799,110 | (b) | | | 23,096,553 | |
| | | | | | | | | | | | | | | | |
Shares Authorized | | | 0 | | | | unlimited | | | | | | | | unlimited | |
| | | | | | | | | | | | | | | | |
Net Asset Value, Offering Price and Redemption Proceeds Per Share | | | | | | $ | 6.40 | | | | | | | $ | 6.40 | |
| | | | | | | | | | | | | | | | |
Service Shares: | | | | | | | | | | | | | | | | |
Net Assets | | $ | 0 | | | $ | 7,296,210 | | | $ | 0 | | | $ | 7,296,210 | |
| | | | | | | | | | | | | | | | |
105
| | | | | | | | | | | | | | | | |
Shares Outstanding | | | 0 | | | | 1,139,298 | | | | 0 | | | | 1,139,298 | |
| | | | | | | | | | | | | | | | |
Shares Authorized | | | 0 | | | | unlimited | | | | | | | | unlimited | |
| | | | | | | | | | | | | | | | |
Net Asset Value, Offering Price and Redemption Proceeds Per Share | | | | | | $ | 6.40 | | | | | | | $ | 6.40 | |
| | | | | | | | | | | | | | | | |
Initial Class: | | | | | | | | | | | | | | | | |
Net Assets | | $ | 71,734,244 | | | $ | 0 | | | ($ | 71,734,244 | ) (b) | | $ | 0 | |
| | | | | | | | | | | | | | | | |
Shares Outstanding | | | 2,010,321 | | | | 0 | | | | (2,010,321 | ) (b) | | | 0 | |
| | | | | | | | | | | | | | | | |
Shares Authorized | | | unlimited | | | | 0 | | | | | | | | 0 | |
| | | | | | | | | | | | | | | | |
Net Asset Value, Offering Price and Redemption Proceeds Per Share | | $ | 35.68 | | | | | | | | | | | | | |
| | | | | | | | | | | | | | | | |
Service Class: | | | | | | | | | | | | | | | | |
Net Assets | | $ | 3,780,956 | | | $ | 0 | | | ($ | 3,780,956 | ) (b) | | $ | 0 | |
| | | | | | | | | | | | | | | | |
Shares Outstanding | | | 102,206 | | | | 0 | | | | (102,206 | ) (b) | | | 0 | |
| | | | | | | | | | | | | | | | |
Shares Authorized | | | unlimited | | | | 0 | | | | | | | | 0 | |
| | | | | | | | | | | | | | | | |
Net Asset Value, Offering Price and Redemption Proceeds Per Share | | $ | 36.99 | | | | | | | | | | | | | |
| | | | | | | | | | | | | | | | |
Investments, at identified cost | | $ | 60,850,200 | | | $ | 65,192,209 | | | $ | 0 | | | $ | 126,042,409 | |
| | | | | | | | | | | | | | | | |
| (a) | Adjustment for prepaid expenses which will not transfer as a result of the reorganization. |
| (b) | Adjustment to reflect share balance as a result of the combination. |
106
Blue Chip Portfolio
Federated Capital Appreciation Fund II
Pro Forma Combining Statements of Operations
For the year ended December 31, 2010 (unaudited)
| | | | | | | | | | | | | | | | |
| | | Blue
Chip
Portfolio | | | Federated
Capital
Appreciation
Fund II | | | Pro Forma
Adjustment | | | Federated
Capital
Appreciation
Fund II
Proforma
Combined | |
Investment Income: | | | | | | | | | | | | | | | | |
Dividends | | $ | 1,962,720 | | | $ | 1,439,966 | | | $ | 0 | | | $ | 3,402,686 | |
Interest | | | 4,097 | | | | 5,754 | | | | 0 | | | | 9,851 | |
| | | | | | | | | | | | | | | | |
Total Investment Income: | | | 1,966,817 | | | | 1,445,720 | | | | 0 | | | | 3,412,537 | |
Expenses: | | | | | | | | | | | | | | | | |
Investment adviser fee | | | 143,837 | | | | 664,569 | | | | 463,908 | (a) | | | 1,272,314 | |
Administrative personnel and services fee | | | 0 | | | | 190,000 | | | | 0 | | | | 190,000 | |
Custodian fees | | | 6,621 | | | | 17,115 | | | | 6,955 | (b) | | | 30,691 | |
Transfer and dividend disbursing agent fees and expenses | | | 0 | | | | 31,216 | | | | 38 | (c) | | | 31,254 | |
Directors’/Trustees’ fees | | | 11,013 | | | | 936 | | | | (7,875) | (d) | | | 4,074 | |
Professional fees | | | 32,152 | | | | 0 | | | | (32,152) | (e) | | | 0 | |
Auditing fees | | | 0 | | | | 24,548 | | | | 0 | | | | 24,548 | |
Legal fees | | | 0 | | | | 5,756 | | | | 1,603 | (f) | | | 7,359 | |
Portfolio accounting fees | | | 30,000 | | | | 63,500 | | | | (26,664) | (g) | | | 66,836 | |
Distribution fees | | | 8,211 | | | | 0 | | | | (8,211) | (h) | | | 0 | |
Distribution services fee - Select Shares | | | 0 | | | | 16,575 | | | | 0 | | | | 16,575 | |
Printing and postage | | | 9,398 | | | | 44,642 | | | | (9,190) | (i) | | | 44,850 | |
Insurance premiums | | | 7,113 | | | | 4,345 | | | | (6,994) | (j) | | | 4,464 | |
Interest expense | | | 0 | | | | 1,346 | | | | 0 | | | | 1,346 | |
Miscellaneous | | | 3,777 | | | | 2,916 | | | | (3,593) | (k) | | | 3,100 | |
| | | | | | | | | | | | | | | | |
Total Expenses | | | 252,122 | | | | 1,067,464 | | | | 377,825 | | | | 1,697,411 | |
| | | | | | | | | | | | | | | | |
Waivers and Reduction— | | | | | | | | | | | | | | | | |
Waiver of investment adviser fee | | | 0 | | | | (90,281) | | | | 90,281 | (l) | | | 0 | |
Waiver of administrative personnel and services fee | | | 0 | | | | (34,218) | | | | 785 | (m) | | | (33,433) | |
Waiver of distribution services fee - Select Shares | | | 0 | | | | (700) | | | | 0 | | | | (700) | |
Fees paid indirectly for directed brokerage arrangements | | | (6) | | | | (5,965) | | | | 0 | | | | (5,971) | |
| | | | | | | | | | | | | | | | |
Total Waivers and Reimbursements | | | (6) | | | | (131,164) | | | | 91,066 | | | | (40,104) | |
| | | | | | | | | | | | | | | | |
Net Expenses | | | 252,116 | | | | 936,300 | | | | 468,891 | | | | 1,657,307 | |
| | | | | | | | | | | | | | | | |
Net investment income | | $ | 1,714,701 | | | $ | 509,420 | | | ($ | 468,891) | | | $ | 1,755,230 | |
| | | | | | | | | | | | | | | | |
Realized and Unrealized Gain (Loss) on Investments and Foreign Currency Transactions: | | | | | | | | | | | | | | | | |
Net realized gain on investments and foreign currency transactions | | | 1,980,601 | | | | 7,317,586 | | | | 0 | | | | 9,298,187 | |
Net change in unrealized appreciation (depreciation) of investments and translation of assets and liabilities in foreign currency | | | 4,034,784 | | | | 1,324,437 | | | | 0 | | | | 5,359,221 | |
| | | | | | | | | | | | | | | | |
Net realized and unrealized loss on investments and foreign currency transactions | | | 6,015,385 | | | | 8,642,023 | | | | 0 | | | | 14,657,408 | |
| | | | | | | | | | | | | | | | |
Change in net assets resulting from operations | | $ | 7,730,086 | | | $ | 9,151,443 | | | ($ | 468,891) | | | $ | 16,412,638 | |
| | | | | | | | | | | | | | | | |
(See Notes to Pro Forma Financial Statements)
107
Blue Chip Portfolio
Federated Capital Appreciation Fund II
Notes to Pro Forma Financial Statements
For the Period Ended December 31, 2010 (unaudited)
Note 1. Description of the Funds
Blue Chip Portfolio is a portfolio of EquiTrust Variable Insurance Series Fund, which is registered under the Investment Company Act of 1940, as amended (the “Act”), as an open-end diversified management investment company. Federated Capital Appreciation Fund II, a series of Federated Insurance Series, is registered under the Act, as an open-end management investment company. Blue Chip Portfolio consists of two classes of shares: Initial Class and Service Class. Federated Capital Appreciation Fund II consists of two classes of shares: Primary Shares and Service Shares.
Note 2. Basis of Combination
The accompanying unaudited Pro Forma Combining Portfolios of Investments, Statements of Assets and Liabilities and Statements of Operations (Pro Forma Financial Statements) reflect the accounts of Blue Chip Portfolio and Federated Capital Appreciation Fund II (individually referred to as the “Fund”, or collectively as the “Funds”), for the year ended December 31, 2010. These statements have been derived from the books and records utilized in calculating daily net asset values at December 31, 2010.
The Pro Forma Financial Statements should be read in conjunction with the historical financial statements of Blue Chip Portfolio and Federated Capital Appreciation Fund II, which have been incorporated by reference in the Statement of Additional Information. The Funds follow generally accepted accounting principles in the United States of America applicable to management investment companies which are disclosed in the historical financial statements.
The Pro Forma Financial Statements give effect to the proposed exchange of assets of Initial Class Shares and Service Class Shares of Blue Chip Portfolio for Primary Shares of Federated Capital Appreciation Fund II. Under generally accepted accounting principles, Federated Capital Appreciation Fund II will be the surviving entity for accounting purposes with its historical cost of investment securities and results of operations being carried forward.
The Pro Forma Financial Statements have been adjusted to reflect the anticipated advisory fee arrangement for the surviving entity, if necessary. Certain other operating costs have also been adjusted to reflect anticipated expenses of the combined entity. Other costs which may change as a result of the reorganization are currently undeterminable.
For the year ended December 31, 2010, Blue Chip Portfolio and Federated Capital Appreciation Fund II paid investment advisory fees computed at the annual rate of 0.20% and 0.85%, respectively, as a percentage of average daily net assets.
The investment advisers of Federated Insurance Funds and the EquiTrust Variable Funds or their affiliates will pay the direct expenses and all the indirect expenses of the Reorganization.
Note 3. Portfolio Valuation
In calculating its net asset value (NAV), Federated Capital Appreciation Fund II generally values investments as follows:
| | • | | Equity securities listed on an exchange or traded through a regulated market system are valued at their last reported sale price or official closing price in their principal exchange or market. |
| | • | | Fixed-income securities acquired with remaining maturities greater than 60 days are fair valued using price evaluations provided by a pricing service approved by the Board of Trustees (the “Trustees”). |
108
| | • | | Fixed-income securities acquired with remaining maturities of 60 days or less are valued at their cost (adjusted for the accretion of any discount or amortization of any premium). |
| | • | | Derivative contracts listed on exchanges are valued at their reported settlement or closing price. |
| | • | | Over-the-counter (OTC) derivative contracts are fair valued using price evaluations provided by a pricing service approved by the Trustees. |
| | • | | Shares of other mutual funds are valued based upon their reported NAVs. |
If Federated Capital Appreciation Fund II cannot obtain a price or price evaluation from a pricing service for an investment, the Fund may attempt to value the investment based upon the mean of bid and asked quotations or fair value the investment based on price evaluations, from one or more dealers. If any price, quotation, price evaluation or other pricing source is not readily available when the NAV is calculated, the Fund uses the fair value of the investment determined in accordance with the procedures described below. There can be no assurance that the Fund could purchase or sell an investment at the price used to calculate the Fund’s NAV.
Fair Valuation and Significant Events Procedures
The Trustees of Federated Capital Appreciation Fund II have authorized the use of pricing services to provide evaluations of the current fair value of certain investments for purposes of calculating the NAV. Factors considered by pricing services in evaluating an investment include the yields or prices of investments of comparable quality, coupon, maturity, call rights and other potential prepayments, terms and type, reported transactions, indications as to values from dealers, and general market conditions. Some pricing services provide a single price evaluation reflecting the bid-side of the market for an investment (a “bid” evaluation). Other pricing services offer both bid evaluations and price evaluations indicative of a price between the prices bid and asked for the investment (a “mid” evaluation). The Funds normally use bid evaluations for U.S. Treasury and Agency securities, mortgage-backed securities and municipal securities. The Funds normally use mid evaluations for other types of fixed-income securities and OTC derivative contracts. In the event that market quotations and price evaluations are not available for an investment, the fair value of the investment is determined in accordance with procedures adopted by the Trustees.
The Trustees also have adopted procedures requiring an investment to be priced at its fair value whenever the Adviser determines that a significant event affecting the value of the investment has occurred between the time as of which the price of the investment would otherwise be determined and the time as of which the NAV is computed. An event is considered significant if there is both an affirmative expectation that the investment’s value will change in response to the event and a reasonable basis for quantifying the resulting change in value. Examples of significant events that may occur after the close of the principal market on which a security is traded, or after the time of a price evaluation provided by a pricing service or a dealer, include:
| | • | | With respect to securities traded in foreign markets, significant trends in U.S. equity markets or in the trading of foreign securities index futures or options contracts; |
| | • | | With respect to price evaluations of fixed-income securities determined before the close of regular trading on the NYSE, actions by the Federal Reserve Open Market Committee and other significant trends in U.S. fixed-income markets; |
| | • | | Political or other developments affecting the economy or markets in which an issuer conducts its operations or its securities are traded; and |
| | • | | Announcements concerning matters such as acquisitions, recapitalizations, litigation developments, a natural disaster affecting the issuer’s operations or regulatory changes or market developments affecting the issuer’s industry. |
The Trustees have approved the use of a pricing service to determine the fair value of equity securities traded principally in foreign markets when the Adviser determines that there has been a significant trend in the U.S. equity markets or in index futures trading. For other significant events, the Funds may seek to obtain more current
109
quotations or price evaluations from alternative pricing sources. If a reliable alternative pricing source is not available, the Fund will determine the fair value of the investment using another method approved by the Trustees.
With respect to Blue Chip Portfolio, the Fund values its investment securities that are traded on any national exchange at the last sale price on the day of valuation or, lacking any sales, at the mean between the closing bid and asked process. Investments traded in the over-the-counter market are valued at the mean between the closing bid and asked prices or yield equivalent. In situations where market quotations are not readily available or quoted market prices are not reliable, investments are valued at fair value in accordance with the procedures adopted by the Fund’s Board of Trustees. Money market investments are valued at market value, except that obligations maturing in 60 days or less are valued using the amortized cost method, which approximates market value. Under the amortized cost method, a security is valued at its cost on the date of purchase and thereafter is adjusted to reflect a constant amortization to maturity of the difference between the principal amount due at maturity and the cost of investment to the Fund.
Note 4. Shares of Beneficial Interest
The Pro Forma Primary Shares net asset value per share assumes the issuance of 11,799,110 Primary Shares of Federated Capital Appreciation Fund II in exchange for 2,010,321 Initial Class Shares and 102,206 Service Class Shares of Blue Chip Portfolio, respectively, which would have been outstanding at December 31, 2010 in connection with the proposed reorganization, assuming the two Funds had been combined as of such date.
Note 5. Federal Income Taxes
Each Fund has elected to be taxed as a “regulated investment company” under the Internal Revenue Code. After the acquisition, Federated Capital Appreciation Fund II intends to continue to qualify as a regulated investment company, if such qualification is in the best interests of its shareholders, by complying with the Subchapter M provision of the Internal Revenue Code and to distribute to shareholders each year substantially all of its income. Accordingly, no provision for federal income tax is necessary. Federated Capital Appreciation Fund II complies with the provisions of Financial Accounting Standards Board (FASB) Interpretation No. 48 (FIN 48) “Accounting for Uncertainty in Income Taxes”. As of and during the year ended December 31, 2010, the Fund did not have a liability for any uncertain tax positions. The Fund recognizes interest and penalties, if any, related to tax liabilities as income tax expense in the Statement of Operations. As of December 31, 2010, tax years 2007 through 2010 remain subject to examination by the Fund’s major tax jurisdictions, which include the United States of America and the Commonwealth of Massachusetts.
Each Fund may be subject to taxes imposed by governments of countries in which it invests. Such taxes are generally based on either income or gains earned or repatriated. Each Fund accrues and applies such taxes to net investment income, net realized gains and net unrealized gains as income and/or gains are earned.
The identified cost of investments for the funds is substantially the same for both financial accounting and federal income tax purposes. The tax cost of investments will remain unchanged for the combined fund.
Note 6. Other
The preparation of financial statements in conformity with GAAP requires management to make estimates and assumptions that affect the amounts of assets, liabilities, expenses and revenue reported in the financial statements. Actual results could differ from those estimated.
Note 7. Pro Forma Adjustments
| | (a) | EquiTrust Investment Management Services, Inc. is the investment adviser for Blue Chip Portfolio. Federated Equity Management Company of Pennsylvania is the investment adviser for Federated Capital Appreciation Fund II. The advisory agreement between Blue Chip Portfolio and the Adviser provides for an annual fee equal to 0.20% of the Fund’s average daily net assets. The advisory agreement between Federated Capital Appreciation Fund II and the Adviser provides for an annual fee equal to 0.85% of the |
110
| | Fund’s average daily net assets. An adjustment to the combined investment adviser fee reflects the fee structure of Federated Capital Appreciation Fund II based on the combined assets of Federated Capital Appreciation Fund II Pro Forma Combined. |
| | (b) | Adjustment to reflect custodian fees based upon the current expense structure for Federated Capital Appreciation Fund II Pro Forma Combined. |
| | (c) | Adjustment to reflect transfer and dividend disbursing agent fees and expenses based upon the current expense structure for Federated Capital Appreciation Fund II Pro Forma Combined. |
| | (d) | Adjustment to reflect Directors/Trustees fees based upon the current expense structure for Federated Capital Appreciation Fund II Pro Forma Combined. |
| | (e) | Adjustment to reflect removal of professional fees since the combined expenses in this category for Blue Chip Portfolio are disclosed separately for Federated Capital Appreciation Fund II Pro Forma Combined. |
| | (f) | Adjustment to reflect legal fees based upon the current expense structure for Federated Capital Appreciation Fund II Pro Forma Combined. |
| | (g) | Adjustment to reflect portfolio accounting fees based upon the current expense structure for Federated Capital Appreciation Fund II Pro Forma Combined. |
| | (h) | Adjustment to reflect removal of distribution fees for Blue Chip Portfolio from Federated Capital Appreciation Fund II Pro Forma Combined since Primary Shares of Federated Capital Appreciation Fund II do not currently incur a distribution fee. |
| | (i) | Adjustment to reflect printing and postage costs based upon the current expense structure for Federated Capital Appreciation Fund II Pro Forma Combined. |
| | (j) | Adjustment to reflect insurance premiums based upon the current expense structure for Federated Capital Appreciation Fund II Pro Forma Combined. |
| | (k) | Adjustment to reflect miscellaneous expenses based upon the current expense structure for Federated Capital Appreciation Fund II Pro Forma Combined. |
| | (l) | Adjustment to reflect removal of the voluntary waiver of investment advisory fees on the average daily net assets of Federated Capital Appreciation Fund II Pro Forma Combined. The adviser of Federated Capital Appreciation Fund II and its affiliates have voluntarily agreed to waive their fees and/or reimburse expenses so that the total annual fund operating expenses (as shown in the financial highlights) paid by the Fund’s Primary Shares (after the voluntary waivers and/or reimbursements) will not exceed 1.18% through the later of (the “Termination Date”); (a) April 30, 2011; or (b) the date of the Fund’s next effective Prospectus. While the adviser and its affiliates currently do not anticipate terminating or increasing these arrangements prior to the Termination Date, these arrangements may only be terminated or increased prior to the Termination Date with the agreement of the Fund’s Trustees. Based on the combined net assets of Federated Capital Appreciation Fund II Pro Forma Combined for the period ended December 31, 2010, no voluntary waiver of investment advisory fee would be required to satisfy this arrangement. |
| | (m) | Adjustment to reflect the voluntary waiver of administrative personnel and services fee on the average daily net assets of Federated Capital Appreciation Fund II Pro Forma Combined. |
111
F. Acquisition of High Grade Bond and Strategic Yield Portfolios by Federated Quality Bond Fund II
INTRODUCTION
The accompanying unaudited Pro Forma Combining Portfolios of Investments, Statements of Assets and Liabilities and Statements of Operations (“Pro Forma Financial Statements”) reflect the accounts of High Grade Bond Portfolio, Strategic Yield Portfolio and Federated Quality Bond Fund II (individually referred to as the “Fund” or collectively as the “Funds”), for the period ended December 31, 2010. High Grade Bond Portfolio and Strategic Yield Portfolio will be reorganized into Federated Quality Bond Fund II as of the close of business on or about [July 15], 2011. For the purposes of these Pro Forma Financial Statements, the financial information covers the period from January 1, 2010 to December 31, 2010. These statements have been derived from the books and records utilized in calculating daily net asset values at December 31, 2010.
The Pro Forma Financial Statements give effect to the proposed exchange of assets of Initial Class Shares and Service Class Shares of High Grade Bond Portfolio and Strategic Yield Portfolio for Primary Shares of Federated Quality Bond Fund II. Under generally accepted accounting principles, Federated Quality Bond Fund II will be the surviving entity for accounting purposes with its historical cost of investment securities and results of operations being carried forward.
The Pro Forma Financial Statements have been adjusted to reflect the anticipated advisory fee arrangement for the surviving entity. Certain other operating costs have also been adjusted to reflect anticipated expenses of the combined entity. Other costs which may change as a result of the reorganization currently are undeterminable.
[Remainder of page intentionally left blank.]
112
High Grade Bond Portfolio
Strategic Yield Portfolio
Federated Quality Bond Fund II
Pro Forma Combining Portfolio of Investments
December 31, 2010 (unaudited)
| | | | | | | | | | | | | | | | | | | | | | | | |
High
Grade
Bond
Portfolio | | Strategic
Yield
Portfolio | | Federated
Quality
Bond Fund II | | Federated
Quality
Bond Fund II Pro Forma
Combined | | | | High Grade Bond
Portfolio | | | Strategic
Yield
Portfolio | | | Federated
Quality
Bond Fund II | | | Federated
Quality Bond Fund II Pro Forma
Combined | |
| | |
| Shares or Principal Amount | | | | Value | |
CORPORATE BONDS – 87.0% | | | | | | | | | | | | | | | | | | |
Basic Industry - Chemicals - 3.7% | | | | | | | | | | | | | | | | | | |
$0 | | $0 | | $1,970,000 | | $1,970,000 | | Albernarle Corp., Sr. Note, 5.10%, 2/1/2015 | | $ | 0 | | | $ | 0 | | | $ | 2,109,607 | | | $ | 2,109,607 | |
0 | | 0 | | 320,000 | | 320,000 | | Du Pont (E.I.) de Nemours & Co., 6.00%, 7/15/2018 | | | 0 | | | | 0 | | | | 368,368 | | | | 368,368 | |
1,500,000 | | 0 | | 0 | | 1,500,000 | | Du Pont (E.I.) de Nemours & Co., 4.625%, 1/15/2020 | | | 1,586,280 | | | | 0 | | | | 0 | | | | 1,586,280 | |
0 | | 0 | | 300,000 | | 300,000 | | Eastman Chemical Co., Sr. Unsecd. Not, 5.50%, 11/15/2019 | | | 0 | | | | 0 | | | | 317,755 | | | | 317,755 | |
0 | | 0 | | 410,000 | | 410,000 | | (1)(2) Incitec Pivot Finance LLC, Company Guarantee, 4.00%, 12/7/2015 | | | 0 | | | | 0 | | | | 403,111 | | | | 403,111 | |
0 | | 0 | | 800,000 | | 800,000 | | (1)(2) Incitec Pivot Finance LLC, Company Guarantee, Series 144A, 6.00%, 12/10/2019 | | | 0 | | | | 0 | | | | 814,174 | | | | 814,174 | |
0 | | 750,000 | | 0 | | 750,000 | | Lubrizol Corp., 8.875%, 2/1/2019 | | | 0 | | | | 955,380 | | | | 0 | | | | 955,380 | |
1,500,000 | | 0 | | 0 | | 1,500,000 | | Merck & Co., Inc. 5.00%, 6/30/2019 | | | 1,661,295 | | | | 0 | | | | 0 | | | | 1,661,295 | |
0 | | 800,000 | | 0 | | 800,000 | | NOVA Chemicals Corp., 7.875%, 9/15/2025 | | | 0 | | | | 748,600 | | | | 0 | | | | 748,600 | |
1,800,000 | | 0 | | 0 | | 1,800,000 | | Pfizer, Inc., 5.35%, 3/15/2015 | | | 2,025,486 | | | | 0 | | | | 0 | | | | 2,025,486 | |
0 | | 0 | | 1,290,000 | | 1,290,000 | | RPM International, Inc., 6.50%, 2/15/2018 | | | 0 | | | | 0 | | | | 1,379,353 | | | | 1,379,353 | |
0 | | 0 | | 1,030,000 | | 1,030,000 | | RPM International, Inc., Sr. Unsecd. Note, 6.125%, 10/15/2019 | | | 0 | | | | 0 | | | | 1,068,788 | | | | 1,068,788 | |
0 | | 0 | | 395,000 | | 395,000 | | Rohm & Haas Co., 6.00%, 9/15/2017 | | | 0 | | | | 0 | | | | 432,903 | | | | 432,903 | |
| | | | | | | | | | | | | | | | | | | | | | | | |
| | | | | | | | TOTAL | | | 5,273,061 | | | | 1,703,980 | | | | 6,894,059 | | | | 13,871,100 | |
| | | | | | | | | | | | | | | | | | | | | | | | |
113
| | | | | | | | | | | | | | | | | | | | | | |
Basic Industry - Metals & Mining - 3.7% | | | | | | | | | | | | | | | | |
0 | | 0 | | 100,000 | | 100,000 | | (1)(2) Anglo American Capital PLC, Company Guarantee, Series 144A, 4.45%m 9/27/2020 | | 0 | | | 0 | | | | 100,418 | | | | 100,418 | |
0 | | 0 | | 300,000 | | 300,000 | | Anglogold Ashanti Holdings PLC, Sr. Note, 6.50%, 4/15/2040 | | 0 | | | 0 | | | | 307,693 | | | | 307,693 | |
0 | | 0 | | 760,000 | | 760,000 | | ArcelorMittal, 6.125%, 6/1/2018 | | 0 | | | 0 | | | | 810,979 | | | | 810,979 | |
0 | | 0 | | 1,300,000 | | 1,300,000 | | ArcelorMittal, Sr. Unsecd. Note, 5.25%, 8/5/2020 | | 0 | | | 0 | | | | 1,287,602 | | | | 1,287,602 | |
0 | | 0 | | 940,000 | | 940,000 | | Barrick Gold Corp., Sr. Unsecd Note, 6.95%, 4/1/2019 | | 0 | | | 0 | | | | 1,155,291 | | | | 1,155,291 | |
0 | | 1,000,000 | | 0 | | 1,000,000 | | Freeport McMoRan Copper & Gold, Inc., 8.375%, 4/1/2017 | | 0 | | | 1,109,690 | | | | 0 | | | | 1,109,690 | |
0 | | 0 | | 1,020,000 | | 1,020,000 | | (1)(2) Gerdau S.A., Company Guarantee, Series 144A, 5.75%, 1/30/2021 | | 0 | | | 0 | | | | 1,027,650 | | | | 1,027,650 | |
0 | | 0 | | 700,000 | | 700,000 | | (1)(2) Gold Fields Orogen Holding BVI Ltd., Company Guarantee, Series 144Am 4.875%, 10/7/2020 | | 0 | | | 0 | | | | 670,921 | | | | 670,921 | |
0 | | 0 | | 1,810,000 | | 1,810,000 | | Newmont Mining Corp., Company Guarantee, 5.875%, 4/1/2035 | | 0 | | | 0 | | | | 1,897,658 | | | | 1,897,658 | |
0 | | 0 | | 435,000 | | 435,000 | | Rio Tinto Finance USA Ltd., Company Guarantee, 6.50%, 7/15/2018 | | 0 | | | 0 | | | | 506,547 | | | | 506,547 | |
0 | | 0 | | 1,000,000 | | 1,000,000 | | Rio Tinto Finance USA Ltd., Company Guarantee, 8.95%, 5/1/2014 | | 0 | | | 0 | | | | 1,212,048 | | | | 1,212,048 | |
0 | | 0 | | 1,430,000 | | 1,430,000 | | Worthington Industries, Inc., Sr. Unsecd. Note, 6.50%, 4/15/2020 | | 0 | | | 0 | | | | 1,502,306 | | | | 1,502,306 | |
0 | | 0 | | 1,000,000 | | 1,000,000 | | Xstrata Canada Corp., 6.00%, 10/15/2015 | | 0 | | | 0 | | | | 1,095,925 | | | | 1,095,925 | |
0 | | 0 | | 1,200,000 | | 1,203,700 | | (1)(2) Xstrata Finance Canada Ltd., Unsecd. Note, 5.50%, 11/16/2011 | | 0 | | | 0 | | | | 1,235,732 | | | | 1,235,732 | |
| | | | | | | | | | | | | | | | | | | | | | |
| | | | | | | | TOTAL | | 0 | | | 1,109,690 | | | | 12,810,770 | | | | 13,920,460 | |
| | | | | | | | | | | | | | | | | | | | | | |
| Basic Industry - Paper - 1.3% | | | | | | | | | | | | | | | | |
0 | | 1,000,000 | | 0 | | 1,000,000 | | International Paper Co., 7.95%, 6/15/2018 | | 0 | | | 1,193,770 | | | | 0 | | | | 1,193,770 | |
0 | | 0 | | 640,000 | | 640,000 | | International Paper Co., Bond, 7.30%, 11/15/2039 | | 0 | | | 0 | | | | 732,797 | | | | 732,797 | |
0 | | 0 | | 450,000 | | 450,000 | | International Paper Co., Sr. Unsecd. Note, 7.50%, 8/15/2021 | | 0 | | | 0 | | | | 531,709 | | | | 531,709 | |
114
| | | | | | | | | | | | | | | | | | | | | | |
0 | | 0 | | 460,000 | | 460,000 | | Plum Creek Timberlands LP, Sr. Unsecd. Note, 4.70%, 3/15/2021 | | 0 | | | 0 | | | | 438,658 | | | | 438,658 | |
0 | | 0 | | 400,000 | | 400,000 | | Westvaco Corp., 7.65%, 3/15/2027 | | 0 | | | 0 | | | | 407,794 | | | | 407,794 | |
0 | | 0 | | 1,500,000 | | 1,500,000 | | Westvaco Corp., Sr. Deb., 7.50%, 6/15/2027 | | 0 | | | 0 | | | | 1,517,047 | | | | 1,517,047 | |
| | | | | | | | | | | | | | | | | | | | | | |
| | | | | | | | TOTAL | | 0 | | | 1,193,770 | | | | 3,628,005 | | | | 4,821,775 | |
| | | | | | | | | | | | | | | | | | | | | | |
Capital Goods - Aerospace & Defense - 0.5% | | | | | | | | | | | | | | |
0 | | 0 | | 500,000 | | 500,000 | | Embraer Overseas Ltd., Sr. Unsecd. Note, 6.375%, 1/24/2017 | | 0 | | | 0 | | | | 526,250 | | | | 526,250 | |
0 | | 0 | | 690,000 | | 690,000 | | Goodrich Corp., 4.875%, 3/1/2020 | | 0 | | | 0 | | | | 722,969 | | | | 722,969 | |
0 | | 0 | | 430,000 | | 430,000 | | (1)(2) Meccanica Holdings USA, Inc., Company Guarantee, Series 144A, 6.25%, 1/15/2040 | | 0 | | | 0 | | | | 405,115 | | | | 405,115 | |
| | | | | | | | | | | | | | | | | | | | | | |
| | | | | | | | TOTAL | | 0 | | | 0 | | | | 1,654,334 | | | | 1,654,334 | |
| | | | | | | | | | | | | | | | | | | | | | |
Capital Goods - Building Materials - 1.0% | | | | | | | | | | | | | | |
0 | | 0 | | 620,000 | | 620,000 | | Masco Corp., Sr. Unsecd. Note, 7.125%, 3/15/2020 | | 0 | | | 0 | | | | 651,468 | | | | 651,468 | |
0 | | 600,000 | | 0 | | 600,000 | | Owens Corning, 9.00%, 6/15/2019 | | 0 | | | 708,186 | | | | 0 | | | | 708,186 | |
0 | | 1,400,000 | | 720,000 | | 2,120,000 | | Valmont Industries, Inc., Sr. Unsecd. Note, 6.625%, 4/20/2020 | | 0 | | | 1,458,422 | | | | 750,305 | | | | 2,208,727 | |
| | | | | | | | | | | | | | | | | | | | | | |
| | | | | | | | TOTAL | | 0 | | | 2,166,608 | | | | 1,401,773 | | | | 3,568,381 | |
| | | | | | | | | | | | | | | | | | | | | | |
Capital Goods - Diversified Manufacturing - 3.0% | | | | | | | | | | | | | | |
0 | | 0 | | 360,000 | | 360,000 | | Avery Dennison Corp., Sr. Unsecd. Note, 5.375%, 4/15/2020 | | 0 | | | 0 | | | | 376,190 | | | | 376,190 | |
0 | | 0 | | 1,045,000 | | 1,045,000 | | Harsco Corp., 5.75%, 5/15/2018 | | 0 | | | 0 | | | | 1,143,142 | | | | 1,143,142 | |
0 | | 0 | | 1,350,000 | | 1,350,000 | | Hubbell, Inc., 5.95%, 6/1/2018 | | 0 | | | 0 | | | | 1,512,566 | | | | 1,512,566 | |
0 | | 0 | | 1,118,000 | | 1,118,000 | | (1)(2) Hutchison Whampoa International Ltd., 6.50%, 2/13/2013 | | 0 | | | 0 | | | | 1,222,351 | | | | 1,222,351 | |
0 | | 0 | | 500,000 | | 500,000 | | Ingersoll-Rand Global Holding Co. Ltd., 6.875%, 8/15/2018 | | 0 | | | 0 | | | | 575,724 | | | | 575,724 | |
0 | | 0 | | 1,240,000 | | 1,240,000 | | Roper Industries, Inc., 6.625%, 8/15/2013 | | 0 | | | 0 | | | | 1,382,872 | | | | 1,382,872 | |
0 | | 0 | | 1,910,000 | | 1,910,000 | | (1)(2) Textron Financial Corp., Jr. Sub. Note, 6.00%, 2/15/2067 | | 0 | | | 0 | | | | 1,635,437 | | | | 1,635,437 | |
115
| | | | | | | | | | | | | | | | | | | | | | | | |
0 | | 0 | | 400,000 | | 400,000 | | Thomas & Betts Corp., sr. Unsecd. Note, 5.625%, 11/15/2021 | | | 0 | | | | 0 | | | | 424,370 | | | | 424,370 | |
0 | | 0 | | 1,930,000 | | 1,930,000 | | Tyco Electronics Group SA, 5.95%, 1/15/2014 | | | 0 | | | | 0 | | | | 2,133,259 | | | | 2,133,259 | |
0 | | 0 | | 1,000,000 | | 1,000,000 | | Tyco International Finance SA, Note, 4.125%, 10/15/2014 | | | 0 | | | | 0 | | | | 1,060,598 | | | | 1,060,598 | |
| | | | | | | | | | | | | | | | | | | | | | | | |
| | | | | | | | TOTAL | | | 0 | | | | 0 | | | | 11,466,509 | | | | 11,466,509 | |
| | | | | | | | | | | | | | | | | | | | | | | | |
Capital Goods - Environmental - 0.4% | | | | | | | | | | | | | | | | |
0 | | 0 | | 770,000 | | 770,000 | | Republic Services, Inc., Company Guarantee, series WI, 5.50%, 9/15/2019 | | | 0 | | | | 0 | | | | 842,428 | | | | 842,428 | |
0 | | 0 | | 575,000 | | 575,000 | | Waste Management, Inc., 7.375%, 3/11/2019 | | | 0 | | | | 0 | | | | 698,182 | | | | 698,182 | |
| | | | | | | | | | | | | �� | | | | | | | | | | | |
| | | | | | | | TOTAL | | | 0 | | | | 0 | | | | 1,540,610 | | | | 1,540,610 | |
| | | | | | | | | | | | | | | | | | | | | | | | |
Capital Goods - Packaging - 0.2% | | | | | | | | | | | | | | | | |
0 | | 0 | | 650,000 | | 650,000 | | Sonoco Products Co., Sr. Unsecd. Note, 5.75%, 11/1/2040 | | | 0 | | | | 0 | | | | 629,328 | | | | 629,328 | |
| | | | | | | | | | | | | | | | | | | | | | | | |
Communications - Media & Cable - 1.0% | | | | | | | | | | | | | | | | |
1,000,000 | | 0 | | 0 | | 1,000,000 | | DIRECTV Holdings LLC, 6.375%, 6/15/2015 | | | 1,036,190 | | | | 0 | | | | 0 | | | | 1,036,190 | |
0 | | 0 | | 1,450,000 | | 1,450,000 | | Time Warner Cable, Inc., Sr. Unsecd. Note, 5.85%, 5/1/2017 | | | 0 | | | | 0 | | | | 1,619,112 | | | | 1,619,112 | |
0 | | 800,000 | | 0 | | 800,000 | | Time Warner, Inc., 8.375%, 3/15/2023 | | | 0 | | | | 1,010,256 | | | | 0 | | | | 1,010,256 | |
| | | | | | | | | | | | | | | | | | | | | | | | |
| | | | | | | | TOTAL | | | 1,036,190 | | | | 1,010,256 | | | | 1,619,112 | | | | 3,665,558 | |
| | | | | | | | | | | | | | | | | | | | | | | | |
Communications - Media Noncable - 0.5% | | | | | | | | | | | | | | | | |
0 | | 0 | | 250,000 | | 250,000 | | Discovery Communications LLC, Company Guarantee, 5.05%, 6/1/2020 | | | 0 | | | | 0 | | | | 264,863 | | | | 264,863 | |
0 | | 0 | | 530,000 | | 530,000 | | Moody’s Corp., Sr. Unsecd. Note, 5.50%, 9/1/2020 | | | 0 | | | | 0 | | | | 524,621 | | | | 524,621 | |
0 | | 0 | | 1,100,000 | | 1,100,000 | | (1)(2) Pearson Funding Two PLC, Sr. Unsecd. Note, Series 144A, 4.00%, 5/17/2016 | | | 0 | | | | 0 | | | | 1,111,771 | | | | 1,111,771 | |
| | | | | | | | | | | | | | | | | | | | | | | | |
| | | | | | | | TOTAL | | | 0 | | | | 0 | | | | 1,901,255 | | | | 1,901,255 | |
| | | | | | | | | | | | | | | | | | | | | | | | |
Communications - Telecom Wireless - 2.6% | | | | | | | | | | | | | | | | |
0 | | 0 | | 1,800,000 | | 1,800,000 | | AT&T Wireless Services, Inc., 8.75%, 3/1/2031 | | | 0 | | | | 0 | | | | 2,459,975 | | | | 2,459,975 | |
116
| | | | | | | | | | | | | | | | | | | | |
| 0 | | 0 | | 1,590,000 | | 1,590,000 | | America Movil S.A.B. de C.V., Note, 5.75%, 1/15/2015 | | 0 | | 0 | | | 1,767,881 | | | | 1,767,881 | |
| 0 | | 0 | | 1,000,000 | | 1,000,000 | | American Tower Corp., Sr. Unsecd. Note, 4.50%, 1/15/2018 | | 0 | | 0 | | | 992,744 | | | | 992,744 | |
| 0 | | 0 | | 2,300,000 | | 2,300,000 | | (1)(2) Crown Castle Towers LLC, Sr. Secd. Note, Series 144A, 5.495%, 1/15/2017 | | 0 | | 0 | | | 2,406,320 | | | | 2,406,320 | |
| 0 | | 0 | | 720,000 | | 720,000 | | (1)(2) SBA Tower Trust, Series 144A, 5.101%, 4/15/2017 | | 0 | | 0 | | | 742,315 | | | | 742,315 | |
| 0 | | 0 | | 1,295,000 | | 1,295,000 | | Vodafone Group PLC, Note, 5.625%, 2/27/2017 | | 0 | | 0 | | | 1,448,065 | | | | 1,448,065 | |
| | | | | | | | | | | | | | | | | | | | |
| | | | | | | | TOTAL | | 0 | | 0 | | | 9,817,300 | | | | 9,817,300 | |
| | | | | | | | | | | | | | | | | | | | |
Communications - Telecom Wirelines - 2.0% | | | | | | | | | | | | |
| 0 | | 0 | | 1,000,000 | | 1,000,000 | | CenturyLink, Inc., Sr. Note, 6.15%, 9/15/2019 | | 0 | | 0 | | | 1,004,698 | | | | 1,004,698 | |
| 0 | | 0 | | 1,000,000 | | 1,000,000 | | Deutsche Telekom International Finance BV, 4.875%, 7/8/2014 | | 0 | | 0 | | | 1,076,413 | | | | 1,076,413 | |
| 0 | | 0 | | 1,000,000 | | 1,000,000 | | (1)(2) KT Corp., Note, 5.875%, 6/24/2014 | | 0 | | 0 | | | 1,076,896 | | | | 1,076,896 | |
| 0 | | 0 | | 1,000,000 | | 1,000,000 | | Rogers Communications, Inc., Company Guarantee, 6.80%, 8/15/2018 | | 0 | | 0 | | | 1,201,479 | | | | 1,201,479 | |
| 0 | | 0 | | 250,000 | | 250,000 | | Telefonica SA, Company Guarantee, 7.045%, 6/20/2036 | | 0 | | 0 | | | 257,798 | | | | 257,798 | |
| 0 | | 0 | | 1,600,000 | | 1,600,000 | | Verizon Communications, Inc., Unsecd. Note, 6.10%, 4/15/2018 | | 0 | | 0 | | | 1,820,964 | | | | 1,820,964 | |
| 0 | | 0 | | 1,000,000 | | 1,000,000 | | Verizon Communications, Inc., Unsecd. Note, 6.35%, 4/1/2019 | | 0 | | 0 | | | 1,159,190 | | | | 1,159,190 | |
| | | | | | | | | | | | | | | | | | | | |
| | | | | | | | TOTAL | | 0 | | 0 | | | 7,597,438 | | | | 7,597,438 | |
| | | | | | | | | | | | | | | | | | | | |
Consumer Cyclical - Automotive - 0.9% | | | | | | | | | | | | |
| 0 | | 0 | | 990,000 | | 990,000 | | (1)(2) Hyundai Capital Services, Inc., Note, Series 144A, 6.00%, 5/5/2015 | | 0 | | 0 | | | 1,074,942 | | | | 1,074,942 | |
| 0 | | 0 | | 505,000 | | 505,000 | | Johnson Controls, Inc., Sr. Unsecd. Note, 5.00%, 3/30/2020 | | 0 | | 0 | | | 538,015 | | | | 538,015 | |
| 0 | | 0 | | 1,860,000 | | 1,860,000 | | (1)(2) Nissan Motor Acceptance Corp., Note, 4.50%, 1/30/2015 | | 0 | | 0 | | | 1,928,953 | | | | 1,928,953 | |
| | | | | | | | | | | | | | | | | | | | |
| | | | | | | | TOTAL | | 0 | | 0 | | | 3,541,910 | | | | 3,541,910 | |
| | | | | | | | | | | | | | | | | | | | |
117
| | | | | | | | | | | | | | | | | | | | | | | | |
Consumer Cyclical - Entertainment - 1.1% | | | | | | | | | | | | | | | | |
0 | | 0 | | 1,000,000 | | 1,000,000 | | (1) Football Trust IV, Pass Thru Cert., 5.35%, 10/5/2020 | | | 0 | | | | 0 | | | | 1,047,529 | | | | 1,047,529 | |
0 | | 0 | | 1,890,000 | | 1,890,000 | | (1)(2) NBC Universal, Inc., Sr. Unsecd. Note, Series 144A, 5.15%, 4/30/2020 | | | 0 | | | | 0 | | | | 1,969,551 | | | | 1,969,551 | |
0 | | 0 | | 450,000 | | 450,000 | | (1)(2) NBC Universal, Inc., Sr. Unsecd. Note, Series 144A, 5.95%, 4/1/2041 | | | 0 | | | | 0 | | | | 452,437 | | | | 452,437 | |
0 | | 0 | | 500,000 | | 500,000 | | Time Warner, Inc., Company Guarantee, 6.20%, 3/15/2040 | | | 0 | | | | 0 | | | | 532,168 | | | | 532,168 | |
| | | | | | | | | | | | | | | | | | | | | | | | |
| | | | | | | | TOTAL | | | 0 | | | | 0 | | | | 4,001,685 | | | | 4,001,685 | |
| | | | | | | | | | | | | | | | | | | | | | | | |
Consumer Cyclical - Lodging - 0.5% | | | | | | | | | | | | | | | | |
0 | | 0 | | 950,000 | | 950,000 | | Choice Hotels International, Inc., Company Guarantee, 5.70%, 8/28/2020 | | | 0 | | | | 0 | | | | 926,896 | | | | 926,896 | |
0 | | 0 | | 930,000 | | 930,000 | | Wyndham Worldwide Corp., Sr. Unsecd. Note, 6.00%, 12/1/2016 | | | 0 | | | | 0 | | | | 974,391 | | | | 974,391 | |
| | | | | | | | | | | | | | | | | | | | | | | | |
| | | | | | | | TOTAL | | | 0 | | | | 0 | | | | 1,901,287 | | | | 1,901,287 | |
| | | | | | | | | | | | | | | | | | | | | | | | |
Consumer Cyclical - Retailers - 1.5% | | | | | | | | | | | | | | | | |
0 | | 0 | | 1,150,000 | | 1,150,000 | | Best Buy Co., Inc., Sr. Unsecd. Note, 6.75%, 7/15/2013 | | | 0 | | | | 0 | | | | 1,272,850 | | | | 1,272,850 | |
0 | | 0 | | 1,543,383 | | 1,543,383 | | (1)(2) CVS Caremark Corp., Pass Thru Cert., 5.298%, 1/11/2027 | | | 0 | | | | 0 | | | | 1,518,039 | | | | 1,518,039 | |
0 | | 0 | | 935,000 | | 935,000 | | CVS Caremark Corp., Sr. Unsecd. Note, 5.75%, 6/1/2017 | | | 0 | | | | 0 | | | | 1,045,672 | | | | 1,045,672 | |
0 | | 0 | | 530,000 | | 530,000 | | JC Penny Corp., Inc., Sr. Unsecd. Note, 5.75%, 2/15/2018 | | | 0 | | | | 0 | | | | 524,700 | | | | 524,700 | |
0 | | 1,400,000 | | 0 | | 1,400,000 | | Woolworth (FW) Corp., 8.50%, 1/15/2022 | | | 0 | | | | 1,393,000 | | | | 0 | | | | 1,393,000 | |
| | | | | | | | | | | | | | | | | | | | | | | | |
| | | | | | | | TOTAL | | | 0 | | | | 1,393,000 | | | | 4,361,261 | | | | 5,754,261 | |
| | | | | | | | | | | | | | | | | | | | | | | | |
Consumer Cyclical - Services - 0.3% | | | | | | | | | | | | | | | | |
0 | | 0 | | 250,000 | | 250,000 | | Boston University, 7.625%, 7/15/2097 | | | 0 | | | | 0 | | | | 279,850 | | | | 279,850 | |
0 | | 0 | | 330,000 | | 330,000 | | eBay, Inc., Sr. Unsecd. Note3.25%, 10/15/2020 | | | 0 | | | | 0 | | | | 307,866 | | | | 307,866 | |
0 | | 0 | | 350,000 | | 350,000 | | Expedia, Inc., Company Guarantee, 5.95%, 8/15/2020 | | | 0 | | | | 0 | | | | 353,500 | | | | 353,500 | |
| | | | | | | | | | | | | | | | | | | | | | | | |
| | | | | | | | TOTAL | | | 0 | | | | 0 | | | | 941,216 | | | | 941,216 | |
| | | | | | | | | | | | | | | | | | | | | | | | |
Consumer Non-Cyclical - Food/Beverage - 1.9% | | | | | | | | | | | | | | | | |
900,000 | | 0 | | 0 | | 900,000 | | Archer-Daniels-Midland Co., 5.935%, 10/1/2032 | | | 993,600 | | | | 0 | | | | 0 | | | | 993,600 | |
118
| | | | | | | | | | | | | | | | | | | | | | | | |
0 | | 0 | | 900,000 | | 900,000 | | Coca-Cola Femsa S.A.B. de C.V., Sr. Unsecd. Note, 4.625%, 2/15/2020 | | | 0 | | | | 0 | | | | 930,239 | | | | 930,239 | |
0 | | 0 | | 161,000 | | 161,000 | | Diageo Capital PLC, Company Guarantee, 7.375%, 1/15/2014 | | | 0 | | | | 0 | | | | 185,537 | | | | 185,537 | |
0 | | 0 | | 1,140,000 | | 1,140,000 | | General Mills, Inc., Note, 5.70%, 2/15/2017 | | | 0 | | | | 0 | | | | 1,282,971 | | | | 1,282,971 | |
0 | | 0 | | 3,000,000 | | 3,000,000 | | PepsiCo, Inc., Note, 4.50%, 1/15/2020 | | | 0 | | | | 0 | | | | 3,161,607 | | | | 3,161,607 | |
0 | | 0 | | 450,000 | | 450,000 | | Ralcorp Holdings, Inc., Sr. Unsecd. Note, 6.625%, 8/15/2039 | | | 0 | | | | 0 | | | | 467,710 | | | | 467,710 | |
| | | | | | | | | | | | | | | | | | | | | | | | |
| | | | | | | | TOTAL | | | 993,600 | | | | 0 | | | | 6,028,064 | | | | 7,021,664 | |
| | | | | | | | | | | | | | | | | | | | | | | | |
| Consumer Non-Cyclical - Health Care - 0.9% | | | | | | | | | | | | | | | | |
0 | | 0 | | 750,000 | | 750,000 | | Boston Scientific Corp., 7.375%, 1/15/2040 | | | 0 | | | | 0 | | | | 822,080 | | | | 822,080 | |
0 | | 0 | | 910,000 | | 910,000 | | Life Technologies Corp., Sr. Note, 3.375%, 3/1/2013 | | | 0 | | | | 0 | | | | 930,650 | | | | 930,650 | |
0 | | 0 | | 370,000 | | 370,000 | | Quest Diagnostics, Inc., Sr. Unsecd. Note, 4.75%, 1/30/2020 | | | 0 | | | | 0 | | | | 369,015 | | | | 369,015 | |
0 | | 0 | | 1,310,000 | | 1,310,000 | | Thermo Electron Corp., Sr. Unsecd. Note, 5.00%, 6/1/2015 | | | 0 | | | | 0 | | | | 1,429,628 | | | | 1,429,628 | |
| | | | | | | | | | | | | | | | | | | | | | | | |
| | | | | | | | TOTAL | | | 0 | | | | 0 | | | | 3,551,373 | | | | 3,551,373 | |
| | | | | | | | | | | | | | | | | | | | | | | | |
| Consumer Non-Cyclical - Pharmaceuticals - 0.2% | | | | | | | | | | | | | | | | |
0 | | 0 | | 900,000 | | 900,000 | | Bio-Rad Laboratories, Inc., Sr. Unsecd. Note, 4.875%, 12/15/2020 | | | 0 | | | | 0 | | | | 869,625 | | | | 869,625 | |
| | | | | | | | | | | | | | | | | | | | | | | | |
| Consumer Non-Cyclical - Products - 1.1% | | | | | | | | | | | | | | | | |
0 | | 0 | | 330,000 | | 330,000 | | Clorox Co., Sr. Unsecd. Note, 3.55%, 11/1/2015 | | | 0 | | | | 0 | | | | 340,861 | | | | 340,861 | |
0 | | 0 | | 510,000 | | 510,000 | | Hasbro, Inc., Sr. Unsecd. Note, 6.35%, 3/15/2040 | | | 0 | | | | 0 | | | | 517,494 | | | | 517,494 | |
500,000 | | 1,300,000 | | 0 | | 1,800,000 | | Steelcase, Inc., 6.50%, 8/15/2011 | | | 511,785 | | | | 1,330,641 | | | | 0 | | | | 1,842,426 | |
0 | | 0 | | 610,000 | | 610,000 | | Whirlpool Corp., 5.50%, 3/1/2013 | | | 0 | | | | 0 | | | | 648,171 | | | | 648,171 | |
0 | | 0 | | 870,000 | | 870,000 | | Whirlpool Corp., Note, 8.00%, 5/1/2012 | | | 0 | | | | 0 | | | | 937,825 | | | | 937,825 | |
| | | | | | | | | | | | | | | | | | | | | | | | |
| | | | | | | | TOTAL | | | 511,785 | | | | 1,330,641 | | | | 2,444,351 | | | | 4,286,777 | |
| | | | | | | | | | | | | | | | | | | | | | | | |
| Consumer Non-Cyclical - Supermarkets - 0.5% | | | | | | | | | | | | | | | | |
0 | | 0 | | 610,000 | | 610,000 | | Kroger Co., Bond, 6.90%, 4/15/2038 | | | 0 | | | | 0 | | | | 700,089 | | | | 700,089 | |
0 | | 1,200,000 | | 0 | | 1,200,000 | | Safeway, Inc., 7.45%, 9/15/2027 | | | 0 | | | | 1,351,422 | | | | 0 | | | | 1,351,422 | |
| | | | | | | | | | | | | | | | | | | | | | | | |
| | | | | | | | TOTAL | | | 0 | | | | 1,351,422 | | | | 700,089 | | | | 2,051,511 | |
| | | | | | | | | | | | | | | | | | | | | | | | |
119
| | | | | | | | | | | | | | | | | | | | | | | | |
Consumer Non-Cyclical - Tobacco - 0.5% | | | | | | | | | | | | | | | | |
0 | | 0 | | 1,500,000 | | 1,500,000 | | Philip Morris International, Inc., 5.65%, 5/16/2018 | | | 0 | | | | 0 | | | | 1,707,506 | | | | 1,707,506 | |
| | | | | | | | | | | | | | | | | | | | | | | | |
Energy - Independent - 2.1% | | | | | | | | | | | | | | | | |
0 | | 0 | | 400,000 | | 400,000 | | Apache Corp., Sr. Unsecd. Note, 5.10%, 9/1/2040 | | | 0 | | | | 0 | | | | 389,126 | | | | 389,126 | |
0 | | 1,471,660 | | 0 | | 1,471,660 | | Bruce Mansfield Unit 1, 6.85%, 6/1/2034 | | | 0 | | | | 1,561,622 | | | | 0 | | | | 1,561,622 | |
0 | | 0 | | 2,870,000 | | 2,870,000 | | Petroleos Mexicanos, Company Guarantee, Series WI, 4.875%, 3/15/2015 | | | 0 | | | | 0 | | | | 3,036,342 | | | | 3,036,342 | |
0 | | 0 | | 1,520,000 | | 1,520,000 | | Petroleos Mexicanos, Company Guarantee, Series WI, 6.00%, 3/5/2020 | | | 0 | | | | 0 | | | | 1,636,549 | | | | 1,636,549 | |
0 | | 0 | | 1,900,000 | | 1,900,000 | | Talisman Energy, Inc., Sr. Unsecd. Note, 3.75%, 2/1/2021 | | | 0 | | | | 0 | | | | 179,421 | | | | 179,421 | |
0 | | 0 | | 560,382 | | 560,382 | | (1)(2) Tengizchevroil LLP, Series 144A, 6.124%, 11/15/2014 | | | 0 | | | | 0 | | | | 589,802 | | | | 589,802 | |
0 | | 151,622 | | 0 | | 151,622 | | Waterford 3 Nuclear Power Plant, 8.09%, 1/2/2017 | | | 0 | | | | 152,572 | | | | 0 | | | | 152,572 | |
0 | | 0 | | 405,000 | | 405,000 | | XTO Energy, Inc., 6.75%, 8/1/2037 | | | 0 | | | | 0 | | | | 507,368 | | | | 507,368 | |
| | | | | | | | | | | | | | | | | | | | | | | | |
| | | | | | | | TOTAL | | | 0 | | | | 1,714,194 | | | | 6,338,608 | | | | 8,052,802 | |
| | | | | | | | | | | | | | | | | | | | | | | | |
Energy - Integrated - 3.0% | | | | | | | | | | | | | | | | |
0 | | 1,400,000 | | 0 | | 1,400,000 | | Avista Corp., 5.95%, 6/1/2018 | | | 0 | | | | 1,511,678 | | | | 0 | | | | 1,511,678 | |
0 | | 0 | | 480,000 | | 480,000 | | BP Capital Markets PLC, Company Guarantee, 3.125%, 10/1/2015 | | | 0 | | | | 0 | | | | 478,775 | | | | 478,775 | |
1,200,000 | | 0 | | 0 | | 1,200,000 | | Conoco Phillips Holding Co., 6.95%, 4/15/2029 | | | 1,484,016 | | | | 0 | | | | 0 | | | | 1,484,016 | |
0 | | 0 | | 1,250,000 | | 1,250,000 | | Husky Oil Ltd., Deb., 7.55%, 11/15/2016 | | | 0 | | | | 0 | | | | 1,468,685 | | | | 1,468,685 | |
700,000 | | 0 | | 0 | | 700,000 | | NorthWestern Corp., 6.34%, 4/1/2019 | | | 754,635 | | | | 0 | | | | 0 | | | | 754,635 | |
0 | | 0 | | 1,000,000 | | 1,000,000 | | Petro-Canada, Note, 5.00%, 11/15/2014 | | | 0 | | | | 0 | | | | 1,083,515 | | | | 1,083,515 | |
1,500,000 | | 0 | | 0 | | 1,500,000 | | Public Service Co. of Colorado, 5.125%, 6/1/2019 | | | 1,634,685 | | | | 0 | | | | 0 | | | | 1,634,685 | |
0 | | 0 | | 272,440 | | 272,440 | | (1)(2) Qatar Petroleum, 5.579%, 5/30/2011 | | | 0 | | | | 0 | | | | 276,067 | | | | 276,067 | |
1,500,000 | | 800,000 | | 0 | | 2,300,000 | | South Carolina Electric & Gas Co., 6.50%, 11/1/2018 | | | 1,787,295 | | | | 953,224 | | | | 0 | | | | 2,740,519 | |
| | | | | | | | | | | | | | | | | | | | | | | | |
| | | | | | | | TOTAL | | | 5,660,631 | | | | 2,464,902 | | | | 3,307,042 | | | | 11,432,575 | |
| | | | | | | | | | | | | | | | | | | | | | | | |
120
| | | | | | | | | | | | | | | | | | | | | | |
Energy - Oil Field Services - 1.2% | | | | | | | | | | | | | | |
0 | | 0 | | 280,000 | | 280,000 | | (1)(2) Nabors Industries, Inc., Company Guarantee, 5.00%, 9/15/2020 | | 0 | | | 0 | | | | 271,886 | | | | 271,886 | |
0 | | 700,000 | | 400,000 | | 1,100,000 | | Nabors Industries, Inc., Company Guarantee, 9.25%, 1/15/2019 | | 0 | | | 867,951 | | | | 495,551 | | | | 1,363,502 | |
0 | | 0 | | 450,000 | | 450,000 | | Noble Holding International Ltd., Company Guarantee, 4.90%, 8/1/2020 | | 0 | | | 0 | | | | 467,753 | | | | 467,753 | |
0 | | 1,000,000 | | 0 | | 1,000,000 | | Sabine Pass LNG, LP, 7.50%, 11/30/2016 | | 0 | | | 942,890 | | | | 0 | | | | 942,890 | |
0 | | 0 | | 1,480,000 | | 1,480,000 | | Weatherford International Ltd., 6.00%, 3/15/2018 | | 0 | | | 0 | | | | 1,596,353 | | | | 1,596,353 | |
| | | | | | | | | | | | | | | | | | | | | | |
| | | | | | | | TOTAL | | 0 | | | 1,810,841 | | | | 2,831,543 | | | | 4,642,384 | |
| | | | | | | | | | | | | | | | | | | | | | |
Energy - Refining - 1.0% | | | | | | | | | | | | | | |
0 | | 1,600,000 | | 0 | | 1,600,000 | | NuStar Logistics, LP, 7.65%, 4/15/2018 | | 0 | | | 1,849,376 | | | | 0 | | | | 1,849,376 | |
0 | | 0 | | 240,000 | | 240,000 | | Valero Energy Corp., 9.375%, 3/15/2019 | | 0 | | | 0 | | | | 298,039 | | | | 298,039 | |
0 | | 0 | | 1,460,000 | | 1,460,000 | | Valero Energy Corp., Note, 4.75%, 4/1/2014 | | 0 | | | 0 | | | | 1,549,792 | | | | 1,549,792 | |
| | | | | | | | | | | | | | | | | | | | | | |
| | | | | | | | TOTAL | | 0 | | | 1,849,376 | | | | 1,847,831 | | | | 3,697,207 | |
| | | | | | | | | | | | | | | | | | | | | | |
Financial Institution - Banking - 13.7% | | | | | | | | | | | | | | |
0 | | 0 | | 1,600,000 | | 1,600,000 | | Astoria Financial Corp., Note, 5.75%, 10/15/2012 | | 0 | | | 0 | | | | 1,643,616 | | | | 1,643,616 | |
0 | | 0 | | 1,000,000 | | 1,000,000 | | Bank of America Corp., Note, 4.50%, 4/1/2015 | | 0 | | | 0 | | | | 1,022,476 | | | | 1,022,476 | |
0 | | 0 | | 2,000,000 | | 2,000,000 | | Bank of America Corp., Sr. Note, 5.375%, 6/15/2014 | | 0 | | | 0 | | | | 2,102,715 | | | | 2,102,715 | |
0 | | 0 | | 1,500,000 | | 1,500,000 | | Bank of America Corp., Sr. Unsecd. Note, 3.70%, 9/1/2015 | | 0 | | | 0 | | | | 1,492,242 | | | | 1,492,242 | |
0 | | 0 | | 3,000,000 | | 3,000,000 | | (1)(2) Barclays Bank PLC, 5.926%, 12/31/2049 | | 0 | | | 0 | | | | 2,673,750 | | | | 2,673,750 | |
0 | | 0 | | 2,030,000 | | 2,030,000 | | (3) Bear Stearns Cos., Inc., Sr. Unsecd. Note, 5.70%, 11/15/2014 | | 0 | | | 0 | | | | 2,230,162 | | | | 2,230,162 | |
0 | | 0 | | 2,470,000 | | 2,470,000 | | Capital One Capital IV, 6.745%, 2/17/2037 | | 0 | | | 0 | | | | 2,463,825 | | | | 2,463,825 | |
0 | | 0 | | 725,000 | | 725,000 | | Capital One Capital V, 10.25%, 8/15/2039 | | 0 | | | 0 | | | | 780,281 | | | | 780,281 | |
0 | | 0 | | 1,340,000 | | 1,340,000 | | Capital One Capital VI, 8.875%, 5/15/2040 | | 0 | | | 0 | | | | 1,405,325 | | | | 1,405,325 | |
0 | | 0 | | 1,000,000 | | 1,000,000 | | Citigroup, Inc., Sr. Note, 5.375%, 8/9/2020 | | 0 | | | 0 | | | | 1,042,220 | | | | 1,042,220 | |
121
| | | | | | | | | | | | | | | | | | | | | | | | |
0 | | 0 | | 500,000 | | 500,000 | | Citigroup, Inc., Sr. Unsecd. Note, 6.00%, 12/13/2013 | | | 0 | | | | 0 | | | | 547,527 | | | | 547,527 | |
0 | | 0 | | 2,290,000 | | 2,290,000 | | Citigroup, Inc., Sr. Unsecd. Note, 6.875%, 3/5/2038 | | | 0 | | | | 0 | | | | 2,556,382 | | | | 2,556,382 | |
0 | | 0 | | 480,000 | | 480,000 | | City National Corp., Note, 5.25%, 9/15/2020 | | | 0 | | | | 0 | | | | 473,267 | | | | 473,267 | |
1,000,000 | | 0 | | 0 | | 1,000,000 | | Comerica Bank, 5.20%, 8/22/2017 | | | 1,033,090 | | | | 0 | | | | 0 | | | | 1,033,090 | |
1,000,000 | | 0 | | 0 | | 1,000,000 | | Fifth Third Bancorp, 5.45%, 1/15/2017 | | | 1,020,320 | | | | 0 | | | | 0 | | | | 1,020,320 | |
900,000 | | 0 | | 0 | | 900,000 | | Goldman Sachs Group, Inc. 5.125%, 1/15/2015 | | | 969,966 | | | | 0 | | | | 0 | | | | 969,966 | |
0 | | 0 | | 250,000 | | 250,000 | | Huntington Bancshares, Inc., Sub Note, 7.00%, 12/15/2020 | | | 0 | | | | 0 | | | | 263,696 | | | | 263,696 | |
0 | | 0 | | 4,300,000 | | 4,300,000 | | JPMorgan Chase & Co., Sub. Note, 5.125%, 9/15/2014 | | | 0 | | | | 0 | | | | 4,586,983 | | | | 4,586,983 | |
0 | | 0 | | 2,440,000 | | 2,440,000 | | Manufactures & Traders Trust Co., Sub. Note, 5.629%, 12/1/2021 | | | 0 | | | | 0 | | | | 2,297,757 | | | | 2,297,757 | |
0 | | 0 | | 1,100,000 | | 1,100,000 | | Morgan Stanley, Sr. Unsecd. Note, 3.45%, 11/2/2015 | | | 0 | | | | 0 | | | | 1,080,165 | | | | 1,080,165 | |
0 | | 0 | | 2,520,000 | | 2,520,000 | | Morgan Stanley, Sr. Unsecd. Note, 4.20%, 11/20/2014 | | | 0 | | | | 0 | | | | 2,580,142 | | | | 2,580,142 | |
0 | | 0 | | 500,000 | | 500,000 | | Morgan Stanley, Sr. Unsecd. Note, 5.50%, 7/24/2020 | | | 0 | | | | 0 | | | | 506,008 | | | | 506,008 | |
0 | | 0 | | 825,000 | | 825,000 | | Morgan Stanley, Sr. Unsecd. Note, 5.95%, 12/28/2017 | | | 0 | | | | 0 | | | | 874,107 | | | | 874,107 | |
0 | | 0 | | 2,010,000 | | 2,010,000 | | Morgan Stanley, Sr. Unsecd. Note, 6.625%, 4/1/2018 | | | 0 | | | | 0 | | | | 2,206,353 | | | | 2,206,353 | |
0 | | 0 | | 800,000 | | 800,000 | | PNC Funding Corp., Sr. Unsecd. Note, 4.25%, 9/21/2015 | | | 0 | | | | 0 | | | | 841,299 | | | | 841,299 | |
0 | | 0 | | 450,000 | | 450,000 | | PNC Funding Corp., Sr. Unsecd. Note, 5.125%, 2/8/2020 | | | 0 | | | | 0 | | | | 472,885 | | | | 472,885 | |
0 | | 0 | | 410,000 | | 410,000 | | PNC Funding Corp., Sr. Unsecd. Note, 5.625%, 2/1/2017 | | | 0 | | | | 0 | | | | 437,667 | | | | 437,667 | |
1,500,000 | | 1,500,000 | | 0 | | 3,000,000 | | (1)(2) PNC Preferred FD, 144A, 6.517%, 12/31/2049 | | | 1,191,927 | | | | 1,191,927 | | | | 0 | | | | 2,383,854 | |
0 | | 0 | | 1,400,000 | | 1,400,000 | | (1)(2) Santander US Debt SA Unipersonal Bank Guarantee, Series 144A, 3.781%, 10/7/2015 | | | 0 | | | | 0 | | | | 1,316,112 | | | | 1,316,112 | |
0 | | 0 | | 630,000 | | 630,000 | | State Street Bank and Trust Co., Sub. Note, 5.30%, 1/15/2016 | | | 0 | | | | 0 | | | | 689,848 | | | | 689,848 | |
0 | | 0 | | 2,500,000 | | 2,500,000 | | Wachovia Bank N.A., 4.80%, 11/1/2014 | | | 0 | | | | 0 | | | | 2,648,713 | | | | 2,648,713 | |
0 | | 0 | | 1,320,000 | | 1,320,000 | | Wachovia Corp., 5.75%, 2/1/2018 | | | 0 | | | | 0 | | | | 1,468,816 | | | | 1,468,816 | |
122
| | | | | | | | | | | | | | | | | | | | | | | | |
750,000 | | 0 | | 0 | | 750,000 | | (9) Washington Mutual Bank, FA, 5.65%, 8/15/2014 | | | 938 | | | | 0 | | | | 0 | | | | 938 | |
0 | | 0 | | 1,175,000 | | 1,175,000 | | Westpac Banking Corp., Sr. Unsecd. Note, 4.875%, 11/19/2019 | | | 0 | | | | 0 | | | | 1,237,948 | | | | 1,237,948 | |
0 | | 0 | | 1,900,000 | | 1,900,000 | | Wilmington Trust Corp., Sub. Note, 8.50%, 4/2/2018 | | | 0 | | | | 0 | | | | 2,171,844 | | | | 2,171,844 | |
| | | | | | | | | | | | | | | | | | | | | | | | |
| | | | | | | | TOTAL | | | 4,216,241 | | | | 1,191,927 | | | | 46,114,131 | | | | 51,522,299 | |
| | | | | | | | | | | | | | | | | | | | | | | | |
Financial Institution - Brokerage - 5.7% | | | | | | | | | | | | | | | | |
0 | | 0 | | 4,480,000 | | 4,480,000 | | BlackRock, Inc., 6.25%, 9/15/2017 | | | 0 | | | | 0 | | | | 5,065,795 | | | | 5,065,795 | |
0 | | 0 | | 500,000 | | 500,000 | | (1)(2) CME Group Index Services LLC, Company Guarantee, Series 144A, 4.40%, 3/15/2018 | | | 0 | | | | 0 | | | | 512,437 | | | | 512,437 | |
0 | | 0 | | 900,000 | | 900,000 | | (1)(2) Cantor Fitzgerald LP, Bond, Series 144A, 7.875%, 10/15/2019 | | | 0 | | | | 0 | | | | 910,983 | | | | 910,983 | |
0 | | 0 | | 835,000 | | 835,000 | | Eaton Vance Corp., 6.50%, 10/2/2017 | | | 0 | | | | 0 | | | | 952,299 | | | | 952,299 | |
0 | | 0 | | 850,000 | | 850,000 | | (1)(2) FMR LLC, 4.75%, 3/1/2013 | | | 0 | | | | 0 | | | | 890,197 | | | | 890,197 | |
0 | | 0 | | 3,000,000 | | 3,000,000 | | (1)(2) FMR LLC, Bond, 7.57%, 6/15/2029 | | | 0 | | | | 0 | | | | 3,327,289 | | | | 3,327,289 | |
0 | | 0 | | 350,000 | | 350,000 | | Franklin Resources, Inc., Sr. Unsecd. Note, 4.625%, 5/20/2020 | | | 0 | | | | 0 | | | | 364,991 | | | | 364,991 | |
0 | | 0 | | 750,000 | | 750,000 | | Invesco Ltd., Sr. Unsecd. Note, 5.625%, 4/17/2012 | | | 0 | | | | 0 | | | | 780,203 | | | | 780,203 | |
0 | | 0 | | 680,000 | | 680,000 | | Janus Capital Group, Inc., Sr. Note, 6.50%, 6/15/2012 | | | 0 | | | | 0 | | | | 735,704 | | | | 735,704 | |
0 | | 0 | | 800,000 | | 800,000 | | Janus Capital Group, Inc., Sr. Note, 6.95%, 6/15/2017 | | | 0 | | | | 0 | | | | 834,540 | | | | 834,540 | |
0 | | 0 | | 635,000 | | 635,000 | | Jefferies Group, Inc., Sr. Unsecd. Note, 6.875%, 4/15/2021 | | | 0 | | | | 0 | | | | 669,634 | | | | 669,634 | |
0 | | 0 | | 1,040,000 | | 1,040,000 | | Jefferies Group, Inc., Sr. Unsecd. Note, 8.50%, 7/15/2019 | | | 0 | | | | 0 | | | | 1,193,307 | | | | 1,193,307 | |
0 | | 0 | | 2,290,000 | | 2,290,000 | | (4)(5) Lehman Brothers Holdings, Inc., 7.875%, 8/15/2011 | | | 0 | | | | 0 | | | | 541,013 | | | | 541,013 | |
0 | | 0 | | 740,000 | | 740,000 | | NASDAQ OMX Group, Inc., Sr. Unsecd. Note, 5.55%, 1/15/2020 | | | 0 | | | | 0 | | | | 745,485 | | | | 745,485 | |
0 | | 0 | | 690,000 | | 690,000 | | Nuveen Investments, 5.50%, 9/15/2015 | | | 0 | | | | 0 | | | | 595,125 | | | | 595,125 | |
0 | | 0 | | 1,210,000 | | 1,210,000 | | Raymond James Financial, Inc., 8.60%, 8/15/2019 | | | 0 | | | | 0 | | | | 1,428,384 | | | | 1,428,384 | |
700,000 | | 0 | | 0 | | 700,000 | | SunAmerica, Inc., 8.125%, 4/28/2023 | | | 715,540 | | | | 0 | | | | 0 | | | | 715,540 | |
123
| | | | | | | | | | | | | | | | | | | | | | | | |
0 | | 0 | | 1,225,000 | | 1,225,000 | | TD Ameritrade Holding Corp., Company Guarantee, 4.15%, 12/1/2014 | | | 0 | | | | 0 | | | | 1,268,495 | | | | 1,268,495 | |
| | | | | | | | | | | | | | | | | | | | | | | | |
| | | | | | | | TOTAL | | | 715,540 | | | | 0 | | | | 20,815,881 | | | | 21,531,421 | |
| | | | | | | | | | | | | | | | | | | | | | | | |
Financial Institution - Finance Noncaptive - 4.5% | | | | | | | | | | | | | | | | |
0 | | 0 | | 850,000 | | 850,000 | | American Express Co., Note, 2.75%, 9/15/2015 | | | 0 | | | | 0 | | | | 839,552 | | | | 839,552 | |
0 | | 0 | | 1,130,000 | | 1,130,000 | | American Express Credit Co., 5.875%, 5/2/2013 | | | 0 | | | | 0 | | | | 1,231,445 | | | | 1,231,445 | |
0 | | 0 | | 1,000,000 | | 1,000,000 | | American Express Credit Co., Sr. Unsecd. Note, 5.125%, 8/25/2014 | | | 0 | | | | 0 | | | | 1,076,139 | | | | 1,076,139 | |
0 | | 0 | | 500,000 | | 500,000 | | American International Group, Inc., Sr. Unsecd. Note, 6.40%, 12/15/2020 | | | 0 | | | | 0 | | | | 521,875 | | | | 521,875 | |
0 | | 0 | | 1,200,000 | | 1,200,000 | | Discover Bank, Sub. 8.70%, 11/18/2019 | | | 0 | | | | 0 | | | | 1,414,794 | | | | 1,414,794 | |
0 | | 0 | | 2,680,000 | | 2,680,000 | | General Electric Capital Corp., 5.625%, 5/1/2018 | | | 0 | | | | 0 | | | | 2,923,754 | | | | 2,923,754 | |
0 | | 0 | | 1,000,000 | | 1,000,000 | | General Electric Capital Corp., Sr. Unsecd. Note, Series MTN, 6.875%, 1/10/2039 | | | 0 | | | | 0 | | | | 1,161,238 | | | | 1,161,238 | |
0 | | 0 | | 4,400,000 | | 4,400,000 | | HSBC Finance Capital Trust IX, Note, 5.911%, 11/30/2035 | | | 0 | | | | 0 | | | | 4,092,000 | | | | 4,092,000 | |
0 | | 0 | | 1,100,000 | | 1,100,000 | | (1)(2) ILFC E-Capital Trust 1, 5.90%, 12/21/2065 | | | 0 | | | | 0 | | | | 838,266 | | | | 838,266 | |
0 | | 0 | | 1,000,000 | | 1,000,000 | | (1)(2) Lukoil International Finance BV, 6.356%, 6/7/2017 | | | 0 | | | | 0 | | | | 1,050,000 | | | | 1,050,000 | |
0 | | 0 | | 450,000 | | 450,000 | | (1)(2) Macquarie Group Ltd., Note, Series 144A, 7.625%, 8/13/2019 | | | 0 | | | | 0 | | | | 498,760 | | | | 498,760 | |
0 | | 0 | | 1,400,000 | | 1,400,000 | | (1)(2) Macquarie Group Ltd., Sr. Unsecd. Note, Series 144A, 6.00%, 1/14/2020 | | | 0 | | | | 0 | | | | 1,414,159 | | | | 1,414,159 | |
| | | | | | | | | | | | | | | | | | | | | | | | |
| | | | | | | | TOTAL | | | 0 | | | | 0 | | | | 17,061,982 | | | | 17,061,982 | |
| | | | | | | | | | | | | | | | | | | | | | | | |
Financial Institution - Insurance - Health - 0.5% | | | | | | | | | | | | | | | | |
0 | | 0 | | 555,000 | | 555,000 | | UnitedHealth Group, Inc., Sr. Unsecd. Note, 6.00%, 2/15/2018 | | | 0 | | | | 0 | | | | 629,690 | | | | 629,690 | |
0 | | 0 | | 1,130,000 | | 1,130,000 | | Wellpoint, Inc., Sr. Unsecd. Note, 7.00%, 2/15/2019 | | | 0 | | | | 0 | | | | 1,328,888 | | | | 1,328,888 | |
| | | | | | | | | | | | | | | | | | | | | | | | |
| | | | | | | | TOTAL | | | 0 | | | | 0 | | | | 1,958,578 | | | | 1,958,578 | |
| | | | | | | | | | | | | | | | | | | | | | | | |
124
| | | | | | | | | | | | | | | | | | | | | | | | |
Financial Institution - Insurance - Life - 2.6% | | | | | | | | | | | | | | | | |
0 | | 0 | | 910,000 | | 910,000 | | (1)(2) AXA Equitable Life Insurance Co., Sub., 7.70%, 12/1/2015 | | | 0 | | | | 0 | | | | 1,011,284 | | | | 1,011,284 | |
0 | | 0 | | 580,000 | | 580,000 | | Aflac, Inc., Sr. Unsecd. Note, 6.90%, 12/17/2039 | | | 0 | | | | 0 | | | | 613,252 | | | | 613,252 | |
0 | | 0 | | 390,000 | | 390,000 | | Aflac, Inc., Sr. Unsecd. Note, 8.50%, 5/15/2019 | | | 0 | | | | 0 | | | | 483,899 | | | | 483,899 | |
0 | | 0 | | 350,000 | | 350,000 | | Lincoln National Corp., Sr. Note, 7.00%, 6/15/2040 | | | 0 | | | | 0 | | | | 382,055 | | | | 382,055 | |
1,700,000 | | 0 | | 0 | | 1,700,000 | | MetLife, Inc., 4.75%, 2/8/2021 | | | 1,745,951 | | | | 0 | | | | 0 | | | | 1,745,951 | |
0 | | 0 | | 500,000 | | 500,000 | | (1)(2) New York Life Insurance Co., Sub. Note, 6.75%, 11/15/2039 | | | 0 | | | | 0 | | | | 580,596 | | | | 580,596 | |
0 | | 0 | | 1,300,000 | | 1,300,000 | | (1)(2) Northwestern Mutual Life Insurance Co., Sub. Note, Series 144A, 6.063%, 3/30/2040 | | | 0 | | | | 0 | | | | 1,383,469 | | | | 1,383,469 | |
0 | | 0 | | 350,000 | | 350,000 | | (1)(2) Penn Mutual Life Insurance Co., Sr. Note, Series 144A, 7.625%, 6/15/2040 | | | 0 | | | | 0 | | | | 347,197 | | | | 347,197 | |
1,500,000 | | 0 | | 0 | | 1,500,000 | | Prudential Financial, Inc., 6.10%, 6/15/2017 | | | 1,660,170 | | | | 0 | | | | 0 | | | | 1,660,170 | |
0 | | 0 | | 850,000 | | 850,000 | | Prudential Financial, Inc., 6.625%, 12/1/2037 | | | 0 | | | | 0 | | | | 937,240 | | | | 937,240 | |
0 | | 0 | | 500,000 | | 500,000 | | Prudential Financial, Inc., Sr. Unsecd. Note, 4.75%, 9/17/2015 | | | 0 | | | | 0 | | | | 532,782 | | | | 532,782 | |
0 | | 0 | | 250,000 | | 250,000 | | (1) Union Central Life Insurance Co., Note, 8.20%, 11/1/2026 | | | 0 | | | | 0 | | | | 249,103 | | | | 249,103 | |
| | | | | | | | | | | | | | | | | | | | | | | | |
| | | | | | | | TOTAL | | | 3,406,121 | | | | 0 | | | | 6,520,877 | | | | 9,926,998 | |
| | | | | | | | | | | | | | | | | | | | | | | | |
Financial Institution - Insurance - P&C - 2.6% | | | | | | | | | | | | | | | | |
0 | | 0 | | 1,300,000 | | 1,300,000 | | ACE INA Holdings, Inc., 5.60%, 5/15/2015 | | | 0 | | | | 0 | | | | 1,438,148 | | | | 1,438,148 | |
0 | | 0 | | 1,380,000 | | 1,380,000 | | ACE INA Holdings, Inc., Sr. Note, 5.70%, 2/15/2017 | | | 0 | | | | 0 | | | | 1,513,905 | | | | 1,513,905 | |
0 | | 0 | | 330,000 | | 330,000 | | CNA Financial Corp., 6.50%, 8/15/2016 | | | 0 | | | | 0 | | | | 353,813 | | | | 353,813 | |
0 | | 0 | | 680,000 | | 680,000 | | CNA Financial Corp., Sr. Unsecd. Note, 5.875%, 8/15/2020 | | | 0 | | | | 0 | | | | 678,288 | | | | 678,288 | |
0 | | 0 | | 100,000 | | 100,000 | | Chubb Corp., Sr. Note, 5.75%, 5/15/2018 | | | 0 | | | | 0 | | | | 111,391 | | | | 111,391 | |
0 | | 0 | | 1,180,000 | | 1,180,000 | | Horace Mann Educators Corp., Sr. Note, 6.85%, 4/15/2016 | | | 0 | | | | 0 | | | | 1,241,220 | | | | 1,241,220 | |
125
| | | | | | | | | | | | | | | | | | | | | | | | |
0 | | 0 | | 2,200,000 | | 2,200,000 | | (1)(2) Liberty Mutual Group, Inc., Unsecd. Note, 5.75%, 3/15/2014 | | | 0 | | | | 0 | | | | 2,289,890 | | | | 2,289,890 | |
0 | | 0 | | 250,000 | | 250,000 | | MBIA Insurance Corp., Sr. Deb., 6.625%, 10/1/2028 | | | 0 | | | | 0 | | | | 185,595 | | | | 185,595 | |
0 | | 670,000 | | 0 | | 670,000 | | PXRE Capital Trust, 8.85%, 2/1/2027 | | | 0 | | | | 623,100 | | | | 0 | | | | 623,100 | |
0 | | 0 | | 370,000 | | 370,000 | | The Travelers Cos, Inc., Sr. Unsecd. Note, 5.50%, 12/1/2015 | | | 0 | | | | 0 | | | | 413,914 | | | | 413,914 | |
0 | | 0 | | 1,050,000 | | 1,050,000 | | (1)(2) ZFS Finance USA Trust II, Jr. Sub. Note, 6.45%, 12/15/2065 | | | 0 | | | | 0 | | | | 1,036,875 | | | | 1,036,875 | |
| | | | | | | | | | | | | | | | | | | | | | | | |
| | | | | | | | TOTAL | | | 0 | | | | 623,100 | | | | 9,263,039 | | | | 9,886,139 | |
| | | | | | | | | | | | | | | | | | | | | | | | |
Financial Institution - REITs - 4.7% | | | | | | | | | | | | | | | | |
0 | | 0 | | 640,000 | | 640,000 | | AMB Property LP, 6.30%, 6/1/2013 | | | 0 | | | | 0 | | | | 685,471 | | | | 685,471 | |
0 | | 0 | | 1,200,000 | | 1,200,000 | | Boston Properties LP, Sr. Unsecd. Note, 5.875%, 10/15/2019 | | | 0 | | | | 0 | | | | 1,307,915 | | | | 1,307,915 | |
0 | | 1,075,000 | | 0 | | 1,075,000 | | CommonWealth REIT, 6.25%, 8/15/2016 | | | 0 | | | | 1,128,331 | | | | 0 | | | | 1,128,331 | |
1,700,000 | | 0 | | 0 | | 1,700,000 | | CommonWealth REIT, 6.25%, 6/15/2017 | | | 1,762,407 | | | | 0 | | | | 0 | | | | 1,762,407 | |
0 | | 0 | | 890,000 | | 890,000 | | Equity One, Inc., Bond, 6.00%, 9/15/2017 | | | 0 | | | | 0 | | | | 884,063 | | | | 884,063 | |
0 | | 0 | | 200,000 | | 200,000 | | Equity One, Inc., Sr. Unsecd. Note, 6.25%, 12/15/2014 | | | 0 | | | | 0 | | | | 211,239 | | | | 211,239 | |
0 | | 700,000 | | 0 | | 700,000 | | First Industrial, LP, 7.60%, 7/15/2028 | | | 0 | | | | 607,250 | | | | 0 | | | | 607,250 | |
0 | | 500,000 | | 0 | | 500,000 | | First Industrial, LP, 7.75%, 4/15/2032 | | | 0 | | | | 418,715 | | | | 0 | | | | 418,715 | |
0 | | 0 | | 960,000 | | 960,000 | | Health Care REIT, Inc., Sr. Unsecd. Note, 6.125%, 4/15/2020 | | | 0 | | | | 0 | | | | 1,012,350 | | | | 1,012,350 | |
0 | | 1,300,000 | | 0 | | 1,300,000 | | Hospitality Properties Trust, 6.75%, 2/15/2013 | | | 0 | | | | 1,361,594 | | | | 0 | | | | 1,361,594 | |
0 | | 1,171,000 | | 0 | | 1,171,000 | | iStar Financial, Inc. - Series B, 5.70%, 3/1/2014 | | | 0 | | | | 1,054,485 | | | | 0 | | | | 1,054,485 | |
0 | | 0 | | 850,000 | | 850,000 | | Liberty Property LP, 6.625%, 10/1/2017 | | | 0 | | | | 0 | | | | 968,596 | | | | 968,596 | |
0 | | 0 | | 630,000 | | 630,000 | | Prologis, Conv. Bond, 2.25%, 4/1/2037 | | | 0 | | | | 0 | | | | 628,154 | | | | 628,154 | |
0 | | 0 | | 250,000 | | 250,000 | | Prologis, Sr. Note, 5.50%, 4/1/2012 | | | 0 | | | | 0 | | | | 258,138 | | | | 258,138 | |
0 | | 0 | | 450,000 | | 450,000 | | Prologis, Sr. Note, 6.875%, 3/15/2020 | | | 0 | | | | 0 | | | | 478,594 | | | | 478,594 | |
0 | | 0 | | 1,260,000 | | 1,260,000 | | Prologis, Sr. Note, 7.625%, 8/15/2014 | | | 0 | | | | 0 | | | | 1,421,934 | | | | 1,421,934 | |
126
| | | | | | | | | | | | | | | | | | | | | | | | |
0 | | 1,500,000 | | 0 | | 1,500,000 | | Realty Income Corp., 6.75%, 8/15/2019 | | | 0 | | | | 1,699,395 | | | | 0 | | | | 1,699,395 | |
0 | | 0 | | 470,000 | | 470,000 | | Regency Centers LP, Company Guarantee, 4.80%, 4/15/2021 | | | 0 | | | | 0 | | | | 450,492 | | | | 450,492 | |
0 | | 0 | | 700,000 | | 700,000 | | Tanger Properties LP, Sr. Unsecd. Note, 6.125%, 6/1/2020 | | | 0 | | | | 0 | | | | 750,930 | | | | 750,930 | |
700,000 | | 0 | | 0 | | 700,000 | | Washington REIT, 5.25%, 1/15/2014 | | | 735,350 | | | | 0 | | | | 0 | | | | 735,350 | |
| | | | | | | | | | | | | | | | | | | | | | | | |
| | | | | | | | TOTAL | | | 2,497,757 | | | | 6,269,770 | | | | 9,057,876 | | | | 17,825,403 | |
| | | | | | | | | | | | | | | | | | | | | | | | |
Municipal Services - 0.7% | | | | | | | | | | | | | | | | |
0 | | 0 | | 895,000 | | 895,000 | | (1)(2) Army Hawaii Family Housing, 5.524%, 6/15/2050 | | | 0 | | | | 0 | | | | 769,378 | | | | 769,378 | |
0 | | 0 | | 1,850,000 | | 1,850,000 | | (1)(2) Camp Pendleton & Quantico Housing LLC, 5.572%, 10/1/2050 | | | 0 | | | | 0 | | | | 1,641,431 | | | | 1,641,431 | |
| | | | | | | | | | | | | | | | | | | | | | | | |
| | | | | | | | TOTAL | | | 0 | | | | 0 | | | | 2,410,809 | | | | 2,410,809 | |
| | | | | | | | | | | | | | | | | | | | | | | | |
Sovereign - 0.6% | | | | | | | | | | | | | | | | |
0 | | 0 | | 1,120,000 | | 1,120,000 | | Corp Andina De Fomento, Sr. Unsecd. Note, 3.75%, 1/15/2016 | | | 0 | | | | 0 | | | | 1,103,184 | | | | 1,103,184 | |
0 | | 0 | | 900,000 | | 900,000 | | (1)(2) State of Qatar, 5.25%, 1/20/2020 | | | 0 | | | | 0 | | | | 957,375 | | | | 957,375 | |
| | | | | | | | | | | | | | | | | | | | | | | | |
| | | | | | | | TOTAL | | | 0 | | | | 0 | | | | 2,060,559 | | | | 2,060,559 | |
| | | | | | | | | | | | | | | | | | | | | | | | |
Technology - 2.6% | | | | | | | | | | | | | | | | |
0 | | 0 | | 1,120,000 | | 1,120,000 | | Adobe Systems, Inc., Sr. Unsecd. Note, 3.25%, 2/1/2015 | | | 0 | | | | 0 | | | | 1,142,402 | | | | 1,142,402 | |
0 | | 0 | | 700,000 | | 700,000 | | BMC Software, Inc., 7.25%, 6/1/2018 | | | 0 | | | | 0 | | | | 810,473 | | | | 810,473 | |
0 | | 0 | | 670,000 | | 670,000 | | Fiserv, Inc., Sr. Note, 6.80%, 11/20/2017 | | | 0 | | | | 0 | | | | 740,621 | | | | 740,621 | |
0 | | 0 | | 3,400,000 | | 3,400,000 | | Harris Corp., 5.95%, 12/1/2017 | | | 0 | | | | 0 | | | | 3,763,383 | | | | 3,763,383 | |
0 | | 0 | | 1,085,000 | | 1,085,000 | | Hewlett-Packard Co., Note, 5.40%, 3/1/2017 | | | 0 | | | | 0 | | | | 1,213,583 | | | | 1,213,583 | |
0 | | 0 | | 1,230,000 | | 1,230,000 | | KLA-Tencor Corp., 6.90%, 5/1/2018 | | | 0 | | | | 0 | | | | 1,355,979 | | | | 1,355,979 | |
0 | | 0 | | 515,000 | | 515,000 | | Maxim Integrated Products, Inc., Note, 3.45%, 6/14/2013 | | | 0 | | | | 0 | | | | 525,954 | | | | 525,954 | |
0 | | 0 | | 285,000 | | 285,000 | | (1)(2) SAIC, Inc., Company Guarantee, Series 144A, 5.95%, 12/1/2040 | | | 0 | | | | 0 | | | | 290,580 | | | | 290,580 | |
| | | | | | | | | | | | | | | | | | | | | | | | |
| | | | | | | | TOTAL | | | 0 | | | | 0 | | | | 9,842,975 | | | | 9,842,975 | |
| | | | | | | | | | | | | | | | | | | | | | | | |
127
| | | | | | | | | | | | | | | | | | | | | | | | |
Transportation - Airlines - 0.3% | | | | | | | | | | | | | | | | | | |
237,395 | | 0 | | 0 | | 237,395 | | Continental Airlines, Inc. - Pass-Thru Cert 1991-1 Class A, 6.545%, 8/2/2020 | | | 252,510 | | | | 0 | | | | 0 | | | | 252,510 | |
0 | | 822,006 | | 0 | | 822,006 | | Continental Airlines, Inc. - Pass-Thru Cert 1997-1 Class 1A, 7.461%, 10/1/2016 | | | 0 | | | | 853,826 | | | | 0 | | | | 853,826 | |
0 | | 0 | | 4,000 | | 4,000 | | Southwest Airlines Co., 6.50%, 3/1/2012 | | | 0 | | | | 0 | | | | 4,196 | | | | 4,196 | |
| | | | | | | | | | | | | | | | | | | | | | | | |
| | | | | | | | TOTAL | | | 252,510 | | | | 853,826 | | | | 4,196 | | | | 1,110,532 | |
| | | | | | | | | | | | | | | | | | | | | | | | |
Transportation - Railroads - 0.8% | | | | | | | | | | | | | | | | | | |
0 | | 0 | | 2,020,000 | | 2,020,000 | | Burlington Northern Santa Fe Corp., 4.875%, 1/15/2015 | | | 0 | | | | 0 | | | | 2,197,963 | | | | 2,197,963 | |
0 | | 0 | | 465,000 | | 465,000 | | Burlington Northern Santa Fe Corp., Deb., 5.75%, 5/1/2040 | | | 0 | | | | 0 | | | | 484,370 | | | | 484,370 | |
0 | | 0 | | 153,378 | | 153,378 | | Burlington Northern Santa Fe Corp., Pass Thru Cert., 7.57%, 1/2/2021 | | | 0 | | | | 0 | | | | 181,400 | | | | 181,400 | |
| | | | | | | | | | | | | | | | | | | | | | | | |
| | | | | | | | TOTAL | | | 0 | | | | 0 | | | | 2,863,733 | | | | 2,863,733 | |
| | | | | | | | | | | | | | | | | | | | | | | | |
Transportation - Services - 1.2% | | | | | | | | | | | | | | | | | | |
0 | | 0 | | 1,695,000 | | 1,695,000 | | (1)(2) Enterprise Rent-A-Car USA Finance Co., 6.375%, 10/15/2017 | | | 0 | | | | 0 | | | | 1,888,856 | | | | 1,888,856 | |
171,994 | | 0 | | 0 | | 171,994 | | FedEx Corp., Pass-Thru Cert., 7.50%, 1/15/2018 | | | 180,952 | | | | 0 | | | | 0 | | | | 180,952 | |
0 | | 1,100,000 | | 0 | | 1,100,000 | | Overseas Shipholding Group, Inc., 8.75%, 12/1/2013 | | | 0 | | | | 1,187,439 | | | | 0 | | | | 1,187,439 | |
0 | | 976,077 | | 0 | | 976,077 | | (1)(2) Windsor Petroleum Transportation, 144A, 7.84%, 1/15/2021 | | | 0 | | | | 855,190 | | | | 0 | | | | 855,190 | |
0 | | 0 | | 530,000 | | 530,000 | | United Parcel Service, Inc., Sr. Unsecd. Note, 3.125%, 1/15/2021 | | | 0 | | | | 0 | | | | 494,443 | | | | 494,443 | |
| | | | | | | | | | | | | | | | | | | | | | | | |
| | | | | | | | TOTAL | | | 180,952 | | | | 2,042,629 | | | | 2,383,299 | | | | 4,606,880 | |
| | | | | | | | | | | | | | | | | | | | | | | | |
Utility - Electric - 6.3% | | | | | | | | | | | | | | | | | | |
0 | | 0 | | 930,000 | | 930,000 | | Cleveland Electric Illuminating Co., Sr. Unsecd. Note, 5.95%, 12/15/2036 | | | 0 | | | | 0 | | | | 891,372 | | | | 891,372 | |
0 | | 0 | | 1,130,000 | | 1,130,000 | | Commonwealth Edison Co., 1st Mtg. Bond, 5.80%, 3/15/2018 | | | 0 | | | | 0 | | | | 1,269,494 | | | | 1,269,494 | |
0 | | 0 | | 910,000 | | 910,000 | | Consolidated Edison Co., Sr. Unsecd. Note, 5.50%, 9/15/2016 | | | 0 | | | | 0 | | | | 1,033,208 | | | | 1,033,208 | |
128
| | | | | | | | | | | | | | | | | | | | | | | | |
0 | | 0 | | 610,000 | | 610,000 | | (1)(2) Enel Finance International SA, Company Guarantee, Series 144A, 3.875%, 10/7/2014 | | | 0 | | | | 0 | | | | 622,558 | | | | 622,558 | |
0 | | 1,700,000 | | 0 | | 1,700,000 | | Entergy Gulf States, Inc., 6.18%, 3/1/2035 | | | 0 | | | | 1,601,468 | | | | 0 | | | | 1,601,468 | |
1,975,000 | | 0 | | 0 | | 1,975,000 | | Entergy Louisiana, LLC, 5.40%, 11/1/2024 | | | 2,119,550 | | | | 0 | | | | 0 | | | | 2,119,550 | |
0 | | 0 | | 500,000 | | 500,000 | | Exelon Generation Co., LLC, Sr. Unsecd. Note, 5.75%, 10/1/2041 | | | 0 | | | | 0 | | | | 477,201 | | | | 477,201 | |
0 | | 0 | | 620,000 | | 620,000 | | FPL Group Capital, Inc., 7.875%, 12/15/2015 | | | 0 | | | | 0 | | | | 748,765 | | | | 748,765 | |
0 | | 0 | | 570,000 | | 570,000 | | FirstEnergy Solutions Corp., Company Guarantee, 4.80%, 2/15/2015 | | | 0 | | | | 0 | | | | 599,105 | | | | 599,105 | |
0 | | 0 | | 800,000 | | 800,000 | | FirstEnergy Solutions Corp., Company Guarantee, 6.05%, 8/15/2021 | | | 0 | | | | 0 | | | | 823,419 | | | | 823,419 | |
0 | | 0 | | 1,629,330 | | 1,629,330 | | (1)(2) Great River Energy, 1st Mtg. Note, 5.829%, 7/1/2017 | | | 0 | | | | 0 | | | | 1,830,484 | | | | 1,830,484 | |
0 | | 0 | | 420,000 | | 420,000 | | KCP&L Greater Missouri Operations Co., Sr. Unsecd. Note, 11.875%, 7/1/2012 | | | 0 | | | | 0 | | | | 476,962 | | | | 476,962 | |
0 | | 0 | | 2,650,000 | | 2,650,000 | | MidAmerican Energy Holdings Co., Sr. Unsecd. Note, 5.95%, 5/15/2037 | | | 0 | | | | 0 | | | | 2,821,750 | | | | 2,821,750 | |
0 | | 0 | | 635,000 | | 635,000 | | Northern States Power Co., MN, 1st Mtg. Bond, 5.25%, 3/1/2018 | | | 0 | | | | 0 | | | | 704,763 | | | | 704,763 | |
71,000 | | 0 | | 0 | | 71,000 | | Oglethorpe Power Corp., 6.974%, 6/30/2011 | | | 72,599 | | | | 0 | | | | 0 | | | | 72,599 | |
750,000 | | 0 | | 0 | | 750,000 | | PacifiCorp, 6.90%, 11/15/2011 | | | 790,380 | | | | 0 | | | | 0 | | | | 790,380 | |
0 | | 0 | | 1,110,000 | | 1,110,000 | | PPL Energy Supply LLC, Sr. Unsecd. Note, 6.0%, 12/15/2036 | | | 0 | | | | 0 | | | | 1,108,815 | | | | 1,108,815 | |
0 | | 0 | | 1,390,000 | | 1,390,000 | | PSI Energy, Inc., Bond, 6.05%, 6/15/2016 | | | 0 | | | | 0 | | | | 1,590,136 | | | | 1,590,136 | |
0 | | 0 | | 500,000 | | 500,000 | | Southwestern Electric Power Co., Sr. Unsecd. Note, 6.20%, 3/15/2040 | | | 0 | | | | 0 | | | | 510,851 | | | | 510,851 | |
0 | | 0 | | 230,000 | | 230,000 | | TECO Finance, Inc. Company Guarantee, 5.15%, 3/15/2020 | | | 0 | | | | 0 | | | | 238,892 | | | | 238,892 | |
0 | | 0 | | 800,000 | | 800,000 | | UIL Holdings Corp., Sr. Unsecd. Note, 4.625%, 10/1/2020 | | | 0 | | | | 0 | | | | 758,994 | | | | 758,994 | |
0 | | 0 | | 1,570,000 | | 1,570,000 | | Union Electric Co., 6.00%, 4/1/2018 | | | 0 | | | | 0 | | | | 1,740,616 | | | | 1,740,616 | |
129
| | | | | | | | | | | | | | | | | | | | | | | | |
1,000,000 | | 0 | | 0 | | 1,000,000 | | Westar Energy, Inc., 5.15%, 1/1/2017 | | | 1,057,280 | | | | 0 | | | | 0 | | | | 1,057,280 | |
| | | | | | | | | | | | | | | | | | | | | | | | |
| | | | | | | | TOTAL | | | 4,039,809 | | | | 1,601,468 | | | | 18,247,385 | | | | 23,888,662 | |
| | | | | | | | | | | | | | | | | | | | | | | | |
| | | | |
Utilities - Natural Gas Distributor - 0.1% | | | | | | | | | | | | | | | | |
0 | | 0 | | 280,000 | | 280,000 | | (1)(2) Florida Gas Transmission Co. LLC, Sr. Unsecd. Note, Series 144A, 5.45%, 7/15/2020 | | | 0 | | | | 0 | | | | 292,707 | | | | 292,707 | |
| | | | | | | | | | | | | | | | | | | | | | | | |
| | | | |
Utility - Natural Gas Pipelines - 3.5% | | | | | | | | | | | | | | | | |
0 | | 0 | | 990,000 | | 990,000 | | Consolidated Natural Gas Co., 5.00%, 12/1/2014 | | | 0 | | | | 0 | | | | 1,082,402 | | | | 1,082,402 | |
0 | | 0 | | 1,865,000 | | 1,865,000 | | Duke Capital Corp., Sr. Note, 6.25%, 2/15/2013 | | | 0 | | | | 0 | | | | 2,023,867 | | | | 2,023,867 | |
0 | | 0 | | 1,850,000 | | 1,850,000 | | Enbridge, Inc., Sr. Note, 5.60%, 4/1/2017 | | | 0 | | | | 0 | | | | 2,075,743 | | | | 2,075,743 | |
0 | | 0 | | 1,670,000 | | 1,670,000 | | Enterprise Products Operating LLC, Company Guarantee, Series O, 9.75%, 1/31/2014 | | | 0 | | | | 0 | | | | 2,018,644 | | | | 2,018,644 | |
1,600,000 | | 0 | | 0 | | 1,600,000 | | Kinder Morgan Energy Partners, LP, 5.30%, 9/15/2020 | | | 1,672,128 | | | | 0 | | | | 0 | | | | 1,672,128 | |
0 | | 0 | | 2,750,000 | | 2,750,000 | | Kinder Morgan Energy Partners, LP, Sr. Unsecd. Note, 5.80%, 3/15/2035 | | | 0 | | | | 0 | | | | 2,654,359 | | | | 2,654,359 | |
0 | | 0 | | 1,110,000 | | 1,110,000 | | Williams Partners LP, 5.25%, 3/15/2020 | | | 0 | | | | 0 | | | | 1,152,722 | | | | 1,152,722 | |
0 | | 0 | | 380,000 | | 380,000 | | Williams Partners LP, Sr. Unsecd. Note, 4.125%, 11/15/2020 | | | 0 | | | | 0 | | | | 360,649 | | | | 360,649 | |
| | | | | | | | | | | | | | | | | | | | | | | | |
| | | | | | | | TOTAL | | | 1,672,128 | | | | 0 | | | | 11,368,386 | | | | 13,040,514 | |
| | | | | | | | | | | | | | | | | | | | | | | | |
| | | | | | | | TOTAL CORPORATE BONDS (IDENTIFIED COST $314,038,925) | | | 30,456,325 | | | | 31,681,400 | | | | 265,600,297 | | | | 327,738,022 | |
| | | | | | | | | | | | | | | | | | | | | | | | |
| | | |
COMMERCIAL MORTGAGE PASS-THRU CERTIFICATES - 0.4% | | | | | | | | | | | | | |
1,500,000 | | 0 | | 0 | | 1,500,000 | | TIAA Seasoned Commercial Mortgage Trust 2007-C4, 6.05%, 8/1/2039 (IDENTIFIED COST $1,487,179) | | | 1,537,676 | | | | 0 | | | | 0 | | | | 1,537,676 | |
| | | | | | | | | | | | | | | | | | | | | | | | |
| | | | |
GOVERNMENT/AGENCY - 0.1% | | | | | | | | | | | | | | | | |
Sovereign - 0.1% | | | | | | | | | | | | | | | | | | |
0 | | 0 | | 500,000 | | 500,000 | | Sweden, Government of, 10.25%, 11/1/2015 (IDENTIFIED COST $500,000) | | | 0 | | | | 0 | | | | 514,590 | | | | 514,590 | |
| | | | | | | | | | | | | | | | | | | | | | | | |
130
| | | | | | | | | | | | | | | | | | | | | | | | |
GOVERNMENT AGENCIES - 1.7% | | | | | | | | | | | | | | | | |
750,000 | | 0 | | 0 | | 750,000 | | Federal Home Loan Bank, 0.10%, 1/7/2011 | | | 749,985 | | | | 0 | | | | 0 | | | | 749,985 | |
1,000,000 | | 0 | | 0 | | 1,000,000 | | Federal Home Loan Bank, 0.10%, 1/21/2011 | | | 999,939 | | | | 0 | | | | 0 | | | | 999,939 | |
750,000 | | 0 | | 0 | | 750,000 | | Federal Home Loan Bank, 0.14%, 1/28/2011 | | | 749,921 | | | | 0 | | | | 0 | | | | 749,921 | |
0 | | 750,000 | | 0 | | 750,000 | | Federal Home Loan Bank, 0.20%, 2/25/2011 | | | 0 | | | | 749,897 | | | | 0 | | | | 749,897 | |
0 | | 750,000 | | 0 | | 750,000 | | Federal Home Loan Mortgage Corp., 0.09%, 1/10/2011 | | | 0 | | | | 749,981 | | | | 0 | | | | 749,981 | |
0 | | 1,000,000 | | 0 | | 1,000,000 | | Federal Home Loan Mortgage Corp., 0.12%, 1/18/2011 | | | 0 | | | | 999,939 | | | | 0 | | | | 999,939 | |
500,000 | | 0 | | 0 | | 500,000 | | Federal National Mortgage Association, 0.07%, 1/7/2011 | | | 499,993 | | | | 0 | | | | 0 | | | | 499,993 | |
1,000,000 | | 0 | | 0 | | 1,000,000 | | Federal National Mortgage Association, 0.09%, 1/12/2011 | | | 999,969 | | | | 0 | | | | 0 | | | | 999,969 | |
| | | | | | | | | | | | | | | | | | | | | | | | |
| | | | | | | | TOTAL GOVERNMENT AGENCIES (IDENTIFIED COST $6,499,624) | | | 3,999,807 | | | | 2,499,817 | | | | 0 | | | | 6,499,624 | |
| | | | | | | | | | | | | | | | | | | | | | | | |
MORTGAGE-BACKED SECURITIES - 5.5% | | | | | | | | | | | | | | | | |
Federal Home Loan Mortgage Corporation - 1.9% | | | | | | | | | | | | | | | | |
473,221 | | 354,916 | | 0 | | 828,137 | | Federal Home Loan Mortgage Corp., 3023 Class TG, 5.50%, 8/1/2035 | | | 475,331 | | | | 356,499 | | | | 0 | | | | 831,830 | |
1,952,319 | | 1,000,000 | | 0 | | 2,952,319 | | Federal Home Loan Mortgage Corp., 3051 Class MY, 5.50%, 10/1/2025 | | | 2,097,732 | | | | 1,074,820 | | | | 0 | | | | 3,172,552 | |
0 | | 223,267 | | 0 | | 223,267 | | Federal Home Loan Mortgage Corp., Pool A53146, 5.50%, 10/1/2036 | | | 0 | | | | 238,661 | | | | 0 | | | | 238,661 | |
0 | | 471,616 | | 0 | | 471,616 | | Federal Home Loan Mortgage Corp., Pool A69436, 6.00%, 12/1/2037 | | | 0 | | | | 511,534 | | | | 0 | | | | 511,534 | |
0 | | 0 | | 3,513 | | 3,513 | | Federal Home Loan Mortgage Corp., Pool C01051, 8.00%, 9/1/2030 | | | 0 | | | | 0 | | | | 3,965 | | | | 3,965 | |
0 | | 0 | | 3,421 | | 3,421 | | Federal Home Loan Mortgage Corp., Pool E80411, 6.50%, 4/1/2015 | | | 0 | | | | 0 | | | | 3,679 | | | | 3,679 | |
497,691 | | 0 | | 0 | | 497,691 | | Federal Home Loan Mortgage Corp., Pool G02562, 6.00%, 1/1/2037 | | | 540,971 | | | | 0 | | | | 0 | | | | 540,971 | |
131
| | | | | | | | | | | | | | | | | | | | | | | | |
613,665 | | 613,665 | | 0 | | 1,227,330 | | Federal Home Loan Mortgage Corp., Pool G02648, 5.50%, 12/1/2036 | | | 655,976 | | | | 655,975 | | | | 0 | | | | 1,311,951 | |
467,912 | | 0 | | 0 | | 467,912 | | Federal Home Loan Mortgage Corp., Pool G03803, 5.50%, 1/1/2038 | | | 499,296 | | | | 0 | | | | 0 | | | | 499,296 | |
| | | | | | | | | | | | | | | | | | | | | | | | |
| | | | | | | | TOTAL | | | 4,269,306 | | | | 2,837,489 | | | | 7,644 | | | | 7,114,439 | |
| | | | | | | | | | | | | | | | | | | | | | | | |
Federal National Mortgage Association - 1.4% | | | | | | | | | | | | | | | | |
458 | | 0 | | 0 | | 458 | | Federal National Mortgage Association, Pool 50276, 9.50%, 2/1/2020 | | | 540 | | | | 0 | | | | 0 | | | | 540 | |
372,970 | | 372,970 | | 0 | | 745,940 | | Federal National Mortgage Association, Pool 256103, 5.50%, 2/1/2026 | | | 401,346 | | | | 401,346 | | | | 0 | | | | 802,692 | |
1,577,058 | | 0 | | 0 | | 1,577,058 | | Federal National Mortgage Association, Pool 257306, 5.50%, 8/1/2038 | | | 1,689,660 | | | | 0 | | | | 0 | | | | 1,689,660 | |
321,251 | | 321,251 | | 0 | | 642,502 | | Federal National Mortgage Association, Pool 897144, 6.00%, 9/1/2036 | | | 350,226 | | | | 350,226 | | | | 0 | | | | 700,452 | |
899,006 | | 0 | | 0 | | 899,006 | | Federal National Mortgage Association, Pool 906224, 5.50%, 1/1/2037 | | | 964,120 | | | | 0 | | | | 0 | | | | 964,120 | |
557,654 | | 557,654 | | 0 | | 1,115,308 | | Federal National Mortgage Association, Pool 928570, 6.00%, 8/1/2037 | | | 606,907 | | | | 606,907 | | | | 0 | | | | 1,213,814 | |
| | | | | | | | | | | | | | | | | | | | | | | | |
| | | | | | | | TOTAL | | | 4,012,799 | | | | 1,358,479 | | | | 0 | | | | 5,371,278 | |
| | | | | | | | | | | | | | | | | | | | | | | | |
Government National Mortgage Association - 2.2% | | | | | | | | | | | | | | | | |
1,000,000 | | 0 | | 0 | | 1,000,000 | | Government National Mortgage Association, 2003-1 Class PE, 5.50%, 7/1/2032 | | | 1,097,986 | | | | 0 | | | | 0 | | | | 1,097,986 | |
1,000,000 | | 0 | | 0 | | 1,000,000 | | Government National Mortgage Association, 2003-116 Class JC, 5.00%, 5/1/2030 | | | 1,022,500 | | | | 0 | | | | 0 | | | | 1,022,500 | |
7,803 | | 0 | | 0 | | 7,803 | | Government National Mortgage Association, Pool 1512, 7.50%, 12/1/2023 | | | 8,967 | | | | 0 | | | | 0 | | | | 8,967 | |
13,032 | | 0 | | 0 | | 13,032 | | Government National Mortgage Association, Pool 2631, 7.00%, 8/1/2028 | | | 14,870 | | | | 0 | | | | 0 | | | | 14,870 | |
132
| | | | | | | | | | | | | | | | | | | | |
21,567 | | 0 | | 0 | | 21,567 | | Government National Mortgage Association, Pool 2658, 6.50%, 10/1/2028 | | | 24,406 | | | 0 | | 0 | | | 24,406 | |
28,418 | | 0 | | 0 | | 28,418 | | Government National Mortgage Association, Pool 2701, 6.50%, 1/1/2029 | | | 32,160 | | | 0 | | 0 | | | 32,160 | |
21,141 | | 0 | | 0 | | 21,141 | | Government National Mortgage Association, Pool 2796, 7.00%, 8/1/2029 | | | 24,134 | | | 0 | | 0 | | | 24,134 | |
7,541 | | 0 | | 0 | | 7,541 | | Government National Mortgage Association, Pool 3039, 6.50%, 2/1/2031 | | | 8,534 | | | 0 | | 0 | | | 8,534 | |
14,084 | | 0 | | 0 | | 14,084 | | Government National Mortgage Association, Pool 3040, 7.00%, 2/1/2031 | | | 16,092 | | | 0 | | 0 | | | 16,092 | |
44,501 | | 0 | | 0 | | 44,501 | | Government National Mortgage Association, Pool 3188, 6.50%, 1/1/2032 | | | 50,347 | | | 0 | | 0 | | | 50,347 | |
40,412 | | 0 | | 0 | | 40,412 | | Government National Mortgage Association, Pool 3239, 6.50%,5/1/2032 | | | 45,721 | | | 0 | | 0 | | | 45,721 | |
84,115 | | 0 | | 0 | | 84,115 | | Government National Mortgage Association, Pool 3261, 6.50%, 7/1/2032 | | | 95,166 | | | 0 | | 0 | | | 95,166 | |
343,572 | | 0 | | 0 | | 343,572 | | Government National Mortgage Association, Pool 3320, 5.50%, 12/1/2032 | | | 372,354 | | | 0 | | 0 | | | 372,354 | |
287,399 | | 0 | | 0 | | 287,399 | | Government National Mortgage Association, Pool 3333, 5.50%, 1/1/2033 | | | 311,377 | | | 0 | | 0 | | | 311,377 | |
44,351 | | 0 | | 0 | | 44,351 | | Government National Mortgage Association, Pool 3375, 5.50%, 4/1/2033 | | | 48,051 | | | 0 | | 0 | | | 48,051 | |
195,442 | | 0 | | 0 | | 195,442 | | Government National Mortgage Association, Pool 3390, 5.50%, 5/1/2033 | | | 211,748 | | | 0 | | 0 | | | 211,748 | |
332,005 | | 0 | | 0 | | 332,005 | | Government National Mortgage Association, Pool 3403, 5.50%, 6/1/2033 | | | 359,704 | | | 0 | | 0 | | | 359,704 | |
337,433 | | 0 | | 0 | | 337,433 | | Government National Mortgage Association, Pool 3458, 5.00%, 10/1/2033 | | | 361,171 | | | 0 | | 0 | | | 361,171 | |
133
| | | | | | | | | | | | | | | | | | | | | | | | |
469,476 | | 0 | | 0 | | 469,476 | | Government National Mortgage Association, Pool 3499, 5.00%, 1/1/2034 | | | 501,984 | | | | 0 | | | | 0 | | | | 501,984 | |
478,494 | | 0 | | 0 | | 478,494 | | Government National Mortgage Association, Pool 3556, 5.50%, 5/1/2034 | | | 517,649 | | | | 0 | | | | 0 | | | | 517,649 | |
772,407 | | 0 | | 0 | | 772,407 | | Government National Mortgage Association, Pool 3623, 5.00%, 10/1/2034 | | | 825,891 | | | | 0 | | | | 0 | | | | 825,891 | |
0 | | 0 | | 2,175 | | 2,175 | | Government National Mortgage Association, Pool 493514, 8.00%, 9/15/2030 | | | 0 | | | | 0 | | | | 2,469 | | | | 2,469 | |
11,704 | | 0 | | 0 | | 11,704 | | Government National Mortgage Association, Pool 22630, 6.50%, 8/1/2028 | | | 13,245 | | | | 0 | | | | 0 | | | | 13,245 | |
3,091 | | 0 | | 0 | | 3,091 | | Government National Mortgage Association, Pool 276337, 10.00%, 8/1/2019 | | | 3,597 | | | | 0 | | | | 0 | | | | 3,597 | |
0 | | 0 | | 6,588 | | 6,588 | | Government National Mortgage Association, Pool 516688, 8.00%, 8/15/2029 | | | 0 | | | | 0 | | | | 7,517 | | | | 7,517 | |
673,055 | | 0 | | 0 | | 673,055 | | Government National Mortgage Association, Pool 643816, 6.00%, 7/1/2025 | | | 743,467 | | | | 0 | | | | 0 | | | | 743,467 | |
509,466 | | 0 | | 0 | | 509,466 | | Government National Mortgage Association, Pool 704189, 5.50%, 1/1/2039 | | | 551,176 | | | | 0 | | | | 0 | | | | 551,176 | |
979,651 | | 0 | | 0 | | 979,651 | | Government National Mortgage Association, Pool 782604, 5.50%, 3/1/2039 | | | 1,059,855 | | | | 0 | | | | 0 | | | | 1,059,855 | |
| | | | | | | | | | | | | | | | | | | | | | | | |
| | | | | | | | TOTAL | | | 8,322,152 | | | | 0 | | | | 9,986 | | | | 8,332,138 | |
| | | | | | | | | | | | | | | | | | | | | | | | |
| | | | | | | | TOTAL MORTGAGE-BACKED SECURITIES (IDENTIFIED COST $19,331,211) | | | 16,604,257 | | | | 4,195,968 | | | | 17,630 | | | | 20,817,855 | |
| | | | | | | | | | | | | | | | | | | | | | | | |
U.S. TREASURY - 0.3% | | | | | | | | | | | | | | | | |
U.S. Treasury Bill - 0.3%6 | | | | | | | | | | | | | | | | |
0 | | 0 | | 1,000,000 | | 1,000,000 | | (7)United State Treasury Bill, 0.065%, 1/27/2011 (IDENTIFIED COST $999,856) | | | 0 | | | | 0 | | | | 999,947 | | | | 999,947 | |
| | | | | | | | | | | | | | | | | | | | | | | | |
COMMERCIAL PAPER - 1.3% | | | | | | | | | | | | | | | | |
134
| | | | | | | | | | | | | | | | | | | | | | | | |
1,000,000 | | 0 | | 0 | | 1,000,000 | | Citigroup, 0.25%, 1/14/2011 | | | 999,906 | | | | 0 | | | | 0 | | | | 999,906 | |
750,000 | | 0 | | 0 | | 750,000 | | Citigroup, 0.24%, 1/31/2011 | | | 749,844 | | | | 0 | | | | 0 | | | | 749,844 | |
1,000,000 | | 0 | | 0 | | 1,000,000 | | Chevron Corp., 0.16%, 1/25/2011 | | | 1,000,000 | | | | 0 | | | | 0 | | | | 1,000,000 | |
1,000,000 | | 0 | | 0 | | 1,000,000 | | General Electric Capital Corp., 0.15%, 1/19/2011 | | | 1,000,000 | | | | 0 | | | | 0 | | | | 1,000,000 | |
1,000,000 | | 0 | | 0 | | 1,000,000 | | General Electric Capital Corp., 0.17%, 1/27/2011 | | | 1,000,000 | | | | 0 | | | | 0 | | | | 1,000,000 | |
| | | | | | | | | | | | | | | | | | | | | | | | |
| | | | | | | | TOTAL COMMERCIAL PAPER (IDENTIFIED COST $4,749,750) | | | 4,749,750 | | | | 0 | | | | 0 | | | | 4,749,750 | |
| | | | | | | | | | | | | | | | | | | | | | | | |
PREFERRED STOCK - 0.2% | | | | | | | | | | | | | | | | |
Financial Institution - Banking - 0.2% | | | | | | | | | | | | | | | | |
0 | | 32,000 | | 0 | | 32,000 | | Sovereign Capital Trust V, 7.75% (IDENTIFIED COST $800,000) | | | 0 | | | | 811,200 | | | | 0 | | | | 811,200 | |
| | | | | | | | | | | | | | | | | | | | | | | | |
| | | | |
MONEY MARKET MUTUAL FUND - 0.2% | | | | | | | | | | | | | | | | |
193,599 | | 639,959 | | 0 | | 833,558 | | JP Morgan U.S. Treasury Plus Money Market Fund (COST $833,558) | | | 193,599 | | | | 639,959 | | | | 0 | | | | 833,558 | |
| | | | |
REPURCHASE AGREEMENT - 2.3% | | | | | | | | | | | | | | | | |
0 | | 0 | | 8,514,000 | | 8,514,000 | | Interest in $5,850,000,000 joint repurchase agreement 0.25%, dated 12/31/2010 under which Bank of America, N.A. will repurchase securities provided as collateral for $5,850,121,875 on 1/3/2011. The securities provided as collateral at the end of the period were U.S. Government Agency securities with various maturities to 4/15/2040 and the market value of those underlying securities was $5,972,500,657 (AT COST). | | | 0 | | | | 0 | | | | 8,514,000 | | | | 8,514,000 | |
| | | | | | | | | | | | | | | | | | | | | | | | |
| | | | | | | | Total Investments (Identified Cost $357,007,463- 99.0%)(8)(9) | | | 57,541,414 | | | | 39,828,344 | | | | 275,646,464 | | | | 373,015,284 | |
| | | | | | | | | | | | | | | | | | | | | | | | |
| | | | | | | | Other Assets and Liabilities - 1.0% (9)(10)(11) | | | 397,369 | | | | 566,441 | | | | 2,960,290 | | | | 3,923,864 | |
| | | | | | | | | | | | | | | | | | | | | | | | |
| | | | | | | | Total Net Assets - 100% | | $ | 57,938,783 | | | $ | 40,394,785 | | | $ | 278,606,754 | | | $ | 376,939,148 | |
| | | | | | | | | | | | | | | | | | | | | | | | |
135
Note: The categories of investments are shown as a percentage of total net assets at December 31, 2010.
At December 31, 2010, Federated Quality Bond Fund II had the following outstanding futures contracts:
| | | | | | | | | | | | | | | | |
Description | | Number of
Contracts | | | Notional
Value | | | Expiration
Date | | | Unrealized
Appreciation/
(Depreciation) | |
(4) U.S. Treasury Notes 5-Year Short Futures | | | 75 | | | $ | 8,828,906 | | | | March 2011 | | | $ | (60,514 | ) |
(4) U.S. Treasury Bonds 30-Year Short Futures | | | 320 | | | $ | 39,080,000 | | | | March 2012 | | | $ | 1,154,309 | |
| | | | | | | | | | | | | | | | |
NET UNREALIZED APPRECIATION ON FUTURES CONTRACTS | | | | | | | $ | 1,093,795 | |
Net Unrealized Appreciation on Futures Contracts is included in “Other Assets and Liabilities - Net”.
| (1) | Denotes a restricted security that either: (a) cannot be offered for public sale without first being registered, or being able to take advantage of an exemption from registration, under the Securities Act of 1933; or (b) is subject to a contractual restriction on public sales. At December 31, 2010, these restricted securities amounted to $53,844,197, which represented 14.3% of total net assets of the Pro Forma Combined. |
| (2) | Denotes a restricted security that may be resold without restriction to “qualified institutional buyers” as defined in Rule 144A under the Securities Act of 1933 and that the Fund has determined to be liquid under the criteria established by the Fund’s Board of Trustees. At December 31, 2010, these liquid restricted securities amounted to $52,547,565, which represented 13.9% of total net assets of the Pro Forma Combined. |
| (3) | JPMorgan Chase & Co. has fully and unconditionally guaranteed Bear Stearns’ outstanding debt securities. |
| (4) | Non-income producing security |
| (6) | Discount rate at time of purchase. |
| (7) | All or a portion of this security is pledged as collateral to ensure Federated Quality Bond Fund II is able to satisfy the obligations of its outstanding futures contracts. |
| (8) | The cost of investment for federal tax purposes for the Pro Forma Combined amounts to $357,754,103. |
| (9) | This security cannot transfer into Federated Quality Bond Fund II as a result of the reorganization and will need to be sold prior to the reorganization. Market value and identified cost of Federated Quality Bond Fund II Pro Forma Combined have been adjusted by ($938) and ($746,640), respectively to reflect the adjustment for this security. Other Assets & Liabilities has been adjusted by $938 to reflect the cash received, based on current market value, for this sale. |
| (10) | Assets, other than investments in securities, less liabilities. See Statement of Assets and Liabilities. |
| (11) | Includes an adjustment of ($1,174) for the Pro Forma Combined for prepaid expenses which will not transfer as a result of the reorganization. |
Various inputs are used in determining the value of each funds’ investments. These inputs are summarized in the three broad levels listed below:
| | | | | | | | | | | | | | | | | | | | | | | | | | | | | | | | | | | | | | |
| | Level 1 - quoted prices in active markets for identical securities |
136
| | |
| | Level 2 - other significant observable inputs (including quoted prices for similar securities, interest rates, prepayment speeds, credit risks, etc.) |
| |
| | Level 3 - significant unobservable inputs (including each fund’s own assumptions in determining the fair value of investments) |
| | |
The inputs or methodology used for valuing securities are not an indication of the risk associated with investing in those securities.
The following is a summary of the inputs used, as of December 31, 2010, in valuing each fund’s assets carried at fair value:
| | | | | | | | | | | | | | | | |
| Fund | | Valuation Inputs | |
| | | Level 1 | | | Level 2 | | | Level 3 | | | Total | |
High Grade Bond Portfolio | | | | | | | | | | | | | | | | |
Debt Securities: | | | | | | | | | | | | | | | | |
Corporate Bonds | | $ | 0 | | | $ | 30,456,325 | | | $ | 0 | | | $ | 30,456,325 | |
Commercial Mortgage Pass-Thru Agreements | | | 0 | | | | 1,537,676 | | | | 0 | | | | 1,537,676 | |
Government/Agency | | | 0 | | | | 0 | | | | 0 | | | | 0 | |
Government Agencies | | | 0 | | | | 3,999,807 | | | | 0 | | | | 3,999,807 | |
Mortgage-Backed Securities | | | 0 | | | | 16,604,257 | | | | 0 | | | | 16,604,257 | |
U.S. Treasury | | | 0 | | | | 0 | | | | 0 | | | | 0 | |
Commercial Paper | | | 0 | | | | 4,749,750 | | | | 0 | | | | 4,749,750 | |
Equity Securities: | | | | | | | | | | | | | | | | |
Preferred Stock | | | 0 | | | | 0 | | | | 0 | | | | 0 | |
Money Market Mutual Fund | | | 193,599 | | | | 0 | | | | 0 | | | | 193,599 | |
Repurchase Agreements | | | 0 | | | | 0 | | | | 0 | | | | 0 | |
| | | | | | | | | | | | | | | | |
TOTAL SECURITIES | | $ | 193,599 | | | $ | 57,347,815 | | | $ | 0 | | | $ | 57,541,414 | |
| | | | | | | | | | | | | | | | |
OTHER FINANCIAL INSTRUMENTS | | $ | 0 | | | $ | 0 | | | $ | 0 | | | $ | 0 | |
| | | | | | | | | | | | | | | | |
Strategic Yield Portfolio | | | | | | | | | | | | | | | | |
Debt Securities: | | | | | | | | | | | | | | | | |
Corporate Bonds | | $ | 0 | | | $ | 31,681,400 | | | $ | 0 | | | $ | 31,681,400 | |
Commercial Mortgage Pass-Thru Agreements | | | 0 | | | | 0 | | | | 0 | | | | 0 | |
Government/Agency | | | 0 | | | | 0 | | | | 0 | | | | 0 | |
Government Agencies | | | 0 | | | | 2,499,817 | | | | 0 | | | | 2,499,817 | |
Mortgage-Backed Securities | | | 0 | | | | 4,195,968 | | | | 0 | | | | 4,195,968 | |
U.S. Treasury | | | 0 | | | | 0 | | | | 0 | | | | 0 | |
Commercial Paper | | | 0 | | | | 0 | | | | 0 | | | | 0 | |
Equity Securities: | | | | | | | | | | | | | | | | |
Preferred Stock | | | 811,200 | | | | 0 | | | | 0 | | | | 811,200 | |
Money Market Mutual Fund | | | 639,959 | | | | 0 | | | | 0 | | | | 639,959 | |
Repurchase Agreements | | | 0 | | | | 0 | | | | 0 | | | | 0 | |
| | | | | | | | | | | | | | | | |
TOTAL SECURITIES | | $ | 1,451,159 | | | $ | 38,377,185 | | | $ | 0 | | | $ | 39,828,344 | |
| | | | | | | | | | | | | | | | |
OTHER FINANCIAL INSTRUMENTS | | $ | 0 | | | $ | 0 | | | $ | 0 | | | $ | 0 | |
| | | | | | | | | | | | | | | | |
Federated Quality Bond Fund II | | | | | | | | | | | | | | | | |
Debt Securities: | | | | | | | | | | | | | | | | |
Corporate Bonds | | $ | 0 | | | $ | 265,600,297 | | | $ | 0 | | | $ | 265,600,297 | |
Commercial Mortgage Pass-Thru Agreements | | | 0 | | | | 0 | | | | 0 | | | | 0 | |
Government/Agency | | | 0 | | | | 514,590 | | | | 0 | | | | 514,590 | |
Government Agencies | | | 0 | | | | 0 | | | | 0 | | | | 0 | |
Mortgage-Backed Securities | | | 0 | | | | 17,630 | | | | 0 | | | | 17,630 | |
U.S. Treasury | | | 0 | | | | 999,947 | | | | 0 | | | | 999,947 | |
137
| | | | | | | | | | | | | | | | |
Commercial Paper | | | 0 | | | | 0 | | | | 0 | | | | 0 | |
Equity Securities: | | | | | | | | | | | | | | | | |
Preferred Stock | | | 0 | | | | 0 | | | | 0 | | | | 0 | |
Money Market Mutual Fund | | | 0 | | | | 0 | | | | 0 | | | | 0 | |
Repurchase Agreements | | | 0 | | | | 8,514,000 | | | | 0 | | | | 8,514,000 | |
| | | | | | | | | | | | | | | | |
TOTAL SECURITIES | | $ | 0 | | | $ | 275,646,464 | | | $ | 0 | | | $ | 275,646,464 | |
| | | | | | | | | | | | | | | | |
OTHER FINANCIAL INSTRUMENTS* | | $ | 1,093,795 | | | $ | 0 | | | $ | 0 | | | $ | 1,093,795 | |
| | | | | | | | | | | | | | | | |
| | | | |
Federated Quality Bond Fund II Pro Forma Combined | | | | | | | | | | | | | | | | |
Debt Securities: | | | | | | | | | | | | | | | | |
Corporate Bonds** | | $ | 0 | | | $ | 327,737,084 | | | $ | 0 | | | $ | 327,737,084 | |
Commercial Mortgage Pass-Thru Agreements | | | 0 | | | | 1,537,676 | | | | 0 | | | | 1,537,676 | |
Government/Agency | | | 0 | | | | 514,590 | | | | 0 | | | | 514,590 | |
Government Agencies | | | 0 | | | | 6,499,624 | | | | 0 | | | | 6,499,624 | |
Mortgage-Backed Securities | | | 0 | | | | 20,817,855 | | | | 0 | | | | 20,817,855 | |
U.S. Treasury | | | 0 | | | | 999,947 | | | | 0 | | | | 999,947 | |
Commercial Paper | | | 0 | | | | 4,749,750 | | | | 0 | | | | 4,749,750 | |
Equity Securities: | | | | | | | | | | | | | | | | |
Preferred Stock | | | 811,200 | | | | 0 | | | | 0 | | | | 811,200 | |
Money Market Mutual Fund | | | 833,558 | | | | 0 | | | | 0 | | | | 833,558 | |
Repurchase Agreements | | | 0 | | | | 8,514,000 | | | | 0 | | | | 8,514,000 | |
| | | | | | | | | | | | | | | | |
TOTAL SECURITIES | | $ | 1,644,758 | | | $ | 371,370,526 | | | $ | 0 | | | $ | 373,015,284 | |
| | | | | | | | | | | | | | | | |
OTHER FINANCIAL INSTRUMENTS* | | $ | 1,093,795 | | | $ | 0 | | | $ | 0 | | | $ | 1,093,795 | |
| | | | | | | | | | | | | | | | |
| * | Other financial instruments include futures contracts. |
| ** | Includes an adjustment of $938 for a security which will not transfer into Federated Quality Bond Fund II as a result of the reorganization. |
The following acronyms are used throughout these portfolios:
| | |
MTN | | - Medium Term Note |
REIT | | - Real Estate Investment Trust |
138
High Grade Bond Portfolio
Strategic Yield Portfolio
Federated Quality Bond Fund II
Pro Forma Combining Statements of Assets & Liabilities
December 31, 2010 (unaudited)
| | | | | | | | | | | | | | | | | | | | |
| | | High Grade Bond
Portfolio | | | Strategic
Yield
Portfolio | | | Federated
Quality Bond Fund II | | | Pro Forma
Adjustment | | | Federated
Quality Bond Fund II
Proforma
Combined | |
Assets: | | | | | | | | | | | | | | | | | | | | |
Investments in securities, at value | | $ | 57,541,414 | | | $ | 39,828,344 | | | $ | 275,646,464 | | | ($ | 938 | ) (a) | | $ | 373,015,284 | |
Cash | | | 0 | | | | 0 | | | | 927 | | | | 938 | | | | 1,865 | |
Income receivable | | | 442,008 | | | | 609,519 | | | | 3,553,531 | | | | 0 | | | | 4,605,058 | |
Receivable for investments sold | | | 0 | | | | 0 | | | | 1,288 | | | | 0 | | | | 1,288 | |
Receivable for shares sold | | | 20,081 | | | | 6,783 | | | | 43,684 | | | | 0 | | | | 70,548 | |
Prepaid expenses | | | 661 | | | | 513 | | | | 0 | | | | (1,174 | ) (b) | | | 0 | |
| | | | | | | | | | | | | | | | | | | | |
Total assets | | | 58,004,164 | | | | 40,445,159 | | | | 279,245,894 | | | | (1,174 | ) | | | 377,694,043 | |
| | | | | | | | | | | | | | | | | | | | |
| | | | | |
Liabilities: | | | | | | | | | | | | | | | | | | | | |
Payable for shares redeemed | | | 55,997 | | | | 42,027 | | | | 202,990 | | | | 0 | | | | 301,014 | |
Income distribution payable | | | 16 | | | | 23 | | | | 0 | | | | 0 | | | | 39 | |
Payable for daily variation margin | | | 0 | | | | 0 | | | | 383,438 | | | | 0 | | | | 383,438 | |
Accrued expenses | | | 9,368 | | | | 8,324 | | | | 52,712 | | | | 0 | | | | 70,404 | |
| | | | | | | | | | | | | | | | | | | | |
Total liabilities | | | 65,381 | | | | 50,374 | | | | 639,140 | | | | 0 | | | | 754,895 | |
| | | | | | | | | | | | | | | | | | | | |
Net Assets | | $ | 57,938,783 | | | $ | 40,394,785 | | | $ | 278,606,754 | | | ($ | 1,174 | ) | | $ | 376,939,148 | |
| | | | | | | | | | | | | | | | | | | | |
Net Assets Consists of: | | | | | | | | | | | | | | | | | | | | |
Paid-in capital | | $ | 56,034,883 | | | $ | 41,405,723 | | | $ | 263,396,671 | | | ($ | 1,174 | ) (a)(b) | | $ | 360,836,103 | |
Net unrealized appreciation of investments and futures contracts | | | 1,936,874 | | | | 1,490,268 | | | | 12,928,772 | | | | 745,702 | (a) | | | 17,101,616 | |
Accumulated net realized loss on investments and futures contracts | | | (32,974 | ) | | | (2,501,206 | ) | | | (11,231,190 | ) | | | (745,702 | ) (a) | | | (14,511,072 | ) |
Undistributed net investment income | | | 0 | | | | 0 | | | | 13,512,501 | | | | 0 | | | | 13,512,501 | |
| | | | | | | | | | | | | | | | | | | | |
Total Net Assets | | $ | 57,938,783 | | | $ | 40,394,785 | | | $ | 278,606,754 | | | ($ | 1,174 | ) | | $ | 376,939,148 | |
| | | | | | | | | | | | | | | | | | | | |
Net Asset Value, Offering Price and Redemption Proceeds Per Share | | | | | | | | | | | | | | | | | | | | |
Primary Shares: | | | | | | | | | | | | | | | | | | | | |
Net Assets | | $ | 0 | | | $ | 0 | | | $ | 214,644,427 | | | $ | 98,332,394 | (c) | | $ | 312,976,821 | |
| | | | | | | | | | | | | | | | | | | | |
Shares Outstanding | | | 0 | | | | 0 | | | | 18,586,882 | | | | 8,513,627 | (c) | | | 27,100,509 | |
| | | | | | | | | | | | | | | | | | | | |
139
| | | | | | | | | | | | | | | | | | | | |
Shares Authorized | | | 0 | | | | 0 | | | | unlimited | | | | | | | | | |
| | | | | | | | | | | | | | | | | | | | |
Net Asset Value, Offering Price and Redemption Proceeds Per Share | | | | | | | | | | $ | 11.55 | | | | | | | $ | 11.55 | |
| | | | | | | | | | | | | | | | | | | | |
Service Shares: | | | | | | | | | | | | | | | | | | | | |
Net Assets | | $ | 0 | | | $ | 0 | | | $ | 63,962,327 | | | $ | 0 | | | $ | 63,962,327 | |
| | | | | | | | | | | | | | | | | | | | |
Shares Outstanding | | | 0 | | | | 0 | | | | 5,563,655 | | | | 0 | | | | 5,563,655 | |
| | | | | | | | | | | | | | | | | | | | |
Shares Authorized | | | 0 | | | | 0 | | | | unlimited | | | | | | | | unlimited | |
| | | | | | | | | | | | | | | | | | | | |
Net Asset Value, Offering Price and Redemption Proceeds Per Share | | | | | | | | | | $ | 11.50 | | | | | | | $ | 11.50 | |
| | | | | | | | | | | | | | | | | | | | |
Initial Class: | | | | | | | | | | | | | | | | | | | | |
Net Assets | | $ | 44,928,603 | | | $ | 39,357,213 | | | $ | 0 | | | ($ | 84,285,816 | ) (c) | | $ | 0 | |
| | | | | | | | | | | | | | | | | | | | |
Shares Outstanding | | | 4,292,484 | | | | 4,304,727 | | | | 0 | | | | (8,597,211 | ) (c) | | | 0 | |
| | | | | | | | | | | | | | | | | | | | |
Shares Authorized | | | unlimited | | | | unlimited | | | | 0 | | | | | | | | 0 | |
| | | | | | | | | | | | | | | | | | | | |
Net Asset Value, Offering Price and Redemption Proceeds Per Share | | $ | 10.47 | | | $ | 9.14 | | | | | | | | | | | | | |
| | | | | | | | | | | | | | | | | | | | |
Service Class: | | | | | | | | | | | | | | | | | | | | |
Net Assets | | $ | 13,010,180 | | | $ | 1,037,572 | | | $ | 0 | | | ($ | 14,047,752 | ) (c) | | $ | 0 | |
| | | | | | | | | | | | | | | | | | | | |
Shares Outstanding | | | 1,242,971 | | | | 113,475 | | | | 0 | | | | (1,356,446 | ) (c) | | | 0 | |
| | | | | | | | | | | | | | | | | | | | |
Shares Authorized | | | unlimited | | | | unlimited | | | | 0 | | | | | | | | 0 | |
| | | | | | | | | | | | | | | | | | | | |
Net Asset Value, Offering Price and Redemption Proceeds Per Share | | $ | 10.47 | | | $ | 9.14 | | | | | | | | | | | | | |
| | | | | | | | | | | | | | | | | | | | |
Investments, at identified cost | | $ | 55,604,540 | | | $ | 38,338,076 | | | $ | 263,811,487 | | | ($ | 746,640 | ) (a) | | $ | 357,007,463 | |
| | | | | | | | | | | | | | | | | | | | |
| (a) | Adjustment to reflect a security held by High Grade Bond Portfolio which will not transfer as a result of the reorganization. |
| (b) | Adjustment for prepaid expenses which will not transfer as a result of the reorganization. |
| (c) | Adjustment to reflect share balance as a result of the combination. |
140
High Grade Bond Portfolio
Strategic Yield Portfolio
Federated Quality Bond Fund II
Pro Forma Combining Statements of Operations
For the year ended December 31, 2010 (unaudited)
| | | | | | | | | | | | | | | | | | | | |
| | | High Grade Bond
Portfolio | | | Strategic
Yield
Portfolio | | | Federated
Quality Bond Fund II | | | Pro Forma
Adjustment | | | Federated
Quality Bond Fund II
Proforma
Combined | |
Investment Income: | | | | | | | | | | | | | | | | | | | | |
Dividends | | $ | 0 | | | $ | 62,000 | | | $ | 0 | | | $ | 0 | | | $ | 62,000 | |
Interest | | | 2,438,937 | | | | 2,459,280 | | | | 15,777,984 | | | | 0 | | | | 20,676,201 | |
| | | | | | | | | | | | | | | | | | | | |
Total Investment Income: | | | 2,438,937 | | | | 2,521,280 | | | | 15,777,984 | | | | 0 | | | | 20,738,201 | |
Expenses: | | | | | | | | | | | | | | | | | | | | |
Investment adviser fee | | | 165,709 | | | | 182,312 | | | | 1,780,809 | | | | 226,316 | (a) | | | 2,355,146 | |
Administrative personnel and services fee | | | 0 | | | | 0 | | | | 231,877 | | | | 74,684 | (b) | | | 306,561 | |
Custodian fees | | | 7,095 | | | | 4,586 | | | | 14,921 | | | | (9,040) | (c) | | | 17,562 | |
Transfer and dividend disbursing agent fees and expenses | | | 0 | | | | 0 | | | | 31,681 | | | | 1,747 | (d) | | | 33,428 | |
Directors’/Trustees’ fees | | | 8,629 | | | | 6,258 | | | | 1,562 | | | | (11,652) | (e) | | | 4,797 | |
Professional fees | | | 26,388 | | | | 21,915 | | | | 0 | | | | (48,303) | (f) | | | 0 | |
Auditing fees | | | 0 | | | | 0 | | | | 20,500 | | | | 0 | | | | 20,500 | |
Legal fees | | | 0 | | | | 0 | | | | 6,749 | | | | 646 | (g) | | | 7,395 | |
Portfolio accounting fees | | | 27,618 | | | | 20,257 | | | | 117,053 | | | | (29,028) | (h) | | | 135,900 | |
Distribution fees | | | 25,158 | | | | 2,387 | | | | 0 | | | | (27,545) | (i) | | | 0 | |
Distribution services fee - Select Shares | | | 0 | | | | 0 | | | | 172,498 | | | | 0 | | | | 172,498 | |
Printing and postage | | | 7,030 | | | | 5,332 | | | | 24,571 | | | | 34,829 | (j) | | | 71,762 | |
Insurance premiums | | | 5,327 | | | | 4,143 | | | | 4,614 | | | | (9,184) | (k) | | | 4,900 | |
Miscellaneous | | | 2,776 | | | | 2,138 | | | | 3,964 | | | | (4,178) | (l) | | | 4,700 | |
| | | | | | | | | | | | | | | | | | | | |
Total Expenses | | | 275,730 | | | | 249,328 | | | | 2,410,799 | | | | 199,292 | | | | 3,135,149 | |
| | | | | | | | | | | | | | | | | | | | |
Waivers and Reduction— | | | | | | | | | | | | | | | | | | | | |
Waiver of investment adviser fee | | | 0 | | | | 0 | | | | (140,166) | | | | (54,919) | (m) | | | (195,085) | |
Waiver of administrative personnel and services fee | | | 0 | | | | 0 | | | | (6,011) | | | | (1,839) | (n) | | | (7,850) | |
Fees paid indirectly for directed brokerage arrangements | | | (5) | | | | (3) | | | | 0 | | | | 8 | (o) | | | 0 | |
| | | | | | | | | | | | | | | | | | | | |
Total Waivers and Reimbursements | | | (5) | | | | (3) | | | | (146,177) | | | | (56,750) | | | | (202,935) | |
| | | | | | | | | | | | | | | | | | | | |
Net Expenses | | | 275,725 | | | | 249,325 | | | | 2,264,622 | | | | 142,542 | | | | 2,932,214 | |
| | | | | | | | | | | | | | | | | | | | |
Net investment income | | $ | 2,163,212 | | | $ | 2,271,955 | | | $ | 13,513,362 | | | ($ | 142,542) | | | $ | 17,805,987 | |
| | | | | | | | | | | | | | | | | | | | |
Realized and Unrealized Gain (Loss) on Investments and Foreign Currency Transactions: | | | | | | | | | | | | | | | | | | | | |
Net realized gain (loss) on investments | | | (739) | | | | 27,166 | | | | 6,073,392 | | | | (745,702) | (p) | | | 5,354,117 | |
Net realized loss on futures contracts | | | 0 | | | | 0 | | | | (4,339,636) | | | | 0 | | | | (4,339,636) | |
Net change in unrealized appreciation (depreciation) of investments | | | 1,954,026 | | | | 1,917,867 | | | | 9,090,458 | | | | 745,702 | (p) | | | 13,708,053 | |
141
| | | | | | | | | | | | | | | | | | | | |
Net change in unrealized appreciation (depreciation) of futures contracts | | | 0 | | | | 0 | | | | 27,825 | | | | 0 | | | | 27,825 | |
| | | | | | | | | | | | | | | | | | | | |
Net realized and unrealized loss on investments and foreign currency transactions | | | 1,953,287 | | | | 1,945,033 | | | | 10,852,039 | | | | 0 | | | | 14,750,359 | |
| | | | | | | | | | | | | | | | | | | | |
Change in net assets resulting from operations | | $ | 4,116,499 | | | $ | 4,216,988 | | | $ | 24,365,401 | | | ($ | 142,542 | ) | | $ | 32,556,346 | |
| | | | | | | | | | | | | | | | | | | | |
| | | | | |
(See Notes to Pro Forma Financial Statements) | | | | | | | | | | | | | | | | | | | | |
142
High Grade Bond Portfolio
Strategic Yield Portfolio
Federated Quality Bond Fund II
Notes to Pro Forma Financial Statements
For the Period Ended December 31, 2010 (unaudited)
Note 1. Description of the Funds
High Grade Bond Portfolio and Strategic Yield Portfolio are portfolios of EquiTrust Variable Insurance Series Fund, which is registered under the Investment Company Act of 1940, as amended (the “Act”), as an open-end diversified management investment company. Federated Quality Bond Fund II, a series of Federated Insurance Series, is registered under the Act, as an open-end management investment company. High Grade Bond Portfolio and Strategic Yield Portfolio consist of two classes of shares: Initial Class and Service Class. Federated Quality Bond Fund II consists of two classes of shares: Primary Shares and Service Shares.
Note 2. Basis of Combination
The accompanying unaudited Pro Forma Combining Portfolios of Investments, Statements of Assets and Liabilities and Statements of Operations (Pro Forma Financial Statements) reflect the accounts of High Grade Bond Portfolio, Strategic Yield Portfolio and Federated Quality Bond Fund II (individually referred to as the “Fund”, or collectively as the “Funds”), for the year ended December 31, 2010. These statements have been derived from the books and records utilized in calculating daily net asset values at December 31, 2010.
The Pro Forma Financial Statements should be read in conjunction with the historical financial statements of High Grade Bond Portfolio, Strategic Yield Portfolio and Federated Quality Bond Fund II, which have been incorporated by reference in the Statement of Additional Information. The Funds follow generally accepted accounting principles in the United States of America applicable to management investment companies which are disclosed in the historical financial statements.
The Pro Forma Financial Statements give effect to the proposed exchange of assets of Initial Class Shares and Service Class Shares of High Grade Bond Portfolio and Strategic Yield Portfolio for Primary Shares of Federated Quality Bond Fund II. Under generally accepted accounting principles, Federated Quality Bond Fund II will be the surviving entity for accounting purposes with its historical cost of investment securities and results of operations being carried forward.
The Pro Forma Financial Statements have been adjusted to reflect the anticipated advisory fee arrangement for the surviving entity, if necessary. Certain other operating costs have also been adjusted to reflect anticipated expenses of the combined entity. Other costs which may change as a result of the reorganization are currently undeterminable.
For the year ended December 31, 2010, High Grade Bond Portfolio, Strategic Yield Portfolio and Federated Quality Bond Fund II paid investment advisory fees computed at the annual rate of 0.30%, 0.45% and 0.60%, respectively, as a percentage of average daily net assets.
The investment advisers of Federated Insurance Funds and the EquiTrust Variable Funds or their affiliates will pay the direct expenses and all the indirect expenses of the Reorganization.
Note 3. Portfolio Valuation
In calculating its net asset value (NAV), Federated Quality Bond Fund II generally values investments as follows:
| | • | | Fixed-income securities acquired with remaining maturities greater than 60 days are fair valued using price evaluations provided by a pricing service approved by the Board of Trustees (the “Trustees”). |
143
| | • | | Fixed-income securities acquired with remaining maturities of 60 days or less are valued at their cost (adjusted for the accretion of any discount or amortization of any premium). |
| | • | | Derivative contracts listed on exchanges are valued at their reported settlement or closing price. |
| | • | | Over-the-counter (OTC) derivative contracts are fair valued using price evaluations provided by a pricing service approved by the Trustees. |
| | • | | Shares of other mutual funds are valued based upon their reported NAVs. |
If Federated Quality Bond Fund II cannot obtain a price or price evaluation from a pricing service for an investment, the Fund may attempt to value the investment based upon the mean of bid and asked quotations or fair value the investment based on price evaluations, from one or more dealers. If any price, quotation, price evaluation or other pricing source is not readily available when the NAV is calculated, the Fund uses the fair value of the investment determined in accordance with the procedures described below. There can be no assurance that the Fund could purchase or sell an investment at the price used to calculate the Fund’s NAV.
Fair Valuation and Significant Events Procedures
The Trustees of Federated Quality Bond Fund II have authorized the use of pricing services to provide evaluations of the current fair value of certain investments for purposes of calculating the NAV. Factors considered by pricing services in evaluating an investment include the yields or prices of investments of comparable quality, coupon, maturity, call rights and other potential prepayments, terms and type, reported transactions, indications as to values from dealers, and general market conditions. Some pricing services provide a single price evaluation reflecting the bid-side of the market for an investment (a “bid” evaluation). Other pricing services offer both bid evaluations and price evaluations indicative of a price between the prices bid and asked for the investment (a “mid” evaluation). The Funds normally use bid evaluations for U.S. Treasury and Agency securities, mortgage-backed securities and municipal securities. The Funds normally use mid evaluations for other types of fixed-income securities and OTC derivative contracts. In the event that market quotations and price evaluations are not available for an investment, the fair value of the investment is determined in accordance with procedures adopted by the Trustees.
The Trustees also have adopted procedures requiring an investment to be priced at its fair value whenever the Adviser determines that a significant event affecting the value of the investment has occurred between the time as of which the price of the investment would otherwise be determined and the time as of which the NAV is computed. An event is considered significant if there is both an affirmative expectation that the investment’s value will change in response to the event and a reasonable basis for quantifying the resulting change in value. Examples of significant events that may occur after the close of the principal market on which a security is traded, or after the time of a price evaluation provided by a pricing service or a dealer, include:
| | • | | With respect to securities traded in foreign markets, significant trends in U.S. equity markets or in the trading of foreign securities index futures or options contracts; |
| | • | | With respect to price evaluations of fixed-income securities determined before the close of regular trading on the NYSE, actions by the Federal Reserve Open Market Committee and other significant trends in U.S. fixed-income markets; |
| | • | | Political or other developments affecting the economy or markets in which an issuer conducts its operations or its securities are traded; and |
| | • | | Announcements concerning matters such as acquisitions, recapitalizations, litigation developments, a natural disaster affecting the issuer’s operations or regulatory changes or market developments affecting the issuer’s industry. |
The Trustees have approved the use of a pricing service to determine the fair value of equity securities traded principally in foreign markets when the Adviser determines that there has been a significant trend in the U.S. equity markets or in index futures trading. For other significant events, the Funds may seek to obtain more current quotations or price evaluations from alternative pricing sources. If a reliable alternative pricing source is not available, the Fund will determine the fair value of the investment using another method approved by the Trustees.
144
With respect to High Grade Bond Portfolio and Strategic Yield Portfolio, each Fund values its investment securities that are traded on any national exchange at the last sale price on the day of valuation or, lacking any sales, at the mean between the closing bid and asked process. Investments traded in the over-the-counter market are valued at the mean between the closing bid and asked prices or yield equivalent. In situations where market quotations are not readily available or quoted market prices are not reliable, investments are valued at fair value in accordance with the procedures adopted by the Fund’s Board of Trustees. Money market investments are valued at market value, except that obligations maturing in 60 days or less are valued using the amortized cost method, which approximates market value. Under the amortized cost method, a security is valued at its cost on the date of purchase and thereafter is adjusted to reflect a constant amortization to maturity of the difference between the principal amount due at maturity and the cost of investment to the Fund.
Note 4. Shares of Beneficial Interest
The Pro Forma Primary Shares net asset value per share assumes the issuance of 8,513,627 Primary Shares of Federated Quality Bond Fund II in exchange for 4,292,484 Initial Class Shares and 1,242,971 Service Class Shares of High Grade Bond Portfolio and 4,304,727 Initial Class Shares and 113,475 Service Class Shares of Strategic Yield Portfolio, respectively, which would have been outstanding at December 31, 2010 in connection with the proposed reorganization, assuming the three Funds had been combined as of such date.
Note 5. Federal Income Taxes
Each Fund has elected to be taxed as a “regulated investment company” under the Internal Revenue Code. After the acquisition, Federated Quality Bond Fund II intends to continue to qualify as a regulated investment company, if such qualification is in the best interests of its shareholders, by complying with the Subchapter M provision of the Internal Revenue Code and to distribute to shareholders each year substantially all of its income. Accordingly, no provision for federal income tax is necessary. Federated Quality Bond Fund II complies with the provisions of Financial Accounting Standards Board (FASB) Interpretation No. 48 (FIN 48) “Accounting for Uncertainty in Income Taxes”. As of and during the year ended December 31, 2010, the Fund did not have a liability for any uncertain tax positions. The Fund recognizes interest and penalties, if any, related to tax liabilities as income tax expense in the Statement of Operations. As of December 31, 2010, tax years 2007 through 2010 remain subject to examination by the Fund’s major tax jurisdictions, which include the United States of America and the Commonwealth of Massachusetts.
The identified cost of investments for the funds is substantially the same for both financial accounting and federal income tax purposes. The tax cost of investments will remain unchanged for the combined fund.
Note 6. Other
The preparation of financial statements in conformity with GAAP requires management to make estimates and assumptions that affect the amounts of assets, liabilities, expenses and revenue reported in the financial statements. Actual results could differ from those estimated.
Note 7. Pro Forma Adjustments
| | (a) | EquiTrust Investment Management Services, Inc. is the investment adviser for High Grade Bond Portfolio and Strategic Yield Portfolio. Federated Equity Management Company of Pennsylvania is the investment adviser for Federated Quality Bond Fund II. The advisory agreement between High Grade Bond Portfolio and Strategic Yield Portfolio and the Adviser provides for an annual fee equal to 0.30% and 0.45%, respectively, of the Fund’s average daily net assets. The advisory agreement between Federated Quality Bond Fund II and the Adviser provides for an annual fee equal to 0.60% of the Fund’s average daily net assets. An adjustment to the combined investment adviser fee reflects the fee structure of Federated Quality Bond Fund II based on the combined assets of Federated Quality Bond Fund II Pro Forma Combined. |
| | (b) | Federated Administrative Services (FAS), under the Administrative Services Agreement, provides each |
145
| | Fund with certain administrative personnel and services necessary to operate the Fund. The fee paid to FAS is based on the average aggregate daily net assets of certain Federated funds. The administrative fee received during any fiscal year shall be at least $150,000 per portfolio and $40,000 per each additional class of Shares. Under a similar plan, FAS provides The Funds with certain administrative personnel and services necessary to operate each Fund. An adjustment to the combined administrative personnel and services fee reflects the fee structure of Federated Quality Bond Fund II Pro Forma Combined. |
| | (c) | Adjustment to reflect custodian fees based upon the current expense structure for Federated Quality Bond Fund II Pro Forma Combined. |
| | (d) | Adjustment to reflect transfer and dividend disbursing agent fees and expenses based upon the current expense structure for Federated Quality Bond Fund II Pro Forma Combined. |
| | (e) | Adjustment to reflect Directors/Trustees fees based upon the current expense structure for Federated Quality Bond Fund II Pro Forma Combined. |
| | (f) | Adjustment to reflect removal of professional fees since the combined expenses in this category for High Grade Bond Portfolio and Strategic Yield Portfolio are disclosed separately for Federated Quality Bond Fund II Pro Forma Combined. |
| | (g) | Adjustment to reflect legal fees based upon the current expense structure for Federated Quality Bond Fund II Pro Forma Combined. |
| | (h) | Adjustment to reflect portfolio accounting fees based upon the current expense structure for Federated Quality Bond Fund II Pro Forma Combined. |
| | (i) | Adjustment to reflect removal of distribution fees for High Grade Bond Portfolio and Strategic Yield Portfolio from Federated Quality Bond Fund II Pro Forma Combined since Primary Shares of Federated Quality Bond Fund II do not currently incur a distribution fee. |
| | (j) | Adjustment to reflect printing and postage costs based upon the current expense structure for Federated Quality Bond Fund II Pro Forma Combined. |
| | (k) | Adjustment to reflect insurance premiums based upon the current expense structure for Federated Quality Bond Fund II Pro Forma Combined. |
| | (l) | Adjustment to reflect miscellaneous expenses based upon the current expense structure for Federated Quality Bond Fund II Pro Forma Combined. |
| | (m) | Adjustment to reflect the voluntary waiver of investment advisory fees on the average daily net assets of Federated Quality Bond Fund II Pro Forma Combined. The adviser of Federated Quality Bond Fund II and its affiliates have voluntarily agreed to waive their fees and/or reimburse expenses so that the total annual fund operating expenses (as shown in the financial highlights) paid by the Fund’s Primary Shares (after the voluntary waivers and/or reimbursements) will not exceed 0.75% through the later of (the “Termination Date”); (a) April 30, 2011; or (b) the date of the Fund’s next effective Prospectus. While the adviser and its affiliates currently do not anticipate terminating or increasing these arrangements prior to the Termination Date, these arrangements may only be terminated or increased prior to the Termination Date with the agreement of the Fund’s Trustees. |
| | (n) | Adjustment to reflect the voluntary waiver of administrative personnel and services fee on the average daily net assets of Federated Quality Bond Fund II Pro Forma Combined. |
| | (o) | Adjustment to remove fees paid indirectly for directed broker arrangements for High Grade Bond Portfolio and Strategic Yield Portfolio since these Federated Quality Bond Fund II does not currently participate in these arrangements. |
| | (p) | Adjustment to reflect the sale of a security that cannot transfer over as a result of the reorganization. |
146
G. Acquisition of Blue Chip and Value Growth Portfolios by Federated Capital Appreciation Fund II
INTRODUCTION
The accompanying unaudited Pro Forma Combining Portfolios of Investments, Statements of Assets and Liabilities and Statements of Operations (“Pro Forma Financial Statements”) reflect the accounts of Blue Chip Portfolio, Value Growth Portfolio and Federated Capital Appreciation Fund II (individually referred to as the “Fund” or collectively as the “Funds”), for the period ended December 31, 2010. Blue Chip Portfolio and Value Growth Portfolio will be reorganized into Federated Capital Appreciation Fund II (the “Acquiring Fund”) as of the close of business on or about [July 15], 2011. For the purposes of these Pro Forma Financial Statements, the financial information covers the period from January 1, 2010 to December 31, 2010. These statements have been derived from the books and records utilized in calculating daily net asset values at December 31, 2010.
The Pro Forma Financial Statements give effect to the proposed exchange of assets of Initial Class Shares and Service Class Shares of Blue Chip Portfolio and Value Growth Portfolio for Primary Shares of Federated Capital Appreciation Fund II. Under generally accepted accounting principles, Federated Capital Appreciation Fund II will be the surviving entity for accounting purposes with its historical cost of investment securities and results of operations being carried forward.
The Pro Forma Financial Statements have been adjusted to reflect the anticipated advisory fee arrangement for the surviving entity. Certain other operating costs have also been adjusted to reflect anticipated expenses of the combined entity. Other costs which may change as a result of the reorganization currently are undeterminable.
[Remainder of page intentionally left blank.]
147
Blue Chip Portfolio
Value Growth Portfolio
Federated Capital Appreciation Fund II
Pro Forma Combining Portfolio of Investments
December 31, 2010 (unaudited)
| | | | | | | | | | | | | | | | | | | | | | | | |
Blue
Chip Portfolio | | Value
Growth
Portfolio | | Federated
Capital
Appreciation
Fund II | | Federated
Capital
Appreciation
Fund II Pro Forma
Combined | | | | Blue Chip
Portfolio | | | Value
Growth
Portfolio | | | Federated
Capital
Appreciation
Fund II | | | Federated
Capital
Appreciation
Fund II Pro Forma
Combined | |
| | |
Shares or Principal Amount | | | | | Value | |
COMMON STOCKS – 96.7% | | | | | | | | | | | | | | | | | | |
Consumer Discretionary - 12.0% | | | | | | | | | | | | | | | | | | |
0 | | 2,700 | | 0 | | 2,700 | | (1) AutoZone, Inc. | | $ | 0 | | | $ | 735,993 | | | $ | 0 | | | $ | 735,993 | |
0 | | 7,010 | | 0 | | 7,010 | | (1) Bed Bath & Beyond, Inc. | | | 0 | | | | 344,541 | | | | 0 | | | | 344,541 | |
0 | | 12,800 | | 0 | | 12,800 | | Cash America International, Inc. | | | 0 | | | | 472,704 | | | | 0 | | | | 472,704 | |
33,054 | | 14,065 | | 0 | | 47,119 | | Comcast Corp. - Class A | | | 726,196 | | | | 309,008 | | | | 0 | | | | 1,035,204 | |
0 | | 7,000 | | 0 | | 7,000 | | (1) DIRECTV - Class A | | | 0 | | | | 279,510 | | | | 0 | | | | 279,510 | |
0 | | 28,000 | | 0 | | 28,000 | | (1) EZCORP, Inc. | | | 0 | | | | 759,640 | | | | 0 | | | | 759,640 | |
0 | | 12,400 | | 0 | | 12,400 | | (1) FTI Consulting, Inc. | | | 0 | | | | 462,272 | | | | 0 | | | | 462,272 | |
0 | | 11,700 | | 0 | | 11,700 | | (1) GameStop Corp.- Class A | | | 0 | | | | 267,696 | | | | 0 | | | | 267,696 | |
0 | | 6,200 | | 0 | | 6,200 | | Genuine Parts Co. | | | 0 | | | | 318,308 | | | | 0 | | | | 318,308 | |
0 | | 8,966 | | 0 | | 8,966 | | (1) Helen of Troy Ltd. | | | 0 | | | | 266,649 | | | | 0 | | | | 266,649 | |
0 | | 0 | | 55,800 | | 55,800 | | Johnson Controls, Inc. | | | 0 | | | | 0 | | | | 2,131,560 | | | | 2,131,560 | |
0 | | 0 | | 30,600 | | 30,600 | | (1) Kohl’s Corp. | | | 0 | | | | 0 | | | | 1,662,804 | | | | 1,662,804 | |
44,467 | | 2,200 | | 24,700 | | 71,367 | | McDonald’s Corp. | | | 3,413,287 | | | | 168,872 | | | | 1,895,972 | | | | 5,478,131 | |
0 | | 0 | | 42,200 | | 42,200 | | Omnicom Group, Inc. | | | 0 | | | | 0 | | | | 1,932,760 | | | | 1,932,760 | |
0 | | 10,600 | | 0 | | 10,600 | | (1) O’Reilly Automotive, Inc. | | | 0 | | | | 640,452 | | | | 0 | | | | 640,452 | |
0 | | 0 | | 28,700 | | 28,700 | | Starwood Hotels & Resorts Worldwide, Inc. | | | 0 | | | | 0 | | | | 1,744,386 | | | | 1,744,386 | |
11,900 | | 8,415 | | 0 | | 20,315 | | Target Corp. | | | 715,547 | | | | 505,994 | | | | 0 | | | | 1,221,541 | |
16,497 | | 9,796 | | 0 | | 26,293 | | Time Warner, Inc. | | | 530,709 | | | | 315,137 | | | | 0 | | | | 845,846 | |
41,773 | | 14,735 | | 0 | | 56,508 | | Wal-Mart Stores, Inc. | | | 2,252,818 | | | | 794,659 | | | | 0 | | | | 3,047,477 | |
0 | | 5,245 | | 0 | | 5,245 | | Walgreen Co. | | | 0 | | | | 204,345 | | | | 0 | | | | 204,345 | |
36,092 | | 0 | | 0 | | 36,092 | | Walt Disney Co. | | | 1,353,811 | | | | 0 | | | | 0 | | | | 1,353,811 | |
| | | | | | | | | | | | | | | | | | | | | | | | |
| | | | | | | | TOTAL | | | 8,992,368 | | | | 6,845,780 | | | | 9,367,482 | | | | 25,205,630 | |
| | | | | | | | | | | | | | | | | | | | | | | | |
| | | | | | | | | | | | | | | | | | | | | | | | |
Consumer Staples - 10.6% | | | | | | | | | | | | | | | | | | |
38,185 | | 0 | | 0 | | 38,185 | | Altria Group, Inc. | | | 940,115 | | | | 0 | | | | 0 | | | | 940,115 | |
148
| | | | | | | | | | | | | | | | | | | | | | | | |
0 | | 0 | | 34,900 | | 34,900 | | Archer-Daniels-Midland Co. | | | 0 | | | | 0 | | | | 1,049,792 | | | | 1,049,792 | |
0 | | 6,900 | | 0 | | 6,900 | | Campbell Soup Co. | | | 0 | | | | 239,775 | | | | 0 | | | | 239,775 | |
6,950 | | 2,605 | | 0 | | 9,555 | | Colgate-Palmolive Co. | | | 558,572 | | | | 209,364 | | | | 0 | | | | 767,936 | |
0 | | 6,100 | | 13,835 | | 19,935 | | H.J. Heinz Co. | | | 0 | | | | 301,706 | | | | 684,278 | | | | 985,984 | |
0 | | 4,020 | | 0 | | 4,020 | | Kimberly-Clark Corp. | | | 0 | | | | 253,421 | | | | 0 | | | | 253,421 | |
26,424 | | 12,708 | | 0 | | 39,132 | | Kraft Foods, Inc. | | | 832,620 | | | | 400,429 | | | | 0 | | | | 1,233,049 | |
0 | | 0 | | 48,200 | | 48,200 | | Kroger Co. | | | 0 | | | | 0 | | | | 1,077,752 | | | | 1,077,752 | |
0 | | 0 | | 30,751 | | 30,751 | | Nestle SA | | | 0 | | | | 0 | | | | 1,801,318 | | | | 1,801,318 | |
37,642 | | 19,425 | | 19,500 | | 76,567 | | Procter & Gamble Co. | | | 2,421,510 | | | | 1,249,610 | | | | 1,254,435 | | | | 4,925,555 | |
15,208 | | 5,180 | | 0 | | 20,388 | | PepsiCo, Inc. | | | 993,539 | | | | 338,409 | | | | 0 | | | | 1,331,948 | |
24,085 | | 8,810 | | 0 | | 32,895 | | Philip Morris International Inc. | | | 1,409,695 | | | | 515,649 | | | | 0 | | | | 1,925,344 | |
0 | | 14,390 | | 0 | | 14,390 | | Sysco Corp. | | | 0 | | | | 423,066 | | | | 0 | | | | 423,066 | |
31,034 | | 6,870 | | 37,000 | | 74,904 | | The Coca-Cola Co. | | | 2,041,106 | | | | 451,840 | | | | 2,433,490 | | | | 4,926,436 | |
0 | | 3,700 | | 0 | | 3,700 | | The Coca-Cola FEMSA, S.A.B. de C.V. | | | 0 | | | | 304,991 | | | | 0 | | | | 304,991 | |
| | | | | | | | | | | | | | | | | | | | | | | | |
| | | | | | | | TOTAL | | | 9,197,157 | | | | 4,688,260 | | | | 8,301,065 | | | | 22,186,482 | |
| | | | | | | | | | | | | | | | | | | | | | | | |
Energy - 11.9% | | | | | | | | | | | | | | | | | | |
0 | | 10,200 | | 0 | | 10,200 | | Anadarko Petroleum Corp. | | | 0 | | | | 776,832 | | | | 0 | | | | 776,832 | |
0 | | 2,600 | | 11,600 | | 14,200 | | Apache Corp. | | | 0 | | | | 309,998 | | | | 1,383,068 | | | | 1,693,066 | |
0 | | 6,200 | | 0 | | 6,200 | | Baker Hughes, Inc. | | | 0 | | | | 354,454 | | | | 0 | | | | 354,454 | |
38,610 | | 10,300 | | 35,470 | | 84,380 | | Chevron Corp. | | | 3,523,163 | | | | 939,875 | | | | 3,236,638 | | | | 7,699,676 | |
0 | | 10,257 | | 15,300 | | 25,557 | | ConocoPhillips | | | 0 | | | | 698,502 | | | | 1,041,930 | | | | 1,740,432 | |
0 | | 4,600 | | 0 | | 4,600 | | Devon Energy Corp. | | | 0 | | | | 361,146 | | | | 0 | | | | 361,146 | |
69,936 | | 4,500 | | 31,300 | | 105,736 | | Exxon Mobil Corp. | | | 5,113,720 | | | | 329,040 | | | | 2,288,656 | | | | 7,731,416 | |
0 | | 14,600 | | 0 | | 14,600 | | Helmerich & Payne, inc. | | | 0 | | | | 707,808 | | | | 0 | | | | 707,808 | |
0 | | 4,300 | | 0 | | 4,300 | | Noble Corp. | | | 0 | | | | 153,811 | | | | 0 | | | | 153,811 | |
0 | | 6,800 | | 0 | | 6,800 | | Occidental Petroleum Corp. | | | 0 | | | | 667,080 | | | | 0 | | | | 667,080 | |
0 | | 8,800 | | 0 | | 8,800 | | (1) Rowan Companies, Inc. | | | 0 | | | | 307,208 | | | | 0 | | | | 307,208 | |
0 | | 0 | | 16,600 | | 16,600 | | Schlumberger Ltd. | | | 0 | | | | 0 | | | | 1,386,100 | | | | 1,386,100 | |
0 | | 4,600 | | 0 | | 4,600 | | (1) Transocean Ltd. | | | 0 | | | | 319,746 | | | | 0 | | | | 319,746 | |
0 | | 6,300 | | 0 | | 6,300 | | Valero Energy Corp. | | | 0 | | | | 145,656 | | | | 0 | | | | 145,656 | |
0 | | 0 | | 49,517 | | 49,517 | | (1) Weatherford International Ltd. | | | 0 | | | | 0 | | | | 1,128,988 | | | | 1,128,988 | |
| | | | | | | | | | | | | | | | | | | | | | | | |
| | | | | | | | TOTAL | | | 8,636,883 | | | | 6,071,156 | | | | 10,465,380 | | | | 25,173,419 | |
| | | | | | | | | | | | | | | | | | | | | | | | |
Financials - 13.1% | | | | | | | | | | | | | | | | | | |
0 | | 4,910 | | 0 | | 4,910 | | Allstate Corp. | | | 0 | | | | 156,531 | | | | 0 | | | | 156,531 | |
0 | | 29,300 | | 0 | | 29,300 | | American Equity Investment Life Holding Co. | | | 0 | | | | 367,715 | | | | 0 | | | | 367,715 | |
54,692 | | 0 | | 0 | | 54,692 | | American Express Co. | | | 2,347,381 | | | | 0 | | | | 0 | | | | 2,347,381 | |
10,349 | | 0 | | 0 | | 10,349 | | Ameriprise Financial, Inc. | | | 595,585 | | | | 0 | | | | 0 | | | | 595,585 | |
149
| | | | | | | | | | | | | | | | | | | | | | | | |
0 | | 12,365 | | 0 | | 12,365 | | Arthur J. Gallagher & Co. | | | 0 | | | | 359,574 | | | | 0 | | | | 359,574 | |
0 | | 0 | | 12,900 | | 12,900 | | Avalonbay Communities, Inc. | | | 0 | | | | 0 | | | | 1,451,895 | | | | 1,451,895 | |
45,666 | | 16,089 | | 0 | | 61,755 | | Bank of America Corp. | | | 609,184 | | | | 214,627 | | | | 0 | | | | 823,811 | |
0 | | 7,150 | | 0 | | 7,150 | | Bank of New York Mellon Corp. | | | 0 | | | | 215,930 | | | | 0 | | | | 215,930 | |
0 | | 68,775 | | 0 | | 68,775 | | BGC Partners, Inc. - Class A | | | 0 | | | | 571,520 | | | | 0 | | | | 571,520 | |
0 | | 10,400 | | 0 | | 10,400 | | CIGNA Corp. | | | 0 | | | | 381,264 | | | | 0 | | | | 381,264 | |
48,341 | | 0 | | 221,800 | | 270,141 | | (1) Citigroup, Inc. | | | 228,653 | | | | 0 | | | | 1,049,115 | | | | 1,277,768 | |
0 | | 50,000 | | 0 | | 50,000 | | (1) CNO Financial Group, Inc. | | | 0 | | | | 339,000 | | | | 0 | | | | 339,000 | |
0 | | 0 | | 26,100 | | 26,100 | | Comerica, Inc. | | | 0 | | | | 0 | | | | 1,102,464 | | | | 1,102,464 | |
0 | | 13,610 | | 0 | | 13,610 | | EMC Insurance Group, Inc. | | | 0 | | | | 308,130 | | | | 0 | | | | 308,130 | |
0 | | 0 | | 7,200 | | 7,200 | | Goldman Sachs Group, Inc. | | | 0 | | | | 0 | | | | 1,210,752 | | | | 1,210,752 | |
0 | | 11,100 | | 0 | | 11,100 | | Hartford Financial Services Group, Inc. | | | 0 | | | | 294,039 | | | | 0 | | | | 294,039 | |
0 | | 0 | | 68,493 | | 68,493 | | Invesco Ltd. | | | 0 | | | | 0 | | | | 1,647,941 | | | | 1,647,941 | |
0 | | 9,600 | | 0 | | 9,600 | | (1) Investment Technology Group, Inc. | | | 0 | | | | 157,152 | | | | 0 | | | | 157,152 | |
46,325 | | 6,600 | | 43,760 | | 96,685 | | J.P. Morgan Chase & Co. | | | 1,965,107 | | | | 279,972 | | | | 1,856,299 | | | | 4,101,378 | |
0 | | 9,600 | | 0 | | 9,600 | | Kansas City Life Insurance Co. | | | 0 | | | | 317,088 | | | | 0 | | | | 317,088 | |
0 | | 11,300 | | 0 | | 11,300 | | Lincoln National Corp. | | | 0 | | | | 314,253 | | | | 0 | | | | 314,253 | |
0 | | 8,705 | | 33,700 | | 42,405 | | MetLife, Inc. | | | 0 | | | | 386,850 | | | | 1,497,628 | | | | 1,884,478 | |
0 | | 23,156 | | 0 | | 23,156 | | New York Community Bancorp, Inc. | | | 0 | | | | 436,491 | | | | 0 | | | | 436,491 | |
0 | | 6,900 | | 0 | | 6,900 | | Northern Trust Corp. | | | 0 | | | | 382,329 | | | | 0 | | | | 382,329 | |
0 | | 21,200 | | 0 | | 21,200 | | Protective Life Corp. | | | 0 | | | | 564,768 | | | | 0 | | | | 564,768 | |
0 | | 22,450 | | 0 | | 22,450 | | SEI Investments Co. | | | 0 | | | | 534,086 | | | | 0 | | | | 534,086 | |
0 | | 0 | | 20,900 | | 20,900 | | State Street Corp. | | | 0 | | | | 0 | | | | 968,506 | | | | 968,506 | |
0 | | 0 | | 29,300 | | 29,300 | | SunTrust Banks, Inc. | | | 0 | | | | 0 | | | | 864,643 | | | | 864,643 | |
0 | | 9,135 | | 55,010 | | 64,145 | | U.S. Bancorp | | | 0 | | | | 246,371 | | | | 1,483,620 | | | | 1,729,991 | |
44,074 | | 1,981 | | 0 | | 46,055 | | Wells Fargo & Co. | | | 1,365,853 | | | | 61,391 | | | | 0 | | | | 1,427,244 | |
15,320 | | 0 | | 0 | | 15,320 | | Weyerhaeuser Co. | | | 290,008 | | | | 0 | | | | 0 | | | | 290,008 | |
0 | | 18,200 | | 0 | | 18,200 | | Wilshire Bancorp, Inc. | | | 0 | | | | 138,684 | | | | 0 | | | | 138,684 | |
| | | | | | | | | | | | | | | | | | | | | | | | |
| | | | | | | | TOTAL | | | 7,401,771 | | | | 7,027,765 | | | | 13,132,863 | | | | 27,562,399 | |
| | | | | | | | | | | | | | | | | | | | | | | | |
Health Care - 10.8% | | | | | | | | | | | | | | | | |
24,755 | | 7,600 | | 15,400 | | 47,755 | | Abbott Laboratories | | | 1,186,012 | | | | 364,116 | | | | 737,814 | | | | 2,287,942 | |
0 | | 7,000 | | 0 | | 7,000 | | (1) Agilent Technologies, Inc. | | | 0 | | | | 290,010 | | | | 0 | | | | 290,010 | |
0 | | 0 | | 17,000 | | 17,000 | | Allergen, Inc. | | | 0 | | | | 0 | | | | 1,167,390 | | | | 1,167,390 | |
17,835 | | 7,625 | | 0 | | 25,460 | | (1) Amgen, Inc. | | | 979,142 | | | | 418,612 | | | | 0 | | | | 1,397,754 | |
0 | | 5,326 | | 0 | | 5,326 | | Becton, Dickinson and Co. | | | 0 | | | | 450,154 | | | | 0 | | | | 450,154 | |
0 | | 3,300 | | 0 | | 3,300 | | (1) Bio-Rad Laboratories, Inc. - Class A | | | 0 | | | | 342,705 | | | | 0 | | | | 342,705 | |
150
| | | | | | | | | | | | | | | | | | | | | | | | |
41,053 | | 0 | | 0 | | 41,053 | | Bristol-Myers Squibb Co. | | | 1,087,083 | | | | 0 | | | | 0 | | | | 1,087,083 | |
0 | | 0 | | 14,350 | | 14,350 | | (1) Celgene Corp. | | | 0 | | | | 0 | | | | 848,659 | | | | 848,659 | |
17,662 | | 0 | | 0 | | 17,662 | | Eli Lilly and Co. | | | 618,876 | | | | 0 | | | | 0 | | | | 618,876 | |
0 | | 0 | | 8,400 | | 8,400 | | (1) Hospira, Inc. | | | 0 | | | | 0 | | | | 467,796 | | | | 467,796 | |
0 | | 0 | | 26,400 | | 26,400 | | (1) Humana, Inc. | | | 0 | | | | 0 | | | | 1,445,136 | | | | 1,445,136 | |
42,710 | | 16,700 | | 0 | | 59,410 | | Johnson & Johnson | | | 2,641,614 | | | | 1,032,895 | | | | 0 | | | | 3,674,509 | |
31,708 | | 8,638 | | 37,650 | | 77,996 | | Merck & Co. | | | 1,142,756 | | | | 311,314 | | | | 1,356,906 | | | | 2,810,976 | |
0 | | 3,375 | | 0 | | 3,375 | | (1) Mettler-Toledo International, Inc. | | | 0 | | | | 510,334 | | | | 0 | | | | 510,334 | |
0 | | 10,050 | | 0 | | 10,050 | | (1) Mylan, Inc. | | | 0 | | | | 212,356 | | | | 0 | | | | 212,356 | |
0 | | 17,000 | | 0 | | 17,000 | | (1) Myriad Genetics, Inc. | | | 0 | | | | 388,280 | | | | 0 | | | | 388,280 | |
44,377 | | 44,486 | | 59,700 | | 148,563 | | Pfizer, Inc. | | | 777,041 | | | | 778,950 | | | | 1,045,347 | | | | 2,601,338 | |
0 | | 7,200 | | 0 | | 7,200 | | Quest Diagnostics, Inc. | | | 0 | | | | 388,584 | | | | 0 | | | | 388,584 | |
0 | | 0 | | 11,000 | | 11,000 | | Shire Ltd., ADR | | | 0 | | | | 0 | | | | 796,180 | | | | 796,180 | |
0 | | 4,380 | | 0 | | 4,380 | | Stryker Corp. | | | 0 | | | | 235,206 | | | | 0 | | | | 235,206 | |
0 | | 9,691 | | 0 | | 9,691 | | Teva Pharmaceutical Industries Ltd. | | | 0 | | | | 505,192 | | | | 0 | | | | 505,192 | |
0 | | 3,200 | | 0 | | 3,200 | | (1) United Therapeutics Corp. | | | 0 | | | | 202,304 | | | | 0 | | | | 202,304 | |
| | | | | | | | | | | | | | | | | | | | | | | | |
| | | | | | | | TOTAL | | | 8,432,524 | | | | 6,431,012 | | | | 7,865,228 | | | | 22,728,764 | |
| | | | | | | | | | | | | | | | | | | | | | | | |
Industrials - 11.1% | | | | | | | | | | | | | | | | | | |
17,453 | | 5,890 | | 0 | | 23,343 | | 3M Co. | | | 1,506,194 | | | | 508,307 | | | | 0 | | | | 2,014,501 | |
0 | | 42,700 | | 0 | | 42,700 | | (1) BigBand Networks, Inc. | | | 0 | | | | 119,560 | | | | 0 | | | | 119,560 | |
26,912 | | 0 | | 0 | | 26,912 | | Boeing Co. | | | 1,756,277 | | | | 0 | | | | 0 | | | | 1,756,277 | |
21,144 | | 0 | | 15,800 | | 36,944 | | Caterpillar, Inc. | | | 1,980,347 | | | | 0 | | | | 1,479,828 | | | | 3,460,175 | |
0 | | 4,800 | | 0 | | 4,800 | | Danaher Corp. | | | 0 | | | | 226,416 | | | | 0 | | | | 226,416 | |
0 | | 13,300 | | 0 | | 13,300 | | Federal Signal Corp. | | | 0 | | | | 91,238 | | | | 0 | | | | 91,238 | |
0 | | 0 | | 15,600 | | 15,600 | | Fluor Corp. | | | 0 | | | | 0 | | | | 1,033,656 | | | | 1,033,656 | |
0 | | 0 | | 16,700 | | 16,700 | | (1) Foster Wheeler AG | | | 0 | | | | 0 | | | | 576,484 | | | | 576,484 | |
84,256 | | 66,480 | | 35,700 | | 186,436 | | General Electric Co. | | | 1,541,042 | | | | 1,215,919 | | | | 652,953 | | | | 3,409,914 | |
20,054 | | 18,835 | | 0 | | 38,889 | | Honeywell International, Inc. | | | 1,066,071 | | | | 1,001,269 | | | | 0 | | | | 2,067,340 | |
0 | | 12,580 | | 0 | | 12,580 | | Illinois Tool Works, Inc. | | | 0 | | | | 671,772 | | | | 0 | | | | 671,772 | |
0 | | 13,020 | | 0 | | 13,020 | | ITT Corp. | | | 0 | | | | 678,472 | | | | 0 | | | | 678,472 | |
0 | | 0 | | 10,600 | | 10,600 | | Joy Global, Inc. | | | 0 | | | | 0 | | | | 919,550 | | | | 919,550 | |
0 | | 12,300 | | 0 | | 12,300 | | (1) Orion Marine Group, Inc. | | | 0 | | | | 142,680 | | | | 0 | | | | 142,680 | |
0 | | 0 | | 11,800 | | 11,800 | | Precision Castparts Corp. | | | 0 | | | | 0 | | | | 1,642,678 | | | | 1,642,678 | |
0 | | 3,140 | | 0 | | 3,140 | | United Pacific Corp. | | | 0 | | | | 290,952 | | | | 0 | | | | 290,952 | |
0 | | 5,675 | | 0 | | 5,675 | | United Parcel Service, Inc. - Class B | | | 0 | | | | 411,892 | | | | 0 | | | | 411,892 | |
20,007 | | 0 | | 26,000 | | 46,007 | | United Technologies Corp. | | | 1,574,951 | | | | 0 | | | | 2,046,720 | | | | 3,621,671 | |
0 | | 5,300 | | 0 | | 5,300 | | Waste Management, Inc. | | | 0 | | | | 195,411 | | | | 0 | | | | 195,411 | |
151
| | | | | | | | | | | | | | | | | | | | | | | | |
| | | | | | | | TOTAL | | | 9,424,882 | | | | 5,553,888 | | | | 8,351,869 | | | | 23,330,639 | |
| | | | | | | | | | | | | | | | | | | | | | | | |
| | | | |
Information Technology - 17.1% | | | | | | | | | | | | | | | | |
0 | | 11,700 | | 0 | | 11,700 | | (1) Adobe Systems, Inc. | | | 0 | | | | 360,126 | | | | 0 | | | | 360,126 | |
0 | | 4,160 | | 7,150 | | 11,310 | | (1) Apple, Inc. | | | 0 | | | | 1,341,850 | | | | 2,306,304 | | | | 3,648,154 | |
23,520 | | 0 | | 0 | | 23,520 | | Applied Materials, Inc. | | | 330,456 | | | | 0 | | | | 0 | | | | 330,456 | |
0 | | 0 | | 48,500 | | 48,500 | | (1) Atmel Corp. | | | 0 | | | | 0 | | | | 597,520 | | | | 597,520 | |
0 | | 6,700 | | 0 | | 6,700 | | Automatic Data Processing, Inc. | | | 0 | | | | 310,076 | | | | 0 | | | | 310,076 | |
61,023 | | 0 | | 30,900 | | 91,923 | | (1) Cisco Systems, Inc., Class A | | | 1,234,495 | | | | 0 | | | | 1,345,694 | | | | 2,580,189 | |
0 | | 46,570 | | 0 | | 46,570 | | (1) Cisco Systems, Inc. | | | 0 | | | | 942,111 | | | | 0 | | | | 942,111 | |
30,585 | | 0 | | 0 | | 30,585 | | (1) Dell, Inc. | | | 414,427 | | | | 0 | | | | 0 | | | | 414,427 | |
0 | | 13,135 | | 0 | | 13,135 | | (1) eBay, Inc. | | | 0 | | | | 365,547 | | | | 0 | | | | 365,547 | |
37,308 | | 62,025 | | 0 | | 99,333 | | (1) EMC Corp. | | | 854,353 | | | | 1,420,373 | | | | 0 | | | | 2,274,726 | |
0 | | 0 | | 1,500 | | 1,500 | | (1) Google Inc., Class A | | | 0 | | | | 0 | | | | 890,955 | | | | 890,955 | |
40,454 | | 5,270 | | 0 | | 45,724 | | Hewlett-Packard Co. | | | 1,703,113 | | | | 221,867 | | | | 0 | | | | 1,924,980 | |
14,526 | | 0 | | 11,600 | | 26,126 | | IBM Corp. | | | 2,131,836 | | | | 0 | | | | 1,702,416 | | | | 3,834,252 | |
57,041 | | 17,500 | | 0 | | 74,541 | | Intel Corp. | | | 1,199,572 | | | | 368,025 | | | | 0 | | | | 1,567,597 | |
0 | | 0 | | 1,450,000 | | 1,450,000 | | Lenovo Group Ltd. | | | 0 | | | | 0 | | | | 921,196 | | | | 921,196 | |
0 | | 5,900 | | 0 | | 5,900 | | (1) ManTech International Corp. - Series A | | | 0 | | | | 243,847 | | | | 0 | | | | 243,847 | |
91,883 | | 55,255 | | 26,400 | | 173,538 | | Microsoft Corp. | | | 2,565,373 | | | | 1,542,720 | | | | 737,088 | | | | 4,845,181 | |
37,189 | | 0 | | 0 | | 37,189 | | (1) Motorola, Inc. | | | 337,304 | | | | 0 | | | | 0 | | | | 337,304 | |
0 | | 6,000 | | 0 | | 6,000 | | (1) NCI, Inc. - Class A | | | 0 | | | | 137,940 | | | | 0 | | | | 137,940 | |
57,149 | | 46,070 | | 60,400 | | 163,619 | | Oracle Corp. | | | 1,788,764 | | | | 1,441,991 | | | | 1,890,520 | | | | 5,121,275 | |
0 | | 4,200 | | 0 | | 4,200 | | QUALCOMM, Inc. | | | 0 | | | | 207,858 | | | | 0 | | | | 207,858 | |
0 | | 11,900 | | 0 | | 11,900 | | (1) Super Micro Computer, Inc. | | | 0 | | | | 137,326 | | | | 0 | | | | 137,326 | |
0 | | 28,002 | | 0 | | 28,002 | | (1) Symantec Corp. | | | 0 | | | | 468,753 | | | | 0 | | | | 468,753 | |
26,461 | | 0 | | 0 | | 26,461 | | Texas Instruments, Inc. | | | 859,983 | | | | 0 | | | | 0 | | | | 859,983 | |
0 | | 0 | | 144,800 | | 144,800 | | Xerox Corp. | | | 0 | | | | 0 | | | | 1,668,096 | | | | 1,668,096 | |
0 | | 0 | | 33,700 | | 33,700 | | Xilinx, Inc. | | | 0 | | | | 0 | | | | 976,626 | | | | 976,626 | |
| | | | | | | | | | | | | | | | | | | | | | | | |
| | | | | | | | TOTAL | | | 13,419,676 | | | | 9,510,410 | | | | 13,036,415 | | | | 35,966,501 | |
| | | | | | | | | | | | | | | | | | | | | | | | |
| | | | |
Materials - 4.2% | | | | | | | | | | | | | | | | |
0 | | 2,000 | | 14,400 | | 16,400 | | Agnico Eagle Mines Ltd. | | | 0 | | | | 153,400 | | | | 1,104,480 | | | | 1,257,880 | |
30,278 | | 0 | | 0 | | 30,278 | | Alcoa, Inc. | | | 465,978 | | | | 0 | | | | 0 | | | | 465,978 | |
0 | | 24,946 | | 0 | | 24,946 | | Barrick Gold Corp. | | | 0 | | | | 1,326,628 | | | | 0 | | | | 1,326,628 | |
0 | | 0 | | 6,400 | | 6,400 | | CF Industries Holdings, Inc. | | | 0 | | | | 0 | | | | 864,960 | | | | 864,960 | |
10,505 | | 5,330 | | 0 | | 15,835 | | Dow Chemical Co. | | | 358,641 | | | | 181,966 | | | | 0 | | | | 540,607 | |
15,756 | | 16,005 | | 0 | | 31,761 | | E.I. Du Pont de Nemours and Co. | | | 785,909 | | | | 798,329 | | | | 0 | | | | 1,584,238 | |
0 | | 0 | | 4,300 | | 4,300 | | Freeport-McMoran Copper & Gold, Inc. | | | 0 | | | | 0 | | | | 516,387 | | | | 516,387 | |
152
| | | | | | | | | | | | | | | | | | | | | | | | |
0 | | 0 | | 12,600 | | 12,600 | | Mosanto Co. | | | 0 | | | | 0 | | | | 877,464 | | | | 877,464 | |
0 | | 12,000 | | 0 | | 12,000 | | Newmont Mining Corp. | | | 0 | | | | 737,160 | | | | 0 | | | | 737,160 | |
0 | | 0 | | 40,200 | | 40,200 | | (1) Stillwater Mining Co. | | | 0 | | | | 0 | | | | 858,270 | | | | 858,270 | |
| | | | | | | | | | | | | | | | | | | | | | | | |
| | | | | | | | TOTAL | | | 1,610,528 | | | | 3,197,483 | | | | 4,221,561 | | | | 9,029,572 | |
| | | | | | | | | | | | | | | | | | | | | | | | |
Telecommunication Services - 2.8% | | | | | | | | | | | | | | | | |
34,855 | | 17,660 | | 0 | | 52,515 | | AT&T, Inc. | | | 1,024,040 | | | | 518,851 | | | | 0 | | | | 1,542,891 | |
0 | | 3,616 | | 81,600 | | 85,216 | | Frontier Communications Corp. | | | 0 | | | | 35,184 | | | | 793,968 | | | | 829,152 | |
0 | | 0 | | 220,000 | | 220,000 | | Qwest Communications International, Inc. | | | 0 | | | | 0 | | | | 1,674,200 | | | | 1,674,200 | |
36,562 | | 15,065 | | 0 | | 51,627 | | Verizon Communications, Inc. | | | 1,308,188 | | | | 539,026 | | | | 0 | | | | 1,847,214 | |
| | | | | | | | | | | | | | | | | | | | | | | | |
| | | | | | | | TOTAL | | | 2,332,228 | | | | 1,093,061 | | | | 2,468,168 | | | | 5,893,457 | |
| | | | | | | | | | | | | | | | | | | | | | | | |
Utilities - 2.3% | | | | | | | | | | | | | | | | | | |
0 | | 11,267 | | 0 | | 11,267 | | Atmos Energy Corp. | | | 0 | | | | 351,530 | | | | 0 | | | | 351,530 | |
0 | | 28,300 | | 0 | | 28,300 | | CMS Energy Corp. | | | 0 | | | | 526,380 | | | | 0 | | | | 526,380 | |
24,105 | | 0 | | 0 | | 24,105 | | Exelon Corp. | | | 1,003,732 | | | | 0 | | | | 0 | | | | 1,003,732 | |
0 | | 9,886 | | 0 | | 9,886 | | Integrys Energy Group, Inc. | | | 0 | | | | 479,570 | | | | 0 | | | | 479,570 | |
0 | | 12,335 | | 0 | | 12,335 | | Pepco Holdings, Inc. | | | 0 | | | | 225,114 | | | | 0 | | | | 225,114 | |
0 | | 9,200 | | 0 | | 9,200 | | Pinnacle West Capital Corp. | | | 0 | | | | 381,340 | | | | 0 | | | | 381,340 | |
21,215 | | 0 | | 29,500 | | 50,715 | | Southern Co. | | | 811,049 | | | | 0 | | | | 1,129,697 | | | | 1,940,746 | |
| | | | | | | | | | | | | | | | | | | | | | | | |
| | | | | | | | TOTAL | | | 1,814,781 | | | | 1,963,934 | | | | 1,129,697 | | | | 4,908,412 | |
| | | | | | | | | | | | | | | | | | | | | | | | |
Other Investment Companies and Exchange-Traded Funds - 0.8% | | | | | | | | | | | | | | | | |
0 | | 71,553 | | 0 | | 71,553 | | Adams Express Co. | | | 0 | | | | 767,048 | | | | 0 | | | | 767,048 | |
0 | | 40,386 | | 0 | | 40,386 | | H&Q Life Sciences Investors | | | 0 | | | | 434,958 | | | | 0 | | | | 434,958 | |
0 | | 6,900 | | 0 | | 6,900 | | (1) ProShares UltraShort 20+Year Treasury | | | 0 | | | | 255,645 | | | | 0 | | | | 255,645 | |
0 | | 13,200 | | 0 | | 13,200 | | Redwood Trust, Inc. | | | 0 | | | | 197,076 | | | | 0 | | | | 197,076 | |
| | | | | | | | | | | | | | | | | | | | | | | | |
| | | | | | | | TOTAL | | | 0 | | | | 1,654,727 | | | | 0 | | | | 1,654,727 | |
| | | | | | | | | | | | | | | | | | | | | | | | |
| | | | | | | | TOTAL COMMON STOCKS (IDENTIFIED COST $167,510,909) | | | 71,262,798 | | | | 54,037,476 | | | | 78,339,728 | | | | 203,640,002 | |
| | | | | | | | | | | | | | | | | | | | | | | | |
GOVERNMENT AGENCIES - 2.3% | | | | | | | | | | | | | | | | |
$0 | | $1,000,000 | | $0 | | $1,000,000 | | Federal Home Loan Mortgage Corp., 0.09%, 1/10/2011 | | | 0 | | | | 999,975 | | | | 0 | | | | 999,975 | |
1,000,000 | | 0 | | 0 | | 1,000,000 | | Federal Home Loan Bank, 0.10%, 1/21/2011 | | | 999,939 | | | | 0 | | | | 0 | | | | 999,939 | |
153
| | | | | | | | | | | | | | | | | | | | | | | | |
500,000 | | 0 | | 0 | | 500,000 | | Federal Home Loan Bank, 0.12%, 1/28/2011 | | | 499,955 | | | | 0 | | | | 0 | | | | 499,955 | |
788,000 | | 0 | | 0 | | 788,000 | | Federal Home Loan Bank, 0.001%, 2/11/2011 | | | 787,910 | | | | 0 | | | | 0 | | | | 787,910 | |
750,000 | | 0 | | 0 | | 750,000 | | Federal Home Loan Mortgage Corp., 0.09%, 1/10/2011 | | | 749,981 | | | | 0 | | | | 0 | | | | 749,981 | |
750,000 | | 0 | | 0 | | 750,000 | | Federal National Mortgage Assoc., 0.15%, 2/15/2011 | | | 749,888 | | | | 0 | | | | 0 | | | | 749,888 | |
| | | | | | | | | | | | | | | | | | | | | | | | |
| | | | | | | | TOTAL GOVERNMENT AGENCIES (IDENTIFIED COST $4,787,648) | | | 3,787,673 | | | | 999,975 | | | | 0 | | | | 4,787,648 | |
| | | | | | | | | | | | | | | | | | | | | | | | |
MONEY MARKET MUTUAL FUND - 0.4% | | | | | | | | | | | | | | | | |
426,567 | | 301,373 | | 0 | | 727,940 | | JP Morgan U.S. Treasury Plus Money Market Fund (IDENTIFIED COST $727,940) | | | 426,567 | | | | 301,373 | | | | 0 | | | | 727,940 | |
| | | | | | | | | | | | | | | | | | | | | | | | |
REPURCHASE AGREEMENT - 0.4% | | | | | | | | | | | | | | | | |
0 | | 0 | | 926,000 | | 926,000 | | Interest in $5,850,000,000 joint repurchase agreement 0.25%, dated 12/31/2010 under which Bank of America, N.A. will repurchase securities provided as collateral for $5,850,121,875 on 1/3/2011. The securities provided as collateral at the end of the period were U.S. Government Agency securities with various maturities to 4/15/2040 and the market value of those underlying securities was $5,972,500,657 (AT COST). | | | 0 | | | | 0 | | | | 926,000 | | | | 926,000 | |
| | | | | | | | | | | | | | | | | | | | | | | | |
| | | | | | | | Total Investments (Identified Cost $173,952,497- 99.8%)(2) | | | 75,477,038 | | | | 55,338,824 | | | | 79,265,728 | | | | 210,081,590 | |
| | | | | | | | | | | | | | | | | | | | | | | | |
| | | | | | | | Other Assets and Liabilities - 0.2% (3)(4) | | | 38,162 | | | | 20,588 | | | | 350,826 | | | | 408,024 | |
| | | | | | | | | | | | | | | | | | | | | | | | |
154
| | | | | | | | | | | | | | | | | | | | | | | | |
| | | | | | | | Total Net Assets - 100% | | $ | 75,515,200 | | | $ | 55,359,412 | | | $ | 79,616,554 | | | $ | 210,489,614 | |
| | | | | | | | | | | | | | | | | | | | | | | | |
Note: The categories of investments are shown as a percentage of total net assets at December 31, 2010.
| (1) | Non-income producing security. |
| (2) | The cost of investment for federal tax purposes for the Pro Forma Combined amounts to $174,986,477. |
| (3) | Assets, other than investments in securities, less liabilities. See Statement of Assets and Liabilities. |
| (4) | Total for Federated Capital Appreciation Fund II Pro Forma Combined includes an adjustment of ($1,552) for prepaid expenses which will not transfer as a result of the reorganization. |
Various inputs are used in determining the value of each funds’ investments. These inputs are summarized in the three broad levels listed below:
| | |
| | Level 1 - quoted prices in active markets for identical securities |
| | Level 2 - other significant observable inputs (including quoted prices for similar securities, interest rates, prepayment speeds, credit risks, etc.) |
| | Level 3 - significant unobservable inputs (including each fund’s own assumptions in determining the fair value of investments) |
The inputs or methodology used for valuing securities are not an indication of the risk associated with investing in those securities.
The following is a summary of the inputs used, as of December 31, 2010, in valuing each fund’s assets carried at fair value:
| | | | | | | | | | | | | | | | |
| Fund | | Valuation Inputs | |
| | | Level 1 | | | Level 2 | | | Level 3 | | | Total | |
Blue Chip Portfolio | | | | | | | | | | | | | | | | |
Equity Securities: | | | | | | | | | | | | | | | | |
Common Stock | | | | | | | | | | | | | | | | |
Domestic | | $ | 71,262,798 | | | $ | 0 | | | $ | 0 | | | $ | 71,262,798 | |
International | | | 0 | | | | 0 | | | | 0 | | | | 0 | |
Debt Securities: | | | | | | | | | | | | | | | | |
Government Agencies | | | 0 | | | | 3,787,673 | | | | 0 | | | | 3,787,673 | |
Money Market Mutual Fund | | | 426,567 | | | | 0 | | | | 0 | | | | 426,567 | |
Repurchase Agreements | | | 0 | | | | 0 | | | | 0 | | | | 0 | |
| | | | | | | | | | | | | | | | |
TOTAL SECURITIES | | $ | 71,689,365 | | | $ | 3,787,673 | | | $ | 0 | | | $ | 75,477,038 | |
| | | | |
Value Growth Portfolio | | | | | | | | | | | | | | | | |
Equity Securities: | | | | | | | | | | | | | | | | |
Common Stock | | | | | | | | | | | | | | | | |
Domestic | | $ | 54,037,476 | | | $ | 0 | | | $ | 0 | | | $ | 54,037,476 | |
International | | | 0 | | | | 0 | | | | 0 | | | | 0 | |
Debt Securities: | | | | | | | | | | | | | | | | |
Government Agencies | | | 0 | | | | 999,975 | | | | 0 | | | | 999,975 | |
Money Market Mutual Fund | | | 301,373 | | | | 0 | | | | 0 | | | | 301,373 | |
Repurchase Agreements | | | 0 | | | | 0 | | | | 0 | | | | 0 | |
| | | | | | | | | | | | | | | | |
155
| | | | | | | | | | | | | | | | |
TOTAL SECURITIES | | $ | 54,338,849 | | | $ | 999,975 | | | $ | 0 | | | $ | 55,338,824 | |
Federated Capital Appreciation Fund II | | | | | | | | | | | | | | | | |
Equity Securities: | | | | | | | | | | | | | | | | |
Common Stock | | | | | | | | | | | | | | | | |
Domestic | | $ | 68,977,041 | | | $ | 0 | | | $ | 0 | | | $ | 68,977,041 | |
International | | | 6,640,173 | | | | 2,722,514 | | | | 0 | | | | 9,362,687 | |
Debt Securities: | | | | | | | | | | | | | | | | |
Government Agencies | | | 0 | | | | 0 | | | | 0 | | | | 0 | |
Money Market Mutual Fund | | | 0 | | | | 0 | | | | 0 | | | | 0 | |
Repurchase Agreements | | | 0 | | | | 926,000 | | | | 0 | | | | 926,000 | |
| | | | | | | | | | | | | | | | |
TOTAL SECURITIES | | $ | 75,617,214 | | | $ | 3,648,514 | | | $ | 0 | | | $ | 79,265,728 | |
Federated Capital Appreciation Fund Pro Forma Combined | | | | | | | | | | | | | | | | |
Equity Securities: | | | | | | | | | | | | | | | | |
Common Stock | | | | | | | | | | | | | | | | |
Domestic | | $ | 194,277,315 | | | $ | 0 | | | $ | 0 | | | $ | 194,277,315 | |
International | | | 6,640,173 | | | | 2,722,514 | | | | 0 | | | | 9,362,687 | |
Debt Securities: | | | | | | | | | | | | | | | | |
Government Agencies | | | 0 | | | | 4,787,648 | | | | 0 | | | | 4,787,648 | |
Money Market Mutual Fund | | | 727,940 | | | | 0 | | | | 0 | | | | 727,940 | |
Repurchase Agreements | | | 0 | | | | 926,000 | | | | 0 | | | | 926,000 | |
| | | | | | | | | | | | | | | | |
TOTAL SECURITIES | | $ | 201,645,428 | | | $ | 8,436,162 | | | $ | 0 | | | $ | 210,081,590 | |
The following acronym is used throughout these portfolios:
| | |
ADR | | - American Depository Receipt |
156
Blue Chip Portfolio
Value Growth Portfolio
Federated Capital Appreciation Fund II
Pro Forma Combining Statements of Assets & Liabilities
December 31, 2010 (unaudited)
| | | | | | | | | | | | | | | | | | | | |
| | | Blue Chip Portfolio | | | Value Growth
Portfolio | | | Federated
Capital
Appreciation
Fund II | | | Pro Forma
Adjustment | | | Federated
Capital
Appreciation
Fund II
Proforma
Combined | |
Assets: | | | | | | | | | | | | | | | | | | | | |
Investments in securities, at value | | $ | 75,477,038 | | | $ | 55,338,824 | | | $ | 79,265,728 | | | $ | 0 | | | $ | 210,081,590 | |
Cash | | | 0 | | | | 0 | | | | 571 | | | | 0 | | | | 571 | |
Income receivable | | | 97,383 | | | | 66,185 | | | | 81,888 | | | | 0 | | | | 245,456 | |
Receivable for investments sold | | | 0 | | | | 0 | | | | 982,093 | | | | 0 | | | | 982,093 | |
Receivable for shares sold | | | 18791 | | | | 11680 | | | | 969 | | | | 0 | | | | 31,440 | |
Prepaid expenses | | | 896 | | | | 656 | | | | 0 | | | | (1,552 | ) (a) | | | 0 | |
| | | | | | | | | | | | | | | | | | | | |
Total assets | | | 75,594,108 | | | | 55,417,345 | | | | 80,331,249 | | | | (1,552 | ) | | | 211,341,150 | |
| | | | | | | | | | | | | | | | | | | | |
Liabilities: | | | | | | | | | | | | | | | | | | | | |
Payable for investments purchased | | | 0 | | | | 0 | | | | 624,034 | | | | 0 | | | | 624,034 | |
Payable for shares redeemed | | | 66,619 | | | | 47,563 | | | | 48,079 | | | | 0 | | | | 162,261 | |
Accrued expenses | | | 12,289 | | | | 10,370 | | | | 42,582 | | | | 0 | | | | 65,241 | |
| | | | | | | | | | | | | | | | | | | | |
Total liabilities | | | 78,908 | | | | 57,933 | | | | 714,695 | | | | 0 | | | | 851,536 | |
| | | | | | | | | | | | | | | | | | | | |
Net Assets | | $ | 75,515,200 | | | $ | 55,359,412 | | | $ | 79,616,554 | | | ($ | 1,552 | ) | | $ | 210,489,614 | |
| | | | | | | | | | | | | | | | | | | | |
Net Assets Consists of: | | | | | | | | | | | | | | | | | | | | |
Paid-in capital | | $ | 64,451,417 | | | $ | 51,606,880 | | | $ | 130,511,782 | | | ($ | 1,552 | ) (a) | | $ | 246,568,527 | |
Net unrealized appreciation of investments and translation of assets and liabilities in foreign currency | | | 14,626,838 | | | | 7,428,736 | | | | 14,075,245 | | | | 0 | | | | 36,130,819 | |
Accumulated net realized loss on investments and foreign currency transactions | | | (5,277,756 | ) | | | (4,311,284 | ) | | | (65,478,160 | ) | | | 0 | | | | (75,067,200 | ) |
Undistributed net investment income | | | 1,714,701 | | | | 635,080 | | | | 507,687 | | | | 0 | | | | 2,857,468 | |
| | | | | | | | | | | | | | | | | | | | |
Total Net Assets | | $ | 75,515,200 | | | $ | 55,359,412 | | | $ | 79,616,554 | | | ($ | 1,552 | ) | | $ | 210,489,614 | |
| | | | | | | | | | | | | | | | | | | | |
Net Asset Value, Offering Price and Redemption Proceeds Per Share | | | | | | | | | | | | | | | | | | | | |
Primary Shares: | | | | | | | | | | | | | | | | | | | | |
Net Assets | | $ | 0 | | | $ | 0 | | | $ | 72,320,344 | | | $ | 130,873,060 | (b) | | $ | 203,193,404 | |
| | | | | | | | | | | | | | | | | | | | |
157
| | | | | | | | | | | | | | | | | | | | |
Shares Outstanding | | | 0 | | | | 0 | | | | 11,297,443 | | | | 20,448,916 | (b) | | | 31,746,359 | |
| | | | | | | | | | | | | | | | | | | | |
Shares Authorized | | | 0 | | | | 0 | | | | unlimited | | | | | | | | unlimited | |
| | | | | | | | | | | | | | | | | | | | |
Net Asset Value, Offering Price and Redemption Proceeds Per Share | | | | | | | | | | $ | 6.40 | | | | | | | $ | 6.40 | |
| | | | | | | | | | | | | | | | | | | | |
Service Shares: | | | | | | | | | | | | | | | | | | | | |
Net Assets | | $ | 0 | | | $ | 0 | | | $ | 7,296,210 | | | $ | 0 | | | $ | 7,296,210 | |
| | | | | | | | | | | | | | | | | | | | |
Shares Outstanding | | | 0 | | | | 0 | | | | 1,139,298 | | | | 0 | | | | 1,139,298 | |
| | | | | | | | | | | | | | | | | | | | |
Shares Authorized | | | 0 | | | | 0 | | | | unlimited | | | | | | | | unlimited | |
| | | | | | | | | | | | | | | | | | | | |
Net Asset Value, Offering Price and Redemption Proceeds Per Share | | | | | | | | | | $ | 6.40 | | | | | | | $ | 6.40 | |
| | | | | | | | | | | | | | | | | | | | |
Initial Class: | | | | | | | | | | | | | | | | | | | | |
Net Assets | | $ | 71,734,244 | | | $ | 54,636,933 | | | $ | 0 | | | ($ | 126,371,177 | ) (b) | | $ | 0 | |
| | | | | | | | | | | | | | | | | | | | |
Shares Outstanding | | | 2,010,321 | | | | 4,001,330 | | | | 0 | | | | (6,011,651 | ) (b) | | | 0 | |
| | | | | | | | | | | | | | | | | | | | |
Shares Authorized | | | unlimited | | | | unlimited | | | | 0 | | | | | | | | 0 | |
| | | | | | | | | | | | | | | | | | | | |
Net Asset Value, Offering Price and Redemption Proceeds Per Share | | $ | 35.68 | | | $ | 13.65 | | | | | | | | | | | | | |
| | | | | | | | | | | | | | | | | | | | |
Service Class: | | | | | | | | | | | | | | | | | | | | |
Net Assets | | $ | 3,780,956 | | | $ | 722,479 | | | $ | 0 | | | ($ | 4,503,435 | ) (b) | | $ | 0 | |
| | | | | | | | | | | | | | | | | | | | |
Shares Outstanding | | | 102,206 | | | | 51,859 | | | | 0 | | | | (154,062 | ) (b) | | | 0 | |
| | | | | | | | | | | | | | | | | | | | |
Shares Authorized | | | unlimited | | | | unlimited | | | | 0 | | | | | | | | 0 | |
| | | | | | | | | | | | | | | | | | | | |
Net Asset Value, Offering Price and Redemption Proceeds Per Share | | $ | 36.99 | | | $ | 13.93 | | | | | | | | | | | | | |
| | | | | | | | | | | | | | | | | | | | |
Investments, at identified cost | | $ | 60,850,200 | | | $ | 47,910,088 | | | $ | 65,192,209 | | | $ | 0 | | | $ | 173,952,497 | |
| | | | | | | | | | | | | | | | | | | | |
| (a) | Adjustment for prepaid expenses which will not transfer as a result of the reorganization. |
| (b) | Adjustment to reflect share balance as a result of the combination. |
158
Blue Chip Portfolio
Value Growth Portfolio
Federated Capital Appreciation Fund II
Pro Forma Combining Statements of Operations
For the year ended December 31, 2010 (unaudited)
| | | | | | | | | | | | | | | | | | | | |
| | | Blue
Chip
Portfolio | | | Value
Growth
Portfolio | | | Federated
Capital
Appreciation
Fund II | | | Pro Forma
Adjustment | | | Federated
Capital
Appreciation
Fund II
Proforma
Combined | |
Investment Income: | | | | | | | | | | | | | | | | | | | | |
Dividends | | $ | 1,962,720 | | | $ | 948,652 | * | | $ | 1,439,966 | | | $ | 0 | | | $ | 4,351,338 | |
Interest | | | 4,097 | | | | 2,775 | | | | 5,754 | | | | 0 | | | | 12,626 | |
| | | | | | | | | | | | | | | | | | | | |
Total Investment Income: | | | 1,966,817 | | | | 951,427 | | | | 1,445,720 | | | | 0 | | | | 4,363,964 | |
Expenses: | | | | | | | | | | | | | | | | | | | | |
Investment adviser fee | | | 143,837 | | | | 234,253 | | | | 664,569 | | | | 672,133 | (a) | | | 1,714,792 | |
Administrative personnel and services fee | | | 0 | | | | 0 | | | | 190,000 | | | | 0 | | | | 190,000 | |
Custodian fees | | | 6,621 | | | | 6,083 | | | | 17,115 | | | | 11,788 | (b) | | | 41,607 | |
Transfer and dividend disbursing agent fees and expenses | | | 0 | | | | 0 | | | | 31,216 | | | | 38 | (c) | | | 31,254 | |
Directors’/Trustees’ fees | | | 11,013 | | | | 7,961 | | | | 936 | | | | (14,383 | ) (d) | | | 5,527 | |
Professional fees | | | 32,152 | | | | 25,599 | | | | 0 | | | | (57,751 | ) (e) | | | 0 | |
Auditing fees | | | 0 | | | | 0 | | | | 24,548 | | | | 0 | | | | 24,548 | |
Legal fees | | | 0 | | | | 0 | | | | 5,756 | | | | 1,603 | (f) | | | 7,359 | |
Portfolio accounting fees | | | 30,000 | | | | 26,028 | | | | 63,500 | | | | (40,913 | ) (g) | | | 78,615 | |
Distribution fees | | | 8,211 | | | | 1,525 | | | | 0 | | | | (9,736 | ) (h) | | | 0 | |
Distribution services fee - Select Shares | | | 0 | | | | 0 | | | | 16,575 | | | | 0 | | | | 16,575 | |
Printing and postage | | | 9,398 | | | | 6,875 | | | | 44,642 | | | | (11,142 | ) (i) | | | 49,773 | |
Insurance premiums | | | 7,113 | | | | 5,258 | | | | 4,345 | | | | (12,136 | ) (j) | | | 4,580 | |
Interest expense | | | 0 | | | | 0 | | | | 1,346 | | | | 0 | | | | 1,346 | |
Miscellaneous | | | 3,777 | | | | 2,769 | | | | 2,916 | | | | (6,262 | ) (k) | | | 3,200 | |
| | | | | | | | | | | | | | | | | | | | |
Total Expenses | | | 252,122 | | | | 316,351 | | | | 1,067,464 | | | | 533,239 | | | | 2,169,176 | |
| | | | | | | | | | | | | | | | | | | | |
Waivers and Reduction– | | | | | | | | | | | | | | | | | | | | |
Waiver of investment adviser fee | | | 0 | | | | 0 | | | | (90,281 | ) | | | 90,281 | (l) | | | 0 | |
Waiver of administrative personnel and services fee | | | 0 | | | | 0 | | | | (34,218 | ) | | | (2,258 | ) (m) | | | (36,476 | ) |
Waiver of distribution services fee - Select Shares | | | 0 | | | | 0 | | | | (700 | ) | | | 0 | | | | (700 | ) |
Fees paid indirectly for directed brokerage arrangements | | | (6 | ) | | | (4 | ) | | | (5,965 | ) | | | 0 | | | | (5,975 | ) |
| | | | | | | | | | | | | | | | | | | | |
Total Waivers and Reimbursements | | | (6 | ) | | | (4 | ) | | | (131,164 | ) | | | 88,023 | | | | (43,151 | ) |
| | | | | | | | | | | | | | | | | | | | |
Net Expenses | | | 252,116 | | | | 316,347 | | | | 936,300 | | | | 621,262 | | | | 2,126,025 | |
| | | | | | | | | | | | | | | | | | | | |
Net investment income | | $ | 1,714,701 | | | $ | 635,080 | | | $ | 509,420 | | | ($ | 621,262 | ) | | $ | 2,237,939 | |
| | | | | | | | | | | | | | | | | | | | |
Realized and Unrealized Gain (Loss) on Investments and Foreign Currency Transactions: | | | | | | | | | | | | | | | | | | | | |
Net realized gain on investments and foreign currency transactions | | | 1,980,601 | | | | 297,511 | | | | 7,317,586 | | | | 0 | | | | 9,595,698 | |
159
| | | | | | | | | | | | | | | | | | | | |
Net change in unrealized appreciation (depreciation) of investments and translation of assets and liabilities in foreign currency | | | 4,034,784 | | | | 6,111,781 | | | | 1,324,437 | | | | 0 | | | | 11,471,002 | |
| | | | | | | | | | | | | | | | | | | | |
Net realized and unrealized loss on investments and foreign currency transactions | | | 6,015,385 | | | | 6,409,292 | | | | 8,642,023 | | | | 0 | | | | 21,066,700 | |
| | | | | | | | | | | | | | | | | | | | |
Change in net assets resulting from operations | | $ | 7,730,086 | | | $ | 7,044,372 | | | $ | 9,151,443 | | | ($ | 621,262 | ) | | $ | 23,304,639 | |
| | | | | | | | | | | | | | | | | | | | |
| * | Includes $956 of foreign tax withheld. |
(See Notes to Pro Forma Financial Statements)
160
Blue Chip Portfolio
Value Growth Portfolio
Federated Capital Appreciation Fund II
Notes to Pro Forma Financial Statements
For the Period Ended December 31, 2010 (unaudited)
Note 1. Description of the Funds
Blue Chip Portfolio and Value Growth Portfolio are portfolios of EquiTrust Variable Insurance Series Fund, which is registered under the Investment Company Act of 1940, as amended (the “Act”), as an open-end diversified management investment company. Federated Capital Appreciation Fund II, a series of Federated Insurance Series, is registered under the Act, as an open-end management investment company. Blue Chip Portfolio and Value Growth Portfolio consist of two classes of shares: Initial Class and Service Class. Federated Capital Appreciation Fund II consists of two classes of shares: Primary Shares and Service Shares.
Note 2. Basis of Combination
The accompanying unaudited Pro Forma Combining Portfolios of Investments, Statements of Assets and Liabilities and Statements of Operations (Pro Forma Financial Statements) reflect the accounts of Blue Chip Portfolio, Value Growth Portfolio and Federated Capital Appreciation Fund II (individually referred to as the “Fund”, or collectively as the “Funds”), for the year ended December 31, 2010. These statements have been derived from the books and records utilized in calculating daily net asset values at December 31, 2010.
The Pro Forma Financial Statements should be read in conjunction with the historical financial statements of Blue Chip Portfolio, Value Growth Portfolio and Federated Capital Appreciation Fund II, which have been incorporated by reference in the Statement of Additional Information. The Funds follow generally accepted accounting principles in the United States of America applicable to management investment companies which are disclosed in the historical financial statements.
The Pro Forma Financial Statements give effect to the proposed exchange of assets of Initial Class Shares and Service Class Shares of Blue Chip Portfolio and Value Growth Portfolio for Primary Shares of Federated Capital Appreciation Fund II. Under generally accepted accounting principles, Federated Capital Appreciation Fund II will be the surviving entity for accounting purposes with its historical cost of investment securities and results of operations being carried forward.
The Pro Forma Financial Statements have been adjusted to reflect the anticipated advisory fee arrangement for the surviving entity, if necessary. Certain other operating costs have also been adjusted to reflect anticipated expenses of the combined entity. Other costs which may change as a result of the reorganization are currently undeterminable.
For the year ended December 31, 2010, Blue Chip Portfolio, Value Growth Portfolio and Federated Capital Appreciation Fund II paid investment advisory fees computed at the annual rate of 0.20%, 0.45% and 0.85%, respectively, as a percentage of average daily net assets.
The investment advisers of Federated Insurance Funds and the EquiTrust Variable Funds or their affiliates will pay the direct expenses and all the indirect expenses of the Reorganization.
Note 3. Portfolio Valuation
In calculating its net asset value (NAV), Federated Capital Appreciation Fund II generally values investments as follows:
| | • | | Equity securities listed on an exchange or traded through a regulated market system are valued at their last reported sale price or official closing price in their principal exchange or market. |
161
| | • | | Fixed-income securities acquired with remaining maturities greater than 60 days are fair valued using price evaluations provided by a pricing service approved by the Board of Trustees (the “Trustees”). |
| | • | | Fixed-income securities acquired with remaining maturities of 60 days or less are valued at their cost (adjusted for the accretion of any discount or amortization of any premium). |
| | • | | Derivative contracts listed on exchanges are valued at their reported settlement or closing price. |
| | • | | Over-the-counter (OTC) derivative contracts are fair valued using price evaluations provided by a pricing service approved by the Trustees. |
| | • | | Shares of other mutual funds are valued based upon their reported NAVs. |
If Federated Capital Appreciation Fund II cannot obtain a price or price evaluation from a pricing service for an investment, the Fund may attempt to value the investment based upon the mean of bid and asked quotations or fair value the investment based on price evaluations, from one or more dealers. If any price, quotation, price evaluation or other pricing source is not readily available when the NAV is calculated, the Fund uses the fair value of the investment determined in accordance with the procedures described below. There can be no assurance that the Fund could purchase or sell an investment at the price used to calculate the Fund’s NAV.
Fair Valuation and Significant Events Procedures
The Trustees of Federated Capital Appreciation Fund II have authorized the use of pricing services to provide evaluations of the current fair value of certain investments for purposes of calculating the NAV. Factors considered by pricing services in evaluating an investment include the yields or prices of investments of comparable quality, coupon, maturity, call rights and other potential prepayments, terms and type, reported transactions, indications as to values from dealers, and general market conditions. Some pricing services provide a single price evaluation reflecting the bid-side of the market for an investment (a “bid” evaluation). Other pricing services offer both bid evaluations and price evaluations indicative of a price between the prices bid and asked for the investment (a “mid” evaluation). The Funds normally use bid evaluations for U.S. Treasury and Agency securities, mortgage-backed securities and municipal securities. The Funds normally use mid evaluations for other types of fixed-income securities and OTC derivative contracts. In the event that market quotations and price evaluations are not available for an investment, the fair value of the investment is determined in accordance with procedures adopted by the Trustees.
The Trustees also have adopted procedures requiring an investment to be priced at its fair value whenever the Adviser determines that a significant event affecting the value of the investment has occurred between the time as of which the price of the investment would otherwise be determined and the time as of which the NAV is computed. An event is considered significant if there is both an affirmative expectation that the investment’s value will change in response to the event and a reasonable basis for quantifying the resulting change in value. Examples of significant events that may occur after the close of the principal market on which a security is traded, or after the time of a price evaluation provided by a pricing service or a dealer, include:
| | • | | With respect to securities traded in foreign markets, significant trends in U.S. equity markets or in the trading of foreign securities index futures or options contracts; |
| | • | | With respect to price evaluations of fixed-income securities determined before the close of regular trading on the NYSE, actions by the Federal Reserve Open Market Committee and other significant trends in U.S. fixed-income markets; |
| | • | | Political or other developments affecting the economy or markets in which an issuer conducts its operations or its securities are traded; and |
| | • | | Announcements concerning matters such as acquisitions, recapitalizations, litigation developments, a natural disaster affecting the issuer’s operations or regulatory changes or market developments affecting the issuer’s industry. |
162
The Trustees have approved the use of a pricing service to determine the fair value of equity securities traded principally in foreign markets when the Adviser determines that there has been a significant trend in the U.S. equity markets or in index futures trading. For other significant events, the Funds may seek to obtain more current quotations or price evaluations from alternative pricing sources. If a reliable alternative pricing source is not available, the Fund will determine the fair value of the investment using another method approved by the Trustees.
With respect to Blue Chip Portfolio and Value Growth Portfolio, each Fund values its investment securities that are traded on any national exchange at the last sale price on the day of valuation or, lacking any sales, at the mean between the closing bid and asked process. Investments traded in the over-the-counter market are valued at the mean between the closing bid and asked prices or yield equivalent. In situations where market quotations are not readily available or quoted market prices are not reliable, investments are valued at fair value in accordance with the procedures adopted by the Fund’s Board of Trustees. Money market investments are valued at market value, except that obligations maturing in 60 days or less are valued using the amortized cost method, which approximates market value. Under the amortized cost method, a security is valued at its cost on the date of purchase and thereafter is adjusted to reflect a constant amortization to maturity of the difference between the principal amount due at maturity and the cost of investment to the Fund.
Note 4. Shares of Beneficial Interest
The Pro Forma Primary Shares net asset value per share assumes the issuance of 20,448,916 Primary Shares of Federated Capital Appreciation Fund II in exchange for 2,010,321 Initial Class Shares and 102,206 Service Class Shares of Blue Chip Portfolio and 4,001,330 Initial Class Shares and 51,859 Service Class Shares of Value Growth Portfolio, respectively, which would have been outstanding at December 31, 2010 in connection with the proposed reorganization, assuming the three Funds had been combined as of such date.
Note 5. Federal Income Taxes
Each Fund has elected to be taxed as a “regulated investment company” under the Internal Revenue Code. After the acquisition, Federated Capital Appreciation Fund II intends to continue to qualify as a regulated investment company, if such qualification is in the best interests of its shareholders, by complying with the Subchapter M provision of the Internal Revenue Code and to distribute to shareholders each year substantially all of its income. Accordingly, no provision for federal income tax is necessary. Federated Capital Appreciation Fund II complies with the provisions of Financial Accounting Standards Board (FASB) Interpretation No. 48 (FIN 48) “Accounting for Uncertainty in Income Taxes”. As of and during the year ended December 31, 2010, the Fund did not have a liability for any uncertain tax positions. The Fund recognizes interest and penalties, if any, related to tax liabilities as income tax expense in the Statement of Operations. As of December 31, 2010, tax years 2007 through 2010 remain subject to examination by the Fund’s major tax jurisdictions, which include the United States of America and the Commonwealth of Massachusetts.
Each Fund may be subject to taxes imposed by governments of countries in which it invests. Such taxes are generally based on either income or gains earned or repatriated. Each Fund accrues and applies such taxes to net investment income, net realized gains and net unrealized gains as income and/or gains are earned.
The identified cost of investments for the funds is substantially the same for both financial accounting and federal income tax purposes. The tax cost of investments will remain unchanged for the combined fund.
Note 6. Other
The preparation of financial statements in conformity with GAAP requires management to make estimates and assumptions that affect the amounts of assets, liabilities, expenses and revenue reported in the financial statements. Actual results could differ from those estimated.
163
Note 7. Pro Forma Adjustments
| | (a) | EquiTrust Investment Management Services, Inc. is the investment adviser for Blue Chip Portfolio and Value Growth Portfolio. Federated Equity Management Company of Pennsylvania is the investment adviser for Federated Capital Appreciation Fund II. The advisory agreement between Blue Chip Portfolio and Value Growth Portfolio and the Adviser provides for an annual fee equal to 0.20% and 0.45%, respectively, of the Fund’s average daily net assets. The advisory agreement between Federated Capital Appreciation Fund II and the Adviser provides for an annual fee equal to 0.85% of the Fund’s average daily net assets. An adjustment to the combined investment adviser fee reflects the fee structure of Federated Capital Appreciation Fund II based on the combined assets of Federated Capital Appreciation Fund II Pro Forma Combined. |
| | (b) | Adjustment to reflect custodian fees based upon the current expense structure for Federated Capital Appreciation Fund II Pro Forma Combined. |
| | (c) | Adjustment to reflect transfer and dividend disbursing agent fees and expenses based upon the current expense structure for Federated Capital Appreciation Fund II Pro Forma Combined. |
| | (d) | Adjustment to reflect Directors/Trustees fees based upon the current expense structure for Federated Capital Appreciation Fund II Pro Forma Combined. |
| | (e) | Adjustment to reflect removal of professional fees since the combined expenses in this category for Blue Chip Portfolio and Value Growth Portfolio are disclosed separately for Federated Capital Appreciation Fund II Pro Forma Combined. |
| | (f) | Adjustment to reflect legal fees based upon the current expense structure for Federated Capital Appreciation Fund II Pro Forma Combined. |
| | (g) | Adjustment to reflect portfolio accounting fees based upon the current expense structure for Federated Capital Appreciation Fund II Pro Forma Combined. |
| | (h) | Adjustment to reflect removal of distribution fees for Blue Chip Portfolio and Value Growth Portfolio from Federated Capital Appreciation Fund II Pro Forma Combined since Primary Shares of Federated Capital Appreciation Fund II do not currently incur a distribution fee. |
| | (i) | Adjustment to reflect printing and postage costs based upon the current expense structure for Federated Capital Appreciation Fund II Pro Forma Combined. |
| | (j) | Adjustment to reflect insurance premiums based upon the current expense structure for Federated Capital Appreciation Fund II Pro Forma Combined. |
| | (k) | Adjustment to reflect miscellaneous expenses based upon the current expense structure for Federated Capital Appreciation Fund II Pro Forma Combined. |
| | (l) | Adjustment to reflect removal of the voluntary waiver of investment advisory fees on the average daily net assets of Federated Capital Appreciation Fund II Pro Forma Combined. The adviser of Federated Capital Appreciation Fund II and its affiliates have voluntarily agreed to waive their fees and/or reimburse expenses so that the total annual fund operating expenses (as shown in the financial highlights) paid by the Fund’s Primary Shares (after the voluntary waivers and/or reimbursements) will not exceed 1.18% through the later of (the “Termination Date”); (a) April 30, 2011; or (b) the date of the Fund’s next effective Prospectus. While the adviser and its affiliates currently do not anticipate terminating or increasing these arrangements prior to the Termination Date, these arrangements may only be terminated or increased prior to the Termination Date with the agreement of the Fund’s Trustees. Based on the combined net assets of Federated Capital Appreciation Fund II Pro Forma Combined for the period ended December 31, 2010, no voluntary waiver of investment advisory fee would be required to satisfy this arrangement. |
| | (m) | Adjustment to reflect the voluntary waiver of administrative personnel and services fee on the average daily net assets of Federated Capital Appreciation Fund II Pro Forma Combined. |
164
PART C. OTHER INFORMATION.
Item 15 Indemnification
(1) Indemnification is provided to Officers and Trustees of the Registrant pursuant to Section 2 of Article XI of Registrant’s Declaration of Trust. The Investment Advisory Contract provides that, in the absence of willful misfeasance, bad faith, gross negligence, or reckless disregard of the obligations or duties under the Investment Advisory Contract on the part of Adviser, Adviser shall not be liable to the Registrant or to any shareholder for any act or omission in the course of or connected in any way with rendering services or for any losses that may be sustained in the purchase, holding, or sale of any security. Registrant’s Trustees and Officers are covered by an Investment Trust Errors and Omissions Policy.
(2) Insofar as indemnification for liabilities arising under the Securities Act of 1933 may be permitted to Trustees, Officers, and controlling persons of the Registrant by the Registrant pursuant to the Declaration of Trust or otherwise, the Registrant is aware that in the opinion of the Securities and Exchange Commission, such indemnification is against public policy as expressed in the Act and, therefore, is unenforceable. In the event that a claim for indemnification against such liabilities (other than the payment by the Registrant of expenses incurred or paid by Trustees, Officers, or controlling persons of the Registrant in connection with the successful defense of any act, suit, or proceeding) is asserted by such Trustees, Officers, or controlling persons in connection with the shares being registered, the Registrant will, unless in the opinion of its counsel the matter has been settled by controlling precedent, submit to a court of appropriate jurisdiction the question whether such indemnification by it is against public policy as expressed in the Act and will be governed by the final adjudication of such issues.
(3) Insofar as indemnification for liabilities may be permitted pursuant to Section 17 of the Investment Company Act of 1940 for Trustees, Officers, and controlling persons of the Registrant by the Registrant pursuant to the Declaration of Trust or otherwise, the Registrant is aware of the position of the Securities and Exchange Commission as set forth in Investment Company Act Release No. IC-11330. Therefore, the Registrant undertakes that in addition to complying with the applicable provisions of the Declaration of Trust or otherwise, in the absence of a final decision on the merits by a court or other body before which the proceeding was brought, that an indemnification payment will not be made unless in the absence of such a decision, a reasonable determination based upon factual review has been made (i) by a majority vote of a quorum of non-party Trustees who are not interested persons of the Registrant or (ii) by independent legal counsel in a written opinion that the indemnitee was not liable for an act of willful misfeasance, bad faith, gross negligence, or reckless disregard of duties. The Registrant further undertakes that advancement of expenses incurred in the defense of a proceeding (upon undertaking for repayment unless it is ultimately determined that indemnification is appropriate) against an Officer, Trustee, or controlling person of the Registrant will not be made absent the fulfillment of at least one of the following conditions: (i) the indemnitee provides security for his undertaking; (ii) the Registrant is insured against losses arising by reason of any lawful advances; or (iii) a majority of a quorum of disinterested non-party Trustees or independent legal counsel in a written opinion makes a factual determination that there is reason to believe the indemnitee will be entitled to indemnification.
Item 16 Exhibits
| 1.1 | Conformed copy of Amended and Restated Declaration of Trust of the Registrant; (33) |
| 1.2 | Conformed copy of Amendment No. 23 of the Declaration of Trust; (36) |
| 1.3 | Form of Amendment No. 24 of the Declaration of Trust; (37) |
| 1.4 | Conformed copy of Amendment No. 25 of the Declaration of Trust; (39) |
| 2.1 | Copy of By-Laws of the Registrant; (19) |
| 2.2 | Amendments Nos. 1, 2 and 3; (19) |
C-1
| 2.3 | Amendments Nos. 4 and 5; (30) |
| 2.4 | Amendments Nos. 6, 7 and 8; (33) |
| 4. | Forms of Agreement and Plans of Reorganization are filed herewith as Annexes A-1 and A-2 to the Proxy Statement/Prospectus; |
| 6.1 | Form of Investment Advisory Contract between the Registrant and Federated Advisers with conformed copies of Exhibits A, B, C, D and E; (3) |
| 6.2 | Conformed copy of Exhibit F to the Investment Advisory Contract; (6) |
| 6.3 | Conformed copy of Exhibit G to the Investment Advisory Contract; (10) |
| 6.4 | Conformed copy of Exhibit H to the Investment Advisory Contract; (12) |
| 6.5 | Conformed copy of Exhibit I to the Investment Advisory Contract; (20) |
| 6.6 | Conformed copy of Exhibits J and K to the Investment Advisory Contract; (22) |
| 6.7 | Conformed copy of Exhibit L to the Investment Advisory Contract; (24) |
| 6.8 | Conformed copy of Amendment to the Investment Advisory Contract; (25) |
| 6.9 | Conformed copy of new Sub-Advisory Agreement with respect to Federated Capital Income Fund II; (30) |
| 6.10 | Conformed copy of new Advisory Contract between Federated Equity Management Company of Pennsylvania and Registrant; (33) |
| 7.1 | Conformed copy of Distributor’s Contract with the Registrant with conformed copies of Exhibits A, B, C and D attached; (3) |
| 7.2 | Conformed copy of Exhibits E, F, L and M to Distributor’s Contract; (23) |
| 7.3 | Conformed copy of Exhibit G to Distributor’s Contract; (10) |
| 7.4 | Conformed copy of Exhibit H to Distributor’s Contract; (12) |
| 7.5 | Conformed copy of Exhibit I to Distributor’s Contract; (20) |
| 7.6 | Conformed copy of Exhibit J and K to Distributor’s Contract; (22) |
| 7.7 | Conformed copy of Exhibit N to Distributor’s Contract; (24) |
| 7.8 | Conformed copy of Amendment to the Distributor’s Contract; (25) |
| 7.9 | Conformed copy of Exhibit O to Distributor’s Contract; (27) |
| 7.10 | The Registrant hereby incorporates the conformed copy of the specimen Mutual Funds Sales and Service Agreement; Mutual Funds Service Agreement; and Plan Trustee/Mutual Funds Service Agreement from |
C-2
| | Item 24(b)(6) of the Cash Trust Series II Registration Statement on Form N-1A, filed with the Securities and Exchange Commission (the “SEC”) on July 24, 1995. (File Nos. 33-38550 and 811-6269). |
| 7.11 | Conformed copy of Exhibit P to Distributor’s Contract; (30) |
| 7.12 | Conformed copy of Exhibit Q to Distributor’s Contract; (33) |
| 9.1 | Conformed copy of Custodian Contract; (7) |
| 9.2 | Conformed copy of Domestic Custody Fee Schedule; (17) |
| 9.3 | Conformed copy of Amendment to the Custodian Contract of the Registrant; (35) |
| 10.1 | Conformed copy of Distribution Plan of the Registrant; (31) |
| 10.2 | Conformed copy of Exhibit D to the Distribution Plan; (33) |
| 11. | Opinion and Consent of Counsel as to legality of Shares being issued; (+) |
| 12. | Forms of opinions regarding tax consequences of Reorganization of Money Market Portfolio, High Grade Bond Portfolio, Strategic Yield Portfolio, Managed Portfolio, Value Growth Portfolio and Blue Chip Portfolio; (+) |
| 13.1 | Conformed copy of Amended and Restated Agreement for Fund Accounting Services, Administrative Services, Transfer Agency Services, and Custody Services Procurement; (19) |
| 13.2 | The Registrant hereby incorporates the conformed copy of Amendment No. 2 to the Amended & Restated Agreement for Fund Accounting Services, Administrative Services, Transfer Agency Services and Custody Services Procurement from Item 23 (h)(v) of the Federated U.S. Government Securities: 2-5 Years Registration Statement on Form N-1A, filed with the SEC on March 30, 2004 (File Nos. 2-75769 and 811-3387); |
| 13.3 | The Registrant hereby incorporates the conformed copy of Amendment No. 3 to the Amended & Restated Agreement for Fund Accounting Services, Administrative Services, Transfer Agency Services and Custody Services Procurement from Item 23 (h)(v) of the Federated U.S. Government Securities: 2-5 Years Registration Statement on Form N-1A, filed with the SEC on March 30, 2004 (File Nos. 2-75769 and 811-3387); |
| 13.4 | Conformed copy of Amended and Restated Shareholder Services Agreement; (17) |
| 13.5 | The Registrant hereby incorporates by reference the conformed copy of the Agreement for Administrative Services, with Exhibit 1 and Amendments 1 and 2 attached, between Federated Administrative Services and the Registrant from Item 23(h)(iv)of the Federated Total Return Series, Inc. Registration Statement on Form N-1A, filed with the SEC on November 29, 2004 (File Nos. 33-50773 and 811-7115); |
| 13.6 | The Registrant hereby incorporates the conformed copy of the Second Amended and Restated Services Agreement, with attached Schedule 1 revised 6/30/04, from Item 23(h)(vii) of the Cash Trust Series, Inc. Registration Statement filed with the SEC on July 29, 2004 (File Nos. 33-29838 and 811-5843); |
| 13.7 | The Registrant hereby incorporates the conformed copy of the Financial Administration and Accounting Services Agreement, with attached Exhibit A revised 6/30/04, from Item 23(h)(viii) of the Cash Trust Series, Inc. Registration Statement filed with the SEC on July 29, 2004 (File Nos. 33-29838 and 811-5843); |
C-3
| 13.8 | The Registrant hereby incorporates the conformed copy of Transfer Agency and Service Agreement between the Federated Funds and State Street Bank and Trust Company from Item 23 (h)(ix) of the Federated Total Return Government Bond Fund Registration Statement on Form N-1A, filed with the SEC on April 28, 2005 (File Nos. 33-60411 and 811-07309); |
| 13.9 | The Registrant hereby incorporates by reference the conformed copy of Amendment No. 3 to the Agreement for Administrative Services between Federated Administrative Services Company and the Registrant dated June 1, 2005, form Item 23(h)(ii) of the Cash Trust Series, Inc. Registration Statement on Form N-1A, filed with the SEC on July 27, 2005 (File Nos. 33-29838 and 811-5843); |
| 13.10 | The Registrant hereby incorporates the Conformed copy of the Financial Administration and Accounting Services Agreement, with attached Exhibit A revised 3/1/06, from Item (h)(viii) of the Federated Total Return Government Bond Fund Registration Statement on Form N-1A, filed with the SEC on April 26, 2006 (File Nos. 33-60411 and 811-07309); |
| 13.11 | The Registrant hereby incorporates the Conformed copy of the Transfer Agency and Service Agreement between the Federated Funds listed on Schedule A revised 3/1/06, from Item (h)(ix) of the Federated Total Return Government Bond Fund Registration Statement on Form N-1A, filed with the SEC on April 26, 2006 (File Nos. 33-60411 and 811-07309). |
| 14. | Consent of Independent Registered Public Accounting Firms; (+) |
| 16.1 | Unanimous Consent of Trustees for Power of Attorney; (+) |
| 16.2 | Power of Attorney of the Registrant; (+) |
| 17 | Form of Proxy Card; (+) |
| + | Exhibit is being filed electronically with registration statement; indicate by footnote. |
ALL RESPONSES ARE INCORPORATED BY REFERENCE TO A POST-EFFECTIVE AMENDMENT (PEA) OF THE REGISTRANT FILED ON FORM N-1A (FILE NOS. 333-69268 and 811-8042)
| 1 | Pre-effective Amendment No. 1 filed December 10, 1993 |
| 2 | PEA No. 1 filed April 29 1994 |
| 3 | PEA No. 2 filed August 23, 1994 |
| 4 | PEA No. 3 filed January 19, 1995 |
| 6 | PEA No. 5 filed on April 3, 1995 |
| 7 | PEA No. 6 filed on April 21, 1994 |
| 10 | PEA No. 9 filed on February 16, 1996 |
| 11 | PEA No. 10 filed on March 28, 1996 |
| 12 | PEA No. 12 filed on February 10, 1997 |
| 13 | PEA No. 15 filed on July 31, 1997 |
| 14 | PEA No. 17 filed on March 9, 1998 |
| 17 | PEA No. 18 filed on April 22, 1998 |
| 19 | PEA No. 20 filed on February 19, 1999 |
| 20 | PEA No. 22 filed on April 20, 1999 |
| 22 | PEA No. 25 filed on February 17, 2000 |
| 23 | PEA No. 28 filed on April 19, 2000 |
| 24 | PEA No. 30 filed on April 23, 2001 |
| 25 | PEA No. 30 filed on April 23, 2001 |
| 26 | PEA No. 31 filed on February 28, 2002 |
| 27 | PEA No. 36 filed on April 29, 2002 |
C-4
| 28 | PEA No. 37 filed on February 18, 2003 |
| 29 | PEA No. 39 filed on April 29, 2003 |
| 30 | PEA No. 40 filed on February 20, 2004 |
| 31 | PEA No. 41 filed on April 29, 2004 |
| 32 | PEA No. 43 filed on April 27, 2005 |
| 33 | PEA No. 45 filed on April 28, 2006 |
| 34 | PEA No. 46 filed on April 27, 2007 |
| 35 | PEA No. 49 filed on April 28, 2008 |
| 36 | PEA No. 50 filed on February 13, 2009 |
| 37 | PEA No. 52 filed on April 30, 2009 |
| 38 | PEA No. 53 filed on February 5, 2010 |
| 39 | PEA No. 55 filed on April 26, 2010 |
Item 17 Undertakings
(1) The undersigned Registrant agrees that prior to any public reoffering of the securities registered through the use of a prospectus which is a part of this Registration Statement by any person or party who is deemed to be an underwriter within the meaning of Rule 145(c) of the Securities Act of 1933, the reoffering prospectus will contain the information called for by the applicable registration form for reofferings by persons who may be deemed underwriters, in addition to the information called for by the other items of the applicable form.
(2) The undersigned Registrant agrees that every prospectus that is filed under paragraph (1) above will be filed as a part of an amendment to the Registration Statement and will not be used until the amendment is effective, and that, in determining any liability under the Securities Act of 1933, each post-effective amendment shall be deemed to be a new Registration Statement for the securities offered therein, and the offering of the securities at that time shall be deemed to be the initial bona fide offering of them.
(3) The undersigned Registrant agrees to file by Post-Effective Amendment the opinion of counsel regarding the tax consequences of the proposed reorganization required by Item 16(12) of Form N-14 within a reasonable time after receipt of such opinion.
C-5
SIGNATURES
Pursuant to the requirements of the Securities Act of 1933, as amended, the Registrant, FEDERATED INSURANCE SERIES, has duly caused its Registration Statement on Form N-14 to be signed on its behalf by the undersigned, thereto duly authorized, in the City of Pittsburgh and Commonwealth of Pennsylvania, on the 15th day of April, 2011.
| | |
| FEDERATED INSURANCE SERIES |
| |
| By: | | /s/ Todd P. Zerega |
| Todd P. Zerega, Assistant Secretary |
Pursuant to the requirements of the Securities Act of 1933, this Registration Statement has been signed below by the following persons on April 15, 2011 in the capacities indicated:
| | | | | | |
| NAME | | | | TITLE |
| | | |
| By: | | /s/ Todd P. Zerega | | | | Attorney In Fact For the Persons Listed Below |
| Todd P. Zerega | | | | |
| ASSISTANT SECRETARY | | | | |
| | |
| NAME | | | | TITLE |
| | |
| John F. Donahue * | | | | Trustee |
| | |
| John B. Fisher | | | | President |
| | |
| J. Christopher Donahue * | | | | President and Trustee (Principal Executive Officer) |
| | |
| Richard A. Novak* | | | | Treasurer (Principal Financial Officer) |
| | |
| John T. Conroy, Jr.* | | | | Trustee |
| | |
| Nicholas P. Constantakis* | | | | Trustee |
| | |
| John F. Cunningham* | | | | Trustee |
| | |
| Maureen Lally-Green | | | | Trustee |
| | |
| Peter E. Madden* | | | | Trustee |
| | |
| Charles F. Mansfield, Jr.* | | | | Trustee |
| | |
| R. James Nicholson | | | | Trustee |
| | |
| Thomas O’Neill* | | | | Trustee |
| | |
| John S. Walsh* | | | | Trustee |
| | |
| James F. Will* | | | | Trustee |
* By Power of Attorney