Table of Contents
|
| |
| Summary - Earnings Press Release | |
| | |
| Investor Information | |
| | |
| Portfolio Overview | |
| | |
| Financial Information | |
| Balance Sheets | |
| Statements of Operations | |
| Outstanding Securities | |
| Reconciliations to Non-GAAP Financial Measures | |
| Reconciliation of Net Income to Funds from Operations | |
| Reconciliation of Recurring EBITDA to Net Income | |
| Reconciliation of Net Operating Income to Net Income | |
| Non-GAAP and Other Financial Measures | |
| Financial Highlights | |
| Debt Analysis | |
| | |
| Selected Financial Information | |
| Statement of Operations – Same Community and Percentage Growth | |
| Rental Program Summary | |
| Home Sales Summary | |
| Acquisitions Summary | |
| | |
| Other Information | |
| Property Summary | |
| Capital Improvements, Development, and Acquisitions | |
| Operating Statistics for Manufactured Homes and Annual/Seasonal RV’s | |
| Footnotes and Definitions | |
| | |
NEWS RELEASE
November 1, 2016
Sun Communities, Inc. Reports 2016 Third Quarter Results
Southfield, Michigan, November 1, 2016 - Sun Communities, Inc. (NYSE: SUI) (the "Company"), a real estate investment trust ("REIT") that owns and operates manufactured housing ("MH") and recreational vehicle ("RV") communities, today reported its third quarter results.
Financial Results for the Quarter and Nine Months Ended September 30, 2016
For the quarter ended September 30, 2016, total revenues increased $64.3 million, or 34.7 percent, to $249.7 million compared to $185.4 million for the same period in 2015. Net income available for Common Stockholders was $18.9 million, or $0.27 per diluted common share, as compared to $28.8 million, or $0.53 per diluted common share, for the same period in 2015.
For the nine months ended September 30, 2016, total revenues increased $108.6 million, or 21.4 percent, to $615.1 million compared to $506.5 million for the same period in 2015. Net income available for Common Stockholders for the nine months ended September 30, 2016 was $19.0 million, or $0.30 per diluted common share, as compared to $47.9 million, or $0.90 per diluted common share, for the same period in 2015.
“Our strong third quarter results demonstrate the consistent growth profile of our portfolio. With home sales solidly ahead of last year in both the third quarter and year to date, the ongoing demand for manufactured housing in our high quality communities is clearly evident,” said Gary A. Shiffman, Chairman and CEO. “I am pleased with the integration of the Carefree assets, which are performing ahead of expectations, as we employ our experience and expertise as a consolidator in this space. With both site expansion opportunities, and selective acquisitions such as the four communities purchased during and subsequent to the quarter, we continue to be well-positioned to drive ongoing growth across our platform.”
Non-GAAP Financial Measures and Portfolio Performance
| |
| • | For the quarter ended September 30, 2016, Funds from Operations (“FFO”)(1) excluding certain items was $1.13 per diluted share and OP unit ("Share") for the three months ended September 30, 2016, as compared to $1.05 in the prior year, an increase of 7.6 percent. |
| |
| • | Home sales increased by 43.0 percent as compared to the third quarter of 2015. |
| |
| • | Revenue producing sites increased by 292 sites for the quarter bringing total portfolio occupancy to 96.2 percent, up 250 basis points from the third quarter of 2015. |
| |
| • | For the quarter, same community Net Operating Income ("NOI")(1) increased by 6.0 percent as compared to the three months ended September 30, 2015. |
OPERATING HIGHLIGHTS
Community Occupancy
Total portfolio occupancy increased to 96.2 percent at September 30, 2016 from 93.7 percent at September 30, 2015. During the third quarter of 2016, revenue producing sites increased by 292 sites, as compared to 358 revenue producing sites gained in the third quarter of 2015.
Revenue producing sites gained during the nine months ended September 30, 2016 were 1,385 as compared to 1,357 revenue producing sites gained during the nine months ended September 30, 2015.
Same Community Results
For the 219 communities owned throughout 2016 and 2015, third quarter 2016 total revenues increased 5.9 percent and total expenses increased 5.6 percent, resulting in an increase in NOI(1) of 6.0 percent over the third quarter of 2015. Same community occupancy increased to 96.4 percent at September 30, 2016 from 94.2 percent at September 30, 2015.
For the nine months ended September 30, 2016, total revenues increased 6.0 percent and total expenses increased 5.1 percent, resulting in an increase in NOI(1) of 6.4 percent over the nine months ended September 30, 2015.
Home Sales
Total home sales were 895 for the third quarter as compared to 626 homes sold during the third quarter of 2015, a 43.0 percent increase.
During the nine months ended September 30, 2016, the Company sold 2,410 homes as compared to the 1,745 homes sold during the same period ending 2015, resulting in an additional 665 homes sold during 2016, or a 38.1 percent increase.
Rental homes sales, which are included in total home sales, were 286 and 223 for the three months ended and 858 and 611 for the nine months ended September 30, 2016 and 2015, respectively.
BALANCE SHEET AND CAPITAL MARKETS ACTIVITY
Debt Transactions
For the quarter ended September 30, 2016, the Company closed on $139.0 million of debt with a weighted average interest rate of 3.84 percent and maturities ranging between seven and ten years. Subsequent to quarter end, the Company completed a $58.5 million secured borrowing that bears interest at a fixed rate of 3.33 percent and has a seven-year term. During the quarter, the Company also repaid three mortgage loans totaling $62.1 million.
As of September 30, 2016, the Company had approximately $3.1 billion of debt outstanding. The weighted average interest rate was 4.56 percent and the weighted average maturity was 8.6 years. The Company had $69.8 million of unrestricted cash on hand. At period-end the Company’s net debt to trailing twelve month EBITDA(1)(7) ratio was 7.7 times.
Equity Transactions
In September 2016, the Company completed an underwritten registered public equity offering of 3,737,500 shares at a net price of $75.89 per share for proceeds of $283.6 million. The Company used the proceeds of the offering to repay borrowings outstanding under the Company's revolving line of credit.
During the quarter the Company sold 620,828 shares of common stock through its At the Market equity sales program at a weighted average price of $76.81 per share. Net proceeds from the sales were $47.1 million.
PORTFOLIO ACTIVITY
Acquisitions (2)
During the quarter and also subsequent to September 30, 2016, the Company acquired four communities for total consideration of $41.0 million. The communities, located in Colorado, Michigan, New York, and Virginia, contain 964 RV sites and have expansion potential of approximately 400 sites.
These resorts are located in high demand destination locations and will undergo repositioning or expansion activities to fully realize the inherent value in the zoned and entitled land that was previously under-managed or under-utilized.
GUIDANCE 2016
The Company expects FFO(1) per Share excluding certain items for fourth quarter 2016 to be in the range of $0.89 to $0.91 per Share. This revised range includes a $0.03 to $0.04 per Share impact from the third quarter equity offerings, partially offset by a higher expected contribution from the Carefree portfolio. Guidance also includes expenses related to Hurricane Matthew as an adjustment to FFO(1) excluding certain items.
The Company anticipates full year same community NOI(1) growth of 6.7 percent to 6.9 percent. This revised outlook reflects transient RV revenues which were impacted by weather in a few communities in the third quarter, along with higher real estate tax assessments on a year to date basis.
Estimates of FFO(1) per Share excluding certain items assume certain non-core items are adjusted from
FFO(1). The estimates and assumptions presented above represent a range of possible outcomes and may differ materially from actual results. The estimates and assumptions are forward looking based on the Company's current assessment of economic and market conditions, as well as other risks outlined below under the caption "Forward-Looking Statements."
EARNINGS CONFERENCE CALL
A conference call to discuss third quarter operating results will be held on Tuesday, November 1, 2016 at 11:00 A.M. (ET). To participate, call toll-free 877-407-4018. Callers outside the U.S. or Canada can access the call at 201-689-8471. A replay will be available following the call through November 15, 2016 and can be accessed toll-free by calling 877-870-5176 or by calling 858-384-5517. The Conference ID number for the call and the replay is 13646698. The conference call will be available live on Sun Communities' website www.suncommunities.com. Replay will also be available on the website.
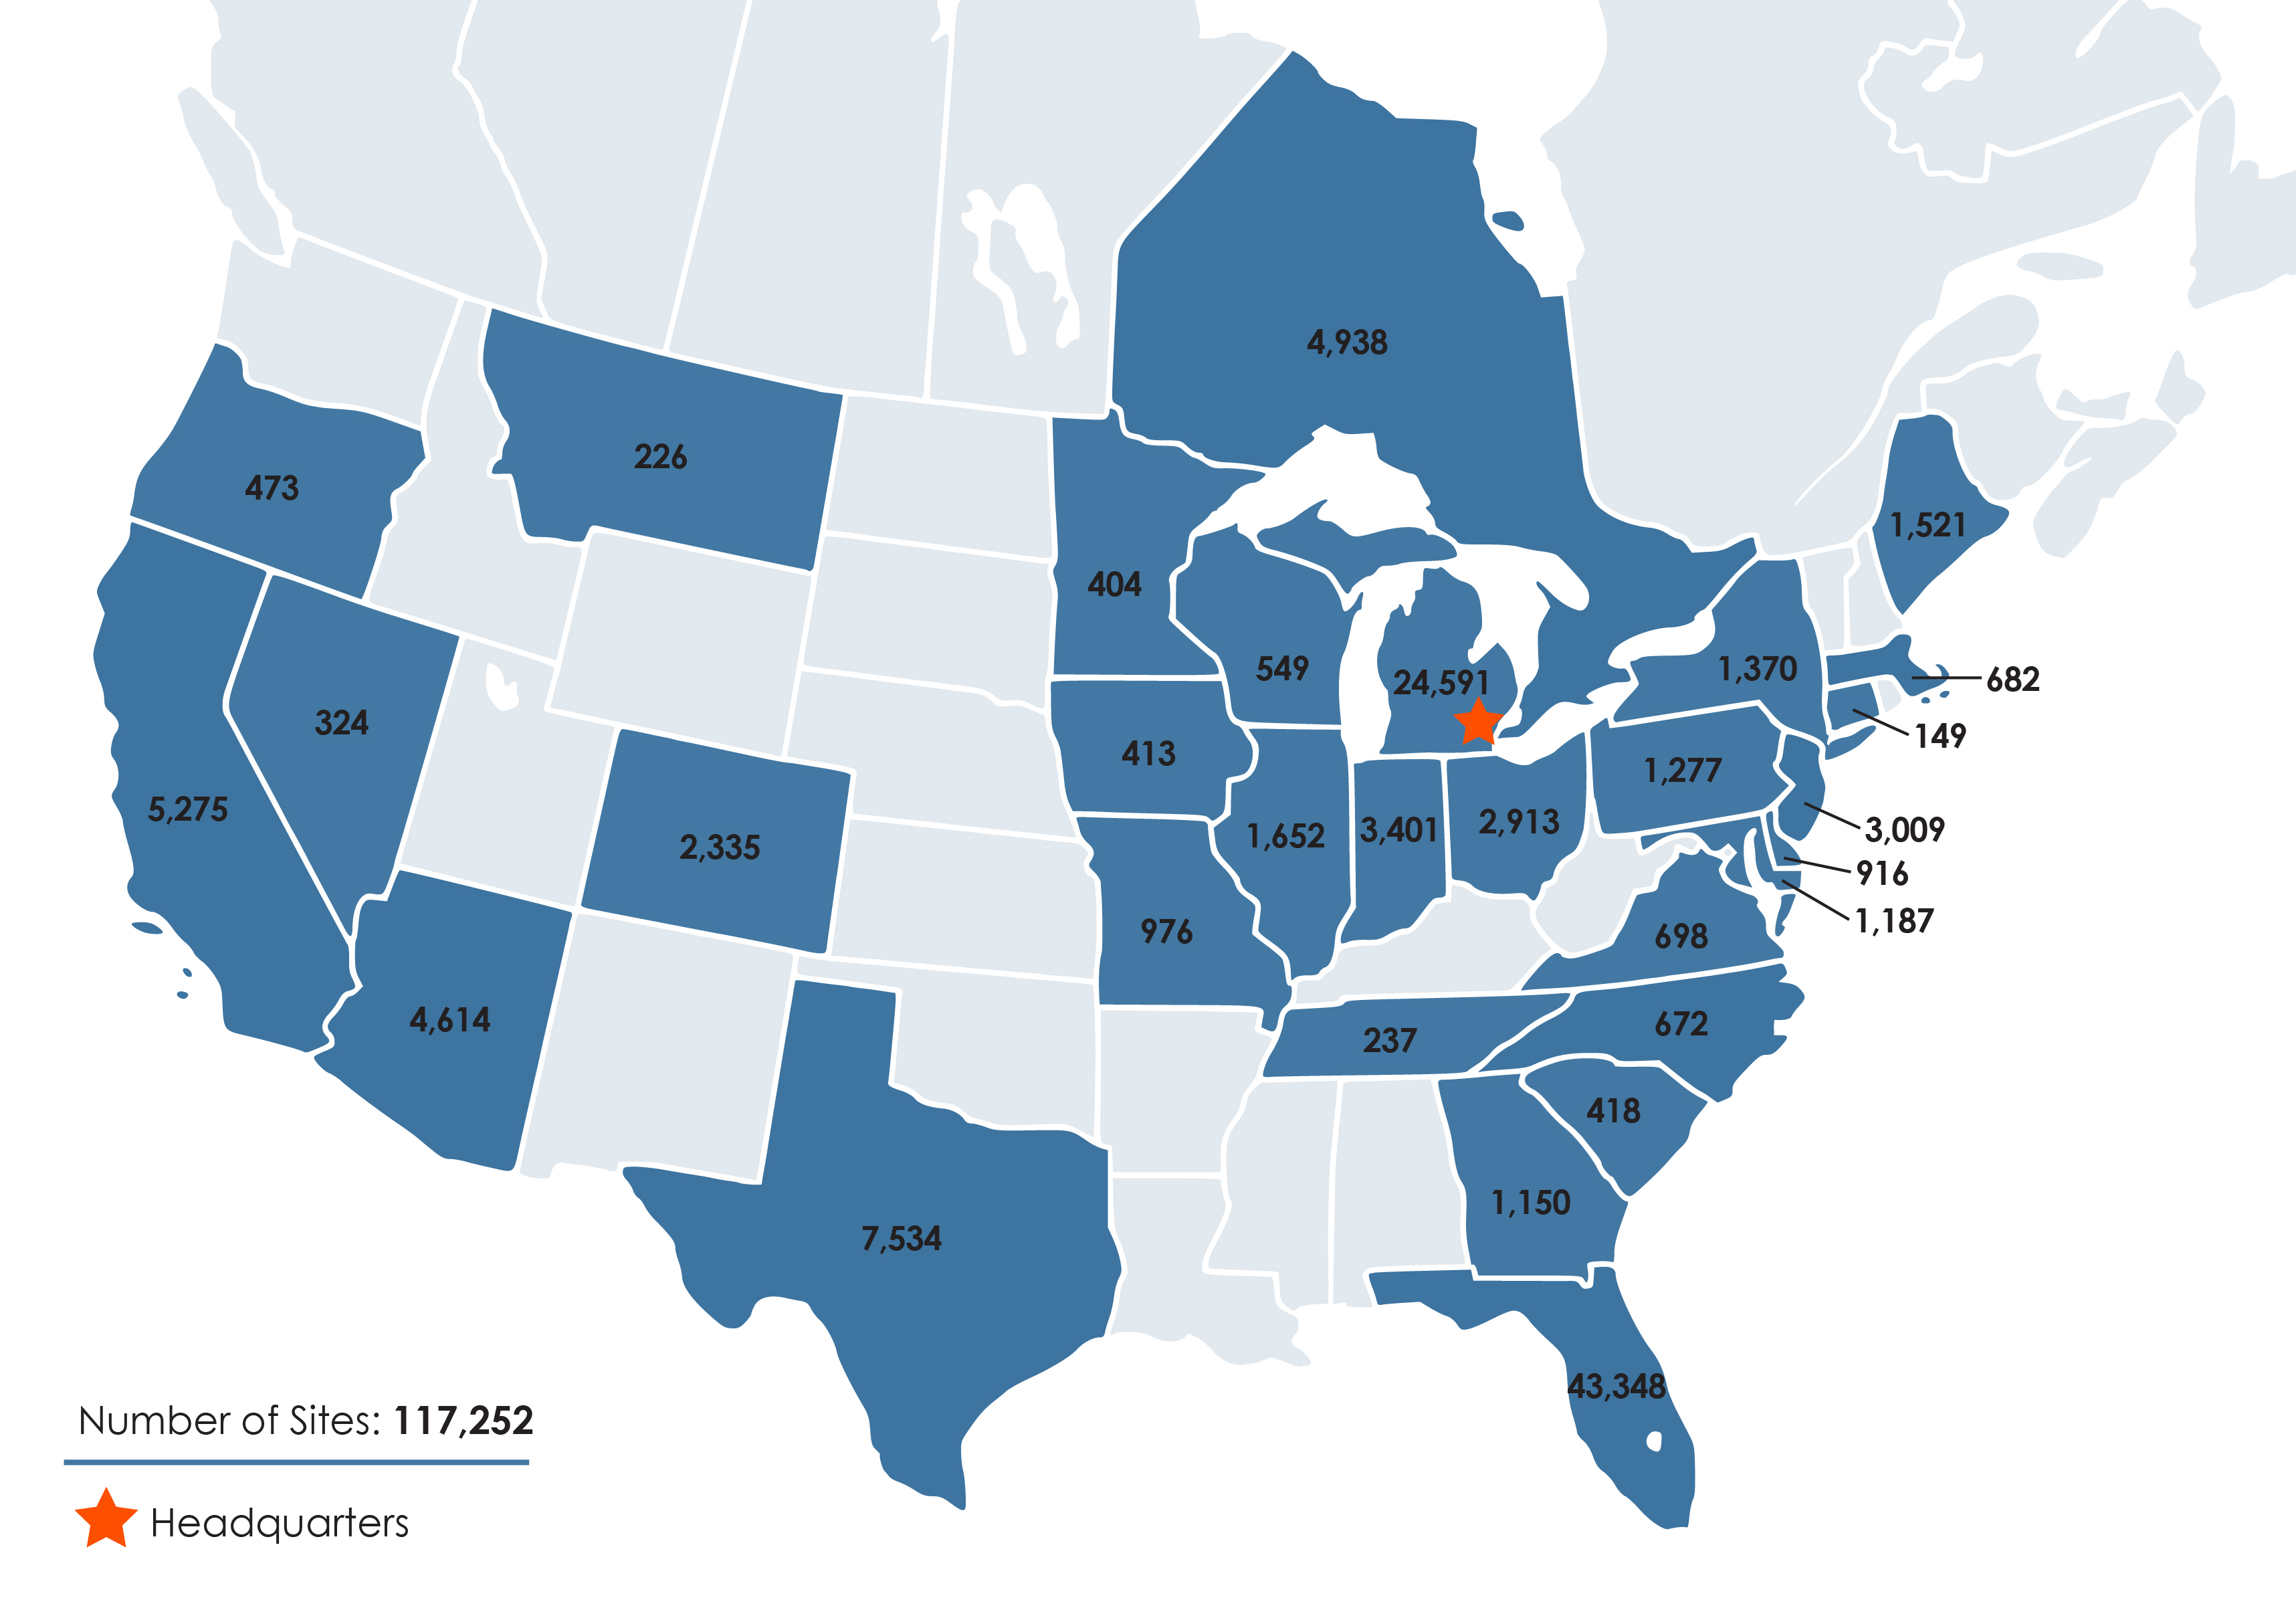
Sun Communities, Inc. is a REIT that, as of September 30, 2016, owned or had an interest in a portfolio of 339 communities comprising approximately 117,000 developed sites in 29 states and Ontario.
For more information about Sun Communities, Inc., please visit the website at www.suncommunities.com.
CONTACT
Please address all inquiries to our investor relations department at our website www.suncommunities.com, by phone (248) 208-2500, by email investorrelations@suncommunities.com or by mail Sun Communities, Inc. Investor Relations, 27777 Franklin Road, Ste. 200, Southfield, MI 48034.
Forward-Looking Statements
This press release contains various "forward-looking statements" within the meaning of the Securities Act of 1933, as amended, and the Securities Exchange Act of 1934, as amended, and the Company intends that such forward-looking statements will be subject to the safe harbors created thereby. Forward-looking statements can be identified by words such as "will," "may," "could," "expect," "anticipate," "believes," "intends," "should," "plans," "estimates," "approximate," "guidance," and similar expressions in this press release that predict or indicate future events and trends and that do not report historical matters.
These forward-looking statements reflect the Company’s current views with respect to future events and financial performance, but involve known and unknown risks, uncertainties, and other factors, some of which are beyond the Company's control. These risks, uncertainties, and other factors may cause the actual results of the Company to be materially different from any future results expressed or implied by such forward-looking statements. Such risks and uncertainties include national, regional and local economic climates, the ability to maintain rental rates and occupancy levels, competitive market forces, the performance of recent acquisitions, the ability to integrate future acquisitions smoothly and efficiently, changes in market rates of interest, the ability of manufactured home buyers to obtain financing, the level of repossessions by manufactured home lenders and those risks and uncertainties referenced under the headings entitled "Risk Factors" contained in the Company's 2015 Annual Report on Form 10-K, the Company's Quarterly Report on Form 10-Q for the Quarter ended September 30, 2016, and the Company’s other periodic filings with the Securities and Exchange Commission.
The forward-looking statements contained in this press release speak only as of the date hereof and the Company expressly disclaims any obligation to provide public updates, revisions or amendments to any forward-looking statements made herein to reflect changes in the Company’s assumptions, expectations of future events, or trends.
Investor Information
|
| | | |
| RESEARCH COVERAGE | | |
| | | | |
| | BMO Capital Markets | | Paul Adornato |
| | | | (212) 885-4170 |
| | | | paul.adornato@bmo.com |
| | | | |
| | Citi Research | | Michael Bilerman/Nicholas Joseph |
| | | | (212) 816-1383 |
| | | | michael.bilerman@citi.com |
| | | | nicholas.joseph@citi.com |
| | | | |
| | Evercore ISI | | Steve Sakwa |
| | | | (212) 446-9462 |
| | | | steve.sakwa@evercoreisi.com |
| | | | |
| | | | Gwen Clark |
| | | | (212) 446-5611 |
| | | | gwen.clark@evercoreisi.com |
| | | | |
| | Green Street Advisors | | Dave Bragg |
| | | | (949) 640-9780 |
| | | | dbragg@greenst.com |
| | | | |
| | Robert W. Baird & Co. | | Drew Babin |
| | | | (215) 553-7816 |
| | | | dbabin@rwbaird.com |
| | | | |
| | Wells Fargo | | Todd Stender |
| | | | (212) 214-8067 |
| | | | todd.stender@wellsfargo.com |
| | | | |
| | | | |
| INQUIRIES | | | |
| | | | |
| Sun Communities welcomes questions or comments from stockholders, analysts, investment managers, media, or |
| any prospective investor. Please address all inquiries to our investor relations department. |
| | | | |
| | At Our Website | | www.suncommunities.com |
| | | | |
| | By Email | | investorrelations@suncommunities.com |
| | | | |
| | By Phone | | (248) 208-2500 |
3rd Quarter 2016 Supplemental Information 1 Sun Communities, Inc.
Portfolio Overview
(As of September 30, 2016)
3rd Quarter 2016 Supplemental Information 2 Sun Communities, Inc.
Balance Sheets
(amounts in thousands)
|
| | | | | | | | | | | | | | | | | | | | |
| | | Quarter Ended |
| | | 9/30/2016 | | 6/30/2016 | | 3/31/2016 | | 12/31/2015 | | 9/30/2015 |
| ASSETS: | | | | | | | | | | |
| Land | | $ | 1,072,964 |
| | $ | 458,349 |
| | $ | 456,380 |
| | $ | 451,340 |
| | $ | 457,279 |
|
| Land improvements and buildings | | 4,682,920 |
| | 5,294,663 |
| | 3,586,969 |
| | 3,535,909 |
| | 3,604,444 |
|
| Rental homes and improvements | | 485,340 |
| | 477,875 |
| | 469,217 |
| | 460,480 |
| | 478,764 |
|
| Furniture, fixtures and equipment | | 125,603 |
| | 107,123 |
| | 104,855 |
| | 102,746 |
| | 98,567 |
|
| Land held for future development | | 23,497 |
| | 23,497 |
| | 23,047 |
| | 23,047 |
| | 23,659 |
|
| Investment property | | 6,390,324 |
| | 6,361,507 |
| | 4,640,468 |
| | 4,573,522 |
| | 4,662,713 |
|
| Accumulated depreciation | | (977,486 | ) | | (928,882 | ) | | (889,941 | ) | | (852,407 | ) | | (879,184 | ) |
| Investment property, net | | 5,412,838 |
| | 5,432,625 |
| | 3,750,527 |
| | 3,721,115 |
| | 3,783,529 |
|
| Cash and cash equivalents | | 69,829 |
| | 31,441 |
| | 410,408 |
| | 45,086 |
| | 23,917 |
|
| Inventory of manufactured homes | | 24,147 |
| | 29,044 |
| | 16,636 |
| | 14,828 |
| | 15,263 |
|
| Notes and other receivables, net | | 87,856 |
| | 76,466 |
| | 54,124 |
| | 47,972 |
| | 49,201 |
|
Collateralized receivables, net (3) | | 143,888 |
| | 144,017 |
| | 142,944 |
| | 139,768 |
| | 138,241 |
|
| Other assets, net | | 166,148 |
| | 109,598 |
| | 188,247 |
| | 213,030 |
| | 95,728 |
|
| Total assets, net | | $ | 5,904,706 |
| | $ | 5,823,191 |
| | $ | 4,562,886 |
| | $ | 4,181,799 |
| | $ | 4,105,879 |
|
| LIABILITIES: | | | | | | | | | | |
| Mortgage loans payable | | $ | 2,854,831 |
| | $ | 2,792,021 |
| | $ | 2,114,818 |
| | $ | 2,125,267 |
| | $ | 2,197,359 |
|
Secured borrowings (3) | | 144,522 |
| | 144,684 |
| | 143,664 |
| | 140,440 |
| | 138,887 |
|
| Preferred OP units - mandatorily redeemable | | 45,903 |
| | 45,903 |
| | 45,903 |
| | 45,903 |
| | 45,903 |
|
| Lines of credit | | 57,737 |
| | 357,721 |
| | 58,065 |
| | 24,687 |
| | 166,677 |
|
| Distributions payable | | 51,100 |
| | 47,992 |
| | 45,351 |
| | 41,265 |
| | 38,819 |
|
| Other liabilities | | 275,650 |
| | 257,423 |
| | 184,102 |
| | 184,859 |
| | 190,284 |
|
| Total liabilities | | 3,429,743 |
| | 3,645,744 |
| | 2,591,903 |
| | 2,562,421 |
| | 2,777,929 |
|
| Series A-4 Preferred Stock | | 50,227 |
| | 50,227 |
| | 61,732 |
| | 61,732 |
| | 68,633 |
|
| Series A-4 preferred OP units | | 19,906 |
| | 20,266 |
| | 20,762 |
| | 21,065 |
| | 20,982 |
|
| STOCKHOLDERS' EQUITY: | | | | | | | | | | |
| Series A Preferred Stock | | 34 |
| | 34 |
| | 34 |
| | 34 |
| | 34 |
|
| Common stock | | 730 |
| | 686 |
| | 646 |
| | 584 |
| | 545 |
|
| Additional paid-in capital | | 3,313,905 |
| | 2,980,382 |
| | 2,706,657 |
| | 2,319,314 |
| | 2,079,139 |
|
| Accumulated other comprehensive (loss) income | | (4,876 | ) | | 1 |
| | — |
| | — |
| | — |
|
| Distributions in excess of accumulated earnings | | (975,511 | ) | | (947,988 | ) | | (896,896 | ) | | (864,122 | ) | | (916,961 | ) |
| Total SUI stockholders' equity | | 2,334,282 |
| | 2,033,115 |
| | 1,810,441 |
| | 1,455,810 |
| | 1,162,757 |
|
| Noncontrolling interests: | | | | | | | | | | |
| Common and preferred OP units | | 73,284 |
| | 76,166 |
| | 80,018 |
| | 82,538 |
| | 76,914 |
|
| Consolidated variable interest entities | | (2,736 | ) | | (2,327 | ) | | (1,970 | ) | | (1,767 | ) | | (1,336 | ) |
| Total noncontrolling interest | | 70,548 |
| | 73,839 |
| | 78,048 |
| | 80,771 |
| | 75,578 |
|
| Total stockholders' equity | | 2,404,830 |
| | 2,106,954 |
| | 1,888,489 |
| | 1,536,581 |
| | 1,238,335 |
|
| Total liabilities & stockholders' equity | | $ | 5,904,706 |
| | $ | 5,823,191 |
| | $ | 4,562,886 |
| | $ | 4,181,799 |
| | $ | 4,105,879 |
|
3rd Quarter 2016 Supplemental Information 3 Sun Communities, Inc.
Statements of Operations
(amounts in thousands, except per share amounts)
|
| | | | | | | | | | | | | | | | | | | |
| | Three Months Ended |
| | 9/30/2016 | | 6/30/2016 | | 3/31/2016 | | 12/31/2015 | | 9/30/2015 |
| REVENUES: | | | | | | | | | |
Income from real property (excluding transient revenue) | $ | 158,020 |
| | $ | 129,117 |
| | $ | 119,084 |
| | $ | 117,604 |
| | $ | 119,784 |
|
| Transient revenue | 26,304 |
| | 10,884 |
| | 10,151 |
| | 5,568 |
| | 17,764 |
|
| Revenue from home sales | 31,211 |
| | 26,039 |
| | 24,737 |
| | 25,169 |
| | 18,991 |
|
| Rental home revenue | 12,031 |
| | 11,957 |
| | 11,708 |
| | 11,756 |
| | 11,856 |
|
| Ancillary revenues | 16,446 |
| | 7,383 |
| | 4,613 |
| | 3,576 |
| | 12,511 |
|
| Interest | 4,705 |
| | 4,672 |
| | 3,945 |
| | 4,074 |
| | 3,987 |
|
| Brokerage commissions and other income, net | 984 |
| | 747 |
| | 406 |
| | 491 |
| | 462 |
|
| Total revenues | 249,701 |
| | 190,799 |
| | 174,644 |
| | 168,238 |
| | 185,355 |
|
| | | | | | | | | | |
| EXPENSES: | | | | | | | | | |
| Property operating and maintenance | 57,089 |
| | 37,067 |
| | 31,201 |
| | 33,360 |
| | 38,716 |
|
| Real estate taxes | 12,384 |
| | 10,153 |
| | 9,585 |
| | 8,683 |
| | 8,520 |
|
| Cost of home sales | 21,935 |
| | 18,684 |
| | 18,184 |
| | 19,296 |
| | 13,386 |
|
| Rental home operating and maintenance | 6,350 |
| | 5,411 |
| | 5,876 |
| | 6,841 |
| | 7,031 |
|
| Ancillary expenses | 8,539 |
| | 5,201 |
| | 3,508 |
| | 3,888 |
| | 6,936 |
|
| Home selling expenses | 3,553 |
| | 2,858 |
| | 2,278 |
| | 2,079 |
| | 1,910 |
|
| General and administrative | 16,575 |
| | 16,543 |
| | 13,792 |
| | 10,511 |
| | 12,670 |
|
| Transaction costs | 4,191 |
| | 20,979 |
| | 2,721 |
| | 4,653 |
| | 1,664 |
|
| Depreciation and amortization | 61,483 |
| | 49,670 |
| | 48,412 |
| | 47,530 |
| | 44,695 |
|
| Interest | 33,800 |
| | 28,428 |
| | 26,294 |
| | 28,066 |
| | 27,453 |
|
| Interest on mandatorily redeemable preferred OP units | 789 |
| | 787 |
| | 787 |
| | 790 |
| | 790 |
|
| Total expenses | 226,688 |
| | 195,781 |
| | 162,638 |
| | 165,697 |
| | 163,771 |
|
| Income / (loss) before other items | 23,013 |
| | (4,982 | ) | | 12,006 |
| | 2,541 |
| | 21,584 |
|
| Gains on disposition of properties, net | — |
| | — |
| | — |
| | 98,430 |
| | 18,190 |
|
| Provision for income taxes | (283 | ) | | (56 | ) | | (228 | ) | | 71 |
| | (77 | ) |
| Income tax expense - reduction of deferred tax asset | — |
| | — |
| | — |
| | (1,000 | ) | | — |
|
| Income from affiliate transactions | 500 |
| | — |
| | — |
| | — |
| | — |
|
| Net income / loss | 23,230 |
| | (5,038 | ) | | 11,778 |
| | 100,042 |
| | 39,697 |
|
| Less: Preferred return to preferred OP units | (1,257 | ) | | (1,263 | ) | | (1,273 | ) | | (1,281 | ) | | (1,302 | ) |
| Less: Amounts attributable to noncontrolling interests | (879 | ) | | 695 |
| | (276 | ) | | (6,922 | ) | | (2,125 | ) |
| Less: Preferred stock distribution | (2,197 | ) | | (2,197 | ) | | (2,354 | ) | | (2,440 | ) | | (3,179 | ) |
| Less: Preferred stock redemption costs | — |
| | — |
| | — |
| | — |
| | (4,328 | ) |
| NET INCOME / (LOSS) ATTRIBUTABLE TO SUI | $ | 18,897 |
|
| $ | (7,803 | ) |
| $ | 7,875 |
|
| $ | 89,399 |
|
| $ | 28,763 |
|
| Weighted average common shares outstanding: | | | | | | | | | |
| Basic | 68,655 |
| | 64,757 |
| | 57,736 |
| | 56,181 |
| | 53,220 |
|
| Diluted | 69,069 |
| | 64,757 |
| | 58,126 |
| | 57,639 |
| | 53,665 |
|
| Earnings (loss) per share: | | | | | | | | | |
| Basic | $ | 0.27 |
| | $ | (0.12 | ) | | $ | 0.14 |
| | $ | 1.57 |
| | $ | 0.53 |
|
| Diluted | $ | 0.27 |
| | $ | (0.12 | ) | | $ | 0.14 |
| | $ | 1.56 |
| | $ | 0.53 |
|
| | | | | | | | | | |
3rd Quarter 2016 Supplemental Information 4 Sun Communities, Inc.
Summary of Securities Outstanding as of September 30, 2016
(units/stock/shares in thousands)
|
| | | | | | | | | |
| | Number of Units/Stock/Shares Outstanding | | Conversion Rate | | If Converted | | Issuance Price per unit | | Annual Distribution Rate |
| Convertible Securities | | | | | | | | | |
| Series A-1 preferred OP Units | 376 | | 2.43902 | | 917 | | $100 | | 6.0% |
| Series A-3 preferred OP Units | 40 | | 1.8605 | | 74 | | $100 | | 4.5% |
| Series A-4 preferred OP Units | 743 | | 0.444444 | | 330 | | $25 | | 6.5% |
| Series C preferred OP Units | 333 | | 1.11 | | 370 | | $100 | | 4.0% |
| Common OP Units | 2,838 | | 1.0 | | 2,838 | | N/A | | Mirrors the Common Share distributions |
| Series A-4 cumulative convertible Preferred Stock | 1,682 | | 0.444444 | | 748 | | $25 | | 6.5% |
| | | | | | | | | | |
| Non-Convertible Securities | | | | | | | | | |
| Preferred Stock ( SUI-PrA) | 3,400 | | N/A | | N/A | | $25 | | 7.125% |
| | | | | | | | | | |
| Common Shares | 73,027 | | N/A | | N/A | | N/A | | $2.60* |
| * Annual distribution is based on the last quarter distribution annualized. |
3rd Quarter 2016 Supplemental Information 5 Sun Communities, Inc.
Reconciliations to Non-GAAP Financial Measures
3rd Quarter 2016 Supplemental Information 6 Sun Communities, Inc.
Reconciliation of Net Income Attributable to Sun Communities, Inc. Common Stockholders to Funds from Operations
(amounts in thousands except for per share data)
|
| | | | | | | | | | | | | | | |
| | Three Months Ended
September 30, | | Nine Months Ended
September 30, |
| | 2016 | | 2015 | | 2016 | | 2015 |
| Net income attributable to Sun Communities, Inc. common stockholders | $ | 18,897 |
| | $ | 28,763 |
| | $ | 18,969 |
| | $ | 47,926 |
|
| Adjustments: | |
| | |
| | |
| | |
|
| Preferred return to preferred OP units | 616 |
| | — |
| | 1,858 |
| | — |
|
| Amounts attributable to noncontrolling interests | 685 |
| | 1,174 |
| | 255 |
| | 1,554 |
|
| Preferred distribution to Series A-4 preferred stock | 683 |
| | 1,666 |
| | — |
| | — |
|
| Depreciation and amortization | 61,809 |
| | 45,014 |
| | 159,225 |
| | 130,247 |
|
| Gain on disposition of properties, net | — |
| | (18,190 | ) | | — |
| | (26,946 | ) |
| Gain on disposition of assets, net | (4,667 | ) | | (2,937 | ) | | (12,226 | ) | | (7,065 | ) |
Funds from operations ("FFO") attributable to Sun Communities, Inc. common stockholders and dilutive convertible securities (1) (5)
| 78,023 |
| | 55,490 |
| | 168,081 |
| | 145,716 |
|
| Adjustments: | | | | | | | |
| Transaction costs | 4,191 |
| | 1,664 |
| | 27,891 |
| | 13,150 |
|
Other acquisition related costs (4) | 1,467 |
| | — |
| | 1,467 |
| | — |
|
| Income from affiliate transactions | (500 | ) | | — |
| | (500 | ) | | (7,500 | ) |
| Preferred stock redemption costs | — |
| | 4,328 |
| | — |
| | 4,328 |
|
| Extinguishment of debt | — |
| | — |
| | — |
| | 2,800 |
|
FFO attributable to Sun Communities, Inc. common stockholders and dilutive convertible securities excluding certain items (1) (5)
| $ | 83,181 |
| | $ | 61,482 |
| | $ | 196,939 |
| | $ | 158,494 |
|
| | | | | | | | |
| Weighted average common shares outstanding - basic: | 68,655 |
| | 53,220 |
| | 63,716 |
| | 52,855 |
|
| Add: | | | | | | | |
| Common stock issuable upon conversion of stock options | 8 |
| | 14 |
| | 10 |
| | 16 |
|
| Restricted stock | 406 |
| | 431 |
| | 437 |
| | 400 |
|
| Common stock issuable upon conversion of Series A-4 preferred stock | 747 |
| | 1,826 |
| | — |
| | — |
|
| Common OP units | 2,856 |
| | 2,874 |
| | 2,861 |
| | 2,783 |
|
| Common stock issuable upon conversion of Series A-1 preferred OP units | 920 |
| | — |
| | 932 |
| | — |
|
| Common stock issuable upon conversion of Series A-3 preferred OP units | 75 |
| | — |
| | 75 |
| | — |
|
| Weighted average common shares outstanding - fully diluted | 73,667 |
| | 58,365 |
| | 68,031 |
| | 56,054 |
|
| | | | | | | | |
FFO attributable to Sun Communities, Inc. common stockholders and dilutive convertible securities (5) per Share - fully diluted
| $ | 1.06 |
| | $ | 0.95 |
| | $ | 2.47 |
| | $ | 2.60 |
|
FFO attributable to Sun Communities, Inc. common stockholders and dilutive convertible securities (5) per Share excluding certain items - fully diluted
| $ | 1.13 |
| | $ | 1.05 |
| | $ | 2.89 |
| | $ | 2.83 |
|
3rd Quarter 2016 Supplemental Information 7 Sun Communities, Inc.
Reconciliation of Recurring EBITDA to Net Income Attributable to Sun Communities, Inc. Common Stockholders
(amounts in thousands)
The following table reconciles Recurring EBITDA to consolidated net income:
|
| | | | | | | | | | | | | | | |
| | Three Months Ended September 30, | | Nine Months Ended September 30, |
| | 2016 | | 2015 | | 2016 | | 2015 |
RECURRING EBITDA (1) | $ | 123,276 |
| | $ | 96,186 |
| | $ | 308,378 |
| | $ | 264,293 |
|
| Interest | 33,800 |
| | 27,453 |
| | 88,522 |
| | 79,593 |
|
| Interest on mandatorily redeemable preferred OP units | 789 |
| | 790 |
| | 2,363 |
| | 2,429 |
|
| Depreciation and amortization | 61,483 |
| | 44,695 |
| | 159,565 |
| | 130,107 |
|
| Extinguishment of debt | — |
| | — |
| | — |
| | 2,800 |
|
| Transaction costs | 4,191 |
| | 1,664 |
| | 27,891 |
| | 13,150 |
|
| Gains on disposition of properties, net | — |
| | (18,190 | ) | | — |
| | (26,946 | ) |
| Provision for income tax | 283 |
| | 77 |
| | 567 |
| | 229 |
|
| Income from affiliate transactions | (500 | ) | | — |
| | (500 | ) | | (7,500 | ) |
| Net income | 23,230 |
| | 39,697 |
| | 29,970 |
| | 70,431 |
|
| Less: Preferred return to preferred OP units | 1,257 |
| | 1,302 |
| | 3,793 |
| | 3,692 |
|
| Less: Amounts attributable to noncontrolling interests | 879 |
| | 2,125 |
| | 460 |
| | 3,132 |
|
| Net income attributable to Sun Communities, Inc. | 21,094 |
| | 36,270 |
| | 25,717 |
| | 63,607 |
|
| Less: Preferred stock distributions | 2,197 |
| | 3,179 |
| | 6,748 |
| | 11,353 |
|
| Less: Preferred stock redemption costs | — |
| | 4,328 |
| | — |
| | 4,328 |
|
| Net income attributable to Sun Communities, Inc., common stockholders | $ | 18,897 |
| | $ | 28,763 |
| | $ | 18,969 |
| | $ | 47,926 |
|
3rd Quarter 2016 Supplemental Information 8 Sun Communities, Inc.
Reconciliation of Net Operating Income to Net Income Attributable to Sun Communities, Inc. Common Stockholders
(amounts in thousands)
The following table reconciles net operating income to consolidated net income:
|
| | | | | | | | | | | | | | | |
| | Three Months Ended September 30, | | Nine Months Ended September 30, |
| | 2016 | | 2015 | | 2016 | | 2015 |
| Real Property NOI | $ | 114,851 |
| | $ | 90,312 |
| | $ | 296,081 |
| | $ | 254,438 |
|
| Rental Program NOI | 21,213 |
| | 20,587 |
| | 64,223 |
| | 62,805 |
|
| Home Sales NOI/Gross profit | 9,276 |
| | 5,605 |
| | 23,184 |
| | 14,914 |
|
| Ancillary NOI/Gross profit | 7,907 |
| | 5,575 |
| | 11,194 |
| | 7,325 |
|
Site rent from Rental Program (included in Real Property NOI) (6) | (15,532 | ) | | (15,762 | ) | | (46,164 | ) | | (46,440 | ) |
| NOI/Gross profit | 137,715 |
| | 106,317 |
| | 348,518 |
| | 293,042 |
|
| Adjustments to arrive at net income: | | | | | | | |
| Other revenues | 5,689 |
| | 4,449 |
| | 15,459 |
| | 13,592 |
|
| Home selling expenses | (3,553 | ) | | (1,910 | ) | | (8,689 | ) | | (5,397 | ) |
| General and administrative | (16,575 | ) | | (12,670 | ) | | (46,910 | ) | | (36,944 | ) |
| Transaction costs | (4,191 | ) | | (1,664 | ) | | (27,891 | ) | | (13,150 | ) |
| Depreciation and amortization | (61,483 | ) | | (44,695 | ) | | (159,565 | ) | | (130,107 | ) |
| Extinguishment of debt | — |
| | — |
| | — |
| | (2,800 | ) |
| Interest expense | (34,589 | ) | | (28,243 | ) | | (90,885 | ) | | (82,022 | ) |
| Gain on disposition of properties, net | — |
| | 18,190 |
| | — |
| | 26,946 |
|
| Provision for state income taxes | (283 | ) | | (77 | ) | | (567 | ) | | (229 | ) |
| Income from affiliate transactions | 500 |
| | — |
| | 500 |
| | 7,500 |
|
| Net income | 23,230 |
| | 39,697 |
| | 29,970 |
| | 70,431 |
|
| Less: Preferred return to preferred OP units | 1,257 |
| | 1,302 |
| | 3,793 |
| | 3,692 |
|
| Less: Amounts attributable to noncontrolling interests | 879 |
| | 2,125 |
| | 460 |
| | 3,132 |
|
| Net income attributable to Sun Communities, Inc. | 21,094 |
| | 36,270 |
| | 25,717 |
| | 63,607 |
|
| Less: Preferred stock distributions | 2,197 |
| | 3,179 |
| | 6,748 |
| | 11,353 |
|
| Less: Preferred stock redemption costs | — |
| | 4,328 |
| | — |
| | 4,328 |
|
| Net income attributable to Sun Communities, Inc., common stockholders | $ | 18,897 |
| | $ | 28,763 |
| | $ | 18,969 |
| | $ | 47,926 |
|
| | | | | | | | |
3rd Quarter 2016 Supplemental Information 9 Sun Communities, Inc.
Non-GAAP and Other Financial Measures
3rd Quarter 2016 Supplemental Information 10 Sun Communities, Inc.
Financial Highlights
(amounts in thousands, except per share data)
|
| | | | | | | | | | | | | | | | | | | |
| | Quarter Ended |
| | 9/30/2016 | | 6/30/2016 | | 3/31/2016 | | 12/31/2015 | | 9/30/2015 |
| OPERATING INFORMATION | | | | | | | | | |
| Total revenues | $ | 249,701 |
| | $ | 190,799 |
| | $ | 174,644 |
| | $ | 168,238 |
| | $ | 185,355 |
|
| Net income (loss) | $ | 23,230 |
| | $ | (5,038 | ) | | $ | 11,778 |
| | $ | 100,042 |
| | $ | 39,697 |
|
| Net income (loss) available for Common Stockholders | $ | 18,897 |
| | $ | (7,803 | ) | | $ | 7,875 |
| | $ | 89,399 |
| | $ | 28,763 |
|
| Earnings (loss) per share basic | $ | 0.27 |
| | $ | (0.12 | ) | | $ | 0.14 |
| | $ | 1.57 |
| | $ | 0.53 |
|
| Earnings (loss) per share diluted | $ | 0.27 |
| | $ | (0.12 | ) | | $ | 0.14 |
| | $ | 1.56 |
| | $ | 0.53 |
|
| | | | | | | | | | |
Recurring EBITDA (1) | $ | 123,276 |
| | $ | 94,882 |
| | $ | 90,220 |
| | $ | 83,580 |
| | $ | 96,186 |
|
FFO attributable to Sun Communities, Inc. common stockholders and dilutive convertible securities(1) (5) | $ | 78,023 |
| | $ | 37,473 |
| | $ | 53,270 |
| | $ | 43,282 |
| | $ | 55,490 |
|
FFO attributable to Sun Communities, Inc. common stockholders and dilutive convertible securities excluding certain items(1) (5) | $ | 83,181 |
| | $ | 58,452 |
| | $ | 55,991 |
| | $ | 48,935 |
| | $ | 61,482 |
|
FFO attributable to Sun Communities, Inc. common stockholders and dilutive convertible securities (5) per Share - fully diluted
| $ | 1.06 |
| | $ | 0.54 |
| | $ | 0.86 |
| | $ | 0.72 |
| | $ | 0.95 |
|
FFO attributable to Sun Communities, Inc. common stockholders and dilutive convertible securities (5) per Share excluding certain items - fully diluted
| $ | 1.13 |
| | $ | 0.85 |
| | $ | 0.90 |
| | $ | 0.81 |
| | $ | 1.05 |
|
| | | | | | | | | | |
| | | | | | | | | | |
| BALANCE SHEET | | | | | | | | | |
| Total assets | $ | 5,904,706 |
| | $ | 5,823,191 |
| | $ | 4,562,886 |
| | $ | 4,181,799 |
| | $ | 4,105,879 |
|
| Total debt | $ | 3,102,993 |
| | $ | 3,340,329 |
| | $ | 2,362,450 |
| | $ | 2,336,297 |
| | $ | 2,548,826 |
|
Total liabilities | $ | 3,429,743 |
| | $ | 3,645,744 |
| | $ | 2,591,903 |
| | $ | 2,562,421 |
| | $ | 2,777,929 |
|
3rd Quarter 2016 Supplemental Information 11 Sun Communities, Inc.
Debt Analysis
(amounts in thousands)
|
| | | | | | | | | | | | | | | | | | | |
| | Quarter Ended |
| | 9/30/2016 | | 6/30/2016 | | 3/31/2016 | | 12/31/2015 | | 9/30/2015 |
| DEBT OUTSTANDING | | | | | | | | | |
| Lines of credit | $ | 57,737 |
| | $ | 357,721 |
| | $ | 58,065 |
| | $ | 24,687 |
| | $ | 166,677 |
|
| Mortgage loans payable | 2,854,831 |
| | 2,792,021 |
| | 2,114,818 |
| | 2,125,267 |
| | 2,197,359 |
|
| Preferred OP units - mandatorily redeemable | 45,903 |
| | 45,903 |
| | 45,903 |
| | 45,903 |
| | 45,903 |
|
Secured borrowing (3) | 144,522 |
| | 144,684 |
| | 143,664 |
| | 140,440 |
| | 138,887 |
|
| Total debt | $ | 3,102,993 |
| | $ | 3,340,329 |
| | $ | 2,362,450 |
| | $ | 2,336,297 |
| | $ | 2,548,826 |
|
| | | | | | | | | | |
| % FIXED/FLOATING | | | | | | | | | |
| Fixed | 93.1% | | 84.5% | | 90.7% | | 92.0% | | 87.0% |
| Floating | 6.9% | | 15.5% | | 9.3% | | 8.0% | | 13.0% |
| Total | 100.0% | | 100.0% | | 100.0% | | 100.0% | | 100.0% |
| | | | | | | | | | |
| WEIGHTED AVERAGE INTEREST RATES | | | | | | | | | |
| Lines of credit | 1.93% | | 1.89% | | 1.87% | | 1.62% | | 1.66% |
| Mortgage loans payable | 4.30% | | 4.38% | | 4.67% | | 4.65% | | 4.69% |
| Preferred OP units - mandatorily redeemable | 6.87% | | 6.87% | | 6.87% | | 6.87% | | 6.87% |
| Average before Secured borrowing | 4.29% | | 4.13% | | 4.64% | | 4.66% | | 4.52% |
Secured borrowing (3) | 10.06% | | 10.09% | | 10.12% | | 10.17% | | 10.23% |
| Total average | 4.56% | | 4.39% | | 4.98% | | 4.99% | | 4.83% |
| | | | | | | | | | |
| DEBT RATIOS | | | | | | | | | |
Net Debt/Recurring EBITDA (1) (7) | 7.7 | | 9.1 | | 5.5 | | 6.6 | | 7.8 |
| | | | | | | | | | |
| Net Debt/Enterprise Value | 32.8% | | 36.6% | | 27.7% | | 34.0% | | 37.9% |
| | | | | | | | | | |
| Net Debt + Preferred Stock/Enterprise Value | 34.2% | | 38.0% | | 29.7% | | 36.1% | | 40.1% |
| | | | | | | | | | |
| Net Debt/Gross Assets | 44.1% | | 49.0% | | 35.8% | | 45.6% | | 50.7% |
| | | | | | | | | | |
| COVERAGE RATIOS | | | | | | | | | |
Recurring EBITDA/ Interest (1) (7) | 3.1 | | 3.1 | | 3.0 | | 3.1 | | 3.1 |
| | | | | | | | | | |
Recurring EBITDA/ Interest + Pref. Distributions + Pref. Stock Distribution (1) (7) | 2.9 | | 2.8 | | 2.7 | | 2.6 | | 2.7 |
|
| | | | | | | | | | | | | | | | | | | |
| MATURITIES/PRINCIPAL AMORTIZATION NEXT FIVE YEARS | 2016 | | 2017 | | 2018 | | 2019 | | 2020 |
| Lines of credit | $ | — |
| | $ | — |
| | $ | — |
| | $ | — |
| | $ | 58,000 |
|
| Mortgage loans payable: | | | | | | | | | |
| Maturities | — |
| | 87,489 |
| | 49,109 |
| | 64,314 |
| | 49,003 |
|
| Weighted average rate of maturities | — | % | | 5.96 | % | | 6.02 | % | | 6.24 | % | | 5.82 | % |
| Principal amortization | 11,399 |
| | 53,144 |
| | 53,353 |
| | 54,035 |
| | 63,650 |
|
| Preferred OP units - mandatorily redeemable | 3,670 |
| | 7,570 |
| | — |
| | — |
| | — |
|
Secured borrowing (3) | 1,357 |
| | 5,752 |
| | 6,291 |
| | 6,838 |
| | 7,459 |
|
| Total | $ | 16,426 |
| | $ | 153,955 |
| | $ | 108,753 |
| | $ | 125,187 |
| | $ | 178,112 |
|
3rd Quarter 2016 Supplemental Information 12 Sun Communities, Inc.
Statements of Operations – Same Community
(amounts in thousands except for percentages and other information)
|
| | | | | | | | | | | | | | | | | | | | | | | | | | | | | |
| | Three Months Ended September 30, | | Nine Months Ended September 30, |
| | 2016 | | 2015 | | Change | | % Change | | 2016 | | 2015 | | Change | | % Change |
| REVENUES: | | | | | | | | | | | | | | | |
| Income from real property | $ | 124,274 |
| | $ | 117,337 |
| | $ | 6,937 |
| | 5.9 | % | | $ | 353,083 |
| | $ | 332,978 |
| | $ | 20,105 |
| | 6.0 | % |
| | | | | | | | | | | | | | | | |
| PROPERTY OPERATING EXPENSES: | | | | | | | | | | | | |
| Payroll and benefits | 11,029 |
| | 9,716 |
| | 1,313 |
| | 13.5 | % | | 29,879 |
| | 27,521 |
| | 2,358 |
| | 8.6 | % |
| Legal, taxes & insurance | 1,116 |
| | 1,892 |
| | (776 | ) | | (41.0 | )% | | 4,174 |
| | 5,221 |
| | (1,047 | ) | | (20.1 | )% |
| Utilities | 7,954 |
| | 7,564 |
| | 390 |
| | 5.2 | % | | 20,400 |
| | 19,716 |
| | 684 |
| | 3.5 | % |
| Supplies and repair | 5,352 |
| | 5,270 |
| (8) | 82 |
| | 1.6 | % | | 12,733 |
| | 12,503 |
| (8) | 230 |
| | 1.8 | % |
| Other | 3,603 |
| | 3,619 |
| | (16 | ) | | (0.5 | )% | | 9,662 |
| | 9,490 |
| | 172 |
| | 1.8 | % |
| Real estate taxes | 8,575 |
| | 7,557 |
| | 1,018 |
| | 13.5 | % | | 26,303 |
| | 23,683 |
| | 2,620 |
| | 11.1 | % |
| Property operating expenses | 37,629 |
| | 35,618 |
| | 2,011 |
| | 5.6 | % | | 103,151 |
| | 98,134 |
| | 5,017 |
| | 5.1 | % |
NET OPERATING INCOME (NOI)(1) | $ | 86,645 |
| | $ | 81,719 |
| | $ | 4,926 |
| | 6.0 | % | | $ | 249,932 |
| | $ | 234,844 |
| | $ | 15,088 |
| | 6.4 | % |
|
| | | | | | | | | | | | | | |
| | As of September 30, |
| | 2016 | | 2015 | | Change | | % Change |
| OTHER INFORMATION | | | | | | | |
| Number of properties | 219 |
| | 219 |
| | — |
| | |
| | | | | | | | |
Overall occupancy (9) | 96.4 | % | | 94.2 | % | (10) | 2.2 | % | | |
| | | | | | | | |
| Sites available for development | 6,608 |
| | 6,174 |
| | 434 |
| | 7.0 | % |
| | | | | | | | |
| Monthly base rent per site - MH | $ | 495 |
| | $ | 478 |
| | $ | 17 |
| | 3.5 | % |
Monthly base rent per site - RV (11) | $ | 432 |
| | $ | 417 |
| | $ | 15 |
| | 3.6 | % |
| Monthly base rent per site - Total | $ | 487 |
| | $ | 470 |
| | $ | 17 |
| | 3.6 | % |
3rd Quarter 2016 Supplemental Information 13 Sun Communities, Inc.
Rental Program Summary
(amounts in thousands except for *)
|
| | | | | | | | | | | | | | | | | | | | | | | | | | | | | |
| | Three Months Ended September 30, | | Nine Months Ended September 30, |
| | 2016 | | 2015 | | Change | | % Change | | 2016 | | 2015 | | Change | | % Change |
| REVENUES: | | | | | | | | | | | | | | | |
| Rental home revenue | $ | 12,031 |
| | $ | 11,856 |
| | $ | 175 |
| | 1.5 | % | | $ | 35,696 |
| | $ | 34,480 |
| | $ | 1,216 |
| | 3.5 | % |
| Site rent included in Income from real property | 15,532 |
| | 15,762 |
| | (230 | ) | | (1.5 | )% | | 46,164 |
| | 46,440 |
| | (276 | ) | | (0.6 | )% |
| Rental Program revenue | 27,563 |
| | 27,618 |
| | (55 | ) | | (0.2 | )% | | 81,860 |
| | 80,920 |
| | 940 |
| | 1.2 | % |
| | | | | | | | | | | | | | | | |
| EXPENSES: | | | | | | | | | | | | | | | |
| Commissions | 551 |
| | 855 |
| | (304 | ) | | (35.6 | )% | | 1,710 |
| | 2,441 |
| | (731 | ) | | (30.0 | )% |
| Repairs and refurbishment | 3,349 |
| | 3,389 |
| | (40 | ) | | (1.2 | )% | | 9,288 |
| | 8,127 |
| | 1,161 |
| | 14.3 | % |
| Taxes and insurance | 1,446 |
| | 1,645 |
| | (199 | ) | | (12.1 | )% | | 4,178 |
| | 4,665 |
| | (487 | ) | | (10.4 | )% |
| Marketing and other | 1,004 |
| | 1,142 |
| | (138 | ) | | (12.1 | )% | | 2,461 |
| | 2,882 |
| | (421 | ) | | (14.6 | )% |
| Rental Program operating and maintenance | 6,350 |
| | 7,031 |
| | (681 | ) | | (9.7 | )% | | 17,637 |
| | 18,115 |
|
| (478 | ) | | (2.6 | )% |
NET OPERATING INCOME (NOI) (1) | $ | 21,213 |
| | $ | 20,587 |
| | $ | 626 |
| | 3.0 | % | | $ | 64,223 |
| | $ | 62,805 |
| | $ | 1,418 |
| | 2.3 | % |
| | | | | | | | | | | | | | | | |
| Occupied rental home information as of September 30, 2016 and 2015: | | | | | | |
| Number of occupied rentals, end of period* | | | | | | | | | 10,797 |
| | 11,443 |
| | (646 | ) | | (5.6 | )% |
| Investment in occupied rental homes, end of period | | | | | | | | | $ | 453,521 |
| | $ | 456,027 |
| | $ | (2,506 | ) | | (0.6 | )% |
| Number of sold rental homes* | | | | | | | | | 858 |
| | 611 |
| | 247 |
| | 40.4 | % |
| Weighted average monthly rental rate, end of period* | | | | | | | | | $ | 879 |
| | $ | 843 |
| | $ | 36 |
| | 4.3 | % |
3rd Quarter 2016 Supplemental Information 14 Sun Communities, Inc.
Homes Sales Summary
(amounts in thousands except for *)
|
| | | | | | | | | | | | | | | | | | | | | | | | | | | | | |
| | Three Months Ended September 30, | | Nine Months Ended September 30, |
| | 2016 | | 2015 | | Change | | % Change | | 2016 | | 2015 | | Change | | % Change |
| New home sales | $ | 9,391 |
| | $ | 4,469 |
| | $ | 4,922 |
| | 110.1 | % | | $ | 20,472 |
| | $ | 14,890 |
| | $ | 5,582 |
| | 37.5 | % |
| Pre-owned home sales | 21,820 |
| | 14,522 |
| | 7,298 |
| | 50.3 | % | | 61,515 |
| | 39,669 |
| | 21,846 |
| | 55.1 | % |
| Revenue from home sales | 31,211 |
| | 18,991 |
| | 12,220 |
| | 64.3 | % | | 81,987 |
| | 54,559 |
| | 27,428 |
| | 50.3 | % |
| | | | | | | | | | | | | | | | |
| New home cost of sales | 7,896 |
| | 3,739 |
| | 4,157 |
| | 111.2 | % | | 17,513 |
| | 12,348 |
| | 5,165 |
| | 41.8 | % |
| Pre-owned home cost of sales | 14,039 |
| | 9,647 |
| | 4,392 |
| | 45.5 | % | | 41,290 |
| | 27,297 |
| | 13,993 |
| | 51.3 | % |
| Cost of home sales | 21,935 |
| | 13,386 |
| | 8,549 |
| | 63.9 | % | | 58,803 |
| | 39,645 |
| | 19,158 |
| | 48.3 | % |
| | | | | | | | | | | | | | | | |
NOI / Gross Profit (1) | $ | 9,276 |
| | $ | 5,605 |
| | $ | 3,671 |
| | 65.5 | % | | $ | 23,184 |
| | $ | 14,914 |
| | $ | 8,270 |
| | 55.5 | % |
| | | | | | | | | | | | | | | | |
| Gross profit – new homes | $ | 1,495 |
| | $ | 730 |
| | $ | 765 |
| | 104.8 | % | | $ | 2,959 |
| | $ | 2,542 |
| | $ | 417 |
| | 16.4 | % |
| Gross margin % – new homes | 15.9 | % | | 16.3 | % | | (0.4 | )% | | | | 14.5 | % | | 17.1 | % | | (2.6 | )% | | |
| Average selling price - new homes* | $ | 90,298 |
|
| $ | 74,483 |
| | $ | 15,815 |
| | 21.2 | % | | $ | 89,397 |
|
| $ | 77,958 |
| | $ | 11,439 |
| | 14.7 | % |
| | | | | | | | | | | | | | | | |
| Gross profit – pre-owned homes | $ | 7,781 |
| | $ | 4,875 |
| | $ | 2,906 |
| | 59.6 | % | | $ | 20,225 |
| | $ | 12,372 |
| | $ | 7,853 |
| | 63.5 | % |
| Gross margin % – pre-owned homes | 35.7 | % | | 33.6 | % | | 2.1 | % | | | | 32.9 | % | | 31.2 | % | | 1.7 | % | | |
| Average selling price - pre-owned homes* | $ | 27,585 |
|
| $ | 25,657 |
| | $ | 1,928 |
| | 7.5 | % | | $ | 28,205 |
|
| $ | 25,527 |
|
| $ | 2,678 |
| | 10.5 | % |
| | | | | | | | | | | | | | | | |
| Home sales volume: | | | | | | | | |
New home sales* | 104 |
| | 60 |
| | 44 |
| | 73.3 | % | | 229 |
| | 191 |
| | 38 |
| | 19.9 | % |
Pre-owned home sales* | 791 |
| | 566 |
| | 225 |
| | 39.8 | % | | 2,181 |
| | 1,554 |
| | 627 |
| | 40.3 | % |
Total homes sold* | 895 |
| | 626 |
| | 269 |
| | 43.0 | % | | 2,410 |
| | 1,745 |
| | 665 |
| | 38.1 | % |
3rd Quarter 2016 Supplemental Information 15 Sun Communities, Inc.
Acquisitions Summary - Properties Acquired in 2015 and 2016
(amounts in thousands except for statistical data)
|
| | | | | | | |
| | Three Months Ended September 30, 2016 | | Nine Months Ended September 30, 2016 |
| REVENUES: | | | |
Income from real property (excluding transient revenue) | $ | 58,609 |
|
| $ | 82,283 |
|
| Transient revenue | 10,653 |
|
| 15,993 |
|
| Revenue from home sales | 9,644 |
|
| 14,018 |
|
| Rental home revenue | 276 |
|
| 475 |
|
| Ancillary revenues | 7,508 |
|
| 10,101 |
|
| Total revenues | 86,690 |
| | 122,870 |
|
| COSTS AND EXPENSES: | | | |
| Property operating and maintenance | 37,898 |
|
| 46,308 |
|
| Real estate taxes | 3,745 |
|
| 5,819 |
|
| Cost of home sales | 6,671 |
|
| 9,824 |
|
| Rental home operating and maintenance | 80 |
|
| 125 |
|
| Ancillary expense | 3,034 |
|
| 4,724 |
|
| Total expenses | 51,428 |
| | 66,800 |
|
| | | | |
NET OPERATING INCOME (NOI) (1) | $ | 35,262 |
| | $ | 56,070 |
|
| | | | |
| | | | As of September 30, 2016 |
| Other information: | | | |
| Number of properties | | | 120 |
|
Occupied sites (12) | | | 24,191 |
|
Developed sites (12) | | | 24,982 |
|
Occupancy % (12) | | | 96.8 | % |
| Transient sites | | | 8,907 |
|
| Monthly base rent per site - MH | | | $ | 590 |
|
Monthly base rent per site - RV (11) | | | $ | 398 |
|
Monthly base rent per site - Total (11) | | | $ | 506 |
|
| | | | |
| Home sales volume: | | | |
| New homes sales | | | 63 |
|
| Pre-owned homes sales | | | 190 |
|
| | | | |
| Occupied rental home information: | | | |
| Number of occupied rentals, end of period | | | 291 |
|
Investment in occupied rental homes (in thousands) | | | $ | 7,582 |
|
| Weighted average monthly rental rate | | | $ | 863 |
|
3rd Quarter 2016 Supplemental Information 16 Sun Communities, Inc.
|
| | | | | | | | | | | | | | | | |
| Property Summary | | | | | | | | | | | |
| (includes MH and Annual/Seasonal RV’s) | | | | | |
| | | | | | | | | | | | |
| COMMUNITIES | | 9/30/2016 | | 6/30/2016 | | 3/31/2016 | | 12/31/2015 | | 9/30/2015 | |
| FLORIDA | | | | | | | | | | | |
| Communities | | 121 |
| | 121 |
| | 61 |
| | 61 |
| | 62 |
| |
| Sites for development | | 1,259 |
| | 1,259 |
| | 823 |
| | 823 |
| | 823 |
| |
Developed sites (12) | | 36,116 |
| | 36,119 |
| | 24,312 |
| | 24,216 |
| | 24,528 |
| |
Occupied (12) | | 34,817 |
| | 34,720 |
| | 23,359 |
| | 23,201 |
| | 23,427 |
| |
Occupancy % (12) | | 96.4 | % | | 96.1 | % | | 96.1 | % | | 95.8 | % | | 95.5 | % | |
| MICHIGAN | | | | | | | | | | | |
| Communities | | 67 |
| | 66 |
| | 66 |
| | 65 |
| | 70 |
| |
| Sites for development | | 2,628 |
| | 2,248 |
| | 2,105 |
| | 2,105 |
| | 2,262 |
| |
Developed sites (12) | | 24,388 |
| | 24,387 |
| | 24,363 |
| | 23,966 |
| | 24,657 |
| |
Occupied (12) | | 23,218 |
| | 23,198 |
| | 23,079 |
| | 22,677 |
| | 23,179 |
| |
Occupancy % (12) | | 95.2 | % | | 95.1 | % | | 94.7 | % | | 94.6 | % | | 94.0 | % | |
| TEXAS | | | | | | | | | | | |
| Communities | | 21 |
| | 21 |
| | 17 |
| | 16 |
| | 19 |
| |
| Sites for development | | 1,455 |
| | 1,347 |
| | 1,347 |
| | 1,347 |
| | 1,599 |
| |
Developed sites (12) | | 6,088 |
| | 6,071 |
| | 5,970 |
| | 5,965 |
| | 6,507 |
| |
Occupied (12) | | 5,774 |
| | 5,771 |
| | 5,602 |
| | 5,517 |
| | 6,034 |
| |
Occupancy % (12) | | 94.8 | % | | 95.1 | % | | 93.8 | % | | 92.5 | % | | 92.7 | % | |
| CALIFORNIA | | | | | | | | | | | |
| Communities | | 22 |
| | 22 |
| | 3 |
| | 3 |
| | 3 |
| |
| Sites for development | | 332 |
| | 332 |
| | 332 |
| | 332 |
| | 332 |
| |
Developed sites (12) | | 4,797 |
| | 4,864 |
| | 198 |
| | 198 |
| | 198 |
| |
Occupied (12) | | 4,720 |
| | 4,796 |
| | 192 |
| | 192 |
| | 191 |
| |
Occupancy % (12) | | 98.4 | % | | 98.6 | % | | 97.0 | % | | 97.0 | % | | 96.5 | % | |
| ARIZONA | | | | | | | | | | | |
| Communities | | 11 |
| | 11 |
| | 10 |
| | 10 |
| | 11 |
| |
| Sites for development | | 358 |
| | 358 |
| | 393 |
| | 393 |
| | 393 |
| |
Developed sites (12) | | 3,567 |
| | 3,532 |
| | 3,302 |
| | 3,301 |
| | 3,279 |
| |
Occupied (12) | | 3,305 |
| | 3,281 |
| | 3,102 |
| | 3,078 |
| | 3,043 |
| |
Occupancy % (12) | | 92.7 | % | | 92.9 | % | | 93.9 | % | | 93.2 | % | | 92.8 | % | |
| ONTARIO | | | | | | | | | | | |
| Communities | | 15 |
| | 15 |
| | — |
| | — |
| | — |
| |
| Sites for development | | 2,029 |
| | 2,029 |
| | — |
| | — |
| | — |
| |
Developed sites (12) | | 3,453 |
| | 3,375 |
| | — |
| | — |
| | — |
| |
Occupied (12) | | 3,453 |
| | 3,375 |
| | — |
| | — |
| | — |
| |
Occupancy % (12) | | 100.0 | % | | 100.0 | % | | — | % | | — | % | | — | % | |
| INDIANA | | | | | | | | | | | |
| Communities | | 11 |
| | 11 |
| | 11 |
| | 11 |
| | 16 |
| |
| Sites for development | | 316 |
| | 316 |
| | 363 |
| | 363 |
| | 522 |
| |
Developed sites (12) | | 2,900 |
| | 2,900 |
| | 2,900 |
| | 2,900 |
| | 4,913 |
| |
Occupied (12) | | 2,712 |
| | 2,700 |
| | 2,674 |
| | 2,628 |
| | 3,865 |
| |
Occupancy % (12) | | 93.5 | % | | 93.1 | % | | 92.2 | % | | 90.6 | % | | 78.7 | % | |
| | | | | | | | | | | | |
| | | | | | | | | | | | |
3rd Quarter 2016 Supplemental Information 17 Sun Communities, Inc.
|
| | | | | | | | | | | | | | | | |
| Property Summary | | | | | | | | | | | |
| (includes MH and Annual/Seasonal RV’s) | | | | | |
| | | | | | | | | | | | |
| COMMUNITIES | | 9/30/2016 | | 6/30/2016 | | 3/31/2016 | | 12/31/2015 | | 9/30/2015 | |
| OHIO | | | | | | | | | | | |
| Communities | | 9 |
| | 9 |
| | 9 |
| | 9 |
| | 9 |
| |
| Sites for development | | — |
| | — |
| | — |
| | — |
| | — |
| |
Developed sites (12) | | 2,719 |
| | 2,718 |
| | 2,700 |
| | 2,703 |
| | 2,703 |
| |
Occupied (12) | | 2,602 |
| | 2,616 |
| | 2,585 |
| | 2,560 |
| | 2,565 |
| |
Occupancy % (12) | | 95.7 | % | | 96.2 | % | | 95.7 | % | | 94.7 | % | | 94.9 | % | |
| COLORADO | | | | | | | | | | | |
| Communities | | 7 |
| | 7 |
| | 7 |
| | 7 |
| | 7 |
| |
| Sites for development | | 304 |
| | 304 |
| | 304 |
| | 304 |
| | 304 |
| |
Developed sites (12) | | 2,335 |
| | 2,335 |
| | 2,335 |
| | 2,335 |
| | 2,335 |
| |
Occupied (12) | | 2,323 |
| | 2,320 |
| | 2,319 |
| | 2,315 |
| | 2,289 |
| |
Occupancy % (12) | | 99.5 | % | | 99.4 | % | | 99.3 | % | | 99.1 | % | | 98.0 | % | |
| OTHER STATES | | | | | | | | | | | |
| Communities | | 55 |
| | 54 |
| | 49 |
| | 49 |
| | 54 |
| |
| Sites for development | | 1,823 |
| | 1,728 |
| | 1,514 |
| | 1,514 |
| | 1,514 |
| |
Developed sites (12) | | 14,415 |
| | 14,337 |
| | 13,683 |
| | 13,657 |
| | 14,705 |
| |
Occupied (12) | | 13,991 |
| | 13,912 |
| | 13,237 |
| | 13,142 |
| | 13,938 |
| |
Occupancy % (12) | | 97.1 | % | | 97.0 | % | | 96.7 | % | | 96.2 | % | | 94.8 | % | |
| TOTAL - PORTFOLIO | | | | | | | | | | | |
| Communities | | 339 |
| | 337 |
| | 233 |
| | 231 |
| | 251 |
| |
| % Community age restricted | | 33.3 | % | | 33.5 | % | | 26.2 | % | | 26.4 | % | | 25.9 | % | |
| Sites for development | | 10,504 |
| | 9,921 |
| | 7,181 |
| | 7,181 |
| | 7,749 |
| |
Developed sites (12) | | 100,778 |
| | 100,638 |
| | 79,763 |
| | 79,241 |
| | 83,825 |
| |
Occupied (12) | | 96,915 |
| | 96,689 |
| | 76,149 |
| | 75,310 |
| | 78,531 |
| |
Occupancy % (12) | | 96.2 | % | | 96.1 | % | | 95.5 | % | | 95.0 | % | | 93.7 | % | |
| | | | | | | | | | | | |
| TRANSIENT RV PORTFOLIO SUMMARY | | | | | | | | | | | |
| Location | | | | | | | | | | | |
| Florida | | 7,232 |
| | 6,990 |
| | 2,664 |
| | 2,823 |
| | 2,915 |
| |
| Michigan | | 203 |
| | 126 |
| | 150 |
| | 160 |
| | 165 |
| |
| Texas | | 1,446 |
| | 1,455 |
| | 799 |
| | 414 |
| | 864 |
| |
| California | | 478 |
| | 518 |
| | 296 |
| | 296 |
| | 296 |
| |
| Arizona | | 1,047 |
| | 1,055 |
| | 1,096 |
| | 1,087 |
| | 1,053 |
| |
| Ontario | | 1,485 |
| | 1,657 |
| | — |
| | — |
| | — |
| |
| Indiana | | 501 |
| | 501 |
| | 501 |
| | 501 |
| | 501 |
| |
| Ohio | | 194 |
| | 195 |
| | 213 |
| | 210 |
| | 237 |
| |
| Maine | | 556 |
| | 571 |
| | 575 |
| | 604 |
| | 605 |
| |
| New York | | 484 |
| | 483 |
| | 489 |
| | 499 |
| | 511 |
| |
| New Jersey | | 1,047 |
| | 1,084 |
| | 995 |
| | 981 |
| | 987 |
| |
| Other States | | 1,801 |
| | 1,864 |
| | 2,099 |
| | 2,092 |
| | 2,055 |
| |
| Total transient RV sites | | 16,474 |
| | 16,499 |
| | 9,877 |
| | 9,667 |
| | 10,189 |
| |
3rd Quarter 2016 Supplemental Information 18 Sun Communities, Inc.
Capital Improvements, Development, and Acquisitions
(amounts in thousands except for *)
|
| | | | | | | | | | | | | | | | | | | | | | | | |
| | Recurring | | | | | | | | | | |
| | Capital | Recurring | | | | | | | | |
| | Expenditures | Capital | Lot | | | Expansion & | Revenue |
| | | Average/Site* |
| Expenditures (13) | | Modifications (14) | | Acquisitions (15) | | Development (16) | | Producing (17) |
| 2014 | | $ | 227 |
| | $ | 18,077 |
| | $ | 9,414 |
| | $ | 785,624 |
| | $ | 22,196 |
| | $ | 1,454 |
|
| 2015 | | $ | 230 |
| | $ | 20,344 |
| | $ | 13,961 |
| | $ | 1,214,482 |
| | $ | 28,660 |
| | $ | 4,497 |
|
| YTD 2016 | | $ | 149 |
| | $ | 13,252 |
| | $ | 13,799 |
| | $ | 1,757,151 |
| | $ | 34,346 |
| | $ | 1,853 |
|
3rd Quarter 2016 Supplemental Information 19 Sun Communities, Inc.
Operating Statistics for Manufactured Homes and Annual/Seasonal RV’s
|
| | | | | | | | | | | | | | | |
| | Resident | Net Leased | New Home | Pre-owned | Brokered |
| MARKETS | Move-outs | Sites (18) | Sales | Home Sales | Re-sales |
| Michigan | | 326 |
| | 251 |
| | 6 |
| | 986 |
| | 112 |
|
| Florida | | 232 |
| | 494 |
| | 119 |
| | 229 |
| | 653 |
|
| Texas | | 106 |
| | 162 |
| | 9 |
| | 290 |
| | 39 |
|
| Indiana | | 44 |
| | 84 |
| | — |
| | 160 |
| | 5 |
|
| Ohio | | 80 |
| | 42 |
| | 1 |
| | 85 |
| | 4 |
|
| Arizona | | 37 |
| | 94 |
| | 26 |
| | 17 |
| | 93 |
|
| Colorado | | 8 |
| | 8 |
| | 15 |
| | 158 |
| | 32 |
|
| Other states | | 346 |
| | 250 |
| | 53 |
| | 256 |
| | 350 |
|
| YTD ended September 30, 2016 | | 1,179 |
| | 1,385 |
| | 229 |
| | 2,181 |
| | 1,288 |
|
|
| | | | | | | | | | | | | | | |
| | Resident | Net Leased | New Home | Pre-owned | Brokered |
| TOTAL FOR YEAR ENDED | Move-outs | Sites (18) | Sales | Home Sales | Re-sales |
| 2015 | | 1,344 |
| | 1,905 |
| | 273 |
| | 2,210 |
| | 1,244 |
|
| 2014 | | 1,504 |
| | 1,890 |
| | 113 |
| | 1,853 |
| | 618 |
|
|
| | | | | | |
| | Resident | | Resident | |
| PERCENTAGE TRENDS | Move-outs | | Re-sales | |
| YTD 2016 | | 1.9 | % | | 6.5 | % |
| 2015 | | 2.0 | % | | 5.9 | % |
| 2014 | | 2.6 | % | | 5.0 | % |
3rd Quarter 2016 Supplemental Information 20 Sun Communities, Inc.
Footnotes and Definitions
| |
| (1) | Investors in and analysts following the real estate industry utilize funds from operations (FFO), net operating income (NOI), and recurring earnings before interest, tax, depreciation and amortization (Recurring EBITDA) as supplemental performance measures. We believe FFO, NOI, and Recurring EBITDA are appropriate measures given their wide use by and relevance to investors and analysts. FFO, reflecting the assumption that real estate values rise or fall with market conditions, principally adjusts for the effects of GAAP depreciation/amortization of real estate assets. NOI provides a measure of rental operations and does not factor in depreciation/amortization and non-property specific expenses such as general and administrative expenses. Recurring EBITDA, a metric calculated as EBITDA exclusive of certain nonrecurring items, provides a further tool to evaluate ability to incur and service debt and to fund dividends and other cash needs. In addition, FFO, NOI, and Recurring EBITDA are commonly used in various ratios, pricing multiples/yields and returns and valuation calculations used to measure financial position, performance and value. |
FFO is defined by the National Association of Real Estate Investment Trusts (NAREIT) as net income (loss) computed in accordance with generally accepted accounting principles (GAAP), excluding gains (or losses) from sales of depreciable operating property, plus real estate-related depreciation and amortization, and after adjustments for unconsolidated partnerships and joint ventures. FFO is a non-GAAP financial measure that management believes is a useful supplemental measure of the Company's operating performance. Management generally considers FFO to be a useful measure for reviewing comparative operating and financial performance because, by excluding gains and losses related to sales of previously depreciated operating real estate assets, impairment and excluding real estate asset depreciation and amortization (which can vary among owners of identical assets in similar condition based on historical cost accounting and useful life estimates), FFO provides a performance measure that, when compared period over period, reflects the impact to operations from trends in occupancy rates, rental rates, and operating costs, providing perspective not readily apparent from net income (loss). Management believes that the use of FFO has been beneficial in improving the understanding of operating results of REITs among the investing public and making comparisons of REIT operating results more meaningful. FFO is computed in accordance with the Company's interpretation of standards established by NAREIT, which may not be comparable to FFO reported by other REITs that do not define the term in accordance with the current NAREIT definition or that interpret the current NAREIT definition differently than the Company. The Company also uses FFO excluding certain items, which excludes certain gain and loss items that management considers unrelated to the operational and financial performance of our core business. We believe that this provides investors with another financial measure of our operating performance that is more comparable when evaluating period over period results.
Because FFO excludes significant economic components of net income (loss) including depreciation and amortization, FFO should be used as an adjunct to net income (loss) and not as an alternative to net income (loss). The principal limitation of FFO is that it does not represent cash flow from operations as defined by GAAP and is a supplemental measure of performance that does not replace net income (loss) as a measure of performance or net cash provided by operating activities as a measure of liquidity. In addition, FFO is not intended as a measure of a REIT’s ability to meet debt principal repayments and other cash requirements, nor as a measure of working capital. FFO only provides investors with an additional performance measure that, when combined with measures computed in accordance with GAAP such as net income (loss), cash flow from operating activities, investing activities and financing activities, provide investors with an indication of our ability to service debt and to fund acquisitions and other expenditures. Other REITs may use different methods for calculating FFO, accordingly, our FFO may not be comparable to other REITs.
NOI is derived from revenues minus property operating expenses and real estate taxes. NOI does not represent cash generated from operating activities in accordance with GAAP and should not be considered to be an alternative to net income (loss) (determined in accordance with GAAP) as an indication of the Company's financial performance or to be an alternative to cash flow from operating activities (determined in accordance with GAAP) as a measure of the Company's liquidity; nor is it indicative of funds available for the Company's cash needs, including its ability to make cash distributions. The Company believes that net income (loss) is the most directly comparable GAAP measurement to NOI. Because of the inclusion of items such as interest, depreciation, and amortization, the use of net income (loss) as a performance measure is limited as these items may not accurately reflect the actual change in market value of a property, in the case of depreciation and in the case of interest, may not necessarily be linked to the operating performance of a real estate asset, as it is often incurred at a parent company level and not at a property level. The Company believes that NOI is helpful to investors as a measure of operating performance because it is an indicator of the return on property investment, and provides a method of comparing property performance over time. The Company uses NOI as a key management tool when evaluating performance and growth of particular properties and/or groups of properties. The principal limitation of NOI is that it excludes depreciation, amortization interest expense and non-property specific expenses such as general and administrative expenses, all of which are significant
3rd Quarter 2016 Supplemental Information 21 Sun Communities, Inc.
costs, therefore, NOI is a measure of the operating performance of the properties of the Company rather than of the Company overall.
EBITDA is defined as NOI plus other income, plus (minus) equity earnings (loss) from affiliates, minus general and administrative expenses. EBITDA includes EBITDA from discontinued operations. The Company believes that net income (loss) is the most directly comparable GAAP measurement to EBITDA.
FFO, NOI, and EBITDA do not represent cash generated from operating activities in accordance with GAAP and are not necessarily indicative of cash available to fund cash needs, including the repayment of principal on debt and payment of dividends and distributions. FFO, NOI, and EBITDA should not be considered as alternatives to net income (loss) (calculated in accordance with GAAP) for purposes of evaluating our operating performance, or cash flows (calculated in accordance with GAAP) as a measure of liquidity. FFO, NOI, and EBITDA as calculated by us may not be comparable to similarly titled, but differently calculated, measures of other REITs or to the definition of FFO published by NAREIT.
(2) The consideration amounts presented with respect to acquired communities represent the economic transaction and do not contemplate the fair value purchase accounting required by GAAP.
(3) This is a transferred asset transaction which has been classified as collateralized receivables and the cash received from this transaction has been classified as a secured borrowing. The interest income and interest expense accrue at the same rate/amount.
(4) These costs represent the first year expenses incurred to bring acquired properties up to the Company's operating standards, including items such as tree trimming and painting costs that do not meet the Company's capitalization policy. These costs are expected to become more significant in connection with the size of our acquisitions, and are therefore included as an adjustment to FFO in the three and nine months ended September 30, 2016. The Company incurred $0.5 million and $1.7 million of these first year expenses in the three and nine month periods ended September 30, 2015, respectively, and had a similar adjustment been made, FFO attributable to Sun Communities, Inc. common stockholders and dilutive convertible securities per share excluding certain items would have been $1.06 and $2.86 for the three and nine months ended September 30, 2015, respectively.
(5) The effect of certain anti-dilutive convertible securities is excluded from these items.
(6) The renter's monthly payment includes the site rent and an amount attributable to the leasing of the home. The site rent is reflected in Real Property NOI. For purposes of management analysis, the site rent is included in the Rental Program revenue to evaluate the incremental revenue gains associated with implementation of the Rental Program, and to assess the overall growth and performance of the Rental Program and financial impact on our operations.
(7) The coverage ratios are calculated using the trailing 12 months for the period ended and have been adjusted to exclude: depreciation and amortization; income taxes; interest expense; transaction costs; extinguishment of debt; income from affiliate transactions; gain on dispositions; and gain on settlement. See Statement of Operations on page 4 for detailed amounts.
(8) Three and nine months ended September 30, 2015 excludes $0.5 million and $1.7 million of first year expenses for properties acquired in late 2014 and 2015 incurred to bring the properties up to Sun's operating standards. These costs did not meet the Company's capitalization policy.
(9) Includes manufactured housing (MH) and annual/seasonal recreational vehicle (RV) sites, and excludes transient RV sites and recently completed but vacant expansion sites.
(10) Occupancy reflects current year gains from expansion sites and the conversion of transient RV guests to annual/seasonal RV contracts as vacant in 2015.
(11) Monthly base rent per site pertains to annual/seasonal RV sites and excludes transient RV sites.
(12) Includes MH and annual/seasonal RV sites, and excludes transient RV sites.
(13) Includes capital expenditures necessary to maintain asset quality, including purchasing and replacing assets used to operate the community. These capital expenditures include items such as: major road, driveway, and pool improvements; clubhouse
3rd Quarter 2016 Supplemental Information 22 Sun Communities, Inc.
renovations; adding or replacing street lights; playground equipment; signage; maintenance facilities; manager housing and property vehicles. The minimum capitalized amount is five hundred dollars.
(14) Includes capital expenditures which improve the asset quality of the community. These costs are incurred when an existing older home moves out, and the site is prepared for a new home, more often than not, a multi-sectional home. These activities which are mandated by strict manufacturer’s installation requirements and state building code include items such as new foundations, driveways, and utility upgrades.
(15) Acquisitions represent the purchase price of existing operating communities and land parcels to develop expansions or new communities. Acquisitions also include deferred maintenance identified during due diligence and those capital improvements necessary to bring the community up to Sun’s standards. These include items such as: upgrading clubhouses; landscaping; new street light systems; new mail delivery systems; pool renovation including larger decks, heaters, and furniture; new maintenance facilities; and new signage including main signs and internal road signs. These are considered acquisition costs and although identified during due diligence, they sometimes require up to twelve months after closing to complete.
(16) Expansion and development costs consist primarily of construction costs and costs necessary to complete home site improvements.
| |
| (17) | Capital costs related to revenue generating activities, consisting primarily of garages, sheds, and sub-metering of water, sewer and electricity. Revenue generating attractions at our RV resorts are also included here and, occasionally, a special capital project requested by residents and accompanied by an extra rental increase will be classified as revenue producing. |
(18) Net leased sites do not include occupied sites acquired in that year.
3rd Quarter 2016 Supplemental Information 23 Sun Communities, Inc.