NAREIT REIT Week Investor Forum June 2011
MAA’s Strategy Full Cycle Performance Objective - High quality recurring revenues - Lower volatility over full cycle - Secure and growing dividend Sunbelt Region Focus - Superior demand side performance - Competitive advantages to manage supply pressure Large and Secondary Market Focus - Full cycle performance profile - Create value in pricing & operating inefficiencies Outperform Local Market Norms - Strong property and asset management - Scope and sophistication of operating platform - Optimize people component Value Investor With Active Deal Flow - Extensive knowledge and market relationships - Due diligence and strong execution capabilities Disciplined Capital Deployment Protocols - Limited approach to new development - Forecasting discipline - IRR driven MAA | A BRIGHTER VIEW 2
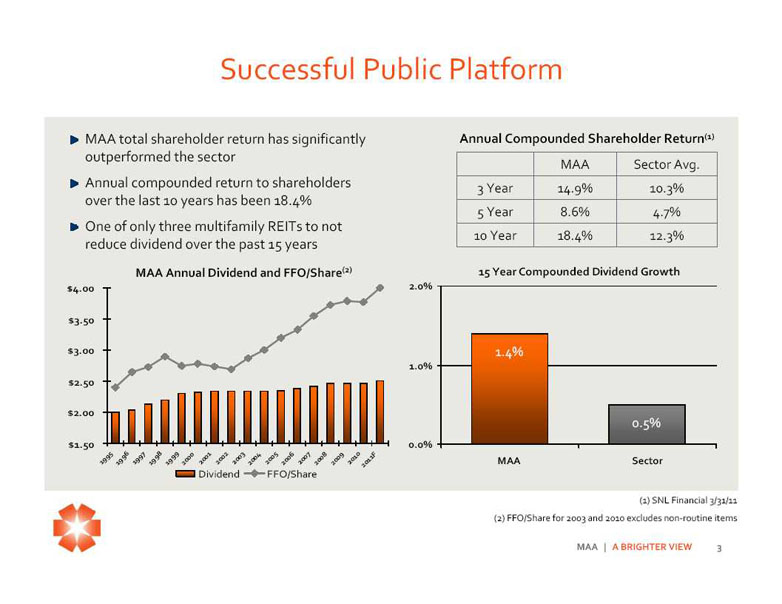
Successful Public Platform MAA total shareholder return has significantly Annual Compounded Shareholder Return(1) outperformed the sector MAA Sector Avg. Annual compounded return to shareholders 3 Year 14.9% 10.3% over the last 10 years has been 18.4% 5 Year 8.6% 4.7% One of only three multifamily REITs to not 10 Year 18.4% 12.3% reduce dividend over the past 15 years MAA Annual Dividend and FFO/Share (2) 15 Year Compounded Dividend Growth $4.00 2.0% $3.50 $3.00 1.4% 1.0% $2.50 $2.00 0.5% $1.50 0.0% 1995199 6 19 971998 1999200 0 2 001 2002 20032 004 2005 2006 2007 2 008 2009 20102011F MAA Sector Dividend FFO/Share (1) SNL Financial 3/31/11 (2) FFO/Share for 2003 and 2010 excludes non‐ routine items MAA | A BRIGHTER VIEW 3

Outperforming Sector Over Full Cycle Better full cycle performance, with lower volatility, drives stronger and more consistent long‐ term performance for MAA shareholders Repositioned portfolio 2004‐ 2011F and strengthened NOI Std Dev platform = stronger “up” cycle performance profile MAA 2.6% 3.2% 8% Sector 2.2% 4.3% 6% 4% Growth 2% 0% NOI ‐ 2% ‐ 4% ‐ 6% ‐ 8% 2000 2002 2004 2006 2008 2010 Sector Average MAA Source: Greenstreet Advisors Residential Sector Update 3‐ 2‐ 11 and company filings MAA | A BRIGHTER VIEW 4
Well Positioned for Recovery Cycle Pro‐ business environment MAA Market Diversification More access to lower cost labor -“Right to Work” region Strong distribution and logistics structure Positive demographic flow Lower cost of living Lower taxes -No state income taxes in TX, TN, FL Higher job growth and household formation trends Import/export and port activities expected to significantly grow MAA | A BRIGHTER VIEW 5

Well Positioned for Recovery Cycle Employment growth in MAA’s markets expected to outpace the national average and the major institutional markets . Annual Employment Growth 4.0% Annual Compounded 3.5% Employment Growth 3.0% (2011 ‐ 2014): 2.5% All MAA Markets: 2.8% 2.0% National MSA Average: 2.3% 1.5% 1.0% 0.5% 0.0% 2010 2011 2012 2013 2014 National MSA Average MAA Large Markets MAA Secondary Markets Major Institutional Markets Note: Approximately 80% of the entire Apartment REIT Sector portfolio is located in the Major Institutional Markets group considered above . Source: Moody’s economy .com MAA | A BRIGHTER VIEW 6

Well Positioned for Recovery Cycle Multifamily Completions According to REIS, for the U.S. Projected % Drop in as a whole, average annual Average Average Average completions from 2011‐ 2015 are expected to drop 39%. 1999‐ 2010 2011‐ 2015 Annual Supply All MAA 67,265 29,509 56.1% In MAA’s markets, this drop is Markets expected to exceed 56% and Large MAA near 59% in MAA’s large 56,325 23,270 58.7% Markets markets . Secondary MAA 10,940 6,239 43.0% Markets The greatest regional drop is expected to occur in the Southwest region (primarily U.S. 129,790 78,965 39.2% Texas), at 64%. West 33,328 24,791 25.6% Northeast 12,300 8,445 31.3% Midwest 12,447 9,506 23.6% South Atlantic 41,724 25,415 39.1% Southwest 29,991 10,808 64.0% Source: REIS MAA | A BRIGHTER VIEW 7
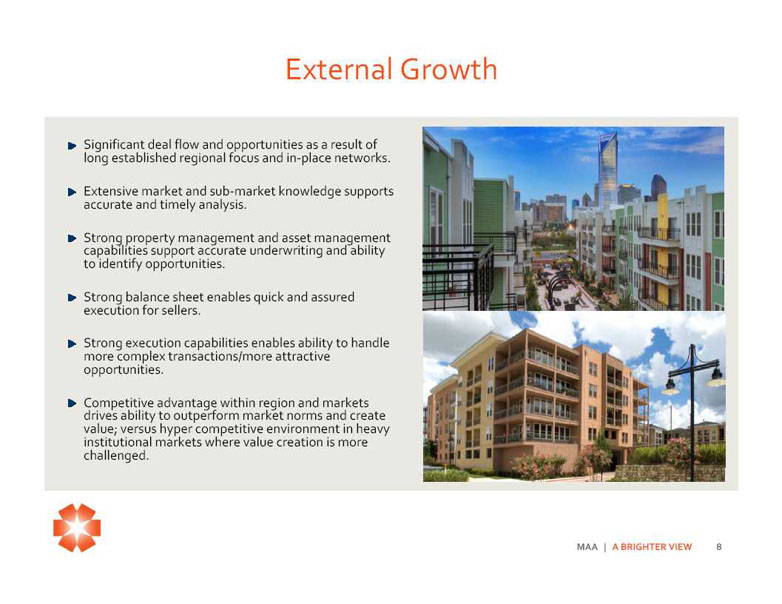
External Growth Significant deal flow and opportunities as a result of long established regional focus and in‐ place networks . Extensive market and sub‐ market knowledge supports accurate and timely analysis . Strong property management and asset management capabilities support accurate underwriting and ability to identify opportunities . Strong balance sheet enables quick and assured execution for sellers. Strong execution capabilities enables ability to handle more complex transactions/more attractive opportunities . Competitive advantage within region and markets drives ability to outperform market norms and create value; versus hyper competitive environment in heavy institutional markets where value creation is more challenged . MAA | A BRIGHTER VIEW 8
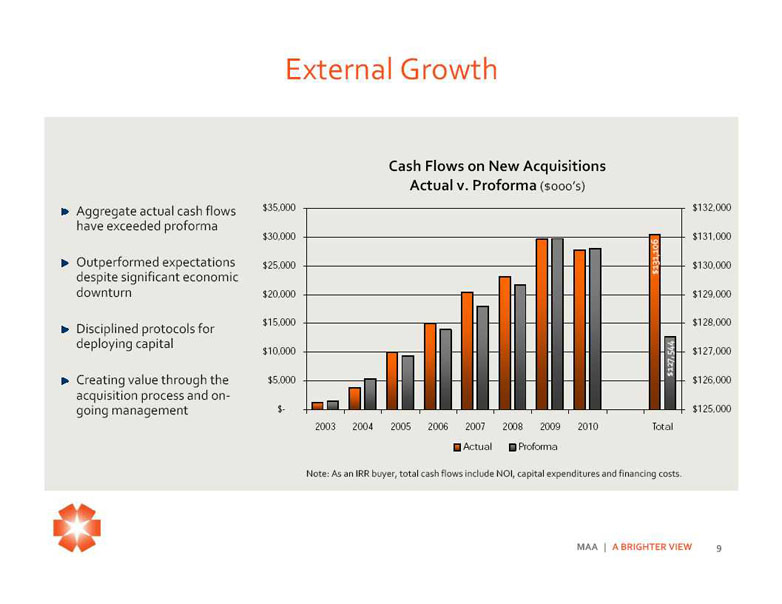
External Growth Cash Flows on New Acquisitions Actual v. Proforma ($000’s) Aggregate actual cash flows $35,000 $132,000 have exceeded proforma $30,000 $131,000 Outperformed expectations $25,000 131,106 $130,000 despite significant economic $ downturn $20,000 $129,000 $15,000 $128,000 Disciplined protocols for deploying capital $10,000 127,544 $127,000 Creating value through the $5,000 $ $126,000 acquisition process and ongoing management $- $125,000 2003 2004 2005 2006 2007 2008 2009 2010 Total Actual Proforma Note: As an IRR buyer, total cash flows include NOI, capital expenditures and financing costs. MAA | A BRIGHTER VIEW 9
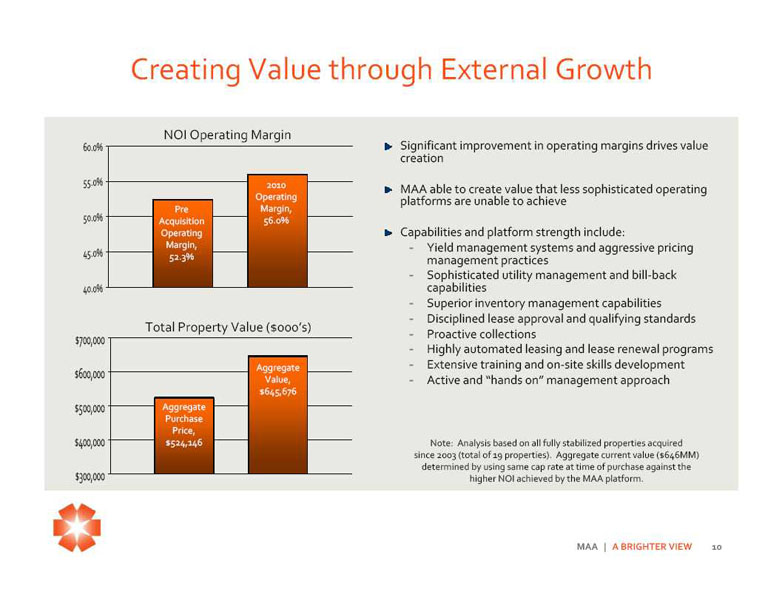
Creating Value through External Growth NOI Operating Margin 60.0% Significant improvement in operating margins drives value creation 55.0% 2010 MAA able to create value that less sophisticated operating Operating platforms are unable to achieve Pre Margin, 50.0% Acquisition 56.0% Operating Capabilities and platform strength include: Margin, - Yield management systems and aggressive pricing 45.0% 52.3% management practices - Sophisticated utility management and bill‐ back 40.0% capabilities - Superior inventory management capabilities - Disciplined lease approval and qualifying standards Total Property Value ($000’s) $700,000 - Proactive collections - Highly automated leasing and lease renewal programs Aggregate - Extensive training and on‐ site skills development $600,000 Value, - Active and “hands on” management approach $645,676 $500,000 Aggregate Purchase Price, $400,000 $524,146 Note: Analysis based on all fully stabilized properties acquired since 2003 (total of 19 properties) . Aggregate current value ($646MM) determined by using same cap rate at time of purchase against the $300,000 higher NOI achieved by the MAA platform. MAA | A BRIGHTER VIEW 10
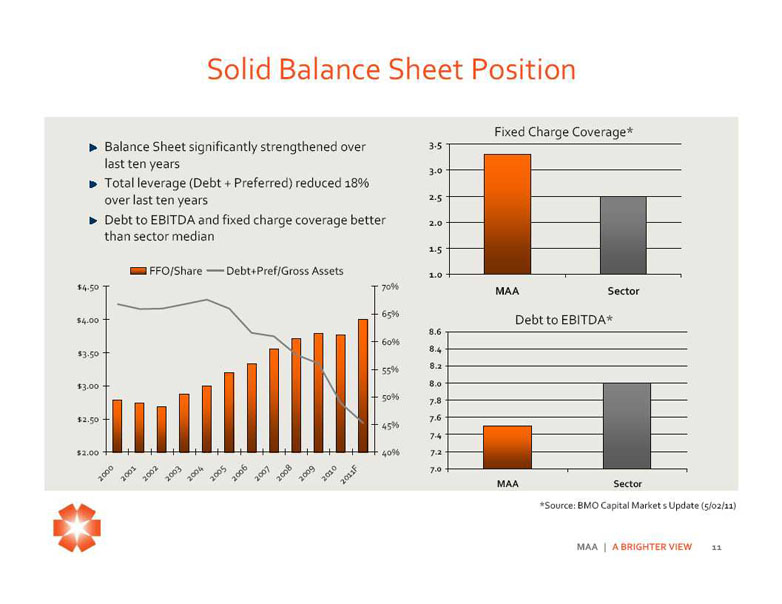
Solid Balance Sheet Position Fixed Charge Coverage* Balance Sheet significantly strengthened over 3.5 last ten years 3.0 Total leverage (Debt + Preferred) reduced 18% over last ten years 2.5 Debt to EBITDA and fixed charge coverage better 2.0 than sector median 1.5 FFO/Share Debt+Pref/Gross Assets 1.0 $4.50 70% MAA Sector 65% $4.00 Debt to EBITDA* 8.6 60% 8.4 $3.50 8.2 55% $3.00 8.0 50% 7.8 $2.50 7.6 45% 7.4 $2.00 40% 7.2 0 7.0 2 00 20 01 2 002 20 03 2 004 20 05 2 006 20 07 2 008 2 009 20102011F MAA Sector *Source: BMO Capital Market s Update (5/02/11) MAA | A BRIGHTER VIEW 11
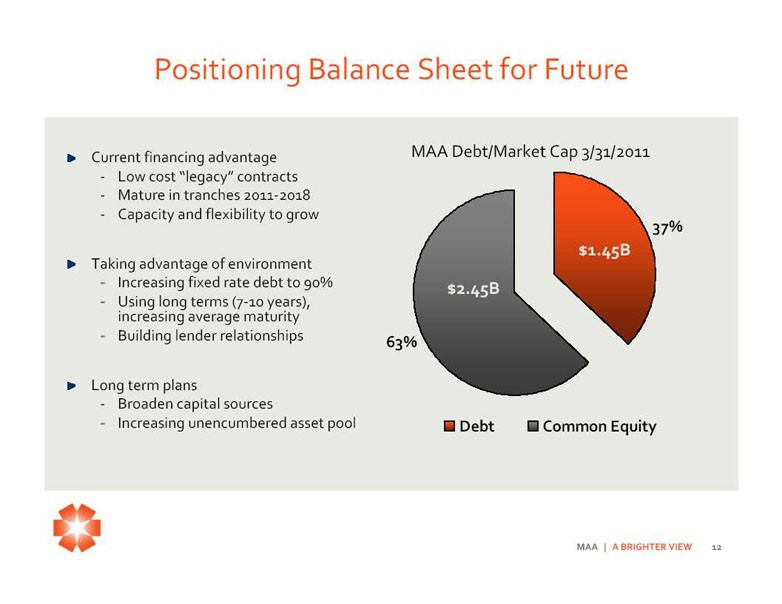
Positioning Balance Sheet for Future Current financing advantage MAA Debt/Market Cap 3/31/2011 ‐Low cost “legacy” contracts ‐Mature in tranches 2011‐ 2018 ‐Capacity and flexibility to grow 37% $1.45B Taking advantage of environment -Increasing fixed rate debt to 90% $2.45B -Using long terms (7‐ 10 years), increasing average maturity -Building lender relationships 63% Long term plans ‐Broaden capital sources -Increasing unencumbered asset pool Debt Common Equity MAA | A BRIGHTER VIEW 12

Attractive Pricing Opportunity MAA is currently priced at an implied cap rate discount to the sector average . However, MAA’s historical long‐ term internal same store growth (and overall FFO growth) performance exceeds the sector average; established record of exceeding regional ‘market’ performance levels and sector ‘averages’ . Outlook for continued ‘out‐ performance’ is positive . Total Implied Unleveraged Return 9.0% Implied 10 Year IRR: 8.0% MAA outperforms by 100 bps on 7.0% 2.6% unleveraged basis with continued 6.0% 2.2% cap rate discount . 5.0% MAA outperforms by 180 bps on 4.0% a leveraged basis. 3.0% 5.5% 4.9% MAA outperforms by 320 bps on 2.0% a leveraged basis by capturing 1.0% the sector’s current average cap 0.0% rate. Sector Average MAA Market Implied Cap Rate Same Store Growth Source: Cap rate data from BMO Capital Markets Update (5/02/11) and same store data from Green Street Mar ’11 Residential Sector Update and company filings (last full cycle 2004‐ 2011). MAA | A BRIGHTER VIEW 13
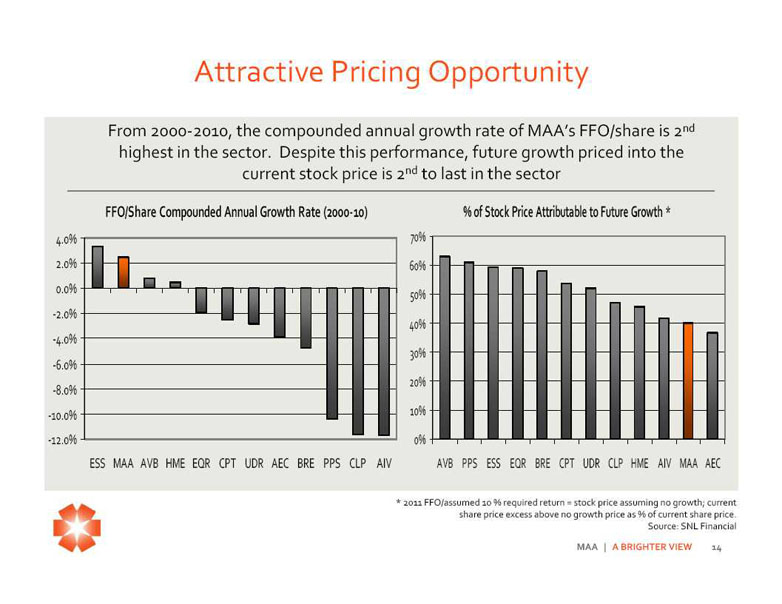
Attractive Pricing Opportunity From 2000 ‐ 2010, the compounded annual growth rate of MAA’s FFO/share is 2nd highest in the sector . Despite this performance, future growth priced into the current stock price is 2nd to last in the sector FFO/Share Compounded Annual Growth Rate (2000‐ 10) % of Stock Price Attributable to Future Growth * 4.0% 70% 2.0% 60% 0.0% 50% ‐ 2.0% 40% ‐ 4.0% 30% ‐ 6.0% 20% ‐ 8.0% ‐ 10.0% 10% ‐ 12.0% 0% ESS MAA AVB HME EQR CPT UDR AEC BRE PPS CLP AIV AVB PPS ESS EQR BRE CPT UDR CLP HME AIV MAA AEC * 2011 FFO/assumed 10 % required return = stock price assuming no growth; current share price excess above no growth price as % of current share price. Source: SNL Financial MAA | A BRIGHTER VIEW 14
Summary Unique strategy with proven long‐ term performance Established and proven public platform Solid internal growth prospects Competitive strengths enables regional outperformance Disciplined approach to capital deployment Solid balance sheet position Well positioned to perform as compared to the sector Attractive buying opportunity MAA | A BRIGHTER VIEW 15

End of Presentation Certain matters in this presentation may constitute forward ‐ looking statements within the meaning of Section 27‐ A of the Securities Act of 1933 and Section 21E of the Securities and Exchange Act of 1934. Such statements include, but are not limited to, statements made about anticipated economic and market conditions, expectations for future demographics, the impact of competition, general changes in the apartment industry, expectations for acquisition and joint venture performance, ability to pay dividends and the ability to obtain financing at reasonable rates. Actual results and the timing of certain events could differ materially from those projected in or contemplated by the forward ‐ looking statements due to a number of factors, including a downturn in general economic conditions or the capital markets, competitive factors including overbuilding or other supply/demand imbalances in some or all of our markets, changes in interest rates and other items that are difficult to control such as the impact of legislation, as well as the other general risks inherent in the apartment and real estate businesses . Reference is hereby made to the filings of Mid‐ America Apartment Communities, Inc., with the Securities and Exchange Commission, including quarterly reports on Form 10‐ Q, reports on Form 8‐ K, and its annual report on Form 10‐ K, particularly including the risk factors contained in the latter filing. Eric Bolton Al Campbell Leslie Wolfgang Jennifer Patrick CEO CFO External Reporting Investor Relations 901‐ 248‐ 4127 901‐ 248‐ 4169 901‐ 248‐ 4126 901‐ 435‐ 5371 eric.bolton@maac .com al.campbell@maac .com leslie.wolfgang@maac .com jennifer .patrick@maac .com http://ir .maac .com 16