
Capital Markets Update January 2012
MAA | A BRIGHTER VIEW 2 MAA’s Strategy • Full Cycle Performance Objective - Establish high quality recurring cash flow - Capture lower volatility over full cycle - Platform supporting a secure and growing dividend • Sunbelt Region Focus - Superior demand side performance - Competitive advantages to manage supply pressure • Large and Secondary Market Strategy - Full cycle performance profile - Create value in pricing & operating inefficiencies • Create Competitive Advantage - Outperform local market norms - Strong property and asset management - Scope and sophistication of operating platform - Optimize people component • Value Investor With Active Deal Flow - Extensive knowledge and market relationships - Due diligence and strong execution capabilities • Disciplined Capital Deployment Protocols - Forecasting discipline - IRR driven - Emphasis on value - buyer approach
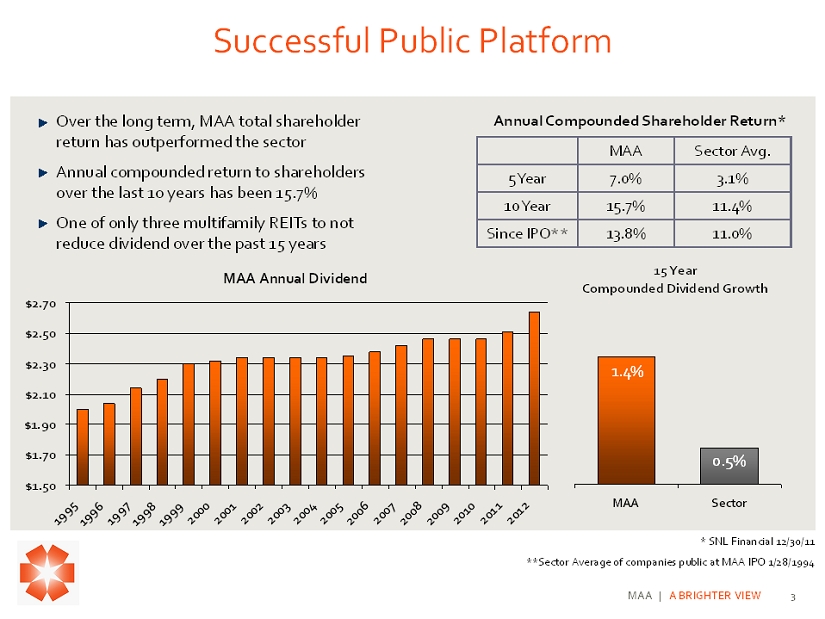
MAA | A BRIGHTER VIEW 3 Successful Public Platform MAA Annual Dividend $1.50 $1.70 $1.90 $2.10 $2.30 $2.50 $2.70 1995 1996 1997 19981999 200020012002200320042005 2006 2007 20082009 2010 20112012 Over the long term, MAA total shareholder return has outperformed the sector Annual compounded return to shareholders over the last 10 years has been 15.7% One of only three multifamily REITs to not reduce dividend over the past 15 years * SNL Financial 12/30/11 **Sector Average of companies public at MAA IPO 1/28/1994 MAA Sector Avg. 5 Year 7.0% 3.1% 10 Year 15.7% 11.4% Since IPO** 13.8% 11.0% Annual Compounded Shareholder Return* 15 Year Compounded Dividend Growth MAA Sector 1.4% 0.5%
MAA | A BRIGHTER VIEW 4 Strong Performance Outlook At A Compelling Value • Positioned To Deliver Robust Internal Growth Through The Recovery Cycle – Job growth outlook and household formation trends ahead of national trends – New supply outlook very manageable relative to demand; strong positive absorption – Unit renovation and property repositioning opportunities further support pricing opportunity • Positioned To Deliver Robust External Growth – MAA positioned to capture strong deal flow and value opportunities – New development projects in 2012/13 will deliver further new growth – Meaningful upside from active transaction activity in 2010/11 • Balance Sheet In Strong Position – Leverage and coverage ratios in very good shape – New unsecured credit facility positions company for enhanced capital access
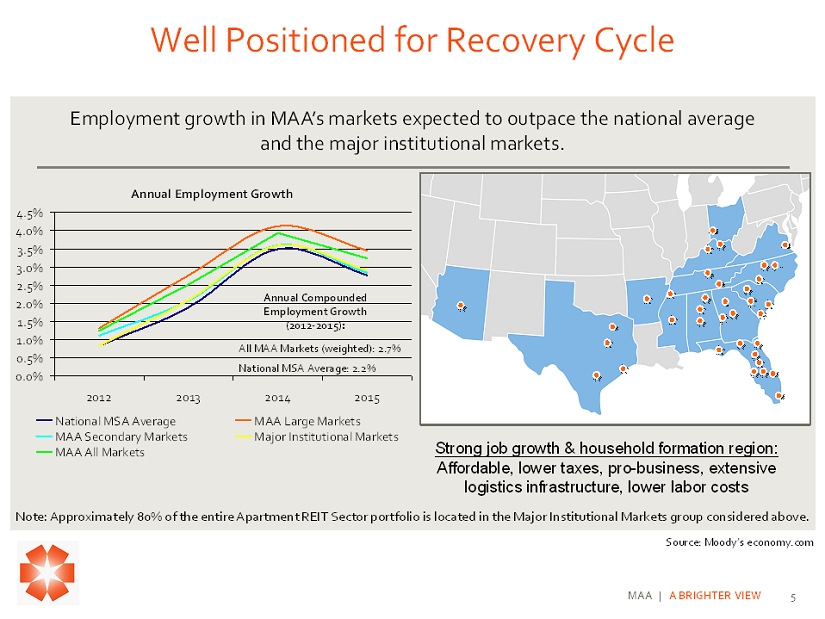
MAA | A BRIGHTER VIEW 5 Well Positioned for Recovery Cycle Employment growth in MAA’s markets expected to outpace the national average and the major institutional markets. Note: Approximately 80% of the entire Apartment REIT Sector portfolio is located in the Major Institutional Markets group con sid ered above. Source: Moody’s economy.com Annual Compounded Employment Growth (2012 - 2015): All MAA Markets (weighted): 2.7% National MSA Average: 2.2% Annual Employment Growth 0.0% 0.5% 1.0% 1.5% 2.0% 2.5% 3.0% 3.5% 4.0% 4.5% 2012 2013 2014 2015 National MSA Average MAA Large Markets MAA Secondary Markets Major Institutional Markets MAA All Markets Strong job growth & household formation region: Affordable, lower taxes, pro - business, extensive logistics infrastructure, lower labor costs
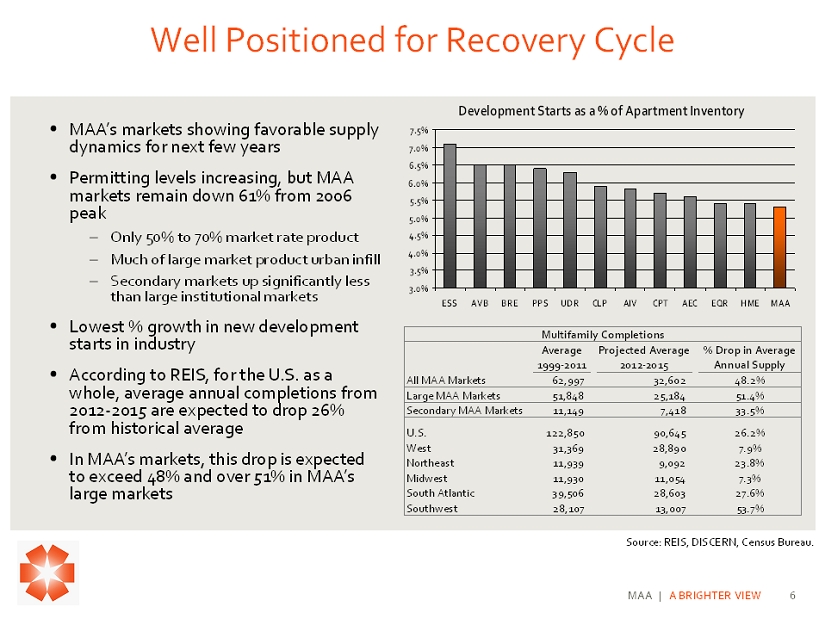
MAA | A BRIGHTER VIEW 6 Well Positioned for Recovery Cycle • MAA’s markets showing favorable supply dynamics for next few years • Permitting levels increasing, but MAA markets remain down 61% from 2006 peak – Only 50% to 70% market rate product – Much of large market product urban infill – Secondary markets up significantly less than large institutional markets • Lowest % growth in new development starts in industry • According to REIS, for the U.S. as a whole, average annual completions from 2012 - 2015 are expected to drop 26% from historical average • In MAA’s markets, this drop is expected to exceed 48% and over 51% in MAA’s large markets Source: REIS, DISCERN, Census Bureau. Average Projected Average % Drop in Average 1999-2011 2012-2015 Annual Supply All MAA Markets 62,997 32,602 48.2% Large MAA Markets 51,848 25,184 51.4% Secondary MAA Markets 11,149 7,418 33.5% U.S. 122,850 90,645 26.2% West 31,369 28,890 7.9% Northeast 11,939 9,092 23.8% Midwest 11,930 11,054 7.3% South Atlantic 39,506 28,603 27.6% Southwest 28,107 13,007 53.7% Multifamily Completions Development Starts as a % of Apartment Inventory 3.0% 3.5% 4.0% 4.5% 5.0% 5.5% 6.0% 6.5% 7.0% 7.5% ESS AVB BRE PPS UDR CLP AIV CPT AEC EQR HME MAA
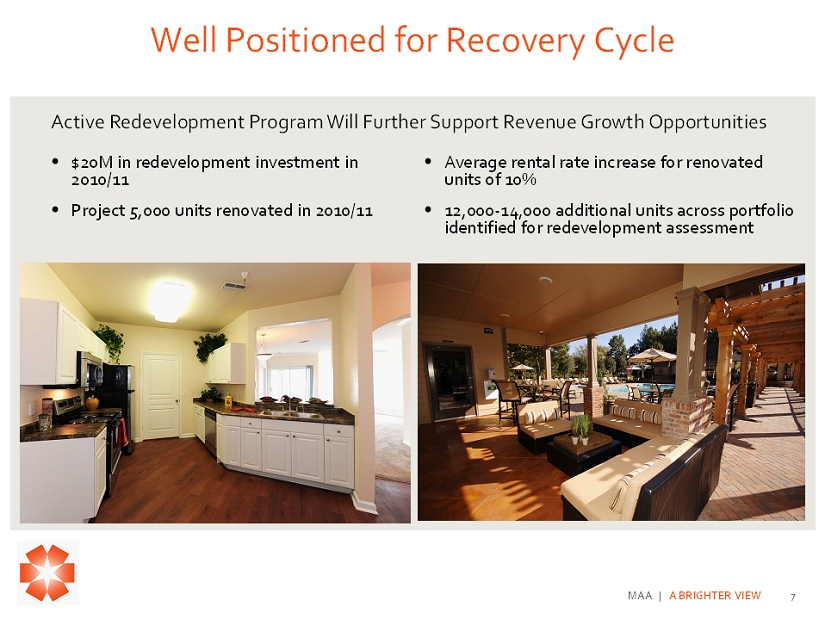
MAA | A BRIGHTER VIEW 7 Well Positioned for Recovery Cycle Active Redevelopment Program Will Further Support Revenue Growth Opportunities • $20M in redevelopment investment in 2010/11 • Project 5,000 units renovated in 2010/11 • Average rental rate increase for renovated units of 10% • 12,000 - 14,000 additional units across portfolio identified for redevelopment assessment
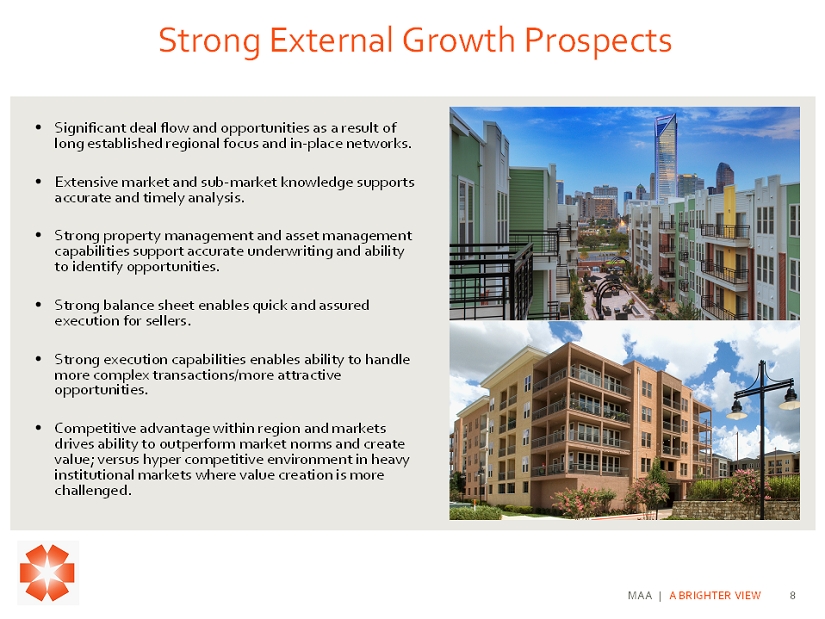
MAA | A BRIGHTER VIEW 8 Strong External Growth Prospects • Significant deal flow and opportunities as a result of long established regional focus and in - place networks. • Extensive market and sub - market knowledge supports accurate and timely analysis. • Strong property management and asset management capabilities support accurate underwriting and ability to identify opportunities. • Strong balance sheet enables quick and assured execution for sellers. • Strong execution capabilities enables ability to handle more complex transactions/more attractive opportunities. • Competitive advantage within region and markets drives ability to outperform market norms and create value; versus hyper competitive environment in heavy institutional markets where value creation is more challenged.
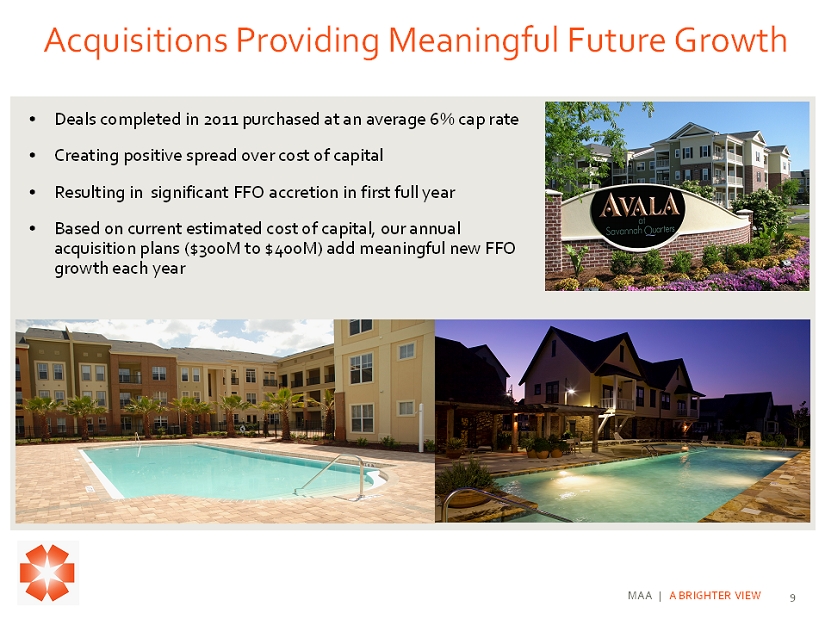
MAA | A BRIGHTER VIEW 9 Acquisitions Providing Meaningful Future Growth • Deals completed in 2011 purchased at an average 6% cap rate • Creating positive spread over cost of capital • Resulting in significant FFO accretion in first full year • Based on current estimated cost of capital, our annual acquisition plans ($300M to $400M) add meaningful new FFO growth each year
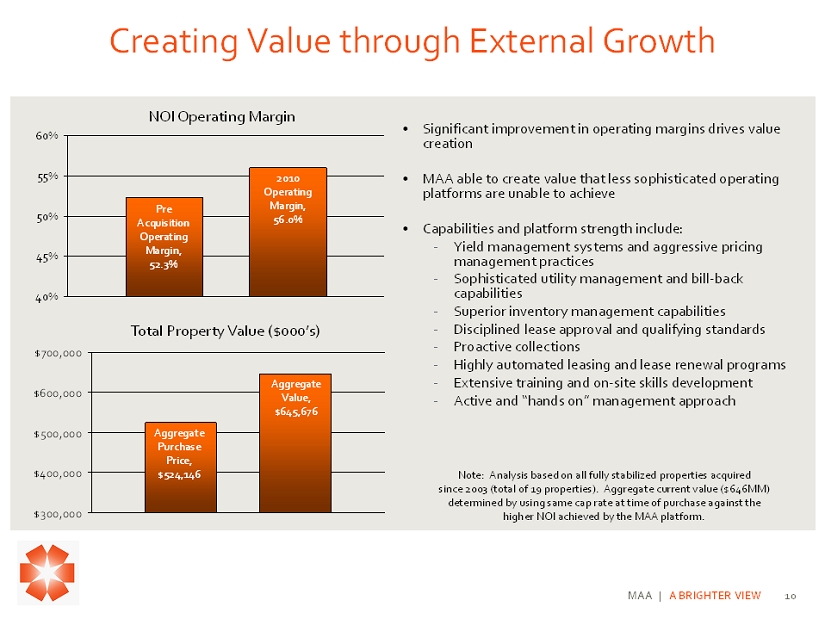
MAA | A BRIGHTER VIEW 10 Creating Value through External Growth • Significant improvement in operating margins drives value creation • MAA able to create value that less sophisticated operating platforms are unable to achieve • Capabilities and platform strength include: - Yield management systems and aggressive pricing management practices - Sophisticated utility management and bill - back capabilities - Superior inventory management capabilities - Disciplined lease approval and qualifying standards - Proactive collections - Highly automated leasing and lease renewal programs - Extensive training and on - site skills development - Active and “hands on” management approach Note: Analysis based on all fully stabilized properties acquired since 2003 (total of 19 properties). Aggregate current value ($646MM) determined by using same cap rate at time of purchase against the higher NOI achieved by the MAA platform. NOI Operating Margin 40% 45% 50% 55% 60% Pre Acquisition Operating Margin, 52.3% 2010 Operating Margin, 56.0% $300,000 $400,000 $500,000 $600,000 $700,000 Total Property Value ($000’s) Aggregate Purchase Price, $524,146 Aggregate Value, $645,676
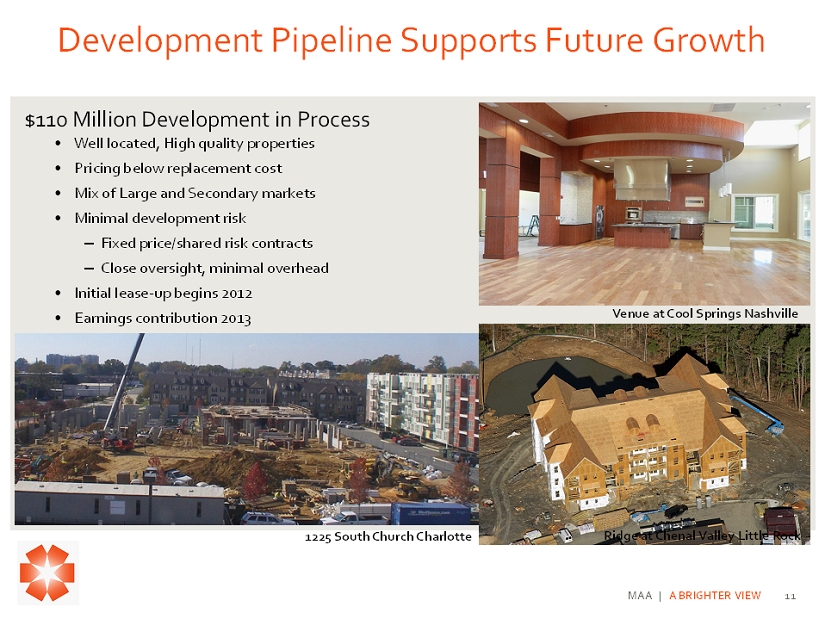
MAA | A BRIGHTER VIEW 11 1225 South Church Charlotte Ridge at Chenal Valley Little Rock Venue at Cool Springs Nashville Development Pipeline Supports Future Growth • Well located, High quality properties • Pricing below replacement cost • Mix of Large and Secondary markets • Minimal development risk – Fixed price/shared risk contracts – Close oversight, minimal overhead • Initial lease - up begins 2012 • Earnings contribution 2013 $110 Million Development in Process
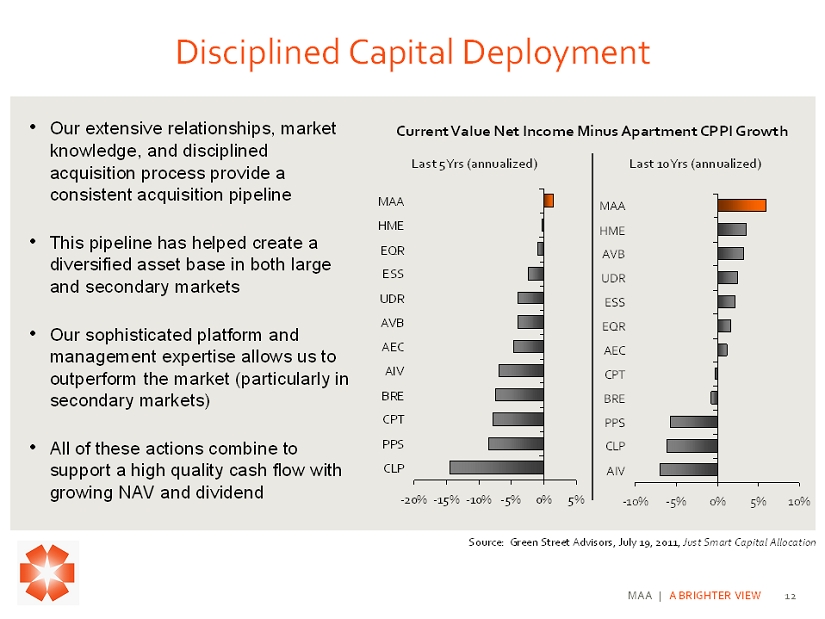
MAA | A BRIGHTER VIEW 12 Disciplined Capital Deployment -20%-15%-10% -5% 0% 5% MAA HME EQR ESS UDR AVB AEC AIV BRE CPT PPS CLP Source: Green Street Advisors, July 19, 2011, Just Smart Capital Allocation • Our extensive relationships, market knowledge, and disciplined acquisition process provide a consistent acquisition pipeline • This pipeline has helped create a diversified asset base in both large and secondary markets • Our sophisticated platform and management expertise allows us to outperform the market (particularly in secondary markets) • All of these actions combine to support a high quality cash flow with growing NAV and dividend -10% -5% 0% 5% 10% MAA HME AVB UDR ESS EQR AEC CPT BRE PPS CLP AIV Current Value Net Income Minus Apartment CPPI Growth Last 5 Yrs (annualized) Last 10 Yrs (annualized)

MAA | A BRIGHTER VIEW 13 Disciplined Capital Deployment • Aggregate actual cash flows have exceeded proforma • Outperformed expectations despite significant economic downturn • Disciplined protocols for deploying capital • Creating value through the acquisition process and on - going management Note: As an IRR buyer, total cash flows include NOI, capital expenditures and financing costs. Cash Flows on New Acquisitions Actual vs. Proforma ($000's) $170,860 $164,650 $- $5,000 $10,000 $15,000 $20,000 $25,000 $30,000 $35,000 $40,000 2003 2004 2005 2006 2007 2008 2009 2010 2011YTD Total to Date $125,000 $130,000 $135,000 $140,000 $145,000 $150,000 $155,000 $160,000 $165,000 $170,000 $175,000 Actual Proforma
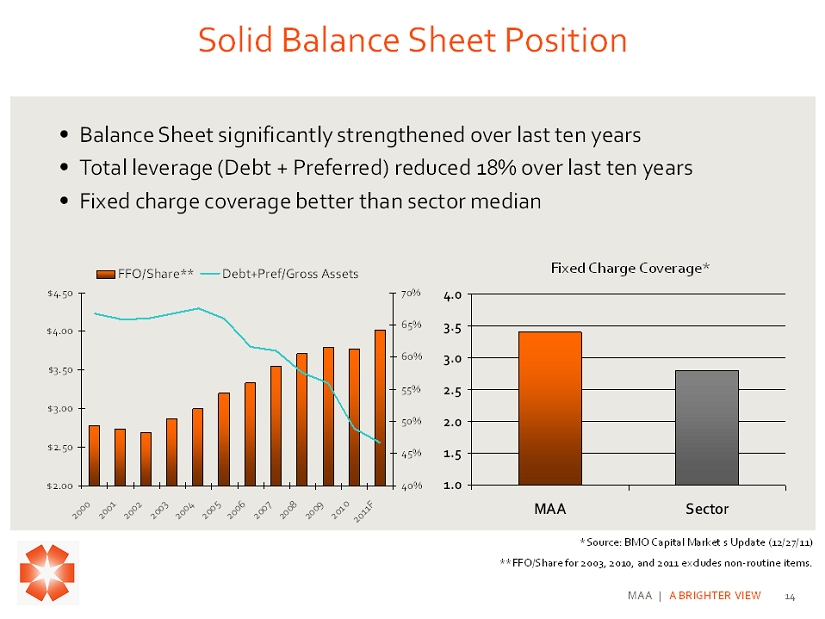
MAA | A BRIGHTER VIEW 14 Solid Balance Sheet Position • Balance Sheet significantly strengthened over last ten years • Total leverage (Debt + Preferred) reduced 18% over last ten years • Fixed charge coverage better than sector median 1.0 1.5 2.0 2.5 3.0 3.5 4.0 MAA Sector *Source: BMO Capital Market s Update (12/27/11) **FFO/Share for 2003, 2010, and 2011 excludes non - routine items. Fixed Charge Coverage* $2.00 $2.50 $3.00 $3.50 $4.00 $4.50 2000 2001 2002 2003 2004 2005 2006 2007 20082009 2010 2011F 40% 45% 50% 55% 60% 65% 70% FFO/Share** Debt+Pref/Gross Assets
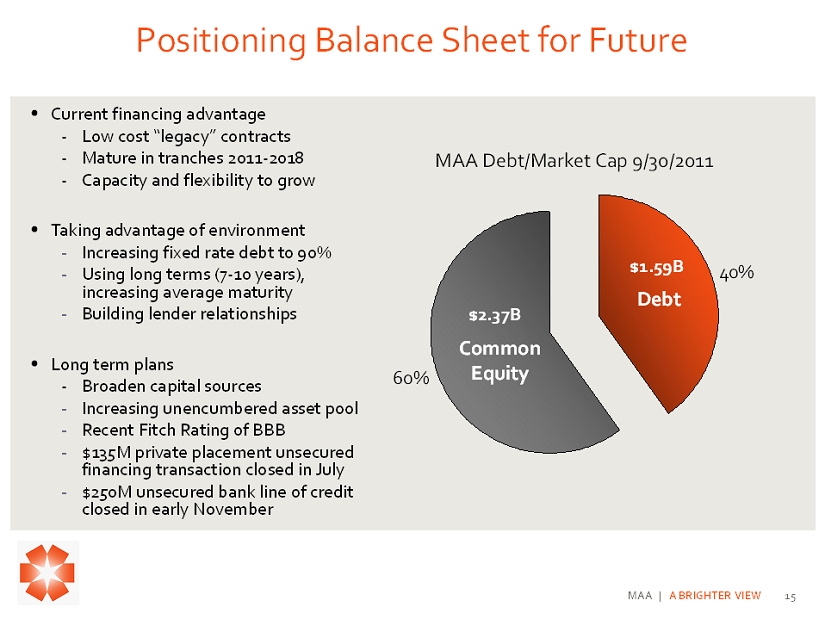
MAA | A BRIGHTER VIEW 15 Positioning Balance Sheet for Future • Current financing advantage - Low cost “legacy” contracts - Mature in tranches 2011 - 2018 - Capacity and flexibility to grow • Taking advantage of environment - Increasing fixed rate debt to 90% - Using long terms (7 - 10 years), increasing average maturity - Building lender relationships • Long term plans - Broaden capital sources - Increasing unencumbered asset pool - Recent Fitch Rating of BBB - $135M private placement unsecured financing transaction closed in July - $250M unsecured bank line of credit closed in early November MAA Debt/Market Cap 9/30/2011 60% 40% $2.37B $1.59B Debt Common Equity
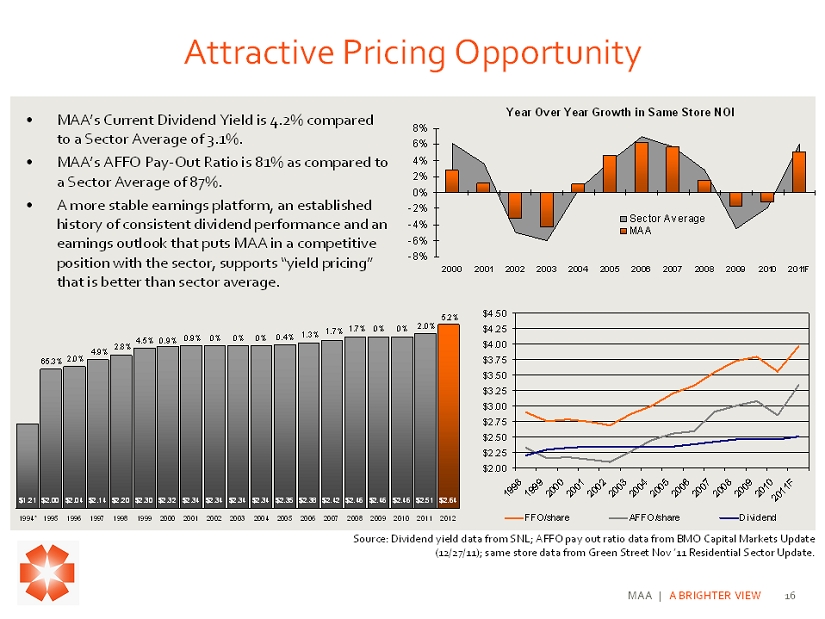
MAA | A BRIGHTER VIEW 16 Attractive Pricing Opportunity • MAA’s Current Dividend Yield is 4.2% compared to a Sector Average of 3.1%. • MAA’s AFFO Pay - Out Ratio is 81% as compared to a Sector Average of 87%. • A more stable earnings platform, an established history of consistent dividend performance and an earnings outlook that puts MAA in a competitive position with the sector, supports “yield pricing” that is better than sector average. -8% -6% -4% -2% 0% 2% 4% 6% 8% 2000 2001 2002 2003 2004 2005 2006 2007 2008 2009 2010 2011F Sector Average MAA Year Over Year Growth in Same Store NOI $2.00 $2.25 $2.50 $2.75 $3.00 $3.25 $3.50 $3.75 $4.00 $4.25 $4.50 1998199920002001200220032004200520062007200820092010 2011F FFO/share AFFO/share Dividend $2.64$2.51$2.46$2.46$2.46$2.42$2.38$2.35$2.34$2.34$2.34$2.34$2.32$2.30$2.20$2.14$2.04$2.00$1.21 65.3% 2.0% 4.9% 2.8% 4.5% 0.9% 0.9% 0% 0% 0% 0.4% 1.3% 1.7% 1.7% 0% 0% 2.0% 5.2% 2012201120102009200820072006200520042003200220012000199919981997199619951994* Source: Dividend yield data from SNL; AFFO pay out ratio data from BMO Capital Markets Update (12/27/11); same store data from Green Street Nov ’11 Residential Sector Update.
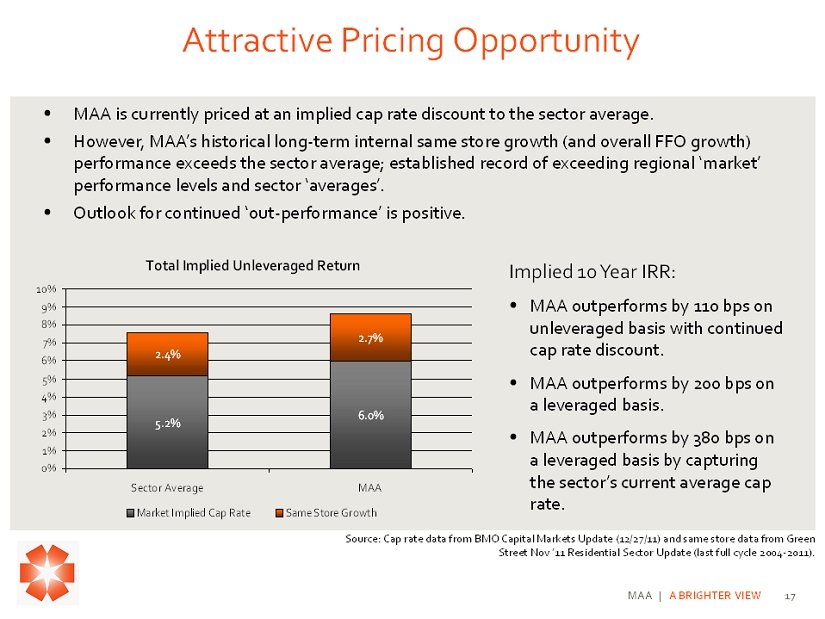
MAA | A BRIGHTER VIEW 17 Attractive Pricing Opportunity • MAA is currently priced at an implied cap rate discount to the sector average. • However, MAA’s historical long - term internal same store growth (and overall FFO growth) performance exceeds the sector average; established record of exceeding regional ‘market’ performance levels and sector ‘averages’. • Outlook for continued ‘out - performance’ is positive. Source: Cap rate data from BMO Capital Markets Update (12/27/11) and same store data from Green Street Nov ’11 Residential Sector Update (last full cycle 2004 - 2011). Implied 10 Year IRR: • MAA outperforms by 110 bps on unleveraged basis with continued cap rate discount. • MAA outperforms by 200 bps on a leveraged basis. • MAA outperforms by 380 bps on a leveraged basis by capturing the sector’s current average cap rate. Total Implied Unleveraged Return 5.2% 6.0% 2.4% 2.7% 0% 1% 2% 3% 4% 5% 6% 7% 8% 9% 10% Sector Average MAA Market Implied Cap Rate Same Store Growth
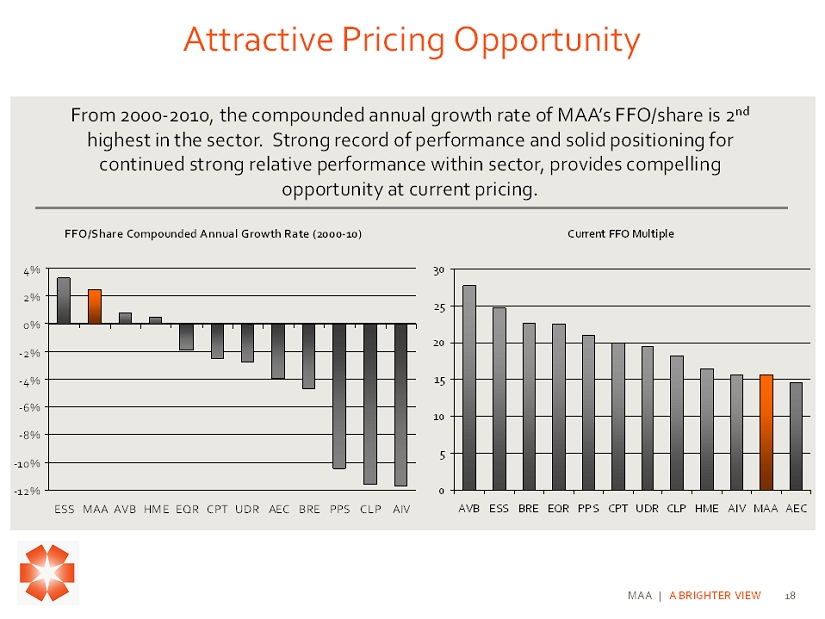
MAA | A BRIGHTER VIEW 18 From 2000 - 2010, the compounded annual growth rate of MAA’s FFO/share is 2 nd highest in the sector. Strong record of performance and solid positioning for continued strong relative performance within sector, provides compelling opportunity at current pricing. FFO/Share Compounded Annual Growth Rate (2000-10) -12% -10% -8% -6% -4% -2% 0% 2% 4% ESS MAAAVBHMEEQR CPT UDR AEC BRE PPS CLP AIV Attractive Pricing Opportunity Current FFO Multiple 0 5 10 15 20 25 30 AVB ESS BRE EQR PPS CPT UDR CLP HME AIV MAA AEC
MAA | A BRIGHTER VIEW 19 Summary • Strong long - term performance record for shareholders • Established and proven public platform • Solid internal growth prospects • Competitive strengths enables regional outperformance • Robust external growth pipeline • Disciplined approach to capital deployment • Solid balance sheet position • Well positioned to perform as compared to the sector • Attractive buying opportunity

20 Certain matters in this presentation may constitute forward - looking statements within the meaning of Section 27 - A of the Securit ies Act of 1933 and Section 21E of the Securities and Exchange Act of 1934. Such statements include, but are not limited to, statements made about anticipate d e conomic and market conditions, expectations for future demographics, the impact of competition, general changes in the apartment industry, expectations for acq uisition and joint venture performance, ability to pay dividends and the ability to obtain financing at reasonable rates. Actual results and the timing of certain events could differ materially from those projected in or contemplated by the forward - looking statements due to a number of factors, including a downturn in ge neral economic conditions or the capital markets, competitive factors including overbuilding or other supply/demand imbalances in some or all of our marke ts, changes in interest rates and other items that are difficult to control such as the impact of legislation, as well as the other general risks inherent in t he apartment and real estate businesses. Reference is hereby made to the filings of Mid - America Apartment Communities, Inc., with the Securities and Exchange Commission, including quarterly reports on Form 10 - Q, reports on Form 8 - K, and its annual report on Form 10 - K, particularly including the risk factors contained in the latter filing. End of Presentation Eric Bolton CEO 901 - 248 - 4127 eric.bolton@maac.com Al Campbell CFO 901 - 248 - 4169 al.campbell@maac.com Leslie Wolfgang External Reporting 901 - 248 - 4126 leslie.wolfgang@maac.com Jennifer Patrick Investor Relations 901 - 435 - 5371 jennifer.patrick@maac.com http://ir.maac.com