Exhibit 13
FFLC BANCORP, INC.
2004 ANNUAL REPORT
OUR MISSION
Our mission is to operate First Federal Savings Bank as a community bank, in a manner consistent with the high expectations of our stockholders, customers and employees. We will achieve attractive financial results for our stockholders, provide quality financial services and products to our customers, and offer rewarding careers to our employees, while maintaining a high level of personal service and integrity. The Company’s primary goals are to: provide an attractive return to its stockholders, as measured by long-term capital appreciation and the continued payment of reasonable dividends; provide a competitive, progressive and profitable array of financial services and products in a manner focused on excellent customer service; attract and retain highly-motivated, top-quality employees; and make a positive impact on the communities that we serve.
FORWARD-LOOKING STATEMENTS
The Private Securities Litigation Reform Act of 1995 evidences Congress’ determination that the disclosure of forward-looking information is desirable for investors and encourages such disclosure by providing a safe harbor for forward-looking statements by corporate management. This Annual Report, including the Letter to Stockholders and the Management’s Discussion and Analysis of Financial Condition and Results of Operations, contains forward-looking statements that involve risk and uncertainty. In order to comply with the terms of the safe harbor, the Company notes that a variety of factors could cause the Company’s actual results and experience to differ materially from the anticipated results or other expectations expressed in the Company’s forward-looking statements. The risks and uncertainties that may affect the operations, performance, development, growth projections and results of the Company’s business include, but are not limited to, the growth of the economy, interest rate movements, timely development by the Company of technology enhancements for its products and operating systems, the impact of competitive products, services and pricing, customer business requirements, Congressional legislation and similar matters. Readers of this report are cautioned not to place undue reliance on forward-looking statements which are subject to influence by the named risk factors and unanticipated future events. Actual results, accordingly, may differ materially from management expectations.
CONTENTS
Inside Cover
CORPORATE PROFILE
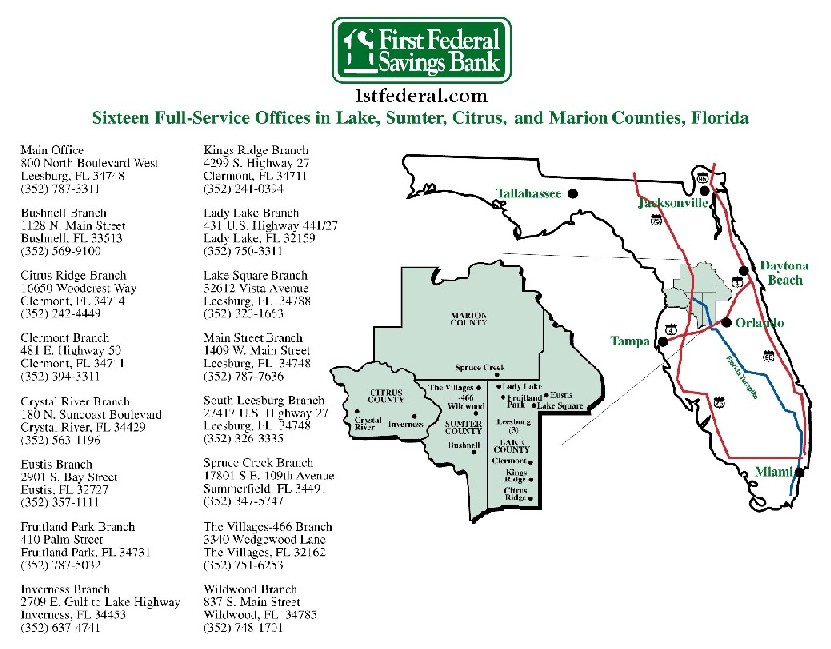
FFLC Bancorp, Inc. (“FFLC” or the “Holding Company”) was incorporated in Delaware on September 16, 1993, and acquired First Federal Savings Bank of Lake County (the “Bank”) (together, the “Company”) in connection with the Bank’s conversion to stock form on January 4, 1994. The Holding Company which transacts its business through its subsidiary, the Bank is a savings and loan holding company subject to regulation by the Office of Thrift Supervision (“OTS”). The Bank is a community-oriented savings institution, chartered in 1934, which offers a variety of financial services to individuals and businesses primarily located in Lake, Sumter, Citrus and Marion Counties in Florida. The deposits of the Bank are insured by the Federal Deposit Insurance Corporation (“FDIC”) through the Savings Association Insurance Fund (“SAIF”).
CORPORATE ORGANIZATION
Holding Company |
| FFLC Bancorp, Inc. |
| |
Subsidiaries |
| First Federal Savings Bank of Lake County |
| |
Bank’sSubsidiary |
| Lake County Service Corporation |
GENERAL INFORMATION
Corporate Headquarters |
| 800 North Boulevard West, Post Office Box 490420, Leesburg, Florida 34749-0420 |
| Telephone: | Local
Toll Free | (352) 787-3311
(877) 955-2265 |
| | | |
| |
Form 10-K |
| A copy of the Form 10-K, as filed with the Securities and Exchange Commission and the Holding Company’s Code of Ethics and Business Conduct, may be obtained by stockholders without charge upon written request to Sandra L. Rutschow, Vice President - Secretary, FFLC Bancorp, Inc., Post Office Box 490420, Leesburg, Florida 34749-0420. The Company’s SEC filings, annual and quarterly reports and press releases are also available at our Website, http://www.1stfederal.com/fflc.htm., in the “FFLC Bancorp” section. |
| |
Stockholder Assistance |
| Stockholders requiring a change of address, records or information about lost certificates, dividend checks or dividend reinvestment should contact: |
| |
| Registrar and Transfer Company
10 Commerce Drive
Cranford, New Jersey 07016
800-368-5948
Website: http://www.rtco.com |
| |
Corporate Counsel |
| George W. Murphy, Jr.
Muldoon Murphy & Aguggia LLP
5101 Wisconsin Avenue, N.W.
Washington, D.C. 20016 |
| |
Independent Auditors |
| Hacker, Johnson & Smith PA
Certified Public Accountants
930 Woodcock Road, Suite 211
Orlando, Florida 32803 |
1
COMMON STOCK PRICES AND DIVIDENDS
FFLC’s common stock is listed on the NASDAQ stock market under the symbol FFLC. The following table sets forth market price information, based on closing prices, as reported by the NASDAQ stock market for the common stock high and low closing sales prices and the amount of dividends paid on the common stock for the periods indicated (adjusted for the three-for-two stock split in February 2003). See Note 22 of the Consolidated Financial Statements for a summary of quarterly financial data.
| | High | | Low | | Cash
Dividends
Paid
Per Share | |
| |
| |
| |
| |
Quarter Ended: | | | | | | | | | | | | |
| | | | | | | | | | | | |
| March 31, 2003 | | | 25.82 | | | 19.38 | | | | .10 | | |
| June 30, 2003 | | | 28.90 | | | 18.67 | | | | .10 | | |
| September 30, 2003 | | | 30.95 | | | 25.08 | | | | .13 | | |
| December 31, 2003 | | | 30.47 | | | 26.50 | | | | .13 | | |
| March 31, 2004 | | | 29.94 | | | 26.60 | | | | .13 | | |
| June 30, 2004 | | | 28.89 | | | 24.75 | | | | .13 | | |
| September 30, 2004 | | | 27.50 | | | 24.26 | | | | .13 | | |
| December 31, 2004 | | | 35.36 | | | 27.00 | | | | .13 | | |
As of January 31, 2005, the Company had 1,745 holders of record of common stock (includes shares held by brokers in street name).
2
CONSOLIDATED FINANCIAL HIGHLIGHTS
($ in thousands, except per share amounts)
| | 2004 | | 2003 | | 2002 | |
| |
| |
| |
| |
AT YEAR END: | | | | | | | | | | |
| | | | | | | | | | |
| Total assets | | $ | 1,065,287 | | | 947,914 | | | 915,976 | |
| Loans, net | | $ | 883,980 | | | 767,987 | | | 735,338 | |
| Securities | | $ | 74,513 | | | 82,137 | | | 77,324 | |
| Deposits | | $ | 795,160 | | | 705,589 | | | 668,058 | |
| Equity | | $ | 84,492 | | | 77,356 | | | 71,062 | |
| Book value per share (1) | | $ | 15.62 | | | 14.33 | | | 13.22 | |
| Shares outstanding (1) | | | 5,408,287 | | | 5,397,154 | | | 5,374,913 | |
| Equity-to-assets ratio | | | 7.93 | % | | 8.16 | % | | 7.76 | % |
| Nonperforming assets to total assets | | | .29 | % | | .65 | % | | .35 | % |
| | | | | | | | | | |
FOR THE YEAR: | | | | | | | | | | |
| | | | | | | | | | |
| Interest income | | $ | 55,405 | | | 52,840 | | | 56,533 | |
| Net interest income after provision for loan losses | | $ | 30,363 | | | 26,719 | | | 25,205 | |
| Net income | | $ | 10,019 | | | 9,148 | | | 8,836 | |
| Basic income per share (1) | | $ | 1.86 | | | 1.70 | | | 1.65 | |
| Diluted income per share (1) | | $ | 1.83 | | | 1.67 | | | 1.61 | |
| Loan originations | | $ | 455,828 | | | 406,510 | | | 323,728 | |
| Return on average assets | | | .99 | % | | .98 | % | | 1.00 | % |
| Return on average equity | | | 12.34 | % | | 12.23 | % | | 13.05 | % |
| Average equity to average assets ratio | | | 8.03 | % | | 8.02 | % | | 7.67 | % |
| Noninterest expense to average assets | | | 1.86 | % | | 1.86 | % | | 1.68 | % |
YIELDS AND RATES:
| | Weighted Average
Rate or Yield
at December 31, | | Average Rate or Yield During
Year Ended December 31, | |
| |
| |
| |
| | 2004 | | 2003 | | 2004 | | 2003 | | 2002 | |
| |
| |
| |
| |
| |
| |
| | | | | | | | | | | | | | | | |
| Loans | | | 6.32 | % | | 6.45 | % | | 6.30 | % | | 6.71 | % | | 7.28 | % |
| Securities | | | 3.16 | % | | 3.24 | % | | 2.79 | % | | 2.48 | % | | 3.76 | % |
| All interest-earning assets | | | 5.88 | % | | 5.96 | % | | 5.86 | % | | 6.02 | % | | 6.73 | % |
| Interest-bearing deposits | | | 2.29 | % | | 2.22 | % | | 2.14 | % | | 2.48 | % | | 3.27 | % |
| All interest-bearing liabilities | | | 2.61 | % | | 2.70 | % | | 2.66 | % | | 2.99 | % | | 3.72 | % |
| Interest-rate spread (2) | | | 3.27 | % | | 3.26 | % | | 3.20 | % | | 3.03 | % | | 3.01 | % |
| Net yield on average interest-earning assets (3) | | | N/A | | | N/A | | | 3.39 | % | | 3.22 | % | | 3.22 | % |
(1) | Adjusted for the three-for-two stock split declared on February 14, 2003. |
| |
(2) | Average yield on all interest-earning assets less average rate paid on all interest-bearing liabilities. |
| |
(3) | Net interest income divided by average interest-earning assets. |
3

Dear Stockholders:
I am very pleased to be able to report to you that 2004 was not only another successful and profitable year, but also a year of significant milestones. During 2004, the Company celebrated its tenth anniversary of being a public company, its 70th anniversary as a financial institution, and surpassed $1 billion in total assets. The Board of Directors and the rest of the management team join me in expressing our sincere appreciation for your support, the hard work of our employees and the wonderful reception we have received from our customers and the communities we serve.
During 2004, the Company earned $10.0 million compared with $9.1 million for 2003, an increase of 10%. On a per share basis, the Company reported basic net income per share of $1.86 for 2004, compared to $1.70 for 2003, and diluted net income per share of $1.83 for 2004 and $1.67 for 2003. The increase in net income for 2004 compared to 2003 was primarily the result of an increase in net interest income of $3.8 million. That increase occurred in large part because of the continued reduction in the Bank’s cost of funds as a result of favorable market interest rates.
I am pleased to report that others also recognized our profitable performance and growth, and our stock price rose approximately 22% during the year, from $28.75 to $35.10. In addition, cash dividends paid per share increased from $.46 to $.52, an increase of 13%, from 2003 to 2004. Since our public offering in 1994, your stock has yielded an average annual return, including dividends, of 25.1%.
We have been very fortunate to serve a growing market, and that growth is reflected in the asset growth of FFLC. During 2004, total assets grew 12%, from $947.9 million at December 31, 2003 to $1.07 billion at December 31, 2004. During 2004, loans receivable increased by $116 million (or, 15%) that was primarily funded by an increase in deposits of $90 million (or, 13%) and in FHLB advances of $20 million (or, 15%). I am also pleased to report that FFLC’s stockholder’s equity increased from $77 million to $84 million during 2004, and book value per share increased from $14.33 at December 31, 2003 to $15.62 at December 31, 2004. In order to continue serving the growing needs of our customer base, we opened our 16th branch office in May 2004, on SR 466 in the Villages area.
In what will be the next exciting chapter in our corporate history, we recently announced that FFLC had signed a definitive agreement to merge with Colonial BankGroup, Inc. (“Colonial”). We believe this merger provides substantial benefit to our stockholders. In addition, linking with Colonial will provide our customers with additional products and an expanded network of branch offices for more convenient banking.
From a financial perspective, FFLC stockholders will have several options. Our stockholders can elect to receive two shares of Colonial stock for each share of FFLC, to receive $42 cash per share for each share of FFLC, or to receive a combination of Colonial stock and cash. In the aggregate, no more than 35% of the exchange can be in cash. An over-election of cash will result in a pro rata distribution of stock.
We are excited to be affiliating with Colonial, which is headquartered in Montgomery, Alabama, and also has a presence in Georgia, Texas and Nevada. However, Florida has been Colonial’s focus for the past decade, and business in Florida now represents over 50% of Colonial’s assets. Over the past ten years, Colonial will have gone from no presence in Florida to being the fifth largest commercial bank in the state following our merger.
4
While significantly larger than FFLC, Colonial shares in the same approach to community banking, and the same focus on providing great customer service. The members of the FFLC Board of Directors will remain involved after the merger, and will continue to have local lending authority. In addition, our customer service team of lenders and branch personnel will remain substantially unchanged. As a result, we will continue to offer the quality customer service for which First Federal Savings Bank has been known.
We sincerely appreciate the support we have received from our stockholders over the past eleven years as a public company. We look forward to the future with our new partner, Colonial BankGroup, Inc., and to the opportunity to continue providing quality banking services throughout Central Florida.
Cordially yours,
Stephen T. Kurtz
President & CEO
5
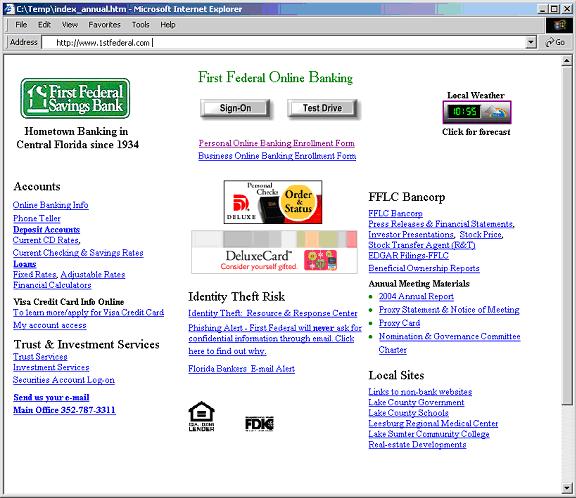
Visit First Federal’s website at http://www.1stfederal.com. This site serves as a portal for First Federal banking services, local news, and information regarding our communities. From this site, customers can gain access to First Federal Online Banking, our fully interactive banking system, that allows bill payments, account inquiries, transfer of funds and more. In addition, commercial customers can access cash management tools, make tax payments and make payroll direct deposit payments through First Federal Online Banking. You’ll also find current information about the Bank’s locations, products and services at our website.
Investors can also get the latest information regarding FFLC, including stock quotes, press releases, SEC filings, beneficial ownership reports, and other supplemental data, in the “FFLC Bancorp” section of our website.
www.1stfederal.com
First Federal online logo
6
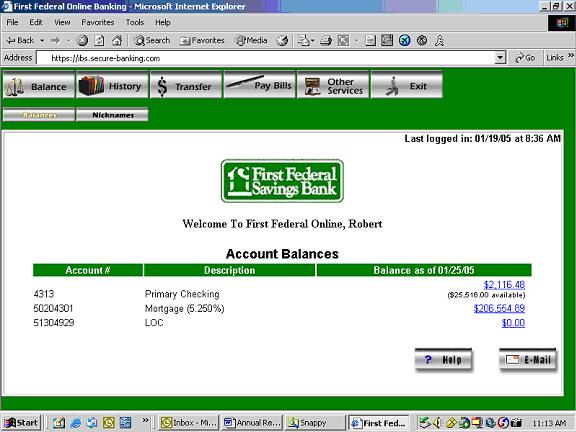
First Federal introduced First Federal Online Banking in July 2000 through the Bank’s website at http://www.1stfederal.com. First Federal customers can now access practically their entire First Federal relationship through the website, 24 hours a day, 7 days a week. From the First Federal website, customers can view our online banking product and may enroll online. After receiving their user ID and password, customers may log-on to check balances, pay their bills online, reconcile their account statements, transfer funds from one account to another, review account histories, reorder checks and more. First Federal Online Banking is just one more added convenience to banking with First Federal.
7
SELECTED CONSOLIDATED FINANCIAL DATA
($ in thousands, except per share amounts)
| | At December 31, | |
| |
| |
| | 2004 | | 2003 | | 2002 | | 2001 | | 2000 | |
| |
| |
| |
| |
| |
| |
| | | | | | | | | | | | | | | | |
| Total assets | | $ | 1,065,287 | | | 947,914 | | | 915,976 | | | 823,151 | | | 711,493 | |
| Loans, net | | | 883,980 | | | 767,987 | | | 735,338 | | | 685,935 | | | 615,484 | |
| Cash and cash equivalents | | | 64,606 | | | 62,160 | | | 69,394 | | | 49,792 | | | 30,481 | |
| Securities | | | 74,513 | | | 82,137 | | | 77,324 | | | 59,503 | | | 42,717 | |
| Deposits | | | 795,160 | | | 705,589 | | | 668,058 | | | 585,128 | | | 518,885 | |
| Borrowed funds | | | 175,186 | | | 155,941 | | | 168,458 | | | 167,327 | | | 129,376 | |
| Stockholders’ equity | | | 84,492 | | | 77,356 | | | 71,062 | | | 64,068 | | | 59,283 | |
| | For the Year Ended December 31, | |
| |
| |
| | 2004 | | 2003 | | 2002 | | 2001 | | 2000 | |
| |
| |
| |
| |
| |
| |
| | | | | | | | | | | | | | | | |
| Interest income | | $ | 55,405 | | | 52,840 | | | 56,533 | | | 56,485 | | | 49,128 | |
| Interest expense | | | 23,367 | | | 24,607 | | | 29,483 | | | 35,316 | | | 30,065 | |
| Net interest income | | | 32,038 | | | 28,233 | | | 27,050 | | | 21,169 | | | 19,063 | |
| Provision for loan losses | | | 1,675 | | | 1,514 | | | 1,845 | | | 1,115 | | | 880 | |
| Net interest income after provision for loan losses | | | 30,363 | | | 26,719 | | | 25,205 | | | 20,054 | | | 18,183 | |
| Noninterest income | | | 4,677 | | | 5,364 | | | 3,776 | | | 2,773 | | | 1,904 | |
| Noninterest expense | | | 18,809 | | | 17,355 | | | 14,868 | | | 12,841 | | | 11,414 | |
| Income before income taxes | | | 16,231 | | | 14,728 | | | 14,113 | | | 9,986 | | | 8,673 | |
| Income taxes | | | 6,212 | | | 5,580 | | | 5,277 | | | 3,697 | | | 3,364 | |
| Net income | | | 10,019 | | | 9,148 | | | 8,836 | | | 6,289 | | | 5,309 | |
| Basic income per share (1) | | $ | 1.86 | | | 1.70 | | | 1.65 | | | 1.18 | | | 1.00 | |
| Weighted average number of common shares outstanding for basic | | | 5,400,214 | | | 5,385,199 | | | 5,360,498 | | | 5,321,646 | | | 5,312,100 | |
| Diluted income per share (1) | | $ | 1.83 | | | 1.67 | | | 1.61 | | | 1.15 | | | .97 | |
| Weighted average number of common shares outstanding for diluted (1) | | | 5,470,430 | | | 5,456,896 | | | 5,466,880 | | | 5,444,148 | | | 5,423,610 | |
| (1) | Adjusted for the three-for-two stock split declared on February 14, 2003. |
8
SELECTED CONSOLIDATED FINANCIAL RATIOS
AND OTHER DATA:
| | At or For the Year Ended December 31, | |
| |
| |
| | 2004 | | 2003 | | 2002 | | 2001 | | 2000 | |
| |
| |
| |
| |
| |
| |
| | | | | | | | | | | | | | | | |
| Return on average assets | | | .99 | % | | .98 | % | | 1.00 | % | | 0.82 | % | | 0.82 | % |
| Return on average equity | | | 12.34 | % | | 12.23 | % | | 13.05 | % | | 10.20 | % | | 9.24 | % |
| Dividend payout ratio | | | 28.04 | % | | 27.18 | % | | 22.66 | % | | 29.35 | % | | 32.32 | % |
| Average equity to average assets | | | 8.03 | % | | 8.02 | % | | 7.67 | % | | 8.05 | % | | 8.88 | % |
| Total equity to total assets | | | 7.93 | % | | 8.16 | % | | 7.76 | % | | 7.78 | % | | 8.33 | % |
| Interest rate spread during year (1) | | | 3.20 | % | | 3.03 | % | | 3.01 | % | | 2.56 | % | | 2.66 | % |
| Net interest margin (2) | | | 3.39 | % | | 3.22 | % | | 3.22 | % | | 2.89 | % | | 3.08 | % |
| Nonperforming assets to total assets (3) | | | .29 | % | | 0.65 | % | | 0.35 | % | | 0.28 | % | | 0.39 | % |
| Nonperforming loans to total loans (4) | | | .30 | % | | 0.66 | % | | 0.34 | % | | 0.27 | % | | 0.40 | % |
| Allowance for loan losses to nonperforming loans | | | 228.99 | % | | 103.84 | % | | 199.88 | % | | 224.20 | % | | 141.51 | % |
| Allowance for loan losses to nonperforming assets | | | 212.30 | % | | 89.01 | % | | 161.00 | % | | 187.62 | % | | 127.49 | % |
| Allowance for loan losses to gross loans | | | .69 | % | | 0.69 | % | | 0.68 | % | | 0.61 | % | | 0.56 | % |
| Noninterest expenses to average assets | | | 1.86 | % | | 1.86 | % | | 1.68 | % | | 1.68 | % | | 1.76 | % |
| Operating efficiency ratio | | | 51.23 | % | | 51.66 | % | | 48.23 | % | | 53.63 | % | | 54.44 | % |
| Average interest-earning assets to average interest-bearing liabilities | | | 1.08 | | | 1.07 | | | 1.06 | | | 1.07 | | | 1.09 | |
| Net interest income to noninterest expenses | | | 1.70 | | | 1.63 | | | 1.82 | | | 1.69 | | | 1.69 | |
| Total shares outstanding (5) | | | 5,408,287 | | | 5,397,154 | | | 5,374,913 | | | 5,345,898 | | | 5,298,842 | |
| Book value per common share outstanding (5) | | $ | 15.62 | | | 14.33 | | | 13.22 | | | 11.99 | | | 11.19 | |
| Number of banking offices (all full-service) | | | 16 | | | 15 | | | 14 | | | 12 | | | 12 | |
(1) | Difference between weighted average yield on all interest-earning assets and weighted average rate on all interest-bearing liabilities. |
| |
(2) | Based upon net interest income before provision for loan losses divided by average interest-earning assets. |
| |
(3) | Nonperforming assets consist of nonperforming loans and foreclosed assets. |
| |
(4) | Nonperforming loans consist of loans 90 days or more delinquent. |
| |
(5) | Adjusted for the three-for-two stock split declared on February 14, 2003. |
9
MANAGEMENT’S DISCUSSION AND ANALYSIS OF FINANCIAL CONDITION
AND RESULTS OF OPERATIONS
GENERAL
First Federal Savings Bank of Lake County, the subsidiary of FFLC, was organized in 1934 as a federally chartered savings and loan association and converted to a federally chartered stock savings bank on January 4, 1994. The Bank’s principal business continues to be attracting retail deposits from the general public and investing those deposits, together with principal repayments on loans and investments and funds generated from operations, primarily in mortgage loans secured by one-to-four-family, owner-occupied homes, commercial loans, consumer loans and, to a lesser extent, construction loans and other loans, and multi-family residential mortgage loans. In addition, the Bank holds investments permitted by federal laws and regulations including securities issued by the U.S. Government and agencies thereof. The Bank’s revenues are derived principally from interest on its loan and mortgage-backed securities portfolios and interest and dividends on its investment securities.
The Bank is a community-oriented savings institution offering a variety of financial services to meet the needs of the communities it serves. The Bank’s deposit gathering and lending markets are primarily concentrated in the communities surrounding its full service offices located in Lake, Sumter, Citrus and Marion counties in central Florida. Management believes that its offices are located in communities that generally can be characterized as rural service and retirement communities with residential neighborhoods comprised predominately of one-to-four-family residences. The Bank is the largest (by asset size) locally-based financial institution in Lake County, and serves its market area with a wide selection of residential mortgage loans and other retail financial services. Management considers the Bank’s reputation for financial strength and customer service as a major advantage in attracting and retaining customers in its market area and believes it benefits from its community orientation as well as its established deposit base and level of core deposits.
On January 14, 2005, FFLC Bancorp, Inc. (the “Holding Company”) entered into a definitive agreement for the Holding Company and First Federal Savings Bank of Lake County (the “Bank”) to be acquired by Colonial BancGroup, Inc., a bank holding company incorporated in Delaware with a subsidiary bank, Colonial Bank, N.A., operating in Alabama, Florida, Georgia, Nevada, Tennessee, and Texas. Under the terms of the agreement, stockholders of the Holding Company will elect to receive either 2.0 shares of Colonial stock or $42.00 in cash for each share of the Holding Company stock they own. The cash consideration will be capped at 35% of the transaction and an over-election of cash will result in a pro rata distribution of stock. Completion of the transaction is subject to approval by the stockholders of the Holding Company and various regulatory agencies.
The Company’s net income from operations increased 9.5% to $10.0 million for the year ended December 31, 2004 from $9.1 million for the year 2003. The Company’s total assets increased 12.4% to $1,065.3 million at December 31, 2004 from $947.9 million at December 31, 2003. That increase resulted primarily from a 15.1% increase in net loans to $884.0 million at December 31, 2004 from $768.0 million at December 31, 2003, reflecting increased local loan demand. Securities decreased 9.3% or $7.6 million during 2004. Deposits increased 12.7% to $795.2 million at December 31, 2004 from $705.6 million at December 31, 2003. Advances from the Federal Home Loan Bank increased $20.0 million, to $153.0 million at December 31, 2004 from $133.0 million at December 31, 2003.
CRITICAL ACCOUNTING POLICIES
Our financial condition and results of operations are sensitive to accounting measurements and estimates of matters that are inherently uncertain. When applying accounting policies in areas that are subjective in nature, we use our best judgment to arrive at the carrying value of certain assets. The most critical accounting policy we apply is related to the valuation of the loan portfolio.
A variety of factors impact the carrying value of the loan portfolio, including the calculation of the allowance for loan losses, the valuation of underlying collateral, the timing of loan charge-offs and the amount and amortization of loan fees and deferred origination costs.
10
We believe that the determination of the allowance for loan losses represents a critical accounting policy. The allowance for loan losses is maintained at a level management considers to be adequate to absorb probable loan losses inherent in the portfolio, based on evaluations of the collectibility and historical loss experience of loans. Credit losses are charged and recoveries are credited to the allowance. In estimating probable credit losses, provisions for loan losses are based on our review of our historical loan loss experience and such other factors which, in management’s judgment, deserve consideration under existing economic conditions. The allowance is based on ongoing assessments of the probable estimated losses inherent in the loan portfolio. Our methodology for assessing the appropriate allowance level consists of several key elements described below.
Larger commercial loans that exhibit probable or observed credit weaknesses are subject to individual review. Where appropriate, reserves are allocated to individual loans based on our estimate of the borrower’s ability to repay the loan given the availability of collateral, other sources of cash flows, and available legal options. Included in the review of individual loans are those that are impaired as provided in Statement of Financial Accounting Standards No. 114, “Accounting by Creditors for Impairment of a Loan” as amended. Any specific reserves for impaired loans are measured based on the fair market value of the underlying collateral. We evaluate the collectibility of both principal and interest when assessing the need for a special reserve. Historical loss rates are applied to other commercial loans not subject to specific reserve allocations.
Homogenous loans, such as installment and residential mortgage loans, are not individually reviewed by management. Reserves are established for each pool of such loans based on the expected net charge-offs. Loss rates are based on the average net charge-off history by loan category.
Historical loss rates for commercial and consumer loans may be adjusted for significant factors that, in management’s judgment, reflect the impact of current conditions on loss recognition. Factors which management considers in the analysis include the effects of the local economy, trends in the nature and volume of loans (delinquencies, charge-offs, nonaccrual and problem loans), changes in the internal lending policies and credit standards, collection practices, and examination results from bank regulatory agencies and our internal credit review function. An unallocated reserve is maintained to recognize the imprecision in estimating and measuring loss when evaluating reserves for individual loans or pools of loans. Specific reserves on individual loans and historical loss rates are reviewed throughout the year and adjusted as necessary based on changing borrower and collateral conditions and actual collection and charge-off experience.
Based on the procedures discussed above, management believes that allowance for loan losses was adequate to absorb estimated loan losses associated with the loan portfolio at December 31, 2004. Actual results could differ from these estimates. However, since the allowance is affected by management’s judgment and uncertainties, there is the likelihood that materially different amounts would be reported under different conditions or assumptions. To the extent that the economy, collateral values, reserve factors, or the nature and volume of problem loans change, we may need to adjust the provision for loan losses. Material additions to our provision for loan losses would result in a decrease in net income and capital.
The allowance for loan losses is also discussed as part of “Results of Operations��� and in Note 3 to the consolidated financial statements. The significant accounting policies are discussed in Note 1 to the consolidated financial statements.
11
REGULATION AND LEGISLATION
General
The operating results of the Bank are affected by Federal laws and regulations and the Bank is subject to extensive regulation, examination and supervision by the OTS as its chartering agency, and the FDIC as the deposit insurer. The Bank is a member of the Federal Home Loan Bank (“FHLB”) System and its deposit accounts are insured up to applicable limits by the FDIC under the SAIF. The Bank must file reports with the OTS and the FDIC concerning its activities and financial condition in addition to obtaining regulatory approvals prior to entering into certain transactions such as mergers with, or acquisitions of, other financial institutions. The OTS and the FDIC conduct periodic examinations to test the Bank’s compliance with various regulatory requirements. The activities of the Company and the Bank are governed by the Home Owner’s Loan Act, as amended (the “HOLA”), and, in certain respects, the Federal Deposit Insurance Act (the “FDIA”). A more complete description of the HOLA and FDIA is included in the Form 10-K.
Capital Requirements
The capital regulations of the OTS require savings institutions to meet three capital standards: a 1.5% tangible capital standard; a 3% leverage (core capital) ratio; and an 8% risk-based capital standard. Under the OTS final rule implementing the Federal Deposit Insurance Corporation Improvement Act (“FDICIA”), a well-capitalized institution is defined generally as one that meets the following capital standards: a 5% tangible capital standard; a 6% leverage (core capital) ratio; and a 10% risk-based capital standard, and has not been notified by the OTS that it is in a “troubled condition.” At December 31, 2004, the Bank met each of its capital requirements and met the criteria of a “well-capitalized” institution as defined above.
Insurance of Deposit Accounts
The FDIC has adopted a risk-based deposit insurance system that assesses deposit insurance premiums according to the level of risk involved in an institution’s activities. An institution’s risk category is based upon whether the institution is classified as “well capitalized,” “adequately capitalized” or “less than adequately capitalized” and one of three supervisory subcategories within each capital group. The supervisory subgroup to which an institution is assigned is based on a supervisory evaluation and information which the FDIC determines to be relevant to the institution’s financial condition and the risk posed to the deposit insurance fund. The FDIC has authority to raise premiums if deemed necessary. If such action is taken, it could have an adverse effect on the earnings of the institution.
Under the FDIA, insurance of deposits may be terminated by the FDIC upon a finding that the institution has engaged in unsafe or unsound practices, is in an unsafe or unsound condition to continue operations or has violated any applicable law, regulation, rule, order or condition imposed by the FDIC or the OTS. The management of the Bank does not know of any practice, condition or violation that might lead to termination of deposit insurance.
CREDIT RISK
The Bank’s primary business is lending on residential real estate, commercial real estate and consumer financing, activities with the inherent risk of generating potential loan losses the magnitude of which depend on a variety of factors affecting borrowers which are beyond the control of the Bank. The Bank has underwriting guidelines and credit review procedures designed to minimize such credit losses.
12
RESULTS OF OPERATIONS
The Company’s results of operations are dependent primarily on net interest income, which is the difference between the income earned on its interest-earning assets, primarily its loans, mortgage-backed securities and investment securities, and its interest-bearing liabilities, consisting of deposits and borrowings. The operating expenses of the Company principally consist of employee compensation, occupancy expenses and other general and administrative expenses. The Company’s results of operations are also significantly affected by general economic and competitive conditions, particularly changes in market interest rates, government policies and actions of regulatory authorities.
Net interest income represents the difference between income on interest-earning assets and expense on interest-bearing liabilities. Net interest income depends upon the volume of interest-earning assets and interest-bearing liabilities and the interest rates earned or paid on them.
13
The following table sets forth, for the periods indicated, information regarding (i) the total dollar amount of interest and dividend income of the Company from interest-earning assets and the resultant average yields; (ii) the total dollar amount of interest expense on interest-bearing liabilities and the resultant average costs; (iii) net interest/dividend income; (iv) interest-rate spread; (v) net interest margin; and (vi) weighted average yields and rates at December 31, 2004. Yields and costs were derived by dividing income or expense by the average balance of assets or liabilities, respectively, for the periods shown. The average balance of loans includes loans on which the Company has discontinued accruing interest. The yields and costs include fees which are considered to constitute adjustments to yields.
| | | | Year Ended December 31, | |
| | | |
| |
| | | | 2004 | | 2003 | | 2002 | |
| | | |
| |
| |
| |
| | Yield At
December 31,
2004 | | Average
Balance | | Interest
and
Dividends | | Average
Yeild/
Cost | | Average
Balance | | Interest
and
Dividends | | Average
Yeild/
Cost | | Average
Balance | | Interest
and
Dividends | | Average
Yeild/
Cost | |
| |
| |
| |
| |
| |
| |
| |
| |
| |
| |
| |
| | | | ($ in thousands | |
| Interest-earning assets: | | | | | | | | | | | | | | | | | | | | | | | | | | | | | | | | | |
| Loans | | 6.32 | % | | $ | 830,971 | | | 52,381 | | | 6.30 | % | $ | 742,461 | | | | 49,844 | | | 6.71 | % | | $ | 721,521 | | | 52,496 | | 7.28 | % | |
| Securities | | 3.16 | | | | 82,535 | | | 2,302 | | | 2.79 | | | 89,536 | | | | 2,218 | | | 2.48 | | | | 79,757 | | | 3,002 | | 3.76 | | |
| Other interest-earning assets (1) | | 2.38 | | | | 32,110 | | | 722 | | | 2.25 | | | 45,209 | | | | 778 | | | 1.72 | | | | 38,186 | | | 1,035 | | 2.71 | | |
| | | | |
|
| |
|
| | | | |
|
| | |
|
| | | | | |
|
| |
|
| | | | |
| | | | | | | | | | | | | | | | | | | | | | | | | | | | | | | | | |
| Total interest-earning assets | | 5.88 | | | | 945,616 | | | 55,405 | | | 5.86 | | | 877,206 | | | | 52,840 | | | 6.02 | | | | 839,464 | | | 56,533 | | 6.73 | | |
| | | | | | | | | | | | | | | | | |
|
| | | | | | | | |
|
| | | | |
| | | | | | | | | | | | | | | | | | | | | | | | | | | | | | | | | |
| Noninterest-earning assets | | | | | | 65,485 | | | | | | | | | 55,385 | | | | | | | | | | | 43,409 | | | | | | | |
| | | | |
|
| | | | | | | |
|
| | | | | | | | | |
|
| | | | | | | |
| | | | | | | | | | | | | | | | | | | | | | | | | | | | | | | | | |
| Total assets | | | | | $ | 1,011,101 | | | | | | | | $ | 932,591 | | | | | | | | | | $ | 882,873 | | | | | | | |
| | | | |
|
| | | | | | | |
|
| | | | | | | | | |
|
| | | | | | | |
| | | | | | | | | | | | | | | | | | | | | | | | | | | | | | | | | |
| Interest-bearing liabilities: | | | | | | | | | | | | | | | | | | | | | | | | | | | | | | | | | |
| NOW and money-market accounts | | .39 | | | | 176,712 | | | 669 | | | .38 | | | 149,486 | | | | 778 | | | .52 | | | | 131,538 | | | 1,449 | | 1.10 | | |
| Passbook and statement savings accounts | | .35 | | | | 28,221 | | | 133 | | | .47 | | | 25,886 | | | | 154 | | | .59 | | | | 23,501 | | | 216 | | .92 | | |
| Certificates | | 2.96 | | | | 506,513 | | | 14,424 | | | 2.85 | | | 484,379 | | | | 15,443 | | | 3.19 | | | | 460,206 | | | 18,461 | | 4.01 | | |
| FHLB advances | | 4.96 | | | | 144,817 | | | 7,640 | | | 5.28 | | | 139,372 | | | | 7,740 | | | 5.55 | | | | 160,235 | | | 8,999 | | 5.62 | | |
| Other borrowings | | 4.65 | | | | 22,105 | | | 501 | | | 2.27 | | | 22,654 | | | | 492 | | | 2.17 | | | | 16,915 | | | 358 | | 2.12 | | |
| | | | |
|
| |
|
| | | | |
|
| | |
|
| | | | | |
|
| |
|
| | | | |
| | | | | | | | | | | | | | | | | | | | | | | | | | | | | | | | | |
| Total interest-bearing liabilities | | 2.61 | | | | 878,368 | | | 23,367 | | | 2.66 | | | 821,777 | | | | 24,607 | | | 2.99 | | | | 792,395 | | | 29,483 | | 3.72 | | |
| | | | | | | |
|
| | | | | | | | |
|
| | | | | | | | |
|
| | | | |
| | | | | | | | | | | | | | | | | | | | | | | | | | | | | | | | | |
| Noninterest-bearing deposits | | | | | | 40,067 | | | | | | | | | 25,296 | | | | | | | | | | | 13,655 | | | | | | | |
| Noninterest-bearing liabilities | | | | | | 11,449 | | | | | | | | | 10,731 | | | | | | | | | | | 9,122 | | | | | | | |
| Stockholders’ equity | | | | | | 81,217 | | | | | | | | | 74,787 | | | | | | | | | | | 67,701 | | | | | | | |
| | | | |
|
| | | | | | | |
|
| | | | | | | | | |
|
| | | | | | | |
| | | | | | | | | | | | | | | | | | | | | | | | | | | | | | | | | |
| Total liabilities and equity | | | | | $ | 1,011,101 | | | | | | | | $ | 932,591 | | | | | | | | | | $ | 882,873 | | | | | | | |
| | | | |
|
| | | | | | | |
|
| | | | | | | | | |
|
| | | | | | | |
| | | | | | | | | | | | | | | | | | | | | | | | | | | | | | | | | |
| Net interest-earning assets and interest-rate spread (2) | | 3.27 | % | | $ | 67,248 | | | | | | 3.20 | % | $ | 55,429 | | | | | | | 3.03 | % | | $ | 47,069 | | | | | 3.01 | % | |
| |
| | |
|
| | | | |
|
| |
|
| | | | | | |
| | |
|
| | | | |
| | |
| | | | | | | | | | | | | | | | | | | | | | | | | | | | | | | | | |
Net interest income and net
margin (3) | | | | | | | | $ | 32,038 | | | 3.39 | % | | | | | $ | 28,233 | | | 3.22 | % | | | | | $ | 27,050 | | 3.22 | % | |
| | | | | | | |
|
| |
|
| | | | | |
|
| | |
| | | | | |
|
| |
| | |
| Ratio of interest-earning assets to interest-bearing liabilities | | | | | | 1.08 | | | | | | | | | 1.07 | | | | | | | | | | | 1.06 | | | | | | | |
| | | | |
|
| | | | | | | |
|
| | | | | | | | | |
|
| | | | | | | |
(1) | Includes interest-earning deposits and FHLB Stock. |
| |
(2) | Interest-rate spread represents the difference between the average yield on interest-earning assets and the average cost of interest bearing liabilities. |
| |
(3) | Net interest margin is net interest income divided by average interest-earning assets. |
14
The following table discloses the extent to which changes in interest rates and changes in the volume of interest-earning assets and interest-bearing liabilities have affected the Company’s interest income and interest expense during the periods indicated. Information is provided in each category with respect to (i) changes attributable to changes in volume (changes in volume multiplied by prior rate), (ii) changes attributable to changes in rate (changes in rate multiplied by prior volume) and (iii) changes attributable to changes in rate/volume (changes in rate multiplied by changes in volume).
| | Year Ended December 31,
2004 vs. 2003
Increase (Decrease) | | Year Ended December 31,
2003 vs. 2002
Increase (Decrease) | |
| |
| |
| |
| | Due to | | Due to | |
| |
| |
| |
| | Rate | | Volume | | Rate/
Volume | | Net | | Rate | | Volume | | Rate/
Volume | | Net | |
| |
| |
| |
| |
| |
| |
| |
| |
| |
| | ($ in thousands) | |
| Interest-earning assets: | | | | | | | | | | | | | | | | | | | | | | | | | | | |
| Loans, net | | $ | (3,042 | ) | | 5,942 | | | | (363 | ) | | | 2,537 | | | (4,058 | ) | | 1,524 | | | (118 | ) | | (2,652 | ) |
| Securities | | | 279 | | | (173 | ) | | | (22 | ) | | | 84 | | | (1,026 | ) | | 368 | | | (126 | ) | | (784 | ) |
| Other interest-earning (1) | | | 239 | | | (225 | ) | | | (70 | ) | | | (56 | ) | | (378 | ) | | 190 | | | (69 | ) | | (257 | ) |
| |
|
| |
|
| | |
|
| | |
|
| |
|
| |
|
| |
|
| |
|
| |
| | | | | | | | | | | | | | | | | | | | | | | | | | | |
| Total | | | (2,524 | ) | | 5,544 | | | | (455 | ) | | | 2,565 | | | (5,462 | ) | | 2,082 | | | (313 | ) | | (3,693 | ) |
| |
|
| |
|
| | |
|
| | |
|
| |
|
| |
|
| |
|
| |
|
| |
| | | | | | | | | | | | | | | | | | | | | | | | | | | |
| Interest-bearing liabilities: | | | | | | | | | | | | | | | | | | | | | | | | | | | |
| NOW and money-market accounts | | | (212 | ) | | 142 | | | | (39 | ) | | | (109 | ) | | (765 | ) | | 198 | | | (104 | ) | | (671 | ) |
| Passbook and statement savings accounts | | | (32 | ) | | 14 | | | | (3 | ) | | | (21 | ) | | (76 | ) | | 22 | | | (8 | ) | | (62 | ) |
| Certificates | | | (1,649 | ) | | 706 | | | | (76 | ) | | | (1,019 | ) | | (3,789 | ) | | 970 | | | (199 | ) | | (3,018 | ) |
| FHLB advances | | | (387 | ) | | 302 | | | | (15 | ) | | | (100 | ) | | (100 | ) | | (1,172 | ) | | 13 | | | (1,259 | ) |
| Other borrowings | | | 21 | | | (12 | ) | | | — | | | | 9 | | | 9 | | | 121 | | | 4 | | | 134 | |
| |
|
| |
|
| | |
|
| | |
|
| |
|
| |
|
| |
|
| |
|
| |
| | | | | | | | | | | | | | | | | | | | | | | | | | | |
| Total | | | (2,259 | ) | | 1,152 | | | | (133 | ) | | | (1,240 | ) | | (4,721 | ) | | 139 | | | (294 | ) | | (4,876 | ) |
| |
|
| |
|
| | |
|
| | |
|
| |
|
| |
|
| |
|
| |
|
| |
| | | | | | | | | | | | | | | | | | | | | | | | | | | |
| Net change in net interest income | | $ | (265 | ) | | 4,392 | | | | (322 | ) | | | 3,805 | | | (741 | ) | | 1,943 | | | (19 | ) | | 1,183 | |
| |
|
| |
|
| | |
|
| | |
|
| |
|
| |
|
| |
|
| |
|
| |
| (1) | Includes interest-earning deposits and FHLB Stock. |
15
CAPITAL RESOURCES
The Bank’s sources of funds include proceeds from payments and prepayments on mortgage loans and mortgage-backed securities, proceeds from the maturities of investment securities and deposits. While maturities and scheduled amortization of loans and investment securities are predictable sources of funds, deposit inflows and mortgage prepayments are greatly influenced by local conditions, general interest rates, and regulatory changes.
At December 31, 2004, the Bank had outstanding commitments to originate $18.3 million of loans, to fund unused lines of credit of $70.0 million, to fund the undisbursed portion of loans in process of $47.5 million and to fund $3.1 million in outstanding standby letters of credit. The Bank believes that it will have sufficient funds available to meet its commitments. At December 31, 2004, certificates of deposit which were scheduled to mature in one year or less totaled $253.9 million. Management believes, based on past experience, that a significant portion of those funds will remain with the Bank.
REGULATORY CAPITAL REQUIREMENTS
As a federally-chartered financial institution, the Bank is required to maintain certain minimum amounts of regulatory capital. Regulatory capital is not a valuation allowance and has not been created by charges against earnings. The following table provides a summary of the capital requirements, the Bank’s regulatory capital and the amounts in excess of the requirements at December 31, 2004:
| | Tangible | | Core | | Risk-Based | |
| |
| |
| |
| |
| | Amount | | % of
Adjusted
Assets | | Amount | | % of
Adjusted
Assets | | Amount | | % of Risk-
Weighted
Assets | |
| |
| |
| |
| |
| |
| |
| |
| | ($ in thousands) | |
| | | | | | | | | | | | | | | | | | | | | | | | | |
| Regulatory capital | | $ | 81,660 | | | | 7.70 | % | | $ | 81,660 | | | | 7.70 | % | | $ | 87,787 | | | | 11.71 | % | |
| Requirement | | | 15,913 | | | | 1.50 | | | | 31,826 | | | | 3.00 | | | | 59,975 | | | | 8.00 | | |
| |
|
| | |
|
| | |
|
| | |
|
| | |
|
| | |
|
| | |
| | | | | | | | | | | | | | | | | | | | | | | | | |
| Excess | | $ | 65,747 | | | | 6.20 | % | | $ | 49,834 | | | | 4.70 | % | | $ | 27,812 | | | | 3.71 | % | |
| |
|
| | |
|
| | |
|
| | |
|
| | |
|
| | |
|
| | |
| | | | | | | | | | | | | | | | | | | | | | | | | | | | | | | | | |
QUANTITATIVE AND QUALITATIVE DISCLOSURES ABOUT MARKET RISK
Market risk is the risk of loss from adverse changes in market prices and rates. The Company’s market risk arises primarily from interest-rate risk inherent in its lending and deposit taking activities. The Company has little or no risk related to trading accounts, commodities or foreign exchange.
Management actively monitors and manages its interest rate risk exposure. The primary objective in managing interest-rate risk is to limit, within established guidelines, the adverse impact of changes in interest rates on the Company’s net interest income and capital, while adjusting the Company’s asset-liability structure to obtain the maximum yield-cost spread on that structure. Management relies primarily on its asset-liability structure to control interest rate risk. However, a sudden and substantial increase in interest rates could adversely impact the Company’s earnings, to the extent that the interest rates borne by assets and liabilities do not change at the same speed, to the same extent, or on the same basis.
Disclosure about the fair value of financial instruments, which reflect changes in market prices and rates, can be found in Note 9 of the notes to the consolidated financial statements.
16
OFF-BALANCE SHEET ARRANGEMENTS AND AGGREGATE CONTRACTUAL OBLIGATIONS
The Company is a party to financial instruments with off-balance-sheet risk in the normal course of business to meet the financing needs of its customers and to reduce its own exposure to fluctuations in interest rates. These financial instruments include commitments to extend credit, unused lines of credit, undisbursed loans in process and standby letters of credit. These instruments involve, to varying degrees, elements of credit and interest-rate risk in excess of the amounts recognized in the consolidated balance sheet. The contract amounts of these instruments reflect the extent of the Company’s involvement in these financial instruments.
The Company’s exposure to credit loss in the event of nonperformance by the other party to the financial instrument for commitments to extend credit, unused lines of credit, undisbursed loans in process and standby letters of credit is represented by the contractual amount of those instruments. The Company uses the same credit policies in making commitments as it does for on-balance sheet instruments.
Commitments to extend credit are agreements to lend to a customer as long as there is no violation of any condition established in the contract. Commitments generally have fixed-expiration dates or other termination clauses and may require payment of a fee. Since certain commitments expire without being drawn upon, the total committed amounts do not necessarily represent future cash requirements. The Company evaluates each customer’s credit worthiness on a case-by-case basis. The amount of collateral obtained, if it is deemed necessary by the Company upon extension of credit, is based on management’s credit evaluation of the counter party.
Standby letters of credit are conditional commitments issued by the Company to guarantee the performance of a customer to a third party. The credit risk involved in issuing letters of credit is essentially the same as that involved in extending loans to customers.
The following is a summary of the Company’s contractual obligations, including certain on-balance sheet obligations, at December 31, 2004 (in thousands):
| | | | Payments Due by Period | |
| | | |
| |
Contractual Obligations | | Total | | Less
Than 1
Year | | 1-3
Years | | 3-5
Years | | More
Than 5
Years | |
| |
| |
| |
| |
| |
| |
| | | | | | | | | | | | | | | | |
| FHLB advances – assumed final maturity | | $ | 153,000 | | | 69,000 | | | 40,000 | | | 29,000 | | | 15,000 | |
| Time deposit maturities | | | 535,986 | | | 253,892 | | | 238,804 | | | 43,290 | | | — | |
| Junior subordinated debentures – assumed final maturity | | | 5,155 | | | — | | | — | | | — | | | 5,155 | |
| Accrued interest payable | | | 1,075 | | | 1,075 | | | — | | | — | | | — | |
| Other borrowings | | | 17,031 | | | 17,031 | | | — | | | — | | | — | |
| Operating leases | | | 313 | | | 46 | | | 99 | | | 109 | | | 59 | |
| Loan commitments | | | 18,326 | | | 18,326 | | | — | | | — | | | — | |
| Standby letters of credit | | | 3,129 | | | 3,129 | | | — | | | — | | | — | |
| Undisbursed construction and line of credit loans | | | 117,477 | | | 117,477 | | | — | | | — | | | — | |
| |
|
| |
|
| |
|
| |
|
| |
|
| |
| | | | | | | | | | | | | | | | |
| Total | | $ | 804,061 | | | 432,486 | | | 278,957 | | | 72,404 | | | 20,214 | |
| |
|
| |
|
| |
|
| |
|
| |
|
| |
17
ASSET /LIABILITY MANAGEMENT
The Bank’s primary mission is to provide financing by offering permanent and construction residential mortgage loans, commercial real estate loans and consumer and commercial loans and by providing conveniently located depository facilities with transaction, savings and certificate accounts. The Bank’s goal is to continue to be a well-capitalized and profitable operation that provides service that is professional, efficient and courteous. The Bank seeks to fulfill its mission and accomplish its goals by pursuing the following strategies: (i) emphasizing lending in the one-to-four-family residential mortgage, commercial real estate and consumer lending markets; (ii) controlling interest-rate risk; (iii) managing deposit pricing and asset growth; (iv) emphasizing cost control; and (v) maintaining asset quality by investing in U.S. government and agency securities which, in management’s judgment, provide a balance between yield and safety. It is management’s intention to continue to employ these strategies over the foreseeable future.
The Bank’s profitability, like that of most financial institutions, is dependent to a large extent upon its net interest income, which is the difference between its interest income on interest-earning assets, such as loans, mortgage-backed securities and investment securities, and its interest expense on interest-bearing liabilities, such as deposits and other borrowings. Financial institutions continue to be affected by general changes in levels of interest rates and other economic factors beyond their control. At December 31, 2004, the Bank’s one-year interest sensitivity gap (the difference between the amount of interest-earning assets anticipated by the Bank to mature or reprice within one year and the amount of interest-bearing liabilities anticipated by the Bank to mature or reprice within one year) as a percentage of total assets was a positive 3.34% Generally, an institution with a positive gap would experience an increase in net interest income in a period of rising interest rates or a decrease in net interest income in a period of declining interest rates. However, certain shortcomings are inherent in the sensitivity analysis presented above. For example, although certain assets and liabilities may have similar maturities or periods to repricing, they may react in different manners to changes in market interest rates. Therefore, no assurance can be given that the Bank will be able to maintain its net interest-rate spread as market interest rates fluctuate.
The Bank monitors its interest-rate risk through the Asset/Liability Committee which meets monthly and reports the results of such monitoring quarterly to the Board of Directors. The Bank’s policy is to seek to maintain a balance between interest-earning assets and interest-bearing liabilities so that the Bank’s cumulative one-year gap is within a range established by the Board of Directors and which management believes is conducive to maintaining profitability without incurring undue risk. The Bank has increased its investment in adjustable-rate, and shorter average life, mortgage-related securities in order to position itself against the consequences of rising interest rates. The Bank also maintains liquid assets in an amount which allows for the possibility of disintermediation when interest rates fluctuate. The Bank’s liquidity ratio was 17.6% at December 31, 2004. In addition, the Bank’s large, stable, core deposit base resulting from its continuing commitment to quality customer service has historically provided it with a steady source of funds.
18
The following table sets forth the amounts of interest-earning assets and interest-bearing liabilities outstanding at December 31, 2004 that are expected to reprice, based upon certain assumptions and contractual maturities, in each of the future periods shown.
| | Three
Months
or Less | | More
than
Three
Months
to Six
Months | | More
than
Six
Months
to 12
Months | | More
than
One
Year
to 3
Years | | More
than
Three
Years
to 5
Years | | More
than
Five
Years
to 10
Years | | More
than
Ten
Years | | Total | |
| |
| |
| |
| |
| |
| |
| |
| |
| |
| | ($ in thousands) | |
| Rate-sensitive assets: | | | | | | | | | | | | | | | | | | | | | | | | | |
| Mortgage loans, net of LIP | | $ | 196,244 | | | 70,651 | | | 116,714 | | | 180,280 | | | 55,783 | | | 25,872 | | | 22,445 | | | 667,989 | |
| Commercial and consumer loans, net of LIP | | | 94,062 | | | 14,327 | | | 23,724 | | | 53,610 | | | 19,227 | | | 11,388 | | | 5,005 | | | 221,343 | |
| Mortgage-backed securities | | | 3,925 | | | 3,585 | | | 5,950 | | | 6,257 | | | 2,965 | | | — | | | — | | | 22,682 | |
| Interest-earning deposits | | | 38,258 | | | | | | | | | | | | | | | | | | — | | | 38,258 | |
| Investment securities | | | | | | — | | | 3,996 | | | 22,966 | | | — | | | — | | | 7,043 | | | 42,663 | |
| Mutual funds | | | 9,168 | | | — | | | — | | | — | | | — | | | — | | | — | | | 9,168 | |
| FHLB stock | | | 8,782 | | | — | | | — | | | — | | | — | | | — | | | — | | | 8,782 | |
| |
|
| |
|
| |
|
| |
|
| |
|
| |
|
| |
|
| |
|
| |
| | | | | | | | | | | | | | | | | | | | | | | | | |
| Total interest-earning assets | | | 359,097 | | | 88,563 | | | 150,384 | | | 263,113 | | | 77,975 | | | 37,260 | | | 34,493 | | | 1,010,885 | |
| |
|
| |
|
| |
|
| |
|
| |
|
| |
|
| |
|
| |
|
| |
| | | | | | | | | | | | | | | | | | | | | | | | | |
| Rate-sensitive liabilities: | | | | | | | | | | | | | | | | | | | | | | | | | |
| Deposits: | | | | | | | | | | | | | | | | | | | | | | | | | |
| Savings accounts | | | 29,891 | | | — | | | — | | | — | | | — | | | — | | | — | | | 29,891 | |
| NOW and money-market accounts | | | 187,487 | | | — | | | — | | | — | | | — | | | — | | | — | | | 187,487 | |
| Certificates | | | 98,564 | | | 56,995 | | | 98,333 | | | 238,804 | | | 43,290 | | | — | | | — | | | 535,986 | |
| Borrowed funds | | | 55,686 | | | 12,500 | | | 23,000 | | | 40,000 | | | 29,000 | | | 15,000 | | | — | | | 175,186 | |
| |
|
| |
|
| |
|
| |
|
| |
|
| |
|
| |
|
| |
|
| |
| | | | | | | | | | | | | | | | | | | | | | | | | |
| Total interest-bearing liabilities | | | 371,628 | | | 69,495 | | | 121,333 | | | 278,804 | | | 72,290 | | | 15,000 | | | — | | | 928,550 | |
| |
|
| |
|
| |
|
| |
|
| |
|
| |
|
| |
|
| |
|
| |
| | | | | | | | | | | | | | | | | | | | | | | | | |
| Interest-sensitivity gap | | $ | (12,531 | ) | | 19,068 | | | 29,051 | | | (15,691 | ) | | 5,685 | | | 22,260 | | | 34,493 | | | 82,335 | |
| |
|
| |
|
| |
|
| |
|
| |
|
| |
|
| |
|
| |
|
| |
| | | | | | | | | | | | | | | | | | | | | | | | | |
| Cumulative interest-sensitivity gap | | $ | (12,531 | ) | | 6,537 | | | 35,588 | | | 19,897 | | | 25,582 | | | 47,842 | | | 82,335 | | | | |
| |
|
| |
|
| |
|
| |
|
| |
|
| |
|
| |
|
| | | | |
| | | | | | | | | | | | | | | | | | | | | | | | | |
| Cumulative interest-earning assets | | $ | 359,097 | | | 447,660 | | | 598,044 | | | 861,157 | | | 939,132 | | | 976,392 | | | 1,010,885 | | | | |
| |
|
| |
|
| |
|
| |
|
| |
|
| |
|
| |
|
| | | | |
| | | | | | | | | | | | | | | | | | | | | | | | | |
| Cumulative interest-bearing liabilities | | $ | 371,628 | | | 441,123 | | | 562,456 | | | 841,260 | | | 913,550 | | | 928,550 | | | 928,550 | | | | |
| |
|
| |
|
| |
|
| |
|
| |
|
| |
|
| |
|
| | | | |
| | | | | | | | | | | | | | | | | | | | | | | | | |
| Cumulative interest-sensitivity gap as a percentage of total assets | | | (1.18% | ) | | 0.61 | % | | 3.34 | % | | 1.87 | % | | 2.40 | % | | 4.49 | % | | 7.73 | % | | | |
| |
|
| |
|
| |
|
| |
|
| |
|
| |
|
| |
|
| | | | |
| | | | | | | | | | | | | | | | | | | | | | | | | |
| Cumulative interest-earning assets as a percentage of cumulative interest-bearing liabilities | | | 96.63 | % | | 101.48 | % | | 106.33 | % | | 102.37 | % | | 102.80 | % | | 105.15 | % | | 108.87 | % | | | |
| |
|
| |
|
| |
|
| |
|
| |
|
| |
|
| |
|
| | | | |
19
| COMPARISON OF THE YEAR ENDED DECEMBER 31, 2004 TO THE YEAR ENDED DECEMBER 31, 2003 |
| |
| General Operating Results. Net income for the year ended December 31, 2004 was $10.0 million, or $1.86 per basic share and $1.83 per diluted share, compared to $9.1 million, or $1.70 per basic share and $1.67 per diluted share, for the year ended December 31, 2003. All per share information has been adjusted to reflect the three-for-two stock split effected in 2003. The increase in net income was primarily due to an increase in net interest income of $3.8 million, partially offset by a $1.5 million increase in noninterest expense and a decrease in noninterest income of $.7 million. |
| |
| Interest Income. Interest income increased $2.6 million to $55.4 million for the year ended December 31, 2004. The increase resulted from a $68.4 million or 7.8% increase in average interest-earning assets outstanding for the year ended December 31, 2004 compared to 2003, partially offset by a decrease in the average yield earned on interest-earning assets from 6.02% for the year ended December 31, 2004 to 5.86% for the year ended December 31, 2003. |
| |
| Interest Expense. Interest expense decreased $1.2 million or 5.0%, from $24.6 million for the year ended December 31, 2003 to $23.4 million for the year ended December 31, 2004. The decrease was due primarily to a decrease in the average cost of interest-bearing liabilities from 2.99% for the year ended December 31, 2003 to 2.66% for 2004, partially offset by an increase of $56.6 million in average interest-bearing liabilities outstanding. Average interest-bearing deposits increased from $659.8 million outstanding during the year ended December 31, 2003 to $711.4 million outstanding during 2004. Average borrowings increased from $162.0 million outstanding during the year ended December 31, 2003 to $166.9 million in 2004. |
| |
| Provision for Loan Losses. The provision for loan losses is charged to income to increase the allowance for loan losses to the level deemed appropriate by management. The provision is based upon the volume and type of lending conducted by the Company, charge-off experience, industry standards, the amount of nonperforming loans, general economic conditions, particularly as they relate to the Company’s market area, and other factors related to the collectibility of the Company’s loan portfolio. The Company recorded provisions for loan losses for the years ended December 31, 2004 and 2003 of $1.7 million and $1.5 million, respectively. Net loans charged off for the years ended December 31, 2004 and 2003 were $673,000 and $1,205,000, respectively. Management believes that the allowance for loan losses, which was $6.5 million or .69% of gross loans at December 31, 2004, is adequate. |
| |
| Noninterest Income. Noninterest income decreased $.7 million, or 12.8% from $5.4 million for the year ended December 31, 2003 to $4.7 million for 2004. That decrease was primarily due to decreases of $384,000 in other service charges and fees and $683,000 in net gain on sales of loans held for sale. The decrease in gain on sales of loans held for sale was due to a decrease in the amount of residential mortgage loans originated and sold in the secondary market. The decrease in loans originated and sold was a result of a decrease in refinancings which had peaked in the prior year. |
| |
| Noninterest Expense. Noninterest expense increased by $1.5 million or 8.4%, from $17.4 million for the year ended December 31, 2003 to $18.8 million for the year ended December 31, 2004. The increase was primarily due to increases in salaries and employee benefits of $782,000, occupancy expense of $111,000 and $284,000 in data processing expenses related to the overall growth of the Company. |
| |
| Income Taxes. Income taxes were $6.2 million for the year ended December 31, 2004 (an effective tax rate of 38.3%) compared to $5.6 million (an effective tax rate of 37.9%) for the year ended December 31, 2003. |
20
| COMPARISON OF THE YEAR ENDED DECEMBER 31, 2003 TO THE YEAR ENDED DECEMBER 31, 2002 |
| |
| General Operating Results. Net income for the year ended December 31, 2003 was $9.1 million, or $1.70 per basic share and $1.67 per diluted share, compared to $8.8 million, or $1.65 per basic share and $1.61 per diluted share, for the year ended December 31, 2002. All per share information has been adjusted to reflect the three-for-two stock split in 2003. The increase in net income was primarily due to increases in net interest income of $1.2 million and noninterest income of $1.6 million, partially offset by a $2.5 million increase in noninterest expense. |
| |
| Interest Income. Interest income decreased $3.7 to $52.8 million for the year ended December 31, 2003. The decrease resulted from a decrease in the average yield earned on interest-earning assets from 6.73% for the year ended December 31, 2002 to 6.02% for the year ended December 31, 2003, partially offset by a $37.7 million or 4.5% increase in average interest-earning assets outstanding for the year ended December 31, 2003 compared to 2002. |
| |
| Interest Expense. Interest expense decreased $4.9 million or 16.5%, from $29.5 million for the year ended December 31, 2002 to $24.6 million for the year ended December 31, 2003. The decrease was due primarily to a decrease in the average cost of interest-bearing liabilities from 3.72% for the year ended December 31, 2002 to 2.99% for 2003, partially offset by an increase of $29.4 million in average interest-bearing liabilities outstanding. Average interest-bearing deposits increased from $615.2 million outstanding during the year ended December 31, 2002 to $659.8 million outstanding during 2003. Average borrowings decreased from $177.2 million outstanding during the year ended December 31, 2002 to $162.0 million in 2003. |
| |
| Provision for Loan Losses. The provision for loan losses is charged to income to increase the allowance for loan losses to the level deemed appropriate by management. The provision is based upon the volume and type of lending conducted by the Company, charge-off experience, industry standards, the amount of nonperforming loans, general economic conditions, particularly as they relate to the Company’s market area, and other factors related to the collectibility of the Company’s loan portfolio. The Company recorded provisions for loan losses for the years ended December 31, 2003 and 2002 of $1.5 million and $1.8 million, respectively. Net loans charged off for the years ended December 31, 2003 and 2002 were $1,205,000 and $953,000, respectively. Management believes that the allowance for loan losses, which was $5.5 million or .69% of gross loans at December 31, 2003 is adequate. |
| |
| Noninterest Income. Noninterest income increased $1.6 million, or 42.1% from $3.8 million for the year ended December 31, 2002 to $5.4 million for 2003. That increase was primarily due to increases of $475,000 in other service charges and fees and $775,000 in net gain on sales of loans held for sale. The increase in gain on sales of loans held for sale was due to an increase in the amount of residential mortgage loans originated and sold in the secondary market due to the low interest-rate environment. |
| |
| Noninterest Expense. Noninterest expense increased by $2.5 million or 16.7%, from $14.9 million for the year ended December 31, 2002 to $17.4 million for the year ended December 31, 2003. The increase was primarily due to increases in salaries and employee benefits of $1.4 million, occupancy expense of $367,000 and $279,000 in data processing expenses related to the overall growth of the Company. |
| |
| Income Taxes. Income taxes were $5.6 million for the year ended December 31, 2003 (an effective tax rate of 37.9%) compared to $5.3 million (an effective tax rate of 37.4%) for the year ended December 31, 2002. |
21
IMPACT OF INFLATION AND CHANGING PRICES
The Consolidated Financial Statements and Notes thereto presented herein have been prepared in accordance with GAAP, which requires the measurement of financial position and operating results in terms of historical dollars without considering the changes in the relative purchasing power of money over time due to inflation. The impact of inflation is reflected in the increased cost of the Company’s operations. Unlike most industrial companies, nearly all the assets and liabilities of the Bank are monetary in nature. As a result, interest rates have a greater impact on the Company’s performance than do the effects of general levels of inflation. Interest rates do not necessarily move in the same direction or to the same extent as the price of goods and services.
22
FFLC BANCORP, INC. AND SUBSIDIARIES
Consolidated Balance Sheets
($ in thousands, except per share amounts)
| | At December 31, | |
| |
| |
| | 2004 | | 2003 | |
| |
| |
| |
| Assets | | | | | | |
| | | | | | |
| Cash and due from banks | | $ | 26,348 | | 35,072 | |
| Interest-earning deposits | | | 38,258 | | 27,088 | |
| |
|
| |
| |
| | | | | | |
| Cash and cash equivalents | | | 64,606 | | 62,160 | |
| | | | | | |
| Securities available for sale | | | 74,513 | | 82,137 | |
| Loans, net of allowance for loan losses of $6,492 in 2004and $5,490 in 2003 | | | 883,980 | | 767,987 | |
| Accrued interest receivable: | | | | | | |
| Securities | | | 481 | | 660 | |
| Loans | | | 3,412 | | 3,189 | |
| Premises and equipment, net | | | 22,522 | | 21,448 | |
| Foreclosed assets | | | 223 | | 881 | |
| Federal Home Loan Bank stock, at cost | | | 8,782 | | 6,900 | |
| Deferred income taxes | | | 1,496 | | 1,134 | |
| Other assets | | | 5,272 | | 1,418 | |
| |
|
| |
| |
| | | | | | |
| Total | | $ | 1,065,287 | | 947,914 | |
| |
|
| |
| |
| | | | | | |
| Liabilities and Stockholders’ Equity | | | | | | |
| | | | | | |
| Liabilities: | | | | | | |
| Noninterest-bearing demand deposits | | | 41,796 | | 31,481 | |
| NOW and money-market accounts | | | 187,487 | | 161,527 | |
| Savings accounts | | | 29,891 | | 26,636 | |
| Certificates | | | 535,986 | | 485,945 | |
| |
|
| |
| |
| | | | | | |
| Total deposits | | | 795,160 | | 705,589 | |
| | | | | | |
| Advances from Federal Home Loan Bank | | | 153,000 | | 133,000 | |
| Other borrowed funds | | | 17,031 | | 17,786 | |
| Junior subordinated debentures | | | 5,155 | | 5,155 | |
| Accrued expenses and other liabilities | | | 10,449 | | 9,028 | |
| |
|
| |
| |
| | | | | | |
| Total liabilities | | | 980,795 | | 870,558 | |
| |
|
| |
| |
| | | | | | |
| Commitments and contingencies (Notes 4, 9 and 12) | | | | | | |
| | | | | | |
| Stockholders’ equity: | | | | | | |
| Preferred stock, $.01 par value, 1,000,000 shares authorized, none outstanding | | | — | | — | |
| Common stock, $.01 par value, 15,000,000 shares authorized,6,411,660 in 2004 and 6,397,202 in 2003 shares issued | | | 64 | | 64 | |
| Additional paid-in-capital | | | 32,353 | | 31,837 | |
| Retained income | | | 72,281 | | 65,071 | |
| Accumulated other comprehensive income (loss) | | | (207 | ) | 297 | |
| Treasury stock, at cost (1,003,373 shares in 2004 and 1,000,048 shares in 2003) | | | (19,999 | ) | (19,913 | ) |
| |
|
| |
| |
| | | | | | |
| Total stockholders’ equity | | | 84,492 | | 77,356 | |
| |
|
| |
| |
| | | | | | |
| Total | | $ | 1,065,287 | | 947,914 | |
| |
|
| |
| |
| | | | | | | | | | | | |
See accompanying Notes to Consolidated Financial Statements.
23
FFLC BANCORP, INC. AND SUBSIDIARIES
Consolidated Statements of Income
($ in thousands, except per share amounts)
| | Year Ended December 31, | |
| |
| |
| | 2004 | | 2003 | | 2002 | |
| |
| |
| |
| |
| Interest income: | | | | | | | | |
| Loans | | $ | 52,381 | | 49,844 | | 52,496 | |
| Securities | | | 2,302 | | 2,218 | | 3,002 | |
| Other | | | 722 | | 778 | | 1,035 | |
| |
|
| |
| |
| |
| | | | | | | | |
| Total interest income | | | 55,405 | | 52,840 | | 56,533 | |
| |
|
| |
| |
| |
| | | | | | | | |
| Interest expense: | | | | | | | | |
| Deposits | | | 15,226 | | 16,375 | | 20,126 | |
| Borrowed funds | | | 8,141 | | 8,232 | | 9,357 | |
| |
|
| |
| |
| |
| | | | | | | | |
| Total interest expense | | | 23,367 | | 24,607 | | 29,483 | |
| |
|
| |
| |
| |
| | | | | | | | |
| Net interest income | | | 32,038 | | 28,233 | | 27,050 | |
| | | | | | | | |
| Provision for loan losses | | | 1,675 | | 1,514 | | 1,845 | |
| |
|
| |
| |
| |
| | | | | | | | |
| Net interest income after provision for loan losses | | | 30,363 | | 26,719 | | 25,205 | |
| |
|
| |
| |
| |
| | | | | | | | |
| Noninterest income: | | | | | | | | |
| Deposit account fees | | | 1,391 | | 1,036 | | 953 | |
| Other service charges and fees | | | 1,991 | | 2,375 | | 1,900 | |
| Net gain on sales of loans held for sale | | | 495 | | 1,178 | | 403 | |
| Other | | | 800 | | 775 | | 520 | |
| |
|
| |
| |
| |
| | | | | | | | |
| Total noninterest income | | | 4,677 | | 5,364 | | 3,776 | |
| |
|
| |
| |
| |
| | | | | | | | |
| Noninterest expense: | | | | | | | | |
| Salaries and employee benefits | | | 10,978 | | 10,196 | | 8,814 | |
| Occupancy expense | | | 2,898 | | 2,787 | | 2,420 | |
| Data processing expense | | | 1,554 | | 1,270 | | 991 | |
| Advertising and promotion | | | 592 | | 507 | | 492 | |
| Professional services | | | 576 | | 480 | | 432 | |
| Other | | | 2,211 | | 2,115 | | 1,719 | |
| |
|
| |
| |
| |
| | | | | | | | |
| Total noninterest expense | | | 18,809 | | 17,355 | | 14,868 | |
| |
|
| |
| |
| |
| | | | | | | | |
| Income before income taxes | | | 16,231 | | 14,728 | | 14,113 | |
| | | | | | | | |
| Income taxes | | | 6,212 | | 5,580 | | 5,277 | |
| |
|
| |
| |
| |
| | | | | | | | |
| Net income | | $ | 10,019 | | 9,148 | | 8,836 | |
| |
|
| |
| |
| |
| | | | | | | | |
| Basic income per share | | $ | 1.86 | | 1.70 | | 1.65 | |
| |
|
| |
| |
| |
| | | | | | | | |
| Weighted-average number of shares outstanding for basic | | | 5,400,214 | | 5,385,199 | | 5,360,498 | |
| |
|
| |
| |
| |
| | | | | | | | |
| Diluted income per share | | $ | 1.83 | | 1.67 | | 1.61 | |
| |
|
| |
| |
| |
| | | | | | | | |
| Weighted-average number of shares outstanding for diluted | | | 5,470,430 | | 5,456,896 | | 5,466,880 | |
| |
|
| |
| |
| |
| | | | | | | | | | |
See accompanying Notes to Consolidated Financial Statements.
24
FFLC BANCORP, INC. AND SUBSIDIARIES
Consolidated Statements of Changes in Stockholders’ Equity
Years Ended December 31, 2004, 2003 and 2002
($ in thousands, except per share amounts)
| | Common Stock | | | | | | | | Accumulated | | | |
| |
| | Additional | | | | | | Other | | Total | |
| | Number of
Shares | | Amount | | Paid-In
Capital | | Treasury
Stock | | Retained
Income | | Comprehensive
Income | | Stockholders’
Equity | |
| |
| |
| |
| |
| |
| |
| |
| |
| | | | | | | | | | | | | | | |
| Balance at December 31, 2001 | | 4,542,953 | | | $ | 45 | | | | 31,355 | | | | (19,347 | ) | | | 51,575 | | | | 440 | | | | 64,068 | | |
| | | | | | | | | | | | | | | | | | | | | | | | | |
| | |
| | | | | | | | | | | | | | | | | | | | | | | | | | | | |
| Comprehensive income: | | | | | | | | | | | | | | | | | | | | | | | | | | | | |
| | | | | | | | | | | | | | | | | | | | | | | | | | | | |
| Net income | | — | | | | — | | | | — | | | | — | | | | 8,836 | | | | — | | | | 8,836 | | |
| | | | | | | | | | | | | | | | | | | | | | | | | | | | |
| Change in unrealized gains on securities available for sale, net of income taxes of $163 | | — | | | | — | | | | — | | | | — | | | | — | | | | 271 | | | | 271 | | |
| | | | | | | | | | | | | | | | | | | | | | | | | | | | |
| Change in unrealized loss on derivative instrument, net of income tax benefit of $45 | | — | | | | — | | | | — | | | | — | | | | — | | | | (75 | ) | | | (75 | ) | |
| | | | | | | | | | | | | | | | | | | | | | | | | |
| | |
| | | | | | | | | | | | | | | | | | | | | | | | | | | | |
| Comprehensive income | | | | | | | | | | | | | | | | | | | | | | | | | | 9,032 | | |
| | | | | | | | | | | | | | | | | | | | | | | | | |
| | |
| | | | | | | | | | | | | | | | | | | | | | | | | | | | |
| Net proceeds from the issuance of common stock, stock options exercised | | 31,991 | | | | 1 | | | | 283 | | | | — | | | | — | | | | — | | | | 284 | | |
| | | | | | | | | | | | | | | | | | | | | | | | | | | | |
| Dividends paid ($.37 per share -adjusted) | | — | | | | — | | | | — | | | | — | | | | (2,002 | ) | | | — | | | | (2,002 | ) | |
| | | | | | | | | | | | | | | | | | | | | | | | | | | | |
| Purchase of treasury stock, 12,648 shares | | — | | | | — | | | | — | | | | (320 | ) | | | — | | | | — | | | | (320 | ) | |
| |
| | |
|
| | | |
| | | |
| | | |
| | | |
| | | |
| | |
| | | | | | | | | | | | | | | | | | | | | | | | | | | | |
| Balance at December 31, 2002 | | 4,574,944 | | | $ | 46 | | | | 31,638 | | | | (19,667 | ) | | | 58,409 | | | | 636 | | | | 71,062 | | |
| |
| | |
|
| | | |
| | | |
| | | |
| | | |
| | | |
| | |
(continued)
25
FFLC BANCORP, INC. AND SUBSIDIARIES
Consolidated Statements of Changes in Stockholders’ Equity, Continued
Years Ended December 31, 2004, 2003 and 2002
($ in thousands, except per share amounts)
| | Common Stock | | | | | | | | Accumulated | | | |
| |
| | Additional | | | | | | Other | | Total | |
| | Number of
Shares | | Amount | | Paid-In
Capital | | Treasury
Stock | | Retained
Income | | Comprehensive
Income | | Stockholders’
Equity | |
| |
| |
| |
| |
| |
| |
| |
| |
| | | | | | | | | | | | | | | |
| Balance at December 31, 2002 | | 4,574,944 | | | $ | 46 | | | | 31,638 | | | | (19,667 | ) | | | 58,409 | | | | 636 | | | | 71,062 | | |
| | | | | | | | | | | | | | | | | | | | | | | | | |
| | |
| | | | | | | | | | | | | | | | | | | | | | | | | | | | |
| Comprehensive income: | | | | | | | | | | | | | | | | | | | | | | | | | | | | |
| | | | | | | | | | | | | | | | | | | | | | | | | | | | |
| Net income | | — | | | | — | | | | — | | | | — | | | | 9,148 | | | | — | | | | 9,148 | | |
| | | | | | | | | | | | | | | | | | | | | | | | | | | | |
| Change in unrealized gains on securities available for sale, net of income tax benefit of $217 | | — | | | | — | | | | — | | | | — | | | | — | | | | (362 | ) | | | (362 | ) | |
| | | | | | | | | | | | | | | | | | | | | | | | | | | | |
| Change in unrealized loss on derivative instrument, net of income taxes of $14 | | — | | | | — | | | | — | | | | — | | | | — | | | | 23 | | | | 23 | | |
| | | | | | | | | | | | | | | | | | | | | | | | | |
| | |
| | | | | | | | | | | | | | | | | | | | | | | | | | | | |
| Comprehensive income | | | | | | | | | | | | | | | | | | | | | | | | | | 8,809 | | |
| | | | | | | | | | | | | | | | | | | | | | | | | |
| | |
| | | | | | | | | | | | | | | | | | | | | | | | | | | | |
| Net proceeds from the issuance of common stock, stock options exercised | | 29,989 | | | | — | | | | 217 | | | | — | | | | — | | | | — | | | | 217 | | |
| | | | | | | | | | | | | | | | | | | | | | | | | | | | |
| Dividends paid ($.46 per share) | | — | | | | — | | | | — | | | | — | | | | (2,486 | ) | | | — | | | | (2,486 | ) | |
| | | | | | | | | | | | | | | | | | | | | | | | | | | | |
| Purchase of treasury stock, 8,379 shares | | — | | | | — | | | | — | | | | (246 | ) | | | — | | | | — | | | | (246 | ) | |
| | | | | | | | | | | | | | | | | | | | | | | | | | | | |
| Three-for-two stock split | | 1,792,269 | | | | 18 | | | | (18 | ) | | | — | | | | — | | | | — | | | | — | | |
| |
| | |
|
| | | |
| | | |
| | | |
| | | |
| | | |
| | |
| | | | | | | | | | | | | | | | | | | | | | | | | | | | |
| Balance at December 31, 2003 | | 6,397,202 | | | $ | 64 | | | | 31,837 | | | | (19,913 | ) | | | 65,071 | | | | 297 | | | | 77,356 | | |
| |
| | |
|
| | | |
| | | |
| | | |
| | | |
| | | |
| | |
(continued)
26
FFLC BANCORP, INC. AND SUBSIDIARIES
Consolidated Statements of Changes in Stockholders’ Equity, Continued
Years Ended December 31, 2004, 2003 and 2002
($ in thousands, except per share amounts)
| | Common Stock | | | | | | | | Accumulated | | | |
| |
| | Additional | | | | | | Other | | Total | |
| | Number of
Shares | | Amount | | Paid-In
Capital | | Treasury
Stock | | Retained
Income | | Comprehensive
Income | | Stockholders’
Equity | |
| |
| |
| |
| |
| |
| |
| |
| |
| Balance at December 31, 2003 | | 6,397,202 | | | $ | 64 | | | | 31,837 | | | | (19,913 | ) | | | 65,071 | | | | 297 | | | | 77,356 | | |
| | | | | | | | | | | | | | | | | | | | | | | | | |
| | |
| | | | | | | | | | | | | | | | | | | | | | | | | | | | |
| Comprehensive income: | | | | | | | | | | | | | | | | | | | | | | | | | | | | |
| | | | | | | | | | | | | | | | | | | | | | | | | | | | |
| Net income | | — | | | | — | | | | — | | | | — | | | | 10,019 | | | | — | | | | 10,019 | | |
| | | | | | | | | | | | | | | | | | | | | | | | | | | | |
| Change in unrealized gains on securities available for sale, net of income tax benefit of $339 | | — | | | | — | | | | — | | | | — | | | | — | | | | (562 | ) | | | (562 | ) | |
| | | | | | | | | | | | | | | | | | | | | | | | | | | | |
| Change in unrealized loss on derivative instrument, net of income taxes of $35 | | — | | | | — | | | | — | | | | — | | | | — | | | | 58 | | | | 58 | | |
| | | | | | | | | | | | | | | | | | | | | | | | | |
| | |
| | | | | | | | | | | | | | | | | | | | | | | | | | | | |
| Comprehensive income | | | | | | | | | | | | | | | | | | | | | | | | | | 9,515 | | |
| | | | | | | | | | | | | | | | | | | | | | | | | |
| | |
| | | | | | | | | | | | | | | | | | | | | | | | | | | | |
| Net proceeds from the issuance of common stock, stock options exercised | | 14,458 | | | | — | | | | 199 | | | | — | | | | — | | | | — | | | | 199 | | |
| | | | | | | | | | | | | | | | | | | | | | | | | | | | |
| Tax benefit from stock compensation plans | | — | | | | — | | | | 317 | | | | — | | | | — | | | | — | | | | 317 | | |
| | | | | | | | | | | | | | | | | | | | | | | | | | | | |
| Dividends paid ($.52 per share) | | — | | | | — | | | | — | | | | — | | | | (2,809 | ) | | | — | | | | (2,809 | ) | |
| | | | | | | | | | | | | | | | | | | | | | | | | | | | |
| Purchase of treasury stock, 3,325 shares | | — | | | | — | | | | — | | | | (86 | ) | | | — | | | | — | | | | (86 | ) | |
| |
| | |
|
| | | |
| | | |
| | | |
| | | |
| | | |
| | |
| | | | | | | | | | | | | | | | | | | | | | | | | | | | |
| Balance at December 31, 2004 | | 6,411,660 | | | $ | 64 | | | | 32,353 | | | | (19,999 | ) | | | 72,281 | | | | (207 | ) | | | 84,492 | | |
| |
| | |
|
| | | |
| | | |
| | | |
| | | |
| | | |
| | |
See accompanying Notes to Consolidated Financial Statements.
27
FFLC BANCORP, INC. AND SUBSIDIARIES
Consolidated Statements of Cash Flows
(In thousands)
| | Year Ended December 31, | |
| |
| |
| | 2004 | | 2003 | | 2002 | |
| |
| |
| |
| |
| Cash flows from operating activities: | | | | | | | | |
| Net income | | $ | 10,019 | | 9,148 | | 8,836 | |
| Adjustments to reconcile net income to net cash provided by operations: | | | | | | | | |
| Provision for loan losses | | | 1,675 | | 1,514 | | 1,845 | |
| Depreciation and amortization | | | 1,339 | | 1,351 | | 1,062 | |
| Deferred income tax benefit | | | (58 | ) | (444 | ) | (331 | ) |
| Net amortization of premiums and discounts on securities | | | 384 | | 1,064 | | 297 | |
| Net amortization of deferred loan fees and costs | | | 160 | | 258 | | (142 | ) |
| Net gain on sales of loans held for sale | | | (495 | ) | (1,178 | ) | (403 | ) |
| Loan originated for sale | | | (14,354 | ) | (77,670 | ) | (44,207 | ) |
| Proceeds from sales of loans held for sale | | | 20,300 | | 77,704 | | 37,289 | |
| Tax benefit from stock compensation plans | | | 317 | | — | | — | |
| Net (increase) decrease in accrued interest receivable | | | (44 | ) | 332 | | 12 | |
| Net (increase) decrease in other assets | | | (3,854 | ) | 139 | | (514 | ) |
| Net increase in accrued expenses and other liabilities | | | 1,514 | | 667 | | 1,650 | |
| |
|
| |
| |
| |
| | | | | | | | |
| Net cash provided by operating activities | | | 16,903 | | 12,885 | | 5,394 | |
| |
|
| |
| |
| |
| | | | | | | | |
| Cash flows from investing activities: | | | | | | | | |
| Purchase of securities available for sale | | | (19,401 | ) | (42,139 | ) | (41,433 | ) |
| Proceeds from principal repayments and maturities of securities available for sale | | | 25,740 | | 35,683 | | 23,749 | |
| Loan disbursements | | | (301,391 | ) | (251,919 | ) | (209,046 | ) |
| Principal repayments on loans | | | 176,602 | | 216,960 | | 163,820 | |
| Purchase of premises and equipment, net | | | (2,413 | ) | (3,430 | ) | (6,093 | ) |
| Net (purchase) redemption of Federal Home Loan Bank stock | | | (1,882 | ) | 800 | | — | |
| Net proceeds from sales of foreclosed assets | | | 2,168 | | 1,427 | | 1,188 | |
| |
|
| |
| |
| |
| | | | | | | | |
| Net cash used in investing activities | | | (120,577 | ) | (42,618 | ) | (67,815 | ) |
| |
|
| |
| |
| |
| | | | | | | | |
| Cash flows from financing activities: | | | | | | | | |
| Net increase in deposits | | | 89,571 | | 37,531 | | 82,930 | |
| Net increase (decrease) in Federal Home Loan Bank advances | | | 20,000 | | (16,000 | ) | (5,000 | ) |
| Net (decrease) increase in other borrowed funds | | | (755 | ) | 3,483 | | 976 | |
| Increase in junior subordinated debentures | | | — | | — | | 5,155 | |
| Issuance of common stock | | | 199 | | 217 | | 284 | |
| Purchase of treasury stock | | | (86 | ) | (246 | ) | (320 | ) |
| Cash dividends paid | | | (2,809 | ) | (2,486 | ) | (2,002 | ) |
| |
|
| |
| |
| |
| | | | | | | | |
| Net cash provided by financing activities | | | 106,120 | | 22,499 | | 82,023 | |
| |
|
| |
| |
| |
| | | | | | | | |
| | | | | | | | |
| Net increase (decrease) in cash and cash equivalents | | | 2,446 | | (7,234 | ) | 19,602 | |
| | | | | | | | |
| Cash and cash equivalents at beginning of year | | | 62,160 | | 69,394 | | 49,792 | |
| |
|
| |
| |
| |
| | | | | | | | |
| Cash and cash equivalents at end of year | | $ | 64,606 | | 62,160 | | 69,394 | |
| |
|
| |
| |
| |
| | | | | | | | | | | | | |
(continued)
28
FFLC BANCORP, INC. AND SUBSIDIARIES
Consolidated Statements of Cash Flows, Continued
(In thousands)
| | Year Ended December 31, | |
| |
| |
| | 2004 | | 2003 | | 2002 | |
| |
| |
| |
| |
| Supplemental disclosures of cash flow information: | | | | | | | | |
| Cash paid during the year for: | | | | | | | | |
| Interest | | $ | 23,269 | | 24,772 | | 29,690 | |
| |
|
| |
| |
| |
| | | | | | | | |
| Income taxes | | $ | 5,948 | | 6,208 | | 5,458 | |
| |
|
| |
| |
| |
| | | | | | | | |
| Noncash investing and financing activities: | | | | | | | | |
| Accumulated other comprehensive income: | | | | | | | | |
| Net change in unrealized gain on securities available for sale, net of tax | | $ | (562 | ) | (362 | ) | 271 | |
| |
|
| |
| |
| |
| | | | | | | | |
| Net change in unrealized loss on derivative investment,net of tax | | $ | 58 | | 23 | | (75 | ) |
| |
|
| |
| |
| |
| | | | | | | | |
| Transfers from loans to foreclosed assets | | $ | 1,835 | | 1,951 | | 1,679 | |
| |
|
| |
| |
| |
| | | | | | | | |
| Loans originated on sales of foreclosed assets | | $ | 325 | | 269 | | 238 | |
| |
|
| |
| |
| |
| | | | | | | | |
| Loans funded by and sold to correspondent | | $ | 11,168 | | 14,383 | | 20,541 | |
| |
|
| |
| |
| |
| | | | | | | | | | | |
See accompanying Notes to Consolidated Financial Statements.
29
FFLC BANCORP, INC. AND SUBSIDIARIES
Notes to Consolidated Financial Statements
December 31, 2004, 2003 and For Each of the Three Years in the
Period Ended December 31, 2004
(1) | Summary of Significant Accounting Policies |
| FFLC Bancorp, Inc. (the “Holding Company”) was incorporated in Delaware on September 16, 1993, and acquired First Federal Savings Bank of Lake County (the “Bank”) in connection with the Bank’s conversion to stock form on January 4, 1994. The Holding Company is a savings and loan holding company subject to regulation by the Office of Thrift Supervision (“OTS”) which mainly transacts its business through its subsidiary, the Bank. The Bank is a community-oriented savings institution, chartered in 1934, which offers a variety of financial services to individuals and businesses primarily located in Lake County, Sumter County, Citrus County and Marion County, Florida. The Bank’s deposits are insured by the Federal Deposit Insurance Corporation (“FDIC”) through the Savings Association Insurance Fund (“SAIF”). |
| | | |
| | First Alliance Title, LLC (“First Alliance”), a 90% owned subsidiary of the Holding Company was formed to operate as a title agency. First Alliance ceased operations in November 2003. |
| Definitive Agreement. On January 14, 2005, the Holding Company entered into a definitive agreement for the Holding Company to be acquired by Colonial BancGroup, Inc., a bank holding company incorporated in Delaware with a subsidiary bank, Colonial Bank, N.A., operating in Alabama, Florida, Georgia, Nevada, Tennessee, and Texas. Under the terms of the agreement, stockholders of the Holding Company will elect to receive either 2.0 shares of Colonial common stock or $42.00 in cash for each share of the Holding Company common stock they own. The cash consideration will be capped at 35% of the transaction and an over-election of cash will result in a pro rata distribution of stock. Completion of the transaction is subject to approval by the stockholders of the Holding Company and various regulatory agencies. |
| | |
| Principles of Consolidation. The consolidated financial statements include the accounts of the Holding Company and its two subsidiaries, the Bank and First Alliance and the Bank’s wholly-owned subsidiary, Lake County Service Corporation (the “Service Corporation”) (all together, the “Company”). All significant intercompany transactions and balances have been eliminated in consolidation. |
| | |
| General. The accounting and reporting policies of the Company conform to accounting principles generally accepted in the United States of America and to general practices within the banking industry. The following summarizes the significant accounting policies of the Company: |
| | |
| Use of Estimates. In preparing consolidated financial statements in conformity with accounting principles generally accepted in the United States of America, management is required to make estimates and assumptions that affect the reported amounts of assets and liabilities as of the date of the balance sheet and reported amounts of revenues and expenses during the reporting period. Actual results could differ from those estimates. Material estimates that are particularly susceptible to significant change in the near term relate to the determination of the allowance for loan losses and foreclosed assets and the valuation of deferred tax assets. |
| | |
| Cash and Cash Equivalents. For purposes of the consolidated statements of cash flows, cash and cash equivalents include cash and balances due from banks and interest-earning deposits. |
| | The Bank is required to maintain certain cash reserve balances pursuant to regulations of the Federal Reserve Board based on the balances of its transaction deposit accounts. These balances must be maintained in the form of vault cash or noninterest-earning deposits at other banks. The reserve balances at December 31, 2004 and 2003 were approximately $7.7 million and $9.0 million, respectively. |
30
| Securities. The Company may classify its securities as either trading, held to maturity or available for sale. Trading securities are held principally for resale and recorded at their fair values. Unrealized gains and losses on trading securities are included immediately in earnings. Held-to-maturity securities are those which the Company has the positive intent and ability to hold to maturity and are reported at amortized cost. Available-for-sale securities consist of securities not classified as trading securities nor as held-to-maturity securities. Unrealized holding gains and losses, net of tax, on available-for-sale securities are excluded from income and reported in other comprehensive income. Gains and losses on the sale of available-for-sale securities are recorded on the trade date and determined using the specific-identification method. Premiums and discounts on securities available for sale are recognized in interest income using the interest method over the period to maturity. |
| | Purchase premiums and discounts are recognized in interest income using the interest method over the terms of the securities. Declines in the fair value of held to maturity and available-for-sale securities below their cost that are deemed to be other then temporary are reflected in income as realized losses. In estimating other-than-temporary impairment losses, management considers (1) the length of time and the extent to which the fair value has been loess than cost, (2) the financial condition and near-term prospects of the issuer, and (3) the intent and ability of the Company to retain its investment in the issuer for a period of time sufficient to allow for any anticipated recovery in fair value. |
| Loans Held For Sale. Loans originated and held for sale by the Company are carried at the lower of cost or fair value using the specific identification method. At December 31, 2004 and 2003, the aggregate fair value of loans held for sale exceeded the carrying value. Gains and losses on the sales of such loans are recognized using the specific identification method. The Company held $10.1 million and $15.6 million of loans held for sale at December 31, 2004 and 2003, respectively, which are included in loans on the accompanying consolidated balance sheets. |
| | |
| Loans. Loans that management has the intent and the Company has the ability to hold for the foreseeable future or until maturity or pay-off are reported at their outstanding principal adjusted for any charge-offs, the allowance for loan losses, and any deferred fees or costs on originated loans. |
| | Loan origination fees are deferred and certain direct origination costs are capitalized. Both are recognized as an adjustment of the yield of the related loan. |
| | |
| | The accrual of interest on loans is discontinued at the time the loan is ninety days delinquent unless the loan is well collateralized and in process of collection. In all cases, loans are placed on nonaccrual or charged-off at an earlier date if collection of principal or interest is considered doubtful. |
| | |
| | All interest accrued but not collected for loans that are placed on nonaccrual or charged-off is reversed against interest income. The interest on these loans is accounted for on the cash-basis or cost-recovery method, until qualifying for return to accrual. Loans are returned to accrual status when all the principal and interest amounts contractually due are brought current and future payments are reasonably assured. |
31
| Allowance for Loan Losses. The allowance for loan losses is established as losses are estimated to have occurred through a provision for loan losses charged to income. Loan losses are charged against the allowance when management believes the uncollectibility of a loan balance is confirmed. Subsequent recoveries, if any, are credited to the allowance. |
| The allowance for loan losses is evaluated on a regular basis by management and is based upon management’s periodic review of the collectibility of the loans in light of historical experience, the nature and volume of the loan portfolio, adverse situations that may affect the borrower’s ability to repay, estimated value of any underlying collateral, prevailing economic conditions and industry standards. This evaluation is inherently subjective as it requires estimates that are susceptible to significant revision as more information becomes available. |
| | |
| | A loan is considered impaired when, based on current information and events, it is probable that the Company will be unable to collect the scheduled payments of principal or interest when due according to the contractual terms of the loan agreement. Factors considered by management in determining impairment include payment status, collateral value, and the probability of collecting scheduled principal and interest payments when due. Loans that experience insignificant payment delays and payment shortfalls generally are not classified as impaired. Management determines the significance of payment delays and payment shortfalls on a case-by-case basis, taking into consideration all of the circumstances surrounding the loan and the borrower, including the length of the delay, the reasons for the delay, the borrower’s prior payment record, and the amount of the shortfall in relation to the principal and interest owed. Impairment is measured on a loan by loan basis for commercial loans by either the present value of expected future cash flows discounted at the loan’s effective interest rate, the loan’s obtainable market price, or the fair value of the collateral if the loan is collateral dependent. |
| | |
| | Large groups of smaller balance homogeneous loans are collectively evaluated for impairment. Accordingly, the Company does not separately identify individual consumer and residential loans for impairment disclosures. |
| Foreclosed Assets. Assets acquired through, or in lieu of, loan foreclosure are held for sale and are initially recorded at the lower of fair value or the loan balance at the date of foreclosure or repossession. Subsequently, valuations are periodically performed by management and the assets are carried at the lower of carrying amount or fair value less cost to sell. Revenues and expenses from operations and changes in the valuation allowance are included in income. |
| |
| Premises and Equipment. Land is carried at cost. The Company’s premises, furniture and equipment and leasehold improvements are carried at cost, less accumulated depreciation and amortization computed principally using the straight-line method. |
| |
| Transfer of Financial Assets. Transfers of financial assets are accounted for as sales, when control over the assets has been surrendered. Control over transferred assets is deemed to be surrendered when (1) the assets have been isolated from the Company, (2) the transferee obtains the right (free of conditions that constrain it from taking advantage of that right) to pledge or exchange the transferred assets, and (3) the Company does not maintain effective control over the transferred assets through an agreement to repurchase them before their maturity. |
| |
| Income Taxes. Deferred income tax assets and liabilities are recorded to reflect the tax consequences on future years of temporary differences between revenues and expenses reported for financial statement and those reported for income tax purposes. Deferred tax assets and liabilities are measured using the enacted tax rates expected to apply to taxable income in the years in which those temporary differences are expected to be realized or settled. Valuation allowances are provided against assets which are not likely to be realized. |
32
| Stock Compensation Plans. Statement of Financial Accounting Standards (SFAS) No. 123,Accounting for Stock-Based Compensation, as amended by SFAS No. 148,Accounting for Stock-Based Compensation Transition and Disclosure (collectively, “SFAS 123”) encourages all entities to adopt a fair value based method of accounting for employee stock compensation plans, whereby compensation cost is measured at the grant date based on the value of the award and is recognized over the service period, which is usually the vesting period. However, it also allows an entity to continue to measure compensation cost for those plans using the intrinsic value based method of accounting prescribed by Accounting Principles Board Opinion No. 25,Accounting for Stock Issued to Employees (APB No. 25), whereby compensation cost is the excess, if any, of the quoted market price of the stock at the grant date (or other measurement date) over the amount an employee must pay to acquire the stock. The Company accounts for its stock option plans under the recognition and measurement principles of APB No. 25. No stock-based employee compensation cost is reflected in net income as all options granted under those plans had an exercise price equal to the market value of the underlying common stock on the date of grant. The following table illustrates the effect on net income and income per share if the Company had applied the fair value recognition provisions of SFAS 123 to stock-based employee compensation ($ in thousands, except per share data). |
| | | Years Ended December 31, | |
| | |
| |
| | | 2004 | | 2003 | | 2002 | |
| | |
| |
| |
| |
| | | | | | | | | | | |
| Net income, as reported | | $ | 10,019 | | | 9,148 | | | 8,836 | |
| Deduct: Total stock-based employee compensation determined under the fair value based method for all awards, net of related tax effect | | | (181 | ) | | (59 | ) | | (7 | ) |
| | |
|
| |
|
| |
|
| |
| | | | | | | | | | | |
| Proforma net income | | $ | 9,838 | | | 9,089 | | | 8,829 | |
| | |
|
| |
|
| |
|
| |
| | | | | | | | | | | |
| Basic income per share, as reported | | $ | 1.86 | | | 1.70 | | | 1.65 | |
| | |
|
| |
|
| |
|
| |
| | | | | | | | | | | |
| Proforma basic income per share | | $ | 1.82 | | | 1.69 | | | 1.65 | |
| | |
|
| |
|
| |
|
| |
| | | | | | | | | | | |
| Diluted income per share, as reported | | $ | 1.83 | | | 1.67 | | | 1.61 | |
| | |
|
| |
|
| |
|
| |
| | | | | | | | | | | |
| Proforma diluted income per share | | $ | 1.80 | | | 1.67 | | | 1.61 | |
| | |
|
| |
|
| |
|
| |
| | In order to calculate the fair value of the options granted using the Black-Scholes model, it was assumed that the risk-free interest rate for 2004 was 3.87%, the annualized dividend yield was 2.0%, the expected life of the options was five years and stock volatility was 22%. For purposes of pro forma disclosures, the estimated fair value is included in expense during the vesting period. |
| | | Years Ended December 31, | |
| | |
| |
| | | 2004 | | 2003 | | 2002 | |
| | |
| |
| |
| |
| | | | | | | | | | | |
| Grant-date fair value per option of options issued during the year | | $ | 6.73 | | | 6.86 | | | N/A | |
| | |
|
| |
|
| |
|
| |
| Derivative Financial Instruments. The Company has one derivative instrument which is used to hedge its interest-rate exposure by modifying the characteristics of the related balance sheet instrument. This derivative instrument qualifies as a cash flow hedge under the provisions of Statement of Financial Accounting Standards No. 133 “Accounting for Derivative Instruments and Hedging Activities” (“SFAS 133”). Changes in the fair value of a derivative that is highly effective, and that is designated and qualifies as a cash flow hedge, are recorded in other comprehensive income (loss), net of tax. |
| | |
| Off-Balance Sheet Instruments. In the ordinary course of business, the Company has entered into off-balance sheet instruments consisting of commitments to extend credit, unused lines of credit, undisbursed loans in process and standby letters of credit. Such financial instruments are recorded in the financial statements when they are funded. |
33
| Fair Values of Financial Instruments. The fair value of a financial instrument is the current amount that would be exchanged between willing parties, other than in a forced liquidation. Fair value is best determined based upon quoted market prices. However, in many instances, there are no quoted market prices for the Company’s various financial instruments. In cases where quoted market prices are not available, fair values are based on estimates using present value or other valuation techniques. Those techniques are significantly affected by the assumptions used, including the discount rate and estimates of future cash flows. Accordingly, the fair value estimates may not be realized in an immediate settlement of the instrument or may not necessarily represent the underlying fair value of the instrument to the Company. The following methods and assumptions were used by the Company in estimating fair values of financial instruments: |
| | |
| | | Cash and Cash Equivalents. The carrying amounts of cash and cash equivalents approximate their fair value. |
| | | |
| | | Securities. Fair values for securities available for sale are based on quoted market prices, where available. If quoted market prices are not available, fair values are based on quoted market prices of comparable instruments. |
| | | |
| | | Federal Home Loan Bank Stock. Fair value of the Company’s investment in Federal Home Loan Bank stock is based on its redemption value, which is its cost of $100 per share. |
| | | |
| | | Loans. For variable-rate loans that reprice frequently and have no significant change in credit risk, fair values are based on carrying values. Fair values for fixed-rate loans are estimated using discounted cash flow analyses, using interest rates currently being offered for loans with similar terms to borrowers of similar credit quality. |
| | | |
| | | Deposit Liabilities. The fair values disclosed for demand, NOW, money-market and savings deposits are, by definition, equal to the amount payable on demand at the reporting date (that is, their carrying amounts). Fair values for fixed-rate certificates of deposit are estimated using a discounted cash flow calculation that applies interest rates currently being offered on certificates to a schedule of aggregated expected monthly maturities of certificates of deposit. |
| | | |
| | | Borrowed Funds. The carrying amounts of borrowings under repurchase agreements approximate their fair values. Fair values of Federal Home Loan Bank advances and junior subordinated debentures are estimated using discounted cash flow analysis based on the Company’s current incremental borrowing rates for similar types of borrowing arrangements. |
| | | |
| | | Derivative Instruments. Fair value for the derivative instrument (interest-rate swap) is based on current settlement value. |
| | | |
| | | Accrued Interest. The carrying amounts of accrued interest approximate their fair values. |
| | | |
| | | Off-Balance Sheet Instruments. Fair values for off-balance sheet lending commitments are based on fees currently charged to enter into similar agreements, taking into account the remaining terms of the agreements and the counterparties’ credit standing. |
34
| Income Per Share of Common Stock. The Company follows the provisions of Financial Accounting Standards No. 128, “Earnings Per Share” (SFAS No. 128). SFAS No. 128 provides accounting and reporting standards for calculating income per share. Basic income per share of common stock has been computed by dividing the net income for the year by the weighted-average number of shares outstanding. Shares of common stock purchased by the Retention and Recognition Plan (“RRP”) (see Note 17) are only considered outstanding when the shares are released or committed to be released for allocation to participants. As of December 31, 2002, 2003 and 2004, 4,102, 3,020 and 0 shares remain uncommitted under the RRP plan, respectively, and are not considered outstanding for purposes of the computation of net income per share of common stock. Diluted income per share is computed by dividing net income by the weighted-average number of shares outstanding including the dilutive effect of stock options (see Note 17) computed using the treasury stock method. All per share amounts reflect the three-for-two stock split declared on February 14, 2003. The following table presents the calculation of basic and dilutive income per share of common stock: |
| | | Year Ended December 31, | |
| | |
| |
| | | 2004 | | 2003 | | 2002 | |
| | |
| |
| |
| |
| Weighted-average shares of common stock issued and outstanding before adjustments for RRP and common stock options | | | 5,401,376 | | | 5,389,219 | | | 5,364,600 | |
| | | | | | | | | | | |
| Adjustment to reflect the effect of unallocated RRP average shares | | | (1,162 | ) | | (4,020 | ) | | (4,102 | ) |
| | |
|
| |
|
| |
|
| |
| | | | | | | | | | | |
| Weighted-average shares for basic income per share | | | 5,400,214 | | | 5,385,199 | | | 5,360,498 | |
| | |
|
| |
|
| |
|
| |
| | | | | | | | | | | |
| Basic income per share | | $ | 1.86 | | | 1.70 | | | 1.65 | |
| | |
|
| |
|
| |
|
| |
| | | | | | | | | | | |
| Total weighted-average common shares and equivalents outstanding for basic income per share computation | | | 5,400,214 | | | 5,385,199 | | | 5,360,498 | |
| | | | | | | | | | | |
| Additional dilutive shares using the average market value for the period utilizing the treasury stock method regarding stock options | | | 70,216 | | | 71,697 | | | 106,382 | |
| | |
|
| |
|
| |
|
| |
| | | | | | | | | | | |
| Weighted-average common shares and equivalents outstanding for diluted income per share | | | 5,470,430 | | | 5,456,896 | | | 5,466,880 | |
| | |
|
| |
|
| |
|
| |
| | | | | | | | | | | |
| Diluted income per share | | $ | 1.83 | | | 1.67 | | | 1.61 | |
| | |
|
| |
|
| |
|
| |
| Comprehensive Income. Accounting principles generally require that recognized revenue, expenses, gains and losses be included in net income. Although certain changes in assets and liabilities, such as unrealized gains and losses on available-for-sale securities, are reported as a separate component of the equity section of the balance sheet, such items, along with net income, are components of comprehensive income. The components of other comprehensive income (loss) were unrealized holding gains and losses on securities available for sale and the interest-rate swap. |
| | |
| Other Recent Pronouncements .In April 2003, the FASB issued SFAS No. 149,“Amendment of Statement 133 on Derivative Instruments and Hedging Activities.” This Statement amended and clarified financial accounting and reporting for derivative instruments, including certain derivative instruments embedded in other contracts (collectively referred to as derivatives) and for hedging activities under FASB Statement No. 133,“Accounting for Derivative Instruments and Hedging Activities.” This Statement was effective for contracts entered into or modified after June 30, 2003. The adoption of this Statement had no effect on the Company’s consolidated financial statements. |
35
| | In May 2003, the FASB issued SFAS No. 150,“Accounting for Certain Financial Instruments with Characteristics of both Liabilities and Equity.” This Statement establishes standards for how an issuer classifies and measures certain financial instruments with characteristics of both liabilities and equity. This Statement was effective for financial instruments entered into or modified after May 31, 2003, and otherwise was effective at the beginning of the first interim period beginning after June 15, 2003. The adoption of this Statement had no effect on the Company’s consolidated financial statements. |
| | |
| | In December 2004, the FASB issued SFAS No. 123 (revised 2004), “Share-Based Payment.” This Statement requires a public entity to measure the cost of employee services received in exchange for an award of equity instruments, which includes stock options and warrants, based on the grant-date fair value of the award. That cost will be recognized over the period during which an employee is required to provide service in exchange for the award. Public entities will adopt this Statement using a modified version of prospective application. Under this application, this Statement will apply to new awards and to awards modified, repurchased, or cancelled after the required effective date and to awards not yet vested that exist as of the effective date. This Statement is effective as of the beginning of the first interim or annual reporting period that begins after June 15, 2005. Management has not yet determined what effect this Statement will have on the Company’s 2005 consolidated financial statements. |
| | |
| | In December 2004, the FASB issued SFAS No. 153, “Exchanges of Nonmonetary Assets-an amendment to APB opinion No. 29. This statement addresses the measurement of exchanges of nonmonetary assets. The statement is effective for fiscal periods beginning after June 15, 2005. Management believes the overall effect of this statement will not have a material effect to the Company’s consolidated financial statements. |
| | |
| | In December 2003, the American Institute of Certified Public Accountants issued Statement of Position 03-3, “Accounting for Certain Loans and Debt Securities Acquired in a Transfer” (SOP 03-3). SOP 03-3 addresses accounting for differences between contractual cash flows expected to be collected and an investor’s initial investment in loans or debt securities acquired in a transfer if those differences are attributable, at least in part, to credit quality. SOP 03-3 also prohibits “carrying over” or creation of valuation allowances in the initial accounting of all loans acquired in a transfer that are within the scope of SOP 03-3. The prohibition of the valuation allowance carryover applies to the purchase of an individual loan, a pool of loans, a group of loans, and loans acquired in a purchase business combination. SOP 03-3 is effective for loans acquired in fiscal years beginning after December 15, 2004. The Company does not anticipate that the adoption of SOP 03-3 will have a material impact on its financial condition or result of operations. |
| | |
| | In March 2004, the Emerging Issues Task Force reached a consensus on Issue 03-1, “Meaning of Other Than Temporary Impairment” (Issue 03-1). The Task Force reached a consensus on an other-than-temporary impairment model for debt and equity securities accounted for under Statement of Financial Accounting Standards No. 115, “Accounting for Certain Investments in Debt and Equity Securities” and cost method investments, and required certain additional financial statement disclosures. The implementation of the “Other-Than-Temporary Impairment” component of this consensus has been postponed. Management cannot determine the effect of the adoption of this guidance on the Company’s financial condition or results of operations. |
| | |
| Reclassifications. Certain immaterial amounts in the 2002 and 2003 consolidated financial statements have been reclassified to conform to the presentation for 2004. |
36
(2) | Securities |
| All securities have been classified as available for sale by management. The carrying amounts of securities available for sale and their approximate fair values were as follows: |
| | | Amortized
Cost | | Gross
Unrealized
Gains | | Gross
Unrealized
Losses | | Fair
Value | |
| | |
| |
| |
| |
| |
| | | (In thousands) | |
| Securities available for sale: | | | | | | | | | | | | | |
| At December 31, 2004: | | | | | | | | | | | | | |
| | Mutual funds | | | $ | 9,371 | | | | | — | | | | | (203 | ) | | | 9,168 | |
| | U.S. Government and agency securities | | | | 35,120 | | | | | 7 | | | | | (156 | ) | | | 34,971 | |
| | Mortgage-backed securities | | | | 22,720 | | | | | 154 | | | | | (192 | ) | | | 22,682 | |
| | Other investment securities | | | | 7,644 | | | | | 48 | | | | | — | | | | 7,692 | |
| | | |
|
| | | |
|
| | | |
|
| | |
|
| |
| | | | | | | | | | | | | | | | | | | | |
| | Total | | | $ | 74,855 | | | | | 209 | | | | | (551 | ) | | | 74,513 | |
| | | |
|
| | | |
|
| | | |
|
| | |
|
| |
| | | | | | | | | | | | | | | | | | | | |
| At December 31, 2003: | | | | | | | | | | | | | | | | | | | |
| | Mutual funds | | | | 9,146 | | | | | — | | | | | (130 | ) | | | 9,016 | |
| | U.S. Government and agency securities | | | | 36,298 | | | | | 342 | | | | | (1 | ) | | | 36,639 | |
| | Mortgage-backed securities | | | | 28,229 | | | | | 317 | | | | | (7 | ) | | | 28,539 | |
| | Other investment securities | | | | 7,904 | | | | | 39 | | | | | — | | | | 7,943 | |
| | | |
|
| | | |
|
| | | |
|
| | |
|
| |
| | | | | | | | | | | | | | | | | | | | |
| | Total | | | $ | 81,577 | | | | | 698 | | | | | (138 | ) | | | 82,137 | |
| | | |
|
| | | |
|
| | | |
|
| | |
|
| |
| | | | | | | | | | | | | | | | | | | | | | |
| The scheduled maturities of securities available for sale at December 31, 2004 were as follows: |
| | | Amortized
Cost | | Fair
Value | |
| | |
| |
| |
| | | | (In thousands) | |
| | | | | | | | |
| Due in less than one year | | | $ | 10,012 | | | | 10,014 | |
| Due from one year to five years | | | | 25,108 | | | | 24,958 | |
| Due after ten years | | | | 7,644 | | | | 7,691 | |
| Mortgage-backed securities | | | | 22,720 | | | | 22,682 | |
| Mutual funds | | | | 9,371 | | | | 9,168 | |
| | | |
|
| | |
|
| |
| | | | | | | | | | |
| | Total | | | $ | 74,855 | | | | 74,513 | |
| | | |
|
| | |
|
| |
| | | | | | | | | | | |
| Securities with a carrying value of approximately $9.0 million and $13.5 million at December 31, 2004 and 2003, respectively, were pledged to secure public funds and tax deposits. The Company has also pledged securities with carrying values of $21.0 million and $22.5 million for borrowings under retail repurchase agreements with customers at December 31, 2004 and 2003, respectively (See Note 6). |
| | |
| There were no sales of securities during the years ended December 31, 2004, 2003 or 2002. |
37
| Information pertaining to securities with gross unrealized losses at December 31, 2004, aggregated by investment category and length of time that individual securities have been in a continuous loss position, follows: |
| | | Less Than Twelve Months | | Over Twelve Months | |
| | |
| |
| |
| | | Gross
Unrealized
Losses | | Fair
Value | | Gross
Unrealized
Losses | | Fair
Value | |
| | |
| |
| |
| |
| |
| | | ( In Thousands) | |
| Securities available for sale: | | | | | | | | | | | | | |
| | Debt securities: | | | | | | | | | | | | | |
| | U.S. Government and agency securities | | | $ | (133 | ) | | | 30,991 | | | | (24 | ) | | | 1,974 | |
| | Mortgage-backed securities | | | | (191 | ) | | | 11,213 | | | | — | | | | — | |
| | | |
|
| | |
|
| | |
|
| | |
|
| |
| | | | | | | | | | | | | | | | | | |
| | Total debt securities available for sale | | | | (324 | ) | | | 42,204 | | | | (24 | ) | | | 1,974 | |
| | | | | | | | | | | | | | | | | | |
| | Mutual funds | | | | — | | | | — | | | | (203 | ) | | | 8,729 | |
| | | |
|
| | |
|
| | |
|
| | |
|
| |
| | | | | | | | | | | | | | | | | | |
| | Total securities available for sale | | | $ | (324 | ) | | | 42,204 | | | | (227 | ) | | | 10,703 | |
| | | |
|
| | |
|
| | |
|
| | |
|
| |
| | | | | | | | | | | | | | | | | | | | | |
| Management evaluates securities for other-than-temporary impairment at least on a quarterly basis, and more frequently when economic or market concerns warrant such evaluation. Consideration is given to (1) the length of time and the extent to which the fair value has been less than cost, (2) the financial condition and near-term prospects of the issuer, and (3) the intent and ability of the Company to retain its investment in the issuer for a period of time sufficient to allow for any anticipated recovery in fair value. |
| | |
| At December 31, 2004, the Company has 27 debt securities and mutual funds with unrealized losses. Management believes these unrealized losses relate to changes in interest rates and not credit quality. Management also believes the Company has the ability to hold these securities until maturity, or for the foreseeable future and therefore no declines are deemed to be other than temporary. |
38
(3) | Loans |
| The components of loans were as follows: |
| | | At December 31, | |
| | |
| |
| | | 2004 | | 2003 | |
| | |
| |
| |
| | | (In thousands) | |
| First mortgage loans secured by: | | | | | | | |
| | One-to-four-family residential * | | $ | 438,610 | | | 384,514 | |
| | Construction and land | | | 82,011 | | | 43,575 | |
| | Multi-family units | | | 11,045 | | | 12,453 | |
| | Commercial real estate, churches and other | | | 183,813 | | | 167,381 | |
| Consumer loans | | | 183,793 | | | 155,438 | |
| Commercial loans | | | 37,550 | | | 33,990 | |
| | |
|
| |
|
| |
| | | | | | | | |
| | Subtotal (1) | | | 936,822 | | | 797,351 | |
| | | | | | | | |
| Undisbursed portion of loans in process | | | (47,490 | ) | | (24,573 | ) |
| Net deferred loan costs | | | 1,140 | | | 699 | |
| Allowance for loan losses (2) | | | (6,492 | ) | | (5,490 | ) |
| | |
|
| |
|
| |
| | | | | | | | |
| | Loans, net | | $ | 883,980 | | | 767,987 | |
| | |
|
| |
|
| |
| | | | | | | | | | |
| * Includes $10.1 million and $15.6 million of loans held for sale at December 31, 2004 and 2003, respectively. |
| |
| (1) Total loans outstanding by department consists of the following ($ in thousands): |
| | | At December 31, | |
| | |
| |
| | | 2004 | | 2003 | |
| | |
| |
| |
| | | Amount | | % of
Total | | Amount | | % of
Total | |
| | |
| |
| |
| |
| |
| | | | | | |
| Residential | | $ | 433,116 | | | 46.23 | % | $ | 372,551 | | | 46.72 | % |
| Commercial | | | 315,507 | | | 33.68 | | | 265,655 | | | 33.32 | |
| Consumer | | | 188,199 | | | 20.09 | | | 159,145 | | | 19.96 | |
| | |
|
| |
|
| |
|
| |
|
| |
| | | | | | | | | | | | | | |
| | | $ | 936,822 | | | 100.00 | % | $ | 797,351 | | | 100.00 | % |
| | |
|
| |
|
| |
|
| |
|
| |
39
| | (2) Total allowance for loan losses by department consists of the following (in thousands): |
| | | | At December 31, | |
| | | |
| |
| | | | 2004 | | 2003 | |
| | | |
| |
| |
| | | | Amount | | % to
Gross
Loans | | Amount | | % to
Gross
Loans | |
| | | |
| |
| |
| |
| |
| | | | | | | | | | | | | | | |
| | Residential | | $ | 989 | | | .23 | % | $ | 911 | | | .24 | % |
| | Commercial | | | 4,013 | | | 1.27 | | | 3,371 | | | 1.27 | |
| | Consumer | | | 1,490 | | | .79 | | | 1,208 | | | .76 | |
| | | |
|
| |
|
| |
|
| |
|
| |
| | | | | | | | | | | | | | | |
| | | | $ | 6,492 | | | .69 | % | $ | 5,490 | | | .69 | % |
| | | |
|
| |
|
| |
|
| |
|
| |
| | Total gross loans originated by department, including unfunded construction and line of credit loans, consist of the following: |
| | | | Year Ended
December 31, | |
| | | |
| |
| | | | 2004 | | 2003 | |
| | | |
| |
| |
| | | | (In thousands) | |
| | | | | | | | | |
| | Residential | | $ | 184,885 | | | 191,048 | |
| | Commercial | | | 139,653 | | | 118,633 | |
| | Consumer | | | 131,290 | | | 96,829 | |
| | | |
|
| |
|
| |
| | | | | | | | | |
| | | | $ | 455,828 | | | 406,510 | |
| | | |
|
| |
|
| |
| | An analysis of the change in the allowance for loan losses follows: |
| | | | Year Ended December 31, | |
| | | |
| |
| | | | 2004 | | 2003 | | 2002 | |
| | | |
| |
| |
| |
| | | | (In thousands) | |
| | | | | | | | | | | | |
| | Balance at January 1 | | $ | 5,490 | | | 5,181 | | | 4,289 | |
| | Provision for loan losses | | | 1,675 | | | 1,514 | | | 1,845 | |
| | Net loans charged-off | | | (673 | ) | | (1,205 | ) | | (953 | ) |
| | | |
|
| |
|
| |
|
| |
| | | | | | | | | | | | |
| | Balance at December 31 | | $ | 6,492 | | | 5,490 | | | 5,181 | |
| | | |
|
| |
|
| |
|
| |
| | The following summarizes the amount of impaired loans at December 31, 2004 and 2003, all of which are collateral dependent: |
| | | | At December 31, | |
| | | |
| |
| | | | 2004 | | 2003 | |
| | | |
| |
| |
| | | | (In thousands) | |
| | | | | |
| | Loans identified as impaired: | | | | | | | |
| | Gross loans with no related allowance for losses | | $ | 491 | | | 2,971 | |
| | Gross loans with related allowance for losses recorded | | | 1,040 | | | 400 | |
| | Less: Allowances on these loans | | | (228 | ) | | (50 | ) |
| | | |
|
| |
|
| |
| | | | | | | | | |
| | Net investment in impaired loans | | $ | 1,303 | | | 3,321 | |
| | | |
|
| |
|
| |
40
| | The average net investment in impaired loans and interest income recognized and received on impaired loans during the years ended December 31, 2004, 2003 and 2002 was as follows: |
| | | | Year Ended December 31, | |
| | | |
| |
| | | | 2004 | | 2003 | | 2002 | |
| | | |
| |
| |
| |
| | | | (In thousands) | |
| | | | | | | | | | | | |
| | Average net investment in impaired loans | | $ | 2,516 | | | 1,920 | | | 184 | |
| | | |
|
| |
|
| |
|
| |
| | | | | | | | | | | | |
| | Interest income recognized on impaired loans | | $ | 51 | | | 143 | | | 35 | |
| | | |
|
| |
|
| |
|
| |
| | | | | | | | | | | | |
| | Interest income received on impaired loans | | $ | 51 | | | 143 | | | 35 | |
| | | |
|
| |
|
| |
|
| |
| | The increase in impaired loans during 2003 mainly resulted from two loans to an agricultural borrower being identified as impaired and placed on nonaccrual status. During 2004 one of the two loans was paid off. |
| | |
| | The Company originates or purchases nonresidential real property loans. These loans are considered by management to be of somewhat greater risk of uncollectibility due to the dependency on income production or future development of the real estate. Nearly all of the Company’s real property loans were collateralized by real property in Lake, Sumter, Citrus and Marion Counties, Florida. |
| | |
| | Nonaccrual loans at December 31, 2004 and 2003 totaled $2.8 million and $5.3 million, respectively. There were no loans past due ninety days or more and still accruing interest income at December 31, 2004 or 2003. For the years ended December 31, 2004, 2003 and 2002, interest income on loans would have been increased approximately $100,000, $83,000 and $106,000, respectively, if the interest on nonaccrual loans had been recorded under the original terms of such loans. |
| | |
(4) | Premises and Equipment |
| | |
| | Components of premises and equipment were as follows: |
| | | | At December 31, | |
| | | |
| |
| | | | 2004 | | 2003 | |
| | | |
| |
| |
| | | | (In thousands) | |
| | Cost: | | | | | | | |
| | | Land | | $ | 5,912 | | | 5,794 | |
| | | Buildings and leasehold improvements | | | 20,231 | | | 18,292 | |
| | | Furniture and equipment | | | 4,432 | | | 4,045 | |
| | | Construction in progress | | | 84 | | | 131 | |
| | | |
|
| |
|
| |
| | | | | | | | | |
| | | Total cost | | | 30,659 | | | 28,262 | |
| | | | | | | | | |
| | Less accumulated depreciation and amortization | | | (8,137 | ) | | (6,814 | ) |
| | | |
|
| |
|
| |
| | | | | | | | | |
| | | Net book value | | $ | 22,522 | | | 21,448 | |
| | | |
|
| |
|
| |
41
| | Certain Company facilities are leased under operating leases. Rental expense was approximately $49,000, $63,000 and $70,000 in 2004, 2003 and 2002, respectively. At December 31, 2004, future minimum rental commitments under noncancellable leases were as follows: |
| | Year Ending
December 31, | | Amount | |
| |
| |
| |
| | | | (In thousands) | |
| | | | | | |
| | | 2005 | | | $ | 46 | | |
| | | 2006 | | | | 48 | | |
| | | 2007 | | | | 51 | | |
| | | 2008 | | | | 53 | | |
| | | 2009 | | | | 56 | | |
| | | Thereafter | | | | 59 | | |
| | | | |
|
| | |
| | | | | | | | |
| | | | | $ | 313 | | |
| | | | |
|
| | |
(5) | Deposits |
| | |
| | The aggregate amount of short-term jumbo time deposits, each with a minimum denomination of $100,000, was approximately $177.6 million and $147.4 million at December 31, 2004 and 2003, respectively. |
| | |
| | At December 31, 2004, the scheduled maturities of time deposits were as follows: |
| | Year Ending
December 31, | | Amount | |
| |
| |
| |
| | | | (In thousands) | |
| | | | | | |
| | | 2005 | | | $ | 253,892 | | |
| | | 2006 | | | | 162,032 | | |
| | | 2007 | | | | 76,772 | | |
| | | 2008 | | | | 25,023 | | |
| | | 2009 | | | | 18,267 | | |
| | | | |
|
| | |
| | | | | | | | |
| | | | | $ | 535,986 | | |
| | | | |
|
| | |
42
(6) | Advances from Federal Home Loan Bank and Other Borrowings |
| | |
| | As of December 31, 2004, the Bank had $153.0 million in Federal Home Loan Bank of Atlanta (“FHLB”) advances outstanding. These advances had a weighted-average interest rate of 4.96% and interest rates and maturities as follows ($in thousands): |
| | | | | | At December 31, | |
| | Maturity During the
Year Ending December 31, | | Interest
Rate | |
| |
| | 2004 | | 2003 | |
| |
| |
| |
| |
| |
| | | | | | | | | | | | | |
| | | 2004 | | | 6.05 | % | | $ | — | | | 10,000 | |
| | | 2004 | | | 3.76 | % | | | — | | | 10,000 | |
| | | 2004 | | | 3.39 | % | | | — | | | 5,000 | |
| | | 2005 | | | 6.39 | % | | | 20,000 | | | 20,000 | |
| | | 2005 | | | 6.60 | % | | | 13,500 | | | 13,500 | |
| | | 2005 | | | 6.68 | % | | | 12,500 | | | 12,500 | |
| | | 2005 | | | 6.31 | % | | | 7,000 | | | 7,000 | |
| | | 2005 | | | 6.04 | % | | | 10,000 | | | 10,000 | |
| | | 2005 | | | 6.00 | % | | | 6,000 | | | 6,000 | |
| | | 2006 | | | 2.57 | %(A) | | | 5,000 | | | 5,000 | |
| | | 2006 | | | 2.30 | %(A) | | | 5,000 | | | — | |
| | | 2007 | | | 3.76 | % | | | 15,000 | | | — | |
| | | 2007 | | | 3.85 | % | | | 10,000 | | | — | |
| | | 2007 | | | 3.84 | % | | | 5,000 | | | — | |
| | | 2008 | | | 2.98 | %(B) | | | 15,000 | | | 15,000 | |
| | | 2009 | | | 6.39 | %(B) | | | 14,000 | | | 14,000 | |
| | | 2011 | | | 4.44 | %(B) | | | 5,000 | | | 5,000 | |
| | | 2014 | | | 2.37 | % | | | 10,000 | | | — | |
| | | | | | | |
|
| |
|
| |
| | | | | | | | | | | | | |
| | | Total | | | | | | $ | 153,000 | | | 133,000 | |
| | | | | | | |
|
| |
|
| |
| | | | | | | | | | | | | | |
| | (A) | Adjustable Rate, this is rate at year-end. |
| | (B) | The FHLB has the option to convert to an adjustable rate in future years, at which time the Company has the option to prepay the advance without penalty. |
| | | |
| | The security agreement with FHLB includes a blanket floating lien requiring the Company to maintain first mortgage loans as pledged collateral in an amount equal to at least, when discounted at 75% of the unpaid principal balances, 100% of these advances. The FHLB stock is also pledged as collateral for these advances. At December 31, 2004, the Company could borrow up to $127.8 million under the FHLB security agreement. |
| | |
| | The Company has an $8.0 million line of credit facility with one of its correspondent banks under which the Company may draw funds for daily liquidity. Borrowings under this line of credit must be repaid within five days. The line of credit bears a floating interest rate equal to the average federal funds rate and expires on June 30, 2005. As of December 31, 2004, the Company has not used this line of credit. |
| | |
| | Other borrowed funds were composed of retail repurchase agreements with customers. The Company enters into retail repurchase agreements with customers in which the funds received are accounted for as borrowings to the Company. The total amount outstanding under these agreements at December 31, 2004 and 2003 were $17.0 million and $17.8 million, respectively. The Company pledged securities with a carrying value of $21.0 million and $22.5 million, respectively as collateral for these agreements at December 31, 2004 and 2003. |
43
(7) | Junior Subordinated Debentures and Derivative Instrument |
| | |
| | FFLC Statutory Trust I (the “Trust”) was formed for the sole purpose of issuing $5,000,000 of trust preferred securities. On September 26, 2002, the Trust sold adjustable-rate Trust Preferred Securities due September 26, 2032 in the aggregate principal amount of $5,000,000 (the “Capital Securities”) in a pooled trust preferred securities offering. The interest rate on the Capital Securities adjusts quarterly, to a rate equal to the then current three-month London Interchange Bank Offering Rate (“LIBOR”), plus 340 basis points. In addition, the Holding Company contributed capital of $155,000 to the Trust for the purchase of the common securities of the Trust. The proceeds from these sales were paid to the Holding Company in exchange for $5,155,000 of its adjustable-rate Junior Subordinated Debentures (the “Debentures”) due September 26, 2032. The Debentures have the same terms as the Capital Securities. The sole asset of the Trust, the obligor on the Capital Securities, is the Debentures. |
| | |
| | The Holding Company has guaranteed the Trust’s payment of distributions on, payments on any redemptions of, and any liquidation distribution with respect to, the Capital Securities. Cash distributions on both the Capital Securities and the Debentures are payable quarterly in arrears on March 26, June 26, September 26 and December 26 of each year. |
| | |
| | The Capital Securities are subject to mandatory redemption (i) in whole, but not in part, upon repayment of the Debentures at stated maturity or, at the option of the Holding Company, their earlier redemption in whole upon the occurrence of certain changes in the tax treatment or capital treatment of the Capital Securities, or a change in the law such that the Trust would be considered an Investment Company and (ii) in whole or in part at any time on or after September 26, 2007 contemporaneously with the optional redemption by the Holding Company of the Debentures in whole or in part. The Debentures are redeemable prior to maturity at the option of the Holding Company (i) on or after September 26, 2007, in whole at any time or in part from time to time, or (ii) in whole, but not in part, at any time within 90 days following the occurrence and continuation of certain changes in the tax treatment or capital treatment of the Capital Securities, or a change in law such that the Trust would be considered an Investment Company, required to be registered under the Investment Company Act of 1940. |
| | |
| | In 2003, the Company adopted Financial Accounting Standards Board Interpretation No. 46, “Consolidation of Variable Interest Entities” as revised in December 2003. In accordance with Interpretation No. 46, the Trust is not consolidated in the financial statements of the Company, but rather accounted for under the equity method of accounting. The Company elected to apply Interpretation No. 46 on a retroactive basis and therefore restated its 2002 consolidated financial statements. Interpretation No. 46 had no effect on the 2002 consolidated statement of income. |
| | |
| | The Company has entered into a five year interest rate swap agreement that effectively converted the floating interest rate of these junior subordinated debentures into a fixed interest rate of 6.85%, thus reducing the impact of interest rate changes on future interest expense for the five year period. In accordance with SFAS 133, this interest rate swap qualifies as a cash flow hedge. The fair value of this interest rate swap is recorded as an asset or liability on the consolidated balance sheet with an offsetting entry recorded in other comprehensive income (loss), net of the income tax effect. At December 31, 2004, the unrealized gain on the derivative instrument was $10,000 ($6,000 net of tax) and at December 31, 2003, the unrealized loss was $83,000 ($52,000 net of tax). |
| | |
(8) | Income Taxes |
| | |
| | The Holding Company files consolidated Federal and state income tax returns with the Bank and the Service Corporation. Income taxes are allocated proportionally to the Holding Company and each of the subsidiaries as though separate income tax returns were filed. First Alliance and the Trust file separate income tax returns. |
| | |
| | Income taxes are summarized as follows: |
| | | | Year Ended December 31, | |
| | | |
| |
| | | | 2004 | | 2003 | | 2002 | |
| | | |
| |
| |
| |
| | | | (In thousands) | |
| | | | | | | | | | | | |
| | Current | | $ | 6,270 | | | 6,024 | | | 5,608 | |
| | Deferred | | | (58 | ) | | (444 | ) | | (331 | ) |
| | | |
|
| |
|
| |
|
| |
| | | | | | | | | | | | |
| | | | $ | 6,212 | | | 5,580 | | | 5,277 | |
| | | |
|
| |
|
| |
|
| |
44
| | The effective tax rate on income before income taxes differs from the U.S. statutory rate of 35%. The following summary reconciles taxes at the U.S. statutory rate with the effective rates: |
| | | | Year Ended December 31, | |
| | | |
| |
| | | | 2004 | | 2003 | | 2002 | |
| | | |
| |
| |
| |
| | | | Amount | | % | | Amount | | % | | Amount | | % | |
| | | |
| |
| |
| |
| |
| |
| |
| | | | ($ in thousands) | |
| | | | | | | | | | | | | | | | | | | | | |
| | Taxes on income at U.S. statutory rate | | $ | 5,681 | | | 35.0 | % | $ | 5,155 | | | 35.0 | % | $ | 4,940 | | | 35.0 | % |
| | State income taxes, net of federal tax benefit | | | 583 | | | 3.6 | | | 527 | | | 3.6 | | | 477 | | | 3.4 | |
| | Graduated tax rates | | | (100 | ) | | (.6 | ) | | (100 | ) | | (.7 | ) | | (100 | ) | | (.7 | ) |
| | Other, net | | | 48 | | | .3 | | | (2 | ) | | — | | | (40 | ) | | (.3 | ) |
| | | |
|
| |
|
| |
|
| |
|
| |
|
| |
|
| |
| | | | | | | | | | | | | | | | | | | | | |
| | Taxes on income at effective rates | | $ | 6,212 | | | 38.3 | % | $ | 5,580 | | | 37.9 | % | $ | 5,277 | | | 37.4 | % |
| | | |
|
| |
|
| |
|
| |
|
| |
|
| |
|
| |
| | Temporary differences between the consolidated financial statement carrying amounts and tax bases of assets and liabilities that gave rise to significant portions of the deferred tax asset relate to the following: |
| | | | At December 31, | |
| | | |
| |
| | | | 2004 | | 2003 | |
| | | |
| |
| |
| | | | (In thousands) | |
| | Deferred tax assets: | | | | | | | |
| | | Allowance for loan losses | | $ | 2,373 | | | 2,100 | |
| | | Accrued interest | | | 209 | | | 55 | |
| | | Unrealized loss on derivative instrument | | | — | | | 31 | |
| | | Unrealized loss on securities available for sale | | | 129 | | | — | |
| | | Other | | | 111 | | | 61 | |
| | | |
|
| |
|
| |
| | | | | | | | | |
| | Gross deferred tax assets | | | 2,822 | | | 2,247 | |
| | | |
|
| |
|
| |
| | | | | | | | | |
| | Deferred tax liabilities: | | | | | | | |
| | | FHLB stock dividends | | | (285 | ) | | (286 | ) |
| | | Building and land | | | (342 | ) | | (342 | ) |
| | | Accumulated depreciation | | | (577 | ) | | (156 | ) |
| | | Unrealized gain on securities available for sale | | | — | | | (211 | ) |
| | | Deferred loan costs | | | (118 | ) | | (118 | ) |
| | | Unrealized gain on derivative instrument | | | (4 | ) | | — | |
| | | |
|
| |
|
| |
| | | | | | | | | |
| | Gross deferred tax liabilities | | | (1,326 | ) | | (1,113 | ) |
| | | |
|
| |
|
| |
| | | | | | | | | |
| | Net deferred tax asset | | $ | 1,496 | | | 1,134 | |
| | | |
|
| |
|
| |
| | Retained earnings at December 31, 2004 and 2003 includes approximately $5.8 million for which no deferred federal income tax liability has been recognized. This amount represents an allocation of income to bad debt deductions for tax purposes only. Reduction of amounts so allocated for purposes other than tax bad debt losses or adjustments arising from carryback of net operating losses would create income for tax purposes only, which would be subject to the then current corporate income tax rate. The unrecorded deferred income tax liability on the above amount was approximately $2.2 million at December 31, 2004 and 2003. |
45
(9) | Financial Instruments |
| | |
| | The Company is a party to financial instruments with off-balance sheet risk in the normal course of business to meet the financing needs of its customers and to reduce its own exposure to fluctuations in interest rates. These financial instruments are commitments to extend credit, unused lines of credit, undisbursed loans in process and standby letters of credit and may involve, to varying degrees, elements of credit and interest-rate risk in excess of the amount recognized in the consolidated balance sheet. The contract amounts of these instruments reflect the extent of involvement the Company has in these financial instruments. |
| | |
| | The Company’s exposure to credit loss in the event of nonperformance by the other party to the financial instrument for commitments to extend credit is represented by the contractual amount of those instruments. The Company uses the same credit policies in making commitments as it does for on-balance-sheet instruments. |
| | |
| | Commitments to extend credit are agreements to lend to a customer as long as there is no violation of any condition established in the contract. Commitments generally have fixed expiration dates or other termination clauses and may require payment of a fee. Since some of the commitments are expected to expire without being drawn upon, the total commitment amounts do not necessarily represent future cash requirements. The Company evaluates each customer’s credit worthiness on a case-by-case basis. The amount of collateral obtained if deemed necessary by the Company upon extension of credit is based on management’s credit evaluation of the counterparty. |
| | |
| | Standby letters of credit are conditional commitments issued by the Company to guarantee the performance of a customer to a third party. The credit risk involved in issuing letters of credit is essentially the same as that involved in extending loans to customers. |
46
| | The estimated fair values of the Company’s financial instruments were as follows: |
| | | | At December 31, 2004 | | At December 31, 2003 | |
| | | |
| |
| |
| | | | Carrying
Amount | | Fair
Value | | Carrying
Amount | | Fair
Value | |
| | | |
| |
| |
| |
| |
| | | | (In thousands) | |
| | Financial assets: | | | | | | | | | | | | | |
| | | Cash and cash equivalents | | $ | 64,606 | | | 64,606 | | | 62,160 | | | 62,160 | |
| | | Securities available for sale | | | 74,513 | | | 74,513 | | | 82,137 | | | 82,137 | |
| | | Loans | | | 883,980 | | | 885,814 | | | 767,987 | | | 771,028 | |
| | | Accrued interest receivable | | | 3,893 | | | 3,893 | | | 3,849 | | | 3,849 | |
| | | Federal Home Loan Bank stock | | | 8,782 | | | 8,782 | | | 6,900 | | | 6,900 | |
| | | | | | | | | | | | | | | |
| | Financial liabilities: | | | | | | | | | | | | | |
| | | Deposit liabilities | | | 795,160 | | | 796,126 | | | 705,589 | | | 708,854 | |
| | | Advances from FHLB | | | 153,000 | | | 155,497 | | | 133,000 | | | 140,331 | |
| | | Other borrowed funds | | | 17,031 | | | 17,031 | | | 17,786 | | | 17,786 | |
| | | Junior subordinated debentures | | | 5,155 | | | 5,155 | | | 5,155 | | | 5,155 | |
| | Derivatives: | | | | | | | | | | | | | |
| | | Interest rate swap (loss position) | | | 10 | | | 10 | | | (83 | ) | | (83 | ) |
| | Commitments to extend credit typically result in loans with a market interest rate when funded. A summary of the Company’s financial instruments with off-balance sheet risk at December 31, 2004, follows: |
| | | | Notional
Amount | | Carrying
Amount | | Fair
Value | |
| | | |
| |
| |
| |
| | | | (In thousands) | |
| | | | | | | | | | | | |
| | Commitments to extend credit | | | $ | 18,326 | | | | | — | | | | — | |
| | | | |
|
| | | |
|
| | |
|
| |
| | | | | | | | | | | | | | | | |
| | Unused lines of credit | | | $ | 69,987 | | | | | — | | | | — | |
| | | | |
|
| | | |
|
| | |
|
| |
| | | | | | | | | | | | | | | | |
| | Undisbursed portion of loans in process | | | $ | 47,490 | | | | | — | | | | — | |
| | | | |
|
| | | |
|
| | |
|
| |
| | | | | | | | | | | | | | | | |
| | Standby letters of credit | | | $ | 3,129 | | | | | — | | | | — | |
| | | | |
|
| | | |
|
| | |
|
| |
(10) | Significant Group Concentration of Credit Risk |
| | |
| | The Company grants real estate, commercial and consumer loans to customers primarily in the State of Florida with the majority of such loans in the Lake, Sumter, Citrus and Marion County area. Therefore, the Company’s exposure to credit risk is significantly affected by changes in the economy of the Lake, Sumter, Citrus and Marion County area. |
| | |
| | The contractual amounts of credit related financial instruments such as commitments to extend credit represent the amounts of potential accounting loss should the contract be fully drawn upon, the customer default and the value of any existing collateral become worthless. |
47
(11) | Related Parties |
| | |
| | Loans to directors and executive officers of the Company were made in the ordinary course of business and did not involve more than normal risk of collectibility or present other unfavorable features. Activity in loans to directors and executive officers were as follows: |
| | | | Year Ended
December 31, | |
| | | |
| |
| | | | 2004 | | 2003 | |
| | | |
| |
| |
| | | | (In thousands) | |
| | | | | | | | | |
| | Beginning balance | | $ | 10,468 | | | 8,307 | |
| | Loans originated | | | 4,797 | | | 2,546 | |
| | Principal repayments | | | (959 | ) | | (385 | ) |
| | | |
|
| |
|
| |
| | | | | | | | | |
| | | Ending balance | | $ | 14,306 | | | 10,468 | |
| | | |
|
| |
|
| |
| | Other related party transactions which were made in the ordinary course of business were are follows (in thousands): |
| | | | Year Ended December 31, | |
| | | |
| |
| | | | 2004 | | 2003 | | 2002 | |
| | | |
| |
| |
| |
| | Legal fees paid | | $ | 70 | | | 137 | | | 103 | |
| | | |
|
| |
|
| |
|
| |
| | Insurance premiums paid | | $ | 158 | | | 205 | | | 282 | |
| | | |
|
| |
|
| |
|
| |
| | Construction contracts paid | | $ | 1,028 | | | 1,518 | | | 1,098 | |
| | | |
|
| |
|
| |
|
| |
(12) | Legal Contingencies |
| | |
| | Various legal claims also arise from time to time in the normal course of business which, in the opinion of management, will not have a material effect on the Company’s consolidated financial statements. |
| | |
(13) | Restrictions on Retained Earnings |
| | |
| | The Bank is subject to certain restrictions on the amount of dividends that it may declare without prior regulatory approval. At December 31, 2004, approximately $31.7 million of retained earnings were available for dividend declaration without prior regulatory approval. |
| | |
(14) | Regulatory Matters |
| | |
| | The Bank is subject to various regulatory capital requirements administered by the federal banking agencies. Failure to meet minimum capital requirements can initiate certain mandatory and possibly additional discretionary actions by regulators that, if undertaken, could have a direct material effect on the Company’s consolidated financial statements. Under capital adequacy guidelines and the regulatory framework for prompt corrective action, the Bank must meet specific capital guidelines that involve quantitative measures of the Bank’s assets, liabilities, and certain off-balance-sheet items as calculated under regulatory accounting practices. The Bank’s capital amounts and classification are also subject to qualitative judgements by the regulators about components, risk weightings, and other factors. |
| | |
| | Quantitative measures established by regulation to ensure capital adequacy require the Bank to maintain minimum amounts (set forth in the table below) of total and Tier I capital (as defined in the regulations) to risk-weighted assets (as defined). Management believes, as of December 31, 2004, that the Bank meets all capital adequacy requirements to which it is subject. |
| | |
| | As of December 31, 2004, the most recent notification from the OTS categorized the Bank as well capitalized under the regulatory framework for prompt corrective action. To be categorized as well capitalized, the Bank must maintain minimum tangible, tier I (core), tier I (risk-based) and total risk-based capital ratios as set forth in the table. There are no conditions or events since that notification that management believes have changed the institution’s category. |
48
| | The Bank’s actual capital amounts and percentages at December 31, 2004 and 2003 are also presented in the tables. |
| | | | Actual | | Minimum
For Capital
Adequacy
Purposes | | To Be Well
Capitalized
For Prompt
Corrective Action
Provisions | |
| | | |
| |
| |
| |
| | | | % | | Amount | | % | | Amount | | % | | Amount | |
| | | |
| |
| |
| |
| |
| |
| |
| | As of December 31, 2004: | | ($ in thousands) | |
| | | | | | | | | | | | | | | | | | | | | |
| | Stockholders’ equity, and ratio to total assets | | | 8.08 | % | $ | 86,023 | | | | | | | | | | | | | |
| | Less- investment in nonincludable subsidiary | | | | | | (4,449 | ) | | | | | | | | | | | | |
| | Add- unrealized loss on available-for-sale securities | | | | | | 86 | | | | | | | | | | | | | |
| | | | | | |
|
| | | | | | | | | | | | | |
| | | | | | | | | | | | | | | | | | | | | |
| | Tangible capital, and ratio to adjusted total assets | | | 7.70 | % | $ | 81,660 | | | 1.5 | % | $ | 15,913 | | | | | | | |
| | | | | | |
|
| | | | |
|
| | | | | | | |
| | | | | | | | | | | | | | | | | | | | | |
| | Tier 1 (core) capital, and ratio to adjusted total assets | | | 7.70 | % | $ | 81,660 | | | 3.0 | % | $ | 31,826 | | | 5.0 | % | $ | 53,043 | |
| | | | | | |
|
| | | | |
|
| | | | |
|
| |
| | | | | | | | | | | | | | | | | | | | | |
| | Tier 1 capital, and ratio to risk-weighted assets | | | 10.89 | % | | 81,660 | | | 4.0 | % | $ | 29,987 | | | 6.0 | % | $ | 44,981 | |
| | | | | | | | | | | | |
|
| | | | |
|
| |
| | | | | | | | | | | | | | | | | | | | | |
| | Tier 2 capital (allowance for loan losses) | | | | | | 6,127 | | | | | | | | | | | | | |
| | | | | | |
|
| | | | | | | | | | | | | |
| | | | | | | | | | | | | | | | | | | | | |
| | Total risk-based capital, and ratio to risk-weighted assets | | | 11.71 | % | $ | 87,787 | | | 8.0 | % | $ | 59,975 | | | 10.0 | % | $ | 74,968 | |
| | | | | | |
|
| | | | |
|
| | | | |
|
| |
| | | | | | | | | | | | | | | | | | | | | |
| | Total assets | | | | | $ | 1,065,217 | | | | | | | | | | | | | |
| | | | | | |
|
| | | | | | | | | | | | | |
| | | | | | | | | | | | | | | | | | | | | |
| | Adjusted total assets | | | | | $ | 1,060,854 | | | | | | | | | | | | | |
| | | | | | |
|
| | | | | | | | | | | | | |
| | | | | | | | | | | | | | | | | | | | | |
| | Risk-weighted assets | | | | | $ | 749,683 | | | | | | | | | | | | | |
| | | | | | |
|
| | | | | | | | | | | | | |
49
| | | | Actual | | Minimum
For Capital
Adequacy
Purposes | | To Be Well
Capitalized
For Prompt
Corrective Action
Provisions | |
| | | |
| |
| |
| |
| | | | % | | Amount | | % | | Amount | | % | | Amount | |
| | | |
| |
| |
| |
| |
| |
| |
| | As of December 31, 2003: | | ($ in thousands) | |
| | | | | | | | | | | | | | | | | | | | | |
| | Stockholders’ equity, and ratio to total assets | | | 8.35 | % | $ | 79,165 | | | | | | | | | | | | | |
| | Less: investment in nonincludable subsidiary | | | | | | (253 | ) | | | | | | | | | | | | |
| | Unrealized gain on available-for-sale securities | | | | | | (430 | ) | | | | | | | | | | | | |
| | | | | | |
|
| | | | | | | | | | | | | |
| | | | | | | | | | | | | | | | | | | | | |
| | Tangible capital, and ratio to adjusted total assets | | | 8.28 | % | $ | 78,482 | | | 1.5 | % | $ | 14,217 | | | | | | | |
| | | | | | |
|
| | | | |
|
| | | | | | | |
| | | | | | | | | | | | | | | | | | | | | |
| | Tier 1 (core) capital, and ratio to adjusted total assets | | | 8.28 | % | $ | 78,482 | | | 3.0 | % | $ | 28,435 | | | 5.0 | % | $ | 47,391 | |
| | | | | | |
|
| | | | |
|
| | | | |
|
| |
| | | | | | | | | | | | | | | | | | | | | |
| | Tier 1 capital, and ratio to risk-weighted assets | | | 12.32 | % | | 78,482 | | | 4.0 | % | $ | 26,062 | | | 6.0 | % | $ | 39,094 | |
| | | | | | | | | | | | |
|
| | | | |
|
| |
| | | | | | | | | | | | | | | | | | | | | |
| | Tier 2 capital (allowance for loan losses) | | | | | | 5,426 | | | | | | | | | | | | | |
| | | | | | |
|
| | | | | | | | | | | | | |
| | | | | | | | | | | | | | | | | | | | | |
| | Total risk-based capital, and ratio to risk-weighted assets | | | 13.17 | % | $ | 83,908 | | | 8.0 | % | $ | 50,961 | | | 10.0 | % | $ | 63,702 | |
| | | | | | |
|
| | | | |
|
| | | | |
|
| |
| | | | | | | | | | | | | | | | | | | | | |
| | Total assets | | | | | $ | 948,503 | | | | | | | | | | | | | |
| | | | | | |
|
| | | | | | | | | | | | | |
| | | | | | | | | | | | | | | | | | | | | |
| | Adjusted total assets | | | | | $ | 947,820 | | | | | | | | | | | | | |
| | | | | | |
|
| | | | | | | | | | | | | |
| | | | | | | | | | | | | | | | | | | | | |
| | Risk-weighted assets | | | | | $ | 637,018 | | | | | | | | | | | | | |
| | | | | | |
|
| | | | | | | | | | | | | |
50
(15) | Conversion to Stock Savings Bank |
| | |
| | The Bank successfully completed a conversion from a federally chartered mutual savings association to a federally chartered stock savings bank on January 4, 1994 pursuant to the Plan of Conversion. The Plan of Conversion provided for the establishment of a Liquidation Account equal to the retained income of the Bank as of September 30, 1993 (the date of the most recent financial statement presented in the final conversion prospectus). The Liquidation Account is established to provide a limited priority claim to the assets of the Bank to qualifying depositors as of September 30, 1992 (Eligible Account Holders) who continue to maintain deposits in the Bank after conversion. In the unlikely event of a complete liquidation of the Bank, and only in such event, each Eligible Account Holder would receive from the Liquidation Account a liquidation distribution based on their proportionate share of the then total remaining qualifying deposits. |
| | |
| | Current regulations allow the Bank to pay dividends on its stock after the conversion if its regulatory capital would not thereby be reduced below the amount then required for the aforementioned Liquidation Account. Also, capital distribution regulations limit the Bank’s ability to make capital distributions which include dividends, stock redemptions and repurchases, cash-out mergers, interest payments on certain convertible debt and other transactions charged to the capital account based on their capital level and supervisory condition. |
| | |
(16) | 401(k) Plan |
| | |
| | The Company has a single-employer 401(k) plan (“KSOP”). Under the KSOP, participation is open to all employees the month after hire date (for purposes of employer contributions, one year of service is required), and participants have twelve investment options, plus a Company stock fund. The Company makes a contribution of at least 3% of compensation (for all participants who have met the one-year of service requirement), which vests immediately. In addition, the Company will make a discretionary matching contribution (for all participants who have met the one-year of service requirement), which will vest after five years of service. For 2004, 2003 and 2002, the Board approved a matching contribution equal to 100% of employees’ deferrals up to 3% of compensation. The Company also makes quarterly profit sharing contributions (more fully discussed below) in connection with the KSOP. Total contribution expenses recognized by the Company under the KSOP during the years ended December 31, 2004, 2003 and 2002 were $833,000, $765,000 and $642,000, respectively. The amounts of employee and employer contributions under the KSOP, 401(k) and the ESOP are subject to IRS limitations. |
| | |
| | The Company makes quarterly profit-sharing contributions to the KSOP in amounts approved by the Board, and those contributions are allocated to the accounts of participating employees on a quarterly basis. Company profit-sharing contributions vest after five years of service. For 2004, 2003 and 2002, the Board approved profit-sharing contributions equal to four percent (4%) of the Bank’s operating net income, which were made after each quarter based on the actual results of the preceding quarter. The Plan allows the Company to fund such KSOP contributions by either issuing shares, or purchasing the required number of shares on the open market. As these shares are allocated on a quarterly basis, the Company records compensation expense, and either an offsetting credit to capital (in the event that new shares are issued) or to cash (in the event that shares are purchased on the open market), equal to the current market price of the shares. The shares become outstanding for income per share computations when allocated. |
51
(17) | Stock Benefit Plans |
| | |
| | Stock Option Plans. During 2002, the Company adopted a new stock option plan (the “2002 Plan”) which authorizes the Company to issue up to 375,000 shares (adjusted) in connection with options granted to directors, officers or employees of the Company. The terms and vesting periods will be determined as each option is granted, but the option price can not be less than the then current market value of the common stock at the grant date. During the year ended December 31, 2004, 43,553 shares were granted and 331,447 shares remain available under the Plan for grant to future directors, officers and employees. |
| | |
| | | The Company also has a 1993 stock option plan (the “1993 Plan”) under which 477,161 (adjusted) common shares were authorized to be issued in connection with options granted to directors, officers and employees of the Company. Options granted under the 1993 Plan are exercisable at the market price of the common stock at the date of grant. Such incentive stock options granted to officers and employees are exercisable in three equal annual installments, with the first installment becoming exercisable one year from the date of grant. Options granted to outside directors are exercisable immediately, but any common shares obtained from exercise of the options may not be sold prior to one year from the date of grant. All options expire at the earlier of ten years for officers and employees or twenty years for directors from the date of grant or one year following the date which the outside director, officer or employee ceases to serve in such capacity. During 2003, all remaining available options under the 1993 Plan were granted. |
| | | |
| | | The following is a summary of option transactions (all options and exercise price information has been adjusted to reflect the three-for-two stock split in 2003): |
| | | | Number
of Options | | Range of
Exercise
Prices | | Weighted-
Average
Exercise
Price | |
| | | |
| |
| |
| |
| | | | | | | | | | | | |
| | Outstanding, December 31, 2001 | | | 200,312 | | $ | 4.00-14.17 | | | | 6.01 | | |
| | Exercised | | | (47,985 | ) | | 4.00-10.83 | | | | 4.69 | | |
| | | |
|
| | | | | | | | | |
| | | | | | | | | | | | | | |
| | Outstanding, December 31, 2002 | | | 152,327 | | | 4.00-14.17 | | | | 6.61 | | |
| | Granted | | | 50,571 | | | 26.74 | | | | 26.74 | | |
| | Exercised | | | (32,102 | ) | | 4.00-14.17 | | | | 5.56 | | |
| | | |
|
| | | | | | | | | |
| | | | | | | | | | | | | | |
| | Outstanding, December 31, 2003 | | | 170,796 | | | 4.00-26.74 | | | | 12.61 | | |
| | Granted | | | 43,553 | | | 25.36-32.99 | | | | 31.67 | | |
| | Exercised | | | (14,458 | ) | | 8.00-26.74 | | | | 13.78 | | |
| | | |
|
| | | | | | | | | |
| | | | | | | | | | | | | | |
| | Outstanding, December 31, 2004 | | | 199,891 | | $ | 4.00-32.99 | | | $ | 16.68 | | |
| | | |
|
| |
|
| | |
|
| | |
| | | The weighted-average remaining contractual life of the outstanding stock options at December 31, 2004, 2003 and 2002 was 9.8, 9.7 and 8.3 years, respectively. |
52
| | The Company’s outstanding stock options at December 31, 2004 are exercisable as follows: |
| | During the Year Ended
December 31, | | Number of
Options | | Weighted-
Average
Exercise
Price | |
| |
| |
| |
| |
| | | | | | | | | |
| | | Currently exercisable | | | | 135,207 | | | | $ | 5.01 | | |
| | | 2005 | | | | 26,334 | | | | | 29.59 | | |
| | | 2006 | | | | 26,350 | | | | | 29.59 | | |
| | | 2007 | | | | 12,000 | | | | | 32.99 | | |
| | | | |
|
| | | | | | | |
| | | | | | | | | | | | | |
| | | | | | 199,891 | | | | $ | 16.68 | | |
| | | | |
|
| | | |
|
| | |
| | Recognition and Retention Plan. The Company also has a Recognition and Retention Plan (the “RRP”) under which 185,489 shares (adjusted) of the Company’s common stock were reserved for grants to directors, officers and employees. The shares are granted in the form of restricted stock to be earned in three equal annual installments. If a holder of restricted stock under the RRP terminated employment for reasons other than death, disability, retirement or change of control in the Company, such employee forfeited all rights to any allocated shares which are still restricted. If termination is caused by death, disability, retirement or change in control of the Company, all allocated shares become unrestricted. Forfeitures are reallocated to eligible participants annually. During 2004, all remaining shares in the RRP Plan were granted. |
| | |
(18) | Stock Repurchase Program |
| | |
| | The Company has a stock repurchase program which allows the Company to acquire shares of the Company’s common stock in the open market. The Company’s Board of Directors approves the maximum amount of shares that can be acquired. During the years ended December 31, 2004, 2003 and 2002, the Company repurchased 3,325, 8,379 and 12,648 shares, respectively under this program. At December 31, 2004, the Company currently holds 1,003,373 shares as treasury stock and can still repurchase an additional 229,348 under this program. |
| | |
(19) | Dividend Reinvestment Plan |
| | |
| | The Company has a Dividend Reinvestment Plan (the “DRP”). The DRP provides stockholders of record of at least 50 shares with a convenient and economical way to automatically reinvest all or a portion of their cash dividends and to invest optional cash payments, subject to minimum and maximum purchase limitations, in additional shares of common stock. Stockholders pay no service charges or brokerage commissions for common stock purchased under the DRP. During the years ended December 31, 2004, 2003 and 2002, 10,739, 10,288 and 8,772 shares of common stock, respectively, were purchased under the DRP, all of which were purchased in the open market. |
| | |
(20) | Stock Split |
| | |
| | On February 14, 2003, the Board of Directors declared a three-for-two stock split on all outstanding common shares for stockholders of record on February 28, 2003, which were distributed on March 14, 2003. Stockholders received cash in lieu of fractional shares resulting from the split based on the closing price on the record date. |
53
(21) | Parent Company Only Financial Statements |
| |
| Condensed financial statements of the Holding Company are presented below. Amounts shown as cash, investment in subsidiaries, loans to subsidiaries and earnings of subsidiaries are eliminated in consolidation. |
Condensed Balance Sheets
| | | At December 31, | |
| | |
| |
| | | 2004 | | 2003 | |
| | |
| |
| |
| | | (In thousands) | |
| Assets | | | | | | | |
| | | | | | | | |
| Cash, deposited with subsidiary | | $ | 2,204 | | | 1,491 | |
| Investment in subsidiaries | | | 86,024 | | | 79,224 | |
| Loans to subsidiaries | | | 1,150 | | | 1,550 | |
| Other assets | | | 321 | | | 352 | |
| | |
|
| |
|
| |
| | | | | | | | |
| Total assets | | $ | 89,699 | | | 82,617 | |
| | |
|
| |
|
| |
| | | | | | | | |
| Liabilities and Stockholders’ Equity | | | | | | | |
| | | | | | | | |
| Junior subordinated debentures | | | 5,155 | | | 5,155 | |
| Other liabilities | | | 52 | | | 106 | |
| Stockholders’ equity | | | 84,492 | | | 77,356 | |
| | |
|
| |
|
| |
| | | | | | | | |
| Total liabilities and stockholders’ equity | | $ | 89,699 | | | 82,617 | |
| | |
|
| |
|
| |
Condensed Statements of Income
| | | Year Ended December 31, | |
| | |
| |
| | | 2004 | | 2003 | | 2002 | |
| | |
| |
| |
| |
| | | (In thousands) | |
| | | | | | | | | | | |
| Revenues | | $ | 30 | | | 34 | | | 60 | |
| Expenses | | | (415 | ) | | (410 | ) | | (205 | ) |
| | |
|
| |
|
| |
|
| |
| | | | | | | | | | | |
| Loss before earnings of subsidiaries | | | (385 | ) | | (376 | ) | | (145 | ) |
| | | | | | | | | | | |
| Earnings of subsidiaries | | | 10,404 | | | 9,524 | | | 8,981 | |
| | |
|
| |
|
| |
|
| |
| | | | | | | | | | | |
| Net income | | $ | 10,019 | | | 9,148 | | | 8,836 | |
| | |
|
| |
|
| |
|
| |
54
Condensed Statements of Cash Flows
| | | | Year Ended December 31, | |
| | | |
| |
| | | | 2004 | | 2003 | | 2002 | |
| | | |
| |
| |
| |
| | | | (In thousands) | |
| | Cash flows from operating activities: | | | | | | | | | | |
| | | Net income | | $ | 10,019 | | | 9,148 | | | 8,836 | |
| | | Adjustments to reconcile net income to net cash used in operating activities: | | | | | | | | | | |
| | | Equity in earnings of subsidiaries | | | (10,404 | ) | | (9,524 | ) | | (8,981 | ) |
| | | Net decrease (increase) in other, net | | | 39 | | | (38 | ) | | (376 | ) |
| | | |
|
| |
|
| |
|
| |
| | | | | | | | | | | | |
| | | Net cash used in operating activities | | | (346 | ) | | (414 | ) | | (521 | ) |
| | | |
|
| |
|
| |
|
| |
| | | | | | | | | | | | |
| | Cash flows from investing activities: | | | | | | | | | | |
| | | Investment in subsidiaries | | | — | | | — | | | (3,000 | ) |
| | | Cash dividends received from subsidiaries | | | 3,355 | | | 2,400 | | | — | |
| | | Repayment of loans to subsidiaries | | | 400 | | | 300 | | | 650 | |
| | | |
|
| |
|
| |
|
| |
| | | | | | | | | | | | |
| | | Net cash provided by (used in) investing activities | | | 3,755 | | | 2,700 | | | (2,350 | ) |
| | | |
|
| |
|
| |
|
| |
| | | | | | | | | | | | |
| | Cash flows from financing activities: | | | | | | | | | | |
| | | Proceeds from issuance of junior subordinated debentures | | | — | | | — | | | 5,155 | |
| | | Purchase of treasury stock | | | (86 | ) | | (246 | ) | | (320 | ) |
| | | Proceeds from issuance of stock | | | 199 | | | 217 | | | 284 | |
| | | Cash dividends paid | | | (2,809 | ) | | (2,486 | ) | | (2,002 | ) |
| | | |
|
| |
|
| |
|
| |
| | | | | | | | | | | | |
| | | Net cash (used in) provided by financing activities | | | (2,696 | ) | | (2,515 | ) | | 3,117 | |
| | | |
|
| |
|
| |
|
| |
| | | | | | | | | | | | |
| | Net increase (decrease) in cash | | | 713 | | | (229 | ) | | 246 | |
| | | | | | | | | | | | |
| | Cash at beginning of year | | | 1,491 | | | 1,720 | | | 1,474 | |
| | | |
|
| |
|
| |
|
| |
| | | | | | | | | | | | |
| | Cash at end of year | | $ | 2,204 | | | 1,491 | | | 1,720 | |
| | | |
|
| |
|
| |
|
| |
| | | | | | | | | | | | |
| | Noncash investing and financing activities- | | | | | | | | | | |
| | | Accumulated other comprehensive income: | | | | | | | | | | |
| | | Net change in investment in subsidiaries due to net change in unrealized gain on securities available for sale, net of tax | | $ | (562 | ) | | (362 | ) | | 271 | |
| | | |
|
| |
|
| |
|
| |
| | | | | | | | | | | | |
| | | Net change in unrealized loss on derivative investment, net of tax | | $ | 58 | | | 23 | | | (75 | ) |
| | | |
|
| |
|
| |
|
| |
| | | | | | | | | | | | | | |
55
(22) | Quarterly Financial Data (Unaudited) |
| |
| The following tables present summarized quarterly data (in thousands, except per share amounts): |
| | | Year Ended December 31, 2004 | |
| | |
| |
| | | First
Quarter | | Second
Quarter | | Third
Quarter | | Fourth
Quarter | | Total | |
| | |
| |
| |
| |
| |
| |
| | | | | | | | | | | | | | | | | |
| Interest income | | $ | 13,220 | | | 13,389 | | | 14,027 | | | 14,769 | | | 55,405 | |
| Interest expense | | | 5,670 | | | 5,670 | | | 5,874 | | | 6,153 | | | 23,367 | |
| | |
|
| |
|
| |
|
| |
|
| |
|
| |
| | | | | | | | | | | | | | | | | |
| Net interest income | | | 7,550 | | | 7,719 | | | 8,153 | | | 8,616 | | | 32,038 | |
| | | | | | | | | | | | | | | | | |
| Provision for loan losses | | | 339 | | | 394 | | | 389 | | | 553 | | | 1,675 | |
| | |
|
| |
|
| |
|
| |
|
| |
|
| |
| Net interest income after provision for loan losses | | | 7,211 | | | 7,325 | | | 7,764 | | | 8,063 | | | 30,363 | |
| | | | | | | | | | | | | | | | | |
| Noninterest income | | | 978 | | | 1,242 | | | 1,277 | | | 1,180 | | | 4,677 | |
| Noninterest expense | | | (4,567 | ) | | (4,674 | ) | | (4,707 | ) | | (4,861 | ) | | (18,809 | ) |
| | |
|
| |
|
| |
|
| |
|
| |
|
| |
| | | | | | | | | | | | | | | | | |
| Income before income taxes | | | 3,622 | | | 3,893 | | | 4,334 | | | 4,382 | | | 16,231 | |
| | | | | | | | | | | | | | | | | |
| Income taxes | | | 1,358 | | | 1,479 | | | 1,650 | | | 1,725 | | | 6,212 | |
| | |
|
| |
|
| |
|
| |
|
| |
|
| |
| | | | | | | | | | | | | | | | | |
| Net income | | $ | 2,264 | | | 2,414 | | | 2,684 | | | 2,657 | | | 10,019 | |
| | |
|
| |
|
| |
|
| |
|
| |
|
| |
| | | | | | | | | | | | | | | | | |
| Basic income per share | | $ | 0.42 | | | 0.45 | | | 0.50 | | | .49 | | | 1.86 | |
| | |
|
| |
|
| |
|
| |
|
| |
|
| |
| | | | | | | | | | | | | | | | | |
| Diluted income per share | | $ | 0.41 | | | 0.44 | | | 0.49 | | | .49 | | | 1.83 | |
| | |
|
| |
|
| |
|
| |
|
| |
|
| |
| | | Year Ended December 31, 2003 | |
| | |
| |
| | | First
Quarter | | Second
Quarter | | Third
Quarter | | Fourth
Quarter | | Total | |
| | |
| |
| |
| |
| |
| |
| | | | | | | | | | | | | | | | | |
| Interest income | | $ | 13,577 | | | 13,329 | | | 12,906 | | | 13,028 | | | 52,840 | |
| Interest expense | | | 6,542 | | | 6,317 | | | 5,926 | | | 5,822 | | | 24,607 | |
| | |
|
| |
|
| |
|
| |
|
| |
|
| |
| | | | | | | | | | | | | | | | | |
| Net interest income | | | 7,035 | | | 7,012 | | | 6,980 | | | 7,206 | | | 28,233 | |
| | | | | | | | | | | | | | | | | |
| Provision for loan losses | | | 406 | | | 388 | | | 330 | | | 390 | | | 1,514 | |
| | |
|
| |
|
| |
|
| |
|
| |
|
| |
| Net interest income after provision for loan losses | | | 6,629 | | | 6,624 | | | 6,650 | | | 6,816 | | | 26,719 | |
| | | | | | | | | | | | | | | | | |
| Noninterest income | | | 1,283 | | | 1,432 | | | 1,465 | | | 1,184 | | | 5,364 | |
| Noninterest expense | | | (4,122 | ) | | (4,263 | ) | | (4,435 | ) | | (4,535 | ) | | (17,355 | ) |
| | |
|
| |
|
| |
|
| |
|
| |
|
| |
| | | | | | | | | | | | | | | | | |
| Income before income taxes | | | 3,790 | | | 3,793 | | | 3,680 | | | 3,465 | | | 14,728 | |
| | | | | | | | | | | | | | | | | |
| Income taxes | | | 1,436 | | | 1,427 | | | 1,387 | | | 1,330 | | | 5,580 | |
| | |
|
| |
|
| |
|
| |
|
| |
|
| |
| | | | | | | | | | | | | | | | | |
| Net income | | $ | 2,354 | | | 2,366 | | | 2,293 | | | 2,135 | | | 9,148 | |
| | |
|
| |
|
| |
|
| |
|
| |
|
| |
| | | | | | | | | | | | | | | | | |
| Basic income per share | | $ | .44 | | | .44 | | | .42 | | | .40 | | | 1.70 | |
| | |
|
| |
|
| |
|
| |
|
| |
|
| |
| | | | | | | | | | | | | | | | | |
| Diluted income per share | | $ | .43 | | | .43 | | | .42 | | | .39 | | | 1.67 | |
| | |
|
| |
|
| |
|
| |
|
| |
|
| |
56
Report of Independent Registered Public Accounting Firm
FFLC Bancorp, Inc.
Leesburg, Florida:
We have audited the accompanying consolidated balance sheets of FFLC Bancorp, Inc. and Subsidiaries (the “Company”) as of December 31, 2004 and 2003 and the related consolidated statements of income, changes in stockholders’ equity and cash flows for each of the three years in the period ended December 31, 2004. These consolidated financial statements are the responsibility of the Company’s management. Our responsibility is to express an opinion on these consolidated financial statements based on our audits.
We conducted our audits in accordance with the standards of the Public Company Accounting Oversight Board (United States). Those standards require that we plan and perform the audit to obtain reasonable assurance about whether the consolidated financial statements are free of material misstatement. An audit includes examining, on a test basis, evidence supporting the amounts and disclosures in the consolidated financial statements. An audit also includes assessing the accounting principles used and significant estimates made by management, as well as evaluating the overall consolidated financial statement presentation. We believe that our audits provide a reasonable basis for our opinion.
In our opinion, the consolidated financial statements referred to above present fairly, in all material respects, the financial position of the Company as of December 31, 2004 and 2003, and the results of its operations and its cash flows for each of the three years in the period ended December 31, 2004 in conformity with U.S. generally accepted accounting principles.
HACKER, JOHNSON & SMITH PA
Orlando, Florida
March 1, 2005
57
FFLC BANCORP, INC.
DIRECTORS AND OFFICERS
Directors: | | Occupation |
| |
|
| | |
James P. Logan | | President/Owner, Logan Sitework Contractors, Inc. |
| Chairman of the Board | | |
| | |
Ted R. Ostrander, Jr. | | President, Lassiter-Ware, Inc. |
| Vice Chairman | | |
| | |
Joseph J. Junod | | Retired, General Manager, Avesta Sheffield Pipe |
Claron D. Wagner | | President, Woody Wagner, Inc. |
H.D. Robuck, Jr. | | Attorney; CEO, Ro-Mac Lumber & Supply, Inc. |
Howard H. Hewitt | | President/Owner, Hewitt Construction Company |
Gregory P. Padgett | | Partner, CPA Firm of Brooks, Wiley, Young, Padgett & Kleiser |
Stephen T. Kurtz | | President, FFLC Bancorp, Inc. & Subsidiaries |
Paul K. Mueller | | Executive Vice President, FFLC Bancorp, Inc. & Subsidiaries |
| | |
Advisory Directors: | | |
| | |
| | |
James R. Gregg | | President, Jarol Company |
James H. Herlong | | Retired |
Horace D. Robuck | | President, Ro-Mac Lumber & Supply, Inc. |
| | |
Officers: | | |
| | |
| | |
Stephen T. Kurtz | | |
| President and Chief Executive Officer | | |
| | |
Paul K. Mueller | | |
| Executive Vice President and Treasurer | | |
| | |
Sandra L. Rutschow | | |
| Vice President and Secretary | | |
58
FIRST FEDERAL SAVINGS BANK
OF LAKE COUNTY
DIRECTORS, OFFICERS AND MANAGERS
DIRECTORS | Brian R. Hofer | Cynthia M. Lay |
James P. Logan | Vice President and Commercial Loan Officer | Assistant Vice President and |
| Chairman of the Board | | Online Banking Systems/Reporting Manager |
| Karen L. Hollister | |
Ted R. Ostrander Jr. | Vice President and Loan Operations Manager | Marilyn A. Leugers |
| Vice Chairman | | Assistant Vice President and IRA |
| Tara A. Keane | Coordinator |
Joseph J. Junod | Vice President and Lake Square Branch | |
Claron D. Wagner | Manager | Faye E. Phillips |
H.D. Robuck, Jr. | | Assistant Vice President |
Howard H. Hewitt | Stephen G. Knowles | Clermont Branch Manager |
Gregory P. Padgett | Vice President and Main Office Branch | |
Stephen T. Kurtz | Manager and Loan Officer | Sandra A. Rowe |
Paul K. Mueller | | Assistant Vice President and Loan Servicing |
| Annette McCullough | Manager |
Advisory Directors | Vice President and | |
James R. Gregg | Secondary Market Manager | Pamela S. Self |
James H. Herlong | | Assistant Vice President and Training |
| Dennis R. Rogers | Manager |
OFFICERS | Vice President, | |
Stephen T. Kurtz | 466/Villages Branch Manager | Mary R. Asher |
| President and Chief Executive Officer | and Area Loan Manager | Inverness Branch Office Manager and |
| | Loan Originator |
Paul K. Mueller | Natalie L. Rojas | |
| Executive Vice President | Vice President and Commercial Loan | Edgar R. Barron |
| Chief Operations Officer and | Portfolio Manager | Investment Officer |
| Treasurer | | |
| Sandra L. Rutschow | Janet R. Burgess |
Dwight L. Hart | Vice President and Corporate Secretary | Main Office Office Manager |
| Senior Vice President and | | |
| Mortgage Lending Manager | Sandra L. Seaton | Craig S. Cannon |
| Vice President and | Loan Officer Wildwood Branch |
Joseph D. Cioppa | Area Loan Manager | |
| Senior Vice President and Commercial | | Deedee A. Dye |
| Lending Manager | Leigh S. Skehan | Lady Lake Branch Manager |
| Vice President and Marketing Officer | |
Paul S. Allen | | Amy L. Griffin |
| Senior Vice President, Audit, Planning | Raynard S. (Ray) Taylor | Business Development Officer |
| and Budget | Vice President and Commercial Loan Officer | |
| | Suzzette Herman |
Jay R. Bartholomew | Phillip P. Tompetrini | Fruitland Park Branch Office Manager |
| Senior Vice President and Retail | Vice President and Inverness Branch Manager | |
| Banking Manager | | Jennifer J. Long |
| Donald E. Turner | Spruce Creek Branch Office Manager |
Brenda M. Grubb | Vice President and Commercial Loan Officer | |
| Senior Vice President and Human | | Catherine D. Love |
| Resources Manager | Tara H. Wainwright | Main Street Branch Office Manager |
| Vice President and Kings Ridge Branch | |
Robert R. Wedlock | Manager | Tammie C. Martin |
| Senior Vice President, Information | | Bushnell Branch Manager |
| Technology & Operations | Catherine M. Wallin | |
| Vice President and Main Office Loan Officer | Shannon J. Peters |
Kimberly R. Bailey | | Lake Square Branch Office Manager |
| Vice President and Spruce Creek Branch | Lynda F. Wemple | |
| Manager | Vice President and Accounting Dept. | Elizabeth M. Shaw |
| Manager | Crystal River Branch Manager |
Vickie S. Baxter | | |
| Vice President and Loan Officer | Barbara J. Boscana | |
| Assistant Vice President and Financial | Paula R. Shipley |
| Administrator | 466/Villages Branch Office Manager |
John A. Beaulieu | | |
| Vice President and Investment Officer | Donna L. Boyett | Carol A. Sieder |
| Assistant Vice President and Branch | South Leesburg Branch Manager |
Susan L. Berkebile | Operations Coordinator | |
| Vice President and Area Loan Manager | | Juanita L. Taylor |
| Norma J. Caron | Eustis Branch Manager |
Victoria M. Boren | Assistant Vice President and Checking | |
| Vice President and Branch Operations | Department Manager | Regina White |
| Manager | | Personal Banking Officer |
| James M. Combs | |
Michael J. Cox | Assistant Vice President and Indirect Loan | Betty L. Wolcott |
| Vice President and Area Loan Manager | Manager | Facilities Management Officer and Purchasing |
| | Manager |
Carrie C. Cribb | Amy S. Conner | |
| Vice President and Loan Officer | Assistant Vice President and Investment | Sylvie M. Zimmerman |
| Officer | Wildwood Branch Manager |
Ginger Devine | | |
| Vice President and Compliance Officer | Karen A. Dixon | |
| Assistant Vice President and Crystal River | |
Jankie Dhanpat | Loan Officer | |
| Vice President, SEC Reporting & | | |
| Controller | Jeffrey R. Dwiggins | |
| Assistant Vice President and Sales Manager | |
Lori M. Farfaglia | | |
| Vice President | Janet B. Farrar | |
| Fruitland Park & Main Street Branch | Assistant Vice President and Branch | |
| Manager | Operations Coordinator | |
| | |
James D. Haug | Gerd Felt | |
| Vice President and Area Loan Manager | Assistant Vice President and Commercial | |
| Closing Coordinator | |
Lawrence E. Hoag | | |
| Vice President | Cinda K. Franklin | |
| Deposit Operations Manager | Assistant Vice President and | |
| Citrus Ridge Branch Manager | |
59
FIRST FEDERAL SAVINGS BANK OF LAKE COUNTY
is Proud of the Outstanding Service its
Employees Provide to the Community and the People it Serves
MAIN OFFICE & | Pamela A. O’Neal | Brian R. Hofer | |
ADMINISTRATION: | Cynthia M. Page | Sarah L. Liston | SPRUCE CREEK |
| Marquisa L. Parham | Darcy R. Muniz | OFFICE: |
| Jamie L. Abbott | Tricka M. Parker | Fay E. Phillips | |
| Angela B. Allen | Tiffany L. Parks | Elizabeth R. Rizzo | Kimberly R. Bailey |
| Paul S. Allen | Angela N. Phillips | Anita Rodriguez | Loretta A. Brown |
| Emily C. Ashline | Heather Ponsell | Melissa D. Schumm | Sophia A. Cheek |
| Jay R. Bartholomew | Shirley R. Randolph | Sharon M. Slack | Crystal L. House |
| Kathy E. Bauer | Tanya R. Reiter | Shane Turk | Jennifer J. Long |
| Vickie S. Baxter | Carla L. Rigdon | | Connie J. Rhodes |
| Charlotte Bennett | Leslie Rocha | EUSTIS OFFICE: | |
| Victoria M. Boren | Natalie J. Rojas | | KINGS RIDGE OFFICE: |
| Barbara Boscana | Jennette L. Roode | Monica Ramjeet | Zaida Colon |
| Lisa B. Bostaph | Sandra A. Rowe | Patricia L. Bartels | Geraldine L. Burgio-Pilch |
| Donna L. Boyett | Dorothy M. Rowe | Amanda L. Collier | Erma R. Moore |
| Deena M. Bryant | Sandra L. Rutschow | Michael J. Cox | Detra M. Tracy |
| Janet R. Burgess | James Schaeffer | Vivian R. Curry | Tara H. Wainwright |
| Tammy A. Calhoun | Pamela S. Self | JoEllen Kersey | |
| Janet M. Caloro | Brandi Shaw | Lisa P. Lee | CRYSTAL RIVER |
| Norma J. Caron | Margaret Siegel | Shawna L. McConnell | OFFICE: |
| Kim L. Chamblin | Leigh S. Skehan | Natasha L. Pender | |
| Dianna L. Christensen | Claire M. Smith | Carolyn A. Rodgers | Keith W. Beaulieu |
| Joseph D. Cioppa | Shelley Smith | Tamika J. Rolle | Karen A. Dixon |
| James M. Combs | Jill S. Spires | Juanita L. Taylor | Elaine Giammasi |
| Betty Jo Conklin | Lynn P. Stoffel | Karen E. Wright | Teresa A. Kuechle |
| Amy S. Conner | Raynard S. Taylor | Arin L. Wyant | Valerie C. Lay |
| Judith A. Cook | Carolyn Torres | | Mitzi M. Parke |
| Diane S. Cook | Danine M. Urban | WILDWOOD OFFICE: | Elizabeth Shaw |
| Robert Cumm | Orpha M. Vogt | | Lori H. Soroka |
| James R. Cummings | Catherine M. Wallin | Craig S. Cannon | Donald E. Turner |
| Kathy A. Curtis | Robert R. Wedlock | Dana L. Fields | |
| Cheryl A. Davis | Lynda F. Wemple | Sarah A. Holt | VILLAGES/466: |
| James D. Davis | Margaret R. White | Rebecca S. Lloyd | |
| Dawn R. Davison | Sharon A.White | Holly D. Sanders | Sue Ann Carpenter |
| Lawashica M. Dawson | Rhonda L. Wilkerson | Wendy A. Then | Constance P. Christian |
| Ginger L. Devine | Joyce L. Williams | Cathy H. Watson | Carrie C. Cribb |
| Carol A. Dewey | Catherine N. Williams | Lori Young | Linda S. Finn |
| Jankie Dhanpat | Betty L. Wolcott | Sylvie M. Zimmerman | Clarisol P. Gonzalez |
| S. Kathy Dixon | Kristin L. Woods | | Latahna J. Green |
| Alma H. Dunbar | Ryan M. Woods | SOUTH LEESBURG | Cynthia D. Hinkle |
| Mary A. Durre | Lisa K. Woolwine | OFFICE: | Dennis R. Rogers |
| Jeffrey R. Dwiggins | Jeffrey W. Wright | | Paula R. Shipley |
| Janet B. Farrar | Cathy J. Wrobleski | Edgar R. Barron | Paula D. Williams |
| Gerd Felt | | Kari K. Caulk | |
| Amanda M Forwerck | LADY LAKE OFFICE: | Claudia Kubis | |
| Terry J. French | | Joanna L. Natal | |
| Clifford H. Frizzell Jr. | John A. Beaulieu | Tiffany C. Rodriguez | |
| Deniza Gardner | Karen L. Bednarik | Sandra L. Seaton | |
| June E. Gasbarra | Sonja K. Craig | Carol A. Sieder | |
| Joan P. Gibson | Estelle E. Crawley | Cristina P. Simmons | |
| Zoann Goodman | DeeDee A. Dye | Linda S. Wagner | |
| Amy L. Griffin | James D. Haug | | |
| Brenda M. Grubb | Constance L. Merrell-Kasch | BUSHNELL OFFICE: | |
| Brandy A. Harris | Mindy L. Mueller | | |
| Anna O. Harrop | Linda H. Murdock | Dawn M. Greene | |
| Dwight L. Hart | Jonathon D. Reeder | Betty J Hewett | |
| Lynette N. Hipp | Brenda A. Simmons | Tammie C. Martin | |
| Lawrence E. Hoag | Vanessa D. Wall | Brenda Matthews | |
| Karen L. Hollister | Misty M. Ware | Amy C. Snow | |
| Justin A. Holloway | Betty T. Woods | | |
| Cathy D. Hughes | | FRUITLAND PARK | |
| Janie W. Hunt | MAIN STREET OFFICE: | OFFICE: | |
| Mary C. Hurst | | | |
| Patricia B Inman | Amanda J. Adams | Dawn C. Alexander | |
| Bobby H. Inscoe | Hilda A. Foster | Lori M. Farfaglia | |
| Jennifer D. Jennings | Catherine Love | Suzzette Herman | |
| Sondra Jones | Suzanne E. Shier | Kim L. Jones | |
| Stephen G. Knowles | Laura K. Soltau | Jennifer A. Strow | |
| Connie Kolisnyk | | Delphine C. Williams | |
| Deborah A. Kolody | LAKE SQUARE | | |
| Kenneth G. Kramer | MALL OFFICE: | | |
| Stephen T. Kurtz | | INVERNESS OFFICE: | |
| Diane M. Lake | Eileen M. Bitting | Mary R. Asher | |
| Nancy J. Lane | Tammy L. Dahl | Judith Lamontagne | |
| Cynthia M. Lay | Linda J. Giggey | Linda S. Rogers | |
| Leslie A. Leach | Bethany Johnson | Lillian G. Russo | |
| Debra J. Lenhart | Jolena Sanders | | |
| Marilyn A. Leugers | Tara A. Keane | Phil P. Tompetrini | |
| Angie R. Liston | Shannon J. Peters | Jeremy L. Wall | |
| Margaret H. Locke | Melissa M. White | | |
| Sharon R. Luke | | CITRUS RIDGE OFFICE: | |
| Megan L. Marsh | CLERMONT OFFICE: | | |
| Melissa Marsh | | Stephany M. Barr | |
| Annette McCullough | Susan Lynn Berkebile | Belitza A. Estanislau | |
| Janet (Jaye) I. McIntosh | Lindsay Diaz | Cinda K. Franklin | |
| Tammy M. Mizell | Birgit M. Fox | Christine M. Martinez | |
| Tami Mosier | Donna L. Franklin | Barbara J. Reutter | |
| Paul K. Mueller | Linda C. Gallop | Amanda N. Smeltzer | |
| Shu Een Chen-Noble | Judy L. Garafola | Sarah L. Williams | |
60