Exhibit 99.3
@NFX is periodically published to keep shareholders aware of current operating activities at Newfield. It may include estimates of expected production volumes, costs and expenses, recent changes to hedging positions and commodity pricing.
February 5, 2009
This edition of @NFX includes:
| · | 2008 DRILLING ACTIVITY BY AREA |
| · | OPERATIONAL SUMMARIES BY GEOGRAPHIC REGION |
| · | FIRST QUARTER 2009 GUIDANCE |
| · | UPDATED TABLES DETAILING COMPLETE HEDGE POSITIONS |
Fourth Quarter 2008 Drilling Activity
NFX Operated Non-Operated Gross Wells Dry Holes
| Mid-Continent | | | 23 | | | | 28 | | | | 51 | | | | 0 | |
| Rocky Mount. | | | 81 | | | | 3 | | | | 84 | | | | 1 | |
| Onshore GC | | | 17 | | | | 3 | | | | 20 | | | | 5 | |
| Gulf of Mexico | | | 1 | | | | 1 | | | | 2 | | | | 0 | |
| International | | | 4 | | | | 4 | | | | 8 | | | | 0 | |
| Total: | | | 126 | | | | 39 | | | | 165 | | | | 6 | |
2008 Drilling Activity
NFX Operated Non-Operated Gross Wells Dry Holes
| Mid-Continent | | | 120 | | | | 107 | | | | 227 | | | | 3 | |
| Rocky Mount. | | | 271 | | | | 16 | | | | 287 | | | | 4 | |
| Onshore GC | | | 55 | | | | 9 | | | | 64 | | | | 16 | |
| Gulf of Mexico | | | 3 | | | | 3 | | | | 6 | | | | 1 | |
| International | | | 10 | | | | 13 | | | | 23 | | | | 1 | |
| Total: | | | 459 | | | | 148 | | | | 607 | | | | 25 | |
HIGHLIGHTS
| - | 2008 production of 236 Bcfe, an increase of 24% over 2007 proforma volumes of 190 Bcfe (adjusted for asset sales and acquisitions). |
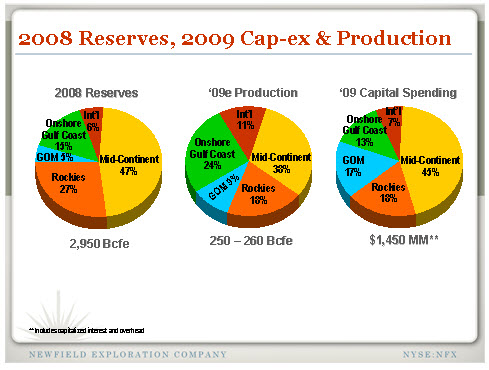
| - | Year-end 2008 proved reserves of 2.95 Tcfe, an 18% increase over proved reserves at year-end 2007. We replaced nearly 300% of 2008 production with new reserves. Substantially all of the reserve additions were from organic drilling programs and 62% at year-end were proved developed. Net negative reserve revisions, due primarily to lower commodity prices at year-end 2008, totaled 66 Bcfe. |
| - | 2008 Capital Spending/Finding Costs. Newfield invested approximately $2.3 billion in 2008. Total F&D costs in 2008 were $2.96 per Mcfe, excluding the negative impact of price-related reserve revisions, and $3.31 per Mcfe including the revisions. |
| - | Approximately 75% of total Company year–end ’08 reserves in resource plays in our two largest divisions: the Mid-Continent and Rocky Mountains. Reserves in these divisions increased 21%. Nearly two-thirds of the 2009 capital budget is allocated to these areas. Combined F&D costs in the Mid-Continent and Rocky Mountains averaged $1.91 per Mcfe in 2008, excluding the negative impact of price related reserve revisions and $2.23 per Mcfe including the revisions. |
| - | Five deepwater Gulf of Mexico developments provide visible, future production growth. |
| - | Williston Basin success continues with a growing inventory of oil locations in the Bakken and Sanish/Three Forks. |
| - | 2009-10 hedge position has a mark-to-market value of nearly $1 billion. Approximately 70% of expected 2009 gas production is hedged with an average minimum price of nearly $8 per Mcf. Substantially all of our 2009 domestic oil production is hedged with half of this amount fixed at about $129 per barrel and the remainder with a floor price of $107 per barrel. |
Our 2009 capital expenditures budget is $1.4 billion, down 30% from original expectations. Our estimate for 2009 cash flow is anchored by our substantial hedge position.
MID-CONTINENT
Our fastest growing division over the last three years has been the Mid-Continent. With 1.4 Tcfe in proved reserves, it comprised 47% of our total Company reserves at year-end 2008. Finding and development costs in the Mid-Continent were approximately $1.80 per Mcfe, excluding the negative impact of price-related reserve revisions and $2.02 per Mcfe including the revisions. The significant improvement in our F&D costs was driven by the Woodford Shale.
THE WOODFORD
The Woodford Shale remains the most active play in Oklahoma and its development has represented the largest portion of our annual capital expenditures for the last three years. There have been 750 industry horizontal wells drilled in the play to date. We have operated 225 of these wells and have 165,000 net acres, of which nearly 90% is “held-by-production,” providing us with control over timing of development.
Our Woodford production set a record in mid-December, surpassing our year-end goal of 250 MMcfe/d. Total 2008 Woodford production increased 65% over 2007. We expect that production will grow 30% in 2009, despite running fewer operated rigs.
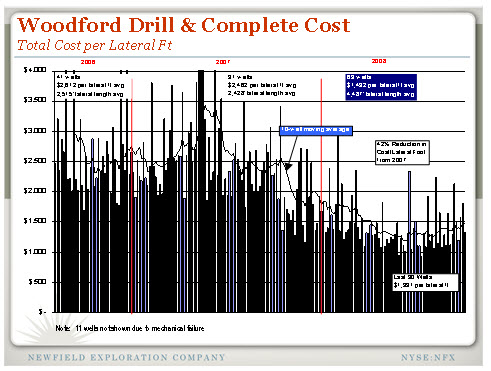
We plan to run 11 operated rigs throughout 2009. Although the rigs are under “term contract,” nine of the 11 rig contracts expire in 2009. We averaged 12 operated rigs in 2008, compared to 13 in 2007. Although we ran fewer rigs, we completed more than 100,000’ of additional Woodford section than in 2007. We reduced our costs to drill and complete a lateral foot of Woodford in 2008 by more than 40% compared to 2007.
The above chart depicts our Woodford wells drilled in 2006-08. Our average cost to drill and complete a lateral foot of Woodford has fallen 42% since 2007.
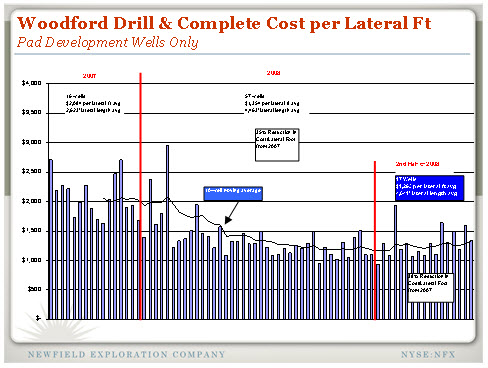
The above chart depicts ONLY wells drilled from common pads. The cost to drill a lateral foot in our last 17 wells has averaged 38% less than in 2007.
We accomplished our cost reductions in several ways:
| - | Drilling improvements – We’re drilling our wells faster. We have identified “speed zones” in the Woodford section that allow our penetration rates in the lateral to dramatically improve. We are continually refining bit designs and using new technology for bits to drill faster and run longer which has been another significant factor for driving cost out of our program. |
| - | Pad drilling – Before the majority of our acreage was held by production, we were unable to fully implement pad drilling. Costs have significantly improved with pad drilling. More than 80% of our 2009 wells will be from common pads. |
| - | Completion advances – We have refined our completions with the biggest cost savings coming through reducing our pumped frac fluid volumes. |
| - | Increased lateral lengths – In 2006, our average well had a 2500’ lateral and our plans for 2009 include 5000’ laterals. Please see above chart. Although our longer lateral wells cost more, the F&D cost per MCF is significantly lower. |
We expect that our average Woodford well in 2009 will have at least a 5,000’ lateral. The above chart shows how F&D metrics improve with increasing lateral length.
DUAL LATERAL COMPLETION -- We recently commenced production from our first multi-lateral completion in the Woodford. The well had initial production of 13 MMcf/d and is producing 6 MMcf/d after nearly three months of production (the well has averaged 8 MMcf/d over that time). The two laterals totaled more than 8,500’.
SUPER EXTENDED LATERAL -- We are currently completing our first super extended lateral. The well has a 5,600’ lateral with 12 frac stages. Production is expected to commence shortly. Increasing lateral lengths are an important part of our plan in 2009.
MOUNTAIN FRONT WASH/STILES RANCH FIELD
Our Stiles Ranch Field located in the Texas Panhandle and western Oklahoma achieved a record gross production rate of 130 MMcfe/d. We have an approximate 80% interest in Stiles Ranch. Our knowledge base from the Woodford’s horizontal development is being applied to improve our estimated recoveries and to lower our F&D costs.
ROCKY MOUNTAINS
MONUMENT BUTTE FIELD
Monument Butte, in the Uinta Basin of Utah, benefited from increased activity levels in 2008. Production reached 17,000 BOPD gross at year end 2008, growing 17% over 2007.
We drilled 124 wells on 20-acre spacing in the field and expect to drill more than 3,000 wells to fully develop the field. We have drilled more than 900 wells since acquiring the field in 2004. We added 45,000 net acres north and adjacent to Monument Butte. These lands are owned by the Ute Tribe where we have drilled 44 successful wells out of 45 attempts to date. Results have been consistent with drilling in the main field area.
We drilled three successful deep gas tests in the eastern portion of the Monument Butte Field. We participated in eight outside operated wells to test the Wasatch, Mesa Verde, Blackhawk and Mancos Shale. A deep gas exploration agreement signed in late 2008 allows for promoted exploratory drilling and progressive earning in approximately 71,000 net acres in which we will retain a greater than 70% interest. Approximately 10,000 net acres in the immediate vicinity of deep gas tests were excluded from the agreement.
In the area excluded from the exploration agreement mentioned above, we recently drilled three successful deep gas wells and participated in two wells that await completion in the eastern portion of the Monument Butte field. These wells tested the Mesa Verde, Blackhawk and Mancos Shale. We have an approximate 86% interest in these wells.
GREATER WILLISTON BASIN
We have a significant acreage position in the Williston Basin. Since 2007, we have added more than 400,000 net acres and are focused primarily on the Bakken Shale and Three Forks/Sanish formations.
Our recent drilling has focused in North Dakota on the southern end of the Nesson Anticline. Drilling results are summarized below:
| Well Name | Initial Rate | Target Zone |
| Olson 1-30H | 329 BOEPD | Bakken |
| Larsen 1-16H | 710 BOEPD | Bakken |
| Rolfsrud 1-32H | 590 BOEPD | Bakken |
| Wisness 1-21H | 538 BOEPD | Bakken |
| Jorgensen 1-10H | 911 BOEPD | Bakken |
| Jorgensen 1-4H | 622 BOEPD | Bakken |
| Jorgensen 1-15H | 1,010 BOEPD | Sanish/Three Forks |
| Lost Bridge 16-9H | 1,023 BOEPD | Sanish/Three Forks |
GULF OF MEXICO
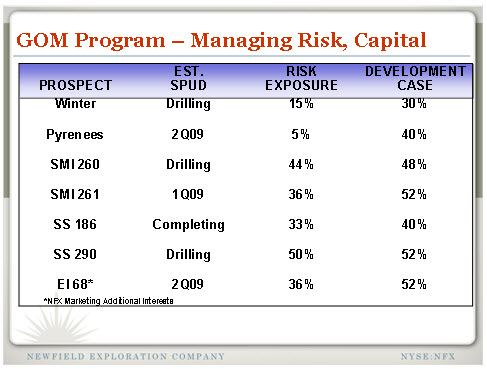
The Gulf of Mexico deepwater program was successful with four wells in 2008/early 2009. Developments underway are expected to generate significant production growth over the next three years.
To reduce capital expenditures and risk, we sold down interests in our 2009 drilling program on a promoted basis. The following chart shows our planned wells and our risked capital exposure in initial exploration as compared to our development case interest.
An update on deepwater developments:
Dalmatian: In the fourth quarter of 2008, we made a significant deepwater GOM discovery at the Dalmatian prospect, located at Desoto Canyon Block 48 in about 5,900’ of water. The well found more than 120' of net high quality dry gas pay in about 5,900 feet of water. The discovery will be developed via a sub-sea tie back to an existing infrastructure. We have a 37.5% working interest. Partners include: Murphy Oil Corporation (operator), 50% working interest and Mariner Energy, 12.5% working interest. We anticipate first production in 2010.
Gladden: The MC 800#1 updip sidetrack tested approximately 5,600 BOEPD. We expect first production in early 2010. We operate and have a 47.5% working interest.
Anduin West: Located at Mississippi Canyon 754, the well tested 32 MMcfe/d. We expect first production in early 2010.
Fastball: Located at Viosca Knoll 1003, this single well development will be a sub-sea tieback to existing infrastructure with first production expected in late 2009. We operate Fastball with a 66% working interest.
Sargent: Located at Garden Banks 339 was drilled and completed. We operate with a 25% interest. Development plans are for a single well tie back to existing infrastructure with first production in 2010.
Shallow Water GOM
Since the sale of the majority of our Gulf of Mexico Shelf assets during August 2007, we have very selectively acquired 10 new shallow water leases through farm-in and lease sale efforts. We currently operate three rigs on the Gulf of Mexico Shelf, and have drilled four prospects since August 2007 making three discoveries. Eight of the newly acquired leases remain to be tested.
INTERNATIONAL
MALAYSIA
Malaysia oil volumes grew 145% in 2008. All of our shallow water fields on PM 318 and PM 323 are now on-line. Although planned international activity levels have been reduced in 2009 due to capital budget constraints, production is expected to increase 10% over 2008 levels.
In the second half of 2008, we drilled six producers and one gas source/injector in a “Phase 1 Program” at East Belumut in Malaysia. The PM 323 fields (East Belumut and Chermingat) are producing 16,000 BOPD gross and performing better than our initial assumptions. Total production from our Malaysian properties is more than 43,000 BOPD. We have a 50% interest in PM 318 and a 60% operated interest in PM 323.
We spud the Paus-1 exploration well early February 2009 in deepwater Block 2C. We are the operator with a 40% working interest. Other partners include Petronas Carigali (40%) and Mitsubishi (20%).
CHINA
Current gross production from our fields in Bohai Bay is 16,000 BOPD, or approximately 1,900 BOPD net to our interest.
FIRST QUARTER 2009 ESTIMATES
| | | 1Q09 Estimates | |
| | | Domestic | | | Int’l | | | Total | |
Production/Liftings Note 1 | | | | | | | | | |
| Natural gas – Bcf | | | 42.1 – 46.6 | | | | – | | | | 42.1 – 46.6 | |
| Oil and condensate – MMBbl | | | 1.4 – 1.6 | | | | 1.4 – 1.5 | | | | 2.8 – 3.1 | |
| Total Bcfe | | | 50.7 – 56.0 | | | | 8.3 – 9.1 | | | | 59.0 – 65.1 | |
| | | | | | | | | | | | | |
| Average Realized Prices | | | | | | | | | | | | |
| Natural gas – $/Mcf | | Note 2 | | | | | | | | | |
| Oil and condensate – $/Bbl | | Note 3 | | | Note 4 | | | | | |
| Mcf equivalent – $/Mcfe | | | | | | | | | | | | |
| | | | | | | | | | | | | |
| Operating Expenses: | | | | | | | | | | | | |
| Lease operating | | | | | | | | | | | | |
| Recurring ($MM) | | $ | 52.4 - $57.9 | | | $ | 15.2 - $16.8 | | | $ | 67.6 - $74.7 | |
| per/Mcfe | | $ | 1.03 - $1.04 | | | $ | 1.83 - $1.85 | | | $ | 1.14 - $1.16 | |
| Major (workover, repairs, etc.) ($MM) | | $ | 8.8 - $9.7 | | | | – | | | $ | 8.8 - $9.7 | |
| per/Mcfe | | $ | 0.17 - $0.18 | | | | – | | | $ | 0.15 - $0.16 | |
| | | | | | | | | | | | | |
Production and other taxes ($MM)Note 5 | | $ | 14.1 - $15.5 | | | $ | 5.1 - $5.7 | | | $ | 19.2 - $21.2 | |
| per/Mcfe | | $ | 0.27 - $0.28 | | | $ | 0.61 - $0.63 | | | $ | 0.32 - $0.33 | |
| | | | | | | | | | | | | |
| General and administrative (G&A), net ($MM) | | $ | 32.7 - $36.1 | | | $ | 1.5 - $1.7 | | | $ | 34.2 - $37.8 | |
| per/Mcfe | | $ | 0.64 - $0.65 | | | $ | 0.18 - $0.19 | | | $ | 0.57 - $0.59 | |
| | | | | | | | | | | | | |
| Capitalized internal costs ($MM) | | | | | | | | | | $ | (17.1 - $18.9 | ) |
| per/Mcfe | | | | | | | | | | $ | (0.28 - $0.30 | ) |
| | | | | | | | | | | | | |
| Interest expense ($MM) | | | | | | | | | | $ | 29.2 - $32.3 | |
| per/Mcfe | | | | | | | | | | $ | 0.48 - $0.50 | |
| | | | | | | | | | | | | |
| Capitalized interest ($MM) | | | | | | | | | | $ | (15.4 - $17.0 | ) |
| per/Mcfe | | | | | | | | | | $ | (0.25 - $0.27 | ) |
| | | | | | | | | | | | | |
Tax rate (%)Note 6 | | | | | | | | | | | 36% - 38 | % |
| | | | | | | | | | | | | |
| Income taxes (%) | | | | | | | | | | | | |
| Current | | | | | | | | | | | 14% - 16 | % |
| Deferred | | | | | | | | | | | 84% - 86 | % |
| | | | | | | | | | | | | |
Note 1: Reflects approximately 1.75 Bcfe of deferred domestic gas production related to GOM storms. Note 2: Gas prices in the Mid-Continent, after basis differentials, transportation and handling charges, typically average 70 – 80% of the Henry Hub Index. Gas prices in the Gulf Coast, after basis differentials, transportation and handling charges, are expected to average $0.40 – $0.60 per MMBtu less than the Henry Hub Index. Note 3: Oil prices in the Gulf Coast typically average 90 – 95% of NYMEX WTI price. Rockies oil prices average about $12 - $14 per barrel below WTI. Oil production from the Mid-Continent typically averages 96 – 98% of WTI. Note 4: Oil in Malaysia typically sells at a slight discount to Tapis, or about 90% of WTI. Oil production from China typically sells at $10 - $15 per barrel below WTI. Note 5: Guidance for production taxes determined using $50/Bbl oil and $5/MMBtu gas. Note 6: Tax rate applied to earnings excluding unrealized gains or losses on commodity derivatives. | |
2009 SPENDING SUMMARY BY QUARTER
In 2009, our capital spending plans are “front-end loaded” due to the timing of our exploratory drilling plans and other developments. Below is a table that details how our $1.45 billion budget will be allocated by quarter.
(in millions) 1Q09 | 2Q09 | 3Q09 | 4Q09 | TOTAL BUDGET |
| $460-$480 | $405-$420 | $310-$325 | $210-$225 | $1,450 |
NATURAL GAS HEDGE POSITIONS
Please see the tables below for our complete hedging positions.
The following hedge positions for the first quarter of 2009 and beyond are as of February 4, 2009:
First Quarter 2009
| | | Weighted Average | | | Range | |
| Volume | | Fixed | | | Floors | | | Collars | | | Floor | | | Ceiling | |
| 2,745 MMMBtus | | $ | 7.14 | | | | — | | | | — | | | | — | | | | — | |
| 21,150 MMMBtus | | | — | | | | — | | | $ | 8.09 — $10.88 | | | $ | 8.00 — $9.00 | | | $ | 9.67 — $17.60 | |
| 9,000 MMMBtus* | | | — | | | | — | | | $ | 8.70 — $13.92 | | | $ | 8.00 — $9.00 | | | $ | 11.72 — $20.10 | |
Second Quarter 2009
| | | Weighted Average | | | Range | |
| Volume | | Fixed | | | Floors | | | Collars | | | Floor | | | Ceiling | |
| 21,950 MMMBtus | | $ | 7.81 | | | | — | | | | — | | | | — | | | | — | |
| 13,485 MMMBtus | | | — | | | | — | | | $ | 8.00 — $11.83 | | | $ | 8.00 | | | $ | 8.97 — $14.37 | |
Third Quarter 2009
| | | Weighted Average | | | Range | |
| Volume | | Fixed | | | Floors | | | Collars | | | Floor | | | Ceiling | |
| 22,150 MMMBtus | | $ | 7.81 | | | | — | | | | — | | | | — | | | | — | |
| 13,620 MMMBtus | | | — | | | | — | | | $ | 8.00 — $11.83 | | | $ | 8.00 | | | $ | 8.97 — $14.37 | |
Fourth Quarter 2009
| | | Weighted Average | | | Range | |
| Volume | | Fixed | | | Floors | | | Collars | | | Floor | | | Ceiling | |
| 26,120 MMMBtus | | $ | 7.34 | | | | — | | | | — | | | | — | | | | — | |
| 8,435 MMMBtus | | | — | | | | — | | | $ | 8.23 — $11.20 | | | $ | 8.00 — $8.50 | | | $ | 8.97 — $14.37 | |
First Quarter 2010
| | | Weighted Average | | | Range | |
| Volume | | Fixed | | | Floors | | | Collars | | | Floor | | | Ceiling | |
| 15,600 MMMBtus | | $ | 7.41 | | | | — | | | | — | | | | — | | | | — | |
| 5,700 MMMBtus | | | — | | | | — | | | $ | 8.50 — $10.44 | | | $ | 8.50 | | | $ | 10.00 — $11.00 | |
Second Quarter 2010
| | | Weighted Average | | | Range | |
| Volume | | Fixed | | | Floors | | | Collars | | | Floor | | | Ceiling | |
| 11,190 MMMBtus | | $ | 6.78 | | | | — | | | | — | | | | — | | | | — | |
Third Quarter 2010
| | | Weighted Average | | | Range | |
| Volume | | Fixed | | | Floors | | | Collars | | | Floor | | | Ceiling | |
| 11,280 MMMBtus | | $ | 6.78 | | | | — | | | | — | | | | — | | | | — | |
Fourth Quarter 2010
| | | Weighted Average | | | Range | |
| Volume | | Fixed | | | Floors | | | Collars | | | Floor | | | Ceiling | |
| 3,790 MMMBtus | | $ | 6.78 | | | | — | | | | — | | | | — | | | | — | |
*These 3–way collar contracts are standard natural gas collar contracts with respect to the periods, volumes and prices stated above. The contracts have floor and ceiling prices per MMBtu as per the table above until the price drops below a weighted average price of $7.20 per MMBtu. Below $7.20 per MMBtu, these contracts effectively result in realized prices that are on average $1.50 per MMBtu higher than the cash price that otherwise would have been realized.
The following table details the expected impact to pre-tax income from the settlement of our derivative contracts, outlined above, at various NYMEX gas prices, net of premiums paid for these contracts (in millions).
| | | $ | 4.00 | | | $ | 5.00 | | | $ | 6.00 | | | $ | 7.00 | | | $ | 8.00 | |
| 2009 | | | | | | | | | | | | | | | | | | | | |
| 1st Quarter | | $ | 109 | | | $ | 85 | | | $ | 61 | | | $ | 37 | | | $ | 6 | |
| 2nd Quarter | | $ | 137 | | | $ | 102 | | | $ | 66 | | | $ | 31 | | | $ | (5 | ) |
| 3rd Quarter | | $ | 138 | | | $ | 102 | | | $ | 67 | | | $ | 31 | | | $ | (5 | ) |
| 4th Quarter | | $ | 123 | | | $ | 88 | | | $ | 54 | | | $ | 19 | | | $ | (15 | ) |
| Total 2009 | | $ | 507 | | | $ | 377 | | | $ | 248 | | | $ | 118 | | | $ | (19 | ) |
| | | | | | | | | | | | | | | | | | | | | |
| 2010 | | | | | | | | | | | | | | | | | | | | |
| 1st Quarter | | $ | 79 | | | $ | 57 | | | $ | 36 | | | $ | 15 | | | $ | (6 | ) |
| 2nd Quarter | | $ | 31 | | | $ | 20 | | | $ | 9 | | | $ | (2 | ) | | $ | (13 | ) |
| 3rd Quarter | | $ | 31 | | | $ | 20 | | | $ | 9 | | | $ | (3 | ) | | $ | (14 | ) |
| 4th Quarter | | $ | 11 | | | $ | 7 | | | $ | 3 | | | $ | (1 | ) | | $ | (5 | ) |
| Total 2010 | | $ | 152 | | | $ | 104 | | | $ | 57 | | | $ | 9 | | | $ | (38 | ) |
In the Rocky Mountains, we hedged basis associated with 40% of the proved producing fields from January 2009 through full-year 2012. The weighted average hedged differential during this period was $(0.976) per Mmbtu.
Approximately 13% of our natural gas production correlates to Houston Ship Channel, 8% to Transco Zone 0, 36% to CenterPoint/East, 16% to Panhandle Eastern Pipeline, 7% to Waha, 9% to Colorado Interstate, 11% to others.
CRUDE OIL HEDGE POSITIONS
The following hedge positions for the first quarter of 2009 and beyond are as of February 4, 2009:
First Quarter 2009
| | | Weighted Average | | | Range | |
| Volume | | Fixed | | | Floors | | | Collars | | | Floor | | | Ceiling | |
| 810,000 Bbls | | $ | 128.93 | | | | — | | | | — | | | | — | | | | — | |
| 810,000 Bbls | | | — | | | $ | 107.11 | | | | — | | | $ | 104.50 — $109.75 | | | | — | |
Second Quarter 2009
| | | Weighted Average | | | Range | |
| Volume | | Fixed | | | Floors | | | Collars | | | Floor | | | Ceiling | |
| 819,000 Bbls | | $ | 128.93 | | | | — | | | | — | | | | — | | | | — | |
| 819,000 Bbls | | | — | | | $ | 107.11 | | | | — | | | $ | 104.50 — $109.75 | | | | — | |
Third Quarter 2009
| | | Weighted Average | | | Range | |
| Volume | | Fixed | | | Floors | | | Collars | | | Floor | | | Ceiling | |
| 828,000 Bbls | | $ | 128.93 | | | | — | | | | — | | | | — | | | | — | |
| 828,000 Bbls | | | — | | | $ | 107.11 | | | | — | | | $ | 104.50 — $109.75 | | | | — | |
Fourth Quarter 2009
| | | Weighted Average | | | Range | |
| Volume | | Fixed | | | Floors | | | Collars | | | Floor | | | Ceiling | |
| 828,000 Bbls | | $ | 128.93 | | | | — | | | | — | | | | — | | | | — | |
| 828,000 Bbls | | | — | | | $ | 107.11 | | | | — | | | $ | 104.50 — $109.75 | | | | — | |
First Quarter 2010
| | | Weighted Average | | | Range | |
| Volume | | Fixed | | | Floors | | | Collars | | | Floor | | | Ceiling | |
| 90,000 Bbls | | $ | 93.40 | | | | — | | | | — | | | | — | | | | — | |
| 810,000 Bbls | | | — | | | | — | | | $ | 127.97— $170.00 | | | $ | 125.50 — $130.50 | | | $ | 170.00 | |
Second Quarter 2010
| | | Weighted Average | | | Range | |
| Volume | | Fixed | | | Floors | | | Collars | | | Floor | | | Ceiling | |
| 90,000 Bbls | | $ | 93.40 | | | | — | | | | — | | | | — | | | | — | |
| 819,000 Bbls | | | — | | | | — | | | $ | 127.97— $170.00 | | | $ | 125.50 — $130.50 | | | $ | 170.00 | |
Third Quarter 2010
| | | Weighted Average | | | Range | |
| Volume | | Fixed | | | Floors | | | Collars | | | Floor | | | Ceiling | |
| 90,000 Bbls | | $ | 93.40 | | | | — | | | | — | | | | — | | | | — | |
| 828,000 Bbls | | | — | | | | — | | | $ | 127.97— $170.00 | | | $ | 125.50 — $130.50 | | | $ | 170.00 | |
Fourth Quarter 2010
| | | Weighted Average | | | Range | |
| Volume | | Fixed | | | Floors | | | Collars | | | Floor | | | Ceiling | |
| 90,000 Bbls | | $ | 93.40 | | | | — | | | | — | | | | — | | | | — | |
| 828,000 Bbls | | | — | | | | — | | | $ | 127.97— $170.00 | | | $ | 125.50 — $130.50 | | | $ | 170.00 | |
The following table details the expected impact to pre-tax income from the settlement of our derivative contracts, outlined above, at various NYMEX oil prices, net of premiums paid for these contracts (in millions).
| | Oil Prices | |
| | $40.00 | $50.00 | $60.00 | $70.00 | $80.00 |
| 2009 | | | | | |
| 1st Quarter | $ 120 | $ 104 | $ 88 | $ 72 | $ 55 |
| 2nd Quarter | $ 122 | $ 105 | $ 89 | $ 72 | $ 56 |
| 3rd Quarter | $ 123 | $ 107 | $ 90 | $ 73 | $ 57 |
| 4th Quarter | $ 145 | $ 134 | $ 122 | $ 112 | $ 101 |
| Total 2009 | $ 510 | $ 450 | $ 389 | $ 329 | $ 269 |
| | | | | | |
| 2010 | | | | | |
| 1st Quarter | $ 69 | $ 59 | $ 50 | $ 42 | $ 33 |
| 2nd Quarter | $ 69 | $ 60 | $ 51 | $ 42 | $ 33 |
| 3rd Quarter | $ 70 | $ 61 | $ 52 | $ 42 | $ 33 |
| 4th Quarter | $ 70 | $ 61 | $ 52 | $ 42 | $ 33 |
| Total 2010 | $ 278 | $ 241 | $ 205 | $ 168 | $ 132 |
We provide information regarding our outstanding hedging positions in our annual and quarterly reports filed with the SEC and in our electronic publication -- @NFX. This publication can be found on Newfield’s web page at http://www.newfield.com. Through the web page, you may elect to receive @NFX through e-mail distribution.
FINDING AND DEVELOPMENT COSTS
Newfield believes that the analysis of F&D cost is a useful tool in helping to evaluate capital productivity. We calculate F&D cost by dividing development, exploitation and exploration capital expenditures by reserve additions for the period. Acquisitions, land, seismic and asset retirement obligations are included in the calculation. Due to the significant drop in commodity prices in late 2008, we have presented the F&D costs in this publication both including and excluding the impact of negative price-related reserve revisions to highlight the impact that the significant drop in prices during 2008 had on net reserve additions and to help provide comparability with F&D costs in prior periods. The metrics provided in this publication should be read and utilized in conjunction with our financial statements and Annual Report on Form 10-K, which are prepared in accordance with generally accepted accounting principles.
Newfield Exploration Company is an independent crude oil and natural gas exploration and production company. The Company relies on a proven growth strategy of growing reserves through an active drilling program and select acquisitions. Newfield's domestic areas of operation include the Anadarko and Arkoma Basins of the Mid-Continent, the Rocky Mountains, onshore Texas and the Gulf of Mexico. The Company has international operations in Malaysia and China.
FORWARD LOOKING STATEMENTS
**This publication contains forward-looking information. All information other than historical facts included in this publication, such as information regarding estimated or anticipated first quarter 2009 results, estimated 2009 capital expenditures, cash flow, production and cost reductions, drilling and development plans and the timing of activities, is forward-looking information. Although Newfield believes that these expectations are reasonable, this information is based upon assumptions and anticipated results that are subject to numerous uncertainties and risks. Actual results may vary significantly from those anticipated due to many factors, including drilling results, oil and gas prices, industry conditions, the prices of goods and services, the availability of drilling rigs and other support services, the availability of refining capacity for the crude oil Newfield produces from its Monument Butte field in Utah, the availability and cost of capital resources, labor conditions and severe weather conditions (such as hurricanes). In addition, the drilling of oil and gas wells and the production of hydrocarbons are subject to governmental regulations and operating risks.
12