Exhibit 99.2
@NFX is periodically published to keep shareholders aware of current operating activities at Newfield. It may include estimates of expected production volumes, costs and expenses, recent changes to hedging positions and commodity pricing.
April 25, 2007
This edition of @NFX includes:
| | • | | Update on Development Projects |
| |
| | • | | 2007 Production Guidance |
| |
| | • | | Update on Recent Activities |
| |
| | • | | Woodford Shale Update and Well Economics |
| |
| | • | | Updated Tables Detailing Complete Hedging Positions |
Fastball Development (Viosca Knoll 1003)
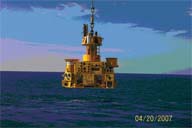
Fastball found approximately 90’ of net gas pay, exceeding pre-drill expectations. The well will be developed with a sub-sea tie to one of several existing fields in the area. The sub-sea tree for this development has been set and first production is expected in late 2008/early 2009. Newfield has a 67% interest.
(Newfield’s deepwater Fastball well was drilled successfully in
late April and the sub-sea tree set in place in the Gulf of Mexico.)
2007 Production Guidance
The following table outlines Newfield’s expected range of production by area for 2007.
| | | | | | | | | |
| | | 2006a (Bcfe) | | 2007e (Bcfe) | | % Increase |
| | | | | | | | | |
Gulf of Mexico | | | 93 | | | 95 — 100 | | 2 — 7% |
Onshore U.S. | | | 143 | | | 158 — 162 | | 10 — 13% |
International (excludes Grove and Abu) | | | 6.6 | | | 7 — 8 | | 6 — 21% |
Total | | | 242.6 | | | 260—270 | | 7 — 11% |
Grove Field, U.K. North Sea | | — | | 1 — 3* | | NM |
Abu Field, offshore Malaysia | | — | | 4 — 6 | | NM |
| | |
| * | | Assumes that the Grove Field is voluntarily curtailed to approximately 10 MMcfe/d (gross) for the remainder of 2007 due to low U.K. natural gas prices. |
FOCUS AREA UPDATES
MID-CONTINENT
In the first quarter, the Mid-Continent region completed 41 successful wells with no dry holes. For 2007, we expect to drill approximately 300 wells, with about half in the Woodford Shale Play. We are running 20 operated rigs in the Mid-Continent at this time.
Woodford Shale
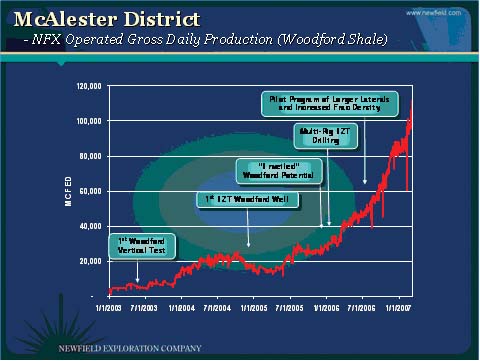
Over the last year, gross daily production in the Woodford has quadrupled from 25 MMcfe/d to a current rate of approximately 110 MMcfe/d. Newfield is now operating 14 of the 40 industry rigs in the Woodford and remains the most active driller. Our acreage in the play continues to expand and today we have interest in approximately 137,000 net acres.
Woodford Shale Economics
To date, the industry has spud more than 200 horizontal wells in the Woodford. Newfield has spud more than 80 of these wells. After experimentation with different drilling and completion techniques, the Company has “standardized” its well designs in the play. Recent wells have 5 fracture stimulation stages across a 2,500’ lateral. Results point to better production rates and increased estimated reserve recoveries. Horizontal well costs have fluctuated during their evolution as we used data to determine the “model” Woodford Shale well that delivered the lowest per unit development costs.
Here is some historical information regarding horizontal drilling, well costs and estimated recoveries:
Mid-2006:In May 2006, we hosted an analyst/shareholder meeting in Tulsa, OK. At that time, the average well cost was approximately $4 to $4.5 million (gross). Our definition of a standard well at the time was a 2,500’ lateral with a three-stage frac. We estimated that the wells would recover 2.5 — 3 Bcfe (gross). Drilling and completion costs have risen since May 2006.
In today’s dollars, we estimate that this horizontal well would cost $4.8 to $5 million (gross).We had less than 10 wells in our data set at the time of this initial estimate. We have a sample set now with more than 25 wells with three-stage fracs and at
least 180 days of production. From this data, we believe that a 2,500’ lateral with a three-stage frac will recover approximately 2.5 Bcfe (gross).
In the second half of 2006,we experimented with longer lateral lengths (as long as 3,700’). The higher well costs were not justified by reserve recoveries. We returned to a 2,500’ lateral and increased frac densities from three to five stages — or a frac every 500’ along the lateral. Adding two additional frac stages increased well costs by about $800,000 (gross).
April 2007:We now have a data set of over 30 wells with increased frac densities and the estimated reserve recoveries are significantly higher. We have redefined our “standard” well. Current costs to drill a 2,500’ lateral with five frac stages is approximately$5.5 — $6 million (gross). EUR’s have increased to3 to 3.4 Bcf (gross).
Newfield remains in the assessment phase and well costs include approximately $200,000 of “science costs,” including experimentation and investments in new drilling technologies, mud systems, bits, steerables, etc. In addition, only one well per 640-acre section is being drilled at this time. In the development phase, the “science” costs will disappear and synergies will be gained through the proximity of drilling operations.
| | • | | A 2,500’ lateral with a three-stage frac would cost about $4.8 — $5 million (gross) today and would recover 2.5 Bcfe of reserves (gross). With an 80% net revenue interest, the cost to find and develop range would be $2.40 — $2.50 per Mcf. |
| |
| | • | | Two additional frac stages increased well costs by about $800,000 and improved EUR’s by .5 — .75 Bcf. The incremental reserves are being added at $1.33 — $2 per Mcf. |
| |
| | • | | Today, we believe we can add approximately 3.2 Bcfe of reserves (mid-point of estimates) for $5.5 — $6 million (gross), yielding finding and development costs of $2.15 — $2.34 per Mcf. |
2008 and Beyond:By year end, nearly all of our acreage will be held by production and our drilling in the Woodford Shale will enter the development phase. As our development program matures, we estimate that we will drill 8 -16 wells per section with an average estimated cost per well lowering to approximately $5 million (gross). These lower costs come from the elimination of $200,000 of “science” and remote location costs. This also includes economies of scale and efficiencies, including the use of pad drilling, simultaneous fracs, common water handling and an established and shared road system.
The Company believes it can add 3 — 3.4 Bcfe (gross) for $5 million (gross) in drill and completion costs (in today’s service cost environment). This equates to an ultimate finding and development cost of approximately $2 per Mcfe. Our net reserve potential from the Woodford Shale play is 3 — 6 Tcfe.
The Woodford Shale Play is in close proximity to several natural gas pipeline systems (Centerpoint, Enogex and Ozark) which allows multiple marketing options. The Company estimates that its realized gas price in the Woodford will be 75-85% of the Henry Hub Index after basis differentials, transportation and handling charges.
Texas Wash Play
We are currently operating six drilling rigs in the Wash Play of the Texas Panhandle, all in the Stiles Ranch Field, Wheeler County, Texas.
In late 2006, we began drilling development wells from pads. The wells are 10 feet apart on the surface and are directionally drilled on 40-acre spacing. The rig is skidded from well to well on a rail system. Once drilled, the wells are fractured stimulated and completed simultaneously. The economies of scale from pad drilling result in lower costs and better capital efficiency. We plan to drill 35-40 wells at Stiles Ranch with two-thirds of those wells being drilled from common well site pads.
In the Stiles Ranch area, we currently hold 10,400 gross acres across about 16 sections. Our working interest is predominantly 100% in 12 of the sections. To date, 79 deep Wash wells have been spud and 65
are on-line. At the end of 2007, we will have 180 locations remaining on 40-acre spacing. Our gross operated daily production in the Texas Wash is 65 MMcfe/d.
ONSHORE GULF COAST
During the first quarter, our Onshore Gulf Coast Division completed 16 wells with one dry well. We currently have seven operated rigs running along the Gulf Coast and are participating in five outside-operated wells.
Sarita Field, South Texas:Under our joint venture with Exxon-Mobil in South Texas, we have drilled 15 successful wells to date. All of the wells are located in the Sarita Field in Kenedy County. Under this joint venture, we expect to operate 2-3 rigs throughout 2007.
Our recent Sarita B-83 well established new, deeper pay zones in the field and tested at 24 MMcf/d (gross). It was drilled to the east of our B-75 discovery and represents our most distant eastern success to date. The well sets up additional development locations.
Also in mid-April, the Sarita B-87 reached a total depth of 16,500’ and encountered more than 700’ of net gas pay — a record. This well sets up at least three offset drilling locations.
Val Verde Basin:On the Mayfield Ranch acreage covering more than 16,000 acres, we drilled four successful wells out of five attempts.
In the Poulter Field, located in Terrell County, Texas, the Poulter 3404 recently logged approximately 80’ of net pay in the Strawn Limestone and is today testing at 5.4 MMcfe/d (gross). This well extends the boundaries of the field. Current Poulter Field production is 33 MMcf/d. Newfield operates the field with a 60% working interest.
ROCKY MOUNTAINS
We continue to be encouraged by the production from our 20-acre infill development wells at Monument Butte. Year-to-date, we’ve drilled 14 successful wells and now have 21 wells on-line associated with this program. Initial production rates have exceeded our expectations at approximately 170 BOPD (gross).
During the first quarter, the Rocky Mountain Division completed 41 wells. Under a four-rig program, we plan to drill approximately 200 wells in the Monument Butte Field in 2007.
In 2007, Newfield signed several joint ventures and alliances that nearly doubled the Company’s acreage position in the Uinta Basin. These include:
Ute Indian Tribal Nation — a 47,000 acre joint venture. Their acreage is located north of Monument Butte. Drilling is currently underway with plans to drill 12-18 shallow Green River wells in 2007.
Horseshoe Bend, northeast of Monument Butte, includes approximately 32,000 gross acres. Current plans include drilling of four Green River wells.
Ouray/Gusher, northeast of Monument Butte, includes approximately 8,000 gross acres. We are currently drilling a deep Mesa Verde test well in the area.
GULF OF MEXICO
Gulf of Mexico production is now approximately 290 MMcfe/d, or nearly the same level of production prior to Hurricanes Katrina and Rita (August/September 2005). Total Gulf of Mexico volumes for 2007 are expected to total 95 — 100 Bcfe net.
In the first quarter of 2007, the Gulf of Mexico region completed nine total wells with two dry holes. In 2007, we plan to drill 12-15 traditional shelf wells and two to three deepwater wells.
DEEPWATER
In addition to Wrigley, we have two deepwater developments underway — PowerPlay and Fastball.
PowerPlay development (GB 258) —PowerPlay is a discovery being developed with operator Anadarko. Plans include a sub-sea tie back to Baldpate with first production expected in late 2008.
Fastball(described on page 1) is will be sub-sea tied to an existing field with first production in late 2008/early 2009. Newfield has a 67% interest.
Wrigley —Production is preparing to commence in the Newfield-operated Wrigley Field. The field is expected to produce approximately 50 MMcfe/d (gross). We operate Wrigley with a 50% working interest.
Nemo (MC 29) —We recently spud an exploration test on our Nemo Prospect which has a shallow amplitude-supported target, as well as a deep Miocene exploration target. We have a 25% operated interest.
TRADITIONAL SHELF DEVELOPMENT PROJECT UPDATES
We have developments either on-line or underway in the shallow water Gulf that should add more than 80 MMcfe/d of production in 2007.
| | | | | |
| Project | | Est. First Production | | Net, MMcfe/d |
| WC 291 | | On-Line | | 3.3 |
| VR 215 | | On-Line | | 7.5 |
| GI 3 | | On-Line | | 7.2 |
| WD 133 | | On-Line | | 15.0 |
| WD 152 | | On-Line | | 1.4 |
| WC 590 | | On-Line | | 4.0 |
| WC 193 | | On-Line | | 2.5 |
| WC 176 | | On-Line | | 6.0 |
| HI 353 | | On-Line | | 2.3 |
| SS 269 | | On-Line | | 3.6 |
| ST 299 | | July | | 6.2 |
| MP138 | | May | | 6.9 |
| WC 593 | | June | | 4.7 |
| South Pelto 9 | | July | | 6.5 |
| EI 318 | | December | | 6.0 |
| | | |
TOTAL | | | | 83.1 |
INTERNATIONAL
North Sea
Our Grove Field is preparing to commence production. We are the operator of Grove with an 85% interest. Our plans are to conduct flow assurance work and gather reservoir data over a period of several weeks. Following this work, we expect to curtail field production to approximately 10 MMcfe/d due to low natural gas prices. The Grove Field is capable of producing 60 MMcfe/d (gross) and production will increase when gas prices improve.
We drilled two dry holes in the North Sea in early 2007 — Auburn and West Cutter. The Seven Seas prospect is currently drilling. Our cost interests in these wells is substantially carried by another company.
Malaysia
The platform for our Abu Field was installed in late 2006 and the floating, storage and offloading vessel has been moored. We expect to commence production late in the second quarter of 2007. Production will ramp up to approximately 15,000 BOPD (gross). At current oil prices, we will have net revenue interest in the Abu Field of approximately 35%. Also, development continues at the Puteri Field on PM 318 and the East Belumut and Chermingat Fields on PM 323. Puteri will be on production in late 2007 or early 2008 and will be produced through existing
facilities. The East Belumut and Chermingat Fields are Newfield-operated and are expected on-line in 2008. We have an inventory of drilling ideas on both our PM 318 and 323 blocks.
SECOND QUARTER 2007 ESTIMATES
Natural Gas Production and PricingThe Company’s natural gas production in the second quarter of 2007 is expected to be 53 — 58 Bcf (582 — 643 MMcf/d). Based on current prices, Newfield estimates that its realized price for natural gas production from the Gulf of Mexico and onshore Gulf Coast, after basis differentials, transportation and handling charges, will average $0.40 — $0.60 less per MMBtu than the Henry Hub Index. Realized gas prices for the Company’s Mid-Continent properties, after basis differentials, transportation and handling charges, typically average 75 — 85% of the Henry Hub Index. Hedging gains or losses will affect price realizations.
Crude Oil Production and PricingThe Company’s oil production, including international liftings, in the second quarter of 2007 is expected to be 2.1 — 2.3 million barrels (23,000 — 26,000 BOPD). Newfield expects to produce approximately 2,700 BOPD net from its Malaysian operations and approximately 2,100 BOPD net from its China operations. The timing of liftings in Malaysia and China may affect total reported production. The price the Company receives for Gulf Coast production typically averages about $2 per barrel below the NYMEX West Texas Intermediate (WTI) price. The price the Company receives for its production in the Rocky Mountains averages about $13 — $15 per barrel below WTI. Oil production from the Mid-Continent typically sells at a $1.00 — $1.50 per barrel discount to WTI. Oil production from Malaysia typically sells at Tapis, or about even with WTI. Oil Production from China typically sells at $10 — $12 per barrel less than WTI. Hedging gains or losses will affect price realizations.
Lease Operating Expense and Production TaxesLOE is expected to be $97 — $107 million ($1.40 — $1.55 per Mcfe) in the second quarter of 2007. This includes major expense of $15 million related to hurricane related repairs in the Gulf of Mexico. It is anticipated that hurricane repairs will be substantially completed by the end of the second quarter. Production taxes in the second quarter of 2007 are expected to be $23 — $25 million ($0.33 — $0.37 per Mcfe). These expenses vary and are subject to impact from, among other things, production volumes and commodity pricing, tax rates, service costs, the costs of goods and materials and workover activities.
General and Administrative ExpenseG&A expense for the second quarter of 2007 is expected to be $33 — $37 million ($0.48 — $0.53 per Mcfe), net of capitalized direct internal costs. Capitalized direct internal costs are expected to be $13 — $15 million. G&A expense includes incentive compensation expense. Incentive compensation expense depends largely on adjusted net income (as defined in the Company’s incentive compensation plan), which excludes unrealized gains and losses on commodity derivatives.
Interest ExpenseThe non-capitalized portion of the Company’s interest expense for the second quarter of 2007 is expected to be $21 — $23 million ($0.30 — $0.34 per Mcfe). As of April 25, 2007, Newfield had $245 million outstanding under its credit arrangements. The remainder of debt consists of four separate issuances of notes that in the aggregate total $1,175 million in principal amount. Capitalized interest for the second quarter of 2007 is expected to be about $10 — $11 million.
Income TaxesIncluding both current and deferred taxes, the Company expects its consolidated income tax rate in the second quarter of 2007 to be about 35 — 38%. About 85 — 95% of the tax provision is expected to be deferred.
Please see the tables below for our complete hedging positions.
NATURAL GAS HEDGE POSITIONS
The following hedge positions for the second quarter of 2007 and beyond are as of April 25, 2007:
Second Quarter 2007
| | | | | | | | | | | | | |
| | | Weighted Average | | Range |
| Volume | | Fixed | | Floors | | Collars | | Floor | | Ceiling |
| 25,800 MMMBtus | | $ | 8.81 | | | — | | — | | — | | — |
| 19,100 MMMBtus | | | — | | | — | | $6.90 — $8.81 | | $6.50 — $8.00 | | $8.23 — $10.15 |
Third Quarter 2007
| | | | | | | | | | | | | |
| | | Weighted Average | | Range |
| Volume | | Fixed | | Floors | | Collars | | Floor | | Ceiling |
| 25,500 MMMBtus | | $ | 8.87 | | | — | | — | | — | | — |
| 15,350 MMMBtus | | | — | | | — | | $6.86 — $8.80 | | $6.50 — $8.00 | | $8.23 — $10.15 |
Fourth Quarter 2007
| | | | | | | | | | | | | |
| | | Weighted Average | | Range |
| Volume | | Fixed | | Floors | | Collars | | Floor | | Ceiling |
| 12,030 MMMBtus | | $ | 9.02 | | | — | | — | | — | | — |
| 19,695 MMMBtus | | | — | | | — | | $7.73 — $10.51 | | $6.50 — $8.00 | | $8.23 — $12.40 |
First Quarter 2008
| | | | | | | | | | | | | | | |
| | | Weighted Average | | Range |
| Volume | | Fixed | | Floors | | Collars | | Floor | | Ceiling |
| 5,460 MMMBtus | | $ | 9.30 | | | — | | — | | | — | | | — |
| 22,595 MMMBtus | | | — | | | — | | $8.00 — $11.04 | | $ | 8.00 | | | $10.00 — $12.40 |
Second Quarter 2008
| | | | | | | | | | | | | |
| | | Weighted Average | | Range |
| Volume | | Fixed | | Floors | | Collars | | Floor | | Ceiling |
| 4,095 MMMBtus | | $ | 7.85 | | | — | | — | | — | | — |
| 3,185 MMMBtus | | | — | | | — | | $7.36 — $9.31 | | $7.00 — $7.75 | | $9.00 — $9.70 |
Third Quarter 2008
| | | | | | | | | | | | | |
| | | Weighted Average | | Range |
| Volume | | Fixed | | Floors | | Collars | | Floor | | Ceiling |
| 4,140 MMMBtus | | $ | 7.85 | | | — | | — | | — | | — |
| 3,220 MMMBtus | | | — | | | — | | $7.36 — $9.31 | | $7.00 — $7.75 | | $9.00 — $9.70 |
Fourth Quarter 2008
| | | | | | | | | | | | | |
| | | Weighted Average | | Range |
| Volume | | Fixed | | Floors | | Collars | | Floor | | Ceiling |
| 1,395 MMMBtus | | $ | 7.85 | | | — | | — | | — | | — |
| 1,085 MMMBtus | | | — | | | — | | $7.36 — $9.31 | | $7.00 — $7.75 | | $9.00 — $9.70 |
The following table details the expected impact to pre-tax income from the settlement of our derivative contracts, outlined above, at various NYMEX gas prices, net of premiums paid for these contracts (in millions).
| | | | | | | | | | | | | | | | | | | | | |
| | | Gas Prices |
| | | $5.00 | | $6.00 | | $7.00 | | $8.00 | | $9.00 |
2007 | | | | | | | | | | | | | | | | | | | | |
| 1st Quarter | | $ | 172 | | | $ | 132 | | | $ | 92 | | | $ | 53 | | | $ | 12 | |
| 2nd Quarter | | $ | 135 | | | $ | 90 | | | $ | 50 | | | $ | 21 | | | $ | (11 | ) |
| 3rd Quarter | | $ | 127 | | | $ | 86 | | | $ | 50 | | | $ | 22 | | | $ | (9 | ) |
| 4th Quarter | | $ | 102 | | | $ | 70 | | | $ | 40 | | | $ | 12 | | | $ | (1 | ) |
| | | | | | | | | | | | | | | | | | | | | |
Total 2007 | | $ | 536 | | | $ | 378 | | | $ | 232 | | | $ | 108 | | | $ | (9 | ) |
| | | | | | | | | | | | | | | | | | | | | |
2008 | | | | | | | | | | | | | | | | | | | | |
| 1st Quarter | | $ | 91 | | | $ | 63 | | | $ | 35 | | | $ | 7 | | | $ | 2 | |
| 2nd Quarter | | $ | 19 | | | $ | 12 | | | $ | 5 | | | $ | — | | | $ | (5 | ) |
| 3rd Quarter | | $ | 19 | | | $ | 12 | | | $ | 5 | | | $ | (1 | ) | | $ | (5 | ) |
| 4th Quarter | | $ | 7 | | | $ | 4 | | | $ | 1 | | | $ | — | | | $ | (1 | ) |
| | | | | | | | | | | | | | | | | | | | | |
Total 2008 | | $ | 136 | | | $ | 91 | | | $ | 46 | | | $ | 6 | | | $ | (9 | ) |
Approximately 25% of our natural gas production correlates to ANR/LA, 30% to Houston Ship Channel, 27% to Panhandle Eastern Pipeline and 10% to Columbia Gulf Transmission.
CRUDE OIL HEDGE POSITIONS
The following hedge positions for the second quarter of 2007 and beyond are as of April 25, 2007:
Second Quarter 2007
| | | | | | | | | | | | | |
| | | Weighted Average | | Range |
| Volume | | Fixed | | Floors | | Collars | | Floor | | Ceiling |
| 241,000 Bbls | | $ | 45.29 | | | — | | — | | — | | — |
| 151,000 Bbls | | | — | | | — | | $55.48 — $80.40 | | $50.00 — $60.00 | | $77.10 — $83.25 |
| 879,000 Bbls** | | | — | | | — | | $37.12 — $55.33 | | $32.00 — $60.00 | | $44.70 — $82.00 |
Third Quarter 2007
| | | | | | | | | | | | | |
| | | Weighted Average | | Range |
| Volume | | Fixed | | Floors | | Collars | | Floor | | Ceiling |
| 122,000 Bbls | | $ | 63.40 | | | — | | — | | — | | — |
| 152,000 Bbls | | | — | | | — | | $55.46 — $80.40 | | $50.00 — $60.00 | | $77.10 — $83.25 |
| 888,000 Bbls** | | | — | | | — | | $37.10 — $55.31 | | $32.00 — $60.00 | | $44.70 — $82.00 |
Fourth Quarter 2007
| | | | | | | | | | | | | |
| | | Weighted Average | | Range |
| Volume | | Fixed | | Floors | | Collars | | Floor | | Ceiling |
| 122,000 Bbls | | $ | 63.40 | | | — | | — | | — | | — |
| 152,000 Bbls | | | — | | | — | | $55.46 — $80.40 | | $50.00 — $60.00 | | $77.10 — $83.25 |
| 888,000 Bbls** | | | — | | | — | | $37.10 — $55.31 | | $32.00 — $60.00 | | $44.70 — $82.00 |
First Quarter 2008
| | | | | | | | | | | |
| | | Weighted Average | | Range |
| Volume | | Fixed | | Floors | | Collars | | Floor | | Ceiling |
| 819,000 Bbls** | | — | | — | | $33.00 — $50.29 | | $32.00 — $35.00 | | $49.50 — $52.90 |
Second Quarter 2008
| | | | | | | | | | | |
| | | Weighted Average | | Range |
| Volume | | Fixed | | Floors | | Collars | | Floor | | Ceiling |
| 819,000 Bbls** | | — | | — | | $33.00 — $50.29 | | $32.00 — $35.00 | | $49.50 — $52.90 |
Third Quarter 2008
| | | | | | | | | | | |
| | | Weighted Average | | Range |
| Volume | | Fixed | | Floors | | Collars | | Floor | | Ceiling |
| 828,000 Bbls** | | — | | — | | $33.00 — $50.29 | | $32.00 — $35.00 | | $49.50 — $52.90 |
Fourth Quarter 2008
| | | | | | | | | | | |
| | | Weighted Average | | Range |
| Volume | | Fixed | | Floors | | Collars | | Floor | | Ceiling |
| 828,000 Bbls** | | — | | — | | $33.00 — $50.29 | | $32.00 — $35.00 | | $49.50 — $52.90 |
First Quarter 2009
| | | | | | | | | | | |
| | | Weighted Average | | Range |
| Volume | | Fixed | | Floors | | Collars | | Floor | | Ceiling |
| 810,000 Bbls** | | — | | — | | $33.33 — $50.62 | | $32.00 — $36.00 | | $50.00 — $54.55 |
Second Quarter 2009
| | | | | | | | | | | |
| | | Weighted Average | | Range |
| Volume | | Fixed | | Floors | | Collars | | Floor | | Ceiling |
| 819,000 Bbls** | | — | | — | | $33.33 — $50.62 | | $32.00 — $36.00 | | $50.00 — $54.55 |
Third Quarter 2009
| | | | | | | | | | | |
| | | Weighted Average | | Range |
| Volume | | Fixed | | Floors | | Collars | | Floor | | Ceiling |
| 828,000 Bbls** | | — | | — | | $33.33 — $50.62 | | $32.00 — $36.00 | | $50.00 — $54.55 |
Fourth Quarter 2009
| | | | | | | | | | | |
| | | Weighted Average | | Range |
| Volume | | Fixed | | Floors | | Collars | | Floor | | Ceiling |
| 828,000 Bbls** | | — | | — | | $33.33 — $50.62 | | $32.00 — $36.00 | | $50.00 — $54.55 |
First Quarter 2010
| | | | | | | | | | | |
| | | Weighted Average | | Range |
| Volume | | Fixed | | Floors | | Collars | | Floor | | Ceiling |
| 900,000 Bbls** | | — | | — | | $34.90 — $51.52 | | $32.00 — $38.00 | | $50.00 — $53.50 |
Second Quarter 2010
| | | | | | | | | | | |
| | | Weighted Average | | Range |
| Volume | | Fixed | | Floors | | Collars | | Floor | | Ceiling |
| 909,000 Bbls** | | — | | — | | $34.90 — $51.52 | | $32.00 — $38.00 | | $50.00 — $53.50 |
Third Quarter 2010
| | | | | | | | | | | |
| | | Weighted Average | | Range |
| Volume | | Fixed | | Floors | | Collars | | Floor | | Ceiling |
| 918,000 Bbls** | | — | | — | | $34.91 — $51.52 | | $32.00 — $38.00 | | $50.00 — $53.50 |
Fourth Quarter 2010
| | | | | | | | | | | |
| | | Weighted Average | | Range |
| Volume | | Fixed | | Floors | | Collars | | Floor | | Ceiling |
| 918,000 Bbls** | | — | | — | | $34.91 — $51.52 | | $32.00 — $38.00 | | $50.00 — $53.50 |
**These 3—way collar contracts are standard crude oil collar contracts with respect to the periods, volumes and prices stated above. The contracts have floor and ceiling prices per barrel as per the table above until the price drops below a weighted average price of $29.23 per barrel. Below $29.23 per barrel, these contracts effectively result in realized prices that are on average $6.64 per barrel higher than the cash price that otherwise would have been realized.
The following table details the expected impact to pre-tax income from the settlement of our derivative contracts, outlined above, at various NYMEX oil prices, net of premiums paid for these contracts (in millions).
| | | | | | | | | | | | | | | | | | | | | | | | | |
| | | Oil Prices |
| | | $50.00 | | $52.00 | | $54.00 | | $56.00 | | $58.00 | | $60.00 |
2007 | | | | | | | | | | | | | | | | | | | | | | | | |
| 1st Quarter | | $ | — | | | $ | (2 | ) | | $ | (4 | ) | | $ | (7 | ) | | $ | (9 | ) | | $ | (11 | ) |
| 2nd Quarter | | $ | — | | | $ | (2 | ) | | $ | (4 | ) | | $ | (7 | ) | | $ | (9 | ) | | $ | (11 | ) |
| 3rd Quarter | | $ | 3 | | | $ | 1 | | | $ | (1 | ) | | $ | (3 | ) | | $ | (5 | ) | | $ | (7 | ) |
| 4th Quarter | | $ | 3 | | | $ | 1 | | | $ | (1 | ) | | $ | (3 | ) | | $ | (5 | ) | | $ | (7 | ) |
Total 2007 | | $ | 6 | | | $ | (2 | ) | | $ | (10 | ) | | $ | (20 | ) | | $ | (28 | ) | | $ | (36 | ) |
| | | | | | | | | | | | | | | | | | | | | | | | | |
2008 | | $ | (2 | ) | | $ | (7 | ) | | $ | (13 | ) | | $ | (20 | ) | | $ | (26 | ) | | $ | (33 | ) |
2009 | | $ | (1 | ) | | $ | (6 | ) | | $ | (12 | ) | | $ | (19 | ) | | $ | (25 | ) | | $ | (32 | ) |
2010 | | $ | — | | | $ | (4 | ) | | $ | (9 | ) | | $ | (17 | ) | | $ | (24 | ) | | $ | (31 | ) |
We provide information regarding our outstanding hedging positions in our annual and quarterly reports filed with the SEC and in our electronic publication — @NFX. This publication can be found on Newfield’s web page at http://www.newfield.com. Through the web page, you may elect to receive @NFX through e-mail distribution.
Newfield Exploration Company is an independent crude oil and natural gas exploration and production company. The Company relies on a proven growth strategy of growing reserves through the drilling of a balanced risk/reward portfolio and select acquisitions. Newfield’s domestic areas of operation include the U.S. onshore Gulf Coast, the Anadarko and Arkoma Basins of the Mid-Continent, the Uinta Basin of the Rocky Mountains and the Gulf of Mexico. The Company has international operations in Malaysia, the U.K. North Sea and China.
The statements set forth in this publication regarding estimated or anticipated
| | • | | timing of first production from our Fastball and Wrigley discoveries; |
| |
| | • | | aggregate 2007 production volumes; |
| |
| | • | | expected initial and 2007 production from wells; |
| |
| | • | | 2007 drilling plans; |
| |
| | • | | expected costs to drill and ultimate recoveries from our Woodford Shale wells; |
| |
| | • | | finding costs for Woodford Shale reserves; and |
| |
| | • | | net reserve potential of the horizontal Woodford Shale play |
are forward looking and are based upon assumptions and anticipated results that are subject to numerous uncertainties. Actual results may vary significantly from those anticipated due to many factors including drilling results, oil and gas prices, industry conditions, the prices of goods and services, the availability of drilling rigs and other support services, the availability of capital resources, the availability of refining capacity for the crude oil we produce from our Monument Butte Field in Utah and labor conditions. In addition, the drilling of oil and gas wells and the production of hydrocarbons are subject to governmental regulations and operating risks.