Exhibit 99.2
@NFX is periodically published to keep shareholders aware of current operating activities at Newfield. It may include estimates of expected production volumes, costs and expenses, recent changes to hedging positions and commodity pricing.
February 11, 2008
This edition of @NFX includes:
| | • | | Focus Area Updates |
| |
| | • | | Updated Tables Detailing Complete Hedging Positions |
2008 Capital Budget
We announced a $1.6 billion capital investment program for 2008. Nearly 85% of the 2008 budget is allocated to development activities. The 2008 capital program will be substantially funded through cash flow and cash on hand. Following the sale of $1.8 billion in assets during 2007, we exited the year with approximately $370 million in cash. Approximately 75% of our 2008 natural gas production is hedged at a NYMEX floor price of approximately $8 per MMBtu. Our debt-to-book capitalization ratio at year-end 2007 was approximately 23%, and our $1.25 billion credit facility is undrawn.
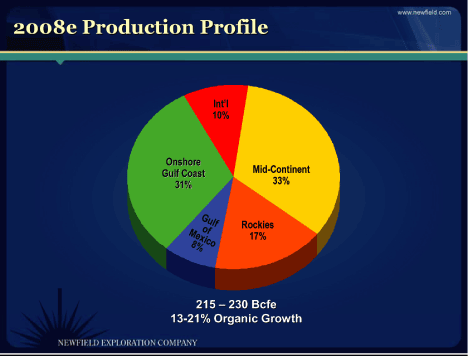
The 2008 budget is expected to deliver organic production growth of 13-21%. We expect to produce 215 — 230 Bcfe in 2008, compared to approximately 190 Bcfe in 2007, adjusted for our 2007 asset sales and acquisitions.
Fourth Quarter 2007 Drilling Activity
| | | | | | | | | | | | | | | | | |
| | | NFX Operated | | Non-Operated | | Gross Wells | | Dry Holes |
| Mid-Continent | | | 33 | | | | 13 | | | | 46 | | | | 0 | |
| Rocky Mount. | | | 66 | | | | 9 | | | | 76 | | | | 1 | |
| Onshore GC | | | 13 | | | | 2 | | | | 16 | | | | 1 | |
| Gulf of Mexico | | | 3 | | | | 0 | | | | 4 | | | | 1 | |
| International | | | 0 | | | | 0 | | | | 0 | | | | 0 | |
| | | | | | | | | | | | | | | | | |
| Total: | | | 115 | | | | 24 | | | | 142 | | | | 3 | |
Full Year 2007 Drilling Activity
| | | | | | | | | | | | | | | | | |
| | | NFX Operated | | Non-Operated | | Gross Wells | | Dry Holes |
| Mid-Continent | | | 147 | | | | 51 | | | | 198 | | | | 0 | |
| Rocky Mount. | | | 212 | | | | 14 | | | | 231 | | | | 5 | |
| Onshore GC | | | 52 | | | | 14 | | | | 80 | | | | 14 | |
| Gulf of Mexico | | | 16 | | | | 0 | | | | 20 | | | | 4 | |
| International | | | 9 | | | | 10 | | | | 24 | | | | 5 | |
| | | | | | | | | | | | | | | | | |
| Total: | | | 436 | | | | 89 | | | | 553 | | | | 28 | |
MID-CONTINENT
The Mid-Continent region is now our largest division with approximately 1.1 Tcfe of proved reserves at year-end 2007, or about 45% of total reserves. Planned investments in the region are approximately 40% of our 2008 budget, or $620 million. The largest portion of spending, approximately $460 million, will be allocated to the development of the Woodford Shale, where we have approximately 165,000 net acres.
Recent Woodford Horizontal Well Performance
We are in the early phases of development in the Woodford and expect significant improvements in our drilling and completion costs in 2008. We are encouraged with the results of our extended lateral wells and our most recent well cost reductions.
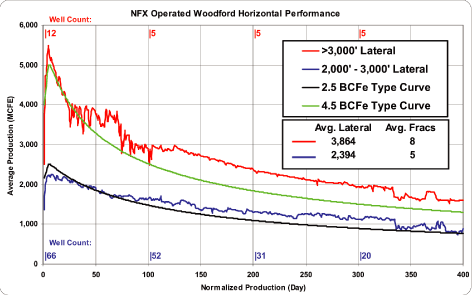
The following chart details the results from our 12 most recent extended lateral completions, as well as results from 66 wells with lateral lengths averaging 2,394’. The improved EUR is evident when compared to a 4.5 Bcfe type curve:
To date, we have drilled 14 wells with lateral lengths greater than 3,000’. The 10 most recent extended lateral completions were drilled and completed for an average of $7 million gross and are expected to have an average EUR of at least 4.5 Bcfe gross. The net revenue interest averages about 81%.
Woodford 2008 Drilling Program
In 2008, we expect to drill about 100 operated horizontal wells and participate in another 60-70 outside operated wells. About 50% of the operated wells will be drilled with lateral lengths greater than 3,000’, more than 50% will be drilled from multi-well pads and 90% of the wells will be drilled with the benefit of 3-D seismic data.
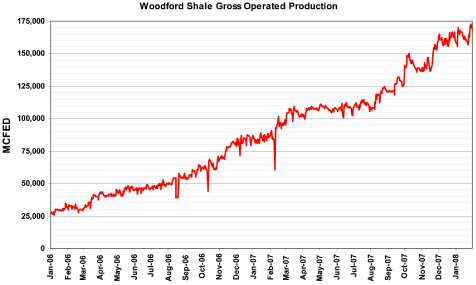
Based on planned activities, our gross operated Woodford Shale production is expected to exit 2008 at approximately 250 MMcfe/d, an increase of 50% over the 2007 exit rate of 165 MMcfe/d.
Woodford Development Spacing Pilots
We are in the process of conducting several infill spacing pilots across our acreage position. The pilots are being conducted on 40-acre and 80-acre spacing. The goal is determine the most effective spacing of future development wells to maximize EUR and capital efficiency.
Our first pilot was called the “Cattle.” The Cattle pilot has four wells with lateral lengths of 2,500’. The wells were drilled 660’ apart – on 40-acre spacing. The Cattle pilot achieved all of its primary objectives:
| | 1. | | Use of fracture stimulation mapping to indicate effective pattern stimulation |
| |
| | 2. | | Measure communication of stimulation treatments |
| |
| | 3. | | Determine production profile of wells drilled on 40-acres vs. wells drilled to date |
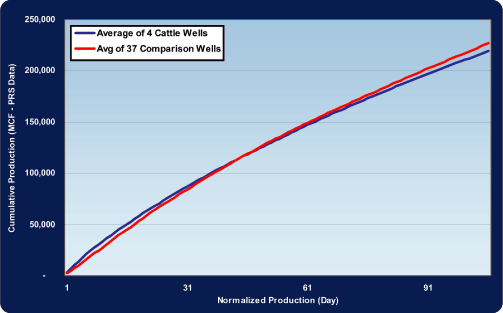
The plot below shows the average production from the four Cattle pilot wells compared to the 37 operated horizontal wells drilled in several townships around the Cattle Pilot.
We now have about four months of production data from the Cattle Pilot and the wells are performing in-line with the 37 operated wells around it. We are still collecting pressure data from the wells and monitoring production, but are encouraged by the data.
Our second Woodford pilot, called the “Whitlow,” also includes four wells drilled on 40-acre spacing. In this pilot, the four wells were drilled from two common pads. The Whitlow demonstrates the capital efficiency improvements in our operations. The Whitlow wells have 2,500’ laterals with 5-stage fracs. The wells were
drilled and completed for an average cost of less than $5 million. We now have three months of production history and the results are in-line with expectations.
Our third pilot, the Morris, was the most recent to commence production. The Morris includes three development wells drilled from a common pad. These wells were also drilled and completed for $5 million each.
In summary, our seven most recent pilot wells were drilled and completed for less than $5 million (gross).
3-D Seismic
The 3-D data is instrumental in selecting well locations and planning extended laterals. We already have processed 3-D seismic data on more than 60% of our net acreage. By the end of 2008, approximately 95% of our acreage will have 3-D seismic coverage.
Marketing Our Growing Woodford Gas Production
In January, we signed two separate agreements for firm transportation of approximately 250 MMcf/d for the Woodford Shale. The first agreement is with Midcontinent Express Pipeline LLC (MEP) for approximately 200 MMcf/d of firm capacity on the MEP transmission system. MEP, connecting Bennington, Oklahoma, and Perryville, Louisiana, will have initial capacity of 1.4 Bcf/d. Pricing for our expected gas sales will be tied to Gulf Coast indices. Gas will be delivered to Bennington through a new 50-mile pipeline planned by MarkWest Energy Partners L.P. This line will connect MarkWest’s gathering system in the Woodford Shale to Bennington. Midcontinent Express Pipeline is a 50/50 joint venture between Kinder Morgan Energy Partners, L.P. (KMP) and Energy Transfer Partners, L.P. KMP is managing the construction and will operate the pipeline.
The second agreement, a five year deal with Laclede Energy Resources, Inc., provides for the firm sale and purchase of approximately 40 MMcf/d in 2008 and approximately 50 MMcf/d in each year of 2009 through 2012. The gas will be delivered into firm transportation on Centerpoint Energy Gas Transmission Company and is priced using a fixed differential to NYMEX.
Increasing Activity Levels in the Woodford Shale
The Woodford Shale Play is the most active play in the State of Oklahoma today. There are 42 drilling rigs running in the Woodford Shale play today. Industry has now spud 460 horizontal wells (NFX has an interest in approximately 60% of total wells). We now have spud 160 operated horizontal wells in the play. The growth in Newfield’s production can be seen in the chart below:
Texas Wash Play
We will remain active in the Mountain Front Wash play in 2008 with a 2-4 rig program. This is our second most active play in the Mid-Continent region. One of our largest fields is Stiles Ranch, where production recently hit a new high of 97 MMcf/d. Our working interest is predominately 100%. We have approximately 50,000 net acres in the area.
ROCKY MOUNTAINS
Investment in the Rocky Mountain region is expected to total $310 million in 2008, or approximately 20% of our total budget. The most significant investment area will be the Monument Butte Field, located in northeast Utah’s Uinta Basin.
Understanding Monument Butte
We have drilled 678 wells in the Monument Butte field since its acquisition in 2004 and today there are more than 1,100 producing wells. Gross production has increased 75% from approximately 8,000 BOPD in 2004 to nearly 14,000 BOPD today. We have up to 3,000 remaining wells to drill in the field and up to a decade of production growth. We expect to drill about 200 wells at Monument Butte in 2008. There are 2 billion barrels of oil in place at Monument Butte and production to date is 38 MMBbls, or 1.9% of the oil in place.For graphics and additional information, please see our recent presentation, posted on our website at www.newfield.com.
There are three main classifications of value in the Monument Butte field:
1.Ongoing 40-acre spacing development of the field. We have 500-1,000 remaining locations on 40-acre spacing. Three of our four active rigs are dedicated to 40-acre development drilling. This 40-acre development is expected to recover approximately 10% of the 2 billion barrels of oil in place.
In addition to the 40-acre development, there is the potential on our acreage adjacent and north of Monument Butte — 47,000 acres signed last year through an alliance with the Ute Indians. We have a rig dedicated to drilling on this acreage and are now drilling our 16th well with results consistent with our main field wells. We have the potential to drill hundreds of wells on this acreage.
2.Infill drilling on 20-acre spacing. We have 20-acre wells being drilled between our 40-acre producers. These wells are just 930’ away from producing 40-acre wells. We have drilled more than 50 wells on 20-acre spacing. These wells are showing initial production rates DOUBLE the original 40-acre wells and the EUR benefits from the aggressive waterflood efforts in the field. We have 2,500 potential locations and our potential is more than 110 MMBbls. This program could increase field recoveries to 18-20% of oil in place.
3.Deep Gas Potential Beneath Monument Butte / Recent Alliance to Enable Assessment. We have now drilled seven wells in the southeastern portion of the field. These wells targeted the Mesaverde and Blackhawk formations. We are encouraged with the recent progress made in lowering completed well costs. Our interest in the deep sections averages 83% across the field.
In late 2007, we participated in drilling two wells beneath the traditional targets (Blackhawk and Mesaverde) to test the upper portion of the Mancos Shale. The Mancos is an active shale development in other parts of the Uinta and recent successes are pushing closer to our acreage. Plans are underway to test both of the wells in the first quarter. We have a 58% interest in these wells.
We recently signed an agreement with a third party to test deep gas targets below the shallow oil producing zones in its Monument Butte Field. Targets include the Wasatch, Mesa Verde, Blackhawk and Mancos Shale. Drilling is planned for the first half of 2008. The agreement allows for promoted exploratory drilling and progressive earning in approximately 71,000 net acres in which we retain a majority of the interest. Approximately 10,000 net acres in the immediate vicinity of recent deep gas tests were excluded from the agreement. Plans are being made to drill five operated and five non-operated wells in the deep Mancos gas play on this acreage in 2008.
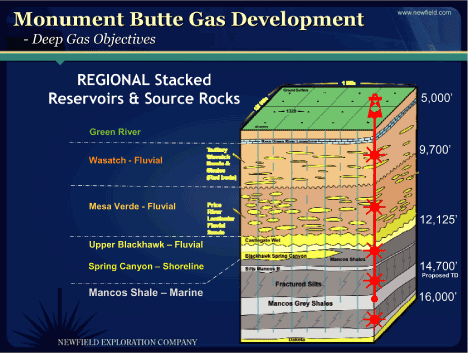
The following cartoon depicts our geologic targets in the deep gas play, as well as the shallow Green River oil sands we are developing at Monument Butte:
Increased Demand for Black Wax
Our production at Monument Butte continues to grow and we have seen increased demand for our Black Wax crude. Today, 100% of our production forecast for Monument Butte is being sold under term agreements.
| | • | | Area refiners are taking more than their required volumes, with 2007 averaging 107% of contracted amounts. |
| |
| | • | | Area refining capacity increased 6,000 BOPD over the last 12 months and refiner upgrades will add an additional 6,000 BOPD in 2008-09. |
Williston Basin
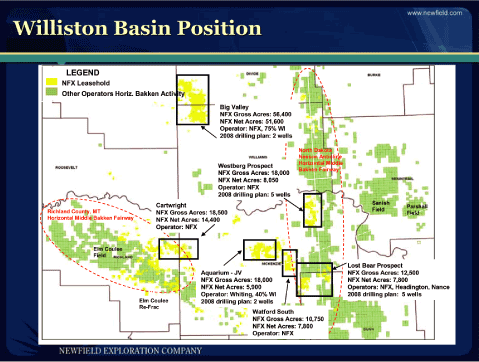
In the Williston Basin, we now have an interest in approximately 170,000 net acres. We had a leasing effort underway in the Williston, and our acreage position was enhanced by the acquisition of Stone Energy’s Rocky Mountain assets in 2007.The map below outlines our growing acreage positions and key areas of activity.
We expect to drill at least 10 wells in the region in 2008. These wells will target a combination of Madison, Bakken, Duperow and Red River formations. Planned investments on drilling and new seismic data total about $50 million in 2008.
Green River Basin
In Wyoming’s Green River Basin, we are active in the Pinedale and Jonah Fields. Through an agreement reached in 2007 with BP, we retained operatorship and increased our working interest to 85%. We are planning to drill 10 wells at Pinedale in 2008. We are encouraged by recent efforts to reduce drilling and completion costs.
Five wells are planned in the Jonah Field, where we have at least 30 remaining locations planned.
GULF COAST
We will invest approximately $245 million, or 15% of the total budget, on projects located in Texas. We currently have seven operated rigs running along the Gulf Coast. We also have formed new joint ventures increasing the size and scope of our operations onshore Texas.
Under an existing South Texas joint venture with Exxon-Mobil, we expect to drill 10-12 additional wells in 2008 in the Sarita Field area of Kenedy County. Newfield has drilled 21 successful wells under the agreement to date and current gross production is more than 75 MMcfe/d with two rigs running. We are currently drilling a significant exploration well that could expose us to 30-50 Bcfe (gross).
Another South Texas joint venture with a private company provides us with access to 58,000 acres just south and east of our Exxon-Mobil JV at Sarita. We have identified prolific targets up to 20,000’. Reserve potential for the identified prospects to date is 60-100 Bcfe (gross). A successful exploration well would set up additional development drilling. Under this venture, we are mapping new 3-D seismic data to determine well locations and expect to spud our first test in mid-2008. We will have a 50% working interest in the venture.
In the Val Verde Basin of West Texas, we plan to drill 12-15 wells targeting primarily the Ellenberger, Canyon and Strawn formations. Current production from the region is approximately 80 MMcfe/d (our interest is 60-100%).
We recently signed a new East Texas joint venture with a private company. We are planning to drill at least three wells under this agreement, which covers 11,000 acres in Shelby and St. Augustine Counties. Potential targets are James Lime and Pettit formations.
GULF OF MEXICO
Our efforts today in the Gulf of Mexico are primarily focused on deepwater. Approximately $240 million, or 15% of our 2008 budget, is allocated to the Gulf of Mexico. This includes four to five deepwater wells, new seismic and a significant allocation for 2008 federal lease sales. Newfield placed high bids on 18 blocks (14 deepwater and 4 shelf), and has been awarded 15 to date, in a 2007 lease sale.
Our production from the Gulf in 2008 will be about 16 Bcfe, representing a 20% increase over 2007 (after asset sales in 2007). The increase relates primarily to our Wrigley Field development. Wrigley is producing approximately 42 MMcfe/d through a host facility operated by a major oil company. Following the remedy of mechanical issues on the host facility, production is expected to ramp up to 50 MMcfe/d (gross). We operate Wrigley with a 50% working interest.
Ongoing deepwater developments at PowerPlay (GB 258) and Fastball (VK 1003) will add significant production in 2008 and 2009.
PowerPlay is a single well tieback to the existing Baldpate deepwater platform and first production is expected in the fourth quarter of 2008. The well is expected to produce about 5,000 BOPD (gross). We have a 35% interest in PowerPlay.
Fastball is a sub-sea tieback to one of several existing fields in the area with first production expected in 2009. We operate Fastball with a 66% working interest.
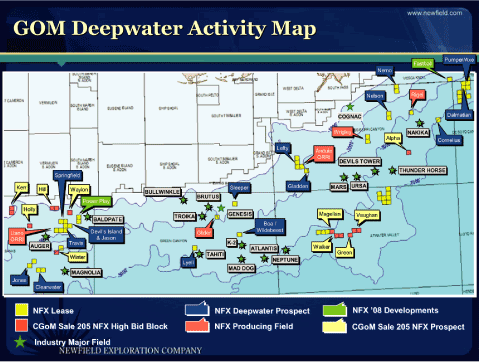
Over the last several years, we have assembled an attractive portfolio of deepwater prospects. The opportunity set is balanced between amplitude supported prospects in conventional water depths to deeper sub-salt prospects. Based on this inventory, we would expect to drill 3-4 wells per year for the next several years and plan to drill 4-5 in 2008. A detailed prospect inventory map is shown below:
INTERNATIONAL
Approximately 10% of our budget, or $155 million, is allocated to international activities.
Malaysia
Our oil production in Malaysia is expected to increase from 9 Bcfe in 2007 to approximately 23 Bcfe in 2008. The increase is being driven by increased volumes from the Abu Field and new developments on PM 318 and PM 323. The production deck for Puteri has been set and a new pipeline will be operational late in the first quarter of 2008. First oil sales are expected in April. Puteri production is estimated at 6,000-8,000 BOPD gross. The East Belumut and Chermingat fields are expected to produce 15,000 BOPD gross. We also will drill a deepwater exploration well on Block 2C, offshore Sarawak, in the third quarter of 2008.
China
Active development drilling continues at our two producing Bohai Bay fields. Current production is 15,000 BOPD gross, with Newfield holding a 12% interest in the unit. The partners plan to drill at least five additional development wells in 2008.
We have a three-well exploration program planned in 2008 on our acreage in the South China Sea. We have three PSCs that cover more than 3.5 million acres. Results from the three-well campaign are expected in the second quarter of 2008.
FIRST QUARTER 2008 ESTIMATES
Natural Gas Production and PricingThe Company’s natural gas production in the first quarter of 2008 is expected to be 36 — 40 Bcf (400 — 435 MMcf/d). Realized gas prices for the Company’s Mid-Continent properties, after basis differentials, transportation and handling charges, typically average 75 — 85% of the Henry Hub Index. Based on current prices, Newfield estimates that its realized price for natural gas production from the deepwater Gulf of Mexico and onshore Gulf Coast, after basis differentials, transportation and handling charges, will average $0.40 — $0.60 per MMBtu less than the Henry Hub Index. Although Newfield’s Rocky Mountain production is primarily oil, the Company does produce approximately 40 MMcfe/d of natural gas in this region. Newfield hedged the basis differential associated with 50% of the expected production from the proved producing fields acquired from Stone Energy in the second quarter of 2007. The basis hedges extend through 2012 at a weighted average hedged differential of ($1.18) per Mcf. Hedging gains or losses will affect price realizations.
Crude Oil Production and PricingThe Company’s oil production in the first quarter of 2008, including international liftings, is expected to be 2.1 — 2.3 million barrels (23,000 — 25,200 BOPD). Newfield expects to produce approximately 7,400 BOPD net from its Malaysian operations, and 1,400 BOPD net from China. The timing of liftings in Malaysia and China may affect total reported production. The price the Company receives for Gulf Coast production typically averages about $2 per barrel below the NYMEX West Texas Intermediate (WTI) price. The price the Company receives for its production in the Rocky Mountains averages about $13 — $15 per barrel below WTI. Oil production from the Mid-Continent typically sells at a $1.00 — $1.50 per barrel discount to WTI. Oil production from Malaysia typically sells at Tapis, or about even with WTI. Oil production from China typically sells at $10 — $12 per barrel less than WTI. Hedging gains or losses will affect price realizations.
Lease Operating Expense and Production TaxesLOE is expected to be $58 — $65 million ($1.14 — $1.27 per Mcfe) in the first quarter of 2008. Production taxes in the first quarter of 2008 are expected to be $36 — $40 million ($0.71— $0.78 per Mcfe). Production taxes on an Mcfe basis have increased now that a significant portion of the Company’s production is onshore and subject to severance taxes. In addition, higher oil production in Malaysia increases production taxes. Approximately 40% of the production taxes are associated with Malaysian operations.
General and Administrative ExpenseG&A expense for the first quarter of 2008 is expected to be $33 — $36 million ($0.65 — $0.71 per Mcfe), net of capitalized direct internal costs (expected to be $14 — $16 million). G&A expense includes incentive compensation expense, which depends largely on adjusted net income (as defined in the Company’s incentive compensation plan), which excludes unrealized gains and losses on commodity derivatives.
Interest ExpenseThe non-capitalized portion of the Company’s interest expense for the first quarter of 2008 is expected to be $17 — $19 million ($0.33 — $0.37 per Mcfe). As of February 11, 2008, Newfield had no borrowings outstanding under its credit arrangements. The remainder of debt consists of public debt that in the aggregate totals $1.05 billion in principal amount. Capitalized interest for the first quarter of 2008 is expected to be about $12 — $13 million.
Income TaxesIncluding both current and deferred taxes, the Company expects its consolidated income tax rate in the first quarter of 2008 to be about 36 — 39%. About 70% of the tax provision is expected to be deferred.
NATURAL GAS HEDGE POSITIONS
Please see the tables below for our complete hedging positions.
The following hedge positions for the fourth quarter of 2008 and beyond are as of February 8, 2008:
First Quarter 2008
| | | | | | | | | | | | | | | | | | | | | |
| | | Weighted Average | | Range |
| Volume | | Fixed | | Floors | | Collars | | Floor | | Ceiling |
| 10,920 MMMBtus | | $ | 8.74 | | | | — | | | | — | | | | — | | | | — | |
| 22,595 MMMBtus | | | — | | | | — | | | $ | 8.00—$11.04 | | | $ | 8.00 | | | $ | 10.00—$12.40 | |
Second Quarter 2008
| | | | | | | | | | | | | | | | | | | | | |
| | | Weighted Average | | Range |
| Volume | | Fixed | | Floors | | Collars | | Floor | | Ceiling |
| 25,325 MMMBtus | | $ | 7.96 | | | | — | | | | — | | | | — | | | | — | |
| 5,715 MMMBtus | | | — | | | | — | | | $ | 7.64—$9.34 | | | $ | 7.00—$8.00 | | | $ | 9.00—$9.70 | |
Third Quarter 2008
| | | | | | | | | | | | | | | | | | | | | |
| | | Weighted Average | | Range |
| Volume | | Fixed | | Floors | | Collars | | Floor | | Ceiling |
| 26,220 MMMBtus | | $ | 7.97 | | | | — | | | | — | | | | — | | | | — | |
| 5,760 MMMBtus | | | — | | | | — | | | $ | 7.64—$9.34 | | | $ | 7.00—$8.00 | | | $ | 9.00—$9.70 | |
Fourth Quarter 2008
| | | | | | | | | | | | | | | | | | | | | |
| | | Weighted Average | | Range |
| Volume | | Fixed | | Floors | | Collars | | Floor | | Ceiling |
| 8,835 MMMBtus | | $ | 7.98 | | | | — | | | | — | | | | — | | | | — | |
| 14,745 MMMBtus | | | — | | | | — | | | $ | 7.95—$10.13 | | | $ | 7.00—$8.00 | | | $ | 9.00—$11.16 | |
| 1,220 MMMBtus | | | — | | | | — | | | $ | 8.25—$12.76 | | | $ | 8.00—$8.50 | | | $ | 11.72—$13.80 | |
First Quarter 2009
| | | | | | | | | | | | | | | | | | | | | |
| | | Weighted Average | | Range |
| Volume | | Fixed | | Floors | | Collars | | Floor | | Ceiling |
| 19,350 MMMBtus | | | — | | | | — | | | $ | 8.00—$10.25 | | | $ | 8.00 | | | $ | 9.67—$11.16 | |
| 1,800 MMMBtus** | | | — | | | | — | | | $ | 8.25—$12.76 | | | $ | 8.00—$8.50 | | | $ | 11.72—$13.80 | |
| | |
| ** | | These 3—way collar contracts are standard natural gas collar contracts with respect to the periods, volumes and prices stated above. The contracts have floor and ceiling prices per MMBtu as per the table above until the price drops below a weighted average price of $7.00 per MMBtu. Below $7.00 per MMBtu, these contracts effectively result in realized prices that are on average $1.25 per MMBtu higher than the cash price that otherwise would have been realized |
The following table details the expected impact to pre-tax income from the settlement of our derivative contracts, outlined above, at various NYMEX gas prices, net of premiums paid for these contracts (in millions).
| | | | | | | | | | | | | | | | | | | | | |
| | | Gas Prices |
| | | $5.00 | | $6.00 | | $7.00 | | $8.00 | | $9.00 |
| | | |
2008 | | | | | | | | | | | | | | | | | | | | |
| 1st Quarter | | $ | 109 | | | $ | 75 | | | $ | 42 | | | $ | 8 | | | $ | (3 | ) |
| 2nd Quarter | | $ | 90 | | | $ | 59 | | | $ | 28 | | | $ | (1 | ) | | $ | (26 | ) |
| 3rd Quarter | | $ | 93 | | | $ | 61 | | | $ | 29 | | | $ | (1 | ) | | $ | (27 | ) |
| 4th Quarter | | $ | 71 | | | $ | 48 | | | $ | 24 | | | $ | — | | | $ | (9 | ) |
| | | |
Total 2008 | | $ | 363 | | | $ | 243 | | | $ | 123 | | | $ | 6 | | | $ | (65 | ) |
| | | | | | | | | | | | | | | | | | | | | |
2009 | | | | | | | | | | | | | | | | | | | | |
1st Quarter | | $ | 60 | | | $ | 41 | | | $ | 22 | | | $ | — | | | $ | — | |
In conjunction with our recent acquisition of properties in the Rocky Mountains, we hedged basis associated with 50% of the proved producing fields from August 2007 through full-year 2012. The weighted average hedged differential during this period was $(1.18) per Mcf.
Approximately 31% of our natural gas production correlates to Houston Ship Channel, 25% to CenterPoint/East, 19% to Panhandle Eastern Pipeline, 10% to Waha, 7% to Colorado Interstate, 8% to others.
CRUDE OIL HEDGE POSITIONS
The following hedge positions for the fourth quarter of 2008 and beyond are as of February 8, 2008:
First Quarter 2008
| | | | | | | | | | | | | | | | | | | | | |
| | | Weighted Average | | Range |
| Volume | | Fixed | | Floors | | Collars | | Floor | | Ceiling |
| 819,000 Bbls** | | | — | | | | — | | | $ | 33.00—$50.29 | | | $ | 32.00—$35.00 | | | $ | 49.50—$52.90 | |
Second Quarter 2008
| | | | | | | | | | | | | | | | | | | | | |
| | | Weighted Average | | Range |
| Volume | | Fixed | | Floors | | Collars | | Floor | | Ceiling |
| 819,000 Bbls** | | | — | | | | — | | | $ | 33.00—$50.29 | | | $ | 32.00—$35.00 | | | $ | 49.50—$52.90 | |
Third Quarter 2008
| | | | | | | | | | | | | | | | | | | | | |
| | | Weighted Average | | Range |
| Volume | | Fixed | | Floors | | Collars | | Floor | | Ceiling |
| 828,000 Bbls** | | | — | | | | — | | | $ | 33.00—$50.29 | | | $ | 32.00—$35.00 | | | $ | 49.50—$52.90 | |
Fourth Quarter 2008
| | | | | | | | | | | | | | | | | | | | | |
| | | Weighted Average | | Range |
| Volume | | Fixed | | Floors | | Collars | | Floor | | Ceiling |
| 828,000 Bbls** | | | — | | | | — | | | $ | 33.00—$50.29 | | | $ | 32.00—$35.00 | | | $ | 49.50—$52.90 | |
First Quarter 2009
| | | | | | | | | | | | | | | | | | | | | |
| | | Weighted Average | | Range |
| Volume | | Fixed | | Floors | | Collars | | Floor | | Ceiling |
| 810,000 Bbls** | | | — | | | | — | | | $ | 33.33—$50.62 | | | $ | 32.00—$36.00 | | | $ | 50.00—$54.55 | |
Second Quarter 2009
| | | | | | | | | | | | | | | | | | | | | |
| | | Weighted Average | | Range |
| Volume | | Fixed | | Floors | | Collars | | Floor | | Ceiling |
| 819,000 Bbls** | | | — | | | | — | | | $ | 33.33—$50.62 | | | $ | 32.00—$36.00 | | | $ | 50.00—$54.55 | |
Third Quarter 2009
| | | | | | | | | | | | | | | | | | | | | |
| | | Weighted Average | | Range |
| Volume | | Fixed | | Floors | | Collars | | Floor | | Ceiling |
| 828,000 Bbls** | | | — | | | | — | | | | $33.33 — $50.62 | | | | $32.00—$36.00 | | | | $50.00—$54.55 | |
Fourth Quarter 2009
| | | | | | | | | | | | | | | | | | | | | |
| | | Weighted Average | | Range |
| Volume | | Fixed | | Floors | | Collars | | Floor | | Ceiling |
| 828,000 Bbls** | | | — | | | | — | | | | $33.33—$50.62 | | | | $32.00—$36.00 | | | | $50.00—$54.55 | |
First Quarter 2010
| | | | | | | | | | | | | | | | | | | | | |
| | | Weighted Average | | Range |
| Volume | | Fixed | | Floors | | Collars | | Floor | | Ceiling |
| 900,000 Bbls** | | | — | | | | — | | | | $34.90—$51.52 | | | | $32.00—$38.00 | | | | $50.00—$53.50 | |
Second Quarter 2010
| | | | | | | | | | | | | | | | | | | | | |
| | | Weighted Average | | Range |
| Volume | | Fixed | | Floors | | Collars | | Floor | | Ceiling |
| 909,000 Bbls** | | | — | | | | — | | | | $34.90—$51.52 | | | | $32.00—$38.00 | | | | $50.00—$53.50 | |
Third Quarter 2010
| | | | | | | | | | | | | | | | | | | | | |
| | | Weighted Average | | Range |
| Volume | | Fixed | | Floors | | Collars | | Floor | | Ceiling |
| 918,000 Bbls** | | | — | | | | — | | | | $34.91—$51.52 | | | | $32.00—$38.00 | | | | $50.00—$53.50 | |
Fourth Quarter 2010
| | | | | | | | | | | | | | | | | | | | | |
| | | Weighted Average | | Range |
| Volume | | Fixed | | Floors | | Collars | | Floor | | Ceiling |
| 918,000 Bbls** | | | — | | | | — | | | | $34.91—$51.52 | | | | $32.00—$38.00 | | | | $50.00—$53.50 | |
**These 3–way collar contracts are standard crude oil collar contracts with respect to the periods, volumes and prices stated above. The contracts have floor and ceiling prices per barrel as per the table above until the price drops below a weighted average price of $27.43 per barrel. Below $27.43 per barrel, these contracts effectively result in realized prices that are on average $6.36 per barrel higher than the cash price that otherwise would have been realized.
The following table details the expected impact to pre-tax income from the settlement of our derivative contracts, outlined above, at various NYMEX oil prices, net of premiums paid for these contracts (in millions).
| | | | | | | | | | | | | | | | | | | | | |
| | | $50.00 | | $60.00 | | $70.00 | | $80.00 | | $90.00 |
| | | |
2008 | | | | | | | | | | | | | | | | | | | | |
| 1st Quarter | | $ | — | | | $ | (8 | ) | | $ | (16 | ) | | $ | (25 | ) | | $ | (33 | ) |
| 2nd Quarter | | $ | (1 | ) | | $ | (8 | ) | | $ | (16 | ) | | $ | (24 | ) | | $ | (33 | ) |
| 3rd Quarter | | $ | — | | | $ | (9 | ) | | $ | (17 | ) | | $ | (25 | ) | | $ | (33 | ) |
| 4th Quarter | | $ | (1 | ) | | $ | (8 | ) | | $ | (17 | ) | | $ | (25 | ) | | $ | (33 | ) |
| | | |
Total 2008 | | $ | (2 | ) | | $ | (33 | ) | | $ | (66 | ) | | $ | (99 | ) | | $ | (132 | ) |
| | | |
| | | | | | | | | | | | | | | | | | | | | |
2009 | | $ | (1 | ) | | $ | (32 | ) | | $ | (65 | ) | | $ | (97 | ) | | $ | (130 | ) |
| | | | | | | | | | | | | | | | | | | | | |
2010 | | $ | — | | | $ | (31 | ) | | $ | (68 | ) | | $ | (104 | ) | | $ | (141 | ) |
We provide information regarding our outstanding hedging positions in our annual and quarterly reports filed with the SEC and in our electronic publication — @NFX. This publication can be found on Newfield’s web page athttp://www.newfield.com. Through the web page, you may elect to receive @NFX through e-mail distribution.
Newfield Exploration Company is an independent crude oil and natural gas exploration and production company. The Company relies on a proven growth strategy of growing reserves through the drilling of a balanced risk/reward portfolio and select acquisitions. Newfield’s domestic areas of operation include the U.S. onshore Gulf Coast, the Anadarko and Arkoma Basins of the Mid-Continent, the Rocky Mountains and the Gulf of Mexico. The Company has international operations in Malaysia and China.
**The statements set forth in this publication regarding estimated or anticipated 2008 production volumes, first quarter 2008 results, drilling plans, capital programs, the timing of drilling programs and future production rates for existing and planned wells are forward looking and are based upon assumptions and anticipated results that are subject to numerous uncertainties. Actual results may vary significantly from those anticipated due to many factors, including drilling results, oil and gas prices, industry conditions, the prices of goods and services, the availability of drilling rigs and other support services, the availability of capital resources, the availability of refining capacity for the crude oil Newfield produces from its Monument Butte Field in Utah and labor conditions. In addition, the drilling of oil and gas wells and the production of hydrocarbons are subject to governmental regulations and operating risks.

