United States
Securities and Exchange Commission
Washington, D.C. 20549
Form N-CSR
Certified Shareholder Report of Registered Management Investment Companies
811-7115
(Investment Company Act File Number)
Federated Hermes Total Return Series, Inc.
_______________________________________________________________
(Exact Name of Registrant as Specified in Charter)
Federated Hermes Funds
4000 Ericsson Drive
Warrendale, Pennsylvania 15086-7561
(Address of Principal Executive Offices)
(412) 288-1900
(Registrant's Telephone Number)
Peter J. Germain, Esquire
1001 Liberty Avenue
Pittsburgh, Pennsylvania 15222-3779
(Name and Address of Agent for Service)
(Notices should be sent to the Agent for Service)
Date of Fiscal Year End: 09/30/21
Date of Reporting Period: 09/30/21
| Item 1. | Reports to Stockholders |

Share Class | Ticker | A | FGFSX | Institutional | FGFIX |
Federated Hermes Core Bond Fund
A Portfolio of Federated Hermes Total Return Series, Inc.

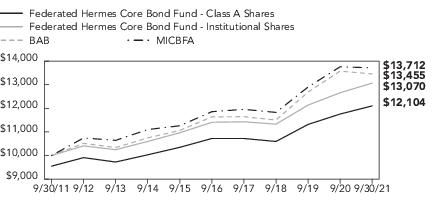
1 Year | 5 Years | 10 Years | |
Class A Shares | -1.69% | 1.52% | 1.93% |
Institutional Shares | 3.23% | 2.76% | 2.71% |
BAB | -0.90% | 2.94% | 3.01% |
MICBFA | -0.27% | 2.92% | 3.05% |
Security Type | Percentage of Total Net Assets |
U.S. Government Agency Mortgage-Backed Securities | 36.8% |
Corporate Debt Securities | 29.8% |
Agency Risk Transfer Security | 10.7% |
U.S. Treasury Securities | 7.7% |
Non-Agency Commercial Mortgage-Backed Security | 5.3% |
U.S. Government Agency Security | 5.0% |
Foreign Governments/Agencies | 1.0% |
U.S. Government Agency Adjustable Rate Mortgages | 0.4% |
Asset-Backed Securities | 0.3% |
Non-Agency Mortgage-Backed Securities | 0.2% |
Collateralized Mortgage Obligations | 0.1% |
Cash Equivalents2 | 5.9% |
Derivative Contracts3 | 1.4% |
Repurchase Agreement | 0.7% |
Other Assets and Liabilities—Net4 | (5.3)% |
TOTAL | 100% |
1 | See the Fund’s Prospectus and Statement of Additional Information for a description of the types of securities in which the Fund invests. As of the date specified above, the Fund owned shares of one or more affiliated investment companies. For purposes of this table, affiliated investment companies (other than an affiliated money market mutual fund) in which the Fund invested greater than 10% of its net assets are not treated as a single portfolio security, but rather the Fund is treated as owning a pro rata portion of each security and each other asset and liability owned by the affiliated investment company. Accordingly, the percentages of total net assets shown in the table will differ from those presented on the Portfolio of Investments. Affiliated investment companies (other than an affiliated money market mutual fund) in which the Fund invested less than 10% of its net assets are listed individually in the table. |
2 | Cash Equivalents include any investments in money market mutual funds. |
3 | Derivative contracts may consist of futures, forwards, written options and swaps. More complete information regarding the Fund’s direct investments in derivative contracts, including unrealized appreciation (depreciation), value and notional values or amounts of such contracts, can be found in the table at the end of the Portfolio of Investments included in this Report. |
4 | Assets, other than investments in securities and derivative contracts, less liabilities. See Statement of Assets and Liabilities. |
Principal Amount or Shares | Value | ||
MORTGAGE-BACKED SECURITIES— 36.8% | |||
Federal Home Loan Mortgage Corporation— 31.2% | |||
$3,278,695 | 2.500%, 1/1/2051 | $3,382,008 | |
2,486,524 | 3.000%, 10/1/2050 | 2,635,778 | |
16,264 | 7.500%, 1/1/2027 | 18,212 | |
2,125 | 7.500%, 1/1/2031 | 2,497 | |
894 | 7.500%, 1/1/2031 | 1,011 | |
1,548 | 7.500%, 1/1/2031 | 1,812 | |
20,597 | 7.500%, 2/1/2031 | 23,948 | |
61,948 | 7.500%, 2/1/2031 | 73,292 | |
TOTAL | 6,138,558 | ||
Federal National Mortgage Association— 1.3% | |||
19,525 | 5.000%, 4/1/2036 | 21,998 | |
129,003 | 5.500%, 11/1/2035 | 148,996 | |
35,706 | 6.000%, 2/1/2026 | 40,203 | |
2,356 | 6.000%, 5/1/2036 | 2,767 | |
424 | 6.500%, 7/1/2029 | 486 | |
850 | 6.500%, 5/1/2030 | 969 | |
3,565 | 6.500%, 2/1/2031 | 4,128 | |
3,178 | 6.500%, 4/1/2031 | 3,685 | |
293 | 6.500%, 4/1/2031 | 342 | |
4,085 | 6.500%, 5/1/2031 | 4,732 | |
4,056 | 6.500%, 6/1/2031 | 4,703 | |
6,763 | 6.500%, 7/1/2031 | 7,909 | |
843 | 6.500%, 8/1/2031 | 961 | |
2,650 | 7.000%, 4/1/2029 | 3,081 | |
816 | 7.000%, 4/1/2029 | 949 | |
4,329 | 7.000%, 5/1/2029 | 4,989 | |
2,046 | 7.000%, 2/1/2030 | 2,387 | |
2,153 | 8.000%, 12/1/2026 | 2,404 | |
TOTAL | 255,689 | ||
Government National Mortgage Association— 0.5% | |||
18,868 | 5.000%, 7/15/2023 | 19,448 | |
5,450 | 7.000%, 10/15/2028 | 6,158 | |
1,072 | 7.000%, 12/15/2028 | 1,213 | |
3,117 | 7.000%, 2/15/2029 | 3,442 | |
1,248 | 7.000%, 6/15/2029 | 1,422 | |
4,168 | 8.000%, 10/15/2030 | 4,823 |
Principal Amount or Shares | Value | ||
MORTGAGE-BACKED SECURITIES— continued | |||
Government National Mortgage Association— continued | |||
$ 57,734 | 8.000%, 11/15/2030 | $67,350 | |
TOTAL | 103,856 | ||
Uniform Mortgage-Backed Securities, TBA— 3.8% | |||
750,000 | 1 | 2.000%, 10/1/2051 | 751,922 |
TOTAL MORTGAGE-BACKED SECURITIES (IDENTIFIED COST $7,288,375) | 7,250,025 | ||
2 | AGENCY RISK TRANSFER SECURITIES— 10.7% | ||
416,047 | FHLMC - STACR 2015-DNA, Class M3, 3.986% (1-month USLIBOR +3.900%), 12/25/2027 | 420,024 | |
1,000,000 | FHLMC - STACR 2017-DNA3, Class M2, 2.586% (1-month USLIBOR +2.500%), 3/25/2030 | 1,023,449 | |
635,264 | FNMA - CAS 2016-C04, Class 1M2, 4.336% (1-month USLIBOR +4.250%), 1/25/2029 | 658,412 | |
TOTAL AGENCY RISK TRANSFER SECURITIES (IDENTIFIED COST $2,139,152) | 2,101,885 | ||
U.S. TREASURIES— 7.7% | |||
U.S. Treasury Bonds— 2.9% | |||
50,000 | 2.000%, 8/15/2051 | 49,078 | |
500,000 | 2.375%, 11/15/2049 | 531,805 | |
TOTAL | 580,883 | ||
U.S. Treasury Notes— 4.8% | |||
550,000 | 0.875%, 9/30/2026 | 547,078 | |
400,000 | 1.250%, 8/15/2031 | 390,313 | |
TOTAL | 937,391 | ||
TOTAL U.S. TREASURIES (IDENTIFIED COST $1,507,539) | 1,518,274 | ||
COMMERCIAL MORTGAGE-BACKED SECURITY— 5.3% | |||
Non-Agency Commercial Mortgage-Backed Securities— 5.3% | |||
1,000,000 | Fontainebleau Miami Beach Trust, Class B, 3.447%, 12/10/2036 (IDENTIFIED COST $1,029,990) | 1,047,252 | |
GOVERNMENT AGENCY— 5.0% | |||
Federal Farm Credit System— 5.0% | |||
1,000,000 | 0.700%, 1/27/2027 (IDENTIFIED COST $1,000,000) | 982,299 | |
2 | ADJUSTABLE RATE MORTGAGES— 0.4% | ||
Federal Home Loan Mortgage Corporation ARM— 0.1% | |||
14,926 | 1.965%, 7/1/2035 | 15,526 | |
Federal National Mortgage Association ARM— 0.3% | |||
20,617 | 1.995%, 7/1/2034 | 21,445 |
Principal Amount or Shares | Value | ||
2 | ADJUSTABLE RATE MORTGAGES— continued | ||
Federal National Mortgage Association ARM— continued | |||
$ 46,891 | 2.425%, 2/1/2036 | $49,395 | |
TOTAL | 70,840 | ||
TOTAL ADJUSTABLE RATE MORTGAGES (IDENTIFIED COST $82,431) | 86,366 | ||
COLLATERALIZED MORTGAGE OBLIGATIONS— 0.3% | |||
Federal National Mortgage Association— 0.1% | |||
22,711 | REMIC, Series 1999-13, Class PH, 6.000%, 4/25/2029 | 25,083 | |
Non-Agency Mortgage-Backed Securities— 0.2% | |||
73,939 | Credit Suisse Mortgage Trust 2007-4, Class 4A2, 5.500%, 6/25/2037 | 27,050 | |
4,438 | Lehman Structured Securities Corp. Mortgage 2002-GE1, Class A, 0.000%, 7/26/2024 | 1,895 | |
TOTAL | 28,945 | ||
TOTAL COLLATERALIZED MORTGAGE OBLIGATIONS (IDENTIFIED COST $100,654) | 54,028 | ||
ASSET-BACKED SECURITY— 0.3% | |||
Auto Receivables— 0.3% | |||
50,000 | CarMax Auto Owner Trust 2021-1, Class D, 1.280%, 7/15/2027 (IDENTIFIED COST $49,981) | 49,815 | |
INVESTMENT COMPANIES— 37.5% | |||
518,649 | Federated Hermes Corporate Bond Strategy Portfolio | 6,228,970 | |
1,155,308 | Federated Hermes Government Obligations Fund, Premier Shares, 0.03%3 | 1,155,308 | |
TOTAL INVESTMENT COMPANIES (IDENTIFIED COST $7,382,031) | 7,384,278 | ||
TOTAL INVESTMENT IN SECURITIES—104.0% (IDENTIFIED COST $20,580,153)4 | 20,474,222 | ||
OTHER ASSETS AND LIABILITIES - NET—(4.0)%5 | (781,166) | ||
TOTAL NET ASSETS—100% | $19,693,056 |
Description | Number of Contracts | Notional Value | Expiration Date | Value and Unrealized Appreciation (Depreciation) |
Long Futures: | ||||
6United States Treasury Notes 5-Year Long Futures | 9 | $1,104,680 | December 2021 | $(7,122) |
6United States Treasury Ultra Bond Long Futures | 2 | $382,125 | December 2021 | $(14,020) |
Short Futures: | ||||
6United States Treasury Long Bond Short Futures | 2 | $318,438 | December 2021 | $6,874 |
6United States Treasury Notes 10-Year Short Futures | 3 | $394,828 | December 2021 | $4,985 |
NET UNREALIZED DEPRECIATION ON FUTURES CONTRACTS | $(9,283) | |||
Federated Hermes Corporate Bond Strategy Portfolio | Federated Hermes Government Obligations Fund, Premier Shares | Total of Affiliated Transactions | |
Value as of 9/30/2020 | $— | $4,355,056 | $4,355,056 |
Purchases at Cost | $7,200,000 | $12,209,262 | $19,409,262 |
Proceeds from Sales | $(1,000,000) | $(15,409,010) | $(16,409,010) |
Change in Unrealized Appreciation/Depreciation | $2,246 | N/A | $2,246 |
Net Realized Gain/(Loss) | $26,724 | N/A | $26,724 |
Value as of 9/30/2021 | $6,228,970 | $1,155,308 | $7,384,278 |
Shares Held as of 9/30/2021 | 518,649 | 1,155,308 | 1,673,957 |
Dividend Income | $106,453 | $623 | $107,076 |
Gain Distributions Received | $2,588 | N/A | $2,588 |
1 | All or a portion of these To Be Announced Securities (TBAs) are subject to dollar-roll transactions. |
2 | Floating/adjustable note with current rate and current maturity or next reset date shown. Adjustable rate mortgage security coupons are based on the weighted average note rates of the underlying mortgages less the guarantee and servicing fees. These securities do not indicate an index and spread in their description above. |
3 | 7-day net yield. |
4 | The cost of investments for federal tax purposes amounts to $20,580,828. |
5 | Assets, other than investments in securities, less liabilities. See Statement of Assets and Liabilities. |
6 | Non-income-producing security. |
The following is a summary of the inputs used, as of September 30, 2021, in valuing the Fund’s assets carried at fair value:
Valuation Inputs | ||||
Level 1— Quoted Prices | Level 2— Other Significant Observable Inputs | Level 3— Significant Unobservable Inputs | Total | |
Debt Securities: | ||||
Mortgage-Backed Securities | $— | $7,250,025 | $— | $7,250,025 |
Agency Risk Transfer Securities | — | 2,101,885 | — | 2,101,885 |
U.S. Treasuries | — | 1,518,274 | — | 1,518,274 |
Commercial Mortgage-Backed Security | — | 1,047,252 | — | 1,047,252 |
Government Agency | — | 982,299 | — | 982,299 |
Adjustable Rate Mortgages | — | 86,366 | — | 86,366 |
Collateralized Mortgage Obligations | — | 54,028 | — | 54,028 |
Asset-Backed Security | — | 49,815 | — | 49,815 |
Investment Companies | 7,384,278 | — | — | 7,384,278 |
TOTAL SECURITIES | $7,384,278 | $13,089,944 | $— | $20,474,222 |
Other Financial Instruments:1 | ||||
Assets | $11,859 | $— | $— | $11,859 |
Liabilities | (21,142) | — | — | (21,142) |
TOTAL OTHER FINANCIAL INSTRUMENTS | $(9,283) | $— | $— | $(9,283) |
1 | Other financial instruments are futures contracts. |
The following acronym(s) are used throughout this portfolio: | ||
ARM | —Adjustable Rate Mortgage | |
CAS | —Connecticut Avenue Securities | |
FHLMC | —Federal Home Loan Mortgage Corporation | |
FNMA | —Federal National Mortgage Association | |
LIBOR | —London Interbank Offered Rate | |
REMIC | —Real Estate Mortgage Investment Conduit | |
STACR | —Structured Agency Credit Risk | |
Year Ended September 30, | |||||
2021 | 2020 | 2019 | 2018 | 2017 | |
Net Asset Value, Beginning of Period | $9.77 | $9.63 | $9.25 | $9.59 | $9.81 |
Income From Investment Operations: | |||||
Net investment income (loss) | 0.122 | 0.172 | 0.23 | 0.22 | 0.18 |
Net realized and unrealized gain (loss) | 0.17 | 0.20 | 0.39 | (0.33) | (0.18) |
Total From Investment Operations | 0.29 | 0.37 | 0.62 | (0.11) | — |
Less Distributions: | |||||
Distributions from net investment income | (0.19) | (0.23) | (0.24) | (0.23) | (0.22) |
Net Asset Value, End of Period | $9.87 | $9.77 | $9.63 | $9.25 | $9.59 |
Total Return3 | 2.94% | 3.89% | 6.82% | (1.19)% | 0.00%4 |
Ratios to Average Net Assets: | |||||
Net expenses5 | 0.62% | 0.66% | 0.80% | 0.81% | 0.81% |
Net investment income | 1.24% | 1.75% | 2.46% | 2.33% | 1.91% |
Expense waiver/reimbursement6 | 1.47% | 1.11% | 0.69% | 0.44% | 0.40% |
Supplemental Data: | |||||
Net assets, end of period (000 omitted) | $2,521 | $4,534 | $4,540 | $7,143 | $11,269 |
Portfolio turnover | 216% | 333% | 391%7 | 72% | 277% |
Portfolio turnover (excluding purchases and sales from dollar-roll transactions) | 82% | 203% | 186% | 18% | 63% |
1 | The Fund’s former Service Shares have been re-designated as Class A Shares, effective May 27, 2021. |
2 | Per share number has been calculated using the average shares method. |
3 | Based on net asset value, which does not reflect the sales charge, redemption fee or contingent deferred sales charge, if applicable. |
4 | Represents less than 0.01%. |
5 | Amount does not reflect net expenses incurred by investment companies in which the Fund may invest. |
6 | This expense decrease is reflected in both the net expense and the net investment income ratios shown above. Amount does not reflect expense waiver/reimbursement recorded by investment companies in which the Fund may invest. |
7 | The portfolio turnover rate was higher from the prior year as a result of significant client activity and asset reduction. |
Year Ended September 30, | |||||
2021 | 2020 | 2019 | 2018 | 2017 | |
Net Asset Value, Beginning of Period | $9.78 | $9.63 | $9.25 | $9.59 | $9.82 |
Income From Investment Operations: | |||||
Net investment income (loss) | 0.151 | 0.211 | 0.26 | 0.25 | 0.21 |
Net realized and unrealized gain (loss) | 0.16 | 0.20 | 0.39 | (0.33) | (0.19) |
Total From Investment Operations | 0.31 | 0.41 | 0.65 | (0.08) | 0.02 |
Less Distributions: | |||||
Distributions from net investment income | (0.21) | (0.26) | (0.27) | (0.26) | (0.25) |
Net Asset Value, End of Period | $9.88 | $9.78 | $9.63 | $9.25 | $9.59 |
Total Return2 | 3.23% | 4.30% | 7.14% | (0.89)% | 0.20% |
Ratios to Average Net Assets: | |||||
Net expenses3 | 0.33% | 0.37% | 0.50% | 0.51% | 0.50% |
Net investment income | 1.53% | 2.15% | 2.75% | 2.63% | 2.21% |
Expense waiver/reimbursement4 | 1.34% | 0.84% | 0.48% | 0.24% | 0.20% |
Supplemental Data: | |||||
Net assets, end of period (000 omitted) | $17,173 | $22,347 | $44,841 | $90,789 | $121,240 |
Portfolio turnover | 216% | 333% | 391%5 | 72% | 277% |
Portfolio turnover (excluding purchases and sales from dollar-roll transactions) | 82% | 203% | 186% | 18% | 63% |
1 | Per share number has been calculated using the average shares method. |
2 | Based on net asset value. |
3 | Amount does not reflect net expenses incurred by investment companies in which the Fund may invest. |
4 | This expense decrease is reflected in both the net expense and the net investment income ratios shown above. Amount does not reflect expense waiver/reimbursement recorded by investment companies in which the Fund may invest. |
5 | The portfolio turnover rate was higher from the prior year as a result of significant client activity and asset reduction. |
September 30, 2021
Assets: | |
Investment in securities, at value including $7,384,278 of investment in affiliated holdings* (identified cost $20,580,153) | $20,474,222 |
Income receivable | 48,326 |
Receivable for investments sold | 1,000,075 |
Total Assets | 21,522,623 |
Liabilities: | |
Payable for investments purchased | 1,745,763 |
Payable for shares redeemed | 63,697 |
Payable for variation margin on futures contracts | 207 |
Income distribution payable | 8,962 |
Payable to adviser (Note 5) | 3,209 |
Payable for administrative fee (Note 5) | 42 |
Payable for other service fees (Notes 2 and 5) | 561 |
Accrued expenses (Note 5) | 7,126 |
Total Liabilities | 1,829,567 |
Net assets for 1,993,325 shares outstanding | $19,693,056 |
Net Assets Consist of: | |
Paid-in capital | $21,383,486 |
Total distributable earnings (loss) | (1,690,430) |
Total Net Assets | $19,693,056 |
Net Asset Value, Offering Price and Redemption Proceeds Per Share: | |
Class A Shares:1 | |
$2,520,525 ÷ 255,273 shares outstanding, no par value, 500,000,000 shares authorized | $9.87 |
Offering price per share (100/95.50 of $9.87) | $10.34 |
Redemption proceeds per share | $9.87 |
Institutional Shares: | |
$17,172,531 ÷ 1,738,052 shares outstanding, no par value, 1,000,000,000 shares authorized | $9.88 |
Offering price per share | $9.88 |
Redemption proceeds per share | $9.88 |
* | See information listed after the Fund’s Portfolio of Investments. |
1 | The Fund’s former Service Shares have been re-designated as Class A Shares, effective May 27, 2021. |
Year Ended September 30, 2021
Investment Income: | |
Interest | $332,713 |
Dividends received from affiliated holdings* | 107,076 |
TOTAL INCOME | 439,789 |
Expenses: | |
Investment adviser fee (Note 5) | 82,524 |
Administrative fee (Note 5) | 19,077 |
Custodian fees | 8,705 |
Transfer agent fees | 16,795 |
Directors’/Trustees’ fees (Note 5) | 2,520 |
Auditing fees | 32,330 |
Legal fees | 10,709 |
Portfolio accounting fees | 104,605 |
Distribution services fee (Note 5) | 6,591 |
Other service fees (Notes 2 and 5) | 9,183 |
Share registration costs | 73,577 |
Printing and postage | 21,362 |
Taxes | 3,634 |
Miscellaneous (Note 5) | 18,661 |
TOTAL EXPENSES | 410,273 |
Waivers and Reimbursements: | |
Waiver/reimbursement of investment adviser fee (Note 5) | (82,524) |
Waivers/reimbursements of other operating expenses (Notes 2 and 5) | (238,275) |
TOTAL WAIVERS AND REIMBURSEMENTS | (320,799) |
Net expenses | 89,474 |
Net investment income | 350,315 |
Realized and Unrealized Gain (Loss) on Investments, Futures Contracts and Swap Contracts: | |
Net realized gain on investments (including net realized gain of $26,724 on sales of investments in affiliated holdings) | $442,818 |
Net realized loss on futures contracts | (305,533) |
Net realized gain on swap contracts | 1,087,062 |
Realized gain distribution from affiliated investment company shares | 2,588 |
Net change in unrealized appreciation of investments (including net change in unrealized appreciation of $2,246 on investments in affiliated holdings*) | (747,985) |
Net change in unrealized depreciation of futures contracts | 9,848 |
Net change in unrealized appreciation of swap contracts | (22,301) |
Net realized and unrealized gain (loss) on investments, futures contracts and swap contracts | 466,497 |
Change in net assets resulting from operations | $816,812 |
* | See information listed after the Fund’s Portfolio of Investments. |
Year Ended September 30 | 2021 | 2020 |
Increase (Decrease) in Net Assets | ||
Operations: | ||
Net investment income | $350,315 | $813,918 |
Net realized gain (loss) | 1,226,935 | 198,062 |
Net change in unrealized appreciation/depreciation | (760,438) | (285,160) |
CHANGE IN NET ASSETS RESULTING FROM OPERATIONS | 816,812 | 726,820 |
Distributions to Shareholders: | ||
Class A Shares1 | (69,841) | (108,043) |
Institutional Shares | (433,386) | (933,587) |
CHANGE IN NET ASSETS RESULTING FROM DISTRIBUTIONS TO SHAREHOLDERS | (503,227) | (1,041,630) |
Share Transactions: | ||
Proceeds from sale of shares | 2,410,257 | 8,452,018 |
Net asset value of shares issued to shareholders in payment of distributions declared | 374,062 | 729,737 |
Cost of shares redeemed | (10,285,290) | (31,367,401) |
CHANGE IN NET ASSETS RESULTING FROM SHARE TRANSACTIONS | (7,500,971) | (22,185,646) |
Change in net assets | (7,187,386) | (22,500,456) |
Net Assets: | ||
Beginning of period | 26,880,442 | 49,380,898 |
End of period | $19,693,056 | $26,880,442 |
1 | The Fund’s former Service Shares have been re-designated as Class A Shares, effective May 27, 2021. |
Other Service Fees Incurred | |
Class A Shares1 | $9,183 |
1 | The Fund’s former Service Shares have been re-designated as Class A Shares, effective May 27, 2021. |
Fair Value of Derivative Instruments | ||
Liabilities | ||
Statement of Assets and Liabilities Location | Fair Value | |
Derivatives not accounted for as hedging instruments under ASC Topic 815 | ||
Interest rate contracts | Payable for variation margin on futures contracts | $9,283* |
* | Includes cumulative net depreciation of futures contracts as reported in the footnotes to the Portfolio of Investments. Only the current day’s variation margin is reported within the Statement of Assets and Liabilities. |
Amount of Realized Gain or (Loss) on Derivatives Recognized in Income | |||
Credit Default Swaps | Futures Contracts | Total | |
Interest rate contracts | $— | $(305,533) | $(305,533) |
Credit contracts | 1,087,062 | — | 1,087,062 |
TOTAL | $1,087,062 | $(305,533) | $781,529 |
Change in Unrealized Appreciation or (Depreciation) on Derivatives Recognized in Income | |||
Credit Default Swaps | Futures Contracts | Total | |
Interest rate contracts | $— | $9,848 | $9,848 |
Credit contracts | (22,301) | — | (22,301) |
TOTAL | $(22,301) | $9,848 | $(12,453) |
Year Ended 9/30/2021 | Year Ended 9/30/2020 | |||
Class A Shares:1 | Shares | Amount | Shares | Amount |
Shares sold | 41,472 | $411,797 | 87,500 | $855,862 |
Shares issued to shareholders in payment of distributions declared | 4,350 | 43,159 | 6,961 | 67,102 |
Shares redeemed | (254,477) | (2,522,533) | (101,917) | (959,138) |
NET CHANGE RESULTING FROM CLASS A SHARE TRANSACTIONS | (208,655) | $(2,067,577) | (7,456) | $(36,174) |
Year Ended 9/30/2021 | Year Ended 9/30/2020 | |||
Institutional Shares: | Shares | Amount | Shares | Amount |
Shares sold | 200,476 | $1,998,460 | 777,919 | $7,596,156 |
Shares issued to shareholders in payment of distributions declared | 33,348 | 330,903 | 68,734 | 662,635 |
Shares redeemed | (781,278) | (7,762,757) | (3,215,735) | (30,408,263) |
NET CHANGE RESULTING FROM INSTITUTIONAL SHARE TRANSACTIONS | (547,454) | $(5,433,394) | (2,369,082) | $(22,149,472) |
NET CHANGE RESULTING FROM TOTAL FUND SHARE TRANSACTIONS | (756,109) | $(7,500,971) | (2,376,538) | $(22,185,646) |
1 | The Fund’s former Service Shares have been re-designated as Class A Shares, effective May 27, 2021. |
2021 | 2020 | |
Ordinary income | $503,227 | $1,041,630 |
Undistributed ordinary income | $192,912 |
Unrealized depreciation | $(117,345) |
Capital loss carryforwards and deferrals | $(1,765,997) |
Short-Term | Long-Term | Total |
$1,765,997 | $— | $1,765,997 |
Administrative Fee | Average Daily Net Assets of the Investment Complex |
0.100% | on assets up to $50 billion |
0.075% | on assets over $50 billion |
Distribution Services Fees Incurred | Distribution Services Fees Waived | |
Class A Shares | $6,591 | $(5,263) |
Purchases | $7,249,982 |
Sales | $8,160,595 |
Beginning Account Value 4/1/2021 | Ending Account Value 9/30/2021 | Expenses Paid During Period1 | |
Actual: | |||
Class A Shares2 | $1,000 | $1,020.70 | $3.04 |
Institutional Shares | $1,000 | $1,022.10 | $1.67 |
Hypothetical (assuming a 5% return before expenses): | |||
Class A Shares2 | $1,000 | $1,022.06 | $3.04 |
Institutional Shares | $1,000 | $1,023.41 | $1.67 |
1 | Expenses are equal to the Fund’s annualized net expense ratios, multiplied by the average account value over the period, multiplied by 183/365 (to reflect the one-half-year period). The annualized net expense ratios are as follows: |
Class A Shares | 0.60% |
Institutional Shares | 0.33% |
2 | The Fund’s former Service Shares have been re-designated as Class A Shares, effective May 27, 2021. |
Name Birth Date Positions Held with Corporation Date Service Began | Principal Occupation(s) for Past Five Years, Other Directorships Held and Previous Position(s) |
J. Christopher Donahue* Birth Date: April 11, 1949 President and Director Indefinite Term Began serving: March 1995 | Principal Occupations: Principal Executive Officer and President of certain of the Funds in the Federated Hermes Fund Family; Director or Trustee of the Funds in the Federated Hermes Fund Family; President, Chief Executive Officer and Director, Federated Hermes, Inc.; Chairman and Trustee, Federated Investment Management Company; Trustee, Federated Investment Counseling; Chairman and Director, Federated Global Investment Management Corp.; Chairman and Trustee, Federated Equity Management Company of Pennsylvania; Trustee, Federated Shareholder Services Company; Director, Federated Services Company. Previous Positions: President, Federated Investment Counseling; President and Chief Executive Officer, Federated Investment Management Company, Federated Global Investment Management Corp. and Passport Research, Ltd; Chairman, Passport Research, Ltd. |
Name Birth Date Positions Held with Corporation Date Service Began | Principal Occupation(s) for Past Five Years, Other Directorships Held and Previous Position(s) |
John B. Fisher* Birth Date: May 16, 1956 Director Indefinite Term Began serving: May 2016 | Principal Occupations: Principal Executive Officer and President of certain of the Funds in the Federated Hermes Fund Family; Director or Trustee of certain of the Funds in the Federated Hermes Fund Family; Vice President, Federated Hermes, Inc.; President, Director/Trustee and CEO, Federated Advisory Services Company, Federated Equity Management Company of Pennsylvania, Federated Global Investment Management Corp., Federated Investment Counseling, Federated Investment Management Company; President of some of the Funds in the Federated Hermes Fund Family and Director, Federated Investors Trust Company. Previous Positions: President and Director of the Institutional Sales Division of Federated Securities Corp.; President and Director of Federated Investment Counseling; President and CEO of Passport Research, Ltd.; Director, Edgewood Securities Corp.; Director, Federated Services Company; Director, Federated Hermes, Inc.; Chairman and Director, Southpointe Distribution Services, Inc. and President, Technology, Federated Services Company. |
Name Birth Date Positions Held with Corporation Date Service Began | Principal Occupation(s) for Past Five Years, Other Directorships Held, Previous Position(s) and Qualifications |
John T. Collins Birth Date: January 24, 1947 Director Indefinite Term Began serving: October 2013 | Principal Occupations: Director or Trustee, and Chair of the Board of Directors or Trustees, of the Federated Hermes Fund Family; formerly, Chairman and CEO, The Collins Group, Inc. (a private equity firm) (Retired). Other Directorships Held: Chairman of the Board of Directors, Director, KLX Energy Services Holdings, Inc. (oilfield services); former Director of KLX Corp. (aerospace). Qualifications: Mr. Collins has served in several business and financial management roles and directorship positions throughout his career. Mr. Collins previously served as Chairman and CEO of The Collins Group, Inc. (a private equity firm) and as a Director of KLX Corp. Mr. Collins serves as Chairman Emeriti, Bentley University. Mr. Collins previously served as Director and Audit Committee Member, Bank of America Corp.; Director, FleetBoston Financial Corp.; and Director, Beth Israel Deaconess Medical Center (Harvard University Affiliate Hospital). |
Name Birth Date Positions Held with Corporation Date Service Began | Principal Occupation(s) for Past Five Years, Other Directorships Held, Previous Position(s) and Qualifications |
G. Thomas Hough Birth Date: February 28, 1955 Director Indefinite Term Began serving: August 2015 | Principal Occupations: Director or Trustee, Chair of the Audit Committee of the Federated Hermes Fund Family; formerly, Vice Chair, Ernst & Young LLP (public accounting firm) (Retired). Other Directorships Held: Director, Chair of the Audit Committee, Equifax, Inc.; Director, Member of the Audit Committee, Haverty Furniture Companies, Inc.; formerly, Director, Member of Governance and Compensation Committees, Publix Super Markets, Inc. Qualifications: Mr. Hough has served in accounting, business management and directorship positions throughout his career. Mr. Hough most recently held the position of Americas Vice Chair of Assurance with Ernst & Young LLP (public accounting firm). Mr. Hough serves on the President’s Cabinet and Business School Board of Visitors for the University of Alabama. Mr. Hough previously served on the Business School Board of Visitors for Wake Forest University, and he previously served as an Executive Committee member of the United States Golf Association. |
Maureen Lally-Green Birth Date: July 5, 1949 Director Indefinite Term Began serving: August 2009 | Principal Occupations: Director or Trustee of the Federated Hermes Fund Family; Adjunct Professor Emerita of Law, Duquesne University School of Law; formerly, Dean of the Duquesne University School of Law and Professor of Law and Interim Dean of the Duquesne University School of Law; formerly, Associate General Secretary and Director, Office of Church Relations, Diocese of Pittsburgh. Other Directorships Held: Director, CNX Resources Corporation (formerly known as CONSOL Energy Inc.). Qualifications: Judge Lally-Green has served in various legal and business roles and directorship positions throughout her career. Judge Lally-Green previously held the position of Dean of the School of Law of Duquesne University (as well as Interim Dean). Judge Lally-Green previously served as a member of the Superior Court of Pennsylvania and as a Professor of Law, Duquesne University School of Law. Judge Lally-Green was appointed by the Supreme Court of Pennsylvania to serve on the Supreme Court’s Board of Continuing Judicial Education and the Supreme Court’s Appellate Court Procedural Rules Committee. Judge Lally-Green also currently holds the positions on not for profit or for profit boards of directors as follows: Director and Chair, UPMC Mercy Hospital; Regent, Saint Vincent Seminary; Member, Pennsylvania State Board of Education (public); Director, Catholic Charities, Pittsburgh; and Director CNX Resources Corporation (formerly known as CONSOL Energy Inc.). Judge Lally-Green has held the positions of: Director, Auberle; Director, Epilepsy Foundation of Western and Central Pennsylvania; Director, Ireland Institute of Pittsburgh; Director, Saint Thomas More Society; Director and Chair, Catholic High Schools of the Diocese of Pittsburgh, Inc.; Director, Pennsylvania Bar Institute; Director, St. Vincent College; Director and Chair, North Catholic High School, Inc.; and Director and Vice Chair, Our Campaign for the Church Alive!, Inc. |
Name Birth Date Positions Held with Corporation Date Service Began | Principal Occupation(s) for Past Five Years, Other Directorships Held, Previous Position(s) and Qualifications |
Thomas M. O’Neill Birth Date: June 14, 1951 Director Indefinite Term Began serving: August 2006 | Principal Occupations: Director or Trustee of the Federated Hermes Fund Family; Sole Proprietor, Navigator Management Company (investment and strategic consulting). Other Directorships Held: None. Qualifications: Mr. O’Neill has served in several business, mutual fund and financial management roles and directorship positions throughout his career. Mr. O’Neill serves as Director, Medicines for Humanity and Director, The Golisano Children’s Museum of Naples, Florida. Mr. O’Neill previously served as Chief Executive Officer and President, Managing Director and Chief Investment Officer, Fleet Investment Advisors; President and Chief Executive Officer, Aeltus Investment Management, Inc.; General Partner, Hellman, Jordan Management Co., Boston, MA; Chief Investment Officer, The Putnam Companies, Boston, MA; Credit Analyst and Lending Officer, Fleet Bank; Director and Consultant, EZE Castle Software (investment order management software); and Director, Midway Pacific (lumber). |
Madelyn A. Reilly Birth Date: February 2, 1956 Director Indefinite Term Began serving: November 2020 | Principal Occupations: Director or Trustee of the Federated Hermes Fund Family; Senior Vice President for Legal Affairs, General Counsel and Secretary of the Board of Trustees, Duquesne University. Other Directorships Held: None. Qualifications: Ms. Reilly has served in various business and legal management roles throughout her career. Ms. Reilly previously served as Director of Risk Management and Associate General Counsel, Duquesne University. Prior to her work at Duquesne University, Ms. Reilly served as Assistant General Counsel of Compliance and Enterprise Risk as well as Senior Counsel of Environment, Health and Safety, PPG Industries. |
P. Jerome Richey Birth Date: February 23, 1949 Director Indefinite Term Began serving: October 2013 | Principal Occupations: Director or Trustee of the Federated Hermes Fund Family; Management Consultant; Retired; formerly, Senior Vice Chancellor and Chief Legal Officer, University of Pittsburgh and Executive Vice President and Chief Legal Officer, CONSOL Energy Inc. (now split into two separate publicly traded companies known as CONSOL Energy Inc. and CNX Resources Corp.). Other Directorships Held: None. Qualifications: Mr. Richey has served in several business and legal management roles and directorship positions throughout his career. Mr. Richey most recently held the positions of Senior Vice Chancellor and Chief Legal Officer, University of Pittsburgh. Mr. Richey previously served as Chairman of the Board, Epilepsy Foundation of Western Pennsylvania and Chairman of the Board, World Affairs Council of Pittsburgh. Mr. Richey previously served as Chief Legal Officer and Executive Vice President, CONSOL Energy Inc. and CNX Gas Company; and Board Member, Ethics Counsel and Shareholder, Buchanan Ingersoll & Rooney PC (a law firm). |
Name Birth Date Positions Held with Corporation Date Service Began | Principal Occupation(s) for Past Five Years, Other Directorships Held, Previous Position(s) and Qualifications |
John S. Walsh Birth Date: November 28, 1957 Director Indefinite Term Began serving: April 1999 | Principal Occupations: Director or Trustee of the Federated Hermes Fund Family; President and Director, Heat Wagon, Inc. (manufacturer of construction temporary heaters); President and Director, Manufacturers Products, Inc. (distributor of portable construction heaters); President, Portable Heater Parts, a division of Manufacturers Products, Inc. Other Directorships Held: None. Qualifications: Mr. Walsh has served in several business management roles and directorship positions throughout his career. Mr. Walsh previously served as Vice President, Walsh & Kelly, Inc. (paving contractors). |
Name Birth Date Positions Held with Corporation Date Service Began | Principal Occupation(s) for Past Five Years and Previous Position(s) |
Lori A. Hensler Birth Date: January 6, 1967 TREASURER Officer since: April 2013 | Principal Occupations: Principal Financial Officer and Treasurer of the Federated Hermes Fund Family; Senior Vice President, Federated Administrative Services; Financial and Operations Principal for Federated Securities Corp.; and Assistant Treasurer, Federated Investors Trust Company. Ms. Hensler has received the Certified Public Accountant designation. Previous Positions: Controller of Federated Hermes, Inc.; Senior Vice President and Assistant Treasurer, Federated Investors Management Company; Treasurer, Federated Investors Trust Company; Assistant Treasurer, Federated Administrative Services, Federated Administrative Services, Inc., Federated Securities Corp., Edgewood Services, Inc., Federated Advisory Services Company, Federated Equity Management Company of Pennsylvania, Federated Global Investment Management Corp., Federated Investment Counseling, Federated Investment Management Company, Passport Research, Ltd., and Federated MDTA, LLC; Financial and Operations Principal for Federated Securities Corp., Edgewood Services, Inc. and Southpointe Distribution Services, Inc. |
Name Birth Date Positions Held with Corporation Date Service Began | Principal Occupation(s) for Past Five Years and Previous Position(s) |
Peter J. Germain Birth Date: September 3, 1959 CHIEF LEGAL OFFICER, SECRETARY and EXECUTIVE VICE PRESIDENT Officer since: January 2005 | Principal Occupations: Mr. Germain is Chief Legal Officer, Secretary and Executive Vice President of the Federated Hermes Fund Family. He is General Counsel, Chief Legal Officer, Secretary and Executive Vice President, Federated Hermes, Inc.; Trustee and Senior Vice President, Federated Investors Management Company; Trustee and President, Federated Administrative Services; Director and President, Federated Administrative Services, Inc.; Director and Vice President, Federated Securities Corp.; Director and Secretary, Federated Private Asset Management, Inc.; Secretary, Federated Shareholder Services Company; and Secretary, Retirement Plan Service Company of America. Mr. Germain joined Federated Hermes, Inc. in 1984 and is a member of the Pennsylvania Bar Association. Previous Positions: Deputy General Counsel, Special Counsel, Managing Director of Mutual Fund Services, Federated Hermes, Inc.; Senior Vice President, Federated Services Company; and Senior Corporate Counsel, Federated Hermes, Inc. |
Stephen Van Meter Birth Date: June 5, 1975 CHIEF COMPLIANCE OFFICER AND SENIOR VICE PRESIDENT Officer since: July 2015 | Principal Occupations: Senior Vice President and Chief Compliance Officer of the Federated Hermes Fund Family; Vice President and Chief Compliance Officer of Federated Hermes, Inc. and Chief Compliance Officer of certain of its subsidiaries. Mr. Van Meter joined Federated Hermes, Inc. in October 2011. He holds FINRA licenses under Series 3, 7, 24 and 66. Previous Positions: Mr. Van Meter previously held the position of Compliance Operating Officer, Federated Hermes, Inc. Prior to joining Federated Hermes, Inc., Mr. Van Meter served at the United States Securities and Exchange Commission in the positions of Senior Counsel, Office of Chief Counsel, Division of Investment Management and Senior Counsel, Division of Enforcement. |
Robert J. Ostrowski Birth Date: April 26, 1963 Chief Investment Officer Officer since: May 2004 | Principal Occupations: Robert J. Ostrowski joined Federated Hermes, Inc. in 1987 as an Investment Analyst and became a Portfolio Manager in 1990. He was named Chief Investment Officer of Federated Hermes’ taxable fixed-income products in 2004 and also serves as a Senior Portfolio Manager. Mr. Ostrowski became an Executive Vice President of the Fund’s Adviser in 2009 and served as a Senior Vice President of the Fund’s Adviser from 1997 to 2009. Mr. Ostrowski has received the Chartered Financial Analyst designation. He received his M.S. in Industrial Administration from Carnegie Mellon University. |
Annual Evaluation of Adequacy and Effectiveness


Federated Hermes Funds
4000 Ericsson Drive
Warrendale, PA 15086-7561
or call 1-800-341-7400.
CUSIP 31428Q887


Share Class | Ticker | A | FULAX | Institutional | FULIX | Service | FULBX | R6 | FULLX |
Federated Hermes Ultrashort Bond Fund
A Portfolio of Federated Hermes Total Return Series, Inc.

1 Year | 5 Years | 10 Years | |
Class A Shares | 1.07% | 1.66% | 1.22% |
Institutional Shares | 1.22% | 2.09% | 1.70% |
Service Shares | 1.12% | 1.77% | 1.31% |
R6 Shares5 | 1.23% | 2.10% | 1.70% |
BSTGCI | 0.19% | 1.45% | 0.90% |
BOA1T | 0.17% | 1.46% | 0.89% |
LUSOFA | 0.56% | 1.54% | 1.16% |
Security Type | Percentage of Total Net Assets2 |
Asset-Backed Securities | 42.7% |
Corporate Bonds | 34.0% |
Collateralized Mortgage Obligations | 7.6% |
Commercial Paper | 1.8% |
Commercial Mortgage-Backed Securities | 1.6% |
Non-Agency Mortgage-Backed Securities | 1.0% |
Certificates of Deposit | 0.3% |
Adjustable Rate Mortgages3 | 0.0% |
Mortgage-Backed Securities3,4 | 0.0% |
Derivative Contracts3,5 | 0.0% |
Bank Loan Core Fund | 3.1% |
High Yield Bond Core Fund | 1.2% |
Federated Hermes Conservative Microshort Fund | 0.5% |
Securities Lending Collateral6 | 0.1% |
Cash Equivalents7 | 8.8% |
Other Assets and Liabilities—Net8 | (2.7)% |
TOTAL | 100% |
1 | See the Fund’s Prospectus and Statement of Additional Information for a description of these security types. |
2 | As of the date specified above, the Fund owned shares of one or more affiliated investment companies. For purposes of this table, affiliated investment companies (other than an affiliated money market mutual fund) in which the Fund invested less than 10% of its net assets, are listed individually in the table. |
3 | Represents less than 0.1%. |
4 | For purposes of this table, Mortgage-Backed Securities include mortgage-backed securities guaranteed by Government Sponsored Entities and adjustable rate mortgage-backed securities. |
5 | Based upon net unrealized appreciation (depreciation) or value of the derivative contracts as applicable. Derivative contracts may consist of futures, forwards, options and swaps. The impact of a derivative contract on the Fund’s performance may be larger than its unrealized appreciation (depreciation) or value may indicate. In many cases, the notional value or amount of a derivative contract may provide a better indication of the contract’s significance to the portfolio. More complete information regarding the Fund’s direct investments in derivative contracts, including unrealized appreciation (depreciation), value and notional values or amounts of such contracts, can be found in the table at the end of the Portfolio of Investments included in this Report. |
6 | Represents cash collateral received for portfolio securities on loan that may be invested in affiliated money market funds, other money market instruments and/or repurchase agreements. |
7 | Cash Equivalents include any investments in money market mutual funds and/or overnight repurchase agreements. |
8 | Assets, other than investments in securities and derivative contracts, less liabilities. See Statement of Assets and Liabilities. |
Principal Amount or Shares | Value | ||
ASSET-BACKED SECURITIES— 42.7% | |||
Auto Receivables— 24.4% | |||
$ 15,000,000 | AmeriCredit Automobile Receivables Trust 2017-2, Class D, 3.420%, 4/18/2023 | $15,133,252 | |
13,000,000 | AmeriCredit Automobile Receivables Trust 2017-3, Class D, 3.180%, 7/18/2023 | 13,202,666 | |
2,590,000 | AmeriCredit Automobile Receivables Trust 2019-3, Class D, 2.580%, 9/18/2025 | 2,688,586 | |
2,000,000 | AmeriCredit Automobile Receivables Trust 2020-2, Class C, 1.480%, 2/18/2026 | 2,033,382 | |
5,320,000 | AmeriCredit Automobile Receivables Trust 2020-2, Class D, 2.130%, 3/18/2026 | 5,468,937 | |
6,000,000 | AmeriCredit Automobile Receivables Trust 2020-3, Class C, 1.060%, 8/18/2026 | 6,055,135 | |
17,825,000 | AmeriCredit Automobile Receivables Trust 2020-3, Class D, 1.490%, 9/18/2026 | 17,989,865 | |
27,000,000 | AmeriCredit Automobile Receivables Trust 2021-1, Class D, 1.210%, 12/18/2026 | 26,946,084 | |
15,500,000 | AmeriCredit Automobile Receivables Trust 2021-2, Class C, 1.010%, 1/19/2027 | 15,545,833 | |
63,000,000 | BMW Vehicle Lease Trust 2021-2, Class A3, 0.330%, 12/26/2024 | 63,027,254 | |
16,175,000 | BMW Vehicle Owner Trust 2020-A, Class A3, 0.480%, 10/25/2024 | 16,238,036 | |
2,500,000 | Canadian Pacer Auto Receivable 2020-1A, Class A3, 1.830%, 7/19/2024 | 2,530,557 | |
18,002,000 | Canadian Pacer Auto Receivable 2021-1A, Class B, 1.120%, 12/21/2026 | 17,842,101 | |
7,000,000 | Capital One Prime Auto Receivables Trust 2019-1, Class A4, 2.560%, 10/15/2024 | 7,202,730 | |
292,434 | Capital One Prime Auto Receivables Trust 2020-1, Class A2, 1.640%, 6/15/2023 | 293,065 | |
29,000,000 | CarMax Auto Owner Trust 2021-1, Class A3, 0.340%, 12/15/2025 | 29,044,234 | |
9,500,000 | CarMax Auto Owner Trust 2021-1, Class B, 0.740%, 10/15/2026 | 9,428,272 | |
800,000 | CarMax Auto Owner Trust 2021-1, Class C, 0.940%, 12/15/2026 | 794,010 | |
1,750,000 | CarMax Auto Owner Trust 2021-1, Class D, 1.280%, 7/15/2027 | 1,743,527 | |
18,750,000 | 1 | CarMax Auto Owner Trust 2021-3, Class A2B, 0.193% (1-month USLIBOR +0.110%), 9/16/2024 | 18,789,564 |
7,000,000 | CarMax Auto Owner Trust 2021-3, Class B, 1.000%, 3/15/2027 | 6,968,310 | |
12,075,000 | CarMax Auto Owner Trust 2021-3, Class C, 1.250%, 5/17/2027 | 12,021,342��� | |
5,600,000 | CarMax Auto Owner Trust 2021-3, Class D, 1.500%, 1/18/2028 | 5,595,954 | |
37,000,000 | Carvana Auto Receivables Trust 2021-N3, Class A1, 0.350%, 6/12/2028 | 37,092,955 | |
2,700,000 | Carvana Auto Receivables Trust 2021-N3, Class N, 2.530%, 6/12/2028 | 2,710,656 |
Principal Amount or Shares | Value | ||
ASSET-BACKED SECURITIES— continued | |||
Auto Receivables— continued | |||
$ 2,893,187 | Carvana Auto Receivables Trust 2021-P1, Class N, 2.160%, 12/10/2027 | $2,901,282 | |
8,582,292 | Carvana Auto Receivables Trust 2021-P2, Class N, 1.880%, 5/10/2028 | 8,617,796 | |
10,100,000 | Carvana Auto Receivables Trust 2021-P3, Class N, 1.990%, 9/11/2028 | 10,126,443 | |
28,276,928 | Chase Auto Credit Linked Notes 2020-2, Class B, 0.840%, 2/25/2028 | 28,383,284 | |
2,406,489 | Chase Auto Credit Linked Notes 2020-2, Class C, 1.139%, 2/25/2028 | 2,419,565 | |
2,939,354 | Chase Auto Credit Linked Notes 2020-2, Class D, 1.487%, 2/25/2028 | 2,958,797 | |
6,451,875 | Chase Auto Credit Linked Notes 2021-1, Class D, 1.174%, 9/25/2028 | 6,476,923 | |
4,731,375 | Chase Auto Credit Linked Notes 2021-1, Class E, 2.365%, 9/25/2028 | 4,755,061 | |
21,263,072 | Chase Auto Credit Linked Notes 2021-3, Class B, 0.760%, 2/26/2029 | 21,252,119 | |
5,557,394 | Chase Auto Credit Linked Notes 2021-3, Class C, 0.860%, 2/26/2029 | 5,554,561 | |
2,512,908 | Chase Auto Credit Linked Notes 2021-3, Class E, 2.102%, 2/26/2029 | 2,512,665 | |
5,197,710 | Daimler Trucks Retail Trust 2020-1, Class A3, 1.220%, 9/15/2023 | 5,229,731 | |
635,000 | Drive Auto Receivables Trust 2019-4, Class C, 2.510%, 11/17/2025 | 642,929 | |
4,705,000 | Drive Auto Receivables Trust 2020-1, Class C, 2.360%, 3/16/2026 | 4,785,230 | |
8,600,000 | Drive Auto Receivables Trust 2020-1, Class D, 2.700%, 5/17/2027 | 8,831,511 | |
11,185,000 | Drive Auto Receivables Trust 2021-1, Class C, 1.020%, 6/15/2027 | 11,255,316 | |
6,750,000 | Drive Auto Receivables Trust 2021-2, Class A2, 0.360%, 5/15/2024 | 6,767,920 | |
42,000,000 | Drive Auto Receivables Trust 2021-2, Class B, 0.580%, 12/15/2025 | 42,150,713 | |
47,000,000 | Drive Auto Receivables Trust 2021-2, Class C, 0.870%, 10/15/2027 | 47,157,469 | |
32,870,000 | Enterprise Fleet Financing LLC 2021-1, Class A2, 0.440%, 12/21/2026 | 32,928,808 | |
7,000,000 | Ford Credit Auto Lease Trust 2020-A, Class B, 2.050%, 6/15/2023 | 7,098,577 | |
11,500,000 | Ford Credit Auto Lease Trust 2020-B, Class B, 1.000%, 11/15/2023 | 11,593,410 | |
6,750,000 | Ford Credit Auto Lease Trust 2020-B, Class C, 1.700%, 2/15/2025 | 6,864,338 | |
15,000,000 | Ford Credit Auto Lease Trust 2021-A, Class B, 0.470%, 5/15/2024 | 15,038,503 | |
5,000,000 | Ford Credit Auto Lease Trust 2021-A, Class C, 0.780%, 9/15/2025 | 5,011,591 | |
6,600,000 | Ford Credit Auto Owner Trust 2019-B, Class B, 2.400%, 11/15/2024 | 6,753,313 | |
5,000,000 | Ford Credit Auto Owner Trust 2019-B, Class C, 2.580%, 12/15/2025 | 5,117,982 | |
5,850,000 | Ford Credit Auto Owner Trust 2019-C, Class C, 2.250%, 5/15/2026 | 5,993,605 | |
1,244,374 | Ford Credit Auto Owner Trust 2020-B, Class A2A, 0.500%, 2/15/2023 | 1,246,880 | |
5,000,000 | Ford Credit Auto Owner Trust 2020-C, Class B, 0.790%, 8/15/2026 | 4,989,088 | |
4,280,000 | Ford Credit Auto Owner Trust 2020-C, Class C, 1.040%, 5/15/2028 | 4,289,364 | |
2,565,000 | Ford Credit Auto Owner Trust 2021-A, Class C, 0.830%, 8/15/2028 | 2,550,926 | |
2,763,000 | Ford Credit Floorplan Master Owner Trust 2019-1, Class A, 2.840%, 3/15/2024 | 2,800,876 | |
16,000,000 | Ford Credit Floorplan Master Owner Trust 2019-1, Class B, 3.040%, 3/15/2024 | 16,231,419 | |
5,000,000 | 1 | Ford Credit Floorplan Master Owner Trust 2019-3, Class A2, 0.683% (1-month USLIBOR +0.600%), 9/15/2024 | 5,034,734 |
14,000,000 | Ford Credit Floorplan Master Owner Trust 2020-1, Class B, 0.980%, 9/15/2025 | 14,144,889 |
Principal Amount or Shares | Value | ||
ASSET-BACKED SECURITIES— continued | |||
Auto Receivables— continued | |||
$ 14,500,000 | Ford Credit Floorplan Master Owner Trust 2020-1, Class C, 1.420%, 9/15/2025 | $14,659,145 | |
17,500,000 | Ford Credit Floorplan Master Owner Trust 2020-1, Class D, 2.120%, 9/15/2025 | 17,925,572 | |
3,340,000 | General Motors 2019-1, Class C, 3.060%, 4/15/2024 | 3,393,199 | |
9,480,000 | General Motors 2020-1, Class A, 0.680%, 8/15/2025 | 9,534,868 | |
2,450,000 | General Motors 2020-1, Class B, 1.030%, 8/15/2025 | 2,469,095 | |
1,440,000 | General Motors 2020-1, Class C, 1.480%, 8/15/2025 | 1,457,944 | |
13,000,000 | General Motors 2020-2, Class A, 0.690%, 10/15/2025 | 13,054,480 | |
5,750,000 | General Motors 2020-2, Class B, 0.960%, 10/15/2025 | 5,816,433 | |
4,000,000 | General Motors 2020-2, Class C, 1.310%, 10/15/2025 | 4,038,256 | |
6,180,783 | GM Financial Automobile Leasing Trust 2019-3, Class A4, 2.030%, 7/20/2023 | 6,204,270 | |
7,000,000 | GM Financial Automobile Leasing Trust 2020-1, Class D, 2.280%, 6/20/2024 | 7,097,091 | |
3,000,000 | GM Financial Automobile Leasing Trust 2020-2, Class C, 2.560%, 7/22/2024 | 3,079,523 | |
7,840,000 | GM Financial Automobile Leasing Trust 2020-2, Class D, 3.210%, 12/20/2024 | 8,092,271 | |
9,356,883 | 1 | GM Financial Automobile Leasing Trust 2020-3, Class A2B, 0.217% (1-month USLIBOR +0.130%), 11/21/2022 | 9,375,529 |
9,000,000 | GM Financial Automobile Leasing Trust 2020-3, Class D, 1.710%, 2/20/2025 | 9,135,760 | |
9,640,000 | GM Financial Automobile Leasing Trust 2021-1, Class C, 0.700%, 2/20/2025 | 9,645,462 | |
10,000,000 | GM Financial Automobile Leasing Trust 2021-1, Class D, 1.010%, 7/21/2025 | 10,044,087 | |
8,000,000 | GM Financial Automobile Leasing Trust 2021-2, Class C, 1.010%, 5/20/2025 | 8,022,807 | |
22,750,000 | GM Financial Automobile Leasing Trust 2021-3, Class C, 1.030%, 7/21/2025 | 22,774,172 | |
4,250,000 | GM Financial Securitized Term 2018-1, Class B, 2.570%, 7/17/2023 | 4,306,398 | |
3,275,000 | GM Financial Securitized Term 2018-4, Class C, 3.620%, 6/17/2024 | 3,367,083 | |
9,000,000 | GM Financial Securitized Term 2019-3, Class C, 2.620%, 1/16/2025 | 9,205,537 | |
3,350,000 | GM Financial Securitized Term 2020-3, Class B, 0.810%, 1/16/2026 | 3,370,664 | |
2,000,000 | GM Financial Securitized Term 2020-3, Class D, 1.910%, 9/16/2027 | 2,042,802 | |
8,400,000 | GM Financial Securitized Term 2021-1, Class A3, 0.350%, 10/16/2025 | 8,415,943 | |
1,675,000 | GM Financial Securitized Term 2021-1, Class B, 0.750%, 5/17/2027 | 1,672,762 | |
1,375,000 | GM Financial Securitized Term 2021-1, Class C, 1.040%, 5/17/2027 | 1,376,044 | |
4,250,000 | GM Financial Securitized Term 2021-3, Class B, 0.970%, 8/16/2027 | 4,252,451 | |
4,798,395 | Harley-Davidson Motorcycle Trust 2019-A, Class A3, 2.340%, 2/15/2024 | 4,839,842 |
Principal Amount or Shares | Value | ||
ASSET-BACKED SECURITIES— continued | |||
Auto Receivables— continued | |||
$ 5,560,000 | Harley-Davidson Motorcycle Trust 2019-A, Class A4, 2.390%, 11/15/2026 | $5,662,700 | |
6,500,000 | Honda Auto Receivables Owner Trust 2019-1, Class A4, 2.900%, 6/18/2024 | 6,633,074 | |
2,567,248 | Honda Auto Receivables Owner Trust 2019-2, Class A3, 2.520%, 6/21/2023 | 2,597,652 | |
4,375,000 | Hyundai Auto Lease Securitization Trust 2020-A, Class B, 2.120%, 5/15/2024 | 4,443,985 | |
6,100,000 | Hyundai Auto Lease Securitization Trust 2020-B, Class B, 0.810%, 10/15/2024 | 6,146,103 | |
30,000,000 | Hyundai Auto Lease Securitization Trust 2021-A, Class A3, 0.330%, 1/16/2024 | 30,087,681 | |
5,150,000 | Hyundai Auto Lease Securitization Trust 2021-A, Class B, 0.610%, 10/15/2025 | 5,168,539 | |
20,050,000 | Hyundai Auto Lease Securitization Trust 2021-B, Class B, 0.620%, 3/16/2026 | 20,049,685 | |
34,000,000 | Hyundai Auto Lease Securitization Trust 2021-C, Class B, 0.760%, 2/17/2026 | 34,001,975 | |
9,367,996 | Hyundai Auto Receivables Trust 2017-B, Class C, 2.440%, 5/15/2024 | 9,412,829 | |
16,000,000 | Hyundai Auto Receivables Trust 2019-A, Class C, 3.030%, 11/17/2025 | 16,604,906 | |
2,750,000 | Hyundai Auto Receivables Trust 2019-B, Class B, 2.210%, 4/15/2025 | 2,833,051 | |
4,900,000 | Hyundai Auto Receivables Trust 2019-B, Class C, 2.400%, 6/15/2026 | 5,081,912 | |
4,125,000 | Hyundai Auto Receivables Trust 2020-B, Class B, 0.940%, 12/15/2025 | 4,126,234 | |
6,353,000 | Hyundai Auto Receivables Trust 2020-B, Class C, 1.600%, 12/15/2026 | 6,455,799 | |
6,375,000 | Hyundai Auto Receivables Trust 2020-C, Class C, 1.080%, 12/15/2027 | 6,390,507 | |
9,330,000 | Hyundai Auto Receivables Trust 2021-B, Class B, 0.910%, 2/16/2027 | 9,276,758 | |
5,000,000 | Hyundai Auto Receivables Trust 2021-B, Class C, 1.120%, 2/15/2028 | 4,967,808 | |
11,100,000 | Mercedes-Benz Auto Lease Trust 2019-B, Class A4, 2.050%, 8/15/2025 | 11,237,155 | |
11,500,000 | Mercedes-Benz Auto Lease Trust 2020-B, Class A4, 0.500%, 6/15/2026 | 11,550,529 | |
1,894,723 | Mercedes-Benz Auto Receivables Trust 2020-1, Class A2, 0.460%, 3/15/2023 | 1,898,772 | |
5,330,000 | 1 | NextGear Floorplan Master Owner Trust 2018-2A, Class A1, 0.683% (1-month USLIBOR +0.600%), 10/15/2023 | 5,341,138 |
33,000,000 | NextGear Floorplan Master Owner Trust 2019-1A, Class B, 3.460%, 2/15/2024 | 33,431,914 | |
18,000,000 | NextGear Floorplan Master Owner Trust 2019-2A, Class B, 2.300%, 10/15/2024 | 18,363,362 | |
4,000,000 | NextGear Floorplan Master Owner Trust 2020-1A, Class B, 1.790%, 2/15/2025 | 4,070,158 | |
20,000,000 | NextGear Floorplan Master Owner Trust 2021-1A, Class A, 0.850%, 7/15/2026 | 20,086,224 | |
1,786,280 | Nissan Auto Receivables Owner 2020-B, Class A2A, 0.470%, 10/17/2022 | 1,789,651 |
Principal Amount or Shares | Value | ||
ASSET-BACKED SECURITIES— continued | |||
Auto Receivables— continued | |||
$ 4,000,000 | Nissan Auto Receivables Owner 2020-B, Class A3, 0.550%, 7/15/2024 | $4,016,253 | |
26,225,000 | 1 | Nissan Master Owner Trust Receivables 2019-A, Class A, 0.643% (1-month USLIBOR +0.560%), 2/15/2024 | 26,321,209 |
20,000,000 | 1 | Nissan Master Owner Trust Receivables 2019-B, Class A, 0.513% (1-month USLIBOR +0.430%), 11/15/2023 | 20,042,280 |
1,750,000 | Santander Consumer Auto Receivables 2021-AA, Class E, 3.280%, 3/15/2027 | 1,785,348 | |
11,892,272 | Santander Consumer Auto Receivables 2021-AA, Class A2, 0.230%, 11/15/2023 | 11,915,833 | |
1,500,000 | Santander Consumer Auto Receivables 2021-AA, Class D, 1.570%, 1/15/2027 | 1,515,208 | |
4,150,000 | Santander Consumer Auto Receivables Trust 2020-B, Class B, 0.770%, 12/15/2025 | 4,170,645 | |
2,000,000 | Santander Consumer Auto Receivables Trust 2020-B, Class C, 1.290%, 4/15/2026 | 2,023,327 | |
3,050,000 | Santander Consumer Auto Receivables Trust 2020-B, Class D, 2.140%, 12/15/2026 | 3,131,829 | |
7,709,168 | Santander Drive Auto Receivables Trust 2019-2, Class C, 2.900%, 10/15/2024 | 7,789,296 | |
17,550,000 | Santander Drive Auto Receivables Trust 2019-3, Class D, 2.680%, 10/15/2025 | 17,979,406 | |
10,000,000 | Santander Drive Auto Receivables Trust 2020-2, Class D, 2.220%, 9/15/2026 | 10,201,693 | |
32,125,000 | Santander Drive Auto Receivables Trust 2020-3, Class C, 1.120%, 1/15/2026 | 32,430,277 | |
4,100,000 | Santander Drive Auto Receivables Trust 2020-3, Class D, 1.640%, 11/16/2026 | 4,170,681 | |
15,244,000 | Santander Drive Auto Receivables Trust 2020-4, Class D, 1.480%, 1/15/2027 | 15,492,992 | |
18,450,000 | Santander Drive Auto Receivables Trust 2021-1, Class A3, 0.320%, 9/16/2024 | 18,522,003 | |
55,000,000 | Santander Drive Auto Receivables Trust 2021-1, Class D, 1.130%, 11/16/2026 | 55,313,335 | |
41,680,000 | Santander Drive Auto Receivables Trust 2021-3, Class B, 0.600%, 12/15/2025 | 41,854,364 | |
33,000,000 | Santander Drive Auto Receivables Trust 2021-3, Class C, 0.950%, 9/15/2027 | 33,060,756 | |
34,000,000 | Santander Drive Auto Receivables Trust 2021-3, Class D, 1.330%, 9/15/2027 | 34,068,507 | |
14,000,000 | Santander Retail Auto Lease Trust 2019-A, Class D, 3.660%, 5/20/2024 | 14,224,970 | |
985,000 | Santander Retail Auto Lease Trust 2019-B, Class B, 2.580%, 8/21/2023 | 1,002,316 | |
15,600,000 | Santander Retail Auto Lease Trust 2019-B, Class C, 2.770%, 8/21/2023 | 15,856,812 | |
5,260,000 | Santander Retail Auto Lease Trust 2020-A, Class D, 2.520%, 11/20/2024 | 5,398,392 |
Principal Amount or Shares | Value | ||
ASSET-BACKED SECURITIES— continued | |||
Auto Receivables— continued | |||
$ 5,750,000 | Santander Retail Auto Lease Trust 2020-B, Class C, 1.180%, 12/20/2024 | $5,801,941 | |
20,000,000 | Santander Retail Auto Lease Trust 2020-B, Class D, 1.980%, 10/20/2025 | 20,361,888 | |
15,000,000 | Santander Retail Auto Lease Trust 2021-A, Class B, 0.920%, 3/20/2026 | 15,054,682 | |
40,000,000 | Santander Retail Auto Lease Trust 2021-A, Class D, 1.380%, 3/22/2027 | 40,044,592 | |
25,500,000 | Santander Retail Auto Lease Trust 2021-B, Class C, 1.100%, 6/20/2025 | 25,539,030 | |
55,825,000 | Santander Retail Auto Lease Trust 2021-B, Class D, 1.410%, 11/20/2025 | 55,894,413 | |
52,000,000 | Santander Retail Auto Lease Trust 2021-C, Class D, 1.390%, 8/20/2026 | 52,067,150 | |
22,000,000 | Securitized Term Auto Receivables Trust 2019-1A, Class A4, 3.141%, 11/27/2023 | 22,477,655 | |
16,760,000 | Tesla Auto Lease Trust 2019-A, Class A4, 2.200%, 11/21/2022 | 17,067,995 | |
20,670,000 | Tesla Auto Lease Trust 2020-A, Class B, 1.180%, 1/22/2024 | 20,910,146 | |
4,650,000 | Tesla Auto Lease Trust 2020-A, Class D, 2.330%, 2/20/2024 | 4,768,071 | |
13,000,000 | Tesla Auto Lease Trust 2021-A, Class C, 1.180%, 3/20/2025 | 13,043,073 | |
18,150,000 | Tesla Auto Lease Trust 2021-A, Class D, 1.340%, 3/20/2025 | 18,284,210 | |
10,000,000 | Tesla Auto Lease Trust 2021-A, Class E, 2.640%, 3/20/2025 | 10,123,081 | |
17,350,000 | Tesla Auto Lease Trust 2021-B, Class B, 0.910%, 9/22/2025 | 17,320,475 | |
16,000,000 | Tesla Auto Lease Trust 2021-B, Class C, 1.120%, 9/22/2025 | 16,053,383 | |
6,000,000 | Tesla Auto Lease Trust 2021-B, Class D, 1.320%, 9/22/2025 | 5,987,248 | |
2,753,679 | Toyota Auto Receivables Owner 2019-B, Class A3, 2.570%, 8/15/2023 | 2,784,350 | |
4,546,959 | Toyota Auto Receivables Owner Trust 2019-C, Class A3, 1.910%, 9/15/2023 | 4,588,634 | |
10,000,000 | Toyota Auto Receivables Owner Trust 2020-C, Class A3, 0.440%, 10/15/2024 | 10,037,302 | |
52,000,000 | Toyota Lease Owner Trust 2021-B, Class A4, 0.450%, 11/20/2025 | 51,956,824 | |
9,425,000 | Volkswagen Auto Lease Trust 2019-A, Class A4, 2.020%, 8/20/2024 | 9,523,607 | |
34,600,000 | Volkswagen Auto Lease Trust 2020-A, Class A3, 0.390%, 1/22/2024 | 34,717,581 | |
12,000,000 | Volkswagen Auto Lease Trust 2020-A, Class A4, 0.450%, 7/21/2025 | 12,015,457 | |
2,250,000 | World Omni Auto Receivables Trust 2017-B, Class B, 2.370%, 5/15/2024 | 2,259,363 | |
1,593,000 | World Omni Auto Receivables Trust 2019-A, Class D, 2.590%, 12/15/2025 | 1,627,733 | |
13,500,000 | World Omni Auto Receivables Trust 2019-C, Class B, 2.200%, 12/15/2025 | 13,808,394 | |
8,100,000 | World Omni Auto Receivables Trust 2019-C, Class C, 2.400%, 6/15/2026 | 8,278,688 | |
1,400,000 | World Omni Auto Receivables Trust 2020-A, Class C, 1.640%, 8/17/2026 | 1,417,834 | |
1,594,297 | 1 | World Omni Auto Receivables Trust 2020-B, Class A2B, 0.333% (1-month USLIBOR +0.250%), 7/17/2023 | 1,597,538 |
Principal Amount or Shares | Value | ||
ASSET-BACKED SECURITIES— continued | |||
Auto Receivables— continued | |||
$ 4,769,363 | World Omni Auto Receivables Trust 2020-C, Class A2, 0.350%, 12/15/2023 | $4,784,052 | |
5,000,000 | World Omni Auto Receivables Trust 2020-C, Class B, 0.870%, 10/15/2026 | 4,997,875 | |
2,650,000 | World Omni Auto Receivables Trust 2020-C, Class C, 1.390%, 5/17/2027 | 2,688,143 | |
6,430,000 | World Omni Auto Receivables Trust 2021-A, Class B, 0.640%, 12/15/2026 | 6,411,412 | |
1,685,000 | World Omni Auto Receivables Trust 2021-A, Class C, 0.890%, 8/16/2027 | 1,673,741 | |
3,500,000 | World Omni Auto Receivables Trust 2021-A, Class C, 1.090%, 11/15/2027 | 3,497,296 | |
4,500,000 | World Omni Auto Receivables Trust 2021-B C, Class C, 1.290%, 12/15/2027 | 4,527,811 | |
5,000,000 | World Omni Auto Receivables Trust 2021-B, Class B, 1.040%, 6/15/2027 | 5,016,537 | |
21,775,000 | World Omni Auto Receivables Trust 2021-C, Class A2, 0.220%, 9/16/2024 | 21,800,573 | |
5,000,000 | World Omni Auto Receivables Trust 2021-C, Class B, 0.840%, 9/15/2027 | 4,969,410 | |
3,000,000 | World Omni Auto Receivables Trust 2021-C, Class C, 1.060%, 4/17/2028 | 2,983,962 | |
1,771,805 | World Omni Auto Receivables Trust, Class A3, 3.040%, 5/15/2024 | 1,793,308 | |
5,000,000 | World Omni Automobile Lease Securitization Trust 2019-A, Class B, 3.240%, 7/15/2024 | 5,017,120 | |
6,000,000 | World Omni Automobile Lease Securitization Trust 2019-B, Class B, 2.130%, 2/18/2025 | 6,078,878 | |
10,645,000 | World Omni Automobile Lease Securitization Trust 2020-A, Class B, 1.930%, 6/16/2025 | 10,818,537 | |
5,700,000 | World Omni Automobile Lease Securitization Trust 2020-B, Class B, 0.700%, 2/17/2026 | 5,724,812 | |
5,760,000 | World Omni Automobile Lease Securitization Trust 2021-A, Class B, 0.750%, 11/16/2026 | 5,768,434 | |
13,578,234 | World Omni Select Auto Trust 2019-A, Class A3, 2.000%, 8/15/2024 | 13,675,443 | |
5,000,000 | World Omni Select Auto Trust 2019-A, Class C, 2.380%, 12/15/2025 | 5,109,997 | |
2,067,570 | World Omni Select Auto Trust 2020-A, Class A2, 0.470%, 6/17/2024 | 2,072,901 | |
9,250,000 | World Omni Select Auto Trust 2020-A, Class B, 0.840%, 6/15/2026 | 9,305,053 | |
7,750,000 | World Omni Select Auto Trust 2020-A, Class C, 1.250%, 10/15/2026 | 7,827,163 | |
9,000,000 | World Omni Select Auto Trust 2020-A, Class D, 1.700%, 10/15/2026 | 9,110,811 | |
9,250,000 | World OMNI Select Auto Trust 2021-A, Class B, 0.850%, 8/16/2027 | 9,236,363 | |
5,000,000 | World OMNI Select Auto Trust 2021-A, Class D, 1.440%, 11/15/2027 | 4,988,172 | |
TOTAL | 2,260,811,390 |
Principal Amount or Shares | Value | ||
ASSET-BACKED SECURITIES— continued | |||
Credit Card— 4.8% | |||
$ 8,200,000 | 1 | American Express Credit Account Master Trust 2017-2, Class A, 0.533% (1-month USLIBOR +0.450%), 9/16/2024 | $8,223,698 |
6,679,000 | 1 | American Express Credit Account Master Trust 2017-5, Class B, 0.663% (1-month USLIBOR +0.580%), 2/18/2025 | 6,708,275 |
12,000,000 | 1 | American Express Credit Account Master Trust 2018-3, Class A, 0.403% (1-month USLIBOR +0.320%), 10/15/2025 | 12,066,084 |
11,537,000 | 1 | American Express Credit Account Master Trust 2018-5, Class A, 0.423% (1-month USLIBOR +0.340%), 12/15/2025 | 11,605,944 |
10,000,000 | 1 | American Express Credit Account Master Trust 2018-5, Class B, 0.633% (1-month USLIBOR +0.550%), 12/15/2025 | 10,082,664 |
3,600,000 | 1 | American Express Credit Account Master Trust 2018-7, Class A, 0.443% (1-month USLIBOR +0.360%), 2/17/2026 | 3,620,406 |
16,613,000 | 1 | American Express Credit Account Master Trust 2018-7, Class B, 0.653% (1-month USLIBOR +0.570%), 2/17/2026 | 16,663,926 |
18,679,000 | 1 | American Express Credit Account Master Trust 2018-9, Class B, 0.673% (1-month USLIBOR +0.590%), 4/15/2026 | 18,852,401 |
4,202,000 | American Express Credit Account Master Trust 2019-2, Class B, 2.860%, 11/15/2024 | 4,267,044 | |
1,200,000 | 1 | Capital One Multi-Asset Execution Trust 2017-A2, Class A2, 0.493% (1-month USLIBOR +0.410%), 1/15/2025 | 1,203,693 |
4,700,000 | 1 | Capital One Multi-Asset Execution Trust 2018-A2, Class A2, 0.433% (1-month USLIBOR +0.350%), 3/16/2026 | 4,726,925 |
50,000,000 | Cards II Trust 2021-1A, Class A, 0.602%, 4/15/2027 | 50,089,050 | |
14,000,000 | Cards II Trust 2021-1A, Class B, 0.931%, 4/15/2027 | 13,988,625 | |
6,118,000 | Cards II Trust 2021-1A, Class C, 1.200%, 4/15/2027 | 6,113,131 | |
10,000,000 | 1 | Citibank Credit Card Issuance Trust 2016-A3, Class A3, 0.572% (1-month USLIBOR +0.490%), 12/7/2023 | 10,020,937 |
10,800,000 | 1 | Citibank Credit Card Issuance Trust 2018-A2, Class A2, 0.417% (1-month USLIBOR +0.330%), 1/20/2025 | 10,861,887 |
20,250,000 | 1 | Citibank Credit Card Issuance Trust 2018-A4, Class A4, 0.422% (1-month USLIBOR +0.340%), 6/7/2025 | 20,368,084 |
6,250,000 | 1 | Discover Card Execution Note Trust 2017-A1, Class A1, 0.573% (1-month USLIBOR +0.490%), 7/15/2024 | 6,266,567 |
14,700,000 | 1 | Discover Card Execution Note Trust 2017-A7, Class A7, 0.443% (1-month USLIBOR +0.360%), 4/15/2025 | 14,769,344 |
14,655,000 | 1 | Discover Card Execution Note Trust 2018-A2, Class A2, 0.413% (1-month USLIBOR +0.330%), 8/15/2025 | 14,736,156 |
6,250,000 | 1 | Discover Card Execution Note Trust 2018-A6, Class A6, 0.473% (1-month USLIBOR +0.390%), 3/15/2026 | 6,299,678 |
4,500,000 | Discover Card Execution Note Trust 2019-A3, Class A, 1.890%, 10/15/2024 | 4,584,721 | |
20,000,000 | 1 | Evergreen Credit Card Trust 2019-3, Class A, 0.453% (1-month USLIBOR +0.370%), 10/16/2023 | 20,026,650 |
13,000,000 | Evergreen Credit Card Trust 2019-3, Class B, 2.360%, 10/16/2023 | 13,031,364 |
Principal Amount or Shares | Value | ||
ASSET-BACKED SECURITIES— continued | |||
Credit Card— continued | |||
$ 3,369,000 | Evergreen Credit Card Trust 2019-3, Class C, 2.710%, 10/16/2023 | $3,377,385 | |
4,100,000 | Evergreen Credit Card Trust Series 2019-2, Class B, 2.270%, 9/15/2024 | 4,176,912 | |
7,000,000 | 1 | First National Master Note Trust 2018-1, Class A, 0.543% (1-month USLIBOR +0.460%), 10/15/2024 | 7,009,507 |
21,500,000 | 1 | Golden Credit Card Trust 2017-4A, Class A, 0.603% (1-month USLIBOR +0.520%), 7/15/2024 | 21,607,485 |
7,000,000 | 1 | Golden Credit Card Trust 2019-2A, Class A, 0.433% (1-month USLIBOR +0.350%), 10/15/2023 | 7,009,477 |
8,000,000 | Golden Credit Card Trust 2021-1A, Class B, 1.440%, 8/15/2028 | 7,951,338 | |
4,250,000 | Golden Credit Card Trust 2021-1A, Class C, 1.740%, 8/15/2028 | 4,236,025 | |
23,995,000 | 1 | Master Credit Card Trust 2018-1A, Class A, 0.573% (1-month USLIBOR +0.490%), 7/21/2024 | 24,145,130 |
7,648,000 | Master Credit Card Trust 2018-1A, Class B, 3.245%, 7/21/2024 | 7,935,192 | |
4,237,000 | Master Credit Card Trust 2018-1A, Class C, 3.737%, 7/21/2024 | 4,392,461 | |
43,200,000 | Master Credit Card Trust 2021-1A, Class A, 0.530%, 11/21/2025 | 43,150,350 | |
9,000,000 | Master Credit Card Trust 2021-1A, Class C, 1.060%, 11/21/2025 | 8,975,974 | |
1,800,000 | 1 | Trillium Credit Card Trust II 2020-1A, Class A, 0.456% (1-month USLIBOR +0.370%), 12/26/2024 | 1,803,812 |
4,240,000 | Trillium Credit Card Trust II 2020-1A, Class B, 2.331%, 12/26/2024 | 4,264,269 | |
TOTAL | 439,212,571 | ||
Equipment Lease— 4.4% | |||
1,500,000 | CNH Equipment Trust 2019-A, Class B, 3.340%, 7/15/2026 | 1,555,715 | |
3,600,000 | CNH Equipment Trust 2019-B, Class B, 2.870%, 11/16/2026 | 3,718,179 | |
4,940,000 | CNH Equipment Trust 2020-A, Class A3, 1.160%, 6/16/2025 | 4,989,526 | |
2,200,000 | CNH Equipment Trust 2020-A, Class B, 2.300%, 10/15/2027 | 2,279,217 | |
10,050,000 | CNH Equipment Trust 2021-A, Class B, 0.970%, 6/15/2028 | 10,057,969 | |
4,500,000 | Dell Equipment Finance Trust 2018-2, Class D, 3.970%, 10/22/2024 | 4,532,872 | |
8,000,000 | Dell Equipment Finance Trust 2019-1, Class D, 3.450%, 3/24/2025 | 8,083,402 | |
6,000,000 | Dell Equipment Finance Trust 2019-2, Class D, 2.480%, 4/22/2025 | 6,090,917 | |
5,000,000 | Dell Equipment Finance Trust 2020-1, Class D, 5.920%, 3/23/2026 | 5,270,236 | |
4,834,000 | Dell Equipment Finance Trust 2020-2, Class B, 0.920%, 11/22/2023 | 4,864,984 | |
2,350,000 | Dell Equipment Finance Trust 2020-2, Class C, 1.370%, 1/22/2024 | 2,381,523 | |
3,380,000 | Dell Equipment Finance Trust 2020-2, Class D, 1.920%, 3/23/2026 | 3,449,510 | |
12,280,000 | Dell Equipment Finance Trust 2021-1, Class B, 0.710%, 5/22/2026 | 12,301,058 | |
17,617,000 | Dell Equipment Finance Trust 2021-1, Class C, 0.810%, 5/22/2026 | 17,661,064 | |
22,518,000 | Dell Equipment Finance Trust 2021-1, Class D, 1.030%, 11/23/2026 | 22,622,141 | |
13,000,000 | Dell Equipment Finance Trust 2021-2, Class B, 0.810%, 12/22/2026 | 12,967,304 | |
10,500,000 | Dell Equipment Finance Trust 2021-2, Class C, 0.940%, 12/22/2026 | 10,503,558 | |
9,000,000 | Dell Equipment Finance Trust 2021-2, Class D, 1.210%, 6/22/2027 | 8,931,463 | |
2,335,000 | DLL Securitization Trust 2019-DA1, Class A4, 2.920%, 4/20/2027 | 2,391,631 |
Principal Amount or Shares | Value | ||
ASSET-BACKED SECURITIES— continued | |||
Equipment Lease— continued | |||
$ 11,848,142 | DLL Securitization Trust 2019-MA2, Class A3, 2.340%, 9/20/2023 | $11,956,914 | |
13,251,000 | DLL Securitization Trust 2019-MA2, Class A4, 2.390%, 4/20/2027 | 13,528,820 | |
3,200,000 | Great America Leasing Receivables 2018-1, Class B, 2.990%, 6/17/2024 | 3,218,387 | |
7,500,000 | Great America Leasing Receivables 2019-1, Class B, 3.370%, 2/18/2025 | 7,781,162 | |
10,800,000 | Great America Leasing Receivables 2020-1 old, Class B, 2.000%, 2/16/2026 | 11,098,763 | |
27,500,000 | Great America Leasing Receivables 2021-1, Class A2, 0.270%, 6/15/2023 | 27,553,169 | |
2,610,000 | Great America Leasing Receivables 2021-1, Class B, 0.720%, 12/15/2026 | 2,588,653 | |
2,750,000 | HPEFS Equipment Trust 2019-1, Class D, 2.720%, 9/20/2029 | 2,806,201 | |
11,650,000 | HPEFS Equipment Trust 2020-1A, Class C, 2.030%, 2/20/2030 | 11,803,012 | |
2,750,000 | HPEFS Equipment Trust 2020-1A, Class D, 2.260%, 2/20/2030 | 2,806,809 | |
2,500,000 | HPEFS Equipment Trust 2020-2A, Class A3, 0.690%, 7/22/2030 | 2,511,415 | |
8,000,000 | HPEFS Equipment Trust 2020-2A, Class D, 2.790%, 7/22/2030 | 8,275,617 | |
25,000,000 | HPEFS Equipment Trust 2021-1A, Class B, 0.570%, 3/20/2031 | 25,015,935 | |
19,640,000 | HPEFS Equipment Trust 2021-1A, Class C, 0.750%, 3/20/2031 | 19,666,866 | |
21,250,000 | HPEFS Equipment Trust 2021-1A, Class D, 1.030%, 3/20/2031 | 21,244,456 | |
15,600,000 | HPEFS Equipment Trust 2021-2A, Class C, 0.880%, 9/20/2028 | 15,590,696 | |
11,200,000 | HPEFS Equipment Trust 2021-2A, Class D, 1.290%, 3/20/2029 | 11,178,484 | |
50,845 | John Deere Owner Trust 2018-B, Class A3, 3.080%, 11/15/2022 | 51,013 | |
1,288,567 | John Deere Owner Trust 2020-B, Class A2, 0.410%, 3/15/2023 | 1,290,638 | |
1,750,000 | Kubota Credit Owner Trust 2020-1A, Class A3, 1.960%, 3/15/2024 | 1,780,916 | |
4,521,987 | Kubota Credit Owner Trust 2020-2A, Class A2, 0.410%, 6/15/2023 | 4,532,211 | |
7,590,070 | MMAF Equipment Finance LLC 2020-A, Class A2, 0.740%, 4/9/2024 | 7,629,045 | |
18,484,327 | MMAF Equipment Finance LLC 2020-BA, Class A2, 0.380%, 8/14/2023 | 18,526,256 | |
3,679,000 | Transportation Finance Equipment Trust 2019-1, Class B, 2.060%, 5/23/2024 | 3,773,041 | |
2,500,000 | Transportation Finance Equipment Trust 2019-1, Class C, 2.190%, 8/23/2024 | 2,539,977 | |
3,000,000 | Transportation Finance Equipment Trust 2019-1, Class D, 2.570%, 1/25/2027 | 3,043,611 | |
4,770,000 | Volvo Financial Equipment LLC 2019-1A, Class C, 3.480%, 4/15/2026 | 4,894,836 | |
4,200,000 | Volvo Financial Equipment LLC 2019-2A, Class B, 2.280%, 11/15/2024 | 4,325,138 | |
1,464,000 | Volvo Financial Equipment LLC 2019-2A, Class C, 2.500%, 5/17/2027 | 1,503,790 | |
13,488,548 | Volvo Financial Equipment LLC 2020-1A, Class A2, 0.370%, 4/17/2023 | 13,521,712 | |
TOTAL | 410,689,812 |
Principal Amount or Shares | Value | ||
ASSET-BACKED SECURITIES— continued | |||
Financial Institution - Banking— 0.3% | |||
$ 10,000,000 | JPMorgan Chase Bank, NA - CACLN 2021-2, Class B, 0.889%, 12/26/2028 | $10,026,655 | |
8,150,000 | JPMorgan Chase Bank, NA - CACLN 2021-2, Class C, 0.969%, 12/26/2028 | 8,172,931 | |
7,250,000 | JPMorgan Chase Bank, NA - CACLN 2021-2, Class D, 1.138%, 12/26/2028 | 7,274,745 | |
4,000,000 | JPMorgan Chase Bank, NA - CACLN 2021-2, Class E, 2.280%, 12/26/2028 | 4,015,983 | |
TOTAL | 29,490,314 | ||
Home Equity Loan— 0.0% | |||
28,887 | 1 | Countrywide Asset Backed Certificates 2004-4, Class A, 0.826% (1-month USLIBOR +0.740%), 8/25/2034 | 25,979 |
109,416 | 2 | NC Finance Trust 1999-1, Class D, 8.750%, 1/25/2029 | 0 |
2,532,132 | 2 | Washington Mutual Asset-Backed Certificates NIM Notes 2007-WM1, Class N1, 6.750%, 1/25/2047 | 0 |
TOTAL | 25,979 | ||
Manufactured Housing— 0.0% | |||
4,102 | Indymac Manufactured Housing Contract 1997-1, Class A3, 6.610%, 2/25/2028 | 4,118 | |
Other— 8.8% | |||
1,891,743 | ARI Fleet Lease Trust 2019-A, Class A2A, 2.410%, 11/15/2027 | 1,907,274 | |
2,750,000 | ARI Fleet Lease Trust 2021-A, Class B, 1.130%, 3/15/2030 | 2,762,513 | |
2,546,000 | ARI Fleet Lease Trust 2021-A, Class C, 1.450%, 3/15/2030 | 2,564,800 | |
3,277,754 | 1 | Chesapeake Funding II LLC 2018-2A, Class A2, 0.453% (1-month USLIBOR +0.370%), 8/15/2030 | 3,288,048 |
5,525,000 | Chesapeake Funding II LLC 2018-2A, Class B, 3.520%, 8/15/2030 | 5,631,833 | |
7,000,000 | Chesapeake Funding II LLC 2018-2A, Class C, 3.720%, 8/15/2030 | 7,154,396 | |
4,000,000 | Chesapeake Funding II LLC 2018-2A, Class D, 4.060%, 8/15/2030 | 4,088,705 | |
6,200,000 | Chesapeake Funding II LLC 2019-1A, Class B, 3.110%, 4/15/2031 | 6,358,298 | |
3,800,000 | Chesapeake Funding II LLC 2019-1A, Class C, 3.360%, 4/15/2031 | 3,895,234 | |
4,000,000 | Chesapeake Funding II LLC 2019-1A, Class D, 3.800%, 4/15/2031 | 4,123,974 | |
8,036,034 | Chesapeake Funding II LLC 2020-1A, Class A1, 0.870%, 8/16/2032 | 8,087,907 | |
1,840,000 | Chesapeake Funding II LLC 2020-1A, Class B, 1.240%, 8/16/2032 | 1,862,653 | |
4,838,000 | Chesapeake Funding II LLC 2020-1A, Class C, 2.140%, 8/16/2032 | 4,956,247 | |
1,350,000 | Chesapeake Funding II LLC 2020-1A, Class D, 2.830%, 8/16/2032 | 1,393,019 | |
5,300,000 | Chesapeake Funding II LLC 2021-1A, Class B, 0.990%, 4/15/2033 | 5,303,276 | |
2,000,000 | Chesapeake Funding II LLC 2021-1A, Class C, 1.230%, 4/15/2033 | 2,001,241 | |
2,550,000 | Chesapeake Funding II LLC 2021-1A, Class D, 1.520%, 4/15/2033 | 2,550,672 | |
22,250,000 | DLLAD LLC 2021-1A, Class A2, 0.350%, 9/20/2024 | 22,275,541 | |
19,000,000 | DLLAD LLC 2021-1A, Class A3, 0.640%, 9/21/2026 | 18,912,058 | |
1,772,182 | Enterprise Fleet Financing LLC 2019-1, Class A2, 2.980%, 10/20/2024 | 1,782,139 |
Principal Amount or Shares | Value | ||
ASSET-BACKED SECURITIES— continued | |||
Other— continued | |||
$ 3,718,608 | Enterprise Fleet Financing LLC 2019-2, Class A2, 2.290%, 2/20/2025 | $3,763,501 | |
2,000,000 | Enterprise Fleet Financing LLC 2019-2, Class A3, 2.380%, 2/20/2025 | 2,057,606 | |
3,371,596 | Enterprise Fleet Financing LLC 2019-3, Class A2, 2.060%, 5/20/2025 | 3,416,248 | |
3,251,314 | Enterprise Fleet Financing LLC 2020-1, Class A2, 1.780%, 12/22/2025 | 3,292,528 | |
38,000,000 | Enterprise Fleet Financing LLC 2021-2, Class A2, 0.480%, 5/20/2027 | 38,009,895 | |
2,898,170 | 1 | Mississippi Higher Education Assistance Corp. 2014-1, Class A1, 0.766% (1-month USLIBOR +0.680%), 10/25/2035 | 2,918,051 |
7,809,726 | 1 | Navient Student Loan Trust 2019-D, Class A2B, 1.133% (1-month USLIBOR +1.050%), 12/15/2059 | 7,909,236 |
814,797 | 1 | Navient Student Loan Trust 2020-A, Class A1, 0.433% (1-month USLIBOR +0.350%), 11/15/2068 | 819,023 |
3,171,447 | 1 | Navient Student Loan Trust 2020-CA, Class A1, 0.833% (1-month USLIBOR +0.750%), 11/15/2068 | 3,189,321 |
16,767,227 | Navient Student Loan Trust 2020-GA, Class A, 1.170%, 9/16/2069 | 16,926,398 | |
14,417,758 | Navient Student Loan Trust 2020-HA, Class A, 1.310%, 1/15/2069 | 14,563,351 | |
27,735,628 | Navient Student Loan Trust 2021-A, Class A, 0.840%, 5/15/2069 | 27,844,091 | |
71,366,063 | Navient Student Loan Trust 2021-BA, Class A, 0.940%, 7/15/2069 | 71,585,207 | |
53,772,724 | Navient Student Loan Trust 2021-CA, Class A, 1.060%, 10/15/2069 | 54,147,563 | |
53,750,000 | Navient Student Loan Trust 2021-FA, Class A, 1.110%, 2/18/2070 | 53,962,780 | |
9,800,000 | 1 | Navistar Financial Dealer Note Master Trust 2020-1, Class A, 1.036% (1-month USLIBOR +0.950%), 7/25/2025 | 9,860,565 |
5,500,000 | 1 | Navistar Financial Dealer Note Master Trust 2020-1, Class B, 1.436% (1-month USLIBOR +1.350%), 7/25/2025 | 5,547,709 |
3,250,000 | 1 | Navistar Financial Dealer Note Master Trust 2020-1, Class D, 2.986% (1-month USLIBOR +2.900%), 7/25/2025 | 3,288,795 |
11,200,000 | 1 | Nelnet Student Loan Trust 2021-CA, Class AFL, 0.828% (1-month USLIBOR +0.740%), 4/20/2062 | 11,255,993 |
11,000,000 | 1 | PFS Financing Corp. 2019-A, Class A1, 0.633% (1-month USLIBOR +0.550%), 4/15/2024 | 11,078,707 |
10,750,000 | PFS Financing Corp. 2019-A, Class B, 3.130%, 4/15/2024 | 10,907,353 | |
2,000,000 | PFS Financing Corp. 2019-C, Class B, 2.420%, 10/15/2024 | 2,046,236 | |
10,000,000 | PFS Financing Corp. 2020-B, Class A, 1.210%, 6/15/2024 | 10,116,595 | |
19,296,000 | PFS Financing Corp. 2020-E, Class A, 1.000%, 10/15/2025 | 19,539,008 | |
4,000,000 | PFS Financing Corp. 2020-E, Class B, 1.570%, 10/15/2025 | 4,057,216 | |
2,900,000 | PFS Financing Corp. 2020-F, Class B, 1.420%, 8/15/2024 | 2,925,220 | |
7,500,000 | PFS Financing Corp. 2020-G, Class A, 0.970%, 2/15/2026 | 7,576,458 | |
4,915,000 | PFS Financing Corp. 2020-G, Class B, 1.570%, 2/15/2026 | 4,983,011 | |
35,410,000 | PFS Financing Corp. 2021-A, Class A, 0.710%, 4/15/2026 | 35,485,802 | |
10,875,000 | PFS Financing Corp. 2021-A, Class B, 0.960%, 4/15/2026 | 10,908,791 | |
38,000,000 | PFS Financing Corp. 2021-B, Class A, 0.775%, 8/15/2026 | 38,044,091 | |
4,500,000 | PFS Financing Corp. 2021-B, Class B, 1.095%, 8/15/2026 | 4,495,005 |
Principal Amount or Shares | Value | ||
ASSET-BACKED SECURITIES— continued | |||
Other— continued | |||
$ 3,500,485 | Public Service New Hampshire 2018-1, Class A1, 3.094%, 2/1/2026 | $3,635,212 | |
5,138,970 | Sierra Receivables Funding Co. 2020-2A, Class A, 1.330%, 7/20/2037 | 5,182,293 | |
146,597 | 1 | SLM Student Loan Trust 2011-2, Class A1, 0.686% (1-month USLIBOR +0.600%), 11/25/2027 | 146,944 |
720,071 | 1 | SMB Private Education Loan Tru 2020-A, Class A1, 0.383% (1-month USLIBOR +0.300%), 3/15/2027 | 723,667 |
15,025,000 | 1 | SMB Private Education Loan Trust 2021-D, Class A1B, 0.683% (1-month USLIBOR +0.600%), 3/17/2053 | 15,116,531 |
406,266 | 1 | Social Professional Loan Program LLC 2016-D, Class A1, 1.036% (1-month USLIBOR +0.950%), 1/25/2039 | 408,984 |
353,754 | 1 | Social Professional Loan Program LLC 2016-E, Class A1, 0.936% (1-month USLIBOR +0.850%), 7/25/2039 | 355,723 |
952,042 | 1 | Social Professional Loan Program LLC 2017-A, Class A1, 0.786% (1-month USLIBOR +0.700%), 3/26/2040 | 957,531 |
689,670 | 1 | Social Professional Loan Program LLC 2017-C, Class A1, 0.686% (1-month USLIBOR +0.600%), 7/25/2040 | 693,448 |
443,283 | 1 | Social Professional Loan Program LLC 2017-E, Class A1, 0.586% (1-month USLIBOR +0.500%), 11/26/2040 | 445,530 |
696,729 | 1 | Social Professional Loan Program LLC 2018-A, Class A1, 0.436% (1-month USLIBOR +0.350%), 2/25/2042 | 699,492 |
1,374,046 | Social Professional Loan Program LLC 2020-A, Class A1FX, 2.060%, 5/15/2046 | 1,382,803 | |
155,506 | Sofi Consumer Loan Program Trust 2016-1, Class A, 3.260%, 8/25/2025 | 156,521 | |
429,741 | Sofi Consumer Loan Program Trust 2019-3, Class A, 2.900%, 5/25/2028 | 432,641 | |
1,452,881 | Sofi Consumer Loan Program Trust 2020-1, Class A, 2.020%, 1/25/2029 | 1,466,099 | |
5,000,000 | Sofi Consumer Loan Program Trust 2020-1, Class B, 2.250%, 1/25/2029 | 5,081,632 | |
24,250,000 | Sofi Consumer Loan Program Trust 2021-1, Class A, 0.490%, 9/25/2030 | 24,291,220 | |
3,327,918 | 1 | State Board of Regents of the State of Utah 2016-1, Class A, 0.836% (1-month USLIBOR +0.750%), 9/25/2056 | 3,331,591 |
6,000,000 | Verizon Owner Trust 2018-1A, Class C, 3.550%, 4/20/2023 | 6,090,110 | |
3,500,000 | Verizon Owner Trust 2019-A, Class C, 2.600%, 12/20/2023 | 3,599,142 | |
9,400,000 | Verizon Owner Trust 2019-A, Class C, 3.220%, 9/20/2023 | 9,664,930 | |
7,591,343 | Verizon Owner Trust 2019-B, Class A1A, 2.330%, 12/20/2023 | 7,701,139 | |
2,898,513 | 1 | Verizon Owner Trust 2019-B, Class A1B, 0.537% (1-month USLIBOR +0.450%), 12/20/2023 | 2,918,182 |
6,500,000 | Verizon Owner Trust 2019-C, Class A1A, 1.940%, 4/22/2024 | 6,597,456 | |
17,600,000 | Verizon Owner Trust 2019-C, Class C, 2.160%, 4/22/2024 | 18,063,169 | |
27,000,000 | 1 | Verizon Owner Trust 2020-A, Class A1B, 0.357% (1-month USLIBOR +0.270%), 7/22/2024 | 27,155,693 |
10,000,000 | Verizon Owner Trust 2020-A, Class C, 2.060%, 7/22/2024 | 10,236,708 | |
17,000,000 | Verizon Owner Trust 2020-B, Class C, 0.830%, 2/20/2025 | 17,156,038 | |
27,000,000 | Verizon Owner Trust 2020-C, Class B, 0.670%, 4/21/2025 | 27,105,408 |
Principal Amount or Shares | Value | ||
ASSET-BACKED SECURITIES— continued | |||
Other— continued | |||
$ 9,000,000 | Verizon Owner Trust 2020-C, Class C, 0.770%, 4/21/2025 | $9,041,748 | |
TOTAL | 817,258,767 | ||
Rate Reduction Bond— 0.0% | |||
280,404 | Atlantic City Electric Transition Funding 2002-1, Class A4, 5.550%, 10/20/2023 | 281,078 | |
TOTAL ASSET-BACKED SECURITIES (IDENTIFIED COST $3,936,244,138) | 3,957,774,029 | ||
CORPORATE BONDS— 34.0% | |||
Basic Industry - Metals & Mining— 0.1% | |||
9,700,000 | Newmont Mining Corp., Sr. Unsecd. Note, 3.500%, 3/15/2022 | 9,758,760 | |
Capital Goods - Aerospace & Defense— 1.1% | |||
5,000,000 | Boeing Co., Sr. Unsecd. Note, 1.167%, 2/4/2023 | 5,011,363 | |
17,075,000 | Boeing Co., Sr. Unsecd. Note, 1.950%, 2/1/2024 | 17,479,027 | |
5,000,000 | Boeing Co., Sr. Unsecd. Note, 4.508%, 5/1/2023 | 5,283,585 | |
19,835,000 | Huntington Ingalls Industries, Inc., Sr. Unsecd. Note, 144A, 0.670%, 8/16/2023 | 19,834,546 | |
14,500,000 | Leidos, Inc., Sr. Unsecd. Note, Series WI, 2.950%, 5/15/2023 | 15,005,760 | |
37,000,000 | Teledyne Technologies, Inc., Sr. Unsecd. Note, 0.650%, 4/1/2023 | 37,002,189 | |
TOTAL | 99,616,470 | ||
Capital Goods - Construction Machinery— 0.5% | |||
9,610,000 | CNH Industrial Capital America LLC, Sr. Unsecd. Note, 1.950%, 7/2/2023 | 9,826,084 | |
20,000,000 | 1 | John Deere Capital Corp., Sr. Unsecd. Note, Series MTN, 0.170% (Secured Overnight Financing Rate +0.120%), 7/10/2023 | 20,039,569 |
8,865,000 | John Deere Capital Corp., Sr. Unsecd. Note, Series MTN, 0.400%, 10/10/2023 | 8,873,993 | |
4,360,000 | John Deere Capital Corp., Sr. Unsecd. Note, Series MTN, 0.700%, 7/5/2023 | 4,390,043 | |
TOTAL | 43,129,689 | ||
Capital Goods - Diversified Manufacturing— 0.5% | |||
2,000,000 | Honeywell International, Inc., Sr. Unsecd. Note, 0.483%, 8/19/2022 | 2,000,518 | |
2,015,000 | Honeywell International, Inc., Sr. Unsecd. Note, 1.350%, 6/1/2025 | 2,048,815 | |
1,545,000 | Lennox International, Inc., Sr. Unsecd. Note, 1.350%, 8/1/2025 | 1,546,192 | |
8,235,000 | 1 | Otis Worldwide Corp., Sr. Unsecd. Note, Series WI, 0.594% (3-month USLIBOR +0.450%), 4/5/2023 | 8,235,878 |
3,830,000 | Roper Technologies, Inc., Sr. Unsecd. Note, 0.450%, 8/15/2022 | 3,837,058 | |
7,135,000 | Roper Technologies, Inc., Sr. Unsecd. Note, 2.350%, 9/15/2024 | 7,473,753 | |
20,000,000 | Roper Technologies, Inc., Sr. Unsecd. Note, 3.650%, 9/15/2023 | 21,194,409 | |
TOTAL | 46,336,623 |
Principal Amount or Shares | Value | ||
CORPORATE BONDS— continued | |||
Communications - Cable & Satellite— 0.4% | |||
$ 35,830,000 | 1 | Comcast Corp., Sr. Unsecd. Note, 0.756% (3-month USLIBOR +0.630%), 4/15/2024 | $36,296,515 |
Communications - Media & Entertainment— 0.0% | |||
2,610,000 | Fox Corp, Sr. Unsecd. Note, Series WI, 3.666%, 1/25/2022 | 2,637,651 | |
555,000 | Interpublic Group of Cos., Inc., Sr. Unsecd. Note, 3.750%, 10/1/2021 | 555,000 | |
TOTAL | 3,192,651 | ||
Communications - Telecom Wireless— 0.6% | |||
19,530,000 | American Tower Corp., Sr. Unsecd. Note, 0.600%, 1/15/2024 | 19,497,132 | |
30,800,000 | 1 | Vodafone Group PLC, Sr. Unsecd. Note, 1.116% (3-month USLIBOR +0.990%), 1/16/2024 | 31,345,079 |
TOTAL | 50,842,211 | ||
Communications - Telecom Wirelines— 0.3% | |||
25,000,000 | Verizon Communications, Inc., Sr. Unsecd. Note, 0.840%, 3/20/2026 | 25,447,290 | |
4,170,000 | 1 | Verizon Communications, Inc., Sr. Unsecd. Note, 1.118% (3-month USLIBOR +1.000%), 3/16/2022 | 4,188,622 |
TOTAL | 29,635,912 | ||
Consumer Cyclical - Automotive— 2.7% | |||
10,000,000 | 1 | American Honda Finance Corp., Sr. Unsecd. Note, Series MTN, 0.399% (3-month USLIBOR +0.280%), 1/12/2024 | 10,033,286 |
7,000,000 | 1 | American Honda Finance Corp., Sr. Unsecd. Note, Series MTN, 0.405% (3-month USLIBOR +0.290%), 12/10/2021 | 7,004,845 |
13,635,000 | American Honda Finance Corp., Sr. Unsecd. Note, Series MTN, 0.750%, 8/9/2024 | 13,634,003 | |
5,000,000 | American Honda Finance Corp., Sr. Unsecd. Note, Series MTN, 0.875%, 7/7/2023 | 5,040,758 | |
14,285,000 | 3 | Daimler Finance NA LLC, Sr. Unsecd. Note, 144A, 0.750%, 3/1/2024 | 14,315,122 |
9,000,000 | Daimler Finance NA LLC, Sr. Unsecd. Note, 144A, 3.400%, 2/22/2022 | 9,109,036 | |
3,570,000 | 1 | Ford Motor Credit Co. LLC, Sr. Unsecd. Note, 1.402% (3-month USLIBOR +1.270%), 3/28/2022 | 3,572,774 |
3,510,000 | General Motors Co., Sr. Unsecd. Note, 5.400%, 10/2/2023 | 3,829,092 | |
10,000,000 | 1 | General Motors Financial Co., Inc., Sr. Unsecd. Note, 0.810% (Secured Overnight Financing Rate +0.760%), 3/8/2024 | 10,099,010 |
9,090,000 | 1 | General Motors Financial Co., Inc., Sr. Unsecd. Note, 1.682% (3-month USLIBOR +1.550%), 1/14/2022 | 9,123,912 |
10,500,000 | General Motors Financial Co., Inc., Sr. Unsecd. Note, 1.700%, 8/18/2023 | 10,701,920 | |
12,000,000 | Hyundai Capital America, Sr. Unsecd. Note, 144A, 1.000%, 9/17/2024 | 11,961,546 | |
14,980,000 | Hyundai Capital America, Sr. Unsecd. Note, 144A, 1.250%, 9/18/2023 | 15,112,472 | |
8,895,000 | Hyundai Capital America, Sr. Unsecd. Note, 144A, 2.375%, 2/10/2023 | 9,092,996 | |
4,850,000 | Metalsa Sa De Cv, 144A, 4.900%, 4/24/2023 | 5,070,602 | |
20,000,000 | 1 | Nissan Motor Acceptance Corp., Sr. Unsecd. Note, 144A, 0.754% (3-month USLIBOR +0.640%), 3/8/2024 | 20,057,626 |
Principal Amount or Shares | Value | ||
CORPORATE BONDS— continued | |||
Consumer Cyclical - Automotive— continued | |||
$ 4,000,000 | 1 | Nissan Motor Acceptance Corp., Sr. Unsecd. Note, 144A, 0.822% (3-month USLIBOR +0.690%), 9/28/2022 | $4,009,146 |
10,000,000 | 1 | Nissan Motor Acceptance Corp., Sr. Unsecd. Note, 144A, 1.018% (3-month USLIBOR +0.890%), 1/13/2022 | 10,017,030 |
9,810,000 | Stellantis N.V., Sr. Unsecd. Note, 5.250%, 4/15/2023 | 10,475,903 | |
5,000,000 | 1 | Toyota Motor Credit Corp., Sr. Unsecd. Note, 0.509% (3-month USLIBOR +0.390%), 1/11/2023 | 5,009,567 |
10,000,000 | Toyota Motor Credit Corp., Sr. Unsecd. Note, Series MTN, 0.370%, 4/6/2023 | 10,025,190 | |
10,000,000 | 1 | Toyota Motor Credit Corp., Sr. Unsecd. Note, Series MTN, 0.380% (Secured Overnight Financing Rate +0.330%), 1/11/2024 | 10,040,740 |
5,000,000 | 1,3 | Toyota Motor Credit Corp., Sr. Unsecd. Note, Series MTN, 0.809% (3-month USLIBOR +0.690%), 1/11/2022 | 5,009,745 |
30,000,000 | Volkswagen Group of America Finance LLC, Sr. Unsecd. Note, 144A, 0.750%, 11/23/2022 | 30,093,488 | |
8,570,000 | Volkswagen Group of America Finance LLC, Sr. Unsecd. Note, 144A, 2.900%, 5/13/2022 | 8,704,928 | |
TOTAL | 251,144,737 | ||
Consumer Cyclical - Retailers— 0.2% | |||
18,700,000 | 1 | Home Depot, Inc., Sr. Unsecd. Note, 0.429% (3-month USLIBOR +0.310%), 3/1/2022 | 18,723,163 |
Consumer Cyclical - Services— 0.5% | |||
14,950,000 | Amazon.com, Inc., Sr. Unsecd. Note, 0.250%, 5/12/2023 | 14,980,573 | |
10,000,000 | Amazon.com, Inc., Sr. Unsecd. Note, 0.400%, 6/3/2023 | 10,025,589 | |
17,000,000 | IHS Markit Ltd., Sr. Unsecd. Note, 4.125%, 8/1/2023 | 18,044,650 | |
TOTAL | 43,050,812 | ||
Consumer Non-Cyclical - Food/Beverage— 1.3% | |||
32,655,000 | Coca-Cola European Partners PLC, Sr. Unsecd. Note, 144A, 0.500%, 5/5/2023 | 32,629,337 | |
19,090,000 | Conagra Brands, Inc., Sr. Unsecd. Note, 0.500%, 8/11/2023 | 19,094,982 | |
6,950,000 | 1 | General Mills, Inc., Sr. Unsecd. Note, 1.143% (3-month USLIBOR +1.010%), 10/17/2023 | 7,072,775 |
3,315,000 | 3 | International Flavors & Fragrances, Inc., Sr. Unsecd. Note, 144A, 0.697%, 9/15/2022 | 3,325,465 |
16,755,000 | Jde Peet’s B.V., Sr. Unsecd. Note, 144A, 0.800%, 9/24/2024 | 16,712,412 | |
6,900,000 | Keurig Dr Pepper, Inc., Sr. Unsecd. Note, 0.750%, 3/15/2024 | 6,905,865 | |
5,028,000 | Keurig Dr Pepper, Inc., Sr. Unsecd. Note, 4.057%, 5/25/2023 | 5,315,116 | |
6,000,000 | McCormick & Co., Inc., Sr. Unsecd. Note, 2.700%, 8/15/2022 | 6,113,421 | |
15,580,000 | Mondelez International, Inc., Sr. Unsecd. Note, 0.625%, 7/1/2022 | 15,626,178 | |
8,660,000 | PepsiCo, Inc., Sr. Unsecd. Note, 0.400%, 10/7/2023 | 8,683,125 | |
TOTAL | 121,478,676 |
Principal Amount or Shares | Value | ||
CORPORATE BONDS— continued | |||
Consumer Non-Cyclical - Health Care— 0.8% | |||
$ 10,500,000 | 1 | Becton Dickinson & Co., Sr. Unsecd. Note, 1.147% (3-month USLIBOR +1.030%), 6/6/2022 | $10,567,053 |
12,495,000 | DH Europe Finance II S.a.r.l., Sr. Unsecd. Note, Series 3YR, 2.050%, 11/15/2022 | 12,736,108 | |
15,000,000 | PerkinElmer, Inc., Sr. Unsecd. Note, 0.550%, 9/15/2023 | 15,014,455 | |
27,235,000 | PerkinElmer, Inc., Sr. Unsecd. Note, 0.850%, 9/15/2024 | 27,241,594 | |
8,145,000 | Stryker Corp., Sr. Unsecd. Note, 0.600%, 12/1/2023 | 8,145,528 | |
TOTAL | 73,704,738 | ||
Consumer Non-Cyclical - Pharmaceuticals— 1.2% | |||
13,635,000 | 1 | AbbVie, Inc., Sr. Unsecd. Note, Series WI, 0.780% (3-month USLIBOR +0.650%), 11/21/2022 | 13,724,564 |
4,700,000 | AstraZeneca PLC, Sr. Unsecd. Note, 0.700%, 4/8/2026 | 4,603,527 | |
6,500,000 | 1 | AstraZeneca PLC, Sr. Unsecd. Note, 0.735% (3-month USLIBOR +0.620%), 6/10/2022 | 6,524,726 |
9,100,000 | 1 | Bayer US Finance II LLC, Sr. Unsecd. Note, 144A, 1.126% (3-month USLIBOR +1.010%), 12/15/2023 | 9,224,418 |
6,330,000 | Bristol-Myers Squibb Co., Sr. Unsecd. Note, 0.537%, 11/13/2023 | 6,331,269 | |
500,000 | 1 | Bristol-Myers Squibb Co., Sr. Unsecd. Note, Series WI, 0.504% (3-month USLIBOR +0.380%), 5/16/2022 | 501,431 |
4,615,000 | Bristol-Myers Squibb Co., Sr. Unsecd. Note, Series WI, 2.900%, 7/26/2024 | 4,901,843 | |
3,430,000 | Eli Lilly & Co., Sr. Unsecd. Note, 2.350%, 5/15/2022 | 3,475,788 | |
7,000,000 | 1 | Gilead Sciences, Inc., Sr. Unsecd. Note, 0.651% (3-month USLIBOR +0.520%), 9/29/2023 | 7,004,223 |
1,900,000 | Gilead Sciences, Inc., Sr. Unsecd. Note, 1.950%, 3/1/2022 | 1,909,823 | |
4,735,000 | Merck & Co., Inc., Sr. Unsecd. Note, 2.900%, 3/7/2024 | 5,019,340 | |
12,085,000 | Royalty Pharma PLC, Sr. Unsecd. Note, Series WI, 0.750%, 9/2/2023 | 12,126,642 | |
23,338,000 | Teva Pharmaceutical Finance Co. BV, Sr. Unsecd. Note, Series 2, 3.650%, 11/10/2021 | 23,436,020 | |
9,500,000 | Zoetis, Inc., Sr. Unsecd. Note, 4.500%, 11/13/2025 | 10,698,181 | |
TOTAL | 109,481,795 | ||
Consumer Non-Cyclical - Products— 0.3% | |||
22,955,000 | Procter & Gamble Co., Sr. Unsecd. Note, 0.550%, 10/29/2025 | 22,644,210 | |
6,545,000 | Unilever Capital Corp., Sr. Unsecd. Note, 0.375%, 9/14/2023 | 6,554,764 | |
TOTAL | 29,198,974 | ||
Consumer Non-Cyclical - Tobacco— 0.1% | |||
10,000,000 | 1 | BAT Capital Corp., Sr. Unsecd. Note, Series WI, 1.004% (3-month USLIBOR +0.880%), 8/15/2022 | 10,057,048 |
Energy - Independent— 0.1% | |||
13,365,000 | Pioneer Natural Resources, Inc., Sr. Unsecd. Note, 0.750%, 1/15/2024 | 13,354,519 |
Principal Amount or Shares | Value | ||
CORPORATE BONDS— continued | |||
Energy - Integrated— 0.9% | |||
$ 4,931,000 | Petroleos Mexicanos, Sr. Unsecd. Note, Series EMTN, 1.875%, 4/21/2022 | $5,751,281 | |
10,000,000 | 1 | Chevron Corp., Unsecd. Note, 0.654% (3-month USLIBOR +0.530%), 11/15/2021 | 10,006,734 |
15,000,000 | 1 | Chevron U.S.A., Inc., Sr. Unsecd. Note, 0.327% (3-month USLIBOR +0.200%), 8/11/2023 | 15,056,594 |
14,155,000 | Exxon Mobil Corp., Sr. Unsecd. Note, 1.902%, 8/16/2022 | 14,372,145 | |
5,329,000 | Petroleos Mexicanos, Sr. Unsecd. Note, 5.375%, 3/13/2022 | 5,419,007 | |
15,200,000 | 1 | Petroleos Mexicanos, Sr. Unsecd. Note, Series WI, 3.764% (3-month USLIBOR +3.650%), 3/11/2022 | 15,306,400 |
18,060,000 | Shell International Finance B.V., Sr. Unsecd. Note, 0.375%, 9/15/2023 | 18,087,311 | |
2,345,000 | Suncor Energy, Inc., Sr. Unsecd. Note, 2.800%, 5/15/2023 | 2,427,931 | |
TOTAL | 86,427,403 | ||
Energy - Midstream— 0.1% | |||
10,800,000 | Enterprise Products Operating LLC, Sr. Unsecd. Note, 3.500%, 2/1/2022 | 10,914,610 | |
Energy - Refining— 0.7% | |||
8,000,000 | Marathon Petroleum Corp., Sr. Unsecd. Note, 4.700%, 5/1/2025 | 8,934,068 | |
9,750,000 | Marathon Petroleum Corp., Sr. Unsecd. Note, 4.750%, 12/15/2023 | 10,542,611 | |
35,000,000 | 1 | Phillips 66, Sr. Unsecd. Note, 0.744% (3-month USLIBOR +0.620%), 2/15/2024 | 35,019,902 |
10,000,000 | Phillips 66, Sr. Unsecd. Note, 3.700%, 4/6/2023 | 10,477,647 | |
2,500,000 | Valero Energy Corp., Sr. Unsecd. Note, 1.200%, 3/15/2024 | 2,528,661 | |
TOTAL | 67,502,889 | ||
Financial Institution - Banking— 12.7% | |||
10,000,000 | 1 | American Express Co., 0.774% (3-month USLIBOR +0.650%), 2/27/2023 | 10,075,566 |
2,655,000 | Associated Banc-Corp., Sub. Note, 4.250%, 1/15/2025 | 2,855,436 | |
430,000 | Australia & New Zealand Banking Group Ltd., Sr. Unsecd. Note, Series MTN, 2.050%, 11/21/2022 | 439,147 | |
13,500,000 | 1 | Australia & New Zealand Banking Group, Melbourne, Sr. Unsecd. Note, 144A, 0.620% (3-month USLIBOR +0.490%), 11/21/2022 | 13,573,140 |
36,000,000 | 1 | Banco Santander, S.A., 1.679% (3-month USLIBOR +1.560%), 4/11/2022 | 36,286,105 |
15,000,000 | Bank of America Corp., Sr. Unsecd. Note, 1.020%, 7/22/2027 | 15,292,326 | |
25,000,000 | 1 | Bank of America Corp., Sr. Unsecd. Note, 1.125% (3-month USLIBOR +1.000%), 4/24/2023 | 25,138,044 |
6,500,000 | Bank of America Corp., Sr. Unsecd. Note, Series MTN, 0.529%, 5/28/2024 | 6,521,385 | |
5,000,000 | 1 | Bank of America Corp., Sr. Unsecd. Note, Series MTN, 0.780% (Secured Overnight Financing Rate +0.730%), 10/24/2024 | 5,047,905 |
7,000,000 | 1 | Bank of America Corp., Sr. Unsecd. Note, Series MTN, 1.314% (3-month USLIBOR +1.180%), 10/21/2022 | 7,004,146 |
Principal Amount or Shares | Value | ||
CORPORATE BONDS— continued | |||
Financial Institution - Banking— continued | |||
$ 50,000,000 | 1 | Bank of Montreal, Sr. Unsecd. Note, 0.400% (Secured Overnight Financing Rate +0.350%), 12/8/2023 | $50,198,414 |
10,000,000 | 1,3 | Bank of Montreal, Sr. Unsecd. Note, Series MTN, 0.670% (Secured Overnight Financing Rate +0.620%), 9/15/2026 | 10,045,481 |
2,060,000 | Bank of Montreal, Sr. Unsecd. Note, Series MTN, 2.050%, 11/1/2022 | 2,099,863 | |
1,000,000 | Bank of Montreal, Sr. Unsecd. Note, Series MTN, 2.900%, 3/26/2022 | 1,013,278 | |
10,000,000 | Bank of New York Mellon Corp., Series MTN, 0.310%, 4/26/2024 | 10,034,511 | |
25,000,000 | Bank of New York Mellon Corp., Sr. Unsecd. Note, Series MTN, 0.350%, 12/7/2023 | 24,981,769 | |
5,000,000 | 1 | Bank of New York Mellon Corp., Sr. Unsecd. Note, Series MTN, 1.178% (3-month USLIBOR +1.050%), 10/30/2023 | 5,052,560 |
15,000,000 | 1 | Bank of Nova Scotia, Sr. Unsecd. Note, 0.600% (Secured Overnight Financing Rate +0.550%), 9/15/2023 | 15,108,633 |
20,000,000 | 1 | Bank of Nova Scotia, Sr. Unsecd. Note, 0.660% (Secured Overnight Financing Rate +0.610%), 9/15/2026 | 20,075,113 |
10,000,000 | Bank of Nova Scotia, Sr. Unsecd. Note, 1.950%, 2/1/2023 | 10,215,360 | |
25,985,000 | Barclays Bank PLC, Sub. Note, 7.625%, 11/21/2022 | 27,861,487 | |
3,280,000 | Barclays PLC, Sr. Unsecd. Note, 1.007%, 12/10/2024 | 3,296,047 | |
15,000,000 | 1 | Barclays PLC, Sr. Unsecd. Note, 1.504% (3-month USLIBOR +1.380%), 5/16/2024 | 15,262,409 |
16,357,000 | 1 | Barclays PLC, Sr. Unsecd. Note, 1.554% (3-month USLIBOR +1.430%), 2/15/2023 | 16,434,201 |
20,000,000 | BPCE SA, Sub., 144A, 5.700%, 10/22/2023 | 21,933,821 | |
10,000,000 | 1 | Canadian Imperial Bank of Commerce, Sr. Unsecd. Note, 0.450% (Secured Overnight Financing Rate +0.400%), 12/14/2023 | 10,030,729 |
10,870,000 | 1 | Canadian Imperial Bank of Commerce, Sr. Unsecd. Note, 0.850% (Secured Overnight Financing Rate +0.800%), 3/17/2023 | 10,970,467 |
5,000,000 | 3 | Canadian Imperial Bank of Commerce, Sr. Unsecd. Note, 0.950%, 6/23/2023 | 5,042,937 |
7,690,000 | 1 | Capital One NA, Sr. Unsecd. Note, Series BKNT, 1.278% (3-month USLIBOR +1.150%), 1/30/2023 | 7,715,486 |
10,000,000 | 1 | Citigroup, Inc., Sr. Unsecd. Note, 0.719% (Secured Overnight Financing Rate +0.669%), 5/1/2025 | 10,095,841 |
15,000,000 | 1 | Citigroup, Inc., Sr. Unsecd. Note, 0.820% (Secured Overnight Financing Rate +0.770%), 6/9/2027 | 15,071,880 |
3,845,000 | 1 | Citigroup, Inc., Sr. Unsecd. Note, 0.920% (Secured Overnight Financing Rate +0.870%), 11/4/2022 | 3,850,392 |
5,000,000 | 1 | Citigroup, Inc., Sr. Unsecd. Note, 1.075% (3-month USLIBOR +0.950%), 7/24/2023 | 5,031,836 |
5,000,000 | 1 | Citigroup, Inc., Sr. Unsecd. Note, 1.184% (3-month USLIBOR +1.070%), 12/8/2021 | 5,005,262 |
3,465,000 | Citigroup, Inc., Sr. Unsecd. Note, 2.312%, 11/4/2022 | 3,470,355 | |
2,000,000 | 1 | Citizens Bank N.A., Sr. Unsecd. Note, Series BKNT, 0.844% (3-month USLIBOR +0.720%), 2/14/2022 | 2,004,073 |
Principal Amount or Shares | Value | ||
CORPORATE BONDS— continued | |||
Financial Institution - Banking— continued | |||
$ 3,890,000 | Citizens Bank N.A., Sr. Unsecd. Note, Series BKNT, 3.250%, 2/14/2022 | $3,923,215 | |
10,000,000 | 1 | Citizens Bank, N.A., Providence, Sr. Unsecd. Note, Series BKNT, 1.081% (3-month USLIBOR +0.950%), 3/29/2023 | 10,112,873 |
25,975,000 | 1 | Commonwealth Bank of Australia, Sr. Unsecd. Note, 144A, 0.450% (Secured Overnight Financing Rate +0.400%), 7/7/2025 | 26,028,980 |
12,000,000 | 1 | Credit Suisse AG of New York, Sr. Unsecd. Note, 0.440% (Secured Overnight Financing Rate +0.390%), 2/2/2024 | 12,026,799 |
19,175,000 | 1 | Credit Suisse AG of New York, Sr. Unsecd. Note, 0.500% (Secured Overnight Financing Rate +0.450%), 2/4/2022 | 19,200,522 |
25,000,000 | 1 | Credit Suisse AG of New York, Sr. Unsecd. Note, Series FRN, 0.430% (Secured Overnight Financing Rate +0.380%), 8/9/2023 | 25,086,529 |
19,150,000 | FNB Corp., (PA), Sr. Unsecd. Note, 2.200%, 2/24/2023 | 19,439,637 | |
10,000,000 | Goldman Sachs Group, Inc., 4.000%, 3/3/2024 | 10,775,923 | |
10,000,000 | Goldman Sachs Group, Inc., Sr. Unsecd. Note, 0.480%, 3/8/2023 | 10,008,924 | |
13,000,000 | 1 | Goldman Sachs Group, Inc., Sr. Unsecd. Note, 0.881% (3-month USLIBOR +0.750%), 2/23/2023 | 13,106,462 |
2,815,000 | Goldman Sachs Group, Inc., Sr. Unsecd. Note, 2.876%, 10/31/2022 | 2,819,917 | |
15,000,000 | 1 | Goldman Sachs Group, Inc., Sr. Unsecd. Note, Series FRN, 0.590% (Secured Overnight Financing Rate +0.540%), 11/17/2023 | 15,052,180 |
10,000,000 | 1 | Goldman Sachs Group, Inc., Sr. Unsecd. Note, Series FRN, 0.840% (Secured Overnight Financing Rate +0.790%), 12/9/2026 | 10,038,797 |
5,000,000 | 1 | HSBC Holdings PLC, Sr. Unsecd. Note, 1.124% (3-month USLIBOR +1.000%), 5/18/2024 | 5,061,442 |
2,855,000 | HSBC Holdings PLC, Sr. Unsecd. Note, 1.645%, 4/18/2026 | 2,871,436 | |
2,800,000 | Huntington National Bank, Sr. Unsecd. Note, Series BKNT, 3.125%, 4/1/2022 | 2,833,677 | |
6,000,000 | JPMorgan Chase & Co., 3.250%, 9/23/2022 | 6,176,822 | |
8,000,000 | JPMorgan Chase & Co., Sr. Unsecd. Note, 0.545%, 6/1/2025 | 8,046,025 | |
2,470,000 | JPMorgan Chase & Co., Sr. Unsecd. Note, 0.563%, 2/16/2025 | 2,460,332 | |
10,000,000 | 1 | JPMorgan Chase & Co., Sr. Unsecd. Note, 0.630% (Secured Overnight Financing Rate +0.580%), 3/16/2024 | 10,038,505 |
12,500,000 | 1 | JPMorgan Chase & Co., Sr. Unsecd. Note, 0.815% (Secured Overnight Financing Rate +0.765%), 9/22/2027 | 12,604,000 |
6,000,000 | 1 | JPMorgan Chase & Co., Sr. Unsecd. Note, 0.867% (3-month USLIBOR +0.730%), 4/23/2024 | 6,055,156 |
5,000,000 | 1 | JPMorgan Chase & Co., Sr. Unsecd. Note, 1.355% (3-month USLIBOR +1.230%), 10/24/2023 | 5,065,096 |
5,000,000 | JPMorgan Chase & Co., Sr. Unsecd. Note, 1.514%, 6/1/2024 | 5,084,747 | |
7,380,000 | Lloyds Banking Group PLC, Sr. Unsecd. Note, 1.326%, 6/15/2023 | 7,428,275 | |
7,000,000 | 1 | Manufacturers & Traders Trust Co., Sr. Unsecd. Note, Series BKNT, 0.734% (3-month USLIBOR +0.610%), 5/18/2022 | 7,027,388 |
25,000,000 | Mitsubishi UFJ Financial Group, Inc., Sr. Note, 2.623%, 7/18/2022 | 25,463,712 |
Principal Amount or Shares | Value | ||
CORPORATE BONDS— continued | |||
Financial Institution - Banking— continued | |||
$ 9,000,000 | Mitsubishi UFJ Financial Group, Inc., Sr. Unsecd. Note, 0.848%, 9/15/2024 | $9,042,252 | |
11,280,000 | 1 | Morgan Stanley, Sr. Unsecd. Note, Series GMTN, 0.750% (Secured Overnight Financing Rate +0.700%), 1/20/2023 | 11,307,701 |
11,970,000 | Morgan Stanley, Sr. Unsecd. Note, Series GMTN, 0.791%, 1/22/2025 | 11,971,885 | |
1,795,000 | Morgan Stanley, Sr. Unsecd. Note, Series I, 0.864%, 10/21/2025 | 1,791,959 | |
20,000,000 | Morgan Stanley, Sr. Unsecd. Note, Series MTN, 0.529%, 1/25/2024 | 20,018,537 | |
4,635,000 | Morgan Stanley, Sr. Unsecd. Note, Series MTN, 0.560%, 11/10/2023 | 4,641,806 | |
2,145,000 | Morgan Stanley, Sr. Unsecd. Note, Series MTN, 2.720%, 7/22/2025 | 2,248,239 | |
7,355,000 | 1 | MUFG Union Bank, N.A., Sr. Unsecd. Note, Series BKNT, 0.760% (Secured Overnight Financing Rate +0.710%), 12/9/2022 | 7,400,000 |
6,825,000 | MUFG Union Bank, N.A., Sr. Unsecd. Note, Series BKNT, 3.150%, 4/1/2022 | 6,908,401 | |
30,000,000 | 1 | National Australia Bank Ltd., Sr. Unsecd. Note, 144A, 0.524% (3-month USLIBOR +0.410%), 12/13/2022 | 30,160,546 |
16,000,000 | 1 | National Bank of Canada, Montreal, Sr. Unsecd. Note, 0.540% (Secured Overnight Financing Rate +0.490%), 8/6/2024 | 16,074,250 |
22,500,000 | National Bank of Canada, Montreal, Sr. Unsecd. Note, Series MTN, 2.100%, 2/1/2023 | 23,000,550 | |
2,000,000 | 1 | NatWest Markets PLC, Sr. Unsecd. Note, 144A, 0.580% (Secured Overnight Financing Rate +0.530%), 8/12/2024 | 2,011,687 |
9,000,000 | 1 | NatWest Markets PLC, Sr. Unsecd. Note, 144A, 0.810% (Secured Overnight Financing Rate +0.760%), 9/29/2026 | 9,027,089 |
6,665,000 | 1 | PNC Bank National Association, Sr. Unsecd. Note, Series BKNT, 0.628% (3-month USLIBOR +0.500%), 7/27/2022 | 6,691,086 |
20,000,000 | 1 | Royal Bank of Canada, Sr. Unsecd. Note, 0.410% (Secured Overnight Financing Rate +0.360%), 7/29/2024 | 20,054,064 |
5,000,000 | 1 | Royal Bank of Canada, Sr. Unsecd. Note, 0.797% (3-month USLIBOR +0.660%), 10/5/2023 | 5,058,952 |
10,000,000 | 1 | Royal Bank of Canada, Sr. Unsecd. Note, Series GMTN, 0.350% (Secured Overnight Financing Rate +0.300%), 1/19/2024 | 10,030,482 |
25,000,000 | 1,3 | Royal Bank of Canada, Sr. Unsecd. Note, Series GMTN, 0.450% (Secured Overnight Financing Rate +0.400%), 8/5/2022 | 25,076,978 |
5,000,000 | 1 | Royal Bank of Canada, Sr. Unsecd. Note, Series GMTN, 0.493% (3-month USLIBOR +0.360%), 1/17/2023 | 5,022,949 |
12,750,000 | Standard Chartered PLC, Sr. Unsecd. Note, 144A, 0.991%, 1/12/2025 | 12,714,493 | |
1,605,000 | State Street Corp., Sr. Unsecd. Note, Series WI, 2.825%, 3/30/2023 | 1,624,717 | |
1,825,000 | Sumitomo Mitsui Financial Group, Inc., Sr. Unsecd. Note, 0.508%, 1/12/2024 | 1,819,625 | |
15,000,000 | 1 | Toronto Dominion Bank, Sr. Unsecd. Note, Series MTN, 0.290% (Secured Overnight Financing Rate +0.240%), 1/6/2023 | 15,034,354 |
5,000,000 | Toronto Dominion Bank, Sr. Unsecd. Note, Series MTN, 0.450%, 9/11/2023 | 5,002,122 |
Principal Amount or Shares | Value | ||
CORPORATE BONDS— continued | |||
Financial Institution - Banking— continued | |||
$ 6,000,000 | 1 | Truist Bank, Sr. Unsecd. Note, Series BKNT, 0.780% (Secured Overnight Financing Rate +0.730%), 3/9/2023 | $6,047,640 |
47,000,000 | 1 | Truist Financial Corp., Sr. Unsecd. Note, Series MTN, 0.450% (Secured Overnight Financing Rate +0.400%), 6/9/2025 | 47,186,252 |
12,855,000 | Truist Financial Corp., Sr. Unsecd. Note, Series MTN, 3.050%, 6/20/2022 | 13,087,243 | |
10,000,000 | 1 | U.S. Bank N.A., Cincinnati, Sr. Unsecd. Note, 0.516% (3-month USLIBOR +0.400%), 12/9/2022 | 10,053,733 |
38,000,000 | 1 | U.S. Bank N.A., Cincinnati, Sr. Unsecd. Note, Series BKNT, 0.265% (3-month BSBY +0.170%), 6/2/2023 | 38,038,380 |
35,000,000 | 1 | UBS AG London, Sr. Unsecd. Note, 144A, 0.410% (Secured Overnight Financing Rate +0.360%), 2/9/2024 | 35,137,164 |
10,000,000 | 1 | UBS AG London, Sr. Unsecd. Note, 144A, 0.500% (Secured Overnight Financing Rate +0.450%), 8/9/2024 | 10,078,337 |
6,866,000 | UBS AG Stamford, CT, Sub., 7.625%, 8/17/2022 | 7,275,826 | |
30,300,000 | 1 | Westpac Banking Corp., Sr. Unsecd. Note, 0.689% (3-month USLIBOR +0.570%), 1/11/2023 | 30,518,761 |
TOTAL | 1,179,130,836 | ||
Financial Institution - Broker/Asset Mgr/Exchange— 0.1% | |||
10,000,000 | 1 | TD Ameritrade Holding Corp., Sr. Unsecd. Note, 0.555% (3-month USLIBOR +0.430%), 11/1/2021 | 10,001,750 |
Financial Institution - Finance Companies— 0.6% | |||
2,120,000 | AerCap Ireland Capital Ltd. / AerCap Global Aviation Trust, Sr. Unsecd. Note, 4.450%, 12/16/2021 | 2,130,069 | |
3,430,000 | AerCap Ireland Capital Ltd / AerCap Global Aviation Trust, Sr. Unsecd. Note, 4.875%, 1/16/2024 | 3,706,784 | |
11,000,000 | 1 | Air Lease Corp., Sr. Unsecd. Note, Series MTN, 0.466% (3-month USLIBOR +0.350%), 12/15/2022 | 11,023,741 |
34,975,000 | Air Lease Corp., Sr. Unsecd. Note, Series MTN, 0.700%, 2/15/2024 | 34,763,734 | |
TOTAL | 51,624,328 | ||
Financial Institution - Insurance - Health— 0.4% | |||
25,000,000 | Anthem, Inc., Sr. Unsecd. Note, 0.450%, 3/15/2023 | 25,031,069 | |
11,035,000 | CIGNA Corp., Sr. Unsecd. Note, 0.613%, 3/15/2024 | 11,014,937 | |
TOTAL | 36,046,006 | ||
Financial Institution - Insurance - Life— 1.6% | |||
5,090,000 | AIG Global Funding, Sr. Note, 144A, 0.650%, 6/17/2024 | 5,078,917 | |
15,000,000 | AIG Global Funding, Sr. Secd. Note, 144A, 0.450%, 12/8/2023 | 15,000,955 | |
6,820,000 | AIG Global Funding, Sr. Secd. Note, 144A, 0.800%, 7/7/2023 | 6,876,172 | |
6,000,000 | Mass Mutual Global Funding II, Sec. Fac. Bond, 144A, 2.750%, 6/22/2024 | 6,330,650 | |
6,475,000 | Mass Mutual Global Funding II, Sr. Secd. Note, 144A, 0.850%, 6/9/2023 | 6,532,326 |
Principal Amount or Shares | Value | ||
CORPORATE BONDS— continued | |||
Financial Institution - Insurance - Life— continued | |||
$ 10,000,000 | 1,3 | Met Life Global Funding I, Sec. Fac. Bond, 144A, 0.350% (Secured Overnight Financing Rate +0.300%), 9/27/2024 | $10,012,967 |
12,000,000 | 1 | Met Life Global Funding I, Sec. Fac. Bond, 144A, 0.370% (Secured Overnight Financing Rate +0.320%), 1/7/2024 | 12,045,172 |
5,555,000 | Met Life Global Funding I, Sec. Fac. Bond, 144A, 0.900%, 6/8/2023 | 5,610,213 | |
4,765,000 | Met Life Global Funding I, Sr. Secd. Note, 144A, 2.650%, 4/8/2022 | 4,826,590 | |
4,375,000 | 3 | Met Life Global Funding I, Sec. Fac. Bond, 144A, 0.550%, 6/7/2024 | 4,368,862 |
7,000,000 | 1 | Met Life Global Funding I, Sec. Fac. Bond, 144A, 0.620% (Secured Overnight Financing Rate +0.570%), 1/13/2023 | 7,040,095 |
2,915,000 | Met Life Global Funding I, Sec. Fac. Bond, 144A, 2.400%, 6/17/2022 | 2,960,922 | |
5,000,000 | 1 | New York Life Global Funding, Sec. Fac. Bond, 144A, 0.270% (Secured Overnight Financing Rate +0.220%), 2/2/2023 | 5,010,255 |
5,000,000 | 1 | New York Life Global Funding, Sec. Fac. Bond, 144A, 0.410% (Secured Overnight Financing Rate +0.360%), 10/21/2023 | 5,026,938 |
16,000,000 | Pacific Life Global Funding II, Term Loan - 2nd Lien, 144A, 0.500%, 9/23/2023 | 16,033,760 | |
9,000,000 | 1 | Principal Life Global Funding II, Sec. Fac. Bond, 144A, 0.430% (Secured Overnight Financing Rate +0.380%), 8/23/2024 | 9,037,786 |
22,815,000 | 3 | Principal Life Global Funding II, Sec. Fac. Bond, 144A, 0.500%, 1/8/2024 | 22,791,995 |
8,000,000 | 1 | Principal Life Global Funding II, Sec. Fac. Bond, 144A, 0.500% (Secured Overnight Financing Rate +0.450%), 4/12/2024 | 8,033,882 |
TOTAL | 152,618,457 | ||
Technology— 1.1% | |||
1,033,000 | 1 | Apple, Inc., Sr. Unsecd. Note, 0.625% (3-month USLIBOR +0.500%), 2/9/2022 | 1,035,021 |
15,000,000 | Apple, Inc., Sr. Unsecd. Note, 0.750%, 5/11/2023 | 15,113,397 | |
6,535,000 | Apple, Inc., Sr. Unsecd. Note, 1.700%, 9/11/2022 | 6,624,769 | |
10,000,000 | Broadcom, Inc., Sr. Unsecd. Note, 2.250%, 11/15/2023 | 10,315,751 | |
5,835,000 | Dell International LLC / EMC Corp., 4.000%, 7/15/2024 | 6,314,579 | |
10,590,000 | Fidelity National Information Services, Inc., Sr. Unsecd. Note, 0.375%, 3/1/2023 | 10,598,374 | |
4,615,000 | Fiserv, Inc., Sr. Unsecd. Note, 2.750%, 7/1/2024 | 4,861,341 | |
16,360,000 | Micron Technology, Inc., Sr. Unsecd. Note, 2.497%, 4/24/2023 | 16,859,471 | |
5,000,000 | 1 | Qualcomm, Inc., Sr. Unsecd. Note, 0.858% (3-month USLIBOR +0.730%), 1/30/2023 | 5,047,410 |
8,015,000 | Skyworks Solutions, Inc., Sr. Unsecd. Note, 0.900%, 6/1/2023 | 8,031,476 | |
14,750,000 | VMware, Inc., Sr. Unsecd. Note, 0.600%, 8/15/2023 | 14,773,128 | |
TOTAL | 99,574,717 | ||
Transportation - Airlines— 0.2% | |||
15,525,000 | Southwest Airlines Co., Sr. Unsecd. Note, 4.750%, 5/4/2023 | 16,531,344 |
Principal Amount or Shares | Value | ||
CORPORATE BONDS— continued | |||
Transportation - Services— 0.0% | |||
$ 3,200,000 | Penske Truck Leasing Co. LP & PTL Finance Corp., Sr. Unsecd. Note, 144A, 3.450%, 7/1/2024 | $3,410,033 | |
Utility - Electric— 3.8% | |||
1,500,000 | AEP Texas, Inc., Sr. Unsecd. Note, Series WI, 2.400%, 10/1/2022 | 1,527,054 | |
12,060,000 | 1 | American Electric Power Co., Inc., Sr. Unsecd. Note, Series A, 0.605% (3-month USLIBOR +0.480%), 11/1/2023 | 12,067,955 |
31,575,000 | Black Hills Corp., Sr. Unsecd. Note, 1.037%, 8/23/2024 | 31,579,943 | |
30,330,000 | 1 | CenterPoint Energy Resources Corp., Sr. Unsecd. Note, 0.619% (3-month USLIBOR +0.500%), 3/2/2023 | 30,335,048 |
9,375,000 | CenterPoint Energy, Inc., Sr. Unsecd. Note, 0.700%, 5/13/2024 | 9,394,988 | |
20,000,000 | Dominion Energy, Inc., Sr. Unsecd. Note, 144A, 2.450%, 1/15/2023 | 20,516,544 | |
16,885,000 | 1 | Dominion Energy, Inc., Sr. Unsecd. Note, Series D, 0.646% (3-month USLIBOR +0.530%), 9/15/2023 | 16,897,284 |
13,540,000 | 1 | Duke Energy Progress LLC, Sr. Unsecd. Note, Series A, 0.304% (3-month USLIBOR +0.180%), 2/18/2022 | 13,540,345 |
7,660,000 | Emera US Finance LP, Sr. Unsecd. Note, 144A, 0.833%, 6/15/2024 | 7,638,433 | |
6,935,000 | EverSource Energy, Sr. Unsecd. Note, Series Q, 0.800%, 8/15/2025 | 6,832,420 | |
47,010,000 | 1 | EverSource Energy, Sr. Unsecd. Note, Series T, 0.300% (Secured Overnight Financing Rate +0.250%), 8/15/2023 | 47,005,020 |
15,295,000 | 1 | Mississippi Power Co., Sr. Unsecd. Note, Series A, 0.350% (Secured Overnight Financing Rate +0.300%), 6/28/2024 | 15,313,994 |
16,930,000 | National Rural Utilities Cooperative Finance Corp., Sr. Unsecd. Note, Series MTN, 1.750%, 1/21/2022 | 17,006,912 | |
20,015,000 | 1 | NextEra Energy Capital Holdings, Inc., Sr. Unsecd. Note, 0.400% (3-month USLIBOR +0.270%), 2/22/2023 | 20,017,108 |
8,570,000 | 1 | NextEra Energy Capital Holdings, Inc., Sr. Unsecd. Note, 0.590% (Secured Overnight Financing Rate +0.540%), 3/1/2023 | 8,609,092 |
19,160,000 | OGE Energy Corp., Sr. Unsecd. Note, 0.703%, 5/26/2023 | 19,162,024 | |
14,970,000 | 1 | PPL Electric Utilities Corp., 0.380% (Secured Overnight Financing Rate +0.330%), 6/24/2024 | 14,984,371 |
17,855,000 | 1 | PPL Electric Utilities Corp., Term Loan - 1st Lien, 0.382% (3-month USLIBOR +0.250%), 9/28/2023 | 17,855,771 |
2,935,000 | Public Service Enterprises Group, Inc., Sr. Unsecd. Note, 2.875%, 6/15/2024 | 3,092,077 | |
10,000,000 | Southern Co., Sr. Unsecd. Note, Series 21-A, 0.600%, 2/26/2024 | 9,982,768 | |
10,000,000 | WEC Energy Group, Inc., Sr. Unsecd. Note, 0.550%, 9/15/2023 | 10,001,118 | |
10,290,000 | Wisconsin Public Service, Sr. Unsecd. Note, 3.350%, 11/21/2021 | 10,329,700 | |
8,575,000 | Xcel Energy, Inc., Sr. Unsecd. Note, 0.500%, 10/15/2023 | 8,586,773 | |
TOTAL | 352,276,742 | ||
Utility - Natural Gas— 1.0% | |||
18,950,000 | 1 | Atmos Energy Corp., Sr. Unsecd. Note, 0.496% (3-month USLIBOR +0.380%), 3/9/2023 | 18,952,716 |
Principal Amount or Shares | Value | ||
CORPORATE BONDS— continued | |||
Utility - Natural Gas— continued | |||
$ 8,935,000 | 1 | Enbridge, Inc., Sr. Unsecd. Note, 0.450% (Secured Overnight Financing Rate +0.400%), 2/17/2023 | $8,963,360 |
25,000,000 | Enbridge, Inc., Sr. Unsecd. Note, 4.000%, 10/1/2023 | 26,487,227 | |
4,965,000 | National Fuel Gas Co., Sr. Unsecd. Note, 5.500%, 1/15/2026 | 5,722,183 | |
24,875,000 | 1 | ONE Gas, Inc., Sr. Unsecd. Note, 0.724% (3-month USLIBOR +0.610%), 3/11/2023 | 24,877,196 |
4,565,000 | Southern Natural Gas, Sr. Unsecd. Note, 144A, 0.625%, 4/28/2023 | 4,564,267 | |
TOTAL | 89,566,949 | ||
Utility - Natural Gas Distributor— 0.1% | |||
9,575,000 | 1 | Southern California Gas Co., Sr. Unsecd. Note, 0.465% (3-month USLIBOR +0.350%), 9/14/2023 | 9,578,555 |
1,000,000 | The East Ohio Gas Company, Sr. Unsecd. Note, 144A, 1.300%, 6/15/2025 | 1,002,901 | |
TOTAL | 10,581,456 | ||
TOTAL CORPORATE BONDS (IDENTIFIED COST $3,138,671,262) | 3,155,210,813 | ||
1 | COLLATERALIZED MORTGAGE OBLIGATIONS— 7.6% | ||
Federal Home Loan Mortgage Corporation— 5.8% | |||
1,886,934 | Federal Home Loan Mortgage Corp. REMIC, Series 2736, Class FB, 0.636% (1-month USLIBOR +0.550%), 12/15/2033 | 1,894,938 | |
1,165,333 | Federal Home Loan Mortgage Corp. REMIC, Series 2819, Class F, 0.483% (1-month USLIBOR +0.400%), 6/15/2034 | 1,170,686 | |
180,348 | Federal Home Loan Mortgage Corp. REMIC, Series 3071, Class TF, 0.383% (1-month USLIBOR +0.300%), 4/15/2035 | 181,050 | |
827,260 | Federal Home Loan Mortgage Corp. REMIC, Series 3084, Class XF, 0.603% (1-month USLIBOR +0.520%), 12/15/2035 | 841,220 | |
202,919 | Federal Home Loan Mortgage Corp. REMIC, Series 3152, Class WF, 0.543% (1-month USLIBOR +0.460%), 2/15/2034 | 205,624 | |
829,675 | Federal Home Loan Mortgage Corp. REMIC, Series 3153, Class EF, 0.493% (1-month USLIBOR +0.410%), 5/15/2036 | 835,322 | |
333,948 | Federal Home Loan Mortgage Corp. REMIC, Series 3153, Class FJ, 0.475% (1-month USLIBOR +0.380%), 5/15/2036 | 336,185 | |
169,869 | Federal Home Loan Mortgage Corp. REMIC, Series 3156, Class HF, 0.568% (1-month USLIBOR +0.485%), 8/15/2035 | 172,312 | |
63,370 | Federal Home Loan Mortgage Corp. REMIC, Series 3191, Class FE, 0.483% (1-month USLIBOR +0.400%), 7/15/2036 | 63,861 | |
279,084 | Federal Home Loan Mortgage Corp. REMIC, Series 3211, Class FN, 0.383% (1-month USLIBOR +0.300%), 9/15/2036 | 280,308 | |
276,180 | Federal Home Loan Mortgage Corp. REMIC, Series 3317, Class F, 0.483% (1-month USLIBOR +0.400%), 7/15/2036 | 278,327 | |
81,326 | Federal Home Loan Mortgage Corp. REMIC, Series 3320, Class FM, 0.483% (1-month USLIBOR +0.400%), 7/15/2036 | 82,104 | |
68,828 | Federal Home Loan Mortgage Corp. REMIC, Series 3339, Class AF, 0.533% (1-month USLIBOR +0.450%), 7/15/2037 | 69,357 |
Principal Amount or Shares | Value | ||
1 | COLLATERALIZED MORTGAGE OBLIGATIONS— continued | ||
Federal Home Loan Mortgage Corporation— continued | |||
$ 1,317,521 | Federal Home Loan Mortgage Corp. REMIC, Series 3382, Class FG, 0.683% (1-month USLIBOR +0.600%), 11/15/2037 | $1,339,595 | |
1,001,651 | Federal Home Loan Mortgage Corp. REMIC, Series 3387, Class PF, 0.503% (1-month USLIBOR +0.420%), 11/15/2037 | 1,010,427 | |
107,002 | Federal Home Loan Mortgage Corp. REMIC, Series 3542, Class NF, 0.833% (1-month USLIBOR +0.750%), 7/15/2036 | 109,181 | |
366,035 | Federal Home Loan Mortgage Corp. REMIC, Series 3556, Class FA, 0.993% (1-month USLIBOR +0.910%), 7/15/2037 | 374,586 | |
14,515,180 | Federal Home Loan Mortgage Corp. REMIC, Series 3843, Class F, 0.413% (1-month USLIBOR +0.330%), 4/15/2041 | 14,596,474 | |
5,983,596 | Federal Home Loan Mortgage Corp. REMIC, Series 3843, Class FB, 0.413% (1-month USLIBOR +0.330%), 4/15/2041 | 6,007,541 | |
1,451,406 | Federal Home Loan Mortgage Corp. REMIC, Series 4238, Class FT, 0.433% (1-month USLIBOR +0.350%), 8/15/2043 | 1,460,163 | |
1,530,171 | Federal Home Loan Mortgage Corp. REMIC, Series 4604, Class FB, 0.483% (1-month USLIBOR +0.400%), 8/15/2046 | 1,544,220 | |
2,630,674 | Federal Home Loan Mortgage Corp. REMIC, Series 4703, Class FA, 0.476% (1-month USLIBOR +0.350%), 7/15/2047 | 2,639,537 | |
20,375,105 | Federal Home Loan Mortgage Corp. REMIC, Series 4901, Class BF, 0.486% (1-month USLIBOR +0.400%), 7/25/2049 | 20,566,433 | |
6,189,595 | Federal Home Loan Mortgage Corp. REMIC, Series 4916, Class FA, 0.486% (1-month USLIBOR +0.400%), 9/25/2049 | 6,259,722 | |
28,127,068 | Federal Home Loan Mortgage Corp. REMIC, Series 4920, Class FA, 0.536% (1-month USLIBOR +0.450%), 10/25/2049 | 28,443,601 | |
23,876,014 | Federal Home Loan Mortgage Corp. REMIC, Series 4988, Class KF, 0.436% (1-month USLIBOR +0.350%), 7/25/2050 | 24,111,589 | |
35,589,438 | Federal Home Loan Mortgage Corp. REMIC, Series 4993, Class F, 0.536% (1-month USLIBOR +0.450%), 7/25/2050 | 35,908,614 | |
28,287,559 | Federal Home Loan Mortgage Corp. REMIC, Series 5031, Class FB, 0.350% (Secured Overnight Financing Rate +0.300%), 4/25/2041 | 28,338,171 | |
9,088,816 | Federal Home Loan Mortgage Corp. REMIC, Series 5057, Class FH, 0.300% (Secured Overnight Financing Rate +0.250%), 12/25/2050 | 9,097,177 | |
25,000,000 | Federal Home Loan Mortgage Corp. REMIC, Series K-F121, Class AS, 0.230% (30-DAY AVERAGE SOFR +0.180%), 8/25/2028 | 25,000,000 | |
11,687,038 | Federal Home Loan Mortgage Corp. REMIC, Series KF79, Class AL, 0.552% (1-month USLIBOR +0.470%), 5/25/2030 | 11,757,950 | |
3,419,739 | Federal Home Loan Mortgage Corp. REMIC, Series KF87, Class AL, 0.432% (1-month USLIBOR +0.350%), 8/25/2030 | 3,430,303 | |
27,074,270 | Federal Home Loan Mortgage Corp. REMIC, Series KF90, Class AL, 0.412% (1-month USLIBOR +0.330%), 9/25/2030 | 27,132,038 | |
26,000,000 | Federal Home Loan Mortgage Corp. REMIC, Series KF92, Class AL, 0.412% (1-month USLIBOR +0.330%), 10/25/2030 | 26,060,187 | |
27,606,087 | Federal Home Loan Mortgage Corp. REMIC, Series KF93, Class AL, 0.362% (1-month USLIBOR +0.280%), 10/25/2027 | 27,630,593 |
Principal Amount or Shares | Value | ||
1 | COLLATERALIZED MORTGAGE OBLIGATIONS— continued | ||
Federal Home Loan Mortgage Corporation— continued | |||
$ 35,058,051 | Federal Home Loan Mortgage Corp. REMIC, Series KF94, Class AL, 0.382% (1-month USLIBOR +0.300%), 11/25/2030 | $35,130,538 | |
57,088,998 | Federal Home Loan Mortgage Corp. REMIC, Series KF95, Class AL, 0.342% (1-month USLIBOR +0.260%), 11/25/2030 | 57,088,998 | |
38,500,000 | Federal Home Loan Mortgage Corp. REMIC, Series KF96, Class AL, 0.342% (1-month USLIBOR +0.260%), 12/25/2030 | 38,493,401 | |
62,500,000 | Federal Home Loan Mortgage Corp. REMIC, Series KF97, Class AS, 0.300% (30-DAY AVERAGE SOFR +0.250%), 12/25/2030 | 62,453,163 | |
30,000,000 | Federal Home Loan Mortgage Corp. REMIC, Series KF98, Class AL, 0.350% (1-month USLIBOR +0.170%), 12/25/2030 | 30,000,000 | |
TOTAL | 532,395,496 | ||
Federal National Mortgage Association— 0.9% | |||
101,681 | Federal National Mortgage Association REMIC, Series 2002-77, Class FA, 1.087% (1-month USLIBOR +1.000%), 12/18/2032 | 104,147 | |
337,552 | Federal National Mortgage Association REMIC, Series 2006-119, Class CF, 0.386% (1-month USLIBOR +0.300%), 12/25/2036 | 339,092 | |
246,043 | Federal National Mortgage Association REMIC, Series 2006-44, Class FK, 0.516% (1-month USLIBOR +0.430%), 6/25/2036 | 248,868 | |
1,224,107 | Federal National Mortgage Association REMIC, Series 2006-61, Class FQ, 0.486% (1-month USLIBOR +0.400%), 7/25/2036 | 1,233,974 | |
262,404 | Federal National Mortgage Association REMIC, Series 2006-79, Class DF, 0.436% (1-month USLIBOR +0.350%), 8/25/2036 | 263,938 | |
777,408 | Federal National Mortgage Association REMIC, Series 2006-81, Class FB, 0.436% (1-month USLIBOR +0.350%), 9/25/2036 | 782,459 | |
647,585 | Federal National Mortgage Association REMIC, Series 2006-W1, Class 2AF1, 0.306% (1-month USLIBOR +0.220%), 2/25/2046 | 640,135 | |
4,170,412 | Federal National Mortgage Association REMIC, Series 2007-22, Class FQ, 0.316% (1-month USLIBOR +0.230%), 3/25/2037 | 4,177,260 | |
424,978 | Federal National Mortgage Association REMIC, Series 2007-88, Class FY, 0.546% (1-month USLIBOR +0.460%), 9/25/2037 | 429,615 | |
235,443 | Federal National Mortgage Association REMIC, Series 2007-97, Class FE, 0.536% (1-month USLIBOR +0.450%), 7/25/2037 | 237,867 | |
114,466 | Federal National Mortgage Association REMIC, Series 2008-69, Class FB, 1.086% (1-month USLIBOR +1.000%), 6/25/2037 | 117,578 | |
6,977 | Federal National Mortgage Association REMIC, Series 2009-42, Class FG, 0.886% (1-month USLIBOR +0.800%), 5/25/2039 | 6,987 | |
20,286 | Federal National Mortgage Association REMIC, Series 2009-63, Class FB, 0.586% (1-month USLIBOR +0.500%), 8/25/2039 | 20,523 | |
284,220 | Federal National Mortgage Association REMIC, Series 2009-69, Class F, 0.936% (1-month USLIBOR +0.850%), 4/25/2037 | 291,190 | |
7,934,609 | Federal National Mortgage Association REMIC, Series 2010-111, Class FM, 0.486% (1-month USLIBOR +0.400%), 10/25/2040 | 8,020,446 | |
12,675,524 | Federal National Mortgage Association REMIC, Series 2016-24, Class FG, 0.436% (1-month USLIBOR +0.350%), 5/25/2046 | 12,750,533 |
Principal Amount or Shares | Value | ||
1 | COLLATERALIZED MORTGAGE OBLIGATIONS— continued | ||
Federal National Mortgage Association— continued | |||
$ 2,584,908 | Federal National Mortgage Association REMIC, Series 2017-24, Class FB, 0.436% (1-month USLIBOR +0.350%), 4/25/2047 | $2,595,350 | |
27,086,690 | Federal National Mortgage Association REMIC, Series 2018-85, Class FE, 0.386% (1-month USLIBOR +0.300%), 12/25/2048 | 27,187,732 | |
2,129,656 | Federal National Mortgage Association REMIC, Series 2019-31, Class FA, 0.486% (1-month USLIBOR +0.400%), 7/25/2049 | 2,153,170 | |
9,868,633 | Federal National Mortgage Association REMIC, Series 2020-47, Class FH, 0.486% (1-month USLIBOR +0.400%), 7/25/2050 | 9,930,313 | |
14,777,350 | Federal National Mortgage Association REMIC, Series 2020-68, Class FB, 0.386% (1-month USLIBOR +0.300%), 10/25/2060 | 14,813,171 | |
TOTAL | 86,344,348 | ||
Government National Mortgage Association— 0.9% | |||
7,143,710 | Government National Mortgage Association REMIC, Series 2005-41, Class FC, 0.387% (1-month USLIBOR +0.300%), 5/20/2035 | 7,212,124 | |
4,023,465 | Government National Mortgage Association REMIC, Series 2005-84, Class FA, 0.287% (1-month USLIBOR +0.200%), 11/20/2035 | 4,025,920 | |
3,296,013 | Government National Mortgage Association REMIC, Series 2007-21, Class F, 0.384% (1-month USLIBOR +0.300%), 4/16/2037 | 3,312,024 | |
5,099,978 | Government National Mortgage Association REMIC, Series 2012-H31, Class FA, 0.439% (1-month USLIBOR +0.350%), 11/20/2062 | 5,102,434 | |
2,165,375 | Government National Mortgage Association REMIC, Series 2013-26, Class GF, 0.387% (1-month USLIBOR +0.300%), 2/20/2043 | 2,172,974 | |
3,456,632 | Government National Mortgage Association REMIC, Series 2013-H16, Class FA, 0.629% (1-month USLIBOR +0.540%), 7/20/2063 | 3,470,220 | |
4,518,272 | Government National Mortgage Association REMIC, Series 2013-H17, Class FA, 0.639% (1-month USLIBOR +0.550%), 7/20/2063 | 4,532,544 | |
5,258,671 | Government National Mortgage Association REMIC, Series 2015-111, Class HF, 0.387% (1-month USLIBOR +0.300%), 8/20/2045 | 5,266,077 | |
4,872,878 | Government National Mortgage Association REMIC, Series 2017-133, Class FB, 0.334% (1-month USLIBOR +0.250%), 9/16/2047 | 4,881,794 | |
30,154,274 | Government National Mortgage Association REMIC, Series 2018-115, Class DF, 0.451% (1-month USLIBOR +0.300%), 8/20/2048 | 30,263,647 | |
14,817,919 | Government National Mortgage Association REMIC, Series 2020-83, Class FA, 0.487% (1-month USLIBOR +0.400%), 6/20/2039 | 14,956,696 | |
TOTAL | 85,196,454 | ||
TOTAL COLLATERALIZED MORTGAGE OBLIGATIONS (IDENTIFIED COST $703,347,455) | 703,936,298 | ||
4 | COMMERCIAL PAPER— 1.8% | ||
Communications - Telecom Wirelines— 0.5% | |||
50,825,000 | AT&T, Inc., 0.401%, 12/15/2021 | 50,805,579 | |
Energy - Midstream— 0.5% | |||
47,144,000 | Energy Transfer LP, 0.350%, 10/1/2021 | 47,143,606 |
Principal Amount or Shares | Value | ||
4 | COMMERCIAL PAPER— continued | ||
Financial Institution - Banking— 0.8% | |||
$ 40,000,000 | HSBC USA, Inc., 0.431%, 1/3/2022 | $39,974,456 | |
9,250,000 | NatWest Markets PLC, 0.371%, 1/7/2022 | 9,246,286 | |
23,850,000 | NatWest Markets PLC, 0.411%, 1/4/2022 | 23,840,842 | |
TOTAL | 73,061,584 | ||
TOTAL COMMERCIAL PAPER (IDENTIFIED COST $170,946,614) | 171,010,769 | ||
COMMERCIAL MORTGAGE-BACKED SECURITIES— 1.6% | |||
Commercial Mortgage— 1.6% | |||
20,000,000 | 1 | BHMS Mortgage Trust 2018-ATLS, Class A, 1.333% (1-month USLIBOR +1.250%), 7/15/2035 | 20,012,480 |
30,000,000 | 1 | Cosmopolitan Hotel Trust 2017-CSMO, Class B, 1.483% (1-month USLIBOR +1.400%), 11/15/2036 | 29,999,955 |
14,053,523 | 1 | DBWF Mortgage Trust 2018-GLKS, Class A, 1.117% (1-month USLIBOR +1.030%), 12/19/2030 | 14,071,344 |
25,000,000 | 1 | DBWF Mortgage Trust 2018-GLKS, Class B, 1.437% (1-month USLIBOR +1.350%), 12/19/2030 | 24,969,163 |
38,000,000 | Fontainebleau Miami Beach Trust, Class B, 3.447%, 12/10/2036 | 39,795,568 | |
14,051,428 | 1 | UBS-Barclays Commercial Mortgage Trust 2013-C6, Class A3FL, 0.872% (1-month USLIBOR +0.790%), 4/10/2046 | 14,161,431 |
4,213,942 | 1 | WF-RBS Commercial Mortgage Trust 2012-C7, Class AFL, 1.284% (1-month USLIBOR +1.200%), 6/15/2045 | 4,217,521 |
TOTAL COMMERCIAL MORTGAGE-BACKED SECURITIES (IDENTIFIED COST $145,462,524) | 147,227,462 | ||
NON-AGENCY MORTGAGE-BACKED SECURITIES— 1.0% | |||
Non-Agency Mortgage— 1.0% | |||
28,711,683 | BRASS PLC, Class A1, 0.669%, 4/16/2069 | 28,711,511 | |
141,812 | 1 | Countrywide Alternative Loan Trust 2005-51, Class 3AB3, 1.183% (1-month USLIBOR +1.100%), 11/20/2035 | 81,843 |
12,454,903 | 1 | Gosforth Funding PLC 2018-1A, Class A1, 0.579% (3-month USLIBOR +0.450%), 8/25/2060 | 12,470,547 |
92,451 | 1 | Impac CMB Trust 2004-7, Class 1A2, 1.006% (1-month USLIBOR +0.920%), 11/25/2034 | 90,108 |
139,125 | 1 | Impac CMB Trust 2004-9, Class 1A2, 0.966% (1-month USLIBOR +0.880%), 1/25/2035 | 136,525 |
9,100,000 | Lanark Master Issuer PLC 2020-1A, Class 1A, 2.277%, 12/22/2069 | 9,287,287 | |
229,369 | 1 | Mellon Residential Funding Corp. 2001-TBC1, Class A1, 0.783% (1-month USLIBOR +0.700%), 11/15/2031 | 223,836 |
22,500,000 | 1 | Permanent Master Issuer PLC 2019-1A, Class 1A1, 0.676% (3-month USLIBOR +0.550%), 7/15/2058 | 22,502,543 |
646,351 | Sequoia Mortgage Trust 2012-6, Class A2, 1.808%, 12/25/2042 | 645,289 | |
14,000,000 | 1 | Silverstone Master Issuer 2018-1A, Class 1A, 0.524% (3-month USLIBOR +0.390%), 1/21/2070 | 14,015,064 |
Principal Amount or Shares | Value | ||
NON-AGENCY MORTGAGE-BACKED SECURITIES— continued | |||
Non-Agency Mortgage— continued | |||
$ 266,715 | 1 | Washington Mutual 2006-AR1, Class 2A1B, 1.162% (Fed Reserve 12Mo Cumulative Avg 1 Yr CMT +1.070%), 1/25/2046 | $264,252 |
468,001 | 1 | Washington Mutual 2006-AR15, Class 1A, 0.932% (Fed Reserve 12Mo Cumulative Avg 1 Yr CMT +0.840%), 11/25/2046 | 448,968 |
253,917 | 1 | Washington Mutual 2006-AR17, Class 1A, 0.919% (Fed Reserve 12Mo Cumulative Avg 1 Yr CMT +0.820%), 12/25/2046 | 240,453 |
TOTAL NON-AGENCY MORTGAGE-BACKED SECURITIES (IDENTIFIED COST $89,067,613) | 89,118,226 | ||
CERTIFICATES OF DEPOSIT— 0.3% | |||
Financial Institution - Banking— 0.3% | |||
20,000,000 | National Bank of Kuwait, 0.420%, 2/18/2022 | 20,011,918 | |
9,250,000 | National Bank of Kuwait, 0.450%, 2/3/2022 | 9,256,056 | |
TOTAL CERTIFICATES OF DEPOSIT (IDENTIFIED COST $29,250,000) | 29,267,974 | ||
1 | ADJUSTABLE RATE MORTGAGES— 0.0% | ||
Federal National Mortgage Association— 0.0% | |||
57,560 | FNMA ARM, 1.499%, 5/1/2040 | 58,784 | |
542,160 | FNMA ARM, 1.556%, 8/1/2033 | 548,538 | |
502,302 | FNMA ARM, 2.445%, 7/1/2034 | 520,902 | |
37,786 | FNMA ARM, 2.618%, 4/1/2030 | 38,828 | |
TOTAL ADJUSTABLE RATE MORTGAGES (IDENTIFIED COST $1,154,713) | 1,167,052 | ||
MORTGAGE-BACKED SECURITY— 0.0% | |||
Federal National Mortgage Association— 0.0% | |||
344,978 | Federal National Mortgage Association, Pool 728568, 6.500%, 10/1/2033 (IDENTIFIED COST $364,707) | 411,285 | |
INVESTMENT COMPANIES— 13.7% | |||
29,519,595 | Bank Loan Core Fund | 285,749,679 | |
4,995,005 | Federated Hermes Conservative Microshort Fund | 50,000,000 | |
12,188,530 | Federated Hermes Government Obligations Fund, Premier Shares, 0.03%5 | 12,188,530 | |
811,011,640 | Federated Hermes Institutional Prime Value Obligations Fund, Institutional Shares, 0.02%5 | 811,254,944 | |
17,230,356 | High Yield Bond Core Fund | 109,929,673 | |
TOTAL INVESTMENT COMPANIES (IDENTIFIED COST $1,262,744,808) | 1,269,122,826 | ||
TOTAL INVESTMENT IN SECURITIES—102.7% (IDENTIFIED COST $9,477,253,834)6 | 9,524,246,734 | ||
OTHER ASSETS AND LIABILITIES - NET—(2.7)%7 | (252,598,847) | ||
TOTAL NET ASSETS—100% | $9,271,647,887 |
Description | Number of Contracts | Notional Value | Expiration Date | Value and Unrealized Appreciation |
Short Futures: | ||||
8United States Treasury Notes 2-Year Short Futures | 1,000 | $220,054,688 | December 2021 | $30,535 |
8United States Treasury Notes 5-Year Short Futures | 1,300 | $159,564,844 | December 2021 | $408,402 |
8United States Treasury Notes 10-Year Short Futures | 1,100 | $144,770,313 | December 2021 | $929,837 |
NET UNREALIZED APPRECIATION ON FUTURES CONTRACTS | $1,368,774 | |||
Settlement Date | Counterparty | Foreign Currency Units to Deliver/Receive | In Exchange For | Net Unrealized Appreciation | |
Contracts Sold: | |||||
4/21/2022 | HSBC Bank USA | 5,023,456 | EUR | $6,104,147 | $260,181 |
NET UNREALIZED APPRECIATION ON FOREIGN EXCHANGE CONTRACTS | $260,181 | ||||
Affiliates | Value as of 9/30/2020 | Purchases at Cost | Proceeds from Sales |
Federated Bank Loan Core Fund | $90,951,701 | $190,193,380 | $— |
Federated Government Obligations Fund, Premier Shares* | $3,739,340 | $62,427,681 | $(53,978,491) |
Federated Hermes Conservative Microshort Fund | $— | $50,000,000 | $— |
Federated Institutional Prime Value Obligations Fund, Institutional Shares | $240,928,252 | $4,791,259,791 | $(4,220,807,900) |
High Yield Bond Portfolio | $82,315,704 | $23,192,157 | $— |
TOTAL OF AFFILIATED TRANSACTIONS | $417,934,997 | $5,117,073,009 | $(4,274,786,391) |
Change in Unrealized Appreciation/ Depreciation | Net Realized Gain/ (Loss) | Value as of 9/30/2021 | Shares Held as of 9/30/2021 | Dividend Income |
$4,604,598 | $— | $285,749,679 | 29,519,595 | $7,943,380 |
N/A | N/A | $12,188,530 | 12,188,530 | $847 |
$— | $— | $50,000,000 | 4,995,005 | $— |
$(95,050) | $(30,149) | $811,254,944 | 811,011,640 | $348,366 |
$4,421,812 | $— | $109,929,673 | 17,230,356 | $5,701,362 |
$8,931,360 | $(30,149) | $1,269,122,826 | 874,945,126 | $13,993,955 |
* | All or a portion of the balance/activity for the fund relates to cash collateral received on securities lending transactions. |
1 | Floating/adjustable note with current rate and current maturity or next reset date shown. Adjustable rate mortgage security coupons are based on the weighted average note rates of the underlying mortgages less the guarantee and servicing fees. These securities do not indicate an index and spread in their description above. |
2 | Market quotations and price evaluations are not available. Fair value determined using significant unobservable inputs in accordance with procedures established by and under the general supervision of the Fund’s Board of Directors (the “Directors”). |
3 | All or a portion of these securities are temporarily on loan to unaffiliated broker/dealers. |
4 | Each issue shows the rate of discount at the time of purchase for discount issues, or the coupon for interest bearing issues. |
5 | 7-day net yield. |
6 | The cost of investments for federal tax purposes amounts to $9,477,275,782. |
7 | Assets, other than investments in securities, less liabilities. See Statement of Assets and Liabilities. |
8 | Non-income-producing security. |
The following is a summary of the inputs used, as of September 30, 2021, in valuing the Fund’s assets carried at fair value:
Valuation Inputs | ||||
Level 1— Quoted Prices | Level 2— Other Significant Observable Inputs | Level 3— Significant Unobservable Inputs | Total | |
Debt Securities: | ||||
Asset-Backed Securities | $— | $3,957,774,029 | $0 | $3,957,774,029 |
Corporate Bonds | — | 3,155,210,813 | — | 3,155,210,813 |
Collateralized Mortgage Obligations | — | 703,936,298 | — | 703,936,298 |
Commercial Paper | — | 171,010,769 | — | 171,010,769 |
Commercial Mortgage-Backed Securities | — | 147,227,462 | — | 147,227,462 |
Non-Agency Mortgage-Backed Securities | — | 89,118,226 | — | 89,118,226 |
Certificates Of Deposit | — | 29,267,974 | — | 29,267,974 |
Adjustable Rate Mortgages | — | 1,167,052 | — | 1,167,052 |
Mortgage-Backed Security | — | 411,285 | — | 411,285 |
Investment Companies | 1,269,122,826 | — | — | 1,269,122,826 |
TOTAL SECURITIES | $1,269,122,826 | $8,255,123,908 | $0 | $9,524,246,734 |
Other Financial Instruments: | ||||
Assets | ||||
Futures Contracts | $1,368,774 | $— | $— | $1,368,774 |
Foreign Exchange Contracts | — | 260,181 | — | 260,181 |
TOTAL OTHER FINANCIAL INSTRUMENTS | $1,368,774 | $260,181 | $— | $1,628,955 |
The following acronym(s) are used throughout this portfolio: | ||
ARM | —Adjustable Rate Mortgage | |
BKNT | —Bank Notes | |
CMT | —Constant Maturity Treasury | |
EMTN | —Euro Medium Term Loan | |
EUR | —Euro Currency | |
FNMA | —Federal National Mortgage Association | |
GMTN | —Global Medium Term Note | |
LIBOR | —London Interbank Offered Rate | |
MTN | —Medium Term Note | |
NIM | —Net Interest Margin | |
REMIC | —Real Estate Mortgage Investment Conduit | |
SOFR | —Secured Overnight Financing Rate | |
Year Ended September 30, | |||||
2021 | 2020 | 2019 | 2018 | 2017 | |
Net Asset Value, Beginning of Period | $9.19 | $9.16 | $9.10 | $9.12 | $9.12 |
Income From Investment Operations: | |||||
Net investment income (loss) | 0.06 | 0.151 | 0.19 | 0.15 | 0.09 |
Net realized and unrealized gain (loss) | 0.04 | 0.03 | 0.06 | (0.02) | 0.002 |
Total From Investment Operations | 0.10 | 0.18 | 0.25 | 0.13 | 0.09 |
Less Distributions: | |||||
Distributions from net investment income | (0.07) | (0.15) | (0.19) | (0.15) | (0.09) |
Net Asset Value, End of Period | $9.22 | $9.19 | $9.16 | $9.10 | $9.12 |
Total Return3 | 1.07% | 2.03% | 2.79% | 1.39% | 1.04% |
Ratios to Average Net Assets: | |||||
Net expenses4 | 0.51% | 0.56% | 0.91% | 0.91% | 0.92% |
Net investment income | 0.69% | 1.65% | 2.10% | 1.60% | 1.02% |
Expense waiver/reimbursement5 | 0.10% | 0.09% | 0.09% | 0.12% | 0.13% |
Supplemental Data: | |||||
Net assets, end of period (000 omitted) | $1,604,459 | $664,369 | $318,992 | $281,543 | $269,004 |
Portfolio turnover | 26% | 47% | 36% | 32% | 33% |
1 | Per share numbers have been calculated using the average shares method. |
2 | Represents less than $0.01. |
3 | Based on net asset value, which does not reflect the sales charge, redemption fee or contingent deferred sales charge, if applicable. |
4 | Amount does not reflect net expenses incurred by investment companies in which the Fund may invest. |
5 | This expense decrease is reflected in both the net expense and the net investment income ratios shown above. Amount does not reflect expense waiver/reimbursement recorded by investment companies in which the Fund may invest. |
Year Ended September 30, | |||||
2021 | 2020 | 2019 | 2018 | 2017 | |
Net Asset Value, Beginning of Period | $9.19 | $9.15 | $9.09 | $9.12 | $9.11 |
Income From Investment Operations: | |||||
Net investment income (loss) | 0.08 | 0.171 | 0.24 | 0.20 | 0.14 |
Net realized and unrealized gain (loss) | 0.03 | 0.04 | 0.06 | (0.03) | 0.01 |
Total From Investment Operations | 0.11 | 0.21 | 0.30 | 0.17 | 0.15 |
Less Distributions: | |||||
Distributions from net investment income | (0.08) | (0.17) | (0.24) | (0.20) | (0.14) |
Net Asset Value, End of Period | $9.22 | $9.19 | $9.15 | $9.09 | $9.12 |
Total Return2 | 1.22% | 2.36% | 3.36% | 1.83% | 1.70% |
Ratios to Average Net Assets: | |||||
Net expenses3 | 0.36% | 0.36% | 0.36% | 0.37% | 0.37% |
Net investment income | 0.85% | 1.91% | 2.65% | 2.17% | 1.58% |
Expense waiver/reimbursement4 | 0.08% | 0.09% | 0.08% | 0.12% | 0.13% |
Supplemental Data: | |||||
Net assets, end of period (000 omitted) | $6,845,790 | $3,669,765 | $3,248,715 | $3,237,960 | $2,629,099 |
Portfolio turnover | 26% | 47% | 36% | 32% | 33% |
1 | Per share numbers have been calculated using the average shares method. |
2 | Based on net asset value. |
3 | Amount does not reflect net expenses incurred by investment companies in which the Fund may invest. |
4 | This expense decrease is reflected in both the net expense and the net investment income ratios shown above. Amount does not reflect expense waiver/reimbursement recorded by investment companies in which the Fund may invest. |
Year Ended September 30, | |||||
2021 | 2020 | 2019 | 2018 | 2017 | |
Net Asset Value, Beginning of Period | $9.19 | $9.15 | $9.10 | $9.12 | $9.11 |
Income From Investment Operations: | |||||
Net investment income (loss) | 0.06 | 0.161 | 0.21 | 0.16 | 0.10 |
Net realized and unrealized gain (loss) | 0.04 | 0.04 | 0.04 | (0.03) | 0.01 |
Total From Investment Operations | 0.10 | 0.20 | 0.25 | 0.13 | 0.11 |
Less Distributions: | |||||
Distributions from net investment income | (0.07) | (0.16) | (0.20) | (0.15) | (0.10) |
Net Asset Value, End of Period | $9.22 | $9.19 | $9.15 | $9.10 | $9.12 |
Total Return2 | 1.12% | 2.20% | 2.78% | 1.49% | 1.25% |
Ratios to Average Net Assets: | |||||
Net expenses3 | 0.46% | 0.56% | 0.81% | 0.82% | 0.82% |
Net investment income | 0.76% | 1.80% | 2.20% | 1.72% | 1.09% |
Expense waiver/reimbursement4 | 0.09% | 0.10% | 0.13% | 0.15% | 0.16% |
Supplemental Data: | |||||
Net assets, end of period (000 omitted) | $16,322 | $17,458 | $74,205 | $53,156 | $33,431 |
Portfolio turnover | 26% | 47% | 36% | 32% | 33% |
1 | Per share numbers have been calculated using the average shares method. |
2 | Based on net asset value. |
3 | Amount does not reflect net expenses incurred by investment companies in which the Fund may invest. |
4 | This expense decrease is reflected in both the net expense and the net investment income ratios shown above. Amount does not reflect expense waiver/reimbursement recorded by investment companies in which the Fund may invest. |
Year Ended September 30, | Period Ended 9/30/20191 | ||
2021 | 2020 | ||
Net Asset Value, Beginning of Period | $9.19 | $9.15 | $9.12 |
Income From Investment Operations: | |||
Net investment income (loss) | 0.08 | 0.162 | 0.08 |
Net realized and unrealized gain (loss) | 0.03 | 0.05 | 0.03 |
Total From Investment Operations | 0.11 | 0.21 | 0.11 |
Less Distributions: | |||
Distributions from net investment income | (0.08) | (0.17) | (0.08) |
Net Asset Value, End of Period | $9.22 | $9.19 | $9.15 |
Total Return3 | 1.23% | 2.37% | 1.23% |
Ratios to Average Net Assets: | |||
Net expenses4 | 0.35% | 0.35% | 0.35%5 |
Net investment income | 0.85% | 1.70% | 2.65%5 |
Expense waiver/reimbursement6 | 0.05% | 0.06% | 0.06%5 |
Supplemental Data: | |||
Net assets, end of period (000 omitted) | $805,078 | $313,440 | $30,911 |
Portfolio turnover | 26% | 47% | 36%7 |
1 | Reflects operations for the period from May 29, 2019 (date of initial investment) to September 30, 2019. |
2 | Per share numbers have been calculated using the average shares method. |
3 | Based on net asset value. Total returns for periods of less than one year are not annualized. |
4 | Amount does not reflect net expenses incurred by investment companies in which the Fund may invest. |
5 | Computed on an annualized basis. |
6 | This expense decrease is reflected in both the net expense and the net investment income ratios shown above. Amount does not reflect expense waiver/reimbursement recorded by investment companies in which the Fund may invest. |
7 | Portfolio turnover is calculated at the Fund level. Percentage indicated was calculated for the year ended September 30, 2019. |
September 30, 2021
Assets: | |
Investment in securities, at value including $11,898,879 of securities loaned and $1,269,122,826 of investment in affiliated holdings* (identified cost $9,477,253,834) | $9,524,246,734 |
Cash | 10,537 |
Due from broker (Note 2) | 2,792,500 |
Income receivable | 11,188,670 |
Income receivable from affiliated holdings | 1,512,042 |
Receivable for shares sold | 35,499,651 |
Unrealized appreciation on foreign exchange contracts | 260,181 |
Total Assets | 9,575,510,315 |
Liabilities: | |
Payable for investments purchased | 51,728,863 |
Payable for shares redeemed | 237,149,633 |
Payable for variation margin on futures contracts | 275,430 |
Payable for collateral due to broker for securities lending (Note 2) | 12,188,530 |
Income distribution payable | 1,209,885 |
Payable for investment adviser fee (Note 5) | 59,662 |
Payable for administrative fee (Note 5) | 20,273 |
Payable for other service fees (Notes 2 and 5) | 183,144 |
Accrued expenses (Note 5) | 1,047,008 |
Total Liabilities | 303,862,428 |
Net assets for 1,005,483,197 shares outstanding | $9,271,647,887 |
Net Assets Consist of: | |
Paid-in capital | $9,259,215,006 |
Total distributable earnings (loss) | 12,432,881 |
Total Net Assets | $9,271,647,887 |
Net Asset Value, Offering Price and Redemption Proceeds Per Share: | |
Class A Shares: | |
Net asset value per share ($1,604,458,591 ÷ 173,927,119 ) shares outstanding, $0.001 par value, 2,000,000,000 shares authorized | $9.22 |
Institutional Shares: | |
Net asset value per share ($6,845,789,663 ÷ 742,458,046 ) shares outstanding, $0.001 par value, 1,000,000,000 shares authorized | $9.22 |
Service Shares: | |
Net asset value per share ($16,321,835 ÷ 1,769,549 ) shares outstanding, $0.001 par value, 1,000,000,000 shares authorized | $9.22 |
Class R6 Shares: | |
Net asset value per share ($805,077,798 ÷ 87,328,483 ) shares outstanding, $0.001 par value, 500,000,000 shares authorized | $9.22 |
* | See information listed after the Fund’s Portfolio of Investments. |
Year Ended September 30, 2021
Investment Income: | |
Interest | $73,268,468 |
Dividends (including $13,993,108 received from affiliated holdings*) | 14,006,083 |
Net income on securities loaned (includes $847 received from affiliated holdings related to cash collateral balances*) (Note 2) | 45,921 |
TOTAL INCOME | 87,320,472 |
Expenses: | |
Investment adviser fee (Note 5) | 21,637,144 |
Administrative fee (Note 5) | 5,643,177 |
Custodian fees | 217,843 |
Transfer agent fees (Note 2) | 3,091,036 |
Directors’/Trustees’ fees (Note 5) | 30,329 |
Auditing fees | 30,630 |
Legal fees | 10,709 |
Portfolio accounting fees | 239,774 |
Other service fees (Notes 2 and 5) | 1,748,190 |
Share registration costs | 973,152 |
Printing and postage | 79,670 |
Miscellaneous (Note 5) | 42,472 |
TOTAL EXPENSES | 33,744,126 |
Waiver and Reimbursements: | |
Waiver/reimbursement of investment adviser fee (Note 5) | (3,805,840) |
Reimbursement of other operating expenses (Notes 2 and 5) | (1,914,519) |
TOTAL WAIVER AND REIMBURSEMENTS | (5,720,359) |
Net expenses | 28,023,767 |
Net investment income | 59,296,705 |
Realized and Unrealized Gain (Loss) on Investments, Foreign Currency Transactions and Futures Contracts: | |
Net realized gain on investments (including net realized loss of $(30,149) on sales of investments in affiliated holdings*) | $1,119,170 |
Net realized gain on foreign currency transactions | 301,712 |
Net realized gain on futures contracts | 330,506 |
Net change in unrealized appreciation of investments (including net change in unrealized depreciation of $8,931,360 on investments in affiliated holdings*) | 15,672,872 |
Net change in unrealized appreciation of translation of assets and liabilities in foreign currency | (1,398) |
Net change in unrealized appreciation of foreign exchange contracts | 260,181 |
Net change in unrealized depreciation of futures contracts | 1,390,671 |
Net realized and unrealized gain (loss) on investments, foreign currency transactions, foreign exchange contracts and futures contracts | 19,073,714 |
Change in net assets resulting from operations | $78,370,419 |
* | See information listed after the Fund’s Portfolio of Investments. |
Year Ended September 30 | 2021 | 2020 |
Increase (Decrease) in Net Assets | ||
Operations: | ||
Net investment income | $59,296,705 | $76,437,379 |
Net realized gain (loss) | 1,751,388 | (17,311,998) |
Net change in unrealized appreciation/depreciation | 17,322,326 | 15,580,632 |
CHANGE IN NET ASSETS RESULTING FROM OPERATIONS | 78,370,419 | 74,706,013 |
Distributions to Shareholders: | ||
Class A Shares | (8,051,351) | (7,268,289) |
Institutional Shares | (48,074,615) | (64,331,409) |
Service Shares | (150,422) | (409,824) |
Class R6 Shares | (3,823,635) | (4,195,586) |
CHANGE IN NET ASSETS RESULTING FROM DISTRIBUTIONS TO SHAREHOLDERS | (60,100,023) | (76,205,108) |
Share Transactions: | ||
Proceeds from sale of shares | 10,538,613,489 | 4,778,155,479 |
Proceeds from shares issued in connection with the tax-free transfer of assets from PNC Ultrashort Bond Fund | — | 200,895,219 |
Net asset value of shares issued to shareholders in payment of distributions declared | 44,642,606 | 56,330,464 |
Cost of shares redeemed | (5,994,911,288) | (4,041,671,741) |
CHANGE IN NET ASSETS RESULTING FROM SHARE TRANSACTIONS | 4,588,344,807 | 993,709,421 |
Change in net assets | 4,606,615,203 | 992,210,326 |
Net Assets: | ||
Beginning of period | 4,665,032,684 | 3,672,822,358 |
End of period | $9,271,647,887 | $4,665,032,684 |
Shares of the Fund Issued | Acquired Fund’s Net Assets Received | Unrealized Appreciation1 | Net Assets of the Fund Immediately Prior to Combination | Net Assets of the Fund Immediately After Combination |
21,955,762 | $200,895,219 | $787,988 | $3,800,175,612 | $4,001,070,831 |
1 | Unrealized Appreciation is included in the Net Assets Received amount shown above. |
Net investment income | $77,094,736 |
Net realized and unrealized loss on investments | (1,656,359) |
Net increase in net assets resulting from operations | $75,438,377 |
Transfer Agent Fees Incurred | Transfer Agent Fees Reimbursed | |
Class A Shares | $729,146 | $(526,670) |
Institutional Shares | 2,322,557 | (1,381,114) |
Service Shares | 10,180 | (6,735) |
Class R6 Shares | 29,153 | — |
TOTAL | $3,091,036 | $(1,914,519) |
Other Service Fees Incurred | |
Class A Shares | $1,729,022 |
Service Shares | 19,168 |
TOTAL | $1,748,190 |
Market Value of Securities Loaned | Collateral Received |
$11,898,879 | $12,188,530 |
Fair Value of Derivative Instruments | ||||
Assets | Liabilities | |||
Statement of Assets and Liabilities Location | Fair Value | Statement of Assets and Liabilities Location | Fair Value | |
Derivatives not accounted for as hedging instruments under ASC Topic 815 | ||||
Interest rate contracts | $— | Payable for variation margin on futures contracts | $(1,368,774)* | |
Foreign exchange contracts | Unrealized appreciation on foreign exchange contracts | 260,181 | — | |
Total derivatives not accounted for as hedging instruments under ASC Topic 815 | $260,181 | $(1,368,774) | ||
* | Includes cumulative appreciation of futures contracts as reported in the footnotes to the Portfolio of Investments. Only the current day’s variation margin is reported within the Statement of Assets and Liabilities. |
Amount of Realized Gain or (Loss) on Derivatives Recognized in Income | |
Futures Contracts | |
Interest rate contracts | $330,506 |
Change in Unrealized Appreciation or (Depreciation) on Derivatives Recognized in Income | |||
Futures Contracts | Foreign Exchange Contracts | Total | |
Interest rate contracts | $1,390,671 | $— | $1,390,671 |
Foreign exchange contracts | — | 260,181 | 260,181 |
TOTAL | $1,390,671 | $260,181 | $1,650,852 |
Year Ended 9/30/2021 | Year Ended 9/30/2020 | |||
Class A Shares: | Shares | Amount | Shares | Amount |
Shares sold | 201,827,152 | $1,861,651,488 | 82,800,748 | $757,984,671 |
Shares issued to shareholders in payment of distributions declared | 858,231 | 7,915,352 | 769,169 | 7,010,276 |
Shares redeemed | (101,040,251) | (932,117,246) | (46,121,127) | (420,117,439) |
NET CHANGE RESULTING FROM CLASS A SHARE TRANSACTIONS | 101,645,132 | $937,449,594 | 37,448,790 | $344,877,508 |
Year Ended 9/30/2021 | Year Ended 9/30/2020 | |||
Institutional Shares: | Shares | Amount | Shares | Amount |
Shares sold | 855,553,995 | $7,886,479,001 | 378,173,546 | $3,453,051,914 |
Proceeds from shares issued in connection with the tax-free transfer of assets from the Acquired Fund | — | — | 21,955,762 | 200,895,219 |
Shares issued to shareholders in payment of distributions declared | 3,627,678 | 33,444,917 | 4,979,064 | 45,385,765 |
Shares redeemed | (516,136,185) | (4,758,535,990) | (360,580,851) | (3,275,167,305) |
NET CHANGE RESULTING FROM INSTITUTIONAL SHARE TRANSACTIONS | 343,045,488 | $3,161,387,928 | 44,527,521 | $424,165,593 |
Year Ended 9/30/2021 | Year Ended 9/30/2020 | |||
Service Shares: | Shares | Amount | Shares | Amount |
Shares sold | 2,114,981 | $19,500,270 | 1,605,360 | $14,677,396 |
Shares issued to shareholders in payment of distributions declared | 15,877 | 146,377 | 43,504 | 396,754 |
Shares redeemed | (2,261,222) | (20,848,185) | (7,855,602) | (71,844,916) |
NET CHANGE RESULTING FROM SERVICE SHARE TRANSACTIONS | (130,364) | $(1,201,538) | (6,206,738) | $(56,770,766) |
Year Ended 9/30/2021 | Year Ended 9/30/2020 | |||
Class R6 Shares: | Shares | Amount | Shares | Amount |
Shares sold | 83,611,976 | $770,982,730 | 60,612,197 | $552,441,498 |
Shares issued to shareholders in payment of distributions declared | 340,174 | 3,135,960 | 388,994 | 3,537,669 |
Shares redeemed | (30,745,078) | (283,409,867) | (30,257,827) | (274,542,081) |
NET CHANGE RESULTING FROM CLASS R6 SHARES TRANSACTIONS | 53,207,072 | $490,708,823 | 30,743,364 | $281,437,086 |
NET CHANGE RESULTING FROM TOTAL FUND SHARE TRANSACTIONS | 497,767,328 | $4,588,344,807 | 106,512,937 | $993,709,421 |
2021 | 2020 | |
Ordinary income | $60,100,023 | $76,205,108 |
Undistributed ordinary income | $311,429 |
Net unrealized appreciation | $47,229,735 |
Capital loss carryforwards | $(35,108,283) |
Short-Term | Long-Term | Total |
$16,964,426 | $18,143,857 | $35,108,283 |
Administrative Fee | Average Daily Net Assets of the Investment Complex |
0.100% | on assets up to $50 billion |
0.075% | on assets over $50 billion |
Percentage of Average Daily Net Assets of Class | |
Class A Shares | 0.30% |
Service Shares | 0.25% |
Purchases | $4,564,799,499 |
Sales | $1,411,950,162 |
November 22, 2021
Beginning Account Value 4/1/2021 | Ending Account Value 9/30/2021 | Expenses Paid During Period1 | |
Actual: | |||
Class A Shares | $1,000 | $1,003.00 | $2.56 |
Institutional Shares | $1,000 | $1,003.80 | $1.81 |
Service Shares | $1,000 | $1,003.30 | $2.31 |
Class R6 Shares | $1,000 | $1,003.90 | $1.76 |
Hypothetical (assuming a 5% return before expenses): | |||
Class A Shares | $1,000 | $1,022.51 | $2.59 |
Institutional Shares | $1,000 | $1,023.26 | $1.83 |
Service Shares | $1,000 | $1,022.76 | $2.33 |
Class R6 Shares | $1,000 | $1,023.31 | $1.78 |
1 | Expenses are equal to the Fund’s annualized net expense ratios, multiplied by the average account value over the period, multiplied by 183/365 (to reflect the one-half-year period). The annualized net expense ratios are as follows: |
Class A Shares | 0.51% |
Institutional Shares | 0.36% |
Service Shares | 0.46% |
Class R6 Shares | 0.35% |
Name Birth Date Positions Held with Corporation Date Service Began | Principal Occupation(s) for Past Five Years, Other Directorships Held and Previous Position(s) |
J. Christopher Donahue* Birth Date: April 11, 1949 President and Director Indefinite Term Began serving: March 1995 | Principal Occupations: Principal Executive Officer and President of certain of the Funds in the Federated Hermes Fund Family; Director or Trustee of the Funds in the Federated Hermes Fund Family; President, Chief Executive Officer and Director, Federated Hermes, Inc.; Chairman and Trustee, Federated Investment Management Company; Trustee, Federated Investment Counseling; Chairman and Director, Federated Global Investment Management Corp.; Chairman and Trustee, Federated Equity Management Company of Pennsylvania; Trustee, Federated Shareholder Services Company; Director, Federated Services Company. Previous Positions: President, Federated Investment Counseling; President and Chief Executive Officer, Federated Investment Management Company, Federated Global Investment Management Corp. and Passport Research, Ltd; Chairman, Passport Research, Ltd. |
Name Birth Date Positions Held with Corporation Date Service Began | Principal Occupation(s) for Past Five Years, Other Directorships Held and Previous Position(s) |
John B. Fisher* Birth Date: May 16, 1956 Director Indefinite Term Began serving: May 2016 | Principal Occupations: Principal Executive Officer and President of certain of the Funds in the Federated Hermes Fund Family; Director or Trustee of certain of the Funds in the Federated Hermes Fund Family; Vice President, Federated Hermes, Inc.; President, Director/Trustee and CEO, Federated Advisory Services Company, Federated Equity Management Company of Pennsylvania, Federated Global Investment Management Corp., Federated Investment Counseling, Federated Investment Management Company; President of some of the Funds in the Federated Hermes Fund Family and Director, Federated Investors Trust Company. Previous Positions: President and Director of the Institutional Sales Division of Federated Securities Corp.; President and Director of Federated Investment Counseling; President and CEO of Passport Research, Ltd.; Director, Edgewood Securities Corp.; Director, Federated Services Company; Director, Federated Hermes, Inc.; Chairman and Director, Southpointe Distribution Services, Inc. and President, Technology, Federated Services Company. |
Name Birth Date Positions Held with Corporation Date Service Began | Principal Occupation(s) for Past Five Years, Other Directorships Held, Previous Position(s) and Qualifications |
John T. Collins Birth Date: January 24, 1947 Director Indefinite Term Began serving: October 2013 | Principal Occupations: Director or Trustee, and Chair of the Board of Directors or Trustees, of the Federated Hermes Fund Family; formerly, Chairman and CEO, The Collins Group, Inc. (a private equity firm) (Retired). Other Directorships Held: Chairman of the Board of Directors, Director, KLX Energy Services Holdings, Inc. (oilfield services); former Director of KLX Corp. (aerospace). Qualifications: Mr. Collins has served in several business and financial management roles and directorship positions throughout his career. Mr. Collins previously served as Chairman and CEO of The Collins Group, Inc. (a private equity firm) and as a Director of KLX Corp. Mr. Collins serves as Chairman Emeriti, Bentley University. Mr. Collins previously served as Director and Audit Committee Member, Bank of America Corp.; Director, FleetBoston Financial Corp.; and Director, Beth Israel Deaconess Medical Center (Harvard University Affiliate Hospital). |
Name Birth Date Positions Held with Corporation Date Service Began | Principal Occupation(s) for Past Five Years, Other Directorships Held, Previous Position(s) and Qualifications |
G. Thomas Hough Birth Date: February 28, 1955 Director Indefinite Term Began serving: August 2015 | Principal Occupations: Director or Trustee, Chair of the Audit Committee of the Federated Hermes Fund Family; formerly, Vice Chair, Ernst & Young LLP (public accounting firm) (Retired). Other Directorships Held: Director, Chair of the Audit Committee, Equifax, Inc.; Director, Member of the Audit Committee, Haverty Furniture Companies, Inc.; formerly, Director, Member of Governance and Compensation Committees, Publix Super Markets, Inc. Qualifications: Mr. Hough has served in accounting, business management and directorship positions throughout his career. Mr. Hough most recently held the position of Americas Vice Chair of Assurance with Ernst & Young LLP (public accounting firm). Mr. Hough serves on the President’s Cabinet and Business School Board of Visitors for the University of Alabama. Mr. Hough previously served on the Business School Board of Visitors for Wake Forest University, and he previously served as an Executive Committee member of the United States Golf Association. |
Maureen Lally-Green Birth Date: July 5, 1949 Director Indefinite Term Began serving: August 2009 | Principal Occupations: Director or Trustee of the Federated Hermes Fund Family; Adjunct Professor Emerita of Law, Duquesne University School of Law; formerly, Dean of the Duquesne University School of Law and Professor of Law and Interim Dean of the Duquesne University School of Law; formerly, Associate General Secretary and Director, Office of Church Relations, Diocese of Pittsburgh. Other Directorships Held: Director, CNX Resources Corporation (formerly known as CONSOL Energy Inc.). Qualifications: Judge Lally-Green has served in various legal and business roles and directorship positions throughout her career. Judge Lally-Green previously held the position of Dean of the School of Law of Duquesne University (as well as Interim Dean). Judge Lally-Green previously served as a member of the Superior Court of Pennsylvania and as a Professor of Law, Duquesne University School of Law. Judge Lally-Green was appointed by the Supreme Court of Pennsylvania to serve on the Supreme Court’s Board of Continuing Judicial Education and the Supreme Court’s Appellate Court Procedural Rules Committee. Judge Lally-Green also currently holds the positions on not for profit or for profit boards of directors as follows: Director and Chair, UPMC Mercy Hospital; Regent, Saint Vincent Seminary; Member, Pennsylvania State Board of Education (public); Director, Catholic Charities, Pittsburgh; and Director CNX Resources Corporation (formerly known as CONSOL Energy Inc.). Judge Lally-Green has held the positions of: Director, Auberle; Director, Epilepsy Foundation of Western and Central Pennsylvania; Director, Ireland Institute of Pittsburgh; Director, Saint Thomas More Society; Director and Chair, Catholic High Schools of the Diocese of Pittsburgh, Inc.; Director, Pennsylvania Bar Institute; Director, St. Vincent College; Director and Chair, North Catholic High School, Inc.; and Director and Vice Chair, Our Campaign for the Church Alive!, Inc. |
Name Birth Date Positions Held with Corporation Date Service Began | Principal Occupation(s) for Past Five Years, Other Directorships Held, Previous Position(s) and Qualifications |
Thomas M. O’Neill Birth Date: June 14, 1951 Director Indefinite Term Began serving: August 2006 | Principal Occupations: Director or Trustee of the Federated Hermes Fund Family; Sole Proprietor, Navigator Management Company (investment and strategic consulting). Other Directorships Held: None. Qualifications: Mr. O’Neill has served in several business, mutual fund and financial management roles and directorship positions throughout his career. Mr. O’Neill serves as Director, Medicines for Humanity and Director, The Golisano Children’s Museum of Naples, Florida. Mr. O’Neill previously served as Chief Executive Officer and President, Managing Director and Chief Investment Officer, Fleet Investment Advisors; President and Chief Executive Officer, Aeltus Investment Management, Inc.; General Partner, Hellman, Jordan Management Co., Boston, MA; Chief Investment Officer, The Putnam Companies, Boston, MA; Credit Analyst and Lending Officer, Fleet Bank; Director and Consultant, EZE Castle Software (investment order management software); and Director, Midway Pacific (lumber). |
Madelyn A. Reilly Birth Date: February 2, 1956 Director Indefinite Term Began serving: November 2020 | Principal Occupations: Director or Trustee of the Federated Hermes Fund Family; Senior Vice President for Legal Affairs, General Counsel and Secretary of the Board of Trustees, Duquesne University. Other Directorships Held: None. Qualifications: Ms. Reilly has served in various business and legal management roles throughout her career. Ms. Reilly previously served as Director of Risk Management and Associate General Counsel, Duquesne University. Prior to her work at Duquesne University, Ms. Reilly served as Assistant General Counsel of Compliance and Enterprise Risk as well as Senior Counsel of Environment, Health and Safety, PPG Industries. |
P. Jerome Richey Birth Date: February 23, 1949 Director Indefinite Term Began serving: October 2013 | Principal Occupations: Director or Trustee of the Federated Hermes Fund Family; Management Consultant; Retired; formerly, Senior Vice Chancellor and Chief Legal Officer, University of Pittsburgh and Executive Vice President and Chief Legal Officer, CONSOL Energy Inc. (now split into two separate publicly traded companies known as CONSOL Energy Inc. and CNX Resources Corp.). Other Directorships Held: None. Qualifications: Mr. Richey has served in several business and legal management roles and directorship positions throughout his career. Mr. Richey most recently held the positions of Senior Vice Chancellor and Chief Legal Officer, University of Pittsburgh. Mr. Richey previously served as Chairman of the Board, Epilepsy Foundation of Western Pennsylvania and Chairman of the Board, World Affairs Council of Pittsburgh. Mr. Richey previously served as Chief Legal Officer and Executive Vice President, CONSOL Energy Inc. and CNX Gas Company; and Board Member, Ethics Counsel and Shareholder, Buchanan Ingersoll & Rooney PC (a law firm). |
Name Birth Date Positions Held with Corporation Date Service Began | Principal Occupation(s) for Past Five Years, Other Directorships Held, Previous Position(s) and Qualifications |
John S. Walsh Birth Date: November 28, 1957 Director Indefinite Term Began serving: April 1999 | Principal Occupations: Director or Trustee of the Federated Hermes Fund Family; President and Director, Heat Wagon, Inc. (manufacturer of construction temporary heaters); President and Director, Manufacturers Products, Inc. (distributor of portable construction heaters); President, Portable Heater Parts, a division of Manufacturers Products, Inc. Other Directorships Held: None. Qualifications: Mr. Walsh has served in several business management roles and directorship positions throughout his career. Mr. Walsh previously served as Vice President, Walsh & Kelly, Inc. (paving contractors). |
Name Birth Date Positions Held with Corporation Date Service Began | Principal Occupation(s) for Past Five Years and Previous Position(s) |
Lori A. Hensler Birth Date: January 6, 1967 TREASURER Officer since: April 2013 | Principal Occupations: Principal Financial Officer and Treasurer of the Federated Hermes Fund Family; Senior Vice President, Federated Administrative Services; Financial and Operations Principal for Federated Securities Corp.; and Assistant Treasurer, Federated Investors Trust Company. Ms. Hensler has received the Certified Public Accountant designation. Previous Positions: Controller of Federated Hermes, Inc.; Senior Vice President and Assistant Treasurer, Federated Investors Management Company; Treasurer, Federated Investors Trust Company; Assistant Treasurer, Federated Administrative Services, Federated Administrative Services, Inc., Federated Securities Corp., Edgewood Services, Inc., Federated Advisory Services Company, Federated Equity Management Company of Pennsylvania, Federated Global Investment Management Corp., Federated Investment Counseling, Federated Investment Management Company, Passport Research, Ltd., and Federated MDTA, LLC; Financial and Operations Principal for Federated Securities Corp., Edgewood Services, Inc. and Southpointe Distribution Services, Inc. |
Name Birth Date Positions Held with Corporation Date Service Began | Principal Occupation(s) for Past Five Years and Previous Position(s) |
Peter J. Germain Birth Date: September 3, 1959 CHIEF LEGAL OFFICER, SECRETARY and EXECUTIVE VICE PRESIDENT Officer since: January 2005 | Principal Occupations: Mr. Germain is Chief Legal Officer, Secretary and Executive Vice President of the Federated Hermes Fund Family. He is General Counsel, Chief Legal Officer, Secretary and Executive Vice President, Federated Hermes, Inc.; Trustee and Senior Vice President, Federated Investors Management Company; Trustee and President, Federated Administrative Services; Director and President, Federated Administrative Services, Inc.; Director and Vice President, Federated Securities Corp.; Director and Secretary, Federated Private Asset Management, Inc.; Secretary, Federated Shareholder Services Company; and Secretary, Retirement Plan Service Company of America. Mr. Germain joined Federated Hermes, Inc. in 1984 and is a member of the Pennsylvania Bar Association. Previous Positions: Deputy General Counsel, Special Counsel, Managing Director of Mutual Fund Services, Federated Hermes, Inc.; Senior Vice President, Federated Services Company; and Senior Corporate Counsel, Federated Hermes, Inc. |
Stephen Van Meter Birth Date: June 5, 1975 CHIEF COMPLIANCE OFFICER AND SENIOR VICE PRESIDENT Officer since: July 2015 | Principal Occupations: Senior Vice President and Chief Compliance Officer of the Federated Hermes Fund Family; Vice President and Chief Compliance Officer of Federated Hermes, Inc. and Chief Compliance Officer of certain of its subsidiaries. Mr. Van Meter joined Federated Hermes, Inc. in October 2011. He holds FINRA licenses under Series 3, 7, 24 and 66. Previous Positions: Mr. Van Meter previously held the position of Compliance Operating Officer, Federated Hermes, Inc. Prior to joining Federated Hermes, Inc., Mr. Van Meter served at the United States Securities and Exchange Commission in the positions of Senior Counsel, Office of Chief Counsel, Division of Investment Management and Senior Counsel, Division of Enforcement. |
Robert J. Ostrowski Birth Date: April 26, 1963 Chief Investment Officer Officer since: May 2004 | Principal Occupations: Robert J. Ostrowski joined Federated Hermes, Inc. in 1987 as an Investment Analyst and became a Portfolio Manager in 1990. He was named Chief Investment Officer of Federated Hermes’ taxable fixed-income products in 2004 and also serves as a Senior Portfolio Manager. Mr. Ostrowski became an Executive Vice President of the Fund’s Adviser in 2009 and served as a Senior Vice President of the Fund’s Adviser from 1997 to 2009. Mr. Ostrowski has received the Chartered Financial Analyst designation. He received his M.S. in Industrial Administration from Carnegie Mellon University. |
Annual Evaluation of Adequacy and Effectiveness
Federated Hermes Funds
4000 Ericsson Drive
Warrendale, PA 15086-7561
or call 1-800-341-7400.
CUSIP 31428Q747
CUSIP 31428Q754
CUSIP 31428Q713
| Item 2. | Code of Ethics |
(a) As of the end of the period covered by this report, the registrant has adopted a code of ethics (the "Section 406 Standards for Investment Companies - Ethical Standards for Principal Executive and Financial Officers") that applies to the registrant's Principal Executive Officer and Principal Financial Officer; the registrant's Principal Financial Officer also serves as the Principal Accounting Officer.
(c) There was no amendment to the registrant’s code of ethics described in Item 2(a) above during the period covered by the report.
(d) There was no waiver granted, either actual or implicit, from a provision to the registrant’s code of ethics described in Item 2(a) above during the period covered by the report.
(e) Not Applicable
(f)(3) The registrant hereby undertakes to provide any person, without charge, upon request, a copy of the code of ethics. To request a copy of the code of ethics, contact the registrant at 1-800-341-7400, and ask for a copy of the Section 406 Standards for Investment Companies - Ethical Standards for Principal Executive and Financial Officers.
Item 3. Audit Committee Financial Expert
The registrant's Board has determined that each of the following members of the Board's Audit Committee is an “audit committee financial expert,” and is "independent," for purposes of this Item: G. Thomas Hough and Thomas M. O'Neill.
| Item 4. | Principal Accountant Fees and Services |
(a) Audit Fees billed to the registrant for the two most recent fiscal years:
Fiscal year ended 2021 – $101,960
Fiscal year ended 2020 - $100,360
(b) Audit-Related Fees billed to the registrant for the two most recent fiscal years:
Fiscal year ended 2021 - $0
Fiscal year ended 2020 - $0
Amount requiring approval of the registrant’s Audit Committee pursuant to paragraph (c)(7)(ii) of Rule 2-01 of Regulation S-X, $0 and $1,648 respectively. Fiscal year ended 2020- Audit consent for N-14 merger document.
(c) Tax Fees billed to the registrant for the two most recent fiscal years:
Fiscal year ended 2021 - $0
Fiscal year ended 2020 - $0
Amount requiring approval of the registrant’s Audit Committee pursuant to paragraph (c)(7)(ii) of Rule 2-01 of Regulation S-X, $0 and $0 respectively.
(d) All Other Fees billed to the registrant for the two most recent fiscal years:
Fiscal year ended 2021 - $0
Fiscal year ended 2020 - $0
Amount requiring approval of the registrant’s Audit Committee pursuant to paragraph (c)(7)(ii) of Rule 2-01 of Regulation S-X, $0 and $0 respectively.
(e)(1) Audit Committee Policies regarding Pre-approval of Services.
The Audit Committee is required to pre-approve audit and non-audit services performed by the independent auditor in order to assure that the provision of such services do not impair the auditor’s independence. Unless a type of service to be provided by the independent auditor has received general pre-approval, it will require specific pre-approval by the Audit Committee. Any proposed services exceeding pre-approved cost levels will require specific pre-approval by the Audit Committee.
Certain services have the general pre-approval of the Audit Committee. The term of the general pre-approval is 12 months from the date of pre-approval, unless the Audit Committee specifically provides for a different period. The Audit Committee will annually review the services that may be provided by the independent auditor without obtaining specific pre-approval from the Audit Committee and may grant general pre-approval for such services. The Audit Committee will revise the list of general pre-approved services from time to time, based on subsequent determinations. The Audit Committee will not delegate to management its responsibilities to pre-approve services performed by the independent auditor.
The Audit Committee has delegated pre-approval authority to its chairman (the “Chairman”) for services that do not exceed a specified dollar threshold. The Chairman or Chief Audit Executive will report any such pre-approval decisions to the Audit Committee at its next scheduled meeting. The Committee will designate another member with such pre-approval authority when the Chairman is unavailable.
AUDIT SERVICES
The annual audit services engagement terms and fees will be subject to the specific pre-approval of the Audit Committee. The Audit Committee will approve, if necessary, any changes in terms, conditions and fees resulting from changes in audit scope, registered investment company (RIC) structure or other matters.
In addition to the annual audit services engagement specifically approved by the Audit Committee, the Audit Committee may grant general pre-approval for other audit services, which are those services that only the independent auditor reasonably can provide. The Audit Committee has pre-approved certain audit services; with limited exception, all other audit services must be specifically pre-approved by the Audit Committee.
AUDIT-RELATED SERVICES
Audit-related services are assurance and related services that are reasonably related to the performance of the audit or review of the RIC’s financial statements or that are traditionally performed by the independent auditor. The Audit Committee believes that the provision of audit-related services does not impair the independence of the auditor, and has pre-approved certain audit-related services; all other audit-related services must be specifically pre-approved by the Audit Committee.
TAX SERVICES
The Audit Committee believes that the independent auditor can provide tax services to the RIC such as tax compliance, tax planning and tax advice without impairing the auditor’s independence. However, the Audit Committee will not permit the retention of the independent auditor in connection with a transaction initially recommended by the independent auditor, the purpose of which may be tax avoidance and the tax treatment of which may not be supported in the Internal Revenue Code and related regulations. The Audit Committee has pre-approved certain tax services; with limited exception, all tax services involving large and complex transactions must be specifically pre-approved by the Audit Committee.
ALL OTHER SERVICES
With respect to the provision of permissible services other than audit, review or attest services the pre-approval requirement is waived if:
| (1) | With respect to such services rendered to the Funds, the aggregate amount of all such services provided constitutes no more than five percent of the total amount of revenues paid by the audit client to its accountant during the fiscal year in which the services are provided; and, |
| (2) | With respect to such services rendered to the Fund’s investment adviser ( the “Adviser”)and any entity controlling, controlled by to under common control with the Adviser such as affiliated non-U.S. and U.S. funds not under the Audit Committee’s purview and which do not fall within a category of service which has been determined by the Audit Committee not to have a direct impact on the operations or financial reporting of the RIC, the aggregate amount of all services provided constitutes no more than five percent of the total amount of revenues paid to the RIC’s auditor by the RIC, its Adviser and any entity controlling, controlled by, or under common control with the Adviser during the fiscal year in which the services are provided; and |
| (3) | Such services were not recognized by the issuer or RIC at the time of the engagement to be non-audit services; and |
| (4) | Such services are promptly brought to the attention of the Audit Committee and approved prior to the completion of the audit by the Audit Committee or by one or more members of the Audit Committee who are members of the Board of Directors to whom authority to grant such approvals has been delegated by the Audit Committee. |
The Audit Committee may grant general pre-approval to those permissible non-audit services which qualify for pre-approval and which it believes are routine and recurring services, and would not impair the independence of the auditor.
The Securities and Exchange Commission’s (the “SEC”) rules and relevant guidance should be consulted to determine the precise definitions of these services and applicability of exceptions to certain of the prohibitions.
PRE-APPROVAL FEE LEVELS
Pre-approval fee levels for all services to be provided by the independent auditor will be established annually by the Audit Committee. Any proposed services exceeding these levels will require specific pre-approval by the Audit Committee.
PROCEDURES
Requests or applications to provide services that require specific approval by the Audit Committee will be submitted to the Audit Committee by the Fund’s Principal Accounting Officer and/or the Chief Audit Executive of Federated Hermes, Inc., only after those individuals have determined that the request or application is consistent with the SEC’s rules on auditor independence.
(e)(2) Percentage of services identified in items 4(b) through 4(d) that were approved by the registrant’s Audit Committee pursuant to paragraph (c)(7)(i)(C) of Rule 2-01 of Regulation S-X:
4(b)
Fiscal year ended 2021 – 0%
Fiscal year ended 2020 - 0%
Percentage of services provided to the registrant’s Adviser and any entity controlling, controlled by, or under common control with the Adviser that provides ongoing services to the registrant that were approved by the registrant’s Audit Committee pursuant to paragraph (c)(7)(i)(C) of Rule 2-01 of Regulation S-X, 0% and 0% respectively.
4(c)
Fiscal year ended 2021 – 0%
Fiscal year ended 2020 – 0%
Percentage of services provided to the registrant’s Adviser and any entity controlling, controlled by, or under common control with the Adviser that provides ongoing services to the registrant that were approved by the registrant’s Audit Committee pursuant to paragraph (c)(7)(i)(C) of Rule 2-01 of Regulation S-X, 0% and 0% respectively.
4(d)
Fiscal year ended 2021 – 0%
Fiscal year ended 2020 – 0%
Percentage of services provided to the registrant’s Adviser and any entity controlling, controlled by, or under common control with the Adviser that provides ongoing services to the registrant that were approved by the registrant’s Audit Committee pursuant to paragraph (c)(7)(i)(C) of Rule 2-01 of Regulation S-X, 0% and 0% respectively.
| (f) | NA |
| (g) | Non-Audit Fees billed to the registrant, the registrant’s Adviser, and certain entities controlling, controlled by or under common control with the Adviser: |
Fiscal year ended 2021 - $79,020
Fiscal year ended 2020 - $128,365
| (h) | The registrant’s Audit Committee has considered that the provision of non-audit services that were rendered to the registrant’s Adviser (not including any sub-adviser whose role is primarily portfolio management and is subcontracted with or overseen by another investment adviser), and any entity controlling, controlled by, or under common control with the Adviser that provides ongoing services to the registrant that were not pre-approved pursuant to paragraph (c)(7)(ii) of Rule 2-01 of Regulation S-X is compatible with maintaining the principal accountant’s independence. |
| Item 5. | Audit Committee of Listed Registrants |
Not Applicable
| Item 6. | Schedule of Investments |
(a) The registrant’s Schedule of Investments is included as part of the Report to Stockholders filed under Item 1 of this form.
(b) Not Applicable; Fund had no divestments during the reporting period covered since the previous Form N-CSR filing.
| Item 7. | Disclosure of Proxy Voting Policies and Procedures for Closed-End Management Investment Companies |
Not Applicable
| Item 8. | Portfolio Managers of Closed-End Management Investment Companies |
Not Applicable
| Item 9. | Purchases of Equity Securities by Closed-End Management Investment Company and Affiliated Purchasers |
Not Applicable
| Item 10. | Submission of Matters to a Vote of Security Holders |
No Changes to Report
| Item 11. | Controls and Procedures |
(a) The registrant’s President and Treasurer have concluded that the
registrant’s disclosure controls and procedures (as defined in rule 30a-3(c) under the Act) are effective in design and operation and are sufficient to form the basis of the certifications required by Rule 30a-(2) under the Act, based on their evaluation of these disclosure controls and procedures within 90 days of the filing date of this report on Form N-CSR.
(b) There were no changes in the registrant’s internal control over financial reporting (as defined in rule 30a-3(d) under the Act) during the registrant’s most recent fiscal half-year (the registrant’s second fiscal half-year in the case of an annual report) that have materially affected, or are reasonably likely to materially affect, the registrant’s internal control over financial reporting.
| Item 12. | Disclosure of Securities Lending Activities for Closed-End Management Investment Companies |
Not Applicable
| Item 13. | Exhibits |
(a)(1) Code of Ethics- Not Applicable to this Report.
(a)(2) Certifications of Principal Executive Officer and Principal Financial Officer.
(a)(3) Not Applicable.
(b) Certifications pursuant to 18 U.S.C. Section 1350.
SIGNATURES
Pursuant to the requirements of the Securities Exchange Act of 1934 and the Investment Company Act of 1940, the registrant has duly caused this report to be signed on its behalf by the undersigned, thereunto duly authorized.
Registrant Federated Hermes Total Return Series, Inc.
By /S/ Lori A. Hensler
Lori A. Hensler, Principal Financial Officer
Date November 22, 2021
Pursuant to the requirements of the Securities Exchange Act of 1934 and the Investment Company Act of 1940, this report has been signed below by the following persons on behalf of the registrant and in the capacities and on the dates indicated.
By /S/ J. Christopher Donahue
J. Christopher Donahue, Principal Executive Officer
Date November 22, 2021
By /S/ Lori A. Hensler
Lori A. Hensler, Principal Financial Officer
Date November 22, 2021