Exhibit 99
| 1 2022 Investor Relations Presentation 2022 Investor Relations Presentation Results through September 24, 2022 |
| 2 UFP INDUSTRIES, INC. 2022 Please be aware that: Statements included in this presentation that are not historical are forward-looking statements within themeaning of Section 21E of the Securities Exchange Act, as amended, and are based on management’s beliefs, assumptions, current expectations, estimates, and projections about the markets we serve, the economy, and the company itself. Words like “anticipates,” “believes,” “confident,” “estimates,” “expects,” “forecasts,” likely,” “plans,” “projects,” “should,” variations of such words, and similar expressions identify such forward-looking statements. These statements do not guarantee future performance and involve certain risks, uncertainties and assumptions that are difficult to predict with regard to timing, extent, likelihood and degree of occurrence.The Company does not undertake to update forward-looking statements to reflect facts, circumstances, assumptions or events that occur after the date the forward-looking statements are made.Actual results could differ materially from those included in such forward-looking statements. Investors are cautioned that all forward-looking statements involve risks and uncertainty.Among the factors that could cause actual results to differ materially from forward-looking statements are the following:Fluctuations in the price of lumber; adverse or unusual weather conditions; adverse conditions in the markets we serve; government regulations, particularly involving environmental and safety regulations; and our ability to make successful business acquisitions.Certain of these risk factors as well as other risk factors and additional information are included in the Company's reports on Form 10-K and 10-Q on file with the Securities and Exchange Commission. Non-GAAP Financial Information: This presentation includes certain financial information not prepared in accordance with U.S. GAAP. Because not all companies calculate non-GAAP financial information identically (or at all), the information herein may not be comparable to other similarly titled measures used by other companies. Management considers adjusted EBITDA and return on invested capital to be non-GAAP alternative performance measures which may provide useful information to investors. This presentation is the property of UFP Industries, Inc.Any redistribution, retransmission, or reprinting of this presentationin any form without the express written consent of Universal is strictly prohibited. |
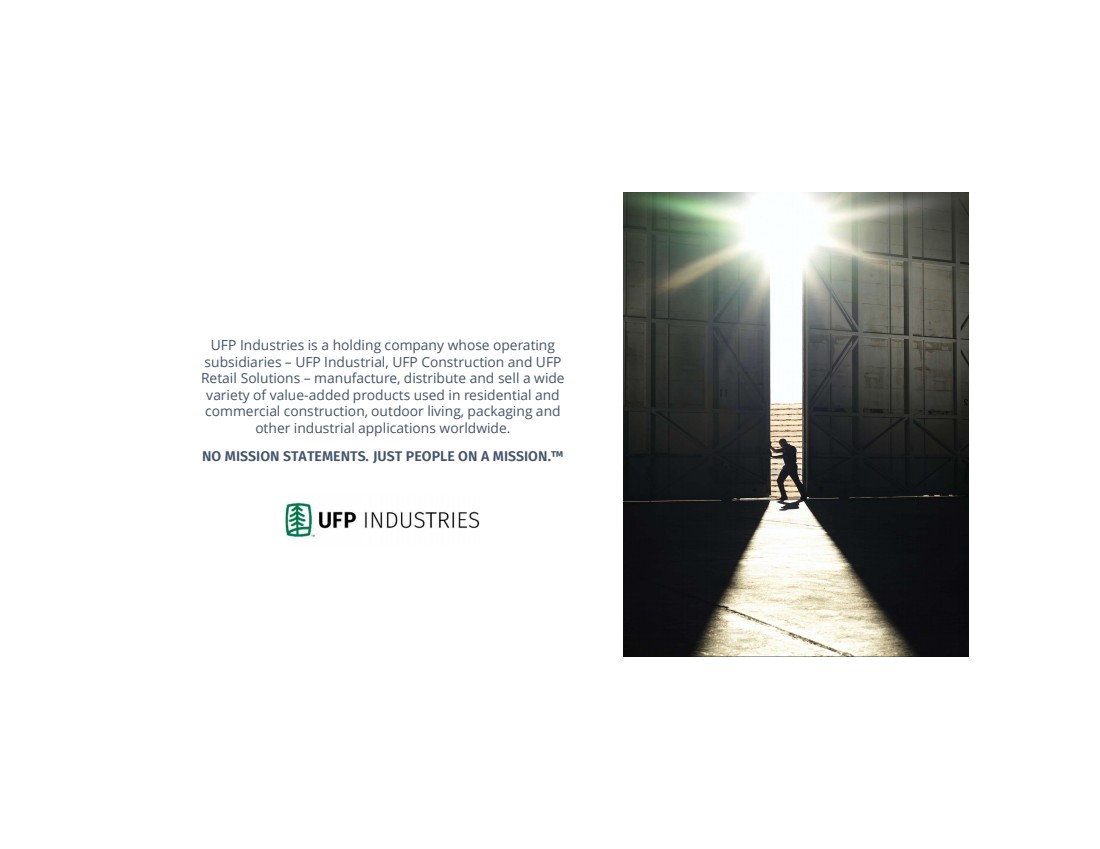
| 3 UFP Industries is a holding company whose operating subsidiaries –UFP Industrial, UFP Construction and UFP Retail Solutions –manufacture, distribute and sell a wide variety of value-added products used in residential and commercial construction, outdoor living, packaging and other industrial applications worldwide. NO MISSION STATEMENTS. JUST PEOPLE ON A MISSION. ™ |
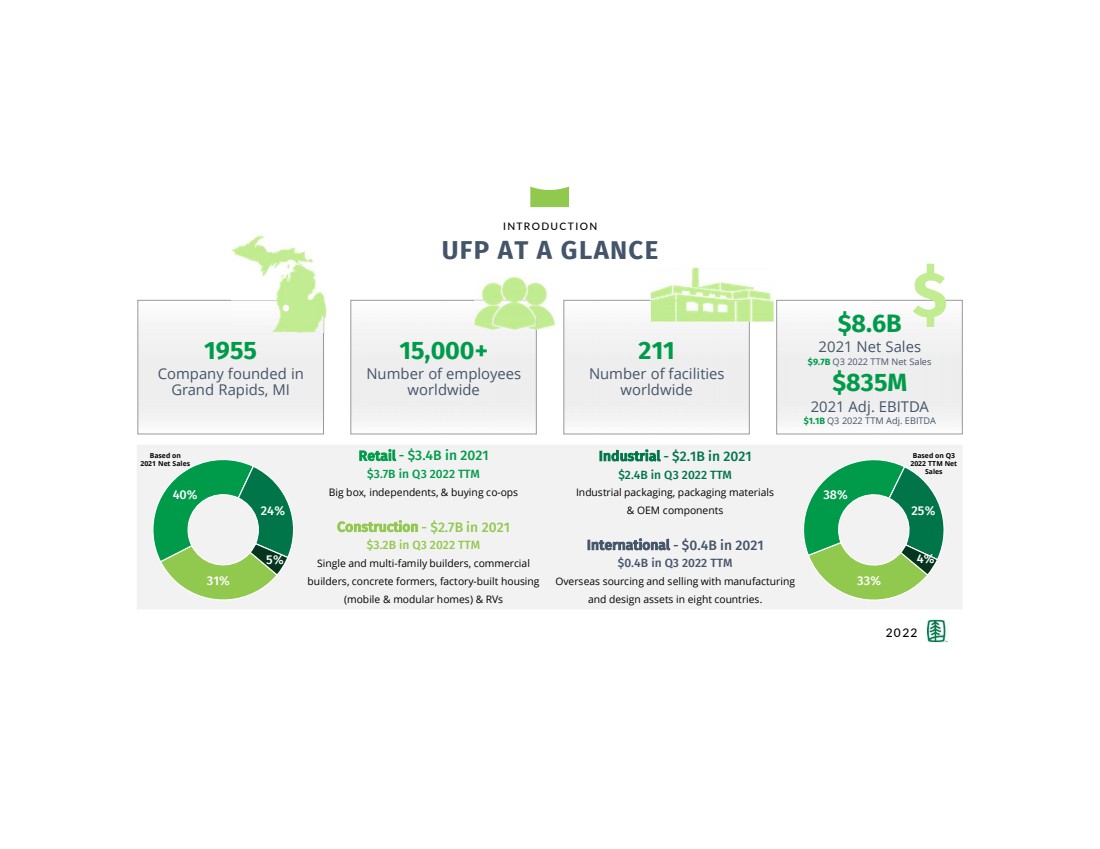
| 4 40% 31% 24% 5% Based on 2021 Net Sales INTRODUCTION UFP AT A GLANCE Retail -$3.4B in 2021 $3.7B in Q3 2022 TTM Big box, independents, & buying co-ops Construction -$2.7B in 2021 $3.2B in Q3 2022 TTM Single and multi-family builders, commercial builders, concrete formers, factory-built housing (mobile & modular homes) & RVs 2022 Industrial -$2.1B in 2021 $2.4B in Q3 2022 TTM Industrial packaging, packaging materials & OEM components International -$0.4B in 2021 $0.4B in Q3 2022 TTM Overseas sourcing and selling with manufacturing and design assets in eight countries. 15,000+ Number of employees worldwide 211 Number of facilities worldwide $8.6B 2021 Net Sales $9.7B Q3 2022 TTM Net Sales $835M 2021 Adj. EBITDA $1.1B Q3 2022 TTM Adj. EBITDA 1955 Company founded in Grand Rapids, MI $ $ 38% 33% 25% 4% Based on Q3 2022 TTM Net Sales |
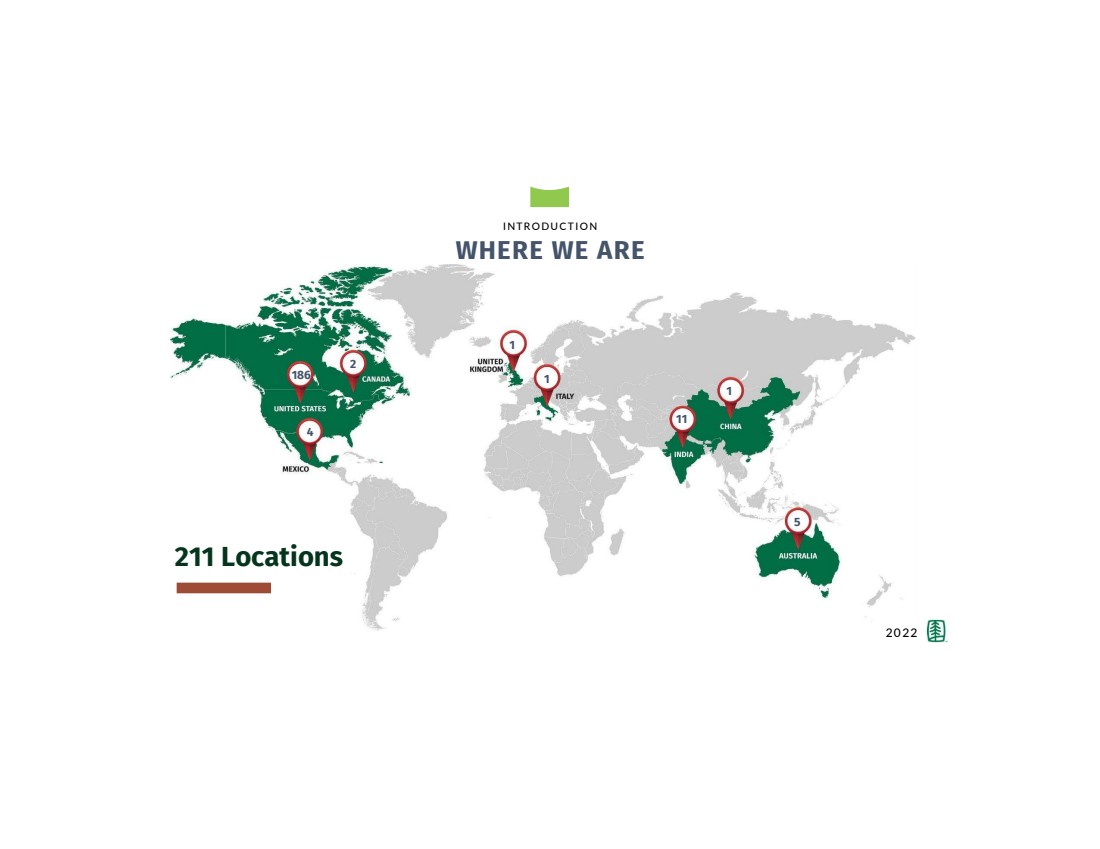
| 5 INTRODUCTION WHERE WE ARE 2022 186 2 4 1 11 1 5 211 Locations 1 |
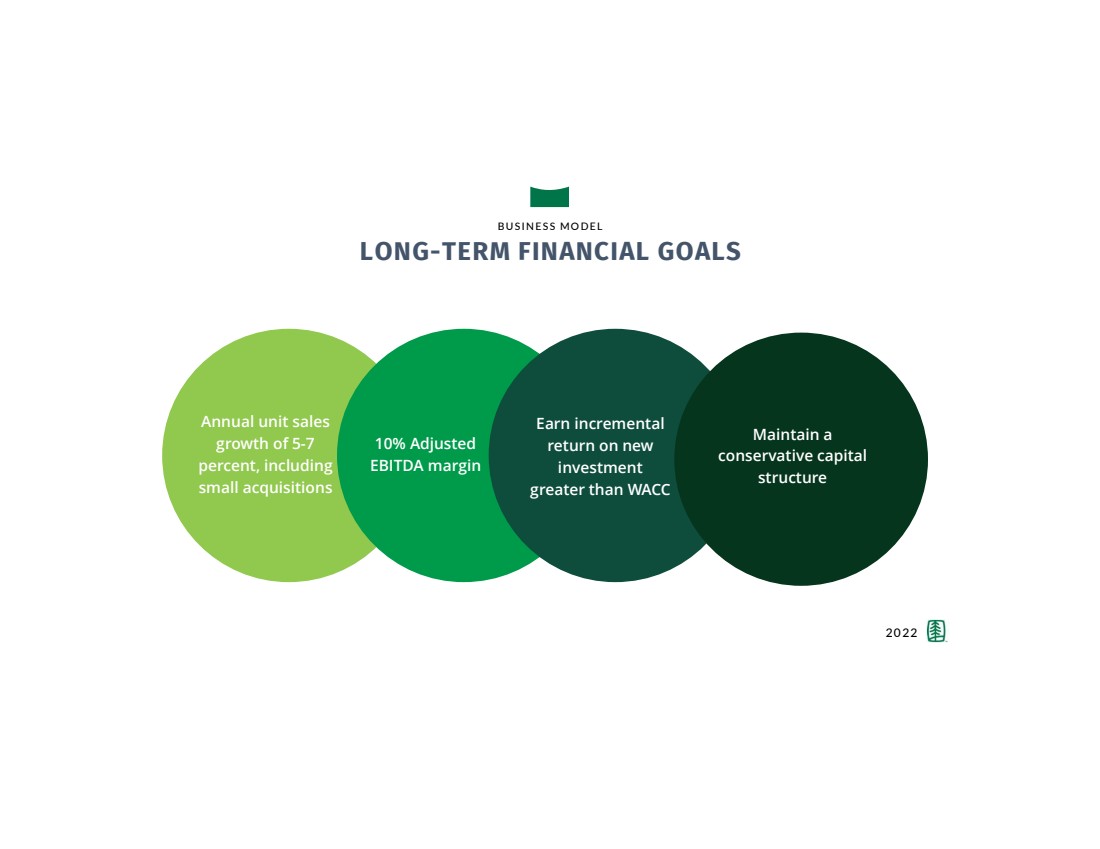
| 6 BUSINESS MODEL LONG-TERM FINANCIAL GOALS 2022 Annual unit sales growth of 5-7 percent, including small acquisitions 10% Adjusted EBITDA margin Earn incremental return on new investment greater than WACC Maintain a conservative capital structure |
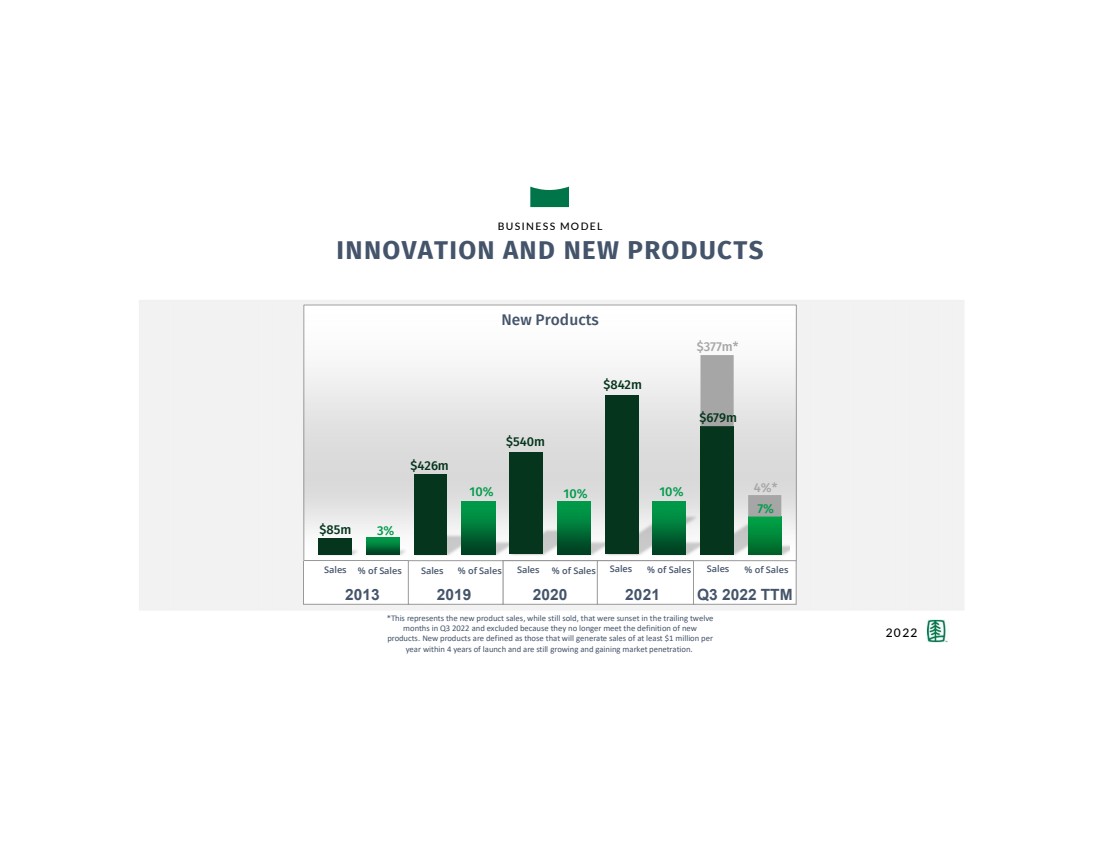
| 7 BUSINESS MODEL INNOVATION AND NEW PRODUCTS 2013 $426m 3% 10% $85m New Products 2022 10% $540m % of Sales Sales % of Sales Sales % of Sales Sales $842m 10% % of Sales Sales 20192021 20132020 $679m % of Sales Sales Q3 2022 TTM 7% 4%* $377m* *This represents the new product sales, while still sold, that were sunset in the trailing twelve months in Q3 2022 and excluded because they no longer meet the definition of new products. New products are defined as those that will generate sales of at least $1 million per year within 4 years of launch and are still growing and gaining market penetration. |
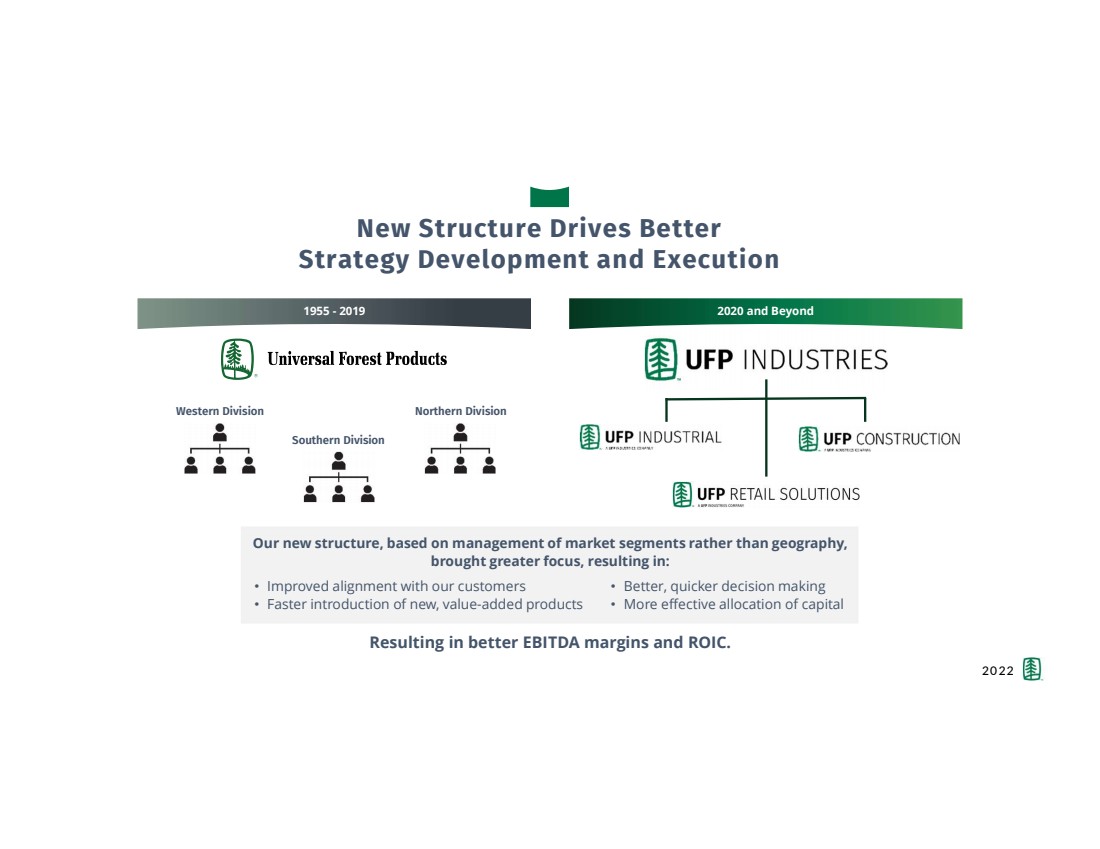
| 8 New Structure Drives Better Strategy Development and Execution Western Division Southern Division Northern Division 2020 and Beyond 1955 -20192020 and Beyond Our new structure, based on management of market segments rather than geography, brought greater focus, resulting in: • Improved alignment with our customers • Faster introduction of new, value-added products • Better, quicker decision making • More effective allocation of capital Resulting in better EBITDA margins and ROIC. 2022 |
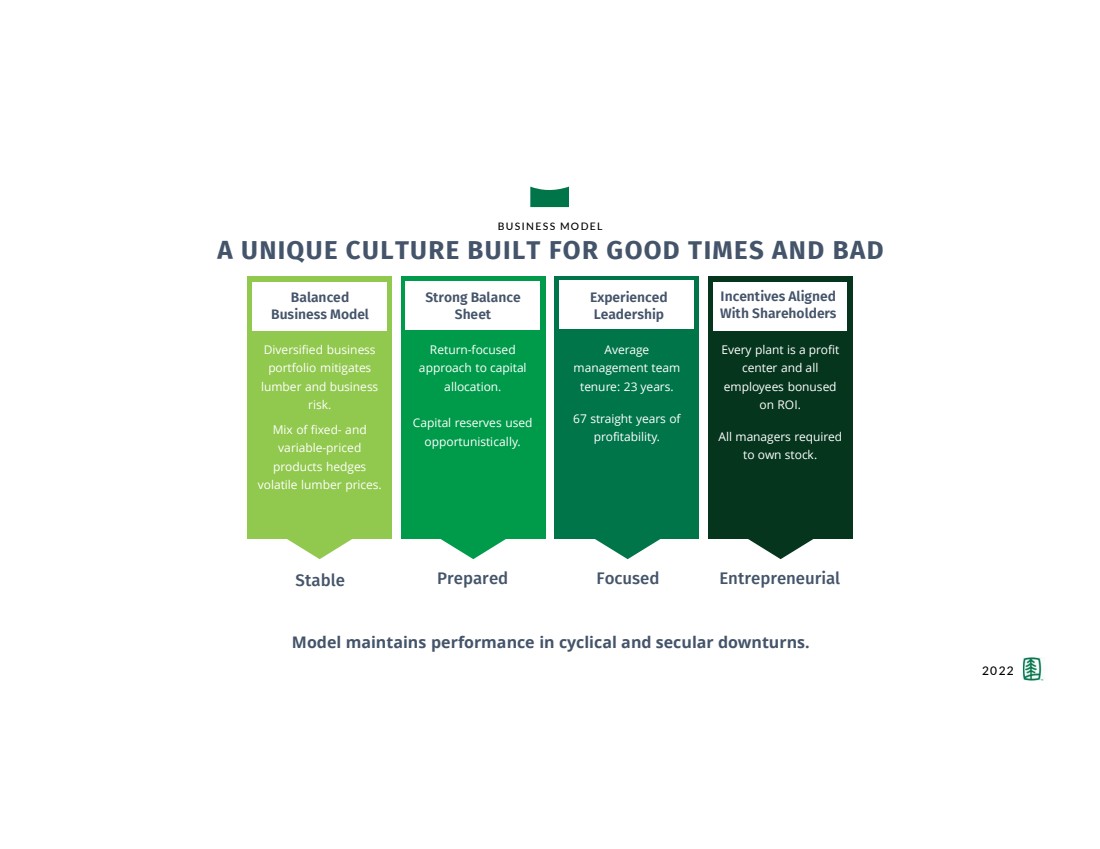
| 9 BUSINESS MODEL A UNIQUE CULTURE BUILT FOR GOOD TIMES AND BAD Strong Balance Sheet Return-focused approach to capital allocation. Capital reserves used opportunistically. Average management team tenure: 23 years. 67 straight years of profitability. Every plant is a profit center and all employees bonused on ROI. All managers required to own stock. Balanced Business Model Experienced Leadership Incentives Aligned With Shareholders Diversified business portfolio mitigates lumber and business risk. Mix of fixed-and variable-priced products hedges volatile lumber prices. Entrepreneurial Focused Stable Prepared Model maintains performance in cyclical and secular downturns. 2022 |
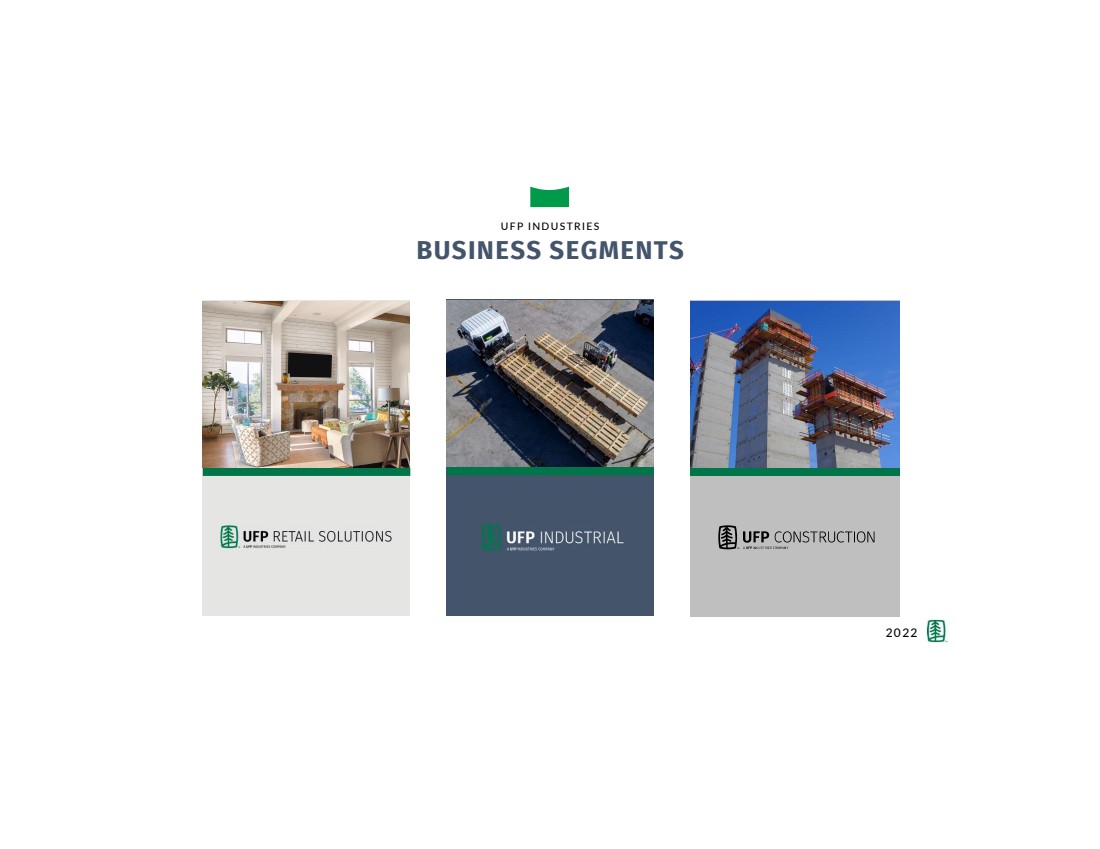
| 10 UFP INDUSTRIES BUSINESS SEGMENTS 2022 |
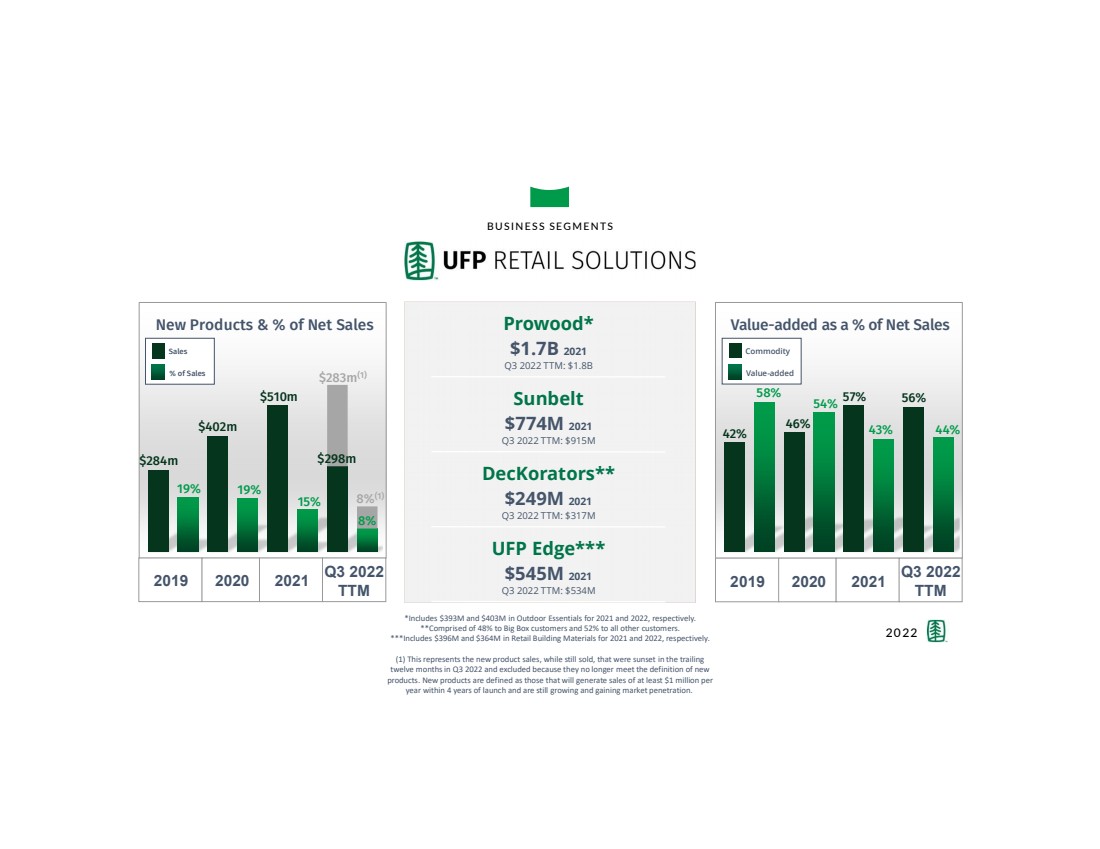
| 11 BUSINESS SEGMENTS 2022 2013 Value-added as a % of Net Sales 2013 $284m 19% 15% $402m $510m 19% Sales % of Sales Commodity Value-added 201920202021 58% 42% 46% 43% 57% 54% Sunbelt $774M 2021 DecKorators** $249M 2021 UFP Edge*** $545M 2021 Prowood* $1.7B 2021 *Includes $393M and $403M in Outdoor Essentials for 2021 and 2022, respectively. **Comprised of 48% to Big Box customers and 52% to all other customers. ***Includes $396M and $364M in Retail Building Materials for 2021 and 2022, respectively. (1) This represents the new product sales, while still sold, that were sunset in the trailing twelve months in Q3 2022 and excluded because they no longer meet the definition of new products. New products are defined as those that will generate sales of at least $1 million per year within 4 years of launch and are still growing and gaining market penetration. Q3 2022 TTM: $1.8B Q3 2022 TTM: $915M Q3 2022 TTM: $317M Q3 2022 TTM: $534M New Products & % of Net Sales 56% 44% Q3 2022 TTM 20192020 2021 Q3 2022 TTM $298m 8% 8% (1) $283m (1) |
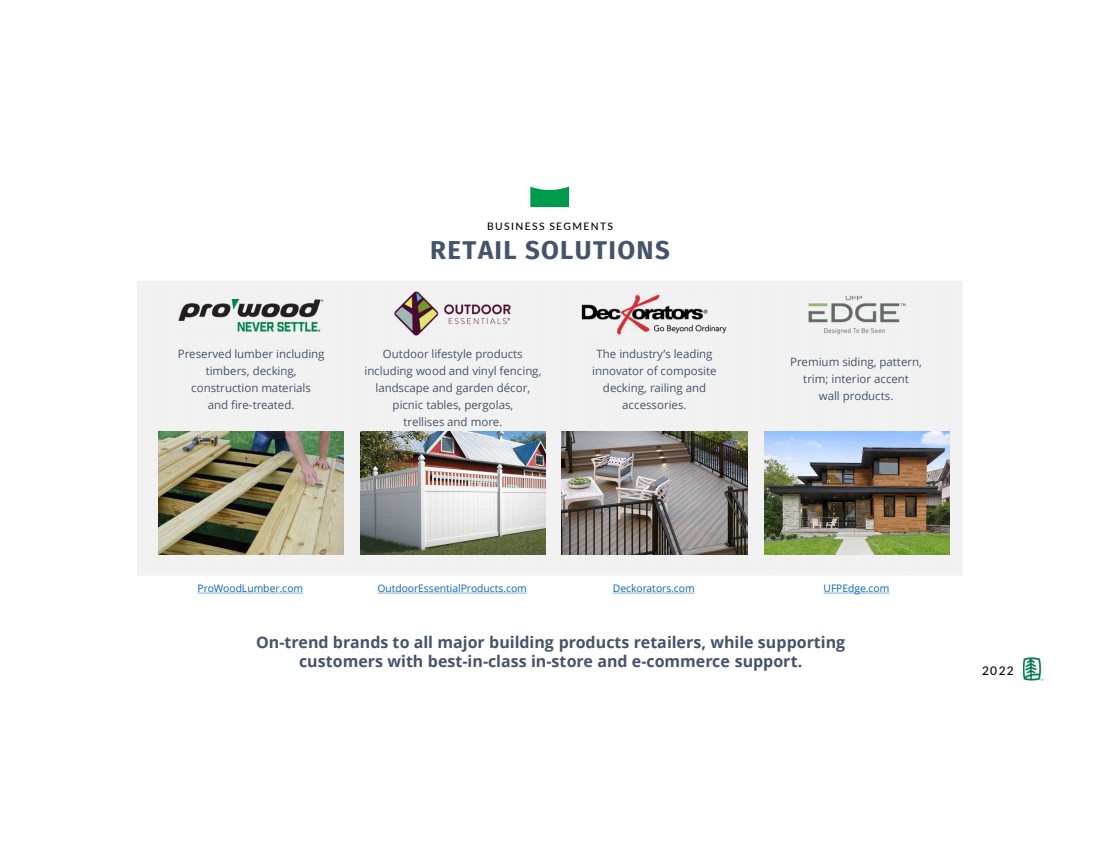
| 12 Deckorators.com BUSINESS SEGMENTS RETAIL SOLUTIONS ProWoodLumber.com OutdoorEssentialProducts.com UFPEdge.com Outdoor lifestyle products including wood and vinyl fencing, landscape and garden décor, picnic tables, pergolas, trellises and more. Premium siding, pattern, trim; interior accent wall products. Preserved lumber including timbers, decking, construction materials and fire-treated. The industry’s leading innovator of composite decking, railing and accessories. On-trend brands to all major building products retailers, while supporting customers with best-in-class in-store and e-commerce support. 2022 |
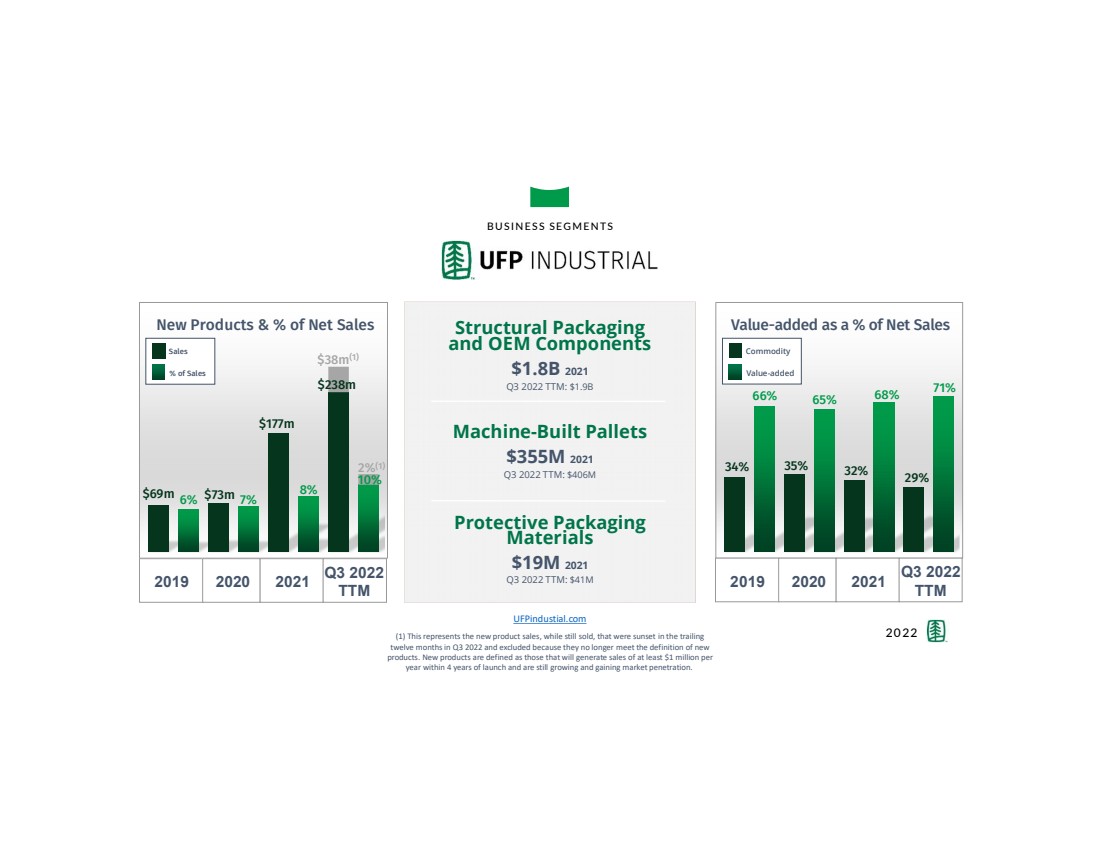
| 13 2022 2013 $69m 6% New Products & % of Net Sales 8% $73m $177m 7% Sales % of Sales 2013 35% 66% 34% 68% 32% 65% Commodity Value-added Value-added as a % of Net Sales UFPindustial.com Protective Packaging Materials $19M 2021 Structural Packaging and OEM Components $1.8B 2021 Q3 2022 TTM: $1.9B Q3 2022 TTM: $41M BUSINESS SEGMENTS Machine-Built Pallets $355M 2021 Q3 2022 TTM: $406M 201920202021 Q3 2022 TTM 71% 29% 201920202021 Q3 2022 TTM (1) This represents the new product sales, while still sold, that were sunset in the trailing twelve months in Q3 2022 and excluded because they no longer meet the definition of new products. New products are defined as those that will generate sales of at least $1 million per year within 4 years of launch and are still growing and gaining market penetration. $238m $38m (1) 10% 2% (1) |
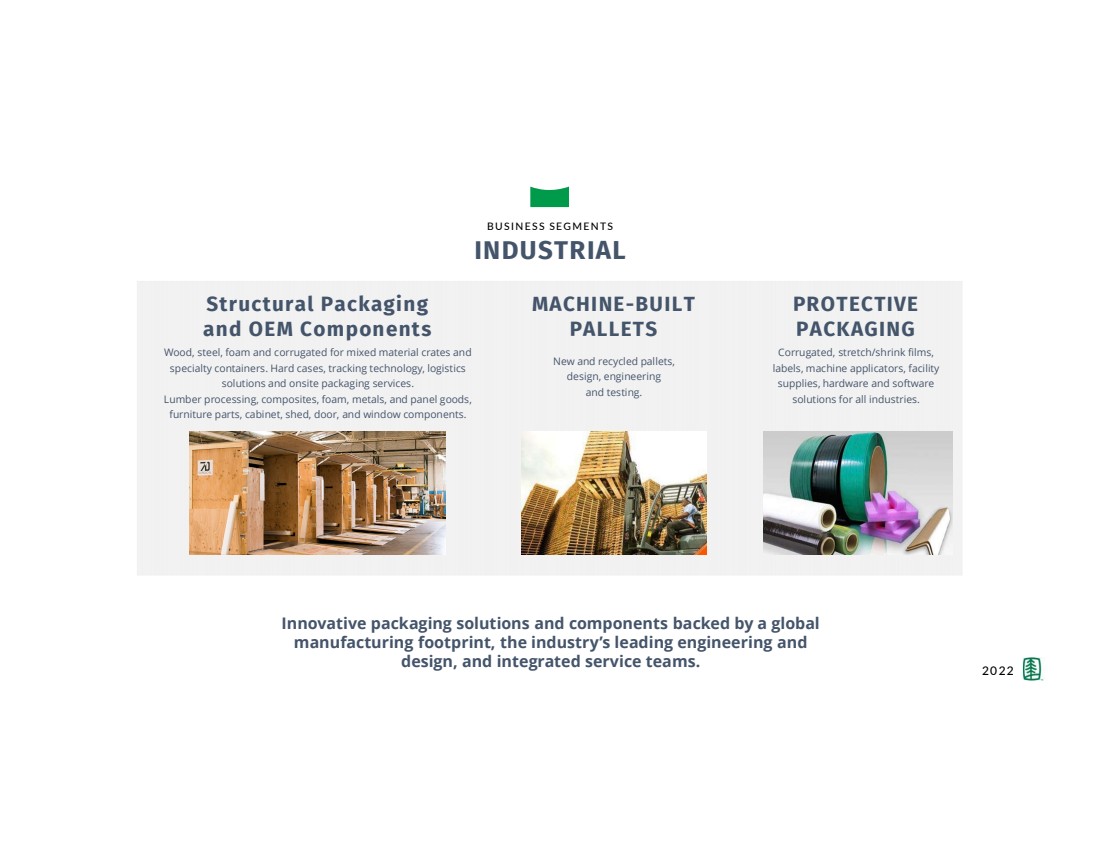
| 14 BUSINESS SEGMENTS INDUSTRIAL Corrugated, stretch/shrink films, labels, machine applicators, facility supplies, hardware and software solutions for all industries. PROTECTIVE PACKAGING Wood, steel, foam and corrugated for mixed material crates and specialty containers. Hard cases, tracking technology, logistics solutions and onsite packaging services. Lumber processing, composites, foam, metals, and panel goods, furniture parts, cabinet, shed, door, and window components. Structural Packaging and OEM Components New and recycled pallets, design, engineering and testing. MACHINE-BUILT PALLETS Innovative packaging solutions and components backed by a global manufacturing footprint, the industry’s leading engineering and design, and integrated service teams. 2022 |
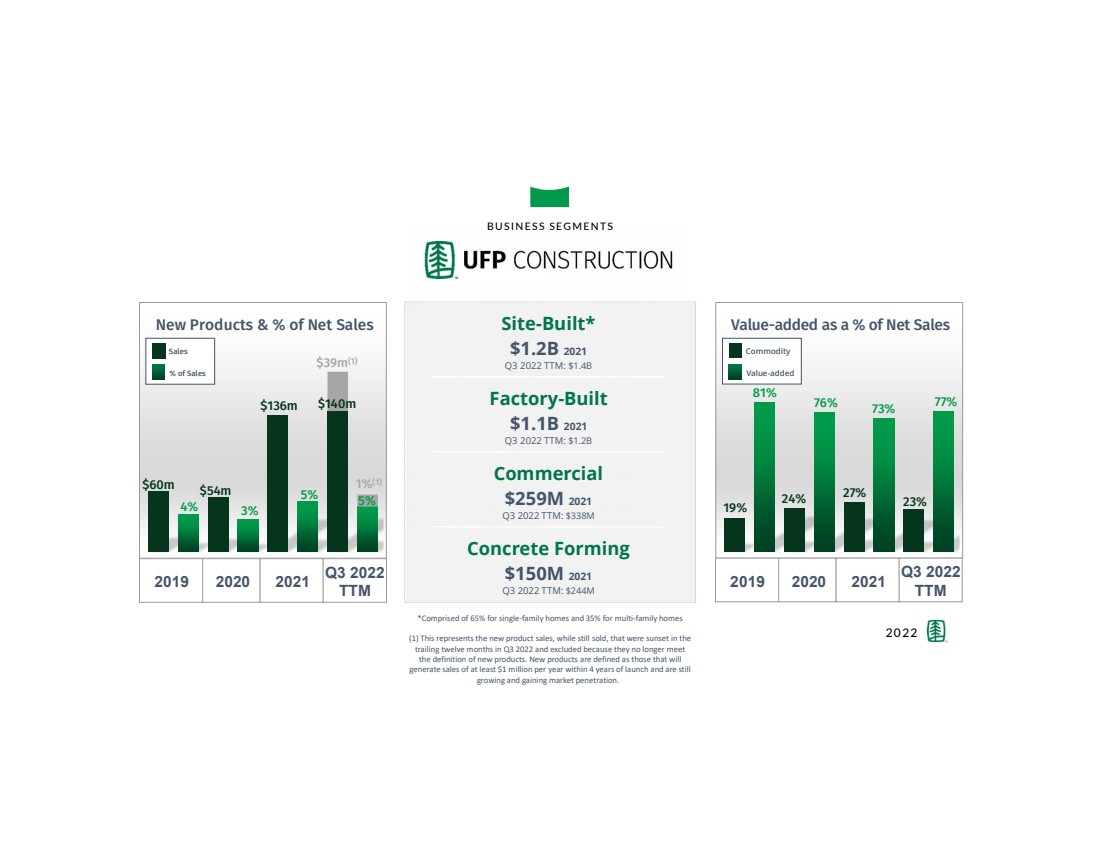
| 15 BUSINESS SEGMENTS 2022 2013 $140m $60m 4% 5% $54m $136m 3% Sales % of Sales 2013 24% 81% 19% 73% 27% 76% Commodity Value-added Value-added as a % of Net Sales Factory-Built $1.1B 2021 Commercial $259M 2021 Concrete Forming $150M 2021 Site-Built* $1.2B 2021 Q3 2022 TTM: $1.4B Q3 2022 TTM: $1.2B Q3 2022 TTM: $338M Q3 2022 TTM: $244M New Products & % of Net Sales *Comprised of 65% for single-family homes and 35% for multi-family homes (1) This represents the new product sales, while still sold, that were sunset in the trailing twelve months in Q3 2022 and excluded because they no longer meet the definition of new products. New products are defined as those that will generate sales of at least $1 million per year within 4 years of launch and are still growing and gaining market penetration. 201920202021 Q3 2022 TTM 23% 77% 201920202021 Q3 2022 TTM $39m (1) 5% 1% (1) |
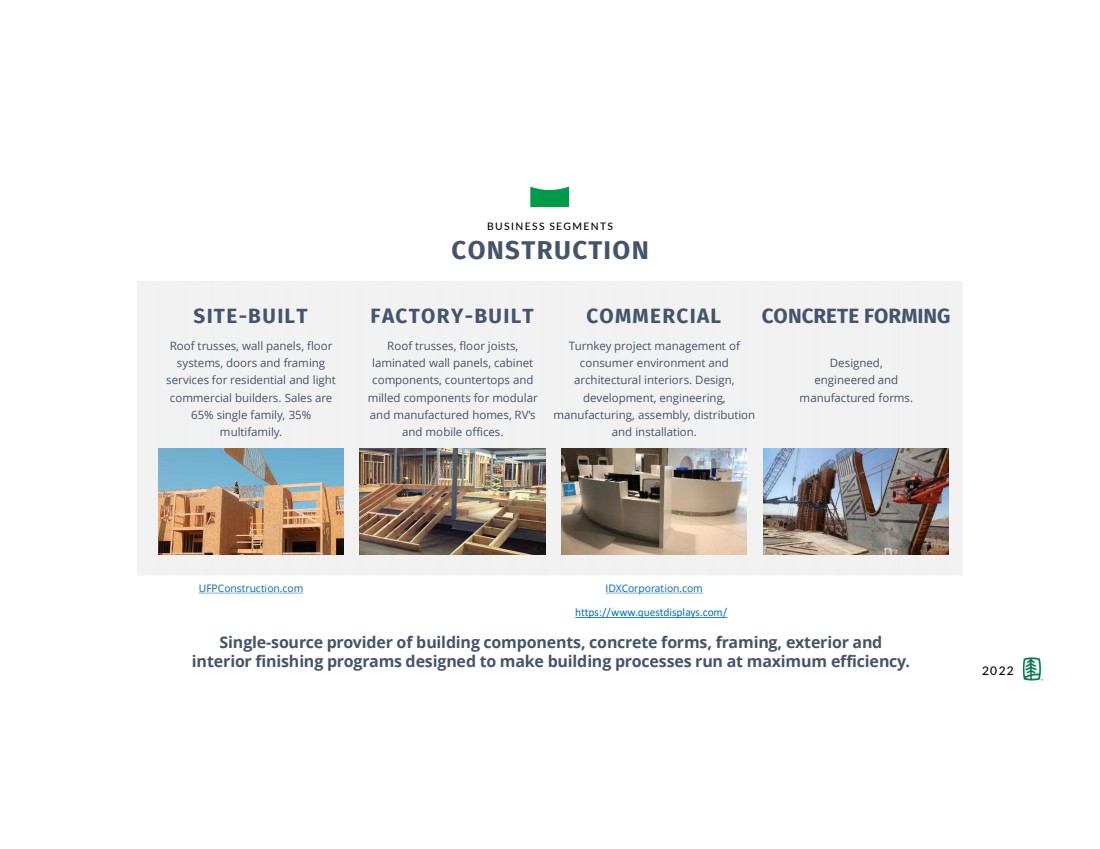
| 16 Roof trusses, wall panels, floor systems, doors and framing services for residential and light commercial builders. Sales are 65% single family, 35% multifamily. Roof trusses, floor joists, laminated wall panels, cabinet components, countertops and milled components for modular and manufactured homes, RV’s and mobile offices. BUSINESS SEGMENTS CONSTRUCTION SITE-BUILT FACTORY-BUILT UFPConstruction.com IDXCorporation.com Turnkey project management of consumer environment and architectural interiors. Design, development, engineering, manufacturing, assembly, distribution and installation. COMMERCIAL Designed, engineered and manufactured forms. CONCRETE FORMING Single-source provider of building components, concrete forms, framing, exterior and interior finishing programs designed to make building processes run at maximum efficiency. 2022 https://www.questdisplays.com/ |
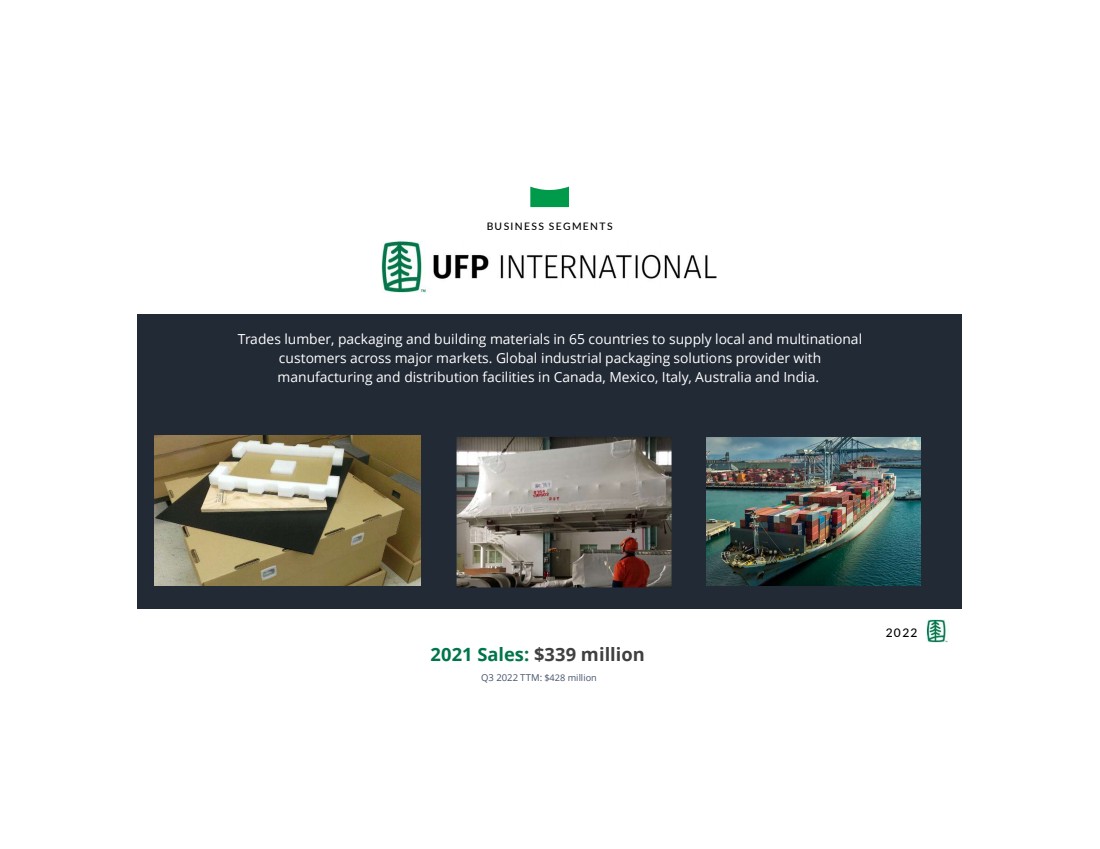
| 17 Trades lumber, packaging and building materials in 65 countries to supply local and multinational customers across major markets. Global industrial packaging solutions provider with manufacturing and distribution facilities in Canada, Mexico, Italy, Australia and India. BUSINESS SEGMENTS 2022 2021 Sales: $339 million Q3 2022 TTM: $428 million |
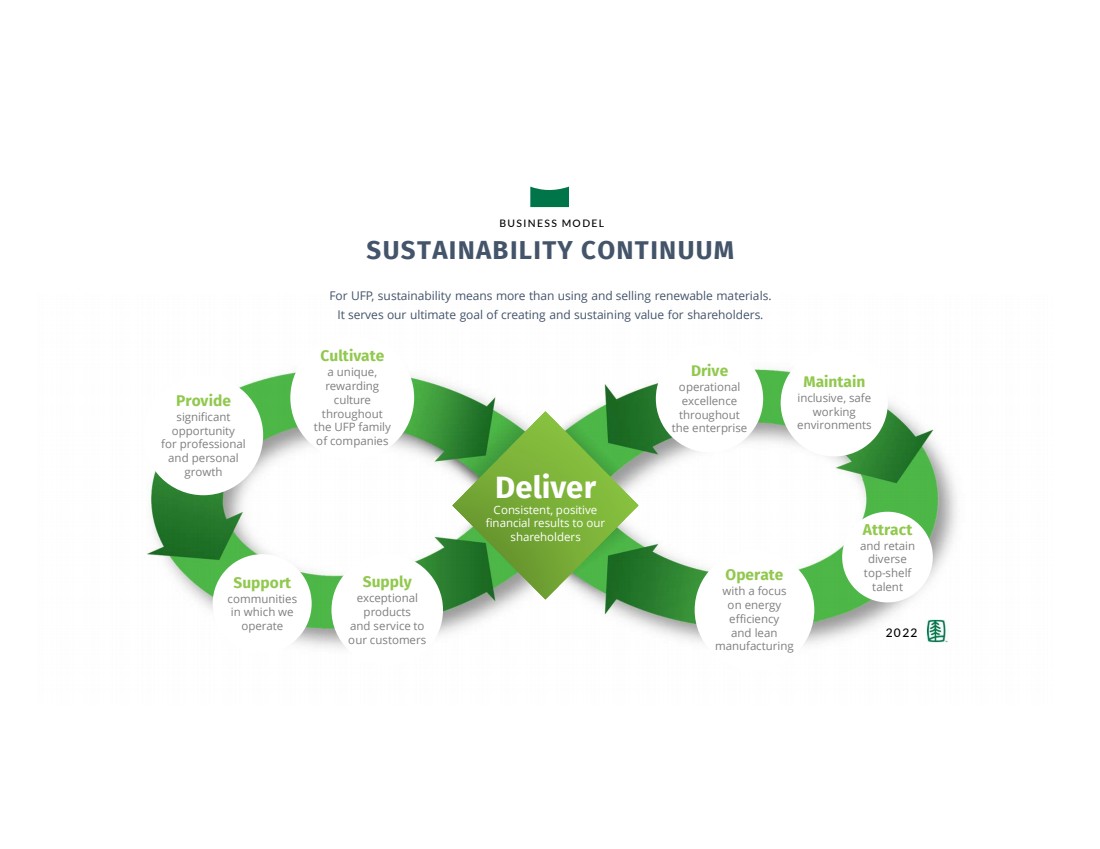
| 18 SUSTAINABILITY CONTINUUM 2022 Drive operational excellence throughout the enterprise Cultivate a unique, rewarding culture throughout the UFP family of companies Provide significant opportunity for professional and personal growth Support communities in which we operate Supply exceptional products and service to our customers Maintain inclusive, safe working environments Attract and retain diverse top-shelf talent Operate with a focus on energy efficiency and lean manufacturing Deliver Consistent, positive financial results to our shareholders For UFP, sustainability means more than using and selling renewable materials. It serves our ultimate goal of creating and sustaining value for shareholders. BUSINESS MODEL |
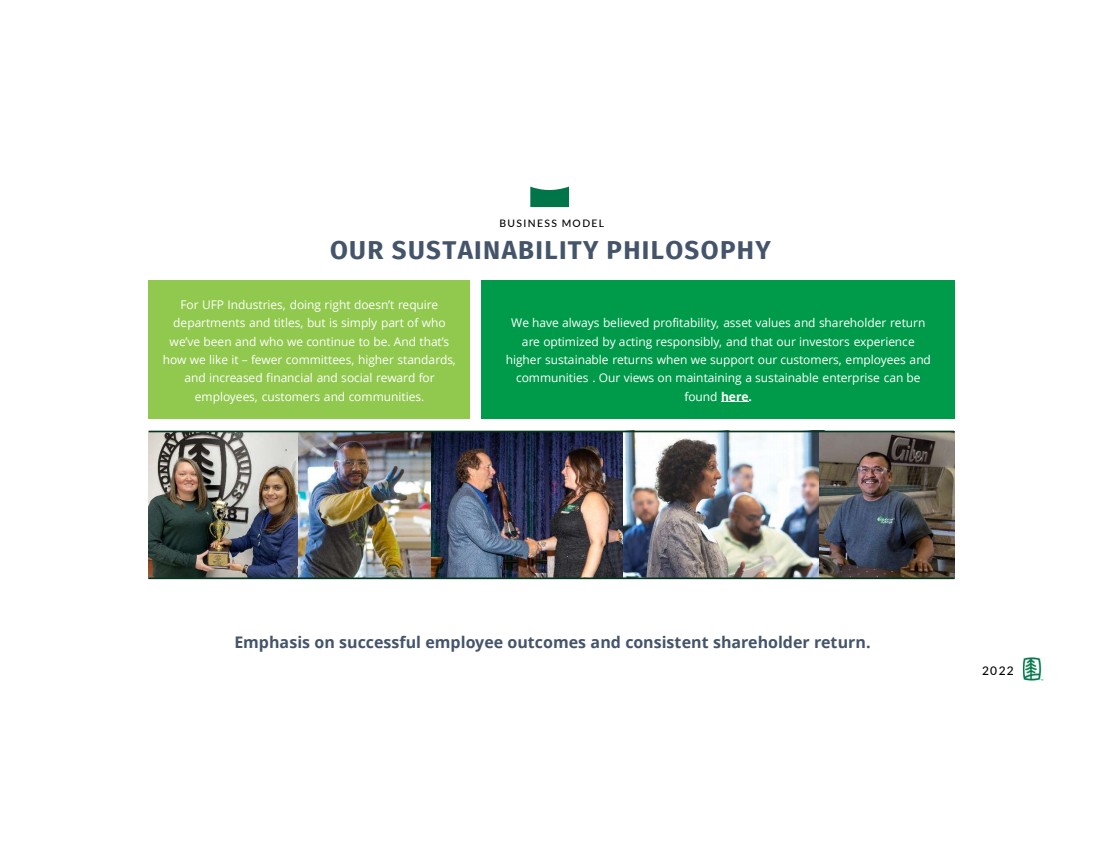
| 19 OUR SUSTAINABILITY PHILOSOPHY We have always believed profitability, asset values and shareholder return are optimized by acting responsibly, and that our investors experience higher sustainable returns when we support our customers, employees and communities . Our views on maintaining a sustainable enterprise can be found here. For UFP Industries, doing right doesn’t require departments and titles, but is simply part of who we’ve been and who we continue to be. And that’s how we like it –fewer committees, higher standards, and increased financial and social reward for employees, customers and communities. BUSINESS MODEL Emphasis on successful employee outcomes and consistent shareholder return. 2022 |
| 20 FINANCIALS |
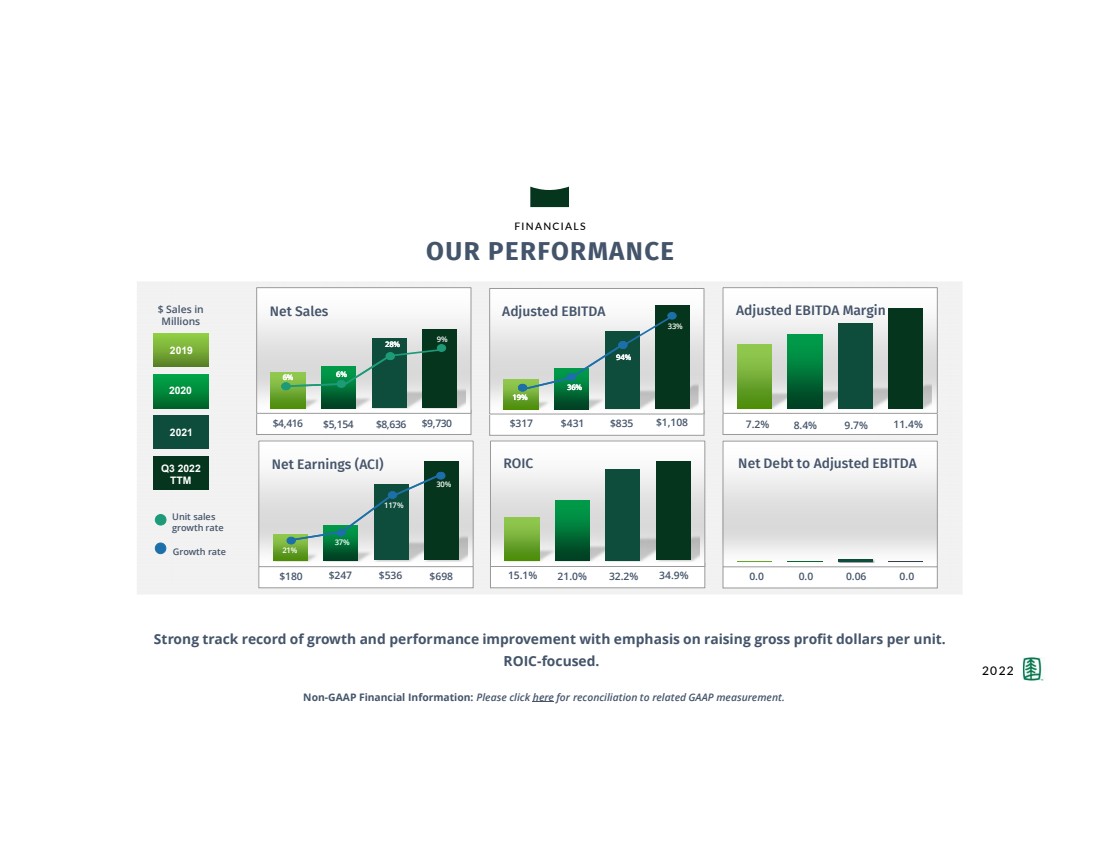
| 21 OUR PERFORMANCE 7.2% Adjusted EBITDA Margin 8.4% 9.7% $4,416 Net Sales $5,154$8,636 $180 Net Earnings (ACI) $247$536 0.0 Net Debt to Adjusted EBITDA 0.0 0.06 15.1% ROIC 21.0% 34.9% 2019 2020 2021 Unit sales growth rate 6% 6% 6% 6% 28% 28% 6% 6% 28% $ Sales in Millions Growth rate 21% 37% 117% $317 Adjusted EBITDA $431$835 19% 19% 36% 36% 94% 94% 19% 36% 94% 2022 Strong track record of growth and performance improvement with emphasis on raising gross profit dollars per unit. ROIC-focused. Q3 2022 TTM $9,730 0.0 11.4% 32.2% $698 30% $1,108 33% 9% FINANCIALS Non-GAAP Financial Information: Please click herefor reconciliation to related GAAP measurement. |
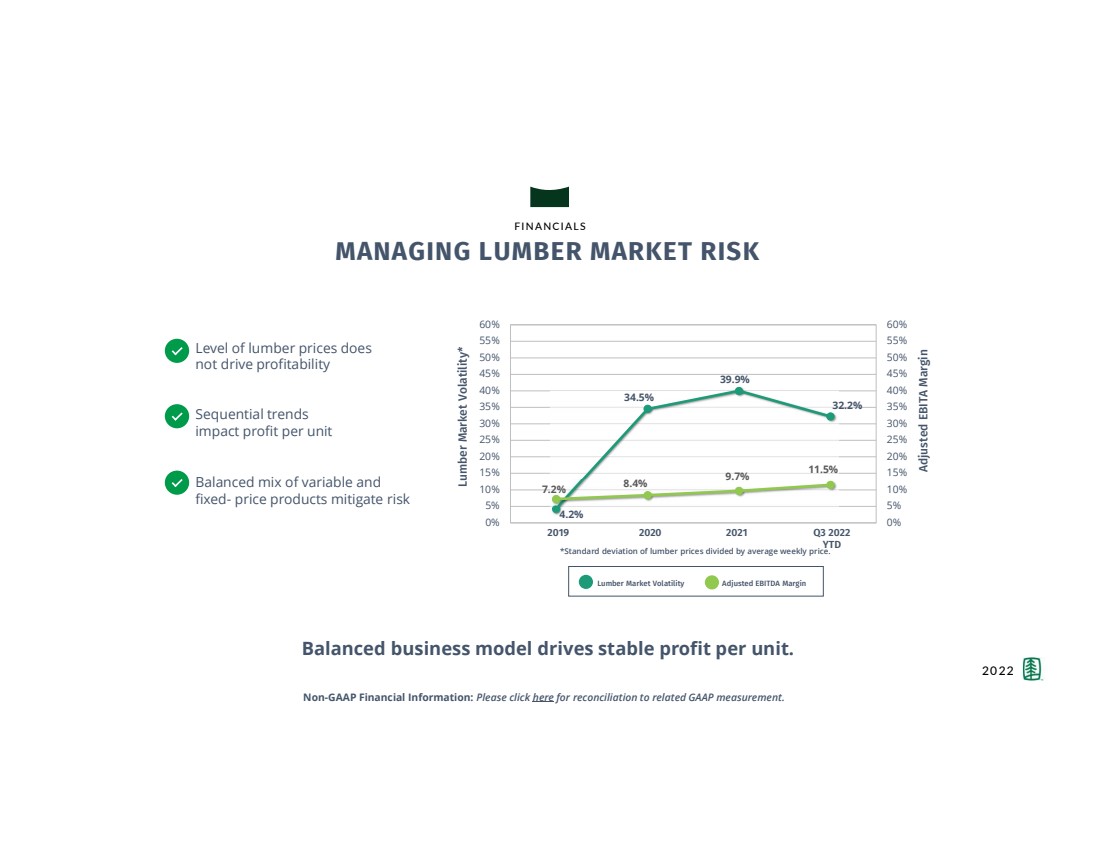
| 22 MANAGING LUMBER MARKET RISK Level of lumber prices does not drive profitability Sequential trends impact profit per unit Balanced mix of variable and fixed-price products mitigate risk Adjusted EBITA Margin Lumber Market Volatility* 4.2% 34.5% 39.9% 32.2% 7.2% 8.4% 9.7% 11.5% 0% 5% 10% 15% 20% 25% 30% 35% 40% 45% 50% 55% 60% 0% 5% 10% 15% 20% 25% 30% 35% 40% 45% 50% 55% 60% 2019 20202021Q3 2022 YTD Lumber Market Volatility Adjusted EBITDA Margin *Standard deviation of lumber prices divided by average weekly price. 2022 Balanced business model drives stable profit per unit. FINANCIALS Non-GAAP Financial Information: Please click herefor reconciliation to related GAAP measurement. |
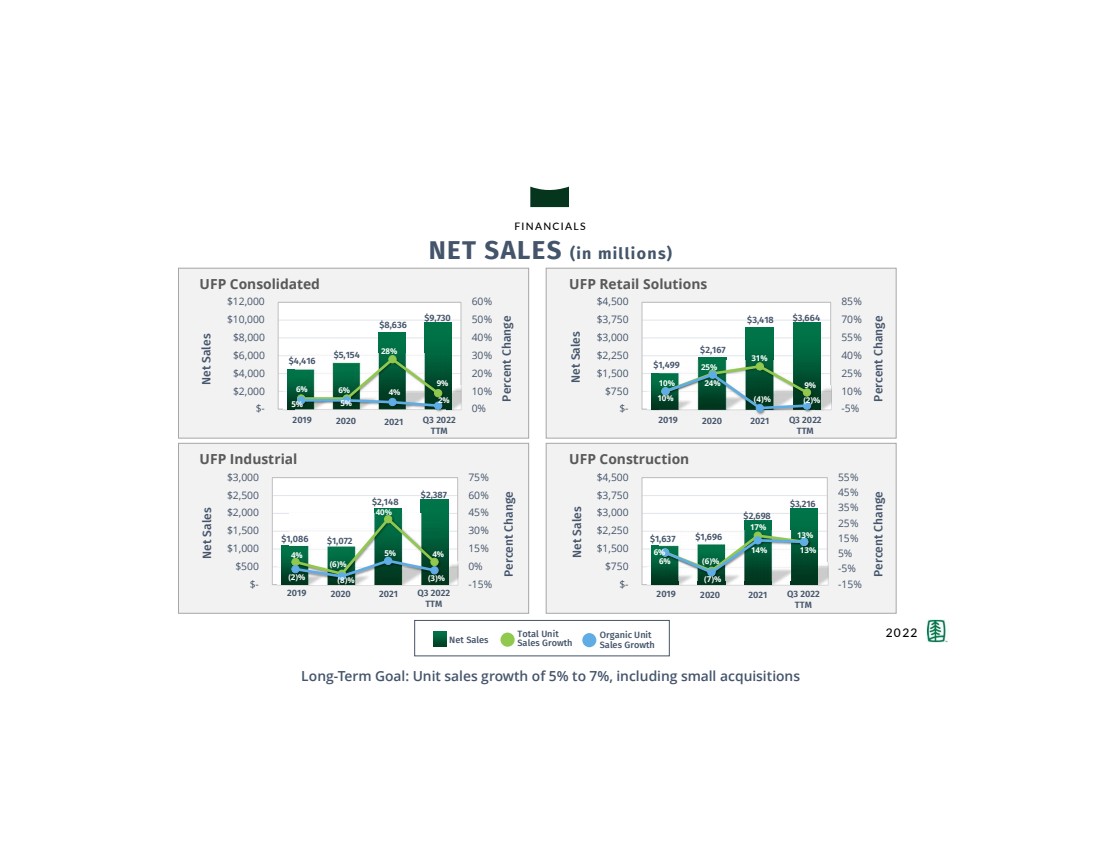
| 23 FINANCIALS 2022 NET SALES (in millions) Long-Term Goal: Unit sales growth of 5% to 7%, including small acquisitions Net Sales Percent Change $4,416 $5,154 $8,636 $9,730 6% 6% 28% 9% 5% 5% 4% 2% 0% 10% 20% 30% 40% 50% 60% $- $2,000 $4,000 $6,000 $8,000 $10,000 $12,000 Organic Unit Sales Growth Total Unit Sales Growth Net Sales 2019 2020 2021 Q3 2022 TTM UFP Consolidated Net Sales Percent Change $1,086 $1,072 $2,148 $2,387 4% (6)% 40% 4% (2)% (8)% 5% (3)% -15% 0% 15% 30% 45% 60% 75% $- $500 $1,000 $1,500 $2,000 $2,500 $3,000 UFP Industrial Net Sales Percent Change $1,499 $2,167 $3,418 $3,664 10% 25% 31% 9% 10% 24% (4)% (2)% -5% 10% 25% 40% 55% 70% 85% $- $750 $1,500 $2,250 $3,000 $3,750 $4,500 UFP Retail Solutions Net Sales Percent Change $1,637 $1,696 $2,698 $3,216 6% (6)% 17% 13% 6% (7)% 14%13% -15% -5% 5% 15% 25% 35% 45% 55% $- $750 $1,500 $2,250 $3,000 $3,750 $4,500 UFP Construction 2019 2020 2021 Q3 2022 TTM 2019 2020 2021 Q3 2022 TTM 2019 20202021 Q3 2022 TTM |
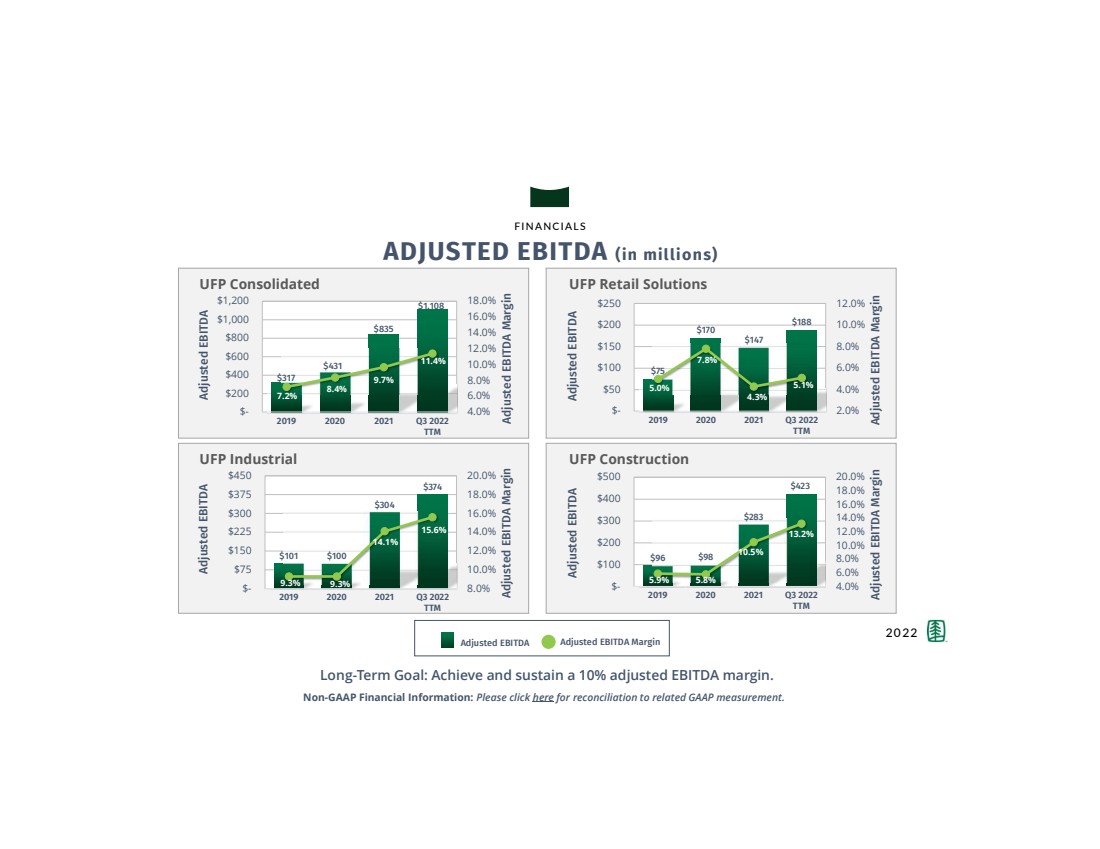
| 24 UFP Consolidated UFP Industrial UFP Retail Solutions UFP Construction FINANCIALS ADJUSTED EBITDA (in millions) 2022 Non-GAAP Financial Information: Please click herefor reconciliation to related GAAP measurement. Adjusted EBITDA Adjusted EBITDA Margin Adjusted EBITDA Margin Adjusted EBITDA $317 $431 $835 $1,108 7.2% 8.4% 9.7% 11.4% 4.0% 6.0% 8.0% 10.0% 12.0% 14.0% 16.0% 18.0% $- $200 $400 $600 $800 $1,000 $1,200 201920202021Q3 2022 TTM Adjusted EBITDA Adjusted EBITDA Margin $101 $100 $304 $374 9.3% 9.3% 14.1% 15.6% 8.0% 10.0% 12.0% 14.0% 16.0% 18.0% 20.0% $- $75 $150 $225 $300 $375 $450 201920202021Q3 2022 TTM Adjusted EBITDA Adjusted EBITDA Margin $75 $170 $147 $188 5.0% 7.8% 4.3% 5.1% 2.0% 4.0% 6.0% 8.0% 10.0% 12.0% $- $50 $100 $150 $200 $250 201920202021Q3 2022 TTM Adjusted EBITDA Adjusted EBITDA Margin $96 $98 $283 $423 5.9% 5.8% 10.5% 13.2% 4.0% 6.0% 8.0% 10.0% 12.0% 14.0% 16.0% 18.0% 20.0% $- $100 $200 $300 $400 $500 201920202021Q3 2022 TTM Long-Term Goal: Achieve and sustain a 10% adjusted EBITDA margin. |
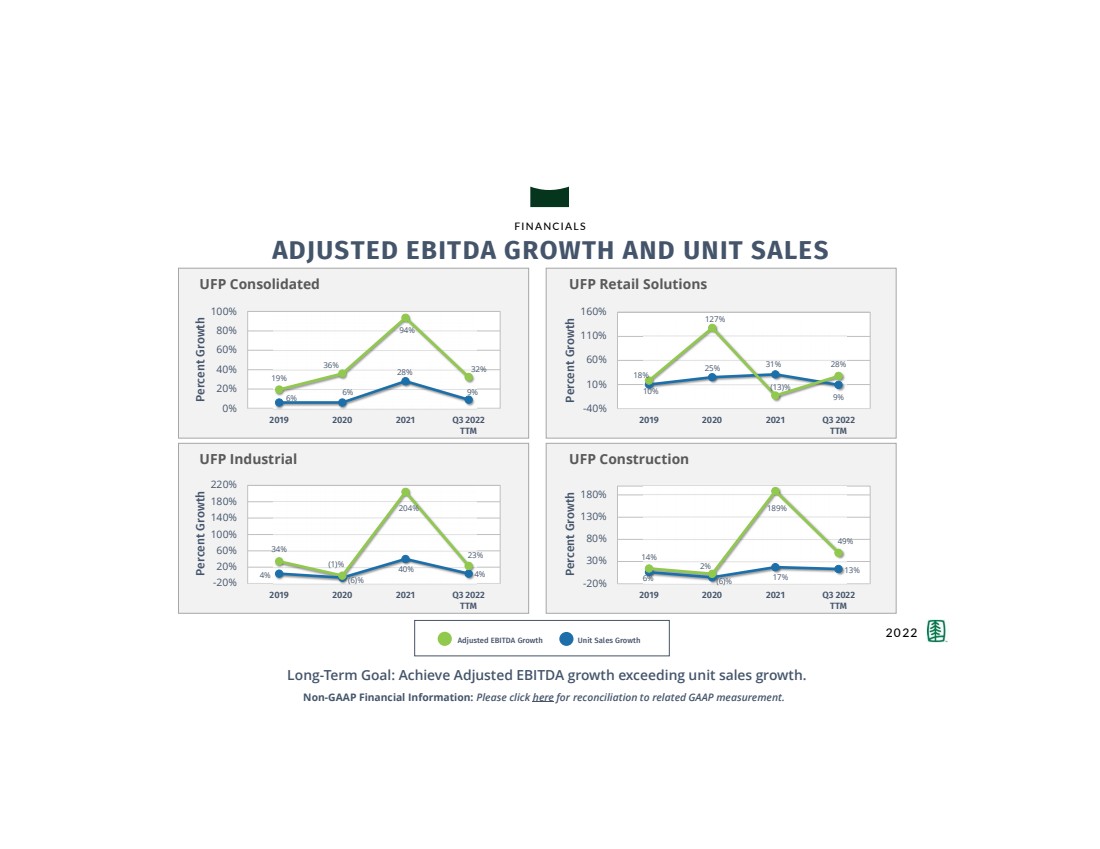
| 25 UFP Consolidated UFP Industrial UFP Retail Solutions FINANCIALS ADJUSTED EBITDA GROWTH AND UNIT SALES 2022 Percent Growth 6% 6% 28% 9% 19% 36% 94% 32% 0% 20% 40% 60% 80% 100% 201920202021Q3 2022 TTM Unit Sales Growth Adjusted EBITDA Growth Long-Term Goal: Achieve Adjusted EBITDA growth exceeding unit sales growth. UFP Construction Percent Growth 4% (6)% 40% 4% 34% (1)% 204% 23% -20% 20% 60% 100% 140% 180% 220% 201920202021Q3 2022 TTM Percent Growth 10% 25% 31% 9% 18% 127% (13)% 28% -40% 10% 60% 110% 160% 201920202021Q3 2022 TTM Percent Growth 6% (6)% 17% 13% 14% 2% 189% 49% -20% 30% 80% 130% 180% 201920202021Q3 2022 TTM Non-GAAP Financial Information: Please click herefor reconciliation to related GAAP measurement. |
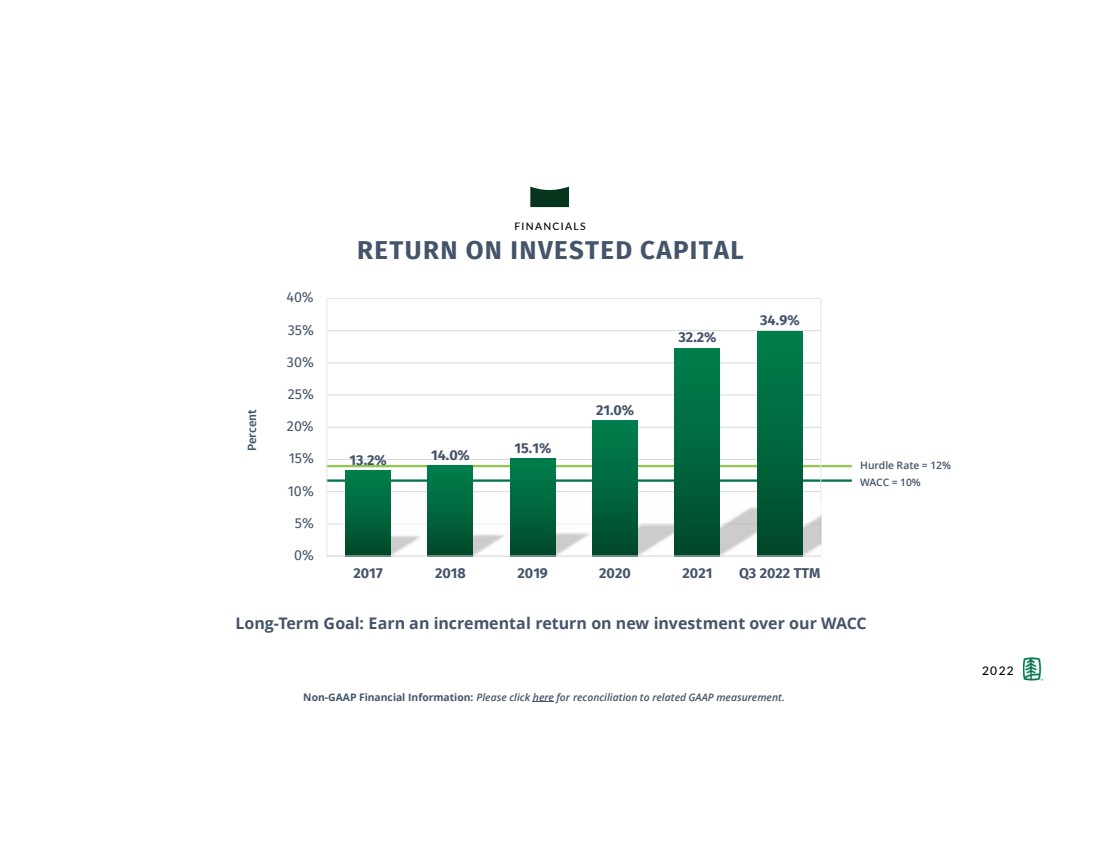
| 26 FINANCIALS RETURN ON INVESTED CAPITAL Hurdle Rate = 12% Percent 13.2% 14.0% 15.1% 21.0% 32.2% 34.9% 0% 5% 10% 15% 20% 25% 30% 35% 40% 20172018201920202021Q3 2022 TTM Long-Term Goal: Earn an incremental return on new investment over our WACC WACC = 10% 2022 Non-GAAP Financial Information: Please click herefor reconciliation to related GAAP measurement. |
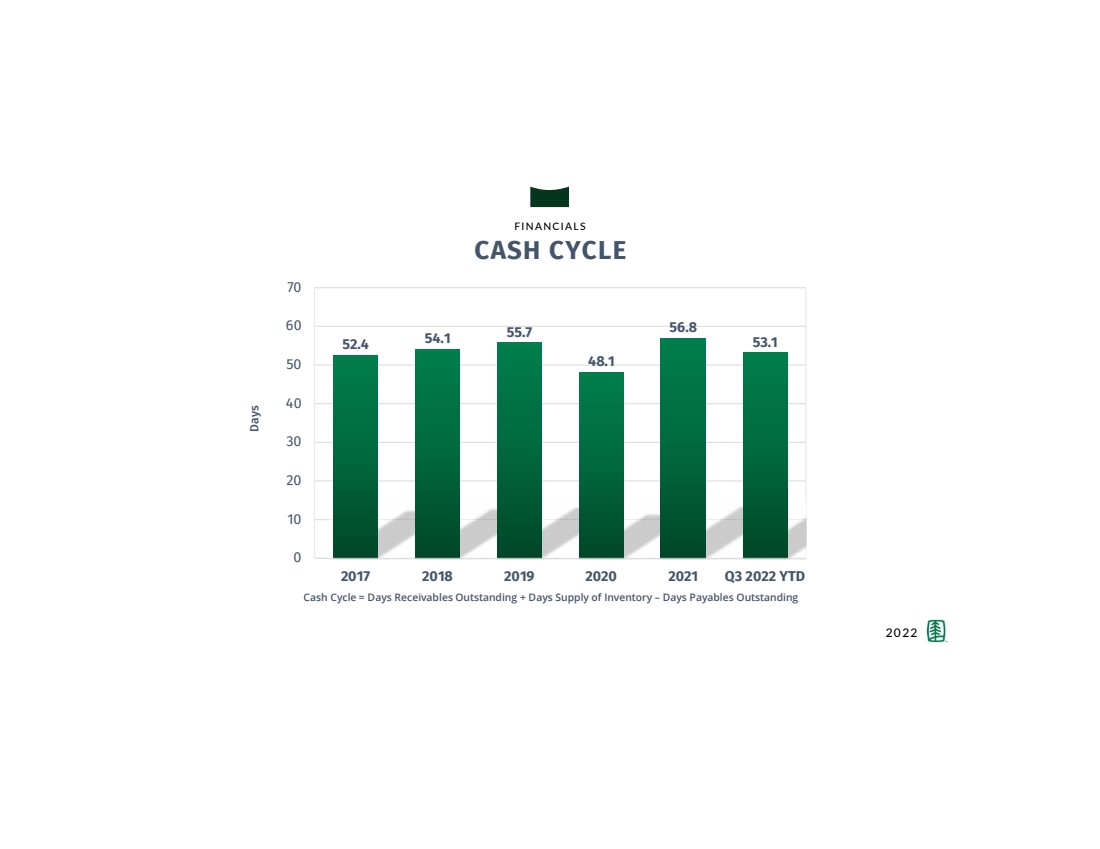
| 27 FINANCIALS CASH CYCLE 2022 Cash Cycle = Days Receivables Outstanding + Days Supply of Inventory –Days Payables Outstanding Days 52.4 54.1 55.7 48.1 56.8 53.1 0 10 20 30 40 50 60 70 20172018201920202021Q3 2022 YTD |
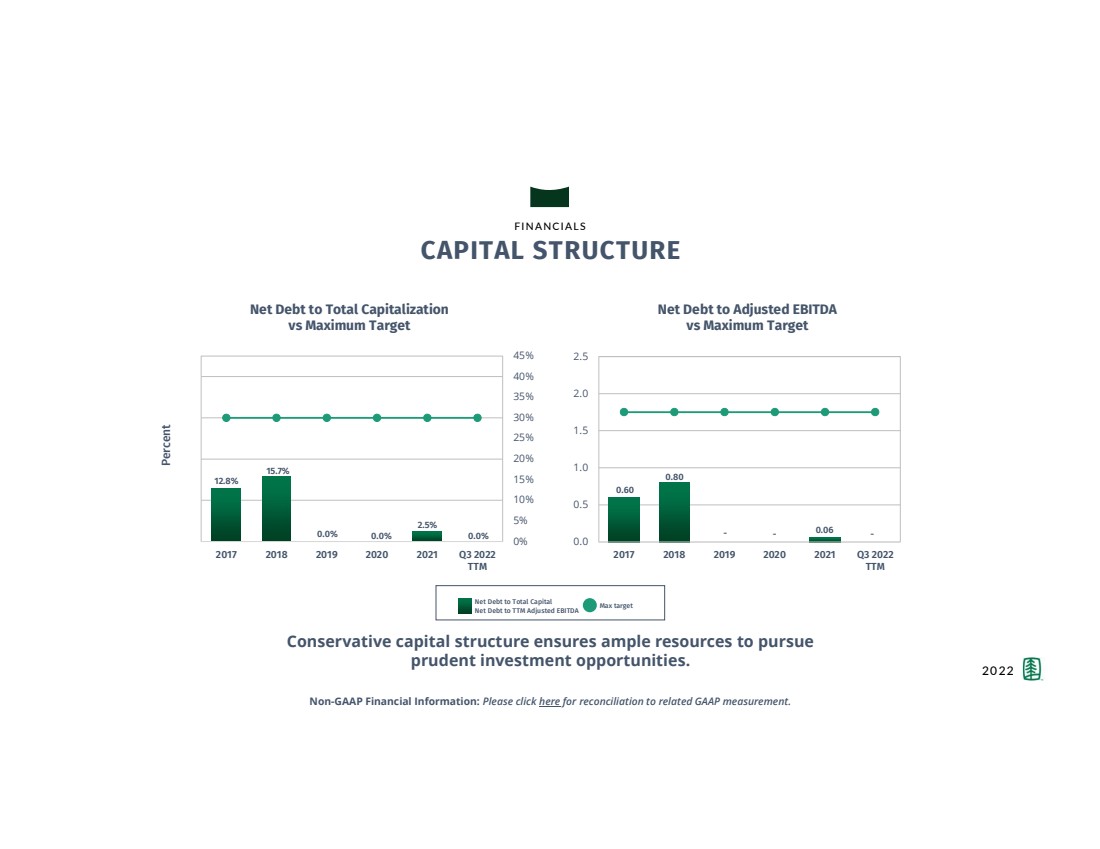
| 28 FINANCIALS CAPITAL STRUCTURE Percent Net Debt to Total Capitalization vs Maximum Target Net Debt to Adjusted EBITDA vs Maximum Target 12.8% 15.7% 0.0% 0.0% 2.5% 0.0% 0% 5% 10% 15% 20% 25% 30% 35% 40% 45% 20172018201920202021Q3 2022 TTM 0.60 0.80 - - 0.06 - 0.0 0.5 1.0 1.5 2.0 2.5 20172018201920202021Q3 2022 TTM Max target Net Debt to Total Capital Net Debt to TTM Adjusted EBITDA Non-GAAP Financial Information: Please click herefor reconciliation to related GAAP measurement. Conservative capital structure ensures ample resources to pursue prudent investment opportunities. 2022 |
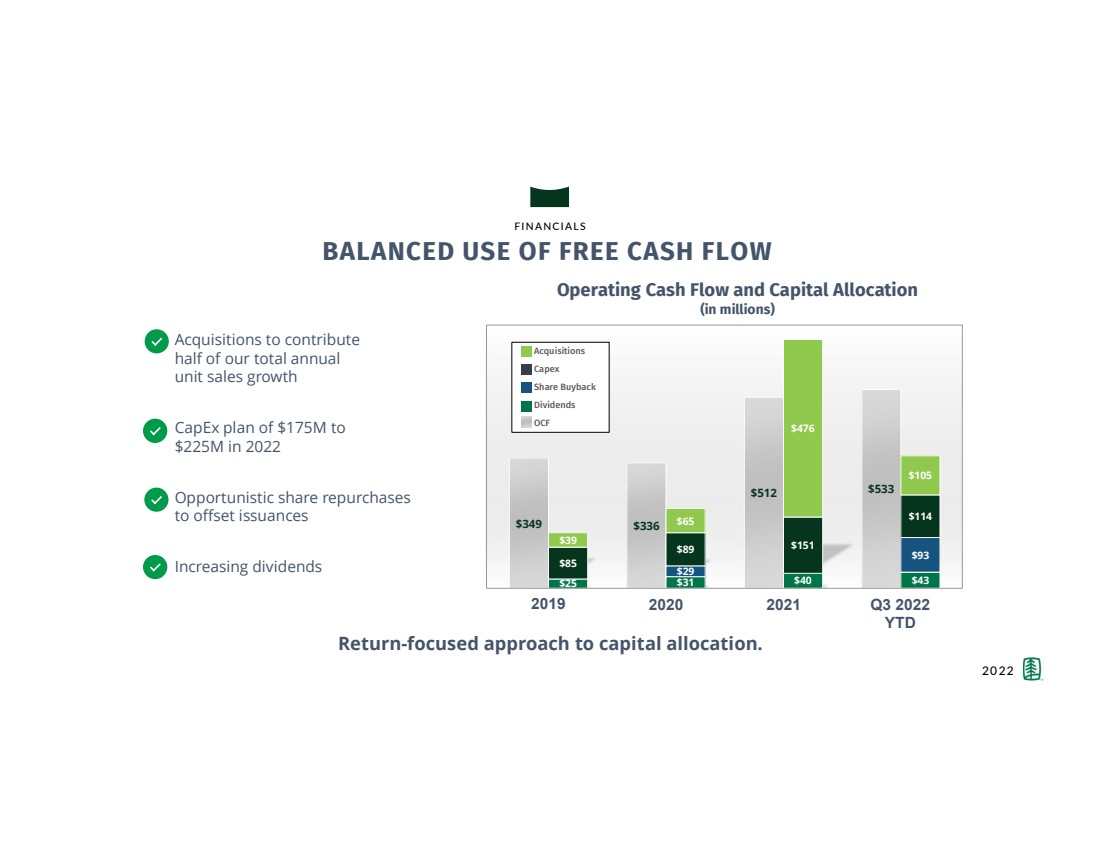
| 29 BALANCED USE OF FREE CASH FLOW Acquisitions to contribute half of our total annual unit sales growth CapExplan of $175M to $225M in 2022 Opportunistic share repurchases to offset issuances Increasing dividends $349 $336 $512 $533 $25 $31 $40 $43 $29 $93 $85 $89 $151 $114 $39 $65 $476 $105 Acquisitions Capex Share Buyback Dividends OCF 2019 2020 2021 Operating Cash Flow and Capital Allocation (in millions) Return-focused approach to capital allocation. 2022 Q3 2022 YTD FINANCIALS |
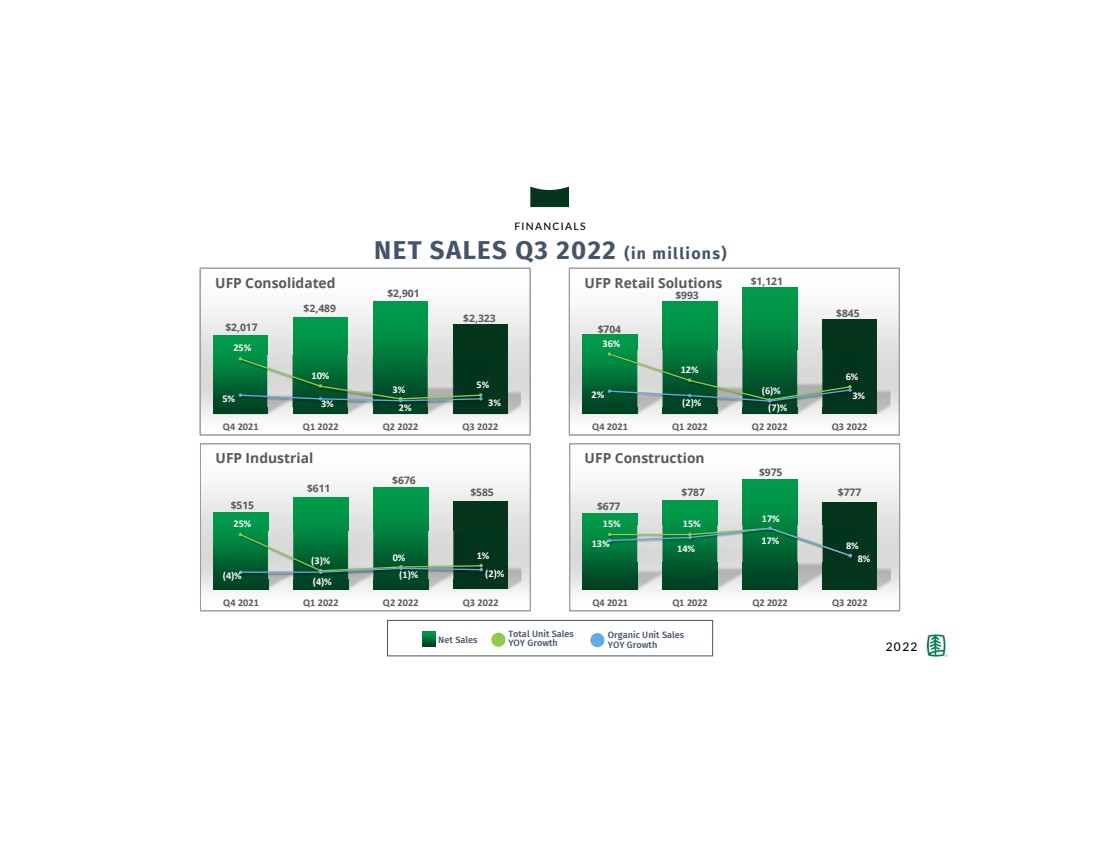
| 30 FINANCIALS 2022 NET SALESQ3 2022 (in millions) $2,017 $2,489 $2,901 $2,323 Q4 2021Q1 2022Q2 2022Q3 2022 UFP Consolidated Organic Unit Sales YOY Growth Total Unit Sales YOY Growth Net Sales $704 $993 $1,121 $845 Q4 2021Q1 2022Q2 2022Q3 2022 UFP Retail Solutions $515 $611 $676 $585 Q4 2021Q1 2022Q2 2022Q3 2022 UFP Industrial $677 $787 $975 $777 Q4 2021Q1 2022Q2 2022Q3 2022 UFP Construction 25% 10% 3% 5% 5% 3% 2% 3% 36% 12% (6)% 6% 2% (2)% (7)% 3% 25% (3)% 0% 1% (4)% (4)% (1)% (2)% 15%15% 17% 8% 13% 14% 17% 8% |
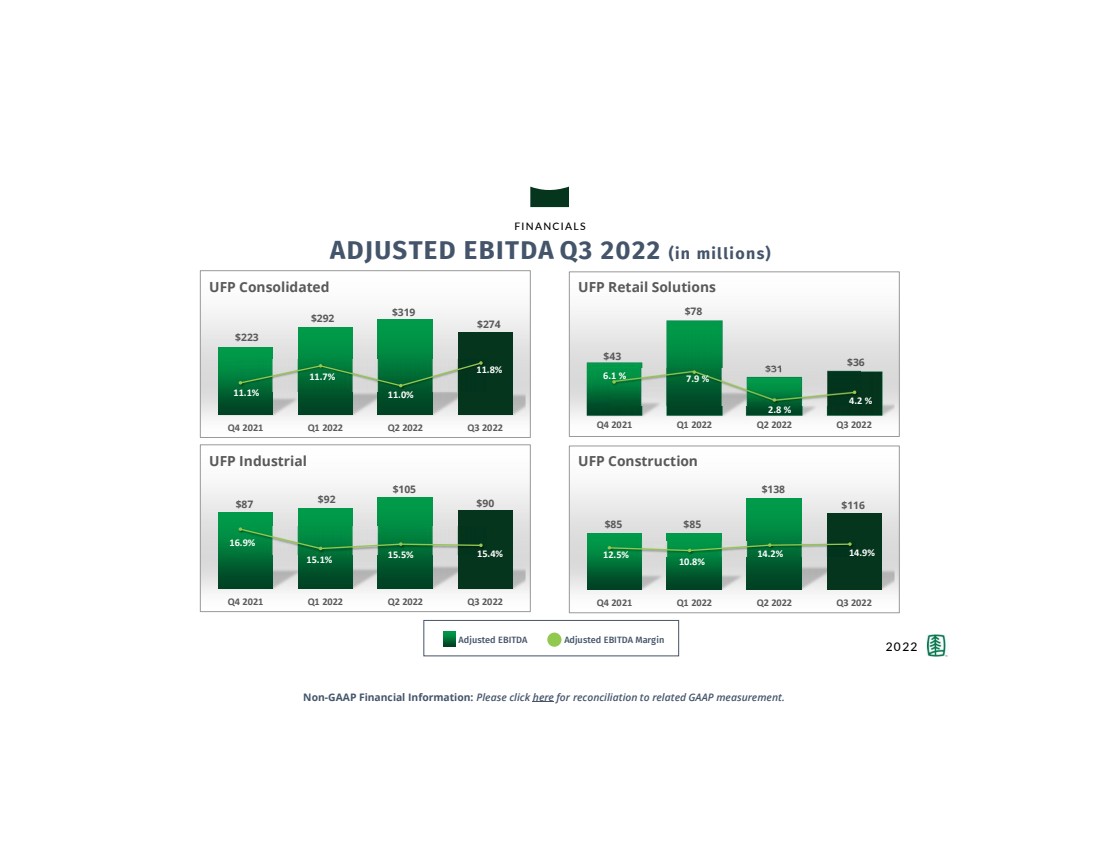
| 31 FINANCIALS 2022 ADJUSTED EBITDAQ3 2022 (in millions) $2.9 $2.0 $2.1 $223 $292 $319 $274 Q4 2021Q1 2022Q2 2022Q3 2022 UFP Consolidated Adjusted EBITDA Margin Adjusted EBITDA $2.9 $2.0 $2.1 $43 $78 $31 $36 Q4 2021Q1 2022Q2 2022Q3 2022 UFP Retail Solutions $2.9 $2.0 $2.1 $87 $92 $105 $90 Q4 2021Q1 2022Q2 2022Q3 2022 UFP Industrial $2.9 $2.0 $2.1 $85 $85 $138 $116 Q4 2021Q1 2022Q2 2022Q3 2022 UFP Construction 11.1% 11.7% 11.0% 11.8% 6.1 % 7.9 % 2.8 % 4.2 % 16.9% 15.1% 15.5% 15.4% 12.5% 10.8% 14.2% 14.9% Non-GAAP Financial Information: Please click herefor reconciliation to related GAAP measurement. |
| 32 2801 E. Beltline Ave. NE Grand Rapids, MI 49506 (800) 598-9663 -UFPI.com THANK YOU. |