Table of Contents
| Welcome Analyst Day - March 3, 2006 |
TABLE OF CONTENTS
Table of Contents

| Safe Harbor Clause Statements expressed during this meeting may constitute "forward-looking statements" within the meaning of the Private Securities Litigation Reform Act of 1995. Terremark's actual results may differ materially from those set forth in the forward-looking statements due to a number of risks, uncertainties and other factors, as discussed in Terremark's filings with the SEC. These factors include, without limitation, Terremark's ability to obtain funding for its business plans, uncertainty in the demand for Terremark's services or products and Terremark's ability to manage its growth. Terremark does not assume any obligation to update these forward- looking statements. |
Table of Contents

| Agenda for Today TIME TOPIC PRESENTER 10:00 a.m. Webcast Begins Welcome and Overview Manuel D. Medina, CEO NAP/Operations/Technology Marvin Wheeler, COO 11:00 a.m. Webcast Break Tour of the NAP Marvin Wheeler, COO Ben Stewart, SVP Hector Hernandez, SVP 12:00 p.m. Buffet Lunch 12:30 p.m. Webcast Continues Marketing/ Managed Services Javier Rodriguez, CMO Commercial Sales John Neville, SVP Federal Sales Jamie Dos Santos, CEO Terremark Federal Group Customer Presentation Jose Gomez Exec. Dir. of Info. Systems Hollywood Media Financials Jose Segrera, CFO Wrap-up Manuel D. Medina, CEO 3:00 p.m. Adjourn |
Table of Contents

| TWW Executive Team Manny Medina CEO Marvin Wheeler COO 5 yrs. with TWW 30 yrs. Industry Exp. Jamie Dos Santos CEO - TFG 5 yrs. with TWW 25 yrs. Industry Exp. Jose Segrera CFO 5 yrs. with TWW 10 yrs. Industry Exp. John Neville Sr. VP Comm. Sales 1 yr. with TWW 23 yrs. Industry Exp. Javier Rodriguez CMO 3 yrs. with TWW 20 yrs. Industry Exp. Founder |
Table of Contents
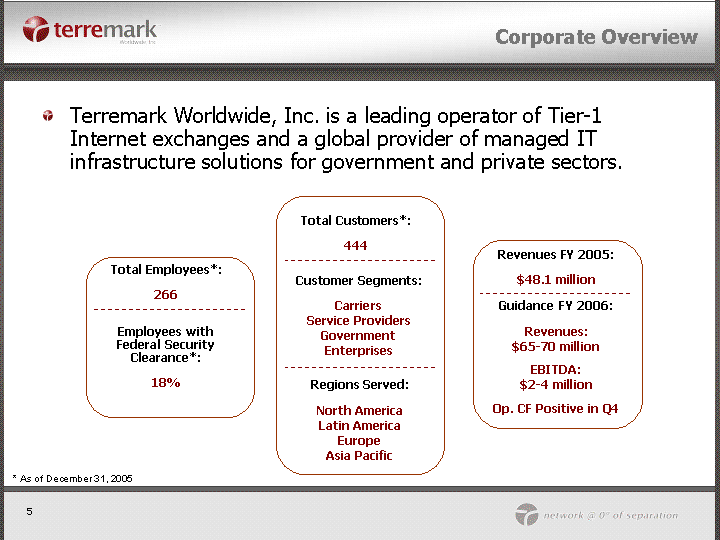
| Terremark Worldwide, Inc. is a leading operator of Tier-1 Internet exchanges and a global provider of managed IT infrastructure solutions for government and private sectors. Total Employees*: 266 Employees with Federal Security Clearance*: 18% Total Customers*: 444 Customer Segments: Carriers Service Providers Government Enterprises Revenues FY 2005: $48.1 million Regions Served: North America Latin America Europe Asia Pacific Guidance FY 2006: Revenues: $65-70 million EBITDA: $2-4 million Op. CF Positive in Q4 * As of December 31, 2005 Corporate Overview |
Table of Contents
| Mission critical infrastructure guarantees an "always on" environment. Complete IT infrastructure management allows customers to deal with a single vendor, have a single SLA, and remain focused on their core business. Network density provides more connectivity options and reduces operating costs. Strategic footprint across the Americas, Europe and Asia allows for a single-vendor solution. Recurring revenues provides visibility to results Significant operating leverage in the model Large CAPEX spending completed Future Capex success-based Key Facts |
Table of Contents
| Business Continuity and Disaster Recovery Planning has become a top priority for companies of all sizes. Continued growth in internet usage Increase in traffic, broadband connections Regulatory Drivers Government Sector Presidential Decision Directive (PDD) 67 Financial Sector Graham-Leach-Bailey Act Expedited Funds Availability Act SAS 70 audit Reports Sarbanes-Oxley Act (SOX) Health Care Sector Health Insurance Portability and Accountability Act (HIPAA) Industry Demand Drivers |
Table of Contents
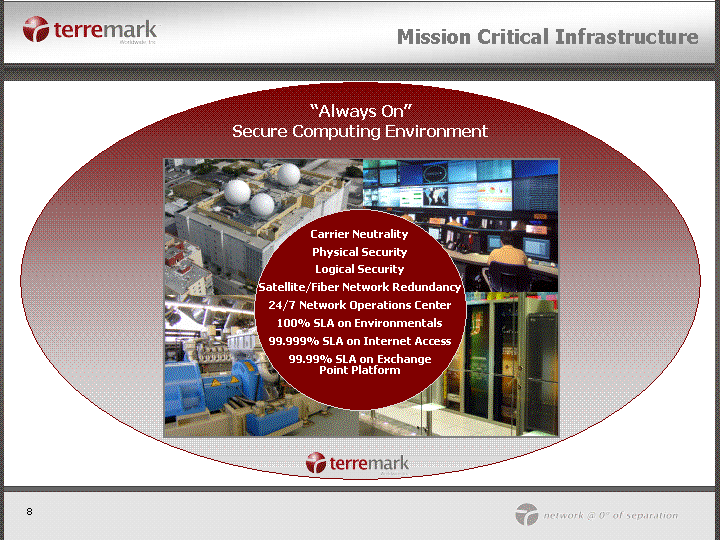
| Mission Critical Infrastructure Mission Critical Infrastructure Carrier Neutrality Physical Security Logical Security Satellite/Fiber Network Redundancy 24/7 Network Operations Center 100% SLA on Environmentals 99.999% SLA on Internet Access 99.99% SLA on Exchange Point Platform Point Platform Point Platform Point Platform Point Platform Point Platform Point Platform Point Platform Point Platform Point Platform "Always On" Secure Computing Environment |
Table of Contents

| The Network As The Enabler Massive aggregation of fiber and satellite networks Provides access to business critical infrastructure through any medium Mobile Phones PD As Personal Computers Corporate Data Centers Exchange Point Platform Data Center Infrastructure Managed Services Santa Clara Sao Paulo Madrid Amsterdam Brussels Herndon Business Applications Miami Enterprise Customers Exchange Point Platform Data Center Infrastructure Managed Services Network Transport Public Internet |
Table of Contents

| Marvin Wheeler Chief Operations Officer |
Table of Contents

| TWW Operations Key Driving Principles People Process Performance |
Table of Contents
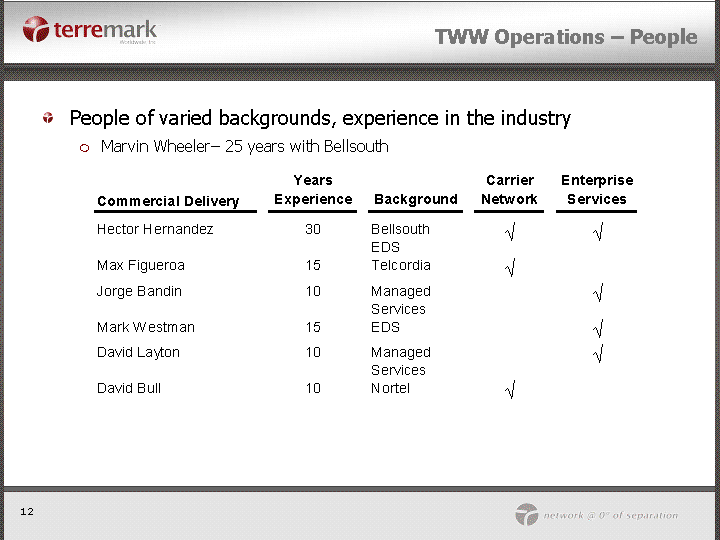
| TWW Operations - People People of varied backgrounds, experience in the industry Marvin Wheeler- 25 years with Bellsouth |
Table of Contents
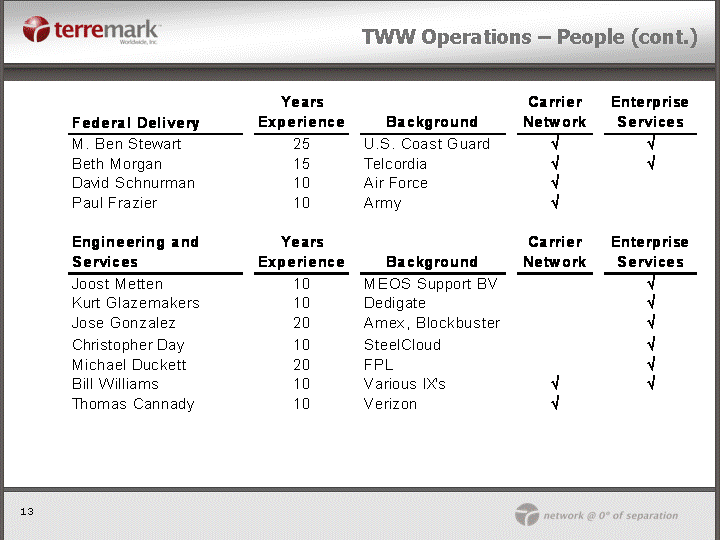
| TWW Operations - People (cont.) 13 |
Table of Contents
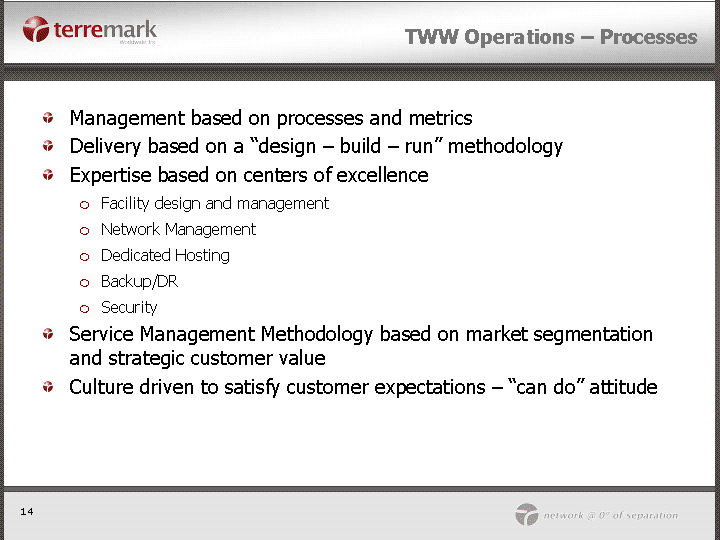
| TWW Operations - Processes Management based on processes and metrics Delivery based on a "design - build - run" methodology Expertise based on centers of excellence Facility design and management Network Management Dedicated Hosting Backup/DR Security Service Management Methodology based on market segmentation and strategic customer value Culture driven to satisfy customer expectations - "can do" attitude |
Table of Contents
| TWW Operations - Performance Driven by Technology Common platform across the facilities Strategic vendor relationships Leading edge technology Positioned to leverage current resource across all facilities Efficiency model - center of delivery in Miami with strong resources and processes to support remote facilities NOCs serve Federal and Commercial sectors as well as different markets Hosting Security Networks |
Table of Contents

| Miami Facility Building Strategic Location - Outside FEMA 500 Year Flood Zone Category 5 Design Criteria 750,000 Square Feet Total 17 Foot slab-to-slab height 6.25 ton freight elevator capacity Mechanical Systems Redundant Chilled Water Supplies (TECO, Own) 12 Fuel tanks - 180,000 gal total Global Networked Management System - HVAC, Power monitoring, security Electrical Systems Redundant power vaults - separate substation feeds 12 MW of Continuous Power Generators Multiple DC (-48V) power plants |
Table of Contents
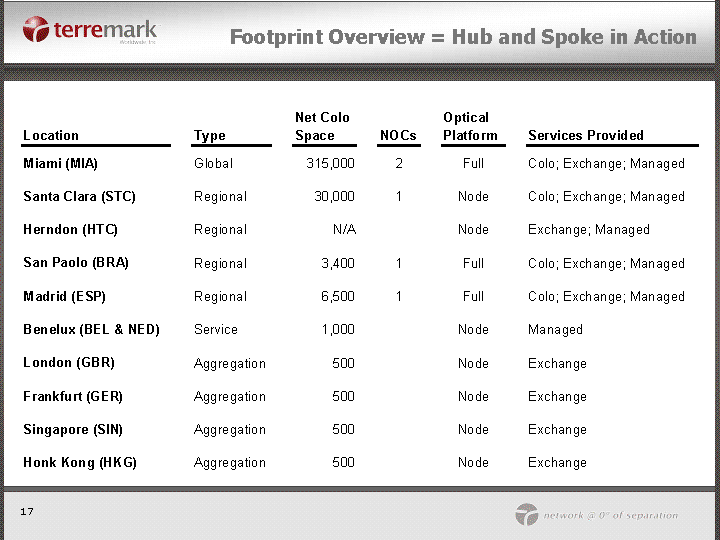
| Footprint Overview = Hub and Spoke in Action |
Table of Contents

| "Questions & Answers" |
Table of Contents
| BREAK FOR TOUR AND LUNCH WE WILL BE BACK AT 12:30PM (ET) |
Table of Contents
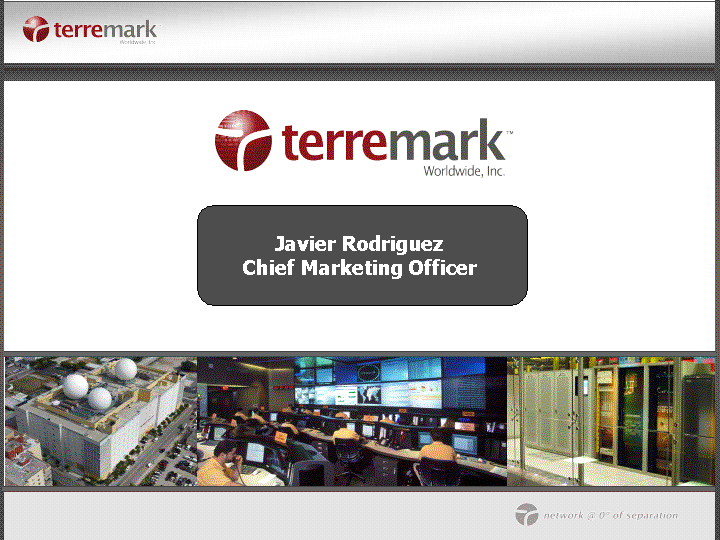
| Javier Rodriguez Chief Marketing Officer |
Table of Contents
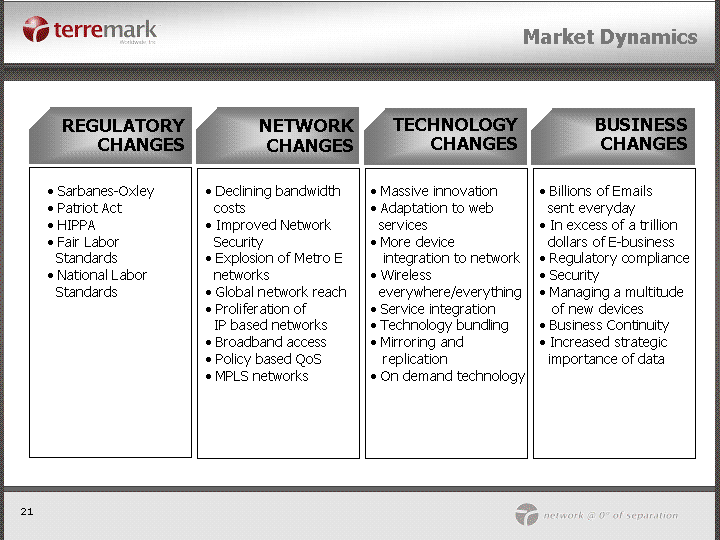
| Market Dynamics REGULATORY CHANGES NETWORK CHANGES TECHNOLOGY CHANGES BUSINESS CHANGES Sarbanes-Oxley Patriot Act HIPPA Fair Labor Standards National Labor Standards Declining bandwidth costs Improved Network Security Explosion of Metro E networks Global network reach Proliferation of IP based networks Broadband access Policy based QoS MPLS networks Massive innovation Adaptation to web services More device integration to network Wireless everywhere/everything Service integration Technology bundling Mirroring and replication On demand technology Billions of Emails sent everyday In excess of a trillion dollars of E-business Regulatory compliance Security Managing a multitude of new devices Business Continuity Increased strategic importance of data |
Table of Contents
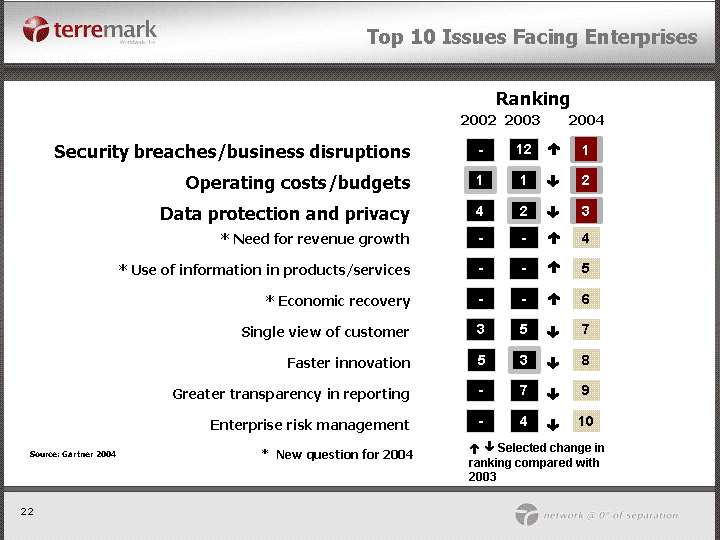
| Top 10 Issues Facing Enterprises ? ? Selected change in ranking compared with 2003 * New question for 2004 * Need for revenue growth * Use of information in products/services * Economic recovery Single view of customer Faster innovation Greater transparency in reporting Enterprise risk management - - - - - - 5 7 4 3 - - - - - - 3 - - - - 5 ? ? 4 5 6 7 9 10 8 Security breaches/business disruptions Operating costs/budgets Data protection and privacy Ranking 12 1 2 2003 2002 - - 1 4 ? ? ? 1 2 3 2004 Source: Gartner 2004 ? ? ? ? ? |
Table of Contents

| Enterprise Data Center Challenges Lower capital and operational costs Consolidate data centers, servers, applications and storage Scarcity of expert personnel Ease technology burden Increase application uptime Achieve highest level of availability Increase operational efficiency |
Table of Contents
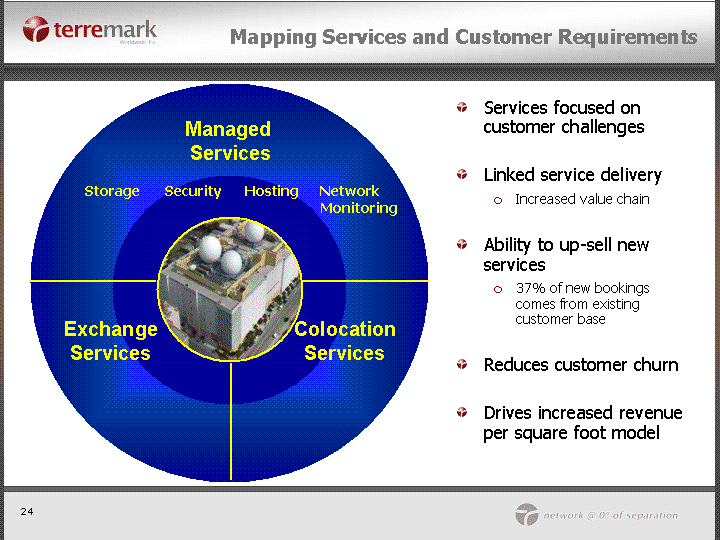
| Colocation Services Managed Services Exchange Services Mapping Services and Customer Requirements Services focused on customer challenges Linked service delivery Increased value chain Ability to up-sell new services 37% of new bookings comes from existing customer base Reduces customer churn Drives increased revenue per square foot model Storage Security Hosting Network Monitoring |
Table of Contents
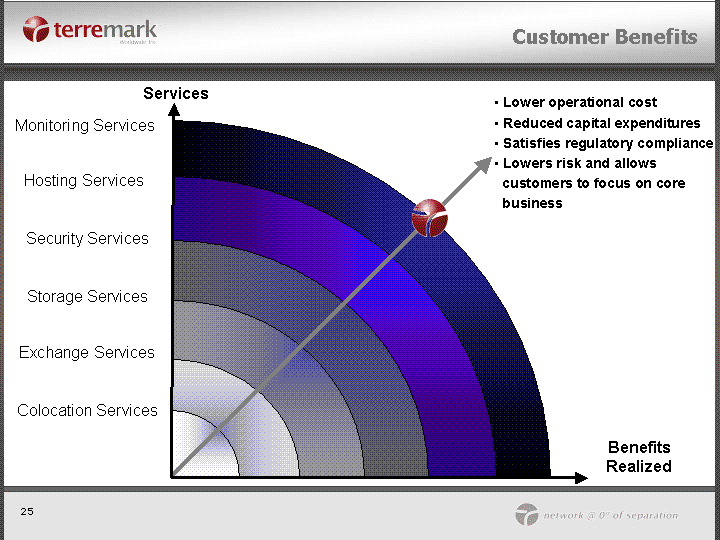
| Customer Benefits Hosting Services Security Services Storage Services Monitoring Services Exchange Services Colocation Services Benefits Realized Services Lower operational cost Reduced capital expenditures Satisfies regulatory compliance Lowers risk and allows customers to focus on core business |
Table of Contents
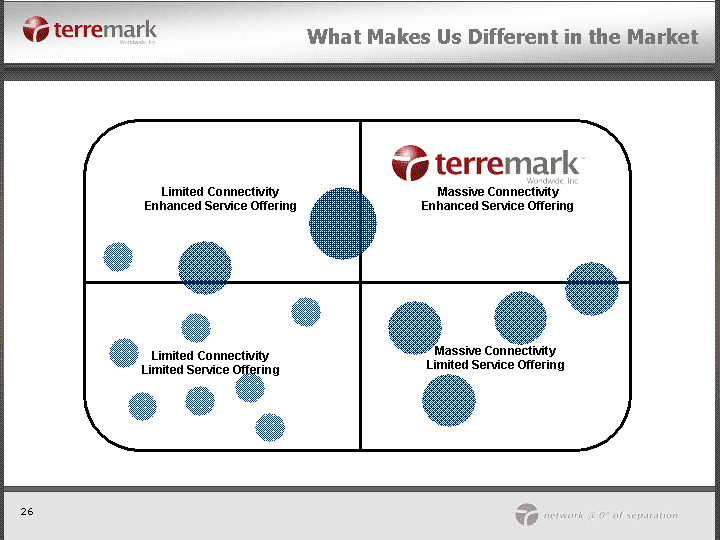
| What Makes Us Different in the Market Massive Connectivity Enhanced Service Offering Limited Connectivity Limited Service Offering Massive Connectivity Limited Service Offering Limited Connectivity Enhanced Service Offering |
Table of Contents
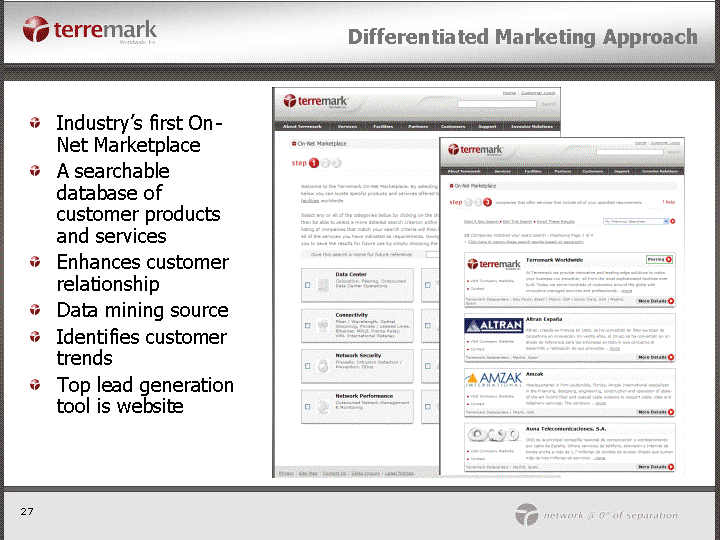
| Differentiated Marketing Approach Industry's first On- Net Marketplace A searchable database of customer products and services Enhances customer relationship Data mining source Identifies customer trends Top lead generation tool is website |
Table of Contents
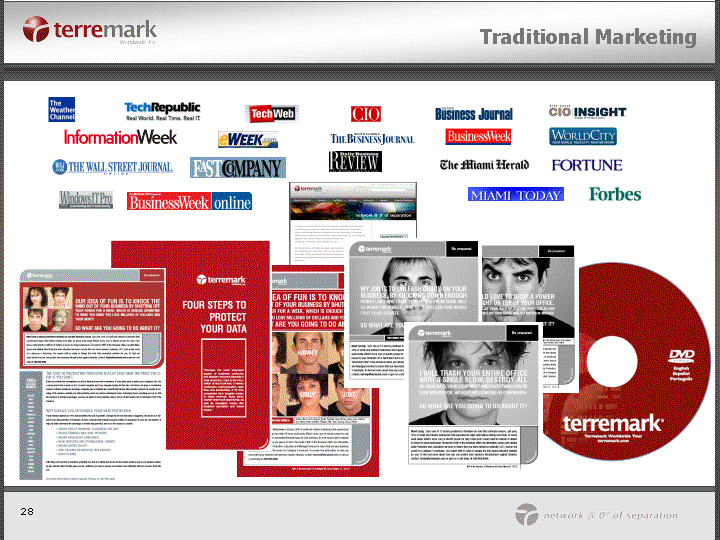
| Traditional Marketing |
Table of Contents
| John Neville Sr. VP of Commercial Sales |
Table of Contents
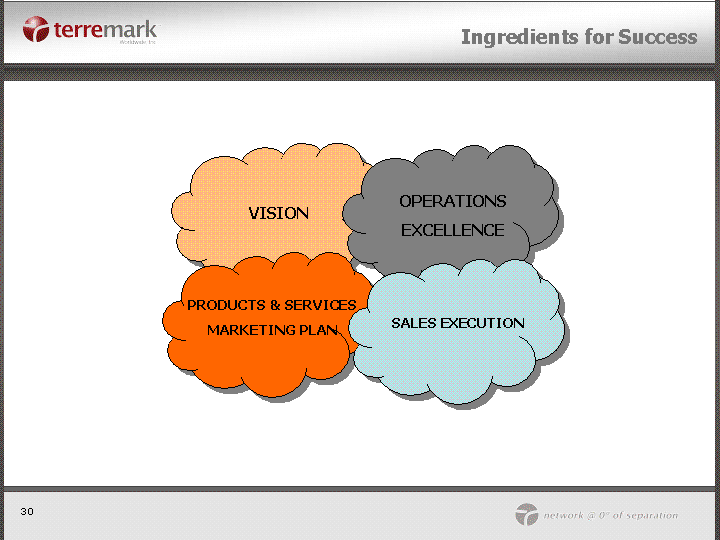
| Ingredients for Success VISION OPERATIONS EXCELLENCE PRODUCTS & SERVICES MARKETING PLAN SALES EXECUTION |
Table of Contents
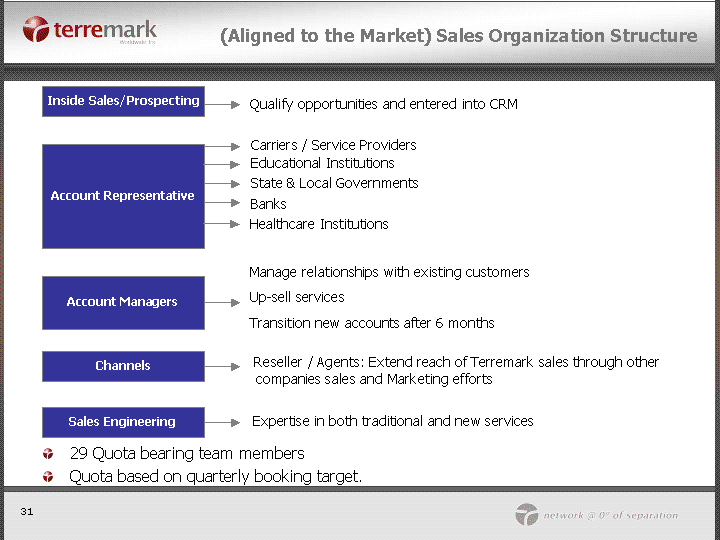
| (Aligned to the Market) Sales Organization Structure Inside Sales/Prospecting Qualify opportunities and entered into CRM Account Representative Carriers / Service Providers Educational Institutions State & Local Governments Banks Healthcare Institutions Account Managers Manage relationships with existing customers Up-sell services Transition new accounts after 6 months Channels Reseller / Agents: Extend reach of Terremark sales through other companies sales and Marketing efforts Sales Engineering Expertise in both traditional and new services 29 Quota bearing team members Quota based on quarterly booking target. |
Table of Contents
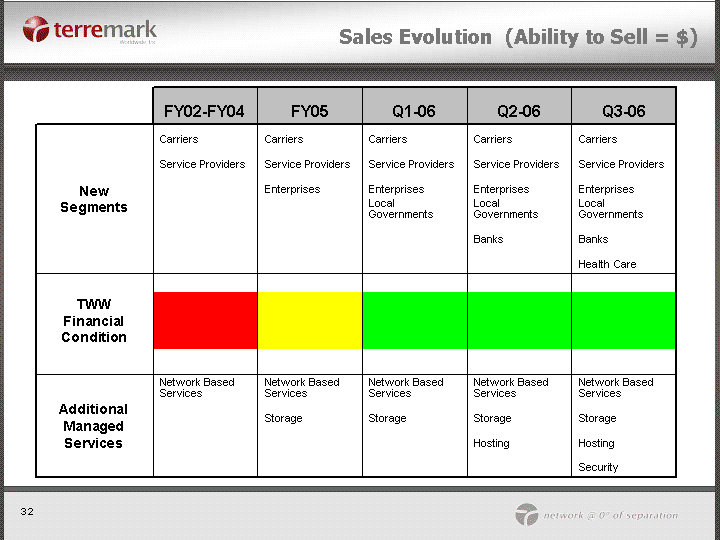
| Sales Evolution (Ability to Sell = $) FY02-FY04 FY05 Q1-06 Q2-06 Q3-06 New Segments Carriers Carriers Carriers Carriers Carriers New Segments Service Providers Service Providers Service Providers Service Providers Service Providers New Segments Enterprises Enterprises Enterprises Enterprises New Segments Local Governments Local Governments Local Governments New Segments Banks Banks New Segments Health Care TWW Financial Condition Additional Managed Services Network Based Services Network Based Services Network Based Services Network Based Services Network Based Services Additional Managed Services Storage Storage Storage Storage Additional Managed Services Hosting Hosting Additional Managed Services Security |
Table of Contents
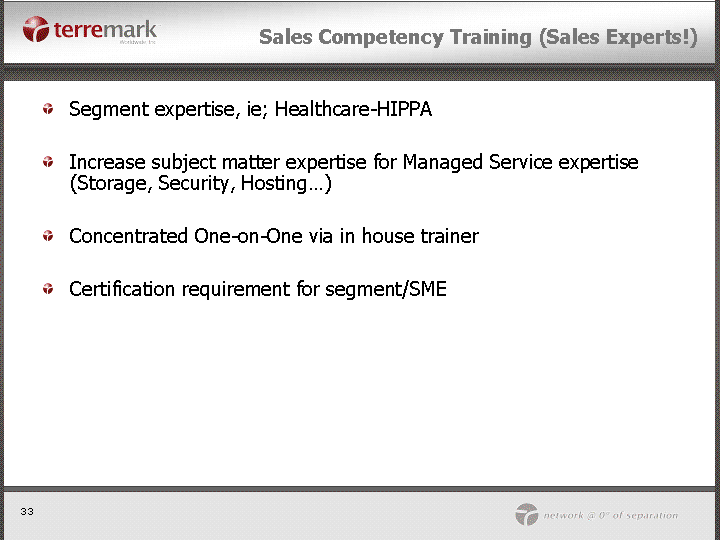
| Sales Competency Training (Sales Experts!) Segment expertise, ie; Healthcare-HIPPA Increase subject matter expertise for Managed Service expertise (Storage, Security, Hosting...) Concentrated One-on-One via in house trainer Certification requirement for segment/SME |
Table of Contents
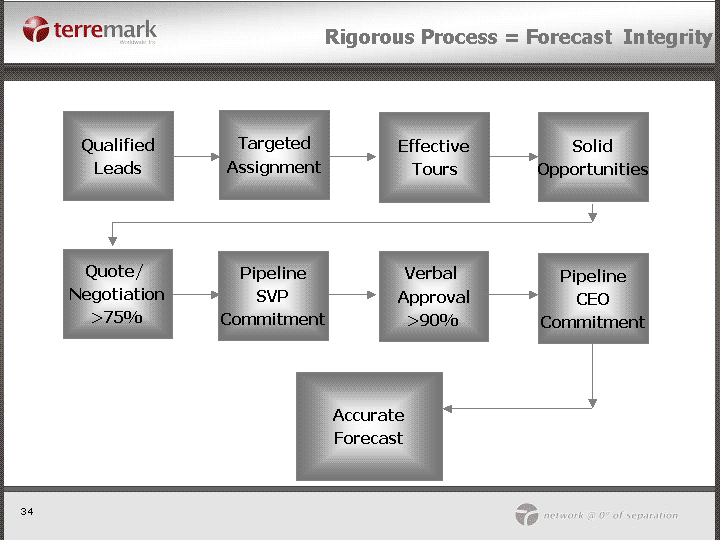
| Rigorous Process = Forecast Integrity Qualified Leads Targeted Assignment Solid Opportunities Quote/ Negotiation >75% Effective Tours Pipeline SVP Commitment Pipeline CEO Commitment Accurate Forecast Verbal Approval >90% |
Table of Contents
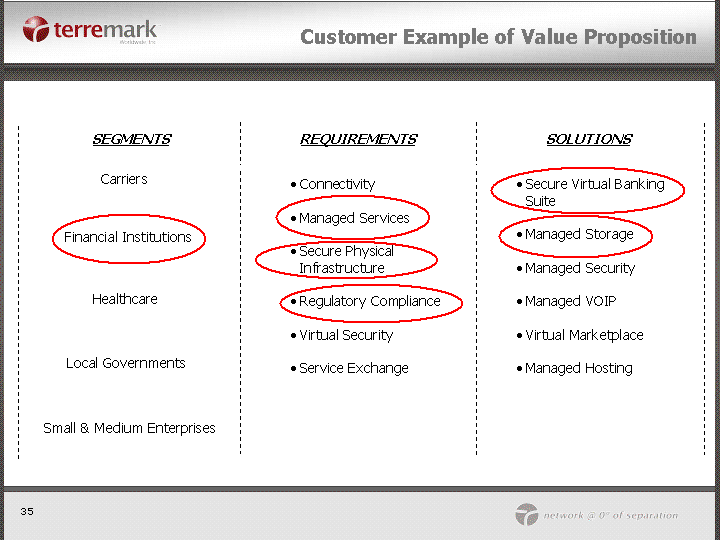
| Customer Example of Value Proposition SEGMENTS REQUIREMENTS SOLUTIONS Carriers Connectivity Managed Services Secure Physical Infrastructure Regulatory Compliance Virtual Security Service Exchange Secure Virtual Banking Suite Managed Storage Managed Security Managed VOIP Virtual Marketplace Managed Hosting External Internal Financial Institutions Healthcare Local Governments Small & Medium Enterprises |
Table of Contents
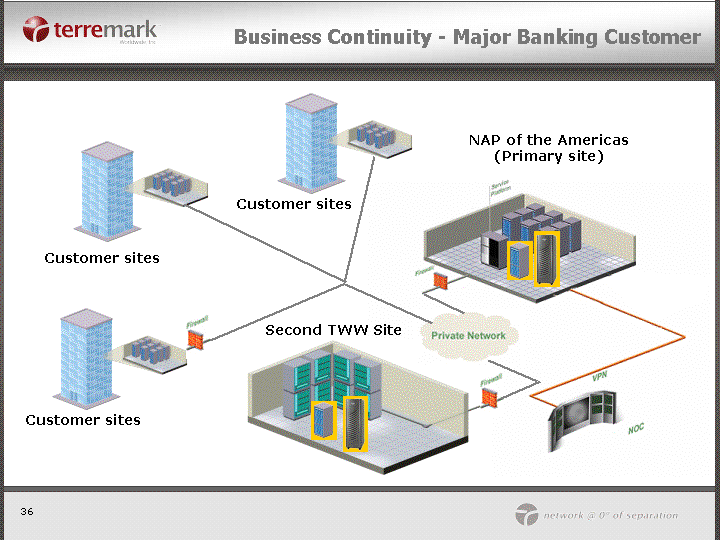
| NAP of the Americas (Primary site) Second TWW Site Customer sites Business Continuity - Major Banking Customer Customer sites Customer sites |
Table of Contents
| Jamie Dos Santos CEO - TFG |
Table of Contents
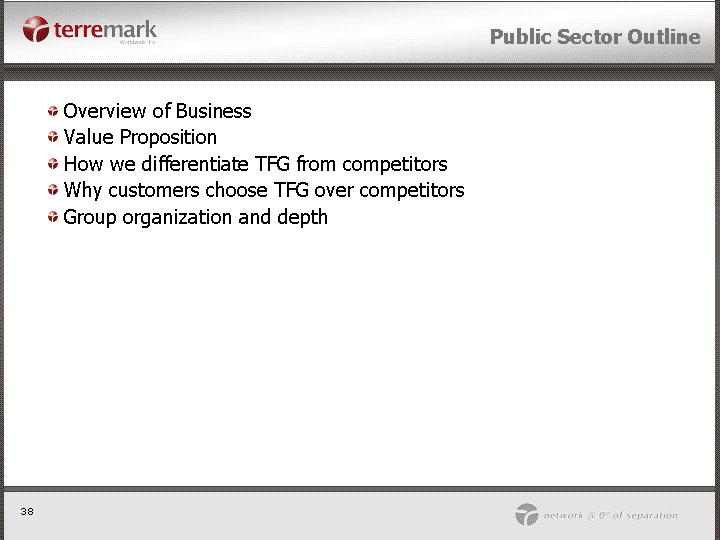
| Public Sector Outline Overview of Business Value Proposition How we differentiate TFG from competitors Why customers choose TFG over competitors Group organization and depth |
Table of Contents
Table of Contents
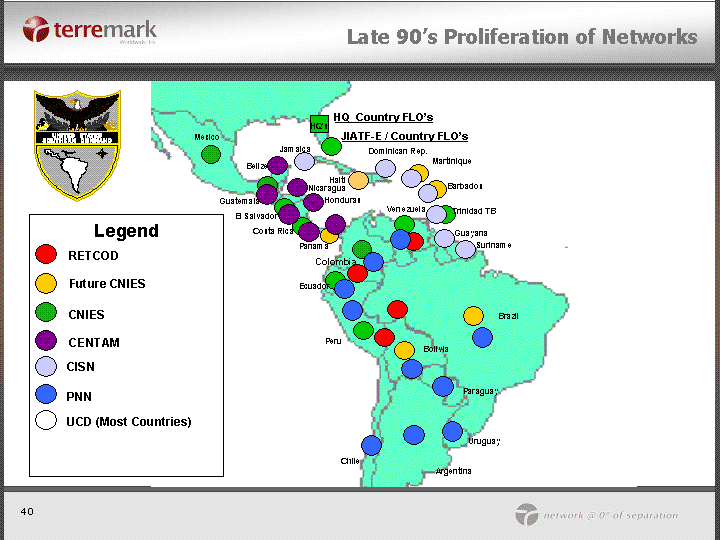
| JIATF-E / Country FLO's Colombia Panama Chile Argentina Uruguay Paraguay Bolivia Brazil Suriname Barbados Costa Rica Dominican Rep. Peru Ecuador Jamaica Haiti Mexico Belize Guatemala El Salvador Honduras Trinidad TB Nicaragua Guayana Venezuela Martinique HQ's HQ Country FLO's Future CNIES CNIES RETCOD Legend CENTAM CISN PNN UCD (Most Countries) Late 90's Proliferation of Networks |
Table of Contents
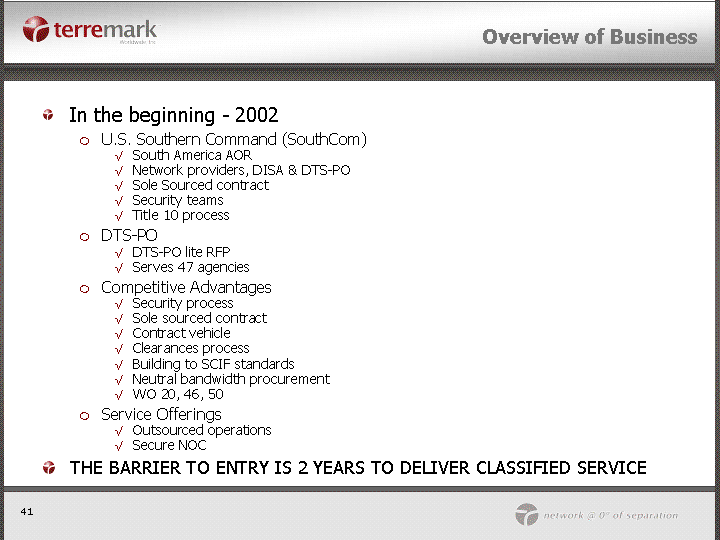
| Overview of Business In the beginning - 2002 U.S. Southern Command (SouthCom) South America AOR Network providers, DISA & DTS-PO Sole Sourced contract Security teams Title 10 process DTS-PO DTS-PO lite RFP Serves 47 agencies Competitive Advantages Security process Sole sourced contract Contract vehicle Clearances process Building to SCIF standards Neutral bandwidth procurement WO 20, 46, 50 Service Offerings Outsourced operations Secure NOC THE BARRIER TO ENTRY IS 2 YEARS TO DELIVER CLASSIFIED SERVICE |
Table of Contents
| Overview of Business Today - 2006 Continue to up-sell existing customers Neutral Services Provided Federal marketplace Engineering modifications Aggregation hubs Customer forum, 47 agencies Sales force New customer channels - Federal IT providers Blackbird Mitre SRA International CACI CSC Titan |
Table of Contents

| TFG Market Differentiator Value Add Over 50 cleared personnel TS and higher from DoD and State Department Executive staff with clearances Sitting on over 100 carriers Carriers expanding due to work received from federal customers Zero mile connectivity to all AOR's and embassies SCIF'd capable environment with security standards met DCID 6/9 construction standards International footprint Miami, Herndon, Santa Clara, Sao Paulo, Madrid, HK, Singapore, London, Frankfurt, Amsterdam Local International IP End to end managed services Private networks "neutral" Secure NOC |
Table of Contents
| TFG Market Differentiator (cont.) Why TFG Live Commercial market Commercial market expertise Lessons learned from the private sector Service Level Agreements 100% Power 100% Environmental MRS Network reachability Provision timing Visibility of the operations Redundancy Cost Past performance Continuous improvement process |
Table of Contents

| TFG vs. Competitors Why TFG Contract vehicle Modifications only Multi-year Aggregate savings for all agencies Traceability Savings in network and operations cost Metrics proving network performance Reliability Accountability Contract against customized SLA's Executive commitment Avoid RFP process 18-24 months |
Table of Contents

| Organization today and tomorrow Organizational capabilities Security officer, SO Security review 100% Alternate SO Federal operations help desk Secure Network Operations Center 7x24 Satellite Control Center Service management group Project management team Engineering staff Contracts officer Account management Sales team DTS-PO, State Department, Southcom, Mitre Herndon Miami Total Federal staff 60 |
Table of Contents
| "Questions & Answers" |
Table of Contents
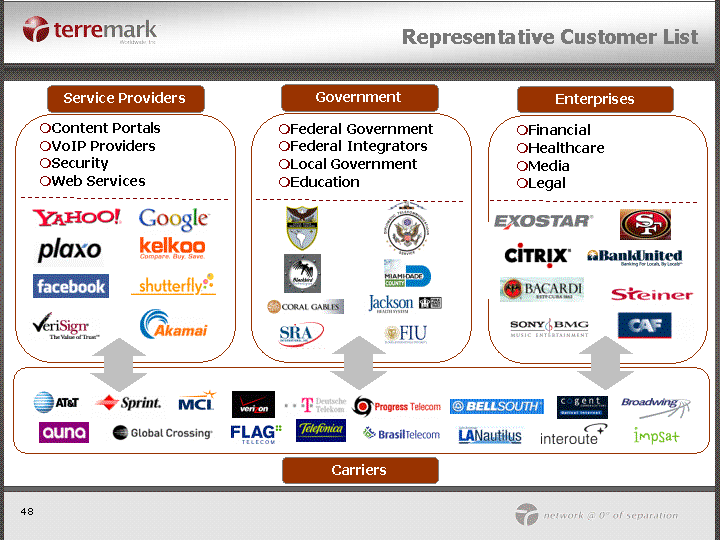
| Representative Customer List Service Providers Government Enterprises Carriers Content Portals VoIP Providers Security Web Services Federal Government Federal Integrators Local Government Education Financial Healthcare Media Legal Legal Legal Legal Legal |
Table of Contents

| Jose Gomez Exec. Dir. Of Info. Systems Hollywood Media |
Table of Contents
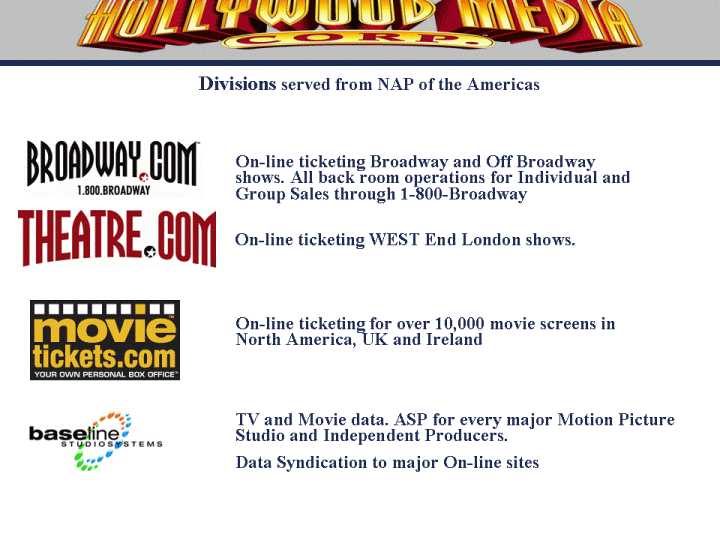
| On-line ticketing for over 10,000 movie screens in North America, UK and Ireland On-line ticketing WEST End London shows. Divisions served from NAP of the Americas On-line ticketing Broadway and Off Broadway shows. All back room operations for Individual and Group Sales through 1-800-Broadway TV and Movie data. ASP for every major Motion Picture Studio and Independent Producers. Data Syndication to major On-line sites |
Table of Contents
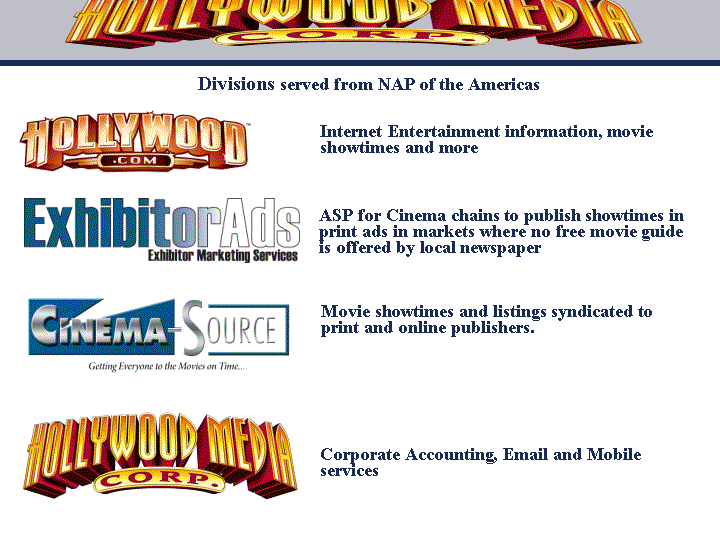
| Corporate Accounting, Email and Mobile services Movie showtimes and listings syndicated to print and online publishers. Internet Entertainment information, movie showtimes and more ASP for Cinema chains to publish showtimes in print ads in markets where no free movie guide is offered by local newspaper Divisions served from NAP of the Americas |
Table of Contents
| "Questions & Answers" |
Table of Contents
| Jose Segrera Chief Financial Officer |
Table of Contents
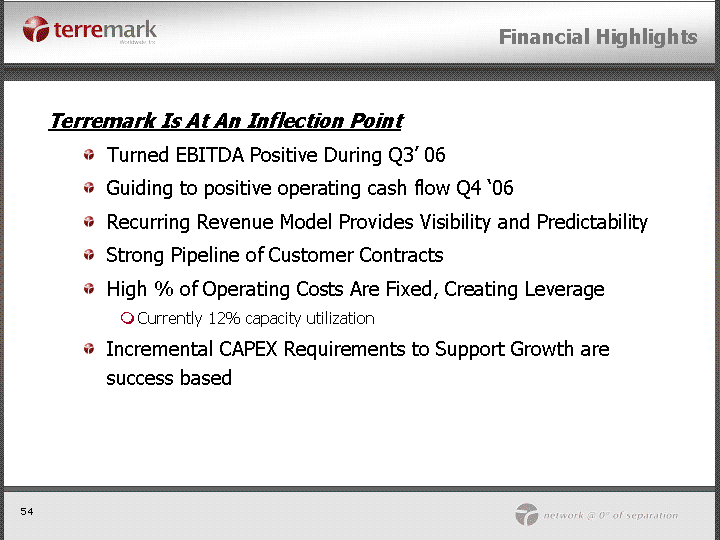
| Financial Highlights Terremark Is At An Inflection Point Turned EBITDA Positive During Q3' 06 Guiding to positive operating cash flow Q4 '06 Recurring Revenue Model Provides Visibility and Predictability Strong Pipeline of Customer Contracts High % of Operating Costs Are Fixed, Creating Leverage Currently 12% capacity utilization Incremental CAPEX Requirements to Support Growth are success based |
Table of Contents
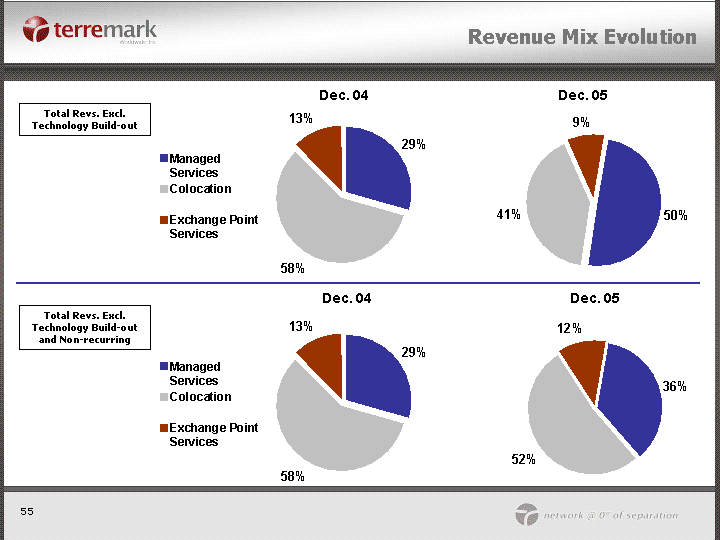
| Revenue Mix Evolution Dec. 04 Dec. 04 Dec. 05 Dec. 05 Total Revs. Excl. Technology Build-out Total Revs. Excl. Technology Build-out and Non-recurring |
Table of Contents
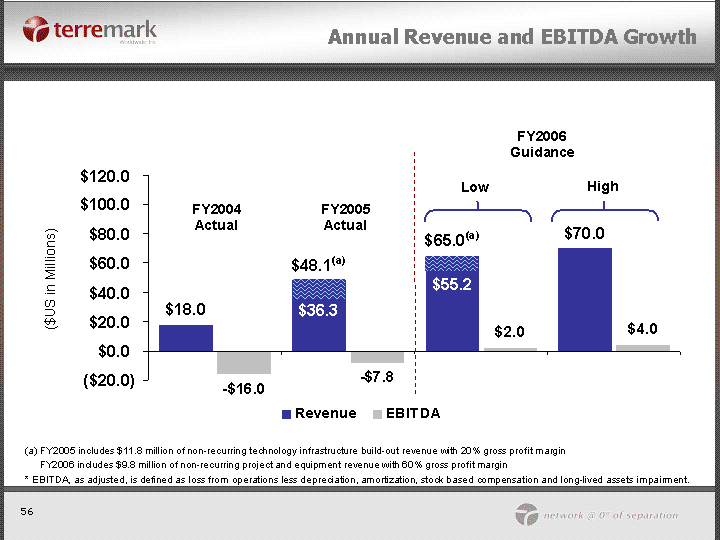
| Annual Revenue and EBITDA Growth FY2004 Actual ($US in Millions) (a) FY2005 includes $11.8 million of non-recurring technology infrastructure build-out revenue with 20% gross profit margin FY2006 includes $9.8 million of non-recurring project and equipment revenue with 60% gross profit margin * EBITDA, as adjusted, is defined as loss from operations less depreciation, amortization, stock based compensation and long-lived assets impairment. FY2005 Actual FY2006 Guidance Low High $36.3 $55.2 |
Table of Contents
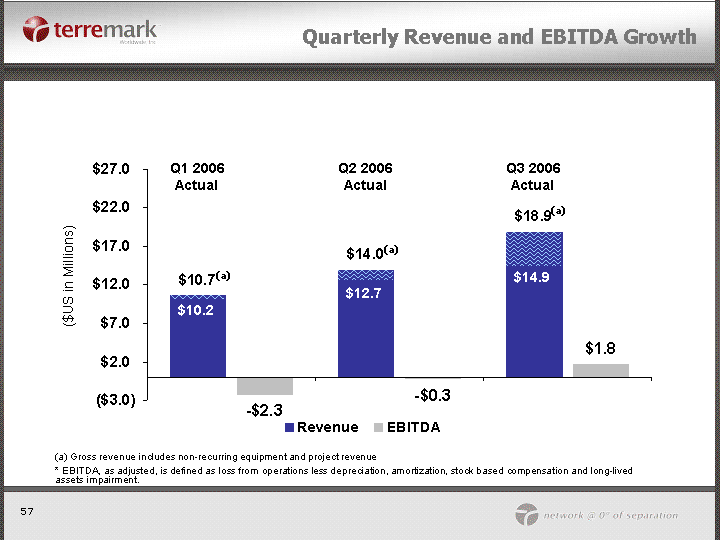
| Quarterly Revenue and EBITDA Growth Q2 2006 Actual (a) Gross revenue includes non-recurring equipment and project revenue * EBITDA, as adjusted, is defined as loss from operations less depreciation, amortization, stock based compensation and long-lived assets impairment. Q3 2006 Actual ($US in Millions) Q1 2006 Actual $14.9 $12.7 $10.2 (a) (a) (a) |
Table of Contents
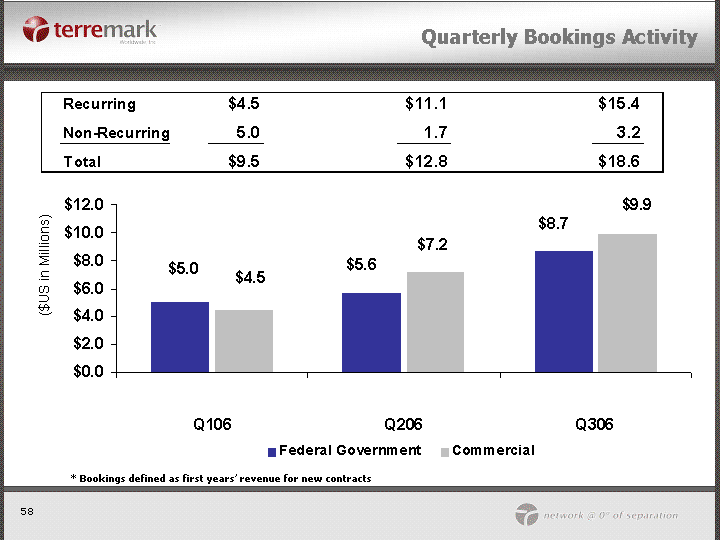
| Quarterly Bookings Activity ($US in Millions) * Bookings defined as first years' revenue for new contracts |
Table of Contents
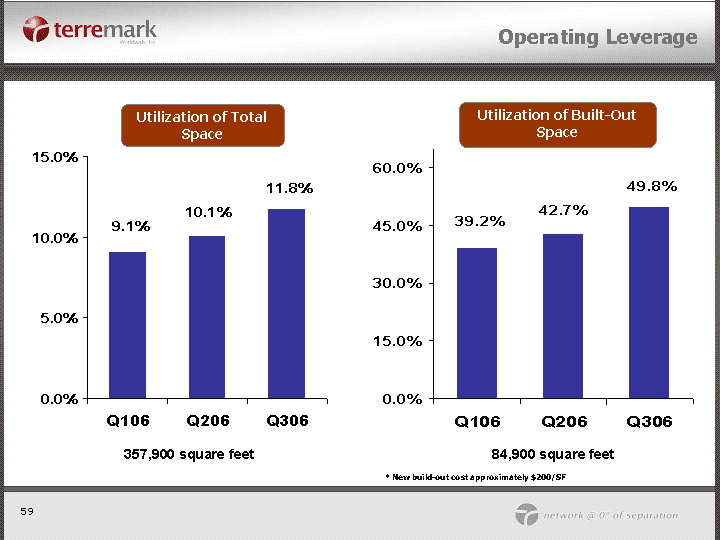
| Operating Leverage Utilization of Total Space Utilization of Built-Out Space 357,900 square feet 84,900 square feet Q106 Q206 Q306 Cross Connects 0.392 0.427 0.498 Q106 Q206 Q306 Total Customers 0.091 0.101 0.118 * New build-out cost approximately $200/SF |
Table of Contents

| Customers & Cross Connects Total Customers Cross Connects Q106 Q206 Q306 Cross Connects 2836 3182 3724 Q106 Q206 Q306 Total Customers 280 396 444 |
Table of Contents
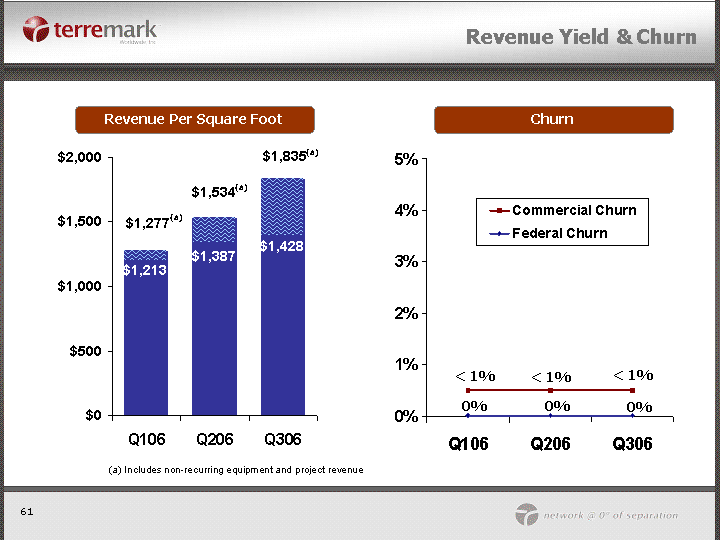
| Q106 Q206 Q306 Total Customers 1277 1534 1835 Revenue Yield & Churn Q106 Q206 Q306 Commercial Churn 0.005 0.005 0.005 Federal Churn 0.0001 0.0001 0.0001 Revenue Per Square Foot Churn < 1% < 1% < 1% 0% 0% 0% $1,387 $1,213 $1,428 (a) (a) (a) (a) Includes non-recurring equipment and project revenue |
Table of Contents
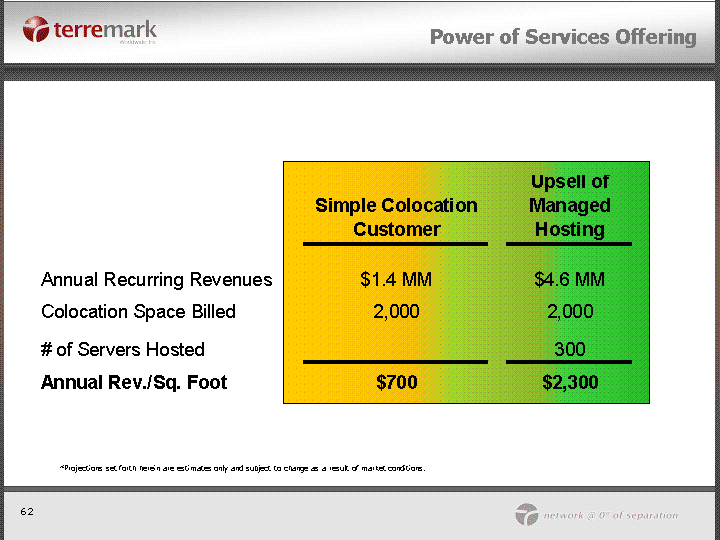
| Power of Services Offering *Projections set forth herein are estimates only and subject to change as a result of market conditions. |
Table of Contents
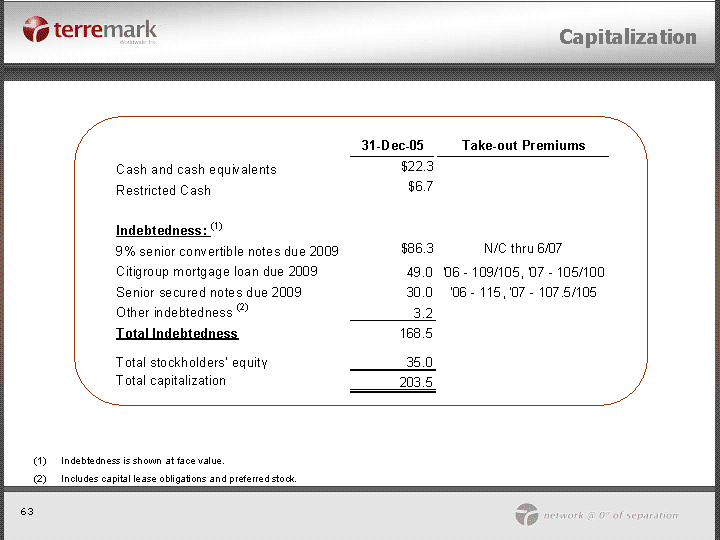
| Capitalization Indebtedness is shown at face value. Includes capital lease obligations and preferred stock. |
Table of Contents

| Fully Diluted Analysis |
Table of Contents
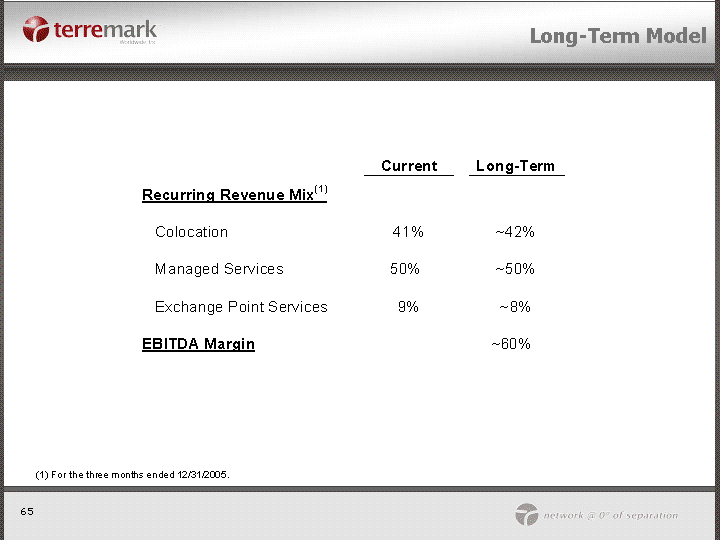
| Long-Term Model (1) For the three months ended 12/31/2005. |
Table of Contents

| "Questions & Answers" |
Table of Contents

| Wrap-Up |
Table of Contents
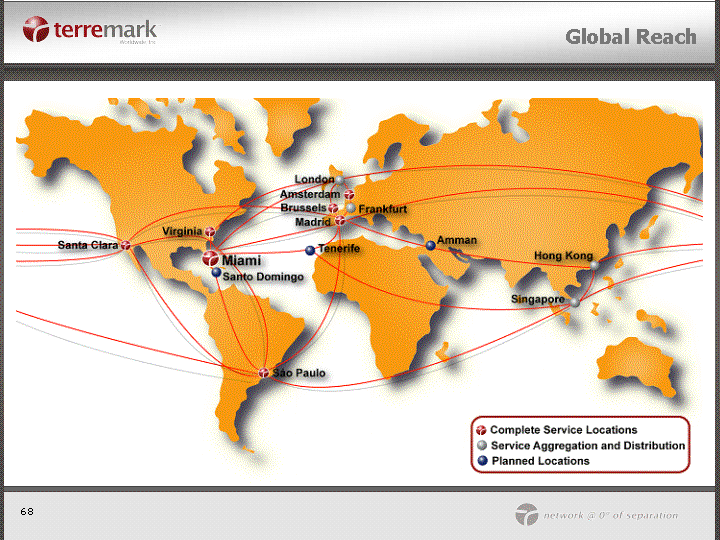
| Global Reach |
Table of Contents
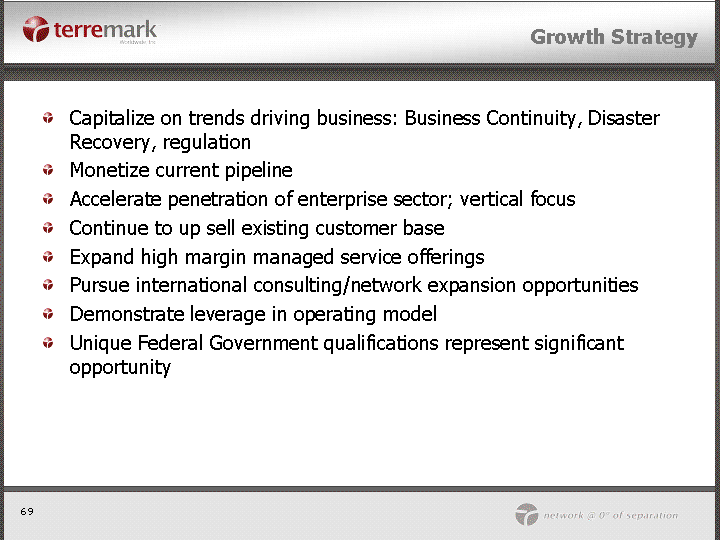
| Growth Strategy Capitalize on trends driving business: Business Continuity, Disaster Recovery, regulation Monetize current pipeline Accelerate penetration of enterprise sector; vertical focus Continue to up sell existing customer base Expand high margin managed service offerings Pursue international consulting/network expansion opportunities Demonstrate leverage in operating model Unique Federal Government qualifications represent significant opportunity |
Table of Contents
| "Questions & Answers" |
Table of Contents
| Thank You |