INVESTOR PRESENTATION CITI Property Tour – April 2014

Safe Harbor: Some of the information contained in this presentation includes forward looking statements. Such statements are subject to a number of risks and uncertainties which could cause actual results in the future to differ materially and adversely from those described in the forward-looking statements. Investors should consult the Company’s filings with the Securities and Exchange Commission for a description of the various risks and uncertainties which could cause such a difference before deciding whether to invest. Glimcher® and The Outlet Collection® are registered trademarks of Glimcher Realty Trust. 2

3 PRESENTATION AGENDA Overview of The Outlet Collection | Jersey Gardens Tourism Overview Company Strategic Overview Balance Sheet Strategy

4 THE OUTLET COLLECTION | JERSEY GARDENS

5 DESIGNER BRANDS/ DISCOUNT PRICES Opened October 1999 Fashion outlet center Brownfield 1.8 million square feet Over 200 stores Largest tourist destination in NJ Great location

6 SUCCESS OF CENTER - LOCATION Airport – 38 million visitors annually (20% international) NYC – 20 miles from center NYC Bus – 40,000 guests/ month NJ Turnpike – 65 million cars annually Port of Elizabeth – employs over 5,700 jobs IKEA – 165 million in sales

7 INDUSTRY RANKINGS The Outlet Collection | Jersey Gardens $788 PSF 1.8 Million SF Outlet Industry $400 PSF 400,000 SF Average Size

8

9 SHOPPER REVIEWS

10 TOURISM OVERVIEW Top Tourist Destination in the State of NJ Daily Transportation from NYC and Newark Airport Tour Bus Meet and Greet Tour Operator Sales Program Hotel Referrals Trade Show Participation

11 39.3% 22.5% 18.5% 7.95% 5.2% 1.89% 1.58% 1.28% .89% .83% Central & South America 39.3% Western Europe 22.5% Israel, Middle East, Eastern Europe, Africa, Russia 18.5% UK, Ireland 7.95% Asia 5.2% Canada 1.89% South & West USA 1.58% New England 1.28% Outer NJ .89% Mid Atlantic .83% 2013 vs. 2012 +25% Increase TOURISM OVERVIEW

12 0 5,000 10,000 15,000 20,000 25,000 JAN FEB MAR APR MAY JUNE JULY AUG SEPT OCT NOV DEC 2009 2010 2011 2012 2013 2009 vs. 2008 Growth Glimcher% 2010 vs. 2009 Growth +21% 2011 vs. 2010 Growth +25% 2012 vs. 2011 Growth +29% 2013 vs. 2012 Growth +25% INTERNATIONAL TRAVELER GROWTH 2009 through 2013

13 NEW YORK CITY TRAFFIC - 100,000 200,000 300,000 400,000 500,000 600,000 700,000 Annual Passengers 2009 2010 2011 2012 2013 NYC Bus up 25% YTD over 2012 Increased 87% over past Five Years

14 TOUR BUSES 0 400 800 1,200 1,600 2,000 2,400 Annual Buses 2009 2010 2011 2012 2013 • 2013 Tour Groups +7% vs. 2012 • Buses have increased 80% over the past five years

15 GLIMCHER STRATEGIC OVERVIEW Scottsdale Quarter

Sales Sales Growth NOI Growth Releasing Spreads Moderately Performing REITs $346 0.1% 1.8% 8% High Performing REITs $607 4.2% 4.7% 15% Total REIT Peer Group $495 2.4% 3.5% 12% GLIMCHER $468 7.6% 4.5% 15% 16 PEER COMPARISON As of December 31, 2013

17 Divestitures Acquisitions Redevelopment Divestitures are key to enhancing the quality of our portfolio. REMIXING THE PORTFOLIO A Three-Tiered Approach

18 The Outlet Collection│Jersey Gardens • Commenced project early in 2012 with completed grand reopening on October 30, 2013 • Enhance the current tenant mix at the center by adding higher-end luxury retail • Major interior and exterior renovations The Outlet Collection│Seattle • Convert from hybrid of full price and outlet to focus primarily on outlet retail • Outlet center to serve the southern half of the Seattle market • Reopening and rebranding on October 17, 2013 REDEVELOPMENT – OUTLET PROPERTIES

19 OUTLET COLLECTION PROPERTIES – SALES HISTORY (Includes both Jersey Gardens and Seattle) $423 $477 $526 $561 $656 $300 $350 $400 $450 $500 $550 $600 $650 $700 2009 2010 2011 2012 2013 55% Increase Over Five Years

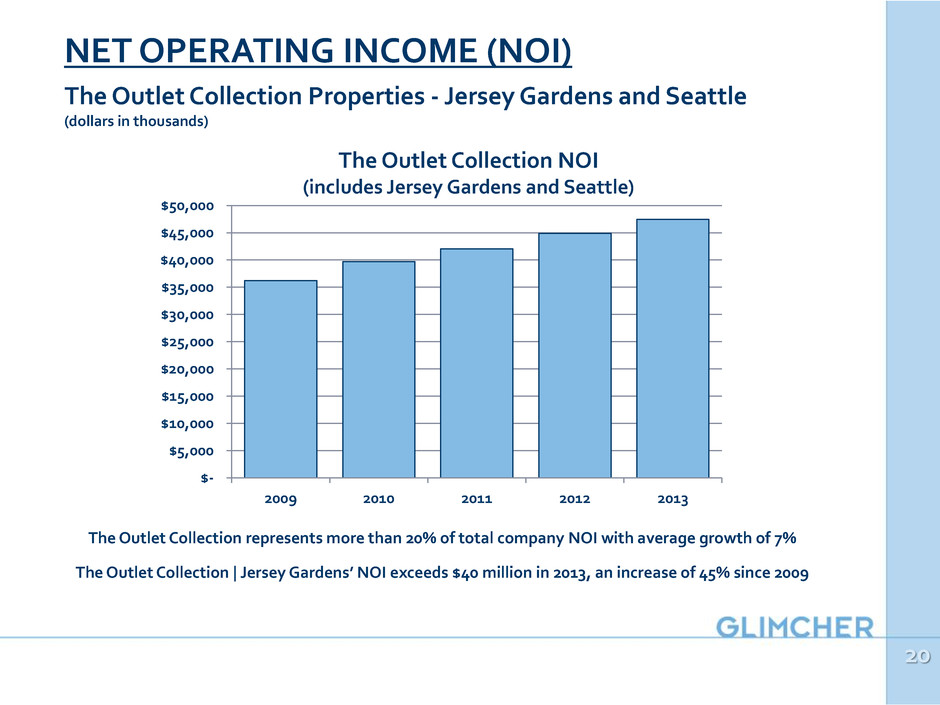
20 NET OPERATING INCOME (NOI) The Outlet Collection Properties - Jersey Gardens and Seattle (dollars in thousands) The Outlet Collection represents more than 20% of total company NOI with average growth of 7% The Outlet Collection | Jersey Gardens’ NOI exceeds $40 million in 2013, an increase of 45% since 2009 $- $5,000 $10,000 $15,000 $20,000 $25,000 $30,000 $35,000 $40,000 $45,000 $50,000 2009 2010 2011 2012 2013 The Outlet Collection NOI (includes Jersey Gardens and Seattle)

21 Redevelopment represents the best use of our capital on a risk- adjusted basis Proven ability to deliver a solid return on investment while repositioning assets for future growth within their markets REDEVELOPMENT PIPELINE

22 Percentage of Portfolio Hi g h Im p act R etaile rs 0% 10% 20% 30% 40% 2014 2009 ACQUISITIONS: EXPANDING KEY RETAIL RELATIONSHIPS “We want to be where the best retailers are.”

23 Strengthen relationships with premier tenants; typically first or only-in-the market Located in affluent neighborhoods with strong market demographics Highly productive, sales above our portfolio average with additional opportunities for growth ACQUISITIONS

24 2013 and 2014 divestitures include: Tulsa Promenade Lloyd Center – 40% Town Square at Surprise Non Core Assets - $20 million Eastland Mall - planned in Q314 DIVESTITURES NOI Growth Trend Recent Mall Divestitures* $10,400 $10,800 $11,200 $11,600 $12,000 $12,400 $12,800 NOI Two Years Prior One Year Prior Most Recent Year -4.1% +1.7% -5.6% *Includes Eastland Mall and Pro-rata shares of Tulsa Promenade and Lloyd Center

25 BALANCE SHEET OVERVIEW The Outlet Collection | Jersey Gardens

26 Fixed Charge Coverage Target Above 1.75x 12/31/13 – 1.82x(1) Debt to EBITDA Target Below 7.5x 12/31/13 – 8.25x (2) (3) Debt to Total Asset Value Target Below 45% 12/31/13 – 51.0% (1) (3) 3-year targets provided during Glimcher’s June 2012 Investor Day LONGER-TERM BALANCE SHEET TARGETS (1)As defined per the company’s credit facility covenants (2)Pro-forma presentation that reflects recent acquisitions and dispositions, including the upcoming Eastland transaction, as well as stabilization of recent redevelopments and Phases I/II of Scottsdale Quarter (3)Excludes outstanding preferred stock

27 Weighted average maturity on fixed rate debt has been extended from 3.9 years to 6.2 years as of December 31, 2013 Overall fixed rate borrowing cost has been reduced by 70 basis points to 4.7% as of December 31, 2013 Reduced borrowing rate on the company’s preferred shares by approximately 75 basis points When including Fairfield Commons, the Company will have eight unencumbered mall properties with a total value of approximately $500 million • Plan to repay The Mall at Fairfield Commons loan at maturity in November 2014 with funds available on credit facility Closed on the most recent modification of the Company’s credit facility in February 2014 • Commitment amount increased to $300 million • Provided additional term through February 2018, with a one-year extension option extending the maturity to February 2019 • Pricing improved to LIBOR + 175.0 bps from LIBOR + 195.5 bps BALANCE SHEET IMPROVEMENTS SINCE 2Q12

28 Lower “Debt to Total Asset Value” and drive improvement in “Debt to EBITDA” • Deliver on 3-4% core mall NOI growth in 2014 to drive EBITDA growth • Utilize free cash flow to lower debt levels (currently generating over $20 million annually) • Reduce overall debt levels, which could include preferred stock redemptions, by $300 million through property dispositions BALANCE SHEET FOCUS THROUGH 2015

29 Improving portfolio quality Solid balance sheet Stable and diversified portfolio Strong management Attractive relative valuation Will be inserting a new photo from JER here. TRANSFORMATION TO A CLASS A MALL REIT