United States
Securities And Exchange Commission
Washington, D.C. 20549
FORM N-CSR
CERTIFIED SHAREHOLDER REPORT OF REGISTERED MANAGEMENT
INVESTMENT COMPANIES
| Investment Company Act file number | 811-8056 |
MMA Praxis Mutual Funds
(Exact name of registrant as specified in charter)
P.O. Box 483, Goshen, IN 46527
| (Address of principal executive offices) | (Zip code) |
Anthony Zacharski, Dechert LLP, 200 Clarendon Street, 27th Floor, Boston, MA 02116
(Name and address of agent for service)
| Registrant's telephone number, including area code | (513) 878-4066 |
| Date of fiscal year end: | 12/31 | |
| Date of reporting period: | 12/31/09 |
Form N-CSR is to be used by management investment companies to file reports with the Commission not later than 10 days after the transmission to stockholders of any report that is required to be transmitted to stockholders under Rule 30e-1 under the Investment Company Act of 1940 (17 CFR 270.30e-1). The Commission may use the information provided on Form N-CSR in its regulatory, disclosure review, inspection and policymaking roles.
A registrant is required to disclose the information specified by Form N-CSR, and the Commission will make this information public. A registrant is not required to respond to the collection of information contained in Form N-CSR unless the Form displays a currently valid Office of Management and Budget ("OMB") control number. Please direct comments concerning the accuracy of the information collection burden estimate and any suggestions for reducing the burden to Secretary, Securities and Exchange Commission, 450 Fifth Street, NW, Washington, DC 20549-0609. The OMB has reviewed this collection of information under the clearance requirements of 44 U.S.C. § 3507.
Item 1. Reports to Stockholders.
Annual Report
| Table of contents |
Table of contents
| Message from the President | 1 | |
| MMA Praxis Stewardship Investing Report | 2 | |
| MMA Praxis Intermediate Income Fund | ||
| Portfolio managers’ letter | 5 | |
| Performance review | 7 | |
| Schedule of portfolio investments | 9 | |
| MMA Praxis Core Stock Fund | ||
| Portfolio managers’ letter | 19 | |
| Performance review | 20 | |
| Schedule of portfolio investments | 22 | |
| MMA Praxis Value Index Fund | ||
| Portfolio manager’s letter | 27 | |
| Performance review | 28 | |
| Schedule of portfolio investments | 30 | |
| MMA Praxis Growth Index Fund | ||
| Portfolio manager’s letter | 40 | |
| Performance review | 41 | |
| Schedule of portfolio investments | 43 | |
| MMA Praxis International Fund | ||
| Portfolio manager’s letter | 53 | |
| Performance review | 56 | |
| Schedule of portfolio investments | 58 | |
| MMA Praxis Small Cap Fund | ||
| Portfolio manager’s letter | 67 | |
| Performance review | 68 | |
| Schedule of portfolio investments | 70 | |
| Statements of assets and liabilities | 75 | |
| Statements of operations | 79 | |
| Statements of changes in net assets | 81 | |
| Financial highlights | 83 | |
| Notes to financial statements | 95 | |
| Report of Independent Registered Public Accounting Firm | 112 | |
| Additional fund information (unaudited) | 113 | |
| Management of the Trust (unaudited) | 123 | |
Glossary of Terms
Barclay’s Capital Aggregate Bond Index is an unmanaged index composed of the Barclay’s Capital Government/Credit Index and the Barclay’s Capital Mortgage-Backed Securities Index and includes Treasury issues, agency issues, corporate bond issues and mortgage-backed securities, and is intended to be generally representative of the bond market as a whole .
The Morgan Stanley Capital International-Europe, Australia and the Far East Index (MSCI EAFE Index) is a widely recognized unmanaged index composed of a sample of companies representative of the developed markets throughout the world, excluding the United States and Canada.
The Morgan Stanley Capital All Country World Free (ex. U.S.) Index is a widely recognized, unmanaged index composed of a sample of companies representative of the markets of both developed and emerging markets throughout the world, excluding the United States.
Standard & Poor’s 500 Composite Stock Price Index (the “S&P 500 Index”) is a widely recognized, unmanaged index of 500 selected common stocks, most of which are listed on the New York Stock Exchange.
Standard & Poor’s 500/Citigroup Value Index (the “S&P 500/Cititgroup Value Index”), is an unmanaged constructed by dividing the stocks in the S&P 500 Index into two categories, growth and value, according to price-to-book ratios. Prior to December 16, 2005, this index represented the S&P/Barra Value Index.
The FTSE KLD 400 Social Index is a float-adjusted market capitalization-weighted, common stock index of U.S. equities. It is a widely recognized benchmark for measuring the impact of social and environmental screening on portfolios.
MSCI US Prime Market Growth Index represents the growth companies of the MSCI US Prime Market 750 Index. The MSCI US Prime market 750 Index represents the universe of large and medium capitalization companies in the US equity market.
MSCI US Prime Market Value Index represents the value companies of the MSCI US Prime Market 750 Index. The MSCI Prime Market 750 Index represents the universe of large and medium capitalization companies in the U.S. equity market.
The Russell 2000 Index measures the performance of the small-cap segment of the U.S. Equity Universe. It measures the performance of the 2,000 smallest companies in the Russell 3000 Index, which represents approximately 10% of the total market capitalization of the Russell 3000 Index. The Russell 3000 Index measures the performance of the 3,000 largest U.S. companies based on total market capitalization, which represents approximately 98% of the investable U.S. equity market.
Gross Domestic Product (the “GDP”), is the measure of the market value of the goods and services produced by labor and property in the United States.
Consumer Price Index (the “CPI”), is an index of prices used to measure the change in the cost of basic goods and services in comparison with a fixed base period.
Price-to-Earnings Ratio (the “P/E Ratio”), is a valuation ratio of a company's current share price compared to its per-share earnings.
SuperComposite 1500 Index. Large-cap core funds have more latitude in the companies in which they invest. These funds typically have an average price-to-earnings ratio, price to-book ratio, and three-year sales-per share growth value, compared to the S&P 500 Index.
The above indices are unmanaged and do not reflect the deduction of expenses associated with a mutual fund, such as investment management and fund accounting fees. An investor cannot invest directly in an index, although they can invest in the underlying securities.
| Message from the President |
Message from the President
One year ago, we were looking back on a 12-month period that was extremely difficult for investors. Today, while there is still a sense of uncertainty about the future, the economic climate in the United States and internationally seems to be improving.
The domestic equity markets performed well in 2009, predicting the current economic recovery. Earlier readings of leading economic indicators were confirmed by a 5.9 percent growth rate during the fourth quarter, but unemployment remains high. In spite of the negatives, we are pleased with progress that is being made.
Domestic equities, as measured by the Standard & Poor’s 500 Index, rose by 26.47 percent for the one-year period ending Dec. 31, 2009. The MMA Praxis Core Stock Class A Share (NAV) outperformed its benchmark and rose 29 percent. Over the same period the Class A Share (NAV) of the MMA Praxis Value Index Fund rose by 22.64 percent and the MMA Praxis Growth Index Fund rose by 34.38 percent. The Class A Share (NAV) of the MMA Praxis Small Cap Fund rose by 29.73 percent.
The international equity benchmark MSCI EAFE Index was up by 32.46 percent for the one-year period ending Dec. 31, 2009. The MMA Praxis International Class A Share (NAV) underperformed its benchmark over the one year period and was up a disappointing 14.75 percent. The majority of the Fund's shortfall relative to its benchmark occurred during the first few weeks of the global equity rally that began in early March. At that time, the fund owned financially sound companies in an effort to preserve capital, during what was expected to be an extended difficult period. Instead, sentiment shifted quickly to a positive trend and investors favored the riskiest stocks over more stable companies during March and April. The sub-advisor for this Fund, Evergreen Investments, provides additional commentary in the section devoted to reports from the portfolio managers.
We are pleased to report that the MMA Praxis Intermediate Income Fund continued to outperform its benchmark, the Barclays Capital Aggregate Bond Index. The Class A Share (NAV) posted a gain of 10.49 percent for the year, against a benchmark return of 5.93 percent. The 3-year annualized returns were 6.45 percent and 5-year annualized returns were 4.94 percent. We are grateful for the stewardship of this fund led by investment co-managers, Delmar King and Benjamin Bailey of MMA Capital Management.
In the following pages you will find portfolio managers’ letters and performance review for each of the Funds. Please read them for further expansion and explanation of the events of 2009.
Thank you for being an investor with MMA Praxis Mutual Funds. As a faith-based mutual fund family, we remain committed to being stewards of the resources you entrust to us, and we are grateful for your confidence.
Sincerely,

David C. Gautsche
President
MMA Praxis Mutual Funds
1
| MMA Praxis Stewardship Investing Report |
MMA Praxis Stewardship Investing Report
New shareholder advocacy themes bring opportunities and challenges
MMA Praxis added two new themes to help focus its shareholder advocacy efforts for the years ahead. These themes – while not excluding other important, emerging issues – help staff focus energy and build relationships to bring impact to our shareholder advocacy efforts.
Modern slavery
In response to growing concerns about human trafficking and its presence in business supply chains, MMA Praxis will focus on several aspects of this issue in partnership with other faith-based institutional investors.
The following issue areas will provide MMA Praxis with opportunities for corporate engagement on this topic in the coming year:
• Extractive industries in the Democratic Republic of Congo (DRC)
• Cotton in Uzbekistan
• Cocoa production in west Africa
• Pig-iron production in South America
• International sex trafficking
• Forced labor in auto supply chain
• Awareness of human trafficking (modern slavery) among health care providers
Food/Water safety and security
Concerns related to food touch all our lives deeply and personally. Food shapes people’s sense of dignity; its scarcity can breed conflict and violence; its distribution raises issues of justice; it can threaten communities and individuals; and, it impacts environmental sustainability – all these concerns are part of MMA Praxis’ stewardship investing core values.
Water is fast becoming the planet’s most precious, limited resource. Unsustainable practices are not only a threat to safety of consumers and the environment, but a threat to the company’s image and long-term profitability.
MMA Praxis has been working with some food companies for more than a year and seeks to address concerns while encouraging them on a more sustainable path. Areas we plan to address include:
• Reduction of waste, energy, and water use throughout supply chains.
• Instituting conservation and pollution prevention measures for the full product life-cycle.
• Labeling products for country of origin.
• Safety testing and systems to ensure identity preservation and traceability “from farm to fork.”
• Pesticide use reduction by potato farmers.
• Reductions in antibiotic use in large-scale farming operations.
Shareholders pursue DRC conflict minerals
MMA Praxis has joined with other investors in signing a shareholder letter stating opposition toward the ongoing conflict in the Democratic Republic of the Congo over “conflict minerals.”
Armed groups control a significant number of the mines in the eastern Congo, and the minerals reaped from these mines are a major source of income for them. These conflict minerals end up in refined electronics goods such as laptops, video game consoles, mobile phones, and equipment in medical devices and automobiles. This investor statement urges companies to take action to ensure their products are free of conflict minerals originating in the DRC.
2
To do their part to stop the continuing violence, investors recommend that companies take immediate and decisive action to:
| • | Make a public statement condemning the use of mineral revenue to fuel the ongoing conflict in the DRC and explain the steps the company is taking to address the issue; |
| • | Develop policies and procedures to identify where the raw metals in their products originate from and ensure conflict minerals are not entering into their supply chain; |
| • | Work with suppliers throughout their entire supply chain to ensure internal policies on sourcing conflict minerals are being adhered to; |
| • | Work with non-governmental organizations, industry associations, investors and other stakeholders to support various corporate social responsibility, legislative, and diplomatic strategies that will help end the exchange of minerals from the DRC that finance the ongoing conflict. |
Safer alternatives sought for natural gas development
As part of its creation care advocacy, MMA Praxis co-filed a shareholder resolution at EOG Resources calling for a report on the environmental impact of its hydraulic fracturing operations and potential policies for the company to adopt – above and beyond regulatory requirements – to reduce or eliminate hazards to air, water, and soil quality from fracturing.
EOG Resources is a major natural gas company and has significant gas reserves that require unconventional production techniques to recover, i.e., hydraulic fracturing, which injects a mix of water, chemicals and particles underground to create fractures through which gas can flow for collection. Fracturing operations potentially increase incidents of toxic spills from waste water ponds, impact to local water quantity and quality, and degradation of air quality.
MMA Praxis believes hydraulic drilling activities increase the potential for reputational damage and vulnerability to litigation, and weak and uneven regulatory controls necessitate that companies go above and beyond regulatory requirements to reduce environmental hazards and protect their own long-term interests.
MMA Praxis and the other filers believe the policies explored should include, among other things, the use of less toxic fracturing fluids, recycling or reuse of waste fluids, and other structural or procedural strategies to reduce fracturing hazards.
MMA Praxis Intermediate Income Fund invests in World Bank Green Bonds
As a reflection of environmental stewardship, MMA Praxis strives to care for God’s creation through investment activities. The MMA Praxis Intermediate Income Fund has shown this commitment by making a $2 million purchase in World Bank Green Bonds. Green Bonds were recently launched by the World Bank to connect capital markets to climate change-related initiatives. The World Bank is a global development cooperative owned by 186 member countries whose goal is to help overcome poverty and improve standards of living for people worldwide.
Green Bonds support World Bank projects that meet specific criteria for development activities that help lower global carbon emissions.
Community Development Investing—more important than ever
With the deepest recession since the Great Depression still impacting lives, the significance of community development financial institutions is clear—providing access to capital at fair terms and in the client’s best interest, to individuals/organizations that most mainstream financial services firms pass by.
3
Through MMA Community Development Investments (MMA CDI), MMA Praxis Mutual Funds, has invested more than $7 million in community development financial institutions across the United States and around the world. And while the economic downturn has posed significant challenges for these institutions, MMA CDI has yet to experience a loss of interest or principal from these investments.
One empowering story of the ongoing need and opportunity is the continued growth of The Isaiah Funds, the nation’s first interfaith partnership for disaster recovery investing. Founded by MMA CDI and five other faith-based investor organizations, the Isaiah Funds is dedicated to investing in communities devastated by disaster. Beginning with a focus on the Gulf Coast in the wake of hurricanes Katrina and Rita, the Isaiah Funds raised over $5 million to support rebuilding by local communities. The Fund’s first investment of $500,000 helped launch the construction of a significant housing project in the Central City region of New Orleans called The Muses. Now well into construction, The Muses will provide more than150 affordable housing units—nearly 60 percent designated for low-income families—strategically poised between the historically black, Central City community and the historically white, wealthy St. Charles Avenue neighborhood. It is hoped that The Muses will not only provide much needed housing, but also lay the foundations for economic growth as well.
Mark Regier
Director of Stewardship Investing
4
| MMA Praxis Intermediate Income Fund |
MMA Praxis Intermediate Income Fund
Annual report to shareholders
Portfolio managers’ letter
Returns for the MMA Praxis Intermediate Income Fund were the best ever relative to the Fund’s benchmark, the Barclays Capital Aggregate Index. For the year, the total return for A shares (NAV) was 10.49 percent. This compared very favorably with the benchmark return of 5.93 percent. For the fourth quarter, the return was .34 percent (A shares NAV) versus .20 percent for the Barclay’s Capital Aggregate Index.
There were several reasons for this strong performance. As reported in previous investor letters, earlier in 2009, we aggressively added to the corporate allocation of the portfolio and drew down the mortgage weight. This helped substantially given the very strong 18.68 percent return for Corporate holdings versus the 5.89 percent return from mortgages.
Another overweighted sector was commercial mortgage backed securities (CMBS). CMBS returned 28.45 percent for 2009. The heavy weights in Corporate and CMBS relative to the benchmark accounted for a substantial portion of the excess return.
The other large positive factor that helped the Fund’s returns was the lack of Treasury securities. Since the Funds avoid Treasuries and substitutes Agencies for them, the return advantage of Agencies, which was 1.95 percent versus the Treasury returns of -3.57 percent, helped overall.
The three overweight areas discussed above were the drivers of the Fund’s outperformance. Beyond that there were other small positives, but their impacts were dwarfed by the relative performance of agencies, CMBS, and Corporate.
Outlook
2010 will be a very different year from 2009. First, we believe the opportunities ahead are very modest compared with 2009. There are economic uncertainties that will be central to how investment grade bonds perform. Among these are the strength of the recovery, the impact of the Federal Reserve withdrawal from its asset acquisition program, possible international imports from sovereign debt problems, and possible state and local solvency issues.
Our outlook for 2010 is for an economic recovery that is well below historical norms. We expect the recovery will be more like the early 1990 and early 2000 experiences. There are severe constraints on the rate of recovery. Among these are tight credit for small businesses, a continued drag from housing and probably further house price declines, a smaller manufacturing sector, drags from tax increases and budget cuts by state and local governments, and commercial real estate problems.
Our current thinking is that the recovery will be strong enough that interest rates will rise moderately. The heavy financing by the federal government will put some upward pressure on rates. Offsetting that will be very low inflation and limited private credit demand as businesses build cash and reduce debt with consumers responding similarly.
We still believe that credit has some room to perform better. This reflects strong corporate cash flows and restrained business capital spending. CMBS valuations on a risk-adjusted basis are attractive as well on the highest rated tranches. Selected municipal bonds look interesting. On the other hand, mortgage-backed securities appear expensive and potentially risky when the Fed stops buying.
We believe there are still opportunities in bonds, but 2010 looks like it will possibly be more like a normal bond year in many ways.
5
Our final comment is about inflation. There is widespread concern about inflation as a result of the large deficit spending and aggressive monetary policy of the government. This combination of government borrowing and easy money policies would be highly inflationary if the economy were operating anywhere near capacity, but we believe that the economy is far below potential.
Even if real growth averages 4 percent over the next few years and assuming long-term potential growth is 2.6 percent (a rate that is in line with historical trends), some leading economists suggest it will take almost seven years to get back to full employment. This suggests that unemployment and sluggish growth will be the biggest concern for 2010 and possibly longer.
This does not mean we are ignoring the potential for inflation risks. As long as deficits require foreign financing and absorb a large percentage of domestic savings there is ample reason to be mindful of inflation risks.
Delmar King
MMA Praxis Intermediate Income Fund
Co-fund Manager
Benjamin J. Bailey, CFA®
MMA Praxis Intermediate Income Fund
Co-fund Manager
6
| Performance review |
MMA Praxis Intermediate Income Fund
Performance review
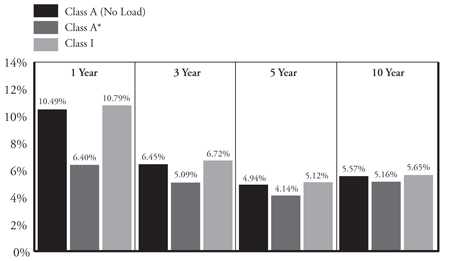
Average annual total returns as of 12/31/09
| Inception | Expense Ratio** | ||||||
| Date | 1 Year | 3 Year | 5 Year | 10 Year | Gross | Net | |
| Class A (No Load) | 5/12/99 | 10.49% | 6.45% | 4.94% | 5.57% | 1.21% | 0.93% |
| Class A* | 5/12/99 | 6.40% | 5.09% | 4.14% | 5.16% | ||
| Class I | 5/1/06 | 10.79% | 6.72% | 5.12% | 5.65% | 0.64% | 0.64% |
Past performance does not guarantee future results. The performance data quoted represents past performance and current returns may be lower or higher. The investment return and principal value will fluctuate so that an investor's shares, when redeemed may be worth more or less than the original cost. These performance figures do not reflect the deduction of taxes that a shareholder would pay on fund distributions or the redemption of fund shares. To obtain performance information current to the most recent month end, please visit mmapraxis.com.
| * | Reflects maximum front-end sales charge of 3.75%. |
Class I Share of this Fund was not in existence prior to 5/1/06. Class I Share performance calculated for any period prior to 5/1/06 is based on the performance of Class B Share since inception of 1/4/94 and has been adjusted to reflect differences in sales charges and expenses between the classes. The Class B Shares were exchanged into Class A Shares on August 17, 2009.
The total return set forth reflects certain expenses that were contractually or voluntarily reduced, reimbursed or paid by third party. In such instances, and without this activity, total return would have been lower.
| ** | Reflects the expense ratios as reported in the Prospectus dated May 1, 2009. Contractual fee waivers are in effect from May 1, 2009 through April 30, 2010 for Class A. Voluntary fee waivers were in effect through December 31, 2009 for Class I. |
7
MMA Praxis Intermediate Income Fund
Performance review
Growth of $10,000 investment 12/31/99 to 12/31/09
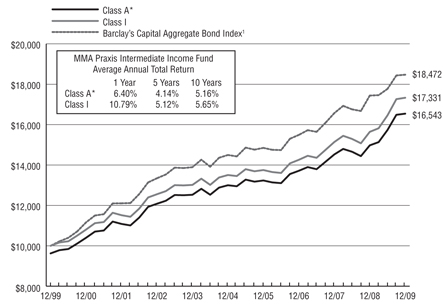
This chart represents historical performance of a hypothetical investment of $10,000 in the Intermediate Income Fund from 12/31/99 to 12/31/09, and represents the reinvestment of dividends and capital gains in the Fund.
Past performance does not guarantee future results. The performance data quoted represents past performance and current returns may be lower or higher. The investment return and principal value will fluctuate so that an investor's shares, when redeemed, may be worth more or less than the original cost. These performance figures do not reflect the deduction of taxes that a shareholder would pay on fund distributions or the redemption of fund shares. To obtain performance information current to the most recent month end, please visit mmapraxis.com.
The total return set forth reflects certain expenses that were contractually or voluntarily reduced, reimbursed or paid by third party. In such instances, and without this activity, total return would have been lower.
| * | Reflects maximum front-end sales charge of 3.75%. |
Class I Share of this Fund was not in existence prior to 5/1/06. Class I Share performance calculated for any period prior to 5/1/06 is based on the performance of Class B Share since inception of 1/4/94 and has been adjusted to reflect differences in sales charges and expenses between the classes. The Class B Shares were exchanged into Class A Shares on August 17, 2009.
| 1 | Barclay's Capital Aggregate Bond Index is an unmanaged index composed of the Barclay's Capital Government/Credit Index and the Barclay's Capital Mortgage-Backed Securities Index and includes Treasury issues, agency issues, corporate bond issues and mortgage-backed securities, and is intended to be generally representative of the bond market as a whole. |
The above indices are for illustrative purposes only and the Barclay's Capital Aggregate Bond Index does not reflect the deduction of expenses associated with a mutual fund, such as investment management and fund accounting fees. The Fund's performance reflects the deduction of these value-added services. An investor cannot invest directly in an index, although they can invest in its underlying securities.
8
| Schedule of portfolio investments |
MMA Praxis Intermediate Income Fund
Schedule of portfolio investments
December 31, 2009
| PRINCIPAL | ||||||||
| AMOUNT | VALUE | |||||||
| ASSET BACKED SECURITIES—0.2% | ||||||||
| Discover Card Master Trust, 5.10%, 10/15/13 | $ | 500,000 | $ | 523,147 | ||||
| Residential Funding Mortgage Securities II, Inc., 5.53%, 2/25/36 | 8,752 | 8,680 | ||||||
| TOTAL ASSET BACKED SECURITIES | 531,827 | |||||||
| COLLATERALIZED MORTGAGE OBLIGATION—0.2% | ||||||||
| JPMorgan Mortgage Trust, 4.50%, 9/25/34 | 381,998 | 367,356 | ||||||
| COMMERCIAL MORTGAGE BACKED SECURITIES—8.4% | ||||||||
| Banc of America Commercial Mortgage, Inc., 5.12%, 7/11/43 | 500,000 | 517,598 | ||||||
| Bear Stearns Commercial Mortgage Securities, 4.95%, 2/11/41 | 268,910 | 270,136 | ||||||
| Bear Stearns Commercial Mortgage Securities, 5.12%, 2/11/41+ | 1,000,000 | 978,605 | ||||||
| Bear Stearns Commercial Mortgage Securities, 4.67%, 6/11/41 | 1,000,000 | 956,604 | ||||||
| Bear Stearns Commercial Mortgage Securities, 5.54%, 9/11/41 | 2,000,000 | 1,947,880 | ||||||
| Bear Stearns Commercial Mortgage Securities, 4.52%, 11/11/41 | 500,000 | 496,031 | ||||||
| Bear Stearns Commercial Mortgage Securities, 4.56%, 2/13/42+ | 979,347 | 978,637 | ||||||
| Bear Stearns Commercial Mortgage Securities, 5.74%, 9/11/42+ | 1,000,000 | 963,096 | ||||||
| Bear Stearns Commercial Mortgage Securities, 5.13%, 10/12/42+ | 1,125,000 | 1,131,422 | ||||||
| Bear Stearns Commercial Mortgage Securities, 5.61%, 6/11/50 | 1,000,000 | 1,014,258 | ||||||
| Chase Commercial Mortgage Securities Corp., 7.32%, 10/15/32 | 851,811 | 872,280 | ||||||
| First Union National Bank Commercial Mortgage, 6.22%, 12/12/33 | 500,000 | 523,540 | ||||||
| GE Capital Commercial Mortgage Corp., 6.53%, 5/15/33 | 850,000 | 882,694 | ||||||
| GMAC Commercial Mortgage Securities, Inc., 6.47%, 4/15/34 | 933,369 | 966,958 | ||||||
| Heller Financial Commercial Mortgage Asset, 7.75%, 1/17/34 | 427 | 426 | ||||||
| JPMorgan Chase Commercial Mortgage Securities Corp., 4.90%, 10/15/42 | 1,000,000 | 945,267 | ||||||
| JPMorgan Chase Commercial Mortgage Securities Corp., 4.92%, 10/15/42+ | 1,000,000 | 961,432 | ||||||
| JPMorgan Chase Commercial Mortgage Securities Corp., 5.40%, 5/15/45 | 2,000,000 | 1,857,949 | ||||||
| JPMorgan Chase Commercial Mortgage Securities Corp., 4.63%, 3/15/46 | 644,843 | 644,270 | ||||||
| Morgan Stanley Capital, 4.83%, 6/12/47 | 1,000,000 | 998,732 | ||||||
| Morgan Stanley Capital I, 5.81%, 8/12/41+ | 1,000,000 | 1,007,672 | ||||||
| Morgan Stanley Capital I, 5.01%, 1/14/42 | 1,000,000 | 1,006,832 | ||||||
| Morgan Stanley Dean Witter Capital I, 5.93%, 12/15/35 | 1,225,000 | 1,268,872 | ||||||
| TOTAL COMMERCIAL MORTGAGE BACKED SECURITIES | 21,191,191 | |||||||
| FOREIGN BONDS—0.8% | ||||||||
| Province of Ontario, Canada, 4.10%, 6/16/14 | 1,000,000 | 1,043,615 | ||||||
| Republic of Austria, 2.00%, 11/15/12(a) | 1,000,000 | 1,010,000 | ||||||
| TOTAL FOREIGN BONDS | 2,053,615 | |||||||
9
MMA Praxis Intermediate Income Fund
Schedule of portfolio investments, continued
December 31, 2009
| PRINCIPAL | ||||||||
| AMOUNT | VALUE | |||||||
| MUNICIPAL BONDS—1.9% | ||||||||
| Cincinnati Ohio Water System Rev., 6.46%, 12/01/34 | $ | 600,000 | $ | 602,748 | ||||
| Houston Independent School District, 6.17%, 2/15/34 | 1,000,000 | 991,240 | ||||||
| Indianapolis Public School Multi-School Building, 5.73%, 7/15/29 | 1,500,000 | 1,398,570 | ||||||
| LL&P Wind Energy, Inc. (XLCA), 5.73%, 12/01/17(a) | 1,000,000 | 958,660 | ||||||
| Wisconsin State Transportation Rev., 5.84%, 7/01/30 | 800,000 | 767,552 | ||||||
| TOTAL MUNICIPAL BONDS | 4,718,770 | |||||||
| CORPORATE BONDS—42.1% | ||||||||
| ADVERTISING—0.4% | ||||||||
| Omnicom Group, Inc., 6.25%, 7/15/19 | 1,000,000 | 1,078,849 | ||||||
| AUTOMOBILE MANUFACTURERS—0.3% | ||||||||
| PACCAR, Inc., 6.88%, 2/15/14 | 760,000 | 857,325 | ||||||
| BIOTECHNOLOGY—0.4% | ||||||||
| Amgen, Inc., 5.70%, 2/01/19 | 500,000 | 536,176 | ||||||
| Biogen Idec, Inc., 6.00%, 3/01/13 | 500,000 | 531,049 | ||||||
| 1,067,225 | ||||||||
| BROADCASTING & CABLE TV—1.1% | ||||||||
| Comcast Corp., 5.70%, 5/15/18 | 500,000 | 525,625 | ||||||
| McGraw-Hill Cos., Inc., 5.38%, 11/15/12 | 1,000,000 | 1,058,487 | ||||||
| Thomson Reuters Corp., 6.20%, 1/05/12 | 1,200,000 | 1,291,211 | ||||||
| 2,875,323 | ||||||||
| CAPITAL MARKETS—0.7% | ||||||||
| BlackRock, Inc., 2.25%, 12/10/12 | 665,000 | 662,089 | ||||||
| BlackRock, Inc., 3.50%, 12/10/14 | 1,000,000 | 987,442 | ||||||
| 1,649,531 | ||||||||
| COMMERCIAL BANKS—1.8% | ||||||||
| American Express Bank FSB, 5.55%, 10/17/12 | 630,000 | 673,740 | ||||||
| Bank of New York Mellon Corp., 5.13%, 8/27/13 | 830,000 | 896,007 | ||||||
| State Street Corp., 7.35%, 6/15/26 | 1,000,000 | 1,054,797 | ||||||
| Wells Fargo & Co., 5.25%, 10/23/12 | 1,250,000 | 1,334,468 | ||||||
| Wells Fargo & Co., Perpetual Bond, 7.98%, 12/31/49+ | 500,000 | 501,250 | ||||||
| 4,460,262 | ||||||||
| COMMERCIAL SERVICES & SUPPLIES—0.6% | ||||||||
| GATX Corp., 9.00%, 11/15/13 | 445,010 | 491,710 | ||||||
| TTX Co., 4.90%, 3/01/15(a) | 1,000,000 | 930,212 | ||||||
| 1,421,922 | ||||||||
| COMMUNICATIONS EQUIPMENT—0.1% | ||||||||
| Cisco Systems, Inc., 4.45%, 1/15/20 | 200,000 | 196,197 | ||||||
| COMPUTERS & PERIPHERALS—0.2% | ||||||||
| Dell, Inc., 5.63%, 4/15/14 | 500,000 | 544,721 | ||||||
10
MMA Praxis Intermediate Income Fund
Schedule of portfolio investments, continued
December 31, 2009
| PRINCIPAL | ||||||||
| AMOUNT | VALUE | |||||||
| CORPORATE BONDS—42.1%, continued | ||||||||
| CONSTRUCTION MATERIALS—0.4% | ||||||||
| Martin Marietta Materials, Inc., 6.60%, 4/15/18 | $ | 1,000,000 | $ | 1,029,375 | ||||
| CONSUMER FINANCE—1.0% | ||||||||
| American Honda Finance Corp., 4.63%, 4/02/13(a) | 1,500,000 | 1,541,175 | ||||||
| Ford Motor Credit Co. LLC, 7.25%, 10/25/11 | 1,000,000 | 1,009,892 | ||||||
| 2,551,067 | ||||||||
| CONTAINERS & PACKAGING—0.2% | ||||||||
| Bemis Co., Inc., 5.65%, 8/01/14 | 500,000 | 532,192 | ||||||
| DIVERSIFIED FINANCIAL SERVICES—4.1% | ||||||||
| Allstate Life Global Funding Trusts, 5.38%, 4/30/13 | 500,000 | 533,737 | ||||||
| Citigroup, Inc., 5.13%, 5/05/14 | 1,000,000 | 995,309 | ||||||
| Equifax, Inc., 4.45%, 12/01/14 | 1,110,000 | 1,115,570 | ||||||
| General Electric Capital Corp., 6.15%, 8/07/37 | 1,000,000 | 944,324 | ||||||
| GMAC, Inc., 6.75%, 12/01/14(a) | 600,000 | 570,000 | ||||||
| Goldman Sachs Group, Inc., 6.88%, 1/15/11 | 500,000 | 530,213 | ||||||
| JPMorgan Chase & Co., 4.75%, 5/01/13 | 1,000,000 | 1,055,522 | ||||||
| Morgan Stanley, 5.63%, 9/23/19 | 1,500,000 | 1,510,965 | ||||||
| National Rural Utilities Cooperative Finance Corp., 10.38%, 11/01/18 | 780,000 | 1,033,559 | ||||||
| NYSE Euronext, 4.80%, 6/28/13 | 1,000,000 | 1,049,131 | ||||||
| Principal Life Global Funding I, 6.25%, 2/15/12(a) | 1,000,000 | 1,050,027 | ||||||
| 10,388,357 | ||||||||
| ELECTRIC UTILITIES—5.3% | ||||||||
| AEP Texas North Co., 5.50%, 3/01/13 | 1,000,000 | 1,051,741 | ||||||
| Atlantic City Electric Co., 7.75%, 11/15/18 | 500,000 | 593,726 | ||||||
| CenterPoint Energy Houston Electric LLC, 7.00%, 3/01/14 | 1,000,000 | 1,138,562 | ||||||
| Consumers Energy Co., 6.70%, 9/15/19 | 625,000 | 704,588 | ||||||
| Idaho Power Co., 4.50%, 3/01/20 | 500,000 | 477,660 | ||||||
| ITC Holdings Corp., 5.50%, 1/15/20(a) | 500,000 | 487,117 | ||||||
| MidAmerican Energy Co., 6.75%, 12/30/31 | 1,500,000 | 1,677,564 | ||||||
| Niagara Mohawk Power Corp., 4.88%, 8/15/19(a) | 500,000 | 495,741 | ||||||
| Pacific Gas & Electric Co., 8.25%, 10/15/18 | 500,000 | 610,524 | ||||||
| Pennsylvania Electric Co., 5.20%, 4/01/20 | 500,000 | 492,441 | ||||||
| Portland General Electric Co., 6.10%, 4/15/19 | 1,100,000 | 1,215,215 | ||||||
| Potomac Electric Power Co., 6.50%, 11/15/37 | 1,000,000 | 1,097,380 | ||||||
| Puget Sound Energy, Inc., 6.74%, 6/15/18 | 1,000,000 | 1,101,246 | ||||||
| TransAlta Corp., 4.75%, 1/15/15 | 500,000 | 503,481 | ||||||
| TransAlta Corp., 6.65%, 5/15/18 | 500,000 | 521,303 | ||||||
| Vectren Utility Holdings, Inc., 6.63%, 12/01/11 | 1,000,000 | 1,049,516 | ||||||
| 13,217,805 | ||||||||
| ELECTRICAL EQUIPMENT—0.6% | ||||||||
| Briggs & Stratton Corp., 8.88%, 3/15/11 | 1,000,000 | 1,048,750 | ||||||
| Thomas & Betts Corp., 5.63%, 11/15/21 | 500,000 | 488,778 | ||||||
| 1,537,528 | ||||||||
11
MMA Praxis Intermediate Income Fund
Schedule of portfolio investments, continued
December 31, 2009
| PRINCIPAL | ||||||||
| AMOUNT | VALUE | |||||||
| CORPORATE BONDS—42.1%, continued | ||||||||
| FOOD & STAPLES RETAILING—0.2% | ||||||||
| Kroger Co., 7.50%, 1/15/14 | $ | 500,000 | $ | 570,643 | ||||
| FOOD PRODUCTS—1.0% | ||||||||
| Cargill, Inc., 7.50%, 9/01/26(a) | 1,250,000 | 1,401,805 | ||||||
| Kellogg Co., 4.25%, 3/06/13 | 1,000,000 | 1,048,305 | ||||||
| 2,450,110 | ||||||||
| GAS UTILITIES—1.9% | ||||||||
| Indiana Gas Co., Inc., 6.55%, 6/30/28 | 250,000 | 233,744 | ||||||
| Michigan Consolidated Gas Co., 8.25%, 5/01/14 | 1,000,000 | 1,152,276 | ||||||
| National Fuel Gas Co., 6.50%, 4/15/18 | 500,000 | 519,155 | ||||||
| Northern Natural Gas Co., 5.38%, 10/31/12(a) | 1,000,000 | 1,086,650 | ||||||
| Sempra Energy, 6.50%, 6/01/16 | 600,000 | 650,705 | ||||||
| Southern Union Co., 8.25%, 11/15/29 | 1,050,000 | 1,172,432 | ||||||
| 4,814,962 | ||||||||
| HEALTH CARE EQUIPMENT & SUPPLIES—0.6% | ||||||||
| Beckman Coulter, Inc., 6.00%, 6/01/15 | 900,000 | 981,223 | ||||||
| Zimmer Holdings, Inc., 4.63%, 11/30/19 | 500,000 | 495,461 | ||||||
| 1,476,684 | ||||||||
| HEALTH CARE PROVIDERS & SERVICES—1.4% | ||||||||
| Express Scripts, Inc., 6.25%, 6/15/14 | 550,000 | 600,121 | ||||||
| Howard Hughes Medical Institute, 3.45%, 9/01/14 | 665,000 | 673,837 | ||||||
| McKesson Corp., 6.50%, 2/15/14 | 1,000,000 | 1,106,164 | ||||||
| Roche Holdings, Inc., 6.00%, 3/01/19(a) | 1,000,000 | 1,098,851 | ||||||
| 3,478,973 | ||||||||
| HOTELS, RESTAURANTS & LEISURE—0.4% | ||||||||
| Yum! Brands, Inc., 8.88%, 4/15/11 | 1,000,000 | 1,082,073 | ||||||
| HOUSEHOLD DURABLES—0.3% | ||||||||
| Stanley Works, 6.15%, 10/01/13 | 725,000 | 797,794 | ||||||
| INDUSTRIAL CONGLOMERATES—0.8% | ||||||||
| Cooper U.S., Inc., 5.45%, 4/01/15 | 1,000,000 | 1,078,254 | ||||||
| Harsco Corp., 5.75%, 5/15/18 | 1,000,000 | 984,312 | ||||||
| 2,062,566 | ||||||||
| INTEGRATED TELECOMMUNICATION SERVICES—1.3% | ||||||||
| AT&T, Inc., 4.95%, 1/15/13 | 1,000,000 | 1,066,880 | ||||||
| Sprint Capital Corp., 7.63%, 1/30/11 | 1,000,000 | 1,023,750 | ||||||
| Verizon Communications, Inc., 5.50%, 4/01/17 | 1,000,000 | 1,055,228 | ||||||
| 3,145,858 | ||||||||
| IT SERVICES—0.4% | ||||||||
| Dun & Bradstreet Corp., 6.00%, 4/01/13 | 1,000,000 | 1,029,450 | ||||||
| LIFE & HEALTH INSURANCE—0.2% | ||||||||
| Prudential Financial, Inc., 4.75%, 4/01/14 | 591,000 | 591,971 | ||||||
12
MMA Praxis Intermediate Income Fund
Schedule of portfolio investments, continued
December 31, 2009
| PRINCIPAL | ||||||||
| AMOUNT | VALUE | |||||||
| CORPORATE BONDS—42.1%, continued | ||||||||
| MULTI-LINE INSURANCE—0.4% | ||||||||
| American International Group, Inc., 4.25%, 5/15/13 | $ | 500,000 | $ | 461,854 | ||||
| Metropolitan Life Global Funding I, 5.13%, 6/10/14(a) | 500,000 | 529,148 | ||||||
| 991,002 | ||||||||
| MULTILINE RETAIL—0.5% | ||||||||
| Wal-Mart Stores, Inc., 7.55%, 2/15/30 | 1,000,000 | 1,239,056 | ||||||
| OFFICE ELECTRONICS—0.4% | ||||||||
| Xerox Corp., 6.35%, 5/15/18 | 1,000,000 | 1,043,128 | ||||||
| OIL, GAS & CONSUMABLE FUELS—3.2% | ||||||||
| BP Capital Markets plc, 3.88%, 3/10/15 | 1,500,000 | 1,541,121 | ||||||
| Conoco, Inc., 6.95%, 4/15/29 | 1,075,000 | 1,218,561 | ||||||
| Motiva Enterprises LLC, 5.20%, 9/15/12(a) | 1,000,000 | 1,027,540 | ||||||
| Ras Laffan Liquefied Natural Gas Co. Ltd. III, 5.83%, 9/30/16(a) | 1,000,000 | 1,047,210 | ||||||
| Shell International Finance BV, 4.00%, 3/21/14 | 1,000,000 | 1,043,531 | ||||||
| Texas Gas Transmission LLC, 4.60%, 6/01/15 | 1,000,000 | 1,012,422 | ||||||
| XTO Energy, Inc., 7.50%, 4/15/12 | 1,000,000 | 1,115,032 | ||||||
| 8,005,417 | ||||||||
| PERSONAL PRODUCTS—0.9% | ||||||||
| Avon Products, Inc., 5.63%, 3/01/14 | 1,000,000 | 1,089,898 | ||||||
| Johnson & Johnson, 5.95%, 8/15/37 | 500,000 | 549,914 | ||||||
| Mead Johnson Nutrition Co., 3.50%, 11/01/14(a) | 500,000 | 494,301 | ||||||
| 2,134,113 | ||||||||
| PHARMACEUTICALS—1.1% | ||||||||
| Abbott Laboratories, 5.13%, 4/01/19 | 1,000,000 | 1,045,968 | ||||||
| Merck & Co., Inc., 4.00%, 6/30/15 | 500,000 | 521,422 | ||||||
| Novartis Capital Corp., 4.13%, 2/10/14 | 1,250,000 | 1,313,971 | ||||||
| 2,881,361 | ||||||||
| PROPERTY & CASUALTY INSURANCE—1.4% | ||||||||
| Chubb Corp., 6.50%, 5/15/38 | 500,000 | 550,606 | ||||||
| Fidelity National Title, 7.30%, 8/15/11 | 1,000,000 | 1,030,324 | ||||||
| Markel Corp., 6.80%, 2/15/13 | 1,000,000 | 1,010,660 | ||||||
| W.R. Berkley Corp., 5.13%, 9/30/10 | 1,000,000 | 1,009,968 | ||||||
| 3,601,558 | ||||||||
| PUBLISHING—0.3% | ||||||||
| Washington Post Co., 7.25%, 2/01/19 | 575,000 | 631,426 | ||||||
| REAL ESTATE INVESTMENT TRUSTS (REITS)—0.5% | ||||||||
| Simon Property Group LP, 6.35%, 8/28/12 | 1,200,000 | 1,280,921 | ||||||
| REAL ESTATE MANAGEMENT & DEVELOPMENT—0.4% | ||||||||
| AMB Property LP, 6.13%, 12/01/16 | 1,000,000 | 987,488 | ||||||
13
MMA Praxis Intermediate Income Fund
Schedule of portfolio investments, continued
December 31, 2009
| PRINCIPAL | ||||||||
| AMOUNT | VALUE | |||||||
| CORPORATE BONDS—42.1%, continued | ||||||||
| ROAD & RAIL—1.1% | ||||||||
| Canadian National Railway Co., 4.40%, 3/15/13 | $ | 1,000,000 | $ | 1,042,487 | ||||
| CSX Transportation, Inc., 8.38%, 10/15/14 | 480,519 | 553,639 | ||||||
| ERAC USA Finance Co., 5.90%, 11/15/15(a) | 1,000,000 | 1,034,480 | ||||||
| 2,630,606 | ||||||||
| SEMICONDUCTORS & SEMICONDUCTOR EQUIPMENT—0.9% | ||||||||
| Analog Devices, Inc., 5.00%, 7/01/14 | 500,000 | 521,596 | ||||||
| Applied Materials, Inc., 7.13%, 10/15/17 | 500,000 | 559,881 | ||||||
| KLA-Tencor Corp., 6.90%, 5/01/18 | 1,000,000 | 1,052,141 | ||||||
| 2,133,618 | ||||||||
| SOFT DRINKS—0.4% | ||||||||
| Bottling Group LLC, 5.13%, 1/15/19 | 1,000,000 | 1,039,157 | ||||||
| SPECIALTY RETAIL—0.5% | ||||||||
| Home Depot, Inc., 5.25%, 12/16/13 | 500,000 | 535,279 | ||||||
| Staples, Inc., 9.75%, 1/15/14 | 500,000 | 609,225 | ||||||
| 1,144,504 | ||||||||
| SUPRANATIONAL—2.5% | ||||||||
| Corporation Andina de Fomento, 5.20%, 5/21/13 | 1,000,000 | 1,045,749 | ||||||
| Inter-American Development Bank, 3.50%, 7/08/13 | 1,000,000 | 1,040,628 | ||||||
| Inter-American Development Bank, 3.50%, 3/15/13 | 1,000,000 | 1,040,244 | ||||||
| International Bank for Reconstruction & Development, 2.00%, 12/04/13 | 2,000,000 | 1,965,786 | ||||||
| International Finance Facility for Immunisation (IFFIM), 5.00%, 11/14/11(a) | 1,000,000 | 1,063,978 | ||||||
| 6,156,385 | ||||||||
| THRIFTS & MORTGAGE FINANCE—0.4% | ||||||||
| Countrywide Financial Corp., 5.80%, 6/07/12 | 1,000,000 | 1,061,511 | ||||||
| TRUCKING—0.4% | ||||||||
| Golden State Petroleum Transport Corp., 8.04%, 2/01/19 | 895,004 | 926,651 | ||||||
| UTILITIES-OTHER—0.7% | ||||||||
| FPL Energy Caithness Funding, 7.65%, 12/31/18(a) | 656,213 | 674,030 | ||||||
| Salton Sea Funding Corp., 7.48%, 11/30/18 | 935,253 | 998,092 | ||||||
| 1,672,122 | ||||||||
| WATER UTILITIES—0.4% | ||||||||
| American Water Capital Corp., 6.09%, 10/15/17 | 1,000,000 | 1,044,904 | ||||||
| TOTAL CORPORATE BONDS | 105,513,691 | |||||||
14
MMA Praxis Intermediate Income Fund
Schedule of portfolio investments, continued
December 31, 2009
| PRINCIPAL | ||||||||
| AMOUNT | VALUE | |||||||
| CORPORATE NOTES—1.0% | ||||||||
| DEVELOPMENT AUTHORITIES—1.0% | ||||||||
| MMA Community Development Investment, Inc., 1.10%, 12/31/11(b) | $ | 802,500 | $ | 802,500 | ||||
| MMA Community Development Investment, Inc., 0.73%, 12/31/12(b) | 910,000 | 910,000 | ||||||
| MMA Community Development Investment, Inc., 1.10%, 12/31/13(b) | 802,500 | 802,500 | ||||||
| TOTAL CORPORATE NOTES | 2,515,000 | |||||||
| INTEREST ONLY BONDS—0.1% | ||||||||
| FREDDIE MAC REMICS — 0.1% | ||||||||
| 5.00%, 4/15/29 | 2,000,000 | 140,933 | ||||||
| GOVERNMENT NATIONAL MORTGAGE ASSOCIATION — 0.0% | ||||||||
| 0.85%, 4/16/27+ | 6,677,526 | 133,854 | ||||||
| TOTAL INTEREST ONLY BONDS | 274,787 | |||||||
| U.S. GOVERNMENT AGENCIES—40.2% | ||||||||
| FEDERAL FARM CREDIT BANK — 0.9% | ||||||||
| 4.88%, 12/16/15 | 2,000,000 | 2,155,142 | ||||||
| FEDERAL HOME LOAN BANK — 3.7% | ||||||||
| 3.88%, 6/14/13 | 300,000 | 317,275 | ||||||
| 4.13%, 8/13/10 | 1,000,000 | 1,021,715 | ||||||
| 5.00%, 11/17/17 | 4,000,000 | 4,326,876 | ||||||
| 5.00%, 12/10/21 | 2,625,000 | 2,766,514 | ||||||
| 6.63%, 11/15/10 | 900,000 | 946,605 | ||||||
| 9,378,985 | ||||||||
| FEDERAL HOME LOAN MORTGAGE CORP. — 12.8% | ||||||||
| 2.97%, 5/01/34+ | 496,030 | 509,924 | ||||||
| 2.97%, 5/01/34+ | 235,873 | 242,484 | ||||||
| 3.75%, 3/27/19 | 3,500,000 | 3,431,473 | ||||||
| 4.13%, 7/12/10 | 1,987,000 | 2,026,468 | ||||||
| 4.50%, 6/01/18 | 1,051,095 | 1,081,434 | ||||||
| 5.00%, 4/01/19 | 1,066,275 | 1,122,386 | ||||||
| 5.00%, 12/01/21 | 1,703,544 | 1,787,333 | ||||||
| 5.00%, 2/15/32 | 2,000,000 | 2,081,621 | ||||||
| 5.00%, 7/01/35 | 1,730,461 | 1,777,868 | ||||||
| 5.50%, 4/01/22 | 1,552,891 | 1,643,352 | ||||||
| 5.50%, 11/01/33 | 845,215 | 889,413 | ||||||
| 5.50%, 3/01/36 | 1,143,540 | 1,202,266 | ||||||
| 5.50%, 6/01/36 | 1,461,792 | 1,531,607 | ||||||
| 5.50%, 6/01/36 | 1,738,158 | 1,824,160 | ||||||
| 5.50%, 12/01/36 | 1,707,785 | 1,792,285 | ||||||
| 5.50%, 12/01/36 | 1,687,590 | 1,771,091 | ||||||
15
MMA Praxis Intermediate Income Fund
Schedule of portfolio investments, continued
December 31, 2009
| PRINCIPAL | ||||||||
| AMOUNT | VALUE | |||||||
| U.S. GOVERNMENT AGENCIES—40.2%, continued | ||||||||
| FEDERAL HOME LOAN MORTGAGE CORP. — 12.8%, continued | ||||||||
| 6.00%, 9/01/17 | $ | 701,782 | $ | 749,136 | ||||
| 6.00%, 4/01/27 | 1,705,208 | 1,824,214 | ||||||
| 6.00%, 6/01/36 | 1,164,006 | 1,235,301 | ||||||
| 6.00%, 8/01/37 | 1,073,370 | 1,139,114 | ||||||
| 6.88%, 9/15/10 | 1,081,000 | 1,129,874 | ||||||
| 7.00%, 2/01/30 | 326,264 | 355,866 | ||||||
| 7.00%, 3/01/31 | 275,042 | 299,996 | ||||||
| 7.50%, 7/01/30 | 539,875 | 589,019 | ||||||
| 32,037,685 | ||||||||
| FEDERAL NATIONAL MORTGAGE ASSOCIATION — 15.3% | ||||||||
| 2.81%, 5/01/34+ | 366,004 | 378,545 | ||||||
| 3.11%, 2/01/34+ | 373,164 | 384,689 | ||||||
| 3.90%, 6/01/33+ | 131,933 | 136,257 | ||||||
| 4.13%, 4/15/14 | 900,000 | 957,185 | ||||||
| 5.00%, 2/13/17 | 3,000,000 | 3,256,491 | ||||||
| 5.00%, 7/01/18 | 557,208 | 582,874 | ||||||
| 5.00%, 9/01/18 | 742,216 | 776,403 | ||||||
| 5.00%, 4/01/25 | 1,297,144 | 1,344,958 | ||||||
| 5.00%, 7/01/25 | 1,124,787 | 1,166,248 | ||||||
| 5.00%, 10/01/25 | 1,401,621 | 1,453,286 | ||||||
| 5.00%, 10/01/35 | 1,919,746 | 1,972,039 | ||||||
| 5.39%, 5/01/37+ | 1,910,085 | 2,016,024 | ||||||
| 5.50%, 6/01/22 | 1,244,436 | 1,317,311 | ||||||
| 5.50%, 11/01/25 | 370 | 391 | ||||||
| 5.50%, 2/01/34 | 720,530 | 754,943 | ||||||
| 5.50%, 1/01/35 | 1,506,670 | 1,578,629 | ||||||
| 5.50%, 10/01/35 | 2,199,401 | 2,304,445 | ||||||
| 5.50%, 11/01/36 | 1,789,950 | 1,875,438 | ||||||
| 6.00%, 10/01/33 | 389,484 | 412,853 | ||||||
| 6.00%, 11/01/34 | 1,506,554 | 1,596,947 | ||||||
| 6.00%, 10/01/35 | 963,172 | 1,020,962 | ||||||
| 6.00%, 6/01/36 | 970,853 | 1,029,104 | ||||||
| 6.63%, 11/15/30 | 6,750,000 | 8,112,204 | ||||||
| 7.00%, 7/01/15 | 5,091 | 5,636 | ||||||
| 7.00%, 11/01/19 | 43,155 | 47,954 | ||||||
| 7.00%, 11/01/19 | 73,993 | 82,222 | ||||||
| 7.25%, 1/15/10 | 3,450,000 | 3,459,965 | ||||||
| 8.50%, 9/01/26 | 232,254 | 267,511 | ||||||
| 38,291,514 | ||||||||
16
MMA Praxis Intermediate Income Fund
Schedule of portfolio investments, continued
December 31, 2009
| PRINCIPAL | ||||||||
| AMOUNT/ | ||||||||
| SHARES | VALUE | |||||||
| U.S. GOVERNMENT AGENCIES—40.2%, continued | ||||||||
| GOVERNMENT NATIONAL MORTGAGE ASSOCIATION — 1.2% | ||||||||
| 4.50%, 1/20/34+ | $ | 173,813 | $ | 178,452 | ||||
| 5.50%, 10/20/38 | 1,821,498 | 1,893,587 | ||||||
| 6.50%, 11/20/38 | 444,035 | 466,779 | ||||||
| 6.75%, 4/15/16 | 56,398 | 61,342 | ||||||
| 7.00%, 12/20/30 | 88,117 | 95,605 | ||||||
| 7.00%, 10/20/31 | 56,534 | 61,339 | ||||||
| 7.00%, 3/20/32 | 190,045 | 206,194 | ||||||
| 2,963,298 | ||||||||
| SMALL BUSINESS ADMINISTRATION — 0.2% | ||||||||
| 0.60%, 2/25/32+ | 601,140 | 590,900 | ||||||
| 1.00%, 9/25/18+ | 44,615 | 44,318 | ||||||
| 635,218 | ||||||||
| FDIC GUARANTEED—6.1% | ||||||||
| U.S. Central Federal Credit Union, 1.25%, 10/19/11 | 1,300,000 | 1,299,645 | ||||||
| General Electric Capital Corp., 1.63%, 1/07/11 | 1,400,000 | 1,414,706 | ||||||
| Citibank NA, 1.75%, 12/28/12 | 3,000,000 | 2,973,606 | ||||||
| PNC Funding Corp., 1.88%, 6/22/11 | 650,000 | 656,616 | ||||||
| U.S. Central Federal Credit Union, 1.90%, 10/19/12 | 2,000,000 | 1,998,436 | ||||||
| Citigroup Funding, Inc., 1.88%, 10/22/12 | 3,000,000 | 2,988,666 | ||||||
| Citigroup Funding, Inc., 1.88%, 11/15/12 | 1,330,000 | 1,326,571 | ||||||
| General Electric Capital Corp., 2.20%, 6/08/12 | 175,000 | 177,454 | ||||||
| JPMorgan Chase & Co., 2.63%, 12/01/10 | 1,000,000 | 1,019,658 | ||||||
| Regions Bank/Birmingham AL, 3.25%, 12/09/11 | 1,500,000 | 1,556,532 | ||||||
| 15,411,890 | ||||||||
| TOTAL U.S. GOVERNMENT AGENCIES | 100,873,732 | |||||||
| INVESTMENT COMPANY—0.5% | ||||||||
| MUTUAL FUND—0.5% | ||||||||
| Pax World High Yield Bond Fund | 167,685 | 1,291,177 | ||||||
| SHORT TERM INVESTMENT—4.8% | ||||||||
| JPMorgan U.S. Government Money Market Fund-Agency Shares | 12,025,905 | 12,025,905 | ||||||
| TOTAL INVESTMENTS (Cost* $244,424,173)—100.2% | $ | 251,357,051 | ||||||
| Net other assets (liabilities) — (0.2)% | (387,049 | ) | ||||||
| NET ASSETS—100% | $ | 250,970,002 | ||||||
17
MMA Praxis Intermediate Income Fund
Schedule of portfolio investments, continued
December 31, 2009
| + | Variable rate security. Rates presented are the rates in effect at December 31, 2009. |
| (a) | 144a security is restricted as to resale to institutional investors. These securities were deemed liquid under guidelines established by the Board of Trustees. At December 31, 2009, these securities were valued at $16,500,925 or 6.6% of net assets. |
| (b) | Represents affiliated restricted security as to resale to shareholders and is not registered under the Securities Act of 1933. These securities have been deemed illiquid under guidelines established by the Board of Trustees: |
| Acquisition | |||
| Security | Yield | Shares | Date |
| MMA Community Development Investment, Inc. | 0.73% | 910,000 | 12/2009 |
| MMA Community Development Investment, Inc. | 1.10% | 802,500 | 12/2009 |
| MMA Community Development Investment, Inc. | 1.10% | 802,500 | 12/2009 |
At December 31, 2009, these securities had an aggregate market value of $2,515,000, representing 1.0% of net assets.
| * | Represents cost for financial reporting purposes. |
plc – Public Liability Company.
Other Information:
The inputs or methodology used for valuing securities may not be an indication of the risk associated with investing in those securities. For more information on valuation inputs, and their aggregation into the levels used in the table below, please refer to the Security Valuation section in the accompanying Notes to Financial Statements.
| Valuation Inputs at Reporting Date: | ||||||||||||||||
| Description | Level 1 | Level 2 | Level 3 | Total | ||||||||||||
| Investments at Value | ||||||||||||||||
| Corporate Bonds | $ | — | $ | 105,513,691 | $ | — | $ | 108,811,772 | ||||||||
| Corporate Notes | — | — | 2,515,000 | 2,515,000 | ||||||||||||
| U.S. Government Agencies | — | 100,873,732 | — | 97,575,651 | ||||||||||||
| Commercial Mortgage Backed Securities | — | 21,191,191 | — | 21,191,191 | ||||||||||||
| Short Term Investment | 12,025,905 | — | — | 12,025,905 | ||||||||||||
| Municipal Bonds | — | 4,718,770 | — | 4,718,770 | ||||||||||||
| Foreign Bonds | — | 2,053,615 | — | 2,053,615 | ||||||||||||
| Investment Company | 1,291,177 | — | — | 1,291,177 | ||||||||||||
| Asset Backed Securities | — | 531,827 | — | 531,827 | ||||||||||||
| Collateralized Mortgage Obligations | — | 367,356 | — | 367,356 | ||||||||||||
| Interest Only Bonds | — | 274,787 | — | 274,787 | ||||||||||||
| Total Investments | $ | 13,317,082 | $ | 235,524,969 | $ | 2,515,000 | $ | 251,357,051 | ||||||||
Following is a reconciliation of Level 3 assets for which significant unobservable inputs for Investments in Securities were used to determine fair value for each Fund:
| Intermediate | ||||
| Income Fund | ||||
| Balance as of December 31, 2008 | $ | 2,515,000 | ||
| Proceeds from Sales | (2,515,000 | ) | ||
| Purchases | 2,515,000 | |||
| Balance as of December 31, 2009 | $ | 2,515,000 | ||
See accompanying notes to financial statements.
18
| MMA Praxis Core Stock Fund |
MMA Praxis Core Stock Fund
Annual report to shareholders
Portfolio managers’ letter
For the year ended Dec. 31, 2009, the Class A shares of MMA Praxis Core Stock Fund (NAV) returned 29.00 percent, out-performing its benchmark, the Standard & Poor’s 500 Index (Index), which returned 26.47 percent.
Factors affecting the Fund’s performance
Information technology, materials and consumer discretionary were the sectors within the Index that turned in the strongest performance over the year. Telecommunication services and utilities had the weakest performance, although their performance was still positive.
The Fund’s financial companies were the strongest contributors to performance on an absolute basis. The Fund’s relative performance versus the Index benefited as the Fund’s financial companies out-performed the corresponding sector within the Index (up 27 percent versus up 17 percent for the Index). American Express and GAM Holding were among the top contributors to the Fund’s performance during the period. Bank of America, Wells Fargo, NIPPONKOA and Citigroup were among the top detractors from performance. The Fund no longer owns Bank of America, NIPPONKOA or Citigroup.
The Fund’s performance versus the Index received support from strong stock selection in the energy and health care sector. The Fund’s health care sector holdings out-performed the Index’s holdings (up 45 percent versus up 20 percent for the Index) and this factor was the largest contributor to the Fund’s positive relative performance. Schering Plough was a top contributor to performance before merging with Merck. The Fund’s energy sector outperformance (up 33 percent versus up 14 percent for the Index) was the second largest factor for the positive relative performance compared with the Index. EOG Resources and Canadian Natural Resources were among the leading contributors to performance. ConocoPhillips was the top detractor from performance.
Information technology companies were a contributor to performance on an absolute basis, however, when compared with the Index, the Fund suffered from having a lower relative weighting (10 percent versus 18 percent for the Index). Google, Microsoft, and Texas Instruments were among the most important contributors to performance.
The Fund held approximately 12 percent of its assets in foreign companies (including American Depositary Receipts) at Dec. 31, 2009. As a whole these companies outperformed the domestic companies held by the Fund.
Christopher C. Davis
Portfolio Manager and CEO of Davis Advisors
Kenneth C. Feinberg
Portfolio Manager
19
| Performance review |
MMA Praxis Core Stock Fund
Performance review
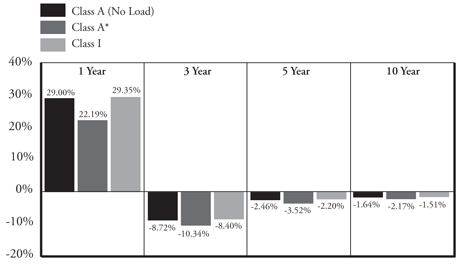
Average annual total returns as of 12/31/09
| Inception | Expense Ratio** | ||||||
| Date | 1 Year | 3 Year | 5 Year | 10 Year | Gross | Net | |
| Class A (No Load) | 5/12/99 | 29.00% | -8.72% | -2.46% | -1.64% | 1.56% | 1.56% |
| Class A* | 5/12/99 | 22.19% | -10.34% | -3.52% | -2.17% | ||
| Class I | 5/1/06 | 29.35% | -8.40% | -2.20% | -1.51% | 1.01% | 1.01% |
Past performance does not guarantee future results. The performance data quoted represents past performance and current returns may be lower or higher. The investment return and principal value will fluctuate so that an investor's shares, when redeemed may be worth more or less than the original cost. These performance figures do not reflect the deduction of taxes that a shareholder would pay on fund distributions or the redemption of fund shares. To obtain performance information current to the most recent month end, please visit mmapraxis.com.
| * | Reflects maximum front-end sales charge of 5.25%. |
Class I Share of this Fund was not in existence prior to 5/1/06. Class I Share performance calculated for any period prior to 5/1/06 is based on the performance of Class B Share since inception of 1/4/94 and has been adjusted to reflect differences in sales charges and expenses between the classes. The Class B Shares were exchanged into Class A Shares on August 17, 2009.
The total return set forth reflects certain expenses that were contractually or voluntarily reduced, reimbursed or paid by third party. In such instances, and without this activity, total return would have been lower.
| ** | Reflects the expense ratios as reported in the Prospectus dated May 1, 2009. Voluntary fee waivers were in effect through December 31, 2009 for Class A and Class I. |
20
MMA Praxis Core Stock Fund
Performance review
Growth of $10,000 investment 12/31/99 to 12/31/09
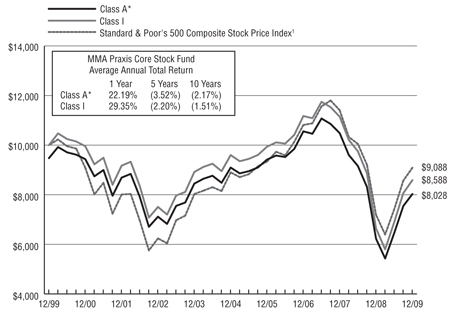
This chart represents historical performance of a hypothetical investment of $10,000 in the Core Stock Fund from 12/31/99 to 12/31/09, and represents the reinvestment of dividends and capital gains in the Fund.
Past performance does not guarantee future results. The performance data quoted represents past performance and current returns may be lower or higher. The investment return and principal value will fluctuate so that an investor's shares, when redeemed may be worth more or less than the original cost. These performance figures do not reflect the deduction of taxes that a shareholder would pay on fund distributions or the redemption of fund shares. To obtain performance information current to the most recent month end, please visit mmapraxis.com.
The total return set forth reflects certain expenses that were contractually or voluntarily reduced, reimbursed or paid by third party. In such instances, and without this activity, total return would have been lower.
| * | Reflects maximum front-end sales charge of 5.25%. |
Class I Share of this Fund was not in existence prior to 5/1/06. Class I Share performance calculated for any period prior to 5/1/06 is based on the performance of Class B Share since inception of 1/4/94 and has been adjusted to reflect differences in sales charges and expenses between the classes. The Class B Shares were exchanged into Class A Shares on August 17, 2009.
| 1 | The S&P 500 Composite Stock Price Index (the "S&P 500 Index") is a widely recognized, unmanaged index of 500 selected common stocks, most of which are listed on the New York Stock Exchange. |
The above index is for illustrative purposes only and does not reflect the deduction of expenses associated with a mutual fund, such as investment management and fund accounting fees. The fund's performance reflects the deduction of these value-added services. An investor cannot invest directly in an index, although they can invest in its underlying securities.
21
| Schedule of portfolio investments |
MMA Praxis Core Stock Fund
Schedule of portfolio investments
December 31, 2009
| SHARES | VALUE | |||||||
| COMMON STOCKS—96.7% | ||||||||
| AIR FREIGHT & LOGISTICS—0.5% | ||||||||
| United Parcel Service, Inc., Class B | 17,900 | $ | 1,026,923 | |||||
| AUTOMOBILES—1.1% | ||||||||
| Harley-Davidson, Inc. | 83,100 | 2,094,120 | ||||||
| BEVERAGES—0.6% | ||||||||
| Coca-Cola Company | 19,300 | 1,100,100 | ||||||
| CAPITAL MARKETS—5.5% | ||||||||
| Ameriprise Financial, Inc. | 40,200 | 1,560,564 | ||||||
| Bank of New York Mellon Corp. | 146,600 | 4,100,402 | ||||||
| GAM Holding Ltd. (Switzerland) | 81,800 | 995,565 | ||||||
| Goldman Sachs Group, Inc. | 7,290 | 1,230,843 | ||||||
| Julius Baer Holding AG (Switzerland) | 81,800 | 2,876,779 | ||||||
| 10,764,153 | ||||||||
| CHEMICALS—0.3% | ||||||||
| Potash Corp of Saskatchewan, Inc. (Canada) | 4,627 | 502,029 | ||||||
| COMMERCIAL BANKS—4.3% | ||||||||
| Wells Fargo & Co. | 308,758 | 8,333,378 | ||||||
| COMMERCIAL SERVICES & SUPPLIES—1.5% | ||||||||
| Iron Mountain, Inc. (a) | 129,600 | 2,949,696 | ||||||
| COMPUTERS & PERIPHERALS—1.6% | ||||||||
| Hewlett-Packard Co. | 60,250 | 3,103,477 | ||||||
| CONSTRUCTION MATERIALS—1.6% | ||||||||
| Martin Marietta Materials, Inc. | 22,200 | 1,984,902 | ||||||
| Vulcan Materials Co. | 22,300 | 1,174,541 | ||||||
| 3,159,443 | ||||||||
| CONSUMER FINANCE—4.1% | ||||||||
| American Express Co. | 194,900 | 7,897,348 | ||||||
| CONTAINERS & PACKAGING—2.1% | ||||||||
| Sealed Air Corp. | 187,800 | 4,105,308 | ||||||
| DIVERSIFIED CONSUMER SERVICES—0.6% | ||||||||
| H&R Block, Inc. | 51,750 | 1,170,585 | ||||||
22
MMA Praxis Core Stock Fund
Schedule of portfolio investments, continued
December 31, 2009
| SHARES | VALUE | |||||||
| COMMON STOCKS—96.7%, continued | ||||||||
| DIVERSIFIED FINANCIAL SERVICES—3.3% | ||||||||
| JPMorgan Chase & Co. | 117,400 | $ | 4,892,058 | |||||
| Moody's Corp. | 54,800 | 1,468,640 | ||||||
| 6,360,698 | ||||||||
| ELECTRICAL EQUIPMENT—0.4% | ||||||||
| ABB Ltd.- ADR (Switzerland)(a) | 43,940 | 839,254 | ||||||
| ENERGY EQUIPMENT & SERVICES—0.9% | ||||||||
| Transocean Ltd. (Switzerland)(a) | 20,055 | 1,660,554 | ||||||
| FOOD & STAPLES RETAILING—9.9% | ||||||||
| Costco Wholesale Corp. | 244,400 | 14,461,148 | ||||||
| CVS Caremark Corp. | 151,122 | 4,867,640 | ||||||
| 19,328,788 | ||||||||
| FOOD PRODUCTS—0.2% | ||||||||
| Hershey Co. | 12,500 | 447,375 | ||||||
| HEALTH CARE EQUIPMENT & SUPPLIES—1.2% | ||||||||
| Becton Dickinson and Co. | 23,600 | 1,861,096 | ||||||
| CareFusion Corp. (a) | 19,465 | 486,820 | ||||||
| 2,347,916 | ||||||||
| HEALTH CARE PROVIDERS & SERVICES—2.3% | ||||||||
| Cardinal Health, Inc. | 38,930 | 1,255,103 | ||||||
| Express Scripts, Inc. (a) | 29,800 | 2,576,210 | ||||||
| Laboratory Corp of America Holdings (a) | 6,900 | 516,396 | ||||||
| UnitedHealth Group, Inc. | 5,700 | 173,736 | ||||||
| 4,521,445 | ||||||||
| HOUSEHOLD DURABLES—0.2% | ||||||||
| Hunter Douglas NV (Netherlands) | 8,300 | 404,905 | ||||||
| HOUSEHOLD PRODUCTS—4.1% | ||||||||
| Procter & Gamble Co. | 133,200 | 8,075,916 | ||||||
| INDEPENDENT POWER PRODUCERS & ENERGY TRADERS—0.2% | ||||||||
| AES Corp. (a) | 31,600 | 420,596 | ||||||
| INDUSTRIAL CONGLOMERATES—0.8% | ||||||||
| Tyco International Ltd. (Bermuda) | 43,890 | 1,565,995 | ||||||
| INSURANCE—11.1% | ||||||||
| Berkshire Hathaway, Inc., Class A (a) | 90 | 8,928,000 | ||||||
| Hartford Financial Services Group, Inc. | 36,600 | 851,316 | ||||||
| Loews Corp. | 138,300 | 5,027,205 | ||||||
23
MMA Praxis Core Stock Fund
Schedule of portfolio investments, continued
December 31, 2009
| SHARES | VALUE | |||||||
| COMMON STOCKS—96.7%, continued | ||||||||
| INSURANCE—11.1%, continued) | ||||||||
| Markel Corp. (a) | 525 | $ | 178,500 | |||||
| Principal Financial Group, Inc. | 15,900 | 382,236 | ||||||
| Progressive Corp. (a) | 239,300 | 4,305,007 | ||||||
| Transatlantic Holdings, Inc. | 37,743 | 1,966,788 | ||||||
| 21,639,052 | ||||||||
| INTERNET & CATALOG RETAIL—0.7% | ||||||||
| Amazon.com, Inc. (a) | 6,720 | 903,974 | ||||||
| Liberty Media Corp. - Interactive, Series A (a) | 41,375 | 448,505 | ||||||
| 1,352,479 | ||||||||
| INTERNET SOFTWARE & SERVICES—4.3% | ||||||||
| Google, Inc., Class A (a) | 13,460 | 8,344,931 | ||||||
| IT SERVICES—0.3% | ||||||||
| Visa, Inc., Class A | 6,970 | 609,596 | ||||||
| MACHINERY—0.2% | ||||||||
| PACCAR, Inc. | 12,810 | 464,619 | ||||||
| MARINE—1.0% | ||||||||
| China Shipping Development Co. Ltd., Class H (China) | 472,000 | 709,820 | ||||||
| Kuehne + Nagel International AG (Switzerland) | 12,000 | 1,165,837 | ||||||
| 1,875,657 | ||||||||
| MEDIA—4.1% | ||||||||
| Comcast Corp. - Special, Class A | 77,250 | 1,236,772 | ||||||
| DIRECTV, Class A (a) | 33,445 | 1,115,391 | ||||||
| Grupo Televisa SA- ADR (Mexico) | 43,600 | 905,136 | ||||||
| Liberty Media Corp. - Starz, Series A (a) | 3,344 | 154,326 | ||||||
| News Corp., Class A | 208,600 | 2,855,734 | ||||||
| Walt Disney Co. | 52,600 | 1,696,350 | ||||||
| 7,963,709 | ||||||||
| METALS & MINING—1.0% | ||||||||
| BHP Billiton plc (United Kingdom) | 32,000 | 1,031,143 | ||||||
| Rio Tinto plc (United Kingdom) | 17,400 | 952,742 | ||||||
| 1,983,885 | ||||||||
| OIL, GAS & CONSUMABLE FUELS—10.2% | ||||||||
| Canadian Natural Resources Ltd. (Canada) | 66,900 | 4,813,455 | ||||||
| ConocoPhillips | 13,750 | 702,212 | ||||||
| Devon Energy Corp. | 86,700 | 6,372,450 | ||||||
| EOG Resources, Inc. | 71,800 | 6,986,140 | ||||||
| OGX Petroleo e Gas Participacoes SA (Brazil) | 110,000 | 1,080,414 | ||||||
| 19,954,671 | ||||||||
24
MMA Praxis Core Stock Fund
Schedule of portfolio investments, continued
December 31, 2009
| SHARES | VALUE | |||||||
| COMMON STOCKS—96.7%, continued | ||||||||
| PAPER & FOREST PRODUCTS—1.1% | ||||||||
| Sino-Forest Corp.- ADR (Canada)(a)(b) | 3,400 | $ | 63,004 | |||||
| Sino-Forest Corp., Class A (Canada)(a) | 113,860 | 2,109,869 | ||||||
| 2,172,873 | ||||||||
| PERSONAL PRODUCTS—0.1% | ||||||||
| Natura Cosmeticos SA (Brazil) | 12,200 | 254,441 | ||||||
| PHARMACEUTICALS—6.4% | ||||||||
| Johnson & Johnson | 66,100 | 4,257,501 | ||||||
| Merck & Co., Inc. | 223,916 | 8,181,891 | ||||||
| 12,439,392 | ||||||||
| REAL ESTATE MANAGEMENT & DEVELOPMENT—1.3% | ||||||||
| Brookfield Asset Management, Inc., Class A (Canada) | 43,600 | 967,048 | ||||||
| Hang Lung Group Ltd. (Hong Kong) | 313,000 | 1,560,277 | ||||||
| 2,527,325 | ||||||||
| SEMICONDUCTORS & SEMICONDUCTOR EQUIPMENT—1.6% | ||||||||
| Texas Instruments, Inc. | 115,800 | 3,017,748 | ||||||
| SOFTWARE—2.6% | ||||||||
| Activision Blizzard, Inc. (a) | 81,500 | 905,465 | ||||||
| Microsoft Corp. | 135,600 | 4,134,444 | ||||||
| 5,039,909 | ||||||||
| SPECIALTY RETAIL—2.1% | ||||||||
| Bed Bath & Beyond, Inc. (a) | 63,500 | 2,453,005 | ||||||
| CarMax, Inc. (a) | 63,900 | 1,549,575 | ||||||
| 4,002,580 | ||||||||
| TRANSPORTATION INFRASTRUCTURE—1.3% | ||||||||
| China Merchants Holdings International Co. Ltd. (Hong Kong) | 636,175 | 2,071,790 | ||||||
| COSCO Pacific Ltd. (Bermuda) | 413,041 | 528,994 | ||||||
| 2,600,784 | ||||||||
| TOTAL COMMON STOCKS | 188,423,653 | |||||||
| COMMERCIAL PAPER—3.9% | ||||||||
| Three Pillars Funding Corp., 0.30%, 1/04/10(b) | 7,575,000 | 7,574,748 | ||||||
| CORPORATE BOND—0.6% | ||||||||
| AUTOMOBILES—0.6% | ||||||||
| Harley-Davidson, Inc., 15.00, 2/01/14(c) | 1,000,000 | 1,224,015 | ||||||
25
MMA Praxis Core Stock Fund
Schedule of portfolio investments, continued
December 31, 2009
| PRINCIPAL | ||||||||
| AMOUNT/ | ||||||||
| SHARES | VALUE | |||||||
| CORPORATE NOTES—1.5% | ||||||||
| DEVELOPMENT AUTHORITIES—1.5% | ||||||||
| MMA Community Development Investment, Inc., 1.10%, 12/31/11(d)+ | 1,016,000 | $ | 1,016,000 | |||||
| MMA Community Development Investment, Inc., 0.73%, 12/31/12(d)+ | 903,000 | 903,000 | ||||||
| MMA Community Development Investment, Inc., 1.10%, 12/31/13(d)+ | 1,016,000 | 1,016,000 | ||||||
| TOTAL CORPORATE NOTES | 2,935,000 | |||||||
| TOTAL INVESTMENTS (Cost* $189,916,692)—102.7% | $ | 200,157,416 | ||||||
| Net other assets (liabilities) — (2.7)% | (5,260,318 | |||||||
| NET ASSETS—100% | $ | 194,897,098 | ||||||
| + | Variable rate security. Rates presented are the rates in effect at December 31, 2009. |
| (a) | Non-income producing securities. |
| (b) | 144a security is restricted as to resale to institutional investors. These securities were deemed liquid under guidelines established by the Board of Trustees. At December 31, 2009, these securities were valued at $7,637,752 or 3.9% of net assets. |
| (c) | Security is illiquid. At December 31, 2009, these securities amounted to $1,224,015 or 0.62% of net assets. |
| (d) | Represents affiliated restricted security as to resale to shareholders and is not registered under the Securities Act of 1933. These securities have been deemed illiquid under guidelines established by the Board of Trustees: |
| Acquisition | |||
| Security | Yield | Shares | Date |
| MMA Community Development Investment, Inc. | 0.73% | 903,000 | 12/2009 |
| MMA Community Development Investment, Inc. | 1.10% | 1,016,000 | 12/2009 |
| MMA Community Development Investment, Inc. | 1.10% | 1,016,000 | 12/2009 |
At December 31, 2009, these securities had an aggregate market value of $2,935,000, representing 1.5% of net assets.
| * | Represents cost for financial reporting purposes. |
ADR – American Depositary Receipt.
plc – Public Liability Company.
Other Information:
The inputs or methodology used for valuing securities may not be an indication of the risk associated with investing in those securities. For more information on valuation inputs, and their aggregation into the levels used in the table below, please refer to the Security Valuation section in the accompanying Notes to Financial Statements.
| Valuation Inputs at Reporting Date: | ||||||||||||||||
| Description | Level 1 | Level 2 | Level 3 | Total | ||||||||||||
| Investments at Value | ||||||||||||||||
| Common Stocks | $ | 188,423,653 | $ | — | $ | — | $ | 188,423,653 | ||||||||
| Commercial Paper | — | 7,574,748 | — | 7,574,748 | ||||||||||||
| Corporate Notes | — | — | 2,935,000 | 2,935,000 | ||||||||||||
| Corporate Bond | — | 1,224,015 | — | 1,224,015 | ||||||||||||
| Total Investments | $ | 188,423,653 | $ | 8,798,763 | $ | 2,935,000 | $ | 200,157,416 | ||||||||
Following is a reconciliation of Level 3 assets for which significant unobservable inputs for Investments in Securities were used to determine fair value for each Fund:
Core Stock Fund | ||||
| Balance as of December 31, 2008 | $ | 2,935,000 | ||
| Proceeds from Sales | (2,935,000 | ) | ||
| Purchases | 2,935,000 | |||
| Balance as of December 31, 2009 | $ | 2,935,000 | ||
See accompanying notes to financial statements.
26
| MMA Praxis Value Index Fund |
MMA Praxis Value Index Fund
Annual report to shareholders
Portfolio manager’s letter
The 26.47 percent return of the Standard & Poor’s 500 Index for 2009 will appear to be one of the better return years for the index when viewed in the fullness of history. But even this impressive return masks the 67.8 percent surge in equity prices that began on March 9 and continued unabated through the end of the year. A massive federal stimulus and the gradual realization that their worst fears were unfounded, led investors to bid stock prices higher in anticipation of a future economic recovery.
Early in the rally, the stocks that had fallen the hardest during the great credit crisis of 2008 had the highest returns. But as the year progressed, the benefits of a recovering economy and improving investor sentiment led to a widespread appreciation in prices. Still, the general level of equity prices remains well below market highs reached in late 2007.
The value style of investing trailed the growth style during the year. Still, the Fund’s A shares (NAV) returned 22.64 percent versus 19.54 percent for its benchmark, the MSCI Prime Market Value Index during the period. The Fund’s outperformance is primarily a result of its overweight to the financial industry that results from tighter screens on other sectors. The financial sector, whose returns lagged significantly in 2008, rebounded with gusto during the rally. The Fund’s positions in major banks, financial services companies, and corresponding underweight positions in major oil companies contributed to its outperformance.
Chad Horning, CFA®
MMA Praxis Value Index Fund Manager
27
Performance review |
MMA Praxis Value Index Fund
Performance review
Average annual total returns as of 12/31/09

| Inception | Since | Expense Ratio** | |||||
| Date | 1 Year | 3 Year | 5 Year | Inception | Gross | Net | |
| Class A (No Load) | 5/1/01 | 22.64% | -11.84% | -2.62% | -1.47% | 1.27% | 1.27% |
| Class A* | 5/1/01 | 16.23% | -13.41% | -3.66% | -2.08% | ||
| Class I | 5/1/06 | 22.82% | -11.63% | -2.45% | -1.44% | 0.64% | 0.64% |
Past performance does not guarantee future results. The performance data quoted represents past performance and current returns may be lower or higher. The investment return and principal value will fluctuate so that an investor's shares, when redeemed may be worth more or less than the original cost. These performance figures do not reflect the deduction of taxes that a shareholder would pay on fund distributions or the redemption of fund shares. To obtain performance information current to the most recent month end, please visit mmapraxis.com.
| * | Reflects maximum front-end sales charge of 5.25%. |
Class I Share of this Fund was not in existence prior to 5/1/06. Class I Share performance calculated for any period prior to 5/1/06 is based on the performance of Class B Share since inception of 5/1/01 and has been adjusted to reflect differences in sales charges and expenses between the classes. The Class B Shares were exchanged into Class A Shares on August 17, 2009.
The total return set forth reflects certain expenses that were contractually or voluntarily reduced, reimbursed or paid by third party. In such instances, and without this activity, total return would have been lower.
| ** | Reflects the expense ratios as reported in the Prospectus dated May 1, 2009. Voluntary fee waivers were in effect through December 31, 2009 for Class A and Class I. |
28
MMA Praxis Value Index Fund
Performance review
Growth of $10,000 investment 5/1/01 to 12/31/09
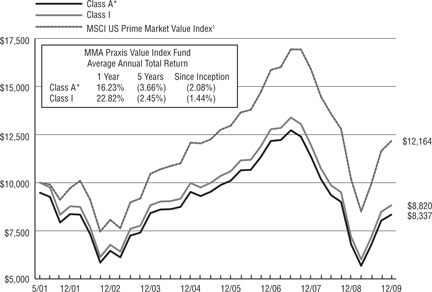
This chart represents historical performance of a hypothetical investment of $10,000 in the Value Index Fund from 5/1/01 to 12/31/09, and represents the reinvestment of dividends and capital gains in the Fund.
Past performance does not guarantee future results. The performance data quoted represents past performance and current returns may be lower or higher. The investment return and principal value will fluctuate so that an investor's shares, when redeemed may be worth more or less than the original cost. These performance figures do not reflect the deduction of taxes that a shareholder would pay on fund distributions or the redemption of fund shares. To obtain performance information current to the most recent month end, please visit mmapraxis.com.
The total return set forth reflects certain expenses that were contractually or voluntarily reduced, reimbursed or paid by third party. In such instances, and without this activity, total return would have been lower.
| * | Reflects maximum front-end sales charge of 5.25%. |
Class I Shares of this Fund were not in existence prior to 5/1/06. Class I Share performance calculated for any period prior to 5/1/06 is based on the performance of Class B Shares since inception of 5/1/01 and has been adjusted to reflect differences in sales charges and expenses between the classes. The Class B Shares were exchanged into Class A Shares on August 17, 2009.
| 1 | The MSCI US Prime Market Value Index represents the value companies of the MSCI US Prime Market 750 Index. (The MSCI US Prime Market 750 Index represents the universe of large and medium capitalization companies in the US equity market). The MSCI US Prime Market Value Index is a subset of the MSCI US Prime Market 750 Index. |
The above index is for illustrative purposes only and does not reflect the deduction of expenses associated with a mutual fund, such as investment management and fund accounting fees. The fund's performance reflects the deduction of these value-added services. An investor cannot invest directly in an index, although they can invest in its underlying securities.
29
| Schedule of portfolio investments |
MMA Praxis Value Index Fund
Schedule of portfolio investments
December 31, 2009
| SHARES | VALUE | |||||||
| COMMON STOCKS—99.0% | ||||||||
| AIR FREIGHT & LOGISTICS—0.4% | ||||||||
| FedEx Corp. | 1,671 | $ | 139,445 | |||||
| United Parcel Service, Inc., Class B | 2,391 | 137,172 | ||||||
| 276,617 | ||||||||
| AUTO COMPONENTS—0.1% | ||||||||
| Autoliv, Inc. | 1,556 | 67,468 | ||||||
| AUTOMOBILES—0.2% | ||||||||
| Harley-Davidson, Inc. | 4,258 | 107,302 | ||||||
| BEVERAGES—2.0% | ||||||||
| Coca-Cola Company | 20,438 | 1,164,966 | ||||||
| Pepsi Bottling Group, Inc. | 2,761 | 103,537 | ||||||
| 1,268,503 | ||||||||
| BUILDING PRODUCTS—0.1% | ||||||||
| Masco Corp. | 6,526 | 90,124 | ||||||
| CAPITAL MARKETS—4.7% | ||||||||
| Ameriprise Financial, Inc. | 4,047 | 157,104 | ||||||
| Bank of New York Mellon Corp. | 19,678 | 550,394 | ||||||
| Goldman Sachs Group, Inc. | 7,433 | 1,254,988 | ||||||
| Invesco Ltd. | 7,369 | 173,098 | ||||||
| Legg Mason, Inc. | 2,963 | 89,364 | ||||||
| Morgan Stanley | 18,821 | 557,102 | ||||||
| State Street Corp. | 2,832 | 123,305 | ||||||
| 2,905,355 | ||||||||
| CHEMICALS—1.9% | ||||||||
| Air Products & Chemicals, Inc. | 2,375 | 192,518 | ||||||
| CF Industries Holdings, Inc. | 637 | 57,827 | ||||||
| E.I. du Pont de Nemours & Co. | 14,712 | 495,353 | ||||||
| FMC Corp. | 861 | 48,009 | ||||||
| International Flavors & Fragrances, Inc. | 2,525 | 103,878 | ||||||
| Lubrizol Corp. | 1,243 | 90,677 | ||||||
| PPG Industries, Inc. | 3,113 | 182,235 | ||||||
| 1,170,497 | ||||||||
| COMMERCIAL BANKS—5.6% | ||||||||
| BB&T Corp. | 10,270 | 260,550 | ||||||
| Comerica, Inc. | 2,600 | 76,882 | ||||||
| Fifth Third Bancorp | 12,540 | 122,265 | ||||||
| First Horizon National Corp. (a) | 4,384 | 58,741 | ||||||
| Huntington Bancshares, Inc. | 10,533 | 38,445 | ||||||
| KeyCorp | 13,700 | 76,035 | ||||||
| M&T Bank Corp. | 1,320 | 88,295 | ||||||
| Marshall & Ilsley Corp. | 8,570 | 46,707 | ||||||
| PNC Financial Services Group, Inc. | 7,186 | 379,349 | ||||||
30
MMA Praxis Value Index Fund
Schedule of portfolio investments, continued
December 31, 2009
| SHARES | VALUE | |||||||
| COMMON STOCKS—99.0%, continued | ||||||||
| COMMERCIAL BANKS—5.6%, continued | ||||||||
| Regions Financial Corp. | 14,128 | $ | 74,737 | |||||
| SunTrust Banks, Inc. | 5,395 | 109,465 | ||||||
| U.S. Bancorp | 10,771 | 242,455 | ||||||
| Wells Fargo & Co. | 68,551 | 1,850,191 | ||||||
| Zions Bancorp. | 2,894 | 37,130 | ||||||
| 3,461,247 | ||||||||
| COMMERCIAL SERVICES & SUPPLIES—0.3% | ||||||||
| Avery Dennison Corp. | 2,490 | 90,860 | ||||||
| R.R. Donnelley & Sons Co. | 3,672 | 81,776 | ||||||
| 172,636 | ||||||||
| COMMUNICATIONS EQUIPMENT—0.1% | ||||||||
| Tellabs, Inc. (a) | 9,507 | 54,000 | ||||||
| COMPUTERS & PERIPHERALS—0.2% | ||||||||
| Seagate Technology | 7,615 | 138,517 | ||||||
| CONSTRUCTION MATERIALS—0.2% | ||||||||
| Vulcan Materials Co. | 2,061 | 108,553 | ||||||
| CONSUMER FINANCE—0.4% | ||||||||
| Discover Financial Services | 8,744 | 128,624 | ||||||
| SLM Corp. (a) | 9,031 | 101,780 | ||||||
| 230,404 | ||||||||
| CONTAINERS & PACKAGING—0.2% | ||||||||
| Owens-Illinois, Inc. (a) | 3,063 | 100,681 | ||||||
| DISTRIBUTORS—0.2% | ||||||||
| Genuine Parts Co. | 3,890 | 147,664 | ||||||
| DIVERSIFIED CONSUMER SERVICES—0.2% | ||||||||
| H&R Block, Inc. | 4,703 | 106,382 | ||||||
| DIVERSIFIED FINANCIAL SERVICES—8.5% | ||||||||
| Bank of America Corp. | 132,569 | 1,996,489 | ||||||
| Citigroup, Inc. | 161,214 | 533,618 | ||||||
| JPMorgan Chase & Co. | 60,336 | 2,514,201 | ||||||
| Leucadia National Corp. (a) | 3,630 | 86,358 | ||||||
| NYSE Euronext | 4,404 | 111,421 | ||||||
| 5,242,087 | ||||||||
| DIVERSIFIED TELECOMMUNICATION SERVICES—7.4% | ||||||||
| AT&T, Inc. | 92,150 | 2,582,965 | ||||||
| CenturyTel, Inc. | 6,311 | 228,521 | ||||||
| Qwest Communications International, Inc. | 29,266 | 123,210 | ||||||
31
MMA Praxis Value Index Fund
Schedule of portfolio investments, continued
December 31, 2009
| SHARES | VALUE | |||||||
| COMMON STOCKS—99.0%, continued | ||||||||
| DIVERSIFIED TELECOMMUNICATION SERVICES—7.4%, continued | ||||||||
| Verizon Communications, Inc. | 46,033 | $ | 1,525,073 | |||||
| Windstream Corp. | 12,182 | 133,880 | ||||||
| 4,593,649 | ||||||||
| ELECTRIC UTILITIES—1.1% | ||||||||
| FPL Group, Inc. | 6,950 | 367,099 | ||||||
| Northeast Utilities | 4,607 | 118,815 | ||||||
| Pepco Holdings, Inc. | 5,850 | 98,572 | ||||||
| Pinnacle West Capital Corp. | 2,837 | 103,777 | ||||||
| 688,263 | ||||||||
| ELECTRICAL EQUIPMENT—1.2% | ||||||||
| Cooper Industries plc, Class A | 2,745 | 117,047 | ||||||
| Emerson Electric Co. | 11,549 | 491,988 | ||||||
| Rockwell Automation, Inc. | 2,683 | 126,047 | ||||||
| 735,082 | ||||||||
| ELECTRONIC EQUIPMENT, INSTRUMENTS & COMPONENTS—0.3% | ||||||||
| Arrow Electronics, Inc. (a) | 2,680 | 79,355 | ||||||
| Corning, Inc. | 3,235 | 62,468 | ||||||
| Flextronics International Ltd. (a) | 9,429 | 68,926 | ||||||
| 210,749 | ||||||||
| ENERGY EQUIPMENT & SERVICES—1.2% | ||||||||
| ENSCO International plc- ADR | 1,066 | 42,576 | ||||||
| Nabors Industries Ltd. (a) | 3,702 | 81,037 | ||||||
| Noble Corp. | 1,629 | 66,300 | ||||||
| Patterson-UTI Energy, Inc. | 2,566 | 39,388 | ||||||
| Pride International, Inc. (a) | 3,089 | 98,570 | ||||||
| Transocean Ltd. (a) | 4,852 | 401,746 | ||||||
| 729,617 | ||||||||
| FOOD & STAPLES RETAILING—1.3% | ||||||||
| CVS Caremark Corp. | 5,927 | 190,909 | ||||||
| Kroger Co. | 9,493 | 194,891 | ||||||
| Safeway, Inc. | 8,190 | 174,365 | ||||||
| SUPERVALU, Inc. | 4,544 | 57,754 | ||||||
| Sysco Corp. | 7,786 | 217,541 | ||||||
| 835,460 | ||||||||
| FOOD PRODUCTS—2.8% | ||||||||
| ConAgra Foods, Inc. | 8,880 | 204,684 | ||||||
| General Mills, Inc. | 2,982 | 211,155 | ||||||
| H.J. Heinz Co. | 5,196 | 222,181 | ||||||
| Hormel Foods Corp. | 2,640 | 101,508 | ||||||
| Kraft Foods, Inc., Class A | 25,161 | 683,876 | ||||||
| McCormick & Co., Inc./MD | 4,389 | 158,575 | ||||||
| Sara Lee Corp. | 13,500 | 164,430 | ||||||
| 1,746,409 | ||||||||
32
MMA Praxis Value Index Fund
Schedule of portfolio investments, continued
December 31, 2009
| SHARES | VALUE | |||||||
| COMMON STOCKS—99.0%, continued | ||||||||
| GAS UTILITIES—0.4% | ||||||||
| National Fuel Gas Co. | 1,408 | $ | 70,400 | |||||
| Oneok, Inc. | 1,960 | 87,357 | ||||||
| Questar Corp. | 1,495 | 62,147 | ||||||
| 219,904 | ||||||||
| HEALTH CARE EQUIPMENT & SUPPLIES—1.0% | ||||||||
| Boston Scientific Corp. (a) | 23,812 | 214,308 | ||||||
| CareFusion Corp. (a) | 3,250 | 81,282 | ||||||
| Covidien plc | 7,347 | 351,848 | ||||||
| 647,438 | ||||||||
| HEALTH CARE PROVIDERS & SERVICES—3.1% | ||||||||
| Aetna, Inc. | 6,164 | 195,399 | ||||||
| AmerisourceBergen Corp. | 7,408 | 193,126 | ||||||
| Cardinal Health, Inc. | 6,500 | 209,560 | ||||||
| CIGNA Corp. | 4,545 | 160,302 | ||||||
| Coventry Health Care, Inc. (a) | 2,032 | 49,357 | ||||||
| Humana, Inc. (a) | 2,757 | 121,005 | ||||||
| Omnicare, Inc. | 3,854 | 93,190 | ||||||
| UnitedHealth Group, Inc. | 16,452 | 501,457 | ||||||
| WellPoint, Inc. (a) | 6,827 | 397,946 | ||||||
| 1,921,342 | ||||||||
| HOTELS, RESTAURANTS & LEISURE—0.8% | ||||||||
| Carnival Corp. (a) | 6,173 | 195,622 | ||||||
| Darden Restaurants, Inc. | 1,878 | 65,862 | ||||||
| Royal Caribbean Cruises Ltd. (a) | 2,635 | 66,613 | ||||||
| Starwood Hotels & Resorts Worldwide, Inc. | 3,392 | 124,045 | ||||||
| Wyndham Worldwide Corp. | 3,152 | 63,576 | ||||||
| 515,718 | ||||||||
| HOUSEHOLD DURABLES—0.7% | ||||||||
| Black & Decker Corp. | 940 | 60,940 | ||||||
| D.R. Horton, Inc. | 3,894 | 42,328 | ||||||
| Leggett & Platt, Inc. | 3,470 | 70,788 | ||||||
| Lennar Corp., Class A | 2,711 | 34,619 | ||||||
| Mohawk Industries, Inc. (a) | 1,561 | 74,304 | ||||||
| Newell Rubbermaid, Inc. | 4,750 | 71,297 | ||||||
| Whirlpool Corp. | 1,307 | 105,423 | ||||||
| 459,699 | ||||||||
| HOUSEHOLD PRODUCTS—4.9% | ||||||||
| Kimberly-Clark Corp. | 5,721 | 364,485 | ||||||
| Procter & Gamble Co. | 43,566 | 2,641,406 | ||||||
| 3,005,891 | ||||||||
| INDEPENDENT POWER PRODUCERS & ENERGY TRADERS—0.2% | ||||||||
| NRG Energy, Inc. (a) | 4,298 | 101,476 | ||||||
33
MMA Praxis Value Index Fund
Schedule of portfolio investments, continued
December 31, 2009
| SHARES | VALUE | |||||||
| COMMON STOCKS—99.0%, continued | ||||||||
| INDUSTRIAL CONGLOMERATES—1.8% | ||||||||
| 3M Co. | 10,245 | $ | 846,954 | |||||
| Tyco International Ltd. (a) | 7,001 | 249,796 | ||||||
| 1,096,750 | ||||||||
| INSURANCE—8.2% | ||||||||
| ACE Ltd. (a) | 6,000 | 302,400 | ||||||
| AFLAC, Inc. | 7,219 | 333,879 | ||||||
| Allstate Corp. | 8,579 | 257,713 | ||||||
| American International Group, Inc. (a) | 1,224 | 36,696 | ||||||
| AON Corp. | 5,090 | 195,151 | ||||||
| Assurant, Inc. | 2,690 | 79,301 | ||||||
| Axis Capital Holdings Ltd. | 3,286 | 93,355 | ||||||
| Chubb Corp. | 6,780 | 333,440 | ||||||
| Cincinnati Financial Corp. | 3,180 | 83,443 | ||||||
| Everest Re Group Ltd. | 1,400 | 119,952 | ||||||
| Fidelity National Financial, Inc., Class A | 3,675 | 49,466 | ||||||
| First American Corp. | 1,690 | 55,956 | ||||||
| Genworth Financial, Inc., Class A (a) | 7,019 | 79,666 | ||||||
| Hartford Financial Services Group, Inc. | 5,940 | 138,164 | ||||||
| Lincoln National Corp. | 4,865 | 121,041 | ||||||
| Loews Corp. | 5,904 | 214,610 | ||||||
| Markel Corp. (a) | 219 | 74,460 | ||||||
| Marsh & McLennan Cos., Inc. | 10,960 | 241,997 | ||||||
| MetLife, Inc. | 12,642 | 446,895 | ||||||
| Principal Financial Group, Inc. | 4,754 | 114,286 | ||||||
| Progressive Corp. (a) | 10,391 | 186,934 | ||||||
| Prudential Financial, Inc. | 7,239 | 360,213 | ||||||
| RenaissanceRe Holdings Ltd. | 1,607 | 85,412 | ||||||
| Torchmark Corp. | 1,879 | 82,582 | ||||||
| Transatlantic Holdings, Inc. | 1,150 | 59,926 | ||||||
| Travelers Cos., Inc. | 10,510 | 524,029 | ||||||
| Unum Group | 6,228 | 121,571 | ||||||
| White Mountains Insurance Group Ltd. | 230 | 76,512 | ||||||
| Willis Group Holdings Ltd. | 3,790 | 99,980 | ||||||
| XL Capital Ltd., Class A | 5,413 | 99,220 | ||||||
| 5,068,250 | ||||||||
| INTERNET & CATALOG RETAIL—0.2% | ||||||||
| Liberty Media Corp. - Interactive, Series A (a) | 9,570 | 103,739 | ||||||
| INTERNET SOFTWARE & SERVICES—0.1% | ||||||||
| AOL, Inc. (a) | 1,732 | 40,321 | ||||||
| IT SERVICES—0.1% | ||||||||
| Fidelity National Information Services, Inc. | 3,883 | 91,018 | ||||||
34
MMA Praxis Value Index Fund
Schedule of portfolio investments, continued
December 31, 2009
| SHARES | VALUE | |||||||
| COMMON STOCKS—99.0%, continued | ||||||||
| LEISURE EQUIPMENT & PRODUCTS—0.4% | ||||||||
| Hasbro, Inc. | 2,627 | $ | 84,222 | |||||
| Mattel, Inc. | 7,526 | 150,369 | ||||||
| 234,591 | ||||||||
| LIFE SCIENCES TOOLS & SERVICES—0.5% | ||||||||
| Thermo Fisher Scientific, Inc. (a) | 6,447 | 307,457 | ||||||
| MACHINERY—1.6% | ||||||||
| Cummins, Inc. | 1,889 | 86,629 | ||||||
| Deere & Co. | 3,896 | 210,735 | ||||||
| Harsco Corp. | 1,722 | 55,500 | ||||||
| Illinois Tool Works, Inc. | 7,133 | 342,313 | ||||||
| Ingersoll-Rand plc, Series A | 5,381 | 192,317 | ||||||
| Stanley Works | 1,943 | 100,084 | ||||||
| 987,578 | ||||||||
| MEDIA—5.8% | ||||||||
| CBS Corp., Class B | 9,908 | 139,207 | ||||||
| Comcast Corp. - Special, Class A | 10,744 | 172,011 | ||||||
| Comcast Corp., Class A | 27,988 | 471,878 | ||||||
| DIRECTV, Class A (a) | 8,937 | 298,049 | ||||||
| DISH Network Corp., Class A | 2,810 | 58,364 | ||||||
| Liberty Media Corp. - Starz, Series A (a) | 893 | 41,212 | ||||||
| News Corp., Class A | 28,849 | 394,943 | ||||||
| News Corp., Class B | 5,034 | 80,141 | ||||||
| Time Warner Cable, Inc. | 5,779 | 239,193 | ||||||
| Time Warner, Inc. | 19,062 | 555,467 | ||||||
| Viacom, Inc., Class B (a) | 4,904 | 145,796 | ||||||
| Virgin Media, Inc. | 1,867 | 31,421 | ||||||
| Walt Disney Co. | 28,044 | 904,419 | ||||||
| Washington Post Co., Class B | 142 | 62,423 | ||||||
| 3,594,524 | ||||||||
| METALS & MINING—0.8% | ||||||||
| Allegheny Technologies, Inc. | 899 | 40,248 | ||||||
| Cliffs Natural Resources, Inc. | 2,030 | 93,563 | ||||||
| Commercial Metals Co. | 1,468 | 22,974 | ||||||
| Nucor Corp. | 5,832 | 272,063 | ||||||
| Steel Dynamics, Inc. | 2,106 | 37,318 | ||||||
| 466,166 | ||||||||
| MULTILINE RETAIL—0.4% | ||||||||
| J.C. Penney Co., Inc. | 2,298 | 61,150 | ||||||
| Macy's, Inc. | 7,382 | 123,722 | ||||||
| Sears Holdings Corp. (a) | 880 | 73,436 | ||||||
| 258,308 | ||||||||
35
MMA Praxis Value Index Fund
Schedule of portfolio investments, continued
December 31, 2009
| SHARES | VALUE | |||||||
| COMMON STOCKS—99.0%, continued | ||||||||
| MULTI-UTILITIES—1.8% | ||||||||
| Alliant Energy Corp. | 3,470 | $ | 105,002 | |||||
| CenterPoint Energy, Inc. | 8,343 | 121,057 | ||||||
| Consolidated Edison, Inc. | 5,600 | 254,408 | ||||||
| DTE Energy Co. | 2,550 | 111,155 | ||||||
| MDU Resources Group, Inc. | 3,469 | 81,868 | ||||||
| NiSource, Inc. | 7,150 | 109,967 | ||||||
| PG&E Corp. | 6,970 | 311,211 | ||||||
| 1,094,668 | ||||||||
| OFFICE ELECTRONICS—0.2% | ||||||||
| Xerox Corp. | 16,880 | 142,805 | ||||||
| OIL, GAS & CONSUMABLE FUELS—7.1% | ||||||||
| Apache Corp. | 5,239 | 540,508 | ||||||
| Arch Coal, Inc. | 2,100 | 46,725 | ||||||
| Cabot Oil & Gas Corp. | 1,057 | 46,075 | ||||||
| Chesapeake Energy Corp. | 9,842 | 254,711 | ||||||
| Cimarex Energy Co. | 1,489 | 78,872 | ||||||
| ConocoPhillips | 22,203 | 1,133,907 | ||||||
| Devon Energy Corp. | 6,765 | 497,228 | ||||||
| El Paso Corp. | 12,590 | 123,760 | ||||||
| Forest Oil Corp. (a) | 1,309 | 29,125 | ||||||
| Hess Corp. | 1,933 | 116,947 | ||||||
| Marathon Oil Corp. | 10,627 | 331,775 | ||||||
| Murphy Oil Corp. | 1,286 | 69,701 | ||||||
| Newfield Exploration Co. (a) | 2,306 | 111,218 | ||||||
| Pioneer Natural Resources Co. | 2,029 | 97,737 | ||||||
| Spectra Energy Corp. | 11,393 | 233,670 | ||||||
| Sunoco, Inc. | 2,362 | 61,648 | ||||||
| Valero Energy Corp. | 9,260 | 155,105 | ||||||
| Williams Cos., Inc. | 9,524 | 200,766 | ||||||
| XTO Energy, Inc. | 5,304 | 246,795 | ||||||
| 4,376,273 | ||||||||
| PAPER & FOREST PRODUCTS—0.3% | ||||||||
| International Paper Co. | 3,535 | 94,667 | ||||||
| MeadWestvaco Corp. | 3,362 | 96,254 | ||||||
| 190,921 | ||||||||
| PHARMACEUTICALS—7.6% | ||||||||
| Bristol-Myers Squibb Co. | 29,040 | 733,260 | ||||||
| Eli Lilly & Co. | 17,460 | 623,496 | ||||||
| Forest Laboratories, Inc. (a) | 4,341 | 139,389 | ||||||
| Johnson & Johnson | 22,326 | 1,438,018 | ||||||
| King Pharmaceuticals, Inc. (a) | 7,944 | 97,473 | ||||||
| Merck & Co., Inc. | 45,068 | 1,646,785 | ||||||
| 4,678,421 | ||||||||
36
MMA Praxis Value Index Fund
Schedule of portfolio investments, continued
December 31, 2009
| SHARES | VALUE | |||||||
| COMMON STOCKS—99.0%, continued | ||||||||
| PROFESSIONAL SERVICES—0.1% | ||||||||
| Manpower, Inc. | 1,125 | $ | 61,402 | |||||
| REAL ESTATE INVESTMENT TRUSTS (REITS)—3.3% | ||||||||
| AMB Property Corp. REIT | 2,750 | 70,263 | ||||||
| Annaly Capital Management, Inc. REIT | 9,607 | 166,681 | ||||||
| AvalonBay Communities, Inc. REIT | 1,702 | 139,751 | ||||||
| Boston Properties, Inc. REIT | 2,165 | 145,207 | ||||||
| Duke Realty Corp. REIT | 4,136 | 50,335 | ||||||
| Equity Residential REIT | 4,980 | 168,224 | ||||||
| Federal Realty Investment Trust REIT | 1,074 | 72,731 | ||||||
| HCP, Inc. REIT | 4,495 | 137,277 | ||||||
| Host Hotels & Resorts, Inc. REIT (a) | 178 | 2,077 | ||||||
| Kimco Realty Corp. REIT | 6,550 | 88,622 | ||||||
| Liberty Property Trust REIT | 2,156 | 69,014 | ||||||
| Macerich Co. REIT | 1,401 | 50,368 | ||||||
| Plum Creek Timber Co., Inc. REIT | 3,320 | 125,363 | ||||||
| ProLogis REIT | 6,068 | 83,071 | ||||||
| Regency Centers Corp. REIT | 1,634 | 57,288 | ||||||
| Simon Property Group, Inc. REIT | 3,110 | 248,165 | ||||||
| UDR, Inc. REIT | 3,642 | 59,875 | ||||||
| Ventas, Inc. REIT | 1,895 | 82,887 | ||||||
| Vornado Realty Trust REIT | 2,580 | 180,452 | ||||||
| Weingarten Realty Investors REIT | 2,084 | 41,242 | ||||||
| 2,038,893 | ||||||||
| ROAD & RAIL—1.9% | ||||||||
| Burlington Northern Santa Fe Corp. | 5,298 | 522,489 | ||||||
| CSX Corp. | 6,245 | 302,820 | ||||||
| Norfolk Southern Corp. | 6,374 | 334,125 | ||||||
| 1,159,434 | ||||||||
| SEMICONDUCTORS & SEMICONDUCTOR EQUIPMENT—2.7% | ||||||||
| Analog Devices, Inc. | 3,097 | 97,803 | ||||||
| Intel Corp. | 56,941 | 1,161,596 | ||||||
| Intersil Corp., Class A | 3,100 | 47,554 | ||||||
| Micron Technology, Inc. (a) | 5,185 | 54,754 | ||||||
| Texas Instruments, Inc. | 5,664 | 147,604 | ||||||
| Xilinx, Inc. | 6,467 | 162,063 | ||||||
| 1,671,374 | ||||||||
| SPECIALTY RETAIL—1.6% | ||||||||
| Abercrombie & Fitch Co., Class A | 1,579 | 55,028 | ||||||
| Foot Locker, Inc. | 3,454 | 38,478 | ||||||
| Gap, Inc. | 4,895 | 102,550 | ||||||
| Home Depot, Inc. | 23,385 | 676,528 | ||||||
| Limited Brands, Inc. | 5,255 | 101,106 | ||||||
| 973,690 | ||||||||
37
MMA Praxis Value Index Fund
Schedule of portfolio investments, continued
December 31, 2009
| PRINCIPAL | ||||||||
AMOUNT/ | ||||||||
| SHARES | VALUE | |||||||
| COMMON STOCKS—99.0%, continued | ||||||||
| TEXTILES, APPAREL & LUXURY GOODS—0.2% | ||||||||
| VF Corp. | 1,870 | $ | 136,959 | |||||
| THRIFTS & MORTGAGE FINANCE—0.3% | ||||||||
| Hudson City Bancorp, Inc. | 7,200 | 98,856 | ||||||
| People's United Financial, Inc. | 6,864 | 114,629 | ||||||
| 213,485 | ||||||||
| WIRELESS TELECOMMUNICATION SERVICES—0.3% | ||||||||
| Sprint Nextel Corp. (a) | 45,732 | 167,379 | ||||||
| Telephone & Data Systems, Inc. | 1,172 | 39,754 | ||||||
| 207,133 | ||||||||
| TOTAL COMMON STOCKS | 61,252,894 | |||||||
| CORPORATE NOTES—1.2% | ||||||||
| DEVELOPMENT AUTHORITIES—1.2% | ||||||||
| MMA Community Development Investment, Inc., 1.10%, 12/31/11(b)+ | 292,500 | 292,500 | ||||||
| MMA Community Development Investment, Inc., 0.73%, 12/31/12(b)+ | 175,000 | 175,000 | ||||||
| MMA Community Development Investment, Inc., 1.10%, 12/31/13(b)+ | 292,500 | 292,500 | ||||||
| TOTAL CORPORATE NOTES | 760,000 | |||||||
| TOTAL INVESTMENTS (Cost* $63,873,291)—100.2% | $ | 62,012,894 | ||||||
| Net other assets (liabilities) — (0.2%) | (129,808 | ) | ||||||
| NET ASSETS—100% | $ | 61,883,086 | ||||||
| + | Variable rate security. Rates presented are the rates in effect at December 31, 2009. |
| (a) | Non-income producing securities. |
| (b) | Represents affiliated restricted security as to resale to shareholders and is not registered under the Securities Act of 1933. These securities have been deemed illiquid under guidelines established by the Board of Trustees: |
| Acquisition | ||||||||||||
| Security | Yield | Shares | Date | |||||||||
| MMA Community Development Investment, Inc. | 0.73 | % | 175,000 | 12/2009 | ||||||||
| MMA Community Development Investment, Inc. | 1.10 | % | 292,500 | 12/2009 | ||||||||
| MMA Community Development Investment, Inc. | 1.10 | % | 292,500 | 12/2009 | ||||||||
At December 31, 2009, these securities had an aggregate market value of $760,000, representing 1.2% of net assets.
| * | Represents cost for financial reporting purposes. |
ADR – American Depositary Receipt.
plc – Public Liability Company.
REIT – Real Estate Investment Trust.
38
MMA Praxis Value Index Fund
Schedule of portfolio investments, continued
December 31, 2009
Other Information:
The inputs or methodology used for valuing securities may not be an indication of the risk associated with investing in those securities. For more information on valuation inputs, and their aggregation into the levels used in the table below, please refer to the Security Valuation section in the accompanying Notes to Financial Statements.
| Valuation Inputs at Reporting Date: | |||||||||||||||
| Description | Level 1 | Level 2 | Level 3 | Total | |||||||||||
| Investments at Value | |||||||||||||||
| Common Stocks | $ | 61,252,894 | $ | — | $ | — | $ | 61,252,894 | |||||||
| Corporate Notes | — | — | 760,000 | 760,000 | |||||||||||
| Total Investments | $ | 61,252,894 | $ | — | $ | 760,000 | $ | 62,012,894 | |||||||
Following is a reconciliation of Level 3 assets for which significant unobservable inputs for Investments in Securities were used to determine fair value for each Fund:
| Value Index Fund | ||||
| Balance as of December 31, 2008 | $ | 760,000 | ||
| Proceeds from Sales | (760,000 | ) | ||
| Purchases | 760,000 | |||
| Balance as of December 31, 2009 | $ | 760,000 | ||
See accompanying notes to financial statements.
39
| MMA Praxis Growth Index Fund |
MMA Praxis Growth Index Fund
Annual report to shareholders
Portfolio manager’s letter
The 26.47 percent return of the Standard & Poor’s 500 Index for 2009 will appear to be one of the better return years for the index when viewed in the fullness of history. But even this impressive return masks the 67.8 percent surge in equity prices that began on March 9 and continued unabated through the end of the year. A massive federal stimulus and the gradual realization that their worst fears were unfounded, led investors to bid stock prices higher in anticipation of a future economic recovery.
Early in the rally, the stocks that had fallen the hardest during the great credit crisis of 2008 had the highest returns. But as the year progressed, the benefits of a recovering economy and improving investor sentiment led to a widespread appreciation in prices. Still, the general level of equity prices remains well below market highs reached in late 2007.
The growth style of equity investing maintained the lead it had established in the first quarter, beating the value style for the year by a significant margin. The Fund’s A shares (NAV) rose 34.38 percent versus 36.52 percent for its benchmark, the MSCI Prime Market Growth Index. The Fund typically generates returns that closely follow the returns of the benchmark, but screens and resulting sector weights can have an impact. In this period, the minimal cash held by the portfolio was also a hindrance as the opportunity cost of not holding stocks was high.
Chad Horning, CFA®
MMA Praxis Value Index Fund Manager
40
| Performance review |
MMA Praxis Growth Index Fund
Performance review
Total returns as of 12/31/09
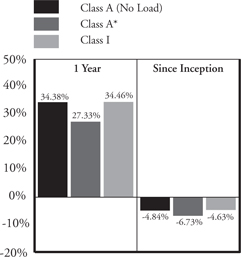
| Inception | Since | Expense Ratios** | |||
| Date | 1 Year | Inception | Gross | Net | |
| Class A (No Load) | 5/1/07 | 34.38% | -4.84% | 1.51% | 1.04% |
| Class A* | 5/1/07 | 27.33% | -6.73% | ||
| Class I | 5/1/07 | 34.46% | -4.63% | 0.73% | 0.73% |
Past performance does not guarantee future results. The performance data quoted represents past performance and current returns may be lower or higher. The investment return and principal value will fluctuate so that an investor's shares, when redeemed may be worth more or less than the original cost. These performance figures do not reflect the deduction of taxes that a shareholder would pay on fund distributions or the redemption of fund shares. To obtain performance information current to the most recent month end, please visit mmapraxis.com.
| * | Reflects maximum front-end sales charge of 5.25%. |
The total return set forth reflects certain expenses that were contractually or voluntarily reduced, reimbursed or paid by third party. In such instances, and without this activity, total return would have been lower.
| ** | Reflects the expense ratios as reported in the Prospectus dated May 1, 2009. Contractual fee waivers are in effect from May 1, 2009 through April 30, 2010 for Class A. Voluntary fee waivers were in effect through December 31, 2009 for Class I. |
41
MMA Praxis Growth Index Fund
Performance review
Growth of $10,000 investment 5/1/07 to 12/31/09
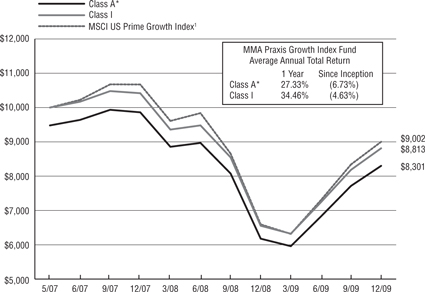
This chart represents historical performance of a hypothetical investment of $10,000 in the Growth Index Fund from 5/1/07 to 12/31/09, and represents the reinvestment of dividends and capital gains in the Fund.
Past performance does not guarantee future results. The performance data quoted represents past performance and current returns may be lower or higher. The investment return and principal value will fluctuate so that an investor's shares, when redeemed may be worth more or less than the original cost. These performance figures do not reflect the deduction of taxes that a shareholder would pay on fund distributions or the redemption of fund shares. To obtain performance information current to the most recent month end, please visit mmapraxis.com.
The total return set forth reflects certain expenses that were contractually or voluntarily reduced, reimbursed or paid by third party. In such instances, and without this activity, total return would have been lower.
| * | Reflects maximum front-end sales charge of 5.25%. |
| 1 | The MSCI US Prime Market Growth Index represents the growth companies of the MSCI US Prime Market 750 Index. (The MSCI US Prime Market 750 Index represents the universe of large and medium capitalization companies in the US equity market). The MSCI US Prime Market Growth Index is a subset of the MSCI US Prime Market 750 Index. |
The above index is for illustrative purposes only and does not reflect the deduction of expenses associated with a mutual fund, such as investment management and fund accounting fees. The fund's performance reflects the deduction of these value-added services. An investor cannot invest directly in an index, although they can invest in its underlying securities.
42
| Schedule of portfolio investments |
MMA Praxis Growth Index Fund
Schedule of portfolio investments
December 31, 2009
| SHARES | VALUE | |||||||
| COMMON STOCKS—98.6% | ||||||||
| AIR FREIGHT & LOGISTICS—1.3% | ||||||||
| CH Robinson Worldwide, Inc. | 806 | $ | 47,336 | |||||
| Expeditors International of Washington, Inc. | 1,026 | 35,633 | ||||||
| FedEx Corp. | 954 | 79,611 | ||||||
| United Parcel Service, Inc., Class B | 2,174 | 124,723 | ||||||
| 287,303 | ||||||||
| AIRLINES—0.4% | ||||||||
| Delta Air Lines, Inc. (a) | 3,819 | 43,460 | ||||||
| Southwest Airlines Co. | 3,572 | 40,828 | ||||||
| 84,288 | ||||||||
| AUTO COMPONENTS—0.4% | ||||||||
| Johnson Controls, Inc. | 3,221 | 87,740 | ||||||
| BEVERAGES—3.1% | ||||||||
| Coca-Cola Company | 3,215 | 183,255 | ||||||
| Coca-Cola Enterprises, Inc. | 1,623 | 34,408 | ||||||
| Dr. Pepper Snapple Group, Inc. | 841 | 23,800 | ||||||
| Hansen Natural Corp. (a) | 424 | 16,282 | ||||||
| PepsiCo, Inc. | 6,739 | 409,731 | ||||||
| 667,476 | ||||||||
| BIOTECHNOLOGY—3.6% | ||||||||
| Amgen, Inc. (a) | 4,515 | 255,414 | ||||||
| Amylin Pharmaceuticals, Inc. (a) | 1,582 | 22,449 | ||||||
| Biogen Idec, Inc. (a) | 1,145 | 61,257 | ||||||
| Celgene Corp. (a) | 2,194 | 122,162 | ||||||
| Cephalon, Inc. (a) | 579 | 36,135 | ||||||
| Genzyme Corp. (a) | 1,336 | 65,477 | ||||||
| Gilead Sciences, Inc. (a) | 3,648 | 157,885 | ||||||
| Myriad Genetics, Inc. (a) | 746 | 19,471 | ||||||
| Vertex Pharmaceuticals, Inc. (a) | 769 | 32,952 | ||||||
| 773,202 | ||||||||
| CAPITAL MARKETS—2.0% | ||||||||
| Charles Schwab Corp. | 4,856 | 91,390 | ||||||
| Eaton Vance Corp. | 845 | 25,697 | ||||||
| Franklin Resources, Inc. | 827 | 87,124 | ||||||
| Northern Trust Corp. | 1,081 | 56,644 | ||||||
| State Street Corp. | 1,585 | 69,011 | ||||||
| T. Rowe Price Group, Inc. | 1,304 | 69,438 | ||||||
| TD Ameritrade Holding Corp. (a) | 1,431 | 27,733 | ||||||
| 427,037 | ||||||||
| CHEMICALS—1.3% | ||||||||
| Celanese Corp. - Series A | 786 | 25,231 | ||||||
| Ecolab, Inc. | 1,178 | 52,515 | ||||||
| Nalco Holding Co. | 1,153 | 29,413 | ||||||
43
MMA Praxis Growth Index Fund
Schedule of portfolio investments, continued
December 31, 2009
| SHARES | VALUE | |||||||
| COMMON STOCKS—98.6%, continued | ||||||||
| CHEMICALS—1.3%, continued | ||||||||
| Praxair, Inc. | 1,396 | $ | 112,113 | |||||
| Sigma-Aldrich Corp. | 636 | 32,137 | ||||||
| Terra Industries, Inc. | 681 | 21,921 | ||||||
| 273,330 | ||||||||
| COMMERCIAL BANKS—0.6% | ||||||||
| U.S. Bancorp | 5,695 | 128,194 | ||||||
| COMMERCIAL SERVICES & SUPPLIES—0.2% | ||||||||
| Copart, Inc. (a) | 479 | 17,546 | ||||||
| Iron Mountain, Inc. (a) | 1,338 | 30,453 | ||||||
| Stericycle, Inc. (a) | 29 | 1,600 | ||||||
| 49,599 | ||||||||
| COMMUNICATIONS EQUIPMENT—5.3% | ||||||||
| Cisco Systems, Inc. (a) | 25,907 | 620,214 | ||||||
| Juniper Networks, Inc. (a) | 2,580 | 68,809 | ||||||
| Motorola, Inc. (a) | 11,249 | 87,292 | ||||||
| QUALCOMM, Inc. | 7,456 | 344,914 | ||||||
| 1,121,229 | ||||||||
| COMPUTERS & PERIPHERALS—12.6% | ||||||||
| Apple, Inc. (a) | 4,015 | 846,603 | ||||||
| Dell, Inc. (a) | 8,450 | 121,342 | ||||||
| EMC Corp./Massachusetts (a) | 9,700 | 169,459 | ||||||
| Hewlett-Packard Co. | 10,737 | 553,063 | ||||||
| International Business Machines Corp. | 5,853 | 766,158 | ||||||
| NetApp, Inc. (a) | 1,842 | 63,346 | ||||||
| SanDisk Corp. (a) | 1,307 | 37,890 | ||||||
| Sun Microsystems, Inc. (a) | 4,033 | 37,789 | ||||||
| Teradata Corp. (a) | 1,028 | 32,310 | ||||||
| Western Digital Corp. (a) | 1,115 | 49,227 | ||||||
| 2,677,187 | ||||||||
| CONSTRUCTION & ENGINEERING—0.4% | ||||||||
| Fluor Corp. | 972 | 43,779 | ||||||
| Foster Wheeler AG (a) | 753 | 22,168 | ||||||
| Quanta Services, Inc. (a) | 1,121 | 23,362 | ||||||
| 89,309 | ||||||||
| CONSTRUCTION MATERIALS—0.1% | ||||||||
| Martin Marietta Materials, Inc. | 325 | 29,058 | ||||||
| CONSUMER FINANCE—1.4% | ||||||||
| American Express Co. | 4,938 | 200,088 | ||||||
| Capital One Financial Corp. | 2,312 | 88,642 | ||||||
| 288,730 | ||||||||
44
MMA Praxis Growth Index Fund
Schedule of portfolio investments, continued
December 31, 2009
| SHARES | VALUE | |||||||
| COMMON STOCKS—98.6%, continued | ||||||||
| CONTAINERS & PACKAGING—0.3% | ||||||||
| Crown Holdings, Inc. (a) | 1,105 | $ | 28,266 | |||||
| Pactiv Corp. (a) | 1,069 | 25,806 | ||||||
| 54,072 | ||||||||
| DIVERSIFIED CONSUMER SERVICES—0.3% | ||||||||
| Apollo Group, Inc., Class A (a) | 606 | 36,711 | ||||||
| ITT Educational Services, Inc. (a) | 251 | 24,086 | ||||||
| 60,797 | ||||||||
| DIVERSIFIED FINANCIAL SERVICES—1.3% | ||||||||
| Citigroup, Inc. | 27,099 | 89,698 | ||||||
| CME Group, Inc., Class A | 303 | 101,793 | ||||||
| IntercontinentalExchange, Inc. (a) | 326 | 36,610 | ||||||
| Moody's Corp. | 1,238 | 33,178 | ||||||
| ASDAQ OMX Group, Inc. (a) | 914 | 18,115 | ||||||
| 279,394 | ||||||||
| ELECTRICAL EQUIPMENT—0.5% | ||||||||
| AMETEK, Inc. | 629 | 24,053 | ||||||
| First Solar, Inc. (a) | 248 | 33,579 | ||||||
| Roper Industries, Inc. | 485 | 25,400 | ||||||
| SunPower Corp., Class A (a) | 468 | 11,082 | ||||||
| SunPower Corp., Class B (a) | 767 | 16,069 | ||||||
| 110,183 | ||||||||
| ELECTRONIC EQUIPMENT, INSTRUMENTS & COMPONENTS—0.4% | ||||||||
| Corning, Inc. | 4,063 | 78,457 | ||||||
| ENERGY EQUIPMENT & SERVICES—1.9% | ||||||||
| Cameron International Corp. (a) | 1,320 | 55,176 | ||||||
| Diamond Offshore Drilling, Inc. | 361 | 35,530 | ||||||
| ENSCO International plc- ADR | 485 | 19,371 | ||||||
| FMC Technologies, Inc. (a) | 743 | 42,975 | ||||||
| Helmerich & Payne, Inc. | 695 | 27,716 | ||||||
| National Oilwell Varco, Inc. | 2,049 | 90,340 | ||||||
| Noble Corp. | 771 | 31,380 | ||||||
| Smith International, Inc. | 1,331 | 36,163 | ||||||
| Weatherford International Ltd. (a) | 3,457 | 61,915 | ||||||
| 400,566 | ||||||||
| FOOD & STAPLES RETAILING—4.4% | ||||||||
| Costco Wholesale Corp. | 2,033 | 120,293 | ||||||
| CVS Caremark Corp. | 4,431 | 142,722 | ||||||
| Walgreen Co. | 4,544 | 166,856 | ||||||
| Wal-Mart Stores, Inc. | 9,509 | 508,256 | ||||||
| 938,127 | ||||||||
45
MMA Praxis Growth Index Fund
Schedule of portfolio investments, continued
December 31, 2009
| SHARES | VALUE | |||||||
| COMMON STOCKS—98.6%, continued | ||||||||
| FOOD PRODUCTS—1.1% | ||||||||
| Dean Foods Co. (a) | 1,806 | $ | 32,580 | |||||
| General Mills, Inc. | 994 | 70,385 | ||||||
| H.J. Heinz Co. | 806 | 34,465 | ||||||
| Hershey Co. | 1,057 | 37,830 | ||||||
| Kellogg Co. | 1,249 | 66,447 | ||||||
| 241,707 | ||||||||
| GAS UTILITIES—0.2% | ||||||||
| EQT Corp. | 838 | 36,805 | ||||||
| HEALTH CARE EQUIPMENT & SUPPLIES—4.2% | ||||||||
| Baxter International, Inc. | 2,521 | 147,932 | ||||||
| Beckman Coulter, Inc. | 419 | 27,419 | ||||||
| Becton Dickinson and Co. | 906 | 71,447 | ||||||
| C.R. Bard, Inc. | 303 | 23,604 | ||||||
| DENTSPLY International, Inc. | 722 | 25,393 | ||||||
| Hologic, Inc. (a) | 1,902 | 27,579 | ||||||
| Hospira, Inc. (a) | 647 | 32,997 | ||||||
| Intuitive Surgical, Inc. (a) | 193 | 58,541 | ||||||
| Medtronic, Inc. | 5,200 | 228,696 | ||||||
| ResMed, Inc. (a) | 488 | 25,508 | ||||||
| St. Jude Medical, Inc. (a) | 1,572 | 57,818 | ||||||
| Stryker Corp. | 1,470 | 74,044 | ||||||
| Varian Medical Systems, Inc. (a) | 682 | 31,952 | ||||||
| Zimmer Holdings, Inc. (a) | 1,166 | 68,922 | ||||||
| 901,852 | ||||||||
| HEALTH CARE PROVIDERS & SERVICES—2.1% | ||||||||
| DaVita, Inc. (a) | 370 | 21,734 | ||||||
| Express Scripts, Inc. (a) | 1,245 | 107,630 | ||||||
| Henry Schein, Inc. (a) | 571 | 30,035 | ||||||
| Laboratory Corp of America Holdings (a) | 346 | 25,895 | ||||||
| McKesson Corp. | 1,403 | 87,687 | ||||||
| Medco Health Solutions, Inc. (a) | 2,276 | 145,459 | ||||||
| Quest Diagnostics, Inc./DE | 546 | 32,967 | ||||||
| 451,407 | ||||||||
| HEALTH CARE TECHNOLOGY—0.3% | ||||||||
| Cerner Corp. (a) | 456 | 37,593 | ||||||
| IMS Health, Inc. | 1,126 | 23,713 | ||||||
| 61,306 | ||||||||
| HOTELS, RESTAURANTS & LEISURE—2.4% | ||||||||
| Marriott International, Inc., Class A | 1,846 | 50,303 | ||||||
| McDonald's Corp. | 4,808 | 300,212 | ||||||
| Starbucks Corp. (a) | 3,619 | 83,454 | ||||||
| Yum! Brands, Inc. | 2,282 | 79,802 | ||||||
| 513,771 | ||||||||
46
MMA Praxis Growth Index Fund
Schedule of portfolio investments, continued
December 31, 2009
| SHARES | VALUE | |||||||
| COMMON STOCKS—98.6%, continued | ||||||||
| HOUSEHOLD DURABLES—0.2% | ||||||||
| NVR, Inc. (a) | 35 | $ | 24,875 | |||||
| Toll Brothers, Inc. (a) | 965 | 18,152 | ||||||
| 43,027 | ||||||||
| HOUSEHOLD PRODUCTS—1.4% | ||||||||
| Clorox Co. | 573 | 34,953 | ||||||
| Colgate-Palmolive Co. | 2,202 | 180,894 | ||||||
| Energizer Holdings, Inc. (a) | 479 | 29,353 | ||||||
| Kimberly-Clark Corp. | 666 | 42,431 | ||||||
| 287,631 | ||||||||
| INDEPENDENT POWER PRODUCERS & ENERGY TRADERS—0.2% | ||||||||
| AES Corp. (a) | 3,402 | 45,281 | ||||||
| INSURANCE—0.9% | ||||||||
| Berkshire Hathaway, Inc., Class B (a) | 51 | 167,586 | ||||||
| Brown & Brown, Inc. | 935 | 16,802 | ||||||
| 184,388 | ||||||||
| INTERNET & CATALOG RETAIL—1.3% | ||||||||
| Amazon.com, Inc. (a) | 1,587 | 213,483 | ||||||
| Expedia, Inc. (a) | 1,063 | 27,330 | ||||||
| priceline.com, Inc. (a) | 195 | 42,607 | ||||||
| 283,420 | ||||||||
| INTERNET SOFTWARE & SERVICES—4.6% | ||||||||
| Akamai Technologies, Inc. (a) | 1,115 | 28,243 | ||||||
| eBay, Inc. (a) | 5,372 | 126,457 | ||||||
| Google, Inc., Class A (a) | 1,089 | 675,158 | ||||||
| VeriSign, Inc. (a) | 1,302 | 31,561 | ||||||
| Yahoo!, Inc. (a) | 6,417 | 107,677 | ||||||
| 969,096 | ||||||||
| IT SERVICES—3.6% | ||||||||
| Accenture plc, Class A | 2,683 | 111,345 | ||||||
| Automatic Data Processing, Inc. | 2,293 | 98,186 | ||||||
| Cognizant Technology Solutions Corp., Class A (a) | 1,437 | 65,096 | ||||||
| Fiserv, Inc. (a) | 785 | 38,057 | ||||||
| Hewitt Associates, Inc., Class A (a) | 609 | 25,736 | ||||||
| Mastercard, Inc., Class A | 450 | 115,191 | ||||||
| Paychex, Inc. | 1,693 | 51,874 | ||||||
| Visa, Inc., Class A | 2,166 | 189,438 | ||||||
| Western Union Co. | 3,288 | 61,979 | ||||||
| 756,902 | ||||||||
| LIFE SCIENCES TOOLS & SERVICES—0.8% | ||||||||
| Covance, Inc. (a) | 508 | 27,722 | ||||||
| Illumina, Inc. (a) | 784 | 24,030 | ||||||
| Life Technologies Corp. (a) | 1,010 | 52,752 | ||||||
47
MMA Praxis Growth Index Fund
Schedule of portfolio investments, continued
December 31, 2009
| SHARES | VALUE | |||||||
| COMMON STOCKS—98.6%, continued | ||||||||
| LIFE SCIENCES TOOLS & SERVICES—0.8%, continued | ||||||||
| Millipore Corp. (a) | 367 | $ | 26,552 | |||||
| Waters Corp. (a) | 530 | 32,839 | ||||||
| 163,895 | ||||||||
| MACHINERY—1.2% | ||||||||
| AGCO Corp. (a) | 810 | 26,195 | ||||||
| Bucyrus International, Inc. | 513 | 28,918 | ||||||
| Deere & Co. | 1,119 | 60,527 | ||||||
| Flowserve Corp. | 385 | 36,394 | ||||||
| Joy Global, Inc. | 650 | 33,534 | ||||||
| PACCAR, Inc. | 1,868 | 67,752 | ||||||
| 253,320 | ||||||||
| MEDIA—1.8% | ||||||||
| Cablevision Systems Corp., Class A | 1,220 | 31,500 | ||||||
| DIRECTV, Class A (a) | 3,641 | 121,427 | ||||||
| Discovery Communications, Inc., Class A (a) | 998 | 30,609 | ||||||
| Discovery Communications, Inc., Class C (a) | 865 | 22,940 | ||||||
| Interpublic Group of Cos., Inc. (a) | 2,138 | 15,778 | ||||||
| Liberty Global, Inc., Series A (a) | 1,054 | 23,093 | ||||||
| McGraw-Hill Companies, Inc. | 1,627 | 54,521 | ||||||
| Omnicom Group, Inc. | 1,634 | 63,971 | ||||||
| Viacom, Inc., Class B (a) | 1,013 | 30,117 | ||||||
| 393,956 | ||||||||
| METALS & MINING—0.8% | ||||||||
| Newmont Mining Corp. | 2,120 | 100,297 | ||||||
| United States Steel Corp. | 885 | 48,781 | ||||||
| Walter Energy, Inc. | 339 | 25,530 | ||||||
| 174,608 | ||||||||
| MULTILINE RETAIL—1.6% | ||||||||
| Dollar Tree, Inc. (a) | 487 | 23,522 | ||||||
| Family Dollar Stores, Inc. | 952 | 26,494 | ||||||
| Kohl's Corp. (a) | 1,513 | 81,596 | ||||||
| Nordstrom, Inc. | 914 | 34,348 | ||||||
| Target Corp. | 3,431 | 165,958 | ||||||
| 331,918 | ||||||||
| OIL, GAS & CONSUMABLE FUELS—3.6% | ||||||||
| Alpha Natural Resources, Inc. (a) | 716 | 31,060 | ||||||
| Anadarko Petroleum Corp. | 2,292 | 143,067 | ||||||
| Consol Energy, Inc. | 1,034 | 51,493 | ||||||
| Denbury Resources, Inc. (a) | 1,618 | 23,946 | ||||||
| EOG Resources, Inc. | 1,153 | 112,187 | ||||||
| Hess Corp. | 988 | 59,774 | ||||||
| Murphy Oil Corp. | 695 | 37,669 | ||||||
| Noble Energy, Inc. | 834 | 59,398 | ||||||
48
MMA Praxis Growth Index Fund
Schedule of portfolio investments, continued
December 31, 2009
| SHARES | VALUE | |||||||
| COMMON STOCKS—98.6%, continued | ||||||||
| OIL, GAS & CONSUMABLE FUELS—3.6%, continued | ||||||||
| Petrohawk Energy Corp. (a) | 1,464 | $ | 35,121 | |||||
| Range Resources Corp. | 907 | 45,214 | ||||||
| Southwestern Energy Co. (a) | 1,613 | 77,747 | ||||||
| Ultra Petroleum Corp. (a) | 741 | 36,946 | ||||||
| XTO Energy, Inc. | 964 | 44,855 | ||||||
| 758,477 | ||||||||
| PAPER & FOREST PRODUCTS—0.4% | ||||||||
| International Paper Co. | 1,238 | 33,154 | ||||||
| Weyerhaeuser Co. | 1,142 | 49,266 | ||||||
| 82,420 | ||||||||
| PERSONAL PRODUCTS—0.5% | ||||||||
| Avon Products, Inc. | 2,251 | 70,907 | ||||||
| Estee Lauder Cos., Inc., Class A | 650 | 31,434 | ||||||
| 102,341 | ||||||||
| PHARMACEUTICALS—4.3% | ||||||||
| Abbott Laboratories | 6,889 | 371,937 | ||||||
| Allergan, Inc./United States | 1,505 | 94,830 | ||||||
| Johnson & Johnson | 5,979 | 385,107 | ||||||
| Mylan, Inc./PA (a) | 1,971 | 36,326 | ||||||
| Perrigo Co. | 523 | 20,836 | ||||||
| 909,036 | ||||||||
| PROFESSIONAL SERVICES—0.3% | ||||||||
| Dun & Bradstreet Corp. | 117 | 9,871 | ||||||
| FTI Consulting, Inc. (a) | 471 | 22,212 | ||||||
| IHS, Inc., Class A (a) | 328 | 17,978 | ||||||
| Robert Half International, Inc. | 879 | 23,496 | ||||||
| 73,557 | ||||||||
| REAL ESTATE INVESTMENT TRUSTS (REITS)—0.5% | ||||||||
| Host Hotels & Resorts, Inc. REIT (a) | 3,752 | 43,786 | ||||||
| Public Storage REIT | 371 | 30,218 | ||||||
| Simon Property Group, Inc. REIT | 540 | 43,075 | ||||||
| 117,079 | ||||||||
| ROAD & RAIL—0.1% | ||||||||
| J.B. Hunt Transport Services, Inc. | 501 | 16,167 | ||||||
| SEMICONDUCTORS & SEMICONDUCTOR EQUIPMENT—3.4% | ||||||||
| Altera Corp. | 1,794 | 40,598 | ||||||
| Applied Materials, Inc. | 4,932 | 68,752 | ||||||
| Broadcom Corp., Class A (a) | 2,456 | 77,241 | ||||||
| Intel Corp. | 9,000 | 183,600 | ||||||
| KLA-Tencor Corp. | 1,041 | 37,643 | ||||||
| Lam Research Corp. (a) | 691 | 27,094 | ||||||
| Marvell Technology Group Ltd. (a) | 2,874 | 59,635 | ||||||
49
MMA Praxis Growth Index Fund
Schedule of portfolio investments, continued
December 31, 2009
| SHARES | VALUE | |||||||
| COMMON STOCKS—98.6%, continued | ||||||||
| SEMICONDUCTORS & SEMICONDUCTOR EQUIPMENT—3.4%, continued | ||||||||
| MEMC Electronic Materials, Inc. (a) | 2,422 | $ | 32,988 | |||||
| Micron Technology, Inc. (a) | 2,896 | 30,582 | ||||||
| National Semiconductor Corp. | 1,720 | 26,419 | ||||||
| NVIDIA Corp. (a) | 2,317 | 43,282 | ||||||
| Texas Instruments, Inc. | 4,007 | 104,422 | ||||||
| 732,256 | ||||||||
| SOFTWARE—10.0% | ||||||||
| Activision Blizzard, Inc. (a) | 3,596 | 39,952 | ||||||
| Adobe Systems, Inc. (a) | 2,601 | 95,665 | ||||||
| Autodesk, Inc. (a) | 1,234 | 31,356 | ||||||
| BMC Software, Inc. (a) | 962 | 38,576 | ||||||
| CA, Inc. | 2,071 | 46,515 | ||||||
| Citrix Systems, Inc. (a) | 751 | 31,249 | ||||||
| Electronic Arts, Inc. (a) | 2,092 | 37,133 | ||||||
| Intuit, Inc. (a) | 1,347 | 41,366 | ||||||
| McAfee, Inc. (a) | 846 | 34,322 | ||||||
| Microsoft Corp. | 35,893 | 1,094,378 | ||||||
| Nuance Communications, Inc. (a) | 1,773 | 27,552 | ||||||
| Oracle Corp. | 18,124 | 444,763 | ||||||
| Red Hat, Inc. (a) | 1,160 | 35,844 | ||||||
| Salesforce.com, Inc. (a) | 664 | 48,983 | ||||||
| Symantec Corp. (a) | 3,953 | 70,719 | ||||||
| 2,118,373 | ||||||||
| SPECIALTY RETAIL—2.9% | ||||||||
| AutoZone, Inc. (a) | 169 | 26,714 | ||||||
| Bed Bath & Beyond, Inc. (a) | 1,359 | 52,498 | ||||||
| Best Buy Co., Inc. | 1,781 | 70,278 | ||||||
| CarMax, Inc. (a) | 1,462 | 35,454 | ||||||
| GameStop Corp., Class A (a) | 1,014 | 22,247 | ||||||
| Lowe's Cos., Inc. | 7,014 | 164,057 | ||||||
| O'Reilly Automotive, Inc. (a) | 724 | 27,599 | ||||||
| PetSmart, Inc. | 1,009 | 26,930 | ||||||
| Ross Stores, Inc. | 752 | 32,118 | ||||||
| Staples, Inc. | 3,352 | 82,426 | ||||||
| TJX Cos., Inc. | 2,035 | 74,379 | ||||||
| 614,700 | ||||||||
| TEXTILES, APPAREL & LUXURY GOODS—0.9% | ||||||||
| Coach, Inc. | 1,504 | 54,941 | ||||||
| NIKE, Inc., Class B | 1,710 | 112,980 | ||||||
| Polo Ralph Lauren Corp. | 368 | 29,800 | ||||||
| 197,721 | ||||||||
50
MMA Praxis Growth Index Fund
Schedule of portfolio investments, continued
December 31, 2009
| PRINCIPAL | ||||||||
| AMOUNT/ | ||||||||
| SHARES | VALUE | |||||||
| COMMON STOCKS—98.6%, continued | ||||||||
| TRADING COMPANIES & DISTRIBUTORS—0.3% | ||||||||
| Fastenal Co. | 853 | $ | 35,519 | |||||
| W.W. Grainger, Inc. | 322 | 31,179 | ||||||
| 66,698 | ||||||||
| WIRELESS TELECOMMUNICATION SERVICES—0.9% | ||||||||
| American Tower Corp., Class A (a) | 1,893 | 81,796 | ||||||
| Crown Castle International Corp. (a) | 1,644 | 64,182 | ||||||
| MetroPCS Communications, Inc. (a) | 2,514 | 19,182 | ||||||
| NII Holdings, Inc. (a) | 998 | 33,513 | ||||||
| 198,673 | ||||||||
| TOTAL COMMON STOCKS | 20,987,066 | |||||||
| CORPORATE NOTES—0.9% | ||||||||
| DEVELOPMENT AUTHORITIES—0.9% | ||||||||
| MMA Community Development Investment, Inc., 1.32%, 12/31/10(b)+ | 155,000 | 155,000 | ||||||
| MMA Community Development Investment, Inc., 0.88%, 12/31/10(b)+ | 35,000 | 35,000 | ||||||
| TOTAL CORPORATE NOTES | 190,000 | |||||||
| TOTAL INVESTMENTS (Cost* $21,101,274)—99.5% | $ | 21,177,066 | ||||||
| Net other assets (liabilities) — 0.5% | 106,659 | |||||||
| NET ASSETS—100% | $ | 21,283,725 | ||||||
| + | Variable rate security. Rates presented are the rates in effect at December 31, 2009. |
| (a) | Non-income producing securities. |
| (b) | Represents affiliated restricted security as to resale to shareholders and is not registered under the Securities Act of 1933. These securities have been deemed illiquid under guidelines established by the Board of Trustees: |
| Acquisition | ||||||||||||
| Security | Yield | Shares | Date | |||||||||
| MMA Community Development Investment, Inc. | 0.88 | % | 155,000 | 12/2009 | ||||||||
| MMA Community Development Investment, Inc. | 1.32 | % | 35,000 | 12/2009 | ||||||||
At December 31, 2009, these securities had an aggregate market value of $190,000, representing 0.9% of net assets.
| * | Represents cost for financial reporting purposes. |
ADR – American Depositary Receipt.
plc – Public Liability Company.
REIT – Real Estate Investment Trust.
51
MMA Praxis Growth Index Fund
Schedule of portfolio investments, continued
December 31, 2009
Other Information:
The inputs or methodology used for valuing securities may not be an indication of the risk associated with investing in those securities. For more information on valuation inputs, and their aggregation into the levels used in the table below, please refer to the Security Valuation section in the accompanying Notes to Financial Statements.
Valuation Inputs at Reporting Date:
| Description | Level 1 | Level 2 | Level 3 | Total | ||||||||||||
| Investments at Value | ||||||||||||||||
| Common Stocks | $ | 20,987,066 | $ | — | $ | — | $ | 20,987,066 | ||||||||
| Corporate Notes | — | — | 190,000 | 190,000 | ||||||||||||
| Total Investments | $ | 20,987,066 | $ | — | $ | 190,000 | $ | 21,177,066 | ||||||||
Following is a reconciliation of Level 3 assets for which significant unobservable inputs for Investments in Securities were used to determine fair value for each Fund:
Growth Index Fund | ||||
| Balance as of December 31, 2008 | $ | 190,000 | ||
| Proceeds from Sales | (190,000 | ) | ||
| Purchases | 190,000 | |||
| Balance as of December 31, 2009 | $ | 190,000 | ||
See accompanying notes to financial statements.
52
| MMA Praxis International Fund |
MMA Praxis International Fund
Annual report to shareholders
Portfolio manager’s letter
MMA Praxis International Equity Strategy Review 2009
Last year, we described the declines of 2008 as exceptional, abnormal, and record breaking in some cases. Twelve months later we can use the same adjectives, but this time from the positive side. Early in the year, global economies continued to stumble, hand-in-hand with equity markets that reflected the weak fundamentals facing most companies, the banking sector in particular. Government actions, both in the United States and overseas, were designed to prevent a total collapse of the banking system globally and avoid the feared slide into a protracted depression.
Suddenly, and contrary to existing fundamentals, equity markets made an abrupt U-turn in early March and headed into a steep, low-quality, momentum rally of historic proportions. This was driven initially in large part by hedge fund managers’ share buying to cover their short positions and to raise capital to meet the growing demand for withdrawals by investors. Slowly, evidence of some improvements in selective industries and regions began to filter out.
International equity markets fared well during the year with the MSCI EAFE index providing a 32.46 percent return over the entire period. From the market bottom the gain was an outstanding 78 percent, a similar level of return that emerging markets produced over the entire year.
Given our emphasis on fundamentals, on high-quality companies, and on our conscious focus on protection of capital, we fared better than the markets over the early months of the year as the downward cycle continued. When the markets changed direction in March, we had little exposure initially to the lower quality companies that provided the steam for the market eruption and, given its scale and pace, we lagged over the period to the end of June. During the second half of the year, performance more closely tracked the benchmark.
Strategy
From the outset of the year, we had maintained our emphasis on companies with stronger balance sheets and higher free cash flow yields, and by early March the portfolio was positioned to withstand the extreme negative fundamentals, both economic and corporate. Major underweights were in the Utilities sector, given the sharp reduction in demand and in pricing power; and Industrials. By the summer of 2009, as we began to see some early signs of improving fundamentals, we moved to some more economically sensitive holdings. By year end we had eliminated the early year overweights in the more defensive areas of Telecom Services, Health Care, and Consumer Staples in favor of increased exposure to Information Technology, Industrials, and Consumer Discretionary. Among the industries and market segments we focused on were automobile companies, which selectively had fallen to very attractive valuation levels, and temporary employment firms, a strong beneficiary of economic recovery. Financials were close to market weight overall but still with meaningful underweight in banks. When viewed from a geographic perspective, the changes in the portfolio structure were more significant with sizeable a reduction in Europe, mainly France and Switzerland, replaced by increased United Kingdom and Canadian exposure.
Contributors to performance
While the portfolio lagged the benchmark index by a wide margin over the year, the vast majority of it was confined to the second quarter. Positive contributions came from our underweight in Utilities. The sector continued to struggle with falling demand for power, resistance from regulators against rate increases, and volatile oil and gas prices. Little change in the bleak environment is anticipated and we are happy with our negligible weight there. Industrials were in line with the overall market, but we benefitted from strong stock performances, the driving force for which was the weight we had built up in the employment companies. This industry is a leading economic indicator as employers tend to add temporary workers at the early stages of a recovery and the improving outlook for employment pushed these companies upward. Our Chinese holdings in IT included Baidu, Inc., which dominates online searches in its home market and SINA Corp., the Chinese online media company and information services provider; both performed strongly. We also had support from Japan Dynamic Random Access Memory (DRAM) producer Elpida Memory, Inc. Geographically, China led all countries in its contribution to overall returns with the Netherlands gaining from the overweight in the number of employment companies centered there.
53
Detractors from performance
Detractors were led by Financials as a result of our underweight exposure to banks in late March as they ran sharply upwards. We had benefitted from our stance against these holdings as markets weakened. However, we could not reconcile the focus we have on quality and on the protection of capital value with a strategy of chasing price movements. Visibility of earnings was not easy to come by nor was satisfying insights to the real strength or otherwise of many leading banks available to us. Some of the better quality financials, such as insurers Munich Re were shunned by investors seeking the quick risers even though they provided higher levels of security. A similar fate was experienced by many of the leading companies in Telecom Services, a sector that underperformed the market as investors switched their focus elsewhere in an attempt to satisfy their growing risk appetite. In Materials, we suffered from weakness in some of our mining stocks. For example, Agnico-Eagle Mines Ltd. dropped sharply during the last quarter, on its announcement that commissioning issues at three of its new mines would delay its expected production ramp-up in 2010. From a country perspective, Europe led the detractors with Switzerland, Germany, and France to the fore. Across these three markets, the mix of weak performers included telecoms, pharmaceutical companies, and some of the larger Swiss financials.
Portfolio outlook
For the first six months of 2010, we expect to see the cyclical recovery in international markets continue. We believe that central bankers in developed nations will continue to retain an accommodative bias toward fiscal and monetary policy until employment numbers actually improve, versus when they are expected to improve. We also expect that forecasted corporate earnings in 2010 and 2011 will be better than expected. From our point of view, the best way to play the resulting effects of an overly stimulated economy will be to emphasize cyclical growth stocks.
In short, our thesis is that policy-makers are concerned primarily with employment, not solely with inflation, and that this focus has consequences far beyond job creation. Employment is at a low point, and in the United States, for example, the share of U.S. Gross Domestic Product for which each employee is responsible, is at its highest level on record. We don’t believe that GDP growth can be sustained without a corresponding increase in employment. We are already seeing this in the temporary employment market, with four straight months through November of absolute employment increases in the temporary space, confirmed through our research. But perhaps the best case for increased employment in the near future is the fact that policy makers globally are using employment as their metric for whether to begin withdrawing stimulus from the economy. If they wait to curtail growth until a recovery in employment – a classic lagging indicator – we believe there is a potential for overstimulation of the economy, which would benefit the cyclical growth companies we favor.
54
The effects of an overheated U.S. economy on world markets could be profound. We anticipate that corporate profits will be up in 2010 and 2011, even without high levels of top-line growth, giving us the opportunity to take advantage of companies that benefit from an uptick in corporate earnings without being tremendously expensive. Because of companies’ ability to modestly improve profits on a reduced cost structure, we believe that growth at a reasonable price companies—those with reasonable growth rates and attractive valuations—could have a good 2010. With the prospect of continued accommodative stances by central governments, corporate earnings should be poised to continue their modest growth on lower breakeven points.
Francis Claró, CFA®
Evergreen Investment Management
55
| Performance review |
MMA Praxis International Fund
Performance review
Average annual total returns as of 12/31/09
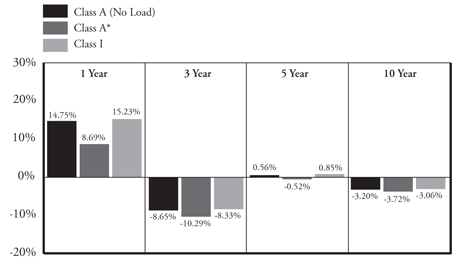
| Inception | Expense Ratio** | ||||||
Date | 1 Year | 3 Year | 5 Year | 10 Year | Gross | Net | |
| Class A (No Load) | 5/12/99 | 14.75% | -8.65% | 0.56% | -3.20% | 1.92% | 1.92% |
| Class A* | 5/12/99 | 8.69% | -10.29% | -0.52% | -3.72% | ||
| Class I | 5/1/06 | 15.23% | -8.33% | 0.85% | -3.06% | 1.32% | 1.32% |
Past performance does not guarantee future results. The performance data quoted represents past performance and current returns may be lower or higher. The investment return and principal value will fluctuate so that an investor's shares, when redeemed may be worth more or less than the original cost. These performance figures do not reflect the deduction of taxes that a shareholder would pay on fund distributions or the redemption of fund shares. To obtain performance information current to the most recent month end, please visit mmapraxis.com.
| * | Reflects maximum front-end sales charge of 5.25%. |
Class I Share of this Fund was not in existence prior to 5/1/06. Class I Share performance calculated for any period prior to 5/1/06 is based on the performance of Class B Share since inception of 4/1/97 and has been adjusted to reflect differences in sales charges and expenses between the classes. The Class B Shares were exchanged into Class A Shares on August 17, 2009.
The total return set forth reflects certain expenses that were contractually or voluntarily reduced, reimbursed or paid by third party. In such instances, and without this activity, total return would have been lower.
| ** | Reflects the expense ratios as reported in the Prospectus dated May 1, 2009. Voluntary fee waivers were in effect through December 31, 2009 for Class A and Class I. |
56
MMA Praxis International Fund
Performance review
Growth of $10,000 investment 12/31/99 to 12/31/09
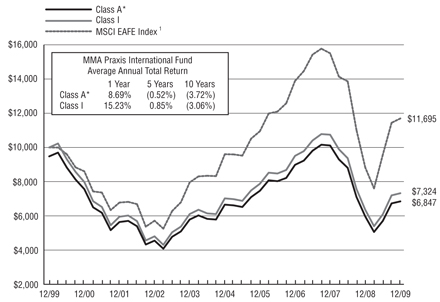
This chart represents historical performance of a hypothetical investment of $10,000 in the International Fund from 12/31/99 to 12/31/09, and represents the reinvestment of dividends and capital gains in the Fund.
Past performance does not guarantee future results. The performance data quoted represents past performance and current returns may be lower or higher. The investment return and principal value will fluctuate so that an investor's shares, when redeemed may be worth more or less than the original cost. These performance figures do not reflect the deduction of taxes that a shareholder would pay on fund distributions or the redemption of fund shares. To obtain performance information current to the most recent month end, please visit mmapraxis.com.
The total return set forth reflects certain expenses that were contractually or voluntarily reduced, reimbursed or paid by third party. In such instances, and without this activity, total return would have been lower.
| * | Reflects maximum front-end sales charge of 5.25%. |
Class I Share of this Fund was not in existence prior to 5/1/06. Class I Share performance calculated for any period prior to 5/1/06 is based on the performance of Class B Share since inception of 4/1/97 and has been adjusted to reflect differences in sales charges and expenses between the classes. The Class B Shares were exchanged into Class A Shares on August 17, 2009.
| 1 | The MSCI EAFE Index is a widely recognized, unmanaged index composed of a sample of companies representative of the developed markets throughout the world, excluding the United States and Canada. |
The above index is for illustrative purposes only and does not reflect the deduction of expenses associated with a mutual fund, such as investment management and fund accounting fees. The fund's performance reflects the deduction of these value-added services. An investor cannot invest directly in an index, although they can invest in its underlying securities.
57
| Schedule of portfolio investments |
MMA Praxis International Fund
Schedule of portfolio investments
December 31, 2009
| SHARES | VALUE | |||||||
| COMMON STOCKS—99.0% | ||||||||
| ARGENTINA—0.6% | ||||||||
| REAL ESTATE MANAGEMENT & DEVELOPMENT—0.6% | ||||||||
| IRSA Inversiones y Representaciones SA- GDR | 61,060 | $ | 580,070 | |||||
| AUSTRALIA—3.5% | ||||||||
| COMMERCIAL BANKS—0.8% | ||||||||
| Commonwealth Bank of Australia | 14,917 | 728,278 | ||||||
| DIVERSIFIED FINANCIAL SERVICES—0.6% | ||||||||
| ASX Ltd. | 17,912 | 558,438 | ||||||
| INSURANCE—1.3% | ||||||||
| AMP Ltd. | 120,078 | 725,313 | ||||||
| Suncorp-Metway Ltd. | 69,251 | 536,138 | ||||||
| 1,261,451 | ||||||||
| METALS & MINING—0.8% | ||||||||
| Newcrest Mining Ltd. | 23,498 | 744,294 | ||||||
| 3,292,461 | ||||||||
| AUSTRIA—0.3% | ||||||||
| CONSTRUCTION MATERIALS—0.3% | ||||||||
| RHI AG (a) | 11,156 | 258,951 | ||||||
| BELGIUM—0.6% | ||||||||
| HEALTH CARE TECHNOLOGY—0.6% | ||||||||
| AGFA-Gevaert NV (a) | 79,453 | 512,165 | ||||||
| BRAZIL—0.6% | ||||||||
| COMMERCIAL BANKS—0.6% | ||||||||
| Banco Bradesco SA- ADR | 23,912 | 522,956 | ||||||
| CANADA—6.7% | ||||||||
| CHEMICALS—0.8% | ||||||||
| Potash Corp of Saskatchewan, Inc. | 7,046 | 764,491 | ||||||
| COMMUNICATIONS EQUIPMENT—0.7% | ||||||||
| Research In Motion Ltd. (a) | 9,179 | 619,950 | ||||||
| METALS & MINING—0.7% | ||||||||
| Agnico-Eagle Mines Ltd. | 13,146 | 709,884 | ||||||
| OIL, GAS & CONSUMABLE FUELS—3.4% | ||||||||
| Canadian Natural Resources Ltd. | 26,650 | 1,936,606 | ||||||
| EnCana Corp. | 24,101 | 786,045 | ||||||
| Pacific Rubiales Energy Corp. (a) | 28,426 | 419,928 | ||||||
| 3,142,579 | ||||||||
58
MMA Praxis International Fund
Schedule of portfolio investments, continued
December 31, 2009
| SHARES | VALUE | |||||||
| COMMON STOCKS—99.0%, continued | ||||||||
| CANADA—6.7%, continued | ||||||||
| REAL ESTATE MANAGEMENT & DEVELOPMENT—1.1% | ||||||||
| Brookfield Asset Management, Inc., Class A | 44,627 | $ | 989,827 | |||||
| 6,226,731 | ||||||||
| CAYMAN ISLANDS—3.8% | ||||||||
| INTERNET SOFTWARE & SERVICES—2.9% | ||||||||
| Netease.com- ADR (a) | 11,923 | 448,424 | ||||||
| Sina Corp. (a) | 49,154 | 2,220,778 | ||||||
| 2,669,202 | ||||||||
| SOFTWARE—0.9% | ||||||||
| VanceInfo Technologies, Inc.- ADR (a) | 46,319 | 889,788 | ||||||
| 3,558,990 | ||||||||
| FINLAND—0.5% | ||||||||
| COMMUNICATIONS EQUIPMENT—0.5% | ||||||||
| Nokia OYJ | 32,927 | 425,746 | ||||||
| FRANCE—6.7% | ||||||||
| BUILDING PRODUCTS—0.8% | ||||||||
| Cie de Saint-Gobain | 13,878 | 752,831 | ||||||
| COMMERCIAL BANKS—1.9% | ||||||||
| BNP Paribas | 8,489 | 673,331 | ||||||
| Credit Agricole SA | 17,669 | 310,089 | ||||||
| Natixis (a) | 52,090 | 260,103 | ||||||
| Societe Generale | 7,562 | 525,408 | ||||||
| 1,768,931 | ||||||||
| DIVERSIFIED TELECOMMUNICATION SERVICES—0.4% | ||||||||
| France Telecom SA | 15,870 | 396,564 | ||||||
| ENERGY EQUIPMENT & SERVICES—1.0% | ||||||||
| Technip SA | 12,401 | 872,493 | ||||||
| INSURANCE—0.9% | ||||||||
| AXA SA | 33,826 | 794,200 | ||||||
| MEDIA—0.5% | ||||||||
| Publicis Groupe SA | 11,998 | 487,841 | ||||||
| MULTILINE RETAIL—1.0% | ||||||||
| PPR | 7,880 | 945,877 | ||||||
| OFFICE ELECTRONICS—0.2% | ||||||||
| Neopost SA | 2,286 | 188,676 | ||||||
| 6,207,413 | ||||||||
59
MMA Praxis International Fund
Schedule of portfolio investments, continued
December 31, 2009
| SHARES | VALUE | |||||||
| COMMON STOCKS—99.0%, continued | ||||||||
| GERMANY—8.9% | ||||||||
| CAPITAL MARKETS—0.3% | ||||||||
| Deutsche Bank AG | 4,114 | $ | 290,901 | |||||
| CHEMICALS—1.5% | ||||||||
| BASF SE | 16,135 | 998,607 | ||||||
| Lanxess AG | 10,037 | 379,437 | ||||||
| 1,378,044 | ||||||||
| CONSTRUCTION & ENGINEERING—0.3% | ||||||||
| Hochtief AG | 4,322 | 329,626 | ||||||
| DISTRIBUTORS—0.3% | ||||||||
| Kloeckner & Co. SE (a) | 12,800 | 324,430 | ||||||
| DIVERSIFIED FINANCIAL SERVICES—1.4% | ||||||||
| Deutsche Boerse AG | 15,422 | 1,277,091 | ||||||
| FOOD & STAPLES RETAILING—0.3% | ||||||||
| Metro AG | 4,902 | 299,379 | ||||||
| INSURANCE—1.5% | ||||||||
| Allianz SE | 5,179 | 641,989 | ||||||
| Muenchener Rueckversicherungs Gesellschaft AG | 4,880 | 760,108 | ||||||
| 1,402,097 | ||||||||
| METALS & MINING—0.5% | ||||||||
| Salzgitter AG | 4,745 | 464,956 | ||||||
| SEMICONDUCTORS & SEMICONDUCTOR EQUIPMENT—0.9% | ||||||||
| Aixtron AG | 9,316 | 313,085 | ||||||
| Infineon Technologies AG (a) | 91,655 | 509,912 | ||||||
| 822,997 | ||||||||
| SOFTWARE—0.3% | ||||||||
| SAP AG | 5,934 | 282,893 | ||||||
| TEXTILES, APPAREL & LUXURY GOODS—1.6% | ||||||||
| Adidas AG | 26,839 | 1,453,747 | ||||||
| 8,326,161 | ||||||||
| GREECE—1.0% | ||||||||
| DIVERSIFIED FINANCIAL SERVICES—1.0% | ||||||||
| Hellenic Exchanges SA Holding Clearing Settlement and Registry | 90,771 | 941,954 | ||||||
| HONG KONG—1.2% | ||||||||
| WIRELESS TELECOMMUNICATION SERVICES—1.2% | ||||||||
| China Mobile Ltd.- ADR | 24,201 | 1,123,652 | ||||||
60
MMA Praxis International Fund
Schedule of portfolio investments, continued
December 31, 2009
| SHARES | VALUE | |||||||
| COMMON STOCKS—99.0%, continued | ||||||||
| ISRAEL—0.3% | ||||||||
| PHARMACEUTICALS—0.3% | ||||||||
| Teva Pharmaceutical Industries Ltd.- ADR | 5,617 | $ | 315,563 | |||||
| JAPAN—12.5% | ||||||||
| AUTOMOBILES—2.8% | ||||||||
| Isuzu Motors Ltd. (a) | 836,000 | 1,570,380 | ||||||
| Toyota Motor Corp. | 25,300 | 1,066,673 | ||||||
| 2,637,053 | ||||||||
| BUILDING PRODUCTS—0.4% | ||||||||
| Asahi Glass Co. Ltd. | 36,000 | 342,435 | ||||||
| CAPITAL MARKETS—0.9% | ||||||||
| Nomura Holdings, Inc. | 107,100 | 796,468 | ||||||
| CONSUMER FINANCE—0.2% | ||||||||
| ORIX Corp. | 3,210 | 218,550 | ||||||
| ELECTRONIC EQUIPMENT, INSTRUMENTS & COMPONENTS—1.2% | ||||||||
| Nippon Electric Glass Co. Ltd. | 48,000 | 660,666 | ||||||
| TDK Corp. | 7,500 | 458,344 | ||||||
| 1,119,010 | ||||||||
| HOUSEHOLD DURABLES—1.3% | ||||||||
| Makita Corp. | 35,800 | 1,229,662 | ||||||
| HOUSEHOLD PRODUCTS—0.9% | ||||||||
| Unicharm Corp. | 8,800 | 824,967 | ||||||
| INSURANCE—0.5% | ||||||||
| Sompo Japan Insurance, Inc. | 72,600 | 468,085 | ||||||
| INTERNET SOFTWARE & SERVICES—0.5% | ||||||||
| Yahoo! Japan Corp. | 1,540 | 463,029 | ||||||
| MACHINERY—0.5% | ||||||||
| Toshiba Machine Co. Ltd. | 117,000 | 448,585 | ||||||
| OFFICE ELECTRONICS—0.5% | ||||||||
| Canon, Inc. | 10,100 | 429,638 | ||||||
| SEMICONDUCTORS & SEMICONDUCTOR EQUIPMENT—2.8% | ||||||||
| ADVANTEST Corp. | 24,000 | 625,224 | ||||||
| Elpida Memory, Inc. (a) | 83,800 | 1,365,770 | ||||||
| Tokyo Electron Ltd. | 10,300 | 661,137 | ||||||
| 2,652,131 | ||||||||
| 11,629,613 | ||||||||
61
MMA Praxis International Fund
Schedule of portfolio investments, continued
December 31, 2009
| SHARES | VALUE | |||||||
| COMMON STOCKS—99.0%, continued | ||||||||
| JERSEY—0.5% | ||||||||
| PROFESSIONAL SERVICES—0.5% | ||||||||
| Experian plc | 46,292 | $ | 457,259 | |||||
| MEXICO—0.5% | ||||||||
| WIRELESS TELECOMMUNICATION SERVICES—0.5% | ||||||||
| America Movil SAB de CV, Series L- ADR | 9,386 | 440,954 | ||||||
| NETHERLANDS—8.5% | ||||||||
| COMMERCIAL SERVICES & SUPPLIES—0.4% | ||||||||
| Brunel International NV | 12,271 | 412,894 | ||||||
| FOOD PRODUCTS—1.5% | ||||||||
| Unilever NV, CVA | 41,592 | 1,353,687 | ||||||
| METALS & MINING—0.5% | ||||||||
| New World Resources NV, Class A | 56,927 | 512,699 | ||||||
| PROFESSIONAL SERVICES—4.8% | ||||||||
| Randstad Holding NV (a) | 57,129 | 2,842,589 | ||||||
| USG People NV (a) | 87,924 | 1,590,339 | ||||||
| 4,432,928 | ||||||||
| SEMICONDUCTORS & SEMICONDUCTOR EQUIPMENT—1.3% | ||||||||
| ASML Holding NV | 36,036 | 1,230,335 | ||||||
| 7,942,543 | ||||||||
| NORWAY—0.5% | ||||||||
| DIVERSIFIED TELECOMMUNICATION SERVICES—0.5% | ||||||||
| Telenor ASA (a) | 31,869 | 445,200 | ||||||
| SINGAPORE—0.5% | ||||||||
| COMMERCIAL BANKS—0.5% | ||||||||
| DBS Group Holdings Ltd. | 38,000 | 413,097 | ||||||
| SOUTH KOREA—0.4% | ||||||||
| FOOD PRODUCTS—0.4% | ||||||||
| Lotte Confectionery Co. Ltd. (a) | 341 | 378,498 | ||||||
| SPAIN—2.5% | ||||||||
| COMMERCIAL BANKS—0.6% | ||||||||
| Banco Santander SA | 31,957 | 528,079 | ||||||
| DIVERSIFIED FINANCIAL SERVICES—0.5% | ||||||||
| Criteria Caixacorp SA | 107,535 | 509,343 | ||||||
62
MMA Praxis International Fund
Schedule of portfolio investments, continued
December 31, 2009
| SHARES | VALUE | |||||||
| COMMON STOCKS—99.0%, continued | ||||||||
| SPAIN—2.5%, continued | ||||||||
| DIVERSIFIED TELECOMMUNICATION SERVICES—0.5% | ||||||||
| Telefonica SA | 16,645 | $ | 465,878 | |||||
| SPECIALTY RETAIL—0.9% | ||||||||
| Inditex SA | 13,850 | 864,967 | ||||||
| 2,368,267 | ||||||||
| SWEDEN—1.8% | ||||||||
| COMMERCIAL BANKS—0.9% | ||||||||
| Nordea Bank AB | 88,445 | 896,126 | ||||||
| CONSTRUCTION & ENGINEERING—0.4% | ||||||||
| Skanska AB, Class B | 21,702 | 368,241 | ||||||
| SPECIALTY RETAIL—0.5% | ||||||||
| Hennes & Mauritz AB (H&M), Class B | 8,138 | 451,144 | ||||||
| 1,715,511 | ||||||||
| SWITZERLAND—12.9% | ||||||||
| CAPITAL MARKETS—1.6% | ||||||||
| Credit Suisse Group AG | 30,510 | 1,511,507 | ||||||
| ELECTRICAL EQUIPMENT—1.1% | ||||||||
| ABB Ltd. (a) | 54,297 | 1,046,267 | ||||||
| ENERGY EQUIPMENT & SERVICES—1.1% | ||||||||
| Transocean Ltd. (a) | 12,695 | 1,051,146 | ||||||
| FOOD PRODUCTS—2.1% | ||||||||
| Nestle SA | 40,969 | 1,988,374 | ||||||
| INSURANCE—1.0% | ||||||||
| Zurich Financial Services AG | 4,265 | 932,430 | ||||||
| PHARMACEUTICALS—2.9% | ||||||||
| Novartis AG | 22,459 | 1,226,469 | ||||||
| Roche Holding AG | 8,824 | 1,509,018 | ||||||
| 2,735,487 | ||||||||
| PROFESSIONAL SERVICES—0.9% | ||||||||
| Adecco SA | 14,830 | 818,097 | ||||||
| TEXTILES, APPAREL & LUXURY GOODS—2.1% | ||||||||
| Swatch Group AG | 7,585 | 1,919,918 | ||||||
| 12,003,226 | ||||||||
63
MMA Praxis International Fund
Schedule of portfolio investments, continued
December 31, 2009
| SHARES | VALUE | |||||||
| COMMON STOCKS—99.0%, continued | ||||||||
| UNITED KINGDOM—23.7% | ||||||||
| AIRLINES—0.4% | ||||||||
| British Airways plc (a) | 110,621 | $ | 332,708 | |||||
| CAPITAL MARKETS—1.4% | ||||||||
| ICAP plc | 42,703 | 294,525 | ||||||
| Man Group plc | 213,500 | 1,053,698 | ||||||
| 1,348,223 | ||||||||
| COMMERCIAL BANKS—4.0% | ||||||||
| Barclays plc | 280,046 | 1,234,012 | ||||||
| HSBC Holdings plc | 189,745 | 2,164,678 | ||||||
| Standard Chartered plc | 11,771 | 297,170 | ||||||
| 3,695,860 | ||||||||
| COMMERCIAL SERVICES & SUPPLIES—0.4% | ||||||||
| Savills plc | 65,806 | 338,845 | ||||||
| ENERGY EQUIPMENT & SERVICES—0.4% | ||||||||
| AMEC plc | 29,733 | 378,813 | ||||||
| FOOD PRODUCTS—0.5% | ||||||||
| Cadbury plc | 35,666 | 458,580 | ||||||
| HOUSEHOLD PRODUCTS—0.5% | ||||||||
| Reckitt Benckiser Group plc | 8,477 | 458,861 | ||||||
| INDUSTRIAL CONGLOMERATES—0.5% | ||||||||
| Cookson Group plc (a) | 76,489 | 517,473 | ||||||
| MACHINERY—0.5% | ||||||||
| Invensys plc | 89,606 | 431,078 | ||||||
| MEDIA—0.6% | ||||||||
| WPP plc | 60,819 | 594,828 | ||||||
| METALS & MINING—6.8% | ||||||||
| Antofagasta plc | 82,970 | 1,319,853 | ||||||
| BHP Billiton plc | 56,981 | 1,816,555 | ||||||
| Rio Tinto plc | 36,008 | 1,944,318 | ||||||
| Xstrata plc (a) | 69,950 | 1,247,635 | ||||||
| 6,328,361 | ||||||||
| MULTILINE RETAIL—0.3% | ||||||||
| Next plc | 8,613 | 287,985 | ||||||
64
MMA Praxis International Fund
Schedule of portfolio investments, continued
December 31, 2009
| PRINCIPAL | ||||||||
| AMOUNT/ | ||||||||
| SHARES | VALUE | |||||||
| COMMON STOCKS—99.0%, continued | ||||||||
| UNITED KINGDOM—23.7%, continued | ||||||||
| OIL, GAS & CONSUMABLE FUELS—4.0% | ||||||||
| BG Group plc | 32,520 | $ | 587,191 | |||||
| BP plc | 195,040 | 1,883,342 | ||||||
| Royal Dutch Shell plc, Class A | 42,134 | 1,274,985 | ||||||
| 3,745,518 | ||||||||
| PROFESSIONAL SERVICES—1.3% | ||||||||
| Hays plc | 552,202 | 923,406 | ||||||
| Intertek Group plc | 14,064 | 284,263 | ||||||
| 1,207,669 | ||||||||
| SPECIALTY RETAIL—0.3% | ||||||||
| Kingfisher plc | 84,872 | 312,432 | ||||||
| TEXTILES, APPAREL & LUXURY GOODS—0.6% | ||||||||
| Burberry Group plc | 56,242 | 540,183 | ||||||
| TRADING COMPANIES & DISTRIBUTORS—0.8% | ||||||||
| Ashtead Group plc | 286,441 | 375,363 | ||||||
| Travis Perkins plc (a) | 25,668 | 351,528 | ||||||
| 726,891 | ||||||||
| WIRELESS TELECOMMUNICATION SERVICES—0.5% | ||||||||
| Vodafone Group plc | 184,685 | 427,678 | ||||||
| 22,131,986 | ||||||||
| TOTAL COMMON STOCKS | 92,218,967 | |||||||
| PREFERRED STOCK—2.0% | ||||||||
| GERMANY—2.0% | ||||||||
| HEALTH CARE EQUIPMENT & SUPPLIES—2.0% | ||||||||
| Fresenius SE (Preference) | 26,035 | 1,868,948 | ||||||
| INVESTMENT COMPANY—0.5% | ||||||||
| EXCHANGE TRADED FUND (ETF)—0.5% | ||||||||
| iShares MSCI EAFE Index Fund | 8,705 | 481,387 | ||||||
| CORPORATE NOTES—1.4% | ||||||||
| DEVELOPMENT AUTHORITIES—1.4% | ||||||||
| MMA Community Development Investment, Inc., 1.10%, 12/31/11(b)+ | 381,000 | 381,000 | ||||||
| MMA Community Development Investment, Inc., 0.73%, 12/31/12(b)+ | 543,000 | 543,000 | ||||||
| MMA Community Development Investment, Inc., 1.10%, 12/31/13(b)+ | 381,000 | 381,000 | ||||||
| TOTAL CORPORATE NOTES | 1,305,000 | |||||||
65
MMA Praxis International Fund
Schedule of portfolio investments, continued
December 31, 2009
| SHARES | VALUE | |||||||
| SHORT TERM INVESTMENT—0.0% | ||||||||
| JPMorgan U.S. Government Money Market Fund-Agency Shares | 232 | $ | 232 | |||||
| TOTAL INVESTMENTS (Cost* $80,275,287)—102.9% | $ | 95,874,534 | ||||||
| Net other assets (liabilities) — (2.9)% | (2,667,082 | ) | ||||||
| NET ASSETS—100% | $ | 93,207,452 | ||||||
| + | Variable rate security. Rates presented are the rates in effect at December 31, 2009. |
| (a) | Non-income producing securities. |
| (b) | Represents affiliated restricted security as to resale to shareholders and is not registered under the Securities Act of 1933. These securities have been deemed illiquid under guidelines established by the Board of Trustees: |
| Acquisition | |||||||||||
| Security | Yield | Shares | Date | ||||||||
| MMA Community Development Investment, Inc. | 0.73 | % | 543,000 | 12/2009 | |||||||
| MMA Community Development Investment, Inc. | 1.10 | % | 381,000 | 12/2009 | |||||||
| MMA Community Development Investment, Inc. | 1.10 | % | 381,000 | 12/2009 | |||||||
At December 31, 2009, these securities had an aggregate market value of $1,305,000, representing 1.4% of net assets.
| * | Represents cost for financial reporting purposes. |
ADR – American Depositary Receipt.
CVA – Dutch Certificate.
GDR – Global Depositary Receipt.
plc – Public Liability Company.
Other Information:
The inputs or methodology used for valuing securities may not be an indication of the risk associated with investing in those securities. For more information on valuation inputs, and their aggregation into the levels used in the table below, please refer to the Security Valuation section in the accompanying Notes to Financial Statements.
Valuation Inputs at Reporting Date:
| Description | Level 1 | Level 2 | Level 3 | Total | ||||||||||||
| Investments at Value | ||||||||||||||||
| Common Stocks | $ | 92,218,967 | $ | — | $ | — | $ | 92,218,967 | ||||||||
| Preferred Stock | — | 1,868,948 | — | 1,868,948 | ||||||||||||
| Investment Company | 481,387 | — | — | 481,387 | ||||||||||||
| Corporate Notes | — | — | 1,305,000 | 1,305,000 | ||||||||||||
| Short Term Investment | 232 | — | — | 232 | ||||||||||||
| Total Investments | $ | 92,700,586 | $ | 1,868,948 | $ | 1,305,000 | $ | 95,874,534 | ||||||||
| Level 1 | Level 2 | Level 3 | Total | |||||||||||||
| Other Financial Instruments* | ||||||||||||||||
| Forward Currency Contracts | $ | — | $ | (36,665 | ) | $ | — | $ | (36,665 | ) | ||||||
| * | Other financial instruments are derivative instruments not reflected in total investments. Amounts shown represent unrealized appreciation/depreciation. |
Following is a reconciliation of Level 3 assets for which significant unobservable inputs for Investments in Securities were used to determine fair value for each Fund:
| International Fund | ||||
| Balance as of December 31, 2008 | $ | 1,305,000 | ||
| Proceeds from Sales | (1,305,000 | ) | ||
| Purchases | 1,305,000 | |||
| Balance as of December 31, 2009 | $ | 1,305,000 | ||
See accompanying notes to financial statements.
66
| MMA Praxis Small Cap Fund |
MMA Praxis Small Cap Fund
Annual report to shareholders
Portfolio managers’ letter
The MMA Praxis Small Cap Fund (A shares NAV) gained 29.73 percent vs. the Russell 2000's 27.18 percent increase during the second half of 2009. The market rebound from the March lows has been significant, up 78 percent, making it one of the best performing periods in market history. But, despite the strong performance in 2009, the market is still below its highs of 2007.
The economy began growing again in the second half of 2009 and is positioned for continued growth in 2010. The aggressive monetary and fiscal policy stimulus is working and we believe its impact has yet to fully benefit the economy. We expect a typical economic recovery to continue to unfold. Not surprisingly, the stock market began discounting this recovery last spring. We believe economic growth will continue to surprise on the upside. We do see potential challenges on the horizon such as government debt/spending, tax policy, consumer leverage, inflation, etc., but believe these are issues for 2011 and beyond. The combination of market skepticism, which remains high despite the recent rebound, as well as our expectation of increased merger and acquisition activity, further strengthens our positive view on the stock market.
The Russell 2000’s performance in the second half of 2009 showed a shift back towards quality companies during the end of the calendar year. This was after the initial rebound in the second and third quarters when lower quality, low stock price, and low market cap companies led the charge. For 2009, the benchmark’s best performers were the sectors that were hit the hardest in 2008, namely the Consumer Discretionary, Materials, and Technology sectors. Performance in 2009 is similar to past periods, where the market rebound from bear market, recessionary lows was led by low quality companies. As the market continues to rotate back towards quality companies, our strategy should be well-positioned.
We are pleased with the Fund’s absolute and relative returns generated during 2009. As a high quality investor, we protected in the first quarter during the last leg down in the bear market, held our own in the low quality rally that followed in the second and third quarters, and outperformed in the fourth quarter as the market began rotating back to quality companies. During the second half of the year, sector allocation decisions were positive to our overall returns, especially helpful was our overweight positions in the Consumer discretionary and Energy sectors. Stock selection, while positive on an absolute basis, did slightly lag the low quality led benchmark. Stock selection in the Technology and Energy sectors was especially strong while our stocks in the Health Care and Financials sectors lagged their respective part of the benchmark.
Our investment strategy is to identify competitively advantaged companies that generate strong financial returns with good reinvestment opportunities and purchase these stocks at attractive prices. We believe this strategy of investing in competitively advantaged companies with viable strategies to increase the value of their businesses will continue to be beneficial for our investors.
Steven R. Purvis, CFA® Co-Portfolio Manager
Luther King Capital Management
67
Performance review |
MMA Praxis Small Cap Fund
Performance review
Total returns as of 12/31/09
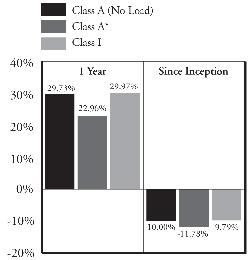
| Inception | Since | Expense Ratios** | |||
| Date | 1 Year | Inception | Gross | Net | |
| Class A (No Load) | 5/1/07 | 29.73% | -10.00% | 2.22% | 1.68% |
| Class A* | 5/1/07 | 22.96% | -11.78% | ||
| Class I | 5/1/07 | 29.97% | -9.79% | 1.29% | 1.29% |
Past performance does not guarantee future results. The performance data quoted represents past performance and current returns may be lower or higher. The investment return and principal value will fluctuate so that an investor's shares, when redeemed may be worth more or less than the original cost. These performance figures do not reflect the deduction of taxes that a shareholder would pay on fund distributions or the redemption of fund shares. To obtain performance information current to the most recent month end, please visit mmapraxis.com.
| * | Reflects maximum front-end sales charge of 5.25%. |
The total return set forth reflects certain expenses that were contractually or voluntarily reduced, reimbursed or paid by third party. In such instances, and without this activity, total return would have been lower.
| ** | Reflects the expense ratios as reported in the Prospectus dated May 1, 2009. Contractual fee waivers are in effect from May 1, 2009 through April 30, 2010 for Class A. Voluntary fee waivers were in effect through December 31, 2009 for Class I. |
68
MMA Praxis Small Cap Fund
Performance review
Growth of $10,000 investment 5/1/07 to 12/31/09
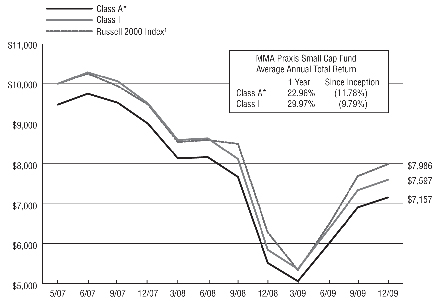
This chart represents historical performance of a hypothetical investment of $10,000 in the Small Cap Fund from 5/1/07 to 12/31/09, and represents the reinvestment of dividends and capital gains in the Fund.
Past performance does not guarantee future results. The performance data quoted represents past performance and current returns may be lower or higher. The investment return and principal value will fluctuate so that an investor's shares, when redeemed may be worth more or less than the original cost. These performance figures do not reflect the deduction of taxes that a shareholder would pay on fund distributions or the redemption of fund shares. To obtain performance information current to the most recent month end, please visit mmapraxis.com.
The total return set forth reflects certain expenses that were contractually or voluntarily reduced, reimbursed or paid by third party. In such instances, and without this activity, total return would have been lower.
| * | Reflects maximum front-end sales charge of 5.25%. |
| 1 | The Russell 2000 Index is a subset of the Russell 3000 Index representing approximately 10% of the total market capitalization of that index. It includes approximately 2000 of the smallest securities based on a combination of their market cap and current index membership. |
The above index is for illustrative purposes only and does not reflect the deduction of expenses associated with a mutual fund, such as investment management and fund accounting fees. The fund's performance reflects the deduction of these value-added services. An investor cannot invest directly in an index, although they can invest in its underlying securities.
69
| Schedule of portfolio investments |
MMA Praxis Small Cap Fund
Schedule of portfolio investments
December 31, 2009
| SHARES | VALUE | |||||||
| COMMON STOCKS—96.5% | ||||||||
| AIR FREIGHT & LOGISTICS—2.4% | ||||||||
| Forward Air Corp. | 11,750 | $ | 294,337 | |||||
| UTi Worldwide, Inc. | 16,550 | 236,996 | ||||||
| 531,333 | ||||||||
| CAPITAL MARKETS—2.2% | ||||||||
| Evercore Partners, Inc., Class A | 6,250 | 190,000 | ||||||
| Raymond James Financial, Inc. | 13,150 | 312,575 | ||||||
| 502,575 | ||||||||
| CHEMICALS—2.5% | ||||||||
| Calgon Carbon Corp. (a) | 18,950 | 263,405 | ||||||
| Schulman (A.), Inc. | 15,400 | 310,772 | ||||||
| 574,177 | ||||||||
| COMMERCIAL BANKS—4.7% | ||||||||
| First Horizon National Corp. (a) | 20,457 | 274,120 | ||||||
| Glacier Bancorp, Inc. | 13,750 | 188,650 | ||||||
| Prosperity Bancshares, Inc. | 6,750 | 273,173 | ||||||
| Synovus Financial Corp. | 60,600 | 124,230 | ||||||
| Texas Capital Bancshares, Inc. (a) | 13,700 | 191,252 | ||||||
| 1,051,425 | ||||||||
| COMMERCIAL SERVICES & SUPPLIES—2.1% | ||||||||
| Copart, Inc. (a) | 6,000 | 219,780 | ||||||
| Waste Connections, Inc. (a) | 7,700 | 256,718 | ||||||
| 476,498 | ||||||||
| COMMUNICATIONS EQUIPMENT—2.4% | ||||||||
| Arris Group, Inc. (a) | 12,600 | 144,018 | ||||||
| Brocade Communications Systems, Inc. (a) | 22,150 | 169,005 | ||||||
| F5 Networks, Inc. (a) | 4,300 | 227,814 | ||||||
| 540,837 | ||||||||
| COMPUTERS & PERIPHERALS—2.7% | ||||||||
| 3PAR, Inc. (a) | 22,200 | 263,070 | ||||||
| Electronics for Imaging, Inc. (a) | 7,150 | 93,021 | ||||||
| Netezza Corp. (a) | 24,900 | 241,530 | ||||||
| 597,621 | ||||||||
| CONSUMER FINANCE—2.6% | ||||||||
| Cash America International, Inc. | 9,550 | 333,868 | ||||||
| First Cash Financial Services, Inc. (a) | 11,600 | 257,404 | ||||||
| 591,272 | ||||||||
| CONTAINERS & PACKAGING—2.4% | ||||||||
| Packaging Corp of America | 13,500 | 310,635 | ||||||
| Silgan Holdings, Inc. | 4,100 | 237,308 | ||||||
| 547,943 | ||||||||
| DISTRIBUTORS—1.2% | ||||||||
| LKQ Corp. (a) | 13,300 | 260,547 | ||||||
70
MMA Praxis Small Cap Fund
Schedule of portfolio investments, continued
December 31, 2009
| SHARES | VALUE | |||||||
| COMMON STOCKS—96.5%, continued | ||||||||
| DIVERSIFIED CONSUMER SERVICES—2.5% | ||||||||
| Capella Education Co. (a) | 3,200 | $ | 240,960 | |||||
| K12, Inc. (a) | 15,800 | 320,266 | ||||||
| 561,226 | ||||||||
| ELECTRICAL EQUIPMENT—1.3% | ||||||||
| Baldor Electric Co. | 10,100 | 283,709 | ||||||
| ELECTRONIC EQUIPMENT, INSTRUMENTS & COMPONENTS—4.4% | ||||||||
| Itron, Inc. (a) | 3,550 | 239,873 | ||||||
| National Instruments Corp. | 10,700 | 315,115 | ||||||
| Rofin-Sinar Technologies, Inc. (a) | 9,400 | 221,934 | ||||||
| Trimble Navigation Ltd. (a) | 8,350 | 210,420 | ||||||
| 987,342 | ||||||||
| ENERGY EQUIPMENT & SERVICES—4.3% | ||||||||
| Atwood Oceanics, Inc. (a) | 5,950 | 213,308 | ||||||
| Core Laboratories NV | 2,500 | 295,300 | ||||||
| Dril-Quip, Inc. (a) | 5,750 | 324,760 | ||||||
| Willbros Group, Inc. (a) | 8,300 | 140,021 | ||||||
| 973,389 | ||||||||
| HEALTH CARE EQUIPMENT & SUPPLIES—7.4% | ||||||||
| American Medical Systems Holdings, Inc. (a) | 13,550 | 261,380 | ||||||
| Conceptus, Inc. (a) | 21,750 | 408,030 | ||||||
| Haemonetics Corp. (a) | 4,600 | 253,690 | ||||||
| Meridian Bioscience, Inc. | 8,050 | 173,478 | ||||||
| Merit Medical Systems, Inc. (a) | 3,250 | 62,692 | ||||||
| NuVasive, Inc. (a) | 9,250 | 295,815 | ||||||
| Wright Medical Group, Inc. (a) | 11,500 | 217,925 | ||||||
| 1,673,010 | ||||||||
| HEALTH CARE PROVIDERS & SERVICES—3.3% | ||||||||
| MWI Veterinary Supply, Inc. (a) | 11,450 | 431,665 | ||||||
| PSS World Medical, Inc. (a) | 13,800 | 311,466 | ||||||
| 743,131 | ||||||||
| HEALTH CARE TECHNOLOGY—0.9% | ||||||||
| MedAssets, Inc. (a) | 9,350 | 198,314 | ||||||
| HOUSEHOLD DURABLES—1.7% | ||||||||
| Tempur-Pedic International, Inc. (a) | 16,400 | 387,532 | ||||||
| INDUSTRIAL CONGLOMERATES—0.9% | ||||||||
| Raven Industries, Inc. | 6,350 | 201,740 | ||||||
| INSURANCE—0.9% | ||||||||
| Argo Group International Holdings Ltd. (a) | 6,609 | 192,586 | ||||||
71
MMA Praxis Small Cap Fund
Schedule of portfolio investments, continued
December 31, 2009
| SHARES | VALUE | |||||||
| COMMON STOCKS—96.5%, continued | ||||||||
| INTERNET & CATALOG RETAIL—1.2% | ||||||||
| PetMed Express, Inc. | 15,600 | $ | 275,028 | |||||
| INTERNET SOFTWARE & SERVICES—2.0% | ||||||||
| LogMeIn, Inc. (a) | 11,000 | 219,450 | ||||||
| MercadoLibre, Inc. (a) | 4,500 | 233,415 | ||||||
| 452,865 | ||||||||
| LIFE SCIENCES TOOLS & SERVICES—2.9% | ||||||||
| Luminex Corp. (a) | 6,400 | 95,552 | ||||||
| Parexel International Corp. (a) | 22,150 | 312,315 | ||||||
| Techne Corp. | 3,550 | 243,388 | ||||||
| 651,255 | ||||||||
| MACHINERY—4.2% | ||||||||
| CIRCOR International, Inc. | 7,000 | 176,260 | ||||||
| CLARCOR, Inc. | 5,350 | 173,554 | ||||||
| Kaydon Corp. | 9,100 | 325,416 | ||||||
| Mueller Water Products, Inc., Class A | 50,250 | 261,300 | ||||||
| 936,530 | ||||||||
| MARINE—1.3% | ||||||||
| Kirby Corp. (a) | 8,550 | 297,796 | ||||||
| MEDIA—1.1% | ||||||||
| Live Nation, Inc. (a) | 29,150 | 248,067 | ||||||
| METALS & MINING—1.5% | ||||||||
| Carpenter Technology Corp. | 12,200 | 328,790 | ||||||
| OIL, GAS & CONSUMABLE FUELS—3.3% | ||||||||
| Carrizo Oil & Gas, Inc. (a) | 10,400 | 275,496 | ||||||
| Concho Resources, Inc./Midland TX (a) | 4,350 | 195,315 | ||||||
| EXCO Resources, Inc. | 10,850 | 230,345 | ||||||
| Rosetta Resources, Inc. (a) | 1,700 | 33,881 | ||||||
| 735,037 | ||||||||
| PHARMACEUTICALS—0.9% | ||||||||
| Endo Pharmaceuticals Holdings, Inc. (a) | 10,300 | 211,253 | ||||||
| PROFESSIONAL SERVICES—2.3% | ||||||||
| Administaff, Inc. | 11,200 | 264,208 | ||||||
| Resources Connection, Inc. (a) | 11,950 | 253,579 | ||||||
| 517,787 | ||||||||
| ROAD & RAIL—1.2% | ||||||||
| Landstar System, Inc. | 7,200 | 279,144 | ||||||
72
MMA Praxis Small Cap Fund
Schedule of portfolio investments, continued
December 31, 2009
| PRINCIPAL | ||||||||
| AMOUNT/ | ||||||||
| SHARES | VALUE | |||||||
| COMMON STOCKS—96.5%, continued | ||||||||
| SEMICONDUCTORS & SEMICONDUCTOR EQUIPMENT—2.4% | ||||||||
| Formfactor, Inc. (a) | 13,500 | $ | 293,760 | |||||
| Intersil Corp., Class A | 16,300 | 250,042 | ||||||
| 543,802 | ||||||||
| SOFTWARE—7.2% | ||||||||
| ANSYS, Inc. (a) | 5,800 | 252,068 | ||||||
| MicroStrategy, Inc., Class A (a) | 3,600 | 338,472 | ||||||
| Nuance Communications, Inc. (a) | 17,950 | 278,943 | ||||||
| SolarWinds, Inc. (a) | 9,250 | 212,843 | ||||||
| Sybase, Inc. (a) | 5,300 | 230,020 | ||||||
| TIBCO Software, Inc. (a) | 32,800 | 315,864 | ||||||
| 1,628,210 | ||||||||
| SPECIALTY RETAIL—8.5% | ||||||||
| DSW, Inc., Class A (a) | 15,800 | 408,904 | ||||||
| Foot Locker, Inc. | 25,400 | 282,956 | ||||||
| Hibbett Sports, Inc. (a) | 14,050 | 308,959 | ||||||
| Monro Muffler Brake, Inc. | 3,550 | 118,712 | ||||||
| Signet Jewelers Ltd. (a) | 7,600 | 203,072 | ||||||
| Tractor Supply Co. (a) | 5,800 | 307,168 | ||||||
| Ulta Salon Cosmetics & Fragrance, Inc. (a) | 15,400 | 279,664 | ||||||
| 1,909,435 | ||||||||
| TEXTILES, APPAREL & LUXURY GOODS—1.4% | ||||||||
| Warnaco Group, Inc./The, Class A (a) | 7,550 | 318,534 | ||||||
| TRADING COMPANIES & DISTRIBUTORS—1.3% | ||||||||
| WESCO International, Inc. (a) | 10,750 | 290,358 | ||||||
| WIRELESS TELECOMMUNICATION SERVICES—1.0% | ||||||||
| SBA Communications Corp., Class A (a) | 6,800 | 232,288 | ||||||
| TOTAL COMMON STOCKS | 21,732,386 | |||||||
| CORPORATE NOTES—0.9% | ||||||||
| DEVELOPMENT AUTHORITIES—0.9% | ||||||||
| MMA Community Development Investment, Inc., 0.88%, 12/31/10(b)+ | 80,000 | 80,000 | ||||||
| MMA Community Development Investment, Inc., 1.32%, 12/31/10(b)+ | 120,000 | 120,000 | ||||||
| TOTAL CORPORATE NOTES | 200,000 | |||||||
73
MMA Praxis Small Cap Fund
Schedule of portfolio investments, continued
December 31, 2009
| SHARES | VALUE | |||||||
| SHORT TERM INVESTMENT—4.6% | ||||||||
| JPMorgan U.S. Government Money Market Fund-Agency Shares | 1,043,326 | $ | 1,043,326 | |||||
| TOTAL INVESTMENTS (Cost* $20,365,575) — 102.0% | $ | 22,975,712 | ||||||
| Net other assets (liabilities) — (2.0)% | (448,150 | ) | ||||||
| NET ASSETS—100% | $ | 22,527,562 | ||||||
| + | Variable rate security. Rates presented are the rates in effect at December 31, 2009. |
| (a) | Non-income producing securities. |
| (b) | Represents affiliated restricted security as to resale to shareholders and is not registered under the Securities Act of 1933. These securities have been deemed illiquid under guidelines established by the Board of Trustees: |
| Acquisition | |||||||||||
| Security | Yield | Shares | Date | ||||||||
| MMA Community Development Investment, Inc. | 0.88 | % | 80,000 | 12/2009 | |||||||
| MMA Community Development Investment, Inc. | 1.32 | % | 120,000 | 12/2009 | |||||||
At December 31, 2009, these securities had an aggregate market value of $200,000, representing 0.9% of net assets.
| * | Represents cost for financial reporting purposes. |
Other Information:
The inputs or methodology used for valuing securities may not be an indication of the risk associated with investing in those securities. For more information on valuation inputs, and their aggregation into the levels used in the table below, please refer to the Security Valuation section in the accompanying Notes to Financial Statements.
Valuation Inputs at Reporting Date:
| Description | Level 1 | Level 2 | Level 3 | Total | ||||||||||||
| Investments at Value | ||||||||||||||||
| Common Stocks | $ | 21,732,386 | $ | — | $ | — | $ | 21,732,386 | ||||||||
| Corporate Notes | — | — | 200,000 | 200,000 | ||||||||||||
| Short Term Investment | 1,043,326 | — | — | 1,043,326 | ||||||||||||
| Total Investments | $ | 22,775,712 | $ | — | $ | 200,000 | $ | 22,975,712 | ||||||||
Following is a reconciliation of Level 3 assets for which significant unobservable inputs for Investments in Securities were used to determine fair value for each Fund:
| Small Cap Fund | ||||
| Balance as of December 31, 2008 | $ | 200,000 | ||
| Proceeds from Sales | (200,000 | ) | ||
| Purchases | 200,000 | |||
| Balance as of December 31, 2009 | $ | 200,000 | ||
See accompanying notes to financial statements.
74
| Statements of assets and liabilities |
MMA Praxis Funds
Statements of assets & liabilities
December 31, 2009
| Intermediate | Core | Value | ||||||||||
| Income Fund | Stock Fund | Index Fund | ||||||||||
| Assets | ||||||||||||
| Investment securities, at cost | $ | 244,424,173 | $ | 189,916,692 | $ | 63,873,291 | ||||||
| Investment securities, at market value | $ | 248,842,051 | $ | 197,222,416 | $ | 61,252,894 | ||||||
| Investments in affiliates | 2,515,000 | 2,935,000 | 760,000 | |||||||||
| Cash | 34,115 | — | — | |||||||||
| Receivable for investments sold | 2,535,569 | 3,032,676 | 1,011,535 | |||||||||
| Receivable for capital shares sold | 3,036,877 | 656,219 | 236,223 | |||||||||
| Receivable for dividends and interest | 2,238,017 | 146,152 | 108,956 | |||||||||
| Receivable for tax reclaims | — | 23,024 | — | |||||||||
| Prepaid expenses | 10,310 | 9,833 | 9,220 | |||||||||
| Total Assets | 259,211,939 | 204,025,320 | 63,378,828 | |||||||||
| Liabilities | ||||||||||||
| Bank overdraft | — | 2,908,844 | 92,311 | |||||||||
| Distributions payable to shareholders | 477,197 | 351,132 | 101,930 | |||||||||
| Payable for capital shares redeemed | 930,505 | 2,398,196 | 448,195 | |||||||||
| Payable for investments purchased | 6,557,480 | 3,137,702 | 760,000 | |||||||||
| Accrued expenses and other payables: | ||||||||||||
| Investment advisory fees | 72,276 | 159,518 | 26,752 | |||||||||
| Affiliates | 114,830 | 94,309 | 29,277 | |||||||||
| Distribution fees | 37,675 | 32,068 | 14,219 | |||||||||
| Trustee fees | 1,045 | 4,045 | 6,045 | |||||||||
| Other | 50,929 | 42,408 | 17,013 | |||||||||
| Total Liabilities | 8,241,937 | 9,128,222 | 1,495,742 | |||||||||
| Net Assets | $ | 250,970,002 | $ | 194,897,098 | $ | 61,883,086 | ||||||
| Components of Net Assets | ||||||||||||
| Paid-in capital | $ | 245,936,132 | $ | 235,926,439 | $ | 79,129,822 | ||||||
| Accumulated net investment income (loss) | 50,695 | (473,319 | ) | 870,648 | ||||||||
Accumulated net realized losses on investments and foreign currency transactions | (1,949,703 | ) | (50,796,746 | ) | (16,256,987 | ) | ||||||
Net unrealized appreciation (depreciation) on investments and foreign currency transactions | 6,932,878 | 10,240,724 | (1,860,397 | ) | ||||||||
| Net Assets | $ | 250,970,002 | $ | 194,897,098 | $ | 61,883,086 | ||||||
75
MMA Praxis Funds
Statements of assets & liabilities, continued
December 31, 2009
| Intermediate | Core | Value | ||||||||||
| Income Fund | Stock Fund | Index Fund | ||||||||||
| Pricing of Class A Shares | ||||||||||||
| Net assets attributable to Class A shares | $ | 74,965,289 | $ | 93,119,818 | $ | 30,983,076 | ||||||
Shares of beneficial interest outstanding (unlimited number of shares authorized, no par value) | 7,350,658 | 8,241,847 | 4,372,397 | |||||||||
| Net asset value and redemption price per share | $ | 10.20 | $ | 11.30 | $ | 7.09 | ||||||
| Maximum sales charge | 3.75 | % | 5.25 | % | 5.25 | % | ||||||
Maximum offering price per share [(100%/(100%-Maximum Sales Charge)) of net asset value adjusted to the nearest cent] | $ | 10.60 | $ | 11.93 | $ | 7.48 | ||||||
| Pricing of Class I Shares | ||||||||||||
| Net assets attributable to Class I shares | $ | 176,004,713 | $ | 101,777,280 | $ | 30,900,010 | ||||||
Shares of beneficial interest outstanding (unlimited number of shares authorized, no par value) | 17,308,702 | 8,952,059 | 4,380,320 | |||||||||
Net asset value, offering price and redemption price per share | $ | 10.17 | $ | 11.37 | $ | 7.05 | ||||||
See accompanying Notes to Financial Statements.
76
MMA Praxis Funds
Statements of assets & liabilities
December 31, 2009
| Growth | International | Small Cap | ||||||||||
| Index Fund | Fund | Fund | ||||||||||
| Assets | ||||||||||||
| Investment securities, at cost | $ | 21,101,274 | $ | 80,275,287 | $ | 20,365,575 | ||||||
| Investment securities, at market value | $ | 20,987,066 | $ | 94,569,534 | $ | 22,775,712 | ||||||
| Investments in affiliates | 190,000 | 1,305,000 | 200,000 | |||||||||
| Foreign currency, at value (cost $1,695,039) | — | 1,696,187 | — | |||||||||
Unrealized appreciation on foreign forward currency exchange contracts | — | 49,315 | — | |||||||||
| Receivable for investments sold | 1,238,372 | 3,783,396 | 200,000 | |||||||||
| Receivable for capital shares sold | 63,238 | 245,493 | 93,448 | |||||||||
| Receivable for dividends and interest | 14,425 | 62,274 | 10,984 | |||||||||
| Receivable for tax reclaims | — | 405,374 | — | |||||||||
| Prepaid expenses | 15,141 | 13,122 | 15,505 | |||||||||
| Total Assets | 22,508,242 | 102,129,695 | 23,295,649 | |||||||||
| Liabilities | ||||||||||||
| Bank overdraft | 830,512 | 1,665,101 | — | |||||||||
| Distributions payable to shareholders | 12,055 | — | — | |||||||||
| Payable for capital shares redeemed | 149,882 | 3,536,581 | 281,523 | |||||||||
| Payable for investments purchased | 190,000 | 3,323,373 | 435,679 | |||||||||
Unrealized depreciation on foreign currency exchange contracts | — | 85,980 | — | |||||||||
| Accrued expenses and other payables: | ||||||||||||
| Investment advisory fees | 11,040 | 107,104 | 2,619 | |||||||||
| Affiliates | 12,951 | 69,459 | 20,647 | |||||||||
| Distribution fees | 131 | 14,970 | 903 | |||||||||
| Trustee fees | 4,045 | 11,045 | 7,045 | |||||||||
| Other | 13,851 | 108,630 | 19,671 | |||||||||
| Total Liabilities | 1,224,517 | 8,922,243 | 768,087 | |||||||||
| Net Assets | $ | 21,283,725 | $ | 93,207,452 | $ | 22,527,562 | ||||||
| Components of Net Assets | ||||||||||||
| Paid-in capital | $ | 24,712,346 | $ | 101,503,189 | $ | 27,572,828 | ||||||
| Accumulated net investment income (loss) | 11,536 | 747,234 | — | |||||||||
Accumulated net realized losses on investments and foreign currency transactions | (3,515,949 | ) | (24,642,218 | ) | (7,655,403 | ) | ||||||
Net unrealized appreciation (depreciation) on investments and foreign currency transactions | 75,792 | 15,599,247 | 2,610,137 | |||||||||
| Net Assets | $ | 21,283,725 | $ | 93,207,452 | $ | 22,527,562 | ||||||
77
MMA Praxis Funds
Statements of assets & liabilities, continued
December 31, 2009
| Growth | International | Small Cap | ||||||||||
| Index Fund | Fund | Fund | ||||||||||
| Pricing of Class A Shares | ||||||||||||
| Net assets attributable to Class A shares | $ | 4,713,981 | $ | 41,158,152 | $ | 4,227,177 | ||||||
| Shares of beneficial interest outstanding | ||||||||||||
| (unlimited number of shares authorized, no par value) | 541,058 | 4,164,305 | 559,577 | |||||||||
| Net asset value and redemption price per share | $ | 8.71 | $ | 9.88 | $ | 7.55 | ||||||
| Maximum sales charge | 5.25 | % | 5.25 | % | 5.25 | % | ||||||
| Maximum offering price per share [(100%/(100%-Maximum | ||||||||||||
| Sales Charge)) of net asset value adjusted | ||||||||||||
| to the nearest cent] | $ | 9.19 | $ | 10.43 | $ | 7.97 | ||||||
| Pricing of Class I Shares | ||||||||||||
| Net assets attributable to Class I shares | $ | 16,569,744 | $ | 52,049,300 | $ | 18,300,385 | ||||||
| Shares of beneficial interest outstanding | ||||||||||||
| (unlimited number of shares authorized, no par value) | 1,899,765 | 5,250,262 | 2,411,369 | |||||||||
| Net asset value, offering price and | ||||||||||||
| redemption price per share | $ | 8.72 | $ | 9.91 | $ | 7.59 | ||||||
See accompanying Notes to Financial Statements.
78
| Statements of operations |
MMA Praxis Funds
Statements of operations
For the year ended December 31, 2009
| Intermediate | Core | Value | ||||||||||
| Income Fund | Stock Fund | Index Fund | ||||||||||
| Investment Income | ||||||||||||
| Dividends | $ | 11,808 | $ | 2,733,912 | $ | 1,582,964 | ||||||
| Foreign tax withholding | — | (33,177 | ) | — | ||||||||
| Interest | 11,693,094 | 142,258 | 3,973 | |||||||||
| Income from securities lending | 4,812 | 4,225 | 457 | |||||||||
| Interest from affiliates | 28,184 | 31,082 | 8,964 | |||||||||
| Total Investment Income | 11,737,898 | 2,878,300 | 1,596,358 | |||||||||
| Expenses | ||||||||||||
| Investment advisory fees | 905,544 | 1,294,813 | 158,905 | |||||||||
| Administration fees | 316,939 | 245,018 | 74,153 | |||||||||
| Distribution fees - Class A | 148,488 | 169,915 | 57,499 | |||||||||
| Distribution fees - Class B | 72,494 | 94,654 | 27,236 | |||||||||
| Shareholder servicing fees - Class A | 150,542 | 172,353 | 58,227 | |||||||||
| Shareholder servicing fees - Class B | 22,453 | 29,113 | 8,345 | |||||||||
| Transfer agent fees - Class A | 30,007 | 56,143 | 19,111 | |||||||||
| Transfer agent fees - Class B | 2,042 | 5,633 | 1,507 | |||||||||
| Transfer agent fees - Class I | 116 | 55 | — | |||||||||
| Registration fees - Class A | 11,653 | 13,426 | 15,914 | |||||||||
| Registration fees - Class B | 10,561 | 11,118 | 10,449 | |||||||||
| Registration fees - Class I | 7,600 | 1,498 | 1,274 | |||||||||
| Shareholder report printing fees - Class A | 2,737 | 16,212 | 2,640 | |||||||||
| Shareholder report printing fees - Class I | 2,614 | 2,442 | 1,433 | |||||||||
| Professional fees | 182,634 | 132,069 | 65,374 | |||||||||
| Supplies | 86,626 | 116,479 | 36,803 | |||||||||
| DDA fees | 13,529 | 14,190 | 13,008 | |||||||||
| Custodian fees | 23,217 | 27,636 | 7,118 | |||||||||
| Trustees' fees and expenses | 6,509 | 2,596 | 9,750 | |||||||||
| Other expenses | 78,090 | 42,452 | 12,189 | |||||||||
| Total Expenses Before Reductions/Reimbursements | 2,074,395 | 2,447,815 | 580,935 | |||||||||
| Expenses waived by Investment Adviser | (155,493 | ) | (3,774 | ) | (36,005 | ) | ||||||
| Expenses reduced by Distributor | (172,653 | ) | (182,535 | ) | (64,762 | ) | ||||||
| Net Expenses | 1,746,249 | 2,261,506 | 480,168 | |||||||||
| Net Investment Income | 9,991,649 | 616,794 | 1,116,190 | |||||||||
| Realized and Unrealized Gains (Losses) on Investments | ||||||||||||
| Net realized gains (losses) on investments and | ||||||||||||
| foreign currency transactions | 1,340,065 | (35,307,988 | ) | (9,604,583 | ) | |||||||
| Net realized losses on closed futures contracts | — | (139,716 | ) | (34,929 | ) | |||||||
| Change in unrealized appreciation/depreciation of investments | ||||||||||||
| and foreign currency translations | 11,138,756 | 82,104,957 | 20,072,651 | |||||||||
| Change in unrealized depreciation on futures contracts | — | 7,800 | 1,950 | |||||||||
| Net Realized and Unrealized Gains on Investments | ||||||||||||
| and Foreign Currency Transactions | 12,478,821 | 46,665,053 | 10,435,089 | |||||||||
| Net Change in Net Assets from Operations | $ | 22,470,470 | $ | 47,281,847 | $ | 11,551,279 | ||||||
See accompanying Notes to Financial Statements.
79
MMA Praxis Funds
Statements of operations
For the year ended December 31, 2009
| Growth | International | Small Cap | ||||||||||
| Index Fund | Fund | Fund | ||||||||||
| Investment Income | ||||||||||||
| Dividends | $ | 243,598 | $ | 2,855,590 | $ | 133,054 | ||||||
| Foreign tax withholding | (19 | ) | (360,200 | ) | (67 | ) | ||||||
| Interest | 119 | 4,990 | 1,815 | |||||||||
| Income from securities lending | 38 | 3,514 | 156 | |||||||||
| Interest from affiliates | 2,274 | 14,303 | 2,214 | |||||||||
| Total Investment Income | 246,010 | 2,518,197 | 137,172 | |||||||||
| Expenses | ||||||||||||
| Investment advisory fees | 54,568 | 768,999 | 167,154 | |||||||||
| Administration fees | 25,465 | 119,621 | 27,531 | |||||||||
| Distribution fees - Class A | 8,530 | 76,953 | 7,688 | |||||||||
| Distribution fees - Class B | 3,973 | 39,237 | 2,206 | |||||||||
| Shareholder servicing fees - Class A | 8,624 | 77,928 | 7,741 | |||||||||
| Shareholder servicing fees - Class B | 1,218 | 12,104 | 675 | |||||||||
| Transfer agent fees - Class A | 4,159 | 30,111 | 4,968 | |||||||||
| Transfer agent fees - Class B | 316 | 3,270 | 228 | |||||||||
| Transfer agent fees - Class I | 33 | — | 38 | |||||||||
| Registration fees - Class A | 5,817 | 8,550 | 5,509 | |||||||||
| Registration fees - Class B | 6,054 | 14,217 | 4,693 | |||||||||
| Registration fees - Class I | 3,958 | — | 3,540 | |||||||||
| Shareholder report printing fees - Class A | 2,735 | 15,009 | 4,547 | |||||||||
| Shareholder report printing fees - Class I | 2,525 | 15,998 | 2,339 | |||||||||
| Professional fees | 24,546 | 65,475 | 32,312 | |||||||||
| Trustees' fees and expenses | 11,414 | 17,565 | 16,347 | |||||||||
| Supplies | 9,956 | 45,116 | 15,853 | |||||||||
| DDA fees | 12,178 | 11,533 | 16,654 | |||||||||
| Custodian fees | 5,656 | 99,983 | 7,072 | |||||||||
| Other expenses | 6,287 | 29,751 | 5,313 | |||||||||
| Total Expenses Before Reductions/Reimbursements | 198,012 | 1,451,420 | 332,408 | |||||||||
| Expenses waived by Investment Adviser | (32,114 | ) | (32,571 | ) | (55,847 | ) | ||||||
| Expenses reduced by Distributor | (9,575 | ) | (82,184 | ) | (7,973 | ) | ||||||
| Net Expenses | 156,323 | 1,336,665 | 268,588 | |||||||||
| Net Investment Income (Loss) | 89,687 | 1,181,532 | (131,416 | ) | ||||||||
| Realized and Unrealized Gains (Losses) on Investments | ||||||||||||
| Net realized losses on investments | (1,354,921 | ) | (4,733,661 | ) | (2,916,387 | ) | ||||||
| Net realized gains on foreign currency transactions | — | 451,201 | — | |||||||||
| Change in unrealized appreciation/depreciation of investments | 6,910,513 | 16,886,546 | 8,479,620 | |||||||||
| Change in unrealized appreciation/depreciation | ||||||||||||
| on foreign currency translations | — | (837,202 | ) | — | ||||||||
| Net Realized and Unrealized Gains on Investments | ||||||||||||
| and Foreign Currency Transactions | 5,555,592 | 11,766,884 | 5,563,233 | |||||||||
| Net Change in Net Assets from Operations | $ | 5,645,279 | $ | 12,948,416 | $ | 5,431,817 | ||||||
See accompanying Notes to Financial Statements.
80
| Statements of changes in net assets |
MMA Praxis Intermediate Income Fund
Statements of changes in net assets
| Intermediate Income Fund | Core Stock Fund | Value Index Fund | ||||||||||||||||||||||
For the Year Ended December 31, 2009 | For the Year Ended December 31, 2008 | For the Year Ended December 31, 2009 | For the Year Ended December 31, 2008 | For the Year Ended December 31, 2009 | For the Year Ended December 31, 2008 | |||||||||||||||||||
| From Operations | ||||||||||||||||||||||||
| Net investment income | $ | 9,991,649 | $ | 11,966,396 | $ | 616,794 | $ | 1,126,910 | $ | 1,116,190 | $ | 1,502,908 | ||||||||||||
| Net realized gains (losses) from | ||||||||||||||||||||||||
| security transactions | 1,340,065 | (74,690 | ) | (35,447,704 | ) | (16,900,843 | ) | (9,639,512 | ) | (6,003,619 | ) | |||||||||||||
| Net change in unrealized appreciation/ | ||||||||||||||||||||||||
| depreciation on investments, | ||||||||||||||||||||||||
| foreign currency translations | ||||||||||||||||||||||||
| and futures contracts | 11,138,756 | (5,115,135 | ) | 82,112,757 | (100,867,309 | ) | 20,074,601 | (26,224,139 | ) | |||||||||||||||
| Net Change in Net Assets | ||||||||||||||||||||||||
| from Operations | 22,470,470 | 6,776,571 | 47,281,847 | (116,641,242 | ) | 11,551,279 | (30,724,850 | ) | ||||||||||||||||
| Distributions to Shareholders | ||||||||||||||||||||||||
| From net investment | ||||||||||||||||||||||||
| income - Class A | (2,438,125 | ) | (2,337,563 | ) | (326,755 | ) | (308,208 | ) | (101,452 | ) | (578,462 | ) | ||||||||||||
| From net investment | ||||||||||||||||||||||||
| income - Class B | (369,458 | ) | (767,959 | ) | — | — | — | (139,543 | ) | |||||||||||||||
| From net investment | ||||||||||||||||||||||||
| income - Class I | (7,230,736 | ) | (9,293,736 | ) | (583,213 | ) | (745,527 | ) | (160,741 | ) | (749,372 | ) | ||||||||||||
| From net realized gains | ||||||||||||||||||||||||
| on investments - Class A | — | — | — | — | — | (351,774 | ) | |||||||||||||||||
| From net realized gains | ||||||||||||||||||||||||
| on investments - Class B | — | — | — | — | — | (112,426 | ) | |||||||||||||||||
| From net realized gains | ||||||||||||||||||||||||
| on investments - Class I | — | — | — | — | — | (444,637 | ) | |||||||||||||||||
| Decrease in Net Assets from | ||||||||||||||||||||||||
| Distributions to Shareholders | (10,038,319 | ) | (12,399,258 | ) | (909,968 | ) | (1,053,735 | ) | (262,193 | ) | (2,376,214 | ) | ||||||||||||
| Change in Net Assets | ||||||||||||||||||||||||
| from Capital Transactions | 19,716,611 | (57,912,102 | ) | (20,151,210 | ) | (25,935,164 | ) | (692,436 | ) | 13,880,779 | ||||||||||||||
| Total Increase (Decrease) | ||||||||||||||||||||||||
| in Net Assets | 32,148,762 | (63,534,789 | ) | 26,220,669 | (143,630,141 | ) | 10,596,650 | (19,220,285 | ) | |||||||||||||||
| Net Assets | ||||||||||||||||||||||||
| Beginning of year | 218,821,240 | 282,356,029 | 168,676,429 | 312,306,570 | 51,286,436 | 70,506,721 | ||||||||||||||||||
| End of year | $ | 250,970,002 | $ | 218,821,240 | $ | 194,897,098 | $ | 168,676,429 | $ | 61,883,086 | $ | 51,286,436 | ||||||||||||
| Accumulated (Distributions in | ||||||||||||||||||||||||
| Excess of) Net Investment | ||||||||||||||||||||||||
| Income | $ | 50,695 | $ | (35,513 | ) | $ | (473,319 | ) | $ | (162,699 | ) | $ | 870,648 | $ | 42,039 | |||||||||
See accompanying Notes to Financial Statements.
81
MMA Praxis Funds
Statements of changes in net assets
Growth Index Fund | International Fund | Small Cap Fund | ||||||||||||||||||||||
For the Year Ended December 31, 2009 | For the Year Ended December 31, 2008 | For the Year Ended December 31, 2009 | For the Year Ended December 31, 2008 | For the Year Ended December 31, 2009 | For the Year Ended December 31, 2008 | |||||||||||||||||||
| From Operations | ||||||||||||||||||||||||
| Net investment income (loss) | $ | 89,687 | $ | 92,810 | $ | 1,181,532 | $ | 1,670,179 | $ | (131,416 | ) | $ | (66,123 | ) | ||||||||||
| Net realized losses from | ||||||||||||||||||||||||
| security transactions | (1,354,921 | ) | (4,027,027 | ) | (4,282,460 | ) | (18,859,217 | ) | (2,916,387 | ) | (4,597,930 | ) | ||||||||||||
| Net change in unrealized appreciation/ | ||||||||||||||||||||||||
| depreciation on investments | 6,910,513 | (6,294,703 | ) | 16,049,344 | (45,291,217 | ) | 8,479,620 | (5,021,850 | ) | |||||||||||||||
| Net Change in Net Assets | ||||||||||||||||||||||||
| from Operations | 5,645,279 | (10,228,920 | ) | 12,948,416 | (62,480,255 | ) | 5,431,817 | (9,685,903 | ) | |||||||||||||||
| Distributions to Shareholders | ||||||||||||||||||||||||
| From net investment | ||||||||||||||||||||||||
| income - Class A | (13,235 | ) | (6,308 | ) | — | (460,064 | ) | — | — | |||||||||||||||
| From net investment | ||||||||||||||||||||||||
| income - Class B | — | (840 | ) | — | (127,793 | ) | — | — | ||||||||||||||||
| From net investment | ||||||||||||||||||||||||
| income - Class I | (63,506 | ) | (85,390 | ) | — | (851,080 | ) | — | — | |||||||||||||||
| From net realized gains | ||||||||||||||||||||||||
| on investments - Class A | — | — | — | (1,071,269 | ) | — | — | |||||||||||||||||
| From net realized gains | ||||||||||||||||||||||||
| on investments - Class B | — | — | — | (416,502 | ) | — | — | |||||||||||||||||
| From net realized gains | ||||||||||||||||||||||||
| on investments - Class I | — | — | — | (1,999,000 | ) | — | — | |||||||||||||||||
| From return of capital - Class A | — | — | — | (67,747 | ) | — | ||||||||||||||||||
| From return of capital - Class B | — | — | — | (18,818 | ) | — | — | |||||||||||||||||
| From return of capital - Class I | — | — | — | (125,327 | ) | — | — | |||||||||||||||||
| Decrease in Net Assets from | ||||||||||||||||||||||||
| Distributions to Shareholders | (76,741 | ) | (92,538 | ) | — | (5,137,600 | ) | — | — | |||||||||||||||
| Change in Net Assets from | ||||||||||||||||||||||||
| Capital Transactions | 42,572 | (1,057,862 | ) | (4,614,235 | ) | (30,585,816 | ) | (1,059,543 | ) | 10,667,638 | ||||||||||||||
| Total Increase (Decrease) | ||||||||||||||||||||||||
| in Net Assets | 5,611,110 | (11,379,320 | ) | 8,334,181 | (98,203,671 | ) | 4,372,274 | 981,735 | ||||||||||||||||
| Net Assets | ||||||||||||||||||||||||
| Beginning of year | 15,672,615 | 27,051,935 | 84,873,271 | 183,076,942 | 18,155,288 | 17,173,553 | ||||||||||||||||||
| End of year | $ | 21,283,725 | $ | 15,672,615 | $ | 93,207,452 | $ | 84,873,271 | $ | 22,527,562 | $ | 18,155,288 | ||||||||||||
| Accumulated (Distributions in | ||||||||||||||||||||||||
| Excess of) Net Investment | ||||||||||||||||||||||||
| Income | $ | 11,536 | $ | (1,019 | ) | $ | 747,234 | $ | (1,334,988 | ) | $ | — | $ | — | ||||||||||
See accompanying Notes to Financial Statements.
82
| Financial highlights |
MMA Praxis Funds
Financial highlights
For a share outstanding throughout the year indicated.
| MMA Praxis Intermediate Income Fund - Class A | ||||||||||||||||||||
| Year Ended | Year Ended | Year Ended | Year Ended | Year Ended | ||||||||||||||||
| December 31, | December 31, | December 31, | December 31, | December 31, | ||||||||||||||||
| 2009 (a) | 2008 | 2007 | 2006 | 2005 | ||||||||||||||||
Net asset value at beginning of year | $ | 9.62 | $ | 9.78 | $ | 9.66 | $ | 9.73 | $ | 9.95 | ||||||||||
Income (loss) from investment operations: | ||||||||||||||||||||
| Net investment income | 0.43 | 0.45 | 0.41 | 0.38 | 0.37 | |||||||||||||||
| Net realized and unrealized gains | ||||||||||||||||||||
| (losses) on investments | 0.56 | (0.16 | ) | 0.15 | (0.04 | ) | (0.19 | ) | ||||||||||||
| Total from investment operations | 0.99 | 0.29 | 0.56 | 0.34 | 0.18 | |||||||||||||||
| Less Distributions: | ||||||||||||||||||||
Dividends from net investment income | (0.41 | ) | (0.45 | ) | (0.44 | ) | (0.41 | ) | (0.40 | ) | ||||||||||
Paid-in capital from redemption fees (b) | — | — | — | — | — | |||||||||||||||
| Net asset value at end of year | $ | 10.20 | $ | 9.62 | $ | 9.78 | $ | 9.66 | $ | 9.73 | ||||||||||
| Total return (excludes sales charge) | 10.49 | % | 3.09 | % | 5.91 | % | 3.63 | % | 1.82 | % | ||||||||||
| Net assets at end of year (000s) | $ | 74,965 | $ | 49,693 | $ | 48,951 | $ | 41,350 | $ | 239,583 | ||||||||||
Ratio of net expenses to average net assets | 0.92 | % | 0.88 | % | 0.88 | % | 0.93 | % | 0.94 | % | ||||||||||
Ratio of net investment income to average net assets | 4.22 | % | 4.49 | % | 4.23 | % | 4.19 | % | 3.77 | % | ||||||||||
Ratio of expenses to average net assets* | 1.27 | % | 1.21 | % | 1.27 | % | 1.28 | % | 1.23 | % | ||||||||||
| Portfolio turnover rate (c) | 28.56 | % | 25.46 | % | 29.22 | % | 34.19 | % | 37.79 | % | ||||||||||
| * | During the period, certain expenses were reduced and/or reimbursed by the Adviser and/or Distributor. If such expense reductions had not occurred, the ratios would have been as indicated. |
| (a) | On August 17, 2009, Class B shares were exchanged for Class A shares. |
| (b) | Amount rounds to less than $0.005 per share. |
| (c) | Portfolio turnover is calculated on the basis of the Fund as a whole without distinguishing between classes of shares issued. |
See accompanying Notes to Financial Statements.
83
MMA Praxis Funds
Financial highlights
For a share outstanding throughout the period indicated.
| MMA Praxis Intermediate Income Fund - Class I | ||||||||||||||||
| Year Ended | Year Ended | Year Ended | Period Ended | |||||||||||||
| December 31, | December 31, | December 31, | December 31, | |||||||||||||
| 2009 | 2008 | 2007 | 2006 (a) | |||||||||||||
Net asset value at beginning of period | $ | 9.61 | $ | 9.77 | $ | 9.65 | $ | 9.47 | ||||||||
Income (loss) from investment operations: | ||||||||||||||||
| Net investment income | 0.45 | 0.47 | 0.43 | 0.29 | ||||||||||||
Net realized and unrealized gains (losses) on investments | 0.57 | (0.16 | ) | 0.15 | 0.18 | |||||||||||
| Total from investment operations | 1.02 | 0.31 | 0.58 | 0.47 | ||||||||||||
| Less Distributions: | ||||||||||||||||
Dividends from net investment income | (0.46 | ) | (0.47 | ) | (0.46 | ) | (0.29 | ) | ||||||||
Paid-in capital from redemption fees | — | — | (b) | — | — | (b) | ||||||||||
| Net asset value at end of period | $ | 10.17 | $ | 9.61 | $ | 9.77 | $ | 9.65 | ||||||||
| Total return (excludes sales charge) | 10.79 | % | 5.21 | % | 6.18 | % | 5.07 | %(d) | ||||||||
| Net assets at end of period (000s) | $ | 176,005 | $ | 153,332 | $ | 212,097 | $ | 206,221 | ||||||||
Ratio of net expenses to average net assets | 0.67 | % | 0.63 | % | 0.63 | % | 0.63 | %(e) | ||||||||
Ratio of net investment income to average net assets | 4.51 | % | 4.73 | % | 4.48 | % | 4.47 | %(e) | ||||||||
Ratio of expenses to average net assets* | 0.72 | % | 0.64 | % | 0.77 | % | 0.76 | %(e) | ||||||||
| Portfolio turnover rate (c) | 28.56 | % | 25.46 | % | 29.22 | % | 34.19 | % | ||||||||
| * | During the period, certain expenses were reduced and/or reimbursed by the Adviser and/or Distributor. If such activity had not occurred, the ratios would have been as indicated. |
| (a) | For the period from May 1, 2006 (commencement of operations) through December 31, 2006. |
| (b) | Amount rounds to less than $0.005 per share. |
| (c) | Portfolio turnover is calculated on the basis of the Fund as a whole without distinguishing between classes of shares issued. |
| (d) | Not annualized. |
| (e) | Annualized. |
See accompanying Notes to Financial Statements.
84
MMA Praxis Funds
Financial highlights
For a share outstanding throughout the year indicated.
| MMA Praxis Core Stock Fund - Class A | ||||||||||||||||||||
| Year Ended | Year Ended | Year Ended | Year Ended | Year Ended | ||||||||||||||||
| December 31, | December 31, | December 31, | December 31, | December 31, | ||||||||||||||||
| 2009 (a) | 2008 | 2007 | 2006 | 2005 | ||||||||||||||||
| Net asset value at beginning of year | $ | 8.79 | $ | 14.87 | $ | 15.40 | $ | 14.42 | $ | 13.99 | ||||||||||
| Income (loss) from investment operations: | ||||||||||||||||||||
| Net investment income | 0.01 | 0.05 | 0.13 | 0.04 | 0.07 | |||||||||||||||
| Net realized and unrealized gains (losses) on investments | 2.54 | (6.08 | ) | (0.24 | ) | 1.70 | 0.42 | |||||||||||||
| Total from investment operations | 2.55 | (6.03 | ) | (0.11 | ) | 1.74 | 0.49 | |||||||||||||
| Less Distributions: | ||||||||||||||||||||
| Dividends from net investment income | (0.04 | ) | (0.05 | ) | (0.14 | ) | — | (0.06 | ) | |||||||||||
| Distributions from net realized gains | — | — | (0.28 | ) | (0.76 | ) | — | |||||||||||||
| Total distributions | (0.04 | ) | (0.05 | ) | (0.42 | ) | (0.76 | ) | (0.06 | ) | ||||||||||
| Paid-in capital from redemption fees (b) | — | — | — | — | — | |||||||||||||||
| Net asset value at end of year | $ | 11.30 | $ | 8.79 | $ | 14.87 | $ | 15.40 | $ | 14.42 | ||||||||||
| Total return (excludes sales charge) | 29.00 | % | (40.64 | %) | (0.68 | %) | 12.10 | % | 3.52 | % | ||||||||||
| Net assets at end of period (000s) | $ | 93,120 | $ | 55,151 | $ | 99,838 | $ | 95,185 | $ | 208,640 | ||||||||||
| Ratio of net expenses to average net assets | 1.44 | % | 1.31 | % | 1.45 | % | 1.49 | % | 1.34 | % | ||||||||||
| Ratio of net investment income to average net assets | 0.15 | % | 0.42 | % | 0.81 | % | 0.19 | % | 0.50 | % | ||||||||||
| Ratio of expenses to average net assets* | 1.69 | % | 1.56 | % | 1.70 | % | 1.74 | % | 1.60 | % | ||||||||||
| Portfolio turnover rate (c) | 12.64 | % | 29.73 | % | 12.17 | % | 72.41 | % | 32.66 | % | ||||||||||
| * | During the period, certain expenses were reduced and/or reimbursed by the Adviser and/or Distributor. If such expense reductions had not occurred, the ratios would have been as indicated. |
| (a) | On August 17, 2009, Class B shares were exchanged for Class A shares. |
| (b) | Amount rounds to less than $0.005 per share. |
| (c) | Portfolio turnover is calculated on the basis of the Fund as a whole without distinguishing between classes of shares issued. |
See accompanying Notes to Financial Statements.
85
MMA Praxis Funds
Financial highlights
For a share outstanding throughout the period indicated.
| MMA Praxis Core Stock Fund - Class I | ||||||||||||||||
| Year Ended | Year Ended | Year Ended | Period Ended | |||||||||||||
| December 31, | December 31, | December 31, | December 31, | |||||||||||||
| 2009 | 2008 | 2007 | 2006 (a) | |||||||||||||
Net asset value at beginning of period | $ | 8.84 | $ | 14.94 | $ | 15.45 | $ | 14.76 | ||||||||
Income (loss) from investment operations: | ||||||||||||||||
| Net investment income | 0.06 | 0.09 | 0.20 | 0.04 | ||||||||||||
Net realized and unrealized gains (losses) on investments | 2.53 | (6.11 | ) | (0.24 | ) | 1.41 | ||||||||||
| Total from investment operations | 2.59 | (6.02 | ) | (0.04 | ) | 1.45 | ||||||||||
| Less Distributions: | ||||||||||||||||
Dividends from net investment income | (0.06 | ) | (0.08 | ) | (0.19 | ) | — | |||||||||
| Distributions from net realized gains | — | — | (0.28 | ) | (0.76 | ) | ||||||||||
| Total distributions | (0.06 | ) | (0.08 | ) | (0.47 | ) | (0.76 | ) | ||||||||
Paid-in capital from redemption fees | — | — | (b) | — | — | |||||||||||
| Net asset value at end of period | $ | 11.37 | $ | 8.84 | $ | 14.94 | $ | 15.45 | ||||||||
| Total return (excludes sales charge) | 29.35 | % | (40.43 | %) | (0.26 | %) | 9.86 | %(d) | ||||||||
| Net assets at end of period (000s) | $ | 101,777 | $ | 90,820 | $ | 159,737 | $ | 173,565 | ||||||||
Ratio of net expenses to average net assets | 1.08 | % | 1.01 | % | 1.05 | % | 1.02 | %(e) | ||||||||
Ratio of net investment income to average net assets | 0.57 | % | 0.72 | % | 1.20 | % | 0.43 | %(e) | ||||||||
Ratio of expenses to average net assets* | 1.08 | % | 1.01 | % | 1.05 | % | 1.03 | %(e) | ||||||||
| Portfolio turnover rate (c) | 12.64 | % | 29.73 | % | 12.17 | % | 72.41 | % | ||||||||
* | During the period, certain expenses were reduced and/or reimbursed by the Adviser and/or Distributor. If such activity had not occurred, the ratios would have been as indicated. |
| (a) | For the period from May 1, 2006 (commencement of operations) through December 31, 2006. |
| (b) | Amount rounds to less than $0.005 per share. |
| (c) | Portfolio turnover is calculated on the basis of the Fund as a whole without distinguishing between classes of shares issued. |
| (d) | Not annualized. |
| (e) | Annualized. |
See accompanying Notes to Financial Statements.
86
MMA Praxis Funds
Financial highlights
For a share outstanding throughout the year indicated.
| MMA Praxis Value Index Fund - Class A | ||||||||||||||||||||
| Year Ended | Year Ended | Year Ended | Year Ended | Year Ended | ||||||||||||||||
| December 31, | December 31, | December 31, | December 31, | December 31, | ||||||||||||||||
| 2009 (a) | 2008 | 2007 | 2006 | 2005 | ||||||||||||||||
Net asset value at beginning of period | $ | 5.80 | $ | 10.12 | $ | 11.43 | $ | 10.09 | $ | 9.65 | ||||||||||
Income (loss) from investment operations: | ||||||||||||||||||||
| Net investment income | 0.10 | 0.18 | 0.17 | 0.22 | 0.15 | |||||||||||||||
| Net realized and unrealized gains | ||||||||||||||||||||
| (losses) on investments | 1.21 | (4.21 | ) | (0.93 | ) | 1.82 | 0.44 | |||||||||||||
| Total from investment operations | 1.31 | (4.03 | ) | (0.76 | ) | 2.04 | 0.59 | |||||||||||||
| Less Distributions: | ||||||||||||||||||||
Dividends from net investment income | (0.02 | ) | (0.18 | ) | (0.20 | ) | (0.13 | ) | (0.15 | |||||||||||
Distributions from net realized gains | — | (0.11 | ) | (0.35 | ) | (0.57 | ) | — | ||||||||||||
| Total distributions | (0.02 | ) | (0.29 | ) | (0.55 | ) | (0.70 | ) | (0.15 | ) | ||||||||||
Paid-in capital from redemption fees (b) | — | — | — | — | — | |||||||||||||||
| Net asset value at end of period | $ | 7.09 | $ | 5.80 | $ | 10.12 | $ | 11.43 | $ | 10.09 | ||||||||||
| Total return (excludes sales charge) | 22.64 | % | (40.15 | %) | (6.66 | %) | 20.41 | % | 6.12 | % | ||||||||||
| Net assets at end of period (000s) | $ | 30,983 | $ | 20,019 | $ | 28,209 | $ | 22,426 | $ | 39,874 | ||||||||||
Ratio of net expenses to average net assets | 1.01 | % | 0.97 | % | 0.90 | % | 1.11 | % | 1.04 | % | ||||||||||
Ratio of net investment income to average net assets | 1.96 | % | 2.35 | % | 1.87 | % | 1.52 | % | 1.55 | % | ||||||||||
Ratio of expenses to average net assets* | 1.33 | % | 1.27 | % | 1.18 | % | 1.37 | % | 1.30 | % | ||||||||||
| Portfolio turnover rate (c) | 25.72 | % | 20.66 | % | 33.34 | % | 55.37 | % | 25.25 | % | ||||||||||
| * | During the period, certain expenses were reduced and/or reimbursed by the Adviser and/or Distributor. If such expense reductions had not occurred, the ratios would have been as indicated. |
| (a) | On August 17, 2009, Class B shares were exchanged for Class A shares. |
| (b) | Amount rounds to less than $0.005 per share. |
| (c) | Portfolio turnover is calculated on the basis of the Fund as a whole without distinguishing between classes of shares issued. |
See accompanying Notes to Financial Statements.
87
MMA Praxis Funds
Financial highlights
For a share outstanding throughout the period indicated.
| MMA Praxis Value Index Fund - Class I | ||||||||||||||||
| Year Ended | Year Ended | Year Ended | Period Ended | |||||||||||||
December 31, | December 31, | December 31, | December 31, | |||||||||||||
| 2009 | 2008 | 2007 | 2006 (a) | |||||||||||||
| Net asset value at beginning of period | $ | 5.77 | $ | 10.07 | $ | 11.38 | $ | 10.90 | ||||||||
| Income (loss) from investment operations: | ||||||||||||||||
| Net investment income | 0.14 | 0.20 | 0.24 | 0.12 | ||||||||||||
| Net realized and unrealized gains (losses) on investments | 1.18 | (4.19 | ) | (0.97 | ) | 1.13 | ||||||||||
| Total from investment operations | 1.32 | (3.99 | ) | (0.73 | ) | 1.25 | ||||||||||
| Less Distributions: | ||||||||||||||||
| Dividends from net investment income | (0.04 | ) | (0.20 | ) | (0.23 | ) | (0.20 | ) | ||||||||
| Distributions from net realized gains | — | (0.11 | ) | (0.35 | ) | (0.57 | ) | |||||||||
| Total distributions | (0.04 | ) | (0.31 | ) | (0.58 | ) | (0.77 | ) | ||||||||
| Net asset value at end of period | $ | 7.05 | $ | 5.77 | $ | 10.07 | $ | 11.38 | ||||||||
| Total return (excludes sales charge) | 22.82 | % | (39.94 | %) | (6.46 | %) | 11.67 | %(c) | ||||||||
| Net assets at end of period (000s) | $ | 30,900 | $ | 24,893 | $ | 29,843 | $ | 27,029 | ||||||||
| Ratio of net expenses to average net assets | 0.73 | % | 0.64 | % | 0.65 | % | 0.89 | %(d) | ||||||||
| Ratio of net investment income to average net assets | 2.28 | % | 2.71 | % | 2.12 | % | 1.69 | %(d) | ||||||||
| Ratio of expenses to average net assets* | 0.73 | % | 0.64 | % | 0.68 | % | 0.95 | %(d) | ||||||||
| Portfolio turnover rate (b) | 25.72 | % | 20.66 | % | 33.34 | % | 55.37 | % | ||||||||
| * | During the period, certain expenses were reduced and/or reimbursed by the Adviser and/or Distributor. If such activity had not occurred, the ratios would have been as indicated. |
| (a) | For the period from May 1, 2006 (commencement of operations) through December 31, 2006. |
| (b) | Portfolio turnover is calculated on the basis of the Fund as a whole without distinguishing between classes of shares issued. |
| (c) | Not annualized. |
| (d) | Annualized. |
See accompanying Notes to Financial Statements.
88
MMA Praxis Funds
Financial highlights
For a share outstanding throughout the period indicated.
| MMA Praxis Growth Index Fund - Class A | ||||||||||||
| Year Ended | Year Ended | Period Ended | ||||||||||
| December 31, | December 31, | December 31, | ||||||||||
| 2009 (a) | 2008 | 2007 (b) | ||||||||||
Net asset value at beginning of period | $ | 6.50 | $ | 10.40 | $ | 10.00 | ||||||
Income (loss) from investment operations: | ||||||||||||
| Net investment income | 0.03 | 0.01 | 0.02 | |||||||||
Net realized and unrealized gains (losses) on investments | 2.20 | (3.89 | ) | 0.38 | ||||||||
| Total from investment operations | 2.23 | (3.88 | ) | 0.40 | ||||||||
| Less Distributions: | ||||||||||||
Dividends from net investment income | (0.02 | ) | (0.02 | ) | — | |||||||
Distributions from net realized gains | — | — | — | (c) | ||||||||
| Total distributions | (0.02 | ) | (0.02 | ) | — | |||||||
Paid-in capital from redemption fees (c) | — | — | — | |||||||||
| Net asset value at end of period | $ | 8.71 | $ | 6.50 | $ | 10.40 | ||||||
| Total return (excludes sales charge) | 34.38 | % | (37.34 | %) | 4.03 | %(e) | ||||||
| Net assets at end of period (000s) | $ | 4,714 | $ | 2,504 | $ | 2,232 | ||||||
Ratio of net expenses to average net assets | 0.93 | % | 0.94 | % | 1.16 | %(f) | ||||||
Ratio of net investment income to average net assets | 0.42 | % | 0.19 | % | 0.68 | %(f) | ||||||
Ratio of expenses to average net assets* | 1.54 | % | 1.51 | % | 3.65 | %(f) | ||||||
| Portfolio turnover rate (d) | 30.99 | % | 28.40 | % | 36.64 | %(f) | ||||||
| * | During the period, certain expenses were reduced and/or reimbursed by the Adviser and/or Distributor. If such activity had not occurred, the ratios would have been as indicated. |
| (a) | On August 17, 2009, Class B shares were exchanged for Class A shares. |
| (b) | For the period May 1, 2007 (commencement of operations) through December 31, 2007. |
| (c) | Amount rounds to less than $0.005 per share. |
| (d) | Portfolio turnover is calculated on the basis of the Fund as a whole without distinguishing between classes of shares issued. |
| (e) | Not annualized. |
| (f) | Annualized. |
See accompanying Notes to Financial Statements.
89
MMA Praxis Funds
Financial highlights
For a share outstanding throughout the period indicated.
| MMA Praxis Growth Index Fund - Class I | ||||||||||||
| Year Ended | Year Ended | Period Ended | ||||||||||
| December 31, | December 31, | December 31, | ||||||||||
| 2009 | 2008 | 2007 (a) | ||||||||||
Net asset value at beginning of period | $ | 6.51 | $ | 10.41 | $ | 10.00 | ||||||
Income (loss) from investment operations: | ||||||||||||
| Net investment income | 0.04 | 0.04 | — | (b) | ||||||||
Net realized and unrealized gains (losses) on investments | 2.20 | (3.90 | ) | 0.42 | ||||||||
| Total from investment operations | 2.24 | (3.86 | ) | 0.42 | ||||||||
| Less Distributions: | ||||||||||||
Dividends from net investment income | (0.03 | ) | (0.04 | ) | (0.01 | ) | ||||||
Distributions from net realized gains | — | — | — | (b) | ||||||||
| Total distributions | (0.03 | ) | (0.04 | ) | (0.01 | ) | ||||||
| Net asset value at end of period | $ | 8.72 | $ | 6.51 | $ | 10.41 | ||||||
| Total return (excludes sales charge) | 34.46 | % | (37.09 | %) | 4.18 | %(d) | ||||||
| Net assets at end of period (000s) | $ | 16,570 | $ | 12,388 | $ | 24,203 | ||||||
Ratio of net expenses to average net assets | 0.81 | % | 0.65 | % | 0.82 | %(e) | ||||||
Ratio of net investment income to average net assets | 0.54 | % | 0.45 | % | 0.34 | %(e) | ||||||
Ratio of expenses to average net assets* | 0.87 | % | 0.73 | % | 2.41 | %(e) | ||||||
| Portfolio turnover rate (c) | 30.99 | % | 28.40 | % | 36.64 | %(e) | ||||||
| * | During the period, certain expenses were reduced and/or reimbursed by the Adviser and/or Distributor. If such activity had not occurred, the ratios would have been as indicated. |
| (a) | For the period May 1, 2007 (commencement of operations) through December 31, 2007. |
| (b) | Amount rounds to less than $0.005 per share. |
| (c) | Portfolio turnover is calculated on the basis of the Fund as a whole without distinguishing between classes of shares issued. |
| (d) | Not annualized. |
| (e) | Annualized. |
See accompanying Notes to Financial Statements.
90
MMA Praxis Funds
Financial highlights
For a share outstanding throughout the year indicated.
| MMA Praxis International Fund - Class A | ||||||||||||||||||||
| Year Ended | Year Ended | Year Ended | Year Ended | Year Ended | ||||||||||||||||
| December 31, | December 31, | December 31, | December 31, | December 31, | ||||||||||||||||
| 2009 (a) | 2008 | 2007 | 2006 | 2005 | ||||||||||||||||
| Net asset value at beginning of year | $ | 8.61 | $ | 15.42 | $ | 14.23 | $ | 11.94 | $ | 10.78 | ||||||||||
| Income (loss) from investment operations: | ||||||||||||||||||||
| Net investment income | 0.08 | 0.16 | 0.12 | 0.16 | 0.08 | |||||||||||||||
| Net realized and unrealized gains | ||||||||||||||||||||
| (losses) on investments | 1.19 | (6.44 | ) | 1.65 | 2.26 | 1.22 | ||||||||||||||
| Total from investment operations | 1.27 | (6.28 | ) | 1.77 | 2.42 | 1.30 | ||||||||||||||
| Less Distributions: | ||||||||||||||||||||
| Dividends from net investment income | — | (0.15 | ) | (0.21 | ) | (0.13 | ) | (0.14 | ) | |||||||||||
| Distributions from net realized gains | — | (0.36 | ) | (0.37 | ) | — | — | |||||||||||||
| Tax return of capital | — | (0.02 | ) | — | — | — | ||||||||||||||
| Total distributions | — | (0.53 | ) | (0.58 | ) | (0.13 | ) | (0.14 | ) | |||||||||||
| Paid-in capital from redemption fees (b) | — | — | — | — | — | |||||||||||||||
| Net asset value at end of year | $ | 9.88 | $ | 8.61 | $ | 15.42 | $ | 14.23 | $ | 11.94 | ||||||||||
| Total return (excludes sales charge) | 14.75 | % | (41.01 | %) | 12.59 | % | 20.31 | % | 12.16 | % | ||||||||||
| Net assets at end of year (000s) | $ | 41,158 | $ | 26,005 | $ | 50,709 | $ | 44,837 | $ | 121,173 | ||||||||||
| Ratio of net expenses to average net assets | 1.70 | % | 1.67 | % | 1.72 | % | 1.76 | % | 1.58 | % | ||||||||||
| Ratio of net investment income to average net assets | 1.04 | % | 1.40 | % | 0.75 | % | 0.85 | % | 0.74 | % | ||||||||||
| Ratio of expenses to average net assets* | 1.98 | % | 1.92 | % | 1.97 | % | 2.09 | % | 1.90 | % | ||||||||||
| Portfolio turnover rate (c) | 194.23 | % | 148.65 | % | 59.13 | % | 82.77 | % | 71.93 | % | ||||||||||
| * | During the period, certain expenses were reduced and/or reimbursed by the Adviser and/or Distributor. If such expense reductions had not occurred, the ratios would have been as indicated. |
| (a) | On August 17, 2009, Class B shares were exchanged for Class A shares. |
| (b) | Amount rounds to less than $0.005 per share. |
| (c) | Portfolio turnover is calculated on the basis of the Fund as a whole without distinguishing between classes of shares issued. |
See accompanying Notes to Financial Statements.
91
MMA Praxis Funds
Financial highlights
For a share outstanding throughout the period indicated.
| MMA Praxis International Fund - Class I | ||||||||||||||||
Year Ended | Year Ended | Year Ended | Period Ended | |||||||||||||
December 31, | December 31, | December 31, | December 31, | |||||||||||||
| 2009 | 2008 | 2007 | 2006 (a) | |||||||||||||
| Net asset value at beginning of period | $ | 8.61 | $ | 15.39 | $ | 14.20 | $ | 13.52 | ||||||||
| Income (loss) from investment operations: | ||||||||||||||||
| Net investment income | 0.14 | 0.15 | 0.17 | 0.10 | ||||||||||||
| Net realized and unrealized gains (losses) on investments | 1.16 | (6.38 | ) | 1.65 | 0.78 | |||||||||||
| Total from investment operations | 1.30 | (6.23 | ) | 1.82 | 0.88 | |||||||||||
| Less Distributions: | ||||||||||||||||
| Dividends from net investment income | — | (0.17 | ) | (0.26 | ) | (0.20 | ) | |||||||||
| Distributions from net realized gains | — | (0.36 | ) | (0.37 | ) | — | ||||||||||
| Tax return of capital | — | (0.02 | ) | — | — | |||||||||||
| Total distributions | — | (0.55 | ) | (0.63 | ) | (0.20 | ) | |||||||||
| Net asset value at end of period | $ | 9.91 | $ | 8.61 | $ | 15.39 | $ | 14.20 | ||||||||
| Total return (excludes sales charge) | 15.23 | % | (40.85 | %) | 13.02 | % | 6.61 | %(c) | ||||||||
| Net assets at end of period (000s) | $ | 52,049 | $ | 48,830 | $ | 110,001 | $ | 98,598 | ||||||||
| Ratio of net expenses to average net assets | 1.39 | % | 1.32 | % | 1.31 | % | 1.28 | %(d) | ||||||||
| Ratio of net investment income to average net assets | 1.56 | % | 1.47 | % | 1.13 | % | 1.23 | %(d) | ||||||||
| Ratio of expenses to average net assets* | 1.39 | % | 1.32 | % | 1.31 | % | 1.39 | %(d) | ||||||||
| Portfolio turnover rate (b) | 194.23 | % | 148.65 | % | 59.13 | % | 82.77 | % | ||||||||
| * | During the period, certain expenses were reduced and/or reimbursed by the Adviser and/or Distributor. If such activity had not occurred, the ratios would have been as indicated. |
| (a) | For the period from May 1, 2006 (commencement of operations) through December 31, 2006. |
| (b) | Portfolio turnover is calculated on the basis of the Fund as a whole without distinguishing between classes of shares issued. |
| (c) | Not annualized. |
| (d) | Annualized. |
See accompanying Notes to Financial Statements.
92
MMA Praxis Funds
Financial highlights
For a share outstanding throughout the period indicated.
MMA Praxis Small Cap Fund - Class A
Year Ended December 31, 2009 (a) | Year Ended December 31, 2008 | Period Ended December 31, 2007 (b) | ||||||||||
| Net asset value at beginning of year | $ | 5.82 | $ | 9.50 | $ | 10.00 | ||||||
| Loss from investment operations: | ||||||||||||
| Net investment loss | (0.04 | ) | (0.03 | ) | — | (c) | ||||||
| Net realized and unrealized losses on investments | 1.77 | (3.65 | ) | (0.50 | ) | |||||||
| Total from investment operations | 1.73 | (3.68 | ) | (0.50 | ) | |||||||
| Paid-in capital from redemption fees (c) | — | — | — | |||||||||
| Net asset value at end of year | $ | 7.55 | $ | 5.82 | $ | 9.50 | ||||||
| Total return (excludes sales charge) | 29.73 | % | (38.74 | %) | (5.00 | %)(e) | ||||||
| Net assets at end of year (000s) | $ | 4,227 | $ | 2,307 | $ | 1,398 | ||||||
| Ratio of net expenses to average net assets | 1.49 | % | 1.46 | % | 1.65 | %(f) | ||||||
| Ratio of net investment loss to average net assets | (0.80 | %) | (0.52 | %) | (0.04 | %)(f) | ||||||
| Ratio of expenses to average net assets* | 2.34 | % | 2.20 | % | 3.78 | %(f) | ||||||
| Portfolio turnover rate (d) | 60.33 | % | 64.37 | % | 30.37 | %(f) | ||||||
| * | During the period, certain expenses were reduced and/or reimbursed by the Adviser and/or Distributor. If such activity had not occurred, the ratios would have been as indicated. |
| (a) | On August 17, 2009, Class B shares were exchanged for Class A shares. |
| (b) | For the period May 1, 2007 (commencement of operations) through December 31, 2007. |
| (c) | Amount rounds to less than $0.005 per share. |
| (d) | Portfolio turnover is calculated on the basis of the Fund as a whole without distinguishing between classes of shares issued. |
| (e) | Not annualized. |
| (f) | Annualized. |
See accompanying Notes to Financial Statements.
93
MMA Praxis Funds
Financial highlights
For a share outstanding throughout the period indicated.
MMA Praxis Small Cap Fund - Class I
| Year Ended | Year Ended | Period Ended | ||||||||||
| December 31, | December 31, | December 31, | ||||||||||
| 2009 | 2008 | 2007 (a) | ||||||||||
| Net asset value at beginning of period | $ | 5.84 | $ | 9.50 | $ | 10.00 | ||||||
| Income (loss) from investment operations: | ||||||||||||
| Net investment income (loss) | (0.04 | ) | (0.02 | ) | 0.01 | |||||||
| Net realized and unrealized losses on investments | 1.79 | (3.64 | ) | (0.50 | ) | |||||||
| Total from investment operations | 1.75 | (3.66 | ) | (0.49 | ) | |||||||
| Less Distributions: | ||||||||||||
| Dividends from net investment income | — | — | (0.01 | ) | ||||||||
| Net asset value at end of period | $ | 7.59 | $ | 5.84 | $ | 9.50 | ||||||
| Total return (excludes sales charge) | 29.97 | % | (38.53 | %) | (4.91 | %)(c) | ||||||
| Net assets at end of period (000s) | $ | 18,300 | $ | 15,392 | $ | 15,406 | ||||||
| Ratio of net expenses to average net assets | 1.36 | % | 1.22 | % | 1.35 | %(d) | ||||||
| Ratio of net investment income (loss) to average net assets | (0.66 | %) | (0.29 | %) | 0.47 | %(d) | ||||||
| Ratio of expenses to average net assets* | 1.53 | % | 1.27 | % | 2.18 | %(d) | ||||||
| Portfolio turnover rate (b) | 60.33 | % | 64.37 | % | 30.37 | %(d) | ||||||
| * | During the period, certain expenses were reduced and/or reimbursed by the Adviser and/or Distributor. If such activity had not occurred, the ratios would have been as indicated. |
| (a) | For the period May 1, 2007 (commencement of operations) through December 31, 2007. |
| (b) | Portfolio turnover is calculated on the basis of the Fund as a whole without distinguishing between classes of shares issued. |
| (c) | Not annualized. |
| (d) | Annualized. |
See accompanying Notes to Financial Statements.
94
| Notes to financial statements |
MMA Praxis Mutual Funds
Notes to financial statements
December 31, 2009
1. Organization:
The MMA Praxis Mutual Funds (the “Trust”) is an open-end management investment company established as a Delaware business trust under a Declaration of Trust dated September 27, 1993, as amended and restated December 1, 1993, and is registered under the Investment Company Act of 1940, as amended (the “1940 Act”). The Trust currently consists of the MMA Praxis Intermediate Income Fund, the MMA Praxis Core Stock Fund, the MMA Praxis Value Index Fund, the MMA Praxis Growth Index Fund, the MMA Praxis International Fund, and the MMA Praxis Small Cap Fund, (individually a “Fund”, collectively “the Funds”). These are also known as the Intermediate Income Fund, Core Stock Fund, Value Index Fund, Growth Index Fund, International Fund, and Small Cap Fund.
As of December 31, 2009, the Funds offer two classes of shares; Class A and Class I. Each class of shares in a Fund has identical rights and privileges except with respect to fees paid under the distribution and shareholder servicing agreements, voting rights on matters affecting a single class of shares and the exchange privileges of each class of shares. Class A has a maximum sales charge on purchases of 5.25% as a percentage of the original purchase price except for the Intermediate Income Fund which is 3.75%. Effective August 17, 2009, outstanding Class B shares were converted to Class A Shares, and Class B Shares are longer offered.
Under the Trust’s organizational documents, its Officers and Trustees are indemnified against certain liabilities arising out of the performance of their duties to the Trust. In addition, in the normal course of business, the Trust enters into contracts with its vendors and others that provide general indemnification. Each Fund’s maximum exposure under these arrangements is unknown, as this would involve future claims that may be made against a Fund. However, based on experience, the Trust expects the risk of loss to be remote.
2. Significant Accounting Policies:
The following is a summary of significant accounting policies followed by the Trust in the preparation of its financial statements. The policies are in conformity with U.S. generally accepted accounting principles (“GAAP”). The preparation of financial statements requires management to make estimates and assumptions that affect the reported amounts of assets and liabilities and disclosure of contingent assets and liabilities at the date of the financial statements and the reported amounts of income and expenses for the reporting period. Actual results could differ from those estimates.
Securities Valuation:
The Funds record their investments at fair value. Fair value is defined as the price that would be received to sell an asset or paid to transfer a liability in an orderly transaction between market participants at the measurement date. The valuation techniques used to determine fair value are further described below.
Securities generally are valued at market values determined on the basis of the latest available bid prices in the principal market (closing sales prices if the principal market is an exchange) in which such securities are normally traded. Investments in investment companies are valued at their respective net asset values as reported by such companies. The differences between the cost and market values of investments are reflected as either unrealized appreciation or depreciation.
95
MMA Praxis Mutual Funds
Notes to financial statements, continued
December 31, 2009
The Funds use various independent pricing services to value most of their investments. A pricing service would normally consider such factors as yield, risk, quality, maturity, type of issue, trading characteristics, special circumstances and other factors it deems relevant in determining valuations of normal institutional trading units of debt securities and would not rely exclusively on quoted prices. When fair valuing foreign securities held by the International Fund, certain pricing services might use computerized pricing models to systematically calculate adjustments to foreign security closing prices based on the latest market movements. Such pricing models utilize market data that has been obtained between the local market close and the NYSE close to compute adjustments to foreign security close prices. The methods used by the pricing service and the valuations so established will be reviewed by the Adviser under general supervision of the Funds’ Board of Trustees. Securities for which market quotations are not readily available (e.g. an approved pricing service does not provide a price, certain stale prices or an event occurs that materiality affects the furnished price) are valued at their fair value as determined in good faith in accordance with consistently applied procedures established by and under the general supervision of the Board of Trustees. Money market instruments and other short-term debt securities of sufficient credit quality maturing in less than 61 days are valued at amortized cost, which approximates market value.
Investments in restricted securities are valued by the Board of Trustees or valued pursuant to valuation procedures approved by the Board of Trustees (the “Valuation Procedures”). The Valuation Procedures contemplate the Board’s delegation of the implementation of the Valuation Procedures to the Adviser. In valuing restricted securities under the Valuation Procedures, the Adviser will consider (but is not limited to) certain specific and general factors enumerated in the Valuation Procedures. The Valuation Procedures require that the Adviser report to the Board at each of its regular quarterly meetings regarding valuation of restricted securities and actions taken in connection with the Valuation Procedures.
The valuation techniques described maximize the use of observable inputs and minimize the use of unobservable inputs in determining fair value. These inputs are summarized in the three broad levels listed below:
• Level 1 — | quoted prices in active markets for identical securities |
| • Level 2 — | other significant observable inputs (including quoted prices for similar securities, interest rates, prepayment speeds, credit risk, etc.) |
| • Level 3 — | significant unobservable inputs (including the Fund’s own assumptions in determining the fair value of investments) |
The inputs or methodology used for valuing securities are not necessarily an indication of the risk associated with investing in those securities. For example, short-term debt securities of sufficient credit quality maturing in less than 61 days of the filing are valued using amortized cost, in accordance with rules under the 1940 Act. Generally, amortized cost approximates the current fair value of a security, but since the value is not obtained from a quoted price in an active market, such securities are reflected as Level 2.
The aggregate value by input level, as of December 31, 2009, for each Fund’s investments, as well as a reconciliation of assets for which significant unobservable inputs (Level 3) were used in determining value, is included in each Fund’s Schedule of Portfolio Investments, which also includes a breakdown of the Fund’s investments by geographic/industry concentration.
96
MMA Praxis Mutual Funds
Notes to financial statements, continued
December 31, 2009
Securities Transactions and Related Income:
Changes in holdings of portfolio securities shall be reflected no later than in the first calculation on the first business day following trade date. However, for financial reporting purposes, security transactions are accounted for on the trade date. Gains or losses realized on sales of securities are determined by comparing the identified cost of the security lot sold with the net sales proceeds. Interest income is recognized on the accrual basis and includes, where applicable, the pro rata amortization of premium or accretion of discount. Dividend income is recorded on the ex-dividend date.
Allocations:
Investment income earned, realized capital gains and losses, and unrealized appreciation and depreciation for the Funds are allocated daily to each class of shares based upon its proportionate share of total net assets of the Fund. Class specific expenses are charged directly to the class incurring the expense. Common expenses, which are not attributable to a specific class, are allocated daily to each class of shares based upon its proportionate share of total net assets of the Fund. Expenses not directly billed to a Fund are allocated proportionally among all Funds daily in relation to net assets of each Fund or another reasonable measure.
Risks associated with Foreign Securities and Currencies:
Investments in securities of foreign issuers carry certain risks not ordinarily associated with investments in securities of domestic issuers. Such risks include adverse future political and economic developments and the possible imposition of exchange controls or other foreign governmental laws and restrictions. In addition, with respect to certain countries, there is the possibility of expropriation of assets, confiscatory taxation, political or social instability or diplomatic developments which could adversely affect investments in those countries.
Certain countries may also impose substantial restrictions on investments on their capital markets by foreign entities, including restriction on investment in issuers or industries deemed sensitive to the relevant nation’s interests. These factors may limit the investment opportunities available or result in lack of liquidity and high price volatility with respect to securities of issuers from developing countries.
Foreign Currency Translation:
The market value of investment securities, other assets and liabilities of the Core Stock Fund and the International Fund denominated in foreign currencies are translated into U.S. dollars at the current exchange rate at the close of each business day. Purchases and sales of securities, income receipts and expense payments are translated into U.S. dollars based at the exchange rate on the date of the transaction.
The Funds do not isolate that portion of the results of operations resulting from changes in foreign exchange rates on investments from the fluctuations arising from changes in market prices of securities held. Such fluctuations are included with the net realized/unrealized gain (loss) from investments.
97
MMA Praxis Mutual Funds
Notes to financial statements, continued
December 31, 2009
Reported net realized foreign exchange gains or losses arise from sales and maturities of short-term securities, sales of foreign currencies, currency gains or losses realized between the trade and settlement dates on securities transactions, the difference between the amounts of dividends, interest, and foreign withholding taxes recorded on the Funds’ books, and the U.S. dollar equivalent of the amounts actually received or paid. Net unrealized foreign exchange gains and losses arise from the changes in the value of assets and liabilities including investments in securities at the reporting period, resulting from changes in the exchange rate.
Community Development Investments:
The Board of Trustees of the MMA Praxis Mutual Funds has authorized the Funds to make certain types of community development investments. In connection with the community development investments, the Funds have received from the Securities and Exchange Commission (“SEC”) an exemptive order that permits each of the Funds to invest a limited portion of its respective net assets in securities issued by an affiliate of the Adviser, MMA Community Development Investments, Inc. (“MMA CDI”). MMA CDI is a not-for-profit corporation that was organized specifically to promote community development investing and it seeks to fund its efforts primarily through the sale to investors of interests in certain investment pools that it has established (the “CDI-Notes”). Assets raised through offerings of CDI-Notes are then invested directly in non-profit and not-for-profit community development organizations. Each Fund, in accordance with guidelines established by the Board of Trustees and in compliance with the SEC’s exemptive order, would be permitted to invest up to 3% of its net assets in CDI-Notes. CDI-Notes have certain specific risk factors associated with them. These types of investments offer a rate of return below the prevailing market rate at acquisition and are considered illiquid, unrated and below-investment grade. They also involve a greater risk of default or price decline than investment-grade securities. However, these investments have been determined by the Board of Trustees as being a beneficial way to carry out each Fund’s goals for stewardship investing at the community level. In addition, these investments are valued in accordance with procedures approved by the Board of Trustees.
Dividends and Distributions:
Dividends from net investment income are declared and paid monthly for the Intermediate Income Fund. Dividends from net investment income are declared and paid annually for the Core Stock Fund, the Value Index Fund, the Growth Index Fund, the International Fund, and the Small Cap Fund. Distributable net realized capital gains, if any, are declared and distributed at least annually.
The amounts of dividends from net investment income and distributions from net realized gains are determined in accordance with federal income tax regulations, which may differ from GAAP. These “book/tax” differences are either considered temporary or permanent in nature. To the extent these differences are permanent in nature, such amounts are reclassified within the composition of net assets based on their federal tax-basis treatment; temporary differences do not require reclassification.
98
MMA Praxis Mutual Funds
Notes to financial statements, continued
December 31, 2009
Federal Income Taxes:
It is each Fund’s policy to continue to qualify as a regulated investment company by complying with the provisions available to certain investment companies, as defined in applicable sections of Subchapter M of the Internal Revenue Code, and to distribute timely all of its net investment company taxable income and net capital gains to shareholders. Therefore, no federal income tax provision is required. Under the applicable foreign tax law, a withholding tax may be imposed on interest, dividends and capital gains earned on foreign investments at various rates. Where available, the International Fund will file for claims on foreign taxes withheld.
Redemption Fees:
The Funds will charge a redemption fee of 2.00% of the total redemption amount if you sell or exchange your shares after holding them for less than 30 days subject to certain exceptions and limitations described in the prospectus.
3. Derivative Financial Instruments:
A derivative financial instrument in very general terms refers to an investment whose value is "derived" from the value of an underlying asset, reference rate or index. The Trust may use derivative instruments for a variety of reasons, such as to attempt to protect a Fund against possible changes in the market value of its portfolio or to manage a Fund's foreign currency exposure or to generate potential gain. All of the Trust's portfolio holdings, including derivative instruments, are marked-to-market each day with the change in value reflected in unrealized appreciation/depreciation. Upon disposition, a realized gain or loss is recognized accordingly, except when taking delivery of a security underlying a contract. In these instances, the recognition of gain or loss is postponed until the disposal of the security underlying the contract. Risk may arise as a result of the potential inability of the counterparties to meet the terms of their contracts.
Summarized below are specific types of derivative financial instruments used by the Trust.
Forward Foreign Currency Exchange Contracts:
The International Fund may enter into forward foreign currency exchange contracts for the purchase or sale of specific foreign currencies at a fixed price on a future date. Risks may arise upon entering these contracts for the potential inability of counterparties to meet the terms of their contracts and from unanticipated movements in the value of a foreign currency relative to the U.S. dollar. The International Fund will enter into forward contracts as a hedge against specific transactions or portfolio positions to protect against adverse currency movements. The forward foreign currency exchange contracts are adjusted by the daily exchange rate of the underlying currency and any gains or losses are recorded for financial statement purposes as unrealized until the contract settlement date, at which time the International Fund records a realized gain or loss equal to the difference between the value of the contract at the time it was opened and the value at the time it was closed.
99
MMA Praxis Mutual Funds
Notes to financial statements, continued
December 31, 2009
As of December 31, 2009, the International Fund had the following forward foreign currency exchange contracts outstanding as follows:
| Settlement | To Receive / | Initial | Market | Net Unrealized | Net Unrealized | ||||||||||||||||
| Date | To Deliver | Value | Value | Appreciation | Depreciation | ||||||||||||||||
| Contracts to Buy | |||||||||||||||||||||
| 1/4/10 | 69,044 | AUD | $ | 61,826 | $ | 62,019 | $ | 193 | $ | — | |||||||||||
| 1/4/10 | 96,441 | CHF | 92,978 | 93,229 | 251 | — | |||||||||||||||
| 1/4/10 | 68,223 | EUR | 98,146 | 97,800 | — | 346 | |||||||||||||||
| 1/5/10 | 30,026 | EUR | 43,103 | 43,043 | — | 60 | |||||||||||||||
| 1/5/10 | 13,806 | EUR | 19,798 | 19,792 | — | 6 | |||||||||||||||
| 1/5/10 | 1,241 | EUR | 1,779 | 1,779 | — | — | |||||||||||||||
| 1/7/10 | 14,010 | EUR | 20,070 | 20,084 | 14 | — | |||||||||||||||
| 1/5/10 | 15,256 | GBP | 24,517 | 24,642 | 125 | — | |||||||||||||||
| 1/6/10 | 29,273 | GBP | 47,269 | 47,281 | 12 | — | |||||||||||||||
| 1/5/10 | 28,308,689 | JPY | 308,071 | 303,953 | — | 4,118 | |||||||||||||||
| 1/29/10 | 180,973,000 | JPY | 1,994,632 | 1,943,376 | — | 51,256 | |||||||||||||||
| 1/4/10 | 100,313 | NOK | 17,328 | 17,326 | — | 2 | |||||||||||||||
| 1/5/10 | 48,787 | NOK | 8,403 | 8,426 | 23 | — | |||||||||||||||
| 1/4/10 | 700,318 | SEK | 96,994 | 97,883 | 889 | — | |||||||||||||||
| 1/5/10 | 111,904 | SEK | 15,524 | 15,641 | 117 | — | |||||||||||||||
| 1/4/10 | 15,203 | SGD | 10,824 | 10,822 | — | 2 | |||||||||||||||
| Contracts to Sell | |||||||||||||||||||||
| 1/4/10 | 49,088 | CAD | 47,033 | 46,936 | 97 | — | |||||||||||||||
| 1/4/10 | 345,217 | CHF | 333,659 | 333,720 | — | 61 | |||||||||||||||
| 3/23/10 | 2,382,000 | CHF | 2,278,859 | 2,303,720 | — | 24,861 | |||||||||||||||
| 1/4/10 | 254,887 | EUR | 365,763 | 365,394 | 369 | — | |||||||||||||||
| 1/6/10 | 23,962 | EUR | 34,328 | 34,351 | — | 23 | |||||||||||||||
| 1/4/10 | 109,849 | GBP | 174,736 | 177,429 | — | 2,693 | |||||||||||||||
| 1/5/10 | 97,691 | GBP | 156,920 | 157,790 | — | 870 | |||||||||||||||
| 1/4/10 | 2,571,633 | JPY | 27,949 | 27,612 | 337 | — | |||||||||||||||
| 1/29/10 | 361,946,000 | JPY | 3,933,640 | 3,886,752 | 46,888 | — | |||||||||||||||
| 1/4/10 | 1,323,287 | SEK | 183,273 | 184,955 | — | 1,682 | |||||||||||||||
| $ | 49,315 | $ | 85,980 | ||||||||||||||||||
AUD - Australian Dollar
CAD - Canadian Dollar
CHF - Swiss Franc
EUR - Euro
GBP - Great British Pound
JPY - - Japanese Yen
NOK - Norwegian Krone
SEK - Swedish Krona
SGD - Singapore Dollar
100
MMA Praxis Mutual Funds
Notes to financial statements, continued
December 31, 2009
Futures Contracts:
The Funds may invest in futures contracts (stock or bond index futures contracts or interest rate futures contracts) to hedge or manage risks associated with a Funds’ securities investments. To enter into a futures contract, an amount of cash and cash equivalents, equal to a certain percentage of the market value of the futures contracts, is deposited in a segregated account with the Fund’s Custodian and/or in a margin account with a broker to collateralize the position and thereby ensure that the use of such futures is unleveraged. Positions in futures contracts may be closed out only on an exchange that provides a secondary market for such futures. However, there can be no assurance that a liquid secondary market will exist for any particular futures contract at any specific time. Thus, it may not be possible to close a futures position. In the event of adverse price movements, a Fund would continue to be required to make daily cash payments to maintain its required margin. In such situations, if a Fund had insufficient cash, it might have to sell portfolio securities to meet daily margin requirements at a time when it would be disadvantageous to do so. In addition, a Fund might be required to make delivery of the instruments to underlying futures contracts it holds. The inability to close the futures position also could have an adverse impact on a Fund’s ability to hedge or manage risks effectively.
Successful use of futures by a Fund is also subject to MMA Capital Management’s (the “Adviser”) ability to predict movements correctly in the direction of the market. There is an imperfect correlation between movements in the price of the future and movements in the price of the securities that are the subject of the hedge. In addition, the price of futures may not correlate perfectly with movement in the cash market due to certain market distortions. Due to the possibility of price distortion in the futures market and because of the imperfect correlation between the movements in the cash market and movements in the price of futures, a correct forecast of general market trends or interest rate movements by the Adviser may still not result in a successful hedging transaction over a short time frame.
Most futures exchanges limit the amount of fluctuation permitted in futures contract prices during a single trading day. The daily limit establishes the maximum amount that the price of a futures contract may vary either up or down from the previous day’s settlement price at the end of a trading session. Once the daily limit has been reached in a particular type of contract, no trades may be made on that day at a price beyond the limit. The daily limit governs only price movement during a particular trading day and therefore does not limit potential losses, because the limit may prevent the liquidation of unfavorable positions. Futures contract prices have occasionally moved to the daily limit for several consecutive trading days with little or no trading, thereby preventing prompt liquidation of futures positions and subjecting some futures to substantial losses.
The trading of futures contracts is also subject to the risk of trading halts, suspensions, exchange or clearing house equipment failures, government intervention, insolvency of a brokerage firm or clearing house or other disruptions of normal trading activity, which could at times make it difficult or impossible to liquidate existing positions or to recover excess variation margin payments.
As of December 31, 2009, the Funds did not hold any futures contracts.
101
MMA Praxis Mutual Funds
Notes to financial statements, continued
December 31, 2009
Derivative Instruments and Hedging Activities:
The Trust adopted disclosures about Derivative Instruments and Hedging Activities, effective January 1, 2009. This disclosure is intended to improve financial reporting about derivative instruments by enhancing disclosures to enable investors to better understand how and why the Trust uses derivative instruments, how these derivative instruments are accounted for and their effects on a Fund’s financial position and results of operations.
The following table sets forth the fair value of the Trust’s derivative contracts by primary risk exposure as of December 31, 2009:
Fair Value of Derivative Investments As of December 31, 2009 | |||||||
| Asset Derivatives | Liabilities Derivatives | ||||||
Derivatives not accounted for as hedging instruments under ASC 815 | Statements of Assets and Liabilities Location | Fund | Unrealized Appreciation | Statement of Assets and Liabilities Location | Fund | Unrealized Depreciation | |
Forward foreign currency exchange contracts | Unrealized appreciation on foreign currency exchange contracts | International Fund | $49,315 | Unrealized depreciation on foreign currency exchange contracts | International Fund | $85,980 | |
The Effect of Derivative Instruments on the Statements of Operations for the Year Ended December 31, 2009 | ||||
Derivatives not accounted for as hedging instruments under ASC 815 | Location of Gain or (Loss) on Derivatives on the Statements of Operations | Fund | Realized Gain or (Loss) on Derivatives | Change in Unrealized Appreciation (Depreciation) on Derivatives |
Equity Index Futures Contracts | Net realized (losses) on futures contracts, Change in unrealized depreciation on futures contracts | Core Stock Fund Value Index Fund | ($139,716) (34,929) | $7,800 1,950 |
Forward Foreign Currency Exchange Contracts | Net realized gains on foreign currency transactions, Change in unrealized appreciation/ depreciation on foreign currency translations | International Fund | $469,096 | ($802,458) |
102
MMA Praxis Mutual Funds
Notes to financial statements, continued
December 31, 2009
4. Purchases and Sales of Securities:
Purchases and sales of securities (excluding short-term debt securities having maturities one year or less and U.S. Government Securities) for the year ended December 31, 2009 were as follows:
| Purchases | Sales | |||||||
| Intermediate Income Fund | $ | 72,703,353 | $ | 61,937,665 | ||||
| Core Stock Fund | 21,077,645 | 40,884,539 | ||||||
| Value Index Fund | 13,656,211 | 13,343,503 | ||||||
| Growth Index Fund | 5,496,271 | 5,510,332 | ||||||
| International Fund | 159,664,795 | 158,033,233 | ||||||
| Small Cap Fund | 11,229,814 | 12,194,314 | ||||||
5. Related Party Transactions:
MMA Capital Management, Inc., the Adviser (a separate corporate entity controlled by MMA Holdings, Inc.), provides investment advisory services to the Funds. Under the terms of the investment advisory agreement, the Adviser is entitled to receive fees based on a percentage of the average daily net assets of each of the Funds as follows: 0.40% for the Intermediate Income Fund; 0.74% for the Core Stock Fund; 0.30% for the Value Index Fund; 0.30% for the Growth Index Fund; 0.90% for the International Fund and 0.85% for the Small Cap Fund. The Adviser has retained various Sub-Advisers to manage the investments of Funds under the terms of the Sub-Advisory Agreements. The Adviser (not the Funds) pays each Sub-Adviser a fee for these services. Evergreen Investment Management Company, LLC, serves as the Sub-Adviser to the International Fund, Davis Selected Advisers, L.P. serves as the Sub-Adviser to the Core Stock Fund, and Luther King Capital Management serves as the Sub-Adviser to the Small Cap Fund.
For the period May 1, 2008 through April 30, 2009, the Adviser entered into a contractual expense limitation agreement pursuant to which the Adviser agreed to waive fees and/or reimburse expenses to the extent necessary in order to limit the total annual fund operating expenses (excluding brokerage costs, interest, taxes, dividends, fees paid to vendors providing fair value pricing and fund compliance services, legal fees, costs relating to such services and extraordinary expenses). The Funds have agreed to repay the Adviser for the amounts waived and/or reimbursed by the Adviser pursuant to the expense limitation agreement, for up to three years following the fiscal year in which the amounts were waived and/or reimbursed. The contractual expense limits in place for the period May 1, 2008 through April 30, 2009 were:
| Fund | Class A | Class B | Class I |
| Intermediate Income Fund | 0.85% | 1.30% | 0.60% |
| Core Stock Fund | 1.43% | 2.08% | 1.18% |
| Value Index Fund | 0.94% | 1.49% | 0.69% |
| Growth Index Fund | 0.94% | 1.49% | 0.69% |
| International Fund | 1.67% | 2.32% | 1.42% |
| Small Cap Fund | 1.45% | 2.10% | 1.20% |
103
MMA Praxis Mutual Funds
Notes to financial statements, continued
December 31, 2009
Effective May 1, 2009, the Adviser entered into a contractual expense limitation agreement similar to the agreement described above which also excludes Trustee fees from the expense limit. This agreement is in place for the following Funds and Share Classes listed below through April 30, 2010:
| Fund | Class A | Class B |
| Intermediate Income Fund | 0.90% | 1.45% |
| Growth Index Fund | 1.04% | 1.84% |
| Small Cap Fund | 1.65% | 2.55% |
For all Funds in the Trust, the Adviser has agreed to maintain voluntary expense limitations through December 31, 2009 at the same contractual limits in place from May 1, 2008 through April 30, 2009 as referenced above. The amounts waived and/or reimbursed by the Adviser pursuant to the voluntary expense limitations are not subject to recoupment. On August 17, 2009, Class B shares of each Fund were exchanged into Class A shares.
For the year ended December 31, 2009, the Adviser waived investment advisory fees and/or reimbursed other operating expenses of the Funds as follows:
| Intermediate Income Fund | $ | 155,493 | ||
| Core Stock Fund | $ | 3,774 | ||
| Value Index Fund | $ | 36,005 | ||
| Growth Index Fund | $ | 32,114 | ||
| International Fund | $ | 32,571 | ||
| Small Cap Fund | $ | 55,847 |
As of December 31, 2009, the Funds had the following amounts (and year of expiration) subject to repayment to the Adviser:
| Fund | Fees Waived | Repayment Expires | Balance | |||
| Intermediate Income Fund | 2007 | 2010 | $ | 397,438 | ||
| 2008 | 2011 | 99,191 | ||||
| 2009 | 2012 | 78,489 | ||||
| $ | 575,118 | |||||
| Core Stock Fund | 2009 | 2012 | $ | 3,112 | ||
| Value Index Fund | 2007 | 2010 | $ | 17,107 | ||
| 2008 | 2011 | 24,950 | ||||
| 2009 | 2012 | 12,461 | ||||
| $ | 54,518 | |||||
| Growth Index Fund | 2007 | 2010 | $ | 53,285 | ||
| 2008 | 2011 | 31,734 | ||||
| 2009 | 2012 | 30,231 | ||||
| $ | 115,250 | |||||
| International Fund | 2008 | 2011 | $ | 4,106 | ||
| 2009 | 2012 | 17,440 | ||||
| $ | 21,546 | |||||
| Small Cap Fund | 2007 | 2010 | $ | 38,293 | ||
| 2008 | 2011 | 26,019 | ||||
| 2009 | 2012 | 31,813 | ||||
| $ | 96,125 | |||||
104
MMA Praxis Mutual Funds
Notes to financial statements, continued
December 31, 2009
During the year ended December 31, 2009, amounts subject to repayment to the Adviser expired as follows:
| Fund | Balance | |||
| Intermediate Income Fund | $ | 299,777 | ||
| Value Index Fund | 9,996 | |||
| International Fund | 875 | |||
JPMorgan Chase Bank, N.A. (JPMorgan) provides administrative, accounting, transfer agency, shareholder servicing and dividend disbursing services on behalf of the Trust. For these services, JPMorgan receives an annual fee, paid monthly, from each Fund.
Effective May 1, 2009, BHIL Distributors, Inc. (“Underwriter”) serves as the Funds’ principal underwriter and, as such, acts as exclusive agent for distribution of the Funds’ shares. Prior to May 1, 2009, IFS Fund Distributors, Inc. was the Underwriter. Under the terms of the Underwriting Agreements between the Trust and the Underwriters, the Underwriters earned amounts from underwriting and broker commissions on the sale of shares as follows:
| IFS Fund Distributors, Inc. | BHIL Distributors, Inc. | |||||||
| January 1, 2009 – | May 1, 2009 – | |||||||
| April 30, 2009 | December 31, 2009 | |||||||
| Intermediate Income Fund | $ | 3,457 | $ | 6,547 | ||||
| Core Stock Fund | $ | 5,799 | $ | 8,209 | ||||
| Value Index Fund | $ | 2,353 | $ | 3,561 | ||||
| Growth Index Fund | $ | 1,052 | $ | 1,945 | ||||
| International Fund | $ | 2,750 | $ | 4,546 | ||||
| Small Cap Fund | $ | 790 | $ | 1,624 | ||||
The Underwriters also earned contingent deferred sales loads from each Fund as follows:
| IFS Fund Distributors, Inc. | BHIL Distributors, Inc. | |||||||
| January 1, 2009 – | May 1, 2009 – | |||||||
| April 30, 2009 | December 31, 2009 | |||||||
| Intermediate Income Fund | $ | 3,974 | $ | 7,381 | ||||
| Core Stock Fund | $ | 4,156 | $ | 3,356 | ||||
| Value Index Fund | $ | 1,265 | $ | 632 | ||||
| Growth Index Fund | $ | 111 | $ | 41 | ||||
| International Fund | $ | 1,817 | $ | 637 | ||||
| Small Cap Fund | $ | 60 | $ | 47 | ||||
105
MMA Praxis Mutual Funds
Notes to financial statements, continued
December 31, 2009
For the year ended December 31, 2009, the Underwriter voluntarily waived distribution fees in the Funds as follows:
| Intermediate Income Fund | $ | 172,653 | ||
| Core Stock Fund | $ | 182,535 | ||
| Value Index Fund | $ | 64,762 | ||
| Growth Index Fund | $ | 9,575 | ||
| International Fund | $ | 82,184 | ||
| Small Cap Fund | $ | 7,973 |
The Trust has adopted a Plan of Distribution (12b-1 plan) for each Fund under which each Fund may directly incur or reimburse the Adviser or the Underwriter for expenses related to the distribution and promotion of shares. The Rule 12b-1 Plan authorizes Class A Shares to pay a 12b-1 fee of up to 0.50% of the average daily net assets of the applicable Fund. The Distributor may use up to 0.25% of the 12b-1 fee for shareholder servicing and up to 0.25% for distribution. Currently, the Distributor is voluntarily waiving 0.25% of the 12b-1 fee. During Class B Shares existence, Class B Shares of each Fund could have paid a 12b-1 fee of up to 1.00% of the average daily net assets of the applicable Fund. This caused expenses for Class B Shares to be higher and dividends to be lower than for Class A Shares. The Distributor may use up to 0.25% of the 12b-1 fee for shareholder servicing and up to 0.75% for distribution. The Distributor voluntarily waived the following percentages of the 12b-1 fees for Class B Shares: 0.10% for the MMA Praxis Core Stock, International and Small Cap Funds; and 0.20% for the MMA Praxis Value Index, Growth Index and Intermediate Income Funds.
Under the terms of the Compliance and Financial Controls Service Agreements between the Trust and Beacon Hill Fund Services (“Beacon Hill”), Beacon Hill provides certain compliance and financial control services to the Trust, including developing and assisting in implementing a compliance program for the Trust, providing administrative support services to the Funds’ Compliance Program, providing the Chief Compliance Officer and providing the Chief Financial Officer. For these services, Beacon Hill receives a monthly fee from each Fund.
Certain Officers of the Trust are affiliated with the Adviser, Distributor and/or JPMorgan. With the exception of the Chief Compliance Officer and the Chief Financial Officer, such officers are not paid any fees directly by the Funds for serving as Officers of the Trust.
106
MMA Praxis Mutual Funds
Notes to financial statements, continued
December 31, 2009
6. Capital Share Transactions:
Transactions in shares of the Funds are summarized below:
| Intermediate Income Fund | Core Stock Fund | Value Index Fund | ||||||||||||||||||||||
| Year | Year | Year | Year | Year | Year | |||||||||||||||||||
| Ended | Ended | Ended | Ended | Ended | Ended | |||||||||||||||||||
| December 31, | December 31, | December 31, | December 31, | December 31, | December 31, | |||||||||||||||||||
| 2009 (A) | 2008 | 2009( A) | 2008 | 2009 (A) | 2008 | |||||||||||||||||||
| Capital Transactions: | ||||||||||||||||||||||||
| Class A Shares: | ||||||||||||||||||||||||
| Proceeds from shares issued | $ | 30,204,865 | $ | 14,462,406 | $ | 29,827,091 | $ | 15,442,770 | $ | 11,674,195 | $ | 10,583,584 | ||||||||||||
| Dividends reinvested | 2,081,266 | 2,000,998 | 314,085 | 295,419 | 93,253 | 822,794 | ||||||||||||||||||
| Cost of shares redeemed | (10,223,257 | ) | (14,785,918 | ) | (10,670,614 | ) | (21,306,843 | ) | (5,556,065 | ) | (6,165,306 | ) | ||||||||||||
| Redemption fees | 730 | 415 | 157 | 833 | 913 | 458 | ||||||||||||||||||
| Class A Share Transactions | $ | 22,063,604 | $ | 1,677,901 | $ | 19,470,719 | $ | (5,567,821 | ) | $ | 6,212,296 | $ | 5,241,530 | |||||||||||
| Class B Shares: | ||||||||||||||||||||||||
| Proceeds from shares issued | $ | 1,422,447 | $ | 2,447,895 | $ | 944,766 | $ | 2,228,152 | $ | 305,775 | $ | 1,039,255 | ||||||||||||
| Dividends reinvested | 348,828 | 724,916 | — | — | 5 | 245,781 | ||||||||||||||||||
| Cost of shares redeemed | (18,342,337 | ) | (8,353,576 | ) | (26,149,469 | ) | (14,604,564 | ) | (7,373,797 | ) | (2,498,161 | ) | ||||||||||||
| Redemption fees | 52 | 2,285 | 100 | 144 | — | 44 | ||||||||||||||||||
| Class B Share Transactions | $ | (16,571,010 | ) | $ | (5,178,480 | ) | $ | (25,204,603 | ) | $ | (12,376,268 | ) | $ | (7,068,017 | ) | $ | (1,213,081 | ) | ||||||
| Class I Shares: | ||||||||||||||||||||||||
| Proceeds from shares issued | $ | 31,214,802 | $ | 5,633,789 | $ | 13,803,621 | $ | 24,876,227 | $ | 4,977,511 | $ | 11,549,538 | ||||||||||||
| Dividends reinvested | 2,725,160 | 6,264,933 | 244,775 | 485,042 | 66,023 | 723,144 | ||||||||||||||||||
| Cost of shares redeemed | (19,715,945 | ) | (66,310,394 | ) | (28,465,722 | ) | (15,960,366 | ) | (4,880,249 | ) | (2,420,352 | ) | ||||||||||||
| Cost of shares redeemed in-kind | — | — | — | (17,391,978 | ) | — | — | |||||||||||||||||
| Redemption fees | — | 149 | — | — | — | — | ||||||||||||||||||
| Class I Share Transactions | $ | 14,224,017 | $ | (54,411,523 | ) | $ | (14,417,326 | ) | $ | (7,991,075 | ) | $ | 163,285 | $ | 9,852,330 | |||||||||
| Net increase (decrease) from capital transactions | $ | 19,716,611 | $ | (57,912,102 | ) | $ | (20,151,210 | ) | $ | (25,935,164 | ) | $ | (692,436 | ) | $ | 13,880,779 | ||||||||
| Share Transactions: | ||||||||||||||||||||||||
| Class A Shares: | ||||||||||||||||||||||||
| Issued | 3,009,574 | 1,500,048 | 3,063,675 | 1,211,622 | 1,883,212 | 1,299,012 | ||||||||||||||||||
| Reinvested | 209,019 | 208,518 | 27,792 | 25,980 | 13,124 | 128,608 | ||||||||||||||||||
| Redeemed | (1,033,868 | ) | (1,548,121 | ) | (1,120,630 | ) | (1,681,188 | ) | (973,170 | ) | (765,966 | ) | ||||||||||||
| Change in Class A Shares | 2,184,725 | 160,445 | 1,970,837 | (443,586 | ) | 923,166 | 661,654 | |||||||||||||||||
| Class B Shares: | ||||||||||||||||||||||||
| Issued | 146,515 | 253,647 | 118,046 | 187,550 | 58,641 | 124,017 | ||||||||||||||||||
| Reinvested | 35,850 | 75,298 | — | 2 | 1 | 38,880 | ||||||||||||||||||
| Redeemed | (1,822,338 | ) | (865,466 | ) | (2,826,197 | ) | (1,188,809 | ) | (1,157,347 | ) | (296,471 | ) | ||||||||||||
| Change in Class B Shares | (1,639,973 | ) | (536,521 | ) | (2,708,151 | ) | (1,001,257 | ) | (1,098,705 | ) | (133,574 | ) | ||||||||||||
| Class I Shares: | ||||||||||||||||||||||||
| Issued | 3,080,155 | 580,358 | 1,574,284 | 2,181,765 | 865,446 | 1,544,428 | ||||||||||||||||||
| Reinvested | 274,682 | 649,132 | 21,528 | 41,230 | 9,365 | 117,743 | ||||||||||||||||||
| Redeemed | (1,998,255 | ) | (6,986,579 | ) | (2,920,736 | ) | (1,322,583 | ) | (805,322 | ) | (314,514 | ) | ||||||||||||
| Redeemed in-kind | — | — | — | (1,318,573 | ) | — | — | |||||||||||||||||
| Change in Class I Shares | 1,356,582 | (5,757,089 | ) | (1,324,924 | ) | (418,161 | ) | 69,489 | 1,347,657 | |||||||||||||||
| Net increase (decrease) from share transactions | 1,901,334 | (6,133,165 | ) | (2,062,238 | ) | (1,863,004 | ) | (106,050 | ) | 1,875,737 | ||||||||||||||
| (A) | Class B represents the period from January 1, 2009 through August 17, 2009. |
107
MMA Praxis Mutual Funds
Notes to financial statements, continued
December 31, 2009
| Growth Index Fund | International Fund | Small Cap Fund | ||||||||||||||||||||||
| Year | Year | Year | Year | Year | Year | |||||||||||||||||||
| Ended | Ended | Ended | Ended | Ended | Ended | |||||||||||||||||||
| December 31, | December 31, | December 31, | December 31, | December 31, | December 31, | |||||||||||||||||||
| 2009 (A) | 2008 | 2009 (A) | 2008 | 2009 (A) | 2008 | |||||||||||||||||||
| Capital Transactions: | ||||||||||||||||||||||||
| Class A Shares: | ||||||||||||||||||||||||
| Proceeds from shares issued | $ | 1,915,807 | $ | 2,054,832 | $ | 16,096,091 | $ | 11,798,862 | $ | 1,710,382 | $ | 2,391,686 | ||||||||||||
| Dividends reinvested | 12,107 | 4,633 | — | 1,508,235 | — | — | ||||||||||||||||||
| Cost of shares redeemed | (779,907 | ) | (458,618 | ) | (5,992,701 | ) | (16,856,474 | ) | (670,005 | ) | (309,601 | ) | ||||||||||||
| Redemption fees | — | 218 | 915 | 1,576 | 174 | 19 | ||||||||||||||||||
| Class A Share Transactions | $ | 1,148,007 | $ | 1,601,065 | $ | 10,104,305 | $ | (3,547,801 | ) | $ | 1,040,551 | $ | 2,082,104 | |||||||||||
| Class B Shares: | ||||||||||||||||||||||||
| Proceeds from shares issued | $ | 144,248 | $ | 741,272 | $ | 387,190 | $ | 1,418,502 | $ | 97,509 | $ | 445,897 | ||||||||||||
| Dividends reinvested | — | 810 | — | 554,247 | — | — | ||||||||||||||||||
| Cost of shares redeemed | (1,073,858 | ) | (174,110 | ) | (10,691,891 | ) | (5,703,415 | ) | (635,992 | ) | (114,169 | ) | ||||||||||||
| Redemption fees | 4 | 2 | 10 | 123 | — | (B) | 2 | |||||||||||||||||
| Class B Share Transactions | $ | (929,606 | ) | $ | 567,974 | $ | (10,304,691 | ) | $ | (3,730,543 | ) | $ | (538,483 | ) | $ | 331,730 | ||||||||
| Class I Shares: | ||||||||||||||||||||||||
| Proceeds from shares issued | $ | 1,408,366 | $ | 692,619 | $ | 7,413,449 | $ | 9,213,487 | $ | 3,056,419 | $ | 10,179,302 | ||||||||||||
| Dividends reinvested | 52,593 | 69,808 | — | 2,634,290 | — | — | ||||||||||||||||||
| Cost of shares redeemed | (1,636,788 | ) | (3,989,328 | ) | (11,827,298 | ) | (4,133,295 | ) | (4,618,030 | ) | (1,925,498 | ) | ||||||||||||
| Cost of shares redeemed in-kind | — | — | — | (31,021,954 | ) | — | — | |||||||||||||||||
| Class I Share Transactions | $ | (175,829 | ) | $ | (3,226,901 | ) | $ | (4,413,849 | ) | $ | 7,714,482 | $ | (1,561,611 | ) | $ | 8,253,804 | ||||||||
| Net increase (decrease) from capital transactions | $ | 42,572 | $ | (1,057,862 | ) | $ | (4,614,235 | ) | $ | 436,138 | $ | (1,059,543 | ) | $ | 10,667,638 | |||||||||
| Share Transactions: | ||||||||||||||||||||||||
| Class A Shares: | ||||||||||||||||||||||||
| Issued | 257,424 | 227,852 | 1,837,603 | 947,125 | 262,699 | 293,206 | ||||||||||||||||||
| Reinvested | 1,390 | 713 | — | 157,705 | — | — | ||||||||||||||||||
| Redeemed | (102,800 | ) | (58,108 | ) | (694,605 | ) | (1,372,349 | ) | (99,678 | ) | (43,852 | ) | ||||||||||||
| Change in Class A Shares | 156,014 | 170,457 | 1,143,998 | (267,519 | ) | 163,021 | 249,354 | |||||||||||||||||
| Class B Shares: | ||||||||||||||||||||||||
| Issued | 22,401 | 81,271 | 51,378 | 114,945 | 17,309 | 53,994 | ||||||||||||||||||
| Reinvested | — | 125 | — | 60,792 | — | — | ||||||||||||||||||
| Redeemed | (143,257 | ) | (20,117 | ) | (1,244,330 | ) | (459,488 | ) | (96,423 | ) | (13,964 | ) | ||||||||||||
| Change in Class B Shares | (120,856 | ) | 61,279 | (1,192,952 | ) | (283,751 | ) | (79,114 | ) | 40,030 | ||||||||||||||
| Class I Shares: | ||||||||||||||||||||||||
| Issued | 188,402 | 86,847 | 830,999 | 822,761 | 462,102 | 1,271,429 | ||||||||||||||||||
| Reinvested | 6,031 | 9,468 | — | 283,394 | — | — | ||||||||||||||||||
| Redeemed | (198,807 | ) | (517,335 | ) | (1,255,375 | ) | (352,428 | ) | (687,837 | ) | (255,243 | ) | ||||||||||||
| Redeemed in-kind | — | — | — | (2,226,989 | ) | — | — | |||||||||||||||||
| Change in Class I Shares | (4,374 | ) | (421,020 | ) | (424,376 | ) | (1,473,262 | ) | (225,735 | ) | 1,016,186 | |||||||||||||
| Net increase (decrease) from share transactions | 30,784 | (189,284 | ) | (474,330 | ) | (2,024,532 | ) | (141,828 | ) | 1,305,570 | ||||||||||||||
| (A) | Class B represents the period from January 1, 2009 through August 17, 2009. |
| (B) | Less than $1.00. |
108
MMA Praxis Mutual Funds
Notes to financial statements, continued
December 31, 2009
7. Federal Income Tax Information:
The character of dividends paid to shareholders for federal income tax purposes during the years ended December 31, 2009 and 2008 was as follows:
| Intermediate Income Fund | Core Stock Fund | Value Index Fund | ||||||||||||||||||||||
| 2009 | 2008 | 2009 | 2008 | 2009 | 2008 | |||||||||||||||||||
| From ordinary income | $ | 10,038,319 | $ | 12,399,258 | $ | 909,968 | $ | 1,053,735 | $ | 262,193 | $ | 1,467,377 | ||||||||||||
| From long-term capital gains | — | — | — | — | — | 908,837 | ||||||||||||||||||
| Total distributions | $ | 10,038,319 | $ | 12,399,258 | $ | 909,968 | $ | 1,053,735 | $ | 262,193 | $ | 2,376,214 | ||||||||||||
| Growth Index Fund | International Fund | Small Cap Fund | ||||||||||||||||||||||
| 2009 | 2008 | 2009 | 2008 | 2009 | 2008 | |||||||||||||||||||
| From ordinary income | $ | 76,741 | $ | 92,538 | $ | — | $ | 1,438,938 | $ | — | $ | — | ||||||||||||
| From long-term capital gains | — | — | — | 3,486,770 | — | — | ||||||||||||||||||
| Tax return of capital | — | — | — | 211,892 | — | — | ||||||||||||||||||
| Total distributions | $ | 76,741 | $ | 92,538 | $ | — | $ | 5,137,600 | $ | — | $ | — | ||||||||||||
The following information is computed on a tax basis for each item as of December 31, 2009:
| Intermediate | Core | Value | Growth | Small | ||||||||||||||||||||
| Income | Stock | Index | Index | International | Cap | |||||||||||||||||||
| Fund | Fund | Fund | Fund | Fund | Fund | |||||||||||||||||||
| Tax cost of portfolio investments | $ | 244,424,173 | $ | 190,497,108 | $ | 65,273,475 | $ | 18,675,501 | $ | 83,032,015 | $ | 20,389,256 | ||||||||||||
| Gross unrealized appreciation | 8,738,921 | 30,622,277 | 22,540,953 | 4,603,481 | 15,881,026 | 3,913,674 | ||||||||||||||||||
| Gross unrealized depreciation | (1,806,043 | ) | (20,961,969 | ) | (25,801,534 | ) | (2,101,916 | ) | (3,038,507 | ) | (1,327,218 | ) | ||||||||||||
| Net unrealized appreciation (depreciation) | 6,932,878 | 9,660,308 | (3,260,581 | ) | 2,501,565 | 12,842,519 | 2,586,456 | |||||||||||||||||
| Undistributed ordinary income | 50,695 | — | 857,451 | 11,512 | 927,265 | — | ||||||||||||||||||
| Capital loss carryforward | (1,940,494 | ) | (44,743,431 | ) | (10,865,736 | ) | (3,138,715 | ) | (22,013,691 | ) | (7,322,873 | ) | ||||||||||||
| Post-October losses | (9,209 | ) | (5,821,479 | ) | (3,977,870 | ) | — | (88,492 | ) | (308,849 | ) | |||||||||||||
| Other temporary differences | — | (124,739 | ) | — | (2,802,983 | ) | 36,662 | — | ||||||||||||||||
| Accumulated earnings (deficit) | $ | 5,033,870 | $ | (41,029,341 | ) | $ | (17,246,736 | ) | $ | (3,428,621 | ) | $ | (8,295,737 | ) | $ | (5,045,266 | ) | |||||||
The difference between book basis and tax basis net unrealized appreciation (depreciation) is attributable primarily to the tax deferral of losses on wash sales and investments in Passive Foreign Investment Companies.
109
MMA Praxis Mutual Funds
Notes to financial statements, continued
December 31, 2009
As of December 31, 2009, the following Funds had net capital loss carryforwards to offset future net capital gains, if any:
| Amount | Expires | ||||
| Intermediate Income Fund | $ | 223,481 | 2010 | ||
| 157,433 | 2012 | ||||
| 1,277,637 | 2014 | ||||
| 281,943 | 2016 | ||||
| $ | 1,940,494 | ||||
| Core Stock Fund | $ | 12,397,714 | 2016 | ||
| 32,345,717 | 2017 | ||||
| $ | 44,743,431 | ||||
| Value Index Fund | $ | 1,354,661 | 2016 | ||
| 9,511,075 | 2017 | ||||
| $ | 10,865,736 | ||||
| Growth Index Fund | $ | 885,950 | 2016 | ||
| 2,252,765 | 2017 | ||||
| $ | 3,138,715 | ||||
| International Fund | $ | 8,630,470 | 2016 | ||
| 13,383,221 | 2017 | ||||
| $ | 22,013,691 | ||||
| Small Cap Fund | $ | 31,958 | 2015 | ||
| 2,932,855 | 2016 | ||||
| 4,358,060 | 2017 | ||||
| $ | 7,322,873 | ||||
During the year ended December 31, 2009, the Intermediate Income Fund utilized $982,987 of capital loss carryforwards.
Certain reclassification, the result of permanent differences between financial statement and income tax reporting requirements, have been made to the components of capital. Reclassifications result primarily from the difference in the tax treatment of paydown gains and losses, investments in Real Estate Investment Trusts, net investment losses and sales of contributed securities. These reclassifications have no impact on the net assets or net asset value per share of the Funds and are designed to present each Fund's capital accounts on a tax basis. The following reclassifications have been made to the following Funds for the year ended December 31, 2009:
| Accumulated | Accumulated | |||||||||||
| Paid-In | Net Investment | Net Realized | ||||||||||
| Capital | Income (Loss) | Gains (Losses) | ||||||||||
| Intermediate Income Fund | $ | — | $ | 132,878 | $ | (132,878 | ) | |||||
| Core Stock Fund | — | (17,446 | ) | 17,446 | ||||||||
| Value Index Fund | — | (25,388 | ) | 25,388 | ||||||||
| Growth Index Fund | (699,073 | ) | (391 | ) | 699,464 | |||||||
| International Fund | — | 900,689 | (900,689 | ) | ||||||||
| Small Cap Fund | (144,982 | ) | 131,416 | 13,566 | ||||||||
110
MMA Praxis Mutual Funds
Notes to financial statements, continued
December 31, 2009
The Funds have analyzed their tax positions taken on Federal income tax returns for all open tax years (tax years ended December 31, 2006 through 2009) and have concluded that no provision for income tax is required in their financial statements.
8. Subsequent Events
The Funds evaluated subsequent events from December 31, 2009, the date of these financial statements, through March 1, 2010, the date these financial statements were issued and available.
On January 1, 2010, the MMA Praxis Mutual Funds launched the MMA Praxis Genesis Portfolios. The Genesis Portfolios consist of three fund of funds structured portfolios: Conservative Portfolio, Balance Portfolio and Growth Portfolio. The fund of funds structure is an investment approach that uses a strategy of holding a group of funds rather than investing directly in individual stocks, bonds or other securities. The Genesis Portfolios will invest in a combination of other MMA Praxis Mutual Funds to achieve the investment objective of each portfolio.
On January 21, 2010, the MMA Praxis Mutual Funds Fair Valuation Committee met to conduct a review of the MMA Community Development Investment (“MMA CDI”) notes held in the Funds. It was determined by the Committee that the maturity and simultaneous renewal of the MMA CDI notes held by the Core Stock, Value Index, International and Intermediate Income Funds on December 31, 2009 has changed the depth of coverage provided by holders of subordinated MMA CDI notes. In particular, the funds mentioned above have purchased notes that mature on a staggered basis on December 15th of 2011, 2012, and 2013. The notes maturing on December 15, 2013 are not supported by subordinate debt held by MMA Praxis affiliates, the longest of which matures on March 13, 2013. Based upon this review, the lack of subordinate coverage for the longest notes in the MMA Praxis Funds has resulted in the Committee discounting these notes maturing on December 15, 2013 by 9.9%. The Committee will continue to assess the credit enhancement of the MMA CDI notes and anticipates that future changes in the position of maturities of the notes held by the MMA Praxis Mutual Funds relative to maturity dates of subordinated notes may alter the recommended discount.
111
Report of Independent Registered Public
Accounting Firm
The Board of Trustees and Shareholders
of the MMA Praxis Mutual Funds:
We have audited the accompanying statements of assets and liabilities of the MMA Praxis Mutual Funds (comprised of the MMA Praxis Intermediate Income Fund, MMA Praxis Core Stock Fund, MMA Praxis Value Index Fund, MMA Praxis Growth Index Fund, MMA Praxis International Fund, and MMA Praxis Small Cap Fund) (collectively, the “Funds”), including the schedules of investments, as of December 31, 2009, and the related statements of operations for the year then ended, the statements of changes in net assets and the financial highlights for the periods indicated therein. These financial statements and financial highlights are the responsibility of the Funds’ management. Our responsibility is to express an opinion on these financial statements and financial highlights based on our audits.
We conducted our audits in accordance with the standards of the Public Company Accounting Oversight Board (United States). Those standards require that we plan and perform the audit to obtain reasonable assurance about whether the financial statements and financial highlights are free of material misstatement. We were not engaged to perform an audit of the Funds’ internal control over financial reporting. Our audits included consideration of internal control over financial reporting as a basis for designing audit procedures that are appropriate in the circumstances, but not for the purpose of expressing an opinion on the effectiveness of the Funds’ internal control over financial reporting. Accordingly, we express no such opinion. An audit also includes examining, on a test basis, evidence supporting the amounts and disclosures in the financial statements and financial highlights, assessing the accounting principles used and significant estimates made by management, and evaluating the overall financial statement presentation. Our procedures included confirmation of securities owned as of December 31, 2009, by correspondence with the custodian and brokers. We believe that our audits provide a reasonable basis for our opinion.
In our opinion, the financial statements and financial highlights referred to above present fairly, in all material respects, the financial position of the MMA Praxis Mutual Funds at December 31, 2009, the results of their operations for the year then ended, the changes in their net assets and the financial highlights for the periods indicated therein, in conformity with U.S. generally accepted accounting principles.

Cincinnati, Ohio
March 1, 2010
112
| Additional fund information |
MMA Praxis Mutual Funds
Additional fund information
December 31, 2009
Security Allocation:
The MMA Praxis Funds invested, as a percentage of net assets, in the following as of the year ended December 31, 2009.
| Intermediate Income Fund |
| Percentage of | |
| Security Allocation | Net Assets |
| Asset Backed Securities | 0.2% |
| Collateralized Mortgage Obligations | 0.2% |
| Commercial Mortgage Backed Securities | 8.4% |
| Foreign Bonds | 0.8% |
| Municipal Bonds | 1.9% |
| Corporate Bonds | 42.1% |
| Corporate Notes | 1.0% |
| Interest Only Bonds | 0.1% |
| Federal Farm Credit Bank | 0.9% |
| Federal Home Loan Bank | 3.7% |
| Freddie Mac | 12.8% |
| Fannie Mae | 15.3% |
| Government National Mortgage Assoc. | 1.2% |
| Small Business Administration | 0.2% |
| FDIC Guaranteed | 6.1% |
| Mutual Funds | 0.5% |
| Short Term Investments | 4.8% |
| Total | 100.2% |
| Core Stock Fund |
| Percentage of | |
| Security Allocation | Net Assets |
| Common Stocks | 96.7% |
| Commercial Paper | 3.9% |
| Corporate Bonds | 0.6% |
| Corporate Notes | 1.5% |
| Total | 102.7% |
| Value Index Fund |
| Percentage of | |
| Security Allocation | Net Assets |
| Common Stocks | 99.0% |
| Corporate Notes | 1.2% |
| Total | 100.2% |
| Growth Index Fund |
| Percentage of | |
| Security Allocation | Net Assets |
| Common Stocks | 98.6% |
| Corporate Notes | 0.9% |
| Total | 99.5% |
| International Fund |
| Percentage of | |
| Security Allocation | Net Assets |
| Argentina | 0.6% |
| Australia | 3.5% |
| Austria | 0.3% |
| Belgium | 0.6% |
| Brazil | 0.6% |
| Canada | 6.7% |
| Cayman Islands | 3.8% |
| Finland | 0.5% |
| France | 6.7% |
| Germany | 8.9% |
| Greece | 1.0% |
| Hong Kong | 1.2% |
| Israel | 0.3% |
| Japan | 12.5% |
| Jersey | 0.5% |
| Mexico | 0.5% |
| Netherlands | 8.5% |
| Norway | 0.5% |
| Singapore | 0.5% |
| South Korea | 0.4% |
| Spain | 2.5% |
| Sweden | 1.8% |
| Switzerland | 12.9% |
| United Kingdom | 23.7% |
| Preferred Stock - Foreign | 2.0% |
| Exchange Traded Fund | 0.5% |
| Corporate Notes - Domestic | 1.4% |
| Short Term Investments | 0.0% |
| Total | 102.9% |
| Small Cap Fund |
| Percentage of | |
| Security Allocation | Net Assets |
| Common Stocks | 96.5% |
| Corporate Notes | 0.9% |
| Short Term Investments | 4.6% |
| Total | 102.0% |
113
MMA Praxis Mutual Funds
Additional fund information, continued
December 31, 2009 (unaudited)
Proxy Voting:
The Adviser and Sub-Adviser are responsible for exercising the voting rights associated with the securities purchased and held by the Funds. A description of the policies and procedures that the Adviser and Sub- Adviser use in fulfilling this responsibility and information regarding how those proxies were voted during the twelve month period ended June 30 are available (i) without charge, upon request, by calling (800) 977-2947; and (ii) on the Securities and Exchange Commission’s (“Commission’s”) Web site at http://www.sec.gov.
Quarterly Portfolio Disclosure:
The Trust files a complete listing of the Schedules of portfolio investments for each Fund as of the end of the first and third quarters of each fiscal year on Form N-Q. The complete listing (i) is available on the Commission’s Web site, (ii) may be reviewed and copied at the Commission’s Public Reference Room in Washington, DC; and (iii) will be made available to shareholders upon request by calling (800) 977-2947. Information on the operation of the Public Reference Room may be obtained by calling (800) SEC-0330. The Statement of Additional Information contains more information about the Funds and can be obtained free of charge by calling (800) 977-2947.
Dividend Received Deduction:
For corporate shareholder, the following ordinary dividends paid during the year ended December 31, 2009 qualify for the corporate dividends received deduction:
| Core Stock Fund | 100% |
| Value Index Fund | 100% |
| Growth Index Fund | 100% |
114
MMA Praxis Mutual Funds
Additional fund information, continued
December 31, 2009 (unaudited)
Expense Comparison:
As a shareholder of the MMA Praxis Mutual Funds, you incur two types of costs: (1) transaction costs, including sales charges (loads) on purchases, reinvested dividends, or other distributions; redemption fees; and exchange fees; (2) ongoing costs, including management fees; distribution and service 12b-1 fees; and other Fund expenses. This example is intended to help you understand your ongoing costs (in dollars) of investing in the MMA Praxis Mutual Funds and to compare these costs with the ongoing costs of investing in other mutual funds.
The example is based on an investment of $1,000 invested at the beginning of the period and held for the entire period from July 1, 2009 through December 31, 2009.
Actual Expenses:
The table below provides information about actual account values and actual expenses. You may use the information below, together with the amount you invested, to estimate the expenses that you paid over the period. Simply divide your account value by $1,000 (for example, an $8,600 account value divided by $1,000 = 8.6), then multiply the result by the number in the table under the heading entitled “Expenses Paid During Period” to estimate the expenses you paid on your account during this period.
| Beginning | Ending | Expense Paid | Expense Ratio | |||||||||||||
Account Value | Account Value | During Period* | During Period** | |||||||||||||
| 7/1/09 | 12/31/09 | 7/1/09 - 12/31/09 | 7/1/09 - 12/31/09 | |||||||||||||
| Intermediate Income Fund | ||||||||||||||||
| Class A | $ | 1,000.00 | $ | 1,051.50 | $ | 5.00 | 0.97 | % | ||||||||
| Class I | 1,000.00 | 1,053.00 | 3.57 | 0.69 | % | |||||||||||
| Core Stock Fund | ||||||||||||||||
| Class A | 1,000.00 | 1,243.40 | 8.47 | 1.50 | % | |||||||||||
| Class I | 1,000.00 | 1,245.60 | 6.14 | 1.09 | % | |||||||||||
| Value Index Fund | ||||||||||||||||
| Class A | 1,000.00 | 1,232.80 | 5.76 | 1.02 | % | |||||||||||
| Class I | 1,000.00 | 1,232.50 | 4.19 | 0.74 | % | |||||||||||
| Growth Index Fund | ||||||||||||||||
| Class A | 1,000.00 | 1,216.50 | 4.44 | 0.79 | % | |||||||||||
| Class I | 1,000.00 | �� | 1,217.40 | 4.53 | 0.81 | % | ||||||||||
| International Fund | ||||||||||||||||
| Class A | 1,000.00 | 1,200.50 | 9.40 | 1.69 | % | |||||||||||
| Class I | 1,000.00 | 1,202.70 | 7.62 | 1.37 | % | |||||||||||
| Small Cap Fund | ||||||||||||||||
| Class A | 1,000.00 | 1,198.40 | 7.91 | 1.43 | % | |||||||||||
| Class I | 1,000.00 | 1,199.10 | 7.87 | 1.42 | % | |||||||||||
| * | Expenses are equal to the average account value times the Fund's annualized expense ratio multiplied by the number of days in the most recent fiscal half-year divided by the number of days in the fiscal year. |
| ** | Annualized. |
115
MMA Praxis Mutual Funds
Additional fund information, continued
December 31, 2009 (unaudited)
Hypothetical Example for Comparison Purposes:
The table below provides information about hypothetical account values and hypothetical expenses based on each MMA Praxis Mutual Fund’s expense ratio and an assumed rate of return of 5% per year before expenses, which is not the Fund’s actual return. The hypothetical account values and expenses may not be used to estimate the actual ending account balance or expenses you paid for the period. You may use this information to compare this 5% hypothetical example with the 5% hypothetical examples that appear in the shareholder reports of other funds.
Please note that the expenses shown in the table are meant to highlight your ongoing costs only and do not reflect any transactional costs, such as sales charges (loads), redemption fees, or exchange fees. Therefore, the table is useful in comparing ongoing costs only, and will not help you determine the relative costs of owning different funds. In addition, if these transactional costs were included, your costs would have been higher.
| Beginning | Ending | Expense Paid | Expense Ratio | |||||||||||||
Account Value | Account Value | During Period* | During Period** | |||||||||||||
| 7/1/09 | 12/31/09 | 7/1/09 - 12/31/09 | 7/1/09 - 12/31/09 | |||||||||||||
| Intermediate Income Fund | ||||||||||||||||
| Class A | $ | 1,000.00 | $ | 1,020.33 | $ | 4.92 | 0.97 | % | ||||||||
| Class I | 1,000.00 | 1,021.73 | 3.52 | 0.69 | % | |||||||||||
| Core Stock Fund | ||||||||||||||||
| Class A | 1,000.00 | 1,017.66 | 7.62 | 1.50 | % | |||||||||||
| Class I | 1,000.00 | 1,019.73 | 5.53 | 1.09 | % | |||||||||||
| Value Index Fund | ||||||||||||||||
| Class A | 1,000.00 | 1,020.05 | 5.21 | 1.02 | % | |||||||||||
| Class I | 1,000.00 | 1,021.45 | 3.79 | 0.74 | % | |||||||||||
| Growth Index Fund | ||||||||||||||||
| Class A | 1,000.00 | 1,021.20 | 4.05 | 0.79 | % | |||||||||||
| Class I | 1,000.00 | 1,021.12 | 4.13 | 0.81 | % | |||||||||||
| International Fund | ||||||||||||||||
| Class A | 1,000.00 | 1,016.66 | 8.61 | 1.69 | % | |||||||||||
| Class I | 1,000.00 | 1,018.29 | 6.98 | 1.37 | % | |||||||||||
| Small Cap Fund | ||||||||||||||||
| Class A | 1,000.00 | 1,018.01 | 7.27 | 1.43 | % | |||||||||||
| Class I | 1,000.00 | 1,018.05 | 7.22 | 1.42 | % | |||||||||||
| * | Expenses are equal to the average account value times the Fund's annualized expense ratio multiplied by the number of days in the most recent fiscal half-year divided by the number of days in the fiscal year. |
| ** | Annualized. |
116
MMA Praxis Mutual Funds
Additional fund information, continued (unaudited)
December 31, 2009
Board Consideration and Approval of Advisory and Sub-advisory Agreements
Section 15(c) of the 1940 Act requires that each mutual fund’s board of trustees, including a majority of trustees who are not “interested persons” of the fund (“Independent Trustees”), annually review and approve the fund’s investment advisory and sub-advisory agreements. At its November 16, 2009 meeting, the Funds’ Board of Trustees, which is comprised of a majority of Independent Trustees, unanimously approved the renewal of the Funds’ Advisory Agreement. Also at its November 16, 2009 meeting, the Board approved a one-year renewal of the Sub-Advisory Agreements for the Core Stock Fund, the International Fund and the Small Cap Fund. In this section, Advisory and Sub-Advisory Agreements are referred to as the “Agreements.”
In reaching its decision to approve the renewals, the Board considered information furnished to the Board throughout the year at regular Board meetings, as well as information prepared specifically in connection with the annual contract review process that took place at various meetings in October and November 2009.
In determining to approve the renewals, the members of the Board reviewed and evaluated all of this information and factors they believed, in light of legal advice furnished to them by independent legal counsel and through the exercise of their own business judgment, to be relevant and appropriate.
The Board’s conclusions with respect to the Agreements were based in part on the Board’s consideration of the Agreements in prior years. The Board also observed that there is a range of investment options available to shareholders of the Funds, including a wide variety of mutual funds offered by competitors to MMA Praxis Mutual Funds, and that the Funds’ shareholders have chosen to invest in the Funds.
The Board’s decision to approve the Agreements was not based on any single factor. Each member of the Board may have weighed certain factors differently. A discussion of factors that figured prominently in the Board’s decision to approve the Agreements is provided below.
INFORMATION FOR SHAREHOLDERS REGARDING THE RENEWAL OF THE INVESTMENT ADVISORY AGREEMENT WITH MMA CAPITAL MANAGEMENT
In approving the continuation of the Investment Advisory Agreement between each of the Funds and MMA Capital Management, Inc., the Board gave weight to the following factors, among others:
Nature, Quality and Extent of Services
The Board examined the nature, quality and extent of services MMA Capital Management provides to the Funds. Among other things, the Board considered MMA Capital Management’s experience in serving as investment manager of the Funds, including the experience of senior personnel at MMA Capital Management providing services to the Funds. The Board also considered MMA Capital Management’s performance in fulfilling its responsibilities for overseeing the Funds’ legal and compliance environment, in overseeing the Sub-Advisers’ compliance with the Funds’ investment objectives and policies, and in implementing Board directives as they relate to the Funds. In addition, the Board considered MMA Capital Management’s track record and experience providing portfolio management services to the Funds that do not have Sub-Advisers. The Board also considered that MMA Capital Management is responsible for the stewardship investing screening process for the Funds, and develops and carries out shareholder advocacy on behalf of the Funds. Based on these and other considerations, within the context of its overall determinations regarding the Agreements, the Board concluded that it was generally satisfied with the nature, quality and extent of services provided to the Funds by MMA Capital Management.
117
Investment Performance of the Funds and MMA
In evaluating each Fund’s investment performance, the Board considered performance in light of the Fund’s investment objectives, strategies, and risks, as disclosed in the Fund’s prospectus. The Board reviewed historical performance data for the Funds, and considered each Fund’s historical performance relative to its benchmark and peer groups. Based on these and other considerations, within the context of its overall determinations regarding the Agreements, the Board reached the following conclusions regarding the Funds that do not have Sub-Advisers: Intermediate Income Fund: the Fund’s gross performance exceeded its benchmark for the one-, three- and five-year periods, and was within or near the top quartile of its peer groups over those periods; Value Index Fund: while the performance of the Fund relative to its benchmark and peer groups over the one-, three- and five-year periods was disappointing, its peer funds were not limited in their stock selection by SRI criteria and the Board noted, for example, that the Fund had outperformed its screened index for the three-year period on a gross-fee basis; Growth Index Fund: while the Fund’s short operating history prevented long-term historical performance comparisons, the Fund’s gross performance exceeded its benchmark for the one-year period, although the Fund trailed its screened index and ranked in the third quartile of its peer groups over that period.
Costs of Services and Profitability of MMA and Affiliates
The Board then reviewed information and data regarding the costs of providing the advisory services to the Funds and the profits to be realized by MMA Capital Management and its affiliates from their relationship with the Funds. Representatives of MMA Capital Management addressed the Board’s questions concerning guidelines for manager selection, cost allocations and compensation levels, revenue sharing arrangements and expense waivers and reimbursements. In their review of the Funds’ total expenses, the Board considered MMA Capital Management’s fees, as well as other Fund expenses, such as transfer agent fees, custodial, legal and audit fees. The Board also noted the effects of MMA Capital Management’s current expense waivers and expense reimbursements on fees and expense levels, as well as proposed changes to the current expense limitations. As part of its review, the Board considered the expense ratios and profitability information by Fund compared with peer group fund expense ratios and profitability information. In addition, the Board reviewed the fee structures and other information provided by MMA Capital Management regarding its services to other clients. Based on these and other considerations, within the context of its overall determinations regarding the Agreements, the Board concluded that the costs to the Funds of the services provided to the Funds by MMA Capital Management were fair.
Economies of Scale
The Board considered the extent to which economies of scale would be realized as the Funds grow and whether the investment advisory fee rates reflect those economies of scale for the benefit of the Funds’ shareholders. MMA Capital Management represented to the Board that MMA Capital Management would consider appropriate breakpoints as the Funds grow in size, but that the Funds’ asset values had not yet reached levels at which economies of scale could be realized. The Board then considered the information provided regarding the expense levels of peer group funds. Based on these and other considerations, within the context of its overall determinations regarding the Agreements, the Board concluded that current asset levels did not warrant breakpoints at this time.
118
Other Benefits
The Board discussed the extent to which MMA Capital Management and its affiliates might derive other benefits, including soft dollar credits or other similar benefits from MMA Capital Management’s relationship with the Funds. The Board noted that MMA Capital Management had voluntarily discontinued the practice of generating soft dollar credits to purchase third-party research services in 2004. The Board also considered other potential benefits to MMA Capital Management and its affiliates from their relationship with the Funds. Based on these and other considerations, within the context of its overall determinations regarding the Agreements, the Board concluded that such benefits were not material or were reasonable in relation to the services provided.
INFORMATION FOR SHAREHOLDERS REGARDING THE RENEWAL OF THE SUB-INVESTMENT ADVISORY AGREEMENT WITH DAVIS
In approving the continuation of the Sub-Investment Advisory Agreement between MMA Capital Management, Inc. and Davis Selected Advisers, L.P., with respect to portfolio management of MMA Praxis Core Stock Fund, the Board gave weight to the following factors, among others:
Nature, Quality and Extent of Services
The Board considered the nature, quality and extent of services Davis provides to the Core Stock Fund. Among other things, the Board considered Davis’s experience in serving as Sub-Adviser to the Fund, including the experience of senior personnel at Davis providing portfolio management and other services to the Fund. The Board considered Davis’s compliance capabilities, its compliance record with respect to the Core Stock Fund, and the quality of communication among MMA Capital Management, Davis and the Board. The Board also considered Davis’s compliance with the Fund’s investment objectives and policies, and its performance in implementing Board directives as they relate to the Fund. In addition, the Board considered Davis’s track record and experience providing portfolio management services to the Fund. Based on these and other considerations, within the context of its overall determinations regarding the Agreements, the Board concluded that it was generally satisfied with the nature, quality and extent of services provided to the Core Stock Fund by Davis.
Investment Performance of the Core Stock Fund and Davis
The Board reviewed historical performance data for the Core Stock Fund, and considered the Fund’s historical performance relative to its benchmark and peer groups. The Board also considered the impact of SRI criteria on Fund performance. Based on these and other considerations, within the context of its overall determinations regarding the Agreements, the Board concluded that, while the performance of the Fund relative to its benchmark and peer groups has been disappointing over the one- and three-year periods (Davis has served as Sub-Adviser only since January 2006), its peer funds were not limited in their stock selection by SRI criteria. The Board also noted that the Fund’s peer group rankings and its performance against its benchmark and screened index had improved for the first three quarters of 2009.
119
Costs of Services and Profitability of Davis and Affiliates
The Board considered the costs of the services provided by Davis to the Core Stock Fund and the profits to be realized by Davis and its affiliates from their relationship with the Core Stock Fund. Based on these and other considerations, within the context of its overall determinations regarding the Agreements, the Board concluded that the costs to the Core Stock Fund of the services provided by Davis were fair.
Economies of Scale
The Board noted that Davis’s sub-advisory fee schedule currently incorporates break-points. The Board also acknowledged Davis’s belief that the current fee schedule anticipates economies of scale that would be realized as assets in the Core Stock Fund grow.
Other Benefits
The Board considered the extent to which Davis or its affiliates would derive other benefits, including soft dollar credits or other similar benefits, from Davis’s relationship with the Core Stock Fund. The Board noted Davis’s statement to the Board that its research analysts may take into account the research resources and execution capacity of a brokerage firm in selecting brokers, and Davis may receive certain types of research services from firms to which transactions are directed. Based on these and other considerations, within the context of its overall determinations regarding the Agreements, the Board concluded that Davis did not derive material benefits, other than its sub-advisory fees and potentially, certain research services from its relationship with the Core Stock Fund.
INFORMATION FOR SHAREHOLDERS REGARDING THE APPROVAL OF THE SUB-INVESTMENT ADVISORY AGREEMENT WITH EVERGREEN
In approving the continuation of the Sub-Investment Advisory Agreement between MMA Capital Management, Inc. and Evergreen Investment Management Company, LLC, with respect to portfolio management of MMA Praxis International Fund, the Board gave weight to the following factors, among others:
Nature, Quality and Extent of Services
The Board considered the nature, quality and extent of services Evergreen provides to the International Fund. Among other things, the Board considered Evergreen’s experience in serving as Sub-Adviser to the Fund, including the experience of senior personnel at Evergreen providing portfolio management and other services to the Fund. The Board considered Evergreen’s compliance capabilities, its compliance record with respect to the International Fund, and the quality of communication among MMA Capital Management, Evergreen and the Board. The Board also considered Evergreen’s compliance with the Fund’s investment objectives and policies, and its performance in implementing Board directives as they relate to the Fund. In addition, the Board considered Evergreen’s track record and experience providing portfolio management services to the Fund. Based on these and other considerations, within the context of its overall determinations regarding the Agreements, the Board concluded that it was generally satisfied with the nature, quality and extent of services provided to the International Fund by Evergreen.
120
Investment Performance of the International Fund and Evergreen
The Board reviewed historical performance data for the International Fund, and considered the Fund’s historical performance relative to its benchmark and peer groups. In addition, the Board considered the impact of SRI criteria on performance. Based on these and other considerations, within the context of its overall determinations regarding the Agreements, the Board concluded that, while the performance of the Fund relative to its benchmark and peer groups has been disappointing over the one-, three- and five-year periods, its peer funds were not limited in their stock selection by SRI criteria. The Board noted that this effect may be more pronounced for international stock selection.
Costs of Services and Profitability of Evergreen and Affiliates
The Board considered the costs of the services provided by Evergreen to the International Fund and the profits to be realized by Evergreen and its affiliates from their relationship with the International Fund. Based on these and other considerations, within the context of its overall determinations regarding the Agreements, the Board concluded that the costs to the International Fund of the services provided by Evergreen were fair.
Economies of Scale
The Board noted that Evergreen’s sub-advisory fee schedule has breakpoints at higher asset levels. The Board also acknowledged Evergreen’s representation that Evergreen would consider additional breakpoints as assets in the International Fund grow to levels where economies of scale would be realized.
Other Benefits
The Board considered the extent to which Evergreen or its affiliates would derive other benefits, including soft dollar credits or other similar benefits, from Evergreen’s relationship with the International Fund. Based on these and other considerations, within the context of its overall determinations regarding the Agreements, the Board concluded that Evergreen did not derive material benefits, other than its sub-advisory fees and potentially, certain soft dollar arrangements, from its relationship with the International Fund.
INFORMATION FOR SHAREHOLDERS REGARDING THE RENEWAL OF THE SUB-INVESTMENT ADVISORY AGREEMENT WITH LUTHER KING CAPITAL MANAGEMENT
In approving the continuation of the Sub-Investment Advisory Agreement between MMA Capital Management, Inc. and Luther King Capital Management, with respect to portfolio management of the MMA Praxis Small Cap Fund, the Board gave weight to the following factors, among others:
Nature, Quality and Extent of Services
The Board considered the nature, quality and extent of services Luther King Capital Management provides to the Small Cap Fund. Among other things, the Board considered Luther King Capital Management’s experience in serving as Sub-Adviser to the Fund, including the experience of senior personnel at Luther King Capital Management providing portfolio management and other services to the Fund. The Board considered Luther King Capital Management’s compliance capabilities, its compliance record with respect to the Small Cap Fund, and the quality of communication among MMA Capital Management, Luther King Capital Management and the Board. The Board also considered Luther King Capital Management’s compliance with the Fund’s investment objectives and policies, and its performance in implementing Board directives as they relate to the Fund. Based on these and other considerations, within the context of its overall determinations regarding the Agreements, the Board concluded that it was generally satisfied with the nature, quality and extent of services provided to the Small Cap Fund by Luther King Capital Management.
121
Investment Performance of the Small Cap Fund and Luther King Capital Management
The Board reviewed historical performance data for the Small Cap Fund, and considered the Fund’s historical performance relative to its benchmark and peer groups, noting that the Fund had only one full year of performance history. The Board also considered the impact of SRI criteria on Fund performance. Based on these and other considerations, within the context of its overall determinations regarding the Agreements, the Board concluded that the Fund’s gross performance exceeded its benchmark for the one-year period, and while the Fund ranked in the third quartile against its peer groups over that period, there was a modest improvement in the peer group rankings for the first three quarters of 2009.
Costs of Services and Profitability of Luther King Capital Management and Affiliates
The Board considered the costs of the services provided by Luther King Capital Management to the Small Cap Fund and the profits to be realized by Luther King Capital Management and its affiliates from their relationship with the Small Cap Fund. Based on these and other considerations, within the context of its overall determinations regarding the Agreements, the Board concluded that the costs to the Small Cap Fund of the services provided by Luther King Capital Management were fair.
Economies of Scale
The Board noted that Luther King Capital Management’s sub-advisory fee schedule does not incorporate breakpoints. The Board also acknowledged Luther King Capital Management’s statement that the current fee schedule reflects existing economies of scale.
Other Benefits
The Board considered the extent to which Luther King Capital Management or its affiliates would derive other benefits, including soft dollar credits or other similar benefits, from Luther King Capital Management’s relationship with the Small Cap Fund. Based on these and other considerations, within the context of its overall determinations regarding the Agreements, the Board concluded that Luther King Capital Management did not derive material benefits, other than its sub-advisory fees and potentially, certain soft dollar arrangements, from its relationship with the Small Cap Fund.
122
| Management of the Trust |
MMA Praxis Mutual Funds
Management of the Trust (unaudited)
Management of the Trust (unaudited)
Listed below is basic information regarding the Trustees and principal officers of the Trust. The Trust’s Statement of Additional Information includes additional information about the Trustees and is available, without charge, upon request by calling (800) 977-2947.
Number of | ||||||||
Position with the | Portfolios in | Other | ||||||
Company, Term of | Fund Complex | Trusteeships | ||||||
Name, Age and | Office and Length | Principal Occupation During | Overseen by | Held by | ||||
Address | of Time Served | the Past Five Years | Trustee | Trustee | ||||
Interested Trustees1 | ||||||||
Howard L. Brenneman | Chairman and | Self-employed Consultant, Consult, Inc. (2006 - | 6 | N/A | ||||
1110 North Main Street | Trustee, Indefinite, | Present); President and CEO, Mennonite Mutual | ||||||
Goshen, IN 46528 | since 12/2/93 | Aid (December 1991 - 2005) | ||||||
Birth date: 3/26/40 | ||||||||
Larry Miller | Trustee, Indefinite, | President and CEO of Mennonite Mutual Aid | 6 | Chair of | ||||
1110 North Main Street | since 2/19/07 | (January 2007 - Present); President and CEO | Board of | |||||
Goshen, IN 46528 | of Mennonite Financial Federal Credit Union | Directors of | ||||||
Birth date: 8/11/49 | (September 1990 - December 2006) | MMA Trust | ||||||
Company |
1 | These Trustees are “interested” persons under the Investment Company Act of 1940 because of their affiliation with the Adviser. |
Independent Trustees | ||||||||
Bruce Harder | Trustee, Indefinite, | Retired; Executive Director for Finance and | 6 | N/A | ||||
1110 North Main Street | since 2/11/00 | Administration, Tri-Met, the Tri-County | ||||||
Goshen, IN 46528 | Metropolitan Transportation District of Oregon, | |||||||
Birth date: 1/17/41 | public transportation system for Portland, Oregon | |||||||
(1986 - 2003); Chairman of the Board, Mennonite | ||||||||
Mutual Aid, Goshen Indiana (1997 - 2003) | ||||||||
Karen Klassen Harder, Ph.D. | Trustee, Indefinite, | Professor, Bluffton University (September | 6 | N/A | ||||
1110 North Main Street | since 12/2/93 | 2001 - present) | ||||||
Goshen, IN 46528 | ||||||||
Birth date: 1/22/56 | ||||||||
R. Clair Sauder | Trustee, Indefinite, | Partner, Encore Enterprises, LLC, retail home | 6 | N/A | ||||
1110 North Main Street | since 6/30/02 | furnishings (May 2001 - October 2008); Partner, | ||||||
Goshen, IN 46528 | C&D Enterprises Unlimited, commercial real | |||||||
Birth date: 1/11/43 | estate (1982 - present) | |||||||
Donald E. Showalter, Esq. | Trustee, Indefinite, | Senior Partner, the law firm of Wharton, Aldhizer, | 6 | N/A | ||||
1110 North Main Street | since 12/2/93 | & Weaver (June 1965 - present) | ||||||
Goshen, IN 46528 | ||||||||
Birth date: 2/23/41 | ||||||||
Candace L. Smith | Trustee, Indefinite, | CFO MicroVest Capital Management LLC (July | 6 | N/A | ||||
1110 North Main Street | since 11/16/07 | 2005 - present); Investment Committee Member, | ||||||
Goshen, IN 46528 | CleanTech Fund LP (2004 - 2008); Self- | |||||||
Birth date: 7/10/58 | Employed Consultant (2003 - 2005); COO, | |||||||
Environmental Enterprises Assistance Fund | ||||||||
(1999 - 2003) | ||||||||
Don E. Weaver | Trustee, Indefinite, | CFO, Hesston College (2006 - present); CIO, | 6 | N/A | ||||
1110 North Main Street | since 5/21/07 | Koch Industries and Flint Hills Resources | ||||||
Goshen, IN 46528 | (1987 - 2006) | |||||||
Birth date: 11/14/62 | ||||||||
123
MMA Praxis Mutual Funds
Management of the Trust (unaudited), continued
| Position with the Company, Term of | Principal Occupation | |||
| Name, Age and Address | Office and Length of Time Served | During the Past Five Years | ||
| Officers | ||||
| David C. Gautsche | President, Indefinite, since 11/17/08 | Senior Vice President, Mennonite Mutual Aid (2008 - | ||
| 1110 North Main Street | Present); Regional Vice President, Mennonite Mutual | |||
| Goshen, IN 46528 | Aid (1999 - 2008) | |||
| Birth date: 5/26/63 | ||||
| Marlo J. Kauffman | Vice President, Indefinite, since 12/2/93 | Financial Services Operation Manager, Mennonite | ||
| 1110 North Main Street | Mutual Aid (1981 - present); President, MMA | |||
| Goshen, IN 46528 | Securities, Inc. (2004 - present); OSJ Principal, | |||
| Birth Date: 9/19/56 | ProEquities, Inc., a broker-dealer (1994 - Present); | |||
| Assistant Secretary, Mennonite Mutual Aid | ||||
| (1990 - Present) | ||||
| Trent M. Statczar | Treasurer, Indefinite, since 1/1/09 | Vice President, Beacon Hill Fund Services, Inc. 2008 to | ||
| 4041 N. High Street | present: Senior Vice President, Citi Fund Services | |||
| Suite 402 | Ohio, Inc. from 2007 Services Ohio, Inc. from 2004 to | |||
| Columbus, OH 43214 | 2007. | |||
| Birthdate: 8/31/1971 | ||||
| George L. Stevens | Chief Compliance Officer, | Vice President, Beacon Hill Fund Services, Inc. 2008 to | ||
| 4041 N. High Street | Indefinite, since 1/1/09 | present: Vice President, Citi Fund Services Ohio, Inc. | ||
| Suite 402 | from 2004 to 2007. | |||
| Columbus, OH 43214 | ||||
| Birthdate: 2/10/1951 | ||||
| Jay S. Fitton | Secretary, Indefinite, since 5/22/06 | Assistant Vice President and Senior Counsel of | ||
| 303 Broadway, Suite 900 | JPMorgan Chase Bank, N.A (2000 - Present) | |||
| Cincinnati, OH 45202 | ||||
| Birth Date: 1/31/70 | ||||
124
This Page intentionally left blank
This Page intentionally left blank
This Page intentionally left blank
JPMorgan Chase Bank N.A.
303 Broadway, Suite 900
Cincinnati, OH 45202
2090918
Item 2. Code of Ethics.
As of the end of the period covered by this report, the registrant has adopted a code of ethics that applies to its principal executive officer and principal financial officer. During the period covered by this report, no amendments were made to the provisions of the code of ethics, nor did the registrant grant any waivers, including any implicit waivers, from the provisions of the code of ethics.
Item 3. Audit Committee Financial Expert.
The registrant’s Board of Trustees has determined that the registrant has at least one audit committee financial expert serving on its audit committee. Mr. R. Clair Sauder is the registrant’s “audit committee financial expert” and is “independent”, as each term is defined in Item 3 of Form N-CSR.
Item 4. Principal Accountant Fees and Services.
(a) Audit Fees. Audit fees totaled $99,460 for the December 31, 2009 fiscal year and $99,460 for the December 31, 2008 fiscal year, including fees associated with the annual audit and filings of the registrant’s Form N-SAR.
(b) Audit-Related Fees. There were no audit-related fees for the December 31, 2009 or December 31, 2008 fiscal years.
(c) Tax Fees. Tax fees totaled $18,000 for the December 31, 2009 fiscal year and $18,000 for the December 31, 2008 fiscal year and consisted of fees for tax compliance services during both years.
(d) All Other Fees. There were no other fees for the December 31, 2009 or December 31, 2008 fiscal years.
(e) (1) Audit Committee Pre-Approval Policies.
(A) Audit Services
Before an auditor is engaged by the funds to render audit services, the committee shall review and approve the engagement. (see also "delegation" below.)
(B) Permissible Non-Audit Services
The committee shall review and approve in advance any proposal (except as set forth in (1) through (3) below) that the funds employ their auditor to render "permissible non-audit services" to the funds. (a "permissible non-audit service" is defined as a non-audit service that is not prohibited by rule 2-01(c)(4) of regulation s-x or other applicable law or regulation.) The committee shall also review and approve in advance any proposal (except as set forth in (1) through (3) below) that the adviser, and any entity controlling, controlled by, or under common control with the adviser that provides ongoing services to the funds (an "adviser-affiliated service provider"), employ the funds' auditor to render non-audit services, if such engagement would relate directly to the operations and financial reporting of the funds. As a part of its review, the committee shall consider whether the provision of such services is consistent with the auditor's independence. (see also "delegation" below.) pre-approval by the committee of non-audit services is not required so Long as:
(1) (a) with respect to the funds, the aggregate amount of all such permissible non-audit services provided to the funds constitutes no more than 5% of the total amount of revenues paid to the auditor by the funds during the fiscal year in which the services are provided; (b) with respect to the adviser and any adviser-affiliated service provider, the aggregate amount of all such non-audit services provided constitutes no more than 5% of the total amount of revenues (of the type that would have to be pre-approved by the committee) paid to the auditor by the funds, the adviser and any adviser-affiliated service provider during the fiscal year in which the services are provided;
(2) such services were not recognized by the funds at the time of the engagement to be non-audit services; and
(3) such services are promptly brought to the attention of the committee and approved prior to the completion of the audit by the committee or its delegate(s) (as defined below).
(C) Delegation
The committee may delegate to one or more of its members ("delegates") authority to pre-approve the auditor's provision of audit services or permissible non-audit services to the funds, or the provision of non- audit services to the adviser or any adviser-affiliated service provider. Any pre-approval determination made by a delegate shall be presented to the full committee at its next meeting. The committee shall communicate any pre-approval made by it or a delegate to the fund administrator/fund accounting agent, who will ensure that the appropriate disclosure is made in the funds' periodic reports and other documents as required under the federal securities laws.
(e)(2) None of the services described in paragraphs (b) through (d) of Item 4 were not pre-approved by the Audit Committee.
(f) Not applicable
(g) The aggregate non-audit fees for services to the registrant, its investment adviser and any entity controlling, controlled by, or under common control with the adviser that provides ongoing services to the registrant were $18,000 for both fiscal year ended December 31, 2009 and December 31, 2008.
(h) Not applicable
Item 5. Audit Committee of Listed Registrants.
Not applicable
Item 6. Schedule of Investments.
| (a) | The Schedule of Investments in securities of unaffiliated issuers is included in the report to shareholders filed under Item 1 of this Form. |
| (b) | Not applicable |
| Item 7. | Disclosure of Proxy Voting Policies and Procedures for Closed-End Management Investment Companies. |
Not applicable.
| Item 8. | Portfolio Managers of Closed-End Management Investment Companies. |
Not applicable.
| Item 9. | Purchases of Equity Securities by Closed-End Management Investment Company and Affiliated Purchasers. |
Not applicable.
| Item 10. | Submission of Matters to a Vote of Security Holders. |
Not applicable
| Item 11. | Controls and Procedures. |
(a) Based on an evaluation of the registrant’s disclosure controls and procedures (as defined in Rule 30a-3(c) under the Investment Company Act of 1940), as of a date within 90 days of the filing date of this report, the registrant’s principal executive officer and principal financial officer have concluded that the registrant’s disclosure controls and procedures are effective.
(b) There were no changes in the registrant’s internal control over financial reporting (as defined in Rule 30a-3(d) under the Investment Company Act of 1940) that occurred during the registrant’s last fiscal half-year that have materially affected, or are reasonably likely to materially affect, the registrant’s internal control over financial reporting.
| Item 12. | Exhibits. |
| (a)(1) | Code of Ethics for Senior Financial Officers is filed herewith. |
| (a)(2) | Certifications required by Item 12(a) of Form N-CSR are filed herewith. |
| (a)(3) | Not applicable. |
| (b) | Certification required by Item 12(b) of Form N-CSR is furnished herewith. |
SIGNATURES
Pursuant to the requirements of the Securities Exchange Act of 1934 and the Investment Company Act of 1940, the registrant has duly caused this report to be signed on its behalf by the undersigned, thereunto duly authorized.
(Registrant) MMA Praxis Mutual Funds
By (Signature and Title)
| /s/ David Gautsche | ||||
David Gautsche President |
Date: March 9, 2010
Pursuant to the requirements of the Securities Exchange Act of 1934 and the Investment Company Act of 1940, this report has been signed below by the following persons on behalf of the registrant and in the capacities and on the dates indicated.
By (Signature and Title)
| /s/ Trent Statczar | ||||
Trent Statczar Treasurer |
Date: March 8, 2010
By (Signature and Title)
| /s/ Trent Statczar | ||||
Trent Statczar Treasurer |
Date: March 8, 2010