FORM 6-K
SECURITIES AND EXCHANGE COMMISSION
Washington, D.C. 20549
Report of Foreign Issuer
Pursuant to Rule 13a-16 or 15d-16
of the Securities Exchange Act of 1934
For the month of March 2022
Commission File Number: 001-12568
BBVA Argentina Bank S.A.
(Translation of registrant’s name into English)
111 Córdoba Av, C1054AAA
Buenos Aires, Argentina
(Address of principal executive offices)
Indicate by check mark whether the registrant files or will file annual reports under cover of Form 20-F or Form 40-F:
| Form 20-F | X | Form 40-F |
Indicate by check mark if the registrant is submitting the Form 6-K in paper as permitted by Regulation S-T Rule 101(b)(1):
| Yes | No | X |
Indicate by check mark if the registrant is submitting the Form 6-K in paper as permitted by Regulation S-T Rule 101(b)(7):
| Yes | No | X |
Indicate by check mark whether by furnishing the information contained in this Form, the Registrant is also thereby furnishing the information to the Commission pursuant to Rule 12g3-2(b) under the Securities Exchange Act of 1934:
| Yes | No | X |
If “Yes” is marked, indicate below the file number assigned to the registrant in connection with Rule 12g3-2(b): N/A
Banco BBVA Argentina S.A.
TABLE OF CONTENTS
Item | |
| 1. | Banco BBVA Argentina S.A. reports consolidated fourth quarter earnings for fiscal year 2021. |

 |
Banco BBVA Argentina S.A. announces Fourth Quarter and Fiscal Year 2021 results
Buenos Aires, March 3, 2022 – Banco BBVA Argentina S.A (NYSE; BYMA; MAE: BBAR; LATIBEX: XBBAR) (“BBVA Argentina” or “BBVA” or “the Bank”) announced today its consolidated results for the fourth quarter (4Q21), ended on December 31, 2021.
As of January 1, 2020, the Bank started to inform its inflation adjusted results pursuant to IAS 29 reporting. To facilitate comparison, figures of comparable quarters of 2020 and 2021 have been updated according to IAS 29 reporting to reflect the accumulated effect of inflation adjustment for each period up to December 31, 2021.
4Q21 and 2021 Highlights
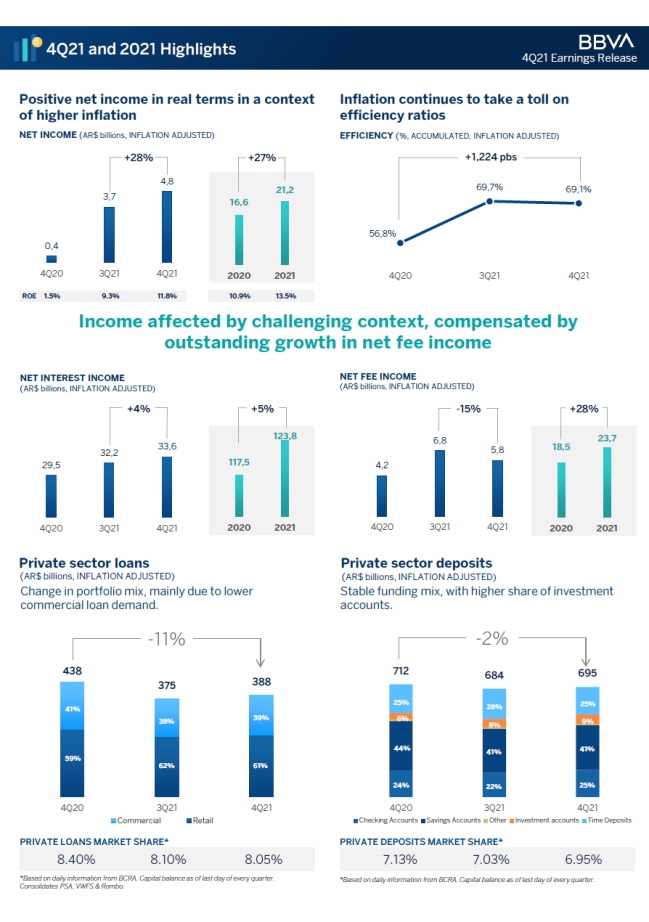
| · | BBVA Argentina’s inflation adjusted net income in 4Q21 was $4.8 billion, 27.8% greater than the $3.7 billion reported on the third quarter of 2021 (3Q21), and 1,008.8% greater than the $430 million reported on the fourth quarter of 2020 (4Q20). BBVA Argentina’s inflation adjusted net income in 2021 totaled $21.2 billion, 27.1% higher than the $16.6 billion reported in 2020. |
| · | In 4Q21, BBVA Argentina posted an inflation adjusted average return on assets (ROAA) of 1.8% and an inflation adjusted average return on equity (ROAE) of 11.8%. In 2021, BBVA Argentina posted an inflation adjusted ROAA of 2.0% and an inflation adjusted ROAE of 13.5%. |
| · | In terms of activity, total consolidated financing to the private sector in 4Q21 totaled $388.4 billion, increasing 3.7% in real terms compared to 3Q21, and contracting 11.4% compared to 4Q20. In the quarter, the increase was mainly driven by growth in other loans and discounted instruments by 17.2%%, and 11.4% respectively. BBVA’s consolidated market share of private sector loans reached 8.05% as of 4Q21. |
| · | Total consolidated deposits in 4Q21 totaled $708.3 billion, increasing 1.9% in real terms during the quarter, and falling 1.9% in the year. Quarterly increase was mainly explained by sight deposits, which grew 5.6%. The Bank’s consolidated market share of private deposits reached 6.95% as of 4Q21. |
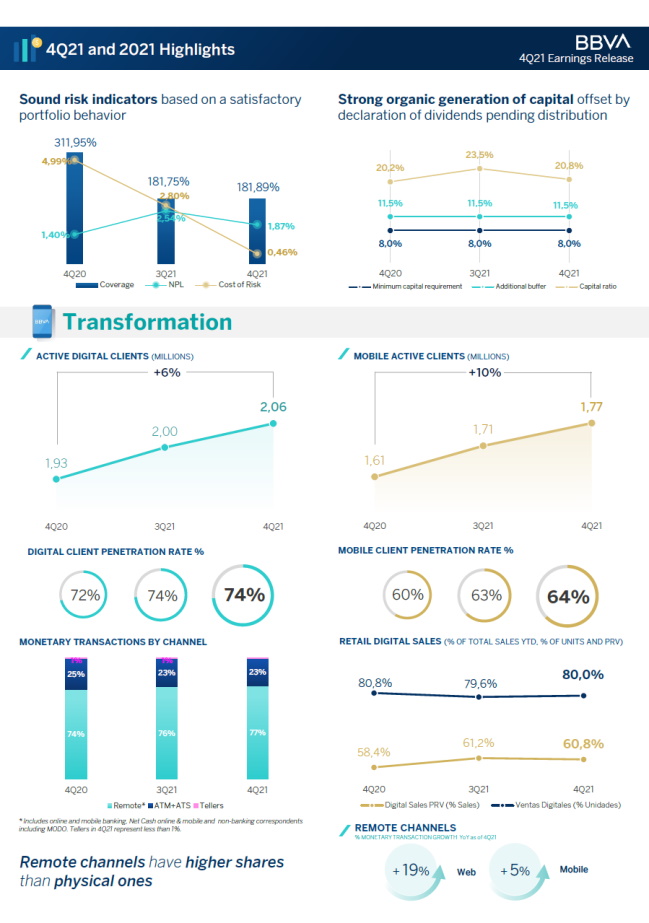
| · | As of 4Q21, the non-performing loan ratio (NPL) reached 1.87%, with a 181.89% coverage ratio. |
| · | The accumulated efficiency ratio in 4Q21 was 69.1%, below 3Q21’s 69.7%, and above 4Q20’s 56.8%. |
| · | As of 4Q21, BBVA Argentina reached a regulatory capital ratio of 20.8%, entailing an $88.5 billion or 154.5% excess over minimum regulatory requirement. Tier I ratio was 20.3%. |
| · | Total liquid assets represented 76.4% of the Bank’s total deposits as of 4Q21. |
| |
Message from the CFO
“The pandemic situation improved during the second half of 2021, which enabled a recovery of the economic activity. This situation has had a positive impact on the financial system as a whole, which holds strong to cope with the challenges that still persist in the short-term.
During 2021, the Central Bank gradually eased the prudential measures adopted at the beginning of the pandemic, in accordance with the evolution of the public health situation and the possibility of recovery of the different economic sectors. BBVA Research, as of the date of this report, estimates that after a 9.9% contraction in 2020, GDP growth in Argentina could be around 10.0% in 2021, and forecasts a moderation in growth of up to 3.5% for 2022. The financial system continues to operate in a persistently high inflation context. Inflation rate reached 50.9% in 2021, versus 36.1% in 2020 and 53.8% in 2019. In the current scenario, a decline is not expected for 2022, as negotiations with the International Monetary Fund are still ongoing and it is expected that they enable a more favorable macroeconomic situation for that matter.
Regarding BBVA Argentina, operating income in 2021 are a consequence of an improvement in interest and fee income, and to lower loan loss allowances, denoting a satisfactory behavior of loan portfolios. As of the fourth quarter of 2021, another factor worth noting are lower administrative expenses.
As of December 2021, BBVA Argentina reached an NPL for private loans of 1.87%, quite below the system which was at 4.3% according to the last information available (November 2021). Concerning liquidity and solvency indicators, the Bank ends the quarter with 76.4% and 20.8% respectively, levels which undoubtedly allow to address business growth in the case of an economic recovery.
Since 2020, the Bank’s Shareholders’ meetings have announced dividends for a total of $28 billion, which remain pending distribution, given the Central Bank stated a suspension in the distribution of results of financial institutions until December 31, 2021. Now that the suspension has been lifted through Communication “A” 7421, the Bank will proceed to work on the authorization request to the regulator once its 2021 results are approved by the Shareholders’ meeting.
With respect to digitalization, our service offering has evolved in such way that by the end of December 2021, digital client penetration reached 74% from 72% a year back, while that of mobile clients reached 64% from 60% in the same period. The response on the side of customers has been satisfactory, and we are convinced this is the path to pursue, in the aim of sustaining and expanding our competitive position in the financial system.
BBVA Argentina has a corporate responsibility with society, inherent to the Bank’s business model, which bolsters inclusion, financial education and supports scientific research and culture. The Bank works with the highest integrity, long-term vision and best practices, and is present through the BBVA Group in the main sustainability indexes.
Lastly, the Bank actively monitors its business, financial conditions and operating results, in the aim of keeping a competitive position to face contextual challenges.”
Ernesto R. Gallardo, CFO at BBVA Argentina
4Q21 Conference Call
Friday, March 4 - 12:00 p.m. Buenos Aires time (10:00 a.m. EST)
To participate, please dial-in:
+ 54-11-3984-5677 (Argentina)
+ 1-844-450-3851 (United States)
+ 1-412-317-6373 (International)
Web Phone: click here
Conference ID: BBVA
Webcast & Replay: click here
| |
Safe Harbor Statement
This press release contains certain forward-looking statements that reflect the current views and/or expectations of Banco BBVA Argentina and its management with respect to its performance, business and future events. We use words such as “believe,” “anticipate,” “plan,” “expect,” “intend,” “target,” “estimate,” “project,” “predict,” “forecast,” “guideline,” “seek,” “future,” “should” and other similar expressions to identify forward-looking statements, but they are not the only way we identify such statements. Such statements are subject to a number of risks, uncertainties and assumptions. We caution you that a number of important factors could cause actual results to differ materially from the plans, objectives, expectations, estimates and intentions expressed in this release. Actual results, performance or events may differ materially from those in such statements due to, without limitation, (i) changes in general economic, financial, business, political, legal, social or other conditions in Argentina or elsewhere in Latin America or changes in either developed or emerging markets, (ii) changes in regional, national and international business and economic conditions, including inflation, (iii) changes in interest rates and the cost of deposits, which may, among other things, affect margins, (iv) unanticipated increases in financing or other costs or the inability to obtain additional debt or equity financing on attractive terms, which may limit our ability to fund existing operations and to finance new activities, (v) changes in government regulation, including tax and banking regulations, (vi) changes in the policies of Argentine authorities, (vii) adverse legal or regulatory disputes or proceedings, (viii) competition in banking and financial services, (ix) changes in the financial condition, creditworthiness or solvency of the customers, debtors or counterparties of Banco BBVA Argentina, (x) increase in the allowances for loan losses, (xi) technological changes or an inability to implement new technologies, (xii) changes in consumer spending and saving habits, (xiii) the ability to implement our business strategy and (xiv) fluctuations in the exchange rate of the Peso. The matters discussed herein may also be affected by risks and uncertainties described from time to time in Banco BBVA Argentina’s filings with the U.S. Securities and Exchange Commission (SEC) and Comisión Nacional de Valores (CNV). Readers are cautioned not to place undue reliance on forward-looking statements, which speak only as the date of this document. Banco BBVA Argentina is under no obligation and expressly disclaims any intention or obligation to update or revise any forward-looking statements, whether as a result of new information, future events or otherwise.
Information
This earnings release has been prepared in accordance with the accounting framework established by the Central Bank of Argentina (“BCRA”), based on International Financial Reporting Standards (“I.F.R.S.”) and the resolutions adopted by the International Accounting Standards Board (“I.A.S.B”) and by the Federación Argentina de Consejos Profesionales de Ciencias Económicas (“F.A.C.P.E.”), with the exceptions: (i) the adjustment in valuation established by the B.C.R.A. applied to the valuation of the remaining investment the Bank keeps of Prisma Medios de Pago S.A. (“Prisma”), and (ii) the exclusion of the application of the IFRS 9 impairment model for non-financial public sector debt instruments.
As of 1Q20, the Bank started to inform its inflation adjusted results pursuant to IAS 29 reporting. To facilitate comparison, figures of comparable quarters of 2020 and 2021 have been updated according to IAS 29 reporting to reflect the accumulated effect of inflation adjustment for each period up to December 21, 2021.
The information in this press release contains unaudited financial information that consolidates, line item by line item, all of the banking activities of BBVA Argentina, including: BBVA Asset Management Argentina S.A., Consolidar AFJP-undergoing liquidation proceeding, PSA Finance Argentina Compañía Financiera S.A. (“PSA”) and Volkswagen Financial Services Compañía Financiera S.A (“VWFS”).
BBVA Consolidar Seguros S.A. is disclosed on a consolidated basis recorded as Investments in associates (reported under the proportional consolidation method), and the corresponding results are reported as “Income from associates”), same as Rombo Compañía Financiera S.A. (“Rombo”), Play Digital S.A., Openpay Argentina S.A. and Interbanking S.A.
Financial statements of subsidiaries have been elaborated as of the same dates and periods as Banco BBVA Argentina S.A.’s. In the case of consolidated companies PSA and VWFS, financial statements were prepared considering the B.C.R.A. accounting framework for institutions belonging to “Group C”, without considering the model established by the IFRS 9 5.5. “Impairment” section for periods starting as of January 1, 2022. It is worth mentioning that the regulator extended the implementation of such section up to January 1, 2023, in a discretionary manner for Group “C” institutions. Companies consolidating with the Bank did not make use of this option.
The information published by the BBVA Group for Argentina is prepared according to IFRS, without considering the temporary exceptions established by BCRA.
| |
Income Statement – 12 month accumulated
| Income Statement - 12 month accumulated | BBVA ARG Consolidated | ||
| In millions of AR$ - Inflation adjusted | 2021 | 2020 | Var % |
| Interest income | 214,903 | 179,553 | 19.7% |
| Interest expense | (91,060) | (62,035) | (46.8%) |
| Net interest income | 123,843 | 117,518 | 5.4% |
| Fee income | 44,705 | 43,240 | 3.4% |
| Fee expenses | (21,037) | (24,765) | 15.1% |
| Net fee income | 23,668 | 18,475 | 28.1% |
| Net income from financial instruments at fair value through P&L | 4,365 | 11,949 | (63.5%) |
| Net loss from write-down of assets at amortized cost and fair value through OCI | (123) | (3,487) | 96.5% |
| Foreign exchange and gold gains | 5,540 | 9,400 | (41.1%) |
| Other operating income | 8,091 | 9,475 | (14.6%) |
| Loan loss allowances | (8,267) | (14,987) | 44.8% |
| Net operating income | 157,117 | 148,343 | 5.9% |
| Personnel benefits | (31,312) | (30,670) | (2.1%) |
| Administrative expenses | (32,432) | (28,407) | (14.2%) |
| Depreciation and amortization | (5,582) | (6,137) | 9.0% |
| Other operating expenses | (26,699) | (24,785) | (7.7%) |
| Operating expenses | (96,025) | (89,999) | (6.7%) |
| Operating income | 61,092 | 58,344 | 4.7% |
| Income from associates and joint ventures | (42) | 412 | (110.2%) |
| Income from net monetary position | (39,967) | (29,730) | (34.4%) |
| Income before income tax | 21,083 | 29,026 | (27.4%) |
| Income tax | 80 | (12,377) | 100.6% |
| Income for the period | 21,163 | 16,649 | 27.1% |
| Owners of the parent | 21,183 | 16,668 | 27.1% |
| Non-controlling interests | (20) | (19) | (5.3%) |
| Other comprehensive Income (OCI) (1) | 578 | 7,539 | (92.3%) |
| Total comprehensive income | 21,741 | 24,188 | (10.1%) |
BBVA Argentina 2021 net income was $21.2 billion, 27.1% higher than the $16.6 billion reported in 2020. This implied an accumulated annualized ROAE of 13.5% and a ROAA of 2.0% in 2021, compared to an accumulated annualized ROAE of 10.9% and a ROAA of 1.7% in 2020.
The increment in the Bank’s operating income is mainly explained by (i) an increase in interest and fee income, the latter mostly enhanced by the implementation of a new reward program within credit card benefits, which meant savings in fee expenses, (ii) lower net loss from write-down of assets at amortized cost and fair value through Other Comprehensive Income (OCI), and (iii) lower loan loss allowances, mainly due to a good evolution in the behavior of loan portfolios, especially on the commercial side.
It should be noted that 2020 results were affected by the partial collection of payments and voluntary swap of the National Treasury U.S. dollar linked notes (LELINK), which had been restructured on August 28, 2019, and that generated a loss in the line Net loss from write-down of assets at amortized cost and fair value through OCI.
Another factor to be highlighted is the income tax line, which showed a positive accumulated result of $80.0 million in 2021 compared to a $12.4 billion charge in 2020, explained by (i) the reversal in the second quarter of 2021 (2Q21), of the provision connected to the repayment of income tax inflation adjustments for 2017 and 2018 fiscal years, for a total of $4.3 billion (in nominal terms), recorded during the first quarter of 2018 and the second quarter of 2019 respectively; and (ii) the reversal in the first quarter of 2021 (1Q21), of a $1.2 billion provision (in nominal terms), recorded during the second quarter of 2017 corresponding to 2016 fiscal year, which was funded on a favorable final sentence in court.
| |
The accumulated net income for 2021 net of the effect of actions of declaratory judgment on the tax line would have been $15.7 billion, decreasing 5.6% versus the accumulated net income for 2020. This would have meant an accumulated ROAE of 10.2% and an accumulated ROAA of 1.5%.
Additional to these factors, net income was affected by the income from the net monetary position in a context of higher inflation.
Quarterly Results
| Income Statement | BBVA ARG Consolidated | Chg (%) | |||
| In millions of AR$ - Inflation adjusted | 4Q21 | 3Q21 | 4Q20 | QoQ | YoY |
| Net Interest Income | 33,582 | 32,191 | 29,475 | 4.3% | 13.9% |
| Net Fee Income | 5,828 | 6,819 | 4,227 | (14.5%) | 37.9% |
| Net income from measurement of financial instruments at fair value through P&L | (226) | 943 | 6,270 | (124.0%) | (103.6%) |
| Net income from write-down of assets at amortized cost and at fair value through OCI | (18) | (41) | (221) | 56.1% | 91.9% |
| Foreign exchange and gold gains | 1,630 | 1,291 | 1,620 | 26.3% | 0.6% |
| Other operating income | 2,098 | 1,745 | 2,909 | 20.2% | (27.9%) |
| Loan loss allowances | (444) | (2,706) | (5,549) | 83.6% | 92.0% |
| Net operating income | 42,450 | 40,242 | 38,731 | 5.5% | 9.6% |
| Personnel benefits | (7,715) | (8,135) | (7,332) | 5.2% | (5.2%) |
| Adminsitrative expenses | (8,528) | (9,700) | (7,306) | 12.1% | (16.7%) |
| Depreciation and amortization | (1,404) | (1,317) | (1,637) | (6.6%) | 14.2% |
| Other operating expenses | (7,326) | (6,463) | (9,184) | (13.4%) | 20.2% |
| Operarting expenses | (24,973) | (25,615) | (25,459) | 2.5% | 1.9% |
| Operating income | 17,477 | 14,627 | 13,272 | 19.5% | 31.7% |
| Income from associates | (115) | (98) | 36 | (17.3%) | (419.4%) |
| Income from net monetary position | (10,227) | (9,131) | (10,314) | (12.0%) | 0.8% |
| Net income before income tax | 7,135 | 5,398 | 2,994 | 32.2% | 138.3% |
| Income tax | (2,367) | (1,666) | (2,564) | (42.1%) | 7.7% |
| Net income for the period | 4,768 | 3,732 | 430 | 27.8% | n.m |
| Owners of the parent | 4,743 | 3,725 | 587 | 27.3% | n.m |
| Non-controlling interests | 25 | 8 | (157) | 212.5% | 115.9% |
| Other comprehensive Income (OCI) (1) | 1,039 | (244) | (402) | n.m | 358.2% |
| Total comprehensive income | 5,807 | 3,489 | 28 | 66.4% | n.m |
| (1) Net of Income Tax. | |||||
BBVA Argentina 4Q21 net income was $4.8 billion, increasing 27.8% or $1.0 billion quarter-over-quarter (QoQ) and 1,008.8% or $4.3 billion year-over-year (YoY). This implied a quarterly ROAE of 11.8% and a quarterly ROAA of 1.8%.
Quarterly results are mainly explained by (i) lower loan loss allowances, especially due to a satisfactory behavior of the loan portfolio, (ii) a greater fall in interest expenses, and (iii) lower administrative expenses. The increase in results is offset by (i) lower net fee income due to higher activity, (ii) higher expenses in the other operating expenses line item due to the recording of a new provision for reorganization charges, and (iii) a higher loss from the net monetary position.
| |
| Earnings per share | BBVA ARG Consolidated | Chg (%) | |||
| 4Q21 | 3Q21 | 4Q20 | QoQ | YoY | |
| Financial Statement information | |||||
| Net income for the period attributable to owners of the parent (in AR$ millions, inflation adjusted) | 4,743 | 3,725 | 587 | 27.3% | n.m |
| Total shares outstanding (1) | 612,710 | 612,710 | 612,710 | - | - |
| Market information | |||||
| Closing price of ordinary share at BYMA (in AR$) | 224.30 | 247.95 | 155.64 | (9.5%) | 44.1% |
| Closing price of ADS at NYSE (in USD) | 3.22 | 3.89 | 3.27 | (17.2%) | (1.5%) |
| Book value per share (in AR$) | 265.40 | 266.94 | 255.60 | (0.6%) | 3.8% |
| Price-to-book ratio (BYMA price) (%) | 0.85 | 0.93 | 0.61 | -9.0% | 38.8% |
| Earnings per share (in AR$) | 7.74 | 6.08 | 0.96 | 27.3% | n.m |
| Earnings per ADS(2) (in AR$) | 23.22 | 18.24 | 2.87 | 27.3% | n.m |
| (1) In thousands of shares. | |||||
| (2) Each ADS accounts for 3 ordinary shares | |||||
Net Interest Income
| Net interest income | BBVA ARG Consolidated | Chg (%) | |||
| In millions of AR$ - Inflation adjusted | 4Q21 | 3Q21 | 4Q20 | QoQ | YoY |
| Net Interest Income | 33,582 | 32,191 | 29,475 | 4.3% | 13.9% |
| Interest Income | 55,904 | 57,353 | 48,336 | (2.5%) | 15.7% |
| From government securities | 13,255 | 13,878 | 13,867 | (4.5%) | (4.4%) |
| From private securities | 60 | 33 | 29 | 81.8% | 106.9% |
| Interest from loans and other financing | 23,205 | 22,210 | 23,551 | 4.5% | (1.5%) |
| Financial Sector | 428 | 277 | 305 | 54.5% | 40.3% |
| Overdrafts | 2,168 | 2,043 | 2,761 | 6.1% | (21.5%) |
| Discounted Instruments | 4,086 | 3,480 | 3,802 | 17.4% | 7.5% |
| Mortgage loans | 397 | 449 | 445 | (11.6%) | (10.8%) |
| Pledge loans | 1,395 | 1,424 | 1,285 | (2.0%) | 8.6% |
| Consumer Loans | 3,746 | 3,763 | 3,523 | (0.5%) | 6.3% |
| Credit Cards | 6,509 | 6,392 | 6,087 | 1.8% | 6.9% |
| Financial leases | 235 | 253 | 228 | (7.1%) | 3.1% |
| Loans for the prefinancing and financing of exports | 187 | 237 | 387 | (21.1%) | (51.7%) |
| Other loans | 4,054 | 3,892 | 4,728 | 4.2% | (14.3%) |
| Premiums on reverse REPO transactions | 10,796 | 13,879 | 4,369 | (22.2%) | 147.1% |
| CER/UVA clause adjustment | 7,698 | 7,353 | 6,425 | 4.7% | 19.8% |
| Other interest income | 890 | - | 95 | N/A | n.m |
| Interest expenses | 22,322 | 25,162 | 18,861 | (11.3%) | 18.4% |
| Deposits | 20,179 | 23,068 | 17,285 | (12.5%) | 16.7% |
| Checking accounts | 2,947 | 4,952 | 2,293 | (40.5%) | 28.5% |
| Savings accounts | 127 | 123 | 108 | 3.3% | 17.6% |
| Time deposits and Investment accounts | 17,105 | 17,993 | 14,884 | (4.9%) | 14.9% |
| Other liabilities from financial transactions | 134 | 185 | 492 | (27.6%) | (72.8%) |
| Interfinancial loans received | 897 | 496 | 590 | 80.8% | 52.0% |
| Premiums on REPO transactions | 1 | 2 | - | (50.0%) | N/A |
| CER/UVA clause adjustment | 1,111 | 1,410 | 396 | (21.2%) | 180.6% |
| Other | - | 1 | 98 | (100.0%) | (100.0%) |
Net interest income for 4Q21 was $33.6 billion, increasing 4.3% or $1.4 billion QoQ, and 13.9% or $4.1 billion YoY. In 4Q21, interest expenses decreased more than interest income, mainly due to (i) higher income from interest from loans and other financing, (ii) increases in income from CER/UVA clause adjustments, and (iii) an improvement in the funding mix.
In 4Q21, interest income totaled $55.9 billion, falling 2.5% compared to 3Q21 and increasing 15.7% compared to 4Q20. Quarterly decrease is mainly driven by lower income from premiums on reverse REPO transactions, especially due to a lower position in these instruments as a result of higher activity. This fall was partially offset by a 4.7% increase in CER/UVA clause adjustments (mostly on income from government securities linked to such indexes), and a 4.5% increase in interest from loans and other financing (primarily affected by an increment in interests from discounted instruments).
Income from government securities fell 4.5% compared to 3Q21, and 4.4% compared to 4Q20. This is partially due to the fact that the effective rate of interests gained through BCRA liquidity bills (LELIQ) could not compensate the quarterly inflation rate of 10.2%1. 92% of these results are explained by government securities at fair value through OCI, of which 70% are LELIQ, and 7% are securities at amortized cost (2022 National Treasury Bonds at fixed rate, used for reserve requirement integration).
| |
Interest income from loans and other financing totaled $23.2 billion, increasing 4.5% QoQ and falling 1.5% YoY. Quarterly growth is mainly due to an increase in discounted instruments by 17.4%. This was partially offset by a fall in interests from mortgage and pledge loans by 11.6% and 2.0% respectively.
Income from CER/UVA adjustments increased 4.7% QoQ and 19.8% YoY. Quarterly growth was driven by a higher yield of CER-linked securities. 63% of income from interests from CER/UVA clause adjustments is explained by interests generated by bonds linked to such indexes.
Interest expenses totaled $22.3 billion, denoting an 11.3% decrease QoQ and an 18.4% increase YoY. Quarterly decrease is described by lower checking account expenses, partially offset by higher expenses by interfinancial loans received by the Bank’s subsidiaries.
Interests from time deposits and investment accounts explain 76.6% of interest expenses, versus 71.5% the previous quarter. These fell 4.9% QoQ and grew 14.9% YoY.
NIM
As of 4Q21, net interest margin (NIM) was 19.2%, higher than the 17.8% recorded on 3Q21. In 2021, NIM was 18.2%. In 4Q21, NIM in pesos was 20.1% and 2.0% in U.S. dollars.
| Assets & Liabilities Performance - Total | BBVA ARG Consolidated | ||||||||||||
| In millions of AR$. Rates and spreads in annualized % | 4Q21 | 3Q21 | 4Q20 | 2021 | |||||||||
| Average Balance | Interest Earned/Paid | Average Real Rate | Average Balance | Interest Earned/Paid | Average Real Rate | Average Balance | Interest Earned/Paid | Average Real Rate | Average Balance | Interest Earned/Paid | Average Real Rate | ||
| Total interest-earning assets | 694,381 | 55,904 | 31.9% | 719,280 | 57,353 | 31.6% | 641,777 | 48,336 | 29.9% | 680,453 | 214,904 | 31.6% | |
| Debt securities | 315,224 | 28,888 | 36.4% | 351,007 | 32,158 | 36.3% | 168,161 | 20,981 | 49.5% | 297,862 | 109,389 | 36.7% | |
| Loans to customers/financial institutions | 367,274 | 26,940 | 29.1% | 356,824 | 25,143 | 28.0% | 403,236 | 27,349 | 26.9% | 371,734 | 105,373 | 28.3% | |
| Other assets | 11,882 | 76 | 2.5% | 11,450 | 52 | 1.8% | 70,380 | 6 | 0.0% | 10,857 | 142 | 1.3% | |
| Total non interest-earning assets | 280,344 | - | 288,118 | - | 297,158 | - | 297,673 | - | |||||
| Total Assets | 974,725 | 55,904 | 22.8% | 1,007,398 | 57,353 | 22.6% | 938,935 | 48,336 | 20.4% | 978,126 | 214,904 | 22.0% | |
| Total interest-bearing liabilities | 489,467 | 22,322 | 18.1% | 539,314 | 25,162 | 18.5% | 441,222 | 18,861 | 17.0% | 510,697 | 91,059 | 17.8% | |
| Sight deposits | 253,008 | 3,074 | 4.8% | 290,100 | 5,077 | 6.9% | 218,554 | 2,401 | 4.4% | 270,181 | 14,324 | 5.3% | |
| Time deposits and investment accounts | 225,630 | 18,913 | 33.3% | 239,871 | 19,931 | 33.0% | 204,789 | 15,577 | 30.2% | 228,569 | 76,753 | 33.6% | |
| Debt securities issued | 310 | 50 | 64.0% | 692 | 93 | 53.1% | 3,925 | 407 | 41.1% | 946 | 422 | 44.6% | |
| Other liabilities | 10,519 | 285 | 10.7% | 8,652 | 62 | 2.8% | 13,954 | 475 | 13.5% | 11,001 | (440) | (4.0%) | |
| Total non-interest-bearing liabilities | 485,258 | - | 468,084 | - | 497,714 | - | 467,428 | - | |||||
| Total liabilities and equity | 974,725 | 22,322 | 9.1% | 1,007,398 | 25,162 | 9.9% | 938,935 | 18,861 | 8.0% | 978,125 | 91,059 | 9.3% | |
| NIM - Total | 19.2% | 17.8% | 18.2% | 18.2% | |||||||||
| Spread - Total | 13.8% | 13.1% | 12.9% | 13.8% | |||||||||
| Nominal rates are calculated over a 365-day year | |||||||||||||
| Does not include Net income from measurement of financial instruments at fair value through P&L nor Net income from write-down of assets at amortized cost and at fair value through OCI | |||||||||||||
Sight deposits include savings accounts and interest-bearing checking accounts. Non interest-bearing accounts are included in non-interest-bearing liabilities.
| |||||||||||||
| Assets & Liabilities Performance - AR$ | BBVA ARG Consolidated | ||||||||||||
| In millions of AR$. Rates and spreads in annualized % | 4Q21 | 3Q21 | 4Q20 | 2021 | |||||||||
| Average Balance | Interest Earned/Paid | Average Real Rate | Average Balance | Interest Earned/Paid | Average Real Rate | Average Balance | Interest Earned/Paid | Average Real Rate | Average Balance | Interest Earned/Paid | Average Real Rate | ||
| Total interest-earning assets | 659,317 | 55,668 | 33.5% | 671,383 | 56,968 | 33.7% | 590,810 | 47,661 | 32.0% | 633,454 | 213,221 | 33.7% | |
| Debt securities | 314,664 | 28,888 | 36.4% | 351,005 | 32,158 | 36.3% | 168,161 | 20,981 | 49.5% | 297,724 | 109,389 | 36.7% | |
| Loans to customers/financial institutions | 339,185 | 26,706 | 31.2% | 315,046 | 24,759 | 31.2% | 359,643 | 26,675 | 29.4% | 331,604 | 103,695 | 31.3% | |
| Loans to the BCRA | 1 | - | - | - | - | - | - | - | - | - | |||
| Other assets | 5,467 | 74 | 5.4% | 5,331 | 51 | 3.8% | 63,006 | 5 | 0.0% | 4,126 | 137 | 3.3% | |
| Total non interest-earning assets | 129,353 | - | 130,092 | - | 155,069 | - | - | 139,602 | - | - | |||
| Total Assets | 788,670 | 55,668 | 28.0% | 801,475 | 56,968 | 28.2% | 745,879 | 47,661 | 25.4% | 773,056 | 213,221 | 27.6% | |
| Total interest-bearing liabilities | 362,272 | 22,265 | 24.4% | 395,681 | 25,096 | 25.2% | 309,323 | 18,817 | 24.1% | 367,477 | 90,784 | 24.7% | |
| Savings accounts | 145,415 | 3,072 | 8.4% | 169,873 | 5,075 | 11.9% | 109,988 | 2,399 | 8.7% | 150,520 | 14,315 | 9.5% | |
| Time deposits | 208,710 | 18,906 | 35.9% | 220,474 | 19,922 | 35.8% | 183,119 | 15,542 | 33.7% | 208,571 | 76,704 | 36.8% | |
| Debt securities issued | 310 | 50 | 64.0% | 692 | 93 | 53.1% | 3,925 | 407 | 41.1% | 946 | 422 | 44.6% | |
| Other liabilities | 7,837 | 237 | 12.0% | 4,643 | 7 | 0.6% | 12,292 | 469 | 15.1% | 7,440 | (657) | (8.8%) | |
| Total non-interest-bearing liabilities | 428,428 | - | 403,529 | - | 438,214 | - | - | 405,848 | - | - | |||
| Total liabilities and equity | 790,700 | 22,265 | 11.2% | 799,210 | 25,096 | 12.5% | 747,537 | 18,817 | 10.0% | 773,325 | 90,784 | 11.7% | |
| NIM - AR$ | 20.1% | 18.8% | 19.4% | 19.3% | |||||||||
| Spread - AR$ | 9.1% | 8.5% | 7.9% | 9.0% | |||||||||
| Nominal rates are calculated over a 365-day year | |||||||||||||
| Does not include Net income from measurement of financial instruments at fair value through P&L nor Net income from write-down of assets at amortized cost and at fair value through OCI | |||||||||||||
| Sight deposits include savings accounts and interest-bearing checking accounts. Non interest-bearing accounts are included in non-interest-bearing liabilities. | |||||||||||||
1 Source: Instituto Nacional de Estadística y Censos (INDEC) – Consumer Price Index change between September and December 2021.
| |
| Assets & Liabilities Performance - Foreign Currency | BBVA ARG Consolidated | ||||||||||||
| In millions of AR$. Rates and spreads in annualized % | 4Q21 | 3Q21 | 4Q20 | 2021 | |||||||||
| Average Balance | Interest Earned/Paid | Average Real Rate | Average Balance | Interest Earned/Paid | Average Real Rate | Average Balance | Interest Earned/Paid | Average Real Rate | Average Balance | Interest Earned/Paid | Average Real Rate | ||
| Total interest-earning assets | 35,064 | 236 | 2.7% | 47,897 | 386 | 3.2% | 50,967 | 675 | 5.3% | 46,999 | 1,683 | 3.6% | |
| Debt securities | 560 | - | - | 1 | - | - | 0 | 0 | 254.5% | 138 | - | - | |
| Loans to customers/financial institutions | 28,089 | 234 | 3.3% | 41,777 | 385 | 3.7% | 43,593 | 673 | 6.1% | 40,130 | 1,678 | 4.2% | |
| Other assets | 6,415 | 2 | 0.1% | 6,119 | 1 | 0.1% | 7,374 | 1 | 0.1% | 6,731 | 5 | 0.1% | |
| Total non interest-earning assets | 150,991 | - | 158,026 | - | 142,089 | - | - | 158,071 | - | - | |||
| Total Assets | 186,055 | 236 | 0.5% | 205,924 | 386 | 0.7% | 193,056 | 675 | 1.4% | 205,070 | 1,683 | 0.8% | |
| Total interest-bearing liabilities | 127,195 | 57 | 0.2% | 143,633 | 66 | 0.2% | 131,899 | 44 | 0.1% | 143,220 | 275 | 0.2% | |
| Savings accounts | 107,593 | 2 | 0.0% | 120,227 | 2 | 0.0% | 108,566 | 2 | 0.0% | 119,661 | 9 | 0.0% | |
| Time deposits and Investment accounts | 16,920 | 7 | 0.2% | 19,397 | 9 | 0.2% | 21,671 | 35 | 0.6% | 19,998 | 49 | 0.2% | |
| Other liabilities | 2,682 | 48 | 7.1% | 4,008 | 55 | 5.5% | 1,662 | 7 | 1.6% | 3,561 | 217 | 6.1% | |
| Total non-interest-bearing liabilities | 56,830 | - | 64,556 | - | 59,500 | - | - | 61,580 | - | - | |||
| Total liabilities and equity | 184,025 | 57 | 0.1% | 208,188 | 66 | 0.1% | 191,398 | 44 | 0.1% | 204,800 | 275 | 0.1% | |
| NIM - Foreign currency | 2.0% | 2.6% | 4.9% | 3.0% | |||||||||
| Spread - Foreign currency | 2.5% | 3.0% | 5.1% | 3.4% | |||||||||
| Nominal rates are calculated over a 365-day year | |||||||||||||
| Does not include Net income from measurement of financial instruments at fair value through P&L nor Net income from write-down of assets at amortized cost and at fair value through OCI | |||||||||||||
| Sight deposits include savings accounts and interest-bearing checking accounts. Non interest-bearing accounts are included in non-interest-bearing liabilities. | |||||||||||||
Net Fee Income
| Net fee income | BBVA ARG Consolidated | Chg (%) | |||
| In millions of AR$ - Inflation adjusted | 4Q21 | 3Q21 | 4Q20 | QoQ | YoY |
| Net Fee Income | 5,828 | 6,819 | 4,227 | (14.5%) | 37.9% |
| Fee Income | 11,570 | 11,389 | 11,367 | 1.6% | 1.8% |
| Linked to liabilities | 4,330 | 4,340 | 4,028 | (0.2%) | 7.5% |
| From credit cards | 5,353 | 5,150 | 5,447 | 3.9% | (1.7%) |
| Linked to loans | 780 | 721 | 593 | 8.2% | 31.5% |
| From insurance | 470 | 482 | 559 | (2.5%) | (15.9%) |
| From foreign trade and foreign currency transactions | 480 | 523 | 577 | (8.2%) | (16.8%) |
| Other fee income | 157 | 173 | 163 | (9.2%) | (3.7%) |
| Fee expenses | 5,742 | 4,570 | 7,140 | 25.6% | (19.6%) |
Net fee income as of 4Q21 totaled $5.8 billion, falling 14.5% or $991 million QoQ and increasing 37.9% or $1.6 billion YoY.
In 4Q21, fee income totaled $11.6 billion, growing 1.6% QoQ and 1.8% YoY. The quarterly growth is mainly explained by an increase in income from credit cards (due to higher activity), and those linked to loans.
Regarding fee expenses, these totaled $5.7 billion, growing 25.6% QoQ and falling 19.6% YoY. Higher expenses in the quarter are partially explained by higher expenditures linked to an increase in marketing actions, higher consumption and a strategy of payroll business acquisition.
Net Income from Measurement of Financial Instruments at Fair Value and Foreign Exchange and Gold Gains/Losses
| Net Income from financial instruments at fair value (FV) through P&L | BBVA ARG Consolidated | Chg (%) | |||
| In millions of AR$ - Inflation adjusted | 4Q21 | 3Q21 | 4Q20 | QoQ | YoY |
| Net Income from financial instruments at FV through P&L | (226) | 943 | 6,270 | (124.0%) | (103.6%) |
| Income from government securities | 472 | 704 | 430 | (33.0%) | 9.8% |
| Income from private securities | (12) | (95) | 1,020 | 87.4% | (101.2%) |
| Interest rate swaps | 5 | 6 | (1) | (16.7%) | n.m |
| Gains from foreign currency forward transactions | 492 | 328 | 4,013 | 50.0% | (87.7%) |
| Income from put option long position - Prisma Medios de Pago | (1,182) | - | 750 | N/A | (257.6%) |
| Income from debt and equity instruments | (1) | - | 42 | N/A | (102.4%) |
| Other | - | - | 16 | N/A | (100.0%) |
In 4Q21, net income from financial instruments at fair value (FV) through P&L was a loss of $226 million, decreasing 124.0% or $1,169 million QoQ and 103.6% or $6,496 million YoY.
These results are mainly explained by the write-off from the balance sheet of the Prisma put option. As of October 1, 2021, the Bank, together with the rest of Prisma’s Class B shareholders, have notified the decision to exercise the put option and initiate the sale procedure of the 49% remaining of its position in Prisma. This generated a loss of $1,182 million in the Income from put option long position – Prisma Medios de Pago line item.
| |
Referred to the previous paragraph, as of the date of this report, there has not been a determination on the sale price of the transaction. Nonetheless, negotiations are being held with Advent International Global Private Equity.
On the other hand, the fall in income from government securities is mostly explained by the effective rate of interests gained through BCRA’s LELIQ, which do not compensate the inflation rate in the quarter.
| Differences in quoted prices of gold and foreign currency | BBVA ARG Consolidated | Chg (%) | |||
| In millions of AR$ - Inflation adjusted | 4Q21 | 3Q21 | 4Q20 | QoQ | YoY |
| Foreign exchange and gold gains/(losses) (1) | 1,630 | 1,291 | 1,620 | 26.3% | 0.6% |
| From foreign exchange position | (149) | (384) | (491) | 61.2% | 69.7% |
| Income from purchase-sale of foreign currency | 1,779 | 1,674 | 2,111 | 6.3% | (15.7%) |
| Net income from financial instruments at FV through P&L (2) | 493 | 328 | 4,013 | 50.3% | (87.7%) |
| Income from foreign currency forward transactions | 493 | 328 | 4,013 | 50.3% | (87.7%) |
| Total differences in quoted prices of gold & foreign currency (1) + (2) | 2,123 | 1,619 | 5,633 | 31.1% | (62.3%) |
In 4Q21, the total differences in quoted prices of gold and foreign currency showed profit for $2.1 billion, increasing 31.1% or $504 million compared to 3Q21, both due to a lower loss in from foreign exchange position line item, and to higher income from purchase-sale of foreign currency and from foreign currency forward transactions.
Other Operating Income
| Other operating income | BBVA ARG Consolidated | Chg (%) | |||
| In millions of AR$ - Inflation adjusted | 4Q21 | 3Q21 | 4Q20 | QoQ | YoY |
| Operating Income | 2,098 | 1,745 | 2,909 | 20.2% | (27.9%) |
| Rental of safe deposit boxes (1) | 388 | 418 | 396 | (7.2%) | (2.0%) |
| Adjustments and interest on miscellaneous receivables (1) | 604 | 506 | 926 | 19.4% | (34.8%) |
| Punitive interest (1) | 51 | 61 | 18 | (16.4%) | 183.3% |
| Loans recovered | 391 | 274 | 421 | 42.7% | (7.1%) |
| Fee income from credit and debit cards (1) | 119 | 88 | 90 | 35.2% | 32.2% |
| Income from initial recognition of public securities | 2 | 1 | - | 100.0% | N/A |
| Other Operating Income(2) | 543 | 397 | 1,058 | 36.8% | (48.7%) |
| (1) Included in the efficiency ratio calculation | |||||
| (2) Includes some of the concepts used in the efficiency ratio calculation | |||||
In 4Q21 other operating income totaled $2.1 billion, growing 20.2% or $353 million QoQ, and falling 27.9% or $811 million YoY. Quarterly growth is partially explained by a 36.8% increase in Other operating income, as a result of the reversal of provisions for $184 million, linked to the reorganization provision recorded on the fourth quarter of 2020. Additionally, the increase was affected by a 42.7% increment in the loans recovered line item, and a 19.4% growth in adjustments and interest on miscellaneous receivables.
| |
Operating Expenses
Personnel Benefits and Administrative Expenses
| Personnel Benefits and Adminsitrative Expenses | BBVA ARG Consolidated | Chg (%) | |||
| In millions of AR$ - Inflation adjusted | 4Q21 | 3Q21 | 4Q20 | QoQ | YoY |
| Total Personnel Benefits and Adminsitrative Expenses | 16,243 | 17,835 | 14,638 | (8.9%) | 11.0% |
| Personnel Benefits (1) | 7,715 | 8,135 | 7,332 | (5.2%) | 5.2% |
| Administrative expenses (1) | 8,528 | 9,700 | 7,306 | (12.1%) | 16.7% |
| Travel expenses | 26 | 39 | 50 | (33.3%) | (48.0%) |
| Outsourced administrative expenses | 1,051 | 1,081 | 563 | (2.8%) | 86.7% |
| Security services | 305 | 265 | 291 | 15.1% | 4.8% |
| Fees to Bank Directors and Supervisory Committee | 26 | 10 | 13 | 160.0% | 100.0% |
| Other fees | 357 | 400 | 336 | (10.8%) | 6.3% |
| Insurance | 91 | 107 | 89 | (15.0%) | 2.2% |
| Rent | 687 | 1,613 | 766 | (57.4%) | (10.3%) |
| Stationery and supplies | 21 | 12 | 19 | 75.0% | 10.5% |
| Electricity and communications | 332 | 369 | 365 | (10.0%) | (9.0%) |
| Advertising | 396 | 652 | 203 | (39.3%) | 95.1% |
| Taxes | 1,825 | 1,747 | 1,746 | 4.5% | 4.5% |
| Maintenance costs | 980 | 904 | 828 | 8.4% | 18.4% |
| Armored transportation services | 1,021 | 1,082 | 1,251 | (5.6%) | (18.4%) |
| Other administrative expenses | 1,410 | 1,419 | 786 | (0.6%) | 79.4% |
| Headcount* | |||||
| BBVA (Bank) | 5,787 | 5,790 | 5,920 | (3) | (133) |
| Associates | 98 | 98 | 99 | - | (1) |
| Total employees | 5,863 | 5,888 | 6,019 | (25) | (156) |
| Branches | 2,000 | 2,055 | 2,901 | (55) | (901) |
| Main office | 3,863 | 3,833 | 3,118 | 30 | 745 |
| Total branches** | 243 | 243 | 247 | - | (4) |
| Efficiency ratio | 67.3% | 69.0% | 44.0% | (167)bps | 2,324 bps |
| Accumulated Efficiency Ratio | 69.1% | 69.7% | 56.8% | (63)bps | 1,224 bps |
| Efficiency ratio - Excl. Inflation adjustment | 48.4% | 51.9% | 34.4% | (351)bps | 1,394 bps |
| Accumulated Efficiency Ratio - Excl. Inflation adjustment | 49.4% | 49.7% | 45.1% | (35)bps | 425 bps |
| (1) Concept included in the efficiency ratio calculation | |||||
| (2) Includes BBVA Asset Management Argentina S.A., PSA & VWFS | |||||
| *corresponds to total effective employees, net of temporary contract employees | |||||
| **do not include administrative offices. As of 4Q21, 54% owned and 46% rented. | |||||
During 4Q21, personnel benefits and administrative expenses totaled $16.2 billion, falling 8.9% or $1.6 billion compared to 3Q21, and growing 11.0% or $1.6 million compared to 4Q20.
Personnel benefits fell 5.2% QoQ, and grew 5.2% YoY. The quarterly decrease is partially explained by a fall in expenses on personnel services.
As of 4Q21, administrative expenses decreased 12.1% QoQ, and increased 16.7% YoY. The quarterly decline is partially explained by a 57.4% fall in the rent line item, and a 39.3% decrease in advertising.
The accumulated efficiency ratio as of 4Q21 was 69.1%, marginally improving compared to the 69.7% and deteriorating versus the 56.8% reported in 3Q21 and 4Q20 respectively. The quarterly improvement is explained by a higher percentage increase in the denominator (income considering monetary position results) than the numerator (expenses), which has been positively affected by an improvement in net fee income and net interest income.
Excluding inflation adjustments considered in the income from the monetary position line item, the 4Q21 accumulated efficiency ratio would have been 49.4%, marginally improving compared to the 49.7% of 3Q21 and deteriorating compared to the 45.1% of 4Q20.
| |
Other Operating Expenses
| Other Operating Expenses | BBVA ARG Consolidated | Chg (%) | |||
| In millions of AR$ - Inflation adjusted | 4Q21 | 3Q21 | 4Q20 | QoQ | YoY |
| Other Operating Expenses | 7,326 | 6,463 | 9,184 | 13.4% | (20.2%) |
| Turnover tax | 4,341 | 4,296 | 3,299 | 1.0% | 31.6% |
| Initial loss of loans below market rate | 643 | 418 | 954 | 53.8% | (32.6%) |
| Contribution to the Deposit Guarantee Fund (SEDESA) | 286 | 291 | 279 | (1.7%) | 2.5% |
| Interest on liabilities from financial lease | 107 | 114 | 130 | (6.1%) | (17.7%) |
| Other allowances | (265) | 247 | 690 | (207.3%) | (138.4%) |
| Loss for sale or depreciation of investment property and other non financial assets | 39 | - | - | N/A | N/A |
| Other operating expenses | 2,175 | 1,097 | 3,832 | 98.3% | (43.2%) |
In 4Q21, other operating expenses totaled $7.3 billion, growing 13.4% or $863 million QoQ, and falling 20.2% or $1.9 billion YoY.
The key factor explaining the quarterly increase in in the other operating expenses line item, where a $1.3 billion provision for reorganization is recorded, consistent with the goal of further aligning the organizational structure with the corporate strategy during the current year, achieving efficiency gains and streamlining the decision-making process across all work teams.
The aforementioned expenses are partially offset by the other allowances line item, falling 207.3% related to the increased use of off-balance sheet items as a result of growth in activity.
Income from Associates
This line reflects the results from non-consolidated associate companies. During 4Q21, a loss of $115 million has been reported, mainly due to the Bank’s participation in BBVA Consolidar Seguros S.A., Rombo Compañía Financiera S.A., Interbanking S.A. and Play Digital S.A. and Openpay Argentina S.A.
Income Tax
Accumulated income tax during 2021 recorded a gain of $80 million. Income tax expense as of 4Q21 was $2.4 billion. The first and second quarters of 2021 were affected by the reversal of provisions connected to the repayment of income tax inflation adjustments for 2016, 2017 and 2018 fiscal years.
Excluding the effect of actions of declaratory judgment during the year, the effective tax rate would have been 30% in 2021, compared to an effective tax rate of 43% in 2020.
The accumulated income tax result as of 4Q21 includes the reversal in 2Q21 of the provision connected to the repayment of income tax inflation adjustments for 2017 and 2018 fiscal years, for a total of $4.3 billion (in nominal terms), recorded during the first quarter of 2018 and the second quarter of 2019 respectively. The reversal was a result of an assessment, funded on legal and tax advisors’ opinions, in which the Bank considered that probabilities of getting a final instance favorable court ruling were higher for those fiscal years.
The accumulated income tax result as of 4Q21 also includes the positive result posted in 1Q21 due to the reversal of a provision of $1.2 billion (in nominal terms) recorded during the second quarter of 2017 corresponding to 2016 fiscal year, which was funded on a favorable final sentence in court.
Meanwhile, on May 26, 2021, the Bank filed a new action of declaratory judgment of unconstitutionality against the Administración Federal de Ingresos Públicos –Dirección General Impositiva (AFIP-DGI) expecting a favorable decision that declares the unconstitutionality of the section 194 of Income Tax Law (T.O. 2019) and/or the regulations that prevent the full implementation of the inflation adjustment for tax purposes mechanism, as it considers a confiscatory income tax effect for fiscal year 2020. Consequently, in the income tax line item, a positive adjustment of $784 million (in nominal terms) is recorded.
| |
Subsequently, Law No 27,630 enacted on June 16, 2021, overruled the general reduction in applicable tax rates2, and introduced a scale system for fiscal years as of January 1, 2021. Thus, the applicable scale for the Bank will be the highest with a 35% tax rate.
Balance sheet and activity
Loans and Other Financing
| Loans and other financing | BBVA ARG Consolidated | Chg (%) | |||
| In millions of AR$ - Inflation adjusted | 4Q21 | 3Q21 | 4Q20 | QoQ | YoY |
| To the public sector | 1 | 1 | 10 | - | (90.0%) |
| To the financial sector | 4,252 | 4,008 | 3,528 | 6.1% | 20.5% |
| Non-financial private sector and residents abroad | 388,440 | 374,591 | 438,185 | 3.7% | (11.4%) |
| Non-financial private sector and residents abroad - AR$ | 365,908 | 342,744 | 391,478 | 6.8% | (6.5%) |
| Overdrafts | 22,526 | 23,348 | 26,277 | (3.5%) | (14.3%) |
| Discounted instruments | 51,375 | 42,832 | 49,988 | 19.9% | 2.8% |
| Mortgage loans | 22,909 | 23,846 | 25,276 | (3.9%) | (9.4%) |
| Pledge loans | 16,342 | 16,609 | 17,226 | (1.6%) | (5.1%) |
| Consumer loans | 40,951 | 39,324 | 42,446 | 4.1% | (3.5%) |
| Credit cards | 154,590 | 149,765 | 170,351 | 3.2% | (9.3%) |
| Receivables from financial leases | 2,888 | 3,074 | 2,632 | (6.1%) | 9.7% |
| Other loans | 54,327 | 43,946 | 57,282 | 23.6% | (5.2%) |
| Non-financial private sector and residents abroad - Foreign Currency | 22,532 | 31,847 | 46,707 | (29.2%) | (51.8%) |
| Overdrafts | 2 | 3 | 4 | (33.3%) | (50.0%) |
| Discounted instruments | - | 3,304 | 2,553 | (100.0%) | (100.0%) |
| Credit cards | 2,549 | 2,702 | 2,530 | (5.7%) | 0.8% |
| Receivables from financial leases | 24 | 60 | 187 | (60.0%) | (87.2%) |
| Loans for the prefinancing and financing of exports | 13,343 | 17,743 | 24,120 | (24.8%) | (44.7%) |
| Other loans | 6,614 | 8,035 | 17,313 | (17.7%) | (61.8%) |
| % of total loans to Private sector in AR$ | 94.2% | 91.5% | 89.3% | 270 bps | 486 bps |
| % of total loans to Private sector in Foreign Currency | 5.8% | 8.5% | 10.7% | (270)bps | (486)bps |
| % of mortgage loans with UVA adjustments / Total mortgage loans (1) | 74.6% | 74.7% | 84.0% | (5)bps | (934)bps |
| % of pledge loans with UVA adjustments / Total pledge loans (1) | 6.7% | 8.1% | 12.5% | (135)bps | (582)bps |
| % of consumer loans with UVA adjustments / Total consumer loans (1) | 3.5% | 5.1% | 11.5% | (162)bps | (802)bps |
| % of loans with UVA adjustments / Total loans and other financing(1) | 4.1% | 4.3% | 3.4% | (16)bps | 70 bps |
| Total loans and other financing | 392,693 | 378,600 | 441,723 | 3.7% | (11.1%) |
| Allowances | (13,653) | (17,862) | (19,813) | 23.6% | 31.1% |
| Total net loans and other financing | 379,040 | 360,738 | 421,910 | 5.1% | (10.2%) |
(1) Excludes effect of accrued interests adjustments.
| |||||
| Loans and other financing to non-financial private sector and residents abroad in foreign currency | BBVA ARG Consolidated | Chg (%) | |||
| In millions of USD | 4Q21 | 3Q21 | 4Q20 | QoQ | YoY |
| FX rate* | 102.8 | 98.7 | 84.1 | 4.1% | 22.1% |
| Non-financial private sector and residents abroad - Foreign Currency (USD) | 219 | 293 | 368 | (25.1%) | (40.4%) |
| *Wholesale U.S. dollar foreign exchange rates on BCRA’s Communication “A” 3500, as of the end of period. | |||||
Private sector loans as of 4Q21 totaled $388.4 billion, increasing 3.7% or $13.9 billion QoQ, and falling 11.1% or $49.8 billion YoY.
Loans to the private sector in pesos increased 6.8% in 4Q21, and decreased 6.5% YoY. During the quarter, growth is especially driven by a 23.6% increase in other loans (mainly company loans or “PIV”, based on productive investment credit lines, and subsidiaries’ Floorplanning), a 19.9% increase in discounted instruments, and a 3.2% increase in credit cards, the latter partially explained by Ahora 12 programs.
2 Previously: 30% for fiscal years as of January 1, 2018 and 25% for fiscal years as of 2022.
| |
Loans to the private sector denominated in foreign currency fell 29.2% QoQ and 51.8% YoY. Quarterly decrease is mainly explained by a 24.8% fall in prefinancing and financing of exports, a 100.0% fall in discounted instruments, and a 17.7% fall in other loans. All the aforementioned indicates a lack of demand of loans in foreign currency. Loans to the private sector in foreign currency measured in U.S. dollars fell 25.1% QoQ and 40.4% YoY. The depreciation of the argentine peso versus the U.S. dollar was 3.9% QoQ and 18.1% YoY3.
In 4Q21, total loans and other financing totaled $392.7 billion, increasing 3.7% compared to 3Q21 and 11.1% compared to 4Q20.
| Loans and other financing | BBVA ARG Consolidated | Chg (%) | |||
| In millions of AR$ - Inflation adjusted | 4Q21 | 3Q21 | 4Q20 | QoQ | YoY |
| Non-financial private sector and residents abroad - Retail | 237,341 | 232,246 | 257,829 | 2.2% | (7.9%) |
| Mortgage loans | 22,909 | 23,846 | 25,276 | (3.9%) | (9.4%) |
| Pledge loans | 16,342 | 16,609 | 17,226 | (1.6%) | (5.1%) |
| Consumer loans | 40,951 | 39,324 | 42,446 | 4.1% | (3.5%) |
| Credit cards | 157,139 | 152,467 | 172,881 | 3.1% | (9.1%) |
| Non-financial private sector and residents abroad - Commercial | 151,099 | 142,345 | 180,356 | 6.1% | (16.2%) |
| Overdrafts | 22,528 | 23,351 | 26,281 | (3.5%) | (14.3%) |
| Discounted instruments | 51,375 | 46,136 | 52,541 | 11.4% | (2.2%) |
| Receivables from financial leases | 2,912 | 3,134 | 2,819 | (7.1%) | 3.3% |
| Loans for the prefinancing and financing of exports | 13,343 | 17,743 | 24,120 | (24.8%) | (44.7%) |
| Other loans | 60,941 | 51,981 | 74,595 | 17.2% | (18.3%) |
| % of total loans to Retail sector | 61.1% | 62.0% | 58.8% | (90)bps | 226 bps |
| % of total loans to Commercial sector | 38.9% | 38.0% | 41.2% | 90 bps | (226)bps |
In real terms, retail loans (mortgage, pledge, consumer and credit cards) have increased 2.2% QoQ and fallen 7.9% YoY. During the quarter, the greatest increases are seen in consumer loans with a 4.1% increment, followed by a 3.1% growth in credit cards.
Commercial loans (overdrafts, discounted instruments, receivables from financial leases, loans for the prefinancing and financing of exports, and other loans) grew 6.1% QoQ and contracted 16.2% YoY both in real terms. Quarterly increase is explained by a 17.2% growth in other loans, followed by an 11.4% increase in discounted instruments. This was partially offset by a 24.8% fall in prefinancing and financing of exports. Growth in commercial loans was primarily motivated by marketing campaigns during 4Q21.
Loan portfolios are mainly impacted by the effect of inflation during the fourth quarter of 2021, which reached 10.2%. In nominal terms, the retail, commercial and total loan portfolio all increased 12.6%, 17.0% and 14.3% respectively during the quarter, well beyond real term growth.
| Loans and other financing- Non restated figures | BBVA ARG Consolidated | Chg (%) | |||
| In millions of AR$ | 4Q21 | 3Q21 | 4Q20 | QoQ | YoY |
| Non-financial private sector and residents abroad - Retail | 237,341 | 210,730 | 171,593 | 12.6% | 38.3% |
| Non-financial private sector and residents abroad - Commercial | 151,099 | 129,157 | 118,708 | 17.0% | 27.3% |
| Total loans and other financing (1) | 392,693 | 343,525 | 292,645 | 14.3% | 34.2% |
| (1) Does not include allowances | |||||
As of 4Q21, the total loans and other financing over deposits ratio was 55.4%, above the 54.5% recorded in 3Q21 and below the 61.2% in 4Q20.
| Market share - Private sector Loans | BBVA ARG Consolidated | Chg (%) | |||
| In % | 4Q21 | 3Q21 | 4Q20 | QoQ | YoY |
| Private sector loans - Bank | 7.18% | 7.25% | 7.66% | (7)bps | (48)bps |
| Private sector loans - Consolidated* | 8.05% | 8.10% | 8.49% | (5)bps | (44)bps |
| Based on daily BCRA information. Capital balance as of the last day of each quarter. | |||||
| * Consolidates PSA, VWFS & Rombo | |||||
3 Taking into consideration wholesale U.S. dollar foreign exchange rates on BCRA’s Communication “A” 3500.
| |
| Loans by economic activity | BBVA ARG Consolidated | Chg (%) | |||
| % over total gross loans and other financing | 4Q21 | 3Q21 | 4Q20 | QoQ | YoY |
| Government services | n.m. | n.m | n.m | - | - |
| Financial Sector | 1.1% | 1.1% | 0.8% | 2 bps | 28 bps |
| Agricultural and Livestock | 4.2% | 3.8% | 5.2% | 41 bps | (99)bps |
| Mining products | 3.8% | 5.4% | 9.4% | (157)bps | (551)bps |
| Other manufacturing | 11.0% | 11.0% | 7.8% | 1 bps | 315 bps |
| Electricity, oil,water and sanitary services | 0.0% | 0.0% | 0.3% | 1 bps | (30)bps |
| Wholesale and retail trade | 7.2% | 6.2% | 5.3% | 101 bps | 192 bps |
| Transport | 1.0% | 0.8% | 0.9% | 19 bps | 17 bps |
| Services | 0.8% | 0.7% | 0.6% | 9 bps | 13 bps |
| Others | 13.2% | 12.8% | 14.2% | 36 bps | (105)bps |
| Construction | 0.6% | 0.6% | 0.7% | 6 bps | (10)bps |
| Consumer | 57.0% | 57.6% | 54.7% | (60)bps | 228 bps |
| Total gross loans and other financing | 100.0% | 100.0% | 100.0% | ||
Asset Quality
| Asset Quality | BBVA ARG Consolidated | Chg (%) | |||
| In millions of AR$ - Inflation adjusted | 4Q21 | 3Q21 | 4Q20 | QoQ | YoY |
| Commercial non-performing portfolio (1) | 2,411 | 2,663 | 3,330 | (9.5%) | (27.6%) |
| Total commercial portfolio | 114,109 | 117,623 | 150,450 | (3.0%) | (24.2%) |
| Commercial non-performing portfolio / Total commercial portfolio | 2.11% | 2.26% | 2.21% | (15)bps | (10)bps |
| Retail non-performing portfolio (1) | 5,095 | 7,165 | 3,022 | (28.9%) | 68.6% |
| Total retail portfolio | 286,991 | 268,804 | 302,588 | 6.8% | (5.2%) |
| Retail non-performing portfolio / Total retail portfolio | 1.78% | 2.67% | 1.00% | (89)bps | 78 bps |
| Total non-performing portfolio (1) | 7,506 | 9,828 | 6,351 | (23.6%) | 18.2% |
| Total portfolio | 401,100 | 386,427 | 453,038 | 3.8% | (11.5%) |
| Total non-performing portfolio / Total portfolio | 1.87% | 2.54% | 1.40% | (67)bps | 47 bps |
| Allowances | 13,653 | 17,862 | 19,813 | (23.6%) | (31.1%) |
| Allowances /Total non-performing portfolio | 181.89% | 181.75% | 311.95% | 14 bps | (13,006)bps |
| Quarterly change in Write-offs | 2,533 | 1,276 | 1,104 | 98.5% | 129.4% |
| Write offs / Total portfolio | 0.63% | 0.33% | 0.24% | 30 bps | 39 bps |
| Cost of Risk (CoR) | 0.46% | 2.80% | 4.99% | (234)bps | (454)bps |
| (1) Non-performing loans include: all loans to borrowers classified as "Deficient Servicing (Stage 3)", "High Insolvency Risk (Stage 4)", "Irrecoverable" and/or "Irrecoverable for Technical Decision" (Stage 5) according to BCRA debtor classification system | |||||
In 4Q21, asset quality ratio or NPL (total non-performing portfolio / total portfolio) was 1.87%, compared to the 2.54% recorded in 3Q21. The decrease is mainly explained by (i) a satisfactory behavior of the loan portfolio, (ii) the write-off of non-performing loans, mainly retail, (iii) together with an increase in the total loan portfolio.
The coverage ratio (allowances / total non-performing portfolio) was 181.89% in 4Q21, versus the 181.75% recorded in 3Q21. The change in this ratio reflects a similar variation in allowances (mainly due to the update and improvement of IFRS 9 impairment loss model parameters, with most impact on the retail portfolio) and in the total non-performing loan portfolio.
Cost of risk (loan loss allowances / average total loans) reached 0.46% as of 4Q21, lower than 3Q21’s 2.80%. This is mainly explained by the reduction in loan loss allowances, as a result of the annual update of IFRS 9 impairment loss model parameters, and an improvement in the sovereign rating for the commercial portfolio, upgrading the commercial loan portfolio’s rating. This was offset by the negative effect of the new default definition implemented in November 2021 by the parent BBVA Group.
| Analysis for the allowance of loan losses | BBVA ARG | ||||||
| Balance at 12/31/2020 | Stage 1 | Stage 2 | Stage 3 | Monetary result generated by allowances | Balance at 12/31/2021 | ||
| In millions of AR$ | |||||||
| Other financial assets | 399 | (25) | - | 51 | (137) | 288 | |
| Loans and other financing | 19,323 | (2,523) | (987) | 4,764 | (7,412) | 13,165 | |
| Other debt securities | - | 18 | - | - | (3) | 15 | |
| Eventual commitments | 2,060 | (463) | (51) | 20 | (712) | 854 | |
| Total allowances | 21,782 | (2,993) | (1,038) | 4,835 | (8,264) | 14,322 | |
| Note: to be consistent with Financial Statements, it must be recorded from the beginning of the year instead of the quarter | |||||||
| |
Allowances for the Bank in 4Q21 reflect expected losses driven by the adoption of the IFRS 9 standards as of January 1, 2020, except for debt instruments issued by the nonfinancial government sector which were temporarily excluded from the scope of such standard.
| Analysis for the allowance of loan losses | Group "C" Subsidiary Companies | ||||||
| Balance at 12/31/2020 | Stage 1 | Stage 2 | Stage 3 | Monetary result generated by allowances | Balance at 12/31/2021 | ||
| In millions of AR$ | |||||||
| Loans and other financing | 490 | 190 | (28) | (15) | (150) | 488 | |
| Non-financial private sector and residents abroad | 490 | 190 | (28) | (15) | (150) | 488 | |
| Pledge loans | 475 | 180 | (25) | (15) | (145) | 469 | |
| Financial leases | 2 | 1 | (1) | - | - | 2 | |
| Other | 13 | 9 | - | - | (5) | 17 | |
| Total allowances | 490 | 190 | (28) | (15) | (150) | 488 | |
| Note: to be consistent with Financial Statements, it must be recorded from the beginning of the year instead of the quarter | |||||||
The financial statements of consolidated subsidiaries PSA and VWFS were prepared considering the financial reporting framework set forth by the BCRA for Group "C" financial institutions, without considering the model established in paragraph 5.5. “Impairment” of IFRS 9 for fiscal years commencing on and after January 1, 2022. It is worth mentioning that the regulator extended the implementation of such section up to January 1, 2023, in a discretionary manner for Group “C” institutions. Companies consolidating with the Bank did not make use of this option.
Public Sector Exposure
| Net Public Debt Exposure | BBVA ARG Consolidated | Chg (%) | |||
| In millions of AR$ - Inflation adjusted | 4Q21 | 3Q21 | 4Q20 | QoQ | YoY |
| Treasury and Government securities | 81,948 | 69,380 | 57,823 | 18.1% | 41.7% |
| Treasury and National Government | 81,948 | 69,380 | 57,823 | 18.1% | 41.7% |
| National Treasury Public Debt in AR$ | 80,330 | 69,380 | 57,823 | 15.8% | 38.9% |
| National Treasury Public Debt in AR$ linked to US dollars | 1,618 | - | - | N/A | N/A |
| Loans to the Public Sector | 1 | 1 | 10 | - | (90.0%) |
| AR$ Subtotal | 80,331 | 69,381 | 57,833 | 15.8% | 38.9% |
| USD Subtotal* | 1,618 | 0 | 0 | n.m | n.m |
| Total Public Debt Exposure | 81,949 | 69,381 | 57,833 | 18.1% | 41.7% |
| B.C.R.A. Exposure | 245,242 | 251,919 | 209,920 | (2.7%) | 16.8% |
| Instruments | 107,693 | 132,055 | 135,675 | (18.4%) | (20.6%) |
| LELIQs | 107,693 | 132,055 | 135,675 | (18.4%) | (20.6%) |
| Repo | 137,548 | 119,864 | 74,245 | 14.8% | 85.3% |
| B.C.R.A. - AR$ | 137,548 | 119,864 | 74,245 | 14.8% | 85.3% |
| % Public sector exposure (Excl. B.C.R.A.) / Total assets | 8.0% | 6.9% | 5.6% | 106 bps | 238 bps |
| *Includes USD-linked Treasury public debt in AR$ | |||||
| This table does not include deposits at the Central Bank used to comply with reserve requirements. | |||||
4Q21 public sector exposure (excluding BCRA) totaled $81.9 billion, growing 18.1% or $12.6 billion QoQ, and 41.7% or $24.1 billion YoY. The quarterly increase is explained by a greater position in CER-linked treasury bonds, CER-linked treasury bills (LECER) and 2022 National Treasury Bonds at fixed rate (Bonte 22, used for reserve requirement integration), as well as U.S. dollar linked treasury bonds.
Short-term liquidity is mostly allocated in BCRA instruments, which fell 2.7% QoQ and increased 16.8% YoY in real terms. The quarterly decrease is explained by a reduction in the final LELIQ position.
Exposure to the public sector (excluding BCRA) represents 8.0% of total assets, above the 6.9% in 3Q21 and the 5.6% in 4Q20.
| |
Deposits
| Total Deposits | BBVA ARG Consolidated | Chg (%) | |||
| In millions of AR$ - Inflation adjusted | 4Q21 | 3Q21 | 4Q20 | QoQ | YoY |
| Total deposits | 708,336 | 695,180 | 721,839 | 1.9% | (1.9%) |
| Non-financial Public Sector | 13,274 | 11,247 | 8,496 | 18.0% | 56.2% |
| Financial Sector | 217 | 226 | 1,301 | (4.0%) | (83.3%) |
| Non-financial private sector and residents abroad | 694,845 | 683,707 | 712,042 | 1.6% | (2.4%) |
| Non-financial private sector and residents abroad - AR$ | 531,860 | 501,445 | 508,207 | 6.1% | 4.7% |
| Checking accounts | 170,393 | 152,490 | 169,875 | 11.7% | 0.3% |
| Savings accounts | 139,820 | 117,542 | 133,596 | 19.0% | 4.7% |
| Time deposits | 157,124 | 170,330 | 157,924 | (7.8%) | (0.5%) |
| Investment accounts | 59,871 | 56,679 | 42,120 | 5.6% | 42.1% |
| Other | 4,653 | 4,404 | 4,692 | 5.6% | (0.8%) |
| Non-financial private sector and res. abroad - Foreign Currency | 162,985 | 182,262 | 203,835 | (10.6%) | (20.0%) |
| Checking accounts | 24 | 65 | 60 | (63.8%) | (61.1%) |
| Savings accounts | 145,372 | 160,852 | 177,234 | (9.6%) | (18.0%) |
| Time deposits | 15,746 | 19,133 | 23,308 | (17.7%) | (32.4%) |
| Other | 1,844 | 2,212 | 3,232 | (16.7%) | (42.9%) |
| % of total portfolio in the private sector in AR$ | 76.5% | 73.3% | 71.4% | 320 bps | 517 bps |
| % of total portfolio in the private sector in Foregin Currency | 23.5% | 26.7% | 28.6% | (320)bps | (517)bps |
| % of time deposits with UVA adjustments / Total AR$ Deposits | 3.9% | 4.0% | 1.7% | (13)bps | 225 bps |
| % of sight deposits over total deposits | 66.5% | 64.0% | 68.6% | 251 bps | (213)bps |
| % of time deposits over total deposits | 33.5% | 36.0% | 31.4% | (251)bps | 213 bps |
| Deposits to the non-financial private sector and res. abroad in foreign currency | BBVA ARG Consolidated | Chg (%) | |||
| In millions of USD | 4Q21 | 3Q21 | 4Q20 | QoQ | YoY |
| FX rate* | 102.8 | 98.7 | 84.1 | 4.1% | 22.1% |
| Non-financial private sector and residents abroad - Foreign Currency (USD) | 1,586 | 1,675 | 1,605 | (5.3%) | (1.2%) |
| *Wholesale U.S. dollar foreign exchange rates on BCRA’s Communication “A” 3500, as of the end of period. | |||||
As of 4Q21, total deposits reached $708.3 billion, growing 1.9% or $13.2 billion QoQ, and falling 1.9% or $13.5 billion YoY.
Private non-financial sector deposits in 4Q21 totaled $694.8 billion, increasing 1.6% QoQ, and falling 2.4% YoY.
Private non-financial sector deposits in pesos totaled $531.9 billion, increasing 6.1% compared to 3Q21, and 4.7% compared to 4Q20. The quarterly growth is mainly affected by the increase in sight deposits, especially checking accounts (non-interest bearing), and savings accounts. This was partially offset by a 7.8% decrease in time deposits.
Private non-financial sector deposits in foreign currency expressed in pesos fell 10.6% QoQ and 20.0% YoY. Measured in U.S. dollars, these deposits fell 5.3% QoQ and 1.2% YoY.
| Private Deposits | BBVA ARG Consolidated | Chg (%) | |||
| In millions of AR$ - Inflation adjusted | 4Q21 | 3Q21 | 4Q20 | QoQ | YoY |
| Non-financial private sector and residents abroad | 694,845 | 683,707 | 712,042 | 1.6% | (2.4%) |
| Sight deposits | 462,105 | 437,565 | 488,689 | 5.6% | (5.4%) |
| Checking accounts | 170,416 | 152,555 | 169,936 | 11.7% | 0.3% |
| Savings accounts | 285,192 | 278,394 | 310,830 | 2.4% | (8.2%) |
| Other | 6,496 | 6,616 | 7,924 | (1.8%) | (18.0%) |
| Time deposits | 232,741 | 246,141 | 223,352 | (5.4%) | 4.2% |
| Time deposits | 172,870 | 189,462 | 181,233 | (8.8%) | (4.6%) |
| Investment accounts | 59,871 | 56,679 | 42,120 | 5.6% | 42.1% |
| % of sight deposits over total deposits | 67.1% | 64.6% | 69.1% | 255 bps | (192)bps |
| % of time deposits over total deposits | 32.9% | 35.4% | 30.9% | (255)bps | 192 bps |
| Private Deposits - Non restated figures | BBVA ARG Consolidated | Chg (%) | |||
| In millions of AR$ | 4Q21 | 3Q21 | 4Q20 | QoQ | YoY |
| Sight deposits | 462,105 | 397,028 | 323,760 | 16.4% | 42.7% |
| Time deposits | 232,741 | 223,338 | 147,973 | 4.2% | 57.3% |
| Total deposits | 708,336 | 630,776 | 478,223 | 12.3% | 48.1% |
| |
As of 4Q21, the Bank’s transactional deposits (checking accounts and savings accounts) represented 65.6% of total non-financial private deposits, totaling $455.6 billion, versus 63.0% in 3Q21.
| Market Share - Private sector Deposits | BBVA ARG Consolidated | Chg (%) | |||
| In % | 4Q21 | 3Q21 | 4Q20 | QoQ | YoY |
| Private sector Deposits - Consolidated* | 6.95% | 7.03% | 7.13% | (8)bps | (18)bps |
| Based on daily BCRA information. Capital balance as of the last day of each quarter. | |||||
| * Consolidates PSA, VWFS & Rombo | |||||
Other Sources of Funds
| Other sources of funds | BBVA ARG Consolidated | Chg (%) | |||
| In millions of AR$ - Inflation adjusted | 4Q21 | 3Q21 | 4Q20 | QoQ | YoY |
| Other sources of funds | 171,667 | 172,850 | 169,676 | (0.7%) | 1.2% |
| Central Bank | 46 | 35 | 43 | 30.5% | 5.9% |
| Banks and international organizations | - | 3,339 | 2,552 | (100.0%) | (100.0%) |
| Financing received from local financial institutions | 11,712 | 8,600 | 11,934 | 36.2% | (1.9%) |
| Corporate bonds | 503 | 502 | 1,764 | 0.2% | (71.5%) |
| Equity | 159,406 | 160,374 | 153,382 | (0.6%) | 3.9% |
In 4Q21, other sources of funds totaled $172.0 billion, decreasing 0.5% or $883 million QoQ, and increasing 1.4% or $3.0 billion YoY.
The fall in Banks and international organizations is related to the finalization of loans with correspondent banks which have not been renewed, which were used for productive investment credit lines for which demand has contracted.
Quarterly increase is mostly explained by the 0.6% decrease in equity. This is explained by the announcement of a dividend distribution for $6.5 billion on November 3, 2021.
Liquid Assets
| Total Liquid Assets | BBVA ARG Consolidated | Chg (%) | |||
| In millions of AR$ - Inflation adjusted | 4Q21 | 3Q21 | 4Q20 | QoQ | YoY |
| Total liquid assets | 540,922 | 534,862 | 486,869 | 1.1% | 11.1% |
| Cash and deposits in banks | 218,346 | 217,404 | 229,595 | 0.4% | (4.9%) |
| Debt securities at fair value through profit or loss | 1,396 | 7,215 | 1,382 | (80.7%) | 1.1% |
| Government securities | 1,396 | 2,386 | 1,382 | (41.5%) | 1.1% |
| Liquidity bills of B. C. R. A. | - | 4,829 | - | (100.0%) | N/A |
| Net REPO transactions | 137,548 | 119,864 | 74,245 | 14.8% | 85.3% |
| Other debt securities | 183,631 | 190,378 | 181,648 | (3.5%) | 1.1% |
| Government securities | 75,938 | 63,153 | 45,966 | 20.2% | 65.2% |
| Liquidity bills of B. C. R. A. | 107,693 | 127,226 | 135,682 | (15.4%) | (20.6%) |
| Liquid assets / Total Deposits | 76.4% | 76.9% | 67.4% | (57)bps | 892 bps |
In 4Q21, liquid assets were $540.9 billion, growing 1.1% or $6.1 billion compared to 3Q21, and 11.1% or $54.1 billion compared to 4Q20, mainly due to an increase in net REPO transactions, and in government securities at amortized cost (other debt securities), as a result of increased liquidity.
In 4Q21, the liquidity ratio (liquid assets / total deposits) reached 76.4%. Liquidity ratio in local and foreign currency reached 72.0% and 92.9% respectively.
| |
Solvency
| Minimum capital requirement | BBVA ARG Consolidated | Chg (%) | |||
| In millions of AR$ - Inflation adjusted | 4Q21 | 3Q21 | 4Q20 | QoQ | YoY |
| Minimum capital requirement | 57,278 | 51,978 | 58,558 | 10.2% | (2.2%) |
| Credit risk | 41,911 | 39,217 | 44,562 | 6.9% | (6.0%) |
| Market risk | 227 | 159 | 371 | 43.0% | (38.9%) |
| Operational risk | 15,140 | 12,603 | 13,624 | 20.1% | 11.1% |
| Integrated Capital - RPC (1)* | 145,792 | 149,518 | 144,705 | (2.5%) | 0.8% |
| Ordinary Capital Level 1 ( COn1) | 160,894 | 164,455 | 163,393 | (2.2%) | (1.5%) |
| Deductible items COn1 | (18,801) | (18,714) | (23,167) | (0.5%) | 18.8% |
| Additional Capital Level 2 (COn2) | 3,699 | 3,777 | 4,478 | (2.1%) | (17.4%) |
| Excess Capital | |||||
| Integration excess | 88,514 | 97,539 | 86,147 | (9.3%) | 2.7% |
| Excess as % of minimum capital requirement | 154.5% | 187.7% | 147.11% | (3,312)pbs | 742 pbs |
| Risk-weighted assets (RWA, according to B.C.R.A. regulation) (2) | 700,715 | 635,454 | 715,750 | 10.3% | (2.1%) |
| Regulatory Capital Ratio (1)/(2) | 20.8% | 23.5% | 20.2% | (272)bps | 59 bps |
| TIER I Capital Ratio (Ordinary Capital Level 1/ RWA) | 20.3% | 22.9% | 19.6% | (266)bps | 69 bps |
| * RPC includes 100% of quarterly results | |||||
BBVA Argentina continues to show strong solvency indicators on 4Q21. Capital ratio reached 20.8%, lower than 3Q21’s 23.5%, mostly due to the announcement of dividend distribution on November 3, 2021 for $6.5 billion. Tier 1 ratio was 20.3% and capital excess over regulatory requirement was $88.5 billion or 154.5%.
Since 2020, the Bank’s Shareholders’ meetings have announced dividends for a total of $28 billion, which remain pending distribution, given the Central Bank stated a suspension in the distribution of results of financial institutions until December 31, 2021. Now that the suspension has been lifted through Communication “A” 7421, the Bank will proceed to work on the authorization request to the regulator once its 2021 results are approved by the Shareholders’ meeting.
BBVA Argentina Asset Management S.A.
| Mutual Funds Assets | BBVA Asset Management | Chg (%) | |||
| In millions of AR$ - Inflation adjusted | 4Q21 | 3Q21 | 4Q20 | QoQ | YoY |
| FBA Renta Pesos | 175,775 | 192,076 | 144,714 | (8.5%) | 21.5% |
| FBA Renta Fija Plus | 16,661 | 12,366 | 657 | 34.7% | n.m |
| FBA Ahorro Pesos | 3,045 | 2,120 | 1,219 | 43.6% | 149.8% |
| FBA Horizonte | 369 | 402 | 962 | (8.2%) | (61.6%) |
| FBA Calificado | 909 | 867 | 846 | 4.8% | 7.4% |
| FBA Acciones Argentinas | 718 | 759 | 710 | (5.4%) | 1.1% |
| FBA Acciones Latinoamericanas | 527 | 538 | 671 | (2.0%) | (21.5%) |
| FBA Bonos Argentina | 788 | 928 | 391 | (15.1%) | 101.5% |
| FBA Bonos Globales | 119 | 137 | 304 | (13.1%) | (60.9%) |
| FBA Renta Mixta | 292 | 290 | 89 | 0.7% | 228.1% |
| FBA Gestión I | 35 | 37 | 41 | (5.4%) | (14.6%) |
| FBA Horizonte Plus | 20 | 26 | 47 | (23.1%) | (57.4%) |
| FBA Retorno Total I | 20 | 23 | 42 | (13.0%) | (52.4%) |
| FBA Renta Publica I | 27 | 7 | 2 | 285.7% | n.m |
| FBA Renta Fija Local | 2 | 2 | 2 | - | - |
| FBA Renta Fija Dólar Plus | - | - | 210 | N/A | (100.0%) |
| Total assets | 199,307 | 210,578 | 150,907 | (5.4%) | 32.1% |
| Market Share - Mutual funds | BBVA Asset Management | Chg (%) | |||
| In % | 4Q21 | 3Q21 | 4Q20 | QoQ | YoY |
| Mutual funds | 5.53% | 6.34% | 5.15% | (81)bps | 38 bps |
| Source: Cámara Argentina de Fondos Comunes de Inversión | |||||
| |
Other events
Main Relevant Events
| · | As of November 24, 2021, the termination of the alliance between BBVA Argentina and LATAM AIRLINES GROUP S.A., regarding the mile accumulation program for BBVA customers, as of February 28, 2022. Both BBVA Argentina and LATAM will continue to accompany their customers, with the strong belief that they will provide a better service independently. The termination of the alliance does not imply the cancellation of the LATAM Pass Program. The miles accrued during the term of duration of the alliance shall be maintained and may be used through LATAM.com according to the terms and conditions of that program. Moreover, as from March, customers will be part of Puntos BBVA, the new benefits program where they will be able to continue flying and arranging their customized trips. |
| · | As of March 2, 2022, the Bank has been notified of a class action filed by the Asociación por la Defensa de Usuarios y Consumidores (Association for the Defense of Consumer and User Rights – ADUC).The Association, acting on behalf of consumers, claims for an alleged new fee “Priority Pass Visit” applied to Credit Cards offered by the Bank, which would imply: (i) the unilateral modification of the agreement terms and conditions ; (ii) the abusive exercise of the activity by the bank. Moreover, it also requests that the amounts collected, interest and costs included, be terminated and refunded. It is important to remark that this action is informed even though it is materially impossible to determine to date, whether the claim has a significant economic importance, since such claim is brought for an indeterminate amount, materially impossible to be determined with certainty today. The Bank is analyzing the content of the lawsuit and defining the course of action, thus considering that even in the hypothetical case of an adverse decision regarding this dispute, such circumstance will not have a significant impact on its assets and activities. |
Digital Transformation
Digitalization continued to accelerate during 4Q21. Active digital client total more than 2.0 million with a 74.0% penetration over total active clients (2.8 million), versus a penetration of 71.7% in 4Q20. Active mobile clients reach 1.8 million, representing a 63.9% penetration in 4Q21, versus a penetration of 59.9% in 4Q20. Digital and mobile transactions4 increased 16.3% in 4Q21 YoY.
On 4Q21, retail digital sales measured in units reached 80.0% of total sales (vs. 80.8% in 4Q20) and represent 60.8% of the Banks total sales measured in monetary value (vs. 58.4% in 3Q20).
SMEs Productive investment financing credit lines – December 2021
As of December 31, 2021, total loans granted by the Bank regarding 2020 and 2021 quotas, complied with what was requested by the BCRA pursuant to Communications “B” 12162 and “B” 12164 respectively. Within this regulation, the total amount to be granted by the bank on the 2021/2022 quota amounts to $32.4 billion, pursuant to Communication “B” 12238.
As of September 30, 2021, total loans granted by the Bank regarding the 2021 quota amounted to $41.7 billion and the average of daily balances of current financing between April 21, 2021 and September 30, 2021, totaled $30.1 billion, having complied with the $24.4 billion quota demanded by the BCRA pursuant to Communication “B” 12164.
4 Includes online and mobile banking, Net Cash online & mobile.
| |
Main Regulatory Changes
Foreign Currency Global Net Position (PGNME). Cash position. (Communication “A” 7405, 11/25/2021). The BCRA updated the percentage of the “cash position”, which as of December 1, 2021, cannot exceed 0% of the bank prior month’s regulatory capital or “RPC”.
Instalment financing of the purchase of travel tickets and touristic services abroad through credit cards. (Communication “A” 7407, 11/25/2021). As of November 26, 2021, financial institutions and non-financial credit card issuers will not be able to finance, through instalments, any purchase of tickets and other touristic services abroad done through credit cards.
Dividend distribution. (Communication “A” 7421, 12/16/2021). The BCRA stated that as of January 1, 2022, and until December 31, 2022, financial institutions will be able to distribute results for up to 20% of what would have corresponded if “Results distribution” regulation had been applied. As of January 1, 2022, financial institutions that should have the BCRA’s authorization, shall do such distribution in twelve equal, monthly consecutive payments.
Financial institution expansion (Communication “A” 7427, 12/23/2021). Regulation indicating that financial institutions must have BCRA’s prior authorization for the relocation or shut down of branches is extended until December 31, 2022.
Minimum reserve requirement for PSPOPA. (Communication “A” 7429, 12/30/2021). As of January 1, 2022, the BCRA states that balances in pesos in deposit accounts from payment service providers that offer payment accounts (PSPOPA) that contain deposits from clients, are subject to 100% reserve requirement.
Maximum credit card rate, productive investment credit lines, minimum reserve requirement. (Communication “A” 7432, 01/06/2022). The BCRA disclosed the reconfiguration of its monetary policy instruments, and related to that, adopted several changes in regulation:
| (i) | SMEs Productive investment financing credit lines: increment of the nominal annual rate from 35% to 41% applicable to financing aimed at working capital, discounted instruments and especial financing granted as of January 10, 2022. |
| (ii) | Maximum interest rate for credit card financing from 43% (on Feb-21) to 49% for amounts of up to $200,000. |
| (iii) | Increment from 14% to 30% on the deduction of reserve requirement for SME’s productive investment credit lines granted as of January 10, 2022. |
| (iv) | As of January 10, 2022: shorter-duration LELIQ position is allowed for up to the monthly average of time deposits in pesos to the non-financial private sector on the previous period (includes those computed as reserve requirement integration). Long-duration LELIQ position is allowed without limit. This is valid for financial institutions that have a ratio of time deposits in pesos to the non-financial private sector over total deposits to the non-financial private sector of 20% or above. |
| (v) | The limit for the retail time deposit rate is raised from $1 million to $10 million, and the rate is increased to 97.5% of the Monetary Policy Rate (LELIQ rate). For deposits above $10 million, the applicable rate will be 92.5% of the Monetary Policy Rate. |
| (vi) | Meanwhile, the BCRA increased the LELIQ rate from 38% to 40% and announced the gradual cancellation and removal of 7-day REPOs.5 |
5 On January 17, 2022, the BCRA cut the 7-day REPO rate from 36.50% to 34.00% and on January 24, 2022, continued to further cut it to 32.00%.
| |
Reserve requirement. Ahora 12. (Communication “A” 7448, 01/27/2022). The BCRA stated, for financing granted within the Ahora 12 program as of February 1, 2022, that the percentage to be deductible from the reserve requirement in pesos will be 40% (previously 50%, Communication “A” 7114).
Deposits and time deposits. Reserve requirement. (Communication “A” 7459, 02/17/2022). The BCRA increased the monetary policy rate from 40% to 42.50%. In line with this, it also raised the minimum limits of time deposit rates. As of February 18, 2022, rates for time deposits for up to $10 million will be of 97.65% of the monetary policy rate. Reserve requirement will be reduced for an amount equivalent to 30% of SME’s productive investment credit lines that are granted at a nominal annual interest rate of up to 30%.
Floating rate liquidity notes. (Communication “A” 7460, 02/17/2022). The BCRA created the floating rate liquidity notes (NOTALIQ) that will have a floating rate equivalent to the effective annual yield of a 28-day LELIQ.
| |
Glossary
Active clients: holders of at least one active product. An active product is in most cases a product with at least “one movement” in the last 3 months, or a minimum balance.
Cost of Risk (accumulated): Year to date accumulated loan loss allowances / Average total loans.
Average total loans: average between previous year-end Total loans and other financing and current period Total loans and other financing.
Cost of Risk (quarterly): Current period Loan loss allowances / Average total loans. Average total loans: average between previous quarter-end Total loans and other financing and current period Total loans and other financing.
Coverage ratio: Quarterly allowances under the Expected Credit Loss model / total non-performing portfolio.
Digital clients: we consider a customer to be an active user of online banking when they have been logged at least once within the last three months using the internet or a cell phone and SMS banking.
Efficiency ratio (Excl. inflation adjustments, accumulated): Accumulated (Personnel benefits+ Administrative expenses + Depreciation & Amortization) / Accumulated (Net Interest Income + Net Fee Income + Net Income from measurement of Financial Instruments at Fair Value through P&L + Net income from write-down of assets at amortized cost and at fair value through OCI + Foreign exchange and gold gains + some concepts included in Other net operating income).
Efficiency ratio (Excl. inflation adjustments, quarterly): (Personnel benefits+ Administrative expenses + Depreciation & Amortization) / (Net Interest Income + Net Fee Income + Net Income from measurement of Financial Instruments at Fair Value through P&L + Net income from write-down of assets at amortized cost and at fair value through OCI + Foreign exchange and gold gains + some concepts included in Other net operating income).
Efficiency ratio (accumulated): Accumulated (Personnel benefits+ Administrative expenses + Depreciation & Amortization) / Accumulated (Net Interest Income + Net Fee Income + Net Income from measurement of Financial Instruments at Fair Value through P&L + Net income from write-down of assets at amortized cost and at fair value through OCI + Foreign exchange and gold gains + some concepts included in Other net operating income+ Income from net monetary position).
Efficiency ratio (quarterly): (Personnel benefits+ Administrative expenses + Depreciation & Amortization) / (Net Interest Income + Net Fee Income + Net Income from measurement of Financial Instruments at Fair Value through P&L + Net income from write-down of assets at amortized cost and at fair value through OCI + Foreign exchange and gold gains + some concepts included in Other net operating income+ Income from net monetary position).
Liquidity Ratio: (Cash and deposits in banks + Debt securities at fair value through P&L (Excl. Private securities) + Net REPO transactions + Other debt securities (Excl. Private securities) / Total Deposits.
Mobile clients: customers who have been active in online banking at least once in the last three months using a mobile device.
Net Interest Margin (NIM) – (quarterly): Quarterly Net Interest Income / Average quarterly interest earning assets.
Public Sector Exposure (excl. BCRA): (National and Provincial Government public debt + Loans to the public sector + REPO transactions) / Total Assets.
ROA (accumulated): Accumulated net Income of the period attributable to owners of the parent / Total Average Assets. Total Average Assets is calculated as the average between total assets on December of the previous year and total assets in the current period, expressed in local currency. Calculated over a 365-day year.
| |
ROA (quarterly): Net Income of the period attributable to owners of the parent / Total Average Assets. Total Average Assets is calculated as the average between total assets on the previous quarter-end and total assets in the current period, expressed in local currency. Calculated over a 365-day year.
ROE (accumulated): Accumulated net Income of the period attributable to owners of the parent / Average Equity. Average Equity is calculated as the average between equity in December of the previous year and equity in the current period, expressed in local currency. Calculated over a 365-day year.
ROE (quarterly): Net Income of the period attributable to owners of the parent / Average Equity. Average Equity is calculated as the average between equity on the previous quarter end and equity in the current period, expressed in local currency. Calculated over a 365-day year.
Spread: (Quarterly Interest Income / Quarterly average Interest-earning Assets) – (Quarterly Interest Expenses / Quarterly average interest-bearing liabilities).
Other terms
n.m.: not meaningful. Implies an increase above 500% and a decrease below -500%.
N/A: not applicable.
Bps: basis points.
| |
Balance Sheet
| Balance Sheet | BBVA ARG Consolidated | Chg (%) | |||
| In millions of AR$ - Inflation adjusted | 4Q21 | 3Q21 | 4Q20 | QoQ | YoY |
| Assets | |||||
| Cash and deposits in banks | 218,346 | 217,404 | 229,595 | 0.4% | (4.9%) |
| Cash | 74,254 | 54,153 | 93,935 | 37.1% | (21.0%) |
| Financial institutions and correspondents | 144,092 | 163,251 | 135,660 | (11.7%) | 6.2% |
| BCRA | 141,984 | 159,795 | 130,088 | (11.1%) | 9.1% |
| Other local and foreign financial institutions | 2,108 | 3,456 | 5,572 | (39.0%) | (62.2%) |
| Debt securities at fair value through profit or loss | 1,397 | 7,218 | 1,423 | (80.6%) | (1.8%) |
| Derivatives | 2,816 | 3,577 | 5,853 | (21.3%) | (51.9%) |
| Repo transactions | 137,548 | 119,864 | 74,245 | 14.8% | 85.3% |
| Other financial assets | 14,676 | 21,573 | 15,162 | (32.0%) | (3.2%) |
| Loans and other financing | 379,040 | 360,738 | 421,910 | 5.1% | (10.2%) |
| Non-financial public sector | 1 | 1 | 1 | - | - |
| B.C.R.A | - | - | 9 | N/A | (100.0%) |
| Other financial institutions | 4,210 | 3,791 | 2,649 | 11.1% | 58.9% |
| Non-financial private sector and residents abroad | 374,829 | 356,946 | 419,251 | 5.0% | (10.6%) |
| Other debt securities | 184,991 | 191,000 | 182,041 | (3.1%) | 1.6% |
| Financial assets pledged as collateral | 20,281 | 17,646 | 27,038 | 14.9% | (25.0%) |
| Current income tax assets | 2,254 | 2,290 | 1 | (1.6%) | n.m |
| Investments in equity instruments | 2,217 | 2,364 | 3,852 | (6.2%) | (42.4%) |
| Investments in subsidiaries and associates | 2,051 | 2,153 | 2,177 | (4.7%) | (5.8%) |
| Property and equipment | 50,921 | 49,117 | 50,970 | 3.7% | (0.1%) |
| Intangible assets | 3,676 | 3,150 | 2,345 | 16.7% | 56.8% |
| Deferred income tax assets | 876 | 735 | 8,005 | 19.2% | (89.1%) |
| Other non-financial assets | 8,802 | 8,377 | 13,471 | 5.1% | (34.7%) |
| Non-current assets held for sale | 302 | 341 | 341 | (11.4%) | (11.4%) |
| Total Assets | 1,030,194 | 1,007,547 | 1,038,429 | 2.2% | (0.8%) |
| Liabilities | |||||
| Deposits | 708,336 | 695,180 | 721,839 | 1.9% | (1.9%) |
| Non-financial public sector | 13,274 | 11,247 | 8,496 | 18.0% | 56.2% |
| Financial sector | 217 | 226 | 1,301 | (4.0%) | (83.3%) |
| Non-financial private sector and residents abroad | 694,844 | 683,707 | 712,042 | 1.6% | (2.4%) |
| Liabilities at fair value through profit or loss | - | 52 | - | (100.0%) | N/A |
| Derivatives | 314 | 387 | 285 | (18.9%) | 10.2% |
| Other financial liabilities | 61,592 | 60,079 | 59,209 | 2.5% | 4.0% |
| Financing received from the B.C.R.A. and other financial institutions | 11,758 | 11,974 | 14,530 | (1.8%) | (19.1%) |
| Corporate bonds issued | 503 | 502 | 1,764 | 0.2% | (71.5%) |
| Current income tax liabilities | 354 | 215 | 5,618 | 64.7% | (93.7%) |
| Provisions | 5,613 | 5,813 | 17,320 | (3.4%) | (67.6%) |
| Deferred income tax liabilities | 8,209 | 5,429 | 59 | 51.2% | n.m |
| Other non-financial liabilities | 70,903 | 64,360 | 61,196 | 10.2% | 15.9% |
| Total Liabilities | 867,582 | 843,991 | 881,820 | 2.8% | (1.6%) |
| Equity | |||||
| Share Capital | 613 | 613 | 613 | - | - |
| Non-capitalized contributions | 39,828 | 39,828 | 39,828 | - | - |
| Capital adjustments | 28,448 | 28,448 | 28,448 | - | - |
| Reserves | 70,149 | 76,899 | 130,311 | (8.8%) | (46.2%) |
| Retained earnings | (1,513) | (1,513) | (62,604) | - | 97.6% |
| Other accumulated comprehensive income | 697 | (341) | 118 | 304.2% | 489.3% |
| Income for the period | 21,183 | 16,440 | 16,668 | 28.9% | 27.1% |
| Equity attributable to owners of the Parent | 159,406 | 160,374 | 153,382 | (0.6%) | 3.9% |
| Equity attributable to non-controlling interests | 3,206 | 3,182 | 3,227 | 0.8% | (0.7%) |
| Total Equity | 162,612 | 163,556 | 156,609 | (0.6%) | 3.8% |
| Total Liabilities and Equity | 1,030,194 | 1,007,547 | 1,038,429 | 2.2% | (0.8%) |
| |
Balance Sheet – 5 Quarters
| Balance Sheet | BBVA ARG Consolidated | ||||
| In millions of AR$ - Inflation adjusted | 4Q21 | 3Q21 | 2Q21 | 1Q21 | 4Q20 |
| Assets | |||||
| Cash and deposits in banks | 218,346 | 217,404 | 238,870 | 261,565 | 229,595 |
| Cash | 74,254 | 54,153 | 71,323 | 88,113 | 93,935 |
| Financial institutions and correspondents | 144,092 | 163,251 | 167,547 | 173,452 | 135,660 |
| B.C.R.A | 141,984 | 159,795 | 162,836 | 167,967 | 130,088 |
| Other local and foreign financial institutions | 2,108 | 3,456 | 4,711 | 5,485 | 5,572 |
| Debt securities at fair value through profit or loss | 1,397 | 7,218 | 5,447 | 6,510 | 1,423 |
| Derivatives | 2,816 | 3,577 | 3,175 | 3,308 | 5,853 |
| Repo transactions | 137,548 | 119,864 | 126,782 | 40,717 | 74,245 |
| Other financial assets | 14,676 | 21,573 | 18,366 | 18,466 | 15,162 |
| Loans and other financing | 379,040 | 360,738 | 369,664 | 380,387 | 421,910 |
| Non-financial public sector | 1 | 1 | - | 1 | 1 |
| B.C.R.A | - | - | - | - | 9 |
| Other financial institutions | 4,210 | 3,791 | 2,851 | 2,655 | 2,649 |
| Non-financial private sector and residents abroad | 374,829 | 356,946 | 366,813 | 377,731 | 419,251 |
| Other debt securities | 184,991 | 191,000 | 185,200 | 180,496 | 182,041 |
| Financial assets pledged as collateral | 20,281 | 17,646 | 20,088 | 22,243 | 27,038 |
| Current income tax assets | 2,254 | 2,290 | 5,819 | 1,819 | 1 |
| Investments in equity instruments | 2,217 | 2,364 | 2,562 | 3,045 | 3,852 |
| Investments in subsidiaries and associates | 2,051 | 2,153 | 2,471 | 2,118 | 2,177 |
| Property and equipment | 50,921 | 49,117 | 49,653 | 50,300 | 50,970 |
| Intangible assets | 3,676 | 3,150 | 2,859 | 2,549 | 2,345 |
| Deferred income tax assets | 876 | 735 | 784 | 5,593 | 8,005 |
| Other non-financial assets | 8,802 | 8,377 | 8,998 | 12,027 | 13,471 |
| Non-current assets held for sale | 302 | 341 | 341 | 341 | 341 |
| Total Assets | 1,030,194 | 1,007,547 | 1,041,079 | 991,484 | 1,038,429 |
| Liabilities | |||||
| Deposits | 708,336 | 695,180 | 733,626 | 678,611 | 721,839 |
| Non-financial public sector | 13,274 | 11,247 | 8,577 | 8,795 | 8,496 |
| Financial sector | 217 | 226 | 525 | 239 | 1,301 |
| Non-financial private sector and residents abroad | 694,844 | 683,707 | 724,524 | 669,576 | 712,042 |
| Liabilities at fair value through profit or loss | - | 52 | - | - | - |
| Derivatives | 314 | 387 | 171 | 533 | 285 |
| Other financial liabilities | 61,592 | 60,079 | 56,478 | 60,018 | 59,209 |
| Financing received from the B.C.R.A. and other financial institutions | 11,758 | 11,974 | 11,701 | 13,060 | 14,530 |
| Corporate bonds issued | 503 | 502 | 1,049 | 1,366 | 1,764 |
| Current income tax liabilities | 354 | 215 | 98 | 2,123 | 5,618 |
| Provisions | 5,613 | 5,813 | 7,632 | 13,986 | 17,320 |
| Deferred income tax liabilities | 8,209 | 5,429 | 4,132 | 98 | 59 |
| Other non-financial liabilities | 70,903 | 64,360 | 66,126 | 61,456 | 61,196 |
| Total Liabilities | 867,582 | 843,991 | 881,013 | 831,251 | 881,820 |
| Equity | |||||
| Share Capital | 613 | 613 | 613 | 613 | 613 |
| Non-capitalized contributions | 39,828 | 39,828 | 39,828 | 39,828 | 39,828 |
| Capital adjustments | 28,448 | 28,448 | 28,448 | 28,448 | 28,448 |
| Reserves | 70,149 | 76,899 | 76,899 | 130,311 | 130,311 |
| Retained earnings | (1,513) | (1,513) | (1,513) | (45,937) | (62,604) |
| Other accumulated comprehensive income | 697 | (341) | (98) | (223) | 118 |
| Income for the period | 21,183 | 16,440 | 12,716 | 4,021 | 16,668 |
| Equity attributable to owners of the Parent | 159,406 | 160,374 | 156,893 | 157,061 | 153,382 |
| Equity attributable to non-controlling interests | 3,206 | 3,182 | 3,173 | 3,172 | 3,227 |
| Total Equity | 162,612 | 163,556 | 160,066 | 160,233 | 156,609 |
| Total Liabilities and Equity | 1,030,194 | 1,007,547 | 1,041,079 | 991,484 | 1,038,429 |
| |
Balance Sheet – Foreign Currency Exposure
| Foreign Currency Exposure | BBVA ARG Consolidated | Chg (%) | |||
| In millions of AR$ - Inflation adjusted | 4Q21 | 3Q21 | 4Q20 | QoQ | YoY |
| Assets | |||||
| Cash and deposits in banks | 149,812 | 166,785 | 173,514 | (10.2%) | (13.7%) |
| Debt securities at fair value through profit or loss | - | 1 | 1 | (100.0%) | (100.0%) |
| Other financial assets | 2,888 | 3,504 | 3,342 | (17.6%) | (13.6%) |
| Loans and other financing | 19,034 | 27,538 | 42,155 | (30.9%) | (54.8%) |
| Other financial institutions | 168 | 175 | 624 | (3.6%) | (73.0%) |
| Non-financial private sector and residents abroad | 18,866 | 27,364 | 41,531 | (31.1%) | (54.6%) |
| Other debt securities | 2,149 | 260 | - | n.m | N/A |
| Financial assets pledged as collateral | 5,624 | 5,811 | 7,119 | (3.2%) | (21.0%) |
| Investments in equity instruments | 36 | 40 | 43 | (10.3%) | (16.6%) |
| Total foreign currency assets | 179,543 | 203,939 | 226,174 | (12.0%) | (20.6%) |
| Liabilities | - | - | |||
| Deposits | 166,232 | 186,766 | 207,457 | (11.0%) | (19.9%) |
| Non-Financial Public Sector | 3,212 | 4,399 | 3,489 | (27.0%) | (7.9%) |
| Financial Sector | 35 | 57 | 77 | (38.7%) | (54.7%) |
| Non-financial private sector and residents abroad | 162,984 | 182,311 | 203,891 | (10.6%) | (20.1%) |
| Other financial liabilities | 10,275 | 11,703 | 15,677 | (12.2%) | (34.5%) |
| Financing received from the B.C.R.A. and other financial institutions | 509 | 3,928 | 3,412 | (87.0%) | (85.1%) |
| Other non financial liabilities | 4,323 | 2,563 | 1,725 | 68.7% | 150.6% |
| Total foreign currency liabilities | 181,338 | 204,960 | 228,271 | (11.5%) | (20.6%) |
| Foreign Currency Net Position - AR$ | (1,795) | (1,021) | (2,097) | (75.9%) | 14.4% |
| Foreign Currency Net Position - USD | (17) | (10) | (25) | (69.0%) | 29.9% |
| *Wholesale U.S. dollar foreign exchange rates on BCRA’s Communication “A” 3500, as of the end of period. | |||||
Income Statement
| Income Statement | BBVA ARG Consolidated | Chg (%) | |||
| In millions of AR$ - Inflation adjusted | 4Q21 | 3Q21 | 4Q20 | QoQ | YoY |
| Interest income | 55,904 | 57,353 | 48,336 | (2.5%) | 15.7% |
| Interest expense | (22,322) | (25,162) | (18,861) | 11.3% | (18.4%) |
| Net interest income | 33,582 | 32,191 | 29,475 | 4.3% | 13.9% |
| Fee income | 11,570 | 11,389 | 11,367 | 1.6% | 1.8% |
| Fee expenses | (5,742) | (4,570) | (7,140) | (25.6%) | 19.6% |
| Net fee income | 5,828 | 6,819 | 4,227 | (14.5%) | 37.9% |
| Net income from financial instruments at fair value through P&L | (226) | 943 | 6,270 | (124.0%) | (103.6%) |
| Net loss from write-down of assets at amortized cost and fair value through OCI | (18) | (41) | (221) | 56.1% | 91.9% |
| Foreign exchange and gold gains | 1,630 | 1,291 | 1,620 | 26.3% | 0.6% |
| Other operating income | 2,098 | 1,745 | 2,909 | 20.2% | (27.9%) |
| Loan loss allowances | (444) | (2,706) | (5,549) | 83.6% | 92.0% |
| Net operating income | 42,450 | 40,242 | 38,731 | 5.5% | 9.6% |
| Personnel benefits | (7,715) | (8,135) | (7,332) | 5.2% | (5.2%) |
| Administrative expenses | (8,528) | (9,700) | (7,306) | 12.1% | (16.7%) |
| Depreciation and amortization | (1,404) | (1,317) | (1,637) | (6.6%) | 14.2% |
| Other operating expenses | (7,326) | (6,463) | (9,184) | (13.4%) | 20.2% |
| Operating expenses | (24,973) | (25,615) | (25,459) | 2.5% | 1.9% |
| Operating income | 17,477 | 14,627 | 13,272 | 19.5% | 31.7% |
| Income from associates and joint ventures | (115) | (98) | 36 | (17.3%) | (419.4%) |
| Income from net monetary position | (10,227) | (9,131) | (10,314) | (12.0%) | 0.8% |
| Income before income tax | 7,135 | 5,398 | 2,994 | 32.2% | 138.3% |
| Income tax | (2,367) | (1,666) | (2,564) | (42.1%) | 7.7% |
| Income for the period | 4,768 | 3,732 | 430 | 27.8% | n.m |
| Owners of the parent | 4,743 | 3,725 | 587 | 27.3% | n.m |
| Non-controlling interests | 25 | 8 | (157) | 212.5% | 115.9% |
| - | |||||
| Other comprehensive Income (1) | 1,039 | (244) | (402) | n.m | 358.2% |
| Total comprehensive income | 5,807 | 3,489 | 28 | 66.4% | n.m |
| (1) Net of Income Tax. | |||||
| |
Income Statement – 5 Quarters
| Income Statement | BBVA ARG Consolidated | ||||
| In millions of AR$ - Inflation adjusted | 4Q21 | 3Q21 | 2Q21 | 1Q21 | 4Q20 |
| Interest income | 55,904 | 57,353 | 52,596 | 49,050 | 48,336 |
| Interest expense | (22,322) | (25,162) | (23,320) | (20,257) | (18,861) |
| Net interest income | 33,582 | 32,191 | 29,275 | 28,794 | 29,475 |
| Fee income | 11,570 | 11,389 | 11,486 | 10,259 | 11,367 |
| Fee expenses | (5,742) | (4,570) | (4,947) | (5,777) | (7,140) |
| Net fee income | 5,828 | 6,819 | 6,539 | 4,482 | 4,227 |
| Net income from financial instruments at fair value through P&L | (226) | 943 | 1,508 | 2,139 | 6,270 |
| Net loss from write-down of assets at amortized cost and fair value through OCI | (18) | (41) | (20) | (44) | (221) |
| Foreign exchange and gold gains | 1,630 | 1,291 | 1,423 | 1,197 | 1,620 |
| Other operating income | 2,098 | 1,745 | 2,182 | 2,066 | 2,909 |
| Loan loss allowances | (444) | (2,706) | (2,560) | (2,557) | (5,549) |
| Net operating income | 42,450 | 40,242 | 38,347 | 36,077 | 38,731 |
| Personnel benefits | (7,715) | (8,135) | (7,659) | (7,804) | (7,332) |
| Administrative expenses | (8,528) | (9,700) | (7,080) | (7,125) | (7,306) |
| Depreciation and amortization | (1,404) | (1,317) | (1,432) | (1,428) | (1,637) |
| Other operating expenses | (7,326) | (6,463) | (6,700) | (6,210) | (9,184) |
| Operating expenses | (24,973) | (25,615) | (22,871) | (22,567) | (25,459) |
| Operating income | 17,477 | 14,627 | 15,476 | 13,510 | 13,272 |
| Income from associates and joint ventures | (115) | (98) | 209 | (39) | 36 |
| Income from net monetary position | (10,227) | (9,131) | (10,520) | (10,090) | (10,314) |
| Income before income tax | 7,135 | 5,398 | 5,165 | 3,381 | 2,994 |
| Income tax | (2,367) | (1,666) | 3,530 | 584 | (2,564) |
| Income for the period | 4,768 | 3,732 | 8,695 | 3,965 | 430 |
| Owners of the parent | 4,743 | 3,725 | 8,694 | 4,020 | 587 |
| Non-controlling interests | 25 | 8 | 2 | (55) | (157) |
| Other comprehensive Income (OCI)(1) | 1,039 | (244) | 90 | (307) | (402) |
| Total comprehensive income | 5,807 | 3,489 | 8,787 | 3,659 | 28 |
| (1) Net of Income Tax. | |||||
Ratios
| Quarterly Annualized Ratios | BBVA ARG Consolidated | Chg (%) | |||
| In % | 4Q21 | 3Q21 | 4Q20 | QoQ | YoY |
| Profitability | |||||
| Efficiency Ratio | 67.3% | 69.0% | 44.0% | (167)bps | 2,324 bps |
| Efficiency Ratio (excl. Inflation adjustments) | 48.4% | 51.9% | 34.4% | (351)bps | 1,394 bps |
| ROA | 1.8% | 1.4% | 0.2% | 40 bps | 162 bps |
| ROE | 11.8% | 9.3% | 1.5% | 245 bps | 1,028 bps |
| Liquidity | |||||
| Liquid assets / Total Deposits | 76.4% | 76.9% | 67.4% | (57)bps | 892 bps |
| Capital | |||||
| Regulatory Capital Ratio | 20.8% | 23.5% | 20.2% | (272)bps | 59 bps |
| TIER I Capital Ratio (Ordinary Capital Level 1/ RWA) | 20.3% | 22.9% | 19.6% | (266)bps | 69 bps |
| Asset Quality | |||||
| Total non-performing portfolio / Total portfolio | 1.87% | 2.54% | 1.40% | (67)bps | 47 bps |
| Allowances /Total non-performing portfolio | 181.89% | 181.75% | 311.95% | 14 bps | (13,006)bps |
| Cost of Risk | 0.46% | 2.80% | 4.99% | (234)bps | (454)bps |
| |
| Accumulated Annualized Ratios | BBVA ARG Consolidated | Chg (%) | |||
| In % | 4Q21 | 3Q21 | 4Q20 | QoQ | YoY |
| Profitability | |||||
| Efficiency Ratio | 69.1% | 69.7% | 56.8% | (63)bps | 1,224 bps |
| Efficiency Ratio (excl. Inflation adjustments) | 49.4% | 49.7% | 45.1% | (35)bps | 425 bps |
| ROA | 2.0% | 2.1% | 1.7% | (10)bps | 36 bps |
| ROE | 13.5% | 14.0% | 10.9% | (47)bps | 268 bps |
| Liquidity | |||||
| Liquid assets / Total Deposits | 76.4% | 76.9% | 67.4% | (57)bps | 892 bps |
| Capital | |||||
| Regulatory Capital Ratio | 20.8% | 23.5% | 20.2% | (272)bps | 59 bps |
| TIER I Capital Ratio (Ordinary Capital Level 1/ RWA) | 20.3% | 22.9% | 19.6% | (266)bps | 69 bps |
| Asset Quality | |||||
| Total non-performing portfolio / Total portfolio | 1.87% | 2.54% | 1.40% | (67)bps | 47 bps |
| Allowances /Total non-performing portfolio | 181.89% | 181.75% | 311.95% | 14 bps | (13,006)bps |
| Cost of Risk | 0.46% | 2.80% | 4.99% | (234)bps | (454)bps |
About BBVA Argentina
BBVA Argentina (NYSE; BYMA; MAE: BBAR; LATIBEX: XBBAR) is a subsidiary of the BBVA Group, the main shareholder since 1996. In Argentina, it is one of the leading private financial institutions since 1886. Nationwide, BBVA Argentina offers retail and corporate banking to a broad customer base, including: individuals, SME’s, and large-sized companies.
BBVA Argentina’s purpose is to bring the age of opportunities to everyone, based on our customers’ real needs, providing the best solutions, and helping them make the best financial decisions through an easy and convenient experience. The institution relies on solid values: “The customer comes first, We think big and We are one team”. At the same time, its responsible banking model aspires to achieve a more inclusive and sustainable society.
Investor Relations Contact
Ernesto Gallardo
Chief Financial Officer
Inés Lanusse
Investor Relations Officer
Belén Fourcade
Investor Relations
investorelations-arg@bbva.com
ir.bbva.com.ar
SIGNATURES
Pursuant to the requirements of the Securities Exchange Act of 1934, the registrant has duly caused this report to be signed on its behalf by the undersigned, thereunto duly authorized.
| Banco BBVA Argentina S.A. | |||||
| Date: | March 3, 2022 | By: | /s/ Ernesto Gallardo Jimenez | ||
| Name: | Ernesto Gallardo Jimenez | ||||
| Title: | Chief Financial Officer | ||||