FORM 6-K
SECURITIES AND EXCHANGE COMMISSION
Washington, D.C. 20549
Report of Foreign Issuer
Pursuant to Rule 13a-16 or 15d-16
of the Securities Exchange Act of 1934
For the month of May 2022
Commission File Number: 001-12568
BBVA Argentina Bank S.A.
(Translation of registrant’s name into English)
111 Córdoba Av, C1054AAA
Buenos Aires, Argentina
(Address of principal executive offices)
Indicate by check mark whether the registrant files or will file annual reports under cover of Form 20-F or Form 40-F:
| Form 20-F | X | Form 40-F |
Indicate by check mark if the registrant is submitting the Form 6-K in paper as permitted by Regulation S-T Rule 101(b)(1):
| Yes | No | X |
Indicate by check mark if the registrant is submitting the Form 6-K in paper as permitted by Regulation S-T Rule 101(b)(7):
| Yes | No | X |
Indicate by check mark whether by furnishing the information contained in this Form, the Registrant is also thereby furnishing the information to the Commission pursuant to Rule 12g3-2(b) under the Securities Exchange Act of 1934:
| Yes | No | X |
If “Yes” is marked, indicate below the file number assigned to the registrant in connection with Rule 12g3-2(b): N/A
Banco BBVA Argentina S.A.
TABLE OF CONTENTS
Item | |
| 1. | Banco BBVA Argentina S.A. reports consolidated first quarter earnings for fiscal year 2022. |


 |
Banco BBVA Argentina S.A. announces First Quarter 2022 results
Buenos Aires, May 19, 2022 – Banco BBVA Argentina S.A (NYSE; BYMA; MAE: BBAR; LATIBEX: XBBAR) (“BBVA Argentina” or “BBVA” or “the Bank”) announced today its consolidated results for the first quarter (1Q22), ended on March 31, 2022.
As of January 1, 2020, the Bank started to inform its inflation adjusted results pursuant to IAS 29 reporting. To facilitate comparison, figures of comparable quarters of 2021 and 2022 have been updated according to IAS 29 reporting to reflect the accumulated effect of inflation adjustment for each period up to March 31, 2022.
1Q22 Highlights
| · | BBVA Argentina’s inflation adjusted net income in 1Q22 was $4.0 billion, 27.1% lower than the $5.5 billion reported on the fourth quarter of 2021 (4Q21), and 12.3% lower than the $4.6 billion reported on the first quarter of 2021 (1Q21). |
| · | In 1Q22, BBVA Argentina posted an inflation adjusted average return on assets (ROAA) of 1.4% and an inflation adjusted average return on equity (ROAE) of 9.0%. |
| · | In terms of activity, total consolidated financing to the private sector in 1Q22 totaled $413.2 billion, decreasing 8.4% in real terms compared to 4Q21, and 10.3% compared to 1Q21. In the quarter, the decrease was mainly driven by a fall in credit cards and discounted instruments by 9.3%, and 17.8% respectively. BBVA’s consolidated market share of private sector loans reached 7.89% as of 1Q22. |
| · | Total consolidated deposits in 1Q22 totaled $797.3 billion, decreasing 3.0% in real terms during the quarter, and increasing 1.2% in the year. Quarterly decrease was mainly explained by sight deposits, which fell 9.6%. The Bank’s consolidated market share of private deposits reached 7.12% as of 1Q22. |
| · | As of 1Q22, the non-performing loan ratio (NPL) reached 1.29%, with a 219.75% coverage ratio. |
| · | The accumulated efficiency ratio in 1Q22 was 72.2%, above 4Q21’s 69.1%, and slightly below 1Q21’s 72.5%. |
| · | As of 1Q22, BBVA Argentina reached a regulatory capital ratio of 23.5%, entailing a $110.1 billion or 188.2% excess over minimum regulatory requirement. Tier I ratio was 23.3%. |
| · | Total liquid assets represented 79.6% of the Bank’s total deposits as of 1Q22. |
Message from the CFO
“The COVID-19 pandemic situation continued to improve through the first quarter of 2022, despite the Omicron variant which took place during January. This has allowed the continuity of the economic recovery, although within a challenging context of sustained high inflation and a capped foreign exchange rate, in spite of the agreement settled with the International Monetary Fund (March 2022).
| 1 |
| |
BBVA Research, as of the date of this report, estimates that after a 10.3% growth in 2021, GDP growth in Argentina could be around 3.5% by the end of 2022, and forecasts a moderation in growth of up to 2.0% in 2023. The financial system continues to operate in a persistently high inflation context. Inflation rate in 1Q22 reached 16.1% compared to 10.2% in 4Q21. Year over year inflation in March 2022 reached 55.1%. In this scenario, chances are inflation will remain high.
Regarding BBVA Argentina, operating income in 1Q22 is a consequence of an improvement in interest income, income from the sale of the Bank’s participation in Prisma Medios de Pago S.A., and lower administrative expenses.
As of March 2022, BBVA Argentina reached an NPL for private loans of 1.29%, quite below the system which was at 4.2% according to the last information available (February 2022). Concerning liquidity and solvency indicators, the Bank ends the quarter with 79.6% and 23.5% respectively, levels which undoubtedly allow to address business growth in the case of an economic recovery.
It is worth mentioning that the Shareholders’ Meeting on April 29, 2022, approved the payment of dividends to non-resident shareholders in securities, with the option of opting out and informing their decision to receive them in Argentine pesos. The Bank has requested the authorization for the payment of $13.2 billion, in line with BCRA requirements. It also delegated on the Board of directors the power to determine the conditions of payment of dividends to shareholders, according to Central Bank’s prior authorization.
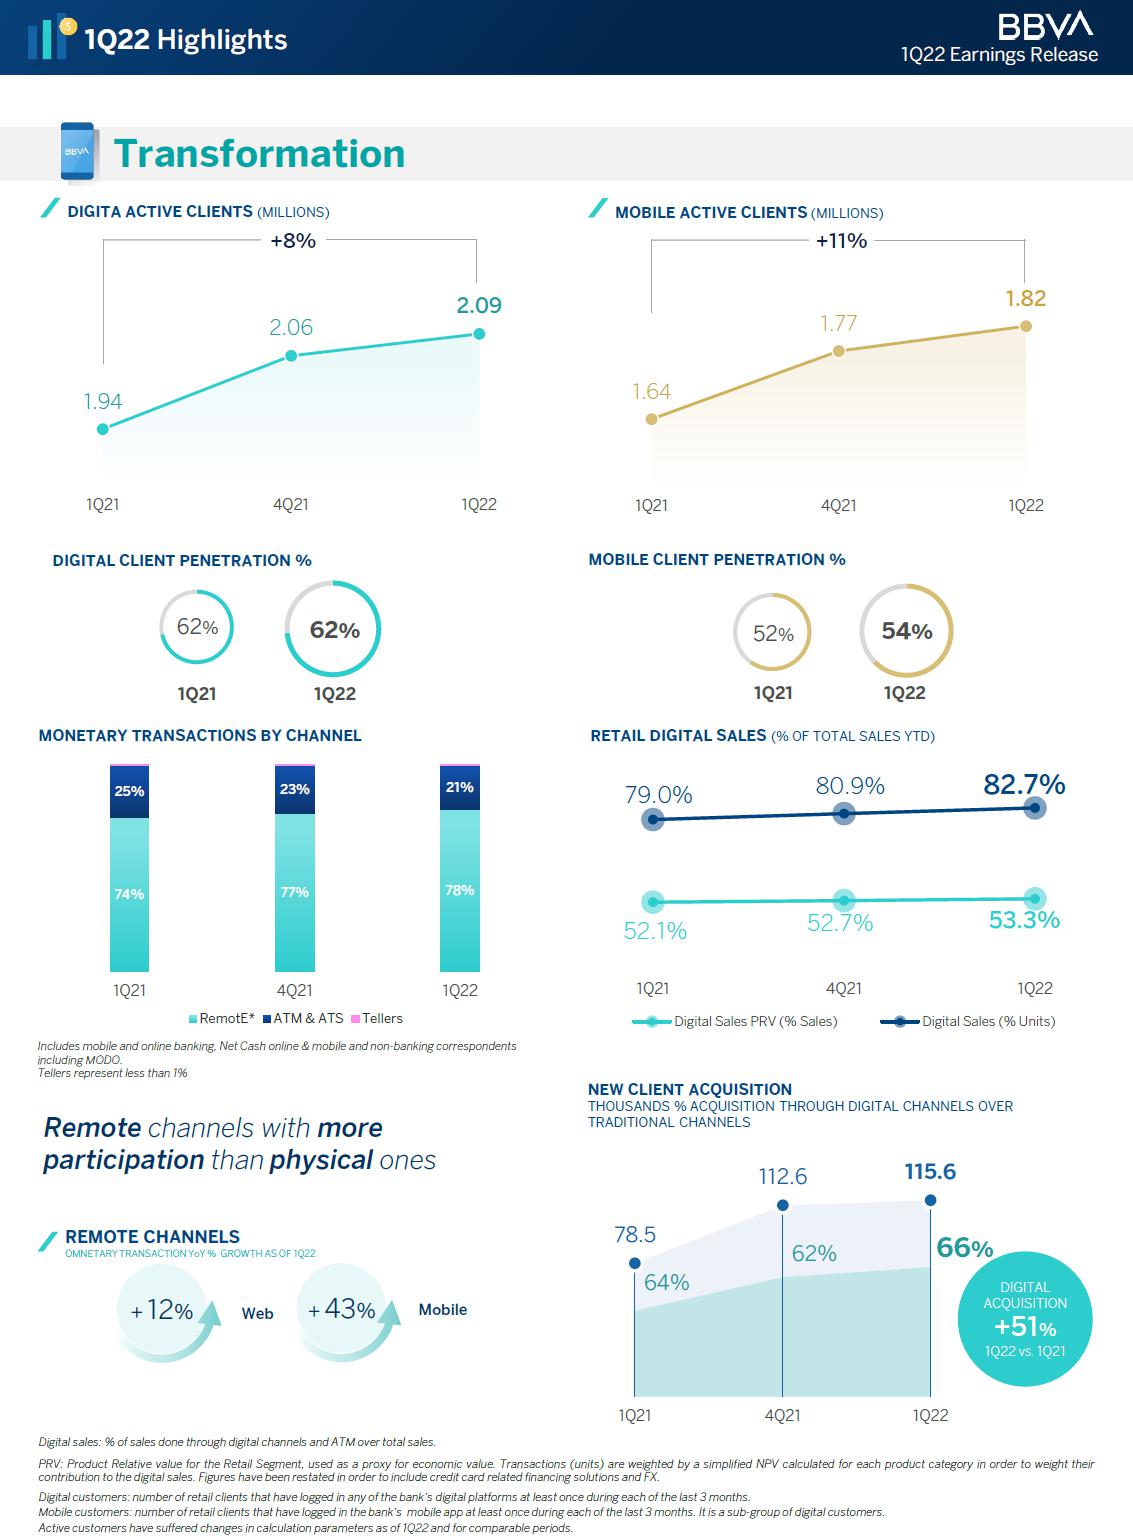
With respect to digitalization, our service offering has evolved in such way that by the end of March 2022, digital client penetration reached 62% keeping stable versus a year back, while that of mobile clients reached 54% from 52% in the same period. The response on the side of customers has been satisfactory, and we are convinced this is the path to pursue, in the aim of sustaining and expanding our competitive position in the financial system. In the quarter, new client acquisition through digital channels over traditional ones was 66%, while in 1Q21 it was 64%.
It should be noted that the Bank finally implemented its new benefit program “Puntos BBVA” on February 2022, thought to provide customers with exclusive benefits in experiences and tourism, in alliance with Despegar.
BBVA Argentina has a corporate responsibility with society, inherent to the Bank’s business model, which bolsters inclusion, financial education and supports scientific research and culture. The Bank works with the highest integrity, long-term vision and best practices, and is present through the BBVA Group in the main sustainability indexes.
Lastly, the Bank actively monitors its business, financial conditions and operating results, in the aim of keeping a competitive position to face contextual challenges.”
Ernesto R. Gallardo, CFO at BBVA Argentina
1Q22 Conference Call
Friday, May 20 - 12:00 p.m. Buenos Aires time (11:00 a.m. EST)
To participate, please dial-in:
+ 54-11-3984-5677 (Argentina)
+ 1-844-450-3851 (United States)
+ 1-412-317-6373 (International)
Web Phone: click here
Conference ID: BBVA
Webcast & Replay: click here
| 2 |
| |
Safe Harbor Statement
This press release contains certain forward-looking statements that reflect the current views and/or expectations of Banco BBVA Argentina and its management with respect to its performance, business and future events. We use words such as “believe,” “anticipate,” “plan,” “expect,” “intend,” “target,” “estimate,” “project,” “predict,” “forecast,” “guideline,” “seek,” “future,” “should” and other similar expressions to identify forward-looking statements, but they are not the only way we identify such statements. Such statements are subject to a number of risks, uncertainties and assumptions. We caution you that a number of important factors could cause actual results to differ materially from the plans, objectives, expectations, estimates and intentions expressed in this release. Actual results, performance or events may differ materially from those in such statements due to, without limitation, (i) changes in general economic, financial, business, political, legal, social or other conditions in Argentina or elsewhere in Latin America or changes in either developed or emerging markets, (ii) changes in regional, national and international business and economic conditions, including inflation, (iii) changes in interest rates and the cost of deposits, which may, among other things, affect margins, (iv) unanticipated increases in financing or other costs or the inability to obtain additional debt or equity financing on attractive terms, which may limit our ability to fund existing operations and to finance new activities, (v) changes in government regulation, including tax and banking regulations, (vi) changes in the policies of Argentine authorities, (vii) adverse legal or regulatory disputes or proceedings, (viii) competition in banking and financial services, (ix) changes in the financial condition, creditworthiness or solvency of the customers, debtors or counterparties of Banco BBVA Argentina, (x) increase in the allowances for loan losses, (xi) technological changes or an inability to implement new technologies, (xii) changes in consumer spending and saving habits, (xiii) the ability to implement our business strategy and (xiv) fluctuations in the exchange rate of the Peso. The matters discussed herein may also be affected by risks and uncertainties described from time to time in Banco BBVA Argentina’s filings with the U.S. Securities and Exchange Commission (SEC) and Comisión Nacional de Valores (CNV). Readers are cautioned not to place undue reliance on forward-looking statements, which speak only as the date of this document. Banco BBVA Argentina is under no obligation and expressly disclaims any intention or obligation to update or revise any forward-looking statements, whether as a result of new information, future events or otherwise.
Information
This earnings release has been prepared in accordance with the accounting framework established by the Central Bank of Argentina (“BCRA”), based on International Financial Reporting Standards (“I.F.R.S.”) and the resolutions adopted by the International Accounting Standards Board (“I.A.S.B”) and by the Federación Argentina de Consejos Profesionales de Ciencias Económicas (“F.A.C.P.E.”), with the exception of the exclusion of the application of the IFRS 9 impairment model for non-financial public sector debt instruments.
As of January 1, 2020, the Bank started to inform its inflation adjusted results pursuant to IAS 29 reporting. To facilitate comparison, figures of comparable quarters of 2020, 2021 and 2022 have been updated according to IAS 29 reporting to reflect the accumulated effect of inflation adjustment for each period up to March 31, 2022.
The information in this press release contains unaudited financial information that consolidates, line item by line item, all of the banking activities of BBVA Argentina, including: BBVA Asset Management Argentina S.A., Consolidar AFJP-undergoing liquidation proceeding, PSA Finance Argentina Compañía Financiera S.A. (“PSA”) and Volkswagen Financial Services Compañía Financiera S.A (“VWFS”).
BBVA Consolidar Seguros S.A. is disclosed on a consolidated basis recorded as Investments in associates (reported under the proportional consolidation method), and the corresponding results are reported as “Income from associates”), same as Rombo Compañía Financiera S.A. (“Rombo”), Play Digital S.A., Openpay Argentina S.A. and Interbanking S.A.
Financial statements of subsidiaries have been elaborated as of the same dates and periods as Banco BBVA Argentina S.A.’s. In the case of consolidated companies PSA and VWFS, financial statements were prepared considering the B.C.R.A. accounting framework for institutions belonging to “Group C”, considering the model established by the IFRS 9 5.5. “Impairment” section for periods starting as of January 1, 2022.
The information published by the BBVA Group for Argentina is prepared according to IFRS, without considering the temporary exceptions established by BCRA.
| 3 |
| |
Quarterly Results
| INCOME STATEMENT | BBVA ARGENTINA CONSOLIDATED | ||||
| In millions of AR$ - Inflation adjusted | ∆ % | ||||
| 1Q22 | 4Q21 | 1Q21 | QoQ | YoY | |
| Net Interest Income | 39,229 | 38,978 | 33,422 | 0.6% | 17.4% |
| Net Fee Income | 6,634 | 6,765 | 5,204 | (1.9%) | 27.5% |
| Net income from measurement of financial instruments at fair value through P&L | 4,086 | (262) | 2,482 | n.m | 64.6% |
| Net income from write-down of assets at amortized cost and at fair value through OCI | (34) | (21) | (51) | (61.9%) | 33.3% |
| Foreign exchange and gold gains | 1,712 | 1,892 | 1,389 | (9.5%) | 23.3% |
| Other operating income | 3,373 | 2,435 | 2,399 | 38.5% | 40.6% |
| Loan loss allowances | (2,269) | (515) | (2,968) | (340.6%) | 23.6% |
| Net operating income | 52,731 | 49,272 | 41,877 | 7.0% | 25.9% |
| Personnel benefits | (9,065) | (8,955) | (9,059) | (1.2%) | (0.1%) |
| Adminsitrative expenses | (9,515) | (9,898) | (8,270) | 3.9% | (15.1%) |
| Depreciation and amortization | (1,634) | (1,630) | (1,657) | (0.2%) | 1.4% |
| Other operating expenses | (7,754) | (8,503) | (7,209) | 8.8% | (7.6%) |
| Operarting expenses | (27,968) | (28,986) | (26,195) | 3.5% | (6.8%) |
| Operating income | 24,763 | 20,286 | 15,682 | 22.1% | 57.9% |
| Income from associates | (267) | (133) | (46) | (100.8%) | (480.4%) |
| Income from net monetary position | (18,729) | (11,870) | (11,711) | (57.8%) | (59.9%) |
| Net income before income tax | 5,767 | 8,283 | 3,925 | (30.4%) | 46.9% |
| Income tax | (1,733) | (2,747) | 677 | 36.9% | (356.0%) |
| Net income for the period | 4,034 | 5,536 | 4,602 | (27.1%) | (12.3%) |
| Owners of the parent | 4,187 | 5,505 | 4,667 | (23.9%) | (10.3%) |
| Non-controlling interests | (153) | 29 | (65) | n.m | (135.4%) |
| Other comprehensive Income (OCI) (1) | 1,324 | 1,206 | (288) | 9.8% | n.m |
| Total comprehensive income | 5,358 | 6,742 | 4,314 | (20.5%) | 24.2% |
BBVA Argentina 1Q22 net income was $4.0 billion, falling 27.1% or $1.5 billion quarter-over-quarter (QoQ) and 12.3% or $568 million year-over-year (YoY). This implied a quarterly ROAE of 9.0% and a quarterly ROAA of 1.4%.
Quarterly operating results are mainly explained by (i) greater interest income, (ii) higher income from measurement of financial instruments at fair value through P&L and in other operating income related to the sale of the remaining participation (49%) of the Bank in Prisma Medios de Pago S.A., and (iii) lower operating expenses.
These effects were offset by an increase in loan loss allowances, which returned to average values considering the particularly positive impacts that took place on 4Q21.
The improvement in net income from measurement of financial instruments at FV through P&L and in other operating income was mainly explained by the result of the sale of the 49% remaining position of the Bank in Prisma, which generated a total benefit before taxes of $3.5 billion. A marginal effect is also seen in the line foreign exchange and gold gains.
| 4 |
| |
Net income for the period is negatively affected by a higher income from net monetary position, given that the quarterly inflation for 1Q22 was 16.1%[1] compared to 10.2% the previous quarter.
Excluding the effect of the sale of Prisma, net income in 1Q22 would have been $1.9 billion, 66.0% lower than 4Q21 and 59.1% lower than 1Q21. This would have implied a quarterly ROAE of 4.4% and ROAA of 0.7%.
| EARNINGS PER SHARE | BBVA ARGENTINA CONSOLIDATED | ||||
| ∆ % | |||||
| 1Q22 | 4Q21 | 1Q21 | QoQ | YoY | |
| Financial Statement information | |||||
| Net income for the period attributable to owners of the parent (in AR$ millions, inflation adjusted) | 4,187 | 5,505 | 4,667 | (23.9%) | (10.3%) |
| Total shares outstanding (1) | 612,710 | 612,710 | 612,710 | - | - |
| Market information | |||||
| Closing price of ordinary share at BYMA (in AR$) | 225.0 | 224.3 | 130.0 | 0.3% | 73.1% |
| Closing price of ADS at NYSE (in USD) | 3.5 | 3.2 | 2.7 | 12.4% | 29.7% |
| Book value per share (in AR$) | 316.87 | 308.05 | 303.54 | 2.9% | 4.4% |
| Price-to-book ratio (BYMA price) (%) | 0.71 | 0.73 | 0.43 | (2.5%) | 65.8% |
| Earnings per share (in AR$) | 6.83 | 8.98 | 7.62 | (23.9%) | (10.3%) |
| Earnings per ADS(2) (in AR$) | 20.50 | 26.95 | 22.85 | (23.9%) | (10.3%) |
| (1) In thousands of shares. | |||||
| (2) Each ADS accounts for 3 ordinary shares | |||||
1 Source: Instituto Nacional de Estadística y Censos (INDEC) – Consumer Price Index change between December 2021 and March 2022.
| 5 |
| |
Net Interest Income
| NET INTEREST INCOME | BBVA ARGENTINA CONSOLIDATED | ||||
| In millions of AR$ - Inflation adjusted | ∆ % | ||||
| 1Q22 | 4Q21 | 1Q21 | QoQ | YoY | |
| Net Interest Income | 39,229 | 38,979 | 33,422 | 0.6% | 17.4% |
| Interest Income | 69,020 | 64,888 | 56,932 | 6.4% | 21.2% |
| From government securities | 24,185 | 15,385 | 15,155 | 57.2% | 59.6% |
| From private securities | 95 | 70 | 36 | 35.7% | 163.9% |
| Interest from loans and other financing | 27,161 | 26,934 | 27,479 | 0.8% | (1.2%) |
| Financial Sector | 356 | 497 | 225 | (28.4%) | 58.2% |
| Overdrafts | 2,380 | 2,516 | 2,771 | (5.4%) | (14.1%) |
| Discounted Instruments | 4,538 | 4,743 | 4,245 | (4.3%) | 6.9% |
| Mortgage loans | 422 | 461 | 491 | (8.5%) | (14.1%) |
| Pledge loans | 1,479 | 1,619 | 1,570 | (8.6%) | (5.8%) |
| Consumer Loans | 4,399 | 4,348 | 4,000 | 1.2% | 10.0% |
| Credit Cards | 8,064 | 7,555 | 8,235 | 6.7% | (2.1%) |
| Financial leases | 257 | 273 | 267 | (5.9%) | (3.7%) |
| Loans for the prefinancing and financing of exports | 129 | 217 | 307 | (40.6%) | (58.0%) |
| Other loans | 5,137 | 4,705 | 5,368 | 9.2% | (4.3%) |
| Premiums on reverse REPO transactions | 7,410 | 12,531 | 4,836 | (40.9%) | 53.2% |
| CER/UVA clause adjustment | 10,082 | 8,935 | 9,423 | 12.8% | 7.0% |
| Other interest income | 87 | 1,033 | 3 | (91.6%) | n.m |
| Interest expenses | 29,791 | 25,909 | 23,510 | 15.0% | 26.7% |
| Deposits | 27,114 | 23,422 | 21,600 | 15.8% | 25.5% |
| Checking accounts | 5,207 | 3,421 | 2,838 | 52.2% | 83.5% |
| Savings accounts | 157 | 147 | 149 | 6.8% | 5.4% |
| Time deposits and Investment accounts | 21,750 | 19,854 | 18,613 | 9.5% | 16.9% |
| Other liabilities from financial transactions | 103 | 156 | 291 | (34.0%) | (64.6%) |
| Interfinancial loans received | 880 | 1,040 | 744 | (15.4%) | 18.3% |
| Premiums on REPO transactions | 2 | 1 | - | 100.0% | N/A |
| CER/UVA clause adjustment | 1,692 | 1,290 | 875 | 31.2% | 93.4% |
Net interest income for 1Q22 was $39.2 billion, increasing 0.6% or $250 million QoQ, and 17.4% or $5.8 billion YoY. In 1Q22, interest income increased more than interest expense, mainly due to (i) higher income from government securities and, (ii) increases in income from CER/UVA clause adjustments. Items (i) and (ii) take place in a context of increasing interest rates, derived from sequential increases in the monetary policy rate by the BCRA[2], an increase in the inflation rate as mentioned before, and a change in regulation which allowed financial institutions to increase their BCRA liquidity bills (LELIQ) position.
In 1Q22, interest income totaled $69.0 billion, increasing 6.4% compared to 4Q21 and 21.1% compared to 1Q21. Quarterly increase is mainly driven by higher income from government securities, especially LELIQ, and an increase in CER/UVA clause adjustments (mostly on income from government securities linked to such indexes). Income from credit cards also stands out although to a lower extent. All this was offset by lower income on premiums on reverse REPO transactions (seven-day REPOs), considering such instruments were gradually removed from the market by the Central Bank.
2 For further details on changes in the monetary policy rate please refer to the Main Regulatory Changes section at the end of the document.
| 6 |
| |
Income from government securities increased 57.2% compared to 4Q21, and 59.6% compared to 1Q21. This is partially due to the higher position in LELIQ, given the progressive removal of REPOs with the BCRA, added to the gradual increase of the monetary policy rate, which was at 38% (nominal annual terms) at the beginning of the quarter and ended at 44.5%. 93% of these results are explained by government securities at fair value through OCI, of which 76% are BCRA securities, and 5% are securities at amortized cost (2022 National Treasury Bonds at fixed rate, used for reserve requirement integration).
Interest income from loans and other financing totaled $27.2 billion, increasing 0.8% QoQ and falling 2.1% YoY. Quarterly growth is mainly due to an increase in credit cards by 6.7% and in other loans by 9.2%. This was partially offset by a fall in interests from discounted instruments by 4.3%.
Income from CER/UVA adjustments increased 12.8% QoQ and 7.0% YoY. Quarterly growth was driven by a higher yield of CER-linked securities, taking into consideration that quarterly inflation reached 16.1% versus 10.2% the previous quarter. 65% of income from interests from CER/UVA clause adjustments is explained by interests generated by bonds linked to such indexes.
Interest expenses totaled $29.8 billion, denoting a 15.0% increase QoQ and a 26.7% increase YoY. Quarterly increase is described by higher time deposit and checking account expenses, together with higher CER/UVA adjustment expenses, partially offset by lower expenses by interfinancial loans received by the Bank’s subsidiaries.
Interests from time deposits and investment accounts explain 73.0% of interest expenses, versus 76.6% the previous quarter. These increased 9.5% QoQ and grew 16.9% YoY.
NIM
As of 1Q22, net interest margin (NIM) was 19.2%, remaining stable compared to 4Q21. In 1Q22, NIM in pesos was 19.9% and 2.5% in U.S. dollars.
| ASSETS & LIABILITIES PERFORMANCE - TOTAL | BBVA ARGENTINA CONSOLIDATED | ||||||||
| In millions of AR$. Rates and spreads in annualized % | |||||||||
| 1Q22 | 4Q21 | 1Q21 | |||||||
| Average Balance | Interest Earned/Paid | Average Real Rate | Average Balance | Interest Earned/Paid | Average Real Rate | Average Balance | Interest Earned/Paid | Average Real Rate | |
| Total interest-earning assets | 826,912 | 69,020 | 33.9% | 805,965 | 64,888 | 31.9% | 705,203 | 56,932 | 32.7% |
| Debt securities | 409,617 | 38,275 | 37.9% | 365,879 | 33,530 | 36.4% | 262,823 | 24,783 | 38.2% |
| Loans to customers/financial institutions | 406,235 | 30,742 | 30.7% | 426,293 | 31,270 | 29.1% | 431,183 | 32,149 | 30.2% |
| Loans to the BCRA | - | 2 | - | 1 | - | 0.0% | - | - | - |
| Other assets | 11,060 | 1 | 0.0% | 13,792 | 88 | 2.5% | 11,197 | - | 0.0% |
| Total non interest-earning assets | 325,328 | - | 0.0% | 325,395 | - | 0.0% | 363,550 | - | 0.0% |
| Total Assets | 1,152,240 | 69,020 | 24.3% | 1,131,360 | 64,888 | 22.8% | 1,068,753 | 56,932 | 21.6% |
| Total interest-bearing liabilities | 600,889 | 29,791 | 20.1% | 568,123 | 25,909 | 18.1% | 553,489 | 23,510 | 17.2% |
| Sight deposits | 241,317 | 157 | 0.3% | 293,666 | 3,568 | 4.8% | 297,434 | 2,987 | 4.1% |
| Time deposits and investment accounts | 269,884 | 23,442 | 35.2% | 261,888 | 21,952 | 33.3% | 241,856 | 19,853 | 33.3% |
| Debt securities issued | 369 | 64 | 70.3% | 360 | 58 | 63.9% | 1,565 | 177 | 45.9% |
| Other liabilities | 89,319 | 6,128 | 27.8% | 12,209 | 331 | 10.8% | 12,634 | 493 | 15.8% |
| Total non-interest-bearing liabilities | 551,351 | - | 0.0% | 563,237 | - | 0.0% | 515,264 | - | 0.0% |
| Total liabilities and equity | 1,152,240 | 29,791 | 10.5% | 1,131,360 | 25,909 | 9.1% | 1,068,753 | 23,510 | 8.9% |
| NIM - Total | 19.2% | 19.2% | 19.2% | ||||||
| Spread - Total | 13.7% | 13.8% | 15.5% | ||||||
| Nominal rates are calculated over a 365-day year | |||||||||
| Does not include Net income from measurement of financial instruments at fair value through P&L nor Net income from write-down of assets at amortized cost and at fair value through OCI | |||||||||
| Sight deposits include savings accounts and interest-bearing checking accounts. Non interest-bearing accounts are included in non-interest-bearing liabilities. | |||||||||
| 7 |
| |
| ASSETS & LIABILITIES PERFORMANCE - AR$ | BBVA ARGENTINA CONSOLIDATED | ||||||||
| In millions of AR$. Rates and spreads in annualized % | |||||||||
| 1Q22 | 4Q21 | 1Q21 | |||||||
| Average Balance | Interest Earned/Paid | Average Real Rate | Average Balance | Interest Earned/Paid | Average Real Rate | Average Balance | Interest Earned/Paid | Average Real Rate | |
| Total interest-earning assets | 795,510 | 68,802 | 35.1% | 765,266 | 64,614 | 33.5% | 651,516 | 56,319 | 35.1% |
| Debt securities | 406,710 | 38,273 | 38.2% | 365,229 | 33,530 | 36.4% | 262,817 | 24,783 | 38.2% |
| Loans to customers/financial institutions | 382,456 | 30,527 | 32.4% | 393,690 | 30,998 | 31.2% | 386,059 | 31,536 | 33.1% |
| Loans to the BCRA | - | 2 | #DIV/0! | 1 | - | 0.0% | - | - | #DIV/0! |
| Other assets | 6,344 | - | 0.0% | 6,346 | 86 | 5.4% | 2,640 | - | 0.0% |
| Total non interest-earning assets | 162,666 | - | 0.0% | 150,140 | - | 0.0% | 175,610 | - | 0.0% |
| Total Assets | 958,176 | 68,802 | 29.1% | 915,406 | 64,614 | 28.0% | 827,126 | 56,319 | 27.6% |
| Total interest-bearing liabilities | 468,384 | 29,767 | 25.8% | 420,488 | 25,843 | 24.4% | 382,290 | 23,437 | 24.9% |
| Savings accounts | 127,116 | 155 | 0.5% | 168,783 | 3,566 | 8.4% | 155,321 | 2,984 | 7.8% |
| Time deposits | 252,620 | 23,434 | 37.6% | 242,249 | 21,944 | 35.9% | 216,668 | 19,831 | 37.1% |
| Debt securities issued | 369 | 64 | 70.3% | 360 | 58 | 63.9% | 1,565 | 177 | 45.9% |
| Other liabilities | 88,279 | 6,114 | 28.1% | 9,096 | 275 | 12.0% | 8,736 | 445 | 20.7% |
| Total non-interest-bearing liabilities | 488,013 | - | 0.0% | 497,275 | - | 0.0% | 446,313 | - | 0.0% |
| Total liabilities and equity | 956,397 | 29,767 | 12.6% | 917,763 | 25,843 | 11.2% | 828,603 | 23,437 | 11.5% |
| NIM - AR$ | 19.9% | 20.1% | 20.5% | ||||||
| Spread - AR$ | 9.3% | 9.1% | 10.2% | ||||||
| Nominal rates are calculated over a 365-day year | |||||||||
| Does not include Net income from measurement of financial instruments at fair value through P&L nor Net income from write-down of assets at amortized cost and at fair value through OCI | |||||||||
| Sight deposits include savings accounts and interest-bearing checking accounts. Non interest-bearing accounts are included in non-interest-bearing liabilities. | |||||||||
| ASSETS & LIABILITIES PERFORMANCE - FOREIGN CURRENCY | BBVA ARGENTINA CONSOLIDATED | ||||||||
| In millions of AR$. Rates and spreads in annualized % | |||||||||
| 1Q22 | 4Q21 | 1Q21 | |||||||
| Average Balance | Interest Earned/Paid | Average Real Rate | Average Balance | Interest Earned/Paid | Average Real Rate | Average Balance | Interest Earned/Paid | Average Real Rate | |
| Total interest-earning assets | 31,402 | 218 | 2.8% | 40,699 | 274 | 2.7% | 53,687 | 613 | 4.6% |
| Debt securities | 2,907 | 2 | 0.3% | 650 | - | 0.0% | 6 | - | 0.0% |
| Loans to customers/financial institutions | 23,779 | 215 | 3.7% | 32,603 | 272 | 3.3% | 45,124 | 613 | 5.5% |
| Other assets | 4,716 | 1 | 0.1% | 7,446 | 2 | 0.1% | 8,557 | - | 0.0% |
| Total non interest-earning assets | 162,662 | - | 0.0% | 175,255 | - | 0.0% | 187,940 | - | 0.0% |
| Total Assets | 194,064 | 218 | 0.5% | 215,954 | 274 | 0.5% | 241,627 | 613 | 1.0% |
| Total interest-bearing liabilities | 132,505 | 24 | 0.1% | 147,635 | 66 | 0.2% | 171,199 | 73 | 0.2% |
| Savings accounts | 114,201 | 2 | 0.0% | 124,883 | 2 | 0.0% | 142,113 | 3 | 0.0% |
| Time deposits and Investment accounts | 17,264 | 8 | 0.2% | 19,639 | 8 | 0.2% | 25,188 | 22 | 0.4% |
| Other liabilities | 1,040 | 14 | 5.5% | 3,113 | 56 | 7.1% | 3,898 | 48 | 5.0% |
| Total non-interest-bearing liabilities | 63,338 | - | 0.0% | 65,962 | - | 0.0% | 68,951 | - | 0.0% |
| Total liabilities and equity | 195,843 | 24 | 0.0% | 213,597 | 66 | 0.1% | 240,150 | 73 | 0.1% |
| NIM - Foreign currency | 2.5% | 2.0% | 4.1% | ||||||
| Spread - Foreign currency | 2.7% | 2.5% | 4.5% | ||||||
| Nominal rates are calculated over a 365-day year | |||||||||
| Does not include Net income from measurement of financial instruments at fair value through P&L nor Net income from write-down of assets at amortized cost and at fair value through OCI | |||||||||
| Sight deposits include savings accounts and interest-bearing checking accounts. Non interest-bearing accounts are included in non-interest-bearing liabilities. | |||||||||
Net Fee Income
| NET FEE INCOME | BBVA ARGENTINA CONSOLIDATED | ||||
| In millions of AR$ - Inflation adjusted | ∆ % | ||||
| 1Q22 | 4Q21 | 1Q21 | QoQ | YoY | |
| Net Fee Income | 6,634 | 6,765 | 5,204 | (1.9%) | 27.5% |
| Fee Income | 12,955 | 13,429 | 11,909 | (3.5%) | 8.8% |
| Linked to liabilities | 5,329 | 5,026 | 4,760 | 6.0% | 12.0% |
| From credit cards | 5,425 | 6,213 | 5,119 | (12.7%) | 6.0% |
| Linked to loans | 996 | 905 | 687 | 10.1% | 45.0% |
| From insurance | 560 | 546 | 597 | 2.6% | (6.2%) |
| From foreign trade and foreign currency transactions | 513 | 557 | 598 | (7.9%) | (14.2%) |
| Other fee income | 132 | 182 | 148 | (27.5%) | (10.8%) |
| Fee expenses | 6,321 | 6,665 | 6,705 | (5.2%) | (5.7%) |
| 8 |
| |
Net fee income as of 1Q22 totaled $6.6 billion, falling 1.9% or $131 million QoQ and increasing 27.5% or $1.4 billion YoY.
In 1Q22, fee income totaled $13.0 billion, falling 3.5% QoQ and growing 8.8% YoY. The quarterly fall is mainly explained by a decline in income from credit cards, especially due to contrast against 4Q21 and seasonal year-end consumption. The negative effect was offset by an increase in fees linked to liabilities due to an increase in prices of account and packaged accounts’ maintenance.
Regarding fee expenses, these totaled $6.3 billion, contracting 5.2% QoQ and 5.7% YoY. Lower expenses in the quarter are partially explained by lower expenditures linked to the strategy of payroll business acquisition and expenses on credit and debit cards.
Net Income from Measurement of Financial Instruments at Fair Value and Foreign Exchange and Gold Gains/Losses
| NET INCOME FROM FINANCIAL INSTRUMENTS AT FAIR VALUE (FV) THROUGH P&L | BBVA ARGENTINA CONSOLIDATED | ||||
| In millions of AR$ - Inflation adjusted | ∆ % | ||||
| 1Q22 | 4Q21 | 1Q21 | QoQ | YoY | |
| Net Income from financial instruments at FV through P&L | 4,086 | (262) | 2,482 | n.m | 64.6% |
| Income from write-down or sale of financial assets | 2,615 | - | - | N/A | N/A |
| Income from government securities | 695 | 548 | 938 | 26.8% | (25.9%) |
| Income from private securities | 130 | (14) | (312) | n.m | 141.7% |
| Interest rate swaps | (1) | 6 | - | (116.7%) | N/A |
| Gains from foreign currency forward transactions | 649 | 571 | 1,852 | 13.7% | (65.0%) |
| Income from put option long position - Prisma Medios de Pago | - | (1,372) | - | 100.0% | N/A |
| Income from debt and equity instruments | 1 | (1) | 4 | 200.0% | (75.0%) |
| Other | (3) | - | - | N/A | N/A |
In 1Q22, net income from financial instruments at fair value (FV) through P&L was $4.1 billion, increasing 1,659.5% or $4.3 billion QoQ and 64.6% or $1.6 billion YoY.
These results are mainly explained by the sale procedure of the Bank’s remaining position in Prisma. As of March 18, 2022, the transfer of the whole remaining stock participation of the Bank in Prisma Medios de Pago S.A. was completed for a price of USD 40 million. This generated profit of $2.6 billion in the Income from write-down or sale of financial assets line item.
There have also been increases in the income from government securities line item, especially due to the greater position and interest rate generated by the LELIQ portfolio.
| DIFFERENCES IN QUOTED PRICES OF GOLD AND FOREIGN FOREIGN CURRENCY | BBVA ARGENTINA CONSOLIDATED | ||||
| In millions of AR$ - Inflation adjusted | ∆ % | ||||
| 1Q22 | 4Q21 | 1Q21 | QoQ | YoY | |
| Foreign exchange and gold gains/(losses) (1) | 1,712 | 1,892 | 1,389 | (9.5%) | 23.3% |
| From foreign exchange position | (405) | (173) | (562) | (134.1%) | 27.9% |
| Income from purchase-sale of foreign currency | 2,117 | 2,065 | 1,951 | 2.5% | 8.5% |
| Net income from financial instruments at FV through P&L (2) | 649 | 571 | 1,852 | 13.7% | (65.0%) |
| Income from foreign currency forward transactions | 649 | 571 | 1,852 | 13.7% | (65.0%) |
| Total differences in quoted prices of gold & foreign currency (1) + (2) | 2,361 | 2,463 | 3,241 | (4.1%) | (27.2%) |
| 9 |
| |
In 1Q22, the total differences in quoted prices of gold and foreign currency showed profit for $1.7 billion, falling 9.5% or $180 million compared to 4Q21, mainly due to a higher loss in from foreign exchange position line item.
Other Operating Income
| OTHER OPERATING INCOME | BBVA ARGENTINA CONSOLIDATED | ||||
| In millions of AR$ - Inflation adjusted | ∆ % | ||||
| 1Q22 | 4Q21 | 1Q21 | QoQ | YoY | |
| Operating Income | 3,373 | 2,435 | 2,399 | 38.5% | 40.6% |
| Rental of safe deposit boxes (1) | 515 | 450 | 442 | 14.4% | 16.5% |
| Adjustments and interest on miscellaneous receivables (1) | 762 | 701 | 895 | 8.7% | (14.9%) |
| Punitive interest (1) | 57 | 59 | 49 | (3.4%) | 16.3% |
| Loans recovered | 397 | 454 | 358 | (12.6%) | 10.9% |
| Fee income from credit and debit cards (1) | 198 | 138 | 94 | 43.5% | 110.6% |
| Income from initial recognition of public securities | - | 2 | 18 | (100.0%) | (100.0%) |
| Income from sale of assets in equity instruments | 840 | - | - | N/A | N/A |
| Other Operating Income(2) | 604 | 631 | 543 | (4.3%) | 11.3% |
| (1) Included in the efficiency ratio calculation | |||||
| (2) Includes some of the concepts used in the efficiency ratio calculation | |||||
In 1Q22 other operating income totaled $3.4 billion, growing 38.5% or $938 million QoQ, and 40.6% or $974 million YoY. Quarterly growth is partially explained by an $840 million profit recorded on the Income from sale of assets in equity instruments line item, as a result from the sale procedures of the remaining stock participation of the Bank in Prisma. Additionally, there has been a 14.4% increase in the rental of safe deposit boxes line item, and an 8.7% increase in adjustments and interest on miscellaneous receivables.
| 10 |
| |
Operating Expenses
Personnel Benefits and Administrative Expenses
| PERSONNEL BENEFITS & ADMINISTRATIVE EXPENSES | BBVA ARGENTINA CONSOLIDATED | ||||
| In millions of AR$ - Inflation adjusted | ∆ % | ||||
| 1Q22 | 4Q21 | 1Q21 | QoQ | YoY | |
| Total Personnel Benefits and Adminsitrative Expenses | 16,479 | 15,982 | 16,580 | 3.1% | (0.6%) |
| Personnel Benefits (1) | 9,065 | 8,955 | 9,059 | 1.2% | 0.1% |
| Administrative expenses (1) | 9,515 | 9,898 | 8,270 | (3.9%) | 15.1% |
| Travel expenses | 41 | 30 | 62 | 36.7% | (33.9%) |
| Outsourced administrative expenses | 688 | 1,220 | 595 | (43.6%) | 15.6% |
| Security services | 281 | 354 | 299 | (20.6%) | (6.0%) |
| Fees to Bank Directors and Supervisory Committee | 13 | 30 | 15 | (56.7%) | (13.3%) |
| Other fees | 351 | 414 | 352 | (15.2%) | (0.3%) |
| Insurance | 108 | 106 | 103 | 1.9% | 4.9% |
| Rent | 1,558 | 797 | 1,062 | 95.5% | 46.7% |
| Stationery and supplies | 26 | 24 | 28 | 8.3% | (7.1%) |
| Electricity and communications | 395 | 385 | 415 | 2.6% | (4.8%) |
| Advertising | 510 | 460 | 313 | 10.9% | 62.9% |
| Taxes | 2,110 | 2,118 | 1,939 | (0.4%) | 8.8% |
| Maintenance costs | 974 | 1,137 | 968 | (14.3%) | 0.6% |
| Armored transportation services | 1,221 | 1,185 | 1,185 | 3.0% | 3.0% |
| Other administrative expenses | 1,239 | 1,638 | 934 | (24.4%) | 32.7% |
| Headcount* | |||||
| BBVA (Bank) | 5,753 | 5,765 | 5,905 | (12) | (152) |
| Associates | 99 | 98 | 99 | 1 | - |
| Total employees | 5,852 | 5,863 | 6,004 | (11) | (152) |
| Branches | 1,994 | 2,000 | 2,261 | (6) | (267) |
| Main office | 3,858 | 3,863 | 3,743 | (5) | 115 |
| Total branches** | 243 | 243 | 247 | - | (4) |
| Efficiency Ratio | |||||
| Efficiency ratio | 72.2% | 67.3% | 72.5% | 490 bps | (30)bps |
| Accumulated Efficiency Ratio | 72.2% | 69.1% | 72.5% | 310 bps | (30)bps |
| Efficiency ratio - Excl. Inflation adjustment | 43.3% | 48.4% | 50.1% | (510)bps | (680)bps |
| Accumulated Efficiency Ratio - Excl. Inflation adjustment | 43.3% | 49.4% | 50.1% | (610)bps | (680)bps |
| (1) Concept included in the efficiency ratio calculation | |||||
| *corresponds to total effective employees, net of temporary contract employees | |||||
| **do not include administrative offices. As of 1Q22, 54% owned and 46% rented. | |||||
During 1Q22, personnel benefits and administrative expenses totaled $16.5 billion, increasing 3.1% or $497 million compared to 4Q21, and falling 0.6% or $101 million compared to 1Q21.
Personnel benefits grew 1.2% QoQ, and 0.1% YoY. The quarterly increase is partially explained by the collective wage agreement reached with the unions which established a fixed sum increase for the months of January, February and March.
| 11 |
| |
As of 1Q22, administrative expenses decreased 3.9% QoQ, and increased 15.1% YoY. The quarterly decline is partially explained by a 43.6% fall in the outsourced administrative expenses line item, and a 24.4% decrease in other administrative expenses.
The accumulated efficiency ratio as of 1Q22 was 72.2%, deteriorating compared to the 69.1% and marginally improving versus the 72.5% reported in 4Q21 and 1Q21 respectively. The quarterly weakening is explained by a higher percentage decrease in the denominator (income considering monetary position results) than the numerator (expenses), almost exclusively due to the negative impact of the income from the net monetary position, as a result of a greater quarterly inflation compared to 4Q21.
Excluding inflation adjustments considered in the income from the monetary position line item, the 1Q22 accumulated efficiency ratio would have been 43.3%, improving compared to the 49.9% of 4Q21 and the 50.1% of 1Q21.
Other Operating Expenses
| OTHER OPERATING EXPENSES | BBVA ARGENTINA CONSOLIDATED | ||||
| In millions of AR$ - Inflation adjusted | ∆ % | ||||
| 1Q22 | 4Q21 | 1Q21 | QoQ | YoY | |
| Other Operating Expenses | 7,754 | 8,503 | 7,209 | (8.8%) | 7.6% |
| Turnover tax | 5,312 | 5,039 | 4,720 | 5.4% | 12.5% |
| Initial loss of loans below market rate | 497 | 746 | 453 | (33.4%) | 9.7% |
| Contribution to the Deposit Guarantee Fund (SEDESA) | 316 | 332 | 319 | (4.8%) | (0.9%) |
| Interest on liabilities from financial lease | 107 | 124 | 139 | (13.7%) | (23.0%) |
| Other allowances | 617 | (308) | 410 | 300.3% | 50.5% |
| Loss for sale or depreciation of investment property and other non financial assets | - | 45 | - | (100.0%) | N/A |
| Other operating expenses | 905 | 2,525 | 1,168 | (64.2%) | (22.6%) |
In 1Q22, other operating expenses totaled $7.8 billion, decreasing 8.8% or $749 million QoQ, and increasing 7.6% or $545 million YoY.
The key factor explaining the quarterly decrease in in the other operating expenses line item, with a decline of 64.2%, considering the $1.6 billion provision for reorganization recorded in 4Q21, consistent with the goal of further aligning the organizational structure with the corporate strategy during the current year, achieving efficiency gains and streamlining the decision-making process across all work teams.
The aforementioned savings are partially offset by the other allowances line item, increasing 300.3% related to the decrease in use of off-balance sheet items, and an increase in the turnover tax line item, derived from higher income from BCRA securities.
| 12 |
| |
Income from Associates
This line reflects the results from non-consolidated associate companies. During 1Q22, a loss of $267 million has been reported, mainly due to the Bank’s participation in BBVA Consolidar Seguros S.A., Rombo Compañía Financiera S.A., Interbanking S.A. and Play Digital S.A. and Openpay Argentina S.A.
Income Tax
Accumulated income tax during the first three months of 2022 recorded a loss of $1.7 billion. The accumulated annual effective tax rate for the first three months of 2022[3] was 30%.
Concerning the first quarter of 2021, accumulated income tax represented a positive result due to: i) having recorded a complete fiscal inflation adjustment, and ii) the reversal of a provision pursuant to BCRA instructions for the year 2016, which was funded on a favorable final sentence in court , recording a positive result in 1Q21 of $1.2 billion.
3 Income tax, according to IAS 34, is recorded on interim financial periods over the best estimate of the weighted average tax rate expected for the fiscal year.
| 13 |
| |
Balance sheet and activity
Loans and Other Financing
| LOANS AND OTHER FINANCING | BBVA ARGENTINA CONSOLIDATED | ||||
| In millions of AR$ - Inflation adjusted | ∆ % | ||||
| 1Q22 | 4Q21 | 1Q21 | QoQ | YoY | |
| To the public sector | 4 | 1 | 1 | 300.0% | 300.0% |
| To the financial sector | 4,792 | 4,935 | 3,472 | (2.9%) | 38.0% |
| Non-financial private sector and residents abroad | 413,156 | 450,861 | 460,395 | (8.4%) | (10.3%) |
| Non-financial private sector and residents abroad - AR$ | 388,666 | 424,705 | 409,111 | (8.5%) | (5.0%) |
| Overdrafts | 25,926 | 26,145 | 20,459 | (0.8%) | 26.7% |
| Discounted instruments | 48,997 | 59,630 | 48,796 | (17.8%) | 0.4% |
| Mortgage loans | 24,660 | 26,590 | 28,433 | (7.3%) | (13.3%) |
| Pledge loans | 17,852 | 21,068 | 18,054 | (15.3%) | (1.1%) |
| Consumer loans | 45,087 | 47,532 | 47,585 | (5.1%) | (5.2%) |
| Credit cards | 161,239 | 179,431 | 184,123 | (10.1%) | (12.4%) |
| Receivables from financial leases | 2,922 | 3,352 | 3,134 | (12.8%) | (6.8%) |
| Other loans | 61,983 | 60,958 | 58,527 | 1.7% | 5.9% |
| Non-financial private sector and residents abroad - Foreign Currency | 24,490 | 26,156 | 51,284 | (6.4%) | (52.2%) |
| Overdrafts | 4 | 3 | 2 | 33.3% | 100.0% |
| Discounted instruments | - | - | 2,898 | N/A | (100.0%) |
| Credit cards | 4,272 | 2,959 | 1,785 | 44.4% | 139.3% |
| Receivables from financial leases | 15 | 28 | 183 | (46.4%) | (91.8%) |
| Loans for the prefinancing and financing of exports | 13,688 | 15,487 | 30,353 | (11.6%) | (54.9%) |
| Other loans | 6,511 | 7,679 | 16,063 | (15.2%) | (59.5%) |
| % of total loans to Private sector in AR$ | 94.1% | 94.2% | 88.9% | (13)bps | 521 bps |
| % of total loans to Private sector in Foreign Currency | 5.9% | 5.8% | 11.1% | 13 bps | (521)bps |
| % of mortgage loans with UVA adjustments / Total mortgage loans (1) | 75% | 75% | 82% | 9 pbs | (721)pbs |
| % of pledge loans with UVA adjustments / Total pledge loans (1) | 5% | 6% | 12% | (63)pbs | (638)pbs |
| % of consumer loans with UVA adjustments / Total consumer loans (1) | 3% | 4% | 9% | (101)pbs | (637)pbs |
| % of loans with UVA adjustments / Total loans and other financing(1) | 2% | 2% | 3% | (25)pbs | (153)pbs |
| Total loans and other financing | 417,952 | 455,797 | 463,868 | (8.3%) | (9.9%) |
| Allowances | (12,128) | (15,847) | (22,354) | 23.5% | 45.7% |
| Total net loans and other financing | 405,824 | 439,950 | 441,514 | (7.8%) | (8.1%) |
(1) Excludes effect of accrued interests adjustments. | |||||
| LOANS AND OTHER FINANCING TO NON-FINANCIAL PRIVATE SECTOR AND RESIDENTS ABROAD IN FOREIGN CURRENCY | BBVA ARGENTINA CONSOLIDATED | ||||
| In millions of USD | ∆ % | ||||
| 1Q22 | 4Q21 | 1Q21 | QoQ | YoY | |
| FX rate* | 110.97 | 102.75 | 91.99 | 8.0% | 20.6% |
| Non-financial private sector and residents abroad - Foreign Currency (USD) | 221 | 219 | 359 | 0.6% | (38.6%) |
| *Wholesale U.S. dollar foreign exchange rates on BCRA’s Communication “A” 3500, as of the end of period. | |||||
Private sector loans as of 1Q22 totaled $413.2 billion, decreasing 8.4% or $37.7 billion QoQ, and 10.3% or $47.2 billion YoY.
| 14 |
| |
Loans to the private sector in pesos decreased 8.5% in 1Q22, and 5.0% YoY. During the quarter, decline was especially driven by a 10.1% fall in credit cards, and a 17.8% fall in discounted instruments.
Loans to the private sector denominated in foreign currency fell 6.4% QoQ and 52.2% YoY. Quarterly decrease is mainly explained by an 11.6% fall in prefinancing and financing of exports, followed by a 15.2% fall in other loans. All the aforementioned indicates the continued lack of demand of loans in foreign currency. The decline was offset by a 44.4% increase in credit cards. Loans to the private sector in foreign currency measured in U.S. dollars increased 0.6% QoQ and fell 38.6% YoY. The depreciation of the argentine peso versus the U.S. dollar was 7.4% QoQ and 17.1% YoY[4].
In 1Q22, total loans and other financing totaled $418.0 billion, decreasing 8.3% compared to 4Q21 and 9.9% compared to 1Q21.
| LOANS AND OTHER FINANCING | BBVA ARGENTINA CONSOLIDATED | ||||
| In millions of AR$ - Inflation adjusted | ∆ % | ||||
| 1Q22 | 4Q21 | 1Q21 | QoQ | YoY | |
| Non-financial private sector and residents abroad - Retail | 253,110 | 277,579 | 279,980 | (8.8%) | (9.6%) |
| Mortgage loans | 24,660 | 26,590 | 28,433 | (7.3%) | (13.3%) |
| Pledge loans | 17,852 | 21,068 | 18,054 | (15.3%) | (1.1%) |
| Consumer loans | 45,087 | 47,532 | 47,585 | (5.1%) | (5.2%) |
| Credit cards | 165,511 | 182,390 | 185,908 | (9.3%) | (11.0%) |
| Non-financial private sector and residents abroad - Commercial | 160,046 | 173,282 | 180,415 | (7.6%) | (11.3%) |
| Overdrafts | 25,930 | 26,148 | 20,461 | (0.8%) | 26.7% |
| Discounted instruments | 48,997 | 59,630 | 51,694 | (17.8%) | (5.2%) |
| Receivables from financial leases | 2,937 | 3,380 | 3,317 | (13.1%) | (11.5%) |
| Loans for the prefinancing and financing of exports | 13,688 | 15,487 | 30,353 | (11.6%) | (54.9%) |
| Other loans | 68,494 | 68,637 | 74,590 | (0.2%) | (8.2%) |
| % of total loans to Retail sector | 61.3% | 61.6% | 60.8% | (30)bps | 45 bps |
| % of total loans to Commercial sector | 38.7% | 38.4% | 39.2% | 30 bps | (45)bps |
In real terms, retail loans (mortgage, pledge, consumer and credit cards) have decreased 8.8% QoQ and 9.6% YoY in real terms. During the quarter, the decrease is mainly explained by a 9.3% fall in credit cards, followed by a 15.3% fall in pledge loans.
Commercial loans (overdrafts, discounted instruments, receivables from financial leases, loans for the prefinancing and financing of exports, and other loans) fell 7.6% QoQ and 11.3% YoY both in real terms. Quarterly decrease is explained by a 17.8% decline in discounted instruments, followed by an 11.6% decrease in prefinancing and financing of exports.
Loan portfolios are mainly impacted by the effect of inflation during the first quarter of 2022, which reached 16.1%. In nominal terms, the retail, commercial and total loan portfolio all increased 6.6%, 5.9% and 6.4% respectively during the quarter, beyond real term growth.
4 Taking into consideration wholesale U.S. dollar foreign exchange rates on BCRA’s Communication “A” 3500.
| 15 |
| |
| LOANS AND OTHER FINANCING - NON RESTATED FIGURES | BBVA ARGENTINA CONSOLIDATED | ||||
| In millions of AR$ | ∆ % | ||||
| 1Q22 | 4Q21 | 1Q21 | QoQ | YoY | |
| Non-financial private sector and residents abroad - Retail | 253,110 | 237,341 | 180,197 | 6.6% | 40.5% |
| Non-financial private sector and residents abroad - Commercial | 160,046 | 151,099 | 116,627 | 5.9% | 37.2% |
| Total loans and other financing (1) | 417,952 | 392,693 | 299,063 | 6.4% | 39.8% |
| (1) Does not include allowances | |||||
As of 1Q22, the total loans and other financing over deposits ratio was 52.4%, below the 55.4% recorded in 4Q21 and the 58.9% in 1Q21.
| MARKET SHARE - PRIVATE SECTOR LOANS | BBVA ARGENTINA CONSOLIDATED | ||||
| In % | ∆ bps | ||||
| 1Q22 | 4Q21 | 1Q21 | QoQ | YoY | |
| Private sector loans - Bank | 7.00% | 7.18% | 7.35% | (17)bps | (35)bps |
| Private sector loans - Consolidated* | 7.89% | 8.05% | 8.23% | (16)bps | (34)bps |
| Based on daily BCRA information. Capital balance as of the last day of each quarter. | |||||
| * Consolidates PSA, VWFS & Rombo | |||||
| LOANS BY ECONOMIC ACTIVITY | BBVA ARGENTINA CONSOLIDATED | ||||
| % over total gross loans and other financing | ∆ bps | ||||
| 1Q22 | 4Q21 | 1Q21 | QoQ | YoY | |
| Government services | n.m | n.m | n.m | - | - |
| Financial Sector | 1.15% | 1.08% | 0.75% | 6 bps | 40 bps |
| Agricultural and Livestock | 4.64% | 4.17% | 5.33% | 47 bps | (69)bps |
| Mining products | 3.83% | 3.85% | 7.65% | (2)bps | (383)bps |
| Other manufacturing | 10.44% | 11.00% | 7.97% | (56)bps | 247 bps |
| Electricity, oil,water and sanitary services | 0.16% | 0.04% | 0.36% | 12 bps | (20)bps |
| Wholesale and retail trade | 5.12% | 7.24% | 4.33% | (212)bps | 79 bps |
| Transport | 1.06% | 1.04% | 0.97% | 2 bps | 10 bps |
| Services | 1.95% | 0.76% | 0.51% | 119 bps | 144 bps |
| Others | 13.92% | 13.19% | 14.83% | 73 bps | (91)bps |
| Construction | 0.68% | 0.62% | 0.70% | 6 bps | (2)bps |
| Consumer | 57.06% | 57.01% | 56.60% | 5 bps | 45 bps |
| Total gross loans and other financing | 100% | 100% | 100% | ||
| 16 |
| |
Asset Quality
| ASSET QUALITY | BBVA ARGENTINA CONSOLIDATED | ||||
| In millions of AR$ - Inflation adjusted | ∆ % | ||||
| 1Q22 | 4Q21 | 1Q21 | QoQ | YoY | |
| Commercial non-performing portfolio (1) | 974 | 2,798 | 3,709 | (65.2%) | (73.7%) |
| Total commercial portfolio | 122,021 | 132,445 | 146,136 | (7.9%) | (16.5%) |
| Commercial non-performing portfolio / Total commercial portfolio | 0.80% | 2.11% | 2.54% | (131)bps | (174)bps |
| Retail non-performing portfolio (1) | 4,545 | 5,914 | 4,413 | (23.1%) | 3.0% |
| Total retail portfolio | 304,913 | 333,110 | 325,441 | (8.5%) | (6.3%) |
| Retail non-performing portfolio / Total retail portfolio | 1.49% | 1.78% | 1.36% | (28)pbs | 13 pbs |
| Total non-performing portfolio (1) | 5,519 | 8,712 | 8,122 | (36.7%) | (32.0%) |
| Total portfolio | 426,934 | 465,555 | 471,577 | (8.3%) | (9.5%) |
| Total non-performing portfolio / Total portfolio | 1.29% | 1.87% | 1.72% | (58)bps | (43)bps |
| Allowances | 12,128 | 15,847 | 22,354 | (23.5%) | (45.7%) |
| Allowances /Total non-performing portfolio | 219.75% | 181.90% | 275.23% | 3,785 bps | (5,548)bps |
| Quarterly change in Write-offs | 5,353 | 2,940 | 796 | 82.1% | n.m |
| Write offs / Total portfolio | 1.25% | 0.63% | 0.17% | 62 bps | 109 bps |
| Cost of Risk (CoR) | 2.11% | 0.46% | 2.47% | 165 bps | (36)bps |
| (1) Non-performing loans include: all loans to borrowers classified as "Deficient Servicing (Stage 3)", "High Insolvency Risk (Stage 4)", "Irrecoverable" and/or "Irrecoverable for Technical Decision" (Stage 5) according to BCRA debtor classification system | |||||
In 1Q22, asset quality ratio or NPL (total non-performing portfolio / total portfolio) was 1.29%, compared to the 1.87% recorded in 4Q21. The decrease is mainly explained by a good loan portfolio behavior, mainly on the commercial side, together with a fall in the total portfolio. Both the decline on the commercial non-performing portfolio and the total portfolio are driven by write-offs in the commercial portfolio.
The coverage ratio (allowances / total non-performing portfolio) was 219.75% in 1Q22, versus the 181.90% recorded in 4Q21. The change in this ratio reflects a lower variation in allowances than in the total non-performing loan portfolio, the latter affected by commercial write-offs.
Cost of risk (loan loss allowances / average total loans) reached 2.11% as of 1Q22, above 4Q21’s 0.46%. The exceptional value recorded on 4Q21 was mainly explained by the reduction in loan loss allowances, as a result of the annual update of IFRS 9 impairment loss model parameters, and an improvement in the sovereign rating for the commercial portfolio, upgrading the commercial loan portfolio’s rating.
| ANALYSIS FOR THE ALLOWANCE OF LOAN LOSSES | BBVA ARGENTINA CONSOLIDATED | |||||
| In millions of AR$ | ||||||
| Balance at 12/31/2021 | Stage 1 | Stage 2 | Stage 3 | Monetary result generated by allowances | Balance at 03/31/2022 | |
| Other financial assets | 334 | 8 | - | 13 | (46) | 309 |
| Loans and other financing | 15,847 | 481 | (1) | (2,016) | (2,183) | 12,128 |
| Other debt securities | 18 | 9 | - | - | (3) | 24 |
| Eventual commitments | 991 | 113 | 26 | 4 | (133) | 1,001 |
| Total allowances | 17,190 | 611 | 25 | (1,999) | (2,365) | 13,462 |
| Note: to be consistent with Financial Statements, it must be recorded from the beginning of the year instead of the quarter | ||||||
Allowances for the Bank in 1Q22 reflect expected losses driven by the adoption of the IFRS 9 standards as of January 1, 2020, except for debt instruments issued by the nonfinancial government sector which were excluded from the scope of such standard.
| 17 |
| |
Public Sector Exposure
| NET PUBLIC DEBT EXPOSURE | BBVA ARGENTINA CONSOLIDATED | ||||
| In millions of AR$ - Inflation adjusted | ∆ % | ||||
| 1Q22 | 4Q21 | 1Q21 | QoQ | YoY | |
| Treasury and Government securities | 104,343 | 95,117 | 73,738 | 9.7% | 41.5% |
| Treasury and National Government | 104,343 | 95,117 | 73,738 | 9.7% | 41.5% |
| National Treasury Public Debt in AR$ | 101,939 | 93,239 | 73,738 | 9.3% | 38.2% |
| National Treasury Public Debt in USD | 741 | - | - | N/A | N/A |
| National Treasury Public Debt in AR$ linked to US dollars | 1,663 | 1,878 | - | (11.5%) | N/A |
| Loans to the Public Sector | 4 | 1 | 1 | 300.0% | 300.0% |
| AR$ Subtotal | 101,943 | 93,240 | 73,739 | 9.3% | 38.2% |
| USD Subtotal* | 2,404 | 1,878 | - | 28.0% | N/A |
| Total Public Debt Exposure | 104,347 | 95,118 | 73,739 | 9.7% | 41.5% |
| B.C.R.A. Exposure | 338,518 | 284,651 | 198,854 | 18.9% | 70.2% |
| Instruments | 271,099 | 124,999 | 151,593 | 116.9% | 78.8% |
| Leliqs | 247,084 | 124,999 | 151,593 | 97.7% | 63.0% |
| Notaliqs | 24,014 | - | - | N/A | N/A |
| Repo | 67,419 | 159,652 | 47,261 | (57.8%) | 42.7% |
| B.C.R.A. - AR$ | 67,419 | 159,652 | 47,261 | (57.8%) | 42.7% |
| % Public sector exposure (Excl. B.C.R.A.) / Total assets | 8.9% | 8.0% | 6.4% | 97 bps | 252 bps |
| *Includes USD-linked Treasury public debt in AR$ | |||||
| This table does not include deposits at the Central Bank used to comply with reserve requirements. | |||||
1Q22 public sector exposure (excluding BCRA) totaled $104.3 billion, growing 9.7% or $9.2 billion QoQ, and 41.5% or $30.6 billion YoY. The quarterly increase is explained by a greater position in CER-linked treasury bonds, CER-linked treasury bills (LECER) and 2022 National Treasury Bonds at fixed rate (Bonte 22, used for reserve requirement integration), as well as U.S. dollar linked treasury bonds.
Short-term liquidity is mostly allocated in BCRA instruments, which increased 18.9% QoQ and increased 70.2% YoY in real terms. The quarterly increase is explained by a higher LELIQ position, and the addition of a new BCRA instrument, the Liquidity Notes (NOTALIQ), which are linked to the monetary policy rate.
Exposure to the public sector (excluding BCRA) represents 8.9% of total assets, above the 8.0% in 4Q21 and the 6.4% in 1Q21.
| 18 |
| |
Deposits
| TOTAL DEPOSITS | BBVA ARGENTINA CONSOLIDATED | ||||
| In millions of AR$ - Inflation adjusted | ∆ % | ||||
| 1Q22 | 4Q21 | 1Q21 | QoQ | YoY | |
| Total deposits | 797,314 | 822,163 | 787,662 | (3.0%) | 1.2% |
| Non-financial Public Sector | 17,411 | 15,408 | 10,209 | 13.0% | 70.5% |
| Financial Sector | 292 | 252 | 278 | 15.9% | 5.0% |
| Non-financial private sector and residents abroad | 779,611 | 806,503 | 777,175 | (3.3%) | 0.3% |
| Non-financial private sector and residents abroad - AR$ | 612,624 | 617,328 | 552,852 | (0.8%) | 10.8% |
| Checking accounts | 200,346 | 197,774 | 159,790 | 1.3% | 25.4% |
| Savings accounts | 130,259 | 162,288 | 140,083 | (19.7%) | (7.0%) |
| Time deposits | 202,437 | 182,373 | 198,124 | 11.0% | 2.2% |
| Investment accounts | 74,659 | 69,492 | 50,202 | 7.4% | 48.7% |
| Other | 4,924 | 5,400 | 4,654 | (8.8%) | 5.8% |
| Non-financial private sector and res. abroad - Foreign Currency | 166,986 | 189,175 | 224,323 | (11.7%) | (25.6%) |
| Checking accounts | 50 | 27 | 26 | 83.8% | 90.1% |
| Savings accounts | 147,360 | 168,733 | 195,422 | (12.7%) | (24.6%) |
| Time deposits | 17,517 | 18,276 | 25,703 | (4.2%) | (31.8%) |
| Other | 2,059 | 2,139 | 3,171 | (3.7%) | (35.1%) |
| % of total portfolio in the private sector in AR$ | 78.6% | 76.5% | 71.1% | 204 bps | 744 bps |
| % of total portfolio in the private sector in Foregin Currency | 21.4% | 23.5% | 28.9% | (204)bps | (744)bps |
| % of time deposits with UVA adjustments / Total AR$ Deposits | 4.4% | 3.9% | 2.7% | 45 bps | 161 bps |
| DEPOSITS TO THE NON-FINANCIAL PRIVATE SECTOR AND RES. ABROAD IN FOREIGN CURRENCY | BBVA ARGENTINA CONSOLIDATED | ||||
| In millions of USD | ∆ % | ||||
| 1Q22 | 4Q21 | 1Q21 | QoQ | YoY | |
| FX rate* | 111.0 | 102.8 | 92.0 | 8.0% | 20.6% |
| Non-financial private sector and residents abroad - Foreign Currency (USD) | 1,505 | 1,586 | 1,572 | (5.1%) | (4.3%) |
| *Wholesale U.S. dollar foreign exchange rates on BCRA’s Communication “A” 3500, as of the end of period. | |||||
As of 1Q22, total deposits reached $797.3 billion, falling 3.0% or $24.5 billion QoQ, and growing 1.2% or $9.7 billion YoY.
Private non-financial sector deposits in 1Q22 totaled $779.6 billion, decreasing 3.3% QoQ, and mildly growing 0.3% YoY.
Private non-financial sector deposits in pesos totaled $612.6 billion, slightly decreasing 0.8% compared to 4Q21, and increasing 10.8% compared to 1Q21. The quarterly decline is mainly affected by a fall in sight deposits, especially savings accounts. This was partially offset by an 11.0% and a 7.4% increase in time deposits and investment accounts respectively.
Private non-financial sector deposits in foreign currency expressed in pesos fell 11.7% QoQ and 25.6% YoY. Measured in U.S. dollars, these deposits fell 5.1% QoQ and 4.3% YoY.
| 19 |
| |
| PRIVATE DEPOSITS | BBVA ARGENTINA CONSOLIDATED | ||||
| In millions of AR$ - Inflation adjusted | ∆ % | ||||
| 1Q22 | 4Q21 | 1Q21 | QoQ | YoY | |
| Non-financial private sector and residents abroad | 779,611 | 806,503 | 777,175 | (3.3%) | 0.3% |
| Sight deposits | 484,998 | 536,362 | 503,146 | (9.6%) | (3.6%) |
| Checking accounts | 200,396 | 197,802 | 159,816 | 1.3% | 25.4% |
| Savings accounts | 277,619 | 331,021 | 335,504 | (16.1%) | (17.3%) |
| Other | 6,983 | 7,539 | 7,825 | (7.4%) | (10.8%) |
| Time deposits | 294,613 | 270,141 | 274,029 | 9.1% | 7.5% |
| Time deposits | 219,954 | 200,649 | 223,827 | 9.6% | (1.7%) |
| Investment accounts | 74,659 | 69,492 | 50,202 | 7.4% | 48.7% |
| % of sight deposits over total private deposits | 62.2% | 66.5% | 64.7% | (429)bps | (253)bps |
| % of time deposits over total private deposits | 37.8% | 33.5% | 35.3% | 429 bps | 253 bps |
| PRIVATE DEPOSITS - NON RESTATED FIGURES | BBVA ARGENTINA CONSOLIDATED | ||||
| In millions of AR$ | ∆ % | ||||
| 1Q22 | 4Q21 | 1Q21 | QoQ | YoY | |
| Sight deposits | 462,105 | 462,105 | 324,387 | 16.4% | 42.7% |
| Time deposits | 232,741 | 232,741 | 176,672 | 4.2% | 57.3% |
| Total deposits | 708,336 | 708,336 | 507,820 | 12.3% | 48.1% |
As of 1Q22, the Bank’s transactional deposits (checking accounts and savings accounts) represented 61.3% of total non-financial private deposits, totaling $478.0 billion, versus 65.6% in 4Q21.
| MARKET SHARE - PRIVATE SECTOR DEPOSITS | BBVA ARGENTINA CONSOLIDATED | ||||
| In % | ∆ bps | ||||
| 1Q22 | 4Q21 | 1Q21 | QoQ | YoY | |
| Private sector Deposits - Consolidated* | 7.12% | 6.95% | 6.90% | 18 pbs | 5 pbs |
| Based on daily BCRA information. Capital balance as of the last day of each quarter. | |||||
| * Consolidates PSA, VWFS & Rombo | |||||
Other Sources of Funds
| OTHER SOURCES OF FUNDS | BBVA ARGENTINA CONSOLIDATED | ||||
| In millions of AR$ - Inflation adjusted | ∆ % | ||||
| 1Q22 | 4Q21 | 1Q21 | QoQ | YoY | |
| Other sources of funds | 203,372 | 199,253 | 199,045 | 2.1% | 2.2% |
| Central Bank | 56 | 53 | 38 | 6.5% | 49.1% |
| Banks and international organizations | - | - | 2,913 | N/A | (100.0%) |
| Financing received from local financial institutions | 12,173 | 13,595 | 12,208 | (10.5%) | (0.3%) |
| Corporate bonds | 584 | 584 | 1,586 | - | (63.2%) |
| Equity | 190,559 | 185,022 | 182,300 | 3.0% | 4.5% |
In 1Q22, other sources of funds totaled $203.4 billion, growing 2.1% or $4.1 billion QoQ, and 2.2% or $4.3 billion YoY.
Quarterly increase is mostly explained by the 3.0% increase in equity.
| 20 |
| |
Liquid Assets
| TOTAL LIQUID ASSETS | BBVA ARGENTINA CONSOLIDATED | ||||
| In millions of AR$ - Inflation adjusted | ∆ % | ||||
| 1Q22 | 4Q21 | 1Q21 | QoQ | YoY | |
| Total liquid assets | 634,974 | 627,844 | 567,456 | 1.1% | 11.9% |
| Cash and deposits in banks | 198,969 | 253,432 | 303,598 | (21.5%) | (34.5%) |
| Debt securities at fair value through profit or loss | 10,382 | 1,621 | 7,514 | n.m | 38.2% |
| Government securities | 3,050 | 1,621 | 7,514 | 88.2% | (59.4%) |
| Liquidity bills of B. C. R. A. | 7,331 | - | - | N/A | N/A |
| Net REPO transactions | 67,419 | 159,652 | 47,261 | (57.8%) | 42.7% |
| Other debt securities | 358,204 | 213,140 | 209,084 | 68.1% | 71.3% |
| Government securities | 94,437 | 88,141 | 57,491 | 7.1% | 64.3% |
| Liquidity bills of B. C. R. A. | 263,767 | 124,999 | 151,593 | 111.0% | 74.0% |
| Liquid assets / Total Deposits | 79.6% | 76.4% | 72.0% | 327 bps | 760 bps |
In 1Q22, liquid assets were $635.0 billion, growing 1.1% or $7.1 billion compared to 4Q21, and 11.9% or $67.5 billion compared to 1Q21, mainly due to an increase in government securities at amortized cost (other debt securities), offset by a decrease in net REPO transactions.
In 4Q21, the liquidity ratio (liquid assets / total deposits) reached 79.6%. Liquidity ratio in local and foreign currency reached 76.4% and 91.2% respectively.
Solvency
| MINIMUM CAPITAL REQUIREMENT | BBVA ARGENTINA CONSOLIDATED | ||||
| In millions of AR$ - Inflation adjusted | ∆ % | ||||
| 1Q22 | 4Q21 | 1Q21 | QoQ | YoY | |
| Minimum capital requirement | 58,506 | 66,482 | 61,928 | (12.0%) | (5.5%) |
| Credit risk | 41,232 | 48,646 | 46,341 | (15.2%) | (11.0%) |
| Market risk | 652 | 263 | 275 | 147.9% | 137.1% |
| Operational risk | 16,622 | 17,573 | 15,312 | (5.4%) | 8.6% |
| Integrated Capital - RPC (1)* | 168,636 | 169,220 | 169,274 | (0.3%) | (0.4%) |
| Ordinary Capital Level 1 ( COn1) | 191,544 | 186,749 | 192,780 | 2.6% | (0.6%) |
| Deductible items COn1 | (24,546) | (21,822) | (28,206) | (12.5%) | 13.0% |
| Additional Capital Level 2 (COn2) | 1,638 | 4,293 | 4,700 | (61.8%) | (65.1%) |
| Excess Capital | |||||
| Integration excess | 110,130 | 102,738 | 107,346 | 7.2% | 2.6% |
| Excess as % of minimum capital requirement | 188.2% | 154.5% | 173.3% | 3,370 bps | 1,486 bps |
| Risk-weighted assets (RWA, according to B.C.R.A. regulation) (2) | 716,314 | 813,317 | 757,232 | (11.9%) | (5.4%) |
| Regulatory Capital Ratio (1)/(2) | 23.5% | 20.8% | 22.4% | 274 pbs | 119 pbs |
| TIER I Capital Ratio (Ordinary Capital Level 1/ RWA) | 23.3% | 20.3% | 21.7% | 304 pbs | 158 pbs |
| * RPC includes 100% of quarterly results | |||||
| 21 |
| |
BBVA Argentina continues to show strong solvency indicators on 1Q22. Capital ratio reached 23.5%, above than 4Q21’s 20.8%, mostly due to the announcement of dividend distribution on 4Q21 for $6.5 billion. Tier 1 ratio was 23.3% and capital excess over regulatory requirement was $110.1 billion or 188.2%.
BBVA Argentina Asset Management S.A.
| MUTUAL FUNDS ASSETS | BBVA ARGENTINA CONSOLIDATED | ||||
| In millions of AR$ - Inflation adjusted | ∆ % | ||||
| 1Q22 | 4Q21 | 1Q21 | QoQ | YoY | |
| FBA Renta Pesos | 204,056 | 204,023 | 208,003 | 0.0% | (1.9%) |
| FBA Renta Fija Plus | 20,510 | 19,338 | 7,875 | 6.1% | 160.4% |
| FBA Ahorro Pesos | 14,768 | 3,534 | 2,012 | 317.9% | n.m |
| FBA Horizonte | 374 | 428 | 966 | (12.6%) | (61.3%) |
| FBA Calificado | 956 | 1,055 | 763 | (9.4%) | 25.3% |
| FBA Acciones Argentinas | 847 | 833 | 631 | 1.7% | 34.2% |
| FBA Acciones Latinoamericanas | 565 | 612 | 589 | (7.7%) | (4.1%) |
| FBA Bonos Argentina | 1,553 | 915 | 461 | 69.7% | 236.9% |
| FBA Bonos Globales | 44 | 138 | 316 | (68.1%) | (86.1%) |
| FBA Renta Mixta | 299 | 339 | 85 | (11.8%) | 251.8% |
| FBA Gestión I | 36 | 41 | 47 | (12.2%) | (23.4%) |
| FBA Horizonte Plus | 14 | 23 | 45 | (39.1%) | (68.9%) |
| FBA Retorno Total I | 19 | 23 | 42 | (17.4%) | (54.8%) |
| FBA Renta Publica I | 33 | 31 | 3 | 6.5% | n.m |
| FBA Renta Fija Local | 2 | 2 | 3 | - | (33.3%) |
| Total assets | 244,076 | 231,335 | 221,841 | 5.5% | 10.0% |
| MARKET SHARE - MUTUAL FUNDS | BBVA ASSET MANAGEMENT | ||||
| In % | ∆ bps | ||||
| 1Q22 | 4Q21 | 1Q21 | QoQ | YoY | |
| Mutual funds | 5.81% | 5.53% | 6.29% | (81)bps | 38 bps |
| Source: Cámara Argentina de Fondos Comunes de Inversión | |||||
| 22 |
| |
Other events
Main Relevant Events
| · | As of March 3, 2022, the Board of Directors has resolved to convene the Annual Ordinary and Extraordinary Shareholders General Meeting for April 29, 2022. |
| · | As of March 18, 2022, the transfer of the whole remaining position of the Bank in Prisma Medios de Pago S.A. in favor of AI ZENITH (Netherlands) B.V. (company associated to Advent International Global Private Equity) representing the 5,4496 % of the capital stock of Prisma, has been perfected. The price for such participation amounts to USD 40,038,121.84 and shall be paid as follows: (i) 30% in Pesos Adjustable by CER (UVA) at a 15% nominal annual rate and (ii) 70% in US Dollars at a nominal rate of 10% within six years. |
| · | As of March 29, 2022, the Board of Directors of Banco BBVA Argentina S.A. accepted the resignation of the Regular Director María Isabel Goiri Lartitegui, which shall take effect when the next Meeting of Shareholders is held and her successor is appointed. Thus, it is expressly stated that such resignation was not intentional or untimely but due to personal reasons. |
| · | As of April 12, 2022, BBVA Argentina has filed with the U.S. Securities and Exchange Commission the Annual Report on Form 20-F as of and for the year ended December 31, 2021. |
| · | As of April 29, 2022, concerning the dividends approved by the Shareholders’ Meeting son May 15, 2020 and April 20, 2021, and the General Extraordinary Shareholders’ Meeting son November 20, 2020 and November 3, 2021, the Shareholders’ Meeting on April 29, 2022 approved: a) subject to the procedure to be informed in due course in the payment notice, the payment of the dividend to nonresident shareholders be made with marketable securities, all in accordance with the regulations in force. Notwithstanding the foregoing, it was approved to grant them the option to express their opposition, informing their decision to receive it in Argentine pesos, through a procedure to be informed in due time; b) for the purposes of the authorization request to be made to the BCRA, to estimate 20% of the profits in the amount of $13.2 billion, under the BCRA Rules; and the Board of Directors be delegated the authority to determine, once the BCRA authorization has been obtained, the timing, method, terms, securities to be delivered (if any) and other terms and conditions for the payment of dividends to the shareholders, as well as to designate authorized persons to make the necessary filings with the corresponding agencies. |
Digital Transformation
Digitalization continued to accelerate during 1Q22. Active digital client total more than 2.1 million with a 61.8% penetration over total active clients (3.4[5] million), versus a penetration of 61.9% in 1Q21. Active mobile clients reach 1.8 million, representing a 54.0% penetration in 1Q22, versus a penetration of 52.3% in 1Q21. Digital and mobile transactions[6] increased 22.7% in 1Q22 YoY.
On 1Q22, retail digital sales measured in units reached 82.7% of total sales (vs. 79.0% in 1Q21) and represent 53.3% of the Banks total sales measured in monetary value (vs. 56.2% in 1Q21).
In 1Q22, new client acquisition through digital channels over traditional ones was 66%, while it was 64% on 1Q21.
5 Calculation parameters were modified as of 1Q22
6 Includes online and mobile banking, Net Cash online & mobile.
| 23 |
| |
SMEs Productive investment financing credit lines – March 2021
As of March 31, 2021, total loans granted by the Bank regarding 2020, 2021 and 2021/2022 quotas, complied with what was requested by the BCRA pursuant to Communications “B” 12162, “B” 12164 and “B” 12238 respectively. Within this regulation, the total amount to be granted by the bank on the 2021/2022 quota amounts to $32.4 billion, pursuant to Communication “B” 12238.
Main Regulatory Changes
Monetary policy rate, time deposits, extension of Productive Investment Credit Lines for SMEs. (Communication “A” 7474, 03/22/2022). The BCRA increased the nominal annual rate of 28-day LELIQs by 200 basis points, going from 42.5% to 44.5%. It also increased the minimum interest rates for time deposits. As of March 23, 2022, minimum applicable rates will be: for time deposits under $10 million: 97.75% (43.5% nominal annual rate), all others: 93.26% (41.5% nominal annual rate).
Concerning productive investment credit lines for SMEs, for credits granted as of March 23, 2022, maximum interest rates were increased: from 30% to 35% the nominal annual rate applicable to investment projects, and from 41% to 43% the nominal annual rate applicable to financing to working capital y discounted instruments. Lastly, as of April 2022, interest rates for credit card financing (up to $200,000) rises to 51%.
Interbanking compensation of bills (Communication “A” 7473, 03/22/2022). The BCRA overruled the regulation that allowed financial institutions to subscribe 30-day BCRA Cash Compensation Notes with cash bill positions considered of “good use”, but that should not be affected by the “Cash Interbanking Compensation” in own vaults as well as in armored transportation.
Productive Investment Credit Lines for SMEs (Communication “A” 7475, 03/22/2022). The BCRA extended until September 30, 2022, the Productive Investment Credit Lines for SMEs. It includes, as of April 1, 2022, the “2022 Quota”, with the same conditions as does the 2021/2022 quota, and applies for Group “A” institutions and those which are not in such group but work as financial agents for sovereign, provincial or municipal governments (including the Citi of Buenos Aires).
Minimum reserve requirements. Productive Investment Credit Lines for SMEs. (Communication “A” 7491, 04/13/2022). The BCRA replaces the applicable percentages for the determination of minimum time deposit rates for the following: time deposits made by individuals which do not exceed the amount of $10 million: 97.87%, deposits not included in the previous item: 93.62% (calculated over the monetary policy rate).
| 24 |
| |
Additionally, it increases to 45.50% the nominal annual fixed rate applicable to working capital financing and discounted instruments granted as of April 18, 2022 related to Productive Investment Credit Lines for SMEs.
Finally, it increases from 30% to 34% the percentage of deduction in the average peso reserve requirement from financing related to Productive Investment Credit Lines for SMEs.
On the same date, it has increased the monetary policy rate from 44.50% to 47.00%
Minimum reserve requirements. Integration with bonds. (Communication “A” 7511, 05/12/2022). The BCRA enabled financial institutions to integrate reserve requirements in pesos with National Treasury Bonds in Pesos maturing on May 23, 2027. The bonds used with this purpose will be excluded from limits provided by regulation on nonfinancial public sector financing.
Interest rates. (Communication “A” 7512, 05/12/2022). As of May 13, 2022, the BCRA replaces the applicable percentages for the determination of minimum time deposit rates for the following: time deposits made by individuals which do not exceed the amount of $10 million: 97.96%, deposits not included in the previous item: 93.96% (calculated over the monetary policy rate).
Additionally, it increases to 47.50% the nominal annual fixed rate applicable to working capital financing and discounted instruments related to Productive Investment Credit Lines for SMEs.
Lastly, as of June 2022, interest rates for credit card financing (up to $200,000) rises from 51% to 53%. On the same date, it has increased the monetary policy rate from 47.00% to 49.00%
| 25 |
| |
Glossary
Active clients: holders of at least one active product. An active product is in most cases a product with at least “one movement” in the last 3 months, or a minimum balance.
Cost of Risk (accumulated): Year to date accumulated loan loss allowances / Average total loans.
Average total loans: average between previous year-end Total loans and other financing and current period Total loans and other financing.
Cost of Risk (quarterly): Current period Loan loss allowances / Average total loans. Average total loans: average between previous quarter-end Total loans and other financing and current period Total loans and other financing.
Coverage ratio: Quarterly allowances under the Expected Credit Loss model / total non-performing portfolio.
Digital clients: we consider a customer to be an active user of online banking when they have been logged at least once within the last three months using the internet or a cell phone and SMS banking.
Efficiency ratio (Excl. inflation adjustments, accumulated): Accumulated (Personnel benefits+ Administrative expenses + Depreciation & Amortization) / Accumulated (Net Interest Income + Net Fee Income + Net Income from measurement of Financial Instruments at Fair Value through P&L + Net income from write-down of assets at amortized cost and at fair value through OCI + Foreign exchange and gold gains + some concepts included in Other net operating income).
Efficiency ratio (Excl. inflation adjustments, quarterly): (Personnel benefits+ Administrative expenses + Depreciation & Amortization) / (Net Interest Income + Net Fee Income + Net Income from measurement of Financial Instruments at Fair Value through P&L + Net income from write-down of assets at amortized cost and at fair value through OCI + Foreign exchange and gold gains + some concepts included in Other net operating income).
Efficiency ratio (accumulated): Accumulated (Personnel benefits+ Administrative expenses + Depreciation & Amortization) / Accumulated (Net Interest Income + Net Fee Income + Net Income from measurement of Financial Instruments at Fair Value through P&L + Net income from write-down of assets at amortized cost and at fair value through OCI + Foreign exchange and gold gains + some concepts included in Other net operating income+ Income from net monetary position).
Efficiency ratio (quarterly): (Personnel benefits+ Administrative expenses + Depreciation & Amortization) / (Net Interest Income + Net Fee Income + Net Income from measurement of Financial Instruments at Fair Value through P&L + Net income from write-down of assets at amortized cost and at fair value through OCI + Foreign exchange and gold gains + some concepts included in Other net operating income+ Income from net monetary position).
Liquidity Ratio: (Cash and deposits in banks + Debt securities at fair value through P&L (Excl. Private securities) + Net REPO transactions + Other debt securities (Excl. Private securities) / Total Deposits.
| 26 |
| |
Mobile clients: customers who have been active in online banking at least once in the last three months using a mobile device.
Net Interest Margin (NIM) – (quarterly): Quarterly Net Interest Income / Average quarterly interest earning assets.
Public Sector Exposure (excl. BCRA): (National and Provincial Government public debt + Loans to the public sector + REPO transactions) / Total Assets.
ROA (accumulated): Accumulated net Income of the period attributable to owners of the parent / Total Average Assets. Total Average Assets is calculated as the average between total assets on December of the previous year and total assets in the current period, expressed in local currency. Calculated over a 365-day year.
ROA (quarterly): Net Income of the period attributable to owners of the parent / Total Average Assets. Total Average Assets is calculated as the average between total assets on the previous quarter-end and total assets in the current period, expressed in local currency. Calculated over a 365-day year.
ROE (accumulated): Accumulated net Income of the period attributable to owners of the parent / Average Equity. Average Equity is calculated as the average between equity in December of the previous year and equity in the current period, expressed in local currency. Calculated over a 365-day year.
ROE (quarterly): Net Income of the period attributable to owners of the parent / Average Equity. Average Equity is calculated as the average between equity on the previous quarter end and equity in the current period, expressed in local currency. Calculated over a 365-day year.
Spread: (Quarterly Interest Income / Quarterly average Interest-earning Assets) – (Quarterly Interest Expenses / Quarterly average interest-bearing liabilities).
Other terms
n.m.: not meaningful. Implies an increase above 500% and a decrease below -500%.
N/A: not applicable.
Bps: basis points.
| 27 |
| |
Balance Sheet
| BALANCE SHEET | BBVA ARGENTINA CONSOLIDATED | ||||
| In millions of AR$ - Inflation adjusted | ∆ % | ||||
| 1Q22 | 4Q21 | 1Q21 | QoQ | YoY | |
| Assets | |||||
| Cash and deposits in banks | 198,969 | 253,432 | 303,598 | (21.5%) | (34.5%) |
| Cash | 74,633 | 86,186 | 102,273 | (13.4%) | (27.0%) |
| Financial institutions and correspondents | 124,336 | 167,246 | 201,325 | (25.7%) | (38.2%) |
| BCRA | 115,925 | 164,800 | 194,959 | (29.7%) | (40.5%) |
| Other local and foreign financial institutions | 8,411 | 2,446 | 6,366 | 243.9% | 32.1% |
| Debt securities at fair value through profit or loss | 10,382 | 1,621 | 7,556 | n.m | 37.4% |
| Derivatives | 996 | 3,269 | 3,840 | (69.5%) | (74.1%) |
| Repo transactions | 67,419 | 159,652 | 47,261 | (57.8%) | 42.7% |
| Other financial assets | 21,721 | 17,034 | 21,434 | 27.5% | 1.3% |
| Loans and other financing | 405,824 | 439,950 | 441,514 | (7.8%) | (8.1%) |
| Non-financial public sector | 1 | 1 | 1 | - | - |
| B.C.R.A | 3 | - | - | N/A | N/A |
| Other financial institutions | 4,565 | 4,887 | 3,081 | (6.6%) | 48.2% |
| Non-financial private sector and residents abroad | 401,255 | 435,062 | 438,432 | (7.8%) | (8.5%) |
| Other debt securities | 359,630 | 214,718 | 209,501 | 67.5% | 71.7% |
| Financial assets pledged as collateral | 23,106 | 23,540 | 25,817 | (1.8%) | (10.5%) |
| Current income tax assets | 2,350 | 2,617 | 2,111 | (10.2%) | 11.3% |
| Investments in equity instruments | 513 | 2,574 | 3,534 | (80.1%) | (85.5%) |
| Investments in subsidiaries and associates | 2,249 | 2,381 | 2,458 | (5.5%) | (8.5%) |
| Property and equipment | 58,289 | 59,104 | 58,384 | (1.4%) | (0.2%) |
| Intangible assets | 4,588 | 4,266 | 2,958 | 7.5% | 55.1% |
| Deferred income tax assets | 1,005 | 1,017 | 6,492 | (1.2%) | (84.5%) |
| Other non-financial assets | 11,689 | 10,216 | 13,960 | 14.4% | (16.3%) |
| Non-current assets held for sale | 351 | 351 | 396 | - | (11.4%) |
| Total Assets | 1,169,081 | 1,195,742 | 1,150,814 | (2.2%) | 1.6% |
| Liabilities | |||||
| Deposits | 797,314 | 822,163 | 787,662 | (3.0%) | 1.2% |
| Non-financial public sector | 17,411 | 15,408 | 10,209 | 13.0% | 70.5% |
| Financial sector | 292 | 252 | 278 | 15.9% | 5.0% |
| Non-financial private sector and residents abroad | 779,611 | 806,503 | 777,175 | (3.3%) | 0.3% |
| Derivatives | 327 | 365 | 619 | (10.4%) | (47.2%) |
| Other financial liabilities | 69,565 | 71,490 | 69,663 | (2.7%) | (0.1%) |
| Financing received from the B.C.R.A. and other financial institutions | 12,229 | 13,647 | 15,159 | (10.4%) | (19.3%) |
| Corporate bonds issued | 449 | 584 | 1,586 | (23.1%) | (71.7%) |
| Current income tax liabilities | 547 | 411 | 2,464 | 33.1% | (77.8%) |
| Provisions | 5,814 | 6,515 | 16,233 | (10.8%) | (64.2%) |
| Deferred income tax liabilities | 11,572 | 9,528 | 113 | 21.5% | n.m |
| Other non-financial liabilities | 77,113 | 82,295 | 71,333 | (6.3%) | 8.1% |
| Total Liabilities | 974,930 | 1,006,998 | 964,832 | (3.2%) | 1.0% |
| Equity | |||||
| Share Capital | 613 | 613 | 613 | - | - |
| Non-capitalized contributions | 46,229 | 46,229 | 46,229 | - | - |
| Capital adjustments | 33,118 | 33,118 | 33,118 | - | - |
| Reserves | 81,422 | 81,422 | 151,251 | - | (46.2%) |
| Retained earnings | 22,857 | (1,756) | (53,319) | n.m | 142.9% |
| Other accumulated comprehensive income | 2,133 | 809 | (259) | 163.6% | n.m |
| Income for the period | 4,187 | 24,587 | 4,667 | (83.0%) | (10.3%) |
| Equity attributable to owners of the Parent | 190,559 | 185,022 | 182,300 | 3.0% | 4.5% |
| Equity attributable to non-controlling interests | 3,592 | 3,722 | 3,682 | (3.5%) | (2.4%) |
| Total Equity | 194,151 | 188,744 | 185,982 | 2.9% | 4.4% |
| Total Liabilities and Equity | 1,169,081 | 1,195,742 | 1,150,814 | (2.2%) | 1.6% |
| 28 |
| |
Balance Sheet – 5 Quarters
| BALANCE SHEET | BBVA ARGENTINA CONSOLIDATED | ||||
| In millions of AR$ - Inflation adjusted | |||||
| 1Q22 | 4Q21 | 3Q21 | 2Q21 | 1Q21 | |
| Assets | |||||
| Cash and deposits in banks | 198,969 | 253,432 | 252,341 | 277,255 | 303,598 |
| Cash | 74,633 | 86,186 | 62,855 | 82,784 | 102,273 |
| Financial institutions and correspondents | 124,336 | 167,246 | 189,486 | 194,471 | 201,325 |
| B.C.R.A | 115,925 | 164,800 | 185,474 | 189,003 | 194,959 |
| Other local and foreign financial institutions | 8,411 | 2,446 | 4,012 | 5,468 | 6,366 |
| Debt securities at fair value through profit or loss | 10,382 | 1,621 | 8,378 | 6,322 | 7,556 |
| Derivatives | 996 | 3,269 | 4,151 | 3,686 | 3,840 |
| Repo transactions | 67,419 | 159,652 | 139,126 | 147,155 | 47,261 |
| Other financial assets | 21,721 | 17,034 | 25,039 | 21,318 | 21,434 |
| Loans and other financing | 405,824 | 439,950 | 418,707 | 429,068 | 441,514 |
| Non-financial public sector | 1 | 1 | 1 | - | 1 |
| B.C.R.A | 3 | - | - | - | - |
| Other financial institutions | 4,565 | 4,887 | 4,400 | 3,310 | 3,081 |
| Non-financial private sector and residents abroad | 401,255 | 435,062 | 414,306 | 425,758 | 438,432 |
| Other debt securities | 359,630 | 214,718 | 221,694 | 214,961 | 209,501 |
| Financial assets pledged as collateral | 23,106 | 23,540 | 20,482 | 23,316 | 25,817 |
| Current income tax assets | 2,350 | 2,617 | 2,658 | 6,754 | 2,111 |
| Investments in equity instruments | 513 | 2,574 | 2,744 | 2,974 | 3,534 |
| Investments in subsidiaries and associates | 2,249 | 2,381 | 2,499 | 2,868 | 2,458 |
| Property and equipment | 58,289 | 59,104 | 57,010 | 57,632 | 58,384 |
| Intangible assets | 4,588 | 4,266 | 3,656 | 3,318 | 2,958 |
| Deferred income tax assets | 1,005 | 1,017 | 854 | 910 | 6,492 |
| Other non-financial assets | 11,689 | 10,216 | 9,723 | 10,444 | 13,960 |
| Non-current assets held for sale | 351 | 351 | 396 | 396 | 396 |
| Total Assets | 1,169,081 | 1,195,742 | 1,169,458 | 1,208,377 | 1,150,814 |
| Liabilities | |||||
| Deposits | 797,314 | 822,163 | 806,893 | 851,518 | 787,662 |
| Non-financial public sector | 17,411 | 15,408 | 13,054 | 9,955 | 10,209 |
| Financial sector | 292 | 252 | 263 | 610 | 278 |
| Non-financial private sector and residents abroad | 779,611 | 806,503 | 793,576 | 840,953 | 777,175 |
| Liabilities at fair value through profit or loss | - | - | 61 | - | - |
| Derivatives | 327 | 365 | 450 | 198 | 619 |
| Other financial liabilities | 69,565 | 71,490 | 69,734 | 65,554 | 69,663 |
| Financing received from the B.C.R.A. and other financial institutions | 12,229 | 13,647 | 13,898 | 13,582 | 15,159 |
| Corporate bonds issued | 449 | 584 | 582 | 1,217 | 1,586 |
| Current income tax liabilities | 547 | 411 | 250 | 114 | 2,464 |
| Provisions | 5,814 | 6,515 | 6,747 | 8,859 | 16,233 |
| Deferred income tax liabilities | 11,572 | 9,528 | 6,301 | 4,796 | 113 |
| Other non-financial liabilities | 77,113 | 82,295 | 74,703 | 76,750 | 71,333 |
| Total Liabilities | 974,930 | 1,006,998 | 979,619 | 1,022,588 | 964,832 |
| Equity | |||||
| Share Capital | 613 | 613 | 613 | 613 | 613 |
| Non-capitalized contributions | 46,229 | 46,229 | 46,229 | 46,229 | 46,229 |
| Capital adjustments | 33,118 | 33,118 | 33,118 | 33,118 | 33,118 |
| Reserves | 81,422 | 81,422 | 89,256 | 89,256 | 151,251 |
| Retained earnings | 22,857 | (1,756) | (1,756) | (1,756) | (53,319) |
| Other accumulated comprehensive income | 2,133 | 809 | (396) | (113) | (259) |
| Income for the period | 4,187 | 24,587 | 19,082 | 14,759 | 4,667 |
| Equity attributable to owners of the Parent | 190,559 | 185,022 | 186,146 | 182,106 | 182,300 |
| Equity attributable to non-controlling interests | 3,592 | 3,722 | 3,693 | 3,683 | 3,682 |
| Total Equity | 194,151 | 188,744 | 189,839 | 185,789 | 185,982 |
| Total Liabilities and Equity | 1,169,081 | 1,195,742 | 1,169,458 | 1,208,377 | 1,150,814 |
| 29 |
| |
Balance Sheet – Foreign Currency Exposure
| FOREIGN CURRENCY EXPOSURE | BBVA ARGENTINA CONSOLIDATED | ||||
| In millions of AR$ - Inflation adjusted | ∆ % | ||||
| 1Q22 | 4Q21 | 1Q21 | QoQ | YoY | |
| Assets | |||||
| Cash and deposits in banks | 156,431 | 173,886 | 196,729 | (10.0%) | (20.5%) |
| Debt securities at fair value through profit or loss | 741 | - | 1 | N/A | n.m |
| Other financial assets | 5,251 | 3,353 | 3,803 | 56.6% | 38.1% |
| Loans and other financing | 21,014 | 22,092 | 44,997 | (4.9%) | (53.3%) |
| Other financial institutions | - | 195 | 457 | (100.0%) | (100.0%) |
| Non-financial private sector and residents abroad | 21,014 | 21,897 | 44,540 | (4.0%) | (52.8%) |
| Other debt securities | 2,225 | 2,494 | - | (10.8%) | N/A |
| Financial assets pledged as collateral | 5,790 | 6,528 | 7,677 | (11.3%) | (24.6%) |
| Investments in equity instruments | 36 | 42 | 45 | (14.3%) | (20.0%) |
| Total foreign currency assets | 191,488 | 208,395 | 253,252 | (8.1%) | (24.4%) |
| Liabilities | |||||
| Deposits | 174,203 | 192,944 | 227,640 | (9.7%) | (23.5%) |
| Non-Financial Public Sector | 7,172 | 3,728 | 3,487 | 92.4% | 105.7% |
| Financial Sector | 45 | 41 | 84 | 9.8% | (46.4%) |
| Non-financial private sector and residents abroad | 166,986 | 189,175 | 224,069 | (11.7%) | (25.5%) |
| Other financial liabilities | 13,813 | 11,926 | 19,609 | 15.8% | (29.6%) |
| Financing received from the B.C.R.A. and other financial institutions | 498 | 591 | 3,815 | (15.7%) | (86.9%) |
| Other non financial liabilities | 4,539 | 5,018 | 2,457 | (9.5%) | 84.7% |
| Total foreign currency liabilities | 193,053 | 210,479 | 253,521 | (8.3%) | (23.9%) |
| Foreign Currency Net Position - AR$ | (1,565) | (2,084) | (269) | 24.9% | (481.8%) |
| Foreign Currency Net Position - USD | (14) | (20) | (3) | 30.5% | (382.3%) |
| *Wholesale U.S. dollar foreign exchange rates on BCRA’s Communication “A” 3500, as of the end of period. | |||||
| 30 |
| |
Income Statement
| INCOME STATEMENT | BBVA ARGENTINA CONSOLIDATED | ||||
| In millions of AR$ - Inflation adjusted | ∆ % | ||||
| 1Q22 | 4Q21 | 1Q21 | QoQ | YoY | |
| Interest income | 69,020 | 64,888 | 56,932 | 6.4% | 21.2% |
| Interest expense | (29,791) | (25,909) | (23,510) | (15.0%) | (26.7%) |
| Net interest income | 39,229 | 38,978 | 33,422 | 0.6% | 17.4% |
| Fee income | 12,955 | 13,429 | 11,909 | (3.5%) | 8.8% |
| Fee expenses | (6,321) | (6,665) | (6,705) | 5.2% | 5.7% |
| Net fee income | 6,634 | 6,765 | 5,204 | (1.9%) | 27.5% |
| Net income from financial instruments at fair value through P&L | 4,086 | (262) | 2,482 | n.m | 64.6% |
| Net loss from write-down of assets at amortized cost and fair value through OCI | (34) | (21) | (51) | (61.9%) | 33.3% |
| Foreign exchange and gold gains | 1,712 | 1,892 | 1,389 | (9.5%) | 23.3% |
| Other operating income | 3,373 | 2,435 | 2,399 | 38.5% | 40.6% |
| Loan loss allowances | (2,269) | (515) | (2,968) | (340.6%) | 23.6% |
| Net operating income | 52,731 | 49,272 | 41,877 | 7.0% | 25.9% |
| Personnel benefits | (9,065) | (8,955) | (9,059) | (1.2%) | (0.1%) |
| Administrative expenses | (9,515) | (9,898) | (8,270) | 3.9% | (15.1%) |
| Depreciation and amortization | (1,634) | (1,630) | (1,657) | (0.2%) | 1.4% |
| Other operating expenses | (7,754) | (8,503) | (7,209) | 8.8% | (7.6%) |
| Operating expenses | (27,968) | (28,986) | (26,195) | 3.5% | (6.8%) |
| Operating income | 24,763 | 20,286 | 15,682 | 22.1% | 57.9% |
| Income from associates and joint ventures | (267) | (133) | (46) | (100.8%) | (480.4%) |
| Income from net monetary position | (18,729) | (11,870) | (11,711) | (57.8%) | (59.9%) |
| Income before income tax | 5,767 | 8,283 | 3,925 | (30.4%) | 46.9% |
| Income tax | (1,733) | (2,747) | 677 | 36.9% | (356.0%) |
| Income for the period | 4,034 | 5,536 | 4,602 | (27.1%) | (12.3%) |
| Owners of the parent | 4,187 | 5,505 | 4,667 | (23.9%) | (10.3%) |
| Non-controlling interests | (153) | 29 | (65) | n.m | (135.4%) |
| Other comprehensive Income (1) | 1,324 | 1,206 | (288) | 9.8% | n.m |
| Total comprehensive income | 5,358 | 6,742 | 4,314 | (20.5%) | 24.2% |
| (1) Net of Income Tax. | |||||
| 31 |
| |
Income Statement – 3 month accumulated
| INCOME STATEMENT - 3 MONTH ACCUMULATED | BBVA ARGENTINA CONSOLIDATED | ||
| In millions of AR$ - Inflation adjusted | |||
| 2022 | 2021 | ∆ % | |
| Interest income | 69,020 | 56,932 | 21.2% |
| Interest expense | (29,791) | (23,510) | (26.7%) |
| Net interest income | 39,229 | 33,422 | 17.4% |
| Fee income | 12,955 | 11,909 | 8.8% |
| Fee expenses | (6,321) | (6,705) | 5.7% |
| Net fee income | 6,634 | 5,204 | 27.5% |
| Net income from financial instruments at fair value through P&L | 4,086 | 2,482 | 64.6% |
| Net loss from write-down of assets at amortized cost and fair value through OCI | (34) | (51) | 33.3% |
| Foreign exchange and gold gains | 1,712 | 1,389 | 23.3% |
| Other operating income | 3,373 | 2,399 | 40.6% |
| Loan loss allowances | (2,269) | (2,968) | 23.6% |
| Net operating income | 52,731 | 41,877 | 25.9% |
| Personnel benefits | (9,065) | (9,059) | (0.1%) |
| Administrative expenses | (9,515) | (8,270) | (15.1%) |
| Depreciation and amortization | (1,634) | (1,657) | 1.4% |
| Other operating expenses | (7,754) | (7,209) | (7.6%) |
| Operating expenses | (27,968) | (26,195) | (6.8%) |
| Operating income | 24,763 | 15,682 | 57.9% |
| Income from associates and joint ventures | (267) | (46) | (480.4%) |
| Income from net monetary position | (18,729) | (11,711) | (59.9%) |
| Income before income tax | 5,767 | 3,925 | 46.9% |
| Income tax | (1,733) | 677 | (356.0%) |
| Income for the period | 4,034 | 4,602 | (12.3%) |
| Owners of the parent | 4,187 | 4,667 | (10.3%) |
| Non-controlling interests | (153) | (65) | (135.4%) |
| Other comprehensive Income (OCI) (1) | 1,324 | (288) | n.m |
| Total comprehensive income | 5,358 | 4,314 | 24.2% |
| (1) Net of Income Tax. | |||
| 32 |
| |
Income Statement – 5 Quarters
| INCOME STATEMENT | BBVA ARGENTINA CONSOLIDATED | ||||
| In millions of AR$ - Inflation adjusted | |||||
| 1Q22 | 4Q21 | 3Q21 | 2Q21 | 1Q21 | |
| Interest income | 69,020 | 64,888 | 66,569 | 61,048 | 56,932 |
| Interest expense | (29,791) | (25,909) | (29,205) | (27,067) | (23,510) |
| Net interest income | 39,229 | 38,978 | 37,364 | 33,979 | 33,422 |
| Fee income | 12,955 | 13,429 | 13,219 | 13,332 | 11,909 |
| Fee expenses | (6,321) | (6,665) | (5,304) | (5,742) | (6,705) |
| Net fee income | 6,634 | 6,765 | 7,915 | 7,590 | 5,204 |
| Net income from financial instruments at fair value through P&L | 4,086 | (262) | 1,095 | 1,750 | 2,482 |
| Net loss from write-down of assets at amortized cost and fair value through OCI | (34) | (21) | (48) | (23) | (51) |
| Foreign exchange and gold gains | 1,712 | 1,892 | 1,498 | 1,652 | 1,389 |
| Other operating income | 3,373 | 2,435 | 2,025 | 2,533 | 2,399 |
| Loan loss allowances | (2,269) | (515) | (3,141) | (2,971) | (2,968) |
| Net operating income | 52,731 | 49,272 | 46,708 | 44,510 | 41,877 |
| Personnel benefits | (9,065) | (8,955) | (9,442) | (8,890) | (9,059) |
| Administrative expenses | (9,515) | (9,898) | (11,259) | (8,218) | (8,270) |
| Depreciation and amortization | (1,634) | (1,630) | (1,529) | (1,662) | (1,657) |
| Other operating expenses | (7,754) | (8,503) | (7,502) | (7,777) | (7,209) |
| Operating expenses | (27,968) | (28,986) | (29,732) | (26,547) | (26,195) |
| Operating income | 24,763 | 20,286 | 16,976 | 17,963 | 15,682 |
| Income from associates and joint ventures | (267) | (133) | (114) | 243 | (46) |
| Income from net monetary position | (18,729) | (11,870) | (10,598) | (12,211) | (11,711) |
| Income before income tax | 5,767 | 8,283 | 6,264 | 5,995 | 3,925 |
| Income tax | (1,733) | (2,747) | (1,934) | 4,097 | 677 |
| Income for the period | 4,034 | 5,536 | 4,330 | 10,092 | 4,602 |
| Owners of the parent | 4,187 | 5,505 | 4,324 | �� 10,091 | 4,667 |
| Non-controlling interests | (153) | 29 | 9 | 2 | (65) |
| Other comprehensive Income (OCI)(1) | 1,324 | 1,206 | (283) | 104 | (288) |
| Total comprehensive income | 5,358 | 6,742 | 4,050 | 10,199 | 4,314 |
| (1) Net of Income Tax. | |||||
| 33 |
| |
Ratios
| QUARTERLY ANNUALIZED RATIOS | BBVA ARGENTINA CONSOLIDATED | ||||
| In % | ∆ bps | ||||
| 1Q22 | 4Q21 | 1Q21 | QoQ | YoY | |
| Profitability | |||||
| Efficiency Ratio | 72.2% | 67.3% | 72.5% | 496 bps | (25)bps |
| Efficiency Ratio (excl. Inflation adjustments) | 43.3% | 48.4% | 50.1% | (511)bps | (682)bps |
| ROA | 1.4% | 1.8% | 1.6% | (41)bps | (17)bps |
| ROE | 9.0% | 11.8% | 10.5% | (273)bps | (146)bps |
| Liquidity | |||||
| Liquid assets / Total Deposits | 79.6% | 76.4% | 72.0% | 327 bps | 760 bps |
| Capital | |||||
| Regulatory Capital Ratio | 23.54% | 20.81% | 22.35% | 274 bps | 119 bps |
| TIER I Capital Ratio (Ordinary Capital Level 1/ RWA) | 23.31% | 20.28% | 21.73% | 304 bps | 158 bps |
| Asset Quality | |||||
| Total non-performing portfolio / Total portfolio | 1.29% | 1.87% | 1.72% | (58)bps | (43)bps |
| Allowances /Total non-performing portfolio | 219.75% | 181.90% | 275.23% | 3,785 bps | (5,548)bps |
| Cost of Risk | 2.11% | 0.46% | 2.47% | 165 bps | (36)bps |
| ACCUMULATED ANNUALIZED RATIOS | BBVA ARGENTINA CONSOLIDATED | ||||
| In % | ∆ bps | ||||
| 1Q22 | 4Q21 | 1Q21 | QoQ | YoY | |
| Profitability | |||||
| Efficiency Ratio | 72.24% | 69.07% | 72.49% | 317 bps | (25)bps |
| Efficiency Ratio (excl. Inflation adjustments) | 43.26% | 49.38% | 50.08% | (612)bps | (682)bps |
| ROA | 1.44% | 2.05% | 1.61% | (61)bps | (17)bps |
| ROE | 9.04% | 13.54% | 10.51% | (450)bps | (146)bps |
| Liquidity | |||||
| Liquid assets / Total Deposits | 79.64% | 76.36% | 72.04% | 327 bps | 760 bps |
| Capital | |||||
| Regulatory Capital Ratio | 23.54% | 20.81% | 22.35% | 274 bps | 119 bps |
| TIER I Capital Ratio (Ordinary Capital Level 1/ RWA) | 23.31% | 20.28% | 21.73% | 304 bps | 158 bps |
| Asset Quality | |||||
| Total non-performing portfolio / Total portfolio | 1.29% | 1.87% | 1.72% | (58)bps | (43)bps |
| Allowances /Total non-performing portfolio | 219.75% | 181.90% | 275.23% | 3,785 bps | (5,548)bps |
| Cost of Risk | 2.11% | 2.14% | 2.47% | (4)bps | (36)bps |
| 34 |
| |
About BBVA Argentina
BBVA Argentina (NYSE; BYMA; MAE: BBAR; LATIBEX: XBBAR) is a subsidiary of the BBVA Group, the main shareholder since 1996. In Argentina, it is one of the leading private financial institutions since 1886. Nationwide, BBVA Argentina offers retail and corporate banking to a broad customer base, including: individuals, SME’s, and large-sized companies.
BBVA Argentina’s purpose is to bring the age of opportunities to everyone, based on our customers’ real needs, providing the best solutions, and helping them make the best financial decisions through an easy and convenient experience. The institution relies on solid values: “The customer comes first, We think big and We are one team”. At the same time, its responsible banking model aspires to achieve a more inclusive and sustainable society.
Investor Relations Contact
Ernesto Gallardo
Chief Financial Officer
Inés Lanusse
Investor Relations Officer
Belén Fourcade
Investor Relations
investorelations-arg@bbva.com
ir.bbva.com.ar
| 35 |
| |
SIGNATURES
Pursuant to the requirements of the Securities Exchange Act of 1934, the registrant has duly caused this report to be signed on its behalf by the undersigned, thereunto duly authorized.
| Banco BBVA Argentina S.A. | |||||
| Date: | May 19, 2022 | By: | /s/ Ernesto Gallardo Jimenez | ||
| Name: | Ernesto Gallardo Jimenez | ||||
| Title: | Chief Financial Officer | ||||