FORM 6-K
SECURITIES AND EXCHANGE COMMISSION
Washington, D.C. 20549
Report of Foreign Issuer
Pursuant to Rule 13a-16 or 15d-16
of the Securities Exchange Act of 1934
For the month of August 2023
Commission File Number: 001-12568
BBVA Argentina Bank S.A.
(Translation of registrant’s name into English)
111 Córdoba Av, C1054AAA
Buenos Aires, Argentina
(Address of principal executive offices)
Indicate by check mark whether the registrant files or will file annual reports under cover of Form 20-F or Form 40-F:
| Form 20-F | X | Form 40-F |
Indicate by check mark if the registrant is submitting the Form 6-K in paper as permitted by Regulation S-T Rule 101(b)(1):
| Yes | No | X |
Indicate by check mark if the registrant is submitting the Form 6-K in paper as permitted by Regulation S-T Rule 101(b)(7):
| Yes | No | X |
Indicate by check mark whether by furnishing the information contained in this Form, the Registrant is also thereby furnishing the information to the Commission pursuant to Rule 12g3-2(b) under the Securities Exchange Act of 1934:
| Yes | No | X |
If “Yes” is marked, indicate below the file number assigned to the registrant in connection with Rule 12g3-2(b): N/A
Banco BBVA Argentina S.A.
TABLE OF CONTENTS
Item | |
| 1. | Banco BBVA Argentina S.A. reports consolidated second quarter earnings for fiscal year 2023. |


 |
Banco BBVA Argentina S.A. announces Second Quarter 2023 results
Buenos Aires, August 23, 2023 – Banco BBVA Argentina S.A (NYSE; BYMA; MAE: BBAR; LATIBEX: XBBAR) (“BBVA Argentina” or “BBVA” or “the Bank”) announced today its consolidated results for the second quarter (2Q23), ended on June 30, 2023.
As of January 1, 2020, the Bank started to inform its inflation adjusted results pursuant to IAS 29 reporting. To facilitate comparison, figures of comparable quarters of 2022 and 2023 have been updated according to IAS 29 reporting to reflect the accumulated effect of inflation adjustment for each period up to June 30, 2023.
2Q23 Highlights
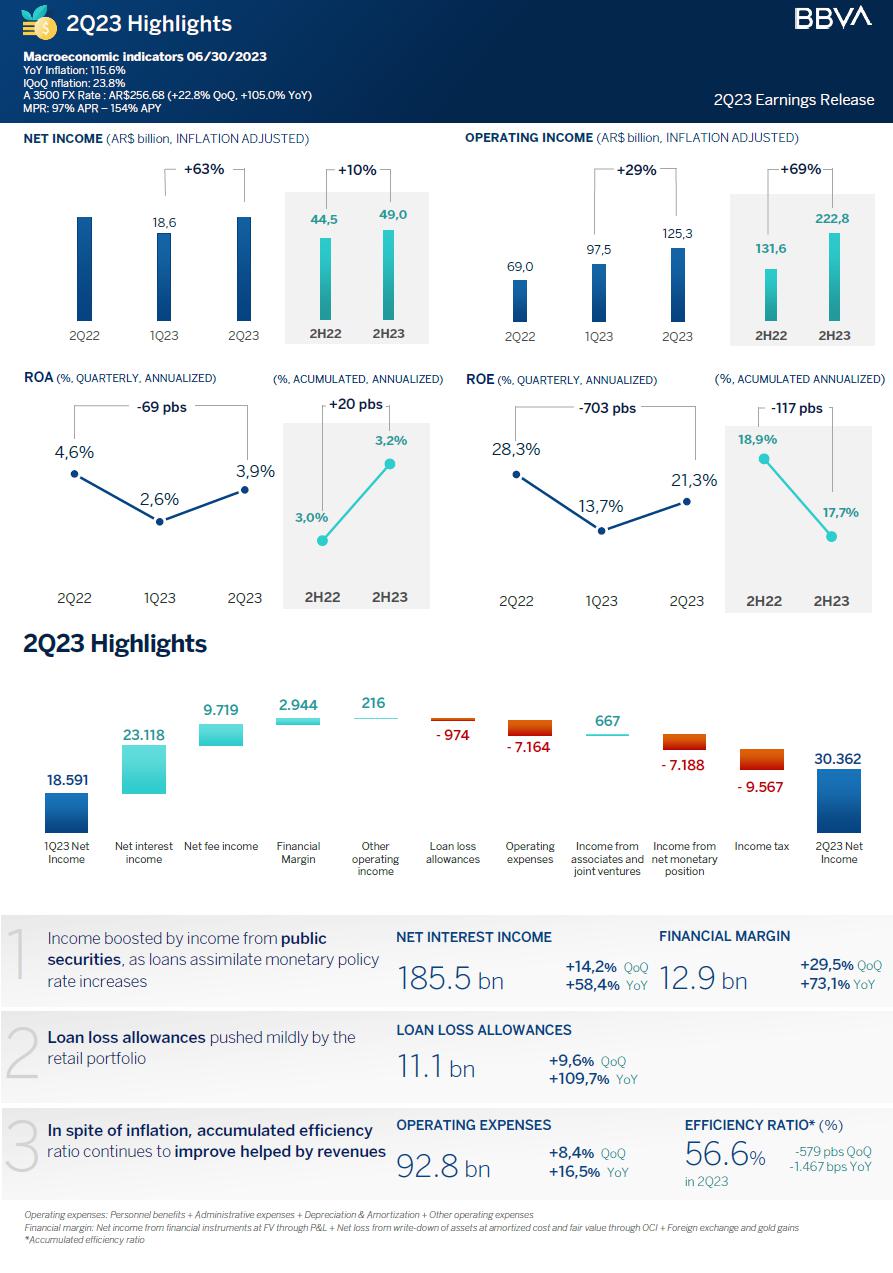
| · | BBVA Argentina’s inflation adjusted net income in 2Q23 was $30.4 billion, 63.3% greater than the $18.6 billion reported on the first quarter of 2023 (1Q23), and 11.4% lower than the $34.3 billion reported on the second quarter of 2022 (2Q22). BBVA Argentina’s inflation adjusted net income for the first half of 2023 (2H23) totaled $49.0 billion, 10.1% higher than the $44.5 billion reported in the first half of 2022 (2H22). |
| · | In 2Q23, BBVA Argentina posted an inflation adjusted average return on assets (ROAA) of 3.9% and an inflation adjusted average return on equity (ROAE) of 21.3%. In 2H23, BBVA Argentina posted an inflation adjusted ROAA of 3.2% and an inflation adjusted ROAE of 17.7%. |
| · | Operating income in 2Q23 was $125.3 billion, 28.6% above the $97.5 billion recorded in 1Q23 and 81.7% over the $69.0 billion recorded in 2Q22. In 2H23, operating income was $222.8 billion, 69.3% above the $131.6 billion recorded in 2H22. |
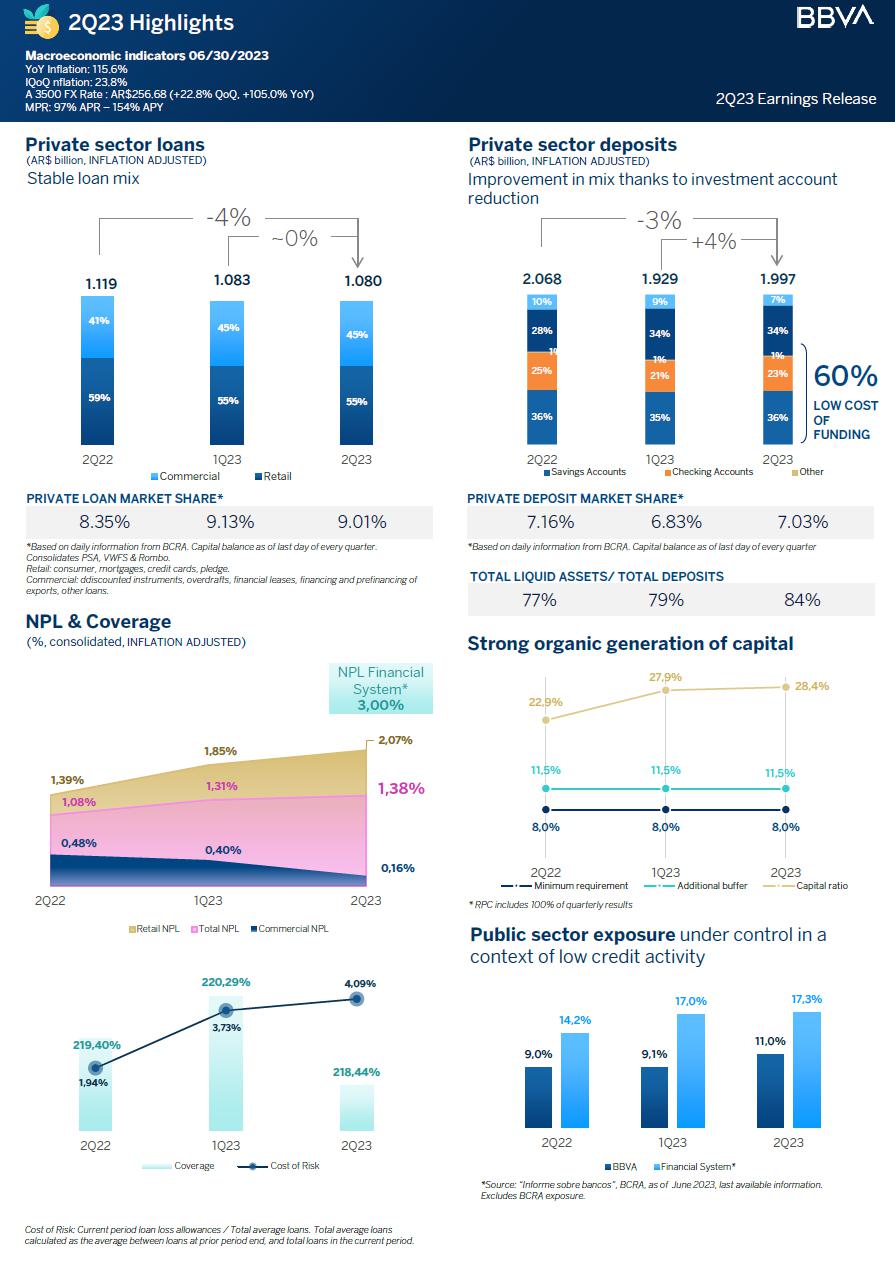
| · | In terms of activity, total consolidated financing to the private sector in 2Q23 totaled $1.1 trillion, remaining practically stable with a mild fall of 0.3% in real terms compared to 1Q23, and contracting 3.5% compared to 2Q22. In the quarter, the variation was mainly driven by a decline in overdrafts by 37.5%, offset by an increase in discounted instruments and other loans by 18.3% and 9.0% respectively. BBVA’s consolidated market share of private sector loans reached 9.01% as of 2Q23. |
| · | Total consolidated deposits in 2Q23 totaled $2.0 trillion, increasing 3.3% in real terms during the quarter, and falling 4.3% in the year. Quarterly increase was mainly explained by sight deposits, which grew 8.3%. The Bank’s consolidated market share of private deposits reached 7.03% as of 2Q23. |
| · | As of 2Q23, the non-performing loan ratio (NPL) reached 1.38%, with a 218.44% coverage ratio. |
| · | The accumulated efficiency ratio in 2Q23 was 56.6%, below 1Q23’s 62.4%, and 2Q22’s 71.3%. |
| · | As of 2Q23, BBVA Argentina reached a regulatory capital ratio of 28.4%, entailing a $369.5 billion or 247.4% excess over minimum regulatory requirement. Tier I ratio was 28.0%. |
| · | Total liquid assets represented 84.1% of the Bank’s total deposits as of 2Q23. |
| 1 |
| |
Message from the CFO
“On Sunday, August 13, Javier Milei, the candidate for “La Libertad Avanza”, was the most voted in the primary presidential elections, gaining 30.2% of total votes, quite above what surveys were estimating. In the second place were the sum of candidates running for “Juntos por el Cambio”, and in third place ended the sum of candidates for “Union por la Patria”. This implies a high uncertainty scenario facing the general elections in October, and it is expectable that high volatility will persist in financial indicators in an already deteriorated macroeconomic environment.
At the same time, the unfavorable macroeconomic conditions have continued to deteriorate, increasing the risk of economic and financial turbulence ahead of the presidential elections scheduled for the last quarter of the year. GDP is expected to fall by around 3.5% this year, 100 basis points more than previously forecast by BBVA Research (-2.5%), due to the impact of the negative weather shock on the production and export of agricultural goods, coupled with increasing exchange rate restrictions and political uncertainty. In this context, its impact on the external and fiscal accounts has contributed to accelerate the exchange rate depreciation and inflation, which in annual terms reached 113.4% in July.
In June 2023, private credit in pesos for the system grew 92% YoY, while BBVA Argentina increased its private loan portfolio in pesos by 113%. Neither the System, nor Bank’s YoY loan growth exceeded that of inflation (which reached 115.6% YoY as of June 2023). Consolidated market share increased 66bps from 8.35% to 9.01% YoY. Regarding consolidated private deposits, the system grew 108% while the Bank grew 105%, in both cases neither beating inflation in the year. Consolidated market share of deposits for BBVA Argentina was 7.03%, lower than the 7.16% recorded the prior year.
Referring to BBVA Argentina performance, a better operating income in the second quarter 2023 was a product of an improvement in interest income, boosted especially by government securities and liquidity instruments, and better fee income.
As of June 2023, BBVA Argentina reached an NPL ratio of 1.38%, way below the last available system NPL (June 2023) of 3.0%. Concerning liquidity and solvency indicators, the Bank ends the quarter with 84.1% and 28.4% respectively, levels which undoubtedly allow to address business growth in the case of an economic recovery.
As of the date of this report, BBVA Argentina has distributed 3 of the 6 installments scheduled on dividend payments, from $50.4 billion total to be paid, according to the plan published on June 7, 2023, on the terms agreed with the Central Bank.
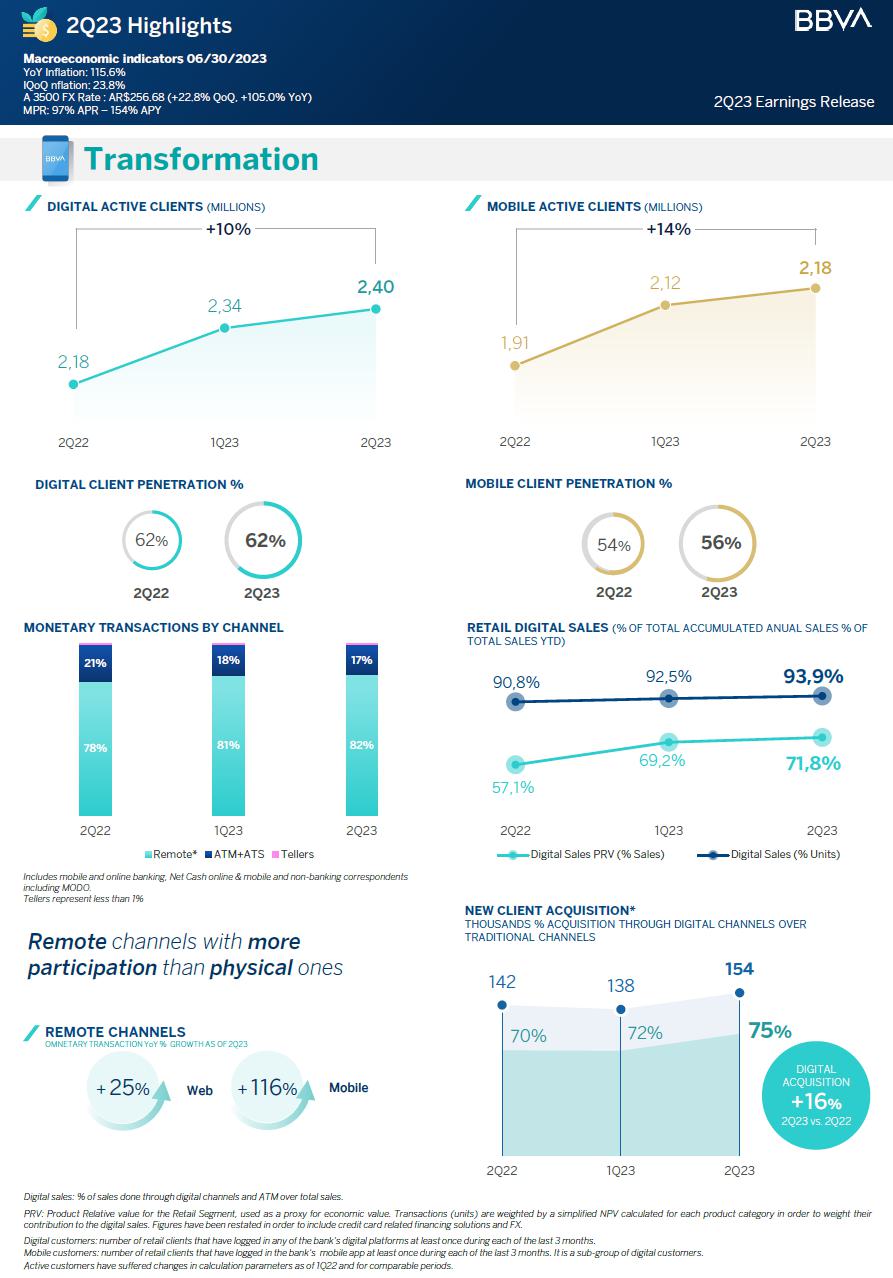
On digitalization, our service offering has evolved in such way that by the end of June 2023, retail digital client penetration reached 62%, remaining stable versus a year back, while that of retail mobile clients reached 56% from 54% in the same period. In the quarter, new client acquisition through digital channels over traditional ones was 75%, while in 2Q22 it was 70%.
BBVA Argentina has a corporate responsibility with society, inherent to the Bank’s business model, which bolsters inclusion, financial education and supports scientific research and culture. The Bank works with the highest integrity, long-term vision and best practices, and is present through the BBVA Group in the main sustainability indexes.
Lastly, the Bank actively monitors its business, financial conditions and operating results, in the aim of keeping a competitive position to face contextual challenges in a decisive year for the Argentine Republic.”
Carmen Morillo Arroyo, CFO at BBVA Argentina
2Q23 Conference Call
Thursday, August 24 - 12:00 p.m. Buenos Aires time (11:00 a.m. EST)
To participate, please dial-in:
+ 54-11-3984-5677 (Argentina)
+ 1-844-450-3851 (United States)
+ 1-412-317-6373 (International)
Web Phone: click here
Conference ID: BBVA
Webcast & Replay: click here
| 2 |
| |
Safe Harbor Statement
This press release contains certain forward-looking statements that reflect the current views and/or expectations of Banco BBVA Argentina and its management with respect to its performance, business and future events. We use words such as “believe,” “anticipate,” “plan,” “expect,” “intend,” “target,” “estimate,” “project,” “predict,” “forecast,” “guideline,” “seek,” “future,” “should” and other similar expressions to identify forward-looking statements, but they are not the only way we identify such statements. Such statements are subject to a number of risks, uncertainties and assumptions. We caution you that a number of important factors could cause actual results to differ materially from the plans, objectives, expectations, estimates and intentions expressed in this release. Actual results, performance or events may differ materially from those in such statements due to, without limitation, (i) changes in general economic, financial, business, political, legal, social or other conditions in Argentina or elsewhere in Latin America or changes in either developed or emerging markets, (ii) changes in regional, national and international business and economic conditions, including inflation, (iii) changes in interest rates and the cost of deposits, which may, among other things, affect margins, (iv) unanticipated increases in financing or other costs or the inability to obtain additional debt or equity financing on attractive terms, which may limit our ability to fund existing operations and to finance new activities, (v) changes in government regulation, including tax and banking regulations, (vi) changes in the policies of Argentine authorities, (vii) adverse legal or regulatory disputes or proceedings, (viii) competition in banking and financial services, (ix) changes in the financial condition, creditworthiness or solvency of the customers, debtors or counterparties of Banco BBVA Argentina, (x) increase in the allowances for loan losses, (xi) technological changes or an inability to implement new technologies, (xii) changes in consumer spending and saving habits, (xiii) the ability to implement our business strategy and (xiv) fluctuations in the exchange rate of the Peso. The matters discussed herein may also be affected by risks and uncertainties described from time to time in Banco BBVA Argentina’s filings with the U.S. Securities and Exchange Commission (SEC) and Comisión Nacional de Valores (CNV). Readers are cautioned not to place undue reliance on forward-looking statements, which speak only as the date of this document. Banco BBVA Argentina is under no obligation and expressly disclaims any intention or obligation to update or revise any forward-looking statements, whether as a result of new information, future events or otherwise.
Information
This earnings release has been prepared in accordance with the accounting framework established by the Central Bank of Argentina (“BCRA”), based on International Financial Reporting Standards (“I.F.R.S.”) and the resolutions adopted by the International Accounting Standards Board (“I.A.S.B”) and by the Federación Argentina de Consejos Profesionales de Ciencias Económicas (“F.A.C.P.E.”), with the following exceptions:
a) The exclusion of the application of the IFRS 9 impairment model for non-financial public sector debt instruments.
b) In March 2022, the shares corresponding to the remaining participation in Prisma Medios de Pago S.A. (“Prisma”) were transferred, which were measured at fair value pursuant to April 29, 2019, and March 22, 2021 Memorandums received from the BCRA, and the income (loss) from their sale was recorded in the quarter ended March 31, 2022. Had IFRS rules been applied to determine the fair value mentioned, results for the quarter ended on June 30, 2022 would have been modified. Nonetheless, this does not generate differences regarding the value of equity as of December 31, 2022.
The information in this press release contains unaudited financial information that consolidates, line item by line item, all of the banking activities of BBVA Argentina, including: BBVA Asset Management Argentina S.A., Consolidar AFJP-undergoing liquidation proceeding, PSA Finance Argentina Compañía Financiera S.A. (“PSA”) and Volkswagen Financial Services Compañía Financiera S.A (“VWFS”).
BBVA Seguros Argentina S.A. is disclosed on a consolidated basis recorded as Investments in associates (reported under the proportional consolidation method), and the corresponding results are reported as “Income from associates”), same as Rombo Compañía Financiera S.A. (“Rombo”), Play Digital S.A. (“MODO”), Openpay Argentina S.A. and Interbanking S.A.
Financial statements of subsidiaries have been elaborated as of the same dates and periods as Banco BBVA Argentina S.A.’s. In the case of consolidated companies PSA and VWFS, financial statements were prepared considering the B.C.R.A. accounting framework for institutions belonging to “Group C”, considering the model established by the IFRS 9 5.5. “Impairment” section for periods starting as of January 1, 2022, excluding debt instruments from the non-financial public sector.
| 3 |
| |
The information published by the BBVA Group for Argentina is prepared according to IFRS, without considering the temporary exceptions established by BCRA.
| 4 |
| |
Quarterly Results
| INCOME STATEMENT | BBVA ARGENTINA CONSOLIDATED | ||||
| In millions of AR$ - Inflation adjusted | ∆ % | ||||
| 2Q23 | 1Q23 | 2Q22 | QoQ | YoY | |
| Net Interest Income | 185,505 | 162,387 | 117,082 | 14.2% | 58.4% |
| Net Fee Income | 23,739 | 14,020 | 22,219 | 69.3% | 6.8% |
| Net income from measurement of financial instruments at fair value through P&L | 7,414 | 8,637 | 2,895 | (14.2%) | 156.1% |
| Net income from write-down of assets at amortized cost and at fair value through OCI | 2,290 | 48 | 1,223 | n.m | 87.2% |
| Foreign exchange and gold gains | 3,231 | 1,306 | 3,356 | 147.4% | (3.7%) |
| Other operating income | 7,014 | 6,798 | 7,150 | 3.2% | (1.9%) |
| Loan loss allowances | (11,097) | (10,123) | (5,293) | (9.6%) | (109.7%) |
| Net operating income | 218,096 | 183,073 | 148,632 | 19.1% | 46.7% |
| Personnel benefits | (29,008) | (27,297) | (27,394) | (6.3%) | (5.9%) |
| Adminsitrative expenses | (31,156) | (29,682) | (26,430) | (5.0%) | (17.9%) |
| Depreciation and amortization | (3,493) | (3,491) | (3,712) | (0.1%) | 5.9% |
| Other operating expenses | (29,094) | (25,117) | (22,105) | (15.8%) | (31.6%) |
| Operarting expenses | (92,751) | (85,587) | (79,641) | (8.4%) | (16.5%) |
| Operating income | 125,345 | 97,486 | 68,991 | 28.6% | 81.7% |
| Income from associates | 593 | (74) | 470 | n.m | 26.2% |
| Income from net monetary position | (77,491) | (70,303) | (51,283) | (10.2%) | (51.1%) |
| Net income before income tax | 48,447 | 27,109 | 18,178 | 78.7% | 166.5% |
| Income tax | (18,085) | (8,518) | 16,072 | (112.3%) | (212.5%) |
| Net income for the period | 30,362 | 18,591 | 34,250 | 63.3% | (11.4%) |
| Owners of the parent | 30,058 | 18,603 | 34,523 | 61.6% | (12.9%) |
| Non-controlling interests | 304 | (12) | (273) | n.m | 211.4% |
| Other comprehensive Income (OCI) (1) | 5,226 | (797) | (20,803) | n.m | 125.1% |
| Total comprehensive income | 35,588 | 17,794 | 13,447 | 100.0% | 164.7% |
| (1) Net of Income Tax. | |||||
BBVA Argentina 2Q23 net income was $30.4 billion, increasing 63.3% or $11.8 billion quarter-over-quarter (QoQ) and falling 11.4% or $3.9 billion year-over-year (YoY). This implied a quarterly ROAE of 21.3% and a quarterly ROAA of 3.9%.
Quarterly operating results are mainly explained by (i) better interest income results through public securities and liquidity instruments, (ii) better fee income, and (iii) higher income from write-down of assets at amortized cost and at fair value through Other Comprehensive Income (OCI), mainly due to the voluntary bond swap offered in June by the National Treasury.
This effect was partially offset by (i) an increase in other operating expenses, pushed by greater turnover tax due to a higher LELIQ position, (ii) an increase in personnel expenses, and (iii) an increase in administrative expenses.
Net Income for the period was highly impacted by income from net monetary position, as inflation increased from 21.7%1 in 1Q23 to 23.8%1 in 2Q23.
1 Source: Instituto Nacional de Estadística y Censos (INDEC).
| 5 |
| |
Lastly, the OCI line totaled a positive result of $5,226 million, mainly due to results of financial instruments at fair value through OCI, particularly through the revaluation of inflation-linked (CER) National Treasury bond portfolio.
Income Statement – 6 month accumulated
| INCOME STATEMENT - 6 MONTH ACCUMULATED | BBVA ARGENTINA CONSOLIDATED | ||
| In millions of AR$ - Inflation adjusted | |||
| 2023 | 2022 | ∆ % | |
| Interest income | 679,683 | 389,300 | 74.6% |
| Interest expense | (331,791) | (173,017) | (91.8%) |
| Net interest income | 347,892 | 216,283 | 60.9% |
| Fee income | 60,561 | 63,787 | (5.1%) |
| Fee expenses | (22,802) | (24,791) | 8.0% |
| Net fee income | 37,759 | 38,996 | (3.2%) |
| Net income from financial instruments at fair value through P&L | 16,051 | 13,227 | 21.4% |
| Net loss from write-down of assets at amortized cost and fair value through OCI | 2,338 | 1,136 | 105.8% |
| Foreign exchange and gold gains | 4,537 | 7,684 | (41.0%) |
| Other operating income | 13,812 | 15,684 | (11.9%) |
| Loan loss allowances | (21,220) | (11,031) | (92.4%) |
| Net operating income | 401,169 | 281,979 | 42.3% |
| Personnel benefits | (56,305) | (50,316) | (11.9%) |
| Administrative expenses | (60,838) | (50,491) | (20.5%) |
| Depreciation and amortization | (6,984) | (7,846) | 11.0% |
| Other operating expenses | (54,211) | (41,714) | (30.0%) |
| Operating expenses | (178,338) | (150,367) | (18.6%) |
| Operating income | 222,831 | 131,612 | 69.3% |
| Income from associates and joint ventures | 519 | (206) | 351.9% |
| Income from net monetary position | (147,794) | (98,645) | (49.8%) |
| Income before income tax | 75,556 | 32,761 | 130.6% |
| Income tax | (26,603) | 11,690 | (327.6%) |
| Income for the period | 48,953 | 44,451 | 10.1% |
| Owners of the parent | 48,661 | 45,110 | 7.9% |
| Non-controlling interests | 292 | (659) | 144.3% |
| Other comprehensive Income (OCI) (1) | 4,429 | (17,454) | 125.4% |
| Total comprehensive income | 53,382 | 26,997 | 97.7% |
| (1) Net of Income Tax. | |||
During the first half of 2023, BBVA Argentina net income was $49.0 billion, 10.1% higher than the $45.0 billion reported in the first half of 2022. This implied an accumulated annualized ROAE of 17.7% and a ROAA of 3.2% in 2022, compared to an accumulated annualized ROAE of 18.9% and a ROAA of 3.0% in 2022.
The 69.3% increment in real terms of the Bank’s operating income is mainly explained by (i) an increase in interest income, mostly due to an increase in the position and yield of Central Bank instruments, and (ii) better net income from financial instruments at fair value through P&L, explained both by an increase in the position of BCRA liquidity bills (LELIQ) and CER bonds.
These effects were negatively offset by (i) greater expenses related to personnel benefits lead by collective agreements with the unions, (ii) other operating expenses, the latter affected by the increase in turnover tax derived from a greater income from LELIQ interests, and (iii) administrative expenses, mainly due to expenses related to software and licenses hired through the controlling company.
| 6 |
| |
Another factor to consider is the income tax line, which had a positive result in 2H22 of $11.7 billion, explained by the implications of fiscal inflation adjustments in the determination of payable taxes and tax deferrals, recorded during the second quarter of 2022.
Additionally, net income is affected by income from net monetary position in a context of higher inflation (50.7% 2023 six month accumulated, versus 36.2% accumulated in the same period of 2022).
| EARNINGS PER SHARE | BBVA ARGENTINA CONSOLIDATED | ||||
| ∆ % | |||||
| 2Q23 | 1Q23 | 2Q22 | QoQ | YoY | |
| Financial Statement information | |||||
| Net income for the period attributable to owners of the parent (in AR$ millions, inflation adjusted) | 30,058 | 18,603 | 34,523 | 61.6% | (12.9%) |
| Total shares outstanding (1) | 612,710 | 612,710 | 612,710 | - | - |
| Market information | |||||
| Closing price of ordinary share at BYMA (in AR$) | 1,020.7 | 537.7 | 201.0 | 89.8% | 407.8% |
| Closing price of ADS at NYSE (in USD) | 6.1 | 3.9 | 2.4 | 56.4% | 156.5% |
| Book value per share (in AR$) | 925.42 | 928.84 | 823.17 | (0.4%) | 12.4% |
| Price-to-book ratio (BYMA price) (%) | 1.10 | 0.58 | 0.24 | 90.5% | 351.7% |
| Earnings per share (in AR$) | 49.06 | 30.36 | 56.34 | 61.6% | (12.9%) |
| Earnings per ADS(2) (in AR$) | 147.17 | 91.09 | 169.03 | 61.6% | (12.9%) |
| (1) In thousands of shares. | |||||
| (2) Each ADS accounts for 3 ordinary shares | |||||
| 7 |
| |
Net Interest Income
| NET INTEREST INCOME | BBVA ARGENTINA CONSOLIDATED | ||||
| In millions of AR$ - Inflation adjusted | ∆ % | ||||
| 2Q23 | 1Q23 | 2Q22 | QoQ | YoY | |
| Net Interest Income | 185,505 | 162,387 | 117,082 | 14.2% | 58.4% |
| Interest Income | 371,223 | 308,460 | 214,764 | 20.3% | 72.9% |
| From government securities | 152,135 | 130,495 | 90,255 | 16.6% | 68.6% |
| From private securities | 446 | 272 | 267 | 64.0% | 67.0% |
| Interest from loans and other financing | 127,273 | 117,822 | 75,211 | 8.0% | 69.2% |
| Financial Sector | 639 | 639 | 1,086 | - | (41.2%) |
| Overdrafts | 20,230 | 21,400 | 8,939 | (5.5%) | 126.3% |
| Discounted Instruments | 32,442 | 23,874 | 11,749 | 35.9% | 176.1% |
| Mortgage loans | 634 | 1,319 | 950 | (51.9%) | (33.3%) |
| Pledge loans | 4,410 | 4,249 | 3,963 | 3.8% | 11.3% |
| Consumer Loans | 15,924 | 15,009 | 11,566 | 6.1% | 37.7% |
| Credit Cards | 32,995 | 32,510 | 20,487 | 1.5% | 61.1% |
| Financial leases | 1,052 | 1,089 | 561 | (3.4%) | 87.5% |
| Loans for the prefinancing and financing of exports | 194 | 191 | 289 | 1.6% | (32.9%) |
| Other loans | 18,753 | 17,542 | 15,621 | 6.9% | 20.0% |
| Premiums on reverse REPO transactions | 31,647 | 21,688 | 2,535 | 45.9% | n.m |
| CER/UVA clause adjustment | 59,431 | 37,934 | 46,280 | 56.7% | 28.4% |
| Other interest income | 291 | 249 | 216 | 16.9% | 34.7% |
| Interest expenses | 185,718 | 146,073 | 97,682 | 27.1% | 90.1% |
| Deposits | 175,811 | 137,335 | 84,142 | 28.0% | 108.9% |
| Checking accounts | 30,736 | 15,709 | 15,868 | 95.7% | 93.7% |
| Savings accounts | 849 | 629 | 622 | 35.0% | 36.5% |
| Time deposits and Investment accounts | 144,226 | 120,997 | 67,652 | 19.2% | 113.2% |
| Other liabilities from financial transactions | 116 | 230 | 251 | (49.6%) | (53.8%) |
| Interfinancial loans received | 3,069 | 2,586 | 3,243 | 18.7% | (5.4%) |
| CER/UVA clause adjustment | 6,719 | 5,921 | 10,045 | 13.5% | (33.1%) |
| Other interest expense | 3 | 1 | 1 | 200.0% | 200.0% |
Net interest income for 2Q23 was $185.5 billion, increasing 14.2% or $23.1 billion QoQ, and 58.4% or $68.4 billion YoY. In 2Q23, interest income, in monetary terms, increased more than interest expense, mainly due to (i) an increase in income from CER/UVA adjustments, especially public securities with this adjustment, and (ii) a higher position and yield of public securities, in particular of LELIQ. Additionally, there is a positive effect from income from loans, mainly discounted instruments, and from premium from reverse REPOs.
In 2Q23, interest income totaled $371.2 billion, increasing 20.3% compared to 1Q23 and 72.9% compared to 2Q22. Quarterly increase is mainly driven by (i) an increase in CER/UVA adjustments, mainly public securities with this adjustment, and (ii) a higher position in public securities, especially LELIQ.
Income from government securities increased 16.1% compared to 1Q23, and 68.6% compared to 2Q22. This is partially due to the higher average position in LELIQ, added to a gradual increase in the monetary policy rate from 78% at the beginning of the quarter up to 97% at quarter end. 94% of these results are explained by government securities at fair value through OCI (of which 76% are BCRA securities) and 4% are securities at amortized cost (2027 National Treasury Bonds at fixed rate, National Treasury Bonds Private 0.70 Badlar Rate maturing on November 2027, and National Treasury Bonds CER 2025, used for reserve requirement integration).
| 8 |
| |
Interest income from loans and other financing totaled $127.3 billion, increasing 8.0% QoQ and 69.2% YoY. Quarterly growth is mainly due to an increase in discounted instruments by 35.9%, both through an increase in activity and in rates.
Income from CER/UVA adjustments increased 56.7% QoQ and 28.4% YoY. Quarterly growth is explained by the delay with which the inflation adjustment effects are recorded, and impact on the subsequent financial statements, recording the increase in inflation in 1Q23 and part of the increment in 2Q23. 77% of income from interests from CER/UVA clause adjustments is explained by interests generated by bonds linked to such indexes.
Interest expenses totaled $185.7 billion, denoting a 27.1% increase QoQ and a 90.1% increase YoY. Quarterly increase is described by higher time deposit expenses.
Interests from time deposits (including investment accounts) explain 77.7% of interest expenses, versus 82.8% the previous quarter. These increased 19.2% QoQ and 113.2% YoY.
NIM
As of 2Q23, net interest margin (NIM) was 33.3%, above the 31.3% reported in 2Q23. In 2Q23, NIM in pesos was 34.9% and 1.4% in U.S. dollars.
| ASSETS & LIABILITIES PERFORMANCE - TOTAL | BBVA ARGENTINA CONSOLIDATED | ||||||||
| In millions of AR$. Rates and spreads in annualized % | |||||||||
| 2Q23 | 1Q23 | 2Q22 | |||||||
| Average Balance | Interest Earned/Paid | Average Real Rate | Average Balance | Interest Earned/Paid | Average Real Rate | Average Balance | Interest Earned/Paid | Average Real Rate | |
| Total interest-earning assets | 2,234,651 | 371,223 | 66.6% | 2,102,990 | 308,460 | 59.5% | 2,128,816 | 214,764 | 40.5% |
| Debt securities | 1,183,938 | 229,732 | 77.8% | 1,054,117 | 179,646 | 69.1% | 1,068,877 | 126,628 | 47.5% |
| Loans to customers/financial institutions | 1,015,325 | 141,482 | 55.9% | 1,013,783 | 128,803 | 51.5% | 1,030,172 | 88,131 | 34.3% |
| Loans to the BCRA | 3 | 7 | 935.9% | 2 | 10 | 1622.2% | 2 | 4 | 802.2% |
| Other assets | 35,385 | 2 | 0.0% | 35,087 | 1 | 0.0% | 29,765 | - | 0.0% |
| Total non interest-earning assets | 689,660 | - | 0.0% | 722,911 | - | 0.0% | 774,925 | - | 0.0% |
| Total Assets | 2,924,311 | 371,223 | 50.9% | 2,825,901 | 308,460 | 44.3% | 2,903,740 | 214,764 | 29.7% |
| Total interest-bearing liabilities | 1,489,400 | 185,718 | 50.0% | 1,446,286 | 146,073 | 41.0% | 1,515,149 | 97,682 | 25.9% |
| Savings accounts | 513,673 | 849 | 0.7% | 529,288 | 629 | 0.5% | 558,096 | 621 | 0.4% |
| Time deposits and investment accounts | 767,377 | 150,946 | 78.9% | 775,233 | 126,918 | 66.4% | 720,340 | 77,698 | 43.3% |
| Debt securities issued | - | 24 | 0.0% | 54 | 63 | 470.1% | 545 | 181 | 133.2% |
| Other liabilities | 208,350 | 33,899 | 65.3% | 141,710 | 18,463 | 52.8% | 236,168 | 19,182 | 32.6% |
| Total non-interest-bearing liabilities | 1,434,911 | - | 0.0% | 1,379,615 | - | 0.0% | 1,388,591 | - | 0.0% |
| Total liabilities and equity | 2,924,311 | 185,718 | 25.5% | 2,825,901 | 146,073 | 21.0% | 2,903,740 | 97,682 | 13.5% |
| NIM - Total | 33.3% | 31.3% | 22.1% | ||||||
| Spread - Total | 16.6% | 18.5% | 14.6% | ||||||
| Nominal rates are calculated over a 365-day year | |||||||||
| Does not include Net income from measurement of financial instruments at fair value through P&L nor Net income from write-down of assets at amortized cost and at fair value through OCI | |||||||||
| Interest-bearing checking accounts included in other interest-bearing liabilities. Non interest-bearing accounts are included in non-interest-bearing liabilities. | |||||||||
| 9 |
| |
| ASSETS & LIABILITIES PERFORMANCE - AR$ | BBVA ARGENTINA CONSOLIDATED | ||||||||
| In millions of AR$. Rates and spreads in annualized % | |||||||||
| 2Q23 | 1Q23 | 2Q22 | |||||||
| Average Balance | Interest Earned/Paid | Average Real Rate | Average Balance | Interest Earned/Paid | Average Real Rate | Average Balance | Interest Earned/Paid | Average Real Rate | |
| Total interest-earning assets | 2,124,777 | 370,783 | 70.0% | 2,027,944 | 308,030 | 61.6% | 2,041,478 | 214,266 | 42.1% |
| Debt securities | 1,134,396 | 229,667 | 81.2% | 1,041,665 | 179,593 | 69.9% | 1,060,719 | 126,618 | 47.9% |
| Loans to customers/financial institutions | 955,027 | 141,109 | 59.3% | 951,767 | 128,428 | 54.7% | 962,186 | 87,644 | 36.5% |
| Loans to the BCRA | 2 | 7 | 1403.8% | 1 | 10 | 3244.4% | - | 4 | - |
| Other assets | 35,352 | - | 0.0% | 34,511 | - | 0.0% | 18,572 | - | 0.0% |
| Total non interest-earning assets | 338,202 | - | 0.0% | 337,897 | - | 0.0% | 388,941 | - | 0.0% |
| Total Assets | 2,462,979 | 370,783 | 60.4% | 2,365,841 | 308,030 | 52.8% | 2,430,419 | 214,266 | 35.4% |
| Total interest-bearing liabilities | 1,213,265 | 185,660 | 61.4% | 1,140,060 | 146,013 | 51.9% | 1,201,890 | 97,644 | 32.6% |
| Savings accounts | 276,283 | 845 | 1.2% | 263,565 | 624 | 1.0% | 287,315 | 617 | 0.9% |
| Time deposits and Investment accounts | 733,943 | 150,931 | 82.5% | 737,560 | 126,900 | 69.8% | 679,190 | 77,679 | 45.9% |
| Debt securities issued | - | 24 | - | 54 | 63 | 470.1% | 545 | 181 | 133.2% |
| Other liabilities | 203,039 | 33,860 | 66.9% | 138,880 | 18,426 | 53.8% | 234,840 | 19,167 | 32.7% |
| Total non-interest-bearing liabilities | 1,292,419 | - | 0.0% | 1,223,280 | - | 0.0% | 1,232,170 | - | 0.0% |
| Total liabilities and equity | 2,505,684 | 185,660 | 29.7% | 2,363,339 | 146,013 | 25.1% | 2,434,060 | 97,644 | 16.1% |
| NIM - AR$ | 34.9% | 32.4% | 22.9% | ||||||
| Spread - AR$ | 8.6% | 9.7% | 9.5% | ||||||
| Nominal rates are calculated over a 365-day year | |||||||||
| Does not include Net income from measurement of financial instruments at fair value through P&L nor Net income from write-down of assets at amortized cost and at fair value through OCI | |||||||||
Interest-bearing checking accounts included in other interest-bearing liabilities. Non interest-bearing accounts are included in non-interest-bearing liabilities.
| |||||||||
| ASSETS & LIABILITIES PERFORMANCE - FOREIGN CURRENCY | BBVA ARGENTINA CONSOLIDATED | ||||||||
| In millions of AR$. Rates and spreads in annualized % | |||||||||
| 2Q23 | 1Q23 | 2Q22 | |||||||
| Average Balance | Interest Earned/Paid | Average Real Rate | Average Balance | Interest Earned/Paid | Average Real Rate | Average Balance | Interest Earned/Paid | Average Real Rate | |
| Total interest-earning assets | 109,874 | 440 | 1.6% | 75,046 | 430 | 2.3% | 87,338 | 498 | 2.3% |
| Debt securities | 49,542 | 65 | 0.5% | 12,452 | 53 | 1.7% | 8,158 | 11 | 0.5% |
| Loans to customers/financial institutions | 60,298 | 373 | 2.5% | 62,017 | 375 | 2.5% | 67,985 | 487 | 2.9% |
| Loans to the BCRA | 1 | - | 0.0% | 1 | - | 0.0% | 2 | - | 0.0% |
| Other assets | 33 | 2 | 24.3% | 576 | 1 | 0.9% | 11,193 | - | 0.0% |
| Total non interest-earning assets | 351,458 | - | 0.0% | 385,014 | - | 0.0% | 385,983 | - | 0.0% |
| Total Assets | 461,332 | 440 | 0.4% | 460,060 | 430 | 0.4% | 473,321 | 498 | 0.4% |
| Total interest-bearing liabilities | 276,135 | 58 | 0.1% | 306,226 | 59 | 0.1% | 313,260 | 39 | 0.0% |
| Savings accounts | 237,390 | 4 | 0.0% | 265,723 | 5 | 0.0% | 270,782 | 4 | 0.0% |
| Time deposits and Investment accounts | 33,434 | 15 | 0.2% | 37,673 | 17 | 0.2% | 41,150 | 19 | 0.2% |
| Other liabilities | 5,311 | 39 | 2.9% | 2,831 | 37 | 5.3% | 1,328 | 15 | 4.6% |
| Total non-interest-bearing liabilities | 142,492 | - | 0.0% | 156,335 | - | 0.0% | 156,421 | - | 0.0% |
| Total liabilities and equity | 418,627 | 58 | 0.1% | 462,561 | 59 | 0.1% | 469,680 | 39 | 0.0% |
| NIM - Foreign currency | 1.4% | 2.0% | 2.1% | ||||||
| Spread - Foreign currency | 1.5% | 2.2% | 2.2% | ||||||
| Nominal rates are calculated over a 365-day year | |||||||||
| Does not include Net income from measurement of financial instruments at fair value through P&L nor Net income from write-down of assets at amortized cost and at fair value through OCI | |||||||||
| Interest-bearing checking accounts included in other interest-bearing liabilities. Non interest-bearing accounts are included in non-interest-bearing liabilities. | |||||||||
| 10 |
| |
Net Fee Income
| NET FEE INCOME | BBVA ARGENTINA CONSOLIDATED | ||||
| In millions of AR$ - Inflation adjusted | ∆ % | ||||
| 2Q23 | 1Q23 | 2Q22 | QoQ | YoY | |
| Net Fee Income | 23,739 | 14,020 | 22,219 | 69.3% | 6.8% |
| Fee Income | 33,357 | 27,204 | 31,029 | 22.6% | 7.5% |
| Linked to liabilities | 10,792 | 11,153 | 12,083 | (3.2%) | (10.7%) |
| From credit cards (1) | 15,976 | 10,106 | 13,488 | 58.1% | 18.4% |
| Linked to loans | 3,319 | 3,013 | 2,453 | 10.2% | 35.3% |
| From insurance | 1,193 | 1,199 | 1,320 | (0.5%) | (9.6%) |
| From foreign trade and foreign currency transactions | 1,418 | 1,250 | 1,363 | 13.4% | 4.0% |
| Other fee income | 575 | 483 | 322 | 19.0% | 78.6% |
| Linked to loan commitments | 84 | - | - | N/A | N/A |
| From guarantees granted | 12 | 8 | 1 | 50.0% | n.m |
| Linked to securities | 563 | 475 | 321 | 18.5% | 75.4% |
| Fee expenses | 9,618 | 13,184 | 8,810 | (27.0%) | 9.2% |
| (1) Includes results from Puntos BBVA royalty program pursuant to IFRS 15 regulation. | |||||
Net fee income as of 2Q23 totaled $23.7 billion, increasing 69.3% or $9.7 billion QoQ and 6.8% or $1.5 billion YoY.
In 2Q23, fee income totaled $33.4 billion, growing 22.6% QoQ and 7.50% YoY. The quarterly increase is mainly explained by an increment of fees from credit cards, considering that this line includes Puntos BBVA royalty program.
Regarding fee expenses, these totaled $9.6 billion, falling 27.0% QoQ and increasing 9.2% YoY.
Net Income from Measurement of Financial Instruments at Fair Value and Foreign Exchange and Gold Gains/Losses
| NET INCOME FROM FINANCIAL INSTRUMENTS AT FAIR VALUE (FV) THROUGH P&L | BBVA ARGENTINA CONSOLIDATED | ||||
| In millions of AR$ - Inflation adjusted | ∆ % | ||||
| 2Q23 | 1Q23 | 2Q22 | QoQ | YoY | |
| Net Income from financial instruments at FV through P&L | 7,414 | 8,637 | 2,895 | (14.2%) | 156.1% |
| Income from government securities | 7,380 | 7,071 | 2,421 | 4.4% | 204.8% |
| Income from private securities | 476 | 793 | 402 | (40.0%) | 18.4% |
| Interest rate swaps | (59) | 27 | - | (318.5%) | N/A |
| Income from foreign currency forward transactions | (298) | 779 | 45 | (138.3%) | n.m |
| Income from put option long position | (85) | (33) | - | (157.6%) | N/A |
| Income from corporate bonds | - | - | 27 | N/A | (100.0%) |
In 2Q23, net income from financial instruments at fair value (FV) through P&L was $7.4 billion, decreasing 14.2% or $1.2 million QoQ and increasing 156.1% or $4.5 billion YoY.
Quarterly results are mainly explained by a decrease in the income from foreign currency forward transactions line item.
| 11 |
| |
| DIFFERENCES IN QUOTED PRICES OF GOLD AND FOREIGN FOREIGN CURRENCY | BBVA ARGENTINA CONSOLIDATED | ||||
| In millions of AR$ - Inflation adjusted | ∆ % | ||||
| 2Q23 | 1Q23 | 2Q22 | QoQ | YoY | |
| Foreign exchange and gold gains/(losses) (1) | 3,231 | 1,306 | 3,356 | 147.4% | (3.7%) |
| From foreign exchange position | (1,663) | (2,852) | (1,339) | 41.7% | (24.2%) |
| Income from purchase-sale of foreign currency | 4,894 | 4,158 | 4,695 | 17.7% | 4.2% |
| Net income from financial instruments at FV through P&L (2) | (298) | 779 | 45 | (138.3%) | n.m |
| Income from foreign currency forward transactions | (298) | 779 | 45 | (138.3%) | n.m |
| Total differences in quoted prices of gold & foreign currency (1) + (2) | 2,933 | 2,085 | 3,401 | 40.7% | (13.8%) |
In 2Q23, the total differences in quoted prices of gold and foreign currency showed profit for $2.9 billion, increasing 40.7% or $848 million compared to 2Q22.
The quarterly increase in foreign exchange and gold gains is mainly explained by a lower loss contained in the From foreign exchange position line and a higher gain in income from purchase-sale of foreign currency, the latter mainly due to higher activity, especially in Chinese Yuan transactions. Increases have been partially offset by income from foreign currency forward transactions.
| 12 |
| |
Other Operating Income
| OTHER OPERATING INCOME | BBVA ARGENTINA CONSOLIDATED | ||||
| In millions of AR$ - Inflation adjusted | ∆ % | ||||
| 2Q23 | 1Q23 | 2Q22 | QoQ | YoY | |
| Operating Income | 7,014 | 6,798 | 7,150 | 3.2% | (1.9%) |
| Rental of safe deposit boxes (1) | 1,045 | 846 | 1,106 | 23.5% | (5.5%) |
| Adjustments and interest on miscellaneous receivables (1) | 2,857 | 2,552 | 2,650 | 12.0% | 7.8% |
| Punitive interest (1) | 315 | 273 | 160 | 15.4% | 96.9% |
| Loans recovered | 565 | 807 | 1,088 | (30.0%) | (48.1%) |
| Non-current assets held for sale | 542 | 589 | 612 | (8.0%) | (11.4%) |
| Fee income from credit and debit cards (1) | - | - | 160 | N/A | (100.0%) |
| Fee expenses recovery | 271 | 272 | 298 | (0.4%) | (9.1%) |
| Rents | 290 | 304 | 300 | (4.6%) | (3.3%) |
| Sindicated transaction fees | 95 | 124 | 68 | (23.4%) | 39.7% |
| Disaffected provisions | 178 | 100 | 293 | 78.0% | (39.2%) |
| Other Operating Income(2) | 856 | 931 | 415 | (8.1%) | 106.3% |
| (1) Included in the efficiency ratio calculation | |||||
| (2) Includes some of the concepts used in the efficiency ratio calculation | |||||
In 2Q23 other operating income totaled $7.0 billion, growing 3.2% or $216 million QoQ, and falling 1.9% or $1.9 billion YoY. Quarterly increase is partially explained by a 12.0% growth in the Adjustments and interest on miscellaneous receivables line item, followed by a 23.5% increase in the Rental of safe deposit boxes.
| 13 |
| |
Operating Expenses
Personnel Benefits and Administrative Expenses
| PERSONNEL BENEFITS & ADMINISTRATIVE EXPENSES | BBVA ARGENTINA CONSOLIDATED | ||||
| In millions of AR$ - Inflation adjusted | ∆ % | ||||
| 2Q23 | 1Q23 | 2Q22 | QoQ | YoY | |
| Total Personnel Benefits and Adminsitrative Expenses | 60,164 | 56,979 | 53,824 | 5.6% | 11.8% |
| Personnel Benefits (1) | 29,008 | 27,297 | 27,394 | 6.3% | 5.9% |
| Administrative expenses (1) | 31,156 | 29,682 | 26,430 | 5.0% | 17.9% |
| Travel expenses | 191 | 148 | 150 | 29.1% | 27.3% |
| Outsourced administrative expenses | 3,722 | 3,286 | 1,909 | 13.3% | 95.0% |
| Security services | 709 | 679 | 688 | 4.4% | 3.1% |
| Fees to Bank Directors and Supervisory Committee | 37 | 30 | 59 | 23.3% | (37.3%) |
| Other fees | 1,028 | 805 | 868 | 27.7% | 18.4% |
| Insurance | 209 | 235 | 234 | (11.1%) | (10.7%) |
| Rent | 4,838 | 4,328 | 4,723 | 11.8% | 2.4% |
| Stationery and supplies | 40 | 30 | (1) | 33.3% | n.m |
| Electricity and communications | 967 | 1,007 | 908 | (4.0%) | 6.5% |
| Advertising | 1,697 | 1,917 | 1,297 | (11.5%) | 30.8% |
| Taxes | 5,962 | 5,979 | 5,166 | (0.3%) | 15.4% |
| Maintenance costs | 2,334 | 2,613 | 2,430 | (10.7%) | (4.0%) |
| Armored transportation services | 2,520 | 2,510 | 2,861 | 0.4% | (11.9%) |
| Software | 4,709 | 3,377 | 2,819 | 39.4% | 67.0% |
| Document distribution | 774 | 856 | 984 | (9.6%) | (21.3%) |
| Commercial reports | 297 | 938 | 441 | (68.3%) | (32.7%) |
| Other administrative expenses | 1,122 | 944 | 894 | 18.9% | 25.5% |
| Headcount* | |||||
| BBVA (Bank) | 5,863 | 5,795 | 5,753 | 68 | 110 |
| Subsidiaries (2) | 94 | 93 | 99 | 1 | (5) |
| Total employees* | 5,978 | 5,957 | 5,839 | 21 | 139 |
| In branches | 1,947 | 1,919 | 1,948 | 28 | (1) |
| At Main office | 4,031 | 4,038 | 3,891 | (7) | 140 |
| Total branches** | 243 | 243 | 243 | - | - |
| Own | 113 | 113 | 112 | - | 1 |
| Rented | 130 | 130 | 131 | - | (1) |
| - | |||||
| Efficiency Ratio | |||||
| Efficiency ratio | 52.0% | 62.4% | 70.4% | (1,039)bps | (1,843)bps |
| Accumulated Efficiency Ratio | 56.6% | 62.4% | 71.3% | (579)bps | (1,467)bps |
| (1) Concept included in the efficiency ratio calculation | |||||
| (2) Includes BBVA Asset Management, PSA & VWFS. Employees included in Main Office. | |||||
| *corresponds to total effective employees, net of temporary contract employees | |||||
| **excludes administrative branches | |||||
During 2Q23, personnel benefits and administrative expenses totaled $60.2 billion, increasing 5.6% or $3.2 billion compared to 1Q23, and 11.8% or $6.3 billion compared to 2Q22.
| 14 |
| |
Personnel benefits increased 6.3% QoQ, and 5.9% YoY. The quarterly increase is mainly explained by the inflation adjustment of vacation stock provisions. Increases were also generated by the effect of collective agreement on wages with the unions for 2Q23 by 25.8% (+56% accumulated year to date).
As of 2Q23, administrative expenses increased 5.0% QoQ, and 17.9% YoY. The quarterly increase is mainly explained by (i) outsourced administrative expenses, (ii) greater rent expenses and (iii) increase in software services, all of them related to software, licenses and services contracted with the Parent company.
The quarterly efficiency ratio as of 2Q23 was 52.0%, improving compared to the 62.4% reported in 1Q23, and versus the 70.4% reported in 2Q22. The quarterly improvement is explained by a lower increase in the numerator (expenses) than the denominator (income considering monetary position results), especially due to a significant increase in interest and fee income.
The accumulated efficiency ratio as of 2Q23 was 56.6%, improving compared to the 62.4% reported in 1Q23, and versus the 71.3% reported in 2Q22.
Other Operating Expenses
| OTHER OPERATING EXPENSES | BBVA ARGENTINA CONSOLIDATED | ||||
| In millions of AR$ - Inflation adjusted | ∆ % | ||||
| 2Q23 | 1Q23 | 2Q22 | QoQ | YoY | |
| Other Operating Expenses | 29,094 | 25,117 | 22,105 | 15.8% | 31.6% |
| Turnover tax | 22,718 | 19,359 | 13,696 | 17.4% | 65.9% |
| Initial loss of loans below market rate | 1,056 | 1,234 | 1,896 | (14.4%) | (44.3%) |
| Contribution to the Deposit Guarantee Fund (SEDESA) | 719 | 725 | 784 | (0.8%) | (8.3%) |
| Interest on liabilities from financial lease | 176 | 212 | 235 | (17.0%) | (25.1%) |
| Other allowances | 2,158 | 1,935 | 1,060 | 11.5% | 103.6% |
| Other operating expenses | 2,267 | 1,652 | 4,434 | 37.2% | (48.9%) |
In 2Q23, other operating expenses totaled $29.1 billion, increasing 15.8% or $4.0 billion QoQ, and increasing 31.6% or $7.0 billion YoY.
The key factor explaining the quarterly growth is in the turnover tax line item, especially due to an increased revenue from LELIQ.
| 15 |
| |
Income from Associates
This line reflects the results from non-consolidated associate companies. During 2Q23, a profit of $593 million has been reported, mainly due to the Bank’s participation in BBVA Seguros Argentina S.A., Rombo Compañía Financiera S.A., Interbanking S.A. and Play Digital S.A. and Openpay Argentina S.A.
Income Tax
Accumulated income tax during the first six months of 2023 recorded a loss of $26.6 billion. As of 2Q23, income tax expense was $18.1 billion.
The accumulated effective tax rate in 2023 was 35%2.
Accumulated income tax during the first six months of 2022 recorded a profit of $11.7 billion. Regarding 2Q22, income tax expenses show a positive result, affected by the implications of inflation adjustments in the determination of payable taxes and tax deferrals.
2 Income tax, according to IAS 34, is recorded on interim financial periods over the best estimate of the weighted average tax rate expected for the fiscal year.
| 16 |
| |
Balance sheet and activity
Loans and Other Financing
| LOANS AND OTHER FINANCING | BBVA ARGENTINA CONSOLIDATED | ||||
| In millions of AR$ - Inflation adjusted | ∆ % | ||||
| 2Q23 | 1Q23 | 2Q22 | QoQ | YoY | |
| To the public sector | 4 | 4 | 13 | - | (69.2%) |
| To the financial sector | 7,083 | 6,676 | 12,096 | 6.1% | (41.4%) |
| Non-financial private sector and residents abroad | 1,079,724 | 1,083,479 | 1,119,412 | (0.3%) | (3.5%) |
| Non-financial private sector and residents abroad - AR$ | 1,012,265 | 1,023,319 | 1,029,133 | (1.1%) | (1.6%) |
| Overdrafts | 83,296 | 133,236 | 79,463 | (37.5%) | 4.8% |
| Discounted instruments | 210,066 | 178,393 | 130,414 | 17.8% | 61.1% |
| Mortgage loans | 52,438 | 54,119 | 63,165 | (3.1%) | (17.0%) |
| Pledge loans | 32,417 | 33,598 | 42,711 | (3.5%) | (24.1%) |
| Consumer loans | 105,927 | 113,704 | 115,155 | (6.8%) | (8.0%) |
| Credit cards | 393,409 | 387,687 | 425,061 | 1.5% | (7.4%) |
| Receivables from financial leases | 9,069 | 8,794 | 7,196 | 3.1% | 26.0% |
| Other loans | 125,643 | 113,788 | 165,968 | 10.4% | (24.3%) |
| Non-financial private sector and residents abroad - Foreign Currency | 67,459 | 60,160 | 90,279 | 12.1% | (25.3%) |
| Overdrafts | 7 | 10 | 8 | (30.0%) | (12.5%) |
| Discounted instruments | 2,214 | 991 | 18 | 123.4% | n.m |
| Credit cards | 10,776 | 9,506 | 15,543 | 13.4% | (30.7%) |
| Receivables from financial leases | (85) | (14) | - | n.m | N/A |
| Loans for the prefinancing and financing of exports | 46,060 | 40,426 | 48,993 | 13.9% | (6.0%) |
| Other loans | 8,487 | 9,241 | 25,717 | (8.2%) | (67.0%) |
| % of total loans to Private sector in AR$ | 93.8% | 94.4% | 91.9% | (70)bps | 182 bps |
| % of total loans to Private sector in Foreign Currency | 6.2% | 5.6% | 8.1% | 70 bps | (182)bps |
| % of mortgage loans with UVA adjustments / Total mortgage loans (1) | 55.3% | 56.2% | 61.7% | (92)bps | (635)bps |
| % of pledge loans with UVA adjustments / Total pledge loans (1) | 1.3% | 1.7% | 3.7% | (41)bps | (244)bps |
| % of consumer loans with UVA adjustments / Total consumer loans (1) | 0.2% | 0.4% | 1.7% | (17)bps | (141)bps |
| % of loans with UVA adjustments / Total loans and other financing(1) | 0.1% | 0.1% | 0.4% | (4)bps | (31)bps |
| Total loans and other financing | 1,086,811 | 1,090,159 | 1,131,521 | (0.3%) | (4.0%) |
| Allowances | (34,721) | (33,237) | (28,302) | (4.5%) | (22.7%) |
| Total net loans and other financing | 1,052,090 | 1,056,922 | 1,103,219 | (0.5%) | (4.6%) |
(1) Excludes effect of accrued interests adjustments.
| |||||
| LOANS AND OTHER FINANCING TO NON-FINANCIAL PRIVATE SECTOR AND RESIDENTS ABROAD IN FOREIGN CURRENCY | BBVA ARGENTINA CONSOLIDATED | ||||
| In millions of USD | ∆ % | ||||
| 2Q23 | 1Q23 | 2Q22 | QoQ | YoY | |
| FX rate* | 256.68 | 208.99 | 125.22 | 22.8% | 105.0% |
| Non-financial private sector and residents abroad - Foreign Currency (USD) | 263 | 233 | 334 | 13.0% | (21.4%) |
| *Wholesale U.S. dollar foreign exchange rates on BCRA’s Communication “A” 3500, as of the end of period. | |||||
| 17 |
| |
Private sector loans as of 2Q23 totaled $1.1 trillion, slightly decreasing 0.3% or $3.8 billion QoQ, and 3.5% or $39.7 billion YoY.
Loans to the private sector in pesos fell 1.1% in 2Q23, and 1.6% YoY. During the quarter, the decrease was especially driven by a 37.5% decline in overdrafts, followed by a 6.8% fall in consumer loans. The fall was partially offset by a 17.8% increase in discounted instruments and a 10.4% increase in other loans, the latter pushed by floorplanning.
Loans to the private sector denominated in foreign currency increased 12.1% QoQ and declined 25.3% YoY. Quarterly increase is mainly explained by a 13.9% growth in financing and prefinancing of exports. Loans to the private sector in foreign currency measured in U.S. dollars increased 13.0% QoQ and fell 21.4% YoY. The depreciation of the argentine peso versus the U.S. dollar was 18.6% QoQ and 51.2% YoY3.
In 2Q23, total loans and other financing totaled $1.1 trillion, remaining practically stable with a decline of 0.5% QoQ and falling 4.6% compared to 2Q22.
| LOANS AND OTHER FINANCING | BBVA ARGENTINA CONSOLIDATED | ||||
| In millions of AR$ - Inflation adjusted | ∆ % | ||||
| 2Q23 | 1Q23 | 2Q22 | QoQ | YoY | |
| Non-financial private sector and residents abroad - Retail | 594,967 | 598,614 | 661,635 | (0.6%) | (10.1%) |
| Mortgage loans | 52,438 | 54,119 | 63,165 | (3.1%) | (17.0%) |
| Pledge loans | 32,417 | 33,598 | 42,711 | (3.5%) | (24.1%) |
| Consumer loans | 105,927 | 113,704 | 115,155 | (6.8%) | (8.0%) |
| Credit cards | 404,185 | 397,193 | 440,604 | 1.8% | (8.3%) |
| Non-financial private sector and residents abroad - Commercial | 484,757 | 484,865 | 457,777 | (0.0%) | 5.9% |
| Overdrafts | 83,303 | 133,246 | 79,471 | (37.5%) | 4.8% |
| Discounted instruments | 212,280 | 179,384 | 130,432 | 18.3% | 62.8% |
| Receivables from financial leases | 8,984 | 8,780 | 7,196 | 2.3% | 24.8% |
| Loans for the prefinancing and financing of exports | 46,060 | 40,426 | 48,993 | 13.9% | (6.0%) |
| Other loans | 134,130 | 123,029 | 191,685 | 9.0% | (30.0%) |
| % of total loans to Retail sector | 55.1% | 55.2% | 59.1% | (15)bps | (400)bps |
| % of total loans to Commercial sector | 44.9% | 44.8% | 40.9% | 15 bps | 400 bps |
In real terms, retail loans (mortgage, pledge, consumer and credit cards) remained stable with a mild fall of 0.6% QoQ and 10.1% YoY in real terms. During the quarter, decline is mainly explained by a 6.8% decrease in consumer loans, offset by a 1.8% increase in credit cards.
Commercial loans (overdrafts, discounted instruments, receivables from financial leases, loans for the prefinancing and financing of exports, and other loans) remained practically stable in the quarter, and falling 5.9% YoY, both in real terms. This is justified by quarterly increases in discounted instruments and other loans by 18.3% and 9.0% respectively, and offset by a 37.5% decrease in overdrafts.
As observed in previous quarters, loan portfolios were impacted by the effect of inflation during the second quarter of 2023, which reached 23.8%. In nominal terms, BBVA Argentina managed to increase the retail, commercial and total loan portfolio by 23.0%, 23.8% and 23.4% respectively during the quarter, practically reaching quarterly inflation levels.
3 Taking into consideration wholesale U.S. dollar foreign exchange rates on BCRA’s Communication “A” 3500.
| 18 |
| |
| LOANS AND OTHER FINANCING - NON RESTATED FIGURES | BBVA ARGENTINA CONSOLIDATED | ||||
| In millions of AR$ | ∆ % | ||||
| 2Q23 | 1Q23 | 2Q22 | QoQ | YoY | |
| Non-financial private sector and residents abroad - Retail | 594,967 | 483,605 | 306,911 | 23.0% | 93.9% |
| Non-financial private sector and residents abroad - Commercial | 484,757 | 391,718 | 212,346 | 23.8% | 128.3% |
| Total loans and other financing (1) | 1,086,811 | 880,719 | 524,874 | 23.4% | 107.1% |
| (1) Does not include allowances | |||||
As of 2Q23, the total loans and other financing over deposits ratio was 54.1%, lower than the 56.0% recorded in 1Q23 and above the 53.9% in 2Q22.
| MARKET SHARE - PRIVATE SECTOR LOANS | BBVA ARGENTINA CONSOLIDATED | ||||
| In % | ∆ bps | ||||
| 2Q23 | 1Q23 | 2Q22 | QoQ | YoY | |
| Private sector loans - Bank | 8.14% | 8.46% | 7.44% | (32)bps | 70 bps |
| Private sector loans - Consolidated* | 9.01% | 9.13% | 8.35% | (12)bps | 66 bps |
| Based on daily BCRA information. Capital balance as of the last day of each quarter. | |||||
| * Consolidates PSA, VWFS & Rombo | |||||
| LOANS BY ECONOMIC ACTIVITY | BBVA ARGENTINA CONSOLIDATED | ||||
| % over total gross loans and other financing | ∆ bps | ||||
| 2Q23 | 1Q23 | 2Q22 | QoQ | YoY | |
| Government services | 0.00% | 0.00% | 0.00% | n.m. | n.m. |
| Non-financial public sector | 0.00% | 0.00% | 0.00% | n.m. | n.m. |
| Financial Sector | 0.65% | 0.61% | 1.07% | 4 bps | (42)bps |
| Agricultural and Livestock | 5.10% | 4.68% | 4.57% | 41 bps | 53 bps |
| Mining products | 3.75% | 2.91% | 3.89% | 83 bps | (14)bps |
| Other manufacturing | 9.18% | 11.22% | 11.49% | (204)bps | (231)bps |
| Electricity, oil,water and sanitary services | 0.35% | 0.61% | 0.23% | (26)bps | 12 bps |
| Wholesale and retail trade | 6.81% | 6.15% | 5.67% | 66 bps | 113 bps |
| Transport | 1.77% | 1.89% | 1.27% | (12)bps | 50 bps |
| Services | 2.08% | 2.47% | 1.54% | (39)bps | 54 bps |
| Others | 17.04% | 16.03% | 15.78% | 101 bps | 126 bps |
| Construction | 0.62% | 0.72% | 0.57% | (11)bps | 5 bps |
| Consumer | 52.66% | 52.70% | 53.91% | (4)bps | (126)bps |
| Total gross loans and other financing | 100% | 100% | 100% | ||
| 19 |
| |
Asset Quality
| ASSET QUALITY | BBVA ARGENTINA CONSOLIDATED | ||||
| In millions of AR$ - Inflation adjusted | ∆ % | ||||
| 2Q23 | 1Q23 | 2Q22 | QoQ | YoY | |
| Commercial non-performing portfolio (1) | 658 | 1,691 | 1,923 | (61.1%) | (65.8%) |
| Total commercial portfolio | 417,232 | 423,730 | 399,218 | (1.5%) | 4.5% |
| Commercial non-performing portfolio / Total commercial portfolio | 0.16% | 0.40% | 0.48% | (24)bps | (32)bps |
| Retail non-performing portfolio (1) | 15,237 | 13,397 | 10,977 | 13.7% | 38.8% |
| Total retail portfolio | 735,493 | 725,559 | 791,184 | 1.4% | (7.0%) |
| Retail non-performing portfolio / Total retail portfolio | 2.07% | 1.85% | 1.39% | 23 pbs | 68 pbs |
| Total non-performing portfolio (1) | 15,895 | 15,088 | 12,900 | 5.3% | 23.2% |
| Total portfolio | 1,152,725 | 1,149,289 | 1,190,402 | 0.3% | (3.2%) |
| Total non-performing portfolio / Total portfolio | 1.38% | 1.31% | 1.08% | 7 bps | 30 bps |
| Allowances | 34,721 | 33,237 | 28,302 | 4.5% | 22.7% |
| Allowances /Total non-performing portfolio | 218.44% | 220.29% | 219.40% | (185)bps | (96)bps |
| Quarterly change in Write-offs | 5,655 | 2,627 | 3,564 | 115.3% | 58.7% |
| Write offs / Total portfolio | 0.49% | 0.23% | 0.30% | 26 bps | 19 bps |
| Cost of Risk (CoR) | 4.09% | 3.73% | 1.94% | 36 bps | 215 bps |
(1) Non-performing loans include: all loans to borrowers classified as "Deficient Servicing (Stage 3)", "High Insolvency Risk (Stage 4)", "Irrecoverable" and/or "Irrecoverable for Technical Decision" (Stage 5) according to BCRA debtor classification system | |||||
As of 2Q23, asset quality ratio or NPL (total non-performing portfolio / total portfolio) keeps a very good performance at 1.38%. The increase from 1Q23’s 1.31% is explained by a slight increase in the retail non-performing portfolio.
Coverage ratio (allowances / total non-performing portfolio) decreased from 220.29% to 218.44% in 2Q23 due to a greater increase in the non-performing portfolio compared to the increase in allowances.
Cost of risk (loan loss allowances / average total loans) reached 4.09% in 2Q23 compared to 3.73% in 1Q23. Even though the portfolio increased, it did so in a lower proportion than allowances.
| ANALYSIS FOR THE ALLOWANCE OF LOAN LOSSES | BBVA ARGENTINA CONSOLIDATED | |||||
| In millions of AR$ | ||||||
| Balance at 12/31/2022 | Stage 1 | Stage 2 | Stage 3 | Monetary result generated by allowances | Balance at 06/30/2022 | |
| Other financial assets | 696 | 53 | - | 84 | (250) | 583 |
| Loans and other financing | 31,477 | 3,100 | 3,447 | 9,846 | (13,149) | 34,721 |
| Other debt securities | 48 | 34 | - | - | (21) | 61 |
| Eventual commitments | 4,060 | 1,093 | 149 | 63 | (1,558) | 3,807 |
| Total allowances | 36,281 | 4,280 | 3,596 | 9,993 | (14,978) | 39,172 |
| Note: to be consistent with Financial Statements, it must be recorded from the beginning of the year instead of the quarter | ||||||
Allowances for the Bank in 2Q23 reflect expected losses driven by the adoption of the IFRS 9 standards as of January 1, 2020, except for debt instruments issued by the nonfinancial government sector which were excluded from the scope of such standard.
| 20 |
| |
Public Sector Exposure
| NET PUBLIC DEBT EXPOSURE* | BBVA ARGENTINA CONSOLIDATED | ||||
| In millions of AR$ - Inflation adjusted | ∆ % | ||||
| 2Q23 | 1Q23 | 2Q22 | QoQ | YoY | |
| Treasury and Government securities | 343,513 | 265,599 | 274,142 | 29.3% | 25.3% |
| Treasury and National Government | 343,513 | 265,599 | 274,142 | 29.3% | 25.3% |
| National Treasury Public Debt in AR$ | 343,508 | 265,017 | 267,500 | 29.6% | 28.4% |
| National Treasury Public Debt in USD | 5 | 15 | 2,644 | (64.9%) | (99.8%) |
| National Treasury Public Debt in AR$ linked to US dollars | - | 567 | 3,997 | (100.0%) | (100.0%) |
| Loans to theNon-financial Public Sector | 4 | 4 | 6 | - | (33.3%) |
| AR$ Subtotal | 343,512 | 265,021 | 267,506 | 29.6% | 28.4% |
| USD Subtotal** | 5 | 582 | 6,642 | (99.1%) | (99.9%) |
| Total Public Debt Exposure | 343,517 | 265,603 | 274,148 | 29.3% | 25.3% |
| B.C.R.A. Exposure | 953,162 | 832,171 | 953,766 | 14.5% | (0.1%) |
| Instruments | 777,431 | 657,403 | 704,076 | 18.3% | 10.4% |
| Leliqs | 745,603 | 654,350 | 599,724 | 13.9% | 24.3% |
| Notaliqs | - | - | 104,353 | N/A | (100.0%) |
| Lediv*** | 31,828 | 3,053 | - | n.m | N/A |
| Loans to the B.C.R.A. | - | - | 7 | N/A | (100.0%) |
| Repo / Pases | 175,731 | 174,768 | 249,689 | 0.6% | (29.6%) |
| % Public sector exposure (Excl. B.C.R.A.) / Total assets | 11.0% | 9.1% | 9.0% | 187 pbs | 191 pbs |
| *Deposits at the Central Bank used to comply with reserve requirements not included. Includes assets used as collateral. | |||||
| **Includes USD-linked Treasury public debt in AR$ | |||||
| ***Securities denominated in foreign currency | |||||
2Q23 total public sector exposure (excluding BCRA) totaled $343.5 billion, increasing 29.3% or $77.9 billion QoQ, and 25.3% or $69.4 billion YoY. The quarterly increase is explained by an increment in the position of National Treasury bills in pesos, especially with CER adjustment.
Short-term liquidity is mostly allocated in BCRA instruments, which increased 18.3% QoQ and 10.4% YoY in real terms. Total exposure to the BCRA increased 14.5% in 2Q23. It is worth noting the increase in LEDIV (Central Bank USD bills settled in pesos through the Reference FX rate at 0% rate), due to greater activity from agro-exporters through the Government’s program “dólar soja III”.
Exposure to the public sector (excluding BCRA) represents 11.0% of total assets, above the 9.1% in 1Q23 and above the 9.0% in 2Q22.
| 21 |
| |
Deposits
| TOTAL DEPOSITS | BBVA ARGENTINA CONSOLIDATED | ||||
| In millions of AR$ - Inflation adjusted | ∆ % | ||||
| 2Q23 | 1Q23 | 2Q22 | QoQ | YoY | |
| Total deposits | 2,009,719 | 1,945,662 | 2,099,959 | 3.3% | (4.3%) |
| Non-financial Public Sector | 11,005 | 14,901 | 31,352 | (26.1%) | (64.9%) |
| Financial Sector | 1,891 | 1,274 | 624 | 48.4% | 203.0% |
| Non-financial private sector and residents abroad | 1,996,823 | 1,929,487 | 2,067,983 | 3.5% | (3.4%) |
| Non-financial private sector and residents abroad - AR$ | 1,627,703 | 1,526,059 | 1,661,849 | 6.7% | (2.1%) |
| Checking accounts | 457,154 | 398,380 | 512,782 | 14.8% | (10.8%) |
| Savings accounts | 379,466 | 316,900 | 391,373 | 19.7% | (3.0%) |
| Time deposits | 637,692 | 623,765 | 544,613 | 2.2% | 17.1% |
| Investment accounts | 142,459 | 175,713 | 201,354 | (18.9%) | (29.2%) |
| Other | 10,932 | 11,301 | 11,727 | (3.3%) | (6.8%) |
| Non-financial private sector and res. abroad - Foreign Currency | 369,120 | 403,428 | 406,134 | (8.5%) | (9.1%) |
| Checking accounts | 116 | 113 | 33 | 2.7% | 251.5% |
| Savings accounts | 332,055 | 362,694 | 360,401 | (8.4%) | (7.9%) |
| Time deposits | 33,325 | 36,990 | 41,056 | (9.9%) | (18.8%) |
| Other | 3,624 | 3,631 | 4,644 | (0.2%) | (22.0%) |
| % of total portfolio in the private sector in AR$ | 81.5% | 79.1% | 80.4% | 242 bps | 115 bps |
| % of total portfolio in the private sector in Foregin Currency | 18.5% | 20.9% | 19.6% | (242)bps | (115)bps |
| % of UVA Time deposits & Investment accounts / Total AR$ Time deposits & Investment accounts | 2.4% | 2.4% | 7.0% | (4)bps | (463)bps |
| DEPOSITS TO THE NON-FINANCIAL PRIVATE SECTOR AND RES. ABROAD IN FOREIGN CURRENCY | BBVA ARGENTINA CONSOLIDATED | ||||
| In millions of USD | ∆ % | ||||
| 2Q23 | 1Q23 | 2Q22 | QoQ | YoY | |
| FX rate* | 256.7 | 209.0 | 125.2 | 22.8% | 105.0% |
| Non-financial private sector and residents abroad - Foreign Currency (USD) | 1,438 | 1,560 | 1,505 | (7.8%) | (4.4%) |
| *Wholesale U.S. dollar foreign exchange rates on BCRA’s Communication “A” 3500, as of the end of period. | |||||
As of 2Q23, total deposits reached $2.0 trillion, increasing 3.3% or $64.1 billion QoQ, and falling 4.3% or $90.2 billion YoY.
Private non-financial sector deposits in 2Q23 totaled $2.0 trillion, growing 3.5% QoQ, and falling 3.4% YoY.
Private non-financial sector deposits in pesos totaled $1.6 trillion, increasing 6.7% compared to 1Q23, and falling 2.1% compared to 2Q22. The quarterly change is mainly affected by a 19.7% increase in savings accounts (partially pushed by exporters’ and agricultural producers’ deposits linked to the “dolar soja III” program), and a 14.8% increase in checking accounts, partially offset by a fall in investment accounts by 18.9%.
Private non-financial sector deposits in foreign currency expressed in pesos fell 8.5% QoQ and 9.1% YoY. Measured in U.S. dollars, these deposits declined 7.8% QoQ, and 4.4% YoY.
| 22 |
| |
| PRIVATE DEPOSITS | BBVA ARGENTINA CONSOLIDATED | ||||
| In millions of AR$ - Inflation adjusted | ∆ % | ||||
| 2Q23 | 1Q23 | 2Q22 | QoQ | YoY | |
| Non-financial private sector and residents abroad | 1,996,823 | 1,929,487 | 2,067,983 | 3.5% | (3.4%) |
| Sight deposits | 1,183,347 | 1,093,019 | 1,280,960 | 8.3% | (7.6%) |
| Checking accounts | 457,270 | 398,493 | 512,815 | 14.7% | (10.8%) |
| Savings accounts | 711,521 | 679,594 | 751,774 | 4.7% | (5.4%) |
| Other | 14,556 | 14,932 | 16,371 | (2.5%) | (11.1%) |
| Time deposits | 813,476 | 836,468 | 787,023 | (2.7%) | 3.4% |
| Time deposits | 671,017 | 660,755 | 585,669 | 1.6% | 14.6% |
| Investment accounts | 142,459 | 175,713 | 201,354 | (18.9%) | (29.2%) |
| % of sight deposits over total private deposits | 59.5% | 57.0% | 62.5% | 251 bps | (300)bps |
| % of time deposits over total private deposits | 40.5% | 43.0% | 37.5% | (251)bps | 300 bps |
As observed in previous quarters, deposits were impacted by the effect of inflation. In spite of this, in nominal terms, BBVA Argentina managed to increase the sight deposits, time deposits and total deposits by 34.0%, 20.4% and 27.9% respectively.
| PRIVATE DEPOSITS - NON RESTATED FIGURES | BBVA ARGENTINA CONSOLIDATED | ||||
| In millions of AR$ | ∆ % | ||||
| 2Q23 | 1Q23 | 2Q22 | QoQ | YoY | |
| Sight deposits | 1,183,347 | 883,030 | 594,196 | 34.0% | 99.2% |
| Time deposits | 813,476 | 675,766 | 365,073 | 20.4% | 122.8% |
| Total deposits | 2,009,719 | 1,571,863 | 974,101 | 27.9% | 106.3% |
As of 2Q23, the Bank’s transactional deposits (checking accounts and savings accounts) represented 58.2% of total non-financial private deposits, totaling $1.2 trillion, versus 55.4% in 1Q23.
| MARKET SHARE - PRIVATE SECTOR DEPOSITS | BBVA ARGENTINA CONSOLIDATED | ||||
| In % | ∆ bps | ||||
| 2Q23 | 1Q23 | 2Q22 | QoQ | YoY | |
| Private sector Deposits - Consolidated* | 7.03% | 6.83% | 7.16% | 21 pbs | (33)pbs |
| Based on daily BCRA information. Capital balance as of the last day of each quarter. | |||||
| * Consolidates PSA, VWFS & Rombo | |||||
Other Sources of Funds
| OTHER SOURCES OF FUNDS | BBVA ARGENTINA CONSOLIDATED | ||||
| In millions of AR$ - Inflation adjusted | ∆ % | ||||
| 2Q23 | 1Q23 | 2Q22 | QoQ | YoY | |
| Other sources of funds | 586,294 | 583,826 | 540,718 | 0.4% | 8.4% |
| Central Bank | 84 | 96 | 120 | (12.5%) | (30.0%) |
| Banks and international organizations | 2,194 | 980 | 18 | 123.9% | n.m |
| Financing received from local financial institutions | 25,434 | 21,769 | 44,176 | 16.8% | (42.4%) |
| Corporate bonds | - | - | 851 | N/A | (100.0%) |
| Equity | 558,582 | 560,981 | 495,553 | (0.4%) | 12.7% |
| 23 |
| |
In 2Q23, other sources of funds totaled $586.3 billion, growing 0.4% or $2.5 billion QoQ, and 8.4% or $45.6 billion YoY.
The mild decrease in the quarter is mostly explained by the 0.4% decline in equity (explained by dividend payments), offset by a 16.8% increase in financing received from local financial institutions taken by consolidated companies, followed by a 123.9% increase in banks and international organizations.
Liquid Assets
| TOTAL LIQUID ASSETS | BBVA ARGENTINA CONSOLIDATED | ||||
| In millions of AR$ - Inflation adjusted | ∆ % | ||||
| 2Q23 | 1Q23 | 2Q22 | QoQ | YoY | |
| Total liquid assets | 1,690,753 | 1,531,130 | 1,610,150 | 10.4% | 5.0% |
| Cash and deposits in banks | 424,604 | 463,087 | 399,635 | (8.3%) | 6.2% |
| Debt securities at fair value through P&L | 80,226 | 35,051 | 43,403 | 128.9% | 84.8% |
| Government securities | 56,369 | 10,550 | 8,650 | 434.3% | n.m |
| Liquidity bills of B. C. R. A. | 23,857 | 24,501 | 34,753 | (2.6%) | (31.4%) |
| Net REPO transactions | 175,731 | 174,768 | 249,688 | 0.6% | (29.6%) |
| Other debt securities | 1,010,192 | 858,224 | 917,424 | 17.7% | 10.1% |
| Government securities | 256,125 | 225,011 | 247,750 | 13.8% | 3.4% |
| Liquidity bills of B. C. R. A. | 722,239 | 630,160 | 669,674 | 14.6% | 7.8% |
| Internal bills of B.C.R.A. | 31,828 | 3,053 | - | n.m | N/A |
| Liquid assets / Total Deposits | 84.1% | 78.7% | 76.7% | 543 bps | 745 bps |
In 2Q23, liquid assets were $1.7 trillion, increasing 10.4% or $159.6 billion versus 1Q23, and 5.0% or $80.6 billion compared to 2Q22.
In the quarter, the liquidity ratio (liquid assets / total deposits) reached 84.1%. Liquidity ratio in local and foreign currency reached 78.5% and 108.6% respectively.
| 24 |
| |
Solvency
| MINIMUM CAPITAL REQUIREMENT | BBVA ARGENTINA CONSOLIDATED | ||||
| In millions of AR$ - Inflation adjusted | ∆ % | ||||
| 2Q23 | 1Q23 | 2Q22 | QoQ | YoY | |
| Minimum capital requirement | 149,327 | 151,079 | 149,282 | (1.2%) | 0.0% |
| Credit risk | 105,317 | 106,934 | 107,216 | (1.5%) | (1.8%) |
| Market risk | 882 | 1,773 | 1,231 | (50.2%) | (28.3%) |
| Operational risk | 43,128 | 42,373 | 40,835 | 1.8% | 5.6% |
| Integrated Capital - RPC (1)* | 518,782 | 515,895 | 418,090 | 0.6% | 24.1% |
| Ordinary Capital Level 1 ( COn1) | 560,326 | 563,235 | 498,236 | (0.5%) | 12.5% |
| Deductible items COn1 | (48,605) | (55,033) | (82,912) | 11.7% | 41.4% |
| Additional Capital Level 2 (COn2) | 7,061 | 7,693 | 2,766 | (8.2%) | 155.3% |
| Excess Capital | |||||
| Integration excess | 369,455 | 364,816 | 268,808 | 1.3% | 37.4% |
| Excess as % of minimum capital requirement | 247.4% | 241.5% | 180.1% | 594 bps | 6,735 bps |
| Risk-weighted assets (RWA, according to B.C.R.A. regulation) (2) | 1,828,243 | 1,849,559 | 1,826,996 | (1.2%) | 0.1% |
| Regulatory Capital Ratio (1)/(2) | 28.4% | 27.9% | 22.9% | 48 pbs | 549 pbs |
| TIER I Capital Ratio (Ordinary Capital Level 1/ RWA) | 28.0% | 27.5% | 0 pbs | 51 pbs | 526 pbs |
| * RPC includes 100% of quarterly results | |||||
BBVA Argentina continues to show strong solvency indicators on 2Q23. Capital ratio reached 28.4%, above 1Q23’s 27.9%. Tier 1 ratio was 28.0% and capital excess over regulatory requirement was $369.5 billion or 247.4%.
| 25 |
| |
BBVA Argentina Asset Management S.A.
| MUTUAL FUNDS ASSETS | BBVA ARGENTINA CONSOLIDATED | ||||
| In millions of AR$ - Inflation adjusted | ∆ % | ||||
| 2Q23 | 1Q23 | 2Q22 | QoQ | YoY | |
| FBA Renta Pesos | 602,127 | 619,293 | 498,406 | (2.8%) | 20.8% |
| FBA Renta Fija Plus | 5,538 | 9,675 | 33,109 | (42.8%) | (83.3%) |
| FBA Ahorro Pesos | 4,016 | 7,531 | 13,219 | (46.7%) | (69.6%) |
| FBA Horizonte | 409 | 468 | 811 | (12.6%) | (49.6%) |
| FBA Calificado | 6,476 | 3,649 | 1,850 | 77.5% | 250.1% |
| FBA Acciones Argentinas | 6,500 | 3,881 | 1,574 | 67.5% | 313.0% |
| FBA Acciones Latinoamericanas | 2,045 | 1,548 | 1,246 | 32.1% | 64.1% |
| FBA Bonos Argentina | 1,104 | 1,381 | 2,229 | (20.1%) | (50.5%) |
| FBA Bonos Globales | 24 | 32 | 78 | (25.0%) | (69.2%) |
| FBA Renta Mixta | 1,729 | 1,008 | 496 | 71.5% | 248.6% |
| FBA Gestión I | 51 | 58 | 80 | (12.1%) | (36.3%) |
| FBA Horizonte Plus | 10 | 14 | 26 | (28.6%) | (61.5%) |
| FBA Retorno Total I | 14 | 25 | 41 | (44.0%) | (65.9%) |
| FBA Renta Publica I | 569 | 562 | 65 | 1.2% | n.m |
| FBA Renta Fija Local | 3 | 4 | 4 | (25.0%) | (25.0%) |
| FBA Renta Publica II | - | - | - | N/A | N/A |
| Total assets | 630,615 | 649,129 | 553,234 | (2.9%) | 14.0% |
| AMASAU Net Income | 1,373 | 1,274 | 973 | 7.8% | 41.1% |
| MARKET SHARE - MUTUAL FUNDS | BBVA ASSET MANAGEMENT | ||||
| In % | ∆ bps | ||||
| 2Q23 | 1Q23 | 2Q22 | QoQ | YoY | |
| Mutual funds | 5.77% | 6.15% | 5.60% | (38)bps | 55 bps |
| Source: Cámara Argentina de Fondos Comunes de Inversión | |||||
| 26 |
| |
Other Events
Main Relevant Events
| · | Dividend payment approval. As of June 1, 2023, the Bank published that, the prior day, the Central Bank of the Argentine Republic’s Superintendence of Exchange Institutions informed that it resolved to authorize Banco BBVA Argentina S.A. the distribution of profits for a total amount of $50.4 billion which shall be made in installments, in accordance with the provisions set forth in Communication "A" 7719 of the BCRA and whose payment schedule will be reported shortly. As established by the Ordinary and Extraordinary General Meeting of Shareholders held on April 28th, 2023, the Board of Directors shall determine the opportunity, modality, terms, and other conditions of dividends to shareholders. For further information click here. |
| · | Payment of installment 1 and dividend payment schedule. As of June 7, 2023, the Board of Directors meeting held on June 7, 2023, the payment of a dividend in the amount of $50.4 billion to be paid in kind through the delivery of 49.5 billion in aggregate principal amount of the Argentine Treasury bill in pesos adjusted by CER at a discount due November 23, 2023 was approved and the following dividend payment schedule was resolved: |
| 2023 | |||
| Installment n° | Record date | Payment date | Argentine Treasury Bill in Pesos adjusted by CER at a discount due on November 21, 2023. Principal Amount: |
| 1 | June 22 | June 27 | 8,254,072,169 |
| 2 | July 17 | July 20 | 8,254,072,169 |
| 3 | August 3 | August 8 | 8,254,072,169 |
| 4 | September 5 | September 8 | 8,254,072,169 |
| 5 | October 2 | October 5 | 8,254,072,169 |
| 6 | October 27 | November 1 | 8,254,072,169 |
For further information refer to the relevant event on the Investor Relations’ website on the Financial information > CNV filings section.
| · | As of June 27, 2023, the Board of Directors approved possible investment operations to its related part Banco Bilbao Vizcaya Argentaria S.A. The Audit Committee is in favor of such operation, considered generic and comprehensive for all transactions carried out since the date of the Committee’s report, which concluded that there were no objections to be raised in this respect and that they could be deemed reasonably adequate to usual and normal market conditions. For further information click here. |
| · | As of July 5, 2023, it was notified in regards to installment 2 of dividend payments, that as of July 20, 2023 the Bank will proceed to make available and pay to its existing shareholders on the Bank's share register, as of July 17, 2023 a dividend, by means of the delivery of: |
| (i) | Payment in Kind: Up to 8,254,072,169 par value of the National Treasury Bill in Pesos Adjusted by CER at a discount due November 23, 2023 at a ratio of par value 13.4714156856 of the above mentioned security for each Company share of $ 1 par value, which represents 1370.99 % of the capital stock of $612,710,079. Fractions of less than 1 will be settled in Pesos; or |
| (ii) | Cash option: Up to $8,400,169,246.50 at a ratio of $13.7098597435 for each Company share of $1 par value. |
Payments will be made in kind, except for those shareholders who expressly elect to receive their dividend in cash in Argentine pesos. The final amounts of the nominal values or pesos detailed in items (i) and (ii) above will depend on the exercise of the option of payment in pesos. For further information refer to the relevant event on the Investor Relations’ website on the Financial information > CNV filings section.
| 27 |
| |
| · | As of July 24, 2023, it was notified in regards to installment 3 of dividend payments, that as of August 8, 2023 the Bank will proceed to make available and pay to its existing shareholders on the Bank's share register, as of August 3, 2023 a dividend, by means of the delivery of: |
| (i) | Payment in Kind: Up to 8,254,072,169 par value of the National Treasury Bill in Pesos Adjusted by CER at a discount due November 23, 2023 (ISIN ARARGE520DT9) Ticker X23N3 (CV code 9197) at a ratio of par value 13.4714156856 of the above mentioned security for each Company share of Ps. 1 par value, which represents 1370.99 % of the capital stock of Ps. 612,710,079. Fractions of less than 1 will be settled in Pesos; or |
| (ii) | Cash option: Up to $8,400,169,246.50 at a ratio of $13.7098597435 for each Company share of $1 par value. |
Payments will be made in kind, except for those shareholders who expressly elect to receive their dividend in cash in Argentine pesos. The final amounts of the nominal values or pesos detailed in items (i) and (ii) above will depend on the exercise of the option of payment in pesos. For further information refer to the relevant event on the Investor Relations’ website on the Financial information > CNV filings section.
SMEs Productive investment financing credit lines – June 2023
As of June 30, 2023, total loans granted by the Ban complied with what was requested by the BCRA. The following table shows the evolution of disbursements:
| Quota | Minimum amount to be allocated (1) | Simple average of daily balances (1) | Disbursed amount (1) |
| 2021/2022 Quota | 32.447.048 | 43.434.402 | 62.449.414 |
| 2022 Quota | 42.867.291 | 63.022.460 | 98.200.990 |
| 2022/2023 Quota | 58.519.929 | 86.880.132 | 127.355.598 |
| 2023 Quota | 58.558.806 | (*) | (*) |
(*)As of the date of these financial statements, the term reported by Communication “B” 12413 has not expired.
(1) Numbers are expressed in nominal terms.
| 28 |
| |
Main Regulatory Changes
Time deposit rate. LELIQ. (Press release, 04/20/2023). The BCRA increased 300bps the 28-day LELIQ monetary policy rate to 81% APR (prev. 78%), increasing by the same magnitude the minimum time deposit rate for deposits of up to $10 million.
Time deposit rate. LELIQ. (Press release, 04/27/2023). The BCRA increased 1000bps the 28-day LELIQ monetary policy rate to 91% APR (prev. 81%), increasing by the same magnitude the minimum time deposit rate for deposits of up to $10 million.
Time deposit rate. LELIQ. (Press release, 05/15/2023). The BCRA increased 600bps the 28-day LELIQ monetary policy rate to 97% APR (prev. 91%), increasing by the same magnitude the minimum time deposit rate for deposits of up to $10 million. Additionally, it increased the credit card financing rate for individuals as of June from 86% to 88% APR.
Saving deposits. (Communication “A” 7796, 06/29/2023). The BCRA includes the Chinese Yuan as an admitted currency for deposit receiving in savings accounts and especial checking accounts for legal entities.
Time deposit rate. LELIQ. Credit card rate. (Communication “A” 7822, 08/14/2023). The BCRA increased 2.100 bps the 28-day LELIQ monetary policy rate to118% APR (prev. 97%), increasing by the same magnitude the minimum time deposit rate for deposits of up to $30 million. For productive investment financing lines to SMEs it will be a 97% APR and 109% APR for working capital. Additionally, it increased the credit card financing rate for individuals as of June from 86% to 107% APR.
| 29 |
| |
Glossary
Active clients: holders of at least one active product. An active product is in most cases a product with at least “one movement” in the last 3 months, or a minimum balance.
APR: Annual Percentage Rate
APY: Annual Percentage Yield
Cost of Risk (accumulated): Year to date accumulated loan loss allowances / Average total loans.
Average total loans: average between previous year-end Total loans and other financing and current period Total loans and other financing.
Cost of Risk (quarterly): Current period Loan loss allowances / Average total loans. Average total loans: average between previous quarter-end Total loans and other financing and current period Total loans and other financing.
Coverage ratio: Quarterly allowances under the Expected Credit Loss model / total non-performing portfolio.
Digital clients: we consider a customer to be an active user of online banking when they have been logged at least once within the last three months using the internet or a cell phone and SMS banking.
Efficiency ratio (Excl. inflation adjustments, accumulated): Accumulated (Personnel benefits+ Administrative expenses + Depreciation & Amortization) / Accumulated (Net Interest Income + Net Fee Income + Net Income from measurement of Financial Instruments at Fair Value through P&L + Net income from write-down of assets at amortized cost and at fair value through OCI + Foreign exchange and gold gains + some concepts included in Other net operating income).
Efficiency ratio (Excl. inflation adjustments, quarterly): (Personnel benefits+ Administrative expenses + Depreciation & Amortization) / (Net Interest Income + Net Fee Income + Net Income from measurement of Financial Instruments at Fair Value through P&L + Net income from write-down of assets at amortized cost and at fair value through OCI + Foreign exchange and gold gains + some concepts included in Other net operating income).
Efficiency ratio (accumulated): Accumulated (Personnel benefits+ Administrative expenses + Depreciation & Amortization) / Accumulated (Net Interest Income + Net Fee Income + Net Income from measurement of Financial Instruments at Fair Value through P&L + Net income from write-down of assets at amortized cost and at fair value through OCI + Foreign exchange and gold gains + some concepts included in Other net operating income+ Income from net monetary position).
Efficiency ratio (quarterly): (Personnel benefits+ Administrative expenses + Depreciation & Amortization) / (Net Interest Income + Net Fee Income + Net Income from measurement of Financial Instruments at Fair Value through P&L + Net income from write-down of assets at amortized cost and at fair value through OCI + Foreign exchange and gold gains + some concepts included in Other net operating income+ Income from net monetary position).
Liquidity Ratio: (Cash and deposits in banks + Debt securities at fair value through P&L (Excl. Private securities) + Net REPO transactions + Other debt securities (Excl. Private securities) / Total Deposits.
Mobile clients: customers who have been active in online banking at least once in the last three months using a mobile device.
Net Interest Margin (NIM) – (quarterly): Quarterly Net Interest Income / Average quarterly interest earning assets.
Public Sector Exposure (excl. BCRA): (National and Provincial Government public debt + Loans to the public sector + REPO transactions) / Total Assets.
| 30 |
| |
ROA (accumulated): Accumulated net Income of the period attributable to owners of the parent / Total Average Assets. Total Average Assets is calculated as the average between total assets on December of the previous year and total assets in the current period, expressed in local currency. Calculated over a 365-day year.
ROA (quarterly): Net Income of the period attributable to owners of the parent / Total Average Assets. Total Average Assets is calculated as the average between total assets on the previous quarter-end and total assets in the current period, expressed in local currency. Calculated over a 365-day year.
ROE (accumulated): Accumulated net Income of the period attributable to owners of the parent / Average Equity. Average Equity is calculated as the average between equity in December of the previous year and equity in the current period, expressed in local currency. Calculated over a 365-day year.
ROE (quarterly): Net Income of the period attributable to owners of the parent / Average Equity. Average Equity is calculated as the average between equity on the previous quarter end and equity in the current period, expressed in local currency. Calculated over a 365-day year.
Spread: (Quarterly Interest Income / Quarterly average Interest-earning Assets) – (Quarterly Interest Expenses / Quarterly average interest-bearing liabilities).
Other terms
n.m.: not meaningful. Implies an increase above 500% and a decrease below -500%.
N/A: not applicable.
Bps: basis points.
| 31 |
| |
Balance Sheet
| BALANCE SHEET | BBVA ARGENTINA CONSOLIDATED | ||||
| In millions of AR$ - Inflation adjusted | ∆ % | ||||
| 2Q23 | 1Q23 | 2Q22 | QoQ | YoY | |
| Assets | |||||
| Cash and deposits in banks | 424,604 | 463,087 | 399,635 | (8.3%) | 6.2% |
| Cash | 141,091 | 148,608 | 164,230 | (5.1%) | (14.1%) |
| Financial institutions and correspondents | 234,275 | 314,296 | 235,007 | (25.5%) | (0.3%) |
| BCRA | 225,278 | 302,652 | 208,919 | (25.6%) | 7.8% |
| Other local and foreign financial institutions | 8,997 | 11,644 | 26,088 | (22.7%) | (65.5%) |
| Other | 49,238 | 183 | 398 | n.m | n.m |
| Debt securities at fair value through profit or loss | 80,226 | 35,051 | 43,403 | 128.9% | 84.8% |
| Derivatives | 3,260 | 1,394 | 930 | 133.9% | 250.5% |
| Repo transactions | 175,731 | 174,768 | 249,688 | 0.6% | (29.6%) |
| Other financial assets | 90,677 | 48,098 | 44,874 | 88.5% | 102.1% |
| Loans and other financing | 1,052,090 | 1,056,922 | 1,103,219 | (0.5%) | (4.6%) |
| Non-financial public sector | 4 | 4 | 6 | - | (33.3%) |
| B.C.R.A | - | - | 7 | N/A | (100.0%) |
| Other financial institutions | 7,081 | 6,536 | 11,241 | 8.3% | (37.0%) |
| Non-financial private sector and residents abroad | 1,045,005 | 1,050,382 | 1,091,965 | (0.5%) | (4.3%) |
| Other debt securities | 1,016,551 | 864,161 | 922,176 | 17.6% | 10.2% |
| Financial assets pledged as collateral | 79,524 | 65,758 | 55,030 | 20.9% | 44.5% |
| Current income tax assets | 80 | 95 | 1,727 | (15.8%) | (95.4%) |
| Investments in equity instruments | 2,324 | 1,503 | 1,130 | 54.6% | 105.7% |
| Investments in subsidiaries and associates | 5,531 | 5,678 | 5,635 | (2.6%) | (1.8%) |
| Property and equipment | 142,744 | 143,779 | 148,146 | (0.7%) | (3.6%) |
| Intangible assets | 14,740 | 14,414 | 12,654 | 2.3% | 16.5% |
| Deferred income tax assets | 1,876 | 1,904 | 2,242 | (1.5%) | (16.3%) |
| Other non-financial assets | 42,941 | 44,000 | 38,201 | (2.4%) | 12.4% |
| Non-current assets held for sale | 400 | 400 | 887 | - | (54.9%) |
| Total Assets | 3,133,299 | 2,921,012 | 3,029,577 | 7.3% | 3.4% |
| Liabilities | |||||
| Deposits | 2,009,719 | 1,945,662 | 2,099,959 | 3.3% | (4.3%) |
| Non-financial public sector | 11,005 | 14,901 | 31,352 | (26.1%) | (64.9%) |
| Financial sector | 1,891 | 1,274 | 624 | 48.4% | 203.0% |
| Non-financial private sector and residents abroad | 1,996,823 | 1,929,487 | 2,067,983 | 3.5% | (3.4%) |
| Derivatives | 472 | 645 | 317 | (26.8%) | 48.9% |
| Other financial liabilities | 278,563 | 164,270 | 170,281 | 69.6% | 63.6% |
| Financing received from the B.C.R.A. and other financial institutions | 27,712 | 22,845 | 44,315 | 21.3% | (37.5%) |
| Corporate bonds issued | - | - | 851 | N/A | (100.0%) |
| Current income tax liabilities | 27,441 | 19,771 | 528 | 38.8% | n.m |
| Provisions | 11,724 | 12,259 | 14,814 | (4.4%) | (20.9%) |
| Deferred income tax liabilities | 14,345 | 7,019 | 9 | 104.4% | n.m |
| Other non-financial liabilities | 196,307 | 179,430 | 194,140 | 9.4% | 1.1% |
| Total Liabilities | 2,566,283 | 2,351,901 | 2,525,214 | 9.1% | 1.6% |
| Equity | |||||
| Share Capital | 613 | 613 | 613 | - | - |
| Non-capitalized contributions | 6,745 | 6,745 | 6,745 | - | - |
| Capital adjustments | 194,843 | 194,843 | 194,843 | - | - |
| Reserves | 314,591 | 263,635 | 263,635 | 19.3% | 19.3% |
| Retained earnings | - | 88,639 | 16 | (100.0%) | (100.0%) |
| Other accumulated comprehensive income | (6,871) | (12,097) | (15,409) | 43.2% | 55.4% |
| Income for the period | 48,661 | 18,603 | 45,110 | 161.6% | 7.9% |
| Equity attributable to owners of the Parent | 558,582 | 560,981 | 495,553 | (0.4%) | 12.7% |
| Equity attributable to non-controlling interests | 8,434 | 8,130 | 8,810 | 3.7% | (4.3%) |
| Total Equity | 567,016 | 569,111 | 504,363 | (0.4%) | 12.4% |
| Total Liabilities and Equity | 3,133,299 | 2,921,012 | 3,029,577 | 7.3% | 3.4% |
| 32 |
| |
Balance Sheet – Five quarters
| BALANCE SHEET | BBVA ARGENTINA CONSOLIDATED | ||||
| In millions of AR$ - Inflation adjusted | |||||
| 2Q23 | 1Q23 | 4Q22 | 3Q22 | 2Q22 | |
| Assets | |||||
| Cash and deposits in banks | 424,604 | 463,087 | 446,456 | 359,254 | 399,635 |
| Cash | 141,091 | 148,608 | 176,984 | 168,122 | 164,230 |
| Financial institutions and correspondents | 234,275 | 314,296 | 269,336 | 191,121 | 235,007 |
| B.C.R.A | 225,278 | 302,652 | 243,212 | 170,291 | 208,919 |
| Other local and foreign financial institutions | 8,997 | 11,644 | 26,124 | 20,830 | 26,088 |
| Other | 49,238 | 183 | 136 | 11 | 398 |
| Debt securities at fair value through profit or loss | 80,226 | 35,051 | 38,454 | 36,316 | 43,403 |
| Derivatives | 3,260 | 1,394 | 3,418 | 3,600 | 930 |
| Repo transactions | 175,731 | 174,768 | 79,205 | 168,408 | 249,688 |
| Other financial assets | 90,677 | 48,098 | 49,337 | 44,633 | 44,874 |
| Loans and other financing | 1,052,090 | 1,056,922 | 1,080,527 | 1,010,694 | 1,103,219 |
| Non-financial public sector | 4 | 4 | 2 | 4 | 6 |
| B.C.R.A | - | - | 14 | 5 | 7 |
| Other financial institutions | 7,081 | 6,536 | 6,376 | 8,257 | 11,241 |
| Non-financial private sector and residents abroad | 1,045,005 | 1,050,382 | 1,074,135 | 1,002,428 | 1,091,965 |
| Other debt securities | 1,016,551 | 864,161 | 972,047 | 917,542 | 922,176 |
| Financial assets pledged as collateral | 79,524 | 65,758 | 69,607 | 82,138 | 55,030 |
| Current income tax assets | 80 | 95 | 58 | 307 | 1,727 |
| Investments in equity instruments | 2,324 | 1,503 | 1,414 | 1,361 | 1,130 |
| Investments in subsidiaries and associates | 5,531 | 5,678 | 5,225 | 5,451 | 5,635 |
| Property and equipment | 142,744 | 143,779 | 144,811 | 143,177 | 148,146 |
| Intangible assets | 14,740 | 14,414 | 14,492 | 13,224 | 12,654 |
| Deferred income tax assets | 1,876 | 1,904 | 2,291 | 2,199 | 2,242 |
| Other non-financial assets | 42,941 | 44,000 | 43,912 | 41,592 | 38,201 |
| Non-current assets held for sale | 400 | 400 | 339 | 357 | 887 |
| Total Assets | 3,133,299 | 2,921,012 | 2,951,593 | 2,830,253 | 3,029,577 |
| Liabilities | |||||
| Deposits | 2,009,719 | 1,945,662 | 1,979,676 | 1,879,947 | 2,099,959 |
| Non-financial public sector | 11,005 | 14,901 | 14,586 | 16,388 | 31,352 |
| Financial sector | 1,891 | 1,274 | 512 | 1,122 | 624 |
| Non-financial private sector and residents abroad | 1,996,823 | 1,929,487 | 1,964,578 | 1,862,437 | 2,067,983 |
| Derivatives | 472 | 645 | 504 | 980 | 317 |
| Other financial liabilities | 278,563 | 164,270 | 178,455 | 190,230 | 170,281 |
| Financing received from the B.C.R.A. and other financial institutions | 27,712 | 22,845 | 29,945 | 26,159 | 44,315 |
| Corporate bonds issued | - | - | 288 | 555 | 851 |
| Current income tax liabilities | 27,441 | 19,771 | 10,921 | 837 | 528 |
| Provisions | 11,724 | 12,259 | 13,063 | 12,465 | 14,814 |
| Deferred income tax liabilities | 14,345 | 7,019 | 10,083 | 12,764 | 9 |
| Other non-financial liabilities | 196,307 | 179,430 | 177,341 | 172,625 | 194,140 |
| Total Liabilities | 2,566,283 | 2,351,901 | 2,400,276 | 2,296,562 | 2,525,214 |
| Equity | |||||
| Share Capital | 613 | 613 | 613 | 613 | 613 |
| Non-capitalized contributions | 6,745 | 6,745 | 6,745 | 6,745 | 6,745 |
| Capital adjustments | 194,843 | 194,843 | 194,843 | 194,843 | 194,843 |
| Reserves | 314,591 | 263,635 | 263,635 | 263,635 | 263,635 |
| Retained earnings | - | 88,639 | 16 | 16 | 16 |
| Other accumulated comprehensive income | (6,871) | (12,097) | (11,299) | (3,160) | (15,409) |
| Income for the period | 48,661 | 18,603 | 88,623 | 62,499 | 45,110 |
| Equity attributable to owners of the Parent | 558,582 | 560,981 | 543,176 | 525,191 | 495,553 |
| Equity attributable to non-controlling interests | 8,434 | 8,130 | 8,141 | 8,500 | 8,810 |
| Total Equity | 567,016 | 569,111 | 551,317 | 533,691 | 504,363 |
| Total Liabilities and Equity | 3,133,299 | 2,921,012 | 2,951,593 | 2,830,253 | 3,029,577 |
| 33 |
| |
Balance Sheet – Foreign Currency Exposure
| FOREIGN CURRENCY EXPOSURE | BBVA ARGENTINA CONSOLIDATED | ||||
| In millions of AR$ - Inflation adjusted | ∆ % | ||||
| 2Q23 | 1Q23 | 2Q22 | QoQ | YoY | |
| Assets | |||||
| Cash and deposits in banks | 376,828 | 372,333 | 342,674 | 1.2% | 10.0% |
| Debt securities at fair value through profit or loss | 5 | 194 | 2,645 | (97.4%) | (99.8%) |
| Other financial assets | 11,850 | 12,114 | 12,758 | (2.2%) | (7.1%) |
| Loans and other financing | 59,625 | 52,388 | 81,933 | 13.8% | (27.2%) |
| Other financial institutions | 5 | 1 | - | 400.0% | N/A |
| Non-financial private sector and residents abroad | 59,618 | 52,386 | 81,929 | 13.8% | (27.2%) |
| Other debt securities | 36,067 | 7,323 | 7,293 | 392.5% | 394.5% |
| Financial assets pledged as collateral | 6,574 | 6,336 | 14,972 | 3.8% | (56.1%) |
| Investments in equity instruments | 123 | 94 | 75 | 30.9% | 64.0% |
| Total foreign currency assets | 491,072 | 450,782 | 462,350 | 8.9% | 6.2% |
| Liabilities | |||||
| Deposits | 376,405 | 413,328 | 420,261 | (8.9%) | (10.4%) |
| Non-Financial Public Sector | 7,082 | 9,733 | 14,015 | (27.2%) | (49.5%) |
| Financial Sector | 205 | 151 | 114 | 35.8% | 79.8% |
| Non-financial private sector and residents abroad | 369,118 | 403,444 | 406,132 | (8.5%) | (9.1%) |
| Other financial liabilities | 75,677 | 30,043 | 33,104 | 151.9% | 128.6% |
| Financing received from the B.C.R.A. and other financial institutions | 2,757 | 1,664 | 1,106 | 65.7% | 149.3% |
| Other non financial liabilities | 13,859 | 20,237 | 13,034 | (31.5%) | 6.3% |
| Total foreign currency liabilities | 468,698 | 465,272 | 467,505 | 0.7% | 0.3% |
| 0 | 0 | 0 | |||
| Foreign Currency Net Position - AR$ | 22,374 | (14,490) | (5,155) | 254.4% | n.m |
| Foreign Currency Net Position - USD | 87 | (69) | (41) | 225.7% | 311.7% |
| *Wholesale U.S. dollar foreign exchange rates on BCRA’s Communication “A” 3500, as of the end of period. | |||||
| 34 |
| |
Income Statement
| INCOME STATEMENT | BBVA ARGENTINA CONSOLIDATED | ||||
| In millions of AR$ - Inflation adjusted | ∆ % | ||||
| 2Q23 | 1Q23 | 2Q22 | QoQ | YoY | |
| Interest income | 371,223 | 308,460 | 214,764 | 20.3% | 72.9% |
| Interest expense | (185,718) | (146,073) | (97,682) | (27.1%) | (90.1%) |
| Net interest income | 185,505 | 162,387 | 117,082 | 14.2% | 58.4% |
| Fee income | 33,357 | 27,204 | 31,029 | 22.6% | 7.5% |
| Fee expenses | (9,618) | (13,184) | (8,810) | 27.0% | (9.2%) |
| Net fee income | 23,739 | 14,020 | 22,219 | 69.3% | 6.8% |
| Net income from financial instruments at fair value through P&L | 7,414 | 8,637 | 2,895 | (14.2%) | 156.1% |
| Net loss from write-down of assets at amortized cost and fair value through OCI | 2,290 | 48 | 1,223 | n.m | 87.2% |
| Foreign exchange and gold gains | 3,231 | 1,306 | 3,356 | 147.4% | (3.7%) |
| Other operating income | 7,014 | 6,798 | 7,150 | 3.2% | (1.9%) |
| Loan loss allowances | (11,097) | (10,123) | (5,293) | (9.6%) | (109.7%) |
| Net operating income | 218,096 | 183,073 | 148,632 | 19.1% | 46.7% |
| Personnel benefits | (29,008) | (27,297) | (27,394) | (6.3%) | (5.9%) |
| Administrative expenses | (31,156) | (29,682) | (26,430) | (5.0%) | (17.9%) |
| Depreciation and amortization | (3,493) | (3,491) | (3,712) | (0.1%) | 5.9% |
| Other operating expenses | (29,094) | (25,117) | (22,105) | (15.8%) | (31.6%) |
| Operating expenses | (92,751) | (85,587) | (79,641) | (8.4%) | (16.5%) |
| Operating income | 125,345 | 97,486 | 68,991 | 28.6% | 81.7% |
| Income from associates and joint ventures | 593 | (74) | 470 | n.m | 26.2% |
| Income from net monetary position | (77,491) | (70,303) | (51,283) | (10.2%) | (51.1%) |
| Income before income tax | 48,447 | 27,109 | 18,178 | 78.7% | 166.5% |
| Income tax | (18,085) | (8,518) | 16,072 | (112.3%) | (212.5%) |
| Income for the period | 30,362 | 18,591 | 34,250 | 63.3% | (11.4%) |
| Owners of the parent | 30,058 | 18,603 | 34,523 | 61.6% | (12.9%) |
| Non-controlling interests | 304 | (12) | (273) | n.m | 211.4% |
| Other comprehensive Income (1) | 5,226 | (797) | (20,803) | n.m | 125.1% |
| Total comprehensive income | 35,588 | 17,794 | 13,447 | 100.0% | 164.7% |
| (1) Net of Income Tax. | |||||
| 35 |
| |
Income Statement – 5 quarters
| INCOME STATEMENT | BBVA ARGENTINA CONSOLIDATED | ||||
| In millions of AR$ - Inflation adjusted | |||||
| 2Q23 | 1Q23 | 4Q22 | 3Q22 | 2Q22 | |
| Interest income | 371,223 | 308,460 | 303,950 | 255,060 | 214,764 |
| Interest expense | (185,718) | (146,073) | (144,119) | (119,702) | (97,682) |
| Net interest income | 185,505 | 162,387 | 159,831 | 135,358 | 117,082 |
| Fee income | 33,357 | 27,204 | 29,799 | 29,188 | 31,029 |
| Fee expenses | (9,618) | (13,184) | (14,480) | (13,069) | (8,810) |
| Net fee income | 23,739 | 14,020 | 15,319 | 16,119 | 22,219 |
| Net income from financial instruments at fair value through P&L | 7,414 | 8,637 | 7,531 | 6,631 | 2,895 |
| Net loss from write-down of assets at amortized cost and fair value through OCI | 2,290 | 48 | (879) | 180 | 1,223 |
| Foreign exchange and gold gains | 3,231 | 1,306 | 553 | 3,933 | 3,356 |
| Other operating income | 7,014 | 6,798 | 8,250 | 7,953 | 7,150 |
| Loan loss allowances | (11,097) | (10,123) | (11,072) | (7,250) | (5,293) |
| Net operating income | 218,096 | 183,073 | 179,533 | 162,924 | 148,632 |
| Personnel benefits | (29,008) | (27,297) | (27,617) | (24,496) | (27,394) |
| Administrative expenses | (31,156) | (29,682) | (26,226) | (25,960) | (26,430) |
| Depreciation and amortization | (3,493) | (3,491) | (5,049) | (3,641) | (3,712) |
| Other operating expenses | (29,094) | (25,117) | (27,692) | (23,242) | (22,105) |
| Operating expenses | (92,751) | (85,587) | (86,584) | (77,339) | (79,641) |
| Operating income | 125,345 | 97,486 | 92,949 | 85,585 | 68,991 |
| Income from associates and joint ventures | 593 | (74) | 180 | (677) | 470 |
| Income from net monetary position | (77,491) | (70,303) | (55,058) | (62,534) | (51,283) |
| Income before income tax | 48,447 | 27,109 | 38,071 | 22,374 | 18,178 |
| Income tax | (18,085) | (8,518) | (12,308) | (5,293) | 16,072 |
| Income for the period | 30,362 | 18,591 | 25,763 | 17,081 | 34,250 |
| Owners of the parent | 30,058 | 18,603 | 26,124 | 17,389 | 34,523 |
| Non-controlling interests | 304 | (12) | (361) | (308) | (273) |
| Other comprehensive Income (OCI)(1) | 5,226 | (797) | (8,139) | 12,249 | (20,803) |
| Total comprehensive income | 35,588 | 17,794 | 17,624 | 29,330 | 13,447 |
| (1) Net of Income Tax. | |||||
| 36 |
| |
Ratios
| QUARTERLY ANNUALIZED RATIOS | BBVA ARGENTINA CONSOLIDATED | ||||
| In % | ∆ bps | ||||
| 2Q23 | 1Q23 | 2Q22 | QoQ | YoY | |
| Profitability | |||||
| Efficiency Ratio | 52.0% | 62.4% | 70.4% | (1,039)bps | (1,843)bps |
| ROA | 3.9% | 2.6% | 4.6% | 137 bps | (69)bps |
| ROE | 21.3% | 13.7% | 28.3% | 760 bps | (703)bps |
| Liquidity | |||||
| Liquid assets / Total Deposits | 84.1% | 78.7% | 76.7% | 543 bps | 745 bps |
| Capital | |||||
| Regulatory Capital Ratio | 28.38% | 27.89% | 22.88% | 48 bps | 549 bps |
| TIER I Capital Ratio (Ordinary Capital Level 1/ RWA) | 27.99% | 27.48% | 22.73% | 51 bps | 526 bps |
| Asset Quality | |||||
| Total non-performing portfolio / Total portfolio | 1.38% | 1.31% | 1.08% | 7 bps | 30 bps |
| Allowances /Total non-performing portfolio | 218.44% | 220.29% | 219.40% | (185)bps | (96)bps |
| Cost of Risk | 4.09% | 3.73% | 1.94% | 36 bps | 215 bps |
| ACCUMULATED ANNUALIZED RATIOS | BBVA ARGENTINA CONSOLIDATED | ||||
| In % | ∆ bps | ||||
| 2Q23 | 1Q23 | 2Q22 | QoQ | YoY | |
| Profitability | |||||
| Efficiency Ratio | 56.6% | 62.4% | 71.3% | (579)bps | (1,467)bps |
| ROA | 3.2% | 2.6% | 3.0% | 64 bps | 20 bps |
| ROE | 17.7% | 13.7% | 18.9% | 402 bps | (117)bps |
| Liquidity | |||||
| Liquid assets / Total Deposits | 84.1% | 78.7% | 76.7% | 543 bps | 745 bps |
| Capital | |||||
| Regulatory Capital Ratio | 28.4% | 27.9% | 22.9% | 48 bps | 549 bps |
| TIER I Capital Ratio (Ordinary Capital Level 1/ RWA) | 28.0% | 27.5% | 22.7% | 51 bps | 526 bps |
| Asset Quality | |||||
| Total non-performing portfolio / Total portfolio | 1.38% | 1.31% | 1.08% | 7 bps | 30 bps |
| Allowances /Total non-performing portfolio | 218.44% | 220.29% | 219.40% | (185)bps | (96)bps |
| Cost of Risk | 3.93% | 3.73% | 2.03% | 20 bps | 190 bps |
| 37 |
| |
About BBVA Argentina
BBVA Argentina (NYSE; BYMA; MAE: BBAR; LATIBEX: XBBAR) is a subsidiary of the BBVA Group, the main shareholder since 1996. In Argentina, it is one of the leading private financial institutions since 1886. Nationwide, BBVA Argentina offers retail and corporate banking to a broad customer base, including: individuals, SME’s, and large-sized companies.
BBVA Argentina’s purpose is to bring the age of opportunities to everyone, based on our customers’ real needs, providing the best solutions, and helping them make the best financial decisions through an easy and convenient experience. The institution relies on solid values: “The customer comes first, We think big and We are one team”. At the same time, its responsible banking model aspires to achieve a more inclusive and sustainable society.
Investor Relations Contact
Carmen Morillo Arroyo
Chief Financial Officer
Inés Lanusse
Investor Relations Officer
Belén Fourcade
Investor Relations
investorelations-arg@bbva.com
ir.bbva.com.ar
| 38 |
SIGNATURES
Pursuant to the requirements of the Securities Exchange Act of 1934, the registrant has duly caused this report to be signed on its behalf by the undersigned, thereunto duly authorized.
| Banco BBVA Argentina S.A. | |||||
| Date: | August 23, 2023 | By: | /s/ Carmen Morillo Arroyo | ||
| Name: | Carmen Morillo Arroyo | ||||
| Title: | Chief Financial Officer | ||||