FORM 6-K
SECURITIES AND EXCHANGE COMMISSION
Washington, D.C. 20549
Report of Foreign Issuer
Pursuant to Rule 13a-16 or 15d-16
of the Securities Exchange Act of 1934
For the month of March 2024
Commission File Number: 001-12568
BBVA Argentina Bank S.A.
(Translation of registrant’s name into English)
111 Córdoba Av, C1054AAA
Buenos Aires, Argentina
(Address of principal executive offices)
Indicate by check mark whether the registrant files or will file annual reports under cover of Form 20-F or Form 40-F:
| Form 20-F | X | Form 40-F |
Indicate by check mark if the registrant is submitting the Form 6-K in paper as permitted by Regulation S-T Rule 101(b)(1):
| Yes | No | X |
Indicate by check mark if the registrant is submitting the Form 6-K in paper as permitted by Regulation S-T Rule 101(b)(7):
| Yes | No | X |
Indicate by check mark whether by furnishing the information contained in this Form, the Registrant is also thereby furnishing the information to the Commission pursuant to Rule 12g3-2(b) under the Securities Exchange Act of 1934:
| Yes | No | X |
If “Yes” is marked, indicate below the file number assigned to the registrant in connection with Rule 12g3-2(b): N/A
Banco BBVA Argentina S.A.
TABLE OF CONTENTS
Item | |
| 1. | Banco BBVA Argentina S.A. reports consolidated fourth quarter earnings for fiscal year 2023. |


 |
Banco BBVA Argentina S.A. announces Fourth Quarter and Fiscal Year 2023 results
Buenos Aires, March 5, 2024 – Banco BBVA Argentina S.A (NYSE; BYMA; MAE: BBAR; LATIBEX: XBBAR) (“BBVA Argentina” or “BBVA” or “the Bank”) announced today its consolidated results for the fourth quarter (4Q23), ended on December 31, 2023.
As of January 1, 2020, the Bank started to inform its inflation adjusted results pursuant to IAS 29 reporting. To facilitate comparison, figures of comparable quarters of 2022 and 2023 have been updated according to IAS 29 reporting to reflect the accumulated effect of inflation adjustment for each period up to December 31, 2023.
4Q23 & 2023 Highlights
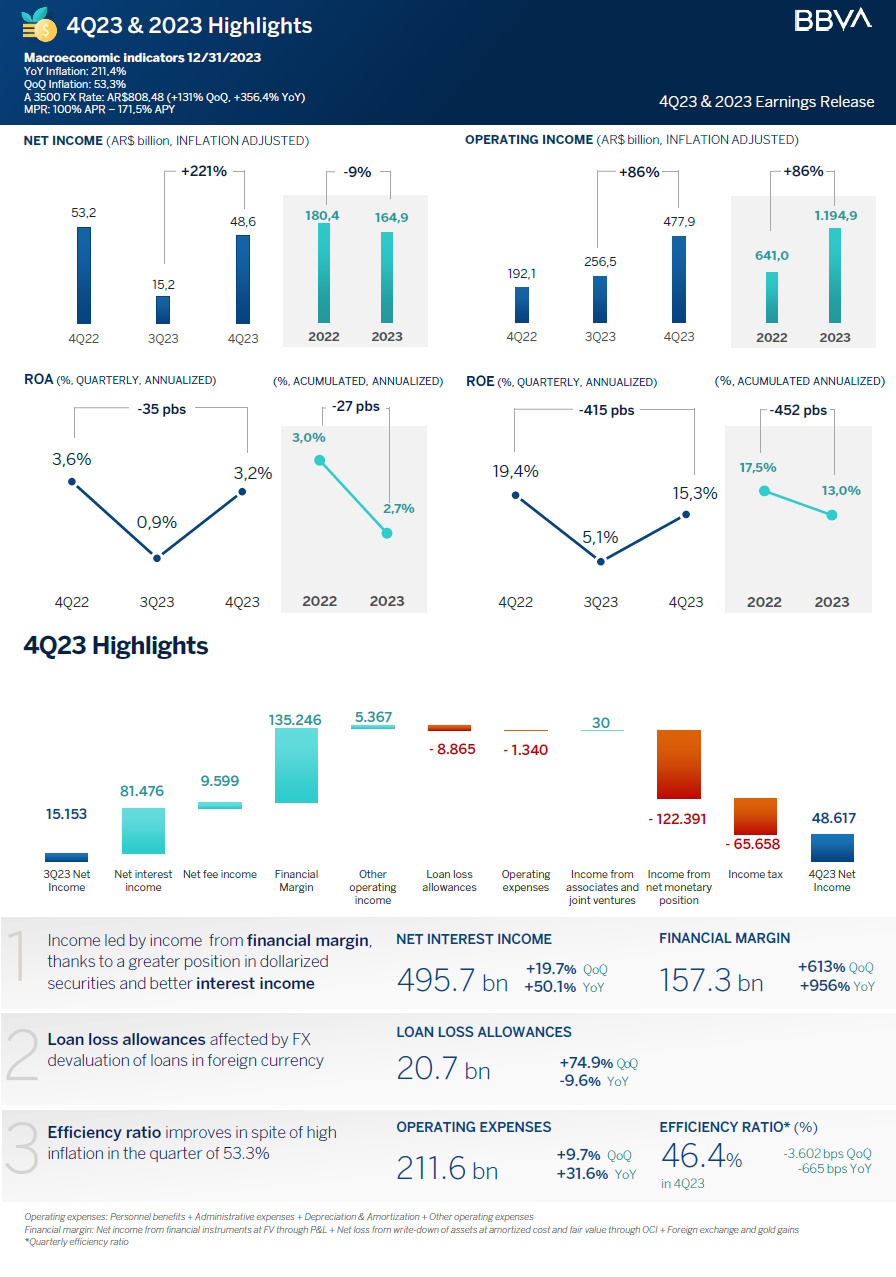
| · | BBVA Argentina’s inflation adjusted net income in 4Q23 was $48.6 billion, 220.8% higher than the $15.2 billion reported on the third quarter of 2023 (3Q23), and 8.7% lower than the $53.2 billion reported on the fourth quarter of 2022 (4Q22). BBVA Argentina’s inflation adjusted net income for the twelve months of 2023 totaled $164.9 billion, 8.6% lower than the $180.4 billion reported in the twelve months of 2022. |
| · | In 4Q23, BBVA Argentina posted an inflation adjusted average return on assets (ROAA) of 3.2% and an inflation adjusted average return on equity (ROAE) of 15.3%. In 2023, BBVA Argentina posted an inflation adjusted ROAA of 2.7% and an inflation adjusted ROAE of 13.0%. |
| · | Operating income in 4Q23 was $477.9 billion, 86.4% higher than the $256.5 billion recorded in 3Q23 and 148.8% over the $192.1 billion recorded in 4Q22. In 2023, the accumulated operating income was $1.19 trillion, 86.4% above the $641.0 billion recorded in the same period of 2022. |
| · | In terms of activity, total consolidated financing to the private sector in 4Q23 totaled $2.0 trillion, falling 5.7% in real terms compared to 3Q23, and contracting 12.3% compared to 4Q22. In the quarter, the variation was mainly driven by a decline in credit cards by 7.6%, in consumer loans by 21.5% and in other loans by 15.4%. This was offset by an increase in prefinancing and financing of exports by 54.7%. BBVA’s consolidated market share of private sector loans reached 9.85% as of 4Q23. |
| · | Total consolidated deposits in 4Q23 totaled $3.6 trillion, decreasing 8.5% in real terms during the quarter, and 11.0% YoY. Quarterly decrease was mainly explained by a fall in time deposits and investment accounts, by 40.9% and 37.1% respectively. The Bank’s consolidated market share of private deposits reached 6.79% as of 4Q23. |
| · | As of 4Q23, the non-performing loan ratio (NPL) reached 1.29%, with a 165.30% coverage ratio. |
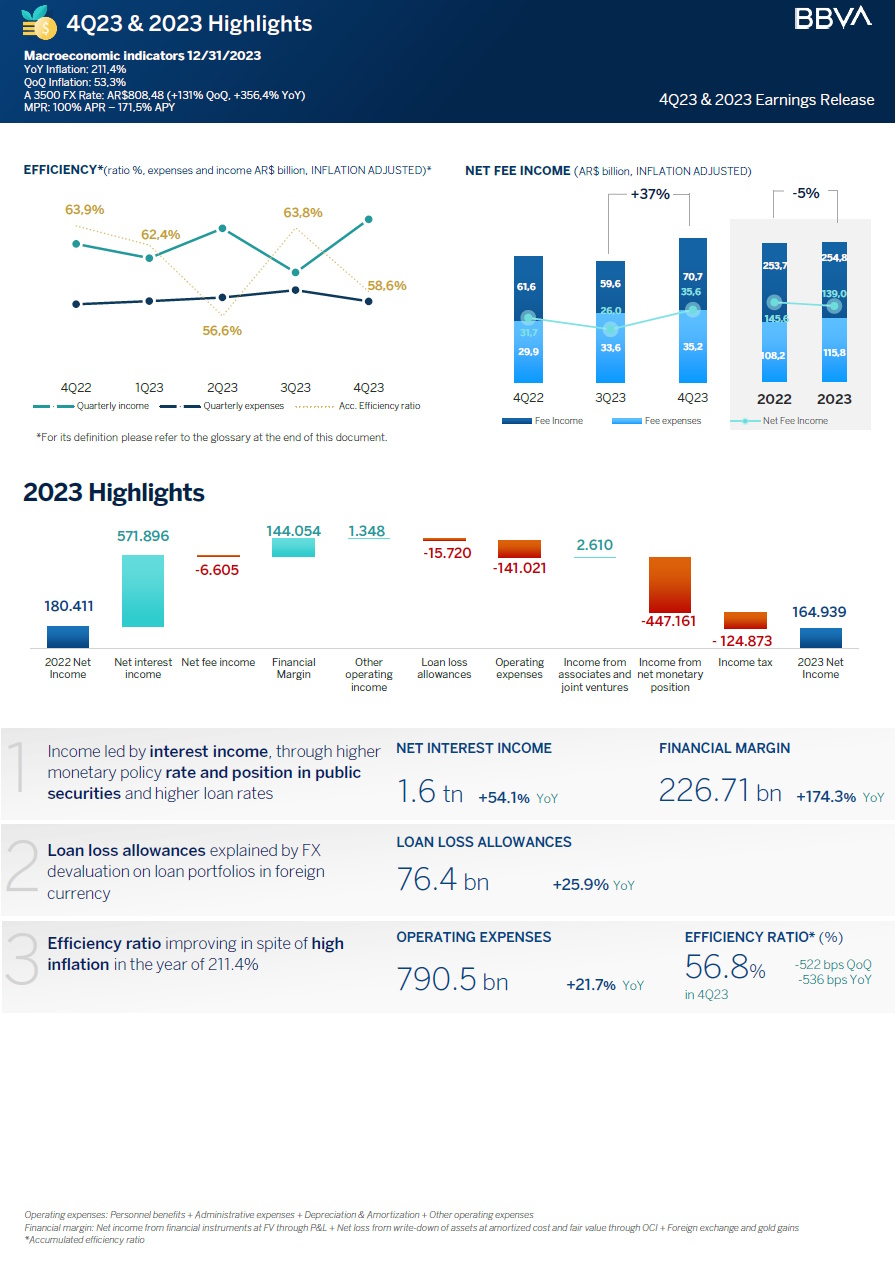
| · | The accumulated efficiency ratio in 4Q23 was 58.6%, improving compared to 3Q23’s 63.8%, and to 4Q22’s 63.9%. |
| · | As of 4Q23, BBVA Argentina reached a regulatory capital ratio of 32.8%, entailing a $944.4 billion or 280.5% excess over minimum regulatory requirement. Tier I ratio was 32.8%. |
| · | Total liquid assets represented 91.2% of the Bank’s total deposits as of 4Q23. |
| 1 |
| |
Message from the CFO
“2023 ends with a new elect governing party, which has announced an adjustment plan to start correcting the strong macroeconomic distortions, which, among other measures, includes a significant reduction of fiscal deficit and a depreciation of the local currency to ease FX restrictions. In a context where uncertainty remains high, BBVA Research estimates an annual inflation near 175% by the end of 2024 (versus 211% at the end of 2023) and expects GDP to fall 4.0% this year (versus an estimated 1.6%1 fall in 2023). It is expected that the most intense recession and inflationary acceleration should happen in the first semester, while expectations improve for the second part of the year. In spite of its impact in the short term, and high associated risks, these adjustments could state the basis for a sustained reduction in inflation and a recovery in a potential growth for the economy from the second half of 2024 onwards.
As of December 2023, private credit in pesos for the system grew 133% YoY, while BBVA Argentina increased its private loan portfolio in pesos by 156%2. Neither the System, nor Bank’s YoY loan growth exceeded that of inflation (which reached 211.4% YoY as of December 2023). Nonetheless, consolidated market share increased 75 bps from 9.10% to 9.85% YoY. Regarding consolidated private deposits, the system grew 171% while the Bank grew 177%, without beating inflation in the year in both cases. Consolidated market share of deposits for BBVA Argentina was 6.79%, higher than the 6.64% recorded the prior year.
Referring to BBVA Argentina performance in 2023, a better operating income was the product of an improvement in interest income, due to an increase in the position and yield of Central Bank instruments and inflation linked bonds an improvement on income from loans and the results generated by dollarized assets towards year end. At the same time, the accumulated efficiency ratio decreased from 63.9% to 58.6% in 2023, mainly thanks to an improvement in income from interests in contrast with expenses, even in the inflationary context previously mentioned.
As of December 2023, BBVA Argentina reached an NPL ratio of 1.29%, way below the last available system NPL (December 2023) of 3.55%. Concerning liquidity and solvency indicators, the Bank ends the quarter with 91.2% and 32.8% respectively, levels which undoubtedly allow to address business growth in the case of an economic recovery.
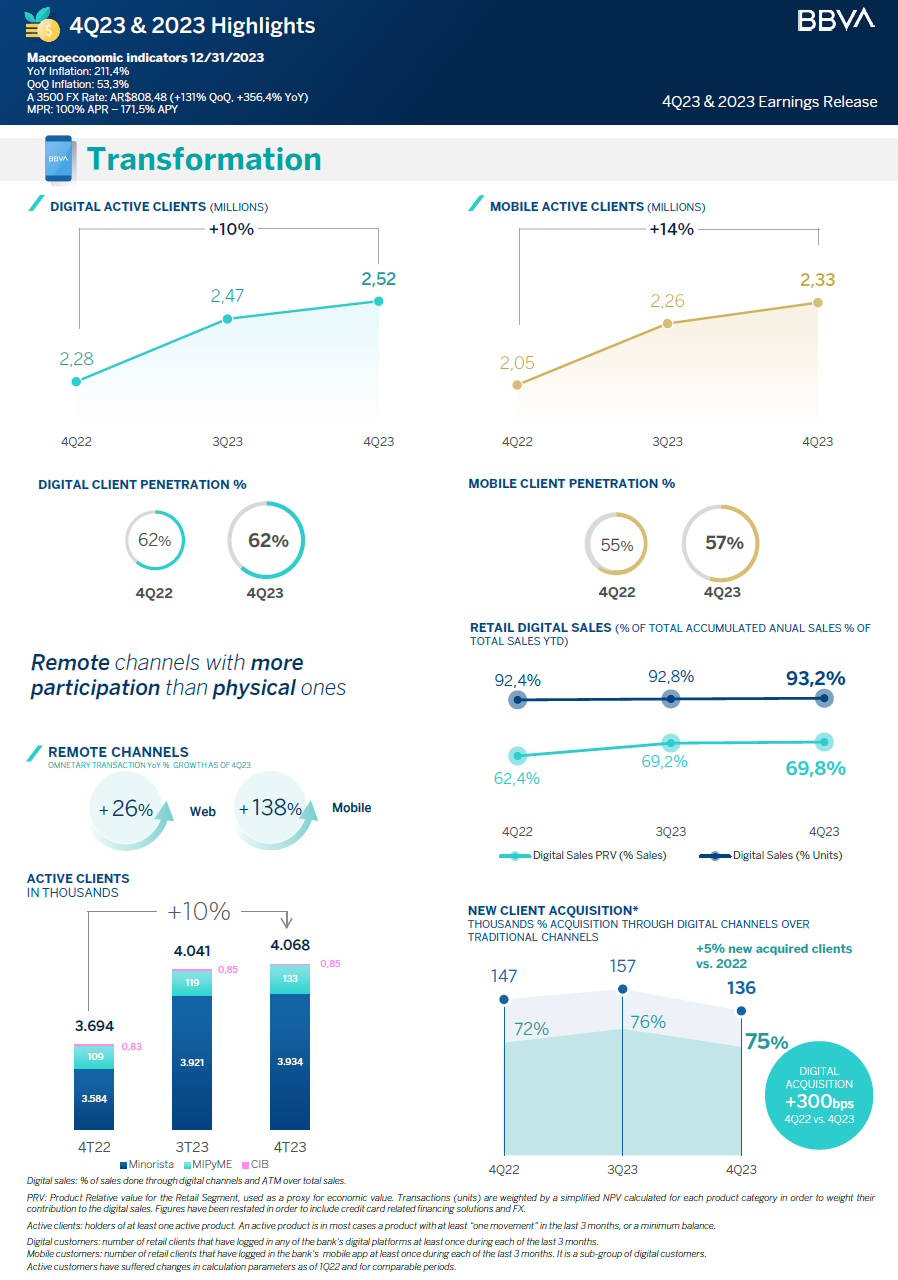
On digitalization, our service offering has evolved in such way that by the end of December 2023, mobile monetary transactions increased 138% compared to the same period a year back. In the year, new client acquisition through digital channels over traditional ones was 75%, while in 2022 it was 72%.
Concerning the benefits BBVA Argentina offers its clients, on January 31, 2024, the Bank has inaugurated its new VIP area in the Ezeiza airport in Buenos Aires. The new space is open to all clients owning a Premium World or Visa Signature and Mastercard Black credit cards issued by BBVA in the country. This initiative is in line to the Puntos BBVA loyalty program, pretending to be the “bank for travelling”. It is noticeable that in December 2023, Argentina added 370.000 new clients, reaching 4.1 million total active customers, which represents a 10% increase compared to December 2022.
Regarding ESG, BBVA Argentina has a corporate responsibility with society, inherent to the Bank’s business model, which bolsters inclusion, financial education and supports scientific research and culture. The Bank works with the highest integrity, long-term vision and best practices, and is present through the BBVA Group in the main sustainability indexes.
Lastly, the Bank actively monitors its business, financial conditions and operating results, in the aim of keeping a competitive position to face contextual challenges in a decisive year for the Argentine Republic.”
Carmen Morillo Arroyo, CFO at BBVA Argentina
4Q23 Conference Call
Wednesday, March 6 - 12:00 p.m. Buenos Aires time (10:00 a.m. EST)
To participate please dial-in:
+ 54-11-3984-5677 (Argentina)
+ 1-844-450-3851 (United States)
+ 1-412-317-6373 (International)
Web Phone: click here
Código de la conferencia: BBVA
Webcast & Replay: click here
1 Source: Estimador Mensual de Actividad Económica (EMAE) December 2023
2 Source: BCRA capital balances as of the last day of each period. Siscen information as of December 31, 2023.
| 2 |
| |
Safe Harbor Statement
This press release contains certain forward-looking statements that reflect the current views and/or expectations of Banco BBVA Argentina and its management with respect to its performance, business and future events. We use words such as “believe,” “anticipate,” “plan,” “expect,” “intend,” “target,” “estimate,” “project,” “predict,” “forecast,” “guideline,” “seek,” “future,” “should” and other similar expressions to identify forward-looking statements, but they are not the only way we identify such statements. Such statements are subject to a number of risks, uncertainties and assumptions. We caution you that a number of important factors could cause actual results to differ materially from the plans, objectives, expectations, estimates and intentions expressed in this release. Actual results, performance or events may differ materially from those in such statements due to, without limitation, (i) changes in general economic, financial, business, political, legal, social or other conditions in Argentina or elsewhere in Latin America or changes in either developed or emerging markets, (ii) changes in regional, national and international business and economic conditions, including inflation, (iii) changes in interest rates and the cost of deposits, which may, among other things, affect margins, (iv) unanticipated increases in financing or other costs or the inability to obtain additional debt or equity financing on attractive terms, which may limit our ability to fund existing operations and to finance new activities, (v) changes in government regulation, including tax and banking regulations, (vi) changes in the policies of Argentine authorities, (vii) adverse legal or regulatory disputes or proceedings, (viii) competition in banking and financial services, (ix) changes in the financial condition, creditworthiness or solvency of the customers, debtors or counterparties of Banco BBVA Argentina, (x) increase in the allowances for loan losses, (xi) technological changes or an inability to implement new technologies, (xii) changes in consumer spending and saving habits, (xiii) the ability to implement our business strategy and (xiv) fluctuations in the exchange rate of the Peso. The matters discussed herein may also be affected by risks and uncertainties described from time to time in Banco BBVA Argentina’s filings with the U.S. Securities and Exchange Commission (SEC) and Comisión Nacional de Valores (CNV). Readers are cautioned not to place undue reliance on forward-looking statements, which speak only as the date of this document. Banco BBVA Argentina is under no obligation and expressly disclaims any intention or obligation to update or revise any forward-looking statements, whether as a result of new information, future events or otherwise.
Information
This earnings release has been prepared in accordance with the accounting framework established by the Central Bank of Argentina (“BCRA”), based on International Financial Reporting Standards (“I.F.R.S.”) and the resolutions adopted by the International Accounting Standards Board (“I.A.S.B”) and by the Federación Argentina de Consejos Profesionales de Ciencias Económicas (“F.A.C.P.E.”), with the following exceptions:
a) The exclusion of the application of the IFRS 9 impairment model for non-financial public sector debt instruments.
b) In March 2022, the shares corresponding to the remaining participation in Prisma Medios de Pago S.A. (“Prisma”) were transferred, which were measured at fair value pursuant to April 29, 2019, and March 22, 2021 Memorandums received from the BCRA, and the income (loss) from their sale was recorded in the quarter ended March 31, 2022. Had IFRS rules been applied to determine the fair value mentioned, results for the quarter ended on December 31, 2022 would have been modified. Nonetheless, this does not generate differences regarding the value of equity as of December 31, 2022.
The information in this press release contains unaudited financial information that consolidates, line item by line item, all of the banking activities of BBVA Argentina, including: BBVA Asset Management Argentina S.A., Consolidar AFJP-undergoing liquidation proceeding, PSA Finance Argentina Compañía Financiera S.A. (“PSA”) and Volkswagen Financial Services Compañía Financiera S.A (“VWFS”).
BBVA Seguros Argentina S.A. is disclosed on a consolidated basis recorded as Investments in associates (reported under the proportional consolidation method), and the corresponding results are reported as “Income from associates”), same as Rombo Compañía Financiera S.A. (“Rombo”), Play Digital S.A. (“MODO”), Openpay Argentina S.A. and Interbanking S.A.
Financial statements of subsidiaries have been elaborated as of the same dates and periods as Banco BBVA Argentina S.A.’s. In the case of consolidated companies PSA and VWFS, financial statements were prepared considering the B.C.R.A. accounting framework for institutions belonging to “Group C”, considering the model established by the IFRS 9 5.5. “Impairment” section for periods starting as of January 1, 2022, excluding debt instruments from the non-financial public sector.
The information published by the BBVA Group for Argentina is prepared according to IFRS, without considering the temporary exceptions established by BCRA.
| 3 |
| |
Quarterly Results
| INCOME STATEMENT | BBVA ARGENTINA CONSOLIDATED | ||||
| In millions of AR$ - Inflation adjusted | ∆ % | ||||
| 4Q23 | 3Q23 | 4Q22 | QoQ | YoY | |
| Net Interest Income | 495,717 | 414,241 | 330,315 | 19.7% | 50.1% |
| Net Fee Income | 35,597 | 25,998 | 31,659 | 36.9% | 12.4% |
| Net income from measurement of financial instruments at fair value through P&L | (69,688) | 12,527 | 15,564 | n.m | n.m |
| Net income from write-down of assets at amortized cost and at fair value through OCI | 29,523 | 6,236 | (1,817) | 373.4% | n.m |
| Foreign exchange and gold gains | 197,454 | 3,280 | 1,147 | n.m | n.m |
| Other operating income | 21,698 | 16,331 | 17,051 | 32.9% | 27.3% |
| Loan loss allowances | (20,696) | (11,831) | (22,882) | (74.9%) | 9.6% |
| Net operating income | 689,605 | 466,782 | 371,037 | 47.7% | 85.9% |
| Personnel benefits | (66,717) | (65,020) | (57,075) | (2.6%) | (16.9%) |
| Adminsitrative expenses | (51,159) | (72,574) | (54,200) | 29.5% | 5.6% |
| Depreciation and amortization | (7,545) | (6,700) | (10,432) | (12.6%) | 27.7% |
| Other operating expenses | (86,241) | (66,028) | (57,230) | (30.6%) | (50.7%) |
| Operarting expenses | (211,662) | (210,322) | (178,937) | (0.6%) | (18.3%) |
| Operating income | 477,943 | 256,460 | 192,100 | 86.4% | 148.8% |
| Income from associates | 57 | 27 | 371 | 111.1% | (84.6%) |
| Income from net monetary position | (355,500) | (233,109) | (113,786) | (52.5%) | (212.4%) |
| Net income before income tax | 122,500 | 23,378 | 78,685 | 424.0% | 55.7% |
| Income tax | (73,883) | (8,225) | (25,436) | n.m | (190.5%) |
| Net income for the period | 48,617 | 15,153 | 53,249 | 220.8% | (8.7%) |
| Owners of the parent | 49,214 | 14,763 | 53,989 | 233.4% | (8.8%) |
| Non-controlling interests | (597) | 390 | (740) | (253.1%) | 19.3% |
| Other comprehensive Income (OCI) (1) | 203,403 | (14,934) | (16,821) | n.m | n.m |
| Total comprehensive income | 252,020 | 219 | 36,428 | n.m | n.m |
| (1) Net of Income Tax. | |||||
BBVA Argentina 4Q23 net income was $48.6 billion, increasing 220.8% or $33.5 billion quarter-over-quarter (QoQ) and falling 8.7% or $13.1 billion year-over-year (YoY). This implied a quarterly ROAE of 15.3% and a quarterly ROAA of 3.2%.
Quarterly operating results are mainly explained by (i) better foreign exchange and gold gains, specially due to a greater position in Dual National Treasury bonds, (ii) better net interest income results, (iii) better net income from write-down of assets at amortized cost and at Fair Value (FV) through Other Comprehensive Income (OCI) mainly due to the sale of inflation linked bonds (through the exercise of put options with the BCRA), and (iv) lower administrative expenses. These effects were negatively affected by (i) a lower net income from measurement of financial instruments at FV through P&L, explained by the valuation of the greater position in Dual bonds, and (ii) greater operating expenses.
In 3Q23, there is a positive effect in the income tax line, considering the final judgments dictated by the Supreme Court of Justice concerning fiscal years 2014 and 2013, rejecting the extraordinary appeal and the claim presented by the tax authorities, and affirming the prior favorable final judgments.
| 4 |
| |
Net Income for the period was highly impacted by income from net monetary position, as inflation on 3Q23 was lower than 4Q23’s (53.3% in 4Q23 compared to 34.8%3 in 3Q23).
Lastly, the OCI line totaled a gain of $203.4 billion, mainly due to results of financial instruments at fair value through OCI, particularly through the revaluation of inflation-linked (CER) National Treasury bond portfolio.
Income Statement – 12 month accumulated
| INCOME STATEMENT - 12 MONTH ACCUMULATED | BBVA ARGENTINA CONSOLIDATED | ||
| In millions of AR$ - Inflation adjusted | |||
| 2023 | 2022 | ∆ % | |
| Interest income | 3,183,947 | 1,959,831 | 62.5% |
| Interest expense | (1,555,015) | (902,795) | (72.2%) |
| Net interest income | 1,628,932 | 1,057,036 | 54.1% |
| Fee income | 254,797 | 253,732 | 0.4% |
| Fee expenses | (115,842) | (108,172) | (7.1%) |
| Net fee income | 138,955 | 145,560 | (4.5%) |
| Net income from financial instruments at fair value through P&L | (23,988) | 56,604 | (142.4%) |
| Net loss from write-down of assets at amortized cost and fair value through OCI | 40,591 | 903 | n.m |
| Foreign exchange and gold gains | 210,110 | 25,152 | n.m |
| Other operating income | 67,248 | 65,900 | 2.0% |
| Loan loss allowances | (76,383) | (60,663) | (25.9%) |
| Net operating income | 1,985,465 | 1,290,492 | 53.9% |
| Personnel benefits | (248,101) | (211,686) | (17.2%) |
| Administrative expenses | (249,465) | (212,198) | (17.6%) |
| Depreciation and amortization | (28,677) | (34,171) | 16.1% |
| Other operating expenses | (264,304) | (191,471) | (38.0%) |
| Operating expenses | (790,547) | (649,526) | (21.7%) |
| Operating income | 1,194,918 | 640,966 | 86.4% |
| Income from associates and joint ventures | 1,157 | (1,453) | 179.6% |
| Income from net monetary position | (894,048) | (446,887) | (100.1%) |
| Income before income tax | 302,027 | 192,626 | 56.8% |
| Income tax | (137,088) | (12,215) | n.m |
| Income for the period | 164,939 | 180,411 | (8.6%) |
| Owners of the parent | 164,542 | 183,153 | (10.2%) |
| Non-controlling interests | �� 397 | (2,742) | 114.5% |
| Other comprehensive Income (OCI) (1) | 197,622 | (27,578) | n.m |
| Total comprehensive income | 362,561 | 152,833 | 137.2% |
| (1) Net of Income Tax. | |||
During 2023, BBVA Argentina net income was $164.9 billion, 8.6% lower than the $180.4 billion reported in 2022. This implied an accumulated annualized ROAE of 13.0% and a ROAA of 2.7% in 2023, compared to an accumulated annualized ROAE of 17.5% and a ROAA of 3.0% in 2022.
The 86.4% increment in real terms of the Bank’s operating income is mainly explained by (i) an increase in interest income, mostly due to an increase in the position and yield of Central Bank instruments and CER bonds, as well as interests from loans. What also stands out is (ii) the increase in the foreign exchange and gold gains line due to a higher position in dollarized assets and (iii) net income from write-down of assets at FV through OCI, mainly due to the sale of corporate bonds in 3Q23 and the exercise of a put option on inflation linked bonds in 4Q23.
3 Source: Instituto Nacional de Estadística y Censos (INDEC).
| 5 |
| |
These effects were negatively offset by (i) lower income from financial instruments at FV through P&L due to the valuation of Dual bonds in 4Q23, (ii) other operating expenses, mainly affected by the increase in the turnover tax from a greater income from LELIQ, and (iii) greater administrative expenses, mainly due to expenses related to software and licenses hired through the controlling company abroad. Administrative expenses increased 17.6% YoY, explained by the increase in the provision of these expenses, in line with the expectations of devaluation of the FX rate, which decreased at year end and impacted positively in 4Q23.
In the year, net fee income decreased 4.5%, as a consequence of a 0.4% increase in fee income and a 7.1% in fee expenses. This is mainly explained by greater expenses in foreign currency and payroll marketing campaigns, together with a fall in fees related to bundle fees and the Puntos BBVA loyalty program. As of December 2023, BBVA Argentina gained more than 370.000 clients, reaching 4.1 million total active clients, which represents a 10% increase compared to December 2022.
Another factor to consider is the income tax line, which represented only a $12.2 million loss, explained by the implications of fiscal inflation adjustments in the determination of payable taxes and tax deferrals, recorded during the second quarter of 2022.
Additionally, net income is affected by income from net monetary position in a context of higher inflation (211.4% 2023 twelve month accumulated, versus 94.8% accumulated in the same period of 20224).
| EARNINGS PER SHARE | BBVA ARGENTINA CONSOLIDATED | ||||
| ∆ % | |||||
| 4Q23 | 3Q23 | 4Q22 | QoQ | YoY | |
| Financial Statement information | |||||
| Net income for the period attributable to owners of the parent (in AR$ millions, inflation adjusted) | 49,214 | 14,763 | 53,989 | 233.4% | (8.8%) |
| Total shares outstanding (1) | 612,710 | 612,710 | 612,710 | - | - |
| Market information | |||||
| Closing price of ordinary share at BYMA (in AR$) | 1,775.3 | 1,024.4 | 455.2 | 73.3% | 290.0% |
| Closing price of ADS at NYSE (in USD) | 5.4 | 4.2 | 3.9 | 31.1% | 39.5% |
| Book value per share (in AR$) | 1,424.14 | 1,172.05 | 1,139.38 | 21.5% | 25.0% |
| Price-to-book ratio (BYMA price) (%) | 1.25 | 0.87 | 0.40 | 42.6% | 212.0% |
| Earnings per share (in AR$) | 80.32 | 24.09 | 88.12 | 233.4% | (8.8%) |
| Earnings per ADS(2) (in AR$) | 240.97 | 72.28 | 264.35 | 233.4% | (8.8%) |
| (1) In thousands of shares. | |||||
| (2) Each ADS accounts for 3 ordinary shares | |||||
4 Source: Instituto Nacional de Estadística y Censos (INDEC).
| 6 |
| |
Net Interest Income
| NET INTEREST INCOME | BBVA ARGENTINA CONSOLIDATED | ||||
| In millions of AR$ - Inflation adjusted | ∆ % | ||||
| 4Q23 | 3Q23 | 4Q22 | QoQ | YoY | |
| Net Interest Income | 495,717 | 414,241 | 330,315 | 19.7% | 50.1% |
| Interest Income | 879,638 | 899,637 | 628,160 | (2.2%) | 40.0% |
| From government securities | 212,005 | 352,460 | 266,722 | (39.8%) | (20.5%) |
| From private securities | 931 | 1,047 | 514 | (11.1%) | 81.1% |
| Interest from loans and other financing | 335,586 | 308,643 | 221,628 | 8.7% | 51.4% |
| Financial Sector | 2,671 | 1,094 | 1,553 | 144.1% | 72.0% |
| Overdrafts | 42,619 | 47,328 | 31,679 | (9.9%) | 34.5% |
| Discounted Instruments | 121,291 | 94,895 | 43,977 | 27.8% | 175.8% |
| Mortgage loans | 1,088 | 1,336 | 2,144 | (18.6%) | (49.3%) |
| Pledge loans | 9,224 | 9,678 | 8,711 | (4.7%) | 5.9% |
| Consumer Loans | 33,886 | 32,454 | 27,889 | 4.4% | 21.5% |
| Credit Cards | 75,317 | 69,854 | 62,009 | 7.8% | 21.5% |
| Financial leases | 2,486 | 2,545 | 2,022 | (2.3%) | 22.9% |
| Loans for the prefinancing and financing of exports | 1,081 | 527 | 441 | 105.1% | 145.1% |
| Other loans | 45,923 | 48,932 | 41,203 | (6.1%) | 11.5% |
| Premiums on reverse REPO transactions | 160,569 | 117,429 | 33,942 | 36.7% | 373.1% |
| CER/UVA clause adjustment | 169,863 | 119,511 | 104,961 | 42.1% | 61.8% |
| Other interest income | 684 | 547 | 393 | 25.0% | 74.0% |
| Interest expenses | 383,921 | 485,396 | 297,845 | (20.9%) | 28.9% |
| Deposits | 365,856 | 469,301 | 269,513 | (22.0%) | 35.7% |
| Checking accounts | 90,186 | 125,370 | 30,101 | (28.1%) | 199.6% |
| Savings accounts | 2,482 | 1,621 | 1,540 | 53.1% | 61.2% |
| Time deposits | 222,012 | 280,881 | 172,423 | (21.0%) | 28.8% |
| Investment accounts | 51,176 | 61,429 | 65,449 | (16.7%) | (21.8%) |
| Other liabilities from financial transactions | 3,612 | 287 | 556 | n.m | n.m |
| Interfinancial loans received | 6,373 | 7,245 | 7,592 | (12.0%) | (16.1%) |
| Premiums on REPO transactions | 2 | 23 | 13 | (91.3%) | (84.6%) |
| CER/UVA clause adjustment | 8,077 | 8,535 | 20,161 | (5.4%) | (59.9%) |
| Other interest expense | 1 | 5 | 10 | (80.0%) | (90.0%) |
Net interest income for 4Q23 was $495.7 billion, increasing 19.7% or $81.5 billion QoQ, and 50.1% or $165.4 billion YoY. In 4Q23, interest income, in monetary terms, decreased more than interest expense, mainly due to lower income from government securities.
In 4Q23, interest income totaled $879.6 billion, falling 2.2% compared to 3Q23 and increasing 40.0% compared to 4Q22. Quarterly decrease is mainly driven by a fall in income from government securities, especially LELIQ, which issuance was terminated by the Central Bank in December, reducing its volume on year end. This was partially offset by (i) a better income from REPO premiums (which turned into the main liquidity instrument and the new monetary policy rate), and (ii) income from inflation linked bonds and loans.
Income from government securities decreased 39.8% compared to 3Q23, and 20.5% compared to 4Q22. This is partially due to the lower average position in LELIQ, as previously explained. 94% of these results are explained by government securities at fair value through OCI (of which 72% are BCRA securities) and 5% by securities at amortized cost (2027 National Treasury Bonds at fixed rate, National Treasury Bonds Private 0.70 Badlar Rate maturing on November 2027, and National Treasury Bonds CER 2025, used for reserve requirement integration).
| 7 |
| |
Interest income from loans and other financing totaled $335.6 billion, increasing 8.7% QoQ and 51.4% YoY. Quarterly growth is mainly due to an increase in rates (October 2023), especially through the discounted instruments line by 27.8%, due to a reduction in productive investment credit lines for SMEs together with the rate increase as mentioned before.
Income from CER/UVA adjustments increased 42.1% QoQ and 61.8% YoY. Quarterly increase is explained by the delay with which the inflation adjustment effects are recorded, and impact on the subsequent financial statements, with a quarterly inflation above the previous quarter. 80% of income from interests from CER/UVA clause adjustments is explained by interests generated by bonds linked to such indexes.
Interest expenses totaled $383.9 billion, denoting a 20.9% decrease QoQ and a 28.9% increase YoY. Quarterly decline is described by lower time deposit and checking accounts expenses (in particular interest-bearing checking accounts).
Interests from time deposits (including investment accounts) explain 71.2% of interest expenses, versus 70.5% the previous quarter. These decreased 21.0% QoQ and increased 28.8% YoY.
NIM
As of 4Q23, net interest margin (NIM) was 50.0%, above the 36.0% reported in 3Q23. In 4Q23, NIM in pesos was 55.1% and 1.5% in U.S. dollars. In 2023, NIM was 37.3% compared to 24.5% in 2022.
| ASSETS & LIABILITIES PERFORMANCE - TOTAL | BBVA ARGENTINA CONSOLIDATED | ||||||||
| In millions of AR$. Rates and spreads in annualized % | |||||||||
| 4Q23 | 3Q23 | 4Q22 | |||||||
| Average Balance | Interest Earned/Paid | Average Real Rate | Average Balance | Interest Earned/Paid | Average Real Rate | Average Balance | Interest Earned/Paid | Average Real Rate | |
| Total interest-earning assets | 3,932,650 | 879,638 | 88.7% | 4,570,330 | 899,637 | 78.1% | 4,325,825 | 628,375 | 57.6% |
| Debt securities | 1,857,544 | 508,737 | 108.7% | 2,368,790 | 564,370 | 94.5% | 2,132,501 | 380,669 | 70.8% |
| Loans to customers/financial institutions | 1,941,715 | 370,895 | 75.8% | 2,106,397 | 335,259 | 63.1% | 2,093,643 | 247,700 | 46.9% |
| Loans to the BCRA | 206 | 4 | 7.7% | 162 | 5 | 11.2% | 3 | 3 | 396.7% |
| Other assets | 133,185 | 2 | 0.0% | 94,981 | 3 | 0.0% | 99,678 | 3 | 0.0% |
| Total non interest-earning assets | 1,337,837 | - | 0.0% | 1,370,630 | - | 0.0% | 1,392,310 | (215) | -0.1% |
| Total Assets | 5,270,487 | 879,638 | 66.2% | 5,940,960 | 899,637 | 60.1% | 5,718,135 | 628,160 | 43.6% |
| Total interest-bearing liabilities | 2,388,880 | 383,921 | 63.8% | 3,104,553 | 485,396 | 62.0% | 2,903,951 | 297,845 | 40.7% |
| Savings accounts | 939,561 | 2,482 | 1.0% | 1,000,061 | 1,620 | 0.6% | 1,047,323 | 1,541 | 0.6% |
| Time deposits and investment accounts | 1,011,813 | 281,266 | 110.3% | 1,483,857 | 350,842 | 93.8% | 1,558,355 | 258,031 | 65.7% |
| Debt securities issued | 10,559 | 3,400 | 127.8% | - | 6 | - | 389 | 283 | 288.8% |
| Other liabilities | 426,947 | 96,773 | 89.9% | 620,636 | 132,927 | 85.0% | 297,883 | 37,989 | 50.6% |
| Total non-interest-bearing liabilities | 2,881,607 | - | 0.0% | 2,836,407 | - | 0.0% | 2,814,184 | - | 0.0% |
| Total liabilities and equity | 5,270,487 | 383,921 | 28.9% | 5,940,960 | 485,396 | 32.4% | 5,718,135 | 297,845 | 20.7% |
| NIM - Total | 50.0% | 36.0% | 30.3% | ||||||
| Spread - Total | 25.0% | 16.1% | 16.9% | ||||||
| Nominal rates are calculated over a 365-day year | |||||||||
| Does not include Net income from measurement of financial instruments at fair value through P&L nor Net income from write-down of assets at amortized cost and at fair value through OCI | |||||||||
| Interest-bearing checking accounts included in other interest-bearing liabilities. Non interest-bearing accounts are included in non-interest-bearing liabilities. | |||||||||
| 8 |
| |
| ASSETS & LIABILITIES PERFORMANCE - AR$ | BBVA ARGENTINA CONSOLIDATED | ||||||||
| In millions of AR$. Rates and spreads in annualized % | |||||||||
| 4Q23 | 3Q23 | 4Q22 | |||||||
| Average Balance | Interest Earned/Paid | Average Real Rate | Average Balance | Interest Earned/Paid | Average Real Rate | Average Balance | Interest Earned/Paid | Average Real Rate | |
| Total interest-earning assets | 3,558,917 | 878,044 | 97.9% | 4,366,349 | 898,426 | 81.6% | 4,150,384 | 627,455 | 60.0% |
| Debt securities | 1,623,265 | 508,665 | 124.3% | 2,306,668 | 564,186 | 97.0% | 2,098,386 | 380,587 | 72.0% |
| Loans to customers/financial institutions | 1,806,969 | 369,375 | 81.1% | 1,964,920 | 334,235 | 67.5% | 1,975,657 | 246,865 | 49.6% |
| Loans to the BCRA | 205 | 4 | 7.7% | 161 | 5 | 11.3% | 3 | 3 | 396.7% |
| Other assets | 128,478 | - | 0.0% | 94,599 | - | 0.0% | 76,338 | - | 0.0% |
| Total non interest-earning assets | 684,120 | - | 0.0% | 646,707 | - | 0.0% | 685,131 | - | 0.0% |
| Total Assets | 4,243,037 | 878,044 | 82.1% | 5,013,056 | 898,426 | 71.1% | 4,835,515 | 627,455 | 51.5% |
| Total interest-bearing liabilities | 1,855,948 | 383,736 | 82.0% | 2,515,449 | 485,179 | 76.5% | 2,327,538 | 297,746 | 50.8% |
| Savings accounts | 482,535 | 2,473 | 2.0% | 500,986 | 1,611 | 1.3% | 549,852 | 1,532 | 1.1% |
| Time deposits and Investment accounts | 938,784 | 281,234 | 118.9% | 1,401,864 | 350,809 | 99.3% | 1,482,970 | 257,995 | 69.0% |
| Debt securities issued | 10,559 | 3,400 | 127.8% | - | 6 | - | 389 | 283 | 288.8% |
| Other liabilities | 424,070 | 96,629 | 90.4% | 612,599 | 132,753 | 86.0% | 294,327 | 37,936 | 51.1% |
| Total non-interest-bearing liabilities | 2,555,028 | - | 0.0% | 2,552,154 | - | 0.0% | 2,528,216 | - | 0.0% |
| Total liabilities and equity | 4,410,976 | 383,736 | 34.5% | 5,067,604 | 485,179 | 38.0% | 4,855,754 | 297,746 | 24.3% |
| NIM - AR$ | 55.1% | 37.5% | 31.5% | ||||||
| Spread - AR$ | 15.9% | 5.1% | 9.2% | ||||||
| Nominal rates are calculated over a 365-day year | |||||||||
| Does not include Net income from measurement of financial instruments at fair value through P&L nor Net income from write-down of assets at amortized cost and at fair value through OCI | |||||||||
| Interest-bearing checking accounts included in other interest-bearing liabilities. Non interest-bearing accounts are included in non-interest-bearing liabilities. | |||||||||
| ASSETS & LIABILITIES PERFORMANCE - FOREIGN CURRENCY | BBVA ARGENTINA CONSOLIDATED | ||||||||
| In millions of AR$. Rates and spreads in annualized % | |||||||||
| 4Q23 | 3Q23 | 4Q22 | |||||||
| Average Balance | Interest Earned/Paid | Average Real Rate | Average Balance | Interest Earned/Paid | Average Real Rate | Average Balance | Interest Earned/Paid | Average Real Rate | |
| Total interest-earning assets | 373,733 | 1,594 | 1.7% | 203,981 | 1,213 | 2.4% | 175,441 | 922 | 2.1% |
| Debt securities | 234,279 | 72 | 0.1% | 62,122 | 185 | 1.2% | 34,115 | 84 | 1.0% |
| Loans to customers/financial institutions | 134,746 | 1,520 | 4.5% | 141,476 | 1,024 | 2.9% | 117,986 | 835 | 2.8% |
| Loans to the BCRA | 1 | - | 0.0% | 2 | - | 0.0% | - | - | #DIV/0! |
| Other assets | 4,707 | 2 | 0.2% | 382 | 3 | 3.2% | 23,340 | 3 | 0.1% |
| Total non interest-earning assets | 653,717 | - | 0.0% | 723,923 | - | 0.0% | 707,179 | (215) | -0.1% |
| Total Assets | 1,027,450 | 1,594 | 0.6% | 927,905 | 1,213 | 0.5% | 882,619 | 707 | 0.3% |
| Total interest-bearing liabilities | 532,932 | 185 | 0.1% | 589,104 | 219 | 0.1% | 576,412 | 100 | 0.1% |
| Savings accounts | 457,026 | 9 | 0.0% | 499,075 | 9 | 0.0% | 497,471 | 9 | 0.0% |
| Time deposits and Investment accounts | 73,029 | 32 | 0.2% | 81,993 | 35 | 0.2% | 75,386 | 37 | 0.2% |
| Other liabilities | 2,877 | 144 | 19.9% | 8,037 | 175 | 8.6% | 3,556 | 53 | 5.9% |
| Total non-interest-bearing liabilities | 326,579 | - | 0.0% | 284,253 | - | 0.0% | 285,969 | - | 0.0% |
| Total liabilities and equity | 859,511 | 185 | 0.1% | 873,357 | 219 | 0.1% | 862,381 | 100 | 0.0% |
| NIM - Foreign currency | 1.5% | 1.9% | 1.9% | ||||||
| Spread - Foreign currency | 1.6% | 2.2% | 2.0% | ||||||
| Nominal rates are calculated over a 365-day year | |||||||||
| Does not include Net income from measurement of financial instruments at fair value through P&L nor Net income from write-down of assets at amortized cost and at fair value through OCI | |||||||||
| Interest-bearing checking accounts included in other interest-bearing liabilities. Non interest-bearing accounts are included in non-interest-bearing liabilities. | |||||||||
| 9 |
| |
| ASSETS & LIABILITIES PERFORMANCE - TOTAL | BBVA ARGENTINA CONSOLIDATED | |||||
| In millions of AR$. Rates and spreads in annualized % | ||||||
| 2023 | 2022 | |||||
| Average Balance | Interest Earned/Paid | Average Real Rate | Average Balance | Interest Earned/Paid | Average Real Rate | |
| Total interest-earning assets | 4,366,733 | 3,183,947 | 72.9% | 4,322,739 | 1,959,831 | 45.3% |
| Debt securities | 2,212,912 | 1,919,153 | 86.7% | 2,131,856 | 1,155,636 | 54.2% |
| Loans to customers/financial institutions | 2,060,273 | 1,264,739 | 61.4% | 2,115,672 | 804,157 | 38.0% |
| Loans to the BCRA | 95 | 44 | 46.3% | 6 | 28 | 450.0% |
| Other assets | 93,453 | 11 | 0.0% | 75,205 | 9 | 0.0% |
| Total non interest-earning assets | 1,406,947 | - | 0.0% | 1,536,186 | - | 0.0% |
| Total Assets | 5,773,680 | 3,183,947 | 55.1% | 5,858,925 | 1,959,831 | 33.5% |
| Total interest-bearing liabilities | 2,890,120 | 1,555,015 | 53.8% | 3,020,545 | 902,795 | 29.9% |
| Savings accounts | 1,023,768 | 7,157 | 0.7% | 1,130,718 | 4,998 | 0.4% |
| Time deposits and investment accounts | 1,420,930 | 1,206,357 | 84.9% | 1,483,088 | 744,992 | 50.2% |
| Debt securities issued | 2,668 | 3,588 | 134.5% | 975 | 1,314 | 134.8% |
| Other liabilities | 442,754 | 337,913 | 76.3% | 405,764 | 151,490 | 37.3% |
| Total non-interest-bearing liabilities | 2,883,560 | - | 0.0% | 2,838,381 | - | 0.0% |
| Total liabilities and equity | 5,773,680 | 1,555,015 | 26.9% | 5,858,925 | 902,795 | 15.4% |
| NIM - Total | 37.3% | 24.5% | ||||
| Spread - Total | 19.1% | 15.4% | ||||
| Nominal rates are calculated over a 365-day year | ||||||
| Does not include Net income from measurement of financial instruments at fair value through P&L nor Net income from write-down of assets at amortized cost and at fair value through OCI | ||||||
| Interest-bearing checking accounts included in other interest-bearing liabilities. Non interest-bearing accounts are included in non-interest-bearing liabilities. | ||||||
Net Fee Income
| NET FEE INCOME | BBVA ARGENTINA CONSOLIDATED | ||||
| In millions of AR$ - Inflation adjusted | ∆ % | ||||
| 4Q23 | 3Q23 | 4Q22 | QoQ | YoY | |
| Net Fee Income | 35,597 | 25,998 | 31,659 | 36.9% | 12.4% |
| Fee Income | 70,749 | 59,564 | 61,584 | 18.8% | 14.9% |
| Linked to liabilities | 17,813 | 21,164 | 26,176 | (15.8%) | (31.9%) |
| From credit cards (1) | 37,090 | 26,076 | 23,935 | 42.2% | 55.0% |
| Linked to loans | 7,806 | 5,502 | 5,516 | 41.9% | 41.5% |
| From insurance | 2,229 | 2,469 | 2,656 | (9.7%) | (16.1%) |
| From foreign trade and foreign currency transactions | 2,762 | 2,558 | 2,530 | 8.0% | 9.2% |
| Other fee income | 2,919 | 1,691 | 771 | 72.6% | 278.6% |
| Linked to loan commitments | 130 | 104 | - | 25.0% | N/A |
| From guarantees granted | 33 | 29 | 3 | 13.8% | n.m |
| Linked to securities | 2,886 | 1,662 | 768 | 73.6% | 275.8% |
| Fee expenses | 35,152 | 33,566 | 29,925 | 4.7% | 17.5% |
| (1) Includes results from Puntos BBVA royalty program pursuant to IFRS 15 regulation. | |||||
Net fee income as of 4Q23 totaled $35.6 billion, increasing 36.9% or $9.6 billion QoQ and 12.4% or $3.9 billion YoY.
In 4Q23, fee income totaled $70.7 billion, increasing 18.8% QoQ and 14.9% YoY. The quarterly increase is mainly explained by a 41.9% growth in fees from credit cards, due to a lower expense related to Puntos BBVA loyalty program, and higher activity combined with an increase in prices.
Regarding fee expenses, these totaled $35.2 billion, increasing 4.7% QoQ and 17.5% YoY. Greater expenses are explained by fees paid in foreign exchange transactions related to royalties affected by the devaluation of the local currency, payroll marketing campaigns.
| 10 |
| |
Net Income from Measurement of Financial Instruments at Fair Value and Foreign Exchange and Gold Gains/Losses
| NET INCOME FROM FINANCIAL INSTRUMENTS AT FAIR VALUE (FV) THROUGH P&L | BBVA ARGENTINA CONSOLIDATED | ||||
| In millions of AR$ - Inflation adjusted | ∆ % | ||||
| 4Q23 | 3Q23 | 4Q22 | QoQ | YoY | |
| Net Income from financial instruments at FV through P&L | (69,688) | 12,527 | 15,564 | n.m | n.m |
| Income from government securities | (90,196) | 8,084 | 15,281 | n.m | n.m |
| Income from private securities | 848 | 578 | 1,762 | 46.7% | (51.9%) |
| Interest rate swaps | (3) | (109) | (49) | 97.2% | 93.9% |
| Income from foreign currency forward transactions | 19,574 | 2,967 | (1,359) | n.m | n.m |
| Income from put option long position | (278) | - | (72) | N/A | (286.1%) |
| Income from corporate bonds | 367 | 1,007 | 1 | (63.6%) | n.m |
In 4Q23, net income from financial instruments at fair value (FV) through P&L was a loss of $69.7 billion, decreasing 656.3% or $82.2 billion QoQ and 547.8% or $85.3 billion YoY.
Quarterly results are mainly explained by a decrease in the income from government securities line item, due to the valuation of National Treasury’s Dual bonds at fair value through P&L.
| DIFFERENCES IN QUOTED PRICES OF GOLD AND FOREIGN FOREIGN CURRENCY | BBVA ARGENTINA CONSOLIDATED | ||||
| In millions of AR$ - Inflation adjusted | ∆ % | ||||
| 4Q23 | 3Q23 | 4Q22 | QoQ | YoY | |
| Foreign exchange and gold gains/(losses) (1) | 197,454 | 3,280 | 1,147 | n.m | n.m |
| From foreign exchange position | 186,654 | (6,789) | (6,187) | n.m | n.m |
| Income from purchase-sale of foreign currency | 10,800 | 10,069 | 7,334 | 7.3% | 47.3% |
| Net income from financial instruments at FV through P&L (2) | 19,574 | 2,967 | (1,359) | n.m | n.m |
| Income from foreign currency forward transactions | 19,574 | 2,967 | (1,359) | n.m | n.m |
| Total differences in quoted prices of gold & foreign currency (1) + (2) | 217,028 | 6,247 | (212) | n.m | n.m |
In 4Q23, the total differences in quoted prices of gold and foreign currency showed profit for $217.0 billion, increasing 3,374.1% or $210.8 billion compared to 3Q23.
The quarterly increase in foreign exchange and gold gains is mainly explained by a higher result from income from foreign exchange position, mainly due to Dual bonds, and also from income from foreign currency forward transactions.
| 11 |
| |
Other Operating Income
| OTHER OPERATING INCOME | BBVA ARGENTINA CONSOLIDATED | ||||
| In millions of AR$ - Inflation adjusted | ∆ % | ||||
| 4Q23 | 3Q23 | 4Q22 | QoQ | YoY | |
| Operating Income | 21,698 | 16,331 | 17,051 | 32.9% | 27.3% |
| Rental of safe deposit boxes (1) | 2,042 | 2,119 | 2,075 | (3.6%) | (1.6%) |
| Adjustments and interest on miscellaneous receivables (1) | 9,228 | 7,124 | 6,151 | 29.5% | 50.0% |
| Punitive interest (1) | 685 | 680 | 473 | 0.7% | 44.8% |
| Loans recovered | 2,296 | 1,754 | 4,027 | 30.9% | (43.0%) |
| Fee income from credit and debit cards (1) | 1,184 | 1,183 | 731 | 0.1% | 62.0% |
| Fee expenses recovery | 619 | 599 | 648 | 3.3% | (4.5%) |
| Rents | 541 | 639 | 615 | (15.3%) | (12.0%) |
| Sindicated transaction fees | 222 | 256 | 160 | (13.3%) | 38.8% |
| Disaffected provisions | 532 | 231 | 563 | 130.3% | (5.5%) |
| Other Operating Income(2) | 4,349 | 1,746 | 1,608 | 149.1% | 170.5% |
| (1) Included in the efficiency ratio calculation | |||||
| (2) Includes some of the concepts used in the efficiency ratio calculation | |||||
In 4Q23 other operating income totaled $21.7 billion, growing 32.9% or $5.4 billion QoQ, and 27.3% or $4.6 billion YoY. Quarterly increase is partially explained by a 29.5% growth in the Adjustments and interest on miscellaneous receivables line item (mainly loans related to Prisma sale, affected by the depreciation of the FX rate and inflation), followed by a 149.1% increase in the other operating income line, the latter due to the recovery generated by the provision of the valuation of bonds used to make dividend payments during 2023, considering the volatility in these bonds’ price.
| 12 |
| |
Operating Expenses
Personnel Benefits and Administrative Expenses
| PERSONNEL BENEFITS & ADMINISTRATIVE EXPENSES | BBVA ARGENTINA CONSOLIDATED | ||||
| In millions of AR$ - Inflation adjusted | ∆ % | ||||
| 4Q23 | 3Q23 | 4Q22 | QoQ | YoY | |
| Total Personnel Benefits and Adminsitrative Expenses | 117,876 | 137,594 | 111,275 | (14.3%) | 5.9% |
| Personnel Benefits (1) | 66,717 | 65,020 | 57,075 | 2.6% | 16.9% |
| Administrative expenses (1) | 51,159 | 72,574 | 54,200 | (29.5%) | (5.6%) |
| Travel expenses | 377 | 518 | 1,157 | (27.2%) | (67.4%) |
| Outsourced administrative expenses | 6,708 | 9,286 | 6,097 | (27.8%) | 10.0% |
| Security services | 1,370 | 1,601 | 1,353 | (14.4%) | 1.3% |
| Fees to Bank Directors and Supervisory Committee | 131 | 60 | 126 | 118.3% | 4.0% |
| Other fees | 1,380 | 2,129 | 2,031 | (35.2%) | (32.1%) |
| Insurance | 517 | 500 | 462 | 3.4% | 11.9% |
| Rent | 4,751 | 10,300 | 7,040 | (53.9%) | (32.5%) |
| Stationery and supplies | 106 | 125 | 59 | (15.2%) | 79.7% |
| Electricity and communications | 2,251 | 2,050 | 1,926 | 9.8% | 16.9% |
| Advertising | 3,000 | 3,275 | 3,043 | (8.4%) | (1.4%) |
| Taxes | 14,489 | 13,552 | 12,056 | 6.9% | 20.2% |
| Maintenance costs | 5,613 | 5,411 | 5,383 | 3.7% | 4.3% |
| Armored transportation services | 5,329 | 5,143 | 5,033 | 3.6% | 5.9% |
| Software | (1,017) | 13,191 | 4,268 | (107.7%) | (123.8%) |
| Document distribution | 1,673 | 1,610 | 1,434 | 3.9% | 16.7% |
| Commercial reports | 945 | 1,024 | 1,016 | (7.7%) | (7.0%) |
| Other administrative expenses | 3,536 | 2,799 | 1,716 | 26.3% | 106.1% |
| Headcount* | |||||
| BBVA (Bank) | 5,918 | 5,919 | 5,765 | (1) | 153 |
| Subsidiaries (2) | 91 | 92 | 93 | (1) | (2) |
| Total employees* | 6,009 | 6,011 | 5,858 | (2) | 151 |
| In branches** | 2,214 | 2,193 | 1,877 | 21 | 337 |
| At Main office | 3,795 | 3,818 | 4,011 | (23) | (216) |
| Total branches*** | 243 | 243 | 243 | - | - |
| Own | 112 | 113 | 113 | (1) | (1) |
| Rented | 131 | 130 | 130 | 1 | 1 |
| - | |||||
| Efficiency Ratio | |||||
| Efficiency ratio | 46.4% | 82.4% | 53.0% | (3,602)bps | (665)bps |
| Accumulated Efficiency Ratio | 58.6% | 63.8% | 63.9% | (522)bps | (536)bps |
| (1) Concept included in the efficiency ratio calculation | |||||
| (2) Includes BBVA Asset Management, PSA & VWFS. Employees included in Main Office. | |||||
| *Total effective employees, net of temporary contract employees. Expatriates excluded. | |||||
| **Branch employees + Business Center managers | |||||
| ***Excludes administrative branches | |||||
During 4Q23, personnel benefits and administrative expenses totaled $117.9 billion, decreasing 14.3% or $19.7 billion compared to 3Q23, and increasing 5.9% or $6.6 billion compared to 4Q22.
| 13 |
| |
Personnel benefits increased 2.6% QoQ, and 16.9% YoY. The quarterly change is mainly explained by the inflation adjustment of vacation stock provisions and variable compensations. This adjustment is applied retroactively to the last twelve months.
As of 4Q23, administrative expenses fell 29.5% QoQ, and 5.6% YoY. This is explained by (i) outsourced administrative expenses, (ii) greater rent expenses, and (iii) an increase in software services. All of these were related to an increase in the amount of services contracted with the Parent company, offset by the update of the provision on these expenses in line with the FX rate depreciation estimates at quarter-end.
The quarterly efficiency ratio as of 4Q23 was 46.4%, improving compared to the 82.4% reported in 3Q23, and versus the 53.0% reported in 4Q22. The quarterly decrease is explained by a decrease in the numerator (expenses) and an increase in the denominator (income considering monetary position results), especially due to an increase in results from income from foreign exchange and gold gains, as well as income from write-down of assets at amortized cost and OCI.
The accumulated efficiency ratio as of 4Q23 was 58.6%, improving compared to the 63.8% reported in 3Q23, and the 63.9% reported in 4Q22. The improvement in this ratio is due to a lower increase in expenses versus net income, considering monetary position results. This positive variation in the ratio is due mainly to better income from write-down of assets at amortized cost and OCI, and income from foreign exchange and gold gains.
Other Operating Expenses
| OTHER OPERATING EXPENSES | BBVA ARGENTINA CONSOLIDATED | ||||
| In millions of AR$ - Inflation adjusted | ∆ % | ||||
| 4Q23 | 3Q23 | 4Q22 | QoQ | YoY | |
| Other Operating Expenses | 86,241 | 66,028 | 57,230 | 30.6% | 50.7% |
| Turnover tax | 60,423 | 56,111 | 37,533 | 7.7% | 61.0% |
| Initial loss of loans below market rate | 5,146 | 1,793 | 3,089 | 187.0% | 66.6% |
| Contribution to the Deposit Guarantee Fund (SEDESA) | 1,279 | 1,465 | 1,486 | (12.7%) | (13.9%) |
| Interest on liabilities from financial lease | 479 | 418 | 430 | 14.6% | 11.4% |
| Other allowances | 11,703 | 593 | 9,326 | n.m | 25.5% |
| Loss for sale or depreciation of investment property and other non financial assets | 238 | - | 38 | N/A | n.m |
| Other operating expenses | 6,973 | 5,648 | 5,328 | 23.5% | 30.9% |
In 4Q23, other operating expenses totaled $86.2 billion, increasing 30.6% or $20.2 billion QoQ, and 50.7% or $29.0 billion YoY.
The key factor explaining the quarterly growth is the 1,874.5% increase in the other allowances line, related to the update in provisions for overdraft credit lines, taking into consideration an increase in credit card limits and commercial overdraft lines in foreign currency affected by the FX rate devaluation. An increase must also be noted in the turnover tax line item, especially due to an increased revenue from interests from loans and revenues from REPO and LEDIV.
| 14 |
| |
Income from Associates
This line reflects the results from non-consolidated associate companies. During 4Q23, a profit of $57 million has been reported, mainly due to the Bank’s participation in BBVA Seguros Argentina S.A., Rombo Compañía Financiera S.A., Interbanking S.A. and Play Digital S.A. and Openpay Argentina S.A.
Income Tax
Accumulated income tax during the first twelve months of 2023 recorded a loss of $137.1 billion. As of 4Q23, income tax expense was $73.9 billion.
In 3Q23, there was a positive effect in the income tax line, considering the final judgments dictated by the Supreme Court of Justice concerning fiscal years 2014 and 2013, rejecting the extraordinary appeal and the claim presented by the tax authorities, and affirming the prior favorable final judgments.
The twelve month accumulated effective tax rate in 2023 was 45%5.
Accumulated income tax during the first twelve months of 2022 recorded a loss of only $12.2 billion. In regards the second quarter of 2022, income tax showed a positive result, affected by the implications of inflation adjustments in the determination of payable taxes and tax deferrals.
5 Income tax, according to IAS 34, is recorded on interim financial periods over the best estimate of the weighted average tax rate expected for the fiscal year.
| 15 |
| |
Balance sheet and activity
Loans and Other Financing
| LOANS AND OTHER FINANCING | BBVA ARGENTINA CONSOLIDATED | ||||
| In millions of AR$ - Inflation adjusted | ∆ % | ||||
| 4Q23 | 3Q23 | 4Q22 | QoQ | YoY | |
| To the public sector | 145 | 86 | 32 | 68.6% | 353.1% |
| To the financial sector | 16,432 | 8,328 | 13,904 | 97.3% | 18.2% |
| Non-financial private sector and residents abroad | 2,004,342 | 2,124,636 | 2,284,196 | (5.7%) | (12.3%) |
| Non-financial private sector and residents abroad - AR$ | 1,802,048 | 1,981,295 | 2,147,693 | (9.0%) | (16.1%) |
| Overdrafts | 176,504 | 173,777 | 196,014 | 1.6% | (10.0%) |
| Discounted instruments | 463,503 | 467,027 | 364,737 | (0.8%) | 27.1% |
| Mortgage loans | 79,405 | 94,963 | 119,922 | (16.4%) | (33.8%) |
| Pledge loans | 44,335 | 58,933 | 76,942 | (24.8%) | (42.4%) |
| Consumer loans | 151,820 | 193,351 | 222,108 | (21.5%) | (31.6%) |
| Credit cards | 681,653 | 736,375 | 836,964 | (7.4%) | (18.6%) |
| Receivables from financial leases | 12,609 | 16,800 | 19,599 | (24.9%) | (35.7%) |
| Other loans | 192,219 | 240,069 | 311,407 | (19.9%) | (38.3%) |
| Non-financial private sector and residents abroad - Foreign Currency | 202,294 | 143,341 | 136,503 | 41.1% | 48.2% |
| Overdrafts | 12 | 14 | 8 | (14.3%) | 50.0% |
| Discounted instruments | 2,794 | 3,045 | 1,752 | (8.2%) | 59.5% |
| Credit cards | 21,005 | 24,372 | 17,961 | (13.8%) | 16.9% |
| Receivables from financial leases | 111 | 114 | 294 | (2.6%) | (62.2%) |
| Loans for the prefinancing and financing of exports | 153,201 | 99,001 | 78,079 | 54.7% | 96.2% |
| Other loans | 25,171 | 16,795 | 38,409 | 49.9% | (34.5%) |
| % of total loans to Private sector in AR$ | 89.9% | 93.3% | 94.0% | (335)bps | (412)bps |
| % of total loans to Private sector in Foreign Currency | 10.1% | 6.7% | 6.0% | 335 bps | 412 bps |
| % of mortgage loans with UVA adjustments / Total mortgage loans (1) | 53.5% | 54.2% | 56.7% | (70)bps | (323)bps |
| % of pledge loans with UVA adjustments / Total pledge loans (1) | 1.3% | 0.9% | 2.2% | 42 bps | (90)bps |
| % of consumer loans with UVA adjustments / Total consumer loans (1) | 0.1% | 0.1% | 0.7% | (7)bps | (67)bps |
| % of loans with UVA adjustments / Total loans and other financing(1) | 0.1% | 0.1% | 0.2% | (0)bps | (14)bps |
| Total loans and other financing | 2,020,919 | 2,133,050 | 2,298,132 | (5.3%) | (12.1%) |
| Allowances | (45,422) | (59,606) | (65,052) | 23.8% | 30.2% |
| Total net loans and other financing | 1,975,497 | 2,073,444 | 2,233,080 | (4.7%) | (11.5%) |
| (1) Excludes effect of accrued interests adjustments. | |||||
| LOANS AND OTHER FINANCING TO NON-FINANCIAL PRIVATE SECTOR AND RESIDENTS ABROAD IN FOREIGN CURRENCY | BBVA ARGENTINA CONSOLIDATED | ||||
| In millions of USD | ∆ % | ||||
| 4Q23 | 3Q23 | 4Q22 | QoQ | YoY | |
| FX rate* | 808.48 | 350.01 | 177.13 | 131.0% | 356.4% |
| Non-financial private sector and residents abroad - Foreign Currency (USD) | 250 | 267 | 247 | (6.2%) | 1.5% |
| *Wholesale U.S. dollar foreign exchange rates on BCRA’s Communication “A” 3500, as of the end of period. | |||||
Private sector loans as of 4Q23 totaled $2.0 trillion, decreasing 5.7% or $120.3 billion QoQ, and 12.3% or $279.9 billion YoY.
| 16 |
| |
Loans to the private sector in pesos fell 9.0% in 4Q23, and 16.1% YoY. During the quarter, the decrease was especially driven by a general decline in loans, but specially a 7.4% decline in credit cards, followed by a 19.9% fall in other loans (mainly commercial loans PIV6) and a 21.5% fall in consumer loans. The decrease was partially offset by a 1.6% increase in overdrafts, driven by greater activity.
Loans to the private sector denominated in foreign currency increased 41.1% QoQ and 48.2% YoY. Quarterly increase is mainly explained by a 54.7% growth in financing and prefinancing of exports. Loans to the private sector in foreign currency measured in U.S. dollars decreased 6.1% QoQ and increased 1.5% YoY. The depreciation of the argentine peso versus the U.S. dollar was 56.7% QoQ and 78.1% YoY7.
In 4Q23, total loans and other financing totaled $2.0 trillion, declining 5.3% QoQ and 12.1% compared to 4Q22.
| LOANS AND OTHER FINANCING | BBVA ARGENTINA CONSOLIDATED | ||||
| In millions of AR$ - Inflation adjusted | ∆ % | ||||
| 4Q23 | 3Q23 | 4Q22 | QoQ | YoY | |
| Non-financial private sector and residents abroad - Retail | 978,218 | 1,107,994 | 1,273,897 | (11.7%) | (23.2%) |
| Mortgage loans | 79,405 | 94,963 | 119,922 | (16.4%) | (33.8%) |
| Pledge loans | 44,335 | 58,933 | 76,942 | (24.8%) | (42.4%) |
| Consumer loans | 151,820 | 193,351 | 222,108 | (21.5%) | (31.6%) |
| Credit cards | 702,658 | 760,747 | 854,925 | (7.6%) | (17.8%) |
| Non-financial private sector and residents abroad - Commercial | 1,026,124 | 1,016,642 | 1,010,299 | 0.9% | 1.6% |
| Overdrafts | 176,516 | 173,791 | 196,022 | 1.6% | (10.0%) |
| Discounted instruments | 466,297 | 470,072 | 366,489 | (0.8%) | 27.2% |
| Receivables from financial leases | 12,720 | 16,914 | 19,893 | (24.8%) | (36.1%) |
| Loans for the prefinancing and financing of exports | 153,201 | 99,001 | 78,079 | 54.7% | 96.2% |
| Other loans | 217,390 | 256,864 | 349,816 | (15.4%) | (37.9%) |
| % of total loans to Retail sector | 48.8% | 52.1% | 55.8% | (334)bps | (697)bps |
| % of total loans to Commercial sector | 51.2% | 47.9% | 44.2% | 334 bps | 697 bps |
In real terms, retail loans (mortgage, pledge, consumer and credit cards) fell 11.7% QoQ and 23.2% YoY in real terms. During the quarter all product lines decline, mainly credit cards by 7.6% and consumer loans by 21.5%.
Commercial loans (overdrafts, discounted instruments, receivables from financial leases, loans for the prefinancing and financing of exports, and other loans) increased 0.9% QoQ and 1.6% YoY, both in real terms. This is justified by quarterly increases in loans for the prefinancing and financing of exports by 54.7% offset by a 15.4% fall in other loans.
As observed in previous quarters, loan portfolios were impacted by the effect of inflation during the fourth quarter of 2023, which reached 53.3%. In nominal terms, BBVA Argentina managed to increase the retail, commercial and total loan portfolio by 35.3%, 54.7% and 45.2% respectively during the quarter, only surpassing quarterly inflation levels in the case of commercial loans.
6 Préstamo a Interés Vencido
7 Taking into consideration wholesale U.S. dollar foreign exchange rates on BCRA’s Communication “A” 3500.
| 17 |
| |
| LOANS AND OTHER FINANCING - NON RESTATED FIGURES | BBVA ARGENTINA CONSOLIDATED | ||||
| In millions of AR$ | ∆ % | ||||
| 4Q23 | 3Q23 | 4Q22 | QoQ | YoY | |
| Non-financial private sector and residents abroad - Retail | 978,218 | 722,816 | 409,079 | 35.3% | 139.1% |
| Non-financial private sector and residents abroad - Commercial | 1,026,124 | 663,221 | 324,433 | 54.7% | 216.3% |
| Total loans and other financing (1) | 2,020,919 | 1,391,526 | 737,987 | 45.2% | 173.8% |
| (1) Does not include allowances | |||||
As of 4Q23, the total loans and other financing over deposits ratio was 55.5%, above the 53.6% recorded in 3Q23 and lower than the 56.2% in 4Q22.
| MARKET SHARE - PRIVATE SECTOR LOANS | BBVA ARGENTINA CONSOLIDATED | ||||
| In % | ∆ bps | ||||
| 4Q23 | 3Q23 | 4Q22 | QoQ | YoY | |
| Private sector loans - Bank | 9.12% | 8.55% | 8.15% | 57 bps | 97 bps |
| Private sector loans - Consolidated* | 9.85% | 9.35% | 9.10% | 50 bps | 75 bps |
| Based on daily BCRA information. Capital balance as of the last day of each quarter. | |||||
| * Consolidates PSA, VWFS & Rombo | |||||
| LOANS BY ECONOMIC ACTIVITY | BBVA ARGENTINA CONSOLIDATED | ||||
| % over total gross loans and other financing | ∆ bps | ||||
| 4Q23 | 3Q23 | 4Q22 | QoQ | YoY | |
| Government services | 0.00% | 0.00% | 0.00% | n.m. | n.m. |
| Non-financial public sector | 0.01% | 0.00% | 0.00% | n.m. | n.m. |
| Financial Sector | 0.81% | 0.39% | 0.61% | 42 bps | 21 bps |
| Agricultural and Livestock | 4.91% | 4.89% | 4.59% | 2 bps | 32 bps |
| Mining products | 7.34% | 4.51% | 3.52% | 283 bps | 382 bps |
| Other manufacturing | 11.62% | 11.36% | 10.50% | 25 bps | 111 bps |
| Electricity, oil,water and sanitary services | 0.54% | 0.30% | 0.14% | 24 bps | 39 bps |
| Wholesale and retail trade | 8.18% | 8.53% | 6.97% | (36)bps | 121 bps |
| Transport | 1.66% | 1.70% | 1.61% | (5)bps | 5 bps |
| Services | 1.85% | 1.61% | 1.03% | 24 bps | 81 bps |
| Others | 15.23% | 15.75% | 17.42% | (52)bps | (219)bps |
| Construction | 0.64% | 0.66% | 0.71% | (1)bps | (6)bps |
| Consumer | 47.22% | 50.28% | 52.89% | (306)bps | (567)bps |
| Total gross loans and other financing | 100% | 100% | 100% | ||
| 18 |
| |
Asset Quality
| ASSET QUALITY | BBVA ARGENTINA CONSOLIDATED | ||||
| In millions of AR$ - Inflation adjusted | ∆ % | ||||
| 4Q23 | 3Q23 | 4Q22 | QoQ | YoY | |
| Commercial non-performing portfolio (1) | 2,861 | 2,911 | 3,955 | (1.7%) | (27.7%) |
| Total commercial portfolio | 905,083 | 853,186 | 804,265 | 6.1% | 12.5% |
| Commercial non-performing portfolio / Total commercial portfolio | 0.32% | 0.34% | 0.49% | (3)bps | (18)bps |
| Retail non-performing portfolio (1) | 24,617 | 29,088 | 22,901 | (15.4%) | 7.5% |
| Total retail portfolio | 1,231,363 | 1,401,190 | 1,569,348 | (12.1%) | (21.5%) |
| Retail non-performing portfolio / Total retail portfolio | 2.00% | 2.08% | 1.46% | (8)pbs | 54 pbs |
| Total non-performing portfolio (1) | 27,478 | 31,999 | 26,856 | (14.1%) | 2.3% |
| Total portfolio | 2,136,446 | 2,254,376 | 2,373,613 | (5.2%) | (10.0%) |
| Total non-performing portfolio / Total portfolio | 1.29% | 1.42% | 1.13% | (13)bps | 15 bps |
| Allowances | 45,422 | 59,606 | 65,052 | (23.8%) | (30.2%) |
| Allowances /Total non-performing portfolio | 165.30% | 186.27% | 242.23% | (2,097)bps | (7,692)bps |
| Quarterly change in Write-offs | 8,193 | 7,918 | 5,590 | 3.5% | 46.6% |
| Write offs / Total portfolio | 0.38% | 0.35% | 0.24% | 3 bps | 15 bps |
| Cost of Risk (CoR) | 3.95% | 2.14% | 4.09% | 181 bps | (13)bps |
| (1) Non-performing loans include: all loans to borrowers classified as "Deficient Servicing (Stage 3)", "High Insolvency Risk (Stage 4)", "Irrecoverable" and/or "Irrecoverable for Technical Decision" (Stage 5) according to BCRA debtor classification system | |||||
As of 4Q23, asset quality ratio or NPL (total non-performing portfolio / total portfolio) keeps a very good performance at 1.29%, in line with the good behavior of both retail and commercial portfolios. The lower decrease of the total loan portfolio versus that of the non-performing portfolio is explained by a growth in commercial loans, driven by a devaluation of the FX rate, without significantly affecting client’s credit behavior.
Coverage ratio (allowances / total non-performing portfolio) decreased from 186.27% in 3Q23 to 165.30% in 4Q23 due to a lower provision requirement from the retail portfolio.
Cost of risk (loan loss allowances / average total loans) reached 3.95% in 4Q23 compared to 2.14% in 3Q23. The increase is explained by the accounting re-expression of loan loss allowances in the foreign currency portfolios.
| ANALYSIS FOR THE ALLOWANCE OF LOAN LOSSES | BBVA ARGENTINA CONSOLIDATED | |||||
| In millions of AR$ | ||||||
| Balance at 12/31/2022 | Stage 1 | Stage 2 | Stage 3 | Monetary result generated by allowances | Balance at 12/31/2022 | |
| Other financial assets | 1,439 | 514 | - | 687 | (1,221) | 1,419 |
| Loans and other financing | 65,051 | 12,550 | 4,848 | 30,025 | (67,052) | 45,422 |
| Other debt securities | 100 | 104 | - | - | (106) | 98 |
| Eventual commitments | 8,390 | 4,438 | 241 | 170 | (7,267) | 5,972 |
| Total allowances | 74,980 | 17,606 | 5,089 | 30,882 | (75,646) | 52,911 |
| Note: to be consistent with Financial Statements, it must be recorded from the beginning of the year instead of the quarter | ||||||
Allowances for the Bank in 4Q23 reflect expected losses driven by the adoption of the IFRS 9 standards as of January 1, 2020, except for debt instruments issued by the nonfinancial government sector which were excluded from the scope of such standard.
| 19 |
| |
Public Sector Exposure
| NET PUBLIC DEBT EXPOSURE* | BBVA ARGENTINA CONSOLIDATED | ||||
| In millions of AR$ - Inflation adjusted | ∆ % | ||||
| 4Q23 | 3Q23 | 4Q22 | QoQ | YoY | |
| Treasury and Government securities | 975,996 | 757,787 | 616,474 | 28.8% | 58.3% |
| Treasury and National Government | 975,996 | 757,787 | 616,474 | 28.8% | 58.3% |
| National Treasury Public Debt in AR$ | 749,507 | 634,929 | 604,677 | 18.0% | 24.0% |
| National Treasury Public Debt in USD | 2,017 | 37 | 0 | n.m | n.m |
| National Treasury Public Debt in AR$ linked to US dollars | 224,471 | 122,821 | 11,797 | 82.8% | n.m |
| Loans to theNon-financial Public Sector | 145 | 86 | 4 | 68.6% | n.m |
| AR$ Subtotal | 749,652 | 635,015 | 604,681 | 18.1% | 24.0% |
| USD Subtotal** | 226,488 | 122,857 | 11,797 | 84.4% | n.m |
| Total Public Debt Exposure | 976,141 | 757,873 | 616,478 | 28.8% | 58.3% |
| B.C.R.A. Exposure | 1,332,679 | 1,674,693 | 1,675,999 | (20.4%) | (20.5%) |
| Instruments | 130,257 | 1,207,523 | 1,512,308 | (89.2%) | (91.4%) |
| Leliqs | 60,485 | 1,188,744 | 1,505,689 | (94.9%) | (96.0%) |
| Notaliqs | - | - | - | N/A | N/A |
| Lediv*** | 69,772 | 18,778 | 6,619 | 271.6% | n.m |
| Loans to the B.C.R.A. | - | - | 28 | N/A | (100.0%) |
| Repo / Pases | 1,202,422 | 467,170 | 163,691 | 157.4% | n.m |
| % Public sector exposure (Excl. B.C.R.A.) / Total assets | 15.9% | 12.7% | 10.1% | 320 pbs | 583 pbs |
| *Deposits at the Central Bank used to comply with reserve requirements not included. Includes assets used as collateral. | |||||
| **Includes USD-linked Treasury public debt in AR$ | |||||
| ***Securities denominated in foreign currency | |||||
4Q23 total public sector exposure (excluding BCRA) totaled $976.1 billion, increasing 28.8% or $218.3 billion QoQ, and 58.3% or $359.7 billion YoY. The quarterly increase is explained by an increment in the position of National Treasury bonds linked to the US dollar and National Treasury debt in pesos.
Short-term liquidity is mostly allocated in REPO, which increased 157.4% QoQ in real terms. This is explained by the total cancellation and cease to issue LELIQ by the Central Bank. Total exposure to the BCRA decreased 20.4% in 4Q23.
Exposure to the public sector (excluding BCRA) represents 15.9% of total assets, above the 12.7% in 3Q23 and above the 10.1% in 4Q22.
| 20 |
| |
Deposits
| TOTAL DEPOSITS | BBVA ARGENTINA CONSOLIDATED | ||||
| In millions of AR$ - Inflation adjusted | ∆ % | ||||
| 4Q23 | 3Q23 | 4Q22 | QoQ | YoY | |
| Total deposits | 3,639,307 | 3,976,103 | 4,091,312 | (8.5%) | (11.0%) |
| Non-financial Public Sector | 34,034 | 31,975 | 30,144 | 6.4% | 12.9% |
| Financial Sector | 2,573 | 1,972 | 1,059 | 30.5% | 143.0% |
| Non-financial private sector and residents abroad | 3,602,700 | 3,942,156 | 4,060,109 | (8.6%) | (11.3%) |
| Non-financial private sector and residents abroad - AR$ | 2,343,616 | 3,171,619 | 3,189,758 | (26.1%) | (26.5%) |
| Checking accounts | 913,013 | 1,170,549 | 789,091 | (22.0%) | 15.7% |
| Savings accounts | 592,684 | 608,991 | 768,289 | (2.7%) | (22.9%) |
| Time deposits | 639,533 | 1,082,600 | 1,215,668 | (40.9%) | (47.4%) |
| Investment accounts | 182,127 | 289,600 | 392,200 | (37.1%) | (53.6%) |
| Other | 16,259 | 19,879 | 24,510 | (18.2%) | (33.7%) |
| Non-financial private sector and res. abroad - Foreign Currency | 1,259,084 | 770,537 | 870,351 | 63.4% | 44.7% |
| Checking accounts | 648 | 270 | 213 | 140.0% | 204.2% |
| Savings accounts | 1,127,472 | 680,165 | 785,742 | 65.8% | 43.5% |
| Time deposits | 120,390 | 82,457 | 75,960 | 46.0% | 58.5% |
| Other | 10,574 | 7,645 | 8,436 | 38.3% | 25.3% |
| % of total portfolio in the private sector in AR$ | 65.1% | 80.5% | 78.6% | (1,540)bps | (1,351)bps |
| % of total portfolio in the private sector in Foregin Currency | 34.9% | 19.5% | 21.4% | 1,540 bps | 1,351 bps |
| % of UVA Time deposits & Investment accounts / Total AR$ Time deposits & Investment accounts | 1.3% | 1.4% | 3.9% | (7)bps | (260)bps |
| DEPOSITS TO THE NON-FINANCIAL PRIVATE SECTOR AND RES. ABROAD IN FOREIGN CURRENCY | BBVA ARGENTINA CONSOLIDATED | ||||
| In millions of USD | ∆ % | ||||
| 4Q23 | 3Q23 | 4Q22 | QoQ | YoY | |
| FX rate* | 808.5 | 350.0 | 177.1 | 131.0% | 356.4% |
| Non-financial private sector and residents abroad - Foreign Currency (USD) | 1,557 | 1,438 | 247 | 8.3% | 531.7% |
| *Wholesale U.S. dollar foreign exchange rates on BCRA’s Communication “A” 3500, as of the end of period. | |||||
As of 4Q23, total deposits reached $3.6 trillion, decreasing 8.5% or $336.8 billion QoQ, and 11.0% or $452.0 billion YoY.
Private non-financial sector deposits in 4Q23 totaled $3.6 trillion, falling 8.6% QoQ, and 11.3% YoY.
Private non-financial sector deposits in pesos totaled $2.3 trillion, decreasing 26.1% compared to 3Q23, and 26.5% compared to 4Q22. The quarterly change is mainly affected by a 40.9% decline in time deposits, a 37.1% fall in investment accounts, and a 22.0% fall in checking accounts, the latter driven by the Bank’s strategy of reducing interest-bearing checking accounts.
Private non-financial sector deposits in foreign currency expressed in pesos increased 63.4% QoQ and 44.7% YoY. This is mainly explained by seasonal factors. Measured in U.S. dollars, these deposits grew 8.3% QoQ, and a 1.3% fall YoY.
| 21 |
| |
| PRIVATE DEPOSITS | BBVA ARGENTINA CONSOLIDATED | ||||
| In millions of AR$ - Inflation adjusted | ∆ % | ||||
| 4Q23 | 3Q23 | 4Q22 | QoQ | YoY | |
| Non-financial private sector and residents abroad | 3,602,700 | 3,942,156 | 4,060,109 | (8.6%) | (11.3%) |
| Sight deposits | 2,660,650 | 2,487,499 | 2,376,281 | 7.0% | 12.0% |
| Checking accounts | 913,661 | 1,170,819 | 789,304 | (22.0%) | 15.8% |
| Savings accounts | 1,720,156 | 1,289,156 | 1,554,031 | 33.4% | 10.7% |
| Other | 26,833 | 27,524 | 32,946 | (2.5%) | (18.6%) |
| Time deposits | 942,050 | 1,454,657 | 1,683,828 | (35.2%) | (44.1%) |
| Time deposits | 759,923 | 1,165,057 | 1,291,628 | (34.8%) | (41.2%) |
| Investment accounts | 182,127 | 289,600 | 392,200 | (37.1%) | (53.6%) |
| % of sight deposits over total private deposits | 74.1% | 63.4% | 58.8% | 1,070 bps | 1,527 bps |
| % of time deposits over total private deposits | 25.9% | 36.6% | 41.2% | (1,070)bps | (1,527)bps |
As observed in previous quarters, deposits were impacted by the effect of inflation. In spite of this, in nominal terms, BBVA Argentina managed to increase the sight deposits and total deposits by 64.0% and 38.9% respectively, while time deposits fell 0.7%. The only line surpassing the level of quarterly inflation was sight deposits.
| PRIVATE DEPOSITS - NON RESTATED FIGURES | BBVA ARGENTINA CONSOLIDATED | ||||
| In millions of AR$ | ∆ % | ||||
| 4Q23 | 3Q23 | 4Q22 | QoQ | YoY | |
| Sight deposits | 2,660,650 | 1,622,755 | 763,082 | 64.0% | 248.7% |
| Time deposits | 942,050 | 948,966 | 540,718 | (0.7%) | 74.2% |
| Total deposits | 3,602,700 | 2,593,867 | 1,313,820 | 38.9% | 174.2% |
As of 4Q23, the Bank’s transactional deposits (checking accounts and savings accounts) represented 72.4% of total non-financial private deposits, totaling $2.6 trillion, versus 61.9% in 3Q23.
| MARKET SHARE - PRIVATE SECTOR DEPOSITS | BBVA ARGENTINA CONSOLIDATED | ||||
| In % | ∆ bps | ||||
| 4Q23 | 3Q23 | 4Q22 | QoQ | YoY | |
| Private sector Deposits - Consolidated* | 6.79% | 7.13% | 6.64% | (34)pbs | 15 pbs |
| Based on daily BCRA information. Capital balance as of the last day of each quarter. | |||||
| * Consolidates PSA, VWFS & Rombo | |||||
Other Sources of Funds
| OTHER SOURCES OF FUNDS | BBVA ARGENTINA CONSOLIDATED | ||||
| In millions of AR$ - Inflation adjusted | ∆ % | ||||
| 4Q23 | 3Q23 | 4Q22 | QoQ | YoY | |
| Other sources of funds | 1,447,177 | 1,190,267 | 1,185,039 | 21.6% | 22.1% |
| Central Bank | 109 | 131 | 274 | (16.8%) | (60.2%) |
| Banks and international organizations | 2,672 | 2,981 | 1,743 | (10.4%) | 53.3% |
| Financing received from local financial institutions | 25,409 | 32,884 | 59,869 | (22.7%) | (57.6%) |
| Corporate bonds | 12,817 | - | 595 | N/A | n.m |
| Equity | 1,406,170 | 1,154,271 | 1,122,558 | 21.8% | 25.3% |
In 4Q23, other sources of funds totaled $1.4 trillion, increasing 21.6% or $256.9 billion QoQ, and 22.1% or $262.1 billion YoY. During 4Q23, installments 5 and 6 of the dividend payment schedule were paid.
| 22 |
| |
The variation in the quarter is mostly explained by the 21.8% increase in equity, due to higher results that accumulate in it, and by an increase in the corporate bonds line (mainly debt taken by the VWFS subsidiary). This was offset by a fall in financing received from local financial institutions taken by consolidated companies.
Liquid Assets
| TOTAL LIQUID ASSETS | BBVA ARGENTINA CONSOLIDATED | ||||
| In millions of AR$ - Inflation adjusted | ∆ % | ||||
| 4Q23 | 3Q23 | 4Q22 | QoQ | YoY | |
| Total liquid assets | 3,318,117 | 3,046,815 | 3,163,129 | 8.9% | 4.9% |
| Cash and deposits in banks | 1,142,950 | 733,239 | 922,672 | 55.9% | 23.9% |
| Debt securities at fair value through P&L | 223,932 | 163,668 | 79,471 | 36.8% | 181.8% |
| Government securities | 223,932 | 163,455 | 33,958 | 37.0% | n.m |
| Liquidity bills of B. C. R. A. | - | 213 | 45,513 | (100.0%) | (100.0%) |
| Net REPO transactions | 1,202,422 | 467,169 | 163,690 | 157.4% | n.m |
| Other debt securities | 748,813 | 1,682,739 | 1,997,296 | (55.5%) | (62.5%) |
| Government securities | 618,556 | 475,432 | 530,509 | 30.1% | 16.6% |
| Liquidity bills of B. C. R. A. | 60,485 | 1,188,529 | 1,460,169 | (94.9%) | (95.9%) |
| Internal bills of B.C.R.A. | 69,772 | 18,778 | 6,618 | 271.6% | n.m |
| Liquid assets / Total Deposits | 91.2% | 76.6% | 77.3% | 1,455 bps | 1,386 bps |
In 4Q23, liquid assets were $3.3 trillion, increasing 8.9% or $271.3 billion versus 3Q23, and 4.9% or $155.0 billion compared to 3Q22. This was mainly driven by an increase in REPO transactions (as explained previously due to total cancellation of LELIQs by the BCRA), and an increase in cash and deposits in banks, especially due to the devaluation of the U.S. dollar reserve requirements.
In the quarter, the liquidity ratio (liquid assets / total deposits) reached 91.2%. Liquidity ratio in local and foreign currency reached 82.6% and 106.9% respectively.
| 23 |
| |
Solvency
| MINIMUM CAPITAL REQUIREMENT | BBVA ARGENTINA CONSOLIDATED | ||||
| In millions of AR$ - Inflation adjusted | ∆ % | ||||
| 4Q23 | 3Q23 | 4Q22 | QoQ | YoY | |
| Minimum capital requirement | 336,644 | 314,784 | 311,898 | 6.9% | 7.9% |
| Credit risk | 222,092 | 225,026 | 219,155 | (1.3%) | 1.3% |
| Market risk | 6,538 | 889 | 4,612 | n.m | 41.8% |
| Operational risk | 90,508 | 88,869 | 88,131 | 1.8% | 2.7% |
| Integrated Capital - RPC (1)* | 1,281,001 | 1,045,149 | 995,353 | 22.6% | 28.7% |
| Ordinary Capital Level 1 ( COn1) | 1,376,618 | 1,139,155 | 1,127,943 | 20.8% | 22.0% |
| Deductible items COn1 | (95,617) | (94,006) | (148,475) | (1.7%) | 35.6% |
| Additional Capital Level 2 (COn2) | - | - | 15,885 | N/A | N/A |
| Excess Capital | |||||
| Integration excess | 944,357 | 730,365 | 683,455 | 29.3% | 38.2% |
| Excess as % of minimum capital requirement | 280.5% | 232.0% | 219.1% | 4,850 bps | 6,139 bps |
| Risk-weighted assets (RWA, according to B.C.R.A. regulation) (2) | 3,908,370 | 3,852,874 | 3,818,928 | 1.4% | 2.3% |
| Regulatory Capital Ratio (1)/(2) | 32.8% | 27.1% | 26.1% | 565 pbs | 671 pbs |
| TIER I Capital Ratio (Ordinary Capital Level 1/ RWA) | 32.8% | 27.1% | 25.6% | 565 pbs | 713 pbs |
| * RPC includes 100% of quarterly results | |||||
BBVA Argentina continues to show strong solvency indicators on 4Q23. Capital ratio reached 32.8%, above 3Q23’s 27.1%. Tier 1 ratio was 32.8% and capital excess over regulatory requirement was $944.4 billion or 280.5%.
Growth in the ratio was mainly driven by an increase in capital mainly due to better OCI results in 4Q23.
It is worth mentioning that since August, the BCRA has issued a clarification where “financial institutions that apply IFRS 9 cannot use what is stated in item 8.2.3.3 on regulation “Minimum capitals for financial institutions (complementary equity calculation including risk loss provisions on portfolios classified as in “normal” situation)”. This is the reason why Additional Capital Level 2 (Con2) is 0, and the capital ratio and tier I ratio have the same value.
| 24 |
| |
BBVA Argentina Asset Management S.A.
| MUTUAL FUNDS ASSETS | BBVA ARGENTINA CONSOLIDATED | ||||
| In millions of AR$ - Inflation adjusted | ∆ % | ||||
| 4Q23 | 3Q23 | 4Q22 | QoQ | YoY | |
| FBA Renta Pesos | 1,234,722 | 1,311,965 | 1,270,069 | (5.9%) | (2.8%) |
| FBA Renta Fija Plus | 20,361 | 14,040 | 6,845 | 45.0% | 197.5% |
| FBA Ahorro Pesos | 15,907 | 13,738 | 6,835 | 15.8% | 132.7% |
| FBA Horizonte | 3,989 | 6,585 | 33,865 | (39.4%) | (88.2%) |
| FBA Calificado | 4,873 | 5,626 | 21,344 | (13.4%) | (77.2%) |
| FBA Acciones Argentinas | 4,313 | 4,162 | 3,242 | 3.6% | 33.0% |
| FBA Acciones Latinoamericanas | 1,995 | 2,960 | 2,195 | (32.6%) | (9.1%) |
| FBA Bonos Argentina | 1,207 | 1,642 | 4,528 | (26.5%) | (73.3%) |
| FBA Bonos Globales | 558 | 782 | 741 | (28.6%) | (24.7%) |
| FBA Renta Mixta | 485 | 682 | 1,202 | (28.9%) | (59.7%) |
| FBA Gestión I | 65 | 87 | 134 | (25.3%) | (51.5%) |
| FBA Horizonte Plus | 16 | 40 | 87 | (60.0%) | (81.6%) |
| FBA Retorno Total I | 13 | 21 | 59 | (38.1%) | (78.0%) |
| FBA Renta Publica I | 11 | 15 | 37 | (26.7%) | (70.3%) |
| FBA Renta Fija Local | 4 | 5 | 9 | (20.0%) | (55.6%) |
| Total assets | 1,288,519 | 1,362,350 | 1,351,192 | (5.4%) | (4.6%) |
| AMASAU Net Income | 296 | 1,772 | 2,969 | (83.3%) | (90.0%) |
| MARKET SHARE - MUTUAL FUNDS | BBVA ASSET MANAGEMENT | ||||
| In % | ∆ bps | ||||
| 4Q23 | 3Q23 | 4Q22 | QoQ | YoY | |
| Mutual funds | 4.78% | 5.58% | 6.23% | (80)bps | (65)bps |
| Source: Cámara Argentina de Fondos Comunes de Inversión | |||||
| 25 |
| |
Other Events
Main Relevant Events
| · | As of November 30, 2023, the Bank was notified of a class action brought by the Argentine Consumer Defense Association ("ADUC"). The Association challenges the collection of the stop-payment fee on checks issued by consumers, and requests not to pay, and refund the money received as fee for the stop-payment to each of the affected clients plus interest and punitive damage. For further information click here. |
| · | As of December 22, 2023, the Bank informed the death of Mr. Gabriel Milstein, member of the Board of Directors. For further information click here. |
| · | As of January 12, 2024, that the Board of Directors decided at its meeting to appoint Mr. Gabriel Alberto Chaufán who was acting as Alternate Director, as Regular Director in replacement of Mr. Gabriel Eugenio Milstein who passed away on December 21, 2023, until the next Annual General Meeting of Shareholders be held, in accordance with Section 10 of the Bylaws. For further information click here. |
| · | As of March 1, 2024, the Board of Directors resolved to renew the possible realization of investment operations to its related part Banco Bilbao Vizcaya Argentaria S.A. The Audit Committee is in favor of such operation, considered generic and comprehensive for all transactions carried out during 2024, which concluded that there were no objections to be raised in this respect and that they could be deemed reasonably adequate to usual and normal market conditions. For further information click here. |
SMEs Productive investment financing credit lines – December 2023
The BCRA established a financing line for productive investments of MSMEs (MiPyMEs, as per its Spanish acronym) aimed at financing CAPEX and/or the construction of the facilities needed for the production and/or marketing of goods and/or services, financing working capital and discounting deferred checks and other instruments, and other special eligible facilities allowed by applicable laws.
The facilities should be granted as part of the 2021/2022, 2022, 2022/2023, 2023 and 2023/2024 Quotas, pursuant to the following conditions:
| Account | 2021/2022 Quota | 2022 Quota | 2022/2023 Quota | 2023 Quota | 2023/2024 Quota |
| Applicable law | “B” 12238 | “B” 12326 | “B” 12413 – “A” 7612 | “B” 12544 – “A” 7720 | "B" 12667 - “A” 7848 |
| Amount to be allocated | At least, the equivalent to 7.5% of the monthly average of daily balances of non-financial private sector deposits in pesos of the previous month at the beginning of the period. | ||||
| Calculations of applications | 1.10.2021 - 31.03.2022 | 1.04.2022 - 30.09.2022 | 1.10.2022 - 31.03.2023 | 1.04.2023 - 30.09.2023 | 1.10.2023 - 31.03.2024 |
| Maximum interest rate | Capped at an annual nominal fixed rate of 35% for investment projects, and at an annual nominal fixed rate of 45.5% for other purposes. | Capped at an annual nominal fixed rate of 64.50% for investment projects, and at an annual nominal fixed rate of 75.50% for other purposes. | Capped at an annual nominal fixed rate of 74.50% for investment projects, and at an annual nominal fixed rate of 86.50% for other purposes. | Capped at an annual nominal fixed rate of 97% for investment projects, and at an annual nominal fixed rate of 109% for other purposes. | |
| Currency | Pesos | ||||
| Minimum term | At the time of disbursement, the credit facilities shall have an average term of at least 24 months, but the total term shall not be of less than 36 months. No minimum term will apply to credit facilities aimed at financing working capital and discounting deferred checks and other instruments. | ||||
As of December 31, 2023, the total amount disbursed by the Entity meets the BCRA requirement. Disbursements are reported below:
| 26 |
| |
| Quota | Minimum amount to be allocated (1) | Simple Average of Daily balances (1) | Disbursed amount (1) |
| 2021/2022 Quota | 32,447,048 | 43,434,402 | 62,449,414 |
| 2022 Quota | 42,867,291 | 63,022,460 | 98,200,990 |
| 2022/2023 Quota | 58,558,806 | 86,880,132 | 127,355,598 |
| 2023 Quota | 84,764,223 | 148,263,325 | 234,048,314 |
| 2023/2024 Quota | 135,740,381 | (*) | (*) |
(*)As of the date of these financial statements, the term reported by Communication “B” 12413 has not expired.
(1) Numbers are expressed in nominal terms.
Main Regulatory Changes
Time deposit rate. LELIQ. Credit card rate. (Communication “A” 7862, 10/12/2023). The BCRA increased the 28-day LELIQ monetary policy rate to 133% APR (prev. 118%), increasing by the same magnitude the minimum time deposit rate for deposits of up to $30 million. For the productive investment credit lines for SMEs, rates will be 112% APR (prev. 97%) and 124% APR (prev. 109%) for working capital. Additionally, it increased the credit card financing rate for individuals as of November 2023 to 122% (107% in September).
Changes in monetary policy rate. (Press Release, 12/18/2023). As of 12/19/2023, the monetary policy rate will be the one-day REPO rate, which has been set to 100% APR (prev. 126% APR) as of 12/13/2023. In aims to rationalize its liquidity management, the Board decided to stop issuing LELIQ, turning REPOs into the main instrument of excess monetary base contraction.
Financing to the non-financial public sector. (Communication “A” 7921, 12/18/2023). The BCRA stated that those securities available for sale to the BCRA through put options will not count in the credit limits to the public sector.
Time deposit minimum rate. (Communication “A” 7922, 12/18/2023). The BCRA kept the minimum interest rate on time deposits at 110% APR. Additionally, the Board considered that it would be necessary that the banking system could continue to offer time deposits linked to inflation (UVA). To give predictability to the availability of funds, it decided to put off the minimum rate of pre-cancelling of these deposits.
“Cuota Simple” Program. (Res 7/2024, 01/22/2024). As of February 1, 2024, and until May 31, 2024, the Cuota Simple Program will replace the “Ahora 12” programs, keeping the possibility of financing purchases in 3 and 6 fixed instalments at 93.5% APR.
Minimum reserve requirements. Cuota Simple. (Communication “A” 7951, 01/25/2024). Financing in pesos for the Cuota Simple program is added as a discount for the minimum reserve requirement in pesos.
| 27 |
| |
Glossary
Active clients: holders of at least one active product. An active product is in most cases a product with at least “one movement” in the last 3 months, or a minimum balance.
APR: Annual Percentage Rate
APY: Annual Percentage Yield
Cost of Risk (accumulated): Year to date accumulated loan loss allowances / Average total loans.
Average total loans: average between previous year-end Total loans and other financing and current period Total loans and other financing.
Cost of Risk (quarterly): Current period Loan loss allowances / Average total loans. Average total loans: average between previous quarter-end Total loans and other financing and current period Total loans and other financing.
Coverage ratio: Quarterly allowances under the Expected Credit Loss model / total non-performing portfolio.
Digital clients: we consider a customer to be an active user of online banking when they have been logged at least once within the last three months using the internet or a cell phone and SMS banking.
Efficiency ratio (Excl. inflation adjustments, accumulated): Accumulated (Personnel benefits+ Administrative expenses + Depreciation & Amortization) / Accumulated (Net Interest Income + Net Fee Income + Net Income from measurement of Financial Instruments at Fair Value through P&L + Net income from write-down of assets at amortized cost and at fair value through OCI + Foreign exchange and gold gains + some concepts included in Other net operating income).
Efficiency ratio (Excl. inflation adjustments, quarterly): (Personnel benefits+ Administrative expenses + Depreciation & Amortization) / (Net Interest Income + Net Fee Income + Net Income from measurement of Financial Instruments at Fair Value through P&L + Net income from write-down of assets at amortized cost and at fair value through OCI + Foreign exchange and gold gains + some concepts included in Other net operating income).
Efficiency ratio (accumulated): Accumulated (Personnel benefits+ Administrative expenses + Depreciation & Amortization) / Accumulated (Net Interest Income + Net Fee Income + Net Income from measurement of Financial Instruments at Fair Value through P&L + Net income from write-down of assets at amortized cost and at fair value through OCI + Foreign exchange and gold gains + some concepts included in Other net operating income+ Income from net monetary position).
Efficiency ratio (quarterly): (Personnel benefits+ Administrative expenses + Depreciation & Amortization) / (Net Interest Income + Net Fee Income + Net Income from measurement of Financial Instruments at Fair Value through P&L + Net income from write-down of assets at amortized cost and at fair value through OCI + Foreign exchange and gold gains + some concepts included in Other net operating income+ Income from net monetary position).
Liquidity Ratio: (Cash and deposits in banks + Debt securities at fair value through P&L (Excl. Private securities) + Net REPO transactions + Other debt securities (Excl. Private securities) / Total Deposits.
Mobile clients: customers who have been active in online banking at least once in the last three months using a mobile device.
Net Interest Margin (NIM) – (quarterly): Quarterly Net Interest Income / Average quarterly interest earning assets.
Public Sector Exposure (excl. BCRA): (National and Provincial Government public debt + Loans to the public sector + REPO transactions) / Total Assets.
| 28 |
| |
ROA (accumulated): Accumulated net Income of the period attributable to owners of the parent / Total Average Assets. Total Average Assets is calculated as the average between total assets on December of the previous year and total assets in the current period, expressed in local currency. Calculated over a 365-day year.
ROA (quarterly): Net Income of the period attributable to owners of the parent / Total Average Assets. Total Average Assets is calculated as the average between total assets on the previous quarter-end and total assets in the current period, expressed in local currency. Calculated over a 365-day year.
ROE (accumulated): Accumulated net Income of the period attributable to owners of the parent / Average Equity. Average Equity is calculated as the average between equity in December of the previous year and equity in the current period, expressed in local currency. Calculated over a 365-day year.
ROE (quarterly): Net Income of the period attributable to owners of the parent / Average Equity. Average Equity is calculated as the average between equity on the previous quarter end and equity in the current period, expressed in local currency. Calculated over a 365-day year.
Spread: (Quarterly Interest Income / Quarterly average Interest-earning Assets) – (Quarterly Interest Expenses / Quarterly average interest-bearing liabilities).
Other terms
n.m.: not meaningful. Implies an increase above 500% and a decrease below -500%.
N/A: not applicable.
Bps: basis points.
| 29 |
| |
Balance Sheet
| BALANCE SHEET | BBVA ARGENTINA CONSOLIDATED | ||||
| In millions of AR$ - Inflation adjusted | ∆ % | ||||
| 4Q23 | 3Q23 | 4Q22 | QoQ | YoY | |
| Assets | |||||
| Cash and deposits in banks | 1,142,950 | 733,239 | 922,672 | 55.9% | 23.9% |
| Cash | 727,271 | 386,681 | 365,765 | 88.1% | 98.8% |
| Financial institutions and correspondents | 415,679 | 346,286 | 556,626 | 20.0% | (25.3%) |
| BCRA | 359,854 | 318,334 | 502,637 | 13.0% | (28.4%) |
| Other local and foreign financial institutions | 55,825 | 27,952 | 53,989 | 99.7% | 3.4% |
| Other | - | 272 | 281 | (100.0%) | (100.0%) |
| Debt securities at fair value through profit or loss | 226,083 | 164,706 | 79,471 | 37.3% | 184.5% |
| Derivatives | 10,002 | 19,778 | 7,063 | (49.4%) | 41.6% |
| Repo transactions | 1,202,422 | 467,169 | 163,690 | 157.4% | n.m |
| Other financial assets | 91,114 | 133,405 | 101,964 | (31.7%) | (10.6%) |
| Loans and other financing | 1,975,497 | 2,073,444 | 2,233,080 | (4.7%) | (11.5%) |
| Non-financial public sector | 145 | 86 | 4 | 68.6% | n.m |
| B.C.R.A | - | - | 28 | N/A | (100.0%) |
| Other financial institutions | 15,451 | 6,944 | 13,178 | 122.5% | 17.2% |
| Non-financial private sector and residents abroad | 1,959,901 | 2,066,414 | 2,219,870 | (5.2%) | (11.7%) |
| Other debt securities | 757,772 | 1,691,780 | 2,008,889 | (55.2%) | (62.3%) |
| Financial assets pledged as collateral | 261,635 | 222,022 | 143,854 | 17.8% | 81.9% |
| Current income tax assets | 160 | 187 | 121 | (14.4%) | 32.2% |
| Investments in equity instruments | 5,211 | 4,559 | 2,922 | 14.3% | 78.3% |
| Investments in subsidiaries and associates | 12,366 | 11,458 | 10,798 | 7.9% | 14.5% |
| Property and equipment | 298,218 | 294,900 | 299,275 | 1.1% | (0.4%) |
| Intangible assets | 33,137 | 31,644 | 29,950 | 4.7% | 10.6% |
| Deferred income tax assets | 2,846 | 3,482 | 4,734 | (18.3%) | (39.9%) |
| Other non-financial assets | 104,245 | 98,043 | 90,748 | 6.3% | 14.9% |
| Non-current assets held for sale | 852 | 826 | 701 | 3.1% | 21.5% |
| Total Assets | 6,124,510 | 5,950,642 | 6,099,932 | 2.9% | 0.4% |
| Liabilities | |||||
| Deposits | 3,639,307 | 3,976,103 | 4,091,312 | (8.5%) | (11.0%) |
| Non-financial public sector | 34,034 | 31,975 | 30,144 | 6.4% | 12.9% |
| Financial sector | 2,573 | 1,972 | 1,059 | 30.5% | 143.0% |
| Non-financial private sector and residents abroad | 3,602,700 | 3,942,156 | 4,060,109 | (8.6%) | (11.3%) |
| Liabilities at fair value through profit or loss | 10,330 | 133 | - | n.m | N/A |
| Derivatives | 2,145 | 3,563 | 1,041 | (39.8%) | 106.1% |
| Other financial liabilities | 448,258 | 322,448 | 368,805 | 39.0% | 21.5% |
| Financing received from the B.C.R.A. and other financial institutions | 28,190 | 35,996 | 61,886 | (21.7%) | (54.4%) |
| Corporate bonds issued | 12,817 | - | 595 | N/A | n.m |
| Current income tax liabilities | 192,167 | 32,982 | 22,571 | 482.6% | n.m |
| Provisions | 20,724 | 16,397 | 26,997 | 26.4% | (23.2%) |
| Deferred income tax liabilities | 23,416 | 42,238 | 20,838 | (44.6%) | 12.4% |
| Other non-financial liabilities | 323,018 | 348,734 | 366,503 | (7.4%) | (11.9%) |
| Total Liabilities | 4,700,372 | 4,778,594 | 4,960,548 | (1.6%) | (5.2%) |
| Equity | |||||
| Share Capital | 613 | 613 | 613 | - | - |
| Non-capitalized contributions | 6,745 | 6,745 | 6,745 | - | - |
| Capital adjustments | 410,521 | 410,521 | 410,521 | - | - |
| Reserves | 650,153 | 650,153 | 544,843 | - | 19.3% |
| Retained earnings | - | - | 34 | N/A | (100.0%) |
| Other accumulated comprehensive income | 173,596 | (29,089) | (23,351) | n.m | n.m |
| Income for the period | 164,542 | 115,328 | 183,153 | 42.7% | (10.2%) |
| Equity attributable to owners of the Parent | 1,406,170 | 1,154,271 | 1,122,558 | 21.8% | 25.3% |
| Equity attributable to non-controlling interests | 17,968 | 17,777 | 16,826 | 1.1% | 6.8% |
| Total Equity | 1,424,138 | 1,172,048 | 1,139,384 | 21.5% | 25.0% |
| Total Liabilities and Equity | 6,124,510 | 5,950,642 | 6,099,932 | 2.9% | 0.4% |
| 30 |
| |
Balance Sheet – Five quarters
| BALANCE SHEET | BBVA ARGENTINA CONSOLIDATED | ||||
| In millions of AR$ - Inflation adjusted | |||||
| 4Q23 | 3Q23 | 2Q23 | 1Q23 | 4Q22 | |
| Assets | |||||
| Cash and deposits in banks | 1,142,950 | 733,239 | 877,511 | 957,045 | 922,672 |
| Cash | 727,271 | 386,681 | 291,587 | 307,122 | 365,765 |
| Financial institutions and correspondents | 415,679 | 346,286 | 484,166 | 649,544 | 556,626 |
| B.C.R.A | 359,854 | 318,334 | 465,573 | 625,480 | 502,637 |
| Other local and foreign financial institutions | 55,825 | 27,952 | 18,593 | 24,064 | 53,989 |
| Other | - | 272 | 101,758 | 379 | 281 |
| Debt securities at fair value through profit or loss | 226,083 | 164,706 | 165,799 | 72,437 | 79,471 |
| Derivatives | 10,002 | 19,778 | 6,737 | 2,880 | 7,063 |
| Repo transactions | 1,202,422 | 467,169 | 363,176 | 361,186 | 163,690 |
| Other financial assets | 91,114 | 133,405 | 187,399 | 99,403 | 101,964 |
| Loans and other financing | 1,975,497 | 2,073,444 | 2,174,309 | 2,184,296 | 2,233,080 |
| Non-financial public sector | 145 | 86 | 8 | 7 | 4 |
| B.C.R.A | - | - | - | - | 28 |
| Other financial institutions | 15,451 | 6,944 | 14,634 | 13,508 | 13,178 |
| Non-financial private sector and residents abroad | 1,959,901 | 2,066,414 | 2,159,667 | 2,170,781 | 2,219,870 |
| Other debt securities | 757,772 | 1,691,780 | 2,100,862 | 1,785,925 | 2,008,889 |
| Financial assets pledged as collateral | 261,635 | 222,022 | 164,350 | 135,899 | 143,854 |
| Current income tax assets | 160 | 187 | 166 | 196 | 121 |
| Investments in equity instruments | 5,211 | 4,559 | 4,802 | 3,107 | 2,922 |
| Investments in subsidiaries and associates | 12,366 | 11,458 | 11,432 | 11,735 | 10,798 |
| Property and equipment | 298,218 | 294,900 | 295,003 | 297,142 | 299,275 |
| Intangible assets | 33,137 | 31,644 | 30,463 | 29,788 | 29,950 |
| Deferred income tax assets | 2,846 | 3,482 | 3,877 | 3,935 | 4,734 |
| Other non-financial assets | 104,245 | 98,043 | 88,744 | 90,936 | 90,748 |
| Non-current assets held for sale | 852 | 826 | 826 | 826 | 701 |
| Total Assets | 6,124,510 | 5,950,642 | 6,475,456 | 6,036,736 | 6,099,932 |
| Liabilities | |||||
| Deposits | 3,639,307 | 3,976,103 | 4,153,402 | 4,021,018 | 4,091,312 |
| Non-financial public sector | 34,034 | 31,975 | 22,744 | 30,796 | 30,144 |
| Financial sector | 2,573 | 1,972 | 3,909 | 2,633 | 1,059 |
| Non-financial private sector and residents abroad | 3,602,700 | 3,942,156 | 4,126,749 | 3,987,589 | 4,060,109 |
| Liabilities at fair value through profit or loss | 10,330 | 133 | - | - | - |
| Derivatives | 2,145 | 3,563 | 975 | 1,332 | 1,041 |
| Other financial liabilities | 448,258 | 322,448 | 575,694 | 339,490 | 368,805 |
| Financing received from the B.C.R.A. and other financial institutions | 28,190 | 35,996 | 57,270 | 47,213 | 61,886 |
| Corporate bonds issued | 12,817 | - | - | - | 595 |
| Current income tax liabilities | 192,167 | 32,982 | 56,711 | 40,861 | 22,571 |
| Provisions | 20,724 | 16,397 | 24,230 | 25,336 | 26,997 |
| Deferred income tax liabilities | 23,416 | 42,238 | 29,647 | 14,507 | 20,838 |
| Other non-financial liabilities | 323,018 | 348,734 | 405,698 | 370,821 | 366,503 |
| Total Liabilities | 4,700,372 | 4,778,594 | 5,303,627 | 4,860,578 | 4,960,548 |
| Equity | |||||
| Share Capital | 613 | 613 | 613 | 613 | 613 |
| Non-capitalized contributions | 6,745 | 6,745 | 6,745 | 6,745 | 6,745 |
| Capital adjustments | 410,521 | 410,521 | 410,521 | 410,521 | 410,521 |
| Reserves | 650,153 | 650,153 | 650,153 | 544,843 | 544,843 |
| Retained earnings | - | - | - | 183,187 | 34 |
| Other accumulated comprehensive income | 173,596 | (29,089) | (14,198) | (24,999) | (23,351) |
| Income for the period | 164,542 | 115,328 | 100,565 | 38,446 | 183,153 |
| Equity attributable to owners of the Parent | 1,406,170 | 1,154,271 | 1,154,399 | 1,159,356 | 1,122,558 |
| Equity attributable to non-controlling interests | 17,968 | 17,777 | 17,430 | 16,802 | 16,826 |
| Total Equity | 1,424,138 | 1,172,048 | 1,171,829 | 1,176,158 | 1,139,384 |
| Total Liabilities and Equity | 6,124,510 | 5,950,642 | 6,475,456 | 6,036,736 | 6,099,932 |
| 31 |
| |
Balance Sheet – Foreign Currency Exposure
| FOREIGN CURRENCY EXPOSURE | BBVA ARGENTINA CONSOLIDATED | ||||
| In millions of AR$ - Inflation adjusted | ∆ % | ||||
| 4Q23 | 3Q23 | 4Q22 | QoQ | YoY | |
| Assets | |||||
| Cash and deposits in banks | 1,076,720 | 674,248 | 773,572 | 59.7% | 39.2% |
| Debt securities at fair value through profit or loss | 225,200 | 121,898 | 10,961 | 84.7% | n.m |
| Other financial assets | 38,278 | 25,372 | 26,342 | 50.9% | 45.3% |
| Loans and other financing | 196,958 | 126,504 | 119,997 | 55.7% | 64.1% |
| Other financial institutions | 4 | 3 | 3 | 33.3% | 33.3% |
| Non-financial private sector and residents abroad | 196,952 | 126,500 | 119,994 | 55.7% | 64.1% |
| Other debt securities | 74,070 | 25,693 | 17,021 | 188.3% | 335.2% |
| Financial assets pledged as collateral | 42,418 | 13,702 | 33,542 | 209.6% | 26.5% |
| Investments in equity instruments | 432 | 248 | 187 | 74.2% | 131.0% |
| Total foreign currency assets | 1,654,076 | 987,665 | 981,622 | 67.5% | 68.5% |
| Liabilities | |||||
| Deposits | 1,281,848 | 795,534 | 890,639 | 61.1% | 43.9% |
| Non-Financial Public Sector | 22,134 | 24,563 | 20,020 | (9.9%) | 10.6% |
| Financial Sector | 632 | 435 | 268 | 45.3% | 135.8% |
| Non-financial private sector and residents abroad | 1,259,082 | 770,536 | 870,351 | 63.4% | 44.7% |
| Other financial liabilities | 79,930 | 44,826 | 68,185 | 78.3% | 17.2% |
| Financing received from the B.C.R.A. and other financial institutions | 3,119 | 3,900 | 3,457 | (20.0%) | (9.8%) |
| Other non financial liabilities | 61,892 | 34,288 | 36,705 | 80.5% | 68.6% |
| Total foreign currency liabilities | 1,426,789 | 878,548 | 998,986 | 62.4% | 42.8% |
| 0 | 0 | 0 | |||
| Foreign Currency Net Position - AR$ | 227,287 | 109,117 | (17,364) | 108.3% | n.m |
| Foreign Currency Net Position - USD | 281 | 312 | (98) | (9.8%) | 386.8% |
| *Wholesale U.S. dollar foreign exchange rates on BCRA’s Communication “A” 3500, as of the end of period. | |||||
| 32 |
| |
Income Statement
| INCOME STATEMENT | BBVA ARGENTINA CONSOLIDATED | ||||
| In millions of AR$ - Inflation adjusted | ∆ % | ||||
| 4Q23 | 3Q23 | 4Q22 | QoQ | YoY | |
| Interest income | 879,638 | 899,637 | 628,160 | (2.2%) | 40.0% |
| Interest expense | (383,921) | (485,396) | (297,845) | 20.9% | (28.9%) |
| Net interest income | 495,717 | 414,241 | 330,315 | 19.7% | 50.1% |
| Fee income | 70,749 | 59,564 | 61,584 | 18.8% | 14.9% |
| Fee expenses | (35,152) | (33,566) | (29,925) | (4.7%) | (17.5%) |
| Net fee income | 35,597 | 25,998 | 31,659 | 36.9% | 12.4% |
| Net income from financial instruments at fair value through P&L | (69,688) | 12,527 | 15,564 | n.m | n.m |
| Net loss from write-down of assets at amortized cost and fair value through OCI | 29,523 | 6,236 | (1,817) | 373.4% | n.m |
| Foreign exchange and gold gains | 197,454 | 3,280 | 1,147 | n.m | n.m |
| Other operating income | 21,698 | 16,331 | 17,051 | 32.9% | 27.3% |
| Loan loss allowances | (20,696) | (11,831) | (22,882) | (74.9%) | 9.6% |
| Net operating income | 689,605 | 466,782 | 371,037 | 47.7% | 85.9% |
| Personnel benefits | (66,717) | (65,020) | (57,075) | (2.6%) | (16.9%) |
| Administrative expenses | (51,159) | (72,574) | (54,200) | 29.5% | 5.6% |
| Depreciation and amortization | (7,545) | (6,700) | (10,432) | (12.6%) | 27.7% |
| Other operating expenses | (86,241) | (66,028) | (57,230) | (30.6%) | (50.7%) |
| Operating expenses | (211,662) | (210,322) | (178,937) | (0.6%) | (18.3%) |
| Operating income | 477,943 | 256,460 | 192,100 | 86.4% | 148.8% |
| Income from associates and joint ventures | 57 | 27 | 371 | 111.1% | (84.6%) |
| Income from net monetary position | (355,500) | (233,109) | (113,786) | (52.5%) | (212.4%) |
| Income before income tax | 122,500 | 23,378 | 78,685 | 424.0% | 55.7% |
| Income tax | (73,883) | (8,225) | (25,436) | n.m | (190.5%) |
| Income for the period | 48,617 | 15,153 | 53,249 | 220.8% | (8.7%) |
| Owners of the parent | 49,214 | 14,763 | 53,989 | 233.4% | (8.8%) |
| Non-controlling interests | (597) | 390 | (740) | (253.1%) | 19.3% |
| Other comprehensive Income (1) | 203,403 | (14,934) | (16,821) | n.m | n.m |
| Total comprehensive income | 252,020 | 219 | 36,428 | n.m | n.m |
| (1) Net of Income Tax. | |||||
| 33 |
| |
Income Statement – 5 quarters
| INCOME STATEMENT | BBVA ARGENTINA CONSOLIDATED | ||||
| In millions of AR$ - Inflation adjusted | |||||
| 4Q23 | 3Q23 | 2Q23 | 1Q23 | 4Q22 | |
| Interest income | 879,638 | 899,637 | 767,191 | 637,481 | 628,160 |
| Interest expense | (383,921) | (485,396) | (383,815) | (301,883) | (297,845) |
| Net interest income | 495,717 | 414,241 | 383,376 | 335,598 | 330,315 |
| Fee income | 70,749 | 59,564 | 68,261 | 56,223 | 61,584 |
| Fee expenses | (35,152) | (33,566) | (19,877) | (27,247) | (29,925) |
| Net fee income | 35,597 | 25,998 | 48,384 | 28,976 | 31,659 |
| Net income from financial instruments at fair value through P&L | (69,688) | 12,527 | 15,323 | 17,850 | 15,564 |
| Net loss from write-down of assets at amortized cost and fair value through OCI | 29,523 | 6,236 | 4,734 | 98 | (1,817) |
| Foreign exchange and gold gains | 197,454 | 3,280 | 6,678 | 2,698 | 1,147 |
| Other operating income | 21,698 | 16,331 | 15,170 | 14,049 | 17,051 |
| Loan loss allowances | (20,696) | (11,831) | (22,936) | (20,920) | (22,882) |
| Net operating income | 689,605 | 466,782 | 450,729 | 378,349 | 371,037 |
| Personnel benefits | (66,717) | (65,020) | (59,951) | (56,413) | (57,075) |
| Administrative expenses | (51,159) | (72,574) | (64,389) | (61,343) | (54,200) |
| Depreciation and amortization | (7,545) | (6,700) | (7,217) | (7,215) | (10,432) |
| Other operating expenses | (86,241) | (66,028) | (60,127) | (51,908) | (57,230) |
| Operating expenses | (211,662) | (210,322) | (191,684) | (176,879) | (178,937) |
| Operating income | 477,943 | 256,460 | 259,045 | 201,470 | 192,100 |
| Income from associates and joint ventures | 57 | 27 | 1,227 | (154) | 371 |
| Income from net monetary position | (355,500) | (233,109) | (160,148) | (145,291) | (113,786) |
| Income before income tax | 122,500 | 23,378 | 100,124 | 56,025 | 78,685 |
| Income tax | (73,883) | (8,225) | (37,376) | (17,604) | (25,436) |
| Income for the period | 48,617 | 15,153 | 62,748 | 38,421 | 53,249 |
| Owners of the parent | 49,214 | 14,763 | 62,120 | 38,445 | 53,989 |
| Non-controlling interests | (597) | 390 | 628 | (24) | (740) |
| Other comprehensive Income (OCI)(1) | 203,403 | (14,934) | 10,801 | (1,648) | (16,821) |
| Total comprehensive income | 252,020 | 219 | 73,549 | 36,773 | 36,428 |
| 34 |
| |
Ratios
| QUARTERLY ANNUALIZED RATIOS | BBVA ARGENTINA CONSOLIDATED | ||||
| In % | ∆ bps | ||||
| 4Q23 | 3Q23 | 4Q22 | QoQ | YoY | |
| Profitability | |||||
| Efficiency Ratio | 46.4% | 82.4% | 53.0% | (3,602)bps | (665)bps |
| ROA | 3.2% | 0.9% | 3.6% | 229 bps | (35)bps |
| ROE | 15.3% | 5.1% | 19.4% | 1,018 bps | (415)bps |
| Liquidity | |||||
| Liquid assets / Total Deposits | 91.2% | 76.6% | 77.3% | 1,455 bps | 1,386 bps |
| Capital | |||||
| Regulatory Capital Ratio | 32.78% | 27.13% | 26.06% | 565 bps | 671 bps |
| TIER I Capital Ratio (Ordinary Capital Level 1/ RWA) | 32.78% | 27.13% | 25.65% | 565 bps | 713 bps |
| Asset Quality | |||||
| Total non-performing portfolio / Total portfolio | 1.29% | 1.42% | 1.13% | (13)bps | 15 bps |
| Allowances /Total non-performing portfolio | 165.30% | 186.27% | 242.23% | (2,097)bps | (7,692)bps |
| Cost of Risk | 3.95% | 2.14% | 4.09% | 181 bps | (13)bps |
| ACCUMULATED ANNUALIZED RATIOS | BBVA ARGENTINA CONSOLIDATED | ||||
| In % | ∆ bps | ||||
| 4Q23 | 3Q23 | 4Q22 | QoQ | YoY | |
| Profitability | |||||
| Efficiency Ratio | 58.6% | 63.8% | 63.9% | (522)bps | (536)bps |
| ROA | 2.7% | 2.6% | 3.0% | 13 bps | (27)bps |
| ROE | 13.0% | 13.5% | 17.5% | (53)bps | (452)bps |
| Liquidity | |||||
| Liquid assets / Total Deposits | 91.2% | 76.6% | 77.3% | 1,455 bps | 1,386 bps |
| Capital | |||||
| Regulatory Capital Ratio | 32.8% | 27.1% | 26.1% | 565 bps | 671 bps |
| TIER I Capital Ratio (Ordinary Capital Level 1/ RWA) | 32.8% | 27.1% | 25.6% | 565 bps | 713 bps |
| Asset Quality | |||||
| Total non-performing portfolio / Total portfolio | 1.29% | 1.42% | 1.13% | (13)bps | 15 bps |
| Allowances /Total non-performing portfolio | 165.30% | 186.27% | 242.23% | (2,097)bps | (7,692)bps |
| Cost of Risk | 3.68% | 3.40% | 2.73% | 28 bps | 95 bps |
| 35 |
| |
About BBVA Argentina
BBVA Argentina (NYSE; BYMA; MAE: BBAR; LATIBEX: XBBAR) is a subsidiary of the BBVA Group, the main shareholder since 1996. In Argentina, it is one of the leading private financial institutions since 1886. Nationwide, BBVA Argentina offers retail and corporate banking to a broad customer base, including: individuals, SME’s, and large-sized companies.
BBVA Argentina’s purpose is to bring the age of opportunities to everyone, based on our customers’ real needs, providing the best solutions, and helping them make the best financial decisions through an easy and convenient experience. The institution relies on solid values: “The customer comes first, We think big and We are one team”. At the same time, its responsible banking model aspires to achieve a more inclusive and sustainable society.
Investor Relations Contact
Carmen Morillo Arroyo
Chief Financial Officer
Inés Lanusse
Investor Relations Officer
Belén Fourcade
Investor Relations
investorelations-arg@bbva.com
ir.bbva.com.ar
| 36 |
SIGNATURES
Pursuant to the requirements of the Securities Exchange Act of 1934, the registrant has duly caused this report to be signed on its behalf by the undersigned, thereunto duly authorized.
| Banco BBVA Argentina S.A. | |||||
| Date: | March 5, 2024 | By: | /s/ Carmen Morillo Arroyo | ||
| Name: | Carmen Morillo Arroyo | ||||
| Title: | Chief Financial Officer | ||||