|
| UNITED STATES |
| SECURITIES AND EXCHANGE COMMISSION |
| Washington, D.C. 20549 |
| |
| FORM N-CSR |
| |
| CERTIFIED SHAREHOLDER REPORT OF REGISTERED |
| MANAGEMENT INVESTMENT COMPANIES |
Investment Company Act file number 811-08062
| |
| Nicholas Equity Income Fund, Inc. |
|
| (Exact Name of Registrant as specified in charter) |
| |
| 411 East Wisconsin Avenue, Suite 2100, Milwaukee, Wisconsin 53202 |
| (Address of Principal Executive Offices) | (Zip Code) |
| |
| Jennifer R. Kloehn, Senior Vice President and Treasurer |
| 411 East Wisconsin Avenue, Suite 2100 |
| Milwaukee, Wisconsin 53202 |
|
| (Name and Address of Agent for Service) |
Registrant's telephone number, including area code: 414-272-4650
Date of fiscal year end: 03/31/2023
Date of reporting period: 03/31/2023
Item 1. Report to Stockholders.
ANNUAL REPORT
March 31, 2023
NICHOLAS EQUITY INCOME
FUND, INC.

WWW.NICHOLASFUNDS.COM
NICHOLAS EQUITY INCOME FUND, INC.
May 2023
Report to Fellow Shareholders:
For the year ended March 31, 2023, Nicholas Equity Income Fund (“Fund”) returned -4.31% versus -7.73% for the Standard & Poor’s 500 Index (“S&P 500”). The primary investment objective of the Fund is to produce reasonable income for the investor. To achieve this objective, the Fund seeks an income yield that exceeds the corporate dividend yield on the securities included in the S&P 500 Index. We are pleased to report as of March 31, 2023, the Fund had a 30-day SEC yield of 2.30%, which exceeds the S&P 500 indicated dividend yield of 1.69%.
Returns for the Fund and selected indices are provided in the chart below for the periods ended March 31, 2023. For all time periods, except the three-year period ended March 31, 2023, the Fund compares favorably to the Morningstar Large Value Category and the Lipper Equity Income Funds Objective. Both benchmarks are more income-oriented, and thus provide meaningful comparisons to the Fund.
| | | | | | | | | | | | | | | |
| | | | | | Average Annual Total Return | |
| | | 1 Year | | | 3 Year | | | 5 Year | | | 10 Year | | | 15 Year | |
| Nicholas Equity Income Fund, Inc. | | -4.31 | % | | 17.19 | % | | 9.63 | % | | 9.31 | % | | 10.14 | % |
| Standard & Poor’s 500 Index | | -7.33 | % | | 18.60 | % | | 11.19 | % | | 12.24 | % | | 10.06 | % |
| Morningstar Large Value Category | | -5.10 | % | | 18.93 | % | | 7.78 | % | | 9.12 | % | | 7.84 | % |
| Lipper Equity Income Funds Objective | | -5.40 | % | | 17.27 | % | | 7.77 | % | | 8.81 | % | | 7.78 | % |
| Consumer Price Index | | | | | | | | | | | | | | | |
| (seasonally adjusted) | | 4.99 | % | | 5.35 | % | | 3.87 | % | | 2.65 | % | | 2.34 | % |
| Ending value of $10,000 invested in | | | | | | | | | | | | | | | |
| Nicholas Equity Income Fund, Inc. | | $9,569 | | | $16,092 | | | $15,834 | | | $24,355 | | | $42,579 | |
| Fund's Expense Ratio: (from 07/29/22 Prospectus): 0.70% | | | | | | | | | | |
Performance data quoted represents past performance and is no guarantee of future results. The investment return and principal value of an investment will fluctuate so that an investor’s shares, when redeemed, may be worth more or less than their original cost. Current performance of the Fund may be lower or higher than the performance quoted. Performance data current to the most recent month-end may be obtained by visiting www.nicholasfunds.com/returns.html.
The Fund's returns are reduced by expenses, while the market indices are not. The ending values above illustrate the performance of a hypothetical $10,000 investment made in the Fund over the timeframes listed. Assumes reinvestment of dividends and capital gains. Returns shown do not reflect the deduction of taxes that a shareholder would pay on Fund distributions or the redemption of Fund shares. These figures do not imply any future performance.
As of March 31, 2023, the Fund held 66 stocks and a cash position of approximately 6%. All stocks in the portfolio have paid dividends during the past period and most have consistently raised their dividends over time. The Fund’s top five holdings were Microsoft, Air Products & Chemicals, Cisco Systems, AbbVie and Unilever PLC. These five holdings accounted for 11.24% of the Fund’s net assets.
For the year end period ended March 31, 2023, stocks that helped the Fund’s performance included Lincoln Electric Holdings, Genuine Parts, Analog Devices, TJX Companies and Merck & Co. Stocks that hindered performance included Fidelity National Information Services, Charles Schwab, Travel + Leisure, Medtronic and PNC Financial Services Group. Relative to the S&P 500, the Fund’s holdings within the consumer discretionary and industrial sectors positively contributed to performance over the past year, whereas holdings within financials and utilities lagged. In terms of industry concentration, healthcare represented approximately 18% of the
portfolio, financials 15%, information technology 15%, consumer staples 12%, industrials 7%, consumer discretionary 6%, materials 6%, utilities 5%, real estate 5%, energy 4%, and communication services 1%.
The year 2022 was only the second time the S&P 500 experienced a decline in total return since the 2008 Great Financial Recession. Persistent inflation and the Federal Reserve’s countermeasures have been the driving forces behind this ongoing downturn. The COVID pandemic's ripple effects, such as the Federal Reserve's accommodative policies, fiscal stimulus of historic proportions, supply chain disruptions, labor shortfalls, and elevated energy costs, have all stirred up an inflationary climate. In response, the Federal Reserve initiated interest rate hikes in March of 2022, maintaining a pace of increase not seen in decades. Compounding the impact of Federal Reserve rate increases on borrowing rates is the recent banking turmoil that has resulted in the failure of three banks. Small- and medium-sized banks, which make up about “50% of U.S. commercial and industrial lending, 60% of residential real estate lending, 80% of commercial real estate lending, and 45% of consumer lending”, are vital to the American economy (Goldman Sachs). As the Federal Reserve raised rates, banks have begun to tighten credit standards and put a cap on loan amounts according to the most recent survey of loan officers. Historically, tightened lending standards, following a Fed rate hike cycle, have invariably signaled an impending recession. In contrast to the past four “soft landings,” where banks were relaxing their lending standards, this is the first instance of concurrent tightening by both the central and commercial banks.
Despite a strong job market reflected by a 3.4% unemployment rate (April 2023), signs of economic deceleration are evident. The Conference Board predicts this sluggishness will worsen and permeate more broadly throughout the American economy in the coming months, potentially triggering a recession by mid-2023. This forecast is tied to sustained inflation and the Federal Reserve’s aggressive stance, projecting real Gross Domestic Product (“GDP”) growth to decelerate to 0.7% in 2023 and then fall 0.4% in 2024. The expectation is for weak earnings in 2023 due to the slowing economy. S&P 500 earnings are projected to grow by a mere 1.2% in 2023. Despite a surprisingly strong start to the year for the S&P 500, management believes the market is appropriately valued at approximately 18x forward earnings, with the risk to downside revisions.
As a result, of this climate of considerable uncertainty, management is focused on companies that boast robust balance sheets and a steady flow of earnings, enabling them to continue paying dividends. Historically, dividends contributed to around 40% of the total returns of common stocks, serving as a buffer against market volatility during bearish phases. In the inflation-heavy 1970s, a period that bears notable resemblances to our current economic scenario, dividends made up a remarkable 72% of total returns. This fact, we believe, further highlights the advantages of a strategy focused on dividend-paying companies.
Our investment approach targets businesses led by management teams which we believe have proven track records of navigating through shifting and uncertain landscapes. In our analysis, these companies must have strong business models, clear competitive edges, and the capacity to yield returns that surpass their cost of capital. We are prepared to seize additional opportunities, as market volatility might present chances to improve the quality of our Fund's portfolio at appealing valuations.
We appreciate your ongoing commitment to the Fund.
Sincerely,

| Michael L. Shelton | David O. Nicholas |
Lead Portfolio Manager | Co-Portfolio Manager |
See important disclosures on the next page.
Opinions expressed are subject to change at any time, are not guaranteed and should not be considered investment advice.
The Fund may invest in small and medium sized companies, which involve additional risks. Small- and medium-capitalization companies tend to have limited liquidity and greater price volatility than large-capitalization companies. Investments in debt securities typically decrease in value when interest rates rise. This risk is usually greater for longer-term debt securities such as limited liquidity and greater volatility. Investment by the Fund in lower-rated and non-rated securities presents a greater risk of loss to principal and interest than higher-rated securities. The fund may invest in REIT’s and Real Estate Securities which involve additional risks related to the real estate industry. The performance of these securities is dependent on the types and locations of the properties owned by the entities issuing the securities and how well the properties are managed.
Earnings growth is not representative of the Fund’s future performance.
Diversification does not assure a profit or protect against loss in a declining market.
Please refer to the schedule of investments in the report for complete fund holdings information. Fund holdings and sector allocations are subject to change and should not be considered a recommendation to buy or sell any security.
The S&P 500 Index is a broad-based unmanaged index of 500 stocks, which is widely recognized as representative of the equity market in general. Each Morningstar Category average represents a universe of Funds with similar investment objectives. The Consumer Price Index (seasonally adjusted) represents changes in prices of all goods and services purchased for consumption by urban households. One cannot invest directly in an index.
Lipper Analytical Services, Inc. is an independent mutual fund research and rating service. Each Lipper average represents a universe of funds with similar investment objectives
Dividend / Indicated Yield: The annual dividends per share divided by the price per share expressed as a percentage.
Forward Price to Earnings (P/E) Ratio is a stock’s current price over its “predicted” earnings per share.
Gross Domestic Product (GDP): The monetary value of all the finished goods and services produced within a country’s borders in a specific time period.
30-day SEC yield: A standardized yield computed by dividing the net investment income per share earned during the past 30-day period by the share price at the end of the period.
There is no guarantee that distributions will be made.
Must be preceded or accompanied by a prospectus.
The Nicholas Funds are distributed by Quasar Distributors, LLC.
Works Cited:
“Stress among Small Banks Is Likely to Slow the US Economy.” Goldman Sachs, 16 Mar. 2023, www.goldmansachs.com/intelligence/pages/stress-among-small-banks-is-likely-to-slow-the-us-economy.html.
COMPARISON OF CHANGE IN VALUE OF $10,000 INVESTMENT IN
NICHOLAS EQUITY INCOME FUND, INC. AND S&P 500 INDEX
The line graph which follows compares the initial account value and subsequent account value at the end of each of the most recently completed ten fiscal years of the Fund to the same investment over the same periods in the S&P 500 Index. The graph assumes a $10,000 investment in the Fund and the index at the beginning of the period.
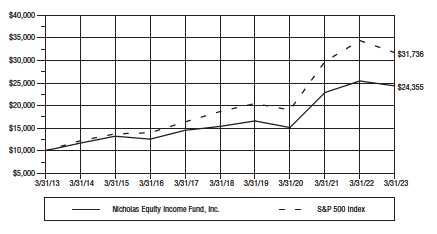
The Fund's average annual total returns for the one-, five- and ten-year periods ended on the last day of the most recent fiscal year are as follows:
| | | | | | |
| | One Year Ended | | Five Years Ended | | Ten Years Ended | |
| | March 31, 2023 | | March 31, 2023 | | March 31, 2023 | |
| Average Annual | | | | | | |
| Total Return | -4.31 | % | 9.63 | % | 9.31 | % |
Past performance is not predictive of future performance, and the above graph and table do not reflect deduction of taxes that a shareholder would pay on Fund distributions or the redemption of Fund shares.
– 4–
Financial Highlights (NSEIX)
For a share outstanding throughout each period
| | | | | | | | | | | | | | | |
| | | | | | Years Ended March 31, | | | | |
| | | 2023 | | | 2022 | | | 2021 | | | 2020 | | | 2019 | |
| NET ASSET VALUE, | | | | | | | | | | | | | | | |
| BEGINNING OF PERIOD. | $ | 21.57 | | $ | 21.75 | | $ | 15.14 | | $ | 18.87 | | $ | 20.50 | |
| INCOME (LOSS) FROM | | | | | | | | | | | | | | | |
| INVESTMENT OPERATIONS | | | | | | | | | | | | | | | |
| Net investment income(1) | | .40 | | | .36 | | | .36 | | | .36 | | | .40 | |
| Net gain (loss) on securities | | | | | | | | | | | | | | | |
| (realized and unrealized) | | (1.35 | ) | | 2.02 | | | 7.23 | | | (1.57 | ) | | .92 | |
| Total from | | | | | | | | | | | | | | | |
| investment operations | | (.95 | ) | | 2.38 | | | 7.59 | | | (1.21 | ) | | 1.32 | |
| LESS DISTRIBUTIONS | | | | | | | | | | | | | | | |
| From net investment income | | (.38 | ) | | (.36 | ) | | (.29 | ) | | (.28 | ) | | (.56 | ) |
| From net capital gain | | (.40 | ) | | (2.20 | ) | | (.69 | ) | | (2.24 | ) | | (2.39 | ) |
| Total distributions | | (.78 | ) | | (2.56 | ) | | (.98 | ) | | (2.52 | ) | | (2.95 | ) |
| NET ASSET VALUE, END OF PERIOD | $ | 19.84 | | $ | 21.57 | | $ | 21.75 | | $ | 15.14 | | $ | 18.87 | |
| |
| TOTAL RETURN | | (4.31 | )% | | 11.23 | % | | 51.18 | % | | (8.80 | )% | | 7.88 | % |
| |
| SUPPLEMENTAL DATA: | | | | | | | | | | | | | | | |
| Net assets, end of period (millions) | $ | 442.0 | | $ | 487.4 | | $ | 459.6 | | $ | 295.9 | | $ | 386.8 | |
| Ratio of expenses to average net assets | | .70 | % | | .70 | % | | .72 | % | | .73 | % | | .73 | % |
| Ratio of net investment income | | | | | | | | | | | | | | | |
| to average net assets | | 2.00 | % | | 1.65 | % | | 1.92 | % | | 1.88 | % | | 2.02 | % |
| Portfolio turnover rate | | 18.75 | % | | 18.11 | % | | 33.58 | % | | 32.04 | % | | 36.76 | % |
| |
| (1) Computed based on average shares outstanding. | | | | | | | | | | | | | |
The accompanying notes to financial statements are an integral part of these highlights.
– 5–
Top Ten Equity Portfolio Holdings
March 31, 2023 (unaudited)
| | |
| | Percentage | |
| Name | of Net Assets | |
| Microsoft Corporation | 2.89 | % |
| Air Products and Chemicals, Inc. | 2.13 | % |
| Cisco Systems, Inc. | 2.12 | % |
| AbbVie, Inc. | 2.07 | % |
| Unilever PLC Sponsored ADR | 2.03 | % |
| Coca-Cola Company | 2.00 | % |
| Analog Devices, Inc. | 2.00 | % |
| Medtronic Plc | 1.99 | % |
| Merck & Co., Inc. | 1.97 | % |
| Sysco Corporation | 1.96 | % |
| Total of top ten | 21.16 | % |
Sector Diversification (as a percentage of portfolio)
March 31, 2023 (unaudited)

– 6–
Fund Expenses
For the six month period ended March 31, 2023 (unaudited)
As a shareholder of the Fund, you incur two types of costs: (1) transaction costs and (2) ongoing costs, including management fees and other operating expenses. The following table is intended to help you understand your ongoing costs (in dollars) of investing in the Fund and to compare these costs with those of other mutual funds.
The example is based on an investment of $1,000 made at the beginning of the period and held for the entire period.
The first line of the table below provides information about the actual account values and actual expenses. You may use the information in this line, together with the amount you invested, to estimate the expenses that you paid over the period. Simply divide your account value by $1,000 (for example, an $8,600 account value divided by $1,000 = 8.6), then multiply the result by the number in the first line under the heading entitled “Expenses Paid During Period” to estimate the expenses you paid on your account during this period.
The second line of the table below provides information about hypothetical account values and hypothetical expenses based on the Fund’s actual expense ratio and an assumed rate of return of 5% per year before expenses, which is not the Fund’s actual return. The hypothetical account values and expenses may not be used to estimate the actual ending account balance or expenses you paid for the period. You may use this information to compare the ongoing costs of investing in the Fund with other funds. To do so, compare this 5% hypothetical example with the 5% hypothetical examples that appear in the shareholder reports of other funds.
Please note that the expenses shown in the table are meant to highlight your ongoing costs only and do not reflect any transactional costs, such as wire fees. Therefore, the second line of the table is useful in comparing ongoing costs only, and will not help you determine the relative total costs of owning different funds. In addition, if these transactional costs were included, your costs would have been higher.
| | | | | | |
| | | Beginning | | Ending | | Expenses Paid |
| | | Account Value | | Account Value | | During Period* |
| | | 09/30/22 | | 03/31/23 | | 10/01/22 – 03/31/23 |
| Actual | | $1,000.00 | | $1,132.00 | | $3.72 |
| Hypothetical | | 1,000.00 | | 1,021.51 | | 3.53 |
| (5% return before expenses) | | | | | | |
|
| * Expenses are equal to the Fund’s six-month annualized expense ratio of 0.70%, |
| multiplied by the average account value over the period, multiplied by 182 then |
| divided by 365 to reflect the one-half year period. | | |
– 7–
Schedule of Investments
March 31, 2023
| | | |
| Shares or | | | |
| Principal | | | |
| Amount | | | Value |
| COMMON STOCK — 93.79% | | |
| | Communication Services – Telecommunication Services — 1.23% | | |
| 139,500 | Verizon Communications Inc. | $ | 5,425,155 |
| | Consumer Discretionary – Consumer Discretionary | | |
| | Distribution & Retail — 4.80% | | |
| 24,800 | Home Depot, Inc. | | 7,318,976 |
| 105,000 | LKQ Corporation | | 5,959,800 |
| 101,500 | TJX Companies Inc | | 7,953,540 |
| | | | 21,232,316 |
| | Consumer Discretionary – Consumer Durables & Apparel — 1.08% | | |
| 87,500 | M.D.C. Holdings, Inc. | | 3,401,125 |
| 110,000 | Newell Brands Inc | | 1,368,400 |
| | | | 4,769,525 |
| | Consumer Discretionary – Consumer Services — 0.49% | | |
| 8,646 | Cedar Fair, L.P. | | 395,036 |
| 45,000 | Travel + Leisure Co. | | 1,764,000 |
| | | | 2,159,036 |
| Consumer Staples – Consumer Staples Distribution & Retail — 3.44% | | |
| 112,000 | Sysco Corporation | | 8,649,760 |
| 39,500 | Target Corporation | | 6,542,385 |
| | | | 15,192,145 |
| | Consumer Staples – Food, Beverage & Tobacco — 4.78% | | |
| 142,500 | Coca-Cola Company | | 8,839,275 |
| 101,500 | Mondelez International, Inc. Class A | | 7,076,580 |
| 53,500 | Philip Morris International Inc. | | 5,202,875 |
| | | | 21,118,730 |
| | Consumer Staples – Household & Personal Products — 3.83% | | |
| 53,500 | Procter & Gamble Company | | 7,954,915 |
| 173,000 | Unilever PLC Sponsored ADR | | 8,983,890 |
| | | | 16,938,805 |
| | Energy – Energy — 3.53% | | |
| 48,000 | Chevron Corporation | | 7,831,680 |
| 41,000 | ConocoPhillips | | 4,067,610 |
| 119,100 | Enterprise Products Partners L.P. | | 3,084,690 |
| 20,183 | Williams Companies, Inc. | | 602,664 |
| | | | 15,586,644 |
The accompanying notes to financial statements are an integral part of this schedule.
– 8–
Schedule of Investments (continued)
March 31, 2023
| | | |
| Shares or | | | |
| Principal | | | |
| Amount | | | Value |
| COMMON STOCK — 93.79% (continued) | | |
| | Financials – Banks — 4.27% | | |
| 61,500 | JPMorgan Chase & Co. | $ | 8,014,065 |
| 52,800 | PNC Financial Services Group, Inc. | | 6,710,880 |
| 43,465 | U.S. Bancorp | | 1,566,913 |
| 65,000 | Webster Financial Corporation | | 2,562,300 |
| | | | 18,854,158 |
| | Financials – Financial Services — 8.91% | | |
| 7,950 | BlackRock, Inc. | | 5,319,504 |
| 37,500 | CME Group Inc. Class A | | 7,182,000 |
| 50,500 | Cohen & Steers, Inc. | | 3,229,980 |
| 128,500 | Fidelity National Information Services, Inc. | | 6,981,405 |
| 62,000 | Northern Trust Corporation | | 5,464,060 |
| 49,500 | Raymond James Financial, Inc. | | 4,616,865 |
| 126,000 | Charles Schwab Corp | | 6,599,880 |
| | | | 39,393,694 |
| | Financials – Insurance — 1.93% | | |
| 44,000 | Chubb Limited | | 8,543,920 |
| | Health Care – Health Care Equipment & Services — 7.28% | | |
| 84,500 | Abbott Laboratories | | 8,556,470 |
| 90,800 | CVS Health Corporation | | 6,747,348 |
| 109,000 | Medtronic Plc | | 8,787,580 |
| 27,500 | Quest Diagnostics Incorporated | | 3,890,700 |
| 150,000 | Smith & Nephew plc Sponsored ADR | | 4,186,500 |
| | | | 32,168,598 |
| | Health Care – Pharmaceuticals, Biotechnology | | |
| | & Life Sciences — 11.15% | | |
| 57,500 | AbbVie, Inc. | | 9,163,775 |
| 120,000 | Astrazeneca PLC Sponsored ADR | | 8,329,200 |
| 185,000 | GSK plc Sponsored ADR | | 6,582,300 |
| 55,500 | Johnson & Johnson | | 8,602,500 |
| 82,000 | Merck & Co., Inc. | | 8,723,980 |
| 220,000 | Perrigo Co. Plc | | 7,891,400 |
| | | | 49,293,155 |
| | Industrials – Capital Goods — 6.10% | | |
| 43,500 | Eaton Corp. Plc | | 7,453,290 |
| 29,500 | Honeywell International Inc. | | 5,638,040 |
| 13,500 | Illinois Tool Works Inc. | | 3,286,575 |
| 44,500 | Lincoln Electric Holdings, Inc. | | 7,524,950 |
| 6,500 | Lockheed Martin Corporation | | 3,072,745 |
| | | | 26,975,600 |
The accompanying notes to financial statements are an integral part of this schedule.
– 9–
Schedule of Investments (continued)
March 31, 2023
| | | |
| Shares or | | | |
| Principal | | | |
| Amount | | | Value |
| COMMON STOCK — 93.79% (continued) | | |
| | Industrials – Transportation — 0.82% | | |
| 18,000 | Union Pacific Corporation | $ | 3,622,680 |
| | Information Technology – Semiconductors | | |
| | & Semiconductor Equipment — 5.74% | | |
| 44,715 | Analog Devices, Inc. | | 8,818,692 |
| 12,805 | Broadcom Inc. | | 8,214,920 |
| 99,360 | Microchip Technology Incorporated | | 8,324,381 |
| | | | 25,357,993 |
| | Information Technology – Software & Services — 4.79% | | |
| 46,000 | International Business Machines Corporation | | 6,030,140 |
| 44,250 | Microsoft Corporation | | 12,757,275 |
| 25,895 | Oracle Corporation | | 2,406,163 |
| | | | 21,193,578 |
| Information Technology – Technology Hardware & Equipment — 4.06% | | |
| 179,000 | Cisco Systems, Inc. | | 9,357,225 |
| 250,000 | Juniper Networks, Inc. | | 8,605,000 |
| | | | 17,962,225 |
| | Materials – Materials — 5.88% | | |
| 32,750 | Air Products and Chemicals, Inc. | | 9,406,128 |
| 31,500 | Avery Dennison Corporation | | 5,636,295 |
| 87,500 | Ball Corporation | | 4,822,125 |
| 85,500 | DuPont de Nemours, Inc. | | 6,136,335 |
| | | | 26,000,883 |
| | Real Estate – Equity Real Estate Investment Trusts (REITs) — 4.78% | | |
| 32,500 | American Tower Corporation | | 6,641,050 |
| 10,750 | Equinix, Inc. | | 7,751,180 |
| 86,800 | W. P. Carey Inc. | | 6,722,660 |
| | | | 21,114,890 |
| | Utilities – Utilities — 4.90% | | |
| 119,000 | CMS Energy Corporation | | 7,304,220 |
| 101,500 | NextEra Energy, Inc. | | 7,823,620 |
| 69,000 | WEC Energy Group Inc | | 6,540,510 |
| | | | 21,668,350 |
| | TOTAL COMMON STOCK | | |
| | (cost $317,292,341) | | 414,572,080 |
The accompanying notes to financial statements are an integral part of this schedule.
– 10 –
Schedule of Investments (continued)
March 31, 2023
| | | | |
| | Shares or | | | |
| | Principal | | | |
| | Amount | | | Value |
| SHORT-TERM INVESTMENTS – 6.08% | | |
| | | U.S. Government Securities — 4.96% | | |
| $ | 5,000,000 | U.S. Treasury Bill 1.558% 04/04/2023 | $ | 4,999,362 |
| | 5,000,000 | U.S. Treasury Bill 4.079% 04/18/2023 | | 4,990,518 |
| | 5,000,000 | U.S. Treasury Bill 4.417% 05/04/2023 | | 4,980,108 |
| | 2,000,000 | U.S. Treasury Bill 4.561% 05/18/2023 | | 1,988,323 |
| | 5,000,000 | U.S. Treasury Bill 4.488% 06/01/2023 | | 4,962,777 |
| | | | | 21,921,088 |
| | | Money Market Fund — 1.12% | | |
| | 4,974,981 | Morgan Stanley Liquidity Funds Government Portfolio | | |
| | | (Institutional Class) 7-day net yield, 4.75% | | 4,974,981 |
| | | TOTAL SHORT-TERM INVESTMENTS | | |
| | | (cost $26,894,920) | | 26,896,069 |
| | | TOTAL INVESTMENTS | | |
| | | (cost $344,187,261) — 99.87% | | 441,468,149 |
| | | OTHER ASSETS, NET OF LIABILITIES — 0.13% | | 553,658 |
| | | TOTAL NET ASSETS | | |
| | | (basis of percentages disclosed above) — 100% | $ | 442,021,807 |
The accompanying notes to financial statements are an integral part of this schedule.
– 11 –
Statement of Assets and Liabilities
March 31, 2023
| | |
| ASSETS | | |
| Investments in securities at value (cost $344,187,261) | $ | 441,468,149 |
| Receivables — | | |
| Dividend and interest | | 819,056 |
| Capital stock subscription | | 18,257 |
| Total receivables | | 837,313 |
| Other | | 26,872 |
| Total assets | | 442,332,334 |
| |
| LIABILITIES | | |
| Payables — | | |
| Due to adviser — | | |
| Management fee | | 225,607 |
| Accounting and administrative fee | | 6,088 |
| Total due to adviser | | 231,695 |
| Capital stock redemption | | 18,743 |
| Other payables and accrued expense | | 60,089 |
| Total liabilities | | 310,527 |
| Total net assets | $ | 442,021,807 |
| |
| NET ASSETS CONSIST OF | | |
| Paid in capital | $ | 336,205,182 |
| Accumulated distributable earnings | | 105,816,625 |
| Total net assets | $ | 442,021,807 |
| |
| NET ASSET VALUE PER SHARE ($.0001 par value, | | |
| 250,000,000 shares authorized), offering price | | |
| and redemption price (22,281,259 shares outstanding) | $ | 19.84 |
The accompanying notes to financial statements are an integral part of this statement.
– 12 –
Statement of Operations
For the year ended March 31, 2023
| | | |
| INCOME | | | |
| Dividend | $ | 11,346,599 | |
| Interest | | 730,943 | |
| Total income | | 12,077,542 | |
| |
| EXPENSES | | | |
| Management fee | | 2,729,688 | |
| Accounting and administrative fees | | 113,405 | |
| Transfer agent fees | | 90,341 | |
| Registration fees | | 50,136 | |
| Audit and tax fees | | 36,748 | |
| Directors’ fees | | 23,130 | |
| Custodian fees | | 22,266 | |
| Insurance | | 15,708 | |
| Legal fees | | 14,686 | |
| Accounting system and pricing service fees | | 13,660 | |
| Printing | | 12,029 | |
| Postage and mailing | | 6,576 | |
| Other operating expenses | | 11,079 | |
| Total expenses | | 3,139,452 | |
| Net investment income | | 8,938,090 | |
| |
| NET REALIZED GAIN ON INVESTMENTS | | 9,443,109 | |
| |
| CHANGE IN NET UNREALIZED APPRECIATION/DEPRECIATION | | | |
| ON INVESTMENTS | | (39,980,133 | ) |
| Net realized and unrealized gain on investments | | (30,537,024 | ) |
| Net decrease in net assets resulting from operations | $ | (21,598,934 | ) |
The accompanying notes to financial statements are an integral part of this statement.
– 13 –
Statements of Changes in Net Assets
For the years ended March 31, 2023 and 2022
| | | | | | |
| | | 2023 | | | 2022 | |
| INCREASE (DECREASE) IN NET ASSETS | | | | | | |
| FROM OPERATIONS | | | | | | |
| Net investment income | $ | 8,938,090 | | $ | 8,038,846 | |
| Net realized gain on investments | | 9,443,109 | | | 32,543,996 | |
| Change in net unrealized appreciation/depreciation | | | | | | |
| on investments | | (39,980,133 | ) | | 10,411,664 | |
| Net increase (decrease) in net assets | | | | | | |
| resulting from operations | | (21,598,934 | ) | | 50,994,506 | |
| |
| DISTRIBUTIONS TO SHAREHOLDERS FROM | | | | | | |
| Investment operations | | (17,571,701 | ) | | (54,978,307 | ) |
| |
| CAPITAL SHARE TRANSACTIONS | | | | | | |
| Proceeds from shares issued | | | | | | |
| (590,671 and 1,178,040 shares, respectively) | | 11,700,043 | | | 25,936,012 | |
| Reinvestment of distributions | | | | | | |
| (743,326 and 2,166,520 shares, respectively) | | 14,523,067 | | | 47,131,143 | |
| Cost of shares redeemed | | | | | | |
| (1,648,567 and 1,873,879 shares, respectively) | | (32,388,817 | ) | | (41,290,951 | ) |
| Change in net assets derived | | | | | | |
| from capital share transactions | | (6,165,707 | ) | | 31,776,204 | |
| Total increase (decrease) in net assets | | (45,336,342 | ) | | 27,792,403 | |
| |
| NET ASSETS | | | | | | |
| Beginning of period | | 487,358,149 | | | 459,565,746 | |
| End of period | $ | 442,021,807 | | $ | 487,358,149 | |
The accompanying notes to financial statements are an integral part of these statements.
– 14 –
Notes to Financial Statements
March 31, 2023
(1) Summary of Significant Accounting Policies —
Nicholas Equity Income Fund, Inc. (the “Fund”) is organized as a Maryland corporation and is registered as an open-end, diversified management investment company under the Investment Company Act of 1940, as amended. The primary objective of the Fund is to produce reasonable income with moderate long-term growth. The following is a summary of the significant accounting policies of the Fund: (a) Equity securities traded on a stock exchange will ordinarily be valued on the basis of the last sale price on the date of valuation on the securities principal exchange, or if in the absence of any sale on that day, the closing bid price. For securities principally traded on the NASDAQ market, the Fund uses the NASDAQ Official Closing Price. Investments in shares of open-end mutual funds, including money market funds, are valued at their daily net asset value. Debt securities, excluding short-term investments, are valued at their current evaluated bid price as determined by an independent pricing service, which generates evaluations on the basis of dealer quotes for normal institutional-sized trading units, issuer analysis, bond market activity and various other factors. Short-term investments are valued using evaluated bid prices. Securities for which market quotations may not be readily available are valued at their fair value as determined in good faith by procedures adopted by the Board of Directors. The Board of Directors has delegated fair value responsibilities to Nicholas Company, Inc., the Fund’s adviser.
The Fund did not maintain any positions in derivative instruments or engage in hedging activities during the year. Investment transactions for financial statement purposes are recorded on trade date.
In accordance with Accounting Standards Codification (“ASC”) 820-10, “Fair Value Measurement” (“ASC 820-10”), fair value is defined as the price that the Fund would receive upon selling an investment in a timely transaction to an independent buyer in the principal or most advantageous market of the investment. ASC 820-10 established a three-tier hierarchy to maximize the use of observable market data and minimize the use of unobservable inputs and to establish classification of fair value measurements for disclosure purposes. Inputs refer broadly to the assumptions that market participants would use in pricing the asset or liability, including assumptions about risk, for example, the risk inherent in a particular valuation technique used to measure fair value such as a pricing model and/or the risk inherent in the inputs to the valuation technique. Inputs may be observable or unobservable. Observable inputs are inputs that reflect the assumptions market participants would use in pricing the asset or liability based on market data obtained from sources independent of the reporting entity. Unobservable inputs are inputs that reflect the reporting entity’s own assumptions about the assumptions market participants would use in pricing the asset or liability based on the best information available in the circumstances. The three-tier hierarchy of inputs is summarized in the three broad levels listed below.
Level 1 – quoted prices in active markets for identical investments
Level 2 – other significant observable inputs (including quoted prices for similar investments, interest rates, benchmark yields, bids, offers,
– 15 –
Notes to Financial Statements (continued)
March 31, 2023
transactions, spreads and other relationships observed in the markets among market securities, underlying equity of the issuer, proprietary pricing models, credit risk, etc.)
Level 3 – significant unobservable inputs (including the Fund’s own assumptions in determining the fair value of investments) The inputs or methodology used for valuing securities are not necessarily an indication of the risk associated with investing in those securities.
The following is a summary of the inputs used as of March 31, 2023 in valuing the Fund’s investments carried at value:
| | |
| | | Investments |
| Valuation Inputs | | in Securities |
| Level 1 — | | |
| Common Stocks(1) | $ | 414,572,080 |
| Money Market Fund | | 4,974,981 |
| Level 2 — | | |
| U.S. Government Securities | | 21,921,088 |
| Level 3 — | | |
| None | | — |
| Total | $ | 441,468,149 |
| (1) See Schedule of Investments for further detail by industry. | | |
The Fund did not hold any Level 3 investments during the year.
(b) Net realized gain (loss) on portfolio securities was computed on the basis of specific identification.
(c) Dividend income is recorded on the ex-dividend date, and interest income is recognized on an accrual basis. Non-cash dividends, if any, are recorded at value on date of distribution. Generally, discounts and premiums on long-term debt security purchases, if any, are amortized over the expected lives of the respective securities using the effective yield method.
(d) Provision has not been made for federal income taxes or excise taxes since the Fund has elected to be taxed as a “regulated investment company” and intends to distribute substantially all net investment income and net realized capital gains on sales of investments to its shareholders and otherwise comply with the provisions of Subchapter M of the Internal Revenue Code applicable to regulated investment companies.
(e) Dividends and distributions paid to shareholders are recorded on the ex-dividend date. Distributions from net investment income are generally declared and paid at least quarterly. Distributions of net realized capital gain, if any, are declared and paid at least annually.
The amount of distributions from net investment income and net realized capital gain are determined in accordance with federal income tax regulations, which may differ from U.S. generally accepted accounting principles (“U.S. GAAP”) for
– 16 –
Notes to Financial Statements (continued)
March 31, 2023
financial reporting purposes. Financial reporting records are adjusted for permanent book-to-tax differences to reflect tax character. These reclassifications have no effect on net assets or net asset value per share. At March 31, 2023, reclassifications were recorded to decrease undistributed ordinary income by $40,218, increase accumulated distributed net realized gain by $41,238, and decrease paid in capital by $1,020.
The tax character of distributions paid during the years ended March 31, 2023 and 2022 was as follows:
| | | | |
| | | 03/31/2023 | | 03/31/2022 |
| Distributions paid from: | | | | |
| Ordinary income | $ | 8,485,907 | $ | 7,879,246 |
| Long-term capital gain | | 9,085,794 | | 47,099,061 |
| Total distributions paid | $ | 17,571,701 | $ | 54,978,307 |
As of March 31, 2023, investment cost for federal tax purposes was $342,807,812 and the tax basis components of net assets were as follows:
| | | |
| Unrealized appreciation | $ | 110,714,942 | |
| Unrealized depreciation | | (12,054,605 | ) |
| Net unrealized appreciation | | 98,660,337 | |
| Undistributed ordinary income | | 2,501,355 | |
| Accumulated net realized capital gain | | 9,482,412 | |
| Other temporary differences | | (4,827,479 | ) |
| Paid in capital | | 336,205,182 | |
| Net assets | $ | 442,021,807 | |
The difference between financial statement and tax-basis cost is attributable primarily to holdings in partnership interests.
The Fund had no material uncertain tax positions and has not recorded a liability for unrecognized tax benefits as of March 31, 2023. Also, the Fund recognized no interest and penalties related to uncertain tax benefits during the year ended March 31, 2023. At March 31, 2023, the fiscal years 2020 through 2023 remain open to examination in the Fund’s major tax jurisdictions.
(f) The Fund is considered an investment company under U.S. GAAP and follows the accounting and reporting guidance applicable to investment companies in the Financial Accounting Standards Board (“FASB”) ASC 946, “Financial Services –Investment Companies.” U.S. GAAP guidance requires management to make estimates and assumptions that effect the amounts reported in the financial statements and accompanying notes. Actual results could differ from estimates.
(g) In the normal course of business the Fund enters into contracts that contain general indemnification clauses. The Fund’s maximum exposure under these arrangements is unknown, as this would involve future claims against the Fund that have not yet occurred. Based on experience, the Fund expects the risk of loss to be remote.
– 17 –
Notes to Financial Statements (continued)
March 31, 2023
(h) In connection with the preparation of the Fund’s financial statements, management evaluated subsequent events after the date of the Statement of Assets and Liabilities of March 31, 2023. There have been no material subsequent events since March 31, 2023 through the date the financial statements were issued that would require adjustment to or additional disclosure in these financial statements.
(2) Related Parties —
(a) Investment Adviser and Management Agreement —
The Fund has an agreement with Nicholas Company, Inc. (with whom certain officers and directors of the Fund are affiliated) (the “Adviser”) to serve as investment adviser and manager. Under the terms of the agreement, a monthly fee is paid to the Adviser based on an annualized fee of 0.70% of the average net asset value up to and including $50 million and 0.60% of the average net asset value in excess of $50 million.
The Adviser may be paid for accounting and administrative services rendered by its personnel, subject to the following guidelines: (i) up to five basis points, on an annual basis, of the average net asset value of the Fund up to and including $2 billion and up to three basis points, on an annual basis, of the average net asset value of the Fund greater than $2 billion, based on the average net asset value of the Fund as determined by valuations made at the close of each business day of each month, and (ii) where the preceding calculation results in an annual payment of less than $50,000, the Adviser, in its discretion, may charge the Fund up to $50,000 for such services.
(b) Legal Counsel —
A director of the Adviser is affiliated with a law firm that provides services to the Fund. The Fund incurred expenses of $7,253 for the year ended March 31, 2023 for legal services rendered by this law firm.
(3) Investment Transactions —
For the year ended March 31, 2023, the cost of purchases and the proceeds from sales of investment securities, other than short-term obligations, aggregated $78,962,505 and $101,118,368, respectively.
– 18 –
Report of Independent Registered Public
Accounting Firm
To the shareholders and the Board of Directors of Nicholas Equity Income Fund, Inc.
Opinion on the Financial Statements and Financial Highlights
We have audited the accompanying statement of assets and liabilities of Nicholas Equity Income Fund, Inc. (the “Fund”), including the schedule of investments, as of March 31, 2023, the related statements of operations for the year then ended, the statements of changes in net assets for each of the two years in the period then ended, the financial highlights for each of the five years in the period then ended, and the related notes. In our opinion, the financial statements and financial highlights present fairly, in all material respects, the financial position of the Fund as of March 31, 2023, and the results of its operations for the year then ended, the changes in its net assets for each of the two years in the period then ended, and the financial highlights for each of the five years in the period then ended, in conformity with accounting principles generally accepted in the United States of America.
Basis for Opinion
These financial statements and financial highlights are the responsibility of the Fund’s management. Our responsibility is to express an opinion on the Fund’s financial statements and financial highlights based on our audits. We are a public accounting firm registered with the Public Company Accounting Oversight Board (United States) (PCAOB) and are required to be independent with respect to the Fund in accordance with the U.S. federal securities laws and the applicable rules and regulations of the Securities and Exchange Commission and the PCAOB.
We conducted our audits in accordance with the standards of the PCAOB. Those standards require that we plan and perform the audit to obtain reasonable assurance about whether the financial statements and financial highlights are free of material misstatement, whether due to error or fraud. The Fund is not required to have, nor were we engaged to perform, an audit of its internal control over financial reporting. As part of our audits we are required to obtain an understanding of internal control over financial reporting but not for the purpose of expressing an opinion on the effectiveness of the Fund’s internal control over financial reporting. Accordingly, we express no such opinion.
Our audits included performing procedures to assess the risks of material misstatement of the financial statements and financial highlights, whether due to error or fraud, and performing procedures that respond to those risks. Such procedures included examining, on a test basis, evidence regarding the amounts and disclosures in the financial statements and financial highlights. Our audits also included evaluating the accounting principles used and significant estimates made by management, as well as evaluating the overall presentation of the financial statements and financial highlights. Our procedures included confirmation of securities owned as of March 31, 2023, by correspondence with the custodian. We believe that our audits provide a reasonable basis for our opinion.

Milwaukee, Wisconsin
May 26, 2023
We have served as the auditor of one or more Nicholas investment companies since 1977.
– 19 –
Historical Record
(unaudited)
| | | | | | | | | | | |
| | | | | Net | | | | | | | |
| | | | | Investment | | | | | Dollar | | Growth of |
| | | Net | | Income | | | Capital Gain | | Weighted | | an Initial |
| | | Asset Value | | Distributions | | | Distributions | | Price/Earnings | | $10,000 |
| | | Per Share | | Per Share(2) | | | Per Share(2) | | Ratio(3) | | Investment(4) |
| November 23, 1993(1) | $ | 10.00 | $ | — | | $ | — | | — | $ | 10,000 |
| March 31, 1994 | | 10.04 | | 0.0133 | | | — | | 14.4 times | | 10,053 |
| March 31, 1995 | | 10.56 | | 0.2810 | | | — | | 14.6 | | 10,871 |
| March 31, 1996 | | 12.35 | | 0.3370 | | | — | | 16.8 | | 13,111 |
| March 31, 1997 | | 12.27 | | 0.4527 | | | 0.5483 | | 15.9 | | 14,138 |
| March 31, 1998 | | 14.35 | | 0.5014 | | | 0.6586 | | 23.0 | | 18,072 |
| March 31, 1999 | | 12.32 | | 0.4843 | | | 0.3278 | | 22.0 | | 16,509 |
| March 31, 2000 | | 11.10 | | 0.4447 | | | 0.2392 | | 20.6 | | 15,816 |
| March 31, 2001 | | 11.20 | | 0.1980 | | | — | | 21.0 | | 16,250 |
| March 31, 2002 | | 12.66 | | 0.1697 | | | — | | 22.4 | | 18,642 |
| March 31, 2003 | | 9.02 | | 0.1920 | | | — | | 15.6 | | 13,531 |
| March 31, 2004 | | 12.45 | | 0.1486 | | | — | | 16.1 | | 18,933 |
| March 31, 2005 | | 13.58 | | 0.2120 | | | — | | 21.0 | | 20,995 |
| March 31, 2006 | | 13.66 | | 0.3843 | | | 0.4259 | | 16.8 | | 22,456 |
| March 31, 2007 | | 15.98 | | 0.3663 | | | 0.2138 | | 17.0 | | 27,307 |
| March 31, 2008 | | 12.59 | | 0.3377 | | | 2.0340 | | 18.2 | | 25,247 |
| March 31, 2009 | | 8.64 | | 0.4188 | | | — | | 11.6 | | 17,989 |
| March 31, 2010 | | 13.64 | | 0.3167 | | | — | | 17.7 | | 29,211 |
| March 31, 2011 | | 15.98 | | 0.3017 | | | 0.0041 | | 19.4 | | 34,949 |
| March 31, 2012 | | 15.61 | | 0.4843 | | | 0.5318 | | 18.5 | | 36,470 |
| March 31, 2013 | | 17.93 | | 0.4658 | | | 0.3584 | | 22.3 | | 44,139 |
| March 31, 2014 | | 19.68 | | 0.4076 | | | 0.8054 | | 19.1 | | 51,554 |
| March 31, 2015 | | 20.99 | | 0.4294 | | | 0.7468 | | 22.4 | | 58,325 |
| March 31, 2016 | | 18.65 | | 0.4226 | | | 0.8980 | | 15.4 | | 55,455 |
| March 31, 2017 | | 20.70 | | 0.3615 | | | 0.3955 | | 18.6 | | 64,090 |
| March 31, 2018 | | 20.50 | | 0.5324 | | | 0.8782 | | 19.1 | | 67,893 |
| March 31, 2019 | | 18.87 | | 0.5634 | | | 2.3904 | | 17.6 | | 73,247 |
| March 31, 2020 | | 15.14 | | 0.2772 | | | 2.2405 | | 16.3 | | 66,803 |
| March 31, 2021 | | 21.75 | | 0.2839 | | | 0.6929 | | 23.7 | | 100,994 |
| March 31, 2022 | | 21.57 | | 0.3630 | | | 2.1970 | | 19.3 | | 112,341 |
| March 31, 2023 | | 19.84 | | 0.3760 | (a) | | 0.4038 | (b) | 17.8 | | 107,502 |
| (1) | Date of Initial Public Offering. |
| (2) | Rounded. |
| (3) | Based on latest 12 months accomplished earnings. |
| (4) | Assuming reinvestment of all distributions. |
| |
| (a) | Paid $0.0930 on May 11, 2022 to shareholders of record on May 10, 2022. Paid $0.0926 on August 3, 2022 to shareholders of record on August 2, 2022. |
| | Paid $0.0968 on October 26, 2022 to shareholders of record on October 25, 2022. |
| | Paid $0.09356656 on December 28, 2022 to shareholders of record on December 27, 2022. |
| (b) | Paid $0.4038 on May 11, 2022 to shareholders of record on May 10, 2022. |
– 20 –
Approval of Investment Advisory Contract
(unaudited)
A discussion of the Approval by the Board of Directors of the Fund’s Investment Advisory Contract can be found in the Fund’s Semiannual Report dated September 30, 2022.
Liquidity Risk Management Program
(unaudited)
The Fund has adopted and implemented a liquidity risk management program (the “Program”) in accordance with Rule 22e-4 under the 1940 Act. The Program seeks to assess and manage the Fund’s liquidity risk, i.e., the risk that the Fund is unable to satisfy redemption requests without significantly diluting remaining investors’ interests in the Fund. The Board of Directors of the Fund has designated Nicholas Company, Inc., the Fund’s investment adviser, to administer the Program. Certain aspects of the Program rely on third parties to perform certain functions, including the provision of market data and application of models.
The Program is comprised of various components designed to support the assessment and/or management of liquidity risk, including: (1) the periodic assessment (no less frequently than annually) of certain factors that influence the Fund’s liquidity risk; (2) the periodic classification (no less frequently than monthly) of the Fund’s investments into one of four liquidity categories that reflect an estimate of their liquidity under current market conditions; (3) a 15% limit on the acquisition of “illiquid investments” (as defined under Rule 22e-4); (4) for a Fund that does not invest primarily in “highly liquid investments” (as defined under Rule 22e-4), the determination of a minimum percentage of the Fund’s assets that will generally be invested in highly liquid investments (a “Highly Liquid Investment Minimum”); and (5) periodic reporting to the Board of Directors.
At a meeting of the Board of Directors on February 10, 2023, Nicholas Company, Inc. provided a written report to the Board addressing the operation, and the adequacy and effectiveness of the implementation, of the Program, including, as applicable, the operation of any Highly Liquid Investment Minimum and any material changes to the Program, for the period from January 1, 2022 through December 31, 2022 (the “Reporting Period”). Among other things, the annual report discussed: (1) the results of stress tests designed to assess liquidity under a hypothetical stressed scenario involving elevated redemptions; and (2) an assessment of the methodologies used to classify investments into one of four liquidity categories. The report concluded that the Program was reasonably designed to assess and manage liquidity risk and was adequately and effectively implemented during the Reporting Period.
There can be no assurance that the Program will achieve its objectives under all circumstances in the future. Please refer to the Fund’s prospectus for more information regarding the Fund’s exposure to liquidity risk and other risks to which it may be subject.
– 21 –
Information on Proxy Voting
(unaudited)
A description of the policies and procedures that the Fund uses to determine how to vote proxies relating to portfolio securities is available, without charge, upon request by calling 800-544-6547 or 414-276-0535. It also appears in the Fund’s Statement of Additional Information, which can be found on the SEC’s website, www.sec.gov. A record of how the Fund voted its proxies for the most recent twelve-month period ended June 30, also is available on the Fund’s website, www.nicholasfunds.com, and the SEC’s website, www.sec.gov.
Quarterly Portfolio Schedule
(unaudited)
The Fund files its complete schedule of investments with the SEC for the first and third quarters of each fiscal year as an exhibit to its reports on Form N-PORT. The Fund’s Form N-PORT reports are available on the SEC’s website at www.sec.gov and may be reviewed and copied at the SEC’s Public Reference Room in Washington, D.C. Information on the operation of the Public Reference Room may be obtained by calling 800-SEC-0330.
– 22 –
Directors and Officers of the Fund
(unaudited)
The following table sets forth the pertinent information about the Fund’s directors and officers as of March 31, 2023. Unless otherwise listed, the business address of each director and officer is 411 East Wisconsin Avenue, Milwaukee, WI 53202.
| | | | | | |
| | | | | | Number of | |
| | | | | | Portfolios | |
| | | | Term of | Principal | in Fund | Other |
| | | Positions | Office and | Occupations | Complex | Directorships |
| | | Held | Length of | During | Overseen | Held |
| Name and Age | | With Fund | Time Served | Past 5 Years | by Director | by Director |
| INTERESTED DIRECTOR | | | | | | |
| David O. Nicholas, CFA | | President, | (2), 30 years | President, Chief | 4 | None |
| – 61(1) | | Director and | | Executive Officer, | | |
| | | Co-Portfolio | | Chief Investment | | |
| | | Manager | | Officer and | | |
| | | | | Director, Nicholas | | |
| | | | | Company, Inc., the | |
| | | | | Adviser to the Fund. | |
| | | | | He also is the Lead | |
| | | | | Portfolio Manager of | |
| | | | | Nicholas Fund, Inc., | |
| | | | | Nicholas II, Inc. and | |
| | | | | Nicholas Limited | | |
| | | | | Edition, Inc. | | |
| DISINTERESTED DIRECTORS | | | | |
| John A. Hauser | | Director | (2), 7 years | Chaplain, Door | 4 | None |
| – 64 | | | | County Medical | | |
| | | | | Center, 2019 to | | |
| | | | | present. Private | | |
| | | | | Investor, January | | |
| | | | | 2018 to present. | | |
| | | | | Senior Vice President – | |
| | | | | Trust and Community | |
| | | | | Relations, Nicolet Bank, | |
| | | | | October 2016 to | | |
| | | | | December 2016. Senior | |
| | | | | Vice President – Director | |
| | | | | of Wealth Services, | |
| | | | | April 2016 to October | |
| | | | | 2016. Prior to its | | |
| | | | | acquisition by Nicolet | |
| | | | | Bank in April 2016, | |
| | | | | Mr. Hauser served | | |
| | | | | in various senior | | |
| | | | | management roles for | |
| | | | | Baylake Bank from | | |
| | | | | 1984 to 2008 and from | |
| | | | | 2009 to April 2016. | |
– 23 –
Directors and Officers of the Fund (continued)
(unaudited)
| | | | | |
| | | | | Number of | |
| | | | | Portfolios | |
| | | Term of | Principal | in Fund | Other |
| | Positions | Office and | Occupations | Complex | Directorships |
| | Held | Length of | During | Overseen | Held |
| Name and Age | With Fund | Time Served | Past 5 Years | by Director | by Director |
| David P. Pelisek, CFA | Director | (2), 3 years | Private Investor, | 4 | None |
| – 64 | | | September 2016 | | |
| | | | to present. | | |
| | | | Managing Director, | |
| | | | Robert W. Baird & | | |
| | | | Co., Inc., and | | |
| | | | Partner, Baird | | |
| | | | Capital Partners | | |
| | | | Buyout Funds I–V, | | |
| | | | January 1994 to | | |
| | | | May 2016. | | |
| Julie M. Van Cleave | Director | (2), 1 year | Private Investor, | 4 | None |
| – 64 | | | July 2020 to | | |
| | | | present. Chief | | |
| | | | Investment Officer, | |
| | | | University of | | |
| | | | Wisconsin | | |
| | | | Foundation, | | |
| | | | July 2013 to | | |
| | | | June 2020. | | |
| | | Term of | | | |
| | Positions | Office and | | | |
| | Held | Length of | | | |
| | With | Time | | | |
| Name and Age | Fund | Served | Principal Occupations During Past 5 Years |
| OFFICERS | | | | | |
| Lawrence J. Pavelec, CFA | Senior Vice | Annual, | Executive Vice President, Secretary and Chief |
| – 64 | President | 19 years | Operating Officer, Nicholas Company, Inc., |
| | and | | the Adviser to the Fund, and employed by |
| | Secretary | | the Adviser since 2003. | |
| Jennifer R. Kloehn, CPA | Senior Vice | Annual, | Executive Vice President, Treasurer, Chief |
| – 49 | President, | 7 years | Financial Officer and Chief Compliance Officer, |
| | Treasurer | | Nicholas Company, Inc., the Adviser to the Fund, |
| | and Chief | | and employed by the Adviser since 1998. |
| | Compliance | | | | |
| | Officer | | | | |
| Michael L. Shelton, | Senior Vice | Annual, | Senior Vice President and Senior Research |
| CFA, CPA | President | 12 years | Analyst, Nicholas Company, Inc. the Adviser |
| – 51 | and Lead | | to the Fund. He also is Co-Portfolio Manager of |
| | Portfolio | | Nicholas Fund, Inc. | | |
| | Manager | | | | |
– 24 –
Directors and Officers of the Fund (continued)
(unaudited)
| | | |
| | | Term of | |
| | Positions | Office and | |
| | Held | Length of | |
| | With | Time | |
| Name and Age | Fund | Served | Principal Occupations During Past 5 Years |
| Candace L. Lesak, CFP | Vice | Annual, | Employee, Nicholas Company, Inc., |
| – 65 | President | 30 years | the Adviser to the Fund. |
| (1) | David O. Nicholas is the only director of the Fund who is an “interested person” of the Fund, as that term is defined in the 1940 Act. Mr. Nicholas is a Director of the Adviser and owns 60% of the outstanding voting securities of the Adviser. |
| (2) | Until duly elected or re-elected at a subsequent annual meeting of the Fund. |
The Fund’s Statement of Additional Information includes additional information about the Fund directors and is available, without charge, upon request, by calling 800-544-6547 or 414-276-0535.
– 25 –
Privacy Policy
(unaudited)
Nicholas Equity Income Fund, Inc. respects each shareholder’s right to privacy. We are committed to safeguarding the information that you provide us to maintain and execute transactions on your behalf.
We collect the following non-public personal information about you:
| * | Information we receive from you on applications or other forms, whether we receive the form in writing or electronically. This includes, but is not limited to, your name, address, phone number, tax identification number, date of birth, beneficiary information and investment selection. |
| * | Information about your transactions with us and account history with us. This includes, but is not limited to, your account number, balances and cost basis information. This also includes transaction requests made through our transfer agent. |
| * | Other general information that we may obtain about you such as demographic information. |
WE DO NOT SELL ANY NON-PUBLIC PERSONAL INFORMATION ABOUT CURRENT OR FORMER SHAREHOLDERS.
INFORMATION SHARED WITH OUR TRANSFER AGENT, A THIRD PARTY COMPANY, ALSO IS NOT SOLD.
We may share, only as permitted by law, non-public personal information about you with third party companies. Listed below are some examples of third parties to whom we may disclose non-public personal information. While these examples do not cover every circumstance permitted by law, we hope they help you understand how your information may be shared.
We may share non-public personal information about you:
| * | With companies who work for us to service your accounts or to process transactions that you may request. This would include, but is not limited to, our transfer agent to process your transactions, mailing houses to send you required reports and correspondence regarding the Fund and its Adviser, the Nicholas Company, Inc., and our dividend disbursing agent to process fund dividend checks. |
| * | With a party representing you, with your consent, such as your broker or lawyer. |
| * | When required by law, such as in response to a subpoena or other legal process. |
The Fund and its Adviser maintain policies and procedures to safeguard your non-public personal information. Access is restricted to employees who the Adviser determines need the information in order to perform their job duties. To guard your non-public personal information we maintain physical, electronic, and procedural safeguards that comply with federal standards.
In the event that you hold shares of the Fund with a financial intermediary, including, but not limited to, a broker-dealer, bank, or trust company, the privacy policy of your financial intermediary would govern how your non-public personal information would be shared with non-affiliated third parties.
– 26 –
Automatic Investment Plan — An Update
(unaudited)
The Nicholas Family of Funds’ Automatic Investment Plan provides a simple method to dollar cost average into the fund(s) of your choice.
Dollar cost averaging involves making equal systematic investments over an extended time period. A fixed dollar investment will purchase more shares when the market is low and fewer shares when the market is high. The automatic investment plan is an excellent way for you to become a disciplined investor.
The following table illustrates what dollar cost averaging can achieve. Please note that past performance is no guarantee of future results. Nicholas Company recommends dollar cost averaging as a practical investment method. It should be consistently applied for long periods so that investments are made through several market cycles.
| | | | | |
| | | Nicholas Equity Income Fund |
| $1,000 initial investment on | | 11/23/1993 | * | | 03/31/2013 |
| Number of years investing $100 each month | | | | | |
| following the date of initial investment | | 29.4 | | | 10 |
| Total cash invested | $ | 36,300 | | $ | 13,000 |
| Total dividend and capital gain | | | | | |
| distributions reinvested | $ | 163,236 | | $ | 8,021 |
| Total full shares owned at 03/31/2023 | | 12,808 | | | 1,075 |
| Total market value at 03/31/2023 | $ | 254,118 | | $ | 21,337 |
The results above assume purchase on the last day of the month. The Nicholas Automatic Investment Plan actually invests on the date specified by the investor. Total market value includes reinvestment of all distributions.
| * | Date of Initial Public Offering. |
– 27 –
Nicholas Funds Services Offered
(unaudited)
| | |
| • | IRAs | |
| | • Traditional | • SIMPLE |
| | • Roth | • SEP |
| • | Coverdell Education Accounts |
| • | Automatic Investment Plan |
| • | Direct Deposit of Dividend and Capital Gain Distributions |
| • | Systematic Withdrawal Plan |
| • | Monthly Automatic Exchange between Funds |
| • | Telephone Purchase and Redemption |
| • | Telephone Exchange | |
| • | 24-hour Automated Account Information (800-544-6547) |
| • | 24-hour Internet Account Access (www.nicholasfunds.com) |
Please call a shareholder representative for further information on the above services or with any other questions you may have regarding the Nicholas Funds (800-544-6547).
– 28 –
Directors and Officers
DAVID O. NICHOLAS, President and Director
JOHN A. HAUSER, Director
DAVID P. PELISEK, Director
JULIE M. VAN CLEAVE, Director
JENNIFER R. KLOEHN, Senior Vice President,
Treasurer and Chief Compliance Officer
LAWRENCE J. PAVELEC, Senior Vice President and Secretary
MICHAEL L. SHELTON, Senior Vice President
CANDACE L. LESAK, Vice President
Investment Adviser
NICHOLAS COMPANY, INC.
Milwaukee, Wisconsin
www.nicholasfunds.com
414-276-0535 or 800-544-6547
Accountant
Dividend Disbursing Agent
Transfer Agent
U.S. BANCORP FUND SERVICES, LLC
Milwaukee, Wisconsin
414-276-0535 or 800-544-6547
Distributor
QUASAR DISTRIBUTORS, LLC
Milwaukee, Wisconsin
Custodian
U.S. BANK N.A.
Milwaukee, Wisconsin
Independent Registered Public Accounting Firm
DELOITTE & TOUCHE LLP
Milwaukee, Wisconsin
Counsel
MICHAEL BEST & FRIEDRICH LLP
Milwaukee, Wisconsin
This report is submitted for the information of shareholders of the Fund. It is not authorized for distribution to prospective investors unless preceded or accompanied by an effective prospectus.
Item 2. Code of Ethics.
(a) The registrant has adopted a Code of Ethics that applies to the registrant’s principal executive officer and principal financial officer.
(b) Not applicable.
(c) During the period covered by the report, there were no amendments to the provisions of the Code of Ethics adopted in Item 2(a) above.
(d) During the period covered by the report, no implicit or explicit waivers were made with respect to the provisions of the Code of Ethics adopted in Item 2(a) above.
(e) Not applicable.
(f) The registrant’s Code of Ethics is attached as Exhibit 13(a)(1) to this Form N-CSR.
Item 3. Audit Committee Financial Expert.
The Fund's Board of Directors has determined that Mr. David P. Pelisek, an independent director, qualifies as an audit committee financial expert as that term is defined for purposes of this item. He was selected as the Fund’s Audit Committee Financial Expert at the Fund’s Board of Directors Meeting held on February 3, 2020.
Item 4. Principal Accountant Fees and Services.
(a) Audit Fees. The aggregate fees billed for each of the last two fiscal years (the "Reporting Periods") for professional services rendered by the Fund's principal accountant (the "Auditor") for the audit of the Fund's annual financial statements, or services that are normally provided by the Auditor in connection with the statutory and regulatory filings or engagements for the Reporting Periods, were $30,170 in 2023 and $28,200 in 2022.
(b) Audit-Related Fees. There were no fees billed in each of the last two fiscal years for assurance and related services rendered by the Auditor to the Fund that are reasonably related to the performance of the audit of the Fund's financial statements and are not reported under paragraph (a) of this Item 4.
(c) Tax Fees. The aggregate fees billed in the Reporting Periods for professional services rendered by the Auditor for tax compliance, tax advice and tax planning ("Tax Services") were $7,050 in 2023 and $6,850 in 2022. These services consisted of (i) review or preparation of U.S. federal, state, local and excise tax returns; (ii) U.S. federal, state and local tax planning, advice and assistance regarding statutory, regulatory or administrative developments, (iii) tax advice regarding tax qualification matters and/or treatment of various financial instruments held or proposed to be acquired or held.
(d) All Other Fees. The aggregate fees billed for professional services rendered by the Auditor to the Fund's investment adviser were approximately $20,650 in 2022 and $19,300 in 2021. These services were for the audit of the investment adviser for the adviser's fiscal year ended 10/31/2022 and 10/31/2021, respectively.
(e) (1) Audit Committee Pre-Approval Policies and Procedures. The Fund's Board of Director's has not adopted any pre-approval policies and procedures as described in paragraph (c)(7) of Rule 2-01 of Regulation S-X. The Fund's Board of Directors meets with the Auditors and management to review and authorize the Auditor's engagements for audit and non-audit services to the Fund and its Adviser prior to each engagement.
(e) (2) The percentage of services described in each of paragraphs (b) through (d) of this Item that were approved by the audit committee pursuant to paragraph (c)(7)(i)(C) of Rule 2-01 of Regulation S-X are as follows:
(f) No disclosures are required by this Item 4(f).
(g) There were no non-audit fees billed in each of the last two fiscal years by the Auditor for services rendered to the Fund or the Fund's investment adviser that provides ongoing services.
(h) No disclosures are required by this Item 4(h).
Item 5. Audit Committee of Listed Registrants.
Not applicable to this filing.
Item 6. Schedule of Investments.
The schedule of investments in securities of unaffiliated issuers is included as part of the report to shareholders filed under Item 1 of this Form N-CSR.
Item 7. Disclosure of Proxy Voting Policies and Procedures for Closed-End Management Investment Companies.
Applicable only to annual reports filed by closed-end funds.
Item 8. Portfolio Managers of Closed-End Management Investment Companies.
Applicable only to annual reports filed by closed-end funds.
Item 9. Purchases of Equity Securities by Closed-End Management Investment Companies and Affiliated Purchasers.
Applicable only to closed-end funds.
Item 10. Submission of Matters to a Vote of Security Holders.
Not applicable to this filing.
Item 11. Controls and Procedures.
(a) The Fund’s principal executive officer and principal financial officer, or persons performing similar functions, have concluded that the registrant’s disclosure controls and procedures (as defined in Rule 30a-3(c) under the Investment Company Act of 1940, as amended (the “1940 Act”) are effective, based on their evaluation of these controls and procedures as of a date within 90 days of the filing date of the
report that includes the disclosure required by this paragraph, based on their evaluation of these controls and procedures required by Rule 30a-3(b) under the 1940 Act and Rules 13a-15(b) or 15d-15(b) under the Securities Exchange Act of 1934, as amended.
(b) There were no changes in the registrant’s internal controls over financial reporting (as defined in Rule 30a-3(d) under the 1940 Act) that occurred during the period covered by this report that have materially affected, or are reasonably likely to materially affect, the registrant’s internal control over financial reporting.
Item 12. Disclosure of Securities Lending Activities for Closed-End Management Investment Companies.
Applicable only to closed-end funds.
Item 13. Exhibits.
(a)(1) Sarbanes-Oxley Code of Ethics for Principal Executive and Senior Financial Officers (that is the subject of the disclosure required by Item 2), attached hereto as EX-99.CODE ETH.
(a)(2) Certifications of Principal Executive Officer and Principal Financial Officer pursuant to Rule 30a-2(a) under the Investment Company Act of 1940, attached hereto as EX-99.CERT.
(a)(3) Any written solicitation to purchase securities under Rule 23c-1 under the Act sent or given during the period covered by the report by or on behalf of the registrant to 10 or more person. Applicable only to closed-end funds.
(a)(4) Change in the registrant’s independent public accountant.
Not applicable to this filing.
(b) Certifications of Principal Executive Officer and Principal Financial Officer pursuant to Rule 30a-2(b) under the Investment Company Act of 1940, attached hereto as EX-99.906 CERT.
SIGNATURES
Pursuant to the requirements of the Securities Exchange Act of 1934 and the Investment Company Act of 1940, the registrant has duly caused this report to be signed on its behalf by the undersigned, thereunto duly authorized.
(Registrant) Nicholas Equity Income Fund, Inc.
By: /s/ David O. Nicholas
Name: David O. Nicholas
Title: Principal Executive Officer
Date: 05/26/2023
Pursuant to the requirements of the Securities Exchange Act of 1934 and the Investment Company Act of 1940, this report has been signed by the following persons on behalf of the registrant and in the capacities and on the dates indicated.
By: /s/ David O. Nicholas
Name: David O. Nicholas
Title: Principal Executive Officer
Date: 05/26/2023
By: /s/ Jennifer R. Kloehn
Name: Jennifer R. Kloehn
Title: Principal Financial Officer
Date: 05/26/2023