operating companies are domiciled in, and operate exclusively from, Bermuda. For example, Bermuda, a small jurisdiction, may be disadvantaged in participating in global or cross border regulatory matters as compared with larger jurisdictions such as the U.S. or the leading European Union countries. In addition, Bermuda, which is currently an overseas territory of the United Kingdom ("U.K."), may consider changes to its relationship with the U.K. in the future. These changes could adversely affect Bermuda's position in respect of future regulatory initiatives, which could impact us commercially.
A decline in our investment performance could reduce our profitability.
We derive a significant portion of our income from our invested assets. As a result, our financial results depend in part on the performance of our investment portfolio, which contains fixed maturity securities, such as bonds and mortgage-backed securities. Our operating results are subject to a variety of investment risks, including risks relating to general economic conditions, market volatility, interest rate fluctuations, foreign currency risk, liquidity risk and credit and default risk. Additionally, with respect to certain of our investments, we are subject to pre-payment or reinvestment risk.
The market value of our fixed maturity investments will be subject to fluctuation depending on changes in various factors, including prevailing interest rates. As a result of large reinsurance or insurance losses, we may be forced to liquidate our investments at times and prices that are not optimal, which could have a material adverse effect on the performance of our investment portfolio.
Increases in interest rates could cause the market value of our investment portfolio to decrease, perhaps substantially. Conversely, a decline in interest rates could reduce our investment yield, which would reduce our overall profitability. Interest rates are highly sensitive to many factors, including governmental monetary policies, domestic and international economic and political conditions and other factors beyond our control. Any measures we take that are intended to manage the risks of operating in a changing interest rate environment may not effectively mitigate such interest rate sensitivity.
In recent years we have increased our allocation to other investments which have different risk characteristics than our traditional fixed maturity securities and short-term investment portfolios. These other investments include hedge fund investments, a fund that invests in senior secured bank loans, a European high yield credit fund and private equity partnerships. Also included in other investments are investments in a medium term note, representing an interest in a pool of European fixed income securities, a non-U.S. dollar convertible fund and miscellaneous other investments. Our percentage allocation to these other investments will likely increase. The performance of these other investments had a positive impact on the performance of our investment portfolio in 2004.
These other investments are recorded on our consolidated balance sheet at fair value. The fair value of certain of these investments is generally established on the basis of the net valuation criteria established by the managers of such investments. These net valuations are determined based upon the valuation criteria established by the governing documents of the investments. Due to a lag in the valuations reported by the fund managers, the majority of our other investments are reported on a one month or one quarter lag. Such valuations may differ significantly from the values that would have been used had ready markets existed for the shares, partnership interests or notes of the investments. Many of the investments are subject to restrictions on redemptions and sales which are determined by the governing documents and limit our ability to liquidate these investments in the short term. These investments expose us to market risks including interest rate risk, foreign currency risk, equity price risk and credit risk. We are unable to quantify these risks as we do not have timely access to the securities underlying each investment. To the extent these risks move against us it could result in a material adverse change to our investment performance. The performance of these investments is also dependent on the individual investment managers and the investment strategies. It is possible that the investment managers will leave and/or the investment strategies will become ineffective. The result of either of the foregoing would be a material adverse change to our investment performance.
U.S. taxing authorities could contend that our Bermuda subsidiaries are subject to U.S. corporate income tax.
If the U.S. Internal Revenue Service (the "IRS") were to contend successfully that Renaissance Reinsurance, Glencoe, DaVinci or Top Layer Re is engaged in a trade or business in the U.S., Renaissance Reinsurance, Glencoe, DaVinci or Top Layer Re would, to the extent not exempted from tax by the U.S.-Bermuda income tax treaty, be subject to U.S. corporate income tax on that portion of its net income treated as effectively connected with a U.S. trade or business, as well as the U.S. corporate branch profits tax. Although we would vigorously resist the imposition of any such tax, if we were ultimately held to be subject to this taxation, our earnings would correspondingly decline.
In addition, benefits of the U.S.-Bermuda income tax treaty which may limit any such tax to income attributable to a permanent establishment maintained by Renaissance Reinsurance, Glencoe, DaVinci or Top Layer Re in the U.S. are only available to any of Renaissance Reinsurance, Glencoe, DaVinci or Top Layer Re if more than 50% of its shares are beneficially owned, directly or indirectly, by individuals who are Bermuda residents or U.S. citizens or residents. Renaissance Reinsurance, Glencoe, DaVinci or Top Layer Re may not be able to continually satisfy such beneficial ownership test or be able to establish its satisfaction to the IRS. Finally, it should be noted that it is unclear whether the income tax treaty (assuming satisfaction of the beneficial ownership test) applies to income other than premium income, such as investment income.
Because we depend on a few reinsurance brokers for a large portion of revenue, loss of business provided by them could adversely affect us.
We market our reinsurance products worldwide exclusively through reinsurance brokers. Four brokerage firms accounted for 82.2%, 80.4% and 71.1%, respectively, of our net premiums written for the years ended December 31, 2004, 2003 and 2002. Subsidiaries and affiliates of Marsh Inc., the Benfield Group Limited, the Willis Group and AON Corporation accounted for approximately 27.2%, 25.1%, 17.2% and 12.7%, respectively, of our Reinsurance segment gross written premiums in 2004. The loss of all or a substantial portion of the business provided by these brokers could have a material adverse effect on us. Our ability to market our products could decline as a result of any loss of the business provided by these brokers and it is possible that our premiums written would decrease.
Our reliance on reinsurance brokers exposes us to their credit risk.
In accordance with industry practice, we pay virtually all amounts owed on claims under our policies to reinsurance brokers, and these brokers, in turn, pay these amounts over to the insurers that have reinsured a portion of their liabilities with us (we refer to these insurers as ceding insurers). Likewise, premiums paid by ceding insurers are paid to brokers, who then pass such amounts on to us. In many jurisdictions, if a broker were to fail to make such a payment to a ceding insurer, we would remain liable to the ceding insurer for the deficiency. Conversely, in many jurisdictions, when the ceding insurer pays premiums for these policies to reinsurance brokers for payment over to us, these premiums are considered to have been paid and the ceding insurer will no longer be liable to us for those amounts, whether or not we have actually received the premiums. Consequently, in connection with the settlement of reinsurance balances, we assume a degree of credit risk associated with brokers around the world. Due to recent developments in the industry, we believe that the degree of this credit risk has increased.
A decline in the ratings assigned to our financial strength would adversely impact our business.
Third party rating agencies assess and rate the financial strength of reinsurers and insurers, such as Renaissance Reinsurance, our Glencoe Group carriers, Top Layer Re and DaVinci. These ratings are based upon criteria established by the rating agencies. Periodically the rating agencies evaluate us to confirm that we continue to meet the criteria of the ratings previously assigned to us. The financial strength ratings assigned by rating agencies to reinsurance or insurance companies are based upon factors relevant to policyholders and are not directed toward the protection of investors. Recently, certain rating agencies have placed us on credit watch with negative implications in connection with our restatement of our financial results for the years ended December 31, 2001, 2002 and 2003. See "Business—Recent Developments."
39
The rating agencies may downgrade or withdraw their financial strength ratings in the future if we do not continue to meet the criteria of the ratings previously assigned to us. Our ability to compete with other reinsurers and insurers, and our results of operations, could be materially adversely affected by any such ratings downgrade. For example, following a ratings downgrade we might lose clients to more highly rated competitors or retain a lower share of the business of our clients. The rating of Top Layer Re is dependent in large part upon the rating of State Farm, who provides Top Layer Re with $3.9 billion of stop loss reinsurance.
As is customary in our industry, a portion of our reinsurance policies provide our clients with the right to cancel or not renew our policies in the event our financial strength ratings are downgraded. We cannot precisely estimate the amount of premium that would be at risk to this development, as this amount depends on the particular facts and circumstances at the time, including the degree of the downgrade, the time elapsed on the impacted in-force policies, and the effects of any related catastrophic event on the industry generally. In the event any of these provisions are triggered, we will vigorously seek to retain our clients. However, we cannot assure you that our premiums would not decline, perhaps materially, following a ratings downgrade.
We could be adversely affected if TRIA is not renewed.
In response to the tightening of supply in certain insurance and reinsurance markets resulting from, among other things, the September 11th tragedy, TRIA was enacted to ensure the availability of commercial insurance coverage for terrorist acts in the U.S. This law established a federal assistance program through the end of 2005 to help the commercial property and casualty insurance industry cover claims related to future terrorism related losses and required that coverage for terrorist acts be offered by insurers. It is possible that TRIA will not be renewed following 2005, or could be adversely amended, which could adversely affect the insurance industry if a material subsequent event occurred. Given these uncertainties, we are currently unable to determine with certainty the impact that TRIA's non-renewal could have on us.
The covenants in our debt agreements limit our financial and operational flexibility, which could have an adverse effect on our financial condition.
We have incurred indebtedness, and may incur additional indebtedness in the future. At December 31, 2004, we had an aggregate of approximately $350 million of indebtedness outstanding, consisting of $100 million of 5.875% Senior Notes due 2013, $150 million of 7.0% Senior Notes due 2008 and a $100 million bank loan incurred and fully drawn by our consolidated subsidiary, DaVinciRe Holdings Ltd. ("DaVinciRe"). RenaissanceRe is also party to a $500 million syndicated revolving credit agreement, none of which was drawn at December 31, 2004.
In addition, we have issued $100 million aggregate liquidation amount of mandatorily redeemable capital securities ("Capital Securities") through the Capital Trust holding solely $103.1 million of the Company's 8.54% junior subordinated debentures due March 1, 2027. Because we hold $15.4 million of these securities and also hold $3.1 million of equity interest in the Capital Trust, our net obligation is $84.6 million.
Our insurance and reinsurance subsidiaries maintain letter of credit facilities in connection with their insurance and reinsurance business. The largest of these is a secured letter of credit facility established under a reimbursement agreement entered into by certain of RenaissanceRe's subsidiaries and affiliates. The obligations of each of RenaissanceRe's subsidiaries and affiliates party to the reimbursement agreement are secured by certain collateral, including cash, eligible high-quality marketable securities and redeemable preference shares of RIHL. The facility currently is in the amount of $850 million. The term of the reimbursement agreement was extended to April 30, 2005 in November 2004 and in March 2005, the reimbursement agreement was amended to conform certain default provisions of the agreement to comparable provisions in existing credit agreements of the Company and DaVinciRe. At December 31, 2004, the aggregate face amount of letters of credit outstanding under the reimbursement agreement was $548.4 million and total letters of credit outstanding was $670.6 million.
The agreements covering our indebtedness, particularly our bank loans, contain numerous covenants that limit our ability, among other things, to borrow money, make particular types of investments or
40
other restricted payments, sell assets, merge or consolidate. These agreements also require us to maintain specific financial ratios. If we fail to comply with these covenants or meet these financial ratios, the lenders under our credit facilities could declare a default and demand immediate repayment of all amounts owed to them, cancel their commitments to lend or issue letters of credit, or both, and require us to pledge additional or a different type of collateral.
In addition, if we are in default under the junior subordinated debentures, discussed above, or if we have given notice of our intention to defer our related payment obligations, the terms of our indebtedness would, among other things, restrict our ability to:
 | |
| • | declare or pay any dividends on our capital shares; |
| |
| • | redeem, purchase or acquire any capital shares; or |
| |
| • | make a liquidation payment with respect to our capital shares. |
Because we are a holding company, we are dependent on dividends and payments from our subsidiaries.
As a holding company with no direct operations, we rely on investment income, cash dividends and other permitted payments from our subsidiaries to make principal and interest payments on our debt and to pay dividends to our shareholders. The holding company does not have any operations and from time to time may not have significant liquid assets. If our subsidiaries are restricted from paying dividends to us, we may be unable to pay dividends or to repay our indebtedness.
Bermuda law and regulations require our subsidiaries which are registered in Bermuda as insurers to maintain a minimum solvency margin and minimum liquidity ratio, and prohibit dividends that would result in a breach of these requirements. Further, Renaissance Reinsurance and DaVinci, as Class 4 insurers in Bermuda, may not pay dividends which would exceed 25% of their respective capital and surplus, unless they first make filings confirming that they meet the required margins. As Class 3 insurers, Glencoe, Lantana and Top Layer Re may not declare or pay dividends during any financial year that would cause Glencoe, Lantana or Top Layer Re (as the case may be) to fail to meet its minimum solvency margin and minimum liquidity ratio.
Generally, our U.S. insurance subsidiaries may only pay dividends out of earned surplus. Further, the amount payable without the prior approval of the applicable state insurance department is generally limited to the greater of 10% of policyholders' surplus or statutory capital, or 100% of the subsidiary's prior year statutory net income. Since our U.S. insurance subsidiaries' earned surplus is negative, these subsidiaries cannot currently pay dividends without the applicable state insurance department approval.
The loss of one or more key executive officers could adversely affect us.
Our success has depended, and will continue to depend, in substantial part upon our ability to attract and retain our executive officers. If we were to lose the services of members of our senior management team, our business could be adversely affected. For example, we might lose clients whose relationship depends in part on the service of a departing executive. In addition, the loss of services of members of our management team would strain our ability to execute our growth initiatives, as described above.
Our ability to execute our business strategy is dependent on our ability to attract and retain a staff of qualified underwriters and service personnel. The location of our global headquarters in Bermuda may impede our ability to recruit and retain highly skilled employees. We do not currently maintain key man life insurance policies with respect to any of our employees.
Under Bermuda law, non-Bermudians may not engage in any gainful occupation in Bermuda without the specific permission of the appropriate government authority. The Bermuda government will issue a work permit for a specific period of time, which may be extended upon showing that, after proper public advertisement, no Bermudian (or spouse of a Bermudian) is available who meets the minimum standards for the advertised position. Substantially all of our officers are working in Bermuda under work permits that will expire over the next three years. The Bermuda government could refuse to extend these work permits. In addition, a Bermuda government policy limits the duration of work
41
permits to a total of six years, which is subject to certain exemptions only for key employees. If any of our senior executive officers were not permitted to remain in Bermuda, our operations could be disrupted and our financial performance could be adversely affected as a result.
Regulatory challenges in the U.S. or elsewhere to our Bermuda operations' claims of exemption from insurance regulation could restrict our ability to operate, increase our costs, or otherwise adversely impact us.
Renaissance Reinsurance, DaVinci and Top Layer Re are not licensed or admitted in any jurisdiction except Bermuda. Renaissance Reinsurance, Glencoe, DaVinci and Top Layer Re each conduct business only from their principal offices in Bermuda and do not maintain an office in the U.S. Recently, the insurance and reinsurance regulatory framework has been subject to increased scrutiny in many jurisdictions, including the U.S. and various states within the U.S. If our Bermuda insurance or reinsurance operations become subject to the insurance laws of any state in the U.S., we could face inquiries or challenges to the future operations of these companies.
Moreover, we could be put at a competitive disadvantage in the future with respect to competitors that are licensed and admitted in U.S. jurisdictions. Among other things, jurisdictions in the U.S. do not permit insurance companies to take credit for reinsurance obtained from unlicensed or non-admitted insurers on their statutory financial statements unless security is posted. Our contracts generally require us to post a letter of credit or provide other security after a reinsured reports a claim. In order to post these letters of credit, issuing banks generally require collateral. It is possible that European Union or other countries might adopt a similar regime in the future, or that the U.S. rules could be altered in a way that treats Bermuda disproportionately. Any such development could adversely affect us.
Glencoe and Lantana are currently eligible, non-admitted excess and surplus lines insurers in, respectively, 51 and 50 states and territories of the U.S. and are each subject to certain regulatory and reporting requirements of these states. However, neither Glencoe nor Lantana is admitted or licensed in any U.S. jurisdiction; moreover, Glencoe only conducts business from Bermuda. Accordingly, the scope of Glencoe's and Lantana's activities in the U.S. is limited, which could adversely affect their ability to compete.
In addition, Stonington, which writes insurance in all 50 states on an admitted basis, is subject to extensive regulation under state statutes which confer regulatory, supervisory and administrative powers on state insurance commissioners. Such regulation generally is designed to protect policyholders rather than investors, and relates to such matters as: rate setting; policy forms; limitations on dividends and transactions with affiliates; solvency standards which must be met and maintained; the licensing of insurers and their agents; the examination of the affairs of insurance companies, which includes periodic market conduct examinations by the regulatory authorities; annual and other reports, prepared on a statutory accounting basis; establishment and maintenance of reserves for unearned premiums and losses; and requirements regarding numerous other matters. We could be required to allocate considerable time and resources to comply with these requirements, and could be adversely affected if a regulatory authority believed we had failed to comply with applicable law or regulation. We plan to grow Stonington's business and, accordingly, expect our regulatory burden to increase.
Our growth plans could cause one or more of our subsidiaries to become subject to additional regulation in other jurisdictions. Any failure to comply with applicable laws could result in the imposition of significant restrictions on our ability to do business, and could also result in fines and other sanctions, any or all of which could adversely affect our financial results and operations.
Retrocessional reinsurance may become unavailable on acceptable terms.
In order to limit the effect of large and multiple losses upon our financial condition, we buy reinsurance for our own account. This type of insurance is known as "retrocessional reinsurance." Our primary insurance companies also buy reinsurance from third parties. A reinsurer's insolvency or inability to make payments under the terms of its reinsurance treaty with us could have a material adverse effect on us.
42
From time to time, market conditions have limited, and in some cases have prevented, insurers and reinsurers from obtaining the types and amounts of reinsurance, which they consider adequate for their business needs. Accordingly, we may not be able to obtain our desired amounts of retrocessional reinsurance. In addition, even if we are able to obtain such retrocessional reinsurance, we may not be able to negotiate terms as favorable to us as in the past. This could limit the amount of business we are willing to write, or decrease the protection available to us as a result of large loss events.
We may be adversely affected by foreign currency fluctuations.
Our functional currency is the U.S. dollar. A portion of our premium is written in currencies other than the U.S. dollar and a portion of our claims and claim expense reserves are also in non-dollar currencies. Moreover, we maintain a portion of our cash equivalent investments in currencies other than the U.S. dollar. Although we generally seek to hedge significant non-U.S. dollar positions, we may, from time to time, experience losses resulting solely from fluctuations in the values of these foreign currencies, which could cause our consolidated earnings to decrease. In addition, failure to manage our foreign currency exposures could cause our results to be more volatile.
Consolidation in the insurance industry could adversely impact us.
We believe that many insurance industry participants are seeking to consolidate. These consolidated entities may try to use their enhanced market power to negotiate price reductions for our products and services. If competitive pressures reduce our prices, we would expect to write less business. As the insurance industry consolidates, competition for customers will become more intense and the importance of acquiring and properly servicing each customer will become greater. We could incur greater expenses relating to customer acquisition and retention, further reducing our operating margins. In addition, insurance companies that merge may be able to spread their risks across a consolidated, larger capital base so that they require less reinsurance. We could also experience more robust competition from larger, better capitalized competitors.
We may encounter difficulties in maintaining the information technology systems necessary to run our business.
We believe our modeling, underwriting and information technology systems are critical to our business. Moreover, our proprietary technology has been an important part of our underwriting process and our ability to compete successfully. We have also licensed certain systems and data from third parties. We cannot be certain that we will also continue to have access to these, or comparable, service providers, or that our proprietary technology will continue to operate as intended. Our business growth strategy will require further development of our technology infrastructure, and any defect or error in our information technology systems could result in reduced or delayed revenue growth, higher than expected losses, management distraction, or harm to our reputation.
Some aspects of our corporate structure may discourage third party takeovers and other transactions or prevent the removal of our current board of directors and management.
Some provisions of our Memorandum of Association and of our Amended and Restated Bye-Laws have the effect of making more difficult or discouraging unsolicited takeover bids from third parties or preventing the removal of our current board of directors and management. In particular, our Bye-Laws prohibit transfers of our capital shares if the transfer would result in a person owning or controlling shares that constitute 9.9% or more of any class or series of our shares. The primary purpose of this restriction is to reduce the likelihood that we will be deemed a "controlled foreign corporation" within the meaning of the Internal Revenue Code for U.S. federal tax purposes. However, this limit may also have the effect of deterring purchases of large blocks of common shares or proposals to acquire us, even if some or a majority of our shareholders might deem these purchases or acquisition proposals to be in their best interests.
In addition, our Bye-Laws provide for:
| |
| • | a classified Board, whose size is fixed and whose members may be removed by the shareholders only for cause upon a 66 2/3% vote; |
| |
| • | restrictions on the ability of shareholders to nominate persons to serve as directors, submit resolutions to a shareholder vote and requisition special general meetings; |
43
| |
| • | a large number of authorized but unissued shares which may be issued by the Board without further shareholder action; and |
| |
| • | a 66 2/3% shareholder vote to amend, repeal or adopt any provision inconsistent with several provisions of the Bye-Laws. |
These Bye-Law provisions make it more difficult to acquire control of us by means of a tender offer, open market purchase, proxy contest or otherwise. These provisions are designed to encourage persons seeking to acquire control of us to negotiate with our directors, which we believe would generally best serve the interests of our shareholders. However, these provisions could have the effect of discouraging a prospective acquirer from making a tender offer or otherwise attempting to obtain control of us. In addition, these Bye-Law provisions could prevent the removal of our current board of directors and management. To the extent these provisions discourage takeover attempts, they could deprive shareholders of opportunities to realize takeover premiums for their shares or could depress the market price of the shares.
RenaissanceRe indirectly owns Stonington, Stonington Lloyd's and Newstead. Our ownership of a U.S. insurance company such as these can, under applicable state insurance company laws and regulations, delay or impede a change of control of RenaissanceRe. Under applicable state insurance regulations, any proposed purchase of 10% or more of our voting securities would require the prior approval of the relevant insurance regulatory authorities.
Investors may have difficulties in serving process or enforcing judgments against us in the U.S.
We are a Bermuda company. In addition, certain of our officers and directors reside in countries outside the U.S. All or a substantial portion of our assets and the assets of these officers and directors are or may be located outside the U.S. Investors may have difficulty effecting service of process within the U.S. on our directors and officers who reside outside the U.S. or to recover against us or these directors and officers on judgments of U.S. courts based on civil liabilities provisions of the U.S. federal securities laws whether or not we appoint an agent in the U.S. to receive service of process.
44
GLOSSARY OF SELECTED INSURANCE AND REINSURANCE TERMS
| | | | | | |
| Accident year | | Year of occurrence of a loss. Claim payments and reserves for claims and claim expenses are allocated to the year in which the loss occurred. |
| Acquisition expenses | | The aggregate expenses incurred by a company acquiring new business, including commissions, underwriting expenses and administrative expenses. |
| Attachment point | | The dollar amount of loss (per occurrence or in the aggregate, as the case may be) above which excess of loss reinsurance becomes operative. |
| Backup premiums written | | The premiums written for additional reinsurance coverage purchased after a series of catastrophic events has exhausted or significantly reduced the initial and reinstatement limits available under the original coverages purchased. |
| Bordereau | | A report providing premium or loss data with respect to identified specific risks. This report is periodically furnished to a reinsurer by the ceding insurers or reinsurers. |
| Broker | | An intermediary who negotiates contracts of insurance or reinsurance, receiving a commission for placement and other services rendered, between (1) a policy holder and a primary insurer, on behalf of the insured party, (2) a primary insurer and reinsurer, on behalf of the primary insurer, or (3) a reinsurer and a retrocessionaire, on behalf of the reinsurer. |
| Capacity | | The percentage of surplus, or the dollar amount of exposure, that an insurer or reinsurer is willing or able to place at risk. Capacity may apply to a single risk, a program, a line of business or an entire book of business. Capacity may be constrained by legal restrictions, corporate restrictions or indirect restrictions. |
| Case reserves | | Loss reserves, established with respect to specific, individual reported claims. |
Casualty insurance or
reinsurance | |
Insurance or reinsurance that is primarily concerned with the losses caused by injuries to third persons and their property (in other words, persons other than the policyholder) and the legal liability imposed on the insured resulting therefrom. Also referred to as liability insurance. |
| Catastrophe | | A severe loss, typically involving multiple claimants. Common perils include earthquakes, hurricanes, hailstorms, severe winter weather, floods, fires, tornadoes, explosions and other natural or man-made disasters. Catastrophe losses may also arise from acts of war, acts of terrorism and political instability. |
Catastrophe excess of loss
reinsurance | |
A form of excess of loss reinsurance that, subject to a specified limit, indemnifies the ceding company for the amount of loss in excess of a specified retention with respect to an accumulation of losses resulting from a "catastrophe." |
|
45
| | | | | | |
| Cede; cedant; ceding company | | When a party reinsures its liability with another, it "cedes" business and is referred to as the "cedant" or "ceding company." |
| Claim | | Request by an insured or reinsured for indemnification by an insurance company or a reinsurance company for loss incurred from an insured peril or event. |
Claims and claim expense
Ratio, net | |
The ratio of net claims and claim expenses to net premiums earned determined in accordance with either SAP or GAAP. |
| Claim reserves | | Liabilities established by insurers and reinsurers to reflect the estimated costs of claim payments and the related expenses that the insurer or reinsurer will ultimately be required to pay in respect of insurance or reinsurance policies it has issued. Claims reserves consist of case reserves, established with respect to individual reported claims, and "IBNR" reserves. For reinsurers, loss expense reserves are generally not significant because substantially all of the loss expenses associated with particular claims are incurred by the primary insurer and reported to reinsurers as losses. |
| Combined ratio | | The combined ratio is the sum of the net claims and claim expense ratio and the underwriting expense ratio. A combined ratio below 100% generally indicates profitable underwriting prior to the consideration of investment income. A combined ratio over 100% generally indicates unprofitable underwriting prior to the consideration of investment income. |
| Earned Premium | | (1) That part of the premium applicable to the expired part of the policy period, including the short-rate premium on cancellation, the entire premium on the amount of loss paid under some contracts, and the entire premium on the contract on the expiration of the policy, which is recognized as income during the period. |
| | | (2) That portion of the reinsurance premium calculated on a monthly, quarterly or annual basis which is to be retained by the reinsurer and recognized as income in the period should their cession be canceled. |
| | | (3) When a premium is paid in advance for a certain time, the company is said to "earn" the premium as the time advances. For example, a policy written for three years and paid for in advance would be one-third earned at the end of the first year. |
Excess and surplus lines
reinsurance | |
Any type of coverage that cannot be placed with an insurer admitted to do business in a certain jurisdiction. Risks placed in excess and surplus lines markets are often substandard as respects adverse loss experience, unusual, or unable to be placed in conventional markets due to a shortage of capacity. |
|
46
| | | | | | |
| Excess of loss | | Reinsurance or insurance that indemnifies the reinsured or insured against all or a specified portion of losses on underlying insurance policies in excess of a specified amount, which is called a "level" or "retention." Also known as non-proportional reinsurance. Excess of loss reinsurance is written in layers. A reinsurer or group of reinsurers accepts a layer of coverage up to a specified amount. The total coverage purchased by the cedant is referred to as a "program" and will typically be placed with predetermined reinsurers in pre-negotiated layers. Any liability exceeding the outer limit of the program reverts to the ceding company, which also bears the credit risk of a reinsurer's insolvency. |
| Exclusions | | Those risk, perils, or classes of insurance with respect to which the reinsurer will not pay loss or provide reinsurance, notwithstanding the other terms and conditions of reinsurance. |
| Frequency | | The number of claims occurring during a given coverage period. |
| Generally accepted accounting principles ("GAAP") | |
Accounting principles as set forth in opinions of the Accounting Principles Board of the American Institute of Certified Public Accountants and/or statements of the Financial Accounting Standards Board and/or their respective successors and which are applicable in the circumstances as of the date in question. Also referred to as GAAP. |
| Gross premiums written | | Total premiums for insurance written and assumed reinsurance during a given period. |
Incurred but not reported
("IBNR") | |
Reserves for estimated losses that have been incurred by insureds and reinsureds but not yet reported to the insurer or reinsurer including unknown future developments on losses which are known to the insurer or reinsurer. |
| Layer | | The interval between the retention or attachment point and the maximum limit of indemnity for which a reinsurer is responsible. |
| Line of Business | | The general classification of insurance written by insurers, i.e., fire, allied lines, homeowners, among others. |
| Loss; losses | | An occurrence that is the basis for submission and/or payment of a claim. Whether losses are covered, limited or excluded from coverage is dependant on the terms of the policy. |
| Losses occurring contracts | | Contracts that cover claims arising from loss events that occur during the term of the reinsurance contract. |
| Loss ratio | | Net claims incurred expressed as a percentage of net earned premiums. |
| Loss reserve | | For an individual loss, an estimate of the amount the insurer expects to pay for the reported claim. For total losses, estimates of expected payments for reported and unreported claims. May include amounts for claims expenses. |
|
47
| | | | | | |
| Net claims and claim expenses | | The expenses of settling claims net of recoveries, including legal and other fees and the portion of expenses general expenses allocated to claim settlement costs (also known as claim adjustment expenses) plus losses incurred with respect to net claims. |
| Net premiums earned | | The portion of net premiums written during or prior to a given period that was actually recognized as income during such period. |
| Net premiums written | | Gross premiums written for a given period less premiums ceded to reinsurers and retrocessionaires during such period. |
| No claims bonus | | A reduction of premiums assumed or ceded if no claims have been made within a specified period. |
| Non-proportional reinsurance | | See Excess of loss. |
| Perils | | This term refers to the causes of possible loss in the property field, such as fire, windstorm, collision, hail, etc. In the casualty field, the term "hazard" is more frequently used. |
Premiums; written, earned and
unearned | |
The amount charged during the term on policies and contracts issued, renewed or reinsured by an insurance company or reinsurance company. Written premium is premium registered on the books of an issuer or reinsurer at the time a policy is issued and paid for. Unearned premium is premium for a future exposure period. Earned premium is written premium minus unearned premium for an individual policy. |
Property insurance or
reinsurance | |
Insurance or reinsurance that provides coverage to a person with an insurable interest in tangible property for that person's property loss, damage or loss of use. |
Property per risk treaty
reinsurance | |
Reinsurance on a treaty basis of individual property risks insured by a ceding company. |
| Proportional reinsurance | | A generic term describing all forms of reinsurance in which the reinsurer shares a proportional part of the original premiums and losses of the reinsured. (Also known as pro rata reinsurance, quota share reinsurance or participating reinsurance.) In proportional reinsurance the reinsurer generally pays the ceding company a ceding commission. The ceding commission generally is based on the ceding company's cost of acquiring the business being reinsured (including commissions, premium taxes, assessments and miscellaneous administrative expense) and also may include a profit factor. See also "Quota Share Reinsurance" and "Surplus Share Reinsurance." |
| Quota Share Reinsurance | | A form of proportional reinsurance in which the reinsurer assumes an agreed percentage of each insurance being reinsured and shares all premiums and losses according with the reinsured. See also "Proportional Reinsurance" and "Surplus Share Reinsurance." |
|
48
| | | | | | |
| Reinstatement premium | | The premium charged for the restoration of the reinsurance limit of a catastrophe contract to its full amount after payment by the reinsurer of losses as a result of an occurrence. |
| Reinsurance | | An arrangement in which an insurance company, the reinsurer, agrees to indemnify another insurance or reinsurance company, the ceding company, against all or a portion of the insurance or reinsurance risks underwritten by the ceding company under one or more policies. Reinsurance can provide a ceding company with several benefits, including a reduction in net liability on individual risks and catastrophe protection from large or multiple losses. Reinsurance also provides a ceding company with additional underwriting capacity by permitting it to accept larger risks and write more business than would be possible without a concomitant increase in capital and surplus, and facilitates the maintenance of acceptable financial ratios by the ceding company. Reinsurance does not legally discharge the primary insurer from its liability with respect to its obligations to the insured. |
| Retention | | The amount or portion of risk that an insurer retains for its own account. Losses in excess of the retention level are paid by the reinsurer. In proportional treaties, the retention may be a percentage of the original policy's limit. In excess of loss business, the retention is a dollar amount of loss, a loss ratio or a percentage. |
Retrocessional reinsurance;
retrocessionaire | |
A transaction whereby a reinsurer cedes to another reinsurer, the retrocessionaire, all or part of the reinsurance that the first reinsurer has assumed. Retrocessional reinsurance does not legally discharge the ceding reinsurer from its liability with respect to its obligations to the reinsured. Reinsurance companies cede risks to retrocessionaires for reasons similar to those that cause primary insurers to purchase reinsurance: to reduce net liability on individual risks, to protect against catastrophic losses, to stabilize financial ratios and to obtain additional underwriting capacity. |
| Risk excess of loss reinsurance | | A form of excess of loss reinsurance that covers a loss of the reinsured on a single "risk" in excess of its retention level of the type reinsured, rather than to aggregate losses for all covered risks, as does catastrophe excess of loss reinsurance. A "risk" in this context might mean the insurance coverage on one building or a group of buildings or the insurance coverage under a single policy, which the reinsured treats as a single risk. |
| Risks | | A term used to denote the physical units of property at risk or the object of insurance protection that are not perils or hazards. Also defined as chance of loss or uncertainty of loss. |
| Risks attaching contracts | | Contracts that cover claims that arise on underlying insurance policies that incept during the term of the reinsurance contract. |
| Specialty lines | | Lines of insurance and reinsurance that provide coverage for risks that are often unusual or difficult to place and do not fit the underwriting criteria of standard commercial products carriers. |
|
49
| | | | | | |
| Statutory accounting principles ("SAP") | |
Recording transactions and preparing financial statements in accordance with the rules and procedures prescribed or permitted by Bermuda and/or the U.S. state insurance regulatory authorities including the NAIC, which in general reflect a liquidating, rather than going concern, concept of accounting. |
| Stop Loss | | A form of reinsurance under which the reinsurer pays some or all of a cedant's aggregate retained losses in excess of a predetermined dollar amount or in excess of a percentage of premium. |
| Submission | | An unprocessed application for (i) insurance coverage forwarded to a primary insurer by a prospective policyholder or by a broker on behalf of such prospective policyholder, (ii) reinsurance coverage forwarded to a reinsurer by a prospective ceding insurer or by a broker or intermediary on behalf of such prospective ceding insurer or (iii) retrocessional coverage forwarded to a retrocessionaire by a prospective ceding reinsurer or by a broker or intermediary on behalf of such prospective ceding reinsurer. |
| Surplus share reinsurance | | A form of pro rata reinsurance (proportional) indemnifying the ceding company against loss to the extent of the surplus insurance liability ceded, on a share basis similar to quota share. See also "Proportional Reinsurance" and "Quota Share Reinsurance." |
| Total Managed Cat Premium | | The total catastrophe reinsurance premiums written on a gross basis by our managed catastrophe joint ventures as well as by our wholly owned subsidiaries. |
| Treaty | | A reinsurance agreement covering a book or class of business that is automatically accepted on a bulk basis by a reinsurer. A treaty contains common contract terms along with a specific risk definition, data on limit and retention, and provisions for premium and duration. |
| Underwriting | | The insurer's or reinsurer's process of reviewing applications submitted for insurance coverage, deciding whether to accept all or part of the coverage requested and determining the applicable premiums. |
| Underwriting capacity | | The maximum amount that an insurance company can underwrite. The limit is generally determined by the company's retained earnings and investment capital. Reinsurance serves to increase a company's underwriting capacity by reducing its exposure from particular risks. |
| Underwriting expense ratio | | The ratio of the sum of the acquisition expenses and operational expenses to net premiums earned, determined in accordance with U.S. GAAP. |
| Underwriting expenses | | The aggregate of policy acquisition costs, including commissions, and the portion of administrative, general and other expenses attributable to underwriting operations. |
| Unearned premium | | The portion of premiums written representing the unexpired portions of the policies or contracts which the insurer or reinsurer has on its books as of a certain date. |
|
50
AVAILABLE INFORMATION
We maintain a website at http://www.renre.com. The information on our website is not incorporated by reference in this Annual Report on Form 10-K and the Internet address is included as an inactive textual reference only.
We make available, free of charge through our website, our financial information, including the information contained in our Annual Reports on Form 10-K, Quarterly Reports on Form 10-Q, Current Reports on Form 8-K and amendments to those reports filed or furnished pursuant to Section 13(a) or 15(d) of the Exchange Act as soon as reasonably practicable after we electronically file such material with, or furnish such material to, the SEC. We also make available, free of charge from our website, our Audit Committee Charter, Compensation/Governance Committee Charter, Corporate Governance Guidelines and Statement of Policies and Code of Ethics and Conduct ("Code of Ethics"). Such information is also available in print for any shareholder who sends a request to the Investor Relations Department of: RenaissanceRe Holdings Ltd., P.O. Box HM 2527, Hamilton, HMGX, Bermuda. Reports filed with the SEC may also be viewed or obtained at the SEC Public Reference Room at 450 Fifth Street, NW, Washington, DC 20549. Information on the operation of the SEC Public Reference Room may be obtained by calling the SEC at 1-800-SEC-0330.
ITEM 2. PROPERTIES
We lease office space in Bermuda, where our executive offices are located. In addition, Stonington leases office space in Addison, Texas, and our other U.S. based subsidiaries lease office space in Richmond, Virginia and Raleigh, North Carolina. We also lease office space in Dublin, Ireland. As we anticipate additional growth in our businesses, it is likely that we will need to expand into additional facilities to accommodate this growth.
ITEM 3. LEGAL PROCEEDINGS
Our insurance and reinsurance subsidiaries are subject in the course of their business to claims litigation involving, among other things, disputed interpretations of policy coverages. These lawsuits involving claims on policies issued by our subsidiaries which are typical to the insurance industry in general and in the normal course of business are considered in our claims and claim expense reserves which are addressed in the reserve for claims and claim expenses discussion.
In addition to claims litigation, we and our subsidiaries may be subject from time to time to lawsuits or regulatory actions that do not arise from or directly relate to claims on insurance policies. This type of potential litigation could include, for example, allegations of underwriting errors or misconduct, employment claims, regulatory activity or disputes arising from our business ventures. We are not currently subject to any litigation of this type whose impact is likely to be material to us. We believe that over the next few years the ultimate outcomes of matters in this category of business litigation should not have a material adverse effect on our financial condition, future operating results or liquidity, although we believe that litigation of this nature will increase in the future, and it is possible that an adverse resolution of a number of these matters could have a material adverse effect on our results of operations in a particular quarter or fiscal year.
See "Recent Developments" for a discussion of recent subpoenas received.
ITEM 4. SUBMISSION OF MATTERS TO A VOTE OF SECURITY HOLDERS
No matters were submitted to a vote of RenaissanceRe's shareholders during the fourth quarter of 2004.
51
PART II.
ITEM 5. MARKET FOR REGISTRANT'S COMMON EQUITY, RELATED SHAREHOLDER MATTERS AND ISSUER REPURCHASES OF EQUITY SECURITIES
PRICE RANGE OF COMMON SHARES
Our common shares began publicly trading on June 27, 1995. Our New York Stock Exchange symbol is "RNR". The following table sets forth, for the periods indicated, the high and low prices per share of our common shares as reported in composite New York Stock Exchange trading.
| | | | | | | | | | |
| | | Price Range
of Common Shares |
| Period | | High | | Low |
| 2001 | | | | | | | | |
| First Quarter | | $ | 27.95 | | | $ | 21.18 | |
| Second Quarter | | | 25.23 | | | | 20.83 | |
| Third Quarter | | | 29.64 | | | | 22.87 | |
| Fourth Quarter | | | 34.57 | | | | 30.47 | |
| | |
| 2002 | | | | | | | | |
| First Quarter | | | 36.35 | | | | 28.90 | |
| Second Quarter | | | 39.65 | | | | 33.85 | |
| Third Quarter | | | 39.40 | | | | 31.30 | |
| Fourth Quarter | | | 43.24 | | | | 37.49 | |
| | |
| 2003 | | | | | | | | |
| First Quarter | | | 40.78 | | | | 34.40 | |
| Second Quarter | | | 46.93 | | | | 40.07 | |
| Third Quarter | | | 48.69 | | | | 41.15 | |
| Fourth Quarter | | | 49.35 | | | | 44.45 | |
| | |
| 2004 | | | | | | | | |
| First Quarter | | | 54.87 | | | | 48.51 | |
| Second Quarter | | | 56.34 | | | | 48.80 | |
| Third Quarter | | | 54.84 | | | | 48.12 | |
| Fourth Quarter | | | 52.08 | | | | 46.82 | |
| | |
| 2005 | | | | | | | | |
| First Quarter (through March 1, 2005) | | | 51.83 | | | | 47.62 | |
|
At March 1, 2005 the last reported sale price for our common shares was $47.99 per share. At March 1, 2005 there were 132 holders of record of our common shares and approximately 25,000 beneficial holders.
DIVIDEND POLICY
Historically, we have paid dividends on our common shares every quarter, and have increased our dividend during each of the nine years since our initial public offering. The Board of Directors of RenaissanceRe declared regular quarterly dividends of $0.19 per share on March 9, June 1, September 1 and December 3, 2004. The Board of Directors declared regular quarterly dividends of $0.15 per share on March 3, June 2, September 10 and December 5, 2003. Most recently, on March 8, 2005, our Board declared a dividend of $0.20 per share payable on March 31, 2005 to shareholders of
52
record on March 15, 2005. The declaration and payment of dividends are subject to the discretion of the Board and depend on, among other things, our financial condition, general business conditions, legal, contractual and regulatory restrictions regarding the payment of dividends by us and our subsidiaries and other factors which the Board may in the future consider to be relevant. See Item 12 for Equity Compensation Plan information.
Below is a summary of stock repurchases for the quarter ended December 31, 2004 which exclusively represent common stock withholdings from employees surrendered in respect of withholding tax obligations on the vesting of restricted stock, or in lieu of cash payments for the exercise price of employee stock options. RenaissanceRe's Board has authorized a share repurchase program of $150 million. No shares were repurchased under this program in the quarter ended December 31, 2004. See Note 10 of our Notes to Consolidated Financial Statements for information regarding RenaissanceRe's stock repurchase plan.
| | | | | | | | | | | | | | | | | | |
| | | Total
number of
shares
purchased | | Average
price paid
per share | | Total number of
shares purchased as
part of publicly
announced plans or
programs | | Maximum number of
shares that may be
purchased for approximate
dollar values under the
publicly announced plans
or programs available for
repurchase (1) |
| | | | | | | (in thousands) | | (in millions) |
| Beginning shares available to be repurchased | | | — | | | | — | | | | — | | | $ | 150.0 | |
| October 1 — 31, 2004 | | | 451 | (2) | | $ | 48.81 | | | | — | | | | 150.0 | |
| November 1 — 30, 2004 | | | 1,833 | (2) | | | 48.09 | | | | — | | | | 150.0 | |
| December 1 — 31, 2004 | | | — | | | | — | | | | — | | | | 150.0 | |
| Total | | | 2,284 | | | | — | | | | — | | | $ | 150.0 | |
|
| |
| (1) | The Company publicly announced its share repurchase program of $150 million on August 7, 2003. No expiration date has been established for this program. |
| |
| (2) | These repurchases exclusively represent withholdings from employees surrendered in respect of withholding tax obligations on the vesting of restricted stock, or in lieu of cash payments for the exercise price of employee stock options. |
ITEM 6. SELECTED CONSOLIDATED FINANCIAL DATA
The following table sets forth our selected financial data and other financial information at the end of and for each of the years in the five-year period ended December 31, 2004. The historical financial information was prepared in accordance with U.S. GAAP. The statement of income data for the years ended December 31, 2004, 2003, 2002, 2001 and 2000 and the balance sheet data at December 31, 2004, 2003, 2002, 2001 and 2000 were derived from our consolidated financial statements. You should read the selected financial data in conjunction with our consolidated financial statements and related notes thereto and "Management's Discussion and Analysis of Financial Condition and Results of Operations" included in this filing and all other information appearing elsewhere or incorporated into this filing by reference.
See Note 2 to the Consolidated Financial Statements for a discussion of the restated amounts.
53
| | | | | | | | | | | | | | | | | | | | | | |
| Year ended December 31, | | 2004 | | 2003 | | 2002 | | 2001 | | 2000 |
| (in thousands, except per share data) | | | | (Restated) | | (Restated) | | (Restated) | | |
| Statement of Income Data: | |
| Gross premiums written | | $ | 1,544,157 | | | $ | 1,382,209 | | | $ | 1,173,049 | | | $ | 501,321 | | | $ | 433,002 | |
| Net premiums written | | | 1,349,287 | | | | 1,154,776 | | | | 925,964 | | | | 342,341 | | | | 293,303 | |
| Net premiums earned | | | 1,338,227 | | | | 1,118,525 | | | | 763,970 | | | | 334,518 | | | | 267,681 | |
| Net investment income | | | 162,722 | | | | 129,542 | | | | 102,686 | | | | 75,156 | | | | 77,868 | |
| Net realized gains (losses) on sales of investments | | | 23,442 | | | | 80,504 | | | | 10,177 | | | | 18,096 | | | | (7,151 | ) |
| Net claims and claim expenses incurred | | | 1,096,299 | | | | 369,181 | | | | 314,525 | | | | 129,917 | | | | 108,604 | |
| Acquisition costs | | | 244,930 | | | | 194,140 | | | | 95,644 | | | | 45,359 | | | | 38,530 | |
| Operational expenses | | | 56,361 | | | | 67,397 | | | | 49,159 | | | | 39,466 | | | | 37,954 | |
| Income before taxes and change in accounting principle | | | 168,245 | | | | 624,775 | | | | 364,135 | | | | 200,636 | | | | 131,876 | |
| Net income available to common shareholders | | | 133,108 | | | | 605,992 | | | | 342,879 | | | | 184,956 | | | | 127,228 | |
| Earnings per common share — diluted (1) | | | 1.85 | | | | 8.53 | | | | 4.88 | | | | 2.96 | | | | 2.17 | |
| Dividends per common share | | | 0.76 | | | | 0.60 | | | | 0.57 | | | | 0.53 | | | | 0.50 | |
| Weighted average common shares outstanding | | | 71,774 | | | | 71,002 | | | | 70,211 | | | | 62,391 | | | | 58,728 | |
|
| | | | | | | | | | | | | | | | | | | | | | |
| At December 31, | | 2004 | | 2003 | | 2002 | | 2001 | | 2000 |
| (in thousands) | | | | | | (Restated) | | (Restated) | |
| Balance Sheet Data: | | | | | | | | | | | | | | | | | | | | |
| Total investments | | $ | 4,826,249 | | | $ | 4,159,081 | | | $ | 3,077,901 | | | $ | 2,054,715 | | | $ | 964,305 | |
| Total assets | | | 5,526,318 | | | | 4,729,702 | | | | 3,747,173 | | | | 2,670,089 | | | | 1,468,989 | |
| Reserve for claims and claim expenses | | | 1,459,398 | | | | 977,892 | | | | 804,795 | | | | 572,877 | | | | 403,611 | |
| Reserve for unearned premiums | | | 365,335 | | | | 349,824 | | | | 331,985 | | | | 125,053 | | | | 112,541 | |
| Debt | | | 350,000 | | | | 350,000 | | | | 275,000 | | | | 183,500 | | | | 50,000 | |
| Subordinated obligation to capital trust | | | 103,093 | | | | 103,093 | | | | — | | | | — | | | | — | |
| Company obligated mandatorily redeemable capital securities of a subsidiary trust holding solely junior subordinated debentures of RenaissanceRe | | | — | | | | — | | | | 84,630 | | | | 87,630 | | | | 87,630 | |
| Preferred shares | | | 500,000 | | | | 250,000 | | | | 150,000 | | | | 150,000 | | | | — | |
| Total shareholders' equity attributable to common shareholders | | | 2,144,042 | | | | 2,084,643 | | | | 1,490,690 | | | | 1,095,614 | | | | 700,818 | |
| Common shares outstanding | | | 71,029 | | | | 70,399 | | | | 69,750 | | | | 67,893 | | | | 58,863 | |
|
| |
| (1) | Earnings per common share — diluted was calculated by dividing net income available to common shareholders by the number of weighted average common shares and common share equivalents outstanding. Common share equivalents are calculated on the basis of the treasury stock method. |
| | | | | | | | | | | | | | | | | | | | | | |
| Year ended December 31, | | 2004 | | 2003 | | 2002 | | 2001 | | 2000 |
| (in thousands, except ratios) | | | | (Restated) | | (Restated) | | (Restated) | | |
| Segment Information: | | | | | | | | | | | | | | | | | | | | |
| Reinsurance | | | | | | | | | | | | | | | | | | | | |
| Gross premiums written (1) | | $ | 1,066,065 | | | $ | 935,485 | | | $ | 890,470 | | | $ | 451,364 | | | $ | 382,816 | |
| Net premiums written | | | 930,946 | | | | 792,022 | | | | 698,863 | | | | 329,474 | | | | 287,941 | |
| Income (2) | | | 46,389 | | | | 455,777 | | | | 286,713 | | | | 82,971 | | | | 150,003 | |
| Net claims and claim expense ratio | | | 79.0 | % | | | 25.9 | % | | | 40.9 | % | | | 40.5 | % | | | 40.4 | % |
| Underwriting expense ratio | | | 16.1 | % | | | 18.0 | % | | | 16.4 | % | | | 22.4 | % | | | 26.8 | % |
| Combined ratio | | | 95.1 | % | | | 43.9 | % | | | 57.3 | % | | | 62.9 | % | | | 67.2 | % |
| Individual Risk | | | | | | | | | | | | | | | | | | | | |
| Gross premiums written | | $ | 478,092 | | | $ | 446,724 | | | $ | 282,579 | | | $ | 49,957 | | | $ | 50,186 | |
| Net premiums written | | | 418,341 | | | | 362,754 | | | | 227,101 | | | | 12,867 | | | | 5,362 | |
| Income (loss) (2) | | | (105,752 | ) | | | 32,030 | | | | 17,929 | | | | (1,469 | ) | | | (4,406 | ) |
| Net claims and claim expense ratio | | | 89.0 | % | | | 51.7 | % | | | 43.2 | % | | | (30.9 | %) | | | 47.0 | % |
| Underwriting expense ratio | | | 37.9 | % | | | 37.8 | % | | | 37.5 | % | | | 149.6 | % | | | 98.1 | % |
| Combined ratio | | | 126.9 | % | | | 89.5 | % | | | 80.7 | % | | | 118.7 | % | | | 145.1 | % |
|
| |
| (1) | Excludes $18.8 million, $20.8 million and $22.2 million of premium assumed from the Individual Risk segment in the years ended December 31, 2004, 2003 and 2002, respectively. |
| |
| (2) | Income (loss) for the Reinsurance and Individual Risk segments represents net underwriting income. Net underwriting income consists of net premiums earned less claims and claim expenses, acquisition costs and operational expenses. |
54
ITEM 7. MANAGEMENT'S DISCUSSION AND ANALYSIS OF FINANCIAL CONDITION AND RESULTS OF OPERATIONS
The following is a discussion and analysis of our results of operations for the year ended December 31, 2004 compared with the years ended December 31, 2003 and December 31, 2002. The following also includes a discussion of our financial condition at December 31, 2004. This discussion and analysis should be read in conjunction with the audited consolidated financial statements and related notes included in this filing. This filing contains forward-looking statements that involve risks and uncertainties. Actual results may differ materially from the results described or implied by these forward-looking statements (see "Note on Forward-Looking Statements").
OVERVIEW
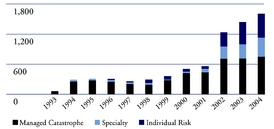
RenaissanceRe was established in 1993 to write property catastrophe reinsurance. By pioneering the use of sophisticated computer models to construct our portfolio, we have become one of the world's largest and most successful catastrophe reinsurers. Recently, we have leveraged our expertise and established growing franchises in additional selected areas of insurance and reinsurance.
Since a substantial portion of the reinsurance and insurance we write provides protection from damages relating to natural and man-made catastrophes, our results depend to a large extent on the frequency and severity of such catastrophic events, and the coverages we offer to clients impacted by these events. Currently, we conduct our business through two reportable segments, Reinsurance and Individual Risk.
Our revenues are principally derived from three sources: 1) net premiums earned from the reinsurance and insurance policies we sell; 2) net investment income and realized gains and losses from the investment of our capital funds and the investment of the cash we receive on the policies which we sell; and 3) other income received from our joint ventures and various other items.
Our expenses primarily consist of: 1) net claims and claim expenses incurred on the policies of reinsurance and insurance we sell; 2) acquisition costs which typically represent a percentage of the premiums we write; 3) operational expenses which primarily consist of personnel expenses, rent and other operating expenses; and 4) interest and dividend costs related to our debt, preference shares and subordinated obligation to our capital trust. We are also subject to taxes in certain jurisdictions in which we operate; however, since the majority of our income is currently earned in Bermuda, a non-taxable jurisdiction, the tax impact to our operations has historically been minimal.
The operational results, also known as the underwriting results, of an insurance or reinsurance company are discussed frequently by reference to its net claims and claim expense ratio, underwriting expense ratio, and combined ratio. The net claims and claim expense ratio is calculated by dividing net claims and claim expenses incurred by net premiums earned. The underwriting expense ratio is calculated by dividing underwriting expenses (acquisition expenses and operational expenses) by net premiums earned. The combined ratio is the sum of the net claims and claim expense ratio and the underwriting expense ratio. A combined ratio below 100% generally indicates profitable underwriting prior to the consideration of investment income. A combined ratio over 100% generally indicates unprofitable underwriting prior to the consideration of investment income. We also discuss our net claims and claim expense ratio on an accident year basis. This ratio is calculated by taking net claims and claim expenses, excluding development on net claims and claim expenses from events that took place in prior years, divided by net premiums earned.
Modeling
We have developed a proprietary, computer-based pricing and exposure management system, Renaissance Exposure Management System (REMS©). REMS© has analytic and modeling capabilities that help us to assess the risk and return of each incremental reinsurance contract in relation to our overall portfolio of reinsurance contracts. Before we bind any risk, exposure data is gathered from clients and this exposure data is input into REMS© modeling system. The REMS© modeling system enables us to measure each policy on a consistent basis and provides us with a measurement of an appropriate price to charge for each policy based upon the risk that is assumed. We combine the
55
analyses generated by REMS© with other information available to us, including our own knowledge of the client submitting the proposed program. While REMS© is most developed in analyzing catastrophe risks, it is also used for analyzing other classes of risk.
REMS© combines computer-generated simulations that estimate event probabilities with exposure and coverage information on each client's reinsurance contract to produce an estimate of expected claims for reinsurance programs submitted to us. We have also customized REMS© by including additional perils, risks and geographic areas that are not captured in the commercially available models.
RESTATEMENT OF FINANCIAL STATEMENTS
As previously disclosed, in the fourth quarter of 2004 we engaged Boies Schiller to complete a review of the Company's business practices in light of the industry-wide investigations by the New York Attorney General and other government authorities into a wide range of practices in the insurance and reinsurance industry. Supervision of this review was subsequently taken over by the Board of Directors, with Boies Schiller reporting directly to the independent members of the Board of Directors. See "Business - Recent Developments." This review has led to the restatement of the Company's audited financial statements for the fiscal years ended December 31, 2003, 2002 and 2001 to correct accounting errors associated with reinsurance ceded by the Company. These restatements arose out of the transactions described below.
Certain of the restatement corrections are attributable to an Aggregate Excess of Loss Reinsurance contract and an Assignment Agreement, each entered into by Renaissance Reinsurance with Inter-Ocean in 2001. The Aggregate Excess of Loss Reinsurance contract initially provided for $45.0 million of maximum limit over a three-year period in exchange for annual premium of $7.3 million. This agreement was subsequently amended to provide for $30.0 million of maximum limit for the same annual premium. The Assignment Agreement provided for the sale by Renaissance Reinsurance to Inter-Ocean of $50.0 million face amount of reinsurance recoverables for $30.0 million. In prior financial statements, the Company accounted for the Aggregate Excess of Loss Reinsurance contract as traditional reinsurance and for the Assignment Agreement as a sale of reinsurance recoverables. In connection with the aforementioned review, the Company concluded that these contracts, based on the totality of the surrounding facts and circumstances, should have been treated as a single transaction and, when so treated, lacked the necessary risk transfer to be accounted for as transactions involving ceded reinsurance and a sale of reinsurance recoverables.
The remaining restatement corrections are attributable to four multi-year ceded reinsurance contracts. The adjustments correct for an error in the amortization period resulting in the amortization of future contractual premium beginning at the end of the third quarter of 2001 rather than beginning at the end of the fourth quarter of 2001.
The aggregate net effect of the corrections is to increase 2003 net income by $1.3 million; to decrease 2002 net income by $21.9 million; and to increase 2001 net income by $20.6 million. The amounts reflect: (1) the timing of the recognition of Inter-Ocean reinsurance recoverables (with the impact of decreasing net income by $1.4 million in 2003; decreasing net income by $25.0 million in 2002; and increasing net income by $26.4 million in 2001), and (2) the timing of premium ceded on multi-year contracts (with the impact of increasing net income by $2.7 million in 2003; increasing net income by $3.1 million in 2002; and decreasing net income by $5.8 million in 2001). These restatements only affect the Reinsurance segment. See Note 2 to our Consolidated Financial Statements.
The independent members of the Board of Directors, in connection with the aforementioned review, have concluded that certain members of senior management (James N. Stanard, Chief Executive Officer; William I. Riker, President; John M. Lummis, Chief Operating Officer/Chief Financial Officer; Michael W. Cash, Senior Vice President; and Martin J. Merritt, Controller) made mistakes and in some instances lacked due care in connection with the original accounting for the Inter-Ocean transactions that led to the restatement. The independent members of the Board of Directors plan to discuss their findings directly with each of the aforementioned executives. The independent members of the Board of Directors also concluded that, since 2001, the Company has made significant improvements in its internal controls, including controls over financial reporting. These improvements include:
56
| |
| • | significantly increasing the number of accounting professionals dedicated to financial reporting; |
| |
| • | hiring a general counsel and developing a legal department, including legal resources dedicated to the Company's reinsurance underwriting function; |
| |
| • | hiring an internal auditor and developing an internal audit function; |
| |
| • | designing and implementing controls related to accounting for complex reinsurance contracts; and |
| |
| • | developing training programs regarding the contractual features contained within reinsurance contracts that may require an accounting review in accordance with the Company's policies and procedures. |
During the last two fiscal years, the Company has also formalized its internal control environment over financial reporting in connection with its compliance with the requirements of Section 404 of the Sarbanes-Oxley Act.
SUMMARY OF CRITICAL ACCOUNTING POLICIES AND ESTIMATES
Claims and Claim Expense Reserves
We believe that the most significant accounting judgment made by management is our estimate of claims and claim expense reserves. Claims reserves represent estimates, including actuarial and statistical projections at a given point in time, of the ultimate settlement and administration costs of claims incurred. Our estimates are not precise in that, among other things, they are based on predictions of future developments and estimates of future trends and other variable factors such as inflation. It is likely that the ultimate liability will be greater or less than such estimates and that, at times, this variance will be material. Also, reserving for our Reinsurance and Individual Risk businesses can involve uncertainty because of the dependence on information from ceding companies, the time lag inherent in reporting information from the primary insurer to us, and differing reserving practices among ceding companies. The information received from ceding companies is typically in the form of bordereaux, broker notifications of loss and/or discussions with ceding companies or their brokers. This information can be received on a monthly, quarterly or transactional basis and normally includes estimates of paid and incurred losses and may sometimes also include an estimate of incurred but not reported reserves ("IBNR").
For our property catastrophe reinsurance business, which is characterized by loss events of low frequency and high severity, reporting of claims in general tends to be prompt (as compared to reporting of claims for "long-tail" products, which tends to be slower). However, the timing of claims reporting also varies depending on various factors, including: whether the claims arise under reinsurance of primary companies or reinsurance of other reinsurance companies; the nature of the events (e.g., hurricanes or earthquakes); the geographic area involved; and the quality of each customer's claims management and reserving practices. Management's judgments as regards to these factors are reflected in management's reserve estimates. Because the events from which claims arise under policies written by our property catastrophe reinsurance business are typically prominent, public occurrences such as hurricanes and earthquakes, we are often able to use independent reports of such events to augment our loss reserve estimation process. However, based upon the amount and timing of the reported claims from any one or more catastrophic event, such reserve estimates may change significantly from one quarter to another. Once we receive a notice of loss under a catastrophe reinsurance contract, we are generally able to process such claims promptly.
For our property catastrophe reinsurance operations, we initially set our claims reserves based on case reserves reported by insureds and ceding companies. We then add to these case reserves our estimates for additional case reserves, and an estimate for IBNR. In addition to the loss information and estimates communicated by cedants, we also utilize industry information which we gather and retain in our REMS© modeling system. When property catastrophe losses do occur, the information stored in
57
our REMS© modeling system enables us to analyze each of our policies against such loss and compare our estimate of the loss with those reported by our policyholders. The REMS© modeling system also allows us to compare and analyze individual losses reported by policyholders affected by the same loss event. Although the REMS modeling system assists with the analysis of the underlying loss, and provides us with the information and ability to perform increased analysis, the estimation of claims resulting from catastrophic events is inherently difficult because of the variability and uncertainty associated with property catastrophe claims and the unique characteristics of each loss. During 2003, with the accumulation of 10 years of historical information on our claims and claim expenses, we adopted a new system to reassess our property catastrophe reserves on our older accident years.
During 2003 our Individual Risk segment began issuing insurance policies for certain commercial liability coverages, including general, automobile and professional liability risks. The claim reporting and claim development periods of these risks are generally expected to be longer than the reporting and development periods for our property risks, and accordingly there is normally greater uncertainty in the estimation of the reserves associated with these policies.
The loss estimation for the coverages we offer through our specialty reinsurance and Individual Risk operations is different than that for property catastrophe oriented coverages because these coverages are potentially subject to greater uncertainties, relating to factors such as long-term inflation and changes in the social and legal environment. Moreover, in reserving for our specialty reinsurance and Individual Risk coverages we do not have the benefit of a significant amount of our own historical experience in these lines. We estimate our IBNR for these coverages by utilizing an actuarial method known as the Bornhuetter-Ferguson technique. The utilization of the Bornhuetter-Ferguson technique requires us to estimate an ultimate claims and claim expense ratio and select an estimated loss reporting pattern. We select our estimates of the ultimate claims and claim expense ratios and estimated loss reporting patterns by reviewing industry standards and adjusting these standards based upon the terms of the coverages we offer. The estimated claims and claim expense ratio may be modified to the extent that reported losses at a given point in time differ from what would be expected based on the selected loss reporting pattern. For the Company's specialty and Individual Risk lines we also considered estimating reserves utilizing paid and incurred development methods. We elected to utilize the Bornhuetter-Ferguson technique because this method allows for weight to be applied to expected results, and hence is less susceptible to the potential pitfall of being excessively swayed by one year or one quarter of paid and/or reported loss data.
The Company's reserving methodology for each line of business, as discussed above, utilizes a loss reserving model that calculates a point estimate for the Company's ultimate losses as opposed to a methodology that develops a range of estimates. The Company then utilizes this point estimate, along with paid and incurred data, to record its estimate of IBNR. The Company does not utilize sensitivity analysis in calculating reserves and therefore does not make any specific quantitative assumptions in connection with such an analysis. See "Reserves for Claims and Claim Expenses" for a breakdown of our case reserves and IBNR by line of business.
Because any reserve estimate is simply an insurer's estimate of its ultimate liability, and because there are numerous factors which affect reserves but cannot be determined with certainty in advance, our ultimate payments will vary, perhaps materially, from our initial estimate of reserves. Therefore, because of these inherent uncertainties, we have developed a reserving philosophy which attempts to incorporate prudent assumptions and estimates. In 2005, assuming future reported and paid claims activity is consistent with that of recent quarters, and barring unforeseen circumstances, we believe that, as our reserves on older accident years continue to age, we may experience further reductions to our older accident year reserves.
All of our estimates are reviewed annually with an independent actuarial firm. We also review certain assumptions and methodologies on a quarterly basis. If we determine that adjustments to an earlier estimate are appropriate, such adjustments are recorded in the quarter in which they are identified. Adjustments to our prior year estimated claims reserves will impact our current year net income by increasing our net income if the prior year estimated claims reserves are determined to be overstated, or by reducing our net income if the prior year estimated claims reserves prove to be insufficient.
58
During the years ended December 31, 2004, 2003 and 2002, changes to prior year estimated claims reserves had the following impact: for 2004, prior year estimated claims reserves were reduced by $140.3 million; for 2003, prior year estimated claims reserves were reduced by $93.6 million; and for 2002, prior year estimated claims reserves were increased by $23.0 million; and in each year there was a corresponding increase or decrease to net income. Although we believe we are cautious in our assumptions, and in the application of our methodologies, we cannot be certain that our ultimate payments will not vary, perhaps materially, from the estimates we have made. (Also see – "Reserves for Claims and Claim Expenses.")
Losses Recoverable
We enter into reinsurance agreements in order to help reduce our exposure to large losses. Amounts recoverable from reinsurers are estimated in a manner consistent with the claims and claim expense reserves associated with the underlying reinsured policies. For multi-year retrospectively rated contracts, we accrue amounts (either assets or liabilities) that are due to or from assuming companies based on estimated contract experience. If we determine that adjustments to earlier estimates are appropriate, such adjustments are recorded in the quarter in which they are determined.
The estimate of losses recoverable can be more subjective than estimating the underlying claims and claim expense reserves as discussed under the heading "Claims and Claim Expense Reserves" above. In particular, losses recoverable may be affected by deemed inuring reinsurance, industry losses reported by various statistical reporting services, and other factors. In addition, the level of IBNR reserves has a significant impact on losses recoverable. These factors can impact the amount of the losses recoverable to be recorded as well as delay the recognition of losses recoverable to reporting periods that are different from the underlying loss.
The amount of losses recoverable ultimately collected is also open to uncertainty due to insolvency, contractual dispute and various other reasons. Amounts estimated to be uncollectible are reflected in a valuation allowance that reduces losses recoverable and net income. We estimate the valuation allowance by applying specific percentages against each losses recoverable balance based on the counterparty's credit rating. The percentages applied are based on historical industry default statistics developed by major rating agencies and are then adjusted by us based on industry knowledge. We also apply case specific valuation allowances against certain losses recoverables that we deem unlikely to be able to recover in full. The valuation allowance against losses recoverable was $13.1 million at December 31, 2004 (2003 - $11.6 million).
Premiums
We recognize premiums as revenue over the terms of the related contracts and policies. Our written premiums are based on policy and contract terms and include estimates based on information received from both insureds and ceding companies. The information received is typically in the form of a bordereau, broker notifications and/or discussions with ceding companies or their broker. This information can be received on a monthly, quarterly or transactional basis and normally includes estimates of written premium (including adjustment and reinstatement premium), earned premium, acquisition costs and ceding commissions.
Consistent with industry practice, we recognize premium on the date the contract is bound, even if the contract provides for an effective date prior to the date the contract is bound, thus preventing premature revenue recognition. The date the contract is bound is the date we are on risk for the policy and this is generally the date on which the reinsurance slip is signed. The signing of the reinsurance contract normally occurs after the date the slip is signed.
We book premiums on non-proportional contracts in accordance with the contract terms. Premiums written on losses occurring contracts are typically earned over the contract period. Premiums on risks attaching contracts are generally earned as reported by the cedants, which may be over a period more than twice as long as the contract period. For multi-year policies, only the initial annual premium is included as written at policy inception. The remaining annual premiums are included as written at
59
each successive anniversary date within the multi-year term. Management is required to make estimates based on judgment and historical experience for periods during which information has not yet been received.
In our Individual Risk business, it is often necessary to estimate portions of premiums written from quota-share contracts and by program managers and the related commission expense. Management estimates these amounts based on discussions with ceding companies and program managers, together with historical experience and judgment. Total premiums written estimated in our Individual Risk business at December 31, 2004, 2003 and 2002 were $30.1 million, $103.7 million and $74.6 million, respectively. The large accrual at December 31, 2003 was primarily due to one large contract where there was a delay in reporting actual figures to us and accordingly we accrued our best estimate of the premiums written as at December 31, 2003 on this contract. At December 31, 2004, there was no such delay on this contract and accordingly there was a corresponding reduction in our year-end premium accruals for our Individual Risk business. Total commissions estimated at December 31, 2004, 2003 and 2002 were $9.1 million, $32.3 million and $20.1 million, respectively. Management tracks the actual premium received and commissions incurred and compares this to the estimates previously booked. Such estimates are subject to adjustment in subsequent periods when actual figures are recorded. To date such subsequent adjustments have not been material.
Since premiums for our Reinsurance segment are contractually driven and the reporting lag for such premiums is minimal, estimates for premiums written for this segment are usually not significant. The minimum and deposit premiums on excess policies are usually set forth in the language of the contract and are utilized to record premiums on these policies. Actual premiums are determined in subsequent periods based on actual exposures and any adjustments are recorded in the period in which they are identified.
Reinstatement premiums are recorded after the occurrence of a loss and are calculated in accordance with the contract terms based upon paid losses and case reserves reported in the period. Reinstatement premiums are earned when written.
Ceded premiums are also recognized on the date the contract is bound and are deducted from gross written premium, to arrive at net premiums written. Ceded premiums are earned over the terms of the related contracts and policies, and are reflected as a reduction to gross premiums earned to arrive at net premiums earned.
60
SUMMARY OF RESULTS OF OPERATIONS FOR 2004, 2003 AND 2002
The following tables present our consolidated results by segment.
| | | | | | | | | | | | | | | | | | | | | | |
| Year ended December 31, 2004 | | Reinsurance | | Individual
Risk | | Eliminations (1) | | Other | | Total |
| (in thousands) | |
| Gross premiums written | | $ | 1,084,896 | | | $ | 478,092 | | | $ | (18,831 | ) | | $ | — | | | $ | 1,544,157 | |
| Net premiums written | | $ | 930,946 | | | $ | 418,341 | | | | | | | | — | | | $ | 1,349,287 | |
| Net premiums earned | | $ | 944,527 | | | $ | 393,700 | | | | | | | | — | | | $ | 1,338,227 | |
| Net claims and claim expenses incurred | | | 746,010 | | | | 350,289 | | | | | | | | — | | | | 1,096,299 | |
| Acquisition expenses | | | 117,145 | | | | 127,785 | | | | | | | | — | | | | 244,930 | |
| Operational expenses | | | 34,983 | | | | 21,378 | | | | | | | | — | | | | 56,361 | |
| Underwriting income (loss) | | $ | 46,389 | | | $ | (105,752 | ) | | | | | | | — | | | | (59,363 | ) |
| Net investment income | | | | | | | | | | | | | | | 162,722 | | | | 162,722 | |
| Equity in earnings of unconsolidated ventures | | | | | | | | | | | | | | | 31,081 | | | | 31,081 | |
| Other income | | | | | | | | | | | | | | | 18,903 | | | | 18,903 | |
| Other items, net | | | | | | | | | | | | | | | (27,995 | ) | | | (27,995 | ) |
| Interest and preferred share dividends | | | | | | | | | | | | | | | (57,102 | ) | | | (57,102 | ) |
| Minority interest — DaVinciRe | | | | | | | | | | | | | | | 41,420 | | | | 41,420 | |
| Net realized gains on investments | | | | | | | | | | | | | | | 23,442 | | | | 23,442 | |
| Net income available to common shareholders | | | | | | | | | | | | | | $ | 192,471 | | | $ | 133,108 | |
| Net claims and claim expenses incurred — current accident year | | $ | 859,842 | | | $ | 376,723 | | | | | | | | | | | $ | 1,236,565 | |
| Net claims and claim expenses incurred — prior years | | | (113,832 | ) | | | (26,434 | ) | | | | | | | | | | | (140,266 | ) |
| Net claims and claim expenses incurred — total | | $ | 746,010 | | | $ | 350,289 | | | | | | | | | | | $ | 1,096,299 | |
| Net claims and claim expense ratio — accident year | | | 91.0 | % | | | 95.7 | % | | | | | | | | | | | 92.4 | % |
| Net claims and claim expense ratio — calendar year | | | 79.0 | % | | | 89.0 | % | | | | | | | | | | | 81.9 | % |
| Underwriting expense ratio | | | 16.1 | % | | | 37.9 | % | | | | | | | | | | | 22.5 | % |
| Combined ratio | | | 95.1 | % | | | 126.9 | % | | | | | | | | | | | 104.4 | % |
|
| |
| (1) | Represents premium ceded from the Individual Risk segment to the Reinsurance segment. |
| | | | | | | | | | | | | | | | | | | | | | |
| Year ended December 31, 2003 (Restated) | | Reinsurance | | Individual
Risk | | Eliminations (1) | | Other | | Total |
| (in thousands) | |
| Gross premiums written | | $ | 956,257 | | | $ | 446,724 | | | $ | (20,772 | ) | | $ | — | | | $ | 1,382,209 | |
| Net premiums written | | $ | 792,022 | | | $ | 362,754 | | | | | | | | — | | | $ | 1,154,776 | |
| Net premiums earned | | $ | 812,142 | | | $ | 306,383 | | | | | | | | — | | | $ | 1,118,525 | |
| Net claims and claim expenses incurred | | | 210,634 | | | | 158,547 | | | | | | | | — | | | | 369,181 | |
| Acquisition expenses | | | 93,227 | | | | 100,913 | | | | | | | | — | | | | 194,140 | |
| Operational expenses | | | 52,504 | | | | 14,893 | | | | | | | | — | | | | 67,397 | |
| Underwriting income | | $ | 455,777 | | | $ | 32,030 | | | | | | | | — | | | | 487,807 | |
| Net investment income | | | | | | | | | | | | | | | 129,542 | | | | 129,542 | |
| Equity in earnings of unconsolidated ventures | | | | | | | | | | | | | | | 21,167 | | | | 21,167 | |
| Other income | | | | | | | | | | | | | | | 5,903 | | | | 5,903 | |
| Other items, net | | | | | | | | | | | | | | | (2,394 | ) | | | (2,394 | ) |
| Interest, preferred share dividends, Capital Securities minority interest | | | | | | | | | | | | | | | (44,523 | ) | | | (44,523 | ) |
| Minority interest — DaVinciRe | | | | | | | | | | | | | | | (72,014 | ) | | | (72,014 | ) |
| Net realized gains on investments | | | | | | | | | | | | | | | 80,504 | | | | 80,504 | |
| Net income available to common shareholders | | | | | | | | | | | | | | $ | 118,185 | | | $ | 605,992 | |
| Net claims and claim expenses incurred — current accident year | | $ | 279,334 | | | $ | 183,482 | | | | | | | | | | | $ | 462,816 | |
| Net claims and claim expenses incurred — prior years | | | (68,700 | ) | | | (24,935 | ) | | | | | | | | | | | (93,635 | ) |
| Net claims and claim expenses incurred — total | | $ | 210,634 | | | $ | 158,547 | | | | | | | | | | | $ | 369,181 | |
| Net claims and claim expense ratio — accident year | | | 34.4 | % | | | 59.9 | % | | | | | | | | | | | 41.4 | % |
| Net claims and claim expense ratio — calendar year | | | 25.9 | % | | | 51.7 | % | | | | | | | | | | | 33.0 | % |
| Underwriting expense ratio | | | 18.0 | % | | | 37.8 | % | | | | | | | | | | | 23.4 | % |
| Combined ratio | | | 43.9 | % | | | 89.5 | % | | | | | | | | | | | 56.4 | % |
|
| |
| (1) | Represents premium ceded from the Individual Risk segment to the Reinsurance segment. |
61
| | | | | | | | | | | | | | | | | | | | | | |
| Year ended December 31, 2002 (Restated) | | Reinsurance | | Individual
Risk | | Eliminations (1) | | Other | | Total |
| (in thousands) | |
| Gross premiums written | | $ | 912,695 | | | $ | 282,579 | | | $ | (22,225 | ) | | $ | — | | | $ | 1,173,049 | |
| Net premiums written | | $ | 698,863 | | | $ | 227,101 | | | | | | | | — | | | $ | 925,964 | |
| Net premiums earned | | $ | 670,991 | | | $ | 92,979 | | | | | | | | — | | | $ | 763,970 | |
| Net claims and claim expenses incurred | | | 274,316 | | | | 40,209 | | | | | | | | — | | | | 314,525 | |
| Acquisition expenses | | | 70,698 | | | | 24,946 | | | | | | | | — | | | | 95,644 | |
| Operational expenses | | | 39,264 | | | | 9,895 | | | | | | | | — | | | | 49,159 | |
| Underwriting income | | $ | 286,713 | | | $ | 17,929 | | | | | | | | — | | | | 304,642 | |
| Net investment income | | | | | | | | | | | | | | | 102,686 | | | | 102,686 | |
| Equity in earnings of unconsolidated ventures | | | | | | | | | | | | | | | 22,339 | | | | 22,339 | |
| Other income | | | | | | | | | | | | | | | 10,482 | | | | 10,482 | |
| Other items, net | | | | | | | | | | | | | | | (10,351 | ) | | | (10,351 | ) |
| Interest, preferred share dividends, Capital Securities minority interest | | | | | | | | | | | | | | | (32,858 | ) | | | (32,858 | ) |
| Minority interest — DaVinciRe | | | | | | | | | | | | | | | (55,051 | ) | | | (55,051 | ) |
| Cumulative effect of a change in accounting principle | | | | | | | | | | | | | | | (9,187 | ) | | | (9,187 | ) |
| Net realized gains on investments | | | | | | | | | | | | | | | 10,177 | | | | 10,177 | |
| Net income available to common shareholders | | | | | | | | | | | | | | $ | 38,237 | | | $ | 342,879 | |
| Net claims and claim expenses incurred — current accident year | | $ | 254,387 | | | $ | 37,133 | | | | | | | | | | | $ | 291,520 | |
| Net claims and claim expenses incurred — prior years | | | 19,929 | | | | 3,076 | | | | | | | | | | | | 23,005 | |
| Net claims and claim expenses incurred — total | | $ | 274,316 | | | $ | 40,209 | | | | | | | | | | | $ | 314,525 | |
| Net claims and claim expense ratio — accident year | | | 37.9 | % | | | 39.9 | % | | | | | | | | | | | 38.2 | % |
| Net claims and claim expense ratio — calendar year | | | 40.9 | % | | | 43.2 | % | | | | | | | | | | | 41.2 | % |
| Underwriting expense ratio | | | 16.4 | % | | | 37.5 | % | | | | | | | | | | | 19.0 | % |
| Combined ratio | | | 57.3 | % | | | 80.7 | % | | | | | | | | | | | 60.2 | % |
|
| |
| (1) | Represents premium ceded from the Individual Risk segment to the Reinsurance segment. |
Summary Overview
Our 2004 net income was $133.1 million compared to net income of $606.0 million in 2003. The substantial decline in net income results from the four large hurricanes, Charley, Frances, Jeanne and Ivan, that occurred during the third quarter of 2004, which together caused a negative impact of $570.2 million to our 2004 results. This impact is reflected in the following items: net losses of $725.5 million, plus the reversal of previously accrued profit commission of $12.6 million, which is reflected as an increase to acquisition expenses of the Reinsurance segment, less reinstatement premiums earned of $30.1 million and less minority interest offset of $137.8 million. These amounts are based on management's estimates following a review of our potential exposures and discussions with our counterparties. Given the magnitude of these loss events and due to delays in receiving claims data, these results are subject to change based on developments including new or revised data received from our counterparties. Additionally, depending on the ultimate level of the industry losses from these events, it is possible that in future periods additional recoveries from certain of our retrocessional coverages may be triggered and result in a reduction to our net losses from these events. Changes to these estimates will be recorded in the period in which they occur.
Other significant items affecting 2004 net income include a reduction of prior years estimated ultimate net claims reserves of $140.3 million, an increase in investment income of $33.2 million, and
62
reductions in net realized gains on investments of $57.1 million. The reduction in prior years' estimated ultimate net claims reserves was primarily due to a re-estimation of our ultimate losses associated with six large catastrophe events, which produced a reduction of approximately $31.3 million, a $23.0 million reduction in reserves from numerous smaller catastrophe events, $46.8 million in reductions from our specialty book of business, and $26.4 million in reductions from our Individual Risk book of business. The reductions in our reserves for the smaller catastrophe events, the reserves for the specialty book of business and the reserves for our Individual Risk book of business were driven by the application of our formulaic reserving methodology used for these books of business and is primarily due to the actual paid and reported loss activity being better than what we had anticipated when setting the initial ultimate claims and claim expense ratios and the initial loss reporting patterns. The increase in investment income was largely due to $46.9 million of income and appreciation related to investments in hedge funds, private equity funds and other alternative investments recorded during 2004 compared to $25.9 million recorded during 2003. The increase in investment income and appreciation was due to both higher returns and a greater level of investment in these other investments in 2004 compared to 2003.
Our net income increased to $606.0 million in 2003 from $342.9 million in 2002, primarily due to an increase in our net premiums earned of $354.6 million and an increase in net realized gains on investments of $70.3 million. The increase in net premiums earned was primarily due to improved market conditions associated with the dislocation which occurred after the World Trade Center disaster, and the significant losses stemming from this event. These losses caused an imbalance in the supply and demand for our insurance and reinsurance products, and as a result, we increased our written premiums, in both our established property catastrophe line and our specialty reinsurance line, and also increased our premiums in our Individual Risk operations. Contributing to the increase in Individual Risk operations during 2003 was the continued growth of: 1) our program manager distribution channel, where we write primary insurance through specialized program managers; and 2) our quota share reinsurance distribution channel, where we write quota share reinsurance with primary insurers (see below for underwriting results by segment). Also, net income for 2003 was positively affected by a reduction of prior years estimated ultimate net claims reserves of $93.6 million and by a reduced level of catastrophe loss events occurring in 2003.
Underwriting Results by Segment
We conduct our business through two reportable segments, Reinsurance and Individual Risk. Our Reinsurance segment provides reinsurance through our catastrophe reinsurance and specialty reinsurance business units and through Ventures. Our Individual Risk segment provides primary insurance and quota share reinsurance.
Our underwriting results by segment are provided below:
Reinsurance Segment
Our Reinsurance operations are comprised of three business units: 1) property catastrophe reinsurance, primarily written through Renaissance Reinsurance and DaVinci; 2) specialty reinsurance, primarily written through Renaissance Reinsurance and DaVinci; and 3) certain activities of Ventures.
63
The following table summarizes the underwriting results and ratios for the Reinsurance segment for the years ended December 31, 2004, 2003 and 2002:
| | | | | | | | | | | | | | | | | | | | | | |
| Reinsurance segment overview | |
| Year ended December 31, | | 2004 | | 2003 | | 2002 | |
| (in thousands) | | | | (Restated) | | (Restated) | |
| Property catastrophe premium (1) | | | | | | | | | | | | | |
| Renaissance | | $ | 533,339 | | | $ | 488,124 | | | $ | 455,628 | | |
| DaVinci | | | 149,840 | | | | 155,541 | | | | 187,822 | | |
| Total property catastrophe premium | | | 683,179 | | | | 643,665 | | | | 643,450 | | |
| Specialty premium | | | | | | | | | | | | | |
| Renaissance | | | 351,261 | | | | 268,506 | | | | 247,020 | | |
| DaVinci | | | 31,625 | | | | 23,314 | | | | — | | |
| Total specialty premium | | | 382,886 | | | | 291,820 | | | | 247,020 | | |
| Total Reinsurance gross premium written | | $ | 1,066,065 | | | $ | 935,485 | | | $ | 890,470 | | |
| Net premium written | | $ | 930,946 | | | $ | 792,022 | | | $ | 698,863 | | |
| Net premium earned — property catastrophe | | $ | 576,049 | | | $ | 501,529 | | | $ | 465,536 | | |
| Net premium earned — specialty | | | 368,478 | | | | 310,613 | | | | 205,455 | | |
| Total net premium earned | | | 944,527 | | | | 812,142 | | | | 670,991 | | |
| Net claims and claim expenses incurred | | | 746,010 | | | | 210,634 | | | | 274,316 | | |
| Acquisition expenses | | | 117,145 | | | | 93,227 | | | | 70,698 | | |
| Operational expenses | | | 34,983 | | | | 52,504 | | | | 39,264 | | |
| Underwriting income | | $ | 46,389 | | | $ | 455,777 | | | $ | 286,713 | | |
| Net claims and claim expenses incurred — current accident year | | $ | 859,842 | | | $ | 279,334 | | | $ | 254,387 | | |
| Net claims and claim expenses incurred — prior years | | | (113,832 | ) | | | (68,700 | ) | | | 19,929 | | |
| Net claims and claim expenses incurred — total | | $ | 746,010 | | | $ | 210,634 | | | $ | 274,316 | | |
| Net claims and claim expense ratio — accident year | | | 91.0 | % | | | 34.4 | % | | | 37.9 | % | |
| Net claims and claim expense ratio | | | 79.0 | % | | | 25.9 | % | | | 40.9 | % | |
| Underwriting expense ratio | | | 16.1 | | | | 18.0 | | | | 16.4 | | |
| Combined ratio | | | 95.1 | % | | | 43.9 | % | | | 57.3 | % | |
|
| |
| (1) | Excludes combined premium assumed from the Individual Risk segment of $18.8 million, $20.8 million and $22.2 million for the years ended December 31, 2004, 2003 and 2002, respectively. |
Premiums
Property catastrophe – The $39.5 million increase in property catastrophe premiums was mainly due to reinstatement premiums of $30.1 million and premiums for back-up covers of $27.4 million written as a result of the third quarter hurricanes. Excluding these premiums, which in the absence of a major catastrophe we would not expect to recur, our property catastrophe premiums declined slightly from 2003.
During 2003 our consolidated property catastrophe premiums remained flat, primarily due to increased competition and due to some softening of prices in the market, where we accordingly chose not to renew certain policies.
During 2005, we are currently anticipating a decline in our property catastrophe premiums. (See "Current Outlook" for additional disclosure.)
Specialty reinsurance – During 2004 and 2003 our consolidated specialty reinsurance written premiums increased by $91.1 million and $44.8 million, respectively. These increases were primarily due to our continued focus on a few targeted areas of this market where we believe we can leverage our expertise, including surety, casualty, property and terrorism-specific classes of reinsurance. The areas representing the majority of the 2003 increase were catastrophe exposed workers' compensation and terrorism-specific reinsurance.
64
During 2005, we currently expect our specialty reinsurance premium to grow modestly. However, our expectations for this business remain prone to potential volatility as this business is characterized by a relatively small number of large transactions. (See "Current Outlook" for additional disclosure.)
Gross Premiums Written by Geographic Region
The following is a summary of our reinsurance premiums by geographic region:
| | | | | | | | | | | | | | |
Reinsurance segment gross written premium
Year ended December 31, | | 2004 | | 2003 | | 2002 |
| (in thousands) | | | | | | |
| Property catastrophe | | | | | | | | | | | | |
| United States and Caribbean | | $ | 338,315 | | | $ | 297,954 | | | $ | 310,090 | |
| Europe | | | 141,385 | | | | 156,156 | | | | 86,461 | |
| Worldwide | | | 90,607 | | | | 126,541 | | | | 169,790 | |
| Australia and New Zealand | | | 28,614 | | | | 26,588 | | | | 2,127 | |
| Worldwide (excluding U.S) (1) | | | 63,529 | | | | 14,968 | | | | 56,628 | |
| Other | | | 20,729 | | | | 21,458 | | | | 18,354 | |
| Specialty reinsurance (2) | | | 382,886 | | | | 291,820 | | | | 247,020 | |
| Total reinsurance gross premiums written (3) | | $ | 1,066,065 | | | $ | 935,485 | | | $ | 890,470 | |
|
| |
| (1) | The category "Worldwide (excluding U.S.)" consists of contracts that cover more than one geographic region (other than the U.S.). The exposure in this category for gross written premiums written to date is predominantly from Europe and Japan. |
| |
| (2) | The category specialty reinsurance consists of contracts that are predominantly exposed to U.S. risks, with a small portion of the risks being Worldwide. |
| |
| (3) | Excludes $18.8 million, $20.8 million and $22.2 million of total premium assumed by the Reinsurance segment from the Individual Risk segment in 2004, 2003 and 2002, respectively. |
Ceded Premiums Written
| | | | | | | | | | | | | | |
| Year ended December 31, | | 2004 | | 2003 | | 2002 |
| (in thousands) | | | | | | |
| Ceded premiums written — Reinsurance segment | | $ | 135,119 | | | $ | 143,463 | | | $ | 191,607 | |
|
Because of the potential volatility of the property catastrophe reinsurance business, we purchase reinsurance to reduce our exposure to large losses. We use our REMS© modeling system to evaluate how each purchase interacts with our portfolio of reinsurance contracts we write, and with the other ceded reinsurance contracts we purchase, to determine the appropriateness of the pricing of each contract. During 2004 and 2003, we reduced the level of reinsurance purchased because of the reduction in the availability of appropriately priced coverages.
Although we would remain liable to the extent that any of our reinsurers fail to pay our claims, before placing reinsurance we evaluate the financial condition of our reinsurers. At December 31, 2004, the majority of the $217.8 million of net losses recoverable relates to outstanding claims reserves on our books (as distinguished from claims that we have already paid), and, in accordance with the terms of the policies, we generally must wait to collect from our reinsurers until we pay the underlying claims. We expect to collect the recorded net balance of the losses recoverable.
To the extent that appropriately priced coverage is available, we anticipate continued use of reinsurance to reduce the potential volatility of our results.
Underwriting Results
The 2004 underwriting results for the Reinsurance segment decreased to $46.4 million of underwriting income, compared to underwriting income of $455.8 million in 2003. The significant decline is
65
primarily attributable to the $549.7 million negative impact from the four large hurricanes that occurred during the third quarter. This impact is reflected in the following items: net losses of $581.8 million, plus the reversal of previously accrued profit commission of $12.6 million, which is reflected as an increase to acquisition expenses of the reinsurance segment, less reinstatement premiums earned of $44.7 million. Because we do not include minority interest in our summary of underwriting income in the table above, the $549.7 million referred to above does not reflect the $137.8 million offset for the minority interest of the 74.75% shareholders of DaVinciRe, which, when considered, would result in the net $411.9 million total effect to the reinsurance segment.
Offsetting the effect of the hurricanes above was a reduction of prior years estimated ultimate net claims reserves of $113.8 million. The reduction in prior years' estimated ultimate net claims reserves was primarily due to a re-estimation of our ultimate losses associated with six large catastrophe events, which produced a reduction of approximately $31.3 million, a $23.0 million reduction in reserves from numerous smaller catastrophe events, and $46.8 million in reductions from our specialty book of business. The reductions in our reserves for the smaller catastrophe events and the reserves for the specialty book of business were driven by the application of our formulaic reserving methodology used for these books of business and were primarily due to the actual paid and reported loss activity being better than what we had anticipated when estimating the initial ultimate claims and claims expense ratios and the initial loss reporting patterns.
The increase in our 2003 net underwriting income from our Reinsurance segment, compared to 2002, was primarily the result of three factors: 1) the comparably low level of property catastrophe losses during 2003 which reduced our net claims and claim expenses by approximately $40.0 million; 2) favorable development on prior period reserves which contributed $68.7 million of a reduction in net claims and claim expenses; and 3) the increase in our net reinsurance premiums earned during 2003, as a result of our increase in gross written property catastrophe premiums in 2002 and the increase in our gross written specialty reinsurance premiums in 2002 and 2003.
Losses from our property catastrophe reinsurance and specialty reinsurance policies can be infrequent, but severe, as demonstrated in the variation of our results during 2004 as compared to 2003 and 2002. During periods with benign property catastrophe loss activity, such as 2003 and 2002, we have the potential to produce a low level of losses and a related increase in underwriting income.
Also during 2004 and 2003, as discussed under the "Premiums" heading above, we have continued to increase our specialty reinsurance premiums written. This increase in specialty reinsurance premiums will normally produce higher net claims and claim expenses than the property catastrophe reinsurance business which will generally cause the combined ratio of our Reinsurance segment to increase in years with normal cat loss activity.
Our underwriting expenses consist of acquisition expenses and operational expenses. Acquisition expenses consist of costs to acquire premiums and are principally comprised of broker commissions and excise taxes. Acquisition expenses are driven by contract terms and are normally a set percentage of premiums and, accordingly, these costs will normally fluctuate in line with the fluctuation in premiums. Operational expenses consist of salaries and other general and administrative expenses. Our reinsurance business operates with a limited number of employees and we have the ability to grow our written premiums without proportionally increasing our operating expenses. The decrease in our operational expenses in 2004 by $17.5 million was primarily due to a reduction of $20.1 million in executive compensation and bonus and incentive compensation due to changes in the compensation structure of certain executives and also due to the reduction in underwriting profit in 2004 (see – "Capital Resources" below). The increase in underwriting expenses during 2003 was primarily due to an increase in acquisition costs on our specialty reinsurance business, which is attributable to commission costs related to certain quota share premiums written in 2003 which typically carry higher acquisition costs than our excess of loss contracts.
We have entered into joint ventures and specialized quota share cessions of our book of business. In accordance with the joint venture and quota share agreements, we are entitled to certain fee income and profit commissions. We record these fees and profit commissions as a reduction in acquisition expenses or operating expenses and, accordingly, these fees have also contributed to the reduction in our expense ratio.
66
During 2005, given the magnitude of the hurricane losses of 2004 and due to delays in receiving claims data and the likelihood of receiving new or revised data from our counterparties, the estimates of hurricane losses and related recoveries are likely to change. Changes in these estimates will be recorded in the period in which they occur.
Also during 2005, as discussed in our critical accounting policies, because our reserve estimate is simply our estimate of our ultimate liability, and since there are numerous factors which affect reserves but cannot be determined with certainty in advance, our ultimate payments will vary, perhaps materially, from our initial estimate of reserves. In response to these inherent uncertainties, we have developed a reserving philosophy which attempts to incorporate prudent assumptions and estimates. Accordingly, if actual paid losses and incurred losses reported to us are below those utilized to establish initial IBNR reserves, we would reflect positive development in our prior year reserves, as has occurred in our 2003 and 2004 results. During 2005, assuming future reported and paid net claims activity is consistent with that of recent quarters, and barring unforeseen circumstances, we believe that, as our reserves on older accident years continue to age, we may experience further reductions to our older accident year reserves. There can be no assurance, however, that this will occur, and if our actual paid and incurred losses exceed our estimates, we would instead reflect adverse rather than positive development.
Individual Risk Segment
We define our Individual Risk segment to include underwriting that involves understanding the exposure characteristics of the original underlying insurance policy. Our principal products include: 1) commercial and homeowners property coverages, including catastrophe-exposed lines; 2) commercial liability coverages, including general, automobile, professional and various specialty lines; and 3) reinsurance to other insurers on a quota share basis. We operate through the Glencoe Group of companies, whose principal operating subsidiaries are Glencoe, Stonington and Lantana.
The following table summarizes the underwriting results and ratios for the Individual Risk segment for the years ended December 31, 2004, 2003, and 2002:
| | | | | | | | | | | | | | |
Individual Risk segment
Year ended December 31, | | 2004 | | 2003 | | 2002 |
| (in thousands) | | | | | | |
| Gross premium written | | $ | 478,092 | | | $ | 446,724 | | | $ | 282,579 | |
| Net premium written | | $ | 418,341 | | | $ | 362,754 | | | $ | 227,101 | |
| Net premium earned | | $ | 393,700 | | | $ | 306,383 | | | $ | 92,979 | |
| Net claims and claim expenses incurred | | | 350,289 | | | | 158,547 | | | | 40,209 | |
| Acquisition expenses | | | 127,785 | | | | 100,913 | | | | 24,946 | |
| Operational expenses | | | 21,378 | | | | 14,893 | | | | 9,895 | |
| Underwriting income (loss) | | $ | (105,752 | ) | | $ | 32,030 | | | $ | 17,929 | |
| Net claims and claim expenses incurred — current accident year | | $ | 376,723 | | | $ | 183,482 | | | $ | 37,133 | |
| Net claims and claim expenses incurred — prior years | | | (26,434 | ) | | | (24,935 | ) | | | 3,076 | |
| Net claims and claim expenses incurred — total | | $ | 350,289 | | | $ | 158,547 | | | $ | 40,209 | |
| Net claims and claim expense ratio — accident year | | | 95.7 | % | | | 59.9 | % | | | 39.9 | % |
| Net claims and claim expense ratio | | | 89.0 | % | | | 51.7 | % | | | 43.2 | % |
| Underwriting expense ratio | | | 37.9 | | | | 37.8 | | | | 37.5 | |
| Combined ratio | | | 126.9 | % | | | 89.5 | % | | | 80.7 | % |
|
Premiums
The increase in gross premiums written from our Individual Risk operations of $31.4 million in 2004 was primarily the result of our addition of new programs and expansion of existing programs
67
compared to the prior year. The 2004 growth in individual risk premiums is below our expectations due to later inceptions of certain programs than previously anticipated.
The increase in our premiums from our Individual Risk operations in 2003 was as a result of an improving market environment due primarily to: 1) the increase in demand for insurance and reinsurance protection, and the withdrawal of supply, as a result of the substantial losses stemming from the World Trade Center disaster in 2001; 2) the ongoing increase to prior year reserves for many companies with asbestos and environmental liabilities; and 3) the continuing increases to prior year reserves for companies who participated in the casualty market of the late 1990's. As a result of these items, many insurance companies in the U.S. withdrew from the U.S. insurance market, and many insurance companies had their credit ratings substantially reduced. In response to these dislocations, we received numerous opportunities to partner with program managers who were looking for high quality, stable companies with which to do business. Also, because of our financial strength and our strong ratings, we received increasing opportunities to work with existing insurance companies on a quota share basis.
During 2005, we expect that certain new programs will incept in the first half of the year. Assuming we are correct, and assuming our estimate for growth in other existing areas of the Individual Risk business is also correct, we expect gross written premium growth for this segment to grow significantly in 2005.
Ceded Premiums Written
| | | | | | | | | | | | | | |
| Year ended December 31, | | 2004 | | 2003 | | 2002 |
| (in thousands) | | | | | | |
| Ceded premiums written — Individual Risk segment (1) | | $ | 59,751 | | | $ | 83,970 | | | $ | 55,478 | |
|
| |
| (1) | Includes $18.8 million, $20.8 million and $22.2 million of premium ceded to Renaissance Reinsurance and DaVinci in 2004, 2003 and 2002, respectively. |
We purchase reinsurance to reduce our exposure to large losses. With the continued growth in the gross written premiums of our Individual Risk segment, we continued to look for opportunities to purchase appropriately priced reinsurance coverage.
Underwriting Results
The 2004 underwriting results for the Individual Risk segment decreased to an underwriting loss of $105.8 million, compared to underwriting income of $32.0 million in 2003. The significant decline is primarily attributable to the $158.3 million of negative impact from the four large hurricanes that occurred during the third quarter. This impact is reflected in the following items: net losses of $143.7 million plus reinstatement premiums ceded of $14.6 million.
Offsetting the effect of the hurricanes above was a reduction of prior years estimated ultimate net claims reserves of $26.4 million. The reduction in prior years' estimated ultimate net claims reserves was driven by the application of our formulaic reserving methodology used for the Individual Risk book of business and is primarily due to the actual paid and reported loss activity being better than what we had anticipated when estimating the initial ultimate claims and claims expense ratios and the initial loss reporting patterns
The increase in the 2003 net underwriting income of our Individual Risk segment was primarily due to the growth in net earned premiums by $213.4 million (as discussed above).
Our underwriting expenses consist of acquisition expenses and operational expenses. Acquisition expenses consist of costs to acquire premiums and are comprised of fees and expenses paid to: 1) program managers, who source primary insurance premiums for us through specialized programs; 2) primary insurers, with whom we write quota share reinsurance; and 3) broker commissions and excise
68
taxes paid to brokers, who source insurance for us on a risk-by-risk basis. Acquisition expenses are driven by contract terms and are generally determined based on a set percentage of premiums. Operational expenses consist of compensation and other general and administrative expenses. Our Individual Risk business operates with a limited number of employees and, accordingly, we outsource much of the administration of our Individual Risk business to program managers and third party administrators.
During 2003 we began issuing insurance policies for certain commercial liability coverages, including general, automobile and professional liability risks. The claim reporting and claim development periods of these risks are longer than the reporting and development periods for our property risks, and accordingly there is normally greater uncertainty in the estimation of the reserves associated with these policies.
During 2005, given the magnitude of the hurricane losses of 2004 and due to delays in receiving claims data and the likelihood of receiving new or revised data from our counterparties, the estimates of hurricane losses and related recoveries are likely to change. Changes in these estimates will be recorded in the period in which they occur.
Net Investment Income
| | | | | | | | | | | | | | |
| Year ended December 31, | | 2004 | | 2003 | | 2002 |
| (in thousands) | | | | | | |
| Net investment income | | $ | 162,722 | | | $ | 129,542 | | | $ | 102,686 | |
|
The increase in investment income in 2004 was largely as a result of increased income from hedge funds, private equity funds and other alternative investments, both as a result of higher returns and a higher level of investment over 2003. Net income on these investments, which includes net unrealized appreciation, was $46.9 million in 2004. During 2003, we recorded $25.9 million of net investment income from these other investments (2002 - $0.4 million loss), which were largely responsible for the increase in net investment income during 2003. These investments are carried at fair value, with interest, dividend income and realized and unrealized gains (losses) included in investment income.
Other Income and Equity in Earnings of Other Ventures
| | | | | | | | | | | | | | |
| Year ended December 31, | | 2004 | | 2003 | | 2002 |
| (in thousands) | | | | | | |
| Fee income | | $ | 6,765 | | | $ | 7,655 | | | $ | 3,882 | |
| Other items | | | 12,138 | | | | (1,752 | ) | | | 6,600 | |
| Total other income | | | 18,903 | | | | 5,903 | | | | 10,482 | |
| Equity in earnings of other ventures | | | 31,081 | | | | 21,167 | | | | 22,339 | |
| Total | | $ | 49,984 | | | $ | 27,070 | | | $ | 32,821 | |
|
Fee income was essentially flat comparing 2004 to 2003 and primarily consisted of fees related to services provided to Platinum. The increase in other items primarily reflects the recording of $27.4 million in unrealized gains on the Platinum warrant, which was recorded in the income statement at fair value commencing in the fourth quarter of 2004 as the result of the expiration of a lockup provision, in accordance with generally accepted accounting principles. This was partially offset by $12.5 million of losses recognized by the Company from short positions in credit derivatives generally used to hedge potential credit-related exposures of the Company. The increase in equity in earnings of other ventures was primarily due to $9.8 million of equity pickup from our investment in Channel Re, which incepted in 2004.
During 2003, the majority of our equity in earnings of other ventures was generated from our 50% equity ownership in Top Layer Re. The increase in fee income during 2003 was primarily due to the
69
$4.0 million annual fee we receive related to services provided to Platinum. The reduction in other items is primarily related to the derivative income we received in 2002 related to derivative instruments under which recoveries are triggered by an industry loss index or geological or physical variables, which did not repeat in 2003.
Corporate Expenses
| | | | | | | | | | | | | | |
| Year ended December 31, | | 2004 | | 2003 | | 2002 |
| (in thousands) | | | | | | |
| Corporate expenses | | $ | 17,609 | | | $ | 16,043 | | | $ | 14,327 | |
|
Corporate expenses include expenses related to legal and certain consulting expenses, costs for research and development, and other miscellaneous costs associated with operating as a publicly traded company. The increase in corporate expenses during 2004, primarily related to increases in fees to comply with recently adopted regulations of the SEC, including those related to complying with the Sarbanes-Oxley Act of 2002, including Section 404, and an increase in various legal expenses.
The increase in corporate expenses during 2003 primarily related to an increase in the cost for directors' and officers' insurance and increases in fees to comply with recently adopted regulations of the SEC, including those related to complying with the Sarbanes-Oxley Act of 2002.
Interest, Capital Securities and Preferred Share Dividends
| | | | | | | | | | | | | | |
| Year ended December 31, | | 2004 | | 2003 | | 2002 |
| (in thousands) | | | | | | |
| Interest — revolving credit facilities | | $ | 2,366 | | | $ | 2,318 | | | $ | 2,569 | |
| Interest — $150 million 7.0% Senior Notes | | | 10,500 | | | | 10,500 | | | | 10,500 | |
| Interest — $100 million 5.875% Senior Notes | | | 5,875 | | | | 5,434 | | | | — | |
| Interest — $103.1 million subordinated obligation to Capital Trust | | | 7,227 | | | | — | | | | — | |
| Total interest expense | | | 25,968 | | | | 18,252 | | | | 13,069 | |
| Dividends — $103.1 million Capital Securities | | | — | | | | 7,470 | | | | 7,605 | |
| Dividends — $150 million 8.1% Series A Preference Shares | | | 12,150 | | | | 12,150 | | | | 12,184 | |
| Dividends — $100 million 7.3% Series B Preference Shares | | | 7,300 | | | | 6,651 | | | | — | |
| Dividends — $250 million 6.08% Series C Preference Shares | | | 11,684 | | | | — | | | | — | |
| Total interest and Capital Securities and preferred share dividends | | $ | 57,102 | | | $ | 44,523 | | | $ | 32,858 | |
|
Our interest payments and preferred dividends increased during 2004, primarily as a result of the issuance of $250 million 6.08% Series C Preference Shares in March 2004. Our interest payments and preferred dividends increased during 2003, primarily as a result of the issuance of $100 million 5.875% Senior Notes and the issuance of $100 million 7.3% Series B Preference Shares. This capital was raised to support the growth in our insurance and reinsurance operations.
70
Income Tax Expense (Benefit)
| | | | | | | | | | | | | | |
| Year ended December 31, | | 2004 | | 2003 | | 2002 |
| (in thousands) | | | | | | |
| Income tax expense (benefit) | | $ | 4,003 | | | $ | (18 | ) | | $ | (115 | ) |
|
During 2004, our U.S. operations did not generate taxable income and, accordingly, we increased the valuation allowance on our deferred tax asset by $4.0 million so that our valuation allowance is now equal to our net deferred tax asset. During 2003 and 2002 we wrote a limited amount of business in our U.S. operations and therefore the related tax impact for 2003 and 2002 was minimal.
We currently plan to continue to increase the business written by our U.S. tax-paying insurance subsidiaries. If, as a result, our U.S. operations begin to generate taxable income, the appropriateness of the valuation allowance will be reassessed and, accordingly, potential profits from our U.S. operations would possibly not have a corresponding offset for tax expenses, up to the $38.2 million valuation allowance recorded at December 31, 2004.
Net Realized Gains on Investments
| | | | | | | | | | | | | | |
| Year ended December 31, | | 2004 | | 2003 | | 2002 |
| (in thousands) | | | | | | |
| Net realized gains on investments | | $ | 23,442 | | | $ | 80,504 | | | $ | 10,177 | |
|
Our investment portfolio is structured to preserve capital and provide us with a high level of liquidity. A large majority of our investments are invested in the fixed income markets and, therefore, our realized holding gains and losses on investments are highly correlated to fluctuations in interest rates. Therefore, as interest rates decline, we will tend to have realized gains from the turnover of our investment portfolio, and as interest rates increase, we will tend to have realized losses from the turnover of our investment portfolio, although the actual amount of realized gains (losses) on sales of investments can be reduced depending on which specific securities we choose to sell.
The amount of the realized gains or realized losses that will be recorded in the future will be dependent upon the level of our investments, the changes in the interest rate environment and how quickly or slowly we choose to turn over our investment portfolio.
Cumulative Effect of a Change in Accounting Principle - Goodwill
Effective January 1, 2002, the Company adopted Financial Accounting Standards Board ("FASB") Statement No. 142, "Goodwill and Other Intangible Assets," ("FAS 142"). In the second quarter of 2002, the Company completed its initial impairment review in compliance with the transition provisions of FAS 142 and, as a result, the Company decided to record goodwill at zero value, the low end of an estimated range of values, and wrote off the balance of its goodwill during the second quarter of 2002, which totaled $9.2 million. In accordance with the provisions of FAS 142, this is required to be recorded as a cumulative effect of a change in accounting principle in the consolidated statement of income and is required to be recorded retroactive to January 1, 2002.
Financial Condition
RenaissanceRe is a holding company, and we therefore rely on dividends from our subsidiaries and investment income to make principal and interest payments on our debt and capital securities, and to make dividend payments to our preference and common shareholders.
The payment of dividends by our Bermuda subsidiaries is, under certain circumstances, limited under U.S. statutory regulations and Bermuda insurance law, which require our Bermuda insurance subsidiaries to maintain certain measures of solvency and liquidity. At December 31, 2004, the
71
statutory capital and surplus of our Bermuda insurance subsidiaries was $2.3 billion, and the amount of capital and surplus required to be maintained was $520.6 million. During 2004, Renaissance Reinsurance, DaVinci and Glencoe declared aggregate cash dividends of $234.4 million, $3.2 million and $55.0 million, respectively, compared with $322.3 million, $81.6 million and $18.0, respectively, in 2003.
Our U.S. insurance subsidiary Stonington is also required to maintain certain measures of solvency and liquidity. This is determined using risk based capital tests, which determines the threshold that constitutes the authorized control level. If Stonington's statutory capital and surplus falls below the authorized control level, the commissioner is authorized to take whatever regulatory actions are considered necessary to protect policyholders and creditors. At December 31, 2004, the statutory capital and surplus of Stonington was $57.5 million. Because of the accumulated deficit in earned surplus from prior operations, Stonington currently cannot pay an ordinary dividend.
In the aggregate, our operating subsidiaries have historically produced sufficient cash flows to meet their expected claims payments and operational expenses and to provide dividend payments to us. Our subsidiaries also maintain a concentration of investments in high quality liquid securities, which management believes will provide additional liquidity for extraordinary claims payments should the need arise. Additionally, we maintain a $500 million revolving credit facility to meet additional liquidity and capital requirements, if necessary.
Cash Flows
Cash flows from operating activities for 2004 were $518.1 million, which principally consisted of net income of $164.2 million (prior to dividends on preference shares), plus $412.9 million for increases to net reserves for claims and claim expenses. The 2004 cash flows from operations were primarily used to increase the investment portfolio, including fixed income securities, other investments and investments in other ventures.
We have generated cash flows from operations in 2004, 2003 and 2002 significantly in excess of our operating commitments. Because a large portion of the coverages we provide typically can produce losses of high severity and low frequency, it is not possible to accurately predict our future cash flows from operating activities. As a consequence, cash flows from operating activities may fluctuate, perhaps significantly, between individual quarters and years.
Reserves for Claims and Claim Expenses
Our gross case reserves and IBNR by line of business at December 31, 2004 and 2003 are as follows:
| | | | | | | | | | | | | | |
| At December 31, 2004 | | Case Reserves (1) | | IBNR | | Total |
| (in thousands) | |
| Property catastrophe reinsurance | | $ | 263,541 | | | $ | 330,744 | | | $ | 594,285 | |
| Specialty reinsurance | | | 107,090 | | | | 419,917 | | | | 527,007 | |
| Total Reinsurance | | | 370,631 | | | | 750,661 | | | | 1,121,292 | |
| Individual Risk | | | 138,285 | | | | 199,821 | | | | 338,106 | |
| Total | | $ | 508,916 | | | $ | 950,482 | | | $ | 1,459,398 | |
| At December 31, 2003 | | | | | | | | | | | | |
| Property catastrophe reinsurance | | $ | 196,477 | | | $ | 238,021 | | | $ | 434,498 | |
| Specialty reinsurance | | | 88,899 | | | | 256,630 | | | | 345,529 | |
| Total Reinsurance | | | 285,376 | | | | 494,651 | | | | 780,027 | |
| Individual Risk | | | 95,930 | | | | 101,935 | | | | 197,865 | |
| Total | | $ | 381,306 | | | $ | 596,586 | | | $ | 977,892 | |
|
| |
| (1) | Case reserves include our estimate of case reserves for insurance policies, case reserves reported by our counterparties for reinsurance contracts, and additional case reserves for reinsurance contracts, which represent additional case reserves established by management. |
72
Of the total case reserve amounts above, the amount reported by ceding insurers and insureds was $326.8 million at December 31, 2004 and $244.0 million at December 31, 2003. The remaining balance represents additional case reserve estimates established by management.
At December 31, 2004, our total gross reserves for claims and claim expenses was $1,459.4 million and our estimated IBNR reserves were $950.5 million. A 5% change in such IBNR reserves would equate to a $47.5 million adjustment to net claims and claim expenses incurred, which would represent 28.9% of our 2004 net income and 1.8% of shareholders' equity at December 31, 2004.
As discussed in the Summary of Critical Accounting Policies and Estimates, the most significant accounting judgment made by management is the estimation of the claims and claim expense reserves. Because of the variability and uncertainty associated with loss estimation, it is possible that our individual case reserves are incorrect, possibly materially.
A large portion of our coverages provide protection from natural and man-made catastrophes which are generally infrequent, but can be significant, such as losses from hurricanes and earthquakes. Our claims and claim expense reserves will generally fluctuate, sometimes materially, based upon the occurrence of a significant natural or man-made catastrophic loss for which we provide reinsurance. Our claims reserves will also fluctuate based on the payments we make for these large loss events. The timing of our payments on loss events can be affected by the event causing the loss, the location of the loss, and whether our losses are from policies with insurers or reinsurers.
During 2003 and 2004 we increased our specialty reinsurance and Individual Risk gross written premiums (see "Premiums"). The addition of these lines of business adds complexity to our claims reserving process and therefore adds uncertainty to our claims reserve estimates as the reporting of information, the setting of initial reserves and the loss settlement process for these lines of business vary from our traditional property catastrophe line of business.
For our Reinsurance and Individual Risk operations, our estimates of claims reserves include case reserves reported to us as well as our estimate of appropriate additional case reserves and IBNR. Our case reserves, additional case reserves, and our estimates for IBNR reserves are based on 1) claims reports from insureds and program managers, 2) our underwriters' experience in setting claims reserves; 3) the use of computer models where applicable; and 4) historical industry claims experience. For some classes of business we also use statistical and actuarial methods to estimate ultimate expected claims and claim expenses. We review our claims reserves on a regular basis. (Also see "Summary of Critical Accounting Policies and Estimates".)
Capital Resources
Our total capital resources at December 31, 2004 and 2003 were as follows:
| | | | | | | | | | |
| At December 31, | | 2004 | | 2003 |
| (in thousands) |
| Common shareholders' equity | | $ | 2,144,042 | | | $ | 2,084,643 | |
| Preference shares | | | 500,000 | | | | 250,000 | |
| Total shareholders' equity | | | 2,644,042 | | | | 2,334,643 | |
| 7.0% Senior Notes | | | 150,000 | | | | 150,000 | |
| 8.54% subordinated obligation to Capital Trust | | | 103,093 | | | | 103,093 | |
| 5.875% Senior Notes | | | 100,000 | | | | 100,000 | |
| DaVinci revolving credit facility — borrowed | | | 100,000 | | | | 100,000 | |
| Revolving credit facility — unborrowed | | | 500,000 | | | | 400,000 | |
| Total capital resources | | $ | 3,597,135 | | | $ | 3,187,736 | |
|
During 2004, our capital resources increased primarily as a result of three items: 1) our net income available to common shareholders of $133.1 million; 2) the issuance of $250.0 million of Series C preference shares; and 3) an increase in our revolving credit facility by $100.0 million.
73
In March 2004, we raised $250 million through the issuance of 10 million Series C preference shares, in February 2003, we raised $100 million through the issuance of 4 million Series B preference shares, and in November 2001, we raised $150 million through the issuance of 6 million Series A preference shares. The Series C, Series B and Series A preference shares may be redeemed at $25 per share at our option on or after March 23, 2009, February 4, 2008 and November 19, 2006, respectively; however, we have no current intentions to redeem the shares. Dividends on the Series C, Series B and Series A preference shares are cumulative from the date of original issuance and are payable quarterly in arrears at 6.08%, 7.3% and 8.1%, respectively, when, if, and as declared by the Board of Directors. If RenaissanceRe submits a proposal to our shareholders concerning an amalgamation or submits any proposal that, as a result of any changes to Bermuda law, requires approval of the holders of RenaissanceRe preference shares to vote as a single class, RenaissanceRe may redeem the Series C, Series B and Series A preference shares prior to March 23, 2009, February 4, 2008 and November 19, 2006, respectively, at $26 per share. The preference shares have no stated maturity and are not convertible into any other of our securities.
In January 2003, we issued $100 million of 5.875% Senior Notes due February 15, 2013, with interest on the notes payable on February 15 and August 15 of each year, commencing August 15, 2003. In July 2001, we issued $150 million of 7.0% Senior Notes due July 15, 2008 with interest on the notes payable on January 15 and July 15 of each year. The notes can be redeemed by us prior to maturity subject to payment of a "make-whole" premium; however, we have no current intentions of calling the notes. The notes, which are senior obligations, contain various covenants, including limitations on mergers and consolidations, restrictions as to the disposition of stock of designated subsidiaries and limitations on liens on the stock of designated subsidiaries. RenaissanceRe was in compliance with the related covenants at December 31, 2004 and 2003.
Our Capital Trust has issued Capital Securities which pay cumulative cash distributions at an annual rate of 8.54%, payable semi-annually. During 2004 and 2003, RenaissanceRe did not purchase any of the Capital Securities. RenaissanceRe has purchased an aggregate $15.4 million of the Capital Securities since their issuance in 1997. The sole asset of the Capital Trust consists of our junior subordinated debentures. The Indenture relating to these junior subordinated debentures contains certain covenants, including a covenant prohibiting us from the payment of dividends if we are in default under the Indenture. We were in compliance with all of the covenants of the Indenture at December 31, 2004 and 2003. The Capital Securities mature on March 1, 2027.
Effective December 31, 2003, we adopted FASB Interpretation No. 46, "Consolidation of Variable Interest Entities – an interpretation of ARB No. 51" ("FIN 46"). FIN 46 requires consolidation of all Variable Interest Entities ("VIE") by the investor that will absorb a majority of the VIE's expected losses or residual returns. As further discussed in Note 8 to the Consolidated Financial Statements, the Capital Trust was determined to be a VIE under FIN 46 and the Company has been determined not to be the primary beneficiary of the Capital Trust. Accordingly, the Capital Trust has been deconsolidated effective December 31, 2003. As a result, the accounts of the Capital Trust, principally the Capital Securities previously classified as minority interest, are not included in our consolidated balance sheet at December 31, 2004 or 2003. Our $103.1 million subordinated obligation to the Capital Trust, previously eliminated in consolidation, is recorded on our consolidated balance sheet at December 31, 2004 and 2003 as a liability.
During May 2004, DaVinciRe amended and restated its credit agreement providing for a $100 million committed revolving credit facility and maintained as outstanding the full $100 million available under this facility. Neither RenaissanceRe nor Renaissance Reinsurance is a guarantor of this facility and the lenders have no recourse against us or our subsidiaries other than DaVinciRe and its subsidiary under the DaVinciRe facility. Pursuant to the terms of the $500 million facility maintained by RenaissanceRe, a default by DaVinciRe in its obligations will not result in a default under the RenaissanceRe facility. Interest rates on the facility are based on a spread above LIBOR, and averaged approximately 2.32% during 2004 (2003 – 2.09%). As amended, the credit agreement contains certain covenants requiring DaVinciRe to maintain a debt to capital ratio of not more than 30% and a minimum net worth of $250 million. At December 31, 2004 and 2003, DaVinciRe was in
74
compliance with the covenants under this agreement. The amended and restated agreement extended the term of the facility to May 25, 2007.
Under the terms of certain reinsurance contracts, our insurance and reinsurance subsidiaries and joint ventures may be required to provide letters of credit to reinsureds in respect of reported claims and/or unearned premiums. Our principal letter of credit facility is a syndicated secured facility which accepts as collateral shares issued by our subsidiary RIHL. Our participating operating subsidiaries and our managed joint ventures have pledged (and must maintain) RIHL shares issued to them with a sufficient collateral value to support their respective obligations under the facility, including reimbursement obligations for outstanding letters of credit. The participating subsidiaries and joint ventures also have the option to post alternative forms of collateral. In addition, for liquidity purposes, in order to be permitted to pledge RIHL shares as collateral, each participating subsidiary and joint venture must maintain additional unpledged RIHL shares that have a net asset value at least equal to 15% of its facility usage, and RIHL shares having an aggregate net asset value equal to at least 15% of the net asset value of all outstanding RIHL shares must remain unencumbered. In the case of a default under the facility, or in other circumstances in which the rights of our lenders to collect on their collateral may be impaired, the lenders may exercise certain remedies under the facility agreement, in accordance with and subject to its terms, including redemption of pledged shares and conversion of the collateral into cash or eligible marketable securities. The redemption of shares by the collateral agent takes priority over any pending redemption of unpledged shares by us or other holders. Between January 2004 and November 2004, this facility was increased to $1.0 billion from $385 million, and as of January 18, 2005, the facility was reduced to $850 million. In November 2004, the term of this facility was extended through April 30, 2005 and in March 2005, the reimbursement agreement was amended to conform certain default provisions of the agreement to comparable provisions in existing credit agreements of the Company and DaVinciRe. Subject to certain conditions, the size of the facility may be increased to $1.3 billion. At December 31, 2004, we had outstanding letters of credit under the facility aggregating $548.4 million.
Our subsidiary Stonington has provided a letter of credit in the amount of $68.7 million to one counterparty which is secured by cash and eligible marketable securities. Also, in connection with our Top Layer Re joint venture, we have committed $37.5 million of collateral to support a letter of credit and are obligated to make a mandatory capital contribution of up to $50.0 million in the event that a loss reduces Top Layer Re's capital below a specified level.
During August 2004, we amended and restated our committed revolving credit agreement to increase the facility from $400 million to $500 million, to extend the term to August 6, 2009 and to make certain other changes. The interest rates on this facility are based on a spread above LIBOR. No balance was outstanding at December 31, 2004 or 2003. As amended, the agreement contains certain financial covenants. These covenants generally provide that consolidated debt to capital shall not exceed the ratio (the "Debt to Capital Ratio") of 0.35:1 and that the consolidated net worth (the "Net Worth Requirements") of RenaissanceRe and Renaissance Reinsurance shall equal or exceed $1 billion and $500 million, respectively, subject to certain adjustments under certain circumstances in the case of the Debt to Capital Ratio and certain grace periods in the case of the Net Worth Requirements, all as more fully set forth in the agreement. We have the right, subject to certain conditions, to increase the size of this facility to $600 million.
Shareholders' Equity
During 2004, shareholders' equity increased by $309.4 million to $2.6 billion at December 31, 2004, from $2.3 billion at December 31, 2003. The significant components of the change in shareholders' equity included net income available to common shareholders of $133.1 million and the issuance of $250.0 million Series C preference shares.
In the future, we may return capital to our shareholders through share repurchases. In August 2003, the Board authorized a share repurchase program of $150 million. This authorization includes the remaining amounts available under prior authorizations. No shares were repurchased during 2004 or
75
2003 under this program. In the future, we may purchase shares under our current authorization, or increase the size of our repurchase program. Any such determination will be subject to market conditions and other factors.
In August 2004, the Company's shareholders approved the RenaissanceRe Holdings Ltd. 2004 Stock Option Incentive Plan (the "Premium Option Plan") under which 6,000,000 common shares were reserved for issuance upon the exercise of options granted under the Premium Option Plan. As described in the Company's Proxy Statement relating to the required shareholder vote, filed with the SEC in July 2004, the Premium Option Plan provides for, among other things, mandatory premium pricing such that options can generally only be issued thereunder with a strike price at a minimum of 150% of the fair market value on the date of grant, minimum 4-year cliff vesting, and no discretionary repricing. The Premium Option Plan includes a dividend protection feature that reduces the strike price for extraordinary dividends and a change in control feature that reduces the strike price based on a pre-established formula in the event of change in control. Grantees under the Premium Option Plan must satisfy performance criteria which is determined by the Company's Compensation Committee. As at December 31, 2004, 3,956,000 options were outstanding under the Premium Option Plan with an exercise price of $74.24 per share, and 1,250,000 options were outstanding with an exercise price of $98.98 per share.
Investments
At December 31, 2004, we held investments totaling $4.8 billion, compared to $4.2 billion in 2003.
The table below shows the aggregate amounts of our invested assets:
| | | | | | | | | | |
| At December 31, | | 2004 | | 2003 |
| (in thousands) |
| Fixed maturities investments available for sale, at fair value | | $ | 3,223,292 | | | $ | 2,947,841 | |
| Short-term investments, at cost | | | 608,292 | | | | 660,564 | |
| Other investments, at fair value | | | 684,590 | | | | 369,242 | |
| Total managed investment portfolio | | | 4,516,174 | | | | 3,977,647 | |
| Equity investments in reinsurance company, at fair value | | | 150,519 | | | | 145,535 | |
| Investments in other ventures, under equity method | | | 159,556 | | | | 35,899 | |
| Total investments | | $ | 4,826,249 | | | $ | 4,159,081 | |
|
The $667.2 million growth in our portfolio of invested assets for the year ended December 31, 2004 resulted primarily from net cash provided by operating activities of $518.1 million and the issuance of $250 million Series C preference shares, partially offset by dividends to common and preference shareholders of $53.8 million and $31.1 million, respectively.
Because our coverages include substantial protection for damages resulting from natural and man-made catastrophes, we may become liable for substantial claim payments on short notice. Accordingly, our investment portfolio is structured to preserve capital and provide a high level of liquidity. The large majority of our investment portfolio consists of highly rated fixed income securities, including U.S. Treasuries, highly-rated sovereign and supranational securities, high-grade corporate securities and mortgage-backed and asset-backed securities. At December 31, 2004, our invested asset portfolio of fixed maturities and short term investments had a dollar weighted average rating of AA (2003 – AA), an average duration of 2.2 years (2003 – 2.0 years) and an average yield to maturity of 3.3% (2003 – 2.7%). As noted in our discussion of our cash flows above, our future cash flows from operations will be negatively impacted by losses we will be required to pay related to the recent third quarter hurricanes.
The equity investments in reinsurance company relate to our November 1, 2002 purchase of 3,960,000 common shares of Platinum in a private placement transaction. In addition, we received a ten-year warrant to purchase up to 2.5 million additional common shares of Platinum for $27.00 per share. We
76
purchased the common shares and warrant for an aggregate price of $84.2 million. At December 31, 2004, we owned (exclusive of the warrant) 9.2% of Platinum's outstanding common shares. We have recorded our investment in Platinum at fair value, and at December 31, 2004 the aggregate fair value was $150.5 million (2003 - $145.5 million). The fair value of the common shares is based on the market price of Platinum's shares as of the balance sheet date. The fair value of the warrant is estimated by the Company using the Black-Scholes option pricing model. The aggregate unrealized gain on the Platinum common shares of $38.9 million (2003 - $34.6 million) is included in accumulated other comprehensive income. During the fourth quarter of 2004, a lockup provision on the warrant expired and as a result the warrant met the definition of a derivative under FAS 133 and therefore changes in the fair value of the warrant were recorded prospectively in other income from November, 2004. At December 31, 2004, $27.4 million was recorded in other income representing the unrealized gain on the warrant. This includes a $23.8 million one-time reclassification from other comprehensive income to other income which occurred during the fourth quarter of 2004 with the $3.6 million remainder being the increase in fair value from November 2004. At December 31, 2003, the aggregate unrealized gain on the Platinum warrant was $26.7 million which was included in other comprehensive income.
At December 31, 2004, $265.3 million (2003 - $182.4 million) of cash and cash equivalents and investments were invested in currencies other than the U.S. dollar, which represented 5.4% (2003 – 4.3%) of our cash and cash equivalents and invested assets.
A portion of our investment assets is directly held by our subsidiary RIHL, a Bermuda company we organized for the primary purpose of holding the investments in high quality marketable securities for RenaissanceRe, our operating subsidiaries and certain of our joint venture affiliates. We believe that RIHL permits us to consolidate and substantially facilitate our investment management operations. RenaissanceRe and each of our participating operating subsidiaries and affiliates have transferred to RIHL marketable securities or other assets, in return for a subscription of RIHL equity interests. Each RIHL share is redeemable by the subscribing companies for cash or in marketable securities. Over time, the subsidiaries and joint ventures which participate in RIHL are expected to both subscribe for additional shares and redeem outstanding shares, as our and their respective liquidity needs change. RIHL is currently rated AAAf/S2 by S&P.
Other Investments
The table below shows our portfolio of other investments:
| | | | | | | | | | |
| At December 31, | | 2004 | | 2003 |
| (in thousands) | | | | |
| Type of investment | | | | | | | | |
| Hedge funds | | $ | 293,462 | | | $ | 170,116 | |
| Senior secured bank loan fund | | | 116,560 | | | | 77,249 | |
| European high yield credit fund | | | 87,689 | | | | 38,333 | |
| Private equity partnerships | | | 82,381 | | | | 24,169 | |
| Medium term note representing an interest in a pool of | | | | | | | | |
| European fixed income securities | | | 50,000 | | | | 30,000 | |
| Non-US convertible fund | | | 28,214 | | | | — | |
| Miscellaneous other investments | | | 26,284 | | | | 29,375 | |
| Total other investments | | $ | 684,590 | | | $ | 369,242 | |
|
Fair values of certain of the other investments noted above are generally established on the basis of the net valuation criteria established by the managers of the investments. These net valuations are determined based upon the valuation criteria established by the governing documents of such investments. Such valuations may differ significantly from the values that would have been used had ready markets existed for the shares, partnership interests or notes. Many of the investments are subject to restrictions on redemptions and sales which are determined by the governing documents
77
and limit the Company's ability to liquidate these investments in the short term. Due to a lag in the valuations reported by the fund managers, the majority of our hedge fund and private equity partnership valuations are reported on a one month or one quarter lag. Interest income, income distributions and realized and unrealized gains and losses on other investments are included in net investment income and totaled $46.9 million (2003 – $25.9 million) of which $24.4 million (2003 – $21.2 million) was related to net unrealized gains.
The hedge funds are engaged in various investment strategies, including event driven, diversified arbitrage, distressed, US long/short, global long/short and sector long/short with original capital contributed by us, generally in the range of $5 million to $15 million per fund, although we have committed to invest up to $60 million in one hedge fund. The loan fund primarily invests in senior secured floating rate loans. The European high yield credit fund is denominated in Euros and primarily invests in unlisted and listed fixed and floating rate debt securities issued by entities that are domiciled in or have a substantial portion of their total assets or operations in a European country. The private equity partnerships are primarily engaged in U.S. private equity, real estate, distressed securities and secondary investment strategies with initial capital commitments ranging from $1.5 million to $15 million, although we have committed to invest up to $30 million in one partnership. The medium term note was issued by an investment company which invests predominantly in investment-grade European fixed income securities and passes through a variable U.S. dollar return on the note based on the performance of the underlying securities. The non-U.S. convertible fund is denominated in Euros and primarily invests in unlisted and listed non-U.S. convertible securities. Included in miscellaneous other investments are catastrophe bonds, that generally include variable rate notes where the return is contingent upon climatical or geological events.
We have committed capital to private equity partnerships of $260.2 million, of which $83.2 million has been contributed at December 31, 2004.
Non-Indemnity Index Transactions
We have assumed risk through securities and derivative instruments under which losses could be triggered by an industry loss index or geological or physical variables. During 2004, 2003 and 2002 we recorded income (loss) on non-indemnity catastrophe index transactions of ($0.1) million, $0.8 million and $7.2 million. We report income (loss) from these transactions in other income.
Effects of Inflation
The potential exists, after a catastrophe loss, for the development of inflationary pressures in a local economy. The anticipated effects on us are considered in our catastrophe loss models. The effects of inflation are also considered in pricing and in estimating reserves for unpaid claims and claim expenses. The actual effects of this post-event inflation on our results cannot be accurately known until claims are ultimately settled.
Off Balance Sheet and Special Purpose Entity Arrangements
At December 31, 2004, we have not entered into any off-balance sheet arrangements, as defined by ITEM 303 (a)(4) of Regulation S-K.
New Accounting Pronouncements
On December 16, 2004, the FASB issued revised FASB Statement No. 123 (revised 2004), "Share-Based Payment" ("FAS 123(R)"). FAS 123(R) replaces FASB Statement No. 123 "Accounting for Stock-Based Compensation" ("FAS 123") and supersedes APB opinion No.25 "Accounting for Stock Issued to Employees". The statement requires all entities to recognize compensation expense in an amount equal to the fair value of share-based payments granted to employees and is effective as of the beginning of the first interim or annual reporting period that begins after June 15, 2005. Because FAS 123(R) must be applied not only to new awards but also to previously granted awards that are not fully vested on the effective date, and because we adopted
78
FAS 123 using the prospective transition method (which applied only to awards granted, modified or settled after the adoption date), compensation costs for some previously granted awards that were not recognized under FAS 123 will be recognized under FAS 123(R). We estimate that the additional compensation expense related to unvested grants that were issued prior to January 1, 2003 will not be material upon adoption of FAS 123(R). Had we adopted FAS 123(R) in prior periods, the impact of that standard would have approximated the impact of FAS 123 as described in the transitional disclosure provisions of FASB Statement No. 148, "Accounting for Stock-Based Compensation – Transition and Disclosure" ("FAS 148"). In accordance with the transitional disclosure provisions of FAS 148, the following table sets out the effect on the Company's net income and earnings per share for all reported periods had the compensation cost been calculated based upon the fair value method recommended in FAS 123:
| | | | | | | | | | | | | | |
| Year ended December 31, | | 2004 | | 2003 | | 2002 |
| (in thousands except per share data) | | | | (Restated) | | (Restated) |
| Net income available to common shareholders, as reported | | $ | 133,108 | | | $ | 605,992 | | | $ | 342,879 | |
add: stock-based employee compensation cost included in
determination of net income | | | 16,982 | | | | 13,892 | | | | 8,243 | |
| less: fair value compensation cost under FAS 123 | | | (19,533 | ) | | | (19,151 | ) | | | (22,307 | ) |
| Pro forma net income available to common shareholders | | $ | 130,557 | | | $ | 600,733 | | | $ | 328,815 | |
| Earnings per share | |
| Basic — as reported | | $ | 1.90 | | | $ | 8.78 | | | $ | 5.08 | |
| Basic — pro forma | | $ | 1.87 | | | $ | 8.70 | | | $ | 4.87 | |
| | |
| Diluted — as reported | | $ | 1.85 | | | $ | 8.53 | | | $ | 4.88 | |
| Diluted — pro forma | | $ | 1.82 | | | $ | 8.46 | | | $ | 4.68 | |
|
Current Outlook
We currently anticipate the following developments in our business:
Reinsurance segment
Since 2001, there has been an increase in the number of traditional reinsurance companies dedicating capital to the property catastrophe reinsurance market. This increase, combined with more recent capital additions from newer, non-traditional market participants, has resulted in an excess of supply over demand in certain sectors of the market and, correspondingly, has caused deterioration in pricing and in terms and conditions. Therefore, we expect that a growing number of transactions will not meet our hurdle rates and we estimate that our property catastrophe reinsurance premium will decline during 2005. We also note that during 2004, we recorded $30.1 million of reinstatement premiums and $27.4 million of premiums on back-up covers related to the third quarter Florida hurricanes. If there is an absence of similar catastrophic events during 2005, we anticipate that such premiums will not recur and, therefore, the decline in property catastrophe reinsurance premiums in 2005 will be more pronounced.
We are currently seeing some softening in the specialty reinsurance market; however, due to the strength of our organization and our relationships with both our brokers and our customers, we believe there are still adequate opportunities for us to grow this line of business modestly during 2005. Our premiums from this line of business are attributable to a relatively small number of large deals and the amount of the premiums can fluctuate significantly between quarters and between years depending upon the number of, and nature of, the transactions that we complete.
79
Individual Risk segment
During 2005, we expect to see continued softening in the commercial property markets. We also expect additional program manager relationships to come on line during 2005. Based upon this, we expect our premiums from our Individual Risk segment to grow significantly in 2005.
New Business
We believe that the current market environment may create more opportunities for the creation of joint ventures and strategic investments. We have established RenaissanceRe Ventures Ltd. to facilitate strategic investments. In evaluating joint ventures and strategic investments, we may consider opportunities in other areas of the insurance and reinsurance markets, or in other financial markets, either through organic growth, the formation of new joint ventures, or the acquisition of other companies or books of business of other companies. We are currently in the process of reviewing certain opportunities and periodically engage in discussions regarding possible transactions, although there can be no assurance that we will complete any such transactions or that any such transaction would contribute materially to our results of operations or financial condition.
Contractual Obligations
| | | | | | | | | | | | | | | | | | | | | | |
| At December 31, | | Total | | Less than
1 year | | 1-3 years | | 3-5 years | | More than
5 years |
| (in thousands) | |
| Long-term debt obligations (1) | | | | | | | | | | | | | | | | | | | | |
| 7.0% Senior Notes | | $ | 187,167 | | | $ | 10,500 | | | $ | 21,000 | | | $ | 155,667 | | | $ | — | |
| 5.875% Senior Notes | | | 147,740 | | | | 5,875 | | | | 11,750 | | | | 11,750 | | | | 118,365 | |
| Capital Securities | | | 289,260 | | | | 8,540 | | | | 17,080 | | | | 17,080 | | | | 246,560 | |
| DaVinciRe revolving credit facility (2) | | | 105,562 | | | | 2,320 | | | | 103,242 | | | | — | | | | — | |
| Private equity commitments | | | 204,887 | | | | 204,887 | | | | — | | | | — | | | | — | |
| Operating lease obligations | | | 53,696 | | | | 3,545 | | | | 7,284 | | | | 7,388 | | | | 35,479 | |
| Obligations under derivative contracts | | | 21,496 | | | | 4,848 | | | | 9,695 | | | | 6,953 | | | | — | |
| Reserve for claims and claim expenses (3) | | | 1,459,399 | | | | 511,475 | | | | 476,800 | | | | 171,546 | | | | 299,578 | |
| Total Contractual Obligations | | $ | 2,469,207 | | | $ | 751,990 | | | $ | 646,851 | | | $ | 370,384 | | | $ | 699,982 | |
|
| |
| (1) | Includes contractual interest and dividend payments. |
| |
| (2) | The interest on this facility is based on a spread above LIBOR. We have reflected the interest due in 2005 and 2006 based upon the current interest rate on the facility. |
| |
| (3) | We caution the reader that the information provided above related to estimated future payment dates of our reserves for claims and claim expenses is not prepared or utilized for internal purposes and that we currently do not estimate the future payment dates of claims and claim expenses. Because of the nature of the coverages that we provide, the amount and timing of the cash flows associated with our policy liabilities will fluctuate, perhaps significantly, and therefore are highly uncertain. In order to estimate the payment dates of our contractual obligations for our reserve for claims and claim expense, we have utilized the work of an outside consulting actuarial firm. |
| |
| | This firm has based their estimate of future claim payments upon benchmark payment patterns constructed internally by their firm, drawing upon available relevant sources of loss and allocated loss adjustment expense development data. These benchmarks are revised periodically as new trends emerge. It is likely that this benchmark data will not be predictive of our future claim payments and that material fluctuations can occur due to the nature of the losses which we insure and the coverages which we provide. |
In certain circumstances many of our contractual obligations may be accelerated to dates other than those reflected in the table, due to defaults under the agreements governing those obligations (including pursuant to cross-default provisions in such agreements) or in connection with certain changes in control of the Company, if applicable. In addition, in connection with any such default under the agreement governing these obligations, in certain circumstances these obligations may bear an increased interest rate or be subject to penalties as a result of such a default.
80
ITEM 7A. QUANTITATIVE AND QUALITATIVE DISCLOSURES ABOUT MARKET RISK
We are principally exposed to four types of market risk: interest rate risk; foreign currency risk; equity price risk; and credit risk. The Company's investment guidelines permit, subject to approval, investments in derivative instruments such as futures, options, foreign currency forward contracts and swap agreements, which may be used to assume risks or for hedging purposes.
Interest Rate Risk
Our investment portfolio includes fixed maturity investments available for sale and short-term investments, whose market values will fluctuate with changes in interest rates. We attempt to maintain adequate liquidity in our fixed maturities investment portfolio to fund operations, pay reinsurance and insurance liabilities and claims and provide funding for unexpected events. We seek to manage our interest rate risk by monitoring the duration and structure of our investment portfolio.
The aggregate hypothetical loss generated from an immediate adverse parallel shift in the treasury yield curve of 100 basis points would cause a decrease in market value of 2.2%, which equated to a decrease in market value of approximately $84.3 million on a portfolio valued at $3,831.6 million at December 31, 2004. At December 31, 2003, the decrease in market value would have been 2.0%, which equated to a decrease in market value of approximately $72.2 million on a portfolio valued at $3,608.4 million. The foregoing reflects the use of an immediate time horizon, since this presents the worst-case scenario. Credit spreads are assumed to remain constant in these hypothetical examples.
Foreign Currency Risk
Our functional currency is the U.S. dollar. We write a substantial portion of our business in currencies other than U.S. dollars and may, from time to time, experience exchange gains and losses and incur underwriting losses in currencies other than U.S. dollars, which will in turn affect our consolidated financial statements.
Our foreign currency policy with regard to our underwriting operations is generally to hold foreign currency assets, including cash, investments and receivables that approximate the foreign currency liabilities, including claims and claim expense reserves and reinsurance balances payable. When necessary, the Company will use foreign currency forward and option contracts to minimize the effect of fluctuating foreign currencies on the value of non-U.S. dollar denominated assets and liabilities associated with our underwriting operations. As of December 31, 2004, the Company had notional exposure of $30.0 million (2003 - $nil) related to foreign currency forward and option contracts purchased.
For our investment operations, we are exposed to currency fluctuations through our investments in non-U.S. Dollar bonds and Euro denominated fixed income funds. As of December 31, 2004, our combined investment in these bonds and funds was $236.6 million. To hedge our exposure to currency fluctuations from these funds, we have entered into foreign currency forward and option contracts with notional exposure of $191.9 million. In the future, we may choose to increase our exposure to non-dollar investments. Foreign exchange gains or losses arising from certain non-U.S. dollar investments are recorded in other comprehensive income or realized gains (losses); the foreign exchange gains (losses) associated with our hedging of these non-U.S. dollar assets are recorded through foreign exchange gains (losses) in our statements of income.
Our foreign currency and option contracts are recorded at fair value, which is determined principally by obtaining quotes from independent dealers and counterparties. The fair value of these contracts as of December 31, 2004 was a loss of $14.7 million (2003 - $nil). All changes in exchange rates are recognized currently in our statements of income.
Equity Risk
We are exposed to equity price risk principally due to our investment in the common shares and warrant to purchase additional common shares of Platinum (see Summary of Results of Operations for 2004, 2003 and 2002 - Other Investments), which we carry on our balance sheet at fair value. The
81
risk is the potential for loss in fair value resulting from adverse changes in the price of Platinum's common stock. The aggregate fair value of this investment in Platinum was $150.5 million at December 31, 2004 compared to $145.5 million at December 31, 2003. A hypothetical 10 percent decline in the price of Platinum stock, holding all other factors constant, would have resulted in a $12.3 million decline in the fair value of the stock and a $6.2 million decline in the fair value of the warrant (assuming no other changes to the inputs to the Black-Scholes option valuation model that we use). The decline in the fair value of the stock would be recorded in net unrealized gains (losses) on securities and included in other comprehensive income in shareholders' equity. The decline in the fair value of the warrant would be recorded in other income. We are also indirectly exposed to equity market risk through our investments in: 1) some hedge funds that have net long equity positions; and 2) private equity partnerships whose exit strategies often depend on the equity markets. Such investments totaled $375.8 million at December 31, 2004 (2003 - $194.3 million).
Credit Risk
Our exposure to credit risk is primarily due to our fixed maturity investments available for sale and short term investments, and to a lesser extent, reinsurance premiums receivable and ceded reinsurance balances. At December 31, 2004 and 2003, our invested asset portfolio had a dollar weighted average rating of AA. From time to time we purchase credit default swaps to hedge our exposures in the insurance industry and to assist in managing the credit risk associated with ceded reinsurance. At December 31, 2004, the maximum payments we were obligated to make under credit default swaps was $21.5 million (2003 - $7.1 million). We account for these credit derivatives at fair value and record them on our consolidated balance sheet as other assets or other liabilities depending on the rights or obligations. The fair value of these credit derivatives, as recognized in other liabilities in our balance sheet, at December 31, 2004 was a liability of $12.6 million (2003 - $3.5 million). During 2004, we recorded losses of $12.5 million (2003 - $4.2 million) in our consolidated statement of income, including the $12.6 million liability on the balance sheet at December 31, 2004 (2003 - $3.5 million). The fair value of the credit derivatives are determined using industry valuation models. The fair value of these credit derivatives can change based on a variety of factors including changes in credit spreads, default rates and recovery rates, the correlation of credit risk between the referenced credit and the counterparty, and market rate inputs such as interest rates.
ITEM 8. FINANCIAL STATEMENTS AND SUPPLEMENTARY DATA
Reference is made to Item 15(a) of this Report for the Consolidated Financial Statements of RenaissanceRe and the Notes thereto, as well as the Schedules to the Consolidated Financial Statements.
ITEM 9. CHANGES IN AND DISAGREEMENTS WITH ACCOUNTANTS ON ACCOUNTING AND FINANCIAL DISCLOSURE
None.
ITEM 9A. CONTROLS AND PROCEDURES
Disclosure Controls and Internal Controls: We have designed various disclosure controls and procedures (as defined in Rules 13a-15(e) and Rule 15d-15(e) under the Exchange Act), to help ensure that information required to be disclosed in our periodic Exchange Act reports, such as this annual report, is recorded, processed, summarized and reported on a timely and accurate basis. Our disclosure controls and procedures are also designed with the objective of ensuring that such information is accumulated and communicated to our senior management, including our Chief Executive Officer and Chief Financial Officer, as appropriate to allow timely decisions regarding required disclosure. Our internal control over financial reporting is a process designed to provide reasonable assurance regarding the reliability of financial reporting and the preparation of financial statements for external purposes in accordance with generally accepted accounting principles and includes those policies and procedures that: (1) pertain to the maintenance of records that in
82
reasonable detail accurately and fairly reflect the transactions and dispositions of the assets of the issuer; (2) provide reasonable assurance that transactions are recorded as necessary to permit preparation of financial statements in accordance with generally accepted accounting principles, and that receipts and expenditures of the issuer are being made only in accordance with authorizations of management and directors of the issuer; and (3) provide reasonable assurance regarding prevention or timely detection of unauthorized acquisition, use or disposition of the issuer's assets that could have a material effect on financial statements.
Limitations on the effectiveness of controls: Our Board of Directors and management, including our Chief Executive Officer and Chief Financial Officer, do not expect that our disclosure controls and procedures or internal control over financial reporting will prevent all error and all fraud. Controls, no matter how well conceived and operated, can provide only reasonable, not absolute, assurance that the objectives of the controls are met. Further, we believe that the design of prudent controls must reflect appropriate resource constraints, such that the benefits of controls must be considered relative to their costs. Because of the inherent limitations in all controls, there can be no absolute assurance that all control issues and instances of fraud, if any, applicable to us have been or will be detected. These inherent limitations include the realities that judgments in decision-making can be faulty, and that breakdowns can occur because of simple errors or mistakes. Additionally, controls can be circumvented by the individual acts of some individuals, by collusion of more than one person, or by management override of the control. The design of any system of controls also is based in part upon certain assumptions about the likelihood of future events, and there can be no assurance that any design will succeed in achieving its stated goals under all potential future conditions; over time, control may become inadequate because of changes in conditions, or the degree of compliance with the policies or procedures may deteriorate. Because of the inherent limitations in a cost-effective control system, misstatements due to error or fraud may occur and not be detected.
Evaluation: An evaluation was performed under the supervision and with the participation of the Company's management, including our Chief Executive Officer and Chief Financial Officer, of the effectiveness of the design and operation of the Company's disclosure controls and procedures as required by Rules 13a-15(b) and 15d-15(b) of the Exchange Act. Based upon that evaluation, the Company's management, including our Chief Executive Officer and Chief Financial Officer, concluded, subject to the limitations noted above, that at December 31, 2004, the Company's disclosure controls and procedures were effective in ensuring that all material information required to be filed in this Report has been made known to them in a timely fashion. In the course of preparing for providing certification of its compliance with Section 404 of the Sarbanes-Oxley Act of 2002, the Company has made certain enhancements in its internal control over financial reporting which are not specifically identified in this report in reliance upon guidance provided by the SEC. During the fourth quarter of 2004, the Company's management discovered errors in the timing of the recognition of premium on multi-year ceded reinsurance contracts. As a result of these errors, management determined that there was a significant deficiency in the Company's control environment. The Company's management has subsequently enhanced its controls over recording premium on multi-year and complex reinsurance contracts and has corrected this significant deficiency. Except for the preceding items, there has been no change in the Company's internal control over financial reporting during the year ended December 31, 2004 that has materially affected, or is reasonably likely to materially affect, the Company's internal control over financial reporting.
ITEM 9B. OTHER INFORMATION
None.
83
PART III
ITEM 10. DIRECTORS AND EXECUTIVE OFFICERS OF RENAISSANCERE
The information required by this item is included under the caption "Directors and Executive Officers of the Company" in our Definitive Proxy Statement to be filed in respect of our 2005 Annual General Meeting of Shareholders (the "Proxy Statement") and is hereby incorporated in this Annual Report by reference.
RenaissanceRe has adopted a Code of Ethics that applies to its directors and executive officers. The Code of Ethics is available free of charge on our website http://www.renre.com. We intend to disclose any amendments to our waivers of our Code of Ethics by posting such information on our website.
ITEM 11. EXECUTIVE COMPENSATION
The information required by this item is included under the caption "Executive Officer and Director Compensation" in our Proxy Statement and is hereby incorporated in this Annual Report by reference.
ITEM 12. SECURITY OWNERSHIP OF CERTAIN BENEFICIAL OWNERS AND MANAGEMENT AND RELATED SHAREHOLDER MATTERS
The information required by this item is included under the caption "Security Ownership of Certain Beneficial Owners, Management and Directors" in our Proxy Statement and is hereby incorporated in this Annual Report by reference.
ITEM 13. CERTAIN RELATIONSHIPS AND RELATED TRANSACTIONS
The information required by this item is included under the caption "Certain Relationships and Related Transactions" in our Proxy Statement and is hereby incorporated in this Annual Report by reference.
ITEM 14. PRINCIPAL ACCOUNTANT FEES AND SERVICES
The information required by this item is included under the caption "Proposal 2" in our Proxy Statement and is hereby incorporated in this Annual Report by reference.
84
PART IV
ITEM 15. EXHIBITS AND FINANCIAL STATEMENT SCHEDULES
(a) Financial Statements, Financial Statement Schedules and Exhibits.
1. Financial Statements
The Consolidated Financial Statements of RenaissanceRe Holdings Ltd. and related Notes thereto are listed in the accompanying Index to Consolidated Financial Statements and are filed as part of this Report.
2. Financial Statement Schedules
The Schedules to the Consolidated Financial Statements of RenaissanceRe Holdings Ltd. are listed in the accompanying Index to Schedules to Consolidated Financial Statements and are filed as a part of this Report.
3. Exhibits
| |
| 3.1 | Memorandum of Association.(1) |
| |
| 3.2 | Amended and Restated Bye-Laws.(13) |
| |
| 3.3 | Memorandum of Increase in Share Capital of RenaissanceRe Holdings Ltd.(11) |
| |
| 4.4 | Specimen Common Share certificate.(1) |
| |
| 10.1 | RenaissanceRe Holdings Ltd. Restricted Stock Plan.(1) |
| |
| 10.2 | Sixth Amended and Restated Employment Agreement, dated as of May 19, 2004, between RenaissanceRe Holdings Ltd. and James N. Stanard.(19) |
| |
| 10.3 | Amended and Restated Employment Agreement, dated as of June 30, 2004, between RenaissanceRe Holdings Ltd. and John M. Lummis.(19) |
| |
| 10.4 | Employment Agreement, dated as of June 30, 2003, between RenaissanceRe Holdings Ltd. and William I. Riker.(14) |
| |
| 10.5 | Amended and Restated Employment Agreement, dated as of June 30, 2003, between Renaissance Reinsurance Ltd. and John D. Nichols, Jr.(14) |
| |
| 10.6 | Employment Agreement, dated as of June 30, 2003, between RenaissanceRe Holdings Ltd. and David Eklund.(14) |
| |
| 10.7 | Letter of Resignation of David A. Eklund, dated June 22, 2004. (19) |
| |
| 10.8 | Second Amended and Restated Credit Agreement, dated as of August 6, 2004, among RenaissanceRe Holdings Ltd., the Lenders named therein, Deutsche Bank AG New York Branch, as LC Issuer and Co-Documentation Agent, HSBC Bank US, National Association, as Co-Documentation Agent, Citibank, N.A. and Wachovia Bank, National Association, as Co-Syndication Agents, Bank of America, N.A., as Administrative Agent and Bank of America Securities LLC, as Sole Lead Arranger and Sole Book Manager.(21) |
| |
| 10.9 | Amended and Restated Credit Agreement, dated as of May 25, 2004, among DaVinciRe Holdings Ltd., as borrower, the Lenders named therein, Citigroup Global Markets Inc., as sole lead arranger and book manager, and Citibank, N.A., as administrative agent for the Lenders.(19) |
| |
| 10.10 | RenaissanceRe Holdings Ltd. Second Amended and Restated 1993 Stock Incentive Plan. (4) |
| |
| 10.11 | RenaissanceRe Holdings Ltd. 2001 Stock Incentive Plan.(3) |
85
| |
| 10.12 | Form of Option Grant Notice and Agreement pursuant to which option grants are made under the RenaissanceRe Holdings Ltd. 2001 Stock Incentive Plan. (21) |
| |
| 10.13 | Form of Restricted Stock Grant Notice and Agreement pursuant to which Restricted Stock grants are made under the RenaissanceRe Holdings Ltd. 2001 Stock Incentive Plan. (21) |
| |
| 10.14 | RenaissanceRe Holdings Ltd. 2004 Stock Option Incentive Plan. (20) |
| |
| 10.15 | Amendment No. 1 to the RenaissanceRe Holdings Ltd. 2004 Stock Option Incentive Plan. |
| |
| 10.16 | Option Agreement pursuant to which option grants are made under the RenaissanceRe Holdings Ltd. 2004 Stock Option Incentive Plan to James N. Stanard. (20) |
| |
| 10.17 | Form of Option Agreement pursuant to which option grants are made under the RenaissanceRe Holdings 2004 Stock Option Incentive Plan to executive officers (excluding grants to Mr. Stanard). (20) |
| |
| 10.18 | Amended and Restated RenaissanceRe Holdings Ltd. Non-Employee Director Stock Plan.(2) |
| |
| 10.19 | Form of Grant Agreement for Directors. (24) |
| |
| 10.20 | Board Compensation Summary. |
| |
| 10.21 | Amended and Restated Declaration of Trust of RenaissanceRe Capital Trust, dated as of March 7, 1997, among RenaissanceRe Holdings Ltd., as Sponsor, The Bank of New York, as Property Trustee, The Bank of New York (Delaware), as Delaware Trustee, and the Administrative Trustees named therein.(5) |
| |
| 10.22 | Indenture, dated as of March 7, 1997, among RenaissanceRe Holdings Ltd., as Sponsor, and The Bank of New York, as Debenture Trustee.(5) |
| |
| 10.23 | Series A Capital Securities Guarantee Agreement, dated as of March 7, 1997, between RenaissanceRe Holdings Ltd. and The Bank of New York, as Trustee.(5) |
| |
| 10.24 | Master Standby Letter of Credit Reimbursement Agreement, dated as of November 2, 2001, between Renaissance Reinsurance Ltd. and Fleet National Bank. Glencoe Insurance Ltd. and Timicuan Reinsurance Ltd. have each become a party to this agreement pursuant to an accession agreement, and DaVinci Reinsurance Ltd. has entered in a substantially similar agreement with Fleet National Bank.(16) |
| |
| 10.25 | Certificate of Designation, Preferences and Rights of 8.10% Series A Preference Shares.(6) |
| |
| 10.26 | Certificate of Designation, Preferences and Rights of 7.30% Series B Preference Shares.(10) |
| |
| 10.27 | Certificate of Designation, Preferences and Rights of 6.08% Series C Preference Shares.(17) |
| |
| 10.28 | Senior Indenture, dated as of July 1, 2001, between RenaissanceRe Holdings Ltd., as Issuer, and Bankers Trust Company, as Trustee.(7) |
| |
| 10.29 | First Supplemental Indenture, dated as of July 17, 2001, to the Indenture, dated as of July 1, 2001, between RenaissanceRe Holdings Ltd., as Issuer, and Bankers Trust Company, as Trustee.(7) |
| |
| 10.30 | Second Supplemental Indenture, by and between RenaissanceRe Holdings Ltd. and Deutsche Bank Trust Company Americas (f/k/a Bankers Trust Company), dated as of January 31, 2003.(9) |
| |
| 10.31 | First Amended and Restated Reimbursement Agreement, dated as of March 31, 2004, by and among Renaissance Reinsurance Ltd., Renaissance Reinsurance of Europe, Glencoe |
86
| |
| | Insurance Ltd., DaVinci Reinsurance Ltd., RenaissanceRe Holdings Ltd, Wachovia Bank, National Association, as issuing bank, administrative agent, and collateral agent for the lenders, certain co-documentation agents and certain lender parties thereto.(18) |
| |
| 10.32 | First Amendment to First Amended and Restated Reimbursement Agreement, dated as of November 18, 2004, by and among Renaissance Reinsurance Ltd., Renaissance Reinsurance of Europe, Glencoe Insurance Ltd., DaVinci Reinsurance Ltd., RenaissanceRe Holdings Ltd., Wachovia Bank, National Association, as issuing bank, administrative agent, and collateral agent for the lenders, certain co-documentation agents and certain lender parties thereto. (22) |
| |
| 10.33 | Notice of Reduction of the L/C Commitments, effective January 18, 2005, to First Amended and Restated Reimbursement Agreement, dated as of November 18, 2004, by and among Renaissance Reinsurance Ltd., Renaissance Reinsurance of Europe, Glencoe Insurance Ltd., DaVinci Reinsurance Ltd., RenaissanceRe Holdings Ltd., Wachovia Bank, National Association, as issuing bank, administrative agent, and collateral agent for the lenders, certain co-documentation agents and certain lender parties thereto. |
| |
| 10.34 | Second Amendment to First Amended and Restated Reimbursement Agreement, dated as of March 11, 2005, by and among Renaissance Reinsurance Ltd., Renaissance Reinsurance of Europe, Glencoe Insurance Ltd., DaVinci Reinsurance Ltd., RenaissanceRe Holdings Ltd., the banks and financial institutions parties thereto, Wachovia Bank, National Association, as issuing bank, administrative agent, and collateral agent for the lenders, and certain co-documentation agents. (24) |
| |
| 10.35 | Investment Agreement, dated as of September 20, 2002, by and among RenaissanceRe Holdings Ltd., Platinum Underwriters Holdings, Ltd. and The St. Paul Companies, Inc.(8) |
| |
| 10.36 | First Amendment to the Investment Agreement by and among Platinum Holdings Ltd., The St. Paul Companies, and RenaissanceRe Holdings Ltd., dated as of November 1, 2002.(8) |
| |
| 10.37 | Amended and Restated Option Agreement, between Platinum Underwriters Holdings, Ltd. and RenaissanceRe Holdings Ltd., dated as of November 18, 2004. |
| |
| 10.38 | Transfer Restrictions, Registration Rights and Standstill Agreement between Platinum Underwriters Holdings, Ltd. and RenaissanceRe Holdings Ltd., dated as of November 1, 2002.(8) |
| |
| 10.39 | Services and Capacity Reservation Agreement between Platinum Underwriters Holdings, Ltd. and RenaissanceRe Holdings Ltd., dated as of November 1, 2002.(8) |
| |
| 10.40 | Form of Director Retention Agreement, dated as of November 8, 2002, entered into by each of the non-employee directors of RenaissanceRe Holdings Ltd.(23) |
| |
| 21.1 | List of Subsidiaries of the Registrant. |
| |
| 23.1 | Consent of Ernst & Young. |
| |
| 31.1 | Certification of James N. Stanard, Chief Executive Officer of RenaissanceRe Holdings Ltd., pursuant to Rule 13a-14(a) or Rule 15d-14(a) of the Securities Exchange Act of 1934, as amended. |
| |
| 31.2 | Certification of John M. Lummis, Chief Financial Officer of RenaissanceRe Holdings Ltd., pursuant to Rule 13a-14(a) or Rule 15d-14(a) of the Securities Exchange Act of 1934, as amended. |
| |
| 32.1 | Certification of James N. Stanard, Chief Executive Officer of RenaissanceRe Holdings Ltd., pursuant to 18 U.S.C. Section 1350, as adopted pursuant to Section 906 of the Sarbanes-Oxley Act of 2002. |
87
| |
| 32.2 | Certification of John M. Lummis, Chief Financial Officer of RenaissanceRe Holdings Ltd., pursuant to 18 U.S.C. Section 1350, as adopted pursuant to Section 906 of the Sarbanes-Oxley Act of 2002. |
| |
| (1) | Incorporated by reference to the Registration Statement on Form S-1 of RenaissanceRe Holdings Ltd. (Registration No. 33-70008) which was declared effective by the Commission on July 26, 1995. |
| |
| (2) | Incorporated by reference to Exhibit 99.1 to the Registration Statement on Form S-8 (Registration No. 333-90758) dated June 19, 2002. |
| |
| (3) | Incorporated by reference to Exhibit 99.2 to the Registration Statement on Form S-8 (Registration No. 333-90758) dated June 19, 2002. |
| |
| (4) | Incorporated by reference to Exhibit 99.3 to the Registration Statement on Form S-8 (Registration No. 333-90758) dated June 19, 2002. |
| |
| (5) | Incorporated by reference to RenaissanceRe Holdings Ltd.'s Current Report on Form 8-K, filed with the Commission on March 19, 1997, relating to certain events which occurred on March 7, 1997 (SEC File Number 000-26512). |
| |
| (6) | Incorporated by reference to RenaissanceRe Holdings Ltd.'s Current Report on Form 8-K, filed with the Commission on November 16, 2001, relating to certain events which occurred on November 14, 2001. |
| |
| (7) | Incorporated by reference to RenaissanceRe Holdings Ltd.'s Current Report on Form 8-K, filed with the Commission on July 17, 2001, relating to certain events which occurred on July 12, 2001. |
| |
| (8) | Incorporated by reference to RenaissanceRe Holdings Ltd.'s Current Report on Form 8-K, filed with the Commission on November 6, 2002, relating to certain events which occurred on November 1, 2002. |
| |
| (9) | Incorporated by reference to RenaissanceRe Holdings Ltd.'s Current Report on Form 8-K, filed with the Commission on January 31, 2003, relating to certain events which occurred on January 28, 2003. |
| |
| (10) | Incorporated by reference to RenaissanceRe Holdings Ltd.'s Current Report on Form 8-K, filed with the Commission on February 2, 2003, relating to certain events which occurred on January 30, 2003. |
| |
| (11) | Incorporated by reference to RenaissanceRe Holdings Ltd.'s Quarterly Report on Form 10-Q for the period ended March 31, 1998, filed with the Commission on May 14, 1998 (SEC File Number 000-26512). |
| |
| (12) | Incorporated by reference to RenaissanceRe Holdings Ltd.'s Quarterly Report on Form 10-Q for the period ended June 30, 1998, filed with the Commission on August 14, 1998 (SEC File Number 000-26512). |
| |
| (13) | Incorporated by reference to RenaissanceRe Holdings Ltd.'s Quarterly Report on Form 10-Q for the period ended June 30, 2002, filed with the Commission on August 14, 2002. |
| |
| (14) | Incorporated by reference to RenaissanceRe Holdings Ltd.'s Quarterly Report on Form 10-Q for the period ended June 30, 2003, filed with the Commission on August 14, 2003. |
| |
| (15) | Incorporated by reference to RenaissanceRe Holdings Ltd.'s Annual Report on Form 10-K for the year ended December 31, 1998, filed with the Commission on March 31, 1999 (SEC File Number 000-26512). |
88
| |
| (16) | Incorporated by reference to RenaissanceRe Holdings Ltd.'s Annual Report on Form 10-K for the year ended December 31, 2001 filed with the Commission on April 1, 2002. |
| |
| (17) | Incorporated by reference to RenaissanceRe Holdings Ltd.'s Current Report on Form 8-K, filed with the Commission on March 18, 2004. |
| |
| (18) | Incorporated by reference to RenaissanceRe Holdings Ltd.'s Quarterly Report on Form 10-Q for the period ended March 31, 2004, filed with the Commission on May 10, 2004. |
| |
| (19) | Incorporated by reference to RenaissanceRe Holdings Ltd.'s Quarterly Report on Form 10-Q for the period ended June 30, 2004, filed with the Commission on August 9, 2004. |
| |
| (20) | Incorporated by reference to RenaissanceRe Holdings Ltd.'s Current Report on Form 8-K, filed with the Commission on September 2, 2004. |
| |
| (21) | Incorporated by reference to RenaissanceRe Holdings Ltd.'s Quarterly Report on Form 10-Q for the period ended September 30, 2004, filed with the Commission on November 9, 2004. |
| |
| (22) | Incorporated by reference to RenaissanceRe Holdings Ltd.'s Current Report on Form 8-K, filed with the Commission on November 24, 2004. |
| |
| (23) | Incorporated by reference to RenaissanceRe Holdings Ltd.'s Annual Report on Form 10-K for the year ended December 31, 2002, filed with the Commission on March 31, 2003 (SEC File Number 001-14428). |
| |
| (24) | Incorporated by reference to RenaissanceRe Holdings Ltd.'s Current Report on Form 8-K, filed with the Commission on March 14, 2005. |
89
SIGNATURES
Pursuant to the requirements of Section 13 or 15(d) of the Securities Exchange Act of 1934, the Registrant has duly caused this report to be signed on its behalf by the undersigned, thereunto duly authorized, in Hamilton, Bermuda on March 31, 2005.
RENAISSANCERE HOLDINGS LTD.
| | | | | | | | | | |
| | | By: | | /s/ James N. Stanard |
| | | | | James N. Stanard
Chief Executive Officer and
Chairman of the Board of Directors |
|
| | | | | | | | | | |
| Signature | | Title | | Date |
| /s/ James N. Stanard | | Chief Executive Officer and
Chairman of the Board of
Directors | | March 31, 2005 |
| James N. Stanard | |
| /s/ William I. Riker | | President, President and Chief
Executive Officer, Glencoe Group, Director | | March 31, 2005 |
William I. Riker
| |
| /s/ John M. Lummis | | Executive Vice President,
Chief Operating Officer and Chief Financial Officer (Principal Accounting Officer) | | March 31, 2005 |
| John M. Lummis | |
| | |
| /s/ Thomas A. Cooper | | Director | | March 31, 2005 |
| Thomas A. Cooper | |
| /s/ Edmund B. Greene | | Director | | March 31, 2005 |
| Edmund B. Greene | |
| /s/ Brian R. Hall | | Director | | March 31, 2005 |
| Brian R. Hall | |
| /s/ William F. Hecht | | Director | | March 31, 2005 |
| William F. Hecht | |
| /s/ W. James MacGinnitie | | Director | | March 31, 2005 |
| W. James MacGinnitie | |
| /s/ Scott E. Pardee | | Director | | March 31, 2005 |
| Scott E. Pardee | |
| /s/ Nicholas L. Trivisonno | | Director | | March 31, 2005 |
| Nicholas L. Trivisonno | |
|
90
[HIS PAGE INTENTIONALLY LEFT BLANK.]
INDEX TO CONSOLIDATED FINANCIAL STATEMENTS
| | | | | | |
| | | Page |
| Management's Report on Internal Control Over Financial Reporting | | | F-2 | |
| Report of Independent Registered Public Accounting Firm | | | F-3 | |
| Report of Independent Registered Public Accounting Firm | | | F-4 | |
| Consolidated Balance Sheets at December 31, 2004 and 2003 | | | F-5 | |
| Consolidated Statements of Income for the Years Ended December 31, 2004, 2003 and 2002 | | | F-6 | |
| Consolidated Statements of Changes in Shareholders' Equity for the Years Ended December 31, 2004, 2003 and 2002 | | | F-7 | |
| Consolidated Statements of Cash Flows for the Years Ended December 31, 2004, 2003 and 2002 | | | F-8 | |
| Notes to the Consolidated Financial Statements | | | F-9 | |
|
F-1
MANAGEMENT'S REPORT ON INTERNAL CONTROL OVER FINANCIAL REPORTING
Management at RenaissanceRe Holdings Ltd. (the "Company") is responsible for establishing and maintaining effective internal control over financial reporting as defined in Rules 13a-15(f) and 15d-15(f) under the Securities Exchange Act of 1934, as amended. The Company's internal control over financial reporting was designed to provide reasonable assurance regarding the reliability of financial reporting and the preparation of financial statements for external purposes in accordance with accounting principles generally accepted in the United States and to reflect management's judgments and estimates concerning effects of events and transactions that are accounted for or disclosed. There are inherent limitations to the effectiveness of any controls. Controls, no matter how well conceived and operated, can provide only reasonable assurance that their objectives are met. No evaluation of controls can provide absolute assurance that all control issues and instances of fraud, if any, within the Company have been detected.
Management, with the participation of the Chief Executive Officer and Chief Financial Officer, assessed its internal control over financial reporting as of December 31, 2004. In making this assessment, management used the criteria set forth by the Committee of Sponsoring Organizations of the Treadway Commission (COSO) in Internal Control-Integrated Framework. Based on this assessment, management believes that the Company maintained effective internal control over financial reporting as of December 31, 2004.
Management's assessment of the effectiveness of internal control over financial reporting as of December 31, 2004, has been audited by Ernst & Young, the Independent Registered Public Accountants who also audited the Company's consolidated financial statements. Ernst & Young's attestation report on management's assessment of the Company's internal control over financial reporting appears on page F-4 hereof.
F-2
REPORT OF INDEPENDENT REGISTERED PUBLIC ACCOUNTING FIRM
TO THE BOARD OF DIRECTORS AND SHAREHOLDERS OF RENAISSANCERE HOLDINGS LTD.
We have audited the accompanying consolidated balance sheets of RenaissanceRe Holdings Ltd. and Subsidiaries as of December 31, 2004 and 2003, and the related consolidated statements of income, changes in shareholders' equity and cash flows for each of the three years in the period ended December 31, 2004. These financial statements are the responsibility of the Company's management. Our responsibility is to express an opinion on these financial statements based on our audits.
We conducted our audits in accordance with the standards of the Public Company Accounting Oversight Board (United States). Those standards require that we plan and perform the audit to obtain reasonable assurance about whether the financial statements are free of material misstatement. An audit includes examining, on a test basis, evidence supporting the amounts and disclosures in the financial statements. An audit also includes assessing the accounting principles used and significant estimates made by management, as well as evaluating the overall financial statement presentation. We believe that our audits provide a reasonable basis for our opinion.
In our opinion, the consolidated financial statements referred to above present fairly, in all material respects, the consolidated financial position of RenaissanceRe Holdings Ltd. and Subsidiaries at December 31, 2004 and 2003, and the consolidated results of their operations and their cash flows for each of the three years in the period ended December 31, 2004, in conformity with U.S. generally accepted accounting principles.
We also have audited, in accordance with the standards of the Public Company Accounting Oversight Board (United States), the effectiveness of RenaissanceRe Holdings Ltd.'s internal control over financial reporting as of December 31, 2004, based on criteria established in Internal Control – Integrated Framework issued by the Committee of Sponsoring Organization of the Treadway Commission and our report dated March 30, 2005 expressed an unqualified opinion thereon.
As discussed in Note 3 to the consolidated financial statements, in 2003 the Company changed its method of accounting for stock compensation.
As discussed in Note 2 to the consolidated financial statements, the Company has restated its 2003 and 2002 consolidated financial statements.
/s/ Ernst & Young
Hamilton, Bermuda
March 30, 2005
F-3
REPORT OF INDEPENDENT REGISTERED PUBLIC ACCOUNTING FIRM
TO THE BOARD OF DIRECTORS AND SHAREHOLDERS OF RENAISSANCERE HOLDINGS LTD.
We have audited management's assessment, included in the accompanying Management's Report on Internal Control Over Financial Reporting, that RenaissanceRe Holdings Ltd. maintained effective internal control over financial reporting as of December 31, 2004, based on criteria established in Internal Control-Integrated Framework issued by the Committee of Sponsoring Organizations of the Treadway Commission (the COSO criteria). RenaissanceRe Holdings Ltd.'s management is responsible for maintaining effective internal control over financial reporting and for its assessment of the effectiveness of internal control over financial reporting. Our responsibility is to express an opinion on management's assessment and an opinion on the effectiveness of the company's internal control over financial reporting based on our audit.
We conducted our audit in accordance with the standards of the Public Company Accounting Oversight Board (United States). Those standards require that we plan and perform the audit to obtain reasonable assurance about whether effective internal control over financial reporting was maintained in all material respects. Our audit included obtaining an understanding of internal control over financial reporting, evaluating management's assessment, testing and evaluating the design and operating effectiveness of internal control, and performing such other procedures as we considered necessary in the circumstances. We believe that our audit provides a reasonable basis for our opinion.
A company's internal control over financial reporting is a process designed to provide reasonable assurance regarding the reliability of financial reporting and the preparation of financial statements for external purposes in accordance with generally accepted accounting principles. A company's internal control over financial reporting includes those policies and procedures that (1) pertain to the maintenance of records that, in reasonable detail, accurately and fairly reflect the transactions and dispositions of the assets of the company; (2) provide reasonable assurance that transactions are recorded as necessary to permit preparation of financial statements in accordance with generally accepted accounting principles, and that receipts and expenditures of the company are being made only in accordance with authorizations of management and directors of the company; and (3) provide reasonable assurance regarding prevention or timely detection of unauthorized acquisition, use, or disposition of the company's assets that could have a material effect on the financial statements.
Because of its inherent limitations, internal control over financial reporting may not prevent or detect misstatements. Also, projections of any evaluation of effectiveness to future periods are subject to the risk that controls may become inadequate because of changes in conditions, or that the degree of compliance with the policies or procedures may deteriorate.
In our opinion, management's assessment that RenaissanceRe Holdings Ltd. maintained effective internal control over financial reporting as of December 31, 2004, is fairly stated, in all material respects, based on the COSO criteria. Also, in our opinion, RenaissanceRe Holdings Ltd. maintained, in all material respects, effective internal control over financial reporting as of December 31, 2004, based on the COSO criteria.
We also have audited, in accordance with the standards of the Public Company Accounting Oversight Board (United States), the consolidated balance sheets of RenaissanceRe Holdings Ltd. as of December 31, 2004 and 2003, and the related consolidated statements of income, changes in shareholders' equity, and cash flows for each of the three years in the period ended December 31, 2004 of RenaissanceRe Holdings Ltd. and our report dated March 30, 2005 expressed an unqualified opinion thereon.
/s/ Ernst & Young
Hamilton, Bermuda
March 30, 2005
F-4
RenaissanceRe Holdings Ltd. and Subsidiaries
Consolidated Balance Sheets
At December 31, 2004 and 2003
(in thousands of United States Dollars, except per share amounts)
| | | | | | | | | | |
| | | December 31, 2004 | | December 31, 2003 |
| Assets | |
| Fixed maturity investments available for sale, at fair value | | | | | | | | |
| (Amortized cost $3,181,664 and $2,895,795 at December 31, 2004 and December 31, 2003, respectively) (Note 4) | | $ | 3,223,292 | | | $ | 2,947,841 | |
| Short term investments, at cost | | | 608,292 | | | | 660,564 | |
| Other investments, at fair value (Note 4) | | | 684,590 | | | | 369,242 | |
Equity investments in reinsurance company, at fair value
(Note 4) (Cost $84,199 at December 31, 2004 and 2003) | | | 150,519 | | | | 145,535 | |
| Investments in other ventures, under equity method | | | 159,556 | | | | 35,899 | |
| Total investments | | | 4,826,249 | | | | 4,159,081 | |
| Cash and cash equivalents | | | 66,740 | | | | 63,397 | |
| Premiums receivable | | | 206,813 | | | | 167,996 | |
| Ceded reinsurance balances | | | 61,303 | | | | 56,852 | |
| Losses recoverable (Note 5) | | | 217,788 | | | | 149,201 | |
| Accrued investment income | | | 30,060 | | | | 22,793 | |
| Deferred acquisition costs | | | 70,933 | | | | 75,261 | |
| Other assets | | | 46,432 | | | | 35,121 | |
| Total assets | | $ | 5,526,318 | | | $ | 4,729,702 | |
| Liabilities, Minority Interest and Shareholders' Equity | | | | | | | | |
| Liabilities | | | | | | | | |
| Reserve for claims and claim expenses (Note 6) | | $ | 1,459,398 | | | $ | 977,892 | |
| Reserve for unearned premiums | | | 365,335 | | | | 349,824 | |
| Debt (Note 7) | | | 350,000 | | | | 350,000 | |
| Subordinated obligation to capital trust (Note 8) | | | 103,093 | | | | 103,093 | |
| Reinsurance balances payable | | | 188,564 | | | | 131,629 | |
| Other liabilities | | | 68,092 | | | | 52,123 | |
| Total liabilities | | | 2,534,482 | | | | 1,964,561 | |
| Minority Interest — DaVinci (Note 9) | | | 347,794 | | | | 430,498 | |
| Shareholders' Equity (Note 10) | | | | | | | | |
| Preference Shares: $1.00 par value — 20,000,000 shares issued and outstanding at December 31, 2004 (2003 — 10,000,000) | | | 500,000 | | | | 250,000 | |
| Common shares and additional paid-in capital: $1.00 par value — 71,028,711 shares issued and outstanding at December 31, 2004 — (2003 — 70,398,699 shares) | | | 328,896 | | | | 314,414 | |
| Accumulated other comprehensive income | | | 78,960 | | | | 113,382 | |
| Retained earnings | | | 1,736,186 | | | | 1,656,847 | |
| Total shareholders' equity | | | 2,644,042 | | | | 2,334,643 | |
| Total liabilities, minority interest, and shareholders' equity | | $ | 5,526,318 | | | $ | 4,729,702 | |
|
See accompanying notes to the consolidated financial statements
F-5
RenaissanceRe Holdings Ltd. and Subsidiaries
Consolidated Statements of Income
For the years ended December 31, 2004, 2003 and 2002
(in thousands of United States Dollars, except per share amounts)
| | | | | | | | | | | | | | |
| | | 2004 | | 2003 | | 2002 |
| | | | | (Restated) | | (Restated) |
| Revenues | | | | | | | | | | | | |
| Gross premiums written | | $ | 1,544,157 | | | $ | 1,382,209 | | | $ | 1,173,049 | |
| Net premiums written | | $ | 1,349,287 | | | $ | 1,154,776 | | | $ | 925,964 | |
| Increase in unearned premiums | | | (11,060 | ) | | | (36,251 | ) | | | (161,994 | ) |
| Net premiums earned | | | 1,338,227 | | | | 1,118,525 | | | | 763,970 | |
| Net investment income (Note 4) | | | 162,722 | | | | 129,542 | | | | 102,686 | |
| Net foreign exchange gains (losses) | | | (6,383 | ) | | | 13,631 | | | | 3,861 | |
| Equity in earnings of other ventures (Note 4) | | | 31,081 | | | | 21,167 | | | | 22,339 | |
| Other income | | | 18,903 | | | | 5,903 | | | | 10,482 | |
| Net realized gains on investments (Note 4) | | | 23,442 | | | | 80,504 | | | | 10,177 | |
| Total revenues | | | 1,567,992 | | | | 1,369,272 | | | | 913,515 | |
| Expenses | | | | | | | | | | | | |
| Net claims and claim expenses incurred (Note 6) | | | 1,096,299 | | | | 369,181 | | | | 314,525 | |
| Acquisition expenses | | | 244,930 | | | | 194,140 | | | | 95,644 | |
| Operational expenses | | | 56,361 | | | | 67,397 | | | | 49,159 | |
| Corporate expenses | | | 17,609 | | | | 16,043 | | | | 14,327 | |
| Interest expense | | | 25,968 | | | | 18,252 | | | | 13,069 | |
| Total expenses | | | 1,441,167 | | | | 665,013 | | | | 486,724 | |
| Income before minority interests, taxes and change in accounting principle | | | 126,825 | | | | 704,259 | | | | 426,791 | |
| Minority interest — mandatorily redeemable capital securities of a subsidiary trust holding solely junior subordinated debentures of the Company (Note 8) | | | — | | | | (7,470 | ) | | | (7,605 | ) |
| Minority interest — DaVinci (Note 9) | | | 41,420 | | | | (72,014 | ) | | | (55,051 | ) |
| Income before taxes and change in accounting principle | | | 168,245 | | | | 624,775 | | | | 364,135 | |
| Income tax benefit (expense) (Note 15) | | | (4,003 | ) | | | 18 | | | | 115 | |
| Cumulative effect of a change in accounting principle (Note 13) | | | — | | | | — | | | | (9,187 | ) |
| | | | | | | | | | | | | |
| Net income | | | 164,242 | | | | 624,793 | | | | 355,063 | |
| Dividends on preference shares (Note 10) | | | (31,134 | ) | | | (18,801 | ) | | | (12,184 | ) |
| Net income available to common shareholders | | $ | 133,108 | | | $ | 605,992 | | | $ | 342,879 | |
| Net income available to common shareholders per Common Share — basic | | $ | 1.90 | | | $ | 8.78 | | | $ | 5.08 | |
| Net income available to common shareholders per Common Share — diluted | | $ | 1.85 | | | $ | 8.53 | | | $ | 4.88 | |
|
See accompanying notes to the consolidated financial statements
F-6
RenaissanceRe Holdings Ltd. and Subsidiaries
Consolidated Statements of Changes in Shareholders' Equity
For the years ended December 31, 2004, 2003 and 2002
(in thousands of United States Dollars)
| | | | | | | | | | | | | | |
| | | 2004 | | 2003 | | 2002 |
| | | | | (Restated) | | (Restated) |
| Preference shares | |
| Balance — January 1 | | $ | 250,000 | | | $ | 150,000 | | | $ | 150,000 | |
| Issuance of shares | | | 250,000 | | | | 100,000 | | | | — | |
| Balance — December 31 | | | 500,000 | | | | 250,000 | | | | 150,000 | |
| Common shares and additional paid-in capital | | | | | | | | | | | | |
| Balance — January 1 | | | 314,414 | | | | 320,936 | | | | 264,623 | |
| Exercise of options, and issuance of restricted stock awards (Note 18) | | | 22,664 | | | | 15,096 | | | | 10,675 | |
| Offering expenses | | | (8,182 | ) | | | (3,150 | ) | | | (73 | ) |
| Cumulative effect of change in accounting for unearned stock grant compensation (Note 18) | | | — | | | | (18,468 | ) | | | — | |
| Stock dividend | | | — | | | | — | | | | 45,711 | |
| Balance — December 31 | | | 328,896 | | | | 314,414 | | | | 320,936 | |
| Unearned stock grant compensation | | | | | | | | | | | | |
| Balance — January 1 | | | — | | | | (18,468 | ) | | | (20,163 | ) |
| Cumulative effect of change in accounting for unearned stock grant compensation (Note 18) | | | — | | | | 18,468 | | | | — | |
| Net stock grants awarded, cancelled | | | — | | | | — | | | | (7,607 | ) |
| Amortization | | | — | | | | — | | | | 9,302 | |
| Balance — December 31 | | | — | | | | — | | | | (18,468 | ) |
| Accumulated other comprehensive income | | | | | | | | | | | | |
| Balance — January 1 | | | 113,382 | | | | 95,234 | | | | 16,295 | |
| Net unrealized gains (losses) on securities, net of adjustment (see disclosure below) | | | (34,422 | ) | | | 18,148 | | | | 78,939 | |
| Balance — December 31 | | | 78,960 | | | | 113,382 | | | | 95,234 | |
| Retained earnings | | | | | | | | | | | | |
| Balance — January 1 | | | 1,656,847 | | | | 1,092,988 | | | | 834,859 | |
| Net income | | | 164,242 | | | | 624,793 | | | | 355,063 | |
| Dividends paid on common shares | | | (53,769 | ) | | | (42,133 | ) | | | (39,039 | ) |
| Dividends paid on preference shares | | | (31,134 | ) | | | (18,801 | ) | | | (12,184 | ) |
| Stock dividend | | | — | | | | — | | | | (45,711 | ) |
| Balance — December 31 | | | 1,736,186 | | | | 1,656,847 | | | | 1,092,988 | |
| Total Shareholders' Equity | | $ | 2,644,042 | | | $ | 2,334,643 | | | $ | 1,640,690 | |
| Comprehensive income | | | | | | | | | | | | |
| Net income | | $ | 164,242 | | | $ | 624,793 | | | $ | 355,063 | |
| Other comprehensive income (loss) | | | (34,422 | ) | | | 18,148 | | | | 78,939 | |
| Comprehensive income | | $ | 129,820 | | | $ | 642,941 | | | $ | 434,002 | |
| Disclosure regarding net unrealized gains (losses) | | | | | | | | | | | | |
| Net unrealized holding gains (losses) arising during the year | | $ | (10,980 | ) | | $ | 98,652 | | | $ | 89,116 | |
| Net realized gains included in net income | | | (23,442 | ) | | | (80,504 | ) | | | (10,177 | ) |
| Net unrealized gains (losses) on securities | | $ | (34,422 | ) | | $ | 18,148 | | | $ | 78,939 | |
|
See accompanying notes to the consolidated financial statements
F-7
RenaissanceRe Holdings Ltd. and Subsidiaries
Consolidated Statements of Cash Flows
For the years ended December 31, 2004, 2003 and 2002
(in thousands of United States Dollars)
| | | | | | | | | | | | | | |
| | | 2004 | | 2003 | | 2002 |
| | | | | (Restated) | | (Restated) |
| Cash flows provided by operating activities | | | | | | | | | | | | |
| Net income | | $ | 164,242 | | | $ | 624,793 | | | $ | 355,063 | |
| Adjustments to reconcile net income to net cash provided by operating activities | | | | | | | | | | | | |
| Amortization and depreciation | | | 16,860 | | | | 13,091 | | | | 19,041 | |
| Equity in undistributed earnings of other ventures | | | (6,629 | ) | | | 1,228 | | | | (12,677 | ) |
| Net unrealized losses (gains) included in net investment income | | | (24,568 | ) | | | (21,230 | ) | | | 1,412 | |
| Net unrealized gains (losses) included in other income | | | (14,771 | ) | | | (3,319 | ) | | | 7,108 | |
| Net realized investment gains | | | (23,442 | ) | | | (80,504 | ) | | | (10,177 | ) |
| Minority interest in undistributed net income of DaVinci | | | (41,420 | ) | | | 72,014 | | | | 55,051 | |
| Change in: | | | | | | | | | | | | |
| Premiums receivable | | | (38,817 | ) | | | 31,453 | | | | (97,247 | ) |
| Ceded reinsurance balances | | | (4,451 | ) | | | 16,508 | | | | (21,780 | ) |
| Deferred acquisition costs | | | 4,328 | | | | (19,408 | ) | | | (50,015 | ) |
| Reserve for claims and claim expenses, net | | | 412,919 | | | | 223,429 | | | | 231,236 | |
| Reserve for unearned premiums | | | 15,511 | | | | 17,839 | | | | 186,124 | |
| Reinsurance balances payable | | | 56,935 | | | | (17,885 | ) | | | 27,700 | |
| Other | | | 1,416 | | | | (36,562 | ) | | | 87,587 | |
| Net cash provided by operating activities | | | 518,113 | | | | 821,447 | | | | 778,426 | |
| Cash flows used in investing activities | | | | | | | | | | | | |
| Proceeds from sales of investments available for sale | | | 17,099,111 | | | | 12,507,381 | | | | 5,775,865 | |
| Purchases of investments available for sale | | | (17,374,824 | ) | | | (13,155,414 | ) | | | (6,727,950 | ) |
| Net sales (purchases) of short-term investments | | | 52,272 | | | | (90,067 | ) | | | 166,428 | |
| Net purchases of other investments | | | (290,780 | ) | | | (216,039 | ) | | | — | |
| Net sales (purchases) of investments in other ventures | | | (118,653 | ) | | | (1,038 | ) | | | — | |
| Equity investments in reinsurance company | | | — | | | | — | | | | (84,199 | ) |
| Acquisition of subsidiary, net of cash acquired | | | — | | | | — | | | | (23,495 | ) |
| Net cash used in investing activities | | | (632,874 | ) | | | (955,177 | ) | | | (893,351 | ) |
| Cash flows provided by financing activities | | | | | | | | | | | | |
| Issuance of preference shares, net of expenses | | | 241,818 | | | | 96,850 | | | | — | |
| DaVinciRe Share Repurchase | | | (38,811 | ) | | | — | | | | — | |
| Dividends paid — Common Shares | | | (53,769 | ) | | | (42,133 | ) | | | (39,039 | ) |
| Dividends paid — Preference Shares | | | (31,134 | ) | | | (18,801 | ) | | | (12,184 | ) |
| Issuance of debt, net of expenses | | | — | | | | 99,144 | | | | 100,000 | |
| Payment of bank loan | | | — | | | | (25,000 | ) | | | (8,500 | ) |
| Net increase in minority interests | | | — | | | | — | | | | 22,000 | |
| Net cash provided by financing activities | | | 118,104 | | | | 110,060 | | | | 62,277 | |
| Net increase (decrease) in cash and cash equivalents | | | 3,343 | | | | (23,670 | ) | | | (52,648 | ) |
| Cash and cash equivalents, beginning of year | | | 63,397 | | | | 87,067 | | | | 139,715 | |
| Cash and cash equivalents, end of year | | $ | 66,740 | | | $ | 63,397 | | | $ | 87,067 | |
|
See accompanying notes to the consolidated financial statements
F-8
NOTES TO THE CONSOLIDATED FINANCIAL STATEMENTS
December 31, 2004 (amounts in tables expressed in thousands of United States dollars, except per share amounts)
NOTE 1. ORGANIZATION
RenaissanceRe Holdings Ltd. ("RenaissanceRe", or the "Company"), was formed under the laws of Bermuda on June 7, 1993. Through its subsidiaries, the Company provides reinsurance and insurance to a broad range of customers.
| |
| • | Renaissance Reinsurance Ltd. ("Renaissance Reinsurance") is the Company's principal subsidiary and provides property catastrophe and specialty reinsurance coverage to insurers and reinsurers on a worldwide basis. |
| |
| • | The Company also manages property catastrophe reinsurance written on behalf of joint ventures, principally including Top Layer Reinsurance Ltd. ("Top Layer Re") and DaVinci Reinsurance Ltd. ("DaVinci"). The results of DaVinci, and the results of DaVinci's parent, DaVinciRe Holdings Ltd. ("DaVinciRe"), are consolidated in the Company's financial statements (Note 9). Renaissance Underwriting Managers, Ltd., a wholly-owned subsidiary, acts as exclusive underwriting manager for these joint ventures in return for fee-based income and profit participation. |
| |
| • | The Company's Individual Risk operations include direct insurance written on both an admitted basis through Stonington Insurance Company ("Stonington") and on an excess and surplus lines basis through Glencoe Insurance Ltd. ("Glencoe") and Lantana Insurance Ltd. ("Lantana"), and also provide reinsurance coverage, principally on a quota share basis, which is analyzed on an individual risk basis. |
NOTE 2. RESTATEMENT OF FINANCIAL STATEMENTS
The Company's previously issued consolidated balance sheets as at December 31, 2002 and 2001 and consolidated statements of income and statements of changes in shareholders' equity and cash flows for the years ended December 31, 2003, 2002 and 2001, respectively, have been restated to correct accounting errors associated with reinsurance ceded by the Company. The aggregate net effect of these corrections is to increase 2003 net income by $1.3 million; decrease 2002 net income by $21.9 million; and to increase 2001 net income by $20.6 million. The amounts reflect: (1) the timing of the recognition of reinsurance recoverables with respect to an aggregate excess of loss reinsurance agreement and an assignment agreement entered into with Inter-Ocean Reinsurance Company, Ltd. in 2001 (with the impact of decreasing net income by $1.4 million in 2003; decreasing net income by $25.0 million in 2002; and increasing net income by $26.4 million in 2001), and (2) the timing of premium ceded on multi-year contracts (with the impact of increasing net income by $2.7 million in 2003; increasing net income by $3.1 million in 2002; and decreasing net income by $5.8 million in 2001). These restatements only affect the Reinsurance segment.
The effect of this restatement on the consolidated statements of income and consolidated statements of changes in shareholders' equity for the years ended December 31, 2003, 2002 and 2001 and on the consolidated balance sheets as at December 31, 2002 and 2001 are shown in the tables below (in thousands, except per share amounts):
F-9
| | | | | | | | | | | | | | |
| Year ended December 31, 2003 | | Originally
reported | | Restatement
adjustment | | Restated |
| Net premiums written | | $ | 1,152,523 | | | $ | 2,253 | | | $ | 1,154,776 | |
| Increase in unearned premiums | | | (36,780 | ) | | | 529 | | | | (36,251 | ) |
| Net premiums earned | | | 1,115,743 | | | | 2,782 | | | | 1,118,525 | |
| Total revenues | | | 1,366,490 | | | | 2,782 | | | | 1,369,272 | |
| Net claims and claim expenses incurred | | | 367,744 | | | | 1,437 | | | | 369,181 | |
| Total expenses | | | 663,576 | | | | 1,437 | | | | 665,013 | |
| Income before minority interests and taxes | | | 702,914 | | | | 1,345 | | | | 704,259 | |
| Income before taxes | | | 623,430 | | | | 1,345 | | | | 624,775 | |
| Net income | | | 623,448 | | | | 1,345 | | | | 624,793 | |
| Net income available to common shareholders | | | 604,647 | | | | 1,345 | | | | 605,992 | |
| Net income available to common shareholders per Common Share — basic | | | 8.76 | | | | 0.02 | | | | 8.78 | |
| Net income available to common shareholders per Common Share — diluted | | | 8.52 | | | | 0.01 | | | | 8.53 | |
| Retained earnings — balance January 1, 2003 | | | 1,094,333 | | | | (1,345 | ) | | | 1,092,988 | |
| Total shareholders' equity | | | 2,334,643 | | | | — | | | | 2,334,643 | |
| Comprehensive income | | | 641,596 | | | | 1,345 | | | | 642,941 | |
| Net claims and claim expense ratio — calendar year | | | 33.0 | % | | | — | | | | 33.0 | % |
| Underwriting expense ratio | | | 23.4 | % | | | — | | | | 23.4 | % |
| Combined ratio | | | 56.4 | % | | | — | | | | 56.4 | % |
|
| | | | | | | | | | | | | | |
| Year ended December 31, 2002 | | Originally
reported | | Restatement
adjustment | | Restated |
| Net premiums written | | $ | 923,711 | | | $ | 2,253 | | | $ | 925,964 | |
| Increase in unearned premiums | | | (162,806 | ) | | | 812 | | | | (161,994 | ) |
| Net premiums earned | | | 760,905 | | | | 3,065 | | | | 763,970 | |
| Total revenues | | | 910,450 | | | | 3,065 | | | | 913,515 | |
| Net claims and claim expenses incurred | | | 289,525 | | | | 25,000 | | | | 314,525 | |
| Total expenses | | | 461,724 | | | | 25,000 | | | | 486,724 | |
| Income before minority interests, taxes and change in accounting principle | | | 448,726 | | | | (21,935 | ) | | | 426,791 | |
| Income before taxes and change in accounting principle | | | 386,070 | | | | (21,935 | ) | | | 364,135 | |
| Net income | | | 376,998 | | | | (21,935 | ) | | | 355,063 | |
| Net income available to common shareholders | | | 364,814 | | | | (21,935 | ) | | | 342,879 | |
| Net income available to common shareholders per Common Share — basic | | | 5.40 | | | | (0.32 | ) | | | 5.08 | |
| Net income available to common shareholders per Common Share — diluted | | | 5.20 | | | | (0.32 | ) | | | 4.88 | |
| Other assets | | | 62,829 | | | | 1,437 | | | | 64,266 | |
| Total assets | | | 3,745,736 | | | | 1,437 | | | | 3,747,173 | |
| Reinsurance balances payable | | | 146,732 | | | | 2,782 | | | | 149,514 | |
| Total liabilities | | | 1,655,525 | | | | 2,782 | | | | 1,658,307 | |
| Retained earnings — balance January 1, 2002 | | | 814,269 | | | | 20,590 | | | | 834,859 | |
| Retained earnings — balance December 31, 2002 | | | 1,094,333 | | | | (1,345 | ) | | | 1,092,988 | |
| Total shareholders' equity | | | 1,642,035 | | | | (1,345 | ) | | | 1,640,690 | |
| Comprehensive income | | | 455,937 | | | | (21,935 | ) | | | 434,002 | |
| Net claims and claim expense ratio — calendar year | | | 38.1 | % | | | 3.1 | % | | | 41.2 | % |
| Underwriting expense ratio | | | 19.0 | % | | | — | | | | 19.0 | % |
| Combined ratio | | | 57.1 | % | | | 3.1 | % | | | 60.2 | % |
|
F-10
| | | | | | | | | | | | | | |
| Year ended December 31, 2001 | | Originally
reported | | Restatement
adjustment | | Restated |
| Net premiums written | | $ | 339,547 | | | $ | 2,794 | | | $ | 342,341 | |
| Increase in unearned premiums | | | (6,482 | ) | | | (1,341 | ) | | | (7,823 | ) |
| Net premiums earned | | | 333,065 | | | | 1,453 | | | | 334,518 | |
| Total revenues | | | 440,894 | | | | 1,453 | | | | 442,347 | |
| Net claims and claim expenses incurred | | | 149,917 | | | | (20,000 | ) | | | 129,917 | |
| Operational expenses | | | 38,603 | | | | 863 | | | | 39,466 | |
| Total expenses | | | 252,613 | | | | (19,137 | ) | | | 233,476 | |
| Income before minority interests and taxes | | | 188,281 | | | | 20,590 | | | | 208,871 | |
| Income before taxes | | | 180,046 | | | | 20,590 | | | | 200,636 | |
| Net income | | | 165,784 | | | | 20,590 | | | | 186,374 | |
| Net income available to common shareholders | | | 164,366 | | | | 20,590 | | | | 184,956 | |
| Net income available to common shareholders per Common Share — basic | | | 2.76 | | | | 0.35 | | | | 3.11 | |
| Net income available to common shareholders per Common Share — diluted | | | 2.63 | | | | 0.33 | | | | 2.96 | |
| Other assets | | | 57,264 | | | | 26,437 | | | | 83,701 | |
| Total assets | | | 2,643,652 | | | | 26,437 | | | | 2,670,089 | |
| Reinsurance balances payable | | | 115,967 | | | | 5,847 | | | | 121,814 | |
| Total liabilities | | | 1,056,047 | | | | 5,847 | | | | 1,061,894 | |
| Retained earnings — balance December 31, 2001 | | | 814,269 | | | | 20,590 | | | | 834,859 | |
| Total shareholders' equity | | | 1,225,024 | | | | 20,590 | | | | 1,245,614 | |
| Comprehensive income | | | 175,248 | | | | 20,590 | | | | 195,838 | |
| Net claims and claim expense ratio — calendar year | | | 45.0 | % | | | (6.2 | %) | | | 38.8 | % |
| Underwriting expense ratio | | | 25.2 | % | | | 0.2 | % | | | 25.4 | % |
| Combined ratio | | | 70.2 | % | | | (6.0 | %) | | | 64.2 | % |
|
NOTE 3. SIGNIFICANT ACCOUNTING POLICIES
BASIS OF PRESENTATION
The consolidated financial statements have been prepared in accordance with accounting principles generally accepted in the United States ("GAAP") and include the accounts of RenaissanceRe and its wholly-owned and majority-owned subsidiaries and DaVinciRe, which are collectively referred to herein as the "Company." All intercompany transactions and balances have been eliminated on consolidation. Certain prior year comparatives have been reclassified to conform to current presentations. Minority interest represents the interests of external parties in respect of net income (loss) and shareholders' equity of DaVinciRe, and, for periods prior to December 31, 2003, the interests of external parties in respect of net income and shareholders' equity of RenaissanceRe Capital Trust (the "Capital Trust") (Note 8).
USE OF ESTIMATES IN FINANCIAL STATEMENTS
The preparation of financial statements in conformity with GAAP requires management to make estimates and assumptions that affect the reported and disclosed amounts of assets and liabilities and
F-11
disclosure of contingent assets and liabilities at the date of the financial statements and the reported amounts of revenues and expenses during the reporting period. Actual results could differ materially from those estimates. The most significant accounting judgment made by management is the estimation of reserves for claims and claim expense. Other material accounting judgments made by management include the estimation of certain written premiums, losses recoverable under ceded reinsurance contracts and the fair value of other investments.
PREMIUMS AND RELATED EXPENSES
Premiums are recognized as income, net of any applicable retrocessional coverage purchased, over the terms of the related contracts and policies. Premiums written are based on contract and policy terms and include estimates based on information received from both insureds and ceding companies. Subsequent differences arising on such estimates are recorded in the period in which they are determined. Reserve for unearned premiums represents the portion of premiums written that relate to the unexpired terms of contracts and policies in force. Such reserves are computed by pro-rata methods based on statistical data or reports received from ceding companies. Reinstatement premiums are recorded after the occurrence of a loss and are calculated in accordance with the contract terms based upon paid losses and case reserves reported in the period. Reinstatement premiums are earned when written.
Acquisition costs, consisting principally of commissions and brokerage expenses incurred at the time a contract or policy is issued, are deferred and amortized over the period in which the related premiums are earned. Deferred policy acquisition costs are limited to their estimated realizable value based on the related unearned premiums. Anticipated claims and claim expenses, based on historical and current experience, and anticipated investment income related to those premiums are considered in determining the recoverability of deferred acquisition costs.
CLAIMS AND CLAIM EXPENSES
The reserve for claims and claim expenses includes estimates for unpaid claims and claim expenses on reported losses as well as an estimate of losses incurred but not reported. The reserve is based on individual claims, case reserves and other reserve estimates reported by insureds and ceding companies as well as management estimates of ultimate losses. Inherent in the estimates of ultimate losses are expected trends in claim severity and frequency and other factors which could vary significantly as claims are settled. Also, during the past few years the Company has increased its specialty reinsurance and Individual Risk premiums, but does not have the benefit of a significant amount of its own historical experience in these lines of business. Accordingly, the setting and reserving for incurred losses in these lines of business could be subject to greater variability.
Ultimate losses may vary materially from the amounts provided in the consolidated financial statements. These estimates are reviewed regularly and, as experience develops and new information becomes known, the reserves are adjusted as necessary. Such adjustments, if any, are reflected in the consolidated statement of income in the period in which they become known and are accounted for as changes in estimates.
REINSURANCE
Amounts recoverable from reinsurers are estimated in a manner consistent with the claim liability associated with the reinsured policies. For multi-year retrospectively rated contracts, the Company accrues amounts (either assets or liabilities) that are due to or from assuming companies based on estimated contract experience. If the Company determines that adjustments to earlier estimates are appropriate, such adjustments are recorded in the quarter in which they are determined. The Company evaluates the financial condition of its reinsurers through internal evaluation by senior management.
INVESTMENTS, CASH AND CASH EQUIVALENTS
Investments in fixed maturities are classified as available for sale and are reported at fair value. Investment transactions are recorded on the trade date with balances pending settlement reflected in
F-12
the balance sheet as a component of other assets or other liabilities. Net investment income includes interest and dividend income together with amortization of market premiums and discounts and is net of investment management and custody fees. The amortization of premium and accretion of discount for fixed maturity securities is computed using the interest method. Fair values of investments are based on quoted market prices, or when such prices are not available, by reference to broker or underwriter bid indications and/or internal pricing valuation techniques. The net unrealized appreciation or depreciation on these investments is included in accumulated other comprehensive income.
Realized gains or losses on the sale of investments are determined on the basis of the average cost method and include adjustments to the cost basis of investments for declines in value that are considered to be other-than-temporary. The Company routinely assesses whether declines in fair value of its available for sale investments represent impairments that are other than temporary. There are several factors that are considered in the assessment of a security, which include (i) the time period during which there has been a significant decline below cost, (ii) the extent of the decline below cost, (iii) the Company's intent and ability to hold the security, (iv) the potential for the security to recover in value, (v) an analysis of the financial condition of the issuer and (vi) an analysis of the collateral structure and credit support of the security, if applicable. Where the Company has determined that there is an other than temporary decline in the fair value of the security, the cost of the security is written down to the fair value and the unrealized loss at the time the determination is charged to income.
Short term investments, which are managed as part of the Company's investment portfolio and have a maturity of one year or less when purchased, are carried at cost which approximates fair value. Cash equivalents include money market instruments with a maturity of ninety days or less when purchased.
Other investments are carried at fair value with interest and dividend income, income distributions and realized and unrealized gains and losses included in net investment income. The fair value of other investments is generally established on the basis of the net valuation criteria established by the managers of the investments. These net valuations are determined based upon the valuation criteria established by the governing documents of such investments. Such valuations may differ significantly from the values that would have been used had ready markets existed for the shares, partnership interests or notes of the other investments.
Equity investments in reinsurance company consist of publicly-traded shares of Platinum Underwriters Holdings, Ltd. ("Platinum") and a warrant to purchase additional shares of Platinum. These are reported at fair value. The net unrealized appreciation or depreciation on the publicly-traded shares is included in accumulated other comprehensive income. The net unrealized appreciation on the warrant was recorded in other comprehensive income until the fourth quarter of 2004, when a lockup provision on the warrant expired and as a result the warrant met the definition of a derivative under Financial Accounting Standards Board ("FASB") Statement No. 133, "Accounting for Derivative Instruments and Hedging Activities" ("FAS 133"), and the changes in fair value were recorded in other income from that time.
Investments in which the Company has significant influence over the operating and financial policies of the investee are classified as investments in other ventures, under equity method, and are accounted for under the equity method of accounting. Under this method, the Company records its proportionate share of income or loss from such investments in its results for the period. Any decline in value of investments in other ventures, under equity method considered by management to be other than temporary is charged to income in the period in which it is determined.
EARNINGS PER SHARE
Basic earnings per share is based on weighted average common shares and excludes any dilutive effects of options and restricted stock. Diluted earnings per share assumes the exercise of all dilutive stock options and restricted stock grants.
F-13
FOREIGN EXCHANGE
The Company's functional currency is the United States dollar. Revenues and expenses denominated in foreign currencies are translated at the prevailing exchange rate at the transaction date. Monetary assets and liabilities denominated in foreign currencies are translated at exchange rates in effect at the balance sheet date, which may result in the recognition of exchange gains or losses which are included in the determination of net income.
VARIABLE INTEREST ENTITIES
Effective December 31, 2003, the Company adopted FASB Interpretation No. 46, "Consolidation of Variable Interest Entities – an interpretation of ARB No. 51" ("FIN 46"). FIN 46 requires consolidation of all Variable Interest Entities ("VIE") by the investor that will absorb a majority of the VIE's expected losses or residual returns. As further discussed in Note 8, the Capital Trust was determined to be a VIE under FIN 46 and has been deconsolidated effective December 31, 2003. This has resulted in reclassifying certain balances. The adoption of FIN 46 did not have a material impact on the Company's financial condition and results of operations.
STOCK INCENTIVE COMPENSATION PLANS
For the year ended December 31, 2002 and for the prior years, the Company followed Accounting Principles Board Opinion No. 25, "Accounting for Stock Issued to Employees" ("APB 25"), and related interpretations in accounting for its employee stock compensation. Effective January 1, 2003, the Company adopted the fair value recognition provisions of FASB Statement No. 123, "Accounting for Stock-Based Compensation" ("FAS 123"), for all stock-based employee compensation granted, modified or settled after January 1, 2003 under the prospective method described in FASB Statement No. 148, "Accounting for Stock-Based Compensation – Transition and Disclosure" ("FAS 148"). Under the fair value recognition provisions of FAS 123, the Company estimates the fair value of employee stock options and other stock-based compensation on the date of grant and amortizes this value as an expense over the vesting period (see Note 18).
The Company uses the Black-Scholes option pricing model to estimate the fair value of stock options granted to employees and expects to continue to use this acceptable option valuation model upon the required adoption of FASB Statement No. 123 (revised 2004), "Share-Based Payment" ("FAS 123(R)") on July 1, 2005. Because FAS 123(R) must be applied not only to new awards but also to previously granted awards that are not fully vested on the effective date, and because the Company adopted FAS 123 using the prospective transition method (which applied only to awards granted, modified or settled after the adoption date), compensation costs for some previously granted awards that were not recognized under FAS 123 will be recognized under FAS 123(R). The Company estimates that the additional compensation expense related to unvested grants that were issued prior to January 1, 2003 will not be material upon adoption of FAS 123(R). Had the Company adopted FAS 123(R) in prior periods, the impact of that standard would have approximated the impact of FAS 123 as described in the transitional disclosure provisions of FASB Statement No. 148, "Accounting for Stock-Based Compensation – Transition and Disclosure" ("FAS 148"). In accordance with the transitional disclosure provisions of FAS 148, the following table sets out the effect on the Company's net income and earnings per share for all reported periods had the compensation cost been calculated based upon the fair value method recommended in FAS 123:
F-14
| | | | | | | | | | | | | | |
| Year ended December 31, | | 2004 | | 2003 | | 2002 |
| | | | | (Restated) | | (Restated) |
| Net income available to common shareholders, as reported | | $ | 133,108 | | | $ | 605,992 | | | $ | 342,879 | |
| add: stock-based employee compensation cost included in determination of net income | | | 16,982 | | | | 13,892 | | | | 8,243 | |
| less: fair value compensation cost under FAS 123 | | | (19,533 | ) | | | (19,151 | ) | | | (22,307 | ) |
| Pro forma net income available to common shareholders | | $ | 130,557 | | | $ | 600,733 | | | $ | 328,815 | |
| Earnings per share | | | | | | | | | | | | |
| Basic — as reported | | $ | 1.90 | | | $ | 8.78 | | | $ | 5.08 | |
| Basic — pro forma | | $ | 1.87 | | | $ | 8.70 | | | $ | 4.87 | |
| | |
| Diluted — as reported | | $ | 1.85 | | | $ | 8.53 | | | $ | 4.88 | |
| Diluted — pro forma | | $ | 1.82 | | | $ | 8.46 | | | $ | 4.68 | |
|
During 2003, as a result of the Company's adoption of FAS 123, the value of the restricted stock grants awarded are no longer reflected as unearned stock grant compensation as a separate component of shareholders' equity. Accordingly the balance of unearned stock grant compensation of $18.5 million at January 1, 2003 has been reclassified from its separate account in shareholders' equity and reflected as a reduction in additional paid-in capital.
TAXATION
The Company uses the liability method of accounting for income taxes. Under the liability method, deferred income taxes reflect the net tax effect of temporary differences between the carrying amounts of assets and liabilities for financial reporting purposes and the amounts used for income tax purposes. A valuation allowance against the deferred tax asset is provided for if and when the Company believes that a portion or all of the deferred tax asset may not be realized in the near term.
NOTE 4. INVESTMENTS
The amortized cost, fair value and related unrealized gains and losses on fixed maturity investments are as follows:
| | | | | | | | | | | | | | | | | | |
| At December 31, 2004 | | Amortized cost | | Gross unrealized
gains | | Gross unrealized
losses | | Fair value |
| U.S. treasuries and agencies | | $ | 920,332 | | | $ | 2,355 | | | $ | (3,674 | ) | | $ | 919,013 | |
| Non-U.S. government | | | 199,642 | | | | 10,922 | | | | (580 | ) | | | 209,984 | |
| Corporate | | | 1,144,773 | | | | 36,072 | | | | (3,166 | ) | | | 1,177,679 | |
| Mortgage-backed | | | 560,810 | | | | 1,660 | | | | (920 | ) | | | 561,550 | |
| Asset-backed | | | 356,107 | | | | 617 | | | | (1,658 | ) | | | 355,066 | |
| | | $ | 3,181,664 | | | $ | 51,626 | | | $ | (9,998 | ) | | $ | 3,223,292 | |
|
| | | | | | | | | | | | | | | | | | |
| At December 31, 2003 | | Amortized cost | | Gross unrealized
gains | | Gross unrealized
losses | | Fair value |
| U.S. treasuries and agencies | | $ | 797,229 | | | $ | 2,385 | | | $ | (303 | ) | | $ | 799,311 | |
| Non-U.S. government | | | 281,231 | | | | 9,726 | | | | (600 | ) | | | 290,357 | |
| Corporate | | | 810,078 | | | | 39,027 | | | | (2,729 | ) | | | 846,376 | |
| Mortgage-backed | | | 213,491 | | | | 2,350 | | | | (478 | ) | | | 215,363 | |
| Asset-backed | | | 793,766 | | | | 3,556 | | | | (888 | ) | | | 796,434 | |
| | | $ | 2,895,795 | | | $ | 57,044 | | | $ | (4,998 | ) | | $ | 2,947,841 | |
|
F-15
The following table presents an analysis of the continuous periods during which the Company has held fixed maturity investment positions which were carried at an unrealized loss as of December 31, 2004 and 2003:
| | | | | | | | | | | | | | | | | | |
| At December 31, 2004 | | 0 - 6
Months | | 6 - 12
Months | | > 12
Months | | Total |
| (in thousands, except number of positions) | | | | | | |
| Fixed maturity investments: | | | | | | | | | | | | | | | | |
| Number of positions | | | 384 | | | | 303 | | | | 137 | | | | 824 | |
| Market value | | $ | 1,431,546 | | | $ | 276,453 | | | $ | 63,046 | | | $ | 1,771,045 | |
| Amortized cost | | | 1,437,672 | | | | 279,534 | | | | 63,837 | | | | 1,781,043 | |
| Gross unrealized loss | | $ | (6,126 | ) | | $ | (3,081 | ) | | $ | (791 | ) | | $ | (9,998 | ) |
|
| | | | | | | | | | | | | | | | | | |
| At December 31, 2003 | | 0 - 6
Months | | 6 - 12
Months | | > 12
Months | | Total |
| Fixed maturity investments: | | | | | | | | | | | | | | | | |
| Number of positions | | | 355 | | | | 68 | | | | 7 | | | | 430 | |
| Market value | | $ | 392,451 | | | $ | 114,003 | | | $ | 2,850 | | | $ | 509,304 | |
| Amortized cost | | | 395,014 | | | | 115,956 | | | | 3,332 | | | | 514,302 | |
| Gross unrealized loss | | $ | (2,563 | ) | | $ | (1,953 | ) | | $ | (482 | ) | | $ | (4,998 | ) |
|
During the year ended December 31, 2004, the Company recorded $1.2 million (2003 — $0.2 million) in other than temporary impairment charges.
Contractual maturities of fixed maturity securities are shown below. Expected maturities will differ from contractual maturities because borrowers may have the right to call or prepay obligations with or without call or prepayment penalties.
| | | | | | | | | | |
| At December 31, 2004 | | Amortized cost | | Fair value |
| Due in less than one year | | $ | 74,250 | | | $ | 77,746 | |
| Due after one through five years | | | 1,490,581 | | | | 1,495,073 | |
| Due after five through ten years | | | 520,573 | | | | 539,040 | |
| Due after ten years | | | 179,343 | | | | 194,817 | |
| Mortgage-backed | | | 560,810 | | | | 561,550 | |
| Asset-backed | | | 356,107 | | | | 355,066 | |
| Total | | $ | 3,181,664 | | | $ | 3,223,292 | |
|
F-16
Net Investment Income
The components of net investment income are as follows:
| | | | | | | | | | | | | | |
| Year ended December 31, | | 2004 | | 2003 | | 2002 |
| Fixed maturities | | $ | 109,285 | | | $ | 100,666 | | | $ | 91,784 | |
| Short term investments | | | 11,156 | | | | 8,158 | | | | 11,137 | |
| Cash and cash equivalents | | | 838 | | | | 1,852 | | | | 3,238 | |
| Dividends on equity investments in reinsurance company | | | 1,267 | | | | 950 | | | | — | |
| Other investments | | | 46,908 | | | | 25,920 | | | | (383 | ) |
| | | | 169,454 | | | | 137,546 | | | | 105,776 | |
| Investment expenses | | | 6,732 | | | | 8,004 | | | | 3,090 | |
| Net investment income | | $ | 162,722 | | | $ | 129,542 | | | $ | 102,686 | |
|
The analysis of realized gains (losses) and the change in unrealized gains on investments is as follows:
| | | | | | | | | | | | | | |
| Year ended December 31, | | 2004 | | 2003 | | 2002 |
| Gross realized gains | | $ | 78,271 | | | $ | 114,834 | | | $ | 67,294 | |
| Gross realized losses | | | (54,829 | ) | | | (34,330 | ) | | | (57,117 | ) |
| Net realized gains on investments | | | 23,442 | | | | 80,504 | | | | 10,177 | |
| Change in unrealized gains (losses) | | | (34,422 | ) | | | 18,148 | | | | 78,939 | |
| Total realized and change in unrealized gains (losses) on investments | | $ | (10,980 | ) | | $ | 98,652 | | | $ | 89,116 | |
|
At December 31, 2004, $51.6 million of cash and investments at fair value were on deposit with, or in trust accounts for the benefit of, various regulatory authorities as required by law (2003 — $37.2 million).
Other Investments
The table below shows the Company's portfolio of other investments:
| | | | | | | | | | |
| At December 31, | | 2004 | | 2003 |
| Type of investment | | | | | | | | |
| Hedge funds | | $ | 293,462 | | | $ | 170,116 | |
| Senior secured bank loan fund | | | 116,560 | | | | 77,249 | |
| European high yield credit fund | | | 87,689 | | | | 38,333 | |
| Private equity partnerships | | | 82,381 | | | | 24,169 | |
| Medium term note representing an interest in a pool of European fixed income securities | | | 50,000 | | | | 30,000 | |
| Non-US convertible fund | | | 28,214 | | | | — | |
| Miscellaneous other investments | | | 26,284 | | | | 29,375 | |
| Total other investments | | $ | 684,590 | | | $ | 369,242 | |
|
Many of the other investments are subject to restrictions on redemptions or sales which are determined by the governing documents and limit the Company's ability to liquidate these investments in the short term. Due to a lag in the valuations reported by the fund managers, the majority of our hedge fund and private equity partnership valuations are reported on a one month or one quarter lag. Interest income, income distributions and realized and unrealized gains and losses on other
F-17
investments are included in net investment income and totaled $46.9 million (2003 — $25.9 million) of which $24.4 million (2003 –$21.2 million) was related to net unrealized gains.
The Company has committed capital to private equity partnerships of $260.2 million, of which $83.2 million has been contributed at December 31, 2004.
Equity Investments in Reinsurance Company
On November 1, 2002, the Company purchased 3,960,000 common shares of Platinum in a private placement transaction and received a ten-year warrant to purchase up to 2.5 million additional common shares of Platinum for $27.00 per share. The Company purchased the common shares and warrant for an aggregate price of $84.2 million. At December 31, 2004, the Company owned (exclusive of the warrant) 9.2% of Platinum's outstanding common shares. The Company records its investments in Platinum at fair value, and at December 31, 2004 the aggregate fair value was $150.5 million (2003 — $145.5 million). The fair value of the common shares is based on the market price of Platinum's shares as of the balance sheet date. The fair value of the warrant is estimated by the Company using the Black-Scholes option pricing model. The aggregate unrealized gain on the Platinum common shares of $38.9 million (2003 — $34.6 million) is included in accumulated other comprehensive income. During the fourth quarter of 2004, a lockup provision on the warrant expired and as a result the warrant met the definition of a derivative under FAS 133 and therefore changes in the fair value of the warrant were recorded prospectively in other income from November 2004. At December 31, 2004, $27.4 million was recorded in other income representing the unrealized gain on the warrant. This includes a $23.8 million one-time reclassification from other comprehensive income to other income which occurred during the fourth quarter of 2004 with the $3.6 million remainder being the increase in fair value from November 2004. At December 31, 2003, the aggregate unrealized gain on the Platinum warrant was $26.7 million which was included in other comprehensive income.
Investments in Other Ventures, under Equity Method
Investments in other ventures, under equity method includes the Company's investment in ChannelRe Holdings Ltd. ("Channel Re") of $128.5 million (2003 — $1.0 million), which is carried using the equity method. The Company invested $118.7 million in Channel Re in 2004 (2003 — $1.0 million) and the Company's earnings from Channel Re, which are reported one quarter in arrears, totaled $9.8 million in 2004 (2003 — $nil) and are included in other income. Investments in other ventures, under equity method also includes the Company's investment in Top Layer Re of $31.1 million (2003 — $34.9 million), which is 50% owned by Renaissance Reinsurance and is carried using the equity method. The Company's earnings from Top Layer Re totaled $17.4 million for the year ended December 31, 2004 (2003 — $21.2 million) and are included in other income. In addition, in 2004 the Company invested in a joint venture focused on trading weather-sensitive commodities and securities, the earnings from which were included in other income through the end of the second quarter of 2004. As a result of the restructuring of the joint venture as at July 1, 2004, the balance of the investment was reclassified to other investments and the income from the investment was recorded in net investment income for the remainder of the year. The earnings from this investment recorded in other income totaled $3.9 million in 2004 (2003 — $nil).
NOTE 5. CEDED REINSURANCE
The Company uses reinsurance to reduce its exposure to large losses. The Company currently has in place contracts that provide for recovery from reinsurers of a portion of certain claims and claim expenses in excess of various retentions. The Company would remain liable to the extent that any reinsurance company fails to meet its obligations. The earned reinsurance premiums ceded were $190.4 million, $239.9 million and $205.2 million for 2004, 2003 and 2002, respectively.
F-18
The effect of reinsurance and retrocessional activity on premiums written and earned for the years ended December 31, 2004, 2003 and 2002 was as follows:
| | | | | | | | | | | | | | |
| Year ended December 31, | | 2004 | | 2003 | | 2002 |
| Premiums written | | | | | | | | | | | | |
| Direct | | $ | 240,385 | | | $ | 103,916 | | | $ | 81,499 | |
| Assumed | | | 1,303,772 | | | | 1,278,293 | | | | 1,091,550 | |
| Ceded | | | (194,870 | ) | | | (227,433 | ) | | | (247,085 | ) |
| Net | | $ | 1,349,287 | | | $ | 1,154,776 | | | $ | 925,964 | |
| Premiums earned | | | | | | | | | | | | |
| Direct | | $ | 154,430 | | | $ | 83,637 | | | $ | 53,898 | |
| Assumed | | | 1,374,216 | | | | 1,274,830 | | | | 915,263 | |
| Ceded | | | (190,419 | ) | | | (239,942 | ) | | | (205,191 | ) |
| Net | | $ | 1,338,227 | | | $ | 1,118,525 | | | $ | 763,970 | |
|
Other than loss recoveries, certain of the Company's ceded reinsurance contracts also provide for recoveries of additional premiums, reinstatement premiums and lost no claims bonuses, which are incurred when losses are ceded to reinsurance contracts. Total recoveries netted against net claims and claim expenses incurred were $173.7 million, $20.2 million and $38.0 million for 2004, 2003 and 2002, respectively. At December 31, 2004, the Company had a $13.1 million valuation allowance against losses recoverable (2003 — $11.6 million).
NOTE 6. RESERVE FOR CLAIMS AND CLAIM EXPENSES
For the Company's Reinsurance operations, estimates of claims and claim expenses are based in part upon the estimation of claims resulting from catastrophic events. Estimation by the Company of claims resulting from catastrophic events is inherently difficult because of the potential severity of property catastrophe claims. Additionally, the Company has recently increased its Individual Risk and specialty reinsurance premiums but does not have the benefit of a significant amount of its own historical experience in these lines. Therefore, the Company uses both proprietary and commercially available models, as well as historical reinsurance industry property catastrophe claims experience, for purposes of evaluating future trends and providing an estimate of ultimate claims costs.
For both the Company's Reinsurance and Individual Risk operations, the Company uses statistical and actuarial methods to estimate ultimate expected claims and claim expenses. The period of time from the reporting of a loss to the Company and the settlement of the Company's liability may be several years. During this period, additional facts and trends will be revealed. As these factors become apparent, case reserves will be adjusted, sometimes requiring an increase or decrease in the overall reserves of the Company, and at other times requiring a reallocation of incurred but not reported ("IBNR") reserves to specific case reserves. These estimates are reviewed regularly, and such adjustments, if any, are reflected in results of operations in the period in which they become known and are accounted for as changes in estimates. Adjustments to the Company's claims and claim expense reserves can impact current year net income by either increasing net income if the estimates of prior year claims and claim expense reserves prove to be overstated or by decreasing net income if the estimates of prior year claims and claim expense reserves prove to be insufficient.
F-19
Activity in the liability for unpaid claims and claim expenses is summarized as follows:
| | | | | | | | | | | | | | |
| Year ended December 31, | | 2004 | | 2003 | | 2002 |
| | | | | (Restated) | | (Restated) |
| Net reserves as of January 1 | | $ | 828,691 | | | $ | 605,262 | | | $ | 355,321 | |
| Net reserves assumed (released) in acquisition (sale) of subsidiary | | | — | | | | (2,090 | ) | | | 33,579 | |
| Net incurred related to: | | | | | | | | | | | | |
| Current year | | | 1,236,565 | | | | 462,816 | | | | 291,520 | |
| Prior years | | | (140,266 | ) | | | (93,635 | ) | | | 23,005 | |
| Total net incurred | | | 1,096,299 | | | | 369,181 | | | | 314,525 | |
| Net paid related to: | | | | | | | | | | | | |
| Current year | | | 619,239 | | | | 61,770 | | | | 10,017 | |
| Prior years | | | 64,141 | | | | 81,892 | | | | 88,146 | |
| Total net paid | | | 683,380 | | | | 143,662 | | | | 98,163 | |
| Total net reserves as of December 31 | | | 1,241,610 | | | | 828,691 | | | | 605,262 | |
| Losses recoverable as of December 31 | | | 217,788 | | | | 149,201 | | | | 199,533 | |
| Total gross reserves as of December 31 | | $ | 1,459,398 | | | $ | 977,892 | | | $ | 804,795 | |
|
The prior year favorable reserve development in 2004 of $140.3 million included $113.9 million attributable to the Reinsurance segment and $26.4 million attributable to the Individual Risk segment. The reduction in prior years' estimated ultimate claims reserves in the Reinsurance segment was primarily due to a re-estimation of our ultimate losses associated with six large catastrophe events, which produced a reduction of approximately $31.3 million, a $23.0 million reduction in reserves from numerous smaller catastrophe events and $46.8 million in reductions from our specialty book of business. The reductions in the Company's reserves for the smaller catastrophe events, the reserves for the specialty book of business and the reserves for our Individual Risk segment were driven by the application of the Company's formulaic methodology used for these books of business and is primarily due to the actual paid and reported loss activity being better than what the Company anticipated when setting the initial IBNR reserves.
As at December 31, 2003, the prior year net favorable reserve development in 2003 of $93.6 million was primarily due to favorable reserve development of $68.7 million in the Company's Reinsurance segment and $24.9 million in the Company's Individual Risk segment. Within the Reinsurance segment the Company's property catastrophe line of business recorded $60.6 million in favorable reserve development. This was driven by reductions in the estimated losses on relatively small catastrophes due to a reduced level of payment and loss activity during the 1999 through 2002 accident years. The largest net favorable reserve development on a single event was $5.1 million which related to the reduction in the ultimate cost to settle net claims arising from the European floods of 2002. The Company's specialty line of business within the Reinsurance segment had favorable reserve development of $8.1 million in 2003 which was principally driven by reductions from the 2002 accident year. The Company's Individual Risk segment had favorable reserve development of $24.9 million in 2003 which was driven by favorable reserve development in the 2002 accident year associated with the Company's Bermuda-based property business.
Net claims and claim expenses incurred were reduced by $0.8 million during 2004 (2003 — $23.0 million) related to income earned on assumed reinsurance contracts that were classified as deposit contracts with underwriting risk only. Other income was reduced by $1.1 million during 2004 (2003 — $nil) related to losses incurred on assumed reinsurance contracts that were classified as deposit contracts with timing risk only. A deposit liability of $109.3 million is included in reinsurance balances payable at December 31, 2004 (2003 — $80.0 million) and a deposit asset of $6.3 million is included in other assets at December 31, 2004 (2003 — $nil).
F-20
NOTE 7. DEBT
In January 2003, the Company issued $100 million of 5.875% Senior Notes due February 15, 2013, with interest on the notes payable on February 15 and August 15 of each year, commencing August 15, 2003. In July 2001, the Company issued $150 million of 7.0% Senior Notes due July 15, 2008 with interest on the notes payable on January 15 and July 15 of each year. The notes can be redeemed by the Company prior to maturity subject to payment of a "make-whole" premium; however, the Company has no current intentions of calling the notes. The notes, which are senior obligations, contain various covenants, including limitations on mergers and consolidations, restrictions as to the disposition of stock of designated subsidiaries and limitations on liens on the stock of designated subsidiaries. The Company was in compliance with the related covenants at December 31, 2004 and 2003. At December 31, 2004, the fair value of the 5.875% Senior Notes was $104.7 million (2003 - $103.1 million) and the fair value of the 7.0% Senior Notes was $163.7 million (2003 - $167.7 million).
During May 2004, DaVinciRe amended and restated its credit agreement providing for a $100 million committed revolving credit facility and maintained as outstanding the full $100 million available under this facility. Neither RenaissanceRe nor Renaissance Reinsurance is a guarantor of this facility and the lenders have no recourse against the Company or its subsidiaries other than DaVinciRe and its subsidiary under the DaVinciRe facility. Pursuant to the terms of the $500 million facility maintained by RenaissanceRe, a default by DaVinciRe in its obligations will not result in a default under the RenaissanceRe facility. Interest rates on the facility are based on a spread above LIBOR, and averaged approximately 2.32% during 2004 (2003 - 2.09%). As amended, the credit agreement contains certain covenants requiring DaVinciRe to maintain a debt to capital ratio of not more than 30% and a minimum net worth of $250 million. At December 31, 2004 and 2003, DaVinciRe was in compliance with the covenants under this agreement. The amended and restated agreement extended the term of the facility to May 25, 2007.
During August 2004, the Company amended and restated its committed revolving credit agreement to increase the facility from $400 million to $500 million, to extend the term to August 6, 2009 and to make certain other changes. The interest rates on this facility are based on a spread above LIBOR. No balance was outstanding at December 31, 2004 or 2003. As amended, the agreement contains certain financial covenants. These covenants generally provide that consolidated debt to capital shall not exceed the ratio (the "Debt to Capital Ratio") of 0.35:1 and that the consolidated net worth (the "Net Worth Requirements") of RenaissanceRe and Renaissance Reinsurance shall equal or exceed $1 billion and $500 million, respectively, subject to certain adjustments under certain circumstances in the case of the Debt to Capital Ratio and certain grace periods in the case of the Net Worth Requirements, all as more fully set forth in the agreement. The Company has the right, subject to certain conditions, to increase the size of this facility to $600 million.
Cash interest paid on the above debt totaled $26.0 million, $15.9 million and $11.9 million for the years ended December 31, 2004, 2003 and 2002, respectively. Interest expense in 2004 includes interest on the subordinated obligation to the Capital Trust which was previously reflected as minority interest (see Note 8).
NOTE 8. SUBORDINATED OBLIGATION TO CAPITAL TRUST (CAPITAL SECURITIES)
In March 1997, the Company issued $100 million aggregate liquidation amount of mandatorily redeemable capital securities ("Capital Securities") through a subsidiary trust holding solely $103.1 million of the Company's 8.54% junior subordinated debentures due March 1, 2027. The Capital Securities pay cumulative cash distributions at an annual rate of 8.54%, payable semi-annually. The Capital Trust is a wholly-owned subsidiary of the Company and was consolidated into the Company's consolidated financial statements up until the Company's adoption of FIN 46 at December 31, 2003. For periods prior to the adoption of FIN 46, the Capital Securities and the related dividends are reflected in the consolidated financial statements as a minority interest. The Company's guarantee of the distributions on the Capital Securities issued by the Capital Trust, when taken together with the Company's obligations under an expense reimbursement agreement with the Capital Trust, provides full and unconditional guarantee of amounts due on the Capital Securities issued by the Capital Trust.
F-21
Upon the adoption of FIN 46 at December 31, 2003, the Capital Trust was determined to be a variable interest entity and the Company was determined not to be the primary beneficiary of the Capital Trust. Accordingly the Capital Trust was deconsolidated from the Company's consolidated financial statements at December 31, 2003. As a result, the balance of the Capital Securities, previously classified as minority interest, has been reclassified in the Company's consolidated balance sheet at December 31, 2003 and the $103.1 million subordinated obligation to the Capital Trust is recognized on the Company's consolidated balance sheet at December 31, 2003 as a liability. In addition, equity interests in the Capital Trust and purchased Capital Securities held by the Company are included in investments at December 31, 2003. These investments include $15.4 million of Capital Securities purchased by the Company and $3.1 million of common stock issued by the Capital Trust to the Company in March 1997, both of which are eliminated on consolidation for periods prior to the adoption of FIN 46 on December 31, 2003. The adjustments required to deconsolidate the Capital Trust represent reclassifications and there was no impact on consolidated net income.
During 2004 and 2003, the Company did not purchase any Capital Securities. The Company has purchased an aggregate $15.4 million of the Capital Securities since their issuance in 1997.
NOTE 9. MINORITY INTEREST
In October 2001, the Company formed DaVinciRe and DaVinci with other equity investors. RenaissanceRe owns a minority economic interest in DaVinciRe; however, because RenaissanceRe controls a majority of DaVinciRe's outstanding voting rights, the consolidated financial statements of DaVinciRe are included in the consolidated financial statements of the Company. The 74.75% portion of DaVinciRe's earnings and shareholders' equity held by third parties is recorded in the consolidated financial statements as minority interest.
NOTE 10. SHAREHOLDERS' EQUITY
The aggregate authorized capital of the Company is 325,000,000 shares consisting of 225,000,000 common shares and 100,000,000 preference shares. The Company's 225,000,000 authorized $1.00 par value common shares consist of three separate series with differing voting rights as follows:
| | | | | | | | | | |
| At December 31, 2004 | | Remaining authorized | | Outstanding |
| | |
Full Voting Common Shares
(includes all shares registered and available to the public) | | | 125,626,621 | | | | 69,193,611 | |
| Diluted Voting Class I Common Shares | | | 10,224,185 | | | | 1,835,100 | |
| Diluted Voting Class II Common Shares | | | 185,532 | | | | — | |
| | | | 136,036,338 | | | | 71,028,711 | |
|
In March 2004, the Company raised $250 million through the issuance of 10,000,000 Series C preference shares at $25 per share, in February 2003, the Company raised $100 million through the issuance of 4,000,000 Series B preference shares at $25 per share, and in November 2001, the Company raised $150 million through the issuance of 6,000,000 Series A preference shares at $25 per share. The Series C, Series B and Series A preference shares may be redeemed at $25 per share at the Company's option on or after March 23, 2009, February 4, 2008 and November 19, 2006, respectively. Dividends on the Series C, Series B and Series A preference shares are cumulative from the date of original issuance and are payable quarterly in arrears at 6.08%, 7.3% and 8.1%, respectively, when, if, and as declared by the Board of Directors. If the Company submits a proposal to its shareholders concerning an amalgamation or submits any proposal that, as a result of any changes to Bermuda law, requires approval of the holders of these preference shares to vote as a single class, the Company may redeem the Series C, Series B and Series A preference shares prior to March 23, 2009, February 4, 2008 and November 19, 2006, respectively, at $26 per share. The preference shares have no stated maturity and are not convertible into any other securities of the Company.
The Diluted Voting shareholders vote together with the common shareholders. The Diluted Voting I Shares are limited to a fixed voting interest in the Company of up to 9.9% on most corporate matters.
F-22
The Diluted Voting shareholders are entitled to the same rights, including receipt of dividends and the right to vote on certain significant corporate matters, and are subject to the same restrictions as the common shareholders. The Company currently does not intend to register or list the Diluted Voting Shares on the New York Stock Exchange.
In August 2003, the Board authorized a share repurchase program of $150 million. This authorization includes the remaining amounts available under prior authorizations. The Company's decision to repurchase common shares will depend on, among other matters, the market price of the common shares and the capital requirements of the Company. No shares were repurchased during 2004, 2003 or 2002 under this program. Common shares repurchased by the Company are normally cancelled and retired.
NOTE 11. EARNINGS PER SHARE
The Company uses FASB Statement No. 128, "Earnings per Share" to account for its weighted average shares. The numerator in both the Company's basic and diluted earnings per share calculations is identical. The following table sets forth the reconciliation of the denominator from basic to diluted weighted average shares outstanding (in thousands of per share amounts):
| | | | | | | | | | | | | | |
| Year ended December 31, | | 2004 | | 2003 | | 2002 |
| (thousands of shares) | | | | | | |
| | | | | | | | | | | | | |
| Weighted average shares — basic | | | 69,874 | | | | 69,039 | | | | 67,555 | |
| Per share equivalents of employee stock options and restricted shares | | | 1,900 | | | | 1,963 | | | | 2,656 | |
| Weighted average shares — diluted | | | 71,774 | | | | 71,002 | | | | 70,211 | |
|
NOTE 12. RELATED PARTY TRANSACTIONS AND MAJOR CUSTOMERS
During 2004, the Company received distributions from Top Layer Re of $21.2 million (2003 - $22.4 million), and a management fee of $2.8 million (2003 - $3.0 million). The management fee reimburses the Company for services it provides to Top Layer Re.
The Company provides Channel Re with various administrative services. The Company was reimbursed $0.2 million for these services in 2004.
During the years ended December 31, 2004, 2003 and 2002, the Company received 82.2%, 80.4% and 71.1%, respectively, of its reinsurance premium assumed from four reinsurance brokers. Subsidiaries and affiliates of Marsh Inc., the Benfield Group Limited, the Willis Group and AON Corporation accounted for approximately 27.2%, 25.1%, 17.2% and 12.7%, respectively, of the Reinsurance segment's gross premiums written in 2004.
NOTE 13. GOODWILL
In connection with the Company's adoption of FASB Statement No. 142, "Goodwill and Other Intangibles" ("FAS 142"), the Company wrote-off the balance of its goodwill during the second quarter of 2002, which totaled $9.2 million. As required by FAS 142, this charge has been reflected in the consolidated statements of income as a cumulative effect of a change in accounting principle.
NOTE 14. DIVIDENDS
Dividends declared and paid on Common Shares amounted to $0.76, $0.60 and $0.57 per common share for the years ended December 31, 2004, 2003, and 2002, respectively.
During the second quarter of 2002, RenaissanceRe effected a three-for-one stock split through a stock dividend of two additional common shares for each common share owned. All of the common share and per common share information provided in these financial statements is presented as if the stock dividend had occurred for all periods.
F-23
The total amount of dividends paid to holders of the common shares during 2004, 2003 and 2002 was $53.8 million, $42.1 million and $39.0 million, respectively.
NOTE 15. TAXATION
Under current Bermuda law, the Company is not required to pay taxes in Bermuda on either income or capital gains. Income from the Company's U.S.-based subsidiaries is subject to taxes imposed by U.S. authorities. Renaissance Reinsurance of Europe is subject to the taxation laws of Ireland.
Income tax expense (benefit) for 2004, 2003 and 2002 is comprised as follows:
| | | | | | | | | | | | | | |
| Year ended December 31, 2004 | | Current | | Deferred | | Total |
| | | | | | | | | | | | | |
| U.S. federal | | $ | — | | | $ | 4,003 | | | $ | 4,003 | |
| U.S. state and local | | | — | | | | — | | | | — | |
| | | $ | — | | | $ | 4,003 | | | $ | 4,003 | |
|
| | | | | | | | | | | | | | |
| Year ended December 31, 2003 | | Current | | Deferred | | Total |
| | | | | | | | | | | | | |
| U.S. federal | | $ | — | | | $ | (18 | ) | | $ | (18 | ) |
| U.S. state and local | | | — | | | | — | | | | — | |
| | | $ | — | | | $ | (18 | ) | | $ | (18 | ) |
|
| | | | | | | | | | | | | | |
| Year ended December 31, 2002 | | Current | | Deferred | | Total |
| | | | | | | | | | | | | |
| U.S. federal | | $ | — | | | $ | (115 | ) | | $ | (115 | ) |
| U.S. state and local | | | — | | | | — | | | | — | |
| | | $ | — | | | $ | (115 | ) | | $ | (115 | ) |
|
The tax effects of temporary differences that give rise to significant portions of the deferred tax assets and deferred tax liabilities are presented below:
| | | | | | | | | | |
| At December 31, | | 2004 | | 2003 |
| Deferred tax assets | | | | | | | | |
| Allowance for doubtful accounts | | $ | 401 | | | $ | 533 | |
| Unearned premium adjustment | | | 3,001 | | | | 1,215 | |
| Claims reserves, principally due to discounting for tax | | | 4,048 | | | | 1,641 | |
| Retroactive reinsurance gain | | | 101 | | | | 1,492 | |
| Net operating loss carryforwards | | | 30,172 | | | | 24,775 | |
| Goodwill | | | 3,172 | | | | 3,542 | |
| Other | | | 1,018 | | | | 568 | |
| | | | 41,913 | | | | 33,766 | |
| Deferred tax liabilities | | | | | | | | |
| Deferred acquisition costs | | | (3,390 | ) | | | — | |
| Fixed asset depreciation | | | (288 | ) | | | (257 | ) |
| Other | | | — | | | | (164 | ) |
| | | | (3,678 | ) | | | (421 | ) |
| Net deferred tax asset before valuation allowance | | | 38,235 | | | | 33,345 | |
| Valuation allowance | | | (38,235 | ) | | | (29,342 | ) |
| Net deferred tax asset | | $ | — | | | $ | 4,003 | |
|
F-24
The net deferred tax asset is included in other assets in the consolidated balance sheet. Net operating loss carryforwards of $88.7 million (2003 - $72.9 million) are available to offset regular taxable U.S. income during the carryforward period (through 2024).
During 2004, the Company recorded additions to the valuation allowance of $8.9 million. The Company's deferred tax asset relates primarily to net operating loss carryforwards that are available to offset future taxes payable by the Company's U.S. subsidiaries. Although the net operating losses, which gave rise to a deferred tax asset have a carryforward period through 2024, the Company's U.S. operations did not generate taxable income during the year ended December 31, 2004 or during prior years. Accordingly, under the circumstances, and until the Company's U.S. operations begin to generate significant taxable income, the Company believes that it is necessary to establish and maintain a valuation allowance against the entire balance of the net deferred tax asset.
The Company was not liable for and accordingly paid no income taxes in the years ended December 31, 2004, 2003 and 2002.
NOTE 16. GEOGRAPHIC INFORMATION
Financial information relating to gross premiums written by geographic region is as follows:
| | | | | | | | | | | | | | |
| Year ended December 31, | | 2004 | | 2003 | | 2002 |
| | | | | | | | | | | | | |
| Property catastrophe | | | | | | | | | | | | |
| United States and Caribbean | | $ | 338,315 | | | $ | 297,954 | | | $ | 310,090 | |
| Europe | | | 141,385 | | | | 156,156 | | | | 86,461 | |
| Worldwide | | | 90,607 | | | | 126,541 | | | | 169,790 | |
| Worldwide (excluding U.S.) (1) | | | 63,529 | | | | 14,968 | | | | 56,628 | |
| Australia and New Zealand | | | 28,614 | | | | 26,588 | | | | 2,127 | |
| Other | | | 20,729 | | | | 21,458 | | | | 18,354 | |
| Specialty reinsurance (2) | | | 382,886 | | | | 291,820 | | | | 247,020 | |
| Total Reinsurance (3) | | | 1,066,065 | | | | 935,485 | | | | 890,470 | |
| Individual Risk (4) | | | 478,092 | | | | 446,724 | | | | 282,579 | |
| Total gross written premium | | $ | 1,544,157 | | | $ | 1,382,209 | | | $ | 1,173,049 | |
|
| |
| (1) | The category Worldwide (excluding U.S.) consists of contracts that cover more than one geographic region (other than the U.S.). The exposure in this category for gross written premiums written to date is predominantly from Europe and Japan. |
| |
| (2) | The category Specialty Reinsurance consists of contracts that are predominantly exposed to U.S. risks, with a small portion of the risks being Worldwide. |
| |
| (3) | Excludes $18.8 million, $20.8 million and $22.2 million of premium assumed from the Individual Risk segment in 2004, 2003 and 2002, respectively. |
| |
| (4) | The category Individual Risk consists of contracts that are primarily exposed to U.S. risks. |
NOTE 17. SEGMENT REPORTING
The Company has two reportable segments: Reinsurance operations and Individual Risk operations. The Reinsurance segment, which includes the results of DaVinciRe, primarily provides property catastrophe reinsurance and specialty reinsurance to selected insurers and reinsurers on a worldwide basis. The Company defines the Individual Risk segment to include underwriting that involves understanding the characteristics of the original underlying insurance policy. The Individual Risk segment currently provides insurance written on both an admitted basis and an excess and surplus lines basis, and also provides reinsurance on a quota share basis.
F-25
Data for the years ended December 31, 2004, 2003 and 2002 is as follows:
| | | | | | | | | | | | | | | | | | | | | | |
| Year ended December 31, 2004 | | Reinsurance | | Individual Risk | | Eliminations (1) | | Other | | Total |
| | |
| Gross premiums written | | $ | 1,084,896 | | | $ | 478,092 | | | $ | (18,831 | ) | | $ | — | | | $ | 1,544,157 | |
| Net premiums written | | $ | 930,946 | | | $ | 418,341 | | | | | | | | — | | | $ | 1,349,287 | |
| Net premiums earned | | $ | 944,527 | | | $ | 393,700 | | | | | | | | — | | | $ | 1,338,227 | |
| Net claims and claim expenses incurred | | | 746,010 | | | | 350,289 | | | | | | | | — | | | | 1,096,299 | |
| Acquisition expenses | | | 117,145 | | | | 127,785 | | | | | | | | — | | | | 244,930 | |
| Operational expenses | | | 34,983 | | | | 21,378 | | | | | | | | — | | | | 56,361 | |
| Underwriting income (loss) | | $ | 46,389 | | | $ | (105,752 | ) | | | | | | | — | | | | (59,363 | ) |
| Net investment income | | | | | | | | | | | | | | | 162,722 | | | | 162,722 | | | | | |
| Equity in earnings of unconsolidated ventures | | | | | | | | | | | | | | | 31,081 | | | | 31,081 | |
| Other income | | | | | | | | | | | | | | | 18,903 | | | | 18,903 | |
| Other items, net | | | | | | | | | | | | | | | (27,995 | ) | | | (27,995 | ) |
| Interest and preferred share dividends | | | | | | | | | | | | | | | (57,102 | ) | | | (57,102 | ) |
| Minority interest — DaVinciRe | | | | | | | | | | | | | | | 41,420 | | | | 41,420 | |
| Net realized gains on investments | | | | | | | | | | | | | | | 23,442 | | | | 23,442 | |
| Net income available to common shareholders | | | | | | | | | | | | | | $ | 192,471 | | | $ | 133,108 | |
| | | | | | | | | | | | | | | | | | | | | | | | | |
| Net claims and claim expenses incurred — current accident year | | $ | 859,842 | | | $ | 376,723 | | | | | | | | | | | $ | 1,236,565 | |
| Net claims and claim expenses incurred — prior years | | | (113,832 | ) | | | (26,434 | ) | | | | | | | | | | | (140,266 | ) |
| Net claims and claim expenses incurred — total | | $ | 746,010 | | | $ | 350,289 | | | | | | | | | | | $ | 1,096,299 | |
| Net claims and claim expense ratio — accident year | | | 91.0 | % | | | 95.7 | % | | | | | | | | | | | 92.4 | % |
| Net claims and claim expense ratio — calendar year | | | 79.0 | % | | | 89.0 | % | | | | | | | | | | | 81.9 | % |
| Underwriting expense ratio | | | 16.1 | % | | | 37.9 | % | | | | | | | | | | | 22.5 | % |
| Combined ratio | | | 95.1 | % | | | 126.9 | % | | | | | | | | | | | 104.4 | % |
|
| |
| (1) | Represents premium ceded from the Individual Risk segment to the Reinsurance segment. |
F-26
| | | | | | | | | | | | | | | | | | | | | | |
| Year ended December 31, 2003 (Restated) | | Reinsurance | | Individual Risk | | Eliminations (1) | | Other | | Total |
| | |
| Gross premiums written | | $ | 956,257 | | | $ | 446,724 | | | $ | (20,772 | ) | | $ | — | | | $ | 1,382,209 | |
| Net premiums written | | $ | 792,022 | | | $ | 362,754 | | | | | | | | — | | | $ | 1,154,776 | |
| Net premiums earned | | $ | 812,142 | | | $ | 306,383 | | | | | | | | — | | | $ | 1,118,525 | |
| Net claims and claim expenses incurred | | | 210,634 | | | | 158,547 | | | | | | | | — | | | | 369,181 | |
| Acquisition expenses | | | 93,227 | | | | 100,913 | | | | | | | | — | | | | 194,140 | |
| Operational expenses | | | 52,504 | | | | 14,893 | | | | | | | | — | | | | 67,397 | |
| Underwriting income | | $ | 455,777 | | | $ | 32,030 | | | | | | | | — | | | | 487,807 | |
| Net investment income | | | | | | | | | | | | | | | 129,542 | | | | 129,542 | |
| Equity in earnings of unconsolidated ventures | | | | | | | | | | | | | | | 21,167 | | | | 21,167 | |
| Other income | | | | | | | | | | | | | | | 5,903 | | | | 5,903 | |
| Other items, net | | | | | | | | | | | | | | | (2,394 | ) | | | (2,394 | ) |
| | | | | | | | | | | | | | | | (44,523 | ) | | | (44,523 | ) |
| Minority interest — DaVinciRe | | | | | | | | | | | | | | | (72,014 | ) | | | (72,014 | ) |
| Net realized gains on investments | | | | | | | | | | | | | | | 80,504 | | | | 80,504 | |
| Net income available to common shareholders | | | | | | | | | | | | | | $ | 118,185 | | | $ | 605,992 | |
| Net claims and claim expenses incurred — current accident year | | $ | 279,334 | | | $ | 183,482 | | | | | | | | | | | $ | 462,816 | |
| Net claims and claim expenses incurred — prior years | | | (68,700 | ) | | | (24,935 | ) | | | | | | | | | | | (93,635 | ) |
| Net claims and claim expenses incurred — total | | $ | 210,634 | | | $ | 158,547 | | | | | | | | | | | $ | 369,181 | |
| Net claims and claim expense ratio — accident year | | | 34.4 | % | | | 59.9 | % | | | | | | | | | | | 41.4 | % |
| Net claims and claim expense ratio — calendar year | | | 25.9 | % | | | 51.7 | % | | | | | | | | | | | 33.0 | % |
| Underwriting expense ratio | | | 18.0 | % | | | 37.8 | % | | | | | | | | | | | 23.4 | % |
| Combined ratio | | | 43.9 | % | | | 89.5 | % | | | | | | | | | | | 56.4 | % |
|
| |
| (1) | Represents premium ceded from the Individual Risk segment to the Reinsurance segment. |
F-27
| | | | | | | | | | | | | | | | | | | | | | |
| Year ended December 31, 2002 (Restated) | | Reinsurance | | Individual Risk | | Eliminations (1) | | Other | | Total |
| | |
| Gross premiums written | | $ | 912,695 | | | $ | 282,579 | | | $ | (22,225 | ) | | $ | — | | | $ | 1,173,049 | |
| Net premiums written | | $ | 698,863 | | | $ | 227,101 | | | | | | | | — | | | $ | 925,964 | |
| Net premiums earned | | $ | 670,991 | | | $ | 92,979 | | | | | | | | — | | | $ | 763,970 | |
| Net claims and claim expenses incurred | | | 274,316 | | | | 40,209 | | | | | | | | — | | | | 314,525 | |
| Acquisition expenses | | | 70,698 | | | | 24,946 | | | | | | | | — | | | | 95,644 | |
| Operational expenses | | | 39,264 | | | | 9,895 | | | | | | | | — | | | | 49,159 | |
| Underwriting income | | $ | 286,713 | | | $ | 17,929 | | | | | | | | — | | | | 304,642 | |
| Net investment income | | | | | | | | | | | | | | | 102,686 | | | | 102,686 | |
| Equity in earnings of unconsolidated ventures | | | | | | | | | | | | | | | 22,339 | | | | 22,339 | |
| Other income | | | | | | | | | | | | | | | 10,482 | | | | 10,482 | |
| Other items, net | | | | | | | | | | | | | | | (10,351 | ) | | | (10,351 | ) |
| Interest, preferred share dividends, Capital Securities minority interest | | | | | | | | | | | | | | | (32,858 | ) | | | (32,858 | ) |
| Minority interest — DaVinciRe | | | | | | | | | | | | | | | (55,051 | ) | | | (55,051 | ) | | | | |
| Cumulative effect of a change in accounting principle | | | | | | | | | | | | | | | (9,187 | ) | | | (9,187 | ) |
| Net realized gains on investments | | | | | | | | | | | | | | | 10,177 | | | | 10,177 | |
| Net income available to common shareholders | | | | | | | | | | | | | | $ | 38,237 | | | $ | 342,879 | |
| Net claims and claim expenses incurred — current accident year | | $ | 254,387 | | | $ | 37,133 | | | | | | | | | | | $ | 291,520 | |
| Net claims and claim expenses incurred — prior years | | | 19,929 | | | | 3,076 | | | | | | | | | | | | 23,005 | |
| Net claims and claim expenses incurred — total | | $ | 274,316 | | | $ | 40,209 | | | | | | | | | | | $ | 314,525 | |
| Net claims and claim expense ratio — accident year | | | 37.9 | % | | | 39.9 | % | | | | | | | | | | | 38.2 | % |
| Net claims and claim expense ratio — calendar year | | | 40.9 | % | | | 43.2 | % | | | | | | | | | | | 41.2 | % |
| Underwriting expense ratio | | | 16.4 | % | | | 37.5 | % | | | | | | | | | | | 19.0 | % |
| Combined ratio | | | 57.3 | % | | | 80.7 | % | | | | | | | | | | | 60.2 | % |
|
| |
| (1) | Represents premium ceded from the Individual Risk segment to the Reinsurance segment. |
The Company does not manage its assets by segment and therefore total assets are not allocated to the segments.
NOTE 18. STOCK INCENTIVE COMPENSATION AND EMPLOYEE BENEFIT PLANS
The Company has a stock incentive plan under which all employees of the Company and its subsidiaries may be granted stock options and restricted stock awards. A stock option award under the Company's stock incentive plan allows for the purchase of the Company's common shares at a price that is generally equal to the five day average closing price of the common shares immediately
F-28
prior to the date of grant. Options to purchase common shares are granted periodically by the Board of Directors, generally vest over four years and generally expire ten years from the date of grant.
The fair value of option grants is estimated on the date of grant using a Black-Scholes option pricing model with the following weighted average assumptions used for grants in 2004, 2003 and 2002, respectively: dividend yield of 1.56%, 1.4% and 1.4%; expected option life of six years for 2004 and five years for 2003 and 2002; expected volatility of 24%, 30% and 30%; and a risk-free interest rate of 3.5%, 1.8% and 2.7%.
The following is a table of the changes in options outstanding for 2004, 2003 and 2002, respectively:
| | | | | | | | | | | | | | | | | | | | | | |
| | | Awards
available
for grant | | Weighted
options
outstanding | | Average
exercise price | | Fair value
of options | | Range of
exercise prices |
| Balance, December 31, 2001 | | | 2,718,687 | | | | 5,276,715 | | | $ | 18.97 | | | | | | | | | |
| Authorized | | | 2,550,000 | | | | — | | | | | | | | | | | | | |
| Options granted | | | (2,637,929 | ) | | | 2,637,929 | | | $ | 39.30 | | | $ | 6.47 | | | $ | 29.77 - - $42.74 | |
| Options forfeited | | | 137,655 | | | | (137,655 | ) | | $ | 18.95 | | | | | | | | | |
| Options exercised | | | — | | | | (3,597,769 | ) | | $ | 22.09 | | | | | | | | | |
| Shares turned in or withheld | | | 2,114,379 | | | | — | | | | | | | | | | | | | |
| Restricted stock issued | | | (380,233 | ) | | | — | | | | | | | | | | | | | |
| Restricted stock forfeited | | | 68,660 | | | | — | | | | | | | | | | | | | |
| | | | | | | | | | | | | | | | | | | | | |
| Balance, December 31, 2002 | | | 4,571,219 | | | | 4,179,220 | | | $ | 28.93 | | | | | | | | | |
| Authorized | | | — | | | | — | | | | | | | | | | | | | |
| Options granted | | | (435,762 | ) | | | 435,762 | | | $ | 45.38 | | | $ | 10.99 | | | $ | 39.16 - - $48.00 | |
| Options forfeited | | | 23,000 | | | | (23,000 | ) | | $ | 12.40 | | | | | | | | | |
| Options exercised | | | | | | | (295,627 | ) | | $ | 13.01 | | | | | | | | | |
| Shares turned in or withheld | | | 74,344 | | | | — | | | | | | | | | | | | | |
| Restricted stock issued | | | (359,727 | ) | | | — | | | | | | | | | | | | | |
| Restricted stock forfeited | | | 571 | | | | — | | | | | | | | | | | | | |
| | | | | | | | | | | | | | | | | | | | | |
| Balance, December 31, 2003 | | | 3,873,645 | | | | 4,296,355 | | | $ | 31.73 | | | | | | | | | |
| Authorized | | | 6,000,000 | | | | | | | | | | | | | | | | | |
| Options granted | | | | | | | | | | | | | | | | | | | | |
| Exercise price at market price | | | (1,212,990 | ) | | | 1,212,990 | | | $ | 52.34 | | | $ | 11.95 | | | $ | 49.81 - - $53.96 | |
| Exercise price greater than market price | | | (5,206,000 | ) | | | 5,206,000 | | | $ | 80.18 | | | $ | 4.90 | | | $ | 74.24 - - $98.98 | |
| Options forfeited | | | 233,991 | | | | (233,991 | ) | | $ | 47.50 | | | | | | | | | |
| Options exercised | | | | | | | (987,734 | ) | | $ | 32.41 | | | | | | | | | |
| Shares turned in or withheld | | | 508,972 | | | | | | | | | | | | | | | | | |
| Restricted stock issued | | | (201,833 | ) | | | | | | | | | | | | | | | | |
| Restricted stock forfeited | | | 59,918 | | | | | | | | | | | | | | | | | |
| | | | | | | | | | | | | | | | | | | | | |
| Balance, December 31, 2004 | | | 4,055,703 | | | | 9,493,620 | | | $ | 60.47 | | | | | | | | | |
Total options exercisable at
December 31, 2004 | | | | | | | 2,674,636 | | | | | | | | | | | | | |
|
The Company's 2001 Stock Incentive Plan allows for the issuance of share-based awards, the issuance of restricted common shares, the issuance of reload options for shares tendered in connection with option exercises and a provision in the calculation of shares available for issuance thereunder by deeming the number of shares tendered to or withheld by the Company in connection with certain option exercises to be so available.
In August 2004 the Company's shareholders approved the RenaissanceRe Holdings Ltd. 2004 Stock Option Incentive Plan (the "Premium Option Plan") under which 6,000,000 common shares were reserved for issuance upon the exercise of options granted under the Premium Option Plan.
F-29
As described in the Company's Proxy Statement relating to the required shareholder vote, filed with the SEC in July 2004, the Premium Option Plan provides for, among other things, mandatory premium pricing such that options can generally only be issued thereunder with a strike price at a minimum of 150% of fair market value on the date of grant, minimum 4-year cliff vesting, and no discretionary repricing. The Premium Option Plan includes a dividend protection feature that reduces the strike price for extraordinary dividends and a change in control feature that reduces the strike price based on a pre-established formula in the event of a change in control. Grantees under the Premium Option Plan must satisfy performance criteria which is determined by the Company's Compensation Committee. Other terms are substantially similar to the 2001 Plan. The assumptions used to determine the fair value of the Premium Option Plan awards in 2004 are as follows: for the options with a strike price of 150% of fair market value on the date of grant, a dividend yield of 1.58%; expected option life of six years; expected volatility of 23%; and a risk-free interest rate of 3.5%, and for the options with a strike price of 200% of fair market value on the date of grant, a dividend yield of 1.58%; expected option life of seven years; expected volatility of 24%; and a risk-free interest rate of 3.7%.
The Company has also established a Non-Employee Director Stock Incentive Plan to issue stock options and shares of restricted stock. Under the plan, the total number of shares available for distribution at December 31, 2004 was 621,177 shares. At December 31, 2004, the number of options issued to directors and unexercised was 218,367. In 2004, 12,867 options to purchase common shares were granted and 22,317 restricted common shares were granted. In 2003, no options to purchase common shares were granted and 13,206 restricted common shares were granted. In 2002, 12,000 options to purchase common shares were granted and 3,132 restricted common shares were granted. The options and restricted common shares vest ratably over three years.
Restricted common shares issued to employees normally vest ratably over a four to five year period. During the restricted period, the employee receives dividends and votes the restricted common shares, but the restricted shares may not be sold, transferred or assigned. In 2004, 2003 and 2002 the Board of Directors granted 201,833, 359,727 and 380,233 restricted shares with a value of $10.4 million, $16.0 million and $14.6 million to certain employees. Prior to 2003, the value of the restricted shares awarded was recorded as unearned stock grant compensation and was presented as a separate component of shareholders' equity. During 2003 the Company adopted FAS 123, as amended by FAS 148, and in accordance with the provisions of FAS 123 the value of the restricted stock grants awarded are no longer reflected as unearned stock grant compensation as a separate component of shareholders' equity. Accordingly the balance of unearned stock grant compensation of $18.5 million at January 1, 2003 has been reclassified from its separate account in shareholders' equity and reflected as a reduction in additional paid-in capital. Under FAS 123 the Company estimates the fair value of restricted stock awards at the date of grant and amortizes this value as an expense over the vesting period. Compensation expense related to the issuance of restricted stock was $11.5 million, $13.0 million and $8.2 million in 2004, 2003 and 2002, respectively.
All of the Company's employees are eligible for defined contribution pension plans. Contributions are primarily based upon a percentage of eligible compensation. The Company contributed $1.0 million to its defined contribution pension plans in 2004, $0.7 million in 2003 and $0.5 million in 2002.
NOTE 19. STATUTORY REQUIREMENTS
Under the Insurance Act 1978, amendments thereto and Related Regulations of Bermuda ("the Act"), certain subsidiaries of the Company are required to prepare statutory financial statements and to file in Bermuda a statutory financial return. The Act also requires these subsidiaries of the Company to maintain certain measures of solvency and liquidity. At December 31, 2004 the statutory capital and surplus of the Bermuda subsidiaries was $2.3 billion and the amount required to be maintained under Bermuda law was $520.6 million.
Under the Act, Renaissance Reinsurance and DaVinci are classified as Class 4 insurers, and are, therefore, restricted as to the payment of dividends in the amount of 25% of the prior year's statutory capital and surplus, unless at least two members of the Board of Directors attest that a dividend in
F-30
excess of this amount would not cause the company to fail to meet its relevant margins. During 2004, Renaissance Reinsurance declared aggregate cash dividends to the Company of $234.4 million (2003 - $322.3 million) and DaVinci declared aggregate cash dividends of $3.2 million (2003 - $81.6 million).
Under the Act, Glencoe is classified as a Class 3 insurer and Glencoe is also eligible as an excess and surplus lines insurer in a number of states in the U.S. Under the various capital and surplus requirements in Bermuda and in these states, Glencoe is required to maintain a minimum of capital and surplus. In this regard, the declaration of dividends from retained earnings and distributions from additional paid-in capital are limited to the extent that the above requirement is met. During 2004, Glencoe declared aggregate cash dividends of $55.0 million (2003 - $18.0).
The Company's U.S. insurance subsidiary, Stonington, is subject to various statutory and regulatory restrictions regarding the payment of dividends. The restrictions are determined using risk based capital tests, which is the threshold that constitutes the authorized control level. If Stonington's statutory capital and surplus falls below the authorized control level, the commissioner is authorized to take whatever regulatory actions considered necessary to protect policyholders and creditors. At December 31, 2004, the statutory capital and surplus of Stonington was $57.5 million. Because of the accumulated deficit in earned surplus from prior operations, Stonington currently cannot pay an ordinary dividend without commissioner approval.
NOTE 20. COMMITMENTS AND CONTINGENCIES
CONCENTRATION OF CREDIT RISK
Financial instruments which potentially subject the Company to concentration of credit risk consist principally of investments, cash and reinsurance balances. The Company limits the amount of credit exposure to any one financial institution and, except for U.S. Government securities, none of the Company's investments exceeded 10% of shareholders' equity at December 31, 2004. Concentrations of credit risk with respect to reinsurance balances are limited due to their dispersion across various companies and geographies.
DERIVATIVES
The Company's investment guidelines permit, subject to specific approval, investments in derivative instruments such as futures, options, foreign currency forward contracts and swap agreements, which may be used to assume risk or for hedging purposes. The Company's primary derivative positions include:
Credit Derivatives
From time to time the Company enters into short positions in credit derivatives. The Company accounts for these credit derivatives at fair value and records them on its consolidated balance sheet as other assets or other liabilities depending on the rights or obligations. The fair value of these credit derivatives, as recognized in other liabilities in our balance sheet, at December 31, 2004 was a liability of $12.6 million (2003 - $3.5 million). During 2004, the Company recorded losses of $12.5 million (2003 - $4.2 million), which is included in other income and represents net settlements and changes in the fair value of these credit derivatives.
Foreign Currency Derivatives
The Company's foreign currency policy with regard to its underwriting operations is generally to hold foreign currency assets, including cash, investments and receivables that approximate the foreign currency liabilities, including claims and claim expense reserves and reinsurance balances payable. When necessary, the Company will use foreign currency forward and option contracts to minimize the effect of fluctuating foreign currencies on the value of non-U.S. dollar denominated assets and liabilities associated with our underwriting operations. The Company will also use foreign currency forward contracts and other foreign exchange derivatives to decrease exposure to non-U.S. dollar investments. Its foreign currency derivative contracts are recorded at fair value, which is determined principally by obtaining quotes from independent dealers and counterparties. The fair value of these contracts as of December 31, 2004 was a loss of $14.7 million (2003 - $nil). Changes in the fair value of the Company's foreign currency derivatives are recognized currently in our consolidated statements of income.
F-31
Derivatives Related to Physical Variables
The Company has assumed and ceded risk through securities and derivative instruments under which losses or recoveries are triggered by an industry loss index or geological or physical variables. During 2004, 2003 and 2002, the Company recognized gains (losses) on these contracts of ($0.1) million, $0.8 million and $7.2 million, respectively, which are included in other income.
OPERATING LEASES
The Company and its subsidiaries lease office space under operating leases which expire at various dates through 2022. Future minimum lease payments under existing operating leases are expected to be as follows:
| | | | | | |
| Year ended December 31, | | Minimum lease payments |
| | | | | |
| 2005 | | $ | 3,545 | |
| 2006 | | | 3,545 | |
| 2007 | | | 3,739 | |
| 2008 | | | 3,694 | |
| 2009 | | | 3,694 | |
| After 2009 | | | 35,479 | |
| | | $ | 53,696 | |
|
LETTERS OF CREDIT
At December 31, 2004, the Company's bankers have issued letters of credit of approximately $633.1 million in favor of certain ceding companies. Also in connection with the Top Layer Re joint venture, the Company has committed $37.5 million of capital in the form of a letter of credit. The letters of credit are secured by cash and investments of similar amounts.
EMPLOYMENT AGREEMENTS
The Board of Directors has authorized the execution of employment agreements between the Company and certain officers. These agreements provide for severance payments under certain circumstances, as well as accelerated vesting of options and restricted stock grants, upon a change in control, as defined therein and by the Company's 2001 Stock Incentive Plan and Premium Option Plan.
LITIGATION
The Company is party to various lawsuits arising in the normal course of business. The Company does not believe that any of its pending litigation will have a material impact on its consolidated financial statements.
F-32
NOTE 21. QUARTERLY FINANCIAL RESULTS (UNAUDITED)
(amounts in tables expressed in thousands of United States dollars, except per share amounts)
| | | | | | | | | | | | | | | | | | | | | | | | | | | | | | | | | | |
| | | Quarter Ended
March 31, | | Quarter Ended
June 30, | | Quarter Ended
September 30, | | Quarter Ended
December 31, |
| | | 2004 | | 2003 | | 2004 | | 2003 | | 2004 | | 2003 | | 2004 | | 2003 |
| | | (A) | | (Restated) | | (A) | | (Restated) | | (A) | | (Restated) | | | | (Restated) |
| Gross premium written | | $ | 780,288 | | | $ | 685,167 | | | $ | 326,876 | | | $ | 212,560 | | | $ | 273,218 | | | $ | 313,317 | | | $ | 163,775 | | | $ | 171,165 | |
| Net premiums written | | $ | 700,219 | | | $ | 592,623 | | | $ | 285,925 | | | $ | 160,223 | | | $ | 219,237 | | | $ | 236,570 | | | $ | 143,905 | | | $ | 165,360 | |
| Net premiums earned | | $ | 308,092 | | | $ | 264,097 | | | $ | 349,002 | | | $ | 276,200 | | | $ | 349,794 | | | $ | 278,018 | | | $ | 331,339 | | | $ | 300,210 | |
| Net investment income | | | 35,050 | | | | 31,434 | | | | 29,833 | | | | 34,109 | | | | 39,487 | | | | 28,280 | | | | 58,352 | | | | 35,719 | |
| Net foreign exchange gains (losses) | | | 2,087 | | | | 3,951 | | | | 786 | | | | 7,640 | | | | (1,839 | ) | | | 252 | | | | (7,417 | ) | | | 1,788 | |
| Equity in earnings of unconsolidated ventures | | | 6,520 | | | | 6,068 | | | | 4,923 | | | | 6,493 | | | | 9,058 | | | | 5,273 | | | | 10,580 | | | | 3,333 | |
| Other income | | | 1,109 | | | | (563 | ) | | | (689 | ) | | | 745 | | | | (4,855 | ) | | | 2,706 | | | | 23,338 | | | | 3,015 | |
| Net realized investment gains (losses) | | | 32,521 | | | | 21,112 | | | | (26,920 | ) | | | 49,660 | | | | 15,023 | | | | 1,172 | | | | 2,818 | | | | 8,560 | |
| Total revenues | | | 385,379 | | | | 326,099 | | | | 356,935 | | | | 374,847 | | | | 406,668 | | | | 315,701 | | | | 419,010 | | | | 352,625 | |
| Claims and claim expenses incurred | | | 112,178 | | | | 84,126 | | | | 120,737 | | | | 100,076 | | | | 738,502 | | | | 96,856 | | | | 124,882 | | | | 88,123 | |
| Acquisition costs | | | 58,031 | | | | 42,133 | | | | 64,047 | | | | 40,704 | | | | 72,434 | | | | 56,317 | | | | 50,418 | | | | 54,986 | |
| Operational expenses | | | 12,376 | | | | 14,907 | | | | 16,502 | | | | 16,332 | | | | 10,116 | | | | 17,882 | | | | 17,367 | | | | 18,276 | |
| Corporate expenses | | | 4,552 | | | | 3,468 | | | | 4,986 | | | | 4,677 | | | | 4,520 | | | | 4,456 | | | | 3,551 | | | | 3,442 | |
| Interest expense | | | 6,271 | | | | 4,499 | | | | 6,334 | | | | 5,335 | | | | 6,683 | | | | 4,318 | | | | 6,680 | | | | 4,100 | |
| Total expenses | | | 193,408 | | | | 149,133 | | | | 212,606 | | | | 167,124 | | | | 832,255 | | | | 179,829 | | | | 202,898 | | | | 168,927 | |
| Income before minority interest and taxes | | | 191,971 | | | | 176,966 | | | | 144,329 | | | | 207,723 | | | | (425,587 | ) | | | 135,872 | | | | 216,112 | | | | 183,698 | |
| Minority interest — Capital Securities | | | — | | | | 1,455 | | | | — | | | | 1,827 | | | | — | | | | 1,827 | | | | — | | | | 2,361 | |
| Minority interest — DaVinci | | | 17,990 | | | | 20,885 | | | | 14,492 | | | | 20,150 | | | | (89,888 | ) | | | 15,211 | | | | 15,986 | | | | 15,768 | |
| Income before taxes | | | 173,981 | | | | 154,626 | | | | 129,837 | | | | 185,746 | | | | (335,699 | ) | | | 118,834 | | | | 200,126 | | | | 165,569 | |
| Income tax benefit (expense) | | | — | | | | 55 | | | | — | | | | — | | | | (4,003 | ) | | | (37 | ) | | | — | | | | — | |
| Net income | | | 173,981 | | | | 154,681 | | | | 129,837 | | | | 185,746 | | | | (339,702 | ) | | | 118,797 | | | | 200,126 | | | | 165,569 | |
| Dividends on preference shares | | | 5,104 | | | | 4,119 | | | | 8,609 | | | | 4,917 | | | | 8,758 | | | | 4,903 | | | | 8,663 | | | | 4,862 | |
| Net income available to common shareholders | | $ | 168,877 | | | $ | 150,562 | | | $ | 121,228 | | | $ | 180,829 | | | $ | (348,460 | ) | | $ | 113,894 | | | $ | 191,463 | | | $ | 160,707 | |
| | | | | | | | | | | | | | | | | | | | | | | | | | | | | | | | | |
| Earnings per common share — basic | | $ | 2.43 | | | $ | 2.20 | | | $ | 1.74 | | | $ | 2.62 | | | $ | (4.97 | ) | | $ | 1.64 | | | $ | 2.72 | | | $ | 2.32 | |
| Earnings per common share — diluted | | $ | 2.36 | | | $ | 2.13 | | | $ | 1.69 | | | $ | 2.54 | | | $ | (4.97 | ) | | $ | 1.60 | | | $ | 2.66 | | | $ | 2.25 | |
| | | | | | | | | | | | | | | | | | | | | | | | | | | | | | | | | |
| Weighted average shares — basic | | | 69,444 | | | | 68,593 | | | | 69,664 | | | | 68,914 | | | | 70,098 | | | | 69,307 | | | | 70,289 | | | | 69,341 | |
| Weighted average shares — diluted | | | 71,592 | | | | 70,564 | | | | 71,683 | | | | 71,056 | | | | 70,098 | | | | 71,187 | | | | 71,925 | | | | 71,202 | |
| | | | | | | | | | | | | | | | | | | | | | | | | �� | | | | | | | | |
| Claims and claim expense ratio | | | 36.4 | % | | | 31.9 | % | | | 34.6 | % | | | 36.2 | % | | | 211.1 | % | | | 34.8 | % | | | 37.7 | % | | | 29.4 | % |
| Underwriting expense ratio | | | 22.9 | % | | | 21.6 | % | | | 23.1 | % | | | 20.7 | % | | | 23.6 | % | | | 26.7 | % | | | 20.4 | % | | | 24.4 | % |
| Combined ratio | | | 59.3 | % | | | 53.5 | % | | | 57.7 | % | | | 56.9 | % | | | 234.7 | % | | | 61.5 | % | | | 58.1 | % | | | 53.8 | % |
|
(A) During the fourth quarter of 2004 the Company discovered errors in the timing of the recognition of premium on multi-year ceded reinsurance contracts which impacted the first three quarters of 2004. These errors were not material to the quarters ended March 31, 2004, June 30, 2004 and September 30, 2004. The reversal of the error was material to the quarter ended December 31, 2004 and, therefore, the quarters ended March 31, 2004, June 30, 2004 and September 30, 2004 have been adjusted from the previously reported amounts to report the premium in the correct quarters.
F-33
[HIS PAGE INTENTIONALLY LEFT BLANK.]
RENAISSANCERE HOLDINGS LTD. AND SUBSIDIARIES
INDEX TO SCHEDULES TO CONSOLIDATED FINANCIAL STATEMENTS
| | | | | | | | | | |
| | | | | Pages |
| Report of Independent Registered Public Accounting Firm on Schedules | | | S-2 | |
| I | | Summary of Investments other than Investments in Related Parties | | | S-3 | |
| II | | Condensed Financial Information of Registrant | | | S-4 | |
| III | | Supplementary Insurance Information | | | S-7 | |
| IV | | Reinsurance for the years ended December 31, 2004, 2003 and 2002 | | | S-8 | |
| VI | | Supplementary Information Concerning Property-Casualty Insurance Operations | | | S-9 | |
| Schedules other than those listed above are omitted for the reason that they are not applicable. | | | | |
|
S-1
REPORT OF INDEPENDENT REGISTERED PUBLIC ACCOUNTING FIRM ON SCHEDULES
To the Board of Directors and Shareholders of RenaissanceRe Holdings Ltd.
We have audited the consolidated financial statements of RenaissanceRe Holdings Ltd. and Subsidiaries as of December 31, 2004 and 2003, and for each of the three years in the period ended December 31, 2004, and have issued our report thereon dated March 30, 2005; such financial statements and our report thereon are included elsewhere in this Annual Report on Form 10-K. Our audits also included the financial statement schedules listed in Item 15(a)(2) of this Annual Report on Form 10-K for the year ended December 31, 2004. These schedules are the responsibility of the Company's management. Our responsibility is to express an opinion based on our audits.
In our opinion, the financial statement schedules referred to above, when considered in relation to the basic financial statements taken as a whole, present fairly in all material respects the information set forth therein.
As discussed in Note 3 to the consolidated financial statements, in 2003 the Company changed its method of accounting for stock compensation.
As discussed in Note 2 to the consolidated financial statements, the Company has restated its 2003 and 2002 consolidated financial statements.
/s/ Ernst & Young
Hamilton, Bermuda
March 30, 2005
S-2
SCHEDULE I
RENAISSANCERE HOLDINGS LTD. AND SUBISIDARIES
SUMMARY OF INVESTMENTS
OTHER THAN INVESTMENTS IN RELATED PARTIES
(MILLIONS OF UNITED STATES DOLLARS)
| | | | | | | | | | | | | | |
| | | Year ended
December 31, 2004 | | Amount at
which shown
in the
Balance Sheet |
| | | Amortized
Cost | | Market
Value | |
| Type of investment: | | | | | | | | | | | | |
| Fixed maturities | | | | | | | | | | | | |
| U.S. treasuries and agencies | | $ | 920.3 | | | $ | 919.0 | | | $ | 919.0 | |
| Non-U.S. government bonds | | | 199.7 | | | | 210.0 | | | | 210.0 | |
| Corporate securities | | | 1,144.8 | | | | 1,177.7 | | | | 1,177.7 | |
| Mortgage-backed securities | | | 560.8 | | | | 561.5 | | | | 561.5 | |
| Asset-backed securities | | | 356.1 | | | | 355.1 | | | | 355.1 | |
| Total fixed maturities | | | 3,181.7 | | | | 3,223.3 | | | | 3,223.3 | |
| Short-term investments | | | 608.3 | | | | 608.3 | | | | 608.3 | |
| Other investments | | | 622.0 | | | | 684.6 | | | | 684.6 | |
| Equity investments in reinsurance company, at fair value | | | 84.2 | | | | 150.5 | | | | 150.5 | |
| Investments in other ventures, under equity method | | | 159.5 | | | | 159.5 | | | | 159.5 | |
| Total investments | | $ | 4,655.7 | | | $ | 4,826.2 | | | $ | 4,826.2 | |
|
S-3
SCHEDULE II
RENAISSANCERE HOLDINGS LTD.
CONDENSED FINANCIAL INFORMATION OF REGISTRANT
RENAISSANCERE HOLDINGS LTD.
BALANCE SHEETS
AT DECEMBER 31, 2004 AND 2003
(PARENT COMPANY)
(THOUSANDS OF UNITED STATES DOLLARS)
| | | | | | | | | | |
| | | At December 31, |
| | | 2004 | | 2003 |
| Assets: | |
| Investments and cash | | | | | | | | |
| Fixed maturity investments, available for sale, at fair value | | $ | 201,640 | | | $ | 111,600 | |
| Short term investments, at cost | | | 65,440 | | | | 207,783 | |
| Other investments | | | 3,093 | | | | 3,093 | |
| Equity investments in reinsurance company, at fair value | | | 150,519 | | | | 145,535 | |
| Investments in other ventures, under equity method | | | 128,484 | | | | — | |
| Total investments | | | 549,176 | | | | 468,011 | |
| Cash and cash equivalents | | | 6,790 | | | | 6,551 | |
| Investments in subsidiaries | | | 2,507,573 | | | | 2,167,476 | |
| Accrued investment income | | | 3,000 | | | | 1,302 | |
| Other assets | | | 17,536 | | | | 20,398 | |
| Due from subsidiary | | | — | | | | 40,761 | |
| Total Assets | | $ | 3,084,075 | | | $ | 2,704,499 | |
| | | | | | | | | |
| Liabilities and Shareholders' Equity: | |
| Liabilities: | |
| Notes and bank loans payable | | $ | 250,000 | | | $ | 250,000 | |
| Subordinated obligation to capital trust | | | 103,093 | | | | 103,093 | |
| Due to subsidiary | | | 70,772 | | | | — | |
| Other liabilities | | | 16,168 | | | | 16,763 | |
| Total Liabilities | | | 440,033 | | | | 369,856 | |
| | | | | | | | | |
| Shareholders' Equity: | | | | | | | | |
| Preference Shares: $1.00 par value — 20,000,000 shares issued and outstanding at December 31, 2004 (2003 — 10,000,000) | | | 500,000 | | | | 250,000 | |
| Common Shares and additional paid-in capital: $1.00 par value — 71,028,711 shares issued and outstanding at December 31, 2004 — (2003 — 70,398,699 shares) | | | 328,896 | | | | 314,414 | |
| Accumulated other comprehensive income | | | 78,960 | | | | 113,382 | |
| Retained earnings | | | 1,736,186 | | | | 1,656,847 | |
| Total Shareholders' Equity | | | 2,644,042 | | | | 2,334,643 | |
| | | | | | | | | |
| Total Liabilities and Shareholders' Equity | | $ | 3,084,075 | | | $ | 2,704,499 | |
|
S-4
SCHEDULE II
RENAISSANCERE HOLDINGS LTD.
CONDENSED FINANCIAL INFORMATION OF REGISTRANT — CONTINUED
RENAISSANCERE HOLDINGS LTD.
INCOME STATEMENTS
FOR THE YEARS ENDED DECEMBER 31, 2004, 2003 AND 2002
(PARENT COMPANY)
(THOUSANDS OF UNITED STATES DOLLARS)
| | | | | | | | | | | | | | |
| | | Year ended December 31, |
| | | 2004 | | 2003 | | 2002 |
| | | | | (Restated) | | (Restated) |
| Revenues | |
| Net investment income | | $ | 16,450 | | | $ | 15,940 | | | $ | 1,736 | |
| Net foreign exchange gains | | | (7,344 | ) | | | — | | | | — | |
| Other income (expense) | | | 37,398 | | | | (327 | ) | | | 559 | |
| Total revenues | | | 46,504 | | | | 15,613 | | | | 2,295 | |
| | | | | | | | | | | | | |
| Expenses | | | | | | | | | | | | |
| Interest expense | | | 23,559 | | | | 15,934 | | | | 9,694 | |
| Corporate expenses | | | 14,574 | | | | 11,730 | | | | 11,742 | |
| Total expenses | | | 38,133 | | | | 27,664 | | | | 21,436 | |
| Loss before equity in net income of subsidiaries & taxes | | | 8,371 | | | | (12,051 | ) | | | (19,141 | ) |
| Equity in net income of subsidiaries | | | 155,871 | | | | 644,314 | | | | 381,809 | |
| Net income before taxes and minority interest | | | 164,242 | | | | 632,263 | | | | 362,668 | |
| Minority interest — Company obligated, mandatorily redeemable capital securities of a subsidiary trust holding solely junior subordinated debentures of the Company | | | — | | | | (7,470 | ) | | | (7,605 | ) |
| Net income before taxes | | | 164,242 | | | | 624,793 | | | | 355,063 | |
| Income tax expense | | | — | | | | — | | | | — | |
| Net income | | | 164,242 | | | | 624,793 | | | | 355,063 | |
| Dividends on preference shares | | | (31,134 | ) | | | (18,801 | ) | | | (12,184 | ) |
| Net income available to Common Shareholders | | $ | 133,108 | | | $ | 605,992 | | | $ | 342,879 | |
|
S-5
SCHEDULE II
RENAISSANCERE HOLDINGS LTD.
CONDENSED FINANCIAL INFORMATION OF REGISTRANT — CONTINUED
RENAISSANCERE HOLDINGS LTD.
STATEMENTS OF CASH FLOWS
FOR THE YEARS ENDED DECEMBER 31, 2004, 2003 AND 2002
(PARENT COMPANY)
(THOUSANDS OF UNITED STATES DOLLARS)
| | | | | | | | | | | | | | |
| | | Year ended December 31, |
| | | 2004 | | 2003 | | 2002 |
| | | | | (Restated) | | (Restated) |
| Cash flows applied to operating activities: | | | | | | | | | | | | |
| Net income | | $ | 164,242 | | | $ | 624,793 | | | $ | 355,063 | |
| Less: equity in net income of subsidiaries | | | 155,871 | | | | 644,314 | | | | 381,809 | |
| | | | 8,371 | | | | (19,521 | ) | | | (26,746 | ) |
| Adjustments to reconcile net income to net cash provided by operating activities | | | | | | | | | | | | |
| Net unrealized (gains) losses included in other income | | | (27,363 | ) | | | — | | | | — | |
| Equity in earnings of other ventures | | | (9,831 | ) | | | — | | | | — | |
| Other | | | 22,102 | | | | (13,376 | ) | | | 18,299 | |
| Net cash applied to operating activities | | | (6,721 | ) | | | (32,897 | ) | | | (8,447 | ) |
| | | | | | | | | | | | | |
| Cash flows provided by (applied to) investing activities: | | | | | | | | | | | | |
| Contributions to subsidiaries | | | (472,307 | ) | | | (259,881 | ) | | | (377,846 | ) |
| Proceeds from maturities and sales of investments | | | 1,476,786 | | | | 354,953 | | | | 218,949 | |
| Purchase of investments available for sale | | | (1,560,684 | ) | | | (334,772 | ) | | | (203,770 | ) |
| Purchase of investments in other ventures | | | (119,697 | ) | | | — | | | | — | |
| Net sales (purchases) of short-term investments | | | 142,343 | | | | (176,516 | ) | | | 148,611 | |
| Equity investments in reinsurance company | | | — | | | | — | | | | (84,199 | ) |
| Dividends from subsidiaries | | | 253,306 | | | | 323,010 | | | | 261,159 | |
| Due to (due from) subsidiary | | | 111,533 | | | | (9,301 | ) | | | 100,000 | |
| Proceeds from share repurchase by subsidiary | | | 18,765 | | | | — | | | | — | |
| Net cash provided by (applied to) investing activities | | | (149,955 | ) | | | (102,507 | ) | | | 62,904 | |
| | | | | | | | | | | | | |
| Cash flows provided by (applied to) financing activities: | | | | | | | | | | | | |
| Issuance of Preference Shares | | | 241,818 | | | | 96,850 | | | | — | |
| Dividends paid on Common Shares | | | (53,769 | ) | | | (42,133 | ) | | | (39,039 | ) |
| Dividends paid on Preference Shares | | | (31,134 | ) | | | (18,801 | ) | | | (12,184 | ) |
| Issuance of debt | | | — | | | | 99,144 | | | | — | |
| Purchase of Capital Securities | | | — | | | | — | | | | (3,000 | ) |
| Net cash provided by (applied to) financing activities | | | 156,915 | | | | 135,060 | | | | (54,223 | ) |
| | | | | | | | | | | | | |
| Net increase (decrease) in cash and cash equivalents | | | 239 | | | | (344 | ) | | | 234 | |
| Cash and cash equivalents, beginning of year | | | 6,551 | | | | 6,895 | | | | 6,661 | |
| Cash and cash equivalents, end of year | | $ | 6,790 | | | $ | 6,551 | | | $ | 6,895 | |
|
S-6
SCHEDULE III
RENAISSANCERE HOLDINGS LTD. AND SUBSIDIARIES
SUPPLEMENTARY INSURANCE INFORMATION
(THOUSANDS OF UNITED STATES DOLLARS)
| | | | | | | | | | | | | | | | | | | | | | | | | | | | | | | | | | | | | | |
| | | December 31, 2004 | | Year ended December 31, 2004 |
| | | Deferred
Policy
Acquisition
Operating
Costs | | Future Policy
Benefits,
Losses and
Claims and
Claims
Premiums
Expenses | | Unearned
Premiums | | Premium
Revenue | | Net
Investment
Income | | Benefits,
Claims,
Losses and
Expenses | | Amortization
of Deferred
Policy
Settlement
Costs | | Other
Acquisition
Expenses | | Net
Written |
| Reinsurance | | $ | 11,174 | | | $ | 1,121,292 | | | $ | 116,821 | | | $ | 944,527 | | | $ | — | | | $ | 746,010 | | | $ | 117,145 | | | $ | 34,983 | | | $ | 930,946 | |
| Individual Risk | | | 59,759 | | | | 338,106 | | | | 248,514 | | | | 393,700 | | | | — | | | | 350,289 | | | | 127,785 | | | | 21,378 | | | | 418,341 | |
| Other | | | — | | | | — | | | | — | | | | — | | | | 162,722 | | | | — | | | | — | | | | — | | | | — | |
| Total | | $ | 70,933 | | | $ | 1,459,398 | | | $ | 365,335 | | | $ | 1,338,227 | | | $ | 162,722 | | | $ | 1,096,299 | | | $ | 244,930 | | | $ | 56,361 | | | $ | 1,349,287 | |
|
| | | | | | | | | | | | | | | | | | | | | | | | | | | | | | | | | | | | | | |
| | | December 31, 2003 | | Year ended December 31, 2003 (Restated) |
| | | Deferred
Policy
Acquisition
Operating
Costs | | Future Policy
Benefits,
Losses and
Claims and
Claims
Premiums
Expenses | | Unearned
Premiums | | Premium
Revenue | | Net
Investment
Income | | Benefits,
Claims,
Losses and
Expenses | | Amortization
of Deferred
Policy
Settlement
Costs | | Other
Acquisition
Expenses | | Net
Written |
| Reinsurance | | $ | 10,853 | | | $ | 780,027 | | | $ | 121,526 | | | $ | 812,142 | | | $ | — | | | $ | 210,634 | | | $ | 93,227 | | | $ | 52,504 | | | $ | 792,022 | |
| Individual Risk | | | 64,408 | | | | 197,865 | | | | 228,298 | | | | 306,383 | | | | — | | | | 158,547 | | | | 100,913 | | | | 14,893 | | | | 362,754 | |
| Other | | | — | | | | — | | | | — | | | | — | | | | 129,542 | | | | — | | | | — | | | | — | | | | — | |
| Total | | $ | 75,261 | | | $ | 977,892 | | | $ | 349,824 | | | $ | 1,118,525 | | | $ | 129,542 | | | $ | 369,181 | | | $ | 194,140 | | | $ | 67,397 | | | $ | 1,154,776 | |
|
| | | | | | | | | | | | | | | | | | | | | | | | | | | | | | | | | | | | | | |
| | | December 31, 2002 | | Year ended December 31, 2002 (Restated) |
| | | Deferred
Policy
Acquisition
Operating
Costs | | Future Policy
Benefits,
Losses and
Claims and
Claims
Premiums
Expenses | | Unearned
Premiums | | Premium
Revenue | | Net
Investment
Income | | Benefits,
Claims,
Losses and
Expenses | | Amortization
of Deferred
Policy
Settlement
Costs | | Other
Acquisition
Expenses | | Net
Written |
| Reinsurance | | $ | 16,388 | | | $ | 707,036 | | | $ | 167,345 | | | $ | 670,991 | | | $ | — | | | $ | 274,316 | | | $ | 70,698 | | | $ | 39,264 | | | $ | 698,863 | |
| Individual Risk | | | 39,465 | | | | 97,759 | | | | 164,640 | | | | 92,979 | | | | — | | | | 40,209 | | | | 24,946 | | | | 9,895 | | | | 227,101 | |
| Other | | | — | | | | — | | | | — | | | | — | | | | 102,686 | | | | — | | | | — | | | | — | | | | — | |
| Total | | $ | 55,853 | | | $ | 804,795 | | | $ | 331,985 | | | $ | 763,970 | | | $ | 102,686 | | | $ | 314,525 | | | $ | 95,644 | | | $ | 49,159 | | | $ | 925,964 | |
|
S-7
SCHEDULE IV
RENAISSANCERE HOLDINGS LTD. AND SUBSIDIARIES
REINSURANCE
(THOUSANDS OF UNITED STATES DOLLARS)
| | | | | | | | | | | | | | | | | | | | | | |
| | | Gross
Amounts | | Ceded to
Other
Companies | | Assumed
From Other
Companies | | Net Amount | | Percentage
of Amount
Assumed
to Net |
| Year ended December 31, 2004 | |
| Property and liability premiums written | | $ | 240,385 | | | $ | 194,870 | | | $ | 1,303,772 | | | $ | 1,349,287 | | | | 97 | % |
| | |
| | |
| Year ended December 31, 2003 (Restated) | |
| Property and liability premiums written | | $ | 103,916 | | | $ | 227,433 | | | $ | 1,278,293 | | | $ | 1,154,776 | | | | 111 | % |
| | |
| | |
| Year ended December 31, 2002 (Restated) | |
| Property and liability premiums written | | $ | 81,499 | | | $ | 247,085 | | | $ | 1,091,550 | | | $ | 925,964 | | | | 118 | % |
|
S-8
SCHEDULE VI
RENAISSANCERE HOLDINGS LTD. AND SUBSIDIARIES
SUPPLEMENTARY INSURANCE INFORMATION CONCERNING
PROPERTY/CASUALTY INSURANCE OPERATIONS
(THOUSANDS OF UNITED STATES DOLLARS)
| | | | | | | | | | | | | | | | | | | | | | | | | | |
| Affiliation with Registrant | | Deferred Policy
Acquisition
Costs | | Reserve for
Unpaid Claims
and Claim
Expenses | | Discount,
if any,
deducted | | Unearned
Premiums | | Earned
Premiums | | Net
Investment
Income |
| Consolidated Subsidiaries | |
| Year ended December 31, 2004 | | $ | 70,933 | | | $ | 1,459,398 | | | $ | — | | | $ | 365,335 | | | $ | 1,338,227 | | | $ | 162,722 | |
| Year ended December 31, 2003 (Restated) | | $ | 75,261 | | | $ | 977,892 | | | $ | — | | | $ | 349,824 | | | $ | 1,118,525 | | | $ | 129,542 | |
| Year ended December 31, 2002 (Restated) | | $ | 55,853 | | | $ | 804,795 | | | $ | — | | | $ | 331,985 | | | $ | 763,970 | | | $ | 102,686 | |
|
| | | | | | | | | | | | | | | | | | | | | | |
| | | Claims and Claim Expense
Incurred Related to | | Amortization of
Deferred Policy
Acquisition Costs | | Paid Claim
and Claims
Expenses | | Net
Premiums
Written |
| Affiliation with Registrant | | Current Year | | Prior Year | |
| Consolidated Subsidiaries | | | | | |
| Year ended December 31, 2004 | | $ | 1,236,565 | | | $ | (140,266 | ) | | $ | 244,930 | | | $ | 683,380 | | | $ | 1,349,287 | |
| Year ended December 31, 2003 (Restated) | | $ | 462,816 | | | $ | (93,635 | ) | | $ | 194,140 | | | $ | 143,662 | | | $ | 1,154,776 | |
| Year ended December 31, 2002 (Restated) | | $ | 291,520 | | | $ | 23,005 | | | $ | 95,644 | | | $ | 98,163 | | | $ | 925,964 | |
|
S-9
Financial and Investor Information
RenaissanceRe Holdings Ltd. and Subsidiaries
For copies of the Company's Annual Report, press releases, Forms 10-K and 10-Q or other filings, please visit our website:
www.renre.com
or contact:
Kekst and Company
437 Madison Avenue
New York, NY 10022
Tel: 212-521-4800
For General Information About the Company Contact:
Todd R. Fonner
Vice President
Tel: 441-298-2291
Email: trf@renre.com
Stock Information
The Company's stock is listed on The New York Stock Exchange under the symbol RNR.
The following table sets forth, for the periods indicated, the high and low closing prices per share of our common shares as reported in composite New York Stock Exchange trading.
| | | | | | | | | | | | | | | | | | |
| | | 2004 Price Range | | 2003 Price Range |
| | | High | | Low | | High | | Low |
| First Quarter | | $ | 54.87 | | | $ | 48.51 | | | $ | 40.78 | | | $ | 34.40 | |
| Second Quarter | | | 56.34 | | | | 48.80 | | | | 46.93 | | | | 40.07 | |
| Third Quarter | | | 54.84 | | | | 48.12 | | | | 48.69 | | | | 41.15 | |
| Fourth Quarter | | | 52.08 | | | | 46.82 | | | | 49.35 | | | | 44.45 | |
|
As required under the rules of the New York Stock Exchange (NYSE), our chief executive officer timely submitted to the NYSE his annual certification that he is not aware of any violation by the company of NYSE corporate governance standards. Also as required under the rules of the NYSE, readers are advised that the certifications required under Section 302 of the Sarbanes-Oxley Act of 2002 are not included in this report but instead are included as exhibits to our Annual Report on Form 10-K for 2004.
Independent Auditors
Ernst & Young
Hamilton, Bermuda
Transfer Agent
Mellon Investor Services, L.L.C.
Overpeck Centre
85 Challenger Road
Ridgefield Park, NJ 07660
USA
Tel: 1-800-756-3353
www.melloninvestor.com
Additional Requests Can Be Directed to:
The Company Secretary
RenaissanceRe Holdings Ltd.
Renaissance House
8-20 East Broadway
P.O. Box HM2527
Hamilton HMGX, Bermuda
Tel: 441-295-4513
Fax: 441-292-9453
Designed and produced by Taylor & Ives, Inc., NYC