
RenaissanceRe RenaissanceRe Holdings Ltd. 2012 Annual Report
Contents
Financial Highlights 1
Company Overview 2
Letter To Our Shareholders 5
Message from the Chairman 13
Executive Committee 14
Essay: Creating Value Over Time From an Integrated System 17
Comments on Regulation G 21
Form 10-K 23
Senior Officers Last Page
Board of Directors Inside Back Cover
Financial and Investor Information Inside Back Cover
Financial Highlights
Financial Highlights for RenaissanceRe Holdings Ltd. and Subsidiaries
(In thousands of United States dollars, except per share amounts and percentages)
2012 2011 2010
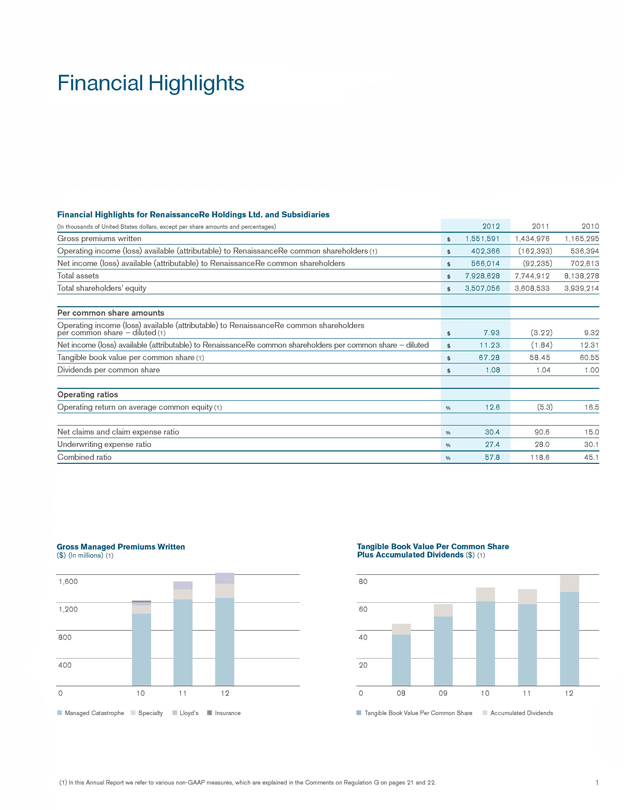
Gross premiums written $1,551,591 1,434,976 1,165,295
Operating income (loss) available (attributable) to RenaissanceRe common shareholders (1) $402,366 (162,393) 536,394
Net income (loss) available (attributable) to RenaissanceRe common shareholders $566,014 (92,235) 702,613
Total assets $7,928,628 7,744,912 8,138,278
Total shareholders’ equity $3,507,056 3,608,533 3,939,214
Per common share amounts
Operating income (loss) available (attributable) to RenaissanceRe common shareholders per common share - diluted (1) $7.93 (3.22) 9.32
Net income (loss) available (attributable) to RenaissanceRe common shareholders per common share - diluted $11.23 (1.84) 12.31
Tangible book value per common share (1) $67.28 58.45 60.55
Dividends per common share $1.08 1.04 1.00
Operating ratios
Operating return on average common equity (1) %12.6 (5.3) 16.5
Net claims and claim expense ratio %30.4 90.6 15.0
Underwriting expense ratio %27.4 28.0 30.1
Combined ratio %57.8 118.6 45.1
Gross Managed Premiums Written
($) (In millions) (1) Tangible Book Value Per Common Share Plus Accumulated Dividends ($) (1)
1,600 80
1,200 60
800 40
400 20
0 10 11 12 0 08 09 10 11 12
Managed Catastrophe Specialty Lloyd’s Insurance Tangible Book Value Per Common Share Accumulated Dividends
(1) In this Annual Report we refer to various non-GAAP measures, which are explained in the Comments on Regulation G on pages 21 and 22.
1
Value and Focus Through an Integrated System
Company Overview
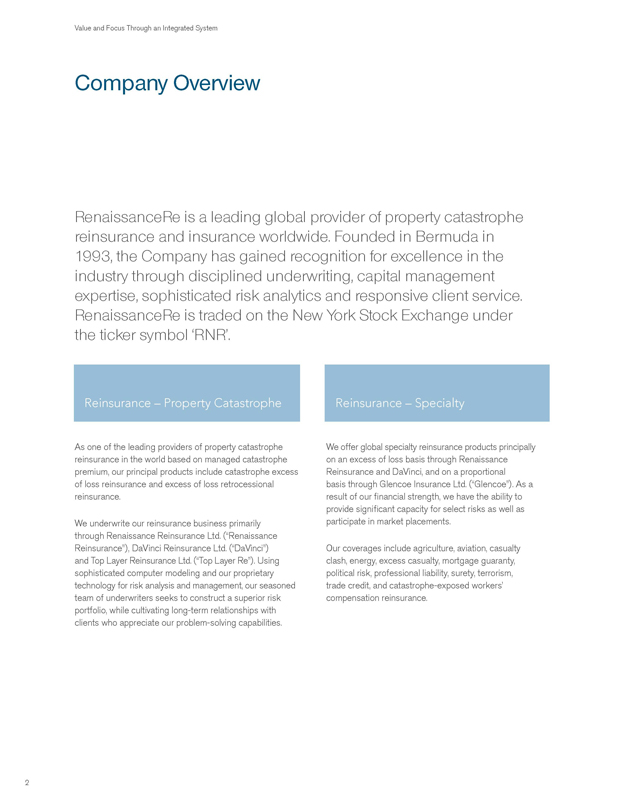
RenaissanceRe is a leading global provider of property catastrophe reinsurance and insurance worldwide. Founded in Bermuda in 1993, the Company has gained recognition for excellence in the industry through disciplined underwriting, capital management expertise, sophisticated risk analytics and responsive client service. RenaissanceRe is traded on the New York Stock Exchange under the ticker symbol ‘RNR’.
Reinsurance - Property Catastrophe
As one of the leading providers of property catastrophe reinsurance in the world based on managed catastrophe premium, our principal products include catastrophe excess of loss reinsurance and excess of loss retrocessional reinsurance.
We underwrite our reinsurance business primarily through Renaissance Reinsurance Ltd. (“Renaissance Reinsurance”), DaVinci Reinsurance Ltd. (“DaVinci”) and Top Layer Reinsurance Ltd. (“Top Layer Re”). Using sophisticated computer modeling and our proprietary technology for risk analysis and management, our seasoned team of underwriters seeks to construct a superior risk portfolio, while cultivating long-term relationships with clients who appreciate our problem-solving capabilities.
Reinsurance - Specialty
We offer global specialty reinsurance products principally on an excess of loss basis through Renaissance Reinsurance and DaVinci, and on a proportional basis through Glencoe Insurance Ltd. (“Glencoe”). As a result of our financial strength, we have the ability to provide significant capacity for select risks as well as participate in market placements.
Our coverages include agriculture, aviation, casualty clash, energy, excess casualty, mortgage guaranty, political risk, professional liability, surety, terrorism, trade credit, and catastrophe-exposed workers’ compensation reinsurance.
2

RenaissanceRe Holdings Ltd. 2012 Annual Report
Lloyd’s
RenaissanceRe operates through RenaissanceRe Syndicate Management Limited and Syndicate 1458 at Lloyd’s. The extensive distribution network and worldwide licenses of the Lloyd’s marketplace complement and extend both our strategy and our strong underwriting platform in Bermuda.
Coverages currently include property insurance and treaty reinsurance, casualty insurance and treaty reinsurance, and crop reinsurance. The disciplined underwriting approach and rigorous risk management which underpin our Bermuda operation are reflected by our London team.
Ventures
RenaissanceRe’s Ventures unit structures and manages joint ventures as well as other strategic relationships that leverage the Company’s underwriting expertise and experience. We manage several property catastrophe joint ventures that provide additional high quality capacity to our clients and generate fee income for RenaissanceRe. Our principal joint ventures include Top Layer Re and DaVinci, and we seek to structure other joint ventures when market opportunities arise. We also make strategic investments to provide capital to existing clients and market participants in forms other than reinsurance.
Our weather and energy risk management operations, RenRe Energy Advisors Ltd. (REAL), has been a part of the RenaissanceRe group since 2007. This team offers risk management solutions pertaining to weather and energy price risks, which include weather, energy and commodity derivatives and hybrid products.
3

Value and Focus Through an Integrated System

RenaissanceRe Holdings Ltd. 2012 Annual Report
To Our Shareholders
RenaissanceRe’s success in 2012 resulted from the focused, hard work of our talented people, the integration of our operations, and the continued execution of a clear and consistent strategy across our organization.
Our achievements during the year reflected our ongoing commitment to a strategy focused on excellence in evaluating and underwriting low-frequency, high-severity risks. We continued to benefit by enlisting our competitive advantages in the integrated operation of three core areas: superior client relationships, superior risk selection, and superior capital management - an approach explained later in this annual report.
Twenty Years of Focused Leadership
We are in our 20th year of operation. At our inception, we articulated the goal of being the first-call market for our clients and brokers, identifying the “three superiors”
I just mentioned as central drivers to achieving that goal. Over our two decades of operation, those drivers have remained embedded in our culture and proven to be fundamental to our long-term success.
I am proud to see that the business model and guiding principles we developed from the outset and have followed diligently ever since, have enabled us once again to generate attractive returns, despite large industry losses in our core market.
Stepping Up to Opportunity in an Uncertain Market
We have always sought opportunity in difficult markets and to be a consistent source of capital for our clients when they need us most. As 2012 began, the global catastrophe reinsurance market was still somewhat uncertain after the string of major disasters during 2011 and late 2010, which included the Japanese earthquake and tsunami, the New Zealand earthquakes, and Hurricane Irene. After these events, many in our industry reduced exposures during the January 2012 renewal season at a time when our clients were looking for coverages and support. We did not.
At RenaissanceRe, as we have after each major catastrophe since we were formed, we approached the January renewals looking to support our clients as expansively as possible, and to pursue promising opportunities. Despite our prior-year losses, we confidently entered the market, growing managed catastrophe premiums by 35% in the first quarter of 2012. Utilizing our ability to evaluate a wide range of risks quickly, we were able to access some of the most desirable opportunities and assemble a large and attractive portfolio. It included risks such as Japanese, Australian and New Zealand earthquake, as well as our traditionally strong participation in the Atlantic hurricane market.
Later in the year, the June 2012 renewals produced fewer and relatively less attractive growth opportunities than January had offered. However, our leading position in Atlantic hurricane exposed markets and coverages enabled us to write well-priced business. This, along with the decisions we had made in January, allowed us to construct an attractive book of business for the year.
Sandy - A Display of Exceptional Customer Service
In a sense, 2012 can be viewed in two parts: the first nine months, with limited insured catastrophic events, and the final quarter, dominated by Sandy. During the first three
Opposite page:
Neill Currie
Chief Executive Officer
5
Value and Focus Through an Integrated System
“We continue to be a leader in providing rapid solutions to cedants and capital providers while striving to ensure that the risks we assume are attractive and well-suited to our own overall portfolio.”
quarters of the year, we experienced some destructive U.S. tornado activity as well as a heightened number of Atlantic hurricanes but few of these reached major strength and, for the most part, remained at sea.
But in late October, Sandy came ashore inflicting significant property damage and, regrettably, loss of life in the densely populated Northeast, especially New York City and the New Jersey coast. Although some in our industry were surprised by the nature and extent of the losses resulting from Sandy, we were not. Our risk models had incorporated the possibility of an event of this scale and in the geographical proximity in which it occurred. Within days after the storm made landfall, we were assisting our clients to evaluate their losses.
Sandy was a prime example of our integrated system at work: the seamless operation of our underwriting, scientific, modeling and claims teams, working in concert. Although it will take a great deal of time for the total claims from Sandy to develop, we quickly estimated our ultimate loss, establishing that it was within our expectation for an event of this nature and would be contained within that quarter’s earnings.
As is the case with all storms, earthquakes or other loss events, Sandy added to our base of information for future modeling. Importantly, it also served as another reminder of the inherent volatility of our business and the importance of our products to our clients. As I have said many times, we expect to incur losses in our business, but believe that through superior risk management, our losses will be manageable and our franchise will endure. Our experience with Sandy, one of the largest insured loss events in U.S. history, certainly supports that view.
Innovative Solutions for Third-Party Capital
As 2012 began, low interest rates continued to force those with capital to explore investment alternatives in order to seek better returns. New market entrants with large pools of capital, including pension funds, hedge funds and university endowments, increasingly turned their attention to our industry.
Again, our flexible business model allowed us to adapt to this market dynamic. Through our Ventures unit, we have always been a leader in developing creative solutions for matching third-party capital with risk/return profiles our capital providers find attractive. Working closely with our underwriters, our Ventures team established a fully collateralized joint venture in January 2012, Upsilon Reinsurance Ltd. (“Upsilon Re”), with a limit of $115 million to write retrocessional protection in a market dislocated by insufficient retrocessional capacity. We built upon the success of Upsilon Re and established Upsilon Re II for 2013, with capacity of $186 million, opening it to new investors.
Similarly, in June 2012 we established Timicuan Reinsurance III Limited (“Tim Re III”), a $96 million vehicle specifically focused on reinsurance for the Florida homeowners market. Tim Re III, like its predecessors, provided our investors with excellent returns.
DaVinci, our long-standing joint venture, which writes the same risks as Renaissance Reinsurance but on a separate balance sheet, significantly diversified its shareholder base. We decreased our ownership during the year from 43% to 33%, to make room for a number of high-quality, long-term investors.
Top Layer Re, our joint venture with State Farm Mutual Automobile Insurance Company that writes high layers of international catastrophe reinsurance, experienced another profitable year. Buyers appreciate the magnitude of the line sizes we offer, along with the claims-paying capability of this partnership. We continue to believe that Top Layer Re is one of the most innovative structures in the market today.
Whether providing limited life vehicles, such as the Upsilon and the Timicuan series, insurance-linked securities, or other ongoing ventures, we have proven ourselves adept at structuring innovative vehicles to match the types of risk our capital providers seek. In a market where capital flows more quickly than ever, we continue to be a leader in providing rapid solutions to cedants and capital providers while striving to ensure that the risks we assume are attractive and well-suited to our own overall portfolio.
6

RenaissanceRe Holdings Ltd. 2012 Annual Report
“Sandy was a prime example of our integrated system at work: the seamless operation of our underwriting, scientific, modeling and claims teams, working in concert.”
Value and Focus Through an Integrated System
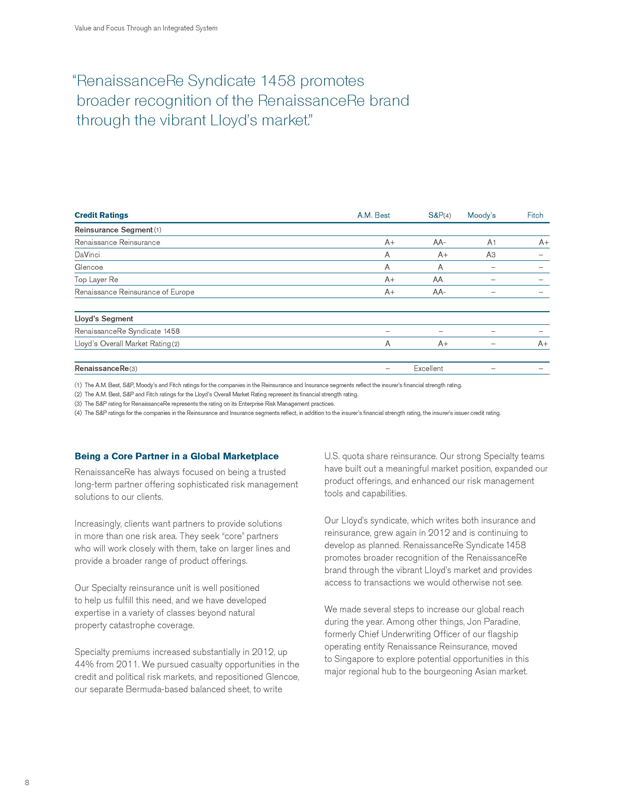
“RenaissanceRe Syndicate 1458 promotes broader recognition of the RenaissanceRe brand through the vibrant Lloyd’s market.”
Credit Ratings A.M. Best S&P(4) Moody’s Fitch
Reinsurance Segment(1)
Renaissance Reinsurance A+ AA- A1 A+
DaVinci A A+ A3 -
Glencoe A A - -
Top Layer Re A+ AA - -
Renaissance Reinsurance of Europe A+ AA- - -
Lloyd’s Segment
RenaissanceRe Syndicate 1458 - - - -
Lloyd’s Overall Market Rating(2) A A+ - A+
RenaissanceRe(3) - Excellent - -
(1) The A.M. Best, S&P, Moody’s and Fitch ratings for the companies in the Reinsurance and Insurance segments reflect the insurer’s financial strength rating.
(2) The A.M. Best, S&P and Fitch ratings for the Lloyd’s Overall Market Rating represent its financial strength rating.
(3) The S&P rating for RenaissanceRe represents the rating on its Enterprise Risk Management practices.
(4) The S&P ratings for the companies in the Reinsurance and Insurance segments reflect, in addition to the insurer’s financial strength rating, the insurer’s issuer credit rating.
Being a Core Partner in a Global Marketplace
RenaissanceRe has always focused on being a trusted long-term partner offering sophisticated risk management solutions to our clients.
Increasingly, clients want partners to provide solutions in more than one risk area. They seek “core” partners who will work closely with them, take on larger lines and provide a broader range of product offerings.
Our Specialty reinsurance unit is well positioned to help us fulfill this need, and we have developed expertise in a variety of classes beyond natural property catastrophe coverage.
Specialty premiums increased substantially in 2012, up 44% from 2011. We pursued casualty opportunities in the credit and political risk markets, and repositioned Glencoe, our separate Bermuda-based balanced sheet, to write
U.S. quota share reinsurance. Our strong Specialty teams have built out a meaningful market position, expanded our product offerings, and enhanced our risk management tools and capabilities.
Our Lloyd’s syndicate, which writes both insurance and reinsurance, grew again in 2012 and is continuing to develop as planned. RenaissanceRe Syndicate 1458 promotes broader recognition of the RenaissanceRe brand through the vibrant Lloyd’s market and provides access to transactions we would otherwise not see.
We made several steps to increase our global reach during the year. Among other things, Jon Paradine, formerly Chief Underwriting Officer of our flagship operating entity Renaissance Reinsurance, moved to Singapore to explore potential opportunities in this major regional hub to the bourgeoning Asian market.
8
RenaissanceRe Holdings Ltd. 2012 Annual Report
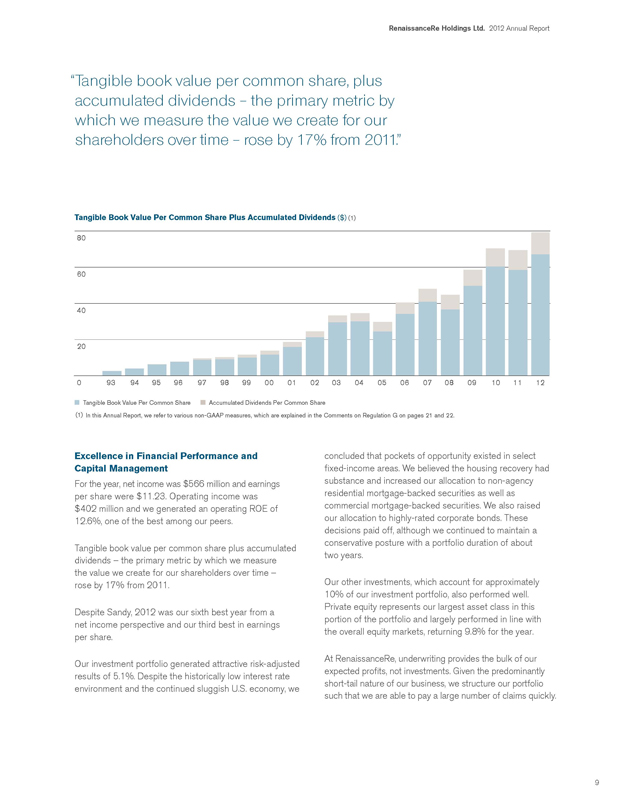
“Tangible book value per common share, plus accumulated dividends – the primary metric by which we measure the value we create for our shareholders over time – rose by 17% from 2011.”
Tangible Book Value Per Common Share Plus Accumulated Dividends ($) (1)
80
60
40
20
0 93 94 95 96 97 98 99 00 01 02 03 04 05 06 07 08 09 10 11 12
Tangible Book Value Per Common Share Accumulated Dividends Per Common Share
(1) In this Annual Report, we refer to various non-GAAP measures, which are explained in the Comments on Regulation G on pages 21 and 22.
Excellence in Financial Performance and Capital Management
For the year, net income was $566 million and earnings per share were $11.23. Operating income was $402 million and we generated an operating ROE of 12.6%, one of the best among our peers.
Tangible book value per common share plus accumulated dividends – the primary metric by which we measure the value we create for our shareholders over time – rose by 17% from 2011.
Despite Sandy, 2012 was our sixth best year from a net income perspective and our third best in earnings per share.
Our investment portfolio generated attractive risk-adjusted results of 5.1%. Despite the historically low interest rate environment and the continued sluggish U.S. economy, we
concluded that pockets of opportunity existed in select fixed-income areas. We believed the housing recovery had substance and increased our allocation to non-agency residential mortgage-backed securities as well as commercial mortgage-backed securities. We also raised our allocation to highly-rated corporate bonds. These decisions paid off, although we continued to maintain a conservative posture with a portfolio duration of about two years.
Our other investments, which account for approximately 10% of our investment portfolio, also performed well.
Private equity represents our largest asset class in this portion of the portfolio and largely performed in line with the overall equity markets, returning 9.8% for the year.
At RenaissanceRe, underwriting provides the bulk of our expected profits, not investments. Given the predominantly short-tail nature of our business, we structure our portfolio such that we are able to pay a large number of claims quickly.
9

Value and Focus Through an Integrated System
“In 2012, we made great strides in implementing investment, accounting and business support tools that allow us to operate seamlessly as an integrated system.”
RenaissanceRe Holdings Ltd. 2012 Annual Report
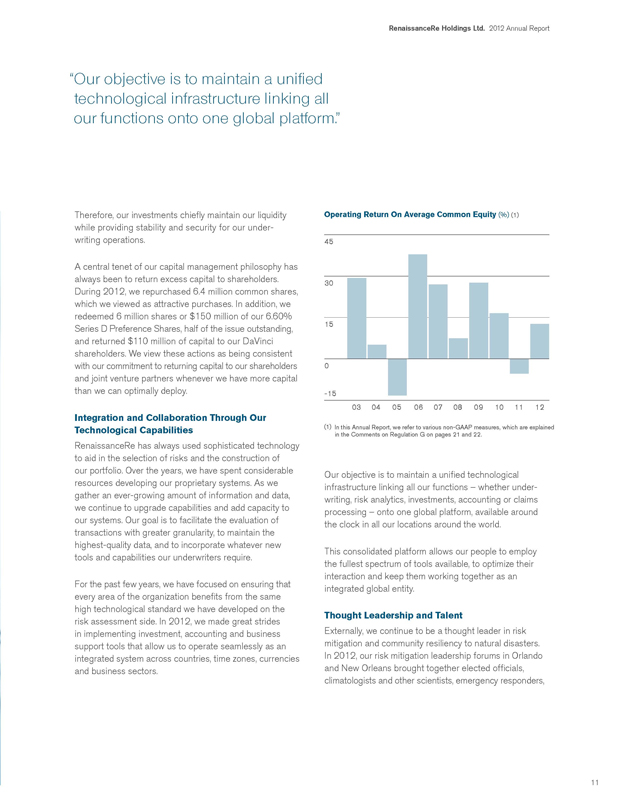
“Our objective is to maintain a unified technological infrastructure linking all our functions onto one global platform.”
Therefore, our investments chiefly maintain our liquidity while providing stability and security for our under- writing operations.
A central tenet of our capital management philosophy has always been to return excess capital to shareholders. During 2012, we repurchased 6.4 million common shares, which we viewed as attractive purchases. In addition, we redeemed 6 million shares or $ 150 million of our 6.60% Series D Preference Shares, half of the issue outstanding, and returned $110 million of capital to our DaVinci shareholders. We view these actions as being consistent with our commitment to returning capital to our shareholders and joint venture partners whenever we have more capital than we can optimally deploy.
Integration and Collaboration Through Our Technological Capabilities
RenaissanceRe has always used sophisticated technology to aid in the selection of risks and the construction of our portfolio. Over the years, we have spent considerable resources developing our proprietary systems. As we gather an ever-growing amount of information and data, we continue to upgrade capabilities and add capacity to our systems. Our goal is to facilitate the evaluation of transactions with greater granularity, to maintain the highest-quality data, and to incorporate whatever new tools and capabilities our underwriters require.
For the past few years, we have focused on ensuring that every area of the organization benefits from the same high technological standard we have developed on the risk assessment side. In 2012, we made great strides in implementing investment, accounting and business support tools that allow us to operate seamlessly as an integrated system across countries, time zones, currencies and business sectors.
Operating Return On Average Common Equity (%) (1)
45
30
15
0
-15
03 04 05 06 07 08 09 10 11 12
(1) In this Annual Report, we refer to various non-GAAP measures, which are explained
in the Comments on Regulation G on pages 21 and 22.
Our objective is to maintain a unified technological infrastructure linking all our functions – whether under- writing, risk analytics, investments, accounting or claims processing – onto one global platform, available around the clock in all our locations around the world.
This consolidated platform allows our people to employ the fullest spectrum of tools available, to optimize their interaction and keep them working together as an integrated global entity.
Thought Leadership and Talent
Externally, we continue to be a thought leader in risk mitigation and community resiliency to natural disasters. In 2012, our risk mitigation leadership forums in Orlando and New Orleans brought together elected officials, climatologists and other scientists, emergency responders,
11

Value and Focus Through an Integrated System
“We work hard at hiring smart, well-educated people, who are driven to help our clients and to succeed.”
environmental groups and policy experts to discuss the latest ideas for reducing the risks that natural disasters pose to life and property. We were also closely consulted for our flood assessment expertise during the bipartisan reform of the National Flood Insurance Program.
I am proud of the depth of management throughout the Company. We continue to invest in our team and in recruiting new talent to incorporate a more diverse range of perspectives within the senior leaders of our Company. I am delighted that so many of our professionals continue to broaden their skills, through our mentoring and leadership programs and immersion in our culture, to become excellent managers and executives as well as domain experts. As we pursue our strategic plans for the future, it is critical that we continue to attract and retain talented employees who share our ethical standards and our passion for client service and risk management.
Looking Ahead
In the near term, challenges include non-traditional capital continuing to flow into our market, as well as competition steadily growing more sophisticated. Many of the innovations we pioneered, in areas such as catastrophe modeling and structuring vehicles that facilitate third party capital investment, have been imitated or are now commercially available in some fashion. Keeping our edge is a top priority and at the center of our strategy. I believe that over the past two decades, we have put together a company with unsurpassed capabilities in our field. We work hard at hiring smart, well-educated people, who are driven to help our clients and to succeed. We also try to hire people with whom others want to work, with whom clients and brokers want to do business. The importance of this should not be underestimated; our people are a differentiator for RenaissanceRe.
As always, I thank our Board of Directors for their invaluable counsel, as well as my colleagues on the executive committee for their deep commitment to the Company. I would also like to congratulate Kevin O’Donnell, who was promoted to President and remains Global Chief Underwriting Officer. His achievements have helped to instill the highest underwriting standards throughout the Company. Kevin’s contributions to our success over the years have been significant and his promotion to President reflects those contributions.
Finally, I want to thank all our employees, whose talents and teamwork make RenaissanceRe such a productive and enjoyable place to work, and of course our many shareholders for their continued support. I am gratified to see how far we have come since our formation twenty years ago and I remain excited about the future prospects of the Company.
Sincerely,
Neill A. Currie
Chief Executive Officer
12

RenaissanceRe Holdings Ltd. 2012 Annual Report
Message from the Chairman
Our Company had a very good year in 2012, generating strong results, managing shareholders’ capital efficiently and delivering outstanding customer service, which contribute to enhanced long-term value. These results were enjoyed because of strong performance across our entire integrated system, as described in Neill’s letter. My fellow directors join me in thanking our whole team for its collaborative effort and focus on successfully executing the Company’s strategy.
Our principal focus as your Board of Directors is effective fiduciary oversight of the Company’s strategic planning, risk management approach, value creation and performance. The Board’s corporate governance practices are rooted in the same commitment to excellence, principles and values that our executive management team seeks to inculcate across our employee team. In 2012, we reviewed the Company’s business strategies and the performance of its tactical plans. We assessed its capital position, allocation, and optimization planning and evaluated the organization’s succession planning and management bench strength. Finally, we continued our evaluation of executive compensation programs to ensure that they do not create unintended risk, remain aligned with long-term shareholder results, and provide appropriate competitive incentives to attract and retain the talented team upon which our business depends.
On behalf of my fellow directors, I would like to recognize the invaluable contributions and expertise of Thomas Cooper, who has served RenaissanceRe since after the Company’s initial public offering and who retires from the Board this year. Tom has provided both wisdom and strong guidance to the Company and we thank him for his many years of service. In turn, we welcome Brian Gray, who joins our Board after a long career at Swiss Re where he most recently held the position of Group Chief Underwriting Officer. Brian’s industry knowledge and global experience will contribute to our stewardship of the organization on behalf of all of our shareholders.
Lastly, I would like to extend personal thanks to my Board colleagues for their dedication and insight and, together with Neill and all directors, gratitude to our shareholders for their continued support. I am proud of the excellence and discipline being exercised across the organization, which are reflected in the strong performance achieved by RenaissanceRe over time.
Sincerely,
Ralph B. Levy
Chairman
13

Value and Focus Through an Integrated System
Executive Committee

RenaissanceRe Holdings Ltd. 2012 Annual Report
Neill A. Currie
Kevin J. O’Donnell
Peter C. Durhager
Jeffrey D. Kelly
Chief Executive Officer, RenaissanceRe Holdings Ltd.
President,
Global Chief Underwriting Officer, RenaissanceRe Holdings Ltd.
Executive Vice President, Chief Administrative Officer, RenaissanceRe Holdings Ltd.
Executive Vice President, Chief Financial Officer, RenaissanceRe Holdings Ltd.
Ian D. Branagan
Dana J. Cuffe
Ross A. Curtis
Aditya K. Dutt
Senior Vice President,
Chief Risk Officer, RenaissanceRe Holdings Ltd.
Senior Vice President,
Chief Information Officer, RenaissanceRe Holdings Ltd.
Senior Vice President, RenaissanceRe Holdings Ltd., Chief Underwriting Officer of European Operations
Senior Vice President, RenaissanceRe Holdings Ltd., President,
Renaissance Underwriting Managers, Ltd.
Todd R. Fonner
David E. Marra
Justin D. O’Keefe
Jonathan D. A. Paradine
Senior Vice President,
Chief Investment Officer, Treasurer,
RenaissanceRe Holdings Ltd.
Senior Vice President, RenaissanceRe Holdings Ltd.
Senior Vice President, RenaissanceRe Holdings Ltd.
Senior Vice President, RenaissanceRe Holdings Ltd., Principal Officer,
Renaissance Reinsurance Ltd., Singapore Representative Office
Stephen H. Weinstein
Mark A. Wilcox
Senior Vice President,
Chief Compliance Officer, General Counsel and Secretary, RenaissanceRe Holdings Ltd.
Senior Vice President,
Chief Accounting Officer, Corporate Controller, RenaissanceRe Holdings Ltd.
15

Value and Focus Through an Integrated System
“Anticipating the final portfolio is essential to consistent selection and pricing of risks within and across renewal cycles.”
RenaissanceRe Holdings Ltd. 2012 Annual Report
Creating Value Over Time From an Integrated System
Our past three annual reports have discussed the three competitive advantages we seek to deploy: superior customer relationships, superior capital management, and superior risk selection.
Last year we concluded by saying: “It is our belief that our success comes in the first instance from our unwavering focus on each, and in the second from seamless integration of all three.” This year we explain how we seek to achieve that integration.
We have been building our Company as an integrated system since our founding. Indeed, the idea of an integrated system of three competitive advantages was outlined in longhand in notes from a staff meeting on August 24, 1993, when the staff was just four people.
The goal was to create this system and support it through integrated technology, integrated decision-making processes, empowered underwriters, and a unique culture.
The 1993 plan started with underwriting. We aspire to be “the best underwriter.” Underwriting includes both risk and capital components: the best underwriter matches well-structured risk with capital whose providers would find the risk/return trade-off attractive.
Our planning process is illustrative of how the three competitive advantages operate as a single integrated system to match risk and capital. Throughout the year we construct forward-looking representations of the portfolio we expect to write at the upcoming renewal period(s).
Our leadership position in our major markets means we have better quality data with which to estimate how the market and our portfolio will change at the next renewal.
In addition, we believe that the value we provide to ceding companies through our superior customer relationships allows us to obtain more of the business we find attractive and therefore to forecast the lines we will sign better than a typical reinsurer.
The more accurate our planning is, the better we can manage capital to support the expected portfolio. Our finance, underwriting, ventures, and risk teams meet regularly to assess the expected portfolio and plan capital management. This assessment includes the balance sheets we manage for third-party capital in our joint venture business. We adjust our plans in real time if conditions change unexpectedly in either the reinsurance or capital markets.
Having a good estimate of our expected portfolio at the next renewal also improves our ability to select risk. Each risk added to our portfolio interacts with other risks either by diversifying or amplifying aggregate risk. So, anticipating the final portfolio is essential to consistent selection and pricing of risks within and across renewal cycles.
Bringing efficient capital to the market and pricing our product consistently are two factors that we believe contribute to superior customer relationships.
In short, the three competitive advantages that we seek, when managed in an integrated manner, become self-reinforcing.
17
Value and Focus Through an Integrated System
“Having one robust set of real-time numbers allows collaborative decision-making among risk, finance, ventures, and underwriting teams.”
Integrated Technology
Being the best underwriter in our definition – matching risk and capital – requires and is enabled by a single system to assess and manage all forms of risk and capital. Shortly after our founding we began building our proprietary Renaissance Exposure Management System (REMS©
). REMS©
intends to capture all assumed risk, all balance sheets, all third-party capital vehicles, all classes of business, investments, reserve risk, credit risk, and other forms of risk irrespective of where it arises within the Company. REMS©
facilitates critical processes across the Company: exposure analysis, deal structuring, gross portfolio optimization and management, the ceding of gross risk, capital management, and risk control. By providing information in real time, REMS©
allows us to adjust plans on a daily basis to incorporate new information.
Integrated Decision-Making
Having one robust set of real-time numbers allows collaborative decision-making among risk, finance, ventures, and underwriting teams. There are many forms of capital with different risk tolerances that can be deployed into the reinsurance market. We seek to bring ceding companies the most efficient capital by optimally balancing the use of our shareholders’ capital, various forms of third-party capital, and ceded retrocessional reinsurance protection. For example, if capital markets change, we can assess the trade-offs among changing our capital management plans, changing the retrocession protection we buy, changing how we assume risk, or repositioning the investment portfolio.
Empowered Underwriters
Our underwriters match our clients’ risk with the right capital. To play their role most effectively, our underwriters are empowered as decision-makers and provided industry-leading tools and risk measures to enable consistent and optimal portfolio construction. REMS©
allows underwriters to evaluate and develop price quotes for different structures backed by different forms of
capital, and it does this in real time to better serve clients and brokers. Our goal is for brokers and ceding companies to receive consistent exposure-based pricing across all our operating units.
An Integrated Culture
Our “all for one, one for all” culture is another self-reinforcing aspect of the integrated system. The culture demands that we operate as one company, not a set of independent local entities. We are a meritocracy, where our leaders reward teamwork, peer review, and careful analysis.
The culture and integrated system are supported by a compensation program focused on rewarding achievement of long-term corporate goals, centrally-managed global support functions, and an inclusive “one company” approach to long-term strategy and budgeting.
Conclusion
Operating a company with multiple lines of business, geographies, and capital sources as a seamlessly integrated system is not as simple as it may seem. Achieving our mission and vision drives us to be a leader in our markets, which comes from – and reinforces – being the best underwriter, which we believe is achievable over the long-term only through operating as an integrated system.
Over the past twenty years, we have differentiated our Company as a leader in risk and capital management, and customer service. Our founding principles have enabled us to lead many of the changes in reinsurance and capital management, while at the same time avoiding less attractive choices. Operating the Company as an integrated system positions us best to continue to achieve our mission of generating superior returns over the long term.
18

Financial Information

UNITED STATES
SECURITIES AND EXCHANGE COMMISSION
WASHINGTON, D.C. 20549
FORM 10-K
Q ANNUAL REPORT PURSUANT TO SECTION 13 OR 15(d) OF
THE SECURITIES EXCHANGE ACT OF 1934
For the fiscal year ended December 31, 2012
OR
o TRANSITION REPORT PURSUANT TO SECTION 13 OR 15(d) OF
THE SECURITIES EXCHANGE ACT OF 1934
For the transition period from to
Commission File No. 001-14428
RENAISSANCERE HOLDINGS LTD.
(Exact Name Of Registrant As Specified In Its Charter)
|
| |
| Bermuda | 98-014-1974 |
(State or Other Jurisdiction of Incorporation or Organization) | (I.R.S. Employer Identification Number) |
Renaissance House, 12 Crow Lane, Pembroke HM 19 Bermuda
(Address of Principal Executive Offices)
(441) 295-4513
(Registrant's telephone number)
Securities registered pursuant to Section 12(b) of the Act:
|
| |
| Title of each class | Name of each exchange on which registered |
| Common Shares, Par Value $1.00 per share | New York Stock Exchange, Inc. |
| Series C 6.08% Preference Shares, Par Value $1.00 per share | New York Stock Exchange, Inc. |
| Series D 6.60% Preference Shares, Par Value $1.00 per share | New York Stock Exchange, Inc. |
Securities registered pursuant to Section 12(g) of the Act: None
Indicate by check mark if the registrant is a well-known seasoned issuer, as defined in Rule 405 of the Act. Yes Q No o
Indicate by check mark if the registrant is not required to file reports pursuant to Section 13 or Section 15(d) of the Act. Yes o No Q
Indicate by check mark whether the registrant (1) has filed all reports required to be filed by Section 13 or 15(d) of the Securities Exchange Act of 1934 during the preceding 12 months (or for such shorter period that the registrant was required to file such reports), and (2) has been subject to such filing requirements for the past 90 days. Yes Q No o
Indicate by check mark whether the registrant has submitted electronically and posted on its corporate Web site, if any, every Interactive Data File required to be submitted and posted pursuant to Rule 405 of Regulation S-T (§232.405 of this chapter) during the preceding 12 months (or for such shorter period that the registrant was required to submit and post such files). Yes Q No o
Indicate by check mark if disclosure of delinquent filers pursuant to Item 405 of Regulation S-K (§229.405 of this chapter) is not contained herein, and will not be contained, to the best of registrant's knowledge, in definitive proxy or information statements incorporated by reference in Part III of this Form 10-K or any amendment to this Form 10-K. o
Indicate by check mark whether the registrant is a large accelerated filer, an accelerated filer, a non-accelerated filer, or a smaller reporting company, as defined in Rule 12b-2 of the Act. Large accelerated filer Q, Accelerated filer o, Non-accelerated filer o, Smaller reporting company o
Indicate by check mark whether the registrant is a shell company (as defined in Rule 12b-2 of the Act). Yes o No Q
The aggregate market value of Common Shares held by nonaffiliates of the registrant at June 30, 2012 was $3,558.0 million based on the closing sale price of the Common Shares on the New York Stock Exchange on that date.
The number of Common Shares, par value US $1.00 per share, outstanding at February 20, 2013 was 44,218,306.
The information required by Part III of this report, to the extent not set forth herein, is incorporated by reference to the registrant's Definitive Proxy Statement to be filed in respect of our 2013 Annual General Meeting of Shareholders.
RENAISSANCERE HOLDINGS LTD.
TABLE OF CONTENTS
|
| | |
| | | Page |
| | | |
| |
| ITEM 1. | | |
| ITEM 1A. | | |
| ITEM 1B. | | |
| ITEM 2. | | |
| ITEM 3. | | |
| ITEM 4. | | |
| |
| ITEM 5. | | |
| ITEM 6. | | |
| ITEM 7. | | |
| ITEM 7A. | | |
| ITEM 8. | | |
| ITEM 9. | | |
| ITEM 9A. | | |
| ITEM 9B. | | |
| |
| ITEM 10. | | |
| ITEM 11. | | |
| ITEM 12. | | |
| ITEM 13. | | |
| ITEM 14. | | |
| |
| ITEM 15. | | |
| |
| | | |
| | | |
| | | |
NOTE ON FORWARD-LOOKING STATEMENTS
This Form 10-K contains forward-looking statements within the meaning of Section 27A of the Securities Act of 1933, as amended (the "Securities Act"), and Section 21E of the Securities Exchange Act of 1934, as amended (the "Exchange Act"). Forward-looking statements are necessarily based on estimates and assumptions that are inherently subject to significant business, economic and competitive uncertainties and contingencies, many of which, with respect to future business decisions, are subject to change. These uncertainties and contingencies can affect actual results and could cause actual results to differ materially from those expressed in any forward-looking statements made by, or on behalf of, us.
In particular, statements using words such as "may", "should", "estimate", "expect", "anticipate", "intends", "believe", "predict", "potential", or words of similar import generally involve forward-looking statements. For example, we may include certain forward-looking statements in "Management's Discussion and Analysis of Financial Condition and Results of Operations" with regard to trends in results, prices, volumes, operations, investment results, margins, combined ratios, reserves, market conditions, risk management and exchange rates. This Form 10-K also contains forward-looking statements with respect to our business and industry, such as those relating to our strategy and management objectives, market standing and product volumes, competition and new entrants in our industry, industry capital, insured losses from loss events, government initiatives and regulatory matters affecting the reinsurance and insurance industries.
In light of the risks and uncertainties inherent in all future projections, the inclusion of forward-looking statements in this report should not be considered as a representation by us or any other person that our objectives or plans will be achieved. Numerous factors could cause our actual results to differ materially from those addressed by the forward-looking statements, including the following:
| |
| • | we are exposed to significant losses from catastrophic events and other exposures that we cover, which we expect to cause significant volatility in our financial results from time to time; |
| |
| • | the frequency and severity of catastrophic events or other events which we cover could exceed our estimates and cause losses greater than we expect; |
| |
| • | the inherent uncertainties in our reserving process, particularly as regards to large catastrophic events and longer tail casualty lines, which uncertainties could increase as the product classes we offer evolve over time; |
| |
| • | the risk of the lowering or loss of any of the financial strength, claims paying or enterprise wide risk management ratings of RenaissanceRe Holdings Ltd. ("RenaissanceRe") or of one or more of our subsidiaries or changes in the policies or practices of the rating agencies; |
| |
| • | risks associated with appropriately modeling, pricing for, and contractually addressing new or potential factors in loss emergence, such as the trend toward potentially significant global warming and other aspects of climate change which have the potential to adversely affect our business, any of which could cause us to underestimate our exposures and potentially adversely impact our financial results; |
| |
| • | risks due to our increasing reliance on a small and potentially decreasing number of insurance and reinsurance brokers for the preponderance of our revenue; |
| |
| • | the risk that our customers may fail to make premium payments due to us (a risk that we believe has increased in certain of our key markets), as well as the risk of failures of our reinsurers, brokers or other counterparties to honor their obligations to us, including as regards to large catastrophic events, and also including their obligations to make third party payments for which we might be liable; |
| |
| • | a contention by the Internal Revenue Service that Renaissance Reinsurance Ltd. ("Renaissance Reinsurance"), or any of our other Bermuda subsidiaries, is subject to U.S. taxation; |
| |
| • | risks associated with implementing our business strategies and initiatives, including risks related to developing or enhancing the operations, controls and other infrastructure necessary in respect of our more recent, new or proposed initiatives, and the risk that we may fail to succeed in our business or financing plans for these initiatives; |
| |
| • | risks relating to operating in a highly competitive environment, which we expect to continue to increase over time from new competition from traditional and non-traditional participants, particularly as capital markets products provide alternatives and replacements for more traditional reinsurance and insurance products, as new entrants or existing competitors attempt to replicate our business model, and as a result of consolidation in the (re)insurance industry; |
| |
| • | risks associated with potential for loss of services of any one of our key senior officers, the risk that we fail to attract or retain the executives and employees necessary to manage our business, or difficulties associated with the transition of members of our senior management team for new or expanded roles necessary to execute our strategic and tactical plans; |
| |
| • | risks relating to adverse legislative developments that could reduce the size of the private markets we serve, or impede their future growth, including proposals to shift United States ("U.S.") catastrophe risks to federal mechanisms; similar proposals at the state level in the U.S., including the risk of new legislation in Florida to expand the reinsurance coverages offered by the Florida Hurricane Catastrophe Fund ("FHCF") and the insurance policies written by state-sponsored Citizens Property Insurance Corporation ("Citizens"), or failing to implement reforms to reduce such coverages; and the risk that new legislation will be enacted in the international markets we serve which might reduce market opportunities in the private sector, weaken our customers or otherwise adversely impact us; |
| |
| • | risks relating to the inability, or delay, in the claims paying ability of Citizens, FHCF or of private market participants in Florida, particularly following a large windstorm or of multiple smaller storms, which we believe would further weaken or destabilize the Florida market and give rise to an unpredictable range of impacts which might be adverse to us, perhaps materially so; |
| |
| • | the risk of potential challenges to the Company's claim of exemption from insurance regulation under certain current laws and the risk of increased global regulation of the insurance and reinsurance industry; |
| |
| • | the passage of federal or state legislation subjecting Renaissance Reinsurance or our other Bermuda subsidiaries to supervision, regulation or taxation in the U.S. or other jurisdictions in which we operate, or increasing the taxation of business ceded to us; |
| |
| • | the risk that there could be regulatory or legislative changes adversely impacting us, as a Bermuda-based company, relative to our competitors, or actions taken by multinational organizations having such an impact; |
| |
| • | risks associated with highly subjective judgments, such as valuing our more illiquid assets, and determining the impairments taken on our investments, all of which impact our reported financial position and operating results; |
| |
| • | risks associated with our investment portfolio, including the risk that our investment assets may fail to yield attractive or even positive results; and the risk that investment managers may breach our investment guidelines, or the inability of such guidelines to mitigate risks arising out of the ongoing period of relative economic weakness; |
| |
| • | risks associated with inflation, which could cause loss costs to increase, and impact the performance of our investment portfolio, thereby adversely impacting our financial position or operating results; |
| |
| • | the risk we might be bound to policyholder obligations beyond our underwriting intent, including due to emerging claims and coverage issues; |
| |
| • | risks associated with counterparty credit risk, including with respect to reinsurance brokers, customers, agents, retrocessionaires, capital providers, parties associated with our investment portfolio and/or our energy trading business, and premiums and other receivables owed to us, which risks we believe continue to be heightened as a result of the ongoing period of relative economic weakness; |
| |
| • | risks associated with our allocation of capital to our weather and energy risk management operations, including the risks that these operations may give rise to unforeseen or unanticipated losses; |
| |
| • | the risk that ongoing or future industry regulatory developments will disrupt our business, or that of our business partners, or mandate changes in industry practices in ways that increase our costs, decrease our revenues or require us to alter aspects of the way we do business; |
| |
| • | acts of terrorism, war or political unrest; |
| |
| • | changes in insurance regulations in the U.S. or other jurisdictions in which we operate, including risks arising out of the Dodd-Frank Wall Street Reform and Consumer Protection Act of 2010 (the "Dodd-Frank Act") or its related rule making or implementation; |
| |
| • | risks that the advent of the new U.S. Federal Insurance Office or other related developments may adversely impact our business, or significantly increase our operating costs; |
| |
| • | operational risks, including system or human failures; |
| |
| • | risks in connection with our management of third party capital; |
| |
| • | changes in economic conditions, including interest rate, currency, equity and credit conditions which could affect our investment portfolio or declines in our investment returns for other reasons which could reduce our profitability and hinder our ability to pay claims promptly in accordance with our strategy, which risks we believe are currently enhanced in light of the current uncertainty regarding U.S. fiscal policy and the ongoing period of relative economic weakness, both globally, particularly in respect of Eurozone countries and companies, and in the U.S.; |
| |
| • | risks relating to our potential failure to comply with covenants in our debt agreements; |
| |
| • | risks relating to the inability of our operating subsidiaries to declare and pay dividends to RenaissanceRe; |
| |
| • | risks that we may require additional capital in the future, particularly after a catastrophic event or to support potential growth opportunities in our business, which may not be available or may be available only on unfavorable terms; |
| |
| • | risks that certain of our new or potentially expanding business lines could have a significant negative impact on our financial results or cause significant volatility in our results for any particular period, including risks relating to our weather and energy risk operations, whose results may be more volatile than we estimate; |
| |
| • | risks arising out of possible changes in the distribution or placement of risks due to increased consolidation of customers or insurance and reinsurance brokers, or from potential changes in their business practices which may be required by future regulatory changes; and |
| |
| • | risks relating to changes in regulatory regimes and/or accounting rules, which could result in significant changes to our financial results, including but not limited to, the European Union ("EU") directive concerning capital adequacy, risk management and regulatory reporting for insurers. |
The factors listed above should not be construed as exhaustive. Certain of these risk factors and others are described in more detail from time to time in our filings with the SEC. We undertake no obligation to release publicly the results of any future revisions we may make to forward-looking statements to reflect events or circumstances after the date hereof or to reflect the occurrence of unanticipated events.
PART I
ITEM 1. BUSINESS
Unless the context otherwise requires, references in this Form 10-K to "RenaissanceRe" refers to RenaissanceRe Holdings Ltd. (the parent company) and the "Company" refers to RenaissanceRe Holdings Ltd. and its subsidiaries, which principally include, but are not limited to, Renaissance Reinsurance, Glencoe Insurance Ltd. ("Glencoe"), Renaissance Reinsurance of Europe ("ROE"), Renaissance Trading Ltd. ("Renaissance Trading"), RenRe Energy Advisors Ltd. ("REAL") and the Company's Lloyd's syndicate, RenaissanceRe Syndicate 1458 ("Syndicate 1458").
We also underwrite reinsurance on behalf of joint ventures, principally including Top Layer Reinsurance Ltd. ("Top Layer Re"), recorded under the equity method of accounting, and DaVinci Reinsurance Ltd. ("DaVinci"). The financial results of DaVinci and DaVinci's parent company, DaVinciRe Holdings Ltd. ("DaVinciRe"), are consolidated in our financial statements. For your convenience, we have included a "Glossary of Selected Insurance and Reinsurance Terms". All dollar amounts referred to in this Form 10-K are in U.S. dollars unless otherwise indicated. Any discrepancies in the tables included herein between the amounts listed and the totals thereof are due to rounding.
OVERVIEW
RenaissanceRe was established in Bermuda in 1993 to write principally property catastrophe reinsurance and today is a leading global provider of reinsurance and insurance coverages and related services. Our aspiration is to be the world's best underwriter of high-severity, low frequency risks. Through our operating subsidiaries, we seek to produce superior returns for our shareholders by being a trusted, long-term partner to our customers for assessing and managing risk, delivering responsive solutions, and keeping our promises. We accomplish this by leveraging our core capabilities of risk assessment and information management, and by investing in our capabilities to serve our customers across the cycles that have historically characterized our markets. Overall, our strategy focuses on superior risk selection, superior customer relationships and superior capital management. We provide value to our customers and joint venture partners in the form of financial security, innovative products, and responsive service. We are known as a leader in paying valid reinsurance claims promptly. We principally measure our financial success through long-term growth in tangible book value per common share plus the change in accumulated dividends, which we believe is the most appropriate measure of our Company's financial performance, and believe we have delivered superior performance in respect of this measure over time.
Our core products include property catastrophe reinsurance, which we primarily write through our principal operating subsidiary Renaissance Reinsurance, Syndicate 1458, and joint ventures, principally DaVinci and Top Layer Re; specialty reinsurance risks written through Renaissance Reinsurance, Glencoe, Syndicate 1458 and DaVinci; and other insurance products primarily written through Syndicate 1458. We believe that we are one of the world's leading providers of property catastrophe reinsurance. We also believe we have a strong position in certain specialty reinsurance lines of business and a growing presence in the Lloyd's marketplace. Our reinsurance and insurance products are principally distributed through intermediaries, with whom we seek to cultivate strong long-term relationships. We continually explore appropriate and efficient ways to address the risk needs of our clients. We have created and managed several alternative capital vehicles in the past and may create additional shorter duration or other risk bearing vehicles in the future.
Since a substantial portion of the reinsurance and insurance we write provides protection from damages relating to natural and man-made catastrophes, our results depend to a large extent on the frequency and severity of such catastrophic events, and the coverages we offer to customers affected by these events. We are exposed to significant losses from these catastrophic events and other exposures that we cover. Accordingly, we expect a significant degree of volatility in our financial results and our financial results may vary significantly from quarter-to-quarter or from year-to-year, based on the level of insured catastrophic losses occurring around the world.
Our revenues are principally derived from three sources: 1) net premiums earned from the reinsurance and insurance policies we sell; 2) net investment income and realized and unrealized gains from the investment of our capital funds and the investment of the cash we receive on the policies which we sell; and 3) other
income received from our joint ventures, advisory services, weather and energy risk management operations and various other items.
Our expenses primarily consist of: 1) net claims and claim expenses incurred on the policies of reinsurance and insurance we sell; 2) acquisition costs which typically represent a percentage of the premiums we write; 3) operating expenses which primarily consist of personnel expenses, rent and other operating expenses; 4) corporate expenses which include certain executive, legal and consulting expenses, costs for research and development, and other miscellaneous costs, including those associated with operating as a publicly traded company; 5) redeemable noncontrolling interest - DaVinciRe, which represents the interest of third parties with respect to the net income (loss) of DaVinciRe; and 6) interest and dividend costs related to our debt and preference shares. We are also subject to taxes in certain jurisdictions in which we operate; however, since the majority of our income is currently earned in Bermuda, a non-taxable jurisdiction, the tax impact to our operations has historically been minimal.
The operating results, also known as the underwriting results, of an insurance or reinsurance company are discussed frequently by reference to its net claims and claim expense ratio, underwriting expense ratio, and combined ratio. The net claims and claim expense ratio is calculated by dividing net claims and claim expenses incurred by net premiums earned. The underwriting expense ratio is calculated by dividing underwriting expenses (acquisition expenses and operational expenses) by net premiums earned. The combined ratio is the sum of the net claims and claim expense ratio and the underwriting expense ratio. A combined ratio below 100% generally indicates profitable underwriting prior to the consideration of investment income. A combined ratio over 100% generally indicates unprofitable underwriting prior to the consideration of investment income. We also discuss our net claims and claim expense ratio on an accident year basis. This ratio is calculated by taking net claims and claim expenses, excluding development on net claims and claim expenses from events that took place in prior fiscal years, divided by net premiums earned.
As described in more detail below under "Segments", our reportable segments currently include: (1) Reinsurance, which includes catastrophe reinsurance, specialty reinsurance and certain property catastrophe and specialty joint ventures and (2) Lloyd's, which includes reinsurance and insurance business written through Syndicate 1458. As of December 31, 2012, we undertook a review of our reportable segments and concluded that our former Insurance segment no longer met the quantitative thresholds defined in Financial Accounting Standards Board ("FASB") Accounting Standards Codification ("ASC") Topic Segment Reporting. These operations are not actively involved in pursuing business opportunities and are in run-off; therefore we determined they no longer require, nor warrant, separate disclosure as a reportable segment. As such, the results of operations of the former Insurance segment have been included in our Other category as noted below, and all prior periods presented herein have been reclassified to conform with the current year presentation. Our Other category primarily reflects our: strategic investments; weather and energy risk management operations; investments unit; corporate expenses, capital servicing costs and noncontrolling interests; results of our discontinued operations; and now, in addition, the remnants of our Bermuda-based insurance operations not sold pursuant to the Stock Purchase Agreement, as defined herein, with QBE Holdings, Inc. ("QBE").
CORPORATE STRATEGY
Our mission is to produce superior returns for our shareholders by being a trusted, long-term partner to our customers for assessing and managing risk, delivering responsive solutions, and keeping our promises. Our aspiration is to be the world's best underwriter of high-severity, low frequency risks. Our vision is to be a leader in select financial services through our people and culture, expertise in risk, and passion for exceeding customers' expectations.
Since our inception, we have cultivated and endeavor to preserve certain competitive advantages that position us to fulfill our strategic objectives. We believe these competitive advantages include:
Superior Risk Selection. We seek to build a portfolio of risks that produces an attractive return on utilized capital. We develop a perspective of the risk in each business opportunity using both our underwriters' expertise and sophisticated risk selection techniques including computer models and databases, such as Renaissance Exposure Management System ("REMS©"). We pursue a disciplined approach to underwriting and select only those risks that we believe will produce a portfolio with an attractive return,
subject to prudent risk constraints. We manage our portfolio of risks dynamically, both within sub-portfolios and across the Company.
Superior Customer Relationships. We believe our modeling and technical expertise, and the risk management products that we provide our customers, has enabled us to become a provider of first choice in many lines of business to our customers worldwide. We seek to offer stable, predictable, and consistent risk-based pricing and a prompt turnaround on our claims.
Superior Capital Management. We seek to write as much attractively priced business as is available to us and then manage our capital accordingly. We generally seek to raise capital when we forecast an increased demand in the market, at times by accessing capital through joint ventures or other structures, and seek to return capital to our shareholders or joint venture investors when the demand for our coverages appears to decline and when we believe a return of capital would be beneficial to our shareholders or joint venture investors. In using joint ventures, we intend to leverage our access to business and our underwriting capabilities on an efficient capital base, develop fee income, generate profit commissions and diversify our portfolio. We routinely evaluate and review potential joint venture opportunities and strategic investments.
We believe we are well positioned to fulfill these objectives by virtue of the experience and skill of our management team, our significant financial strength, and our strong relationships with brokers and customers. In addition, we believe our superior service, our proprietary modeling technology, and our extensive business relationships, which have enabled us to become a leader in the property catastrophe reinsurance market, will be instrumental in allowing us to achieve our strategic objectives. In particular, we believe our strategy, high performance culture, and commitment to our customers and joint venture partners help us to differentiate ourselves by offering specialized services and products at times and in markets where capacity and alternatives may be limited.
SEGMENTS
As discussed above, our reportable segments currently include: (1) Reinsurance, which includes catastrophe reinsurance, specialty reinsurance and certain property catastrophe and specialty joint ventures and (2) Lloyd's, which includes reinsurance and insurance business written through Syndicate 1458. In addition, our Other category primarily reflects our: strategic investments; weather and energy risk management operations; investments unit; corporate expenses, capital servicing costs and noncontrolling interests; results of our discontinued operations; and now, in addition, the remnants of our Bermuda-based insurance operations not sold pursuant to the Stock Purchase Agreement with QBE.
For the year ended December 31, 2012, our Reinsurance and Lloyd's segment accounted for 89.8% and 10.2%, respectively, of our total consolidated gross premiums written. We currently expect contributions from our Lloyd's segment to increase over time, on both an absolute and relative basis, although we cannot assure you we will succeed in meeting this goal. Operating results relating to our segments is included in "Item 7. Management's Discussion and Analysis of Financial Condition and Results of Operations."
Reinsurance
Our Reinsurance segment has two main units and is managed by our President and Global Chief Underwriting Officer, who leads a team of underwriters, risk modelers and other industry professionals, who have access to our proprietary risk management, underwriting and modeling resources and tools.
| |
| (1) | Property catastrophe reinsurance, principally written for our own account, and for DaVinci, is our traditional core business. We believe we are one of the world's leading providers of this coverage, based on total catastrophe gross premiums written. This coverage protects against large natural catastrophes, such as earthquakes, hurricanes and tsunamis, as well as claims arising from other natural and man-made catastrophes such as winter storms, freezes, floods, fires, wind storms, tornadoes, explosions and acts of terrorism. We offer this coverage to insurance companies and other reinsurers primarily on an excess of loss basis. This means that we begin paying when our customers' claims from a catastrophe exceed a certain retained amount. |
| |
| (2) | Specialty reinsurance, also principally written for our own account and for DaVinci, covering certain targeted classes of business where we believe we have a sound basis for underwriting and pricing the risk that we assume. Our portfolio includes various classes of business, such as catastrophe |
exposed workers' compensation, surety, terrorism, energy, aviation, crop, political risk, trade credit, financial, mortgage guarantee, catastrophe-exposed personal lines property, casualty clash, certain other casualty lines and other specialty lines of reinsurance that we collectively refer to as specialty reinsurance. We believe that we are seen as a market leader in certain of these classes of business. We are seeking to expand our specialty reinsurance operations over time, although we cannot assure you that we will do so, particularly in light of current and forecasted market conditions. Our specialty reinsurance business is typically significantly impacted by a comparably small number of relatively large transactions.
We believe the expertise of our underwriting and modeling team and our proprietary analytic tools, together with superior customer service, provide us with a significant competitive advantage.
Our portfolio of business has continued to be increasingly characterized by relatively large transactions with ceding companies with whom we do business, although no current relationship exceeds 10% of our gross premiums written. Accordingly, our gross premiums written are subject to significant fluctuations depending on our success in maintaining or expanding our relationships with these large customers. We market our reinsurance products worldwide exclusively through brokers, whose market has become extremely consolidated in recent years. In 2012, three brokerage firms accounted for 84.6% of our Reinsurance segment gross premiums written. We believe that recent market dynamics, and trends in our industry in respect of potential future consolidation, have increased our exposure to the risks of broker, client and counterparty concentration.
The following table shows our total Reinsurance segment gross premiums written split between catastrophe and specialty reinsurance, respectively: |
| | | | | | | | | | | | | |
| | | | | | | | |
| | Year ended December 31, | 2012 | | 2011 | | 2010 | |
| | (in thousands) | | | | | | |
| | Renaissance catastrophe premiums | $ | 733,963 |
| | $ | 742,236 |
| | $ | 630,080 |
| |
| | Renaissance specialty premiums | 207,387 |
| | 144,192 |
| | 126,848 |
| |
| | Total Renaissance premiums | 941,350 |
| | 886,428 |
| | 756,928 |
| |
| | DaVinci catastrophe premiums | 448,244 |
| | 435,060 |
| | 364,153 |
| |
| | DaVinci specialty premiums | 2,500 |
| | 1,699 |
| | 2,538 |
| |
| | Total DaVinci premiums | 450,744 |
| | 436,759 |
| | 366,691 |
| |
| | Total catastrophe unit premiums (1) | 1,182,207 |
| | 1,177,296 |
| | 994,233 |
| |
| | Total specialty unit premiums | 209,887 |
| | 145,891 |
| | 129,386 |
| |
| | Total Reinsurance segment premiums | $ | 1,392,094 |
| | $ | 1,323,187 |
| | $ | 1,123,619 |
| |
| | | | | | | | |
| |
| (1) | Total catastrophe premiums written includes $Nil, $Nil and $9.5 million of gross premiums written assumed from our Other category for the years ended December 31, 2012, 2011 and 2010, respectively. |
Property Catastrophe Reinsurance
We believe we are one of the largest providers of property catastrophe reinsurance in the world, based on our total catastrophe gross premiums written. Our principal property catastrophe reinsurance products include catastrophe excess of loss reinsurance and excess of loss retrocessional reinsurance as described below.
Catastrophe Excess of Loss Reinsurance. We principally write catastrophe reinsurance on an excess of loss basis, which means we provide coverage to our insureds when aggregate claims and claim expenses from a single occurrence of a covered peril exceed the attachment point specified in a particular contract. Under these contracts, we indemnify an insurer for all or a specified portion of the losses on underlying insurance policies in excess of a specified amount, and up to an amount per loss specified in the contract. The coverage provided under excess of loss reinsurance contracts may be on a worldwide basis or limited in scope to selected geographic areas. Coverage can also vary from "all property" perils to limited coverage on selected perils, such as "earthquake only" coverage.
Excess of Loss Retrocessional Reinsurance. We also write retrocessional reinsurance contracts that provide property catastrophe coverage to other reinsurers or retrocedants. In providing retrocessional reinsurance, we focus on property catastrophe retrocessional reinsurance, which covers the retrocedant on
an excess of loss basis when aggregate claims and claim expenses from a single occurrence of a covered peril and from a multiple number of reinsureds exceed a specified attachment point. The coverage provided under excess of loss retrocessional contracts may be on a worldwide basis or limited in scope to selected geographic areas. Coverage can also vary from "all property" perils to limited coverage on selected perils, such as "earthquake only" coverage. The information available to retrocessional underwriters concerning the original primary risk can be less precise than the information received from primary companies directly. Moreover, exposures from retrocessional business can change within a contract term as the underwriters of a retrocedant alter their book of business after retrocessional coverage has been bound.
Our property catastrophe reinsurance contracts are generally "all risk" in nature. Our most significant exposure is to losses from earthquakes and hurricanes and other windstorms, although we are also exposed to claims arising from other catastrophes, such as tsunamis, freezes, floods, fires, tornadoes, explosions and acts of terrorism in connection with the coverages we provide. Our predominant exposure under such coverage is to property damage. However, other risks, including business interruption and other non-property losses, may also be covered under our property reinsurance contracts when arising from a covered peril. We offer our coverages on a worldwide basis. Because of the wide range of possible catastrophic events to which we are exposed, including the size of such events and because of the potential for multiple events to occur in the same time period, our catastrophe reinsurance business is volatile and our results of operations reflect this volatility. Further, our financial condition may be impacted by this volatility over time or at any point in time. The effects of claims from one or a number of severe catastrophic events could have a material adverse effect on us. We expect that increases in the values and concentrations of insured property and the effects of inflation will increase the severity of such occurrences in the future.
Insurance-Linked Securities. We also invest in insurance-linked securities. Insurance-linked securities are generally privately placed fixed income securities as to which all or a portion of the repayment of the principal is linked to catastrophic events; for example, the occurrence of one or more hurricanes or earthquakes producing industry losses exceeding certain specified thresholds. We underwrite, model, evaluate and monitor these securities using similar tools and techniques used to evaluate our more traditional property catastrophe reinsurance business assumed. In addition, we may enter into derivative transactions, such as total return swaps, that are based on or referenced to underlying insurance-linked securities. Based on an evaluation of the specific features of each insurance-linked security, we account for these securities as reinsurance or at fair value, as applicable, in accordance with U.S. generally accepted accounting principles ("GAAP"). In addition, in future periods we may utilize the growing market for insurance-linked securities to expand our ceded reinsurance buying if we find the pricing and terms of such coverage attractive.
We seek to moderate the volatility of our risk portfolio through superior risk selection, diversification and the purchase of retrocessional coverages and other protections. In furtherance of our strategy, we may increase or decrease our presence in the catastrophe reinsurance business based on market conditions and our assessment of risk-adjusted pricing adequacy. We frequently seek to purchase reinsurance or other protection for our own account to further reduce the financial impact that a large catastrophe or a series of catastrophes could have on our results.
As a result of our position in the market and reputation for superior customer relationships, we believe we have superior access to reinsurance business we view as desirable compared to the market as a whole. As described above, we use our proprietary underwriting tools and guidelines to attempt to construct an attractive portfolio from these opportunities. We dynamically model policy submissions against our current in-force underwriting portfolio, comparing our estimate of the modeled expected returns of the contract against the amount of capital that we allocate to the contract, based on our estimate of its marginal impact on our overall risk portfolio. At times, our approach to portfolio management has resulted and may result in the future in our having a relatively large market share of catastrophe reinsurance exposure in a particular geographic region, such as Florida where we historically have had a relatively large percentage of coverage exposures, or to a particular peril, such as U.S. hurricane risk, where we believe our analytical skills, claims paying history, large capacity, strong ratings and other attributes offer a competitive advantage, or where the risks or class of risks otherwise adds efficiency to our portfolio. Conversely, from time to time we may have a disproportionately low market share in certain regions or perils where we believe our capital would be less effectively deployed.
Specialty Reinsurance
We write a number of lines of reinsurance other than property catastrophe, such as catastrophe exposed workers' compensation, surety, terrorism, energy, aviation, crop, political risk, trade credit, financial, mortgage guarantee, catastrophe-exposed personal lines property, casualty clash, certain other casualty lines and other specialty lines of reinsurance that we collectively refer to as specialty reinsurance. We believe that we are seen as a market leader in certain of these classes of business. As with our catastrophe business, our team of experienced professionals seeks to underwrite these lines using a disciplined underwriting approach and sophisticated analytical tools. We are seeking to expand our specialty reinsurance operations over time, although we cannot assure you that we will do so, particularly in light of current and forecasted market conditions.
We generally target lines of business where we believe we can adequately quantify the risks assumed and where potential losses could be characterized as low frequency and high severity, similar to our catastrophe reinsurance coverages. However, we also provide other coverage where we believe our underwriting is robust and the market is attractive, and may grow in these lines over time. We also seek to identify market dislocations and write new lines of business whose risk and return characteristics are estimated to exceed our hurdle rates. Furthermore, we also seek to manage the correlations of this business with our overall portfolio, including our aggregate exposure to single and aggregated catastrophe events. We believe that our underwriting and analytical capabilities have positioned us well to manage our specialty reinsurance business.
We offer our specialty reinsurance products principally on an excess of loss basis, as described above with respect to our catastrophe reinsurance products, and also provide some proportional coverage. In a proportional reinsurance arrangement (also referred to as quota share reinsurance and pro-rata reinsurance), the reinsurer shares a proportional part of the original premiums and losses of the reinsured. The reinsurer pays the cedant a commission which is generally based on the cedant's cost of acquiring the business being reinsured (including commissions, premium taxes, assessments and miscellaneous administrative expenses) and may also include a profit factor. Our proportional reinsurance product offerings have grown in recent periods and may continue to grow in the future. These products frequently include tailored features such as limits or sub-limits which we believe help us manage our exposures. Any liability exceeding, or otherwise not subject to, such limits reverts to the cedant. As with our catastrophe reinsurance business, our specialty reinsurance frequently provides coverage for relatively large limits or exposures, and thus we are subject to potential significant claims volatility.
We generally seek to write significant lines on our specialty reinsurance treaties. As a result of our financial strength, we have the ability to offer significant capacity and, for select risks, we have made available significant limits. We believe these capabilities, the strength of our specialty reinsurance underwriting team, and our demonstrated ability and willingness to pay valid claims are competitive advantages of our specialty reinsurance business. While we believe that these and other initiatives will support growth in our specialty reinsurance unit, we intend to continue to apply our disciplined underwriting approach which, together with currently prevailing market conditions, is likely to temper such growth in current and near term-term periods.
Ventures
We pursue a number of other opportunities through our ventures unit, which has responsibility for creating and managing our joint ventures, executing customized reinsurance transactions to assume or cede risk and managing certain investments directed at classes of risk other than catastrophe reinsurance. We also provide customized weather and energy risk management solutions to various customers on a worldwide basis.
Property Catastrophe Managed Joint Ventures. We actively manage property catastrophe-oriented joint ventures, which provide us with an additional presence in the market, enhance our client relationships and generate fee income and profit commissions. These joint ventures allow us to leverage our access to business and our underwriting capabilities on a larger capital base. Currently, our principal joint ventures include Top Layer Re and DaVinci. Renaissance Underwriting Managers, Ltd. ("RUM"), a wholly owned subsidiary of the Company, acts as the exclusive underwriting manager for each of these joint ventures.
DaVinci was established in 2001 and principally writes property catastrophe reinsurance and certain low frequency, high severity specialty reinsurance lines of business on a global basis. In general, we seek to
construct for DaVinci a property catastrophe reinsurance portfolio with risk characteristics similar to those of Renaissance Reinsurance's property catastrophe reinsurance portfolio and a portfolio of certain lines of specialty reinsurance such as terrorism and catastrophe exposed workers' compensation. In accordance with DaVinci's underwriting guidelines, it can only participate in business that is underwritten by Renaissance Reinsurance. We maintain majority voting control of DaVinciRe and, accordingly, consolidate the results of DaVinciRe into our consolidated results of operations and financial position. We seek to manage DaVinci's capital efficiently over time in light of the market opportunities and needs we perceive and believe we are able to serve. Our ownership in DaVinciRe was 30.8% at December 31, 2012 (2011 - 42.8%). During January 2013 DaVinciRe redeemed shares from certain DaVinciRe shareholders, including us, while certain other existing DaVinciRe shareholders purchased additional shares in DaVinciRe. Subsequent to the above transactions, our ownership in DaVinciRe increased to 32.9% effective January 1, 2013.
We expect our ownership in DaVinciRe to fluctuate over time. See "Item 7. Management's Discussion and Analysis of Financial Condition and Results of Operations, Capital Resources" for additional information with respect of DaVinci.
Top Layer Re was established in 1999 and writes high excess non-U.S. property catastrophe reinsurance. Top Layer Re is owned 50% by State Farm Mutual Automobile Insurance Company ("State Farm") and 50% by Renaissance Reinsurance. State Farm provides $3.9 billion of stop loss reinsurance coverage to Top Layer Re. We account for our equity ownership in Top Layer Re under the equity method of accounting and our proportionate share of its results is reflected in equity in earnings (losses) of other ventures in our consolidated statements of operations.
Effective January 1, 2012, we formed and launched a managed joint venture, Upsilon Reinsurance Ltd. ("Upsilon Re"), a Bermuda domiciled special purpose insurer ("SPI"), to provide additional capacity to the worldwide aggregate and per-occurrence retrocessional property catastrophe excess of loss market for the 2012 underwriting year. The original business was written by ROE, a wholly owned subsidiary of RenaissanceRe, and included $37.4 million of gross premiums written incepting between January 1, 2012 and June 1, 2012. A portion of this business was in turn ceded to Upsilon Re under a fully-collateralized retrocessional reinsurance contract, effective January 1, 2012. In conjunction with the formation and launch of Upsilon Re, $16.8 million of non-voting Class B shares were sold to external investors, and we invested $48.8 million in Upsilon Re's non-voting Class B shares, representing a 74.5% ownership interest in Upsilon Re. The Class B shareholders participate in substantially all of the profits or losses of Upsilon Re while the Class B shares remain outstanding. The holders of Class B shares indemnify Upsilon Re against losses relating to insurance risk. In addition, another third party investor supplied $17.6 million of capital through a reinsurance participation (a third party quota share agreement) with ROE alongside Upsilon Re. Inclusive of the reinsurance participation, we have a 61.4% participation in the original risks assumed by ROE related to Upsilon Re. During February 2013, Upsilon Re redeemed a portion of its outstanding third party non-voting Class B shares for $20.5 million as a result of the scheduled expiration of certain risks underwritten by Upsilon Re, subject to a holdback for development of claims and claim expenses. Following the redemption, third-party non-voting Class B Shares with a GAAP book value of $2.2 million as at December 31, 2012, remained outstanding. In addition, the Company has authorized the release of $21.9 million of collateral to a third party investor who participated in risks underwritten by ROE related to Upsilon Re through a reinsurance participation. Both Upsilon Re and the reinsurance participation are managed by RUM in return for an expense override, as well as a potential underwriting profit commission. Upsilon Re is considered a variable interest entity ("VIE") and we are considered the primary beneficiary. As a result, Upsilon Re is consolidated by the Company and all significant inter-company transactions have been eliminated.
Effective June 1, 2012, we formed and launched a managed joint venture, Timicuan Reinsurance III Limited ("Tim Re III"), a Bermuda domiciled SPI, to provide collateralized reinsurance in respect of a portfolio of Florida reinstatement premium protection ("RPP") contracts. The original business was written by Renaissance Reinsurance and DaVinci, and included $41.1 million of gross premiums written incepting June 1, 2012, of which Renaissance Reinsurance and DaVinci ceded $37.7 million to Tim Re III under a fully-collateralized reinsurance contract. In conjunction with the formation and launch of Tim Re III, $44.8 million of Tim Re III's non-voting Class B shares were sold to external investors. Additionally, $10.3 million of the non-voting Class B shares were acquired by us, representing an 18.6% ownership interest in Tim Re III. The Class B shareholders participate in substantially all of the profits or losses of Tim Re III while the
Class B shares remain outstanding. The holders of Class B shares indemnify Tim Re III against losses relating to insurance risk. In addition, another third party investor supplied $5.2 million of capital through a reinsurance participation with Renaissance Reinsurance and DaVinci, alongside Tim Re III. Inclusive of the reinsurance participation, we have a 17.1% participation in the original risks assumed by Renaissance Reinsurance and DaVinci related to Tim Re III. Both Tim Re III and the reinsurance participation are managed by RUM in return for a potential underwriting profit commission. Tim Re III is considered a VIE and we are considered the primary beneficiary. As a result, Tim Re III is consolidated by the Company and all significant inter-company transactions have been eliminated.
Effective January 1, 2013, we formed and launched a managed joint venture, Upsilon Reinsurance II Ltd. ("Upsilon Re II"), a Bermuda domiciled SPI, to provide additional capacity to the worldwide aggregate and per-occurrence retrocessional property catastrophe excess of loss market for the 2013 underwriting year. Original business was written directly by Upsilon Re II and included $53.5 million of gross premiums written incepting January 1, 2013 under fully-collateralized reinsurance contracts. In conjunction with the formation and launch of Upsilon Re II, $61.0 million of Upsilon Re II non-voting Class B shares were sold to external investors. Additionally, $76.4 million of the non-voting Class B shares were acquired by us, representing a 55.6% ownership interest in Upsilon Re II. The Class B shareholders participate in substantially all of the profits or losses of Upsilon Re II while the Class B shares remain outstanding. The holders of Class B shares indemnify Upsilon Re II against losses relating to insurance risk. In addition, another third party investor supplied $17.5 million of capital through an insurance contract with the Company related to Upsilon Re II's reinsurance portfolio. Inclusive of the insurance contract, we have a 42.9% participation in the original risks assumed by Upsilon Re II. Both Upsilon Re II and the insurance contract are managed by RUM in return for an expense override, as well as a potential underwriting profit commission. Upsilon Re II is considered a VIE and we are considered the primary beneficiary. As a result, Upsilon Re II will be consolidated by the Company and all significant inter-company transactions will be eliminated.
We currently have an ownership interest in Upsilon Re, Tim Re III and Upsilon Re II which we expect will change over time, perhaps materially so, and we may also elect to underwrite additional risks within Upsilon Re II and utilize this entity, or newly formed joint ventures, to write business in future periods. We cannot assure you that additional opportunities to grow the business we have accessed through these joint ventures, will be realized.
Ventures works on a range of other customized reinsurance and financing transactions. For example, we have participated in and continuously analyze other attractive opportunities in the market for insurance-linked securities and derivatives. We believe our products contain a number of customized features designed to fit the needs of our partners, as well as our risk management objectives.
Weather and Energy Risk Management Operations. We provide weather and energy related risk management solutions and financial products primarily through Renaissance Trading and REAL. Renaissance Trading sells financial products primarily to address weather risks, and engage in certain weather, energy and commodity derivatives trading activities, including trading securities and derivatives linked to energy, commodities, weather, other natural phenomena, and/or products or indices linked in part to such phenomena. Certain of these trading activities require the physical delivery of energy-related commodities, including natural gas. While our activities focus on products that allow various energy, utility and other customers to manage their exposures to energy related commodities, we expect our own results in this area to be volatile over time. We continually seek new markets and relationships for our weather and energy risk products, including continued leveraging of strategic affiliations and ceding risk through similar arrangements where we deem appropriate. Although there can be no assurances, it is possible that our results from these activities will increase on an absolute or relative basis over time, or in respect of any other period. As with our reinsurance operations, we seek to obtain capital support, volatility protection and other enhancements to the capital we deploy in respect of this business. However, we cannot assure you we will succeed in these initiatives in the future, or in maintaining the capital support and other related transactions currently in effect.
Strategic Investments. Ventures also pursues strategic investments where, rather than assuming exclusive management responsibilities ourselves, we instead partner with other market participants. These investments are directed at classes of risk other than catastrophe, and at times may also be directed at non-insurance risks. We find these investments attractive both for their expected returns, and also because they provide us diversification benefits and information and exposure to other aspects of the market.
Examples of these investments include our investments in Tower Hill Insurance Group, LLC. ("THIG"), Tower Hill Holdings, Inc. ("Tower Hill") and Tower Hill Signature Insurance Holdings, Inc. ("Tower Hill Signature"), (collectively, the "Tower Hill Companies"), Angus Partners, LLC. ("Angus"), Angus Fund L.P. (the "Angus Fund") and Essent Group Ltd. ("Essent"). THIG is a managing general agency specializing in insurance coverage for site built and manufactured homes. Subsidiaries of THIG, namely Tower Hill Claims Services, LLC, and Tower Hill Claims Management, LLC, provide claim adjustment services through exclusive agreements with THIG. Tower Hill is an insurance holding company. The subsidiaries of Tower Hill, along with Tower Hill Signature, write residential property insurance. We invested in the Tower Hill Companies, which operate primarily in the State of Florida, to expand our core platforms by obtaining ownership in an additional distribution channel for the Florida homeowners market and to enhance our relationships with other stakeholders. Angus and entities in the Angus Fund's investment portfolio provide commodity related risk management products to third party customers. Renaissance Trading is the primary counterparty to Angus Partner's energy risk management hedging activities. Essent provides mortgage insurance and reinsurance coverage for mortgages located in the U.S.
Business activities that appear in our consolidated underwriting results, such as DaVinci and certain reinsurance transactions, are included in our Reinsurance segment results; the results of our investments, such as Top Layer Re, our weather and energy related activities and other ventures are included in the Other category of our segment results.
Lloyd's Segment
Our Lloyd's segment includes insurance and reinsurance business written for our own account through Syndicate 1458. Syndicate 1458 commenced business by writing certain lines of insurance and reinsurance business incepting on or after June 1, 2009. The syndicate was established to enhance our underwriting platform by providing access to Lloyd's extensive distribution network and worldwide licenses. RenaissanceRe Corporate Capital (UK) Limited ("RenaissanceRe CCL"), an indirect wholly owned subsidiary of the Company, is the sole corporate member of Syndicate 1458. RenaissanceRe Syndicate Management Ltd. ("RSML"), a wholly owned subsidiary of RenaissanceRe, is the managing agent for Syndicate 1458. We anticipate that Syndicate 1458's absolute and relative contributions to our consolidated results of operations will have a meaningful impact over time, although we cannot assure you we will succeed in executing our growth strategy in respect of Syndicate 1458, or that its results will be favorable.
Syndicate 1458 generally targets lines of business where we believe we can adequately quantify the risks assumed. We also seek to identify market dislocations and to write new lines of business whose risk and return characteristics are attractive and add to our portfolio of risks. Furthermore, we seek to manage the correlations of this business with our overall portfolio, including our aggregate exposure to single and aggregated catastrophe events. We believe that our underwriting and analytical capabilities have positioned us well to manage this business.
We offer a range of property and casualty insurance and reinsurance products including, but not limited to, direct and facultative property, property catastrophe, agriculture, medical malpractice, general liability, professional indemnity, political risk and trade credit. We may seek to expand our coverages and capacity over time. As with our catastrophe and specialty reinsurance business, we frequently provide coverage for relatively large limits or exposures, and thus we are subject to potential significant claims volatility.
Other
Our Other category primarily includes the results of: (1) our share of strategic investments in certain markets we believe offer attractive risk-adjusted returns or where we believe our investment adds value, and where, rather than assuming exclusive management responsibilities ourselves, we partner with other market participants; (2) our weather and energy risk management operations primarily through Renaissance Trading and REAL; (3) our investment unit which manages and invests the funds generated by our consolidated operations; (4) corporate expenses, capital services costs and noncontrolling interests; (5) the results of our discontinued operations; and (6) as described in more details above, the remnants of our Bermuda-based insurance operations not sold pursuant to the Stock Purchase Agreement with QBE.
GEOGRAPHIC BREAKDOWN
Our exposures are generally diversified across geographic zones, but are also a function of market conditions and opportunities. Our largest exposure has historically been to the U.S. and Caribbean property catastrophe market, which represented 63.4% of the Company's gross premiums written for the year ended December 31, 2012. A significant amount of our U.S. and Caribbean premium provides coverage against windstorms, mainly U.S. Atlantic hurricanes, as well as earthquakes and other natural and man-made catastrophes. The following table sets forth the percentage of our gross premiums written allocated to the territory of coverage exposure: |
| | | | | | | | | | | | | | | | | | | | | | |
| | | | | | | | | | | | | | |
| | | 2012 | | 2011 | | 2010 | |
| | Year ended December 31, | Gross Premiums Written | | Percentage of Gross Premiums Written | | Gross Premiums Written | | Percentage of Gross Premiums Written | | Gross Premiums Written | | Percentage of Gross Premiums Written | |
| | (in thousands, except percentages) | | | | | | | | | | | |
| | Catastrophe | | | | | | | | | | | | |
| | U.S. and Caribbean | $ | 857,740 |
| | 55.3 | % | | $ | 786,721 |
| | 54.8 | % | | $ | 720,250 |
| | 61.8 | % | |
| | Worldwide (excluding U.S.) (1) | 139,265 |
| | 9.0 | % | | 164,112 |
| | 11.4 | % | | 113,270 |
| | 9.7 | % | |
| | Worldwide | 81,595 |
| | 5.3 | % | | 124,797 |
| | 8.7 | % | | 65,500 |
| | 5.6 | % | |
| | Japan | 43,238 |
| | 2.8 | % | | 49,021 |
| | 3.4 | % | | 26,188 |
| | 2.2 | % | |
| | Europe | 37,113 |
| | 2.4 | % | | 31,888 |
| | 2.2 | % | | 59,480 |
| | 5.1 | % | |
| | Australia and New Zealand | 18,578 |
| | 1.2 | % | | 16,818 |
| | 1.2 | % | | 6,269 |
| | 0.5 | % | |
| | Other | 4,678 |
| | 0.3 | % | | 3,939 |
| | 0.3 | % | | 3,276 |
| | 0.3 | % | |
| | Total catastrophe | 1,182,207 |
| | 76.3 | % | | 1,177,296 |
| | 82.0 | % | | 994,233 |
| | 85.2 | % | |
| | Specialty | | | | | | | | | | | | |
| | Worldwide | 96,081 |
| | 6.2 | % | | 91,032 |
| | 6.3 | % | | 59,636 |
| | 5.2 | % | |
| | U.S. and Caribbean | 69,070 |
| | 4.4 | % | | 49,832 |
| | 3.5 | % | | 57,461 |
| | 4.9 | % | |
| | Australia and New Zealand | 28,307 |
| | 1.8 | % | | 792 |
| | 0.1 | % | | 8,934 |
| | 0.8 | % | |
| | Europe | 16,429 |
| | 1.1 | % | | 3,595 |
| | 0.3 | % | | 2,786 |
| | 0.2 | % | |
| | Other | — |
| | — | % | | 640 |
| | — | % | | 569 |
| | — | % | |
| | Total specialty | 209,887 |
| | 13.5 | % | | 145,891 |
| | 10.2 | % | | 129,386 |
| | 11.1 | % | |
| | Total Reinsurance | 1,392,094 |
| | 89.8 | % | | 1,323,187 |
| | 92.2 | % | | 1,123,619 |
| | 96.3 | % | |
| | Lloyd's | | | | | | | | | | | | |
| | Worldwide | 75,132 |
| | 4.8 | % | | 47,605 |
| | 3.3 | % | | 16,207 |
| | 1.4 | % | |
| | U.S. and Caribbean | 57,332 |
| | 3.7 | % | | 48,435 |
| | 3.4 | % | | 43,178 |
| | 3.7 | % | |
| | Europe | 14,456 |
| | 0.9 | % | | 8,044 |
| | 0.6 | % | | 3,174 |
| | 0.3 | % | |
| | Worldwide (excluding U.S.) (1) | 6,064 |
| | 0.4 | % | | 238 |
| | — | % | | 1,049 |
| | 0.1 | % | |
| | Australia and New Zealand | 2,152 |
| | 0.1 | % | | 2,060 |
| | 0.1 | % | | 91 |
| | — | % | |
| | Other | 4,851 |
| | 0.3 | % | | 5,202 |
| | 0.4 | % | | 2,510 |
| | 0.2 | % | |
| | Total Lloyd's | 159,987 |
| | 10.2 | % | | 111,584 |
| | 7.8 | % | | 66,209 |
| | 5.7 | % | |
| | Other category (2) | — |
| | — | % | | 282 |
| | — | % | | 2,585 |
| | 0.3 | % | |
| | Eliminations (3) | (490 | ) | | — | % | | (77 | ) | | — | % | | (27,118 | ) | | (2.3 | )% | |
| | Total gross premiums written | $ | 1,551,591 |
| | 100.0 | % | | $ | 1,434,976 |
| | 100.0 | % | | $ | 1,165,295 |
| | 100.0 | % | |
| | | | | | | | | | | | | | |
| |
| (1) | The category "Worldwide (excluding U.S.)" consists of contracts that cover more than one geographic region (other than the U.S.). The exposure in this category for gross premiums written to date is predominantly from Europe and Japan. |
| |
| (2) | The Other category consists of contracts that are primarily exposed to U.S. risks. |
| |
| (3) | Represents $0.5 million of gross premiums ceded from the Reinsurance segment to the Lloyd's segment, for the year ended December 31, 2012 (2011 - $0.1 million of gross premiums ceded from the Reinsurance segment to the Lloyd's segment, 2010 - $9.5 million, $17.4 million and $0.2 million of gross premiums ceded from the Other category to the Reinsurance segment, from the Other category to the Lloyd's segment and from the Reinsurance segment to the Lloyd's segment, respectively). |
NEW BUSINESS
From time to time we consider diversification into new ventures, either through organic growth, the formation of new joint ventures, or the acquisition of or the investment in other companies or books of business of other companies. This potential diversification includes opportunities to write targeted, additional classes of risk-exposed business, both directly for our own account and through possible new joint venture opportunities. We also regularly evaluate potential strategic opportunities that we believe might utilize our skills, capabilities, proprietary technology and relationships to support possible expansion into further risk-related coverages, services and products. Generally, we focus on underwriting or trading risks where reasonably sufficient data may be available, and where our analytical abilities may provide us a competitive advantage, in order for us to seek to model estimated probabilities of losses and returns in accordance with our approach in respect of our then current portfolio of risks.
We regularly review potential strategic transactions that might improve our portfolio of business, enhance or focus our strategies, expand our distribution or capabilities, or to seek other benefits. In evaluating potential new ventures or investments, we generally seek an attractive estimated return on equity, the ability to develop or capitalize on a competitive advantage, and opportunities which we believe will not detract from our core operations. While we regularly review potential strategic transactions and periodically engage in discussions regarding possible transactions, there can be no assurance that we will complete any such transactions or that any such transaction would be successful or materially enhance our results of operations or financial condition. We believe that our ability to potentially attract investment and operational opportunities is supported by our strong reputation and financial resources, and by the capabilities and track record of our ventures unit.
COMPETITION
The markets in which we operate are highly competitive, and we believe that competition is in general increasing and becoming more robust. Our competitors include independent reinsurance and insurance companies, subsidiaries and/or affiliates of globally recognized insurance companies, reinsurance divisions of certain insurance companies and domestic and international underwriting operations. As our business evolves over time we expect our competitors to change as well.
Hedge funds, investment banks, exchanges and other capital market participants have been increasingly active in the reinsurance market and the market for related risk. We expect competition from, or funded by, these sources to increase. In addition, we continue to anticipate further, and perhaps accelerating, growth in financial products such as exchange traded catastrophe options, insurance-linked securities, unrated privately held reinsurance companies providing collateralized reinsurance, catastrophe-linked derivative agreements and other financial products, intended to compete with traditional reinsurance. We believe that competition from non-traditional sources such as these has recently increased and will increase further in the future. It is possible that these changing dynamics will meaningfully impact the markets in which we participate, possibly adversely. Many of these competitors or their financial backers have greater financial, marketing and management resources than we do. Further, we believe new entrants or existing competitors may attempt to replicate all or part of our business model and provide further competition in the markets in which we participate. In addition, the tax policies of the countries where our customers operate, as well as government sponsored or backed catastrophe funds, affect demand for reinsurance, sometimes significantly. Moreover, explicitly or implicitly government-backed entities increasingly represent competition for the coverages that we provide directly, or for the business of our customers, reducing the potential amount of third party private protection our clients might need or desire. We are unable to predict the extent to which the foregoing new, proposed or potential initiatives may affect the demand for our products or the risks for which we seek to provide coverage.
UNDERWRITING AND ENTERPRISE RISK MANAGEMENT
Underwriting
Our primary underwriting goal is to construct a portfolio of reinsurance and insurance contracts and other financial risks that maximizes our return on shareholders' equity, subject to prudent risk constraints, and to generate long-term growth in tangible book value per common share plus the change in accumulated
dividends. We assess each new (re)insurance contract on the basis of the expected incremental return relative to the incremental contribution to portfolio risk.
We have developed a proprietary, computer-based pricing and exposure management system, REMS©. Since inception, we have continued to invest in and improve REMS©, incorporating our underwriting and modeling experience, adding proprietary software and a significant amount of new industry data. REMS© has analytic and modeling capabilities that help us to assess the risk and return of each incremental (re)insurance contract in relation to our overall portfolio of (re)insurance contracts. We combine the analyses generated by REMS© with other information available to us, including our own knowledge of the client submitting the proposed program, to assess the premium offered against the risk of loss and the cost of utilized capital which the program presents. The REMS© framework encompasses and facilitates risk capture, analysis, correlation, portfolio aggregation and capital allocation within a single system for all of our natural hazards and non-natural hazards (re)insurance contracts.
We generally utilize a multiple model approach combining both probabilistic and deterministic techniques. The underlying risk models integrated into our underwriting and REMS© framework are a combination of internally constructed and commercially available models. We use commercially available natural hazard catastrophe models to assist with validating and stress testing our base model and REMS© results. We continually strive to improve our analytical techniques for both natural hazard and non-natural hazard models in REMS© and while our experience is most developed for analyzing natural hazard catastrophe risks, we continue to make significant advances in our capabilities for assessing non-natural hazard catastrophe risks. In addition, multiple members of our underwriting and risk management team review the models, and their respective results.
We believe that REMS© is a robust underwriting and risk management system that has been successfully integrated into our business processes and culture. Before we bind a (re)insurance risk, exposure data, historical loss information and other risk data is gathered from customers. Using a combination of proprietary software, underwriting experience, actuarial techniques and engineering expertise where we deem appropriate, the exposure data is reviewed and augmented. We use this data as primary inputs into the REMS© modeling system as a base to create risk distributions to represent the risk being evaluated. We believe that the REMS© modeling system helps us to analyze each policy on a consistent basis, assisting our determination of what we believe to be an appropriate price to charge for each policy based upon the risk to be assumed. REMS© combines computer-generated statistical simulations that estimate loss and event probabilities with exposure and coverage information on each client's (re)insurance contract to produce expected claims for (re)insurance programs submitted to us. Operationally, on a deal-by-deal basis, our models employ simulation techniques that have the ability to generate 40,000 years of loss activity. When deemed necessary, we stress test the 40,000 year simulations with simulations of up to 1,000,000 years. At a consolidated level, we frequently utilize simulations of 500,000 years to incorporate reserve risk, investment risk, expenses, and operational and other risks at a portfolio and risk assuming entity level. For natural hazards, we simulate a large range of potential industry losses in respect of events by region and peril. For some regions and perils, the extreme tails of these simulations include industry losses in excess of $600 billion. From these simulations, we generate a probability distribution of potential outcomes for each policy in our portfolio and for our total portfolio. In part, through the process described above and the utilization of REMS©, we seek to compare our estimate of the expected returns in respect of a contract with the amount of capital that we notionally allocate to the contract based on our estimate of its marginal impact on our portfolio of risks. A key advantage of our REMS© framework is our ability to include additional perils, risks and geographic areas that may not be captured in commercially available natural hazards risk models.
We periodically review the estimates and assumptions that are reflected in REMS© and our other tools. For example, the 2011 and 2010 earthquake events in New Zealand and the Tohoku earthquake provided new insight on certain aspects of hazard and vulnerability to the global earthquake science community. Utilizing internal research capabilities from our team of scientists at Weather Predict Consulting Inc. ("Weather Predict") and new research from the global earthquake science community, we updated several of our internal regional representations of earthquake risk in advance of the commercially available models. In late 2012, storm Sandy gave rise to new data relating to storm surge, flood persistence and mid-Atlantic tropical storm meteorology.
Our underwriters use this combination of our risk assessment and underwriting process, REMS© and other tools in their pricing decisions, which we believe provides them with several competitive advantages. These include the ability to:
| |
| • | simulate a range of potential outcomes that adequately represents the risk to an individual contract; |
| |
| • | analyze the incremental impact of an individual reinsurance contract on our overall portfolio; |
| |
| • | better assess the underlying exposures associated with assumed retrocessional business; |
| |
| • | price contracts within a short time frame; |
| |
| • | capture various classes of risk, including catastrophe and other insurance risks; |
| |
| • | assess risk across multiple entities (including our various joint ventures) and across different components of our capital structure; and |
| |
| • | provide consistent pricing information. |
As part of our risk management process, we also use REMS© to assist us, as a retrocedant, with the purchase of reinsurance coverage for our own account.
Our underwriting and risk management process, in conjunction with REMS©, quantifies and manages our exposure to claims from single events and the exposure to losses from a series of events. As part of our pricing and underwriting process, we also assess a variety of other factors, including:
| |
| • | the reputation of the proposed cedant and the likelihood of establishing a long-term relationship with the cedant; |
| |
| • | the geographic area in which the cedant does business and its market share; |
| |
| • | historical loss data for the cedant and, where available, for the industry as a whole in the relevant regions and lines of business, in order to compare the cedant's historical catastrophe loss experience to industry averages; |
| |
| • | the cedant's pricing strategies; and |
| |
| • | the perceived financial strength of the cedant and factors such as the cedant's historical record of making premium payments in full and on a timely basis. |
In order to estimate the risk profile of each line of non-natural hazard reinsurance (i.e., our specialty and casualty lines of business), we establish probability distributions and assess the correlations with the rest of our portfolio. In lines with catastrophe risk, such as excess workers' compensation and terrorism, we seek to directly leverage our skill in modeling for our property catastrophe reinsurance risks, and seek to appropriately estimate and manage the correlations between these specialty lines and our catastrophe reinsurance portfolio. For other classes of business, in which we believe we have little or no natural catastrophe exposure, and therefore less correlation with our property catastrophe reinsurance coverages, we derive probability distributions from a variety of underlying information sources, including recent historical experience, and the application of judgment as appropriate. The nature of some of these businesses lends itself less to the analysis that we use for our property catastrophe (re)insurance coverages, reflecting both the nature of available exposure information, and the impact of human factors such as tort exposure. We produce probability distributions to represent our estimates of the related underlying risks which our products cover, which we believe helps us to make consistent underwriting decisions and to manage our total risk portfolio.
In addition, we also produce, utilize and report on models which measure our utilization of capital in light of regulatory capital considerations and constraints. Our position in respect of these regulatory capital models are reviewed by our risk management professional staff and periodically reported to and reviewed by senior underwriting personnel and executive management with responsibility for our regulated operating insurance entities.
Enterprise Risk Management ("ERM")
We believe that high-quality and effective risk management is best achieved through it being a shared cultural value throughout the organization. We have sought to develop and utilize a series of tools and processes that support a culture of risk management and to create a robust framework of ERM within our organization. We consider ERM to be a key process which is the responsibility of every individual within the Company. ERM is managed by our senior executive team under the oversight of our Board of Directors, and implemented by personnel from across our organization. We believe that ERM helps us to identify potential events that may affect us, to quantify, evaluate and manage the risks to which we are exposed, and to provide reasonable assurance regarding the achievement of our objectives. We believe that effective ERM can provide us with a significant competitive advantage. We also believe that effective ERM assists our efforts to minimize the likelihood of suffering financial outcomes in excess of the ranges which we have estimated in respect of specific investments, underwriting decisions, or other operating or business activities, although we do not believe this risk can be eliminated. We believe that our risk management tools support our strategy of pursuing opportunities and help us to identify opportunities that we believe to be the most attractive. In particular, we utilize our risk management tools to support our efforts to monitor our capital position, on a consolidated basis and for each of our major operating subsidiaries, and to allocate an appropriate amount of capital to support the risks that we have assumed in the aggregate and for each of our major operating subsidiaries. We believe that our risk management efforts are essential to our corporate strategy and our goal of achieving long-term growth in tangible book value per share plus the change in accumulated dividends for our shareholders.
Our ERM framework comprises three primary areas of focus, as set forth below:
| |
| (1) | Assumed Risk. We define assumed risk as activities where we deliberately take risk against the Company's capital base, including underwriting risks and other quantifiable risks such as credit risk and interest rate risk as they relate to investments, ceded reinsurance credit risk and strategic investment risk, each of which can be analyzed in substantial part through quantitative tools and techniques. Of these, we believe underwriting risk to be the most material to us. In order to understand, monitor, quantify and proactively assess underwriting risk, we seek to develop and deploy appropriate tools to, among other things, estimate the comparable expected returns on potential business opportunities, and estimate the impact that such incremental business could have on our overall risk profile. We use the tools and methods described above in "Underwriting" to seek to achieve these objectives. Embedded within our consideration of assumed risk is our management of the Company's aggregate, consolidated risk profile. In part through the utilization of REMS© and our other systems and procedures, we seek to analyze our in-force aggregate assumed risk portfolio on a daily basis. We believe this capability helps us to manage our aggregate exposures, as well as to rigorously analyze individual proposed transactions and evaluate them in the context of our in-force portfolio. This aggregation process captures line of business, segment and corporate risk profiles, calculates internal and external capital tests and explicitly models ceded reinsurance. Generally, additional data is added quarterly to our aggregate risk framework to reflect updated or new information or estimates relating to matters such as interest rate risk, credit risk, capital adequacy and liquidity. This information is used in day-to-day decision making for underwriting, investments and operations and is also reviewed quarterly from both a unit level and in respect of our consolidated financial position. We also regularly assess, monitor and review our regulatory risk capital and related constraints. |
| |
| (2) | Business Environment Risk. We define this as the risk of changes in the business, political or regulatory environment that could negatively impact our short term or long-term financial results or the markets in which we operate. Accordingly, these risks are predominately extrinsic to the Company and in general, our ability to alter or eliminate these risks is limited. Rather, our efforts focus on monitoring developments, assessing potential impacts of any such changes, and investing in cost effective means to attempt to mitigate the consequences of and ensure compliance with any new requirements applicable to us. |
| |
| (3) | Operational Risk. We are subject to a number of additional risks arising out of operational, regulatory, and other matters. We define operational risk to include the risk that we fail to create, manage, control or mitigate the people, processes, structures or functions required to execute our strategic and tactical plans and assemble an optimized portfolio of assumed risk, and to adjust to |
and comply with the evolving requirements of business environment risk applicable to us. In light of the rapid evolution of our markets, business environment, and business initiatives, we seek to continually invest in the tools, processes and procedures to mitigate our exposure to operational risk on a cost-effective basis. As with assumed risk and business environment risk, operational risk presents intrinsic uncertainties, and we may fail to appropriately identify or mitigate applicable operational risk.
Identification and monitoring of business environment risk and operational risk is coordinated by senior personnel including our Chief Financial Officer ("CFO"), General Counsel and Chief Compliance Officer ("CCO"), Corporate Controller and Chief Accounting Officer ("CAO"), Chief Administrative Officer, Chief Risk Officer ("CRO"), Chief Information Officer and Internal Audit, utilizing resources throughout the Company.
Although financial reporting is a key area of our focus, other operational risks are addressed through our disaster recovery program, human resource practices such as motivating and retaining top talent, our strict tax protocols and our legal and regulatory policies and procedures.
Controls and Compliance Committee. We believe that a key component of our current operational risk management platform is our Controls and Compliance Committee. The Controls and Compliance Committee is comprised of our CFO, CCO, CAO, Chief Administrative Officer, CRO, staff compliance professionals and representatives from our business units. The purpose of the Controls and Compliance Committee is to establish, assess the effectiveness of, and enforce policies, procedures and practices relating to accounting, financial reporting, internal controls, regulatory, legal, compliance and related matters, and for ensuring compliance with applicable laws and regulations, the Company's Code of Ethics and Conduct (the "Code of Ethics"), and other relevant standards. In addition, the Controls and Compliance Committee is charged with reviewing certain transactions that potentially raise complex and/or significant tax, legal, accounting, regulatory, financial reporting, reputational or compliance issues.
Ongoing Development and Enhancement. We seek to reflect and categorize risks we monitor in part through quantitative risk distributions, even where we believe that such quantitative analysis is not as robust or well developed as our tools and models for measuring and evaluating other risks, such as catastrophe and market risks. We also seek to improve the methods by which we measure risks. We believe effective risk management is a core attribute of our culture and is a continual process that requires ongoing improvement and development. We seek from time to time to identify effective new practices or additional developments both from within our industry and from other sectors. We believe that our ongoing efforts to embed ERM throughout our organization are important to our efforts to produce and maintain a competitive advantage to achieve our corporate goals.
RATINGS
Financial strength ratings are an important factor in respect of the competitive position of reinsurance and insurance companies. Rating organizations continually review the financial positions of our reinsurers and insurers. We continue to receive high claims-paying and financial strength ratings from A.M. Best Co. ("A.M. Best"), Standard and Poor's Rating Services ("S&P"), Moody's Investors Service ("Moody's") and Fitch Ratings Ltd. ("Fitch"). These ratings represent independent opinions of an insurer's financial strength, operating performance and ability to meet policyholder obligations, and are not an evaluation directed toward the protection of investors or a recommendation to buy, sell or hold any of our securities.
See "Item 7. Management's Discussion and Analysis of Financial Condition and Results of Operations, Capital Resources, Ratings" for the ratings of our principal operating subsidiaries and joint ventures by segment, and details of recent ratings actions. In addition, S&P assesses companies' ERM practices, which is an opinion on the many critical dimensions of risk that determine overall creditworthiness. RenaissanceRe has been assigned an ERM rating of "Excellent", which is the highest rating assigned by S&P, and indicates that S&P believes RenaissanceRe has extremely strong capabilities to consistently identify, measure, and manage risk exposures and losses within RenaissanceRe's predetermined tolerance guidelines.
RESERVES FOR CLAIMS AND CLAIM EXPENSES
We believe the most significant accounting judgment made by management is our estimate of claims and claim expense reserves. Claims and claim expense reserves represent estimates, including actuarial and statistical projections at a given point in time, of the ultimate settlement and administration costs for unpaid claims and claim expenses arising from the insurance and reinsurance contracts we sell. We establish our claims and claim expense reserves by taking claims reported to us by insureds and ceding companies, but which have not yet been paid ("case reserves"), adding the costs for additional case reserves ("additional case reserves") which represent our estimates for claims previously reported to us which we believe may not be adequately reserved as of that date, and adding estimates for the anticipated cost of claims incurred but not yet reported to us ("IBNR").
The following table summarizes our claims and claim expense reserves by line of business and split between case reserves, additional case reserves and IBNR: |
| | | | | | | | | | | | | | | | | |
| | | | | | | | | | |
| | At December 31, 2012 | Case Reserves | | Additional Case Reserves | | IBNR | | Total | |
| | (in thousands) | | | | | | | | |
| | Catastrophe | $ | 706,264 |
| | $ | 222,208 |
| | $ | 255,786 |
| | $ | 1,184,258 |
| |
| | Specialty | 111,234 |
| | 80,971 |
| | 286,108 |
| | 478,313 |
| |
| | Total Reinsurance | 817,498 |
| | 303,179 |
| | 541,894 |
| | 1,662,571 |
| |
| | Lloyd's | 29,260 |
| | 10,548 |
| | 109,662 |
| | 149,470 |
| |
| | Other | 17,016 |
| | 8,522 |
| | 41,798 |
| | 67,336 |
| |
| | Total | $ | 863,774 |
| | $ | 322,249 |
| | $ | 693,354 |
| | $ | 1,879,377 |
| |
| | | | | | | | | | |
| | At December 31, 2011 | | | | | | | | |
| | (in thousands) | | | | | | | | |
| | Catastrophe | $ | 681,771 |
| | $ | 271,990 |
| | $ | 388,147 |
| | $ | 1,341,908 |
| |
| | Specialty | 120,189 |
| | 49,840 |
| | 301,589 |
| | 471,618 |
| |
| | Total Reinsurance | 801,960 |
| | 321,830 |
| | 689,736 |
| | 1,813,526 |
| |
| | Lloyd's | 17,909 |
| | 14,459 |
| | 55,127 |
| | 87,495 |
| |
| | Other | 32,944 |
| | 3,515 |
| | 54,874 |
| | 91,333 |
| |
| | Total | $ | 852,813 |
| | $ | 339,804 |
| | $ | 799,737 |
| | $ | 1,992,354 |
| |
| | | | | | | | | | |
Our estimates of claims and claim expense reserves are not precise in that, among other matters, they are based on predictions of future developments and estimates of future trends and other variable factors. Some, but not all, of our reserves are further subject to the uncertainty inherent in actuarial methodologies and estimates. Because a reserve estimate is simply an insurer's estimate at a point in time of its ultimate liability, and because there are numerous factors which affect reserves and claims payments that cannot be determined with certainty in advance, our ultimate payments will vary, perhaps materially, from our estimates of reserves. If we determine in a subsequent period that adjustments to our previously established reserves are appropriate, such adjustments are recorded in the period in which they are identified. During the year ended December 31, 2012, changes to prior year estimated claims reserves increased our net income by $158.0 million (2011 - decreased our net loss by $132.0 million, 2010 - increased our net income by $302.1 million), excluding the consideration of changes in reinstatement premium, profit commissions, redeemable noncontrolling interest - DaVinciRe, equity in net claims and claim expenses of Top Layer Re and income tax.
The following table presents an analysis of our paid, unpaid and incurred losses and loss expenses and a reconciliation of beginning and ending reserves for claims and claim expenses for the years indicated: |
| | | | | | | | | | | | | |
| | | | | | | | |
| | Year ended December 31, | 2012 | | 2011 | | 2010 | |
| | (in thousands) | | | | | | |
| | Net reserves as of January 1 | $ | 1,588,325 |
| | $ | 1,156,132 |
| | $ | 1,260,334 |
| |
| | Net incurred related to: | | | | | | |
| | Current year | 483,180 |
| | 993,168 |
| | 431,476 |
| |
| | Prior years | (157,969 | ) | | (131,989 | ) | | (302,131 | ) | |
| | Total net incurred | 325,211 |
| | 861,179 |
| | 129,345 |
| |
| | Net paid related to: | | | | | | |
| | Current year | 84,056 |
| | 299,299 |
| | 50,793 |
| |
| | Prior years | 142,615 |
| | 129,687 |
| | 182,754 |
| |
| | Total net paid | 226,671 |
| | 428,986 |
| | 233,547 |
| |
| | Total net reserves as of December 31 | 1,686,865 |
| | 1,588,325 |
| | 1,156,132 |
| |
| | Reinsurance recoverable as of December 31 | 192,512 |
| | 404,029 |
| | 101,711 |
| |
| | Total gross reserves as of December 31 | $ | 1,879,377 |
| | $ | 1,992,354 |
| | $ | 1,257,843 |
| |
| | | | | | | | |
Refer to "Item 7. Management's Discussion and Analysis of Financial Condition and Results of Operations, Summary of Critical Accounting Estimates, Claims and Claim Expense Reserves" for additional discussion regarding the Company's reserving methodologies, including key assumptions and sensitivity analysis and a discussion regarding the Company's accounting treatment and favorable development on prior years net claims and claim expenses.
Our reserving methodology for each line of business uses a loss reserving process that calculates a point estimate for the Company's ultimate settlement and administration costs for claims and claim expenses. We do not calculate a range of estimates. We use this point estimate, along with paid claims and case reserves, to record our best estimate of additional case reserves and IBNR in our consolidated financial statements. Under GAAP, we are not permitted to establish estimates for catastrophe claims and claim expense reserves until an event occurs that gives rise to a loss.
Reserving for our reinsurance claims involves other uncertainties, such as the dependence on information from ceding companies, which among other matters, includes the time lag inherent in reporting information from the primary insurer to us or to our ceding companies and differing reserving practices among ceding companies. The information received from ceding companies is typically in the form of bordereaux, broker notifications of loss and/or discussions with ceding companies or their brokers. This information can be received on a monthly, quarterly or transactional basis and normally includes estimates of paid claims and case reserves. We sometimes also receive an estimate or provision for IBNR. This information is often updated and adjusted from time to time during the loss settlement period as new data or facts in respect of initial claims, client accounts, industry or event trends may be reported or emerge in addition to changes in applicable statutory and case laws.
Our estimates of losses from large events are based on factors including currently available information derived from the Company's claims information from certain customers and brokers, industry assessments of losses from the events, proprietary models, and the terms and conditions of our contracts. The uncertainty of our estimates for certain of these large events is additionally impacted by the preliminary nature of the information available, the magnitude and relative infrequency of the events, the expected duration of the respective claims development period, inadequacies in the data provided thus far by industry participants and the potential for further reporting lags or insufficiencies (particularly in respect of the Chilean, 2010 New Zealand, 2011 New Zealand and Tohoku earthquakes); and in the case of storm Sandy and the Thailand flooding, significant uncertainty as to the form of the claims and legal issues, under the relevant terms of insurance contracts and reinsurance treaties. In addition, a significant portion of the net claims and claim expenses associated with storm Sandy and the New Zealand and Tohoku earthquakes are concentrated with a few large clients and therefore the loss estimates for these events may vary significantly based on the claims experience of those clients. Loss reserve estimation in respect of our retrocessional contracts poses further challenges compared to directly assumed reinsurance. A significant
portion of our reinsurance recoverable relates to the New Zealand and Tohoku earthquakes. There is inherent uncertainty and complexity in evaluating loss reserve levels and reinsurance recoverable amounts, due to the nature of the losses relating to earthquake events, including that loss development time frames tend to take longer with respect to earthquake events. The contingent nature of business interruption and other exposures will also impact losses in a meaningful way, especially with regard to storm Sandy, the Tohoku earthquake and Thailand flooding, which we believe may give rise to significant complexity in respect of claims handling, claims adjustment and other coverage issues, over time. Given the magnitude and relatively recent occurrence of these large events, meaningful uncertainty remains regarding total covered losses for the insurance industry and, accordingly, several of the key assumptions underlying our loss estimates. In addition, our actual net losses from these events may increase if our reinsurers or other obligors fail to meet their obligations.
Because of the inherent uncertainties discussed above, we have developed a reserving philosophy which attempts to incorporate prudent assumptions and estimates, and we have generally experienced favorable net development on prior year reserves in the last several years. However, there is no assurance that this will occur in future periods.
Our reserving techniques, assumptions and processes differ between our property catastrophe reinsurance, specialty reinsurance and insurance businesses within our Reinsurance and Lloyd's segments, and Other category. Refer to our "Item 7. Management's Discussion and Analysis of Financial Condition and Results of Operations, Summary of Critical Accounting Estimates, Claims and Claim Expense Reserves" for more information on the risks we insure and reinsure, the reserving techniques, assumptions and processes we follow to estimate our claims and claim expense reserves, and our current estimates versus our initial estimates of our claims reserves, for each of these units.
The following table represents the development of our GAAP balance sheet reserves for December 31, 2002 through December 31, 2012. This table does not present accident or policy year development data. The top line of the table shows the gross reserves for claims and claim expenses at the balance sheet date for each of the indicated years. This represents the estimated amounts of claims and claim expenses arising in the current year and all prior years that are unpaid at the balance sheet date, including additional case reserves and IBNR reserves. The table also shows the re-estimated amount of the previously recorded reserves based on experience as of the end of each succeeding year. The estimate changes as more information becomes known about the frequency and severity of claims for individual years. The "cumulative redundancy on net reserves" represents the aggregate change to date from the indicated estimate of the gross reserve for claims and claim expenses, net of reinsurance recoverable on the second line of the table. The table also shows the cumulative net paid amounts as of successive years with respect to the net reserve liability. At the bottom of the table is a reconciliation of the gross reserve for claims and claim expenses to the net reserve for claims and claim expenses, the gross re-estimated liability to the net re-estimated liability for claims and claim expenses, and the cumulative redundancy on gross reserves.
With respect to the information in the table below, note that each amount includes the effects of all changes in amounts for prior periods, including the effect of foreign exchange rates.
|
| | | | | | | | | | | | | | | | | | | | | | | | | | | | | | | | | | | | | | | | | | | | | | |
| | Year ended December 31, | | 2002 | | 2003 | | 2004 | | 2005 | | 2006 | | 2007 | | 2008 | | 2009 | | 2010 | | 2011 | | 2012 | |
| | (in millions) | | | | | | | | | | | | | | | | | | | | | | | |
| | Gross reserve for claims and claim expenses | | $ | 747.9 |
| | $ | 924.4 |
| | $ | 1,295.0 |
| | $ | 2,381.4 |
| | $ | 1,811.0 |
| | $ | 1,717.2 |
| | $ | 1,758.8 |
| | $ | 1,344.4 |
| | $ | 1,257.8 |
| | $ | 1,992.3 |
| | $ | 1,879.4 |
| |
| | Reserve for claims and claim expenses, net of reinsurance recoverable | | $ | 595.0 |
| | $ | 810.6 |
| | $ | 1,099.2 |
| | $ | 1,742.2 |
| | $ | 1,591.3 |
| | $ | 1,609.5 |
| | $ | 1,565.2 |
| | $ | 1,260.3 |
| | $ | 1,156.1 |
| | $ | 1,588.3 |
| | $ | 1,686.9 |
| |
| | 1 Year Later | | 494.8 |
| | 661.5 |
| | 878.6 |
| | 1,610.7 |
| | 1,368.3 |
| | 1,412.6 |
| | 1,299.0 |
| | 958.2 |
| | 1,024.1 |
| | 1,430.3 |
| | — |
| |
| | 2 Years Later | | 449.5 |
| | 379.5 |
| | 844.0 |
| | 1,449.1 |
| | 1,225.9 |
| | 1,199.0 |
| | 1,045.1 |
| | 857.6 |
| | 895.8 |
| | — |
| | — |
| |
| | 3 Years Later | | 270.8 |
| | 362.8 |
| | 749.1 |
| | 1,333.7 |
| | 1,092.2 |
| | 997.8 |
| | 961.4 |
| | 770.8 |
| | — |
| | — |
| | — |
| |
| | 4 Years Later | | 258.7 |
| | 332.9 |
| | 717.2 |
| | 1,231.6 |
| | 911.1 |
| | 923.0 |
| | 888.7 |
| | — |
| | — |
| | — |
| | — |
| |
| | 5 Years Later | | 246.3 |
| | 312.2 |
| | 683.7 |
| | 1,077.8 |
| | 847.2 |
| | 878.5 |
| | — |
| | — |
| | — |
| | — |
| | — |
| |
| | 6 Years Later | | 220.2 |
| | 301.5 |
| | 628.9 |
| | 1,022.7 |
| | 823.5 |
| | — |
| | — |
| | — |
| | — |
| | — |
| | — |
| |
| | 7 Years Later | | 210.8 |
| | 266.2 |
| | 609.2 |
| | 1,002.8 |
| | — |
| | — |
| | — |
| | — |
| | — |
| | — |
| | — |
| |
| | 8 Years Later | | 186.0 |
| | 251.2 |
| | 604.5 |
| | — |
| | — |
| | — |
| | — |
| | — |
| | — |
| | — |
| | — |
| |
| | 9 Years Later | | 174.7 |
| | 241.2 |
| | — |
| | — |
| | — |
| | — |
| | — |
| | — |
| | — |
| | — |
| | — |
| |
| | 10 Years Later | | 167.9 |
| | — |
| | — |
| | — |
| | — |
| | — |
| | — |
| | — |
| | — |
| | — |
| | — |
| |
| | Cumulative redundancy on net reserves | | $ | 427.1 |
| | $ | 569.4 |
| | $ | 494.7 |
| | $ | 739.4 |
| | $ | 767.8 |
| | $ | 731.0 |
| | $ | 676.5 |
| | $ | 489.5 |
| | $ | 260.3 |
| | $ | 158.0 |
| | $ | — |
| |
| | Cumulative Net Paid Losses | | | | | | | | | | | | | | | | | | | | | | | |
| | 1 Year Later | | 81.1 |
| | 58.0 |
| | 302.8 |
| | 354.8 |
| | 247.6 |
| | 337.1 |
| | 191.5 |
| | 182.8 |
| | 129.7 |
| | 142.6 |
| | — |
| |
| | 2 Years Later | | 85.3 |
| | 100.6 |
| | 370.8 |
| | 548.4 |
| | 435.8 |
| | 469.5 |
| | 369.1 |
| | 301.5 |
| | 301.5 |
| | — |
| | — |
| |
| | 3 Years Later | | 113.0 |
| | 107.5 |
| | 395.7 |
| | 712.6 |
| | 529.5 |
| | 553.0 |
| | 471.6 |
| | 420.6 |
| | — |
| | — |
| | — |
| |
| | 4 Years Later | | 91.8 |
| | 96.4 |
| | 446.8 |
| | 782.9 |
| | 569.4 |
| | 605.7 |
| | 585.8 |
| | — |
| | — |
| | — |
| | — |
| |
| | 5 Years Later | | 85.9 |
| | 129.8 |
| | 472.7 |
| | 812.0 |
| | 594.2 |
| | 690.4 |
| | — |
| | — |
| | — |
| | — |
| | — |
| |
| | 6 Years Later | | 102.8 |
| | 136.1 |
| | 482.7 |
| | 833.1 |
| | 656.1 |
| | — |
| | — |
| | — |
| | — |
| | — |
| | — |
| |
| | 7 Years Later | | 109.6 |
| | 137.3 |
| | 492.2 |
| | 879.1 |
| | — |
| | — |
| | — |
| | — |
| | — |
| | — |
| | — |
| |
| | 8 Years Later | | 103.0 |
| | 139.2 |
| | 527.6 |
| | — |
| | — |
| | — |
| | — |
| | — |
| | — |
| | — |
| | — |
| |
| | 9 Years Later | | 99.1 |
| | 152.1 |
| | — |
| | — |
| | — |
| | — |
| | — |
| | — |
| | — |
| | — |
| | — |
| |
| | 10 Years Later | | 99.6 |
| | — |
| | — |
| | — |
| | — |
| | — |
| | — |
| | — |
| | — |
| | — |
| | — |
| |
| | Gross reserve for claims and claim expenses | | $ | 747.9 |
| | $ | 924.4 |
| | $ | 1,295.0 |
| | $ | 2,381.4 |
| | $ | 1,811.0 |
| | $ | 1,717.2 |
| | $ | 1,758.8 |
| | $ | 1,344.4 |
| | $ | 1,257.8 |
| | $ | 1,992.3 |
| | $ | 1,879.4 |
| |
| | Reinsurance recoverable on unpaid losses | | 152.9 |
| | 113.8 |
| | 195.8 |
| | 639.2 |
| | 219.7 |
| | 107.7 |
| | 193.6 |
| | 84.1 |
| | 101.7 |
| | 404.0 |
| | 192.5 |
| |
| | Net reserve for claims and claim expenses | | $ | 595.0 |
| | $ | 810.6 |
| | $ | 1,099.2 |
| | $ | 1,742.2 |
| | $ | 1,591.3 |
| | $ | 1,609.5 |
| | $ | 1,565.2 |
| | $ | 1,260.3 |
| | $ | 1,156.1 |
| | $ | 1,588.3 |
| | $ | 1,686.9 |
| |
| | Gross liability re-estimated | | $ | 300.8 |
| | $ | 355.4 |
| | $ | 797.6 |
| | $ | 1,608.7 |
| | $ | 1,024.8 |
| | $ | 940.8 |
| | $ | 1,030.3 |
| | $ | 821.3 |
| | $ | 974.9 |
| | $ | 1,830.4 |
| | $ | — |
| |
| | Reinsurance recoverable on unpaid losses re-estimated | | 132.9 |
| | 114.2 |
| | 193.1 |
| | 605.9 |
| | 201.3 |
| | 62.3 |
| | 141.6 |
| | 50.5 |
| | 79.1 |
| | 400.1 |
| | — |
| |
| | Net liability re-estimated | | $ | 167.9 |
| | $ | 241.2 |
| | $ | 604.5 |
| | $ | 1,002.8 |
| | $ | 823.5 |
| | $ | 878.5 |
| | $ | 888.7 |
| | $ | 770.8 |
| | $ | 895.8 |
| | $ | 1,430.3 |
| | $ | — |
| |
| | Cumulative redundancy on gross reserves | | $ | 447.1 |
| | $ | 569.0 |
| | $ | 497.4 |
| | $ | 772.7 |
| | $ | 786.2 |
| | $ | 776.4 |
| | $ | 728.5 |
| | $ | 523.1 |
| | $ | 282.9 |
| | $ | 161.9 |
| | $ | — |
| |
| | | | | | | | | | | | | | | | | | | | | | | | | |
INVESTMENTS
Our investment guidelines stress preservation of capital, market liquidity, and diversification of risk. The majority of our investments consist of highly rated fixed income securities. We also hold a significant amount of short term investments. Short term investments are managed as part of our investment portfolio and have a maturity of one year or less when purchased. In addition, we have an allocation to other investments including private equity partnerships, senior secured bank loan funds, catastrophe bonds, and hedge funds; and to certain equity securities. We may from time to time re-evaluate our investment guidelines and explore investment allocations to other asset classes. Our investments are subject to market-wide risks and fluctuations, as well as to risks inherent in particular securities.
The table below shows the aggregate amounts of our invested assets: |
| | | | | | | | | | | | | | | |
| | | | | | | | | | |
| | At December 31, | 2012 | | 2011 | |
| | (in thousands, except percentages) | | | | | | | | |
| | U.S. treasuries | $ | 1,259,800 |
| | 19.8 | % | | $ | 885,152 |
| | 14.2 | % | |
| | Agencies | 315,154 |
| | 5.0 | % | | 158,561 |
| | 2.6 | % | |
| | Non-U.S. government (Sovereign debt) | 133,198 |
| | 2.1 | % | | 227,912 |
| | 3.7 | % | |
| | FDIC guaranteed corporate | — |
| | — | % | | 423,630 |
| | 6.8 | % | |
| | Non-U.S. government-backed corporate | 349,514 |
| | 5.5 | % | | 641,082 |
| | 10.3 | % | |
| | Corporate | 1,615,207 |
| | 25.4 | % | | 1,206,904 |
| | 19.4 | % | |
| | Agency mortgage-backed | 408,531 |
| | 6.4 | % | | 441,749 |
| | 7.1 | % | |
| | Non-agency mortgage-backed | 248,339 |
| | 3.9 | % | | 104,771 |
| | 1.7 | % | |
| | Commercial mortgage-backed | 406,166 |
| | 6.4 | % | | 325,729 |
| | 5.2 | % | |
| | Asset-backed | 12,954 |
| | 0.2 | % | | 18,027 |
| | 0.3 | % | |
| | Total fixed maturity investments, at fair value | 4,748,863 |
| | 74.7 | % | | 4,433,517 |
| | 71.4 | % | |
| | Short term investments, at fair value | 821,163 |
| | 12.9 | % | | 905,477 |
| | 14.6 | % | |
| | Equity investments trading, at fair value | 58,186 |
| | 0.9 | % | | 50,560 |
| | 0.8 | % | |
| | Other investments, at fair value | 644,711 |
| | 10.1 | % | | 748,984 |
| | 12.1 | % | |
| | Total managed investment portfolio | 6,360,647 |
| | 98.6 | % | | 6,138,538 |
| | 98.9 | % | |
| | Investments in other ventures, under equity method | 87,724 |
| | 1.4 | % | | 70,714 |
| | 1.1 | % | |
| | Total investments | $ | 6,360,647 |
| | 100.0 | % | | $ | 6,209,252 |
| | 100.0 | % | |
| | | | | | | | | | |
For additional information regarding the investment portfolio, refer to "Item 7. Management's Discussion and Analysis of Financial Condition and Results of Operations, Liquidity and Capital Resources, Investments".
MARKETING
We believe that our modeling and technical expertise, the risk management products that we provide to our customers, and our reputation for paying claims promptly has enabled us to become a provider of first choice in many lines of business to our customers worldwide. We market our products worldwide primarily through reinsurance brokers and we focus our marketing efforts on targeted brokers and partners. We believe that our existing portfolio of business is a valuable asset and, therefore, we attempt to continually strengthen relationships with our existing brokers and customers. We target prospects that are capable of supplying detailed and accurate underwriting data and that potentially add further diversification to our book of business.
We believe that primary insurers' and brokers' willingness to use a particular reinsurer is based not just on pricing, but also on the financial security of the reinsurer, its claim paying ability ratings and demonstrated willingness to promptly pay valid claims, the quality of a reinsurer's service, the reinsurer's willingness and ability to design customized programs, its long-term stability and its commitment to provide reinsurance capacity. We believe we have established a reputation with our brokers and customers for prompt response on underwriting submissions, for fast claims payments and for providing creative solutions to our customers' needs. Since we selectively write large lines on a limited number of property catastrophe and specialty reinsurance contracts, we can establish terms and conditions on those contracts that are attractive
in our judgment, make large commitments to the most attractive programs and provide superior client responsiveness. We believe that our willingness and ability to design customized programs and to provide bespoke risk management products has helped us to develop long-term relationships with brokers and customers.
Our brokers assess client needs and perform data collection, contract preparation and other administrative tasks, enabling us to market our products cost effectively by maintaining a smaller staff. We believe that by maintaining close relationships with brokers, we are able to obtain access to a broad range of potential reinsureds. In recent years, our distribution has become increasingly reliant on a small and relatively decreasing number of such relationships reflecting consolidation in the broker sector. We expect this concentration to continue and perhaps increase.
The following table shows the percentage of our Reinsurance segment gross premiums written generated through our largest brokers:
|
| | | | | | | | | | |
| | | | | | | | |
| | Year ended December 31, | 2012 | | 2011 | | 2010 | |
| | AON Benfield | 51.5 | % | | 56.1 | % | | 53.5 | % | |
| | Marsh Inc. | 21.4 | % | | 21.9 | % | | 23.1 | % | |
| | Willis Group | 11.7 | % | | 12.7 | % | | 11.6 | % | |
| | Total of largest brokers | 84.6 | % | | 90.7 | % | | 88.2 | % | |
| | All others | 15.4 | % | | 9.3 | % | | 11.8 | % | |
| | Total percentage of Reinsurance segment gross premiums written | 100.0 | % | | 100.0 | % | | 100.0 | % | |
| | | | | | | | |
During 2012, our Reinsurance segment issued authorization for coverage on programs submitted by 40 brokers worldwide (2011 – 44 brokers). We received approximately 3,228 program submissions during 2012 (2011 – approximately 3,733). Of these submissions, we issued authorizations for coverage for approximately 1,065 programs, or approximately 33% of the program submissions received (2011 – approximately 1,021 programs, or approximately 27%).
Our Lloyd's segment received approximately 3,676 program submissions during 2012 (2011 – approximately 3,390), from 45 different brokers worldwide (2011 – 46 brokers). Of these submissions, we issued authorizations for coverage for approximately 881 programs, or approximately 24% of the program submissions received (2011 – approximately 654 programs, or approximately 19%).
EMPLOYEES
At February 20, 2013, we employed 309 people worldwide (February 15, 2012 - 311, February 16, 2011 - 517). As part of the sale of our U.S.-based insurance operations, which closed on March 4, 2011, our overall headcount was reduced by 204 employees that were formerly employed in the U.S.-based insurance operations. We believe our strong employee relations are among our most significant strengths. None of our employees are subject to collective bargaining agreements. We are not aware of any current efforts to implement such agreements at any of our subsidiaries. The Company has historically looked for opportunities to strengthen its operations during periods of softening markets in anticipation of improving market conditions, however, we may from time to time reevaluate our operational needs based on various factors, including the changing nature of such market conditions and changes in our strategy or tactical plans. We currently expect to continue to experience a degree of employee growth in the U.K. and other markets, although we do not expect these increases to be material to the Company as a whole.
INFORMATION TECHNOLOGY
Our information technology infrastructure is important to our business. Our information technology platform, supported by a team of professionals, is currently principally located in our corporate headquarters and principal corporate offices in Bermuda. Additional information technology assets are maintained at the office locations of our operating subsidiaries. We have implemented backup procedures that seek to ensure that our key business systems and data are backed up, generally on a daily basis, and can be restored promptly if and as needed. In addition, we generally store backup information at off-site locations, in order to seek to minimize our risk of loss of key data in the event of a disaster.
We depend on the proper functioning and availability of our information technology platform. This includes communications and data processing systems used in operating our business. These systems consist of proprietary software programs that are integral to the efficient operation of our business (including REMS©, our proprietary computer-based pricing and exposure management system). In addition, we frequently transmit and receive personal, confidential and proprietary information by email and other electronic means, as required in connection with our business, with our internal operations and with facilitating the oversight conducted by our Board of Directors. Computer viruses, hackers, employee misuse or misconduct and other external hazards could expose our data systems to security breaches, cyber attacks or other disruptions.
We believe that the preponderance of our business and support functions utilize information systems that provide critical services to both our employees and our customers. We are also required to effect electronic transmissions with third parties including brokers, clients vendors and others with whom we do business. While we seek to ensure that our information is appropriately protected by these parties, we may be unable to put in place secure capabilities with all of them; in addition, these third parties may not have appropriate controls in place to protect the confidentiality of the information.
Cyber incidents that impact the availability, reliability, speed, accuracy or other proper functioning of these systems could have a significant impact on our operations, and potentially on our results. We also operate in a number of jurisdictions with strict data privacy and other related laws, which could be violated in the event of a significant cybersecurity incident, or by our personnel. Failure to comply with these obligations can give rise to monetary fines and other penalties, which could be significant.
We seek to protect our information systems through physical and software safeguards as well as backup systems considered appropriate by management. However, it is not practicable to protect against every potential power loss, telecommunications failure, cybersecurity attack or similar event that may arise. Moreover, the safeguards we have chosen to utilize are subject to human implementation and maintenance and to other uncertainties.
A significant cyber incident, including system failure, security breach, disruption by malware or other damage could interrupt or delay our operations. This type of incident may result in a violation of applicable privacy and other laws and could damage our reputation potentially causing a loss of customers. Management is not aware of a cybersecurity incident that has had a material effect on our operations, although there can be no assurances that a cyber incident that could have a material impact on us will not occur in the future.
We have implemented and periodically test our disaster recovery plans with respect to our information technology infrastructure. Among other things, our recovery plans involve arrangements with off-site, secure data centers in alternative locations. We believe we will be able to access our systems from these facilities in the event that our primary systems are unavailable due to a scenario such as a natural disaster. In addition, we periodically perform security penetration scenarios to evaluate our preparedness and ability to detect, alert and respond to such an incident. However, we have not prepared for every conceivable disaster or every scenario which might arise in respect of the disaster for which we have prepared, and cannot assure you our efforts in respect of disaster recovery will succeed, or will be sufficiently rapid to avoid harm to our business.
REGULATION
U.S. Regulation
Dodd-Frank Act. On July 21, 2010, President Obama signed into law the Dodd-Frank Act which effects sweeping reforms of the financial services industries. The Dodd-Frank Act does not implement the federal regulation of insurance, but it does establish federal measures that will impact the U.S. insurance business and preempt certain state insurance measures. It may then lay the foundation for ultimately establishing some form of federal regulation of insurance in the future.
The Dodd-Frank Act created the Financial Stability Oversight Council ("FSOC") to identify risks to U.S. financial stability, promote market discipline and respond to emerging threats to U.S. financial stability. FSOC is authorized to designate a nonbank financial company as "systemically significant" if a nonbank financial company's material financial distress could threaten the financial stability of the U.S. Nonbank financial
companies, which may include insurance companies, designated as systemically significant by FSOC will be subject to supervision by the Board of Governors of the Federal Reserve System (the "Federal Reserve") and enhanced prudential standards, including stress tests, liquidity requirements, annual resolution plans or "living wills," and enhanced public disclosures. In April 2012, FSOC adopted final rules setting forth a three-stage process to evaluate whether nonbank financial companies should be designated as systemically significant. FSOC has not yet designated any company as systemically significant under the April 2012 final rules. Other related regulations required by the Dodd-Frank Act, such as how a "nonbank financial company" will be defined in connection with FSOC's designation process, have not yet been finalized. FSOC's potential recommendation of measures to address systemic risk in the insurance industry could affect our U.S.-based insurance and reinsurance operations as could a determination that we or our counterparties are systemically significant and subject to supervision and regulation by the Federal Reserve.
The Dodd-Frank Act also creates the first office in the Federal government focused on insurance - the Federal Insurance Office (the "FIO"). Although the FIO has preemption authority over state insurance laws that conflict with certain international agreements, the Dodd-Frank Act does not grant the FIO general supervisory or regulatory authority over the business of insurance. Certain functions of the FIO relate to systemic risk. Specifically, the FIO is authorized to monitor the U.S. insurance industry and identify potential regulatory gaps that could contribute to systemic risk to the insurance industry and the U.S. financial system. In addition, the FIO may recommend insurers for supervision by the FSOC.
With respect to certain aspects of international insurance regulations, the FIO represents the U.S. at the International Association of Insurance Supervisors ("IAIS"); in 2012, it participated in the IAIS's Financial Stability Committee and joined IAIS's Executive Committee. The Dodd-Frank Act authorizes the Treasury Secretary and U.S. Trade Representative to enter into international agreements of mutual recognition regarding the prudential regulation of insurance ("Covered Agreements"). Significantly, the FIO is authorized to preempt state measures that (i) are inconsistent with a Covered Agreement and (ii) disfavor non-U.S. insurers subject to a Covered Agreement.
In furtherance of its duties to monitor the U.S. insurance business, represent the U.S. on an international stage and consult with the states on insurance regulation, the FIO is authorized to collect information from insurers and from state insurance regulators. The FIO is obligated to report to Congress annually on the insurance industry and any preemption actions regarding Covered Agreements. The FIO was scheduled to report to Congress by September 2012 describing the breadth of the global reinsurance market and its critical role in supporting the U.S. insurance system. In addition, by January 2012, the FIO was scheduled to report to Congress on how to modernize and improve the system of insurance regulation in the U.S. including considerations of international coordination of insurance regulation. The FIO has not yet issued either of these reports. The potential impact of the Dodd-Frank Act on our U.S. cedants and on the U.S. treatment of global reinsurance matters is not clear at this time. We are monitoring developments at the FSOC and the FIO in connection with the possible impact on our U.S. insurance and reinsurance business. It is possible the FIO will issue recommendations in respect of the reinsurance market that would, if enacted, impact our market or our operations significantly, perhaps adversely. The Dodd-Frank Act also provides for the specific preemption of certain state insurance laws in the areas of reinsurance and surplus insurance regulation.
At this time, it is difficult to predict the extent to which the Dodd-Frank Act or the resulting regulations will impact our business. However, compliance with these new laws and regulations has resulted in additional costs. Although we do not expect these costs to be material to us as a whole, we cannot be certain that this expectation will prove accurate or that the Dodd-Frank Act will not impact our business more adversely than we currently estimate.
Reinsurance Regulation. Our Bermuda-domiciled insurance operations and joint ventures principally consist of Renaissance Reinsurance, DaVinci, Top Layer Re and Glencoe. Renaissance Reinsurance, DaVinci and Top Layer Re are Bermuda-based companies that operate as reinsurers. Although none of these companies is admitted to transact the business of insurance in any jurisdiction except Bermuda, the insurance laws of each state of the U.S. regulate the sale of reinsurance to ceding insurers authorized in the state by non-admitted alien reinsurers, such as Renaissance Reinsurance or DaVinci, acting from locations outside the state. Rates, contract terms and conditions of reinsurance agreements generally are not subject to regulation by any governmental authority. A primary insurer ordinarily will enter into a reinsurance agreement, however, only if it can obtain credit for the reinsurance ceded on its statutory financial statements.
In general, regulators permit ceding insurers to take credit for reinsurance under the following circumstances if the contract contains certain minimum provisions: if the reinsurer is licensed or accredited, if the reinsurer is domiciled in a state with substantially similar regulatory requirements as the primary insurer's domiciliary
jurisdiction and meets certain financial requirements, or if the reinsurance obligations are collateralized appropriately. Recently eleven states have changed their credit for reinsurance laws. For example, effective January 1, 2011, New York requires domestic ceding insurers to exercise prudent reinsurance credit risk management. For a New York domestic ceding insurer to exercise financial prudence when entering into any reinsurance arrangement, it must take into account the recoverability of future reinsurance proceeds and the security of a reinsurer. Domestic ceding insurers are also required to monitor reinsurance programs. New York law also establishes a basis for an unauthorized non-U.S. reinsurer to reduce its reinsurance collateral obligations based on a secure rating assigned by the New York Insurance Department. Of the eleven states that have changed their credit for reinsurance laws, only New York and Florida have approved any reinsurers for collateral reduction.
The Dodd-Frank Act also addresses states' extraterritorial regulation of credit for reinsurance and the solvency regulation of U.S. reinsurers. The Dodd-Frank Act prohibits a state in which a U.S. ceding insurer is licensed, but not domiciled, from denying credit for reinsurance if the ceding insurer's domestic state recognizes credit for reinsurance for the insurer's ceded risk and is a state accredited by the National Association of Insurance Commissioners (the "NAIC") (or has substantially similar financial solvency requirements). With limited exceptions, the provisions of the Dodd-Frank Act affecting reinsurance became effective July 21, 2011.
As alien companies, our Bermuda subsidiaries collateralize their reinsurance obligations to U.S. insurance companies. States are expected to change their credit for reinsurance laws to comply with Dodd-Frank Act requirements. Although these changes may benefit our Bermuda based reinsurers by prohibiting states' extraterritorial application of credit for reinsurance laws and streamlining the credit for reinsurance process, states may also impose heightened standards on U.S. ceding insurers' reinsurance selections which could have an adverse impact on our business. With some exceptions, the sale of insurance or reinsurance within a jurisdiction where the insurer is not admitted to do business is prohibited. None of Renaissance Reinsurance, DaVinci or Top Layer Re intends to maintain an office or to solicit, advertise, settle claims or conduct other insurance activities in any jurisdiction, other than Bermuda, where the conduct of such activities would require that each company be so admitted.
Excess and Surplus Lines Regulation. Glencoe, domiciled in Bermuda, is not licensed in the U.S. but is eligible to offer coverage in the U.S. exclusively in the surplus lines market. Glencoe is eligible to write surplus lines primary insurance in 49 U.S. states, the District of Columbia, Puerto Rico and the U.S. Virgin Islands, and is subject to the surplus lines regulation and reporting requirements of the jurisdictions in which it is eligible to write surplus lines primary insurance. In accordance with certain provisions of the NAIC Nonadmitted Insurance Model Act, which provisions have been adopted by a number of states, Glencoe has established, and is required to maintain, a trust funded to a minimum amount as a condition of its status as an eligible, non-admitted insurer in the U.S. Under the Dodd-Frank Act, effective July 21, 2011, the states are required to amend their laws to provide that any insurer listed on the NAIC/IID Quarterly listing is eligible in the state as a surplus lines insurer. Glencoe is listed on the NAIC/IID Quarterly listing. Although surplus lines business is generally less regulated than the admitted market, strict regulations apply to surplus lines placements under the laws of every state, and the regulation of surplus lines insurance may undergo changes in the future.
Legislative and Regulatory Proposals. Government intervention in the insurance and reinsurance markets in the U.S. continues to evolve. Although U.S. state regulation is currently the primary form of regulation of insurance and reinsurance, in addition to changes brought about by the Dodd-Frank Act, Congress has considered over the past years various proposals relating to the creation of an optional federal charter, repeal of the insurance company antitrust exemption from the McCarran Ferguson Act, and tax law changes, including changes to increase the taxation of reinsurance premiums paid to off-shore affiliates with respect to U.S. risks. We are unable to predict what reforms will be proposed or adopted or the effect, if any, that such reforms would have on our operations and financial condition.
In 2007, Florida enacted legislation which enabled the FHCF to offer increased amounts of coverage in addition to the mandatory coverage amount, at below-market rates. Further, the legislation expanded the ability of the state-sponsored insurer, Citizens, to compete with private insurance companies, and other companies that cede business to us. This legislation reduced the role of the private insurance and reinsurance markets in Florida, a key target market of ours. In May 2009, the Florida legislature took steps to strengthen the financial condition of FHCF and Citizens, which a government-appointed task force determined to have been impaired by issues including the crisis in the credit markets, widespread rate inadequacy, and issues arising out of the application of discounts for housing retrofits and mitigation features. A bill was passed in 2009 permitting Citizens to raise its rates by up to 10% starting in 2010 and every year thereafter until its current shortfall is corrected and Citizens has sufficient funds to pay its claims and expenses. The rate increases and cut back on coverage by
FHCF and Citizens are expected to support, over time, a relatively increased role of the private insurers in Florida, a market in which we have established substantial market share. However, we cannot assure you that this increased role will transpire, or that adverse new legislation will not be passed.
It is possible that other states, particularly those with Atlantic or Gulf Coast exposures, may enact new or expanded legislation based on the earlier Florida precedent, or may otherwise enact legislation which would further diminish aggregate private market demand for our products. Alternatively, legislation adversely impacting the private markets could be enacted on a regional or Federal level. For example, in the past, federal bills have been proposed in Congress (and, in prior congressional sessions, passed by the House of Representatives) which would, if enacted, create a federal reinsurance backstop or guarantee mechanism for catastrophic risks, including those we currently insure and reinsure in the private markets. In 2009 the Catastrophe Obligation Guarantee Act was introduced in the Senate and House (S. 886) to federally guarantee bond issuances by certain government entities, potentially including the FHCF, the Texas Windstorm Insurance Association, the California Earthquake Authority, and others. In August 2012, Congressman Albio Sires introduced the Taxpayers' Protection Act (HR 6477). The bill would establish a federal catastrophe fund where eligible states can purchase reinsurance directly from the federal government. In January 2013, Congresswoman Frederica Wilson introduced the Homeowners' Defense Act which would, if enacted, provide for the creation of (i) a federal reinsurance catastrophe fund; (ii) a federal consortium to facilitate qualifying state residual markets and catastrophe funds in securing reinsurance; and (iii) a federal bond guarantee program for state catastrophe funds in qualifying state residual markets. In January 2013, Congressman Dennis Ross introduced the Homeowners' Insurance Protection Act (HR 240), which would create a federal catastrophe reinsurance program to back up federal reinsurance programs. If enacted, any of these bills, or legislation similar to these proposals, would, we believe, likely contribute to the growth of state entities offering below market priced insurance and reinsurance in a manner adverse to us and market participants more generally, and could accordingly adversely impact our financial results, perhaps materially. Moreover, we believe that numerous modeled potential catastrophes could exceed the actual or politically acceptable bonded capacity of Citizens and of the FHCF, which could lead either to a severe dislocation or the necessity of federal intervention in the Florida market, either of which would adversely impact the private insurance and reinsurance industry. See "Item 7. Management's Discussion and Analysis of Financial Condition and Results of Operations, Current Outlook, Legislative and Regulatory Update" for further information regarding recent legislative and regulatory proposals.
The potential for further expansion into additional insurance markets could expose us or our subsidiaries to increasing regulatory oversight, including the oversight of countries other than Bermuda and the U.S. However, we intend to continue to conduct our operations so as to minimize the likelihood that Renaissance Reinsurance, DaVinci, Top Layer Re, Glencoe, or any of our other Bermudian subsidiaries will become subject to direct U.S. regulation. In addition, as discussed above, REAL and Renaissance Trading are involved in certain commodities trading activities relating to weather, natural gas, heating oil, power, crude oil, agricultural commodities and cross-commodity structures. While REAL's and Renaissance Trading's operations currently are not subject to significant federal oversight, we are monitoring carefully new or revised legislation or regulation in the U.S. or otherwise, which could increase the regulatory burden and operating expenses of these operations. For example, certain provisions of the Dodd-Frank Act will establish greater oversight over derivatives trading and could restrict the Company's trading activities.
Bermuda Regulation
All Bermuda companies must comply with the provisions of the Companies Act 1981. In addition, the Insurance Act 1978, and related regulations (the "Insurance Act"), regulate the business of our Bermuda insurance, reinsurance and management company subsidiaries.
As a holding company, RenaissanceRe is not currently subject to the Insurance Act. However, the Insurance Act regulates the insurance and reinsurance business of our operating insurance companies. The Company's most significant operating subsidiaries include Renaissance Reinsurance and DaVinci which are registered as Class 4 general business insurers and Glencoe and Top Layer Re which are registered as Class 3A general business insurers under the Insurance Act. The Company also has operating subsidiaries registered as SPIs under the Insurance Act, including most recently, Upsilon Re II, Tim Re III and Upsilon Re. RUM and RenaissanceRe Underwriting Management Ltd. are each registered as insurance managers under the Insurance Act.
The Insurance Act imposes solvency and liquidity standards as well as auditing and reporting requirements and confers on the Bermuda Monetary Authority ("BMA") powers to supervise, investigate and intervene in the affairs of insurance companies. Significant requirements of the Insurance Act include the appointment of an independent auditor and loss reserve specialist (both of whom must be approved by the BMA), the filing of an annual financial return and provisions relating to the payment of distributions and dividends. In particular:
| |
| • | Class 3A and Class 4 general business insurers are required to submit annual statutory financial statements as part of its statutory financial return no later than four months after the insurer's financial year end (unless specifically extended). The annual statutory financial statements give detailed information and analyses regarding premiums, claims, reinsurance, reserves and investments. The statutory financial return includes, among other items: a report of the approved independent auditor on the statutory financial statements; a declaration of statutory ratios; a solvency certificate; the statutory financial statements themselves; the opinion of the approved loss reserve specialist; and details concerning ceded reinsurance. |
| |
| • | In addition to preparing statutory financial statements, all Class 3A and Class 4 insurers must prepare financial statements in respect of their insurance business in accordance with GAAP or International Financial Reporting Standards ("IFRS"). |
| |
| • | A general business insurer's statutory assets must exceed its statutory liabilities by an amount, equal to or greater than the prescribed minimum solvency margin, which varies with the category of its registration and net premiums written and loss reserves posted ("Minimum Solvency Margin"). The Minimum Solvency Margin that must be maintained by a Class 4 insurer is the greater of (i) $100.0 million, or (ii) 50% of net premiums written (with a credit for reinsurance ceded not exceeding 25% of gross premiums) or (iii) 15% of net discounted aggregate loss and loss expense provisions and other insurance reserves. The Minimum Solvency Margin for a Class 3A insurer is the greater of (i) $1.0 million, or (ii) 20% of the first $6.0 million of net premiums written; if in excess of $6.0 million, the figure is $1.2 million plus 15% of net premiums written in excess of $6.0 million, or (iii) 15% of net discounted aggregate loss and loss expense provisions and other insurance reserves. |
| |
| • | In addition, each Class 3A and Class 4 insurer must maintain its capital at a level equal to its enhanced capital requirement ("ECR") which is established by reference to the Bermuda Solvency Capital Requirement ("BSCR") model. Alternatively, under the Insurance Act, insurers may, subject to the terms of the Insurance Act and to the BMA's oversight, elect to utilize an approved internal capital model to determine regulatory capital. In either case, the ECR shall at all times equal or exceed the respective Class 3A and Class 4 insurer's Minimum Solvency Margin and may be adjusted in circumstances where the BMA concludes that the insurer's risk profile deviates significantly from the assumptions underlying its ECR or the insurer's assessment of its risk management policies and practices used to calculate the ECR applicable to it. While not specifically referred to in the Insurance Act, the BMA has also established a target capital level ("TCL") for each Class 3A and Class 4 insurer equal to 120% of the respective ECR. While a Class 3A and Class 4 insurer is not currently required to maintain its statutory capital and surplus at this level, the TCL serves as an early warning tool for the BMA and failure to maintain statutory capital at least equal to the TCL will likely result in increased BMA regulatory oversight. |
| |
| • | An insurer engaged in general business is required to maintain the value of its relevant assets at not less than 75% of the amount of its relevant liabilities ("Minimum Liquidity Ratio"). |
| |
| • | Both Class 3A and Class 4 insurers are prohibited from declaring or paying any dividends if in breach of the required Minimum Solvency Margin or Minimum Liquidity Ratio (the "Relevant Margins") or if the declaration or payment of such dividend would cause the insurer to fail to meet the Relevant Margins. Further, a Class 4 insurer is prohibited from declaring or paying in any financial year dividends of more than 25% of its total statutory capital and surplus (as shown on its previous financial year's statutory balance sheet) unless it files (at least seven days before payment of such dividends) with the BMA an affidavit stating that it will continue to meet its Relevant Margins. Class 3A and Class 4 insurers must obtain the BMA's prior approval for a reduction by 15% or more of the total statutory capital as set forth in its previous year's financial statements. These restrictions on declaring or paying dividends and distributions under the Insurance Act are in addition to the solvency requirements under the Companies Act which apply to all Bermuda companies. |
| |
| • | Unlike other (re)insurers, SPIs are fully funded to meet their (re)insurance obligations and are not exposed to insolvency, therefore the application and supervision processes are streamlined to facilitate the transparent structure. Further, SPIs are exempt from filing annual loss reserve specialist opinions and the BMA has the discretion to modify such insurer's accounting requirements under the Insurance Act. Like other (re)insurers, the principal representative of an SPI has a duty to inform the BMA in relation to solvency matters, where applicable. |
| |
| • | The BMA maintains supervision over the controllers (as defined herein) of all Bermuda registered insurers. Currently the Insurance Act states that no person shall become a controller of any description of a registered insurer unless he has first served the BMA notice in writing stating that he intends to become such a controller. A controller includes the managing director and chief executive of the registered insurer or its parent company; a 10%, 20%, 33% or 50% shareholder controller; and any person in accordance with whose directions or instructions the directors of the registered insurer or of its parent company are accustomed to act. In addition, all Bermuda insurers are also required to give the BMA written notice of the fact that a person has become, or ceased to be, a controller or officer of the registered insurer within 45 days of becoming aware of such fact. An officer in relation to a registered insurer includes a director, secretary, chief executive or senior executive by whatever name called. |
| |
| • | All registered insurers are required to give the BMA 14 days' notice of certain matters that are likely to be of material significance (each a "Material Change") to the BMA in carrying out its supervisory function under the Insurance Act. |
| |
| • | All Bermuda insurers are required to comply with the BMA's Insurance Code of Conduct which establishes duties, requirements and standards to be complied with to ensure each insurer implements sound corporate governance, risk management and internal controls. Failure to comply with these requirements will be a factor taken into account by the BMA in determining whether an insurer is conducting its business in a sound and prudent manner under the Insurance Act. |
| |
| • | Pursuant to the Insurance Act, the BMA acts as the group supervisor of the RenaissanceRe group of companies (the "RenaissanceRe Group") and it has designated Renaissance Reinsurance to be the "designated insurer" in respect of the RenaissanceRe Group. The designated insurer is required to ensure that the RenaissanceRe Group complies with the provisions of the Insurance Act pertaining to groups and all related group solvency and group supervision rules (together, the "Group Rules"). Under the Group Rules, the RenaissanceRe Group is required to annually prepare and submit to the BMA group GAAP financial statements, a group statutory financial return and a group capital and solvency return. Further, our Board of Directors has established solvency self assessment procedures for the RenaissanceRe Group that factor in all foreseeable material risks; Renaissance Reinsurance must ensure that the RenaissanceRe Group's assets exceed the amount of the RenaissanceRe Group's liabilities by the aggregate minimum margin of solvency of each qualifying member; and our Board of Directors has established and effectively implement corporate governance policies and procedures to ensure they support the overall organizational strategy of the RenaissanceRe Group. In addition, the RenaissanceRe Group is required to prepare and submit a quarterly financial return comprising unaudited group statutory financial statements, a schedule of intra-group transactions and a schedule of risk concentrations. |
| |
| • | The BMA has certain powers of investigation and intervention relating to insurers and their holding companies, subsidiaries and other affiliates, which it may exercise in the interest of such insurer's policyholders or if there is any risk of insolvency or of a breach of the Insurance Act or the insurer's license conditions. |
| |
| • | Under the provisions of the Insurance Act, the BMA may, from time to time, conduct "on site" visits at the offices of insurers it regulates. Over the past several years the BMA has conducted several "on site" reviews in respect of our Bermuda-domiciled operating insurers. No remedial actions were communicated to us as a result of any of the on-site reviews to date. |
| |
| • | The BMA may cancel an insurer's registration on certain grounds specified in the Insurance Act. |
Given the delays announced in late 2012 in respect of the implementation timetable related to Solvency II, as discussed below, the BMA has indicated that it will remain committed to the regulatory equivalence process in relation to Solvency II for Bermuda's commercial insurance sector. However, the BMA has noted that its overall adoption of progressive, risk-based supervision will go beyond this single regulatory initiative. The BMA has expressed its desire to implement changes to Bermuda's regulatory regime on a schedule that enables Bermuda's (re)insurers to transition to enhanced requirements on a phased basis where appropriate.
Under current Bermuda law, the Company is not subject to any tax computed on profits or income or computed on any capital asset, gain or appreciation. The Company has been exempted from any such tax until March 2035 pursuant to the Bermuda Exempted Undertakings Tax Protection Act of 1966.
U.K. Regulation
Lloyd's Regulation
General. The operations of RSML are franchised by Lloyd's. The Lloyd's Franchise Board was formally constituted on January 1, 2003. The Franchise Board establishes guidelines and operates a business planning and monitoring process for all Lloyd's syndicates. RSML's business plan for Syndicate 1458 requires annual approval by the Lloyd's Franchise Board including maximum underwriting capacity. The Lloyd's Franchise Board may require changes to any business plan presented to it or additional capital to be provided to support the underwriting plan. Lloyd's also imposes various charges and assessments on its members. If material changes in the business plan for Syndicate 1458 were required by the Lloyd's Franchise Board, or if charges and assessments payable to Lloyd's by RenaissanceRe CCL were to increase significantly, these events could have an adverse effect on the operations and financial results of RSML. The Company has deposited certain assets with Lloyd's to support RenaissanceRe CCL's underwriting business at Lloyd's. Dividends from a Lloyd's managing agent and a Lloyd's corporate member can be declared and paid provided the relevant company has sufficient profits available for distribution.
By entering into a membership agreement with Lloyd's, RenaissanceRe CCL has undertaken to comply with all Lloyd's bye-laws and regulations as well as the provisions of the Lloyd's Acts and the Financial Services and Markets Act 2000 (the "FSMA") that are applicable to it.
Capital Requirements. Capital is supplied on the basis of an annual venture, with continuing support from capital providers and the members of Lloyd's, and requires affirmation each year. The underwriting capacity of a member of Lloyd's must be supported by providing a deposit (referred to as "Funds at Lloyd's") in the form of cash, securities or letters of credit in an amount determined under the Individual Capital Adequacy regime of the U.K.'s Financial Services Authority (the "FSA"). The amount of such deposit is calculated for each member through the completion of an annual capital adequacy exercise. Under these requirements, Lloyd's must demonstrate that each member has sufficient assets to meet its underwriting liabilities plus a required solvency margin.
Restrictions. A Reinsurance to Close ("RITC") generally is put in place after the third year of operations of a syndicate year of account. On successful conclusion of a RITC, any profit from the syndicate's operations for that year of account can be remitted by the managing agent to the syndicate's members. If the syndicate's managing agency concludes that an appropriate RITC cannot be determined or negotiated on commercially acceptable terms in respect of a particular underwriting year, it must determine that the underwriting year remain open and be placed into run-off. During this period there cannot be a release of the Funds at Lloyd's of a member of that syndicate without the consent of Lloyd's and such consent will only be considered where the member has surplus Funds at Lloyd's over and above the capital requirement.
The financial security of the Lloyd's market is regularly assessed by three independent rating agencies (A.M. Best, S&P and Fitch). A satisfactory credit rating issued by an accredited rating agency is necessary for Lloyd's syndicates to be able to trade in certain classes of business at current levels. RSML and RenaissanceRe CCL would be adversely affected if Lloyd's current ratings were downgraded.
Intervention Powers. The Council of Lloyd's has wide discretionary powers to regulate members' underwriting at Lloyd's. It may, for instance, change the basis on which syndicate expenses are allocated or vary the Funds at Lloyd's requirements or the investment criteria applicable to the provision of Funds at Lloyd's. Exercising any of these powers might affect the return on the corporate member's participation in a given underwriting year. If a member of Lloyd's is unable to pay its debts to policyholders, the member may obtain financial assistance from the Lloyd's Central Fund, which in many respects acts as an equivalent to a state guaranty fund in the U.S. If Lloyd's determines that the Central Fund needs to be increased, it has the power to assess premium levies on current Lloyd's members. The Council of Lloyd's has discretion to call or assess up to 3% of a member's underwriting capacity in any one year as a Central Fund contribution.
Lloyd's approval is also required before any person can acquire control (as defined below in relation to the FSMA and giving prior notification to the FSA) of a Lloyd's managing agent or Lloyd's corporate member.
FSA Regulation
The FSA currently has ultimate responsibility for the regulation of the Lloyd's market and has substantial powers of intervention in relation to Lloyd's managing agents, such as RSML, including the power to remove an agent's authorization to manage Lloyd's syndicates. In addition, each year the FSA requires Lloyd's to satisfy an annual solvency test which measures whether Lloyd's has sufficient assets in the aggregate to meet all outstanding liabilities of its members, both current and run-off. If Lloyd's fails this test, the FSA may require the entire Lloyd's market to cease underwriting or individual Lloyd's members may be required to cease or reduce their underwriting.
Lloyd's as a whole is authorized by the FSA and is required to implement certain rules prescribed by the FSA; such rules are to be implemented by Lloyd's pursuant to its powers under the Lloyd's Act 1982 relating to the operation of the Lloyd's market. Lloyd's prescribes, in respect of its managing agents and corporate members, certain minimum standards relating to their management and control, solvency and various other requirements. The FSA directly monitors Lloyd's managing agents' compliance with the systems and controls prescribed by Lloyd's. If it appears to the FSA that either Lloyd's is not fulfilling its delegated regulatory responsibilities or that managing agents are not complying with the applicable regulatory rules and guidance, the FSA may intervene at its discretion. Future regulatory changes or rulings by the FSA could impact RSML's business strategy or financial assumptions, possibly resulting in an adverse effect on RSML's financial condition and operating results.
Regulatory Reform in the UK
The Financial Services Act 2012 will become effective on April 1, 2013. By amending the FSMA and the Banking Act 2009 the Financial Services Act will implement the UK's new "twin peaks" regulatory structure. Regulatory responsibility for insurance undertakings in the UK will pass from the FSA to two new bodies, the Prudential Regulation Authority ("PRA") and the Financial Conduct Authority ("FCA") from April 1, 2013. It is expected that Lloyd's will operate pursuant to a similar delegation of regulatory authority from these two bodies as currently granted by the FSA. However, there is still some uncertainty over how this change to the regulatory architecture in the U.K. will affect operations at Lloyd's.
Change of Control. The FSA currently regulates the acquisition of control of any Lloyd's managing agent which is authorized under the FSMA. Any company or individual that, together with its or his associates, directly or indirectly acquires 10% or more of the shares in a Lloyd's managing agent or its parent company, or is entitled to exercise or control the exercise of 10% or more of the voting power in such Lloyd's managing agent or its parent company, would be considered to have acquired control for the purposes of the relevant legislation, as would a person who had significant influence over the management of such Lloyd's managing agent or its parent company by virtue of his shareholding or voting power in either. A purchaser of 10% or more of RenaissanceRe's common shares or voting power would therefore be considered to have acquired control of RSML. Under the FSMA, any person or entity proposing to acquire control over a Lloyd's managing agent must give prior notification to the FSA of his or the entity's intention to do so. The FSA would then have sixty working days to consider the application to acquire control. Failure to make the relevant prior application could result in action being taken against RSML by the FSA. Lloyd's approval is also required before any person can acquire control (using the same definition as for the FSA) of a Lloyd's managing agent or Lloyd's corporate member.
Other Applicable Laws. Lloyd's worldwide insurance and reinsurance business is subject to various regulations, laws, treaties and other applicable policies of the EU, as well as of each nation, state and locality in which it operates. Material changes in governmental requirements and laws could have an adverse affect on Lloyd's and its member companies, including RSML and RenaissanceRe CCL.
Solvency II
Solvency II was adopted by the European Parliament in April of 2009. The timing for the implementation of Solvency II in European Member States by the European Commission ("EC"), previously scheduled for January 1, 2014 is expected to be delayed as the time frame appears unachievable. Lloyd's Solvency II implementation plans are designed to facilitate a January 1, 2016 implementation date, however Lloyd's has noted to its managing agents that this a planning assumption only and is subject to change as further clarification from the EC emerges. Upon its adoption, Solvency II will replace the current solvency requirements and implement a risk-based approach to insurance regulation. Its principal goals are to improve the correlation between capital and risk, effect group supervision of insurance and reinsurance affiliates, implement a uniform capital adequacy structure for (re)insurers across the EU Member States, establish consistent corporate governance standards for insurance and reinsurance companies, and establish transparency through standard reporting of insurance
operations. Under Solvency II, an insurer's or reinsurer's capital adequacy in relation to various insurance and business risks may be measured with an internal model developed by the insurer or reinsurer and approved for use by the Member State's regulator or pursuant to a standard formula developed by the European Commission. Lloyd's requires all managing agents to develop internal models for the syndicate they manage. The 2013 capital requirement for Syndicate 1458 was based on RSML's internal model in line with this process. We continue to monitor the ongoing legislative and regulatory steps in relation to the adoption of Solvency II.
ENVIRONMENTAL AND CLIMATE CHANGE MATTERS
Our principal coverages and services relate to natural disasters and catastrophes, such as earthquakes and hurricanes. We believe, and believe the consensus view of current scientific studies substantiates, that changes in climate conditions, primarily global temperatures and expected sea levels are likely to increase the severity, and possibly the frequency, of weather related natural disasters and catastrophes relative to the historical experience over the past 100 years. Coupled with currently projected demographic trends in catastrophe-exposed regions, we currently estimate that this expected increase in severe weather, such as tropical cyclone intensity, over coming periods will increase the average economic value of expected losses, increase the number of people exposed per year to natural disasters and in general exacerbate disaster risk, including risks to infrastructure, global supply chains and agricultural production.
Accordingly, we currently estimate that these trends will increase the risk of claims arising from our property and casualty lines of business, particularly with respect to properties located in coastal areas, among others. While a substantial portion of our coverages may be adversely impacted by climate change, we have taken certain measures, to the extent permissible by law and prevailing market conditions, to mitigate against such losses by giving consideration to these risks in our underwriting decisions. We seek to continuously monitor and adjust, as we believe appropriate, our risk management models to reflect our judgment of how to interpret current developments and information such as the studies referred to above. However, it is possible that, even after these assessments, we will have underestimated the frequency or severity of tropical cyclones or of other catastrophes. To the extent broad environmental factors, exacerbated by climate change or otherwise, lead to increases in insured losses, particularly if those losses exceed expectations and the prior estimates of market participants, regulators or other stakeholders, the markets and clients we serve may be disrupted and adversely impacted, and we may be adversely affected, directly or indirectly. Further, certain of our investments such as catastrophe-linked securities and property catastrophe managed joint ventures related to hurricane coverage, could also be adversely impacted by climate change.
An increasing number of federal, state, local and foreign government requirements and international agreements apply to environmental and climate change, in particular by seeking to limit or penalize the discharge of materials such as greenhouse gas ("GHG") into the environment or otherwise relating to the protection of the environment. Although our operations are characterized by a small number of professional office facilities, and we have not been directly, materially impacted by these changes to date, it is our policy to monitor and seek to ensure compliance with these requirements, as applicable. We believe that, as a general matter, our policies, practices and procedures are properly designed to identify and manage environmental and climate-related risks, particularly the risks of potential financial liability in connection with our reinsurance, insurance and trading businesses. However, we believe that some risk of environmental damage is inherent in respect of any commercial operation, and may increase for us if our business continues to expand and diversify by investments which we have made or may make through REAL or other subsidiaries. For example, our weather and energy risk management operations and our customers of such services could be impacted by climate change and increased GHG regulation. Likewise, certain of our investments may also be adversely affected by climate change and increased governmental regulation of, or international agreements pertaining to, GHG emissions. Moreover, our evaluation may be flawed or may reflect inaccurate or incomplete information, and it is possible our exposure to climate change or other environmental risks is greater than we have currently estimated.
At this time, we do not believe that any existing or currently pending climate change legislation, regulation, or international treaty or accord known to us would be reasonably likely to have a material effect in the foreseeable future on our business or on our results of operations, capital expenditures or financial position. However, it is possible that future developments, such as increasingly strict environmental laws and standards and enforcement policies, could give rise to more severe exposure, more costly compliance requirements, or otherwise bring into question our current policies and practices. In addition, it is possible that state insurance regulation could impact the ability of our customers, or of the Company, to manage property exposures in areas vulnerable to significant climate-driven losses. For example, if our customers or
operations are unable to utilize actuarially sound, risk-based pricing, to modify policy terms if necessary to reflect changes in the underlying risks, or to otherwise manage exposures appropriately to reflect the risk of increased loss from both large scale natural catastrophes and smaller scale weather events, our markets, customers, or our own financial results may all be adversely affected. We will continue to monitor emerging developments in this area.
GLOSSARY OF SELECTED INSURANCE AND REINSURANCE TERMS |
| |
| Accident year | Year of occurrence of a loss. Claim payments and reserves for claims and claim expenses are allocated to the year in which the loss occurred for losses occurring contracts and in the year the loss was reported for claims made contracts. |
|
| |
| Acquisition expenses | The aggregate expenses incurred by a company for acquiring new business, including commissions, underwriting expenses, premium taxes and administrative expenses. |
|
| |
| Additional case reserves | Additional case reserves represent management's estimate of reserves for claims and claim expenses that are allocated to specific contracts, less paid and reported losses by the client. |
|
| |
| Attachment point | The dollar amount of loss (per occurrence or in the aggregate, as the case may be) above which excess of loss reinsurance becomes operative. |
|
| |
| Bordereau | A report providing premium or loss data with respect to identified specific risks. This report is periodically furnished to a reinsurer by the ceding insurers or reinsurers. |
|
| |
| Bound | A (re)insurance policy is considered bound, and the (re)insurer responsible for the risks of the policy, when both parties agree to the terms and conditions set forth in the policy. |
|
| |
| Broker | An intermediary who negotiates contracts of insurance or reinsurance, receiving a commission for placement and other services rendered, between (1) a policy holder and a primary insurer, on behalf of the insured party, (2) a primary insurer and reinsurer, on behalf of the primary insurer, or (3) a reinsurer and a retrocessionaire, on behalf of the reinsurer. |
|
| |
| Capacity | The percentage of surplus, or the dollar amount of exposure, that an insurer or reinsurer is willing or able to place at risk. Capacity may apply to a single risk, a program, a line of business or an entire book of business. Capacity may be constrained by legal restrictions, corporate restrictions or indirect restrictions. |
|
| |
| Case reserves | Loss reserves, established with respect to specific, individual reported claims. |
|
| |
| Casualty insurance or reinsurance | Insurance or reinsurance that is primarily concerned with the losses caused by injuries to third persons and their property (in other words, persons other than the policyholder) and the legal liability imposed on the insured resulting there from. Also referred to as liability insurance. |
|
| |
| Catastrophe | A severe loss, typically involving multiple claimants. Common perils include earthquakes, hurricanes, hailstorms, severe winter weather, floods, fires, tornadoes, explosions and other natural or man-made disasters. Catastrophe losses may also arise from acts of war, acts of terrorism and political instability. |
|
| |
| Catastrophe excess of loss reinsurance | A form of excess of loss reinsurance that, subject to a specified limit, indemnifies the ceding company for the amount of loss in excess of a specified retention with respect to an accumulation of losses resulting from a "catastrophe." |
|
| |
| Catastrophe-linked securities; cat-linked securities | Cat-linked securities are generally privately placed fixed income securities where all or a portion of the repayment of the principal is linked to catastrophic events. This includes securities where the repayment is linked to the occurrence and/or size of, for example, one or more hurricanes or earthquakes, or insured industry losses associated with these catastrophic events. |
|
| |
| Cede; cedant; ceding company | When a party reinsures its liability with another, it "cedes" business and is referred to as the "cedant" or "ceding company." |
|
| |
| Claim | Request by an insured or reinsured for indemnification by an insurance company or a reinsurance company for losses incurred from an insured peril or event. |
|
| |
| Claims made contracts | Contracts that cover claims for losses occurring during a specified period that are reported during the term of the contract. |
|
| |
| Claims and claim expense ratio, net | The ratio of net claims and claim expenses to net premiums earned determined in accordance with either statutory accounting principles or GAAP. |
|
| |
| Claim reserves | Liabilities established by insurers and reinsurers to reflect the estimated costs of claim payments and the related expenses that the insurer or reinsurer will ultimately be required to pay in respect of insurance or reinsurance policies it has issued. Claims reserves consist of case reserves, established with respect to individual reported claims, additional case reserves and "IBNR" reserves. For reinsurers, loss expense reserves are generally not significant because substantially all of the loss expenses associated with particular claims are incurred by the primary insurer and reported to reinsurers as losses. |
|
| |
| Combined ratio | The combined ratio is the sum of the net claims and claim expense ratio and the underwriting expense ratio. A combined ratio below 100% generally indicates profitable underwriting prior to the consideration of investment income. A combined ratio over 100% generally indicates unprofitable underwriting prior to the consideration of investment income. |
|
| |
| Decadal | Refers to events occurring over a 10-year period, such as an oscillation whose period is roughly 10 years. |
|
| |
| Excess and surplus lines reinsurance | Any type of coverage that cannot be placed with an insurer admitted to do business in a certain jurisdiction. Risks placed in excess and surplus lines markets are often substandard as respects adverse loss experience, unusual, or unable to be placed in conventional markets due to a shortage of capacity. |
|
| |
| Excess of loss | Reinsurance or insurance that indemnifies the reinsured or insured against all or a specified portion of losses on underlying insurance policies in excess of a specified amount, which is called a "level" or "retention." Also known as non-proportional reinsurance. Excess of loss reinsurance is written in layers. A reinsurer or group of reinsurers accepts a layer of coverage up to a specified amount. The total coverage purchased by the cedant is referred to as a "program" and will typically be placed with predetermined reinsurers in pre-negotiated layers. Any liability exceeding the outer limit of the program reverts to the ceding company, which also bears the credit risk of a reinsurer's insolvency. |
|
| |
| Exclusions | Those risk, perils, or classes of insurance with respect to which the reinsurer will not pay loss or provide reinsurance, notwithstanding the other terms and conditions of reinsurance. |
|
| |
| Expense override | An amount paid to a ceding company in addition to the acquisition cost to compensate for overhead expenses. |
|
| |
| Frequency | The number of claims occurring during a given coverage period. |
|
| |
| Funds at Lloyd's | Funds of an approved form that are lodged and held in trust at Lloyd's as security for a member's underwriting activities. They comprise the members' deposit, personal reserve fund and special reserve fund and may be drawn down in the event that the member's syndicate level premium trust funds are insufficient to cover his liabilities. The amount of the deposit is related to the member's premium income limit and also the nature of the underwriting account. |
|
| |
| Generally Accepted Accounting Principles in the United States ("GAAP") | Accounting principles as set forth in opinions of the Accounting Principles Board of the American Institute of Certified Public Accountants and/or statements of the Financial Accounting Standards Board and/or their respective successors and which are applicable in the circumstances as of the date in question. |
|
| |
| Gross premiums written | Total premiums for insurance written and assumed reinsurance during a given period. |
|
| |
| Incurred but not reported ("IBNR") | Reserves for estimated losses that have been incurred by insureds and reinsureds but not yet reported to the insurer or reinsurer, including unknown future developments on losses that are known to the insurer or reinsurer. |
|
| |
| Insurance-linked securities | Financial instruments whose values are driven by (re)insurance loss events. For the Company, insurance-linked securities are generally linked to property losses due to natural catastrophes. |
|
| |
| International Financial Reporting Standards ("IFRS") | Accounting principles, standards and interpretations as set forth in opinions of the International Accounting Standards Board which are applicable in the circumstances as of the date in question. |
|
| |
| Layer | The interval between the retention or attachment point and the maximum limit of indemnity for which a reinsurer is responsible. |
|
| |
| Line | The amount of excess of loss reinsurance protection provided to an insurer or another reinsurer, often referred to as limit. |
|
| |
| Line of business | The general classification of insurance written by insurers and reinsurers, e.g. fire, allied lines, homeowners and surety, among others. |
|
| |
| Lloyd's | Depending on the context this term may refer to (a) the society of individual and corporate underwriting members that insure and reinsure risks as members of one or more syndicates (i.e., Lloyd's is not an insurance company); (b) the underwriting room in the Lloyd's building in which managing agents underwrite insurance and reinsurance on behalf of their syndicate members (in this sense Lloyd's should be understood as a market place); or (c) the Corporation of Lloyd's which regulates and provides support services to the Lloyd's market. |
|
| |
| Loss; losses | An occurrence that is the basis for submission and/or payment of a claim. Whether losses are covered, limited or excluded from coverage is dependent on the terms of the policy. |
|
| |
| Loss reserve | For an individual loss, an estimate of the amount the insurer expects to pay for the reported claim. For total losses, estimates of expected payments for reported and unreported claims. These may include amounts for claims expenses. |
|
| |
| Managing agent | An underwriting agent which has permission from Lloyd's to manage a syndicate and carry on underwriting and other functions for a member. |
|
| |
| Net claims and claim expenses | The expenses of settling claims, net of recoveries, including legal and other fees and the portion of general expenses allocated to claim settlement costs (also known as claim adjustment expenses or loss adjustment expenses) plus losses incurred with respect to net claims. |
|
| |
| Net claims and claim expense ratio | Net claims and claim expenses incurred expressed as a percentage of net earned premiums. |
|
| |
| Net premiums earned | The portion of net premiums written during or prior to a given period that was actually recognized as income during such period. |
|
| |
| Net premiums written | Gross premiums written for a given period less premiums ceded to reinsurers and retrocessionaires during such period. |
|
| |
| Non-proportional reinsurance | See "Excess of loss." |
|
| |
| Perils | This term refers to the causes of possible loss in the property field, such as fire, windstorm, collision, hail, etc. In the casualty field, the term "hazard" is more frequently used. |
|
| |
| Profit commission | A provision found in some reinsurance agreements that provides for profit sharing. Parties agree to a formula for calculating profit, an allowance for the reinsurer's expenses, and the cedant's share of such profit after expenses. |
|
| |
| Property insurance or reinsurance | Insurance or reinsurance that provides coverage to a person with an insurable interest in tangible property for that person's property loss, damage or loss of use. |
|
| |
| Property per risk | Reinsurance on a treaty basis of individual property risks insured by a ceding company. |
|
| |
| Proportional reinsurance | A generic term describing all forms of reinsurance in which the reinsurer shares a proportional part of the original premiums and losses of the reinsured. (Also known as pro-rata reinsurance, quota share reinsurance or participating reinsurance.) In proportional reinsurance the reinsurer generally pays the ceding company a ceding commission. The ceding commission generally is based on the ceding company's cost of acquiring the business being reinsured (including commissions, premium taxes, assessments and miscellaneous administrative expense) and also may include a profit factor. See also "Quota Share Reinsurance". |
|
| |
| Quota share reinsurance | A form of proportional reinsurance in which the reinsurer assumes an agreed percentage of each insurance policy being reinsured and shares all premiums and losses according with the reinsured. See also "Proportional Reinsurance". |
|
| |
| Reinstatement premium | The premium charged for the restoration of the reinsurance limit of a catastrophe contract to its full amount after payment by the reinsurer of losses as a result of an occurrence. |
|
| |
| Reinsurance | An arrangement in which an insurance company, the reinsurer, agrees to indemnify another insurance or reinsurance company, the ceding company, against all or a portion of the insurance or reinsurance risks underwritten by the ceding company under one or more policies. Reinsurance can provide a ceding company with several benefits, including a reduction in net liability on insurances and catastrophe protection from large or multiple losses. Reinsurance also provides a ceding company with additional underwriting capacity by permitting it to accept larger risks and write more business than would be possible without an equivalent increase in capital and surplus, and facilitates the maintenance of acceptable financial ratios by the ceding company. Reinsurance does not legally discharge the primary insurer from its liability with respect to its obligations to the insured. |
|
| |
| Reinsurance to Close | Also referred to as a RITC, it is a contract to transfer the responsibility for discharging all the liabilities that attach to one year of account of a syndicate into a later year of account of the same or different syndicate in return for a premium. |
|
| |
| Retention | The amount or portion of risk that an insurer retains for its own account. Losses in excess of the retention level are paid by the reinsurer. In proportional treaties, the retention may be a percentage of the original policy's limit. In excess of loss business, the retention is a dollar amount of loss, a loss ratio or a percentage. |
|
| |
| Retrocedant | A reinsurer who cedes all or a portion of its assumed insurance to another reinsurer. |
|
| |
| Retrocessional reinsurance; Retrocessionaire | A transaction whereby a reinsurer cedes to another reinsurer, the retrocessionaire, all or part of the reinsurance that the first reinsurer has assumed. Retrocessional reinsurance does not legally discharge the ceding reinsurer from its liability with respect to its obligations to the reinsured. Reinsurance companies cede risks to retrocessionaires for reasons similar to those that cause primary insurers to purchase reinsurance: to reduce net liability on insurances, to protect against catastrophic losses, to stabilize financial ratios and to obtain additional underwriting capacity. |
|
| |
| Risks | A term used to denote the physical units of property at risk or the object of insurance protection that are not perils or hazards. Also defined as chance of loss or uncertainty of loss. |
|
| |
| Risks attaching contracts | Contracts that cover claims that arise on underlying insurance policies that incept during the term of the reinsurance contract. |
|
| |
| Solvency II | A proposed set of regulatory requirements that would codify and harmonize the EU insurance and reinsurance regulation. Among other things, these requirements would impact the amount of capital that EU insurance and reinsurance companies would be required to hold. Solvency II was scheduled to come into effect on January 1, 2014, however this is expected to be delayed until at least January 1, 2016. |
|
| |
| Specialty lines | Lines of insurance and reinsurance that provide coverage for risks that are often unusual or difficult to place and do not fit the underwriting criteria of standard commercial products carriers. |
|
| |
| Statutory accounting principles | Recording transactions and preparing financial statements in accordance with the rules and procedures prescribed or permitted by Bermuda, U.S. state insurance regulatory authorities including the NAIC and/or in accordance with Lloyd's specific principles, all of which generally reflect a liquidating, rather than going concern, concept of accounting. |
|
| |
| Stop loss | A form of reinsurance under which the reinsurer pays some or all of a cedant's aggregate retained losses in excess of a predetermined dollar amount or in excess of a percentage of premium. |
|
| |
| Submission | An unprocessed application for (i) insurance coverage forwarded to a primary insurer by a prospective policyholder or by a broker on behalf of such prospective policyholder, (ii) reinsurance coverage forwarded to a reinsurer by a prospective ceding insurer or by a broker or intermediary on behalf of such prospective ceding insurer or (iii) retrocessional coverage forwarded to a retrocessionaire by a prospective ceding reinsurer or by a broker or intermediary on behalf of such prospective ceding reinsurer. |
|
| |
| Syndicate | A member or group of members underwriting (re)insurance business at Lloyd's through the agency of a managing agent or substitute agent to which a syndicate number is assigned. |
|
| |
| Treaty | A reinsurance agreement covering a book or class of business that is automatically accepted on a bulk basis by a reinsurer. A treaty contains common contract terms along with a specific risk definition, data on limit and retention, and provisions for premium and duration. |
|
| |
| Underwriting | The insurer's or reinsurer's process of reviewing applications submitted for insurance coverage, deciding whether to accept all or part of the coverage requested and determining the applicable premiums. |
|
| |
| Underwriting capacity | The maximum amount that an insurance company can underwrite. The limit is generally determined by a company's retained earnings and investment capital. Reinsurance serves to increase a company's underwriting capacity by reducing its exposure from particular risks. |
|
| |
| Underwriting expense ratio | The ratio of the sum of the acquisition expenses and operational expenses to net premiums earned. |
|
| |
| Underwriting expenses | The aggregate of policy acquisition costs, including commissions, and the portion of administrative, general and other expenses attributable to underwriting operations. |
|
| |
| Unearned premium | The portion of premiums written representing the unexpired portions of the policies or contracts that the insurer or reinsurer has on its books as of a certain date. |
AVAILABLE INFORMATION
We maintain a website at http://www.renre.com. The information on our website is not incorporated by reference in this Form 10-K.
We make available, free of charge through our website, our Annual Reports on Form 10-K, Quarterly Reports on Form 10-Q, Current Reports on Form 8-K and amendments to those reports filed or furnished pursuant to Section 13(a) or 15(d) of the Exchange Act as soon as reasonably practicable after we electronically file such material with, or furnish such material to, the Securities and Exchange Commission (the "SEC"). We also make available, free of charge from our website, our Audit Committee Charter, Compensation/Governance Committee Charter, Corporate Governance Guidelines, and Code of Ethics. Such information is also available in print for any shareholder who sends a request to RenaissanceRe Holdings Ltd., Attn: Office of the Corporate Secretary, P.O. Box HM 2527, Hamilton, HMGX, Bermuda. Reports filed with the SEC may also be viewed or obtained at the SEC Public Reference Room at 100 F Street, N.E., Washington, DC 20549. Information on the operation of the SEC Public Reference Room may be obtained by calling the SEC at 1-800-SEC-0330. The SEC maintains an internet site that contains reports, proxy and information statements, and other information regarding issuers, including the Company, that file electronically with the SEC. The address of the SEC's website is http://www.sec.gov.
ITEM 1A. RISK FACTORS
Factors that could cause our actual results to differ materially from those in the forward-looking statements contained in this Form 10-K and other documents we file with the SEC include the following:
Risks Related to Our Company
Our exposure to catastrophic events and other exposures that we cover could cause our financial results to vary significantly from one period to the next.
Our largest product based on total gross premiums written is property catastrophe reinsurance. We also sell lines of specialty reinsurance products and insurance products that are exposed to catastrophe risk. We therefore have a large overall exposure to natural and man-made disasters, such as earthquakes, hurricanes, tsunamis, winter storms, freezes, floods, fires, tornados, hailstorms, drought and other natural or man-made disasters, such as acts of terrorism. Our relative exposure to catastrophe risk has recently increased, including as a result of the sale of substantially all of our U.S.-based insurance operations in early 2011, which diminished the diversification of our exposure to non-catastrophe perils to a degree. As a result, our operating results have historically been, and we expect will continue to be, significantly affected by relatively few events of a large magnitude.
We expect claims from catastrophic events to cause substantial volatility in our financial results for any fiscal quarter or year; moreover, catastrophic claims could adversely affect our financial condition, results of operations and cash flows. Our ability to write new business could also be affected. We believe that factors including increases in the value and geographic concentration of insured property, particularly along coastal regions, the increasing risk of extreme weather events reflecting changes in climate and ocean temperatures, and the effects of inflation may continue to increase the severity of claims from catastrophic events in the future.
From time to time, we expect to have greater exposures in one or more specific geographic areas than our overall share of the worldwide market would otherwise suggest. Accordingly, when and if catastrophes occur in these areas, we may experience relatively more severe net negative impacts from such events than our competitors. In particular, we have historically had a relatively large percentage of our coverage exposures concentrated in the U.S. southeast, and may develop other significant exposures in catastrophe-exposed zones in the future.
Through Renaissance Trading and REAL, we sell certain financial products primarily to address weather risks, and engage in certain weather, energy and commodity derivatives trading activities. The trading markets for these derivatives are generally linked to energy and agriculture commodities, weather and other natural phenomena. The results from these activities have been, and we expect will continue to be, subject to volatility, both potentially as a result of the occurrence or non-occurrence of the event or events which might trigger counterparty payments under these contracts, and as a result of the potential for variance in the reportable fair value of these contracts between periods as a result of a wide number of potential factors. While we seek to purchase financial protection for a portion of REAL's exposures, we cannot assure you we will succeed in doing so, or in monitoring the protections in place, or that these instruments will perform as we expect. It is possible that our exposures through Renaissance Trading and REAL are more volatile, or more correlated with our reinsurance exposures, than we estimate. There can be no assurance that our Renaissance Trading or REAL business will have a positive impact on our operating results or financial condition, and such businesses may negatively impact our operating results or financial condition in any given fiscal period, perhaps materially so.
Our claims and claim expense reserves are subject to inherent uncertainties.
Our claims and claim expense reserves reflect our estimates, using actuarial and statistical projections at a given point in time, of our expectations of the ultimate settlement and administration costs of claims incurred. Although we use actuarial and computer models as well as historical reinsurance and insurance industry loss statistics, we also rely heavily on management's experience and judgment to assist in the establishment of appropriate claims and claim expense reserves. However, because of the many assumptions and estimates involved in establishing reserves, the reserving process is inherently uncertain. Our estimates and judgments are based on numerous factors, and may be revised as additional experience and other data become available and are reviewed, as new or improved methodologies are developed, as
loss trends and claims inflation impact future payments, or as current laws or interpretations thereof change.
Our specialty reinsurance operations are expected to produce claims which at times can only be resolved through lengthy and unpredictable litigation. The measures required to resolve such claims, including the adjudication process, present more reserve challenges than property losses (which, on the whole, tend to be reported comparatively more promptly and to be settled within a relatively shorter period of time, although every catastrophic event is comprised of a unique set of circumstances). Actual net claims and claim expenses paid and reported may deviate, perhaps materially, from the reserve estimates reflected in our financial statements.
We expect that some of our assumptions or estimates will prove to be inaccurate, and that our actual net claims and claim expenses paid and reported will differ, perhaps materially, from the reserve estimates reflected in our financial statements. To the extent that our actual claims and claim expenses exceed our expectations, we would be required to increase claims and claim expense reserves. This would reduce our net income by a corresponding amount in the period in which the deficiency is identified. To the extent that our actual claims and claim expenses are lower than our expectations, we would be required to decrease claims and claim expense reserves and this would increase our net income.
Estimates of losses are based on, among other things, a review of potentially exposed contracts, information reported by and discussions with counterparties, and our estimate of losses related to those contracts and are subject to change as more information is reported and becomes available.
As an example, our estimates of losses from catastrophic events are based on factors including currently available information derived from claims information from certain customers and brokers, industry assessments of losses from the events, proprietary models, and the terms and conditions of our contracts. Due to the magnitude and unusual complexity of the legal and claims issues relating to these events, particularly storm Sandy, the 2011 Thailand flooding, and the 2011 and 2010 earthquakes, meaningful uncertainty remains regarding total covered losses for the insurance industry and, accordingly, several of the key assumptions underlying our loss estimates. In addition, actual losses from these events may increase if our reinsurers or other obligors fail to meet their obligations to us. Our actual losses from these events will likely vary, perhaps materially, from these current estimates due to the inherent uncertainties in reserving for such losses, including the nature of the available information, the potential inaccuracies and inadequacies in the data provided by customers and brokers, the potential lengthy claims development period, the inherent uncertainty of modeling techniques and the application of such techniques, the effects of any demand surge on claims activity and complex coverage and other legal issues.
A decline in the ratings assigned to our financial strength may adversely impact our business, perhaps materially so.
Third party rating agencies assess and rate the financial strength, claims paying ability and enterprise wide risk management of reinsurers and insurers, such as Renaissance Reinsurance, DaVinci, Glencoe, Top Layer Re and certain of our other operating subsidiaries and joint ventures. These ratings are based upon criteria established by the rating agencies. Periodically, the rating agencies evaluate us and may downgrade or withdraw their financial strength ratings in the future if we do not continue to meet the criteria of the ratings previously assigned to us. The financial strength and claims paying ratings assigned by rating agencies to reinsurance or insurance companies are based upon factors relevant to policyholders and are not directed toward the protection of investors.
These ratings are subject to periodic review and may be revised or revoked by the agencies which issue them. In addition, from time to time one or more rating agencies have effected changes in their capital models and rating methodologies, which have generally served to increase the amounts of capital required to support the ratings, and it is possible that legislation arising as a result of the financial crisis that preceded the ongoing period of relative economic weakness may result in additional changes. Negative ratings actions in the future could have an adverse effect on our ability to fully realize the market opportunities we currently expect to participate in. In addition, it is increasingly common for our reinsurance contracts to contain provisions permitting our customers to cancel coverage pro-rata if our relevant operating subsidiary is downgraded below a certain rating level. Whether a client would exercise this right would depend, among other factors, on the reason for such a downgrade, the extent of the downgrade, the prevailing market conditions and the pricing and availability of replacement reinsurance coverage.
Therefore, in the event of a downgrade, it is not possible to predict in advance the extent to which this cancellation right would be exercised, if at all, or what effect such cancellations would have on our financial condition or future operations, but such effect potentially could be material. To date, we are not aware that we have experienced such a cancellation.
Our ability to compete with other reinsurers and insurers, and our results of operations, could be materially adversely affected by any such ratings downgrade. For example, following a ratings downgrade we might lose customers to more highly rated competitors or retain a lower share of the business of our customers.
For the current ratings of certain of our subsidiaries and joint ventures, refer to "Item 7. Management's Discussion and Analysis of Financial Condition and Results of Operations, Liquidity and Capital Resources, Ratings" for additional information.
The emergence of matters which may impact certain of our coverages, such as the asserted trend toward potentially significant climate change and the ongoing period of relative economic weakness, could cause us to underestimate our exposures and potentially adversely impact our financial results, perhaps significantly.
In our Reinsurance business, we use analytic and modeling capabilities that help us to assess the risk and return of each reinsurance contract in relation to our overall portfolio of reinsurance contracts. See "Item 1. Business, Underwriting and Enterprise Risk Management."
In general, our techniques for evaluating catastrophe risk are much better developed than those for other classes of risk in businesses that we have entered into more recently. Our models and databases may not accurately address the emergence of a variety of matters which might be deemed to impact certain of our coverages. Accordingly, our models may understate the exposures we are assuming and our financial results may be adversely impacted, perhaps significantly. These risks may increase if we succeed in increasing the contributions from our specialty reinsurance unit or from our Lloyd's segment, either on an absolute or relative basis.
We believe, and believe the consensus view of current scientific studies substantiates, that changes in climate conditions, primarily increasing global temperatures and expected sea levels, are likely to increase the severity and possibly the frequency of natural catastrophes relative to the historical experience over the past 100 years. Coupled with currently projected demographic trends in catastrophe-exposed regions, we currently estimate that this expected increase in tropical cyclone intensity over coming periods may significantly increase the average economic value of expected losses, increase the number of people exposed per year to natural disasters and in general exacerbate disaster risk, including risks to infrastructure, global supply chains and agricultural production.
Accordingly, we currently estimate that these trends may increase claims under our property and casualty lines of business, particularly with respect to properties located in coastal and flood-exposed areas, among others. Furthermore, certain energy and agriculture-related products that we offer could also be negatively impacted by dramatically changing climactic conditions. While we believe a substantial portion of our insureds may be adversely impacted by climate change, we have taken certain measures, to the extent permissible by law and prevailing market conditions, to mitigate against such losses by giving consideration to these risks in our underwriting decisions. We continuously monitor and adjust, as we believe appropriate, our risk management models to reflect our judgment of how to interpret current developments and information such as these studies. However, it is possible that, even after these assessments, we will have underestimated the scale of the risks, such as the frequency or severity of hurricanes or other catastrophes or may have failed to identify new or increased risks. To the extent broad environmental factors, exacerbated by climate change or otherwise, lead to increases in likely insured losses, particularly if those losses exceed expectations and the prior estimates of market participants, regulators or other stakeholders, the markets and clients we serve may be disrupted and adversely impacted, and we may be adversely affected, directly or indirectly. Further, certain of our investments such as insurance-linked securities and property catastrophe managed joint ventures related to hurricane coverage could also be adversely impacted by climate change.
Emerging claim and coverage issues, or other litigation, could adversely affect us.
Unanticipated developments in the law as well as changes in social and environmental conditions could potentially result in unexpected claims for coverage under our insurance and reinsurance contracts. These developments and changes may adversely affect us, perhaps materially so. For example, we could be subject to developments that impose additional coverage obligations on us beyond our underwriting intent, particularly in Florida or Texas, or to increases in the number or size of claims to which we are subject. We believe our property catastrophe results have been adversely impacted over recent periods by increasing primary claims level fraud and abuses, as well as other forms of social inflation, and that these trends may continue.
With respect to our specialty reinsurance operations, these legal, social and environmental changes may not become apparent until some point in time after their occurrence. For example, we could be deemed liable for losses arising out of a matter, such as the potential for industry losses arising out of a pandemic illness, that we had not anticipated or had attempted to contractually exclude. Moreover, irrespective of the clarity and inclusiveness of policy language, there can be no assurance that a court or arbitration panel will limit enforceability of policy language or not issue a ruling adverse to us. Our exposure to these uncertainties could be exacerbated by the increased willingness of some market participants to dispute insurance and reinsurance contract and policy wordings. Alternatively, potential efforts by us to exclude such exposures could, if successful, reduce the market's acceptance of our related products. The full effects of these and other unforeseen emerging claim and coverage issues are extremely hard to predict. As a result, the full extent of our liability under our coverages may not be known for many years after a contract is issued. Our exposure to this uncertainty will grow as our "long-tail" casualty businesses grow, because in these lines claims can typically be made for many years, making them more susceptible to these trends than our traditional catastrophe business, which is typically more "short-tail." While we continually seek to improve the effectiveness of our contracts and claims capabilities, we may fail to mitigate our exposure to these growing uncertainties.
Because we depend on a few insurance and reinsurance brokers in our Reinsurance segment for a preponderance of our revenue, loss of business provided by them could adversely affect us.
Our Reinsurance business markets insurance and reinsurance products worldwide exclusively through insurance and reinsurance brokers. Three brokerage firms accounted for 84.6% of our Reinsurance segment gross premiums written for the year ended December 31, 2012 (2011 - 90.7%). Subsidiaries and affiliates of AON Benfield, Marsh Inc. and the Willis Group accounted for approximately 51.5%, 21.4% and 11.7%, respectively, of our Reinsurance segment gross premiums written in 2012 (2011 - 56.1%, 21.9% and 12.7%, respectively). The loss of a substantial portion of the business provided by our brokers would have a material adverse effect on us. Our ability to market our products could decline as a result of any loss of the business provided by these brokers and it is possible that our premiums written would decrease.
We are exposed to counterparty credit risk, including with respect to reinsurance brokers.
In accordance with industry practice, we pay virtually all amounts owed on claims under our policies to reinsurance brokers, and these brokers, in turn, pay these amounts over to the insurers that have reinsured a portion of their liabilities with us (we refer to these insurers as ceding insurers). Likewise, premiums due to us by ceding insurers are virtually all paid to brokers, who then pass such amounts on to us. In many jurisdictions, if a broker were to fail to make such a payment to a ceding insurer, we would remain liable to the ceding insurer for the deficiency. Conversely, in many jurisdictions, when the ceding insurer pays premiums for these policies to reinsurance brokers for payment over to us, these premiums are considered to have been paid by the cedants and the ceding insurer will no longer be liable to us for those amounts, whether or not we have actually received the premiums. Consequently, in connection with the settlement of reinsurance balances, we assume a substantial degree of credit risk associated with brokers around the world.
We are also exposed to the credit risk of our customers, who, pursuant to their contracts with us, frequently pay us over time. Our premiums receivable at December 31, 2012 totaled $491.4 million, and these amounts are generally not collateralized. At December 31, 2012, we had recorded $192.5 million of reinsurance recoverables, net of a valuation allowance of $4.5 million for uncollectible recoverables. We cannot assure you that such recoverables will ever be collected or that additional amounts will not be required to be written down in 2012 or future periods. To the extent our customers or retrocedants become
unable to pay future premiums, we would be required to recognize a downward adjustment to our premiums receivable in our financial statements. We cannot assure you that all of such amounts will ever be collected or that additional amounts will not be required to be written down in 2013 or future periods.
As a result of the ongoing period of relative economic weakness, our consolidated credit risk, reflecting our counterparty dealings with agents, brokers, customers, retrocessionaires, capital providers, parties associated with our investment portfolio and others has increased, perhaps materially so.
We undertake energy related trading activities through our operating subsidiaries, including Renaissance Trading and REAL, where counterparty credit risk is an important factor. These operating subsidiaries execute weather, energy and commodity derivative transactions whereby the value of the derivatives at any point in time is dependent upon not only the market but also the viability of the counterparty. The failure or perceived weakness of any of our counterparties has the potential to expose us to risk of loss in these situations. Although these operating subsidiaries have credit risk management policies and procedures, we cannot assure you that any of the policies or procedures will be effective. While many of the original trading positions established in our energy related trading business are partially or substantially hedged, the effectiveness of those hedges depends on the willingness and ability to pay of the parties with whom we establish the hedge positions. The failure of our policies and procedures, or the failure of one or more of our counterparties, could result in losses that substantially exceed our expectations and could have a material adverse effect on our results of operations.
The ongoing relative weakness in business and economic conditions generally or specifically in the principal markets in which we do business could adversely affect our business and operating results.
The U.S. and numerous other leading markets around the world continue to experience challenging economic conditions, and, although conditions may be improving, we believe meaningful risk remains of returned deterioration in economic conditions, including substantial and continuing financial market disruptions. In particular, global economic markets, including many of the key markets which we serve, may continue to be adversely impacted by the ongoing financial and fiscal instability of several European jurisdictions and, increasingly, the Eurozone market as a whole, the rising prices for various agricultural and other commodities, and other factors. While many governments, including the U.S. federal government, have taken substantial steps to stabilize economic conditions in an effort to increase liquidity and capital availability, if economic conditions should weaken, the business environment in our principal markets would be further adversely affected, which accordingly could adversely affect demand for the products sold by us or our customers. Economic conditions could also be adversely affected by an increase in global political instability, which might impact the price of energy products, agricultural goods and other commodities, or otherwise harm the markets in which we participate. In addition, during an economic downturn we believe our consolidated credit risk, reflecting our counterparty dealings with agents, brokers, customers, retrocessionaires, capital providers and parties associated with our investment portfolio, among others, is likely to be increased.
U.S. taxing authorities could contend that one or more of our Bermuda subsidiaries are subject to U.S. corporate income tax, as a result of changes in law or regulations, or otherwise.
If the IRS were to contend successfully that one or more of our Bermuda subsidiaries is engaged in a trade or business in the U.S., such subsidiary would, to the extent not exempted from tax by the U.S.-Bermuda income tax treaty, be subject to U.S. corporate income tax on that portion of its net income treated as effectively connected with a U.S. trade or business, as well as the U.S. corporate branch profits tax. Although we would vigorously contest such an assertion, if we were ultimately held to be subject to taxation, our earnings would correspondingly decline.
In addition, benefits of the U.S.-Bermuda income tax treaty which may limit any such tax to income attributable to a permanent establishment maintained by one or more of our Bermuda subsidiaries in the U.S. are only available to any of such subsidiaries if more than 50% of its shares are beneficially owned, directly or indirectly, by individuals who are Bermuda residents or U.S. citizens or residents. Our Bermuda subsidiaries may not be able to continually satisfy such beneficial ownership test or be able to establish it to the satisfaction of the IRS. Finally, it is unclear whether the U.S.-Bermuda income tax treaty (assuming satisfaction of the beneficial ownership test) applies to income other than premium income, such as investment income.
Changes in U.S. tax law or regulations could increase the costs of our products and services or otherwise reduce our profitability.
On February 7, 2013, U.S. Senator Bernard Sanders introduced legislation in the U.S. Senate entitled the "Corporate Tax Dodging Prevention Act". Similar legislation was also proposed in 2012, 2011 and 2010. If enacted, this legislation would, among other things, cause to be treated as a U.S. corporation for U.S. tax purposes generally, certain corporate entities if the "management and control" of such a corporation is, directly or indirectly, treated as occurring primarily within the U.S. The proposed legislation provides that a corporation will be so treated if substantially all of the executive officers and senior management of the corporation who exercise day-to-day responsibility for making decisions involving strategic, financial, and operational policies of the corporation are located primarily within the U.S. To date, this legislation has not been approved by either the House of Representatives or the Senate. However, we can provide no assurance that this legislation or similar legislation will not ultimately be adopted. While we do not believe that the legislation would negatively impact us, it is possible that an adopted bill would include additional or expanded provisions which could negatively impact us, or that the interpretation or enforcement of the current proposal, if enacted, would be more expansive or adverse than we currently estimate.
A decline in our investment performance could reduce our profitability and hinder our ability to pay claims promptly in accordance with our strategy.
We have historically derived a meaningful portion of our income from our invested assets, which are comprised of, among other things, fixed maturity securities, such as bonds, asset-backed securities, mortgage-backed securities and investments in bank loan funds, hedge funds and private equity partnerships. Accordingly, our financial results are subject to a variety of investment risks, including risks relating to general economic conditions, market volatility, interest rate fluctuations, foreign currency risk, liquidity risk and credit and default risk. Additionally, with respect to certain of our investments, we are subject to pre-payment or reinvestment risk.
Our invested assets have grown over the years and have come to effect a comparably greater contribution to our financial results. Accordingly, a failure to successfully execute our investment strategy could have a material adverse effect on our overall results. In the event of a significant or total loss in our investment portfolio, our ability to pay any claims promptly in accordance with our strategy could be adversely affected.
The market value of our fixed maturity investments is subject to fluctuation depending on changes in various factors, including prevailing interest rates and widening credit spreads.
Increases in interest rates could cause the market value of our investment portfolio to decrease, perhaps substantially. Conversely, a decline in interest rates could reduce our investment yield, which would reduce our overall profitability. Interest rates are highly sensitive to many factors, including governmental monetary policies, domestic and international economic and political conditions and other factors beyond our control. Any measures we take that are intended to manage the risks of operating in a changing interest rate environment may not effectively mitigate such interest rate sensitivity.
A portion of our investment portfolio is allocated to other classes of investments which we expect to have different risk characteristics than our investments in traditional fixed maturity securities and short term investments. These other classes of investments include interests in alternative investment vehicles such as private equity partnerships, hedge funds, senior secured bank loan funds and catastrophe bonds and are recorded on our consolidated balance sheet at fair value. For the aforementioned classes of investments, the fair value of the assets comprising the portfolio of an investment vehicle, and likewise the net asset value of the investment vehicle itself, are generally established on the basis of the valuation criteria applied by the investment managers as set forth in the governing documents of such investment vehicles. Such valuations may differ significantly from the values that would have been used had ready markets existed for the shares, partnership interests, notes or other securities representing interests in the relevant investment vehicles. Interests in many of the investment classes described above are subject to restrictions on redemptions and sales which are determined by the governing documents and limit our ability to liquidate these investments in the short term. These classes of investments expose us to market risks including interest rate risk, foreign currency risk, equity price risk and credit risk. The performance of these classes of investments is also dependent on the individual investment managers and the investment strategies. It is possible that the investment managers will leave and/or the investment strategies will become ineffective or that such managers will fail to follow our investment guidelines. Any of the foregoing could result in a
material adverse change to our investment performance, and accordingly adversely affect our financial results.
In addition to the foregoing, we may from time to time re-evaluate our investment approach and guidelines and explore investment opportunities in respect of other asset classes not previously discussed above, including, without limitation, by expanding our relatively small portfolio of direct investments in the equity markets. Any such investments could expose us to systemic and price volatility risk, interest rate risk and other market risks. Any investment in equity securities carries with it inherent volatility and there can be no assurance that such an investment will prove profitable and we could, in fact, lose the value of our investment. Accordingly, any such investment could impact our financial results, perhaps materially, over both the short and the long term.
The loss of key senior members of management could adversely affect us.
Our success has depended, and will continue to depend, in substantial part upon our ability to attract and retain our senior officers. The loss of services of members of our senior management team in the future, and the uncertain transition of new members of our senior management team, as applicable, may strain our ability to execute our strategic initiatives. Given our reliance on a relatively small management team, the loss of one or more of our senior officers could adversely impact our business, by, for example, making it more difficult to retain customers, attract or maintain our capital support, or other needs of our business, which depend in part on the service of the departing officer. We do not currently maintain key man life insurance policies with respect to any of our employees.
In addition, our ability to execute our business strategy is dependent on our ability to attract and retain a staff of qualified underwriters and service personnel. The location of our global headquarters in Bermuda may impede our ability to recruit and retain highly skilled employees. Under Bermuda law, non-Bermudians (other than spouses of Bermudians, holders of Permanent Residents' Certificates and holders of Working Residents' Certificates) may not engage in any gainful occupation in Bermuda without a valid government work permit. Substantially all of our officers are working in Bermuda under work permits that will expire over the next three years. The Bermuda government could refuse to extend these work permits, which would adversely impact us. A work permit is issued with an expiry date (up to ten years) and no assurances can be given that any work permit will be issued or, if issued, renewed upon the expiration of the relevant term. If any of our senior officers or key contributors were not permitted to remain in Bermuda, or if we experience delays or failures to obtain permits for a number of our professional staff, our operations could be disrupted and our financial performance could be adversely affected as a result.
In late 2011, the Bermuda Parliament passed the Incentives for Job Makers Act 2011 (the "Job Makers Act"), which provides that a limited number of non-Bermudian executives of Bermuda companies may, subject to their and their company's meeting the requirements under the Job Makers Act, apply for permission to reside and work in Bermuda exempt from the requirement for a work permit. Eligibility to apply for status under the Job Makers Act commences in January 2015; at this time we cannot assure you that the Job Makers Act diminishes our risks of retaining and attracting senior executives to our Bermuda headquarters location.
Concerns over U.S. fiscal policy, as well as any further downgrade of U.S. government securities by credit rating agencies and the economic crisis in Europe could have a material adverse effect on our business, financial condition and results of operations.
Financial markets have recently been affected by concerns over U.S. fiscal policy. Although the U.S. government passed legislation at the beginning of 2013 averting the so-called "fiscal cliff" (which, in the absence of such legislation, would have resulted in automatic tax increases and spending cuts at the end of 2012), significant uncertainty remains relating to the stability of the U.S. fiscal and budgetary policy. This uncertainty, together with the continuing U.S. debt and budget deficit concerns, as well as recent issues relating to sovereign debt conditions in Europe, continue to contribute to the possibility of additional economic slowdowns and/or credit rating downgrades. The impact of U.S. fiscal uncertainty, or any further downgrades to the U.S. government's sovereign credit rating, or its perceived creditworthiness, or the impact of the recent crisis in Europe with respect to the ability of certain EU countries to continue to service their sovereign debt obligations, is inherently unpredictable and could adversely affect U.S. and global financial markets and economic conditions. In addition, any further downgrade of U.S. government securities by credit rating agencies, and/or a worsening or expansion of the recent crisis in Europe, may
have an adverse impact on fixed income markets, which in turn could cause our net income to decline or have a material adverse effect on our financial condition.
Further, although we do not directly hold a material amount of investment securities related to distressed Eurozone countries, we believe that many of our customers and counterparties hold positions in these instruments. If the European economic situation were to worsen, or expand to other countries within Europe, we would be subject to enhanced risk of counterparty failure as well as related problems arising from a lack of liquidity in our markets. A worsening of the European economic situation may affect other aspects of our business for a variety of reasons. For example, such an event may cause the value of the Euro to deteriorate, which could cause a member country to exit from the EU and introduce a new currency to replace the Euro. If such new currency is undervalued in relation to the Euro, customers and/or brokers in such country may be unable to pay the amounts owed to us under our existing contracts with them and they may seek to renegotiate such contracts in the new currency on terms that are less favorable to us.
There can be no assurance that governmental or other measures to aid economic recovery will be effective. These developments and the government's credit concerns in general, could cause interest rates and borrowing costs to rise, which may negatively impact our ability to access the debt markets on favorable terms. In addition, any decreased credit rating of U.S. government securities could create broader financial turmoil and uncertainty, which may exert downward pressure on the price of our common shares. Continued adverse economic conditions could have a material adverse effect on our business, financial condition and results of operations.
Some of our investments are relatively illiquid and are in asset classes that may experience significant market valuation fluctuations.
Although we invest primarily in highly liquid securities in order to ensure our ability to pay valid claims in a prompt manner, we do hold certain investments that may lack liquidity, such as our alternative investments, which include, but are not limited to, private equity investments, hedge funds, bank loan fund investments, insurance-linked securities and certain high-yield securities. If we require significant amounts of cash on short notice in excess of our normal cash requirements or are required to post or return collateral in connection with our investment portfolio, we may have difficulty selling these investments in a timely manner, be forced to sell them for less than we otherwise would have been able to realize, or both.
At times, the reported value of our relatively illiquid types of investments and of our high quality, generally more liquid asset classes, do not necessarily reflect the lowest current market price for the asset. If we were forced to sell certain of our assets in the current market, there can be no assurance that we will be able to sell them for the prices at which we have recorded them and we may be forced to sell them at significantly lower prices.
A reduction in market liquidity may make it difficult to value certain of our securities as trading becomes less frequent. As such, valuations may include assumptions or estimates that may be more susceptible to significant period-to-period changes which could have a material adverse effect on our consolidated results of operations or financial condition.
The determination of impairments taken on our investments, investments in other ventures, under equity method, goodwill and other intangible assets and loans is highly subjective and could materially impact our financial position or results of operations.
The determination of impairments taken varies by type and is based upon our periodic evaluation and assessment of known and inherent risks associated with the respective asset class. Such evaluations and assessments are revised as conditions change and new information becomes available. Management updates its evaluations regularly and reflects impairments in operations as such evaluations are revised. There can be no assurance that our management has accurately assessed the level of impairments taken in our financial statements. Furthermore, additional impairments may need to be taken in the future, which could materially impact our financial position or results of operations. Historical trends may not be indicative of future impairments.
Retrocessional reinsurance may become unavailable on acceptable terms.
As part of our risk management, we buy reinsurance for our own account. This type of insurance when purchased to protect reinsurance companies is known as "retrocessional reinsurance." From time to time, market conditions have limited, and in some cases have prevented, insurers and reinsurers from obtaining
reinsurance. Accordingly, we may not be able to obtain our desired amounts of retrocessional reinsurance. In addition, even if we are able to obtain such retrocessional reinsurance, we may not be able to negotiate terms as favorable to us as in the past. This could limit the amount of business we are willing to write, or decrease the protection available to us as a result of large loss events.
When we purchase reinsurance or retrocessional reinsurance for our own account, the insolvency, inability or reluctance of any of our reinsurers to make timely payments to us under the terms of our reinsurance agreements could have a material adverse effect on us. Generally, we believe that the "willingness to pay" of some reinsurers and retrocessionaires is declining, and that the overall industry ability to pay may be impacted by renewed weakness in the financial and credit markets. This risk may be more significant to us at present than at many times in the past. A large portion of our reinsurance protection is concentrated with a relatively small number of reinsurers. The risk of such concentration of retrocessional coverage may be increased by recent and future consolidation within the industry.
We may be adversely impacted by inflation.
We monitor the risk that the principal markets in which we operate could experience increased inflationary conditions, which would, among other things, cause loss costs to increase, and impact the performance of our investment portfolio. The onset, duration and severity of an inflationary period cannot be estimated with precision. The sovereign debt crisis in Europe and the related financial restructuring efforts has, among other factors, made it more difficult to predict the inflationary environment.
Our utilization of third parties to support our business exposes us to operational and financial risks.
With respect to our Reinsurance operations we do not separately evaluate each primary risk assumed under our reinsurance contracts and, accordingly, like other reinsurers, are heavily dependent on the original underwriting decisions made by our ceding companies. We are therefore subject to the risk that our customers may not have adequately evaluated the risks to be reinsured, or that the premiums ceded to us will not adequately compensate us for the risks we assume, perhaps materially so. We have recently increased, and are seeking to continue to increase, the absolute and, potentially, the relative amount of proportional coverages we offer, which will increase our aggregate exposure to risks of this nature.
Operational risks, including systems or human failures, are inherent in business, including ours.
We are subject to operational risks including fraud, employee errors, failure to document transactions properly or to obtain proper internal authorization, failure to comply with regulatory requirements or obligations under our agreements, failure of our service providers, such as investment custodians, actuaries, IT providers, etc., to comply with our service agreements, or information technology failures. Losses from these risks may occur from time to time and may be significant.
Our modeling, underwriting and information technology and application systems are critical to our success. Moreover, our proprietary technology and application systems have been an important part of our underwriting strategy and our ability to compete successfully. We have also licensed certain systems and data from third parties. We cannot be certain that we will have access to these, or comparable, service providers, or that our information technology or application systems will continue to operate as intended. While we have implemented disaster recovery and other business contingency plans, a defect or failure in our internal controls, information technology or application systems could result in reduced or delayed revenue growth, higher than expected losses, management distraction, or harm to our reputation. We believe appropriate controls and mitigation procedures are in place to prevent significant risk of defect in our internal controls, information technology and application systems, but internal controls provide only reasonable, not absolute, assurance as to the absence of errors or irregularities and any ineffectiveness of such controls and procedures could have a material adverse effect on our business.
We are exposed to risks in connection with our management of third party capital.
Our operating subsidiaries may owe certain legal duties and obligations to third party investors (including reporting obligations) and are subject to a variety of often complex laws and regulations relating to the management of third party capital. Compliance with some of these laws and regulations, all of which are subject to change, requires significant management time and attention. Although we seek to continually monitor our policies and procedures to attempt to ensure compliance, faulty judgments, simple errors or mistakes, or the failure of our personnel to adhere to established policies and procedures, could result in our failure to comply with applicable laws or regulations which could result in significant liabilities, penalties
or other losses to the Company, and seriously harm our business and results of operations. In addition to the foregoing, our third party capital providers may redeem their interests in our joint ventures, which could materially impact the financial condition of such joint ventures, and could in turn materially impact our financial condition and results of operations. Moreover, we can provide no assurance that we may be able to attract and raise additional third party capital for our existing joint ventures or for potential new joint ventures and therefore we may forego existing and/or potential attractive fee income and other income generating opportunities.
We may be adversely affected by foreign currency fluctuations.
Our functional currency is the U.S. dollar; however, as we expand geographically, an increasing portion of our premium is, and likely will be, written in currencies other than the U.S. dollar and a portion of our claims and claim expense reserves is also in non-U.S. dollar currencies. Moreover, we maintain a portion of our cash and investments in currencies other than the U.S. dollar. Although we generally seek to hedge significant non-U.S. dollar positions, we may, from time to time, experience losses resulting solely from fluctuations in the values of these foreign currencies, which could cause our consolidated earnings to decrease. In addition, failure to manage our foreign currency exposures could cause our results of operations to be more volatile. The sovereign debt crisis in Europe and the related financial restructuring efforts, which may cause the value of the Euro to deteriorate, may magnify these risks.
We may require additional capital in the future, which may not be available or only available on unfavorable terms.
We monitor our capital adequacy on a regular basis. The capital requirements of our business depend on many factors, including our ability to write new business successfully and to establish premium rates and reserves at levels sufficient to cover losses. Our ability to sell our reinsurance, insurance and other products is largely dependent upon the quality of our claims paying and financial strength ratings as evaluated by independent rating agencies. To the extent that our existing capital is insufficient to support our future operating requirements, we may need to raise additional funds through financings or limit our growth. While we do not currently expect to require additional external capital in the near term due to our strong current capital position, our operations are subject to the ever present potential for significant volatility in capital due to our exposure to potentially significant catastrophic events. Any further equity or debt financing, or capacity needed for letters of credit, if available at all, may be on terms that are unfavorable to us. Our ability to raise such capital successfully would depend upon the facts and circumstances at the time, including our financial position and operating results, market conditions, and applicable legal issues. If we are unable to obtain adequate capital if and when needed, our business, results of operations and financial condition would be adversely affected. In addition, in the future we may be unable to raise new capital for our managed joint ventures and other private alternative investment vehicles, which would reduce our future fee income and market capacity.
The covenants in our debt agreements limit our financial and operational flexibility, which could have an adverse effect on our financial condition.
We have incurred indebtedness, and may incur additional indebtedness in the future. At December 31, 2012, we had an aggregate of $351.8 million of indebtedness outstanding and $507.2 million of outstanding letters of credit. In addition, we have in place committed debt facilities which would permit us to borrow, subject to their respective terms and conditions, up to another $167.6 million. Our indebtedness primarily consists of publicly traded notes and letter of credit and revolving credit facilities. For more details on our indebtedness, see "Item 7. Management's Discussion and Analysis of Financial Condition and Results of Operations, Capital Resources".
The agreements covering our indebtedness, particularly our bank loans, contain covenants that limit our ability, among other things, to borrow money, make particular types of investments or other restricted payments, sell assets, merge or consolidate. These agreements also require us to maintain specific financial ratios. If we fail to comply with these covenants or meet these financial ratios, the lenders under our credit facilities could declare a default and demand immediate repayment of all amounts owed to them, cancel their commitments to lend or issue letters of credit, or both, and require us to pledge additional or a different type of collateral.
Regulatory challenges in the U.S. or elsewhere to our Bermuda operations' claims of exemption from certain insurance regulation could restrict our ability to operate, increase our costs, or otherwise adversely impact us.
Renaissance Reinsurance, DaVinci and Top Layer Re are not licensed or admitted in any jurisdiction except Bermuda. Renaissance Reinsurance, Glencoe, DaVinci and Top Layer Re each conduct business only from their principal offices in Bermuda and do not maintain an office in the U.S. The insurance and reinsurance regulatory framework continues to be subject to increased scrutiny in many jurisdictions, including the U.S. and Europe. If our Bermuda insurance or reinsurance operations become subject to the insurance laws of any state in the U.S., jurisdictions in the EU, or elsewhere, we could face inquiries or challenges to the future operations of these companies.
Moreover, we could be put at a competitive disadvantage in the future with respect to competitors that are licensed and admitted in U.S. jurisdictions. Among other things, jurisdictions in the U.S. do not permit insurance companies to take credit for reinsurance obtained from unlicensed or non-admitted insurers on their statutory financial statements unless security is posted. Our contracts generally require us to post a letter of credit or provide other security (e.g., through a multi-beneficiary reinsurance trust) after a reinsured reports a claim. In order to post these letters of credit, issuing banks generally require collateral. It is possible that the EU or other countries might adopt a similar regime in the future, or that U.S. rules could be altered in a way that treats Bermuda-based companies disproportionately. Any such development, or if we are unable to post security in the form of letters of credit or trust funds when required, could significantly and negatively affect our operations.
Glencoe is currently an eligible, non-admitted excess and surplus lines insurer in 49 U.S. states, the District of Columbia, Puerto Rico and the U.S. Virgin Islands, and is subject to certain regulatory and reporting requirements of these jurisdictions. However, Glencoe is not admitted or licensed in any U.S. jurisdiction; moreover, Glencoe only conducts business from Bermuda. Accordingly, the scope of Glencoe's activities in the U.S. is limited, which could adversely affect its ability to compete. Although surplus lines business is generally less regulated than the admitted market, the regulation of surplus lines insurance may undergo changes in the future. Federal and/or state measures may be introduced and promulgated that could result in increased oversight and regulation of surplus lines insurance. Additionally, some recent and pending cases in Florida and California courts have raised potentially significant questions regarding surplus lines insurance in those states such as whether surplus lines insurers will be subject to policy form content, filing and approval requirements or additional taxes.
Our current or future business strategy could cause one or more of our currently unregulated non-insurance subsidiaries to become subject to some form of regulation. Any failure to comply with applicable laws could result in the imposition of significant restrictions on our ability to do business, and could also result in fines and other sanctions, any or all of which could adversely affect our financial results and operations.
We could be required to allocate considerable time and resources to comply with any new or additional regulatory requirements, and any such requirements may impact the operations of our insurance and/or non-insurance subsidiaries and ultimately could impact our financial condition as well. In addition, we could be adversely affected if a regulatory authority believed we had failed to comply with applicable law or regulation.
Because we are a holding company, we are dependent on dividends and payments from our subsidiaries.
As a holding company with no direct operations, we rely on investment income, cash dividends and other permitted payments from our subsidiaries to make principal and interest payments on our debt and to pay dividends to our shareholders. The holding company does not have any operations and from time to time may not have significant liquid assets. Bermuda law and various U.S. insurance regulations may limit the ability of our subsidiaries to pay dividends. If our subsidiaries are restricted from paying dividends to us, we may be unable to pay dividends or to repay our indebtedness.
Acquisitions or strategic investments that we have made or may make could turn out to be unsuccessful.
As part of our strategy, we frequently monitor and analyze opportunities to acquire or make a strategic investment in new or other businesses that will not detract from our core Reinsurance operations. The negotiation of potential acquisitions or strategic investments as well as the integration of an acquired business or new personnel could result in a substantial diversion of management resources. Acquisitions
could involve numerous additional risks such as potential losses from unanticipated litigation or levels of claims and inability to generate sufficient revenue to offset acquisition costs. Any failure by us to effectively limit such risks or implement our acquisitions or strategic investment strategies could have a material adverse effect on our business, financial condition or results of operations.
We are subject to cybersecurity risks and may incur increasing costs in an effort to minimize those risks.
We depend on the proper functioning and availability of our information technology platform, including communications and data processing systems, in operating our business. These systems include proprietary software programs that are integral to the efficient operation of our business, including our proprietary pricing and exposure management system. We are also required to effect electronic transmissions with third parties including brokers, clients vendors and others with whom we do business, and to facilitate the oversight conducted by our Board of Directors. Security breaches could expose us to a risk of loss or misuse of our information, litigation and potential liability. In addition, cyber incidents that impact the availability, reliability, speed, accuracy or other proper functioning of these systems could have a significant impact on our operations, and potentially on our results. We may not have the resources or technical sophistication to anticipate or prevent rapidly evolving types of cyber attacks. A significant cyber incident, including system failure, security breach, disruption by malware or other damage could interrupt or delay our operations, result in a violation of applicable privacy and other laws, damage our reputation, cause a loss of customers or give rise to monetary fines and other penalties, which could be significant. See "Item 1. Business, Information Technology".
Some aspects of our corporate structure may discourage third party takeovers and other transactions or prevent the removal of our current board of directors and management.
Some provisions of our Amended and Restated Bye-Laws have the effect of making more difficult or discouraging unsolicited takeover bids from third parties or preventing the removal of our current board of directors and management. In particular, our Bye-Laws prohibit transfers of our capital shares if the transfer would result in a person owning or controlling shares that constitute 9.9% or more of any class or series of our shares. In addition, our Bye-Laws reduce the total voting power of any shareholder owning, directly or indirectly, beneficially or otherwise, as described in our Bye-laws, more than 9.9% of our common shares to not more than 9.9% of the total voting power of our capital stock unless otherwise waived at the discretion of the Board. The primary purpose of these provisions is to reduce the likelihood that we will be deemed a "controlled foreign corporation" within the meaning of the Internal Revenue Code for U.S. federal tax purposes. However, these provisions may also have the effect of deterring purchases of large blocks of common shares or proposals to acquire us, even if some or a majority of our shareholders might deem these purchases or acquisition proposals to be in their best interests.
In addition, our Bye-Laws provide for, among other things:
| |
| • | a classified Board, whose size is fixed and whose members may be removed by the shareholders only for cause upon a 66 2/3% vote; |
| |
| • | restrictions on the ability of shareholders to nominate persons to serve as directors, submit resolutions to a shareholder vote and requisition special general meetings; |
| |
| • | a large number of authorized but unissued shares which may be issued by the Board without further shareholder action; and |
| |
| • | a 66 2/3% shareholder vote to amend, repeal or adopt any provision inconsistent with several provisions of the Bye-Laws. |
These Bye-Law provisions make it more difficult to acquire control of us by means of a tender offer, open market purchase, proxy contest or otherwise. These provisions are designed to encourage persons seeking to acquire control of us to negotiate with our directors, which we believe would generally best serve the interests of our shareholders. However, these provisions could have the effect of discouraging a prospective acquirer from making a tender offer or otherwise attempting to obtain control of us. In addition, these Bye-Law provisions could prevent the removal of our current board of directors and management. To the extent these provisions discourage takeover attempts, they could deprive shareholders of opportunities to realize takeover premiums for their shares or could depress the market price of the shares.
In addition, similar provisions apply to RSML, our Lloyd's managing agent, whereby the FSA regulates the acquisition of control of any Lloyd's managing agent which is authorized under the FSMA. Any company or individual that, together with its or his associates, directly or indirectly acquires 10% or more of the shares in a Lloyd's managing agent or its parent company, or is entitled to exercise or control the exercise of 10% or more of the voting power in such Lloyd's managing agent or its parent company, would be considered to have acquired control for the purposes of the relevant legislation, as would a person who had significant influence over the management of such Lloyd's managing agent or its parent company by virtue of his shareholding or voting power in either.
Investors may have difficulties in serving process or enforcing judgments against us in the U.S.
We are a Bermuda company. In addition, certain of our officers and directors reside in countries outside the U.S. All or a substantial portion of our assets and the assets of these officers and directors are or may be located outside the U.S. Investors may have difficulty effecting service of process within the U.S. on our directors and officers who reside outside the U.S. or recovering against us or these directors and officers on judgments of U.S. courts based on civil liabilities provisions of the U.S. federal securities laws whether or not we appoint an agent in the U.S. to receive service of process.
Risks Related to Our Industry
The reinsurance and insurance businesses are historically cyclical and the pricing and terms for our products may decline, which would affect our profitability.
The reinsurance and insurance industries have historically been cyclical, characterized by periods of decreasing prices followed by periods of increasing prices. Reinsurers have experienced significant fluctuations in their results of operations due to numerous factors, including the frequency and severity of catastrophic events, perceptions of risk, levels of capacity, general economic conditions and underwriting results of other insurers and reinsurers. All of these factors fluctuate and may contribute to price declines generally in the reinsurance and insurance industries. Following an increase in capital in our industry after the 2005 catastrophe events and the subsequent period of substantial dislocation in the financial markets which has resulted in ongoing relative economic weakness, the reinsurance and insurance markets have experienced a prolonged period of generally softening markets, temporarily dampened with respect to certain loss impacted regions or lines following the 2011 New Zealand earthquake, the Tohoku earthquake, the Thailand flooding and more recently, storm Sandy in 2012.
The catastrophe-exposed lines in which we are a market leader are affected significantly by volatile and unpredictable developments, including natural and man-made disasters. The occurrence, or nonoccurrence, of catastrophic events, the frequency and severity of which are inherently unpredictable, affects both industry results and consequently prevailing market prices of our products.
We expect premium rates and other terms and conditions of trade to vary in the future. If demand for our products falls or the supply of competing capacity rises, our prospects for potential growth, due in part to our disciplined approach to underwriting, may be adversely affected. In particular, we might lose existing customers or decline business, which we might not regain when industry conditions improve.
In recent years, hedge funds and investment banks have been increasingly active in the reinsurance market and markets for related risks. Further, we believe new entrants or existing competitors may attempt to replicate all or part of our business model and provide further competition in the markets in which we participate. We generally expect increased competition from a wider range of entrants over time. It is possible that such new or alternative capital could cause reductions in prices of our products, or reduce the duration of amplitude of attractive portions of the historical market cycles. Moreover, explicitly or implicitly government-backed entities increasingly represent competition for the coverages that we provide directly, or for the business of our customers, reducing the potential amount of third party private protection our clients might need or desire. To the extent that industry pricing of our products does not meet our hurdle rate, we would generally expect to reduce our future underwriting activities thus resulting in reduced premiums and a reduction in expected earnings.
Recent or future legislation may decrease the demand for our property catastrophe reinsurance products and adversely affect our business and results of operations.
In 2007, the State of Florida enacted legislation to expand the FHCF's provision of below-market rate reinsurance to up to $28.0 billion per season (the "2007 Florida Bill"). We believe that the 2007 Florida Bill and other regulatory actions since the introduction of the 2007 Florida Bill contributed to instability in the Florida primary insurance market, where many insurers reported substantial and continuing losses from 2009 through 2012, an unusually low period for catastrophe losses in the state. Because of our position as one of the largest providers of catastrophe-exposed coverage, both on a global basis and in respect of the Florida market, the 2007 Florida Bill and the weakened financial position of Florida insurers may have a disproportionate adverse impact on us compared to other reinsurance market participants. In addition, it is possible that other regulatory or legislative changes in, or impacting, Florida could affect our ability to sell certain of our products and could therefore have a material adverse effect on our operations.
It is also possible that other states, particularly those with Atlantic or Gulf Coast exposures, may enact new or expanded legislation based on the Florida precedent, or may otherwise enact legislation, which would further diminish aggregate private market demand for our products. Alternatively, legislation adversely impacting the private markets could be enacted on a regional or at the federal level. For example, in the past, federal bills have been proposed in Congress (and, in prior congressional sessions, passed by the House of Representatives) which would, if enacted, create a federal reinsurance backstop or guarantee mechanism for catastrophic risks, including those we currently insure and reinsure in the private markets. Such legislation, if enacted, would, we believe, likely contribute to growth of state insurance entities or to their inception or alteration in a manner adverse to us. If enacted, bills of this nature would likely further erode the role of private market catastrophe reinsurers and could adversely impact our financial results, perhaps materially. Moreover, we believe that numerous modeled potential catastrophes could exceed the actual or politically acceptable bonded capacity of Citizens and of the FHCF, which could lead either to a severe dislocation or the necessity of federal intervention in the Florida market, either of which would adversely impact the private insurance and reinsurance industry.
Over the past few years the U.S. Congress has considered legislation which, if passed, would deny U.S. insurers and reinsurers the deduction for reinsurance placed with non-U.S. affiliates. In February 2012, the Obama administration included a formal proposal for such a provision in its budget proposal. As described in the administration's 2012 budget request, the proposal would deny an insurance company a deduction for premiums and other amounts paid to affiliated foreign companies with respect to reinsurance of property and casualty risks to the extent that the foreign reinsurer (or its parent company) is not subject to U.S. income tax with respect to the premiums received; and would exclude from the insurance company's income (in the same proportion in which the premium deduction was denied) any return premiums, ceding commissions, reinsurance recovered, or other amounts received with respect to reinsurance policies for which a premium deduction is wholly or partially denied. We believe that the passage of such legislation could adversely affect the reinsurance market broadly and potentially impact our own current or future operations in particular.
Internationally, in the wake of recent large natural catastrophes, a number of proposals have been introduced to alter the financing of natural catastrophes in several of the markets in which we operate. For example, the Thailand government has announced it is studying proposals for a natural catastrophe fund, under which the government would provide coverage for natural disasters in excess of an industry retention and below a certain limit, after which private reinsurers would continue to participate. The government of the Philippines has announced that it is considering similar proposals. A range of proposals from varying stakeholders have been reported to have been made to alter the current regimes for insuring flood risk in the U.K., flood risk in Australia and earthquake risk in New Zealand. If these proposals are enacted and reduce market opportunities for our clients or for the reinsurance industry, we could be adversely impacted.
See "Item 7. Management's Discussion and Analysis of Financial Condition and Results of Operations, Current Outlook, Legislative and Regulatory Update" for further information.
Other political, regulatory and industry initiatives could adversely affect our business.
The insurance and reinsurance regulatory framework is subject to heavy scrutiny by the U.S. and individual state governments as well as an increasing number of international authorities. Government regulators are generally concerned with the protection of policyholders to the exclusion of other constituencies, including
shareholders. Governmental authorities in both the U.S. and worldwide seem increasingly interested in the potential risks posed by the reinsurance industry as a whole, and to commercial and financial systems in general. While we do not believe these inquiries have identified meaningful new risks posed by the reinsurance industry, and we cannot predict the exact nature, timing or scope of possible governmental initiatives, we believe it is likely there will be increased regulatory intervention in our industry in the future. For example, the U.S. federal government has increased its scrutiny of the insurance regulatory framework in recent years (including as specifically addressed in the Dodd-Frank Act), and some state legislators have considered or enacted laws that will alter and likely increase state regulation of insurance and reinsurance companies and holding companies. Moreover, the NAIC, which is an association of the insurance commissioners of all 50 states and the District of Columbia and state insurance regulators, regularly reexamine existing laws and regulations.
For example, we could be adversely affected by proposals or enacted legislation to:
| |
| • | provide insurance and reinsurance capacity in markets and to consumers that we target, such as the legislation enacted in Florida in 2007 or the proposed federal legislation described above; |
| |
| • | expand the scope of coverage under existing policies for perils such as hurricanes or earthquakes or for a pandemic disease outbreak; |
| |
| • | increasingly mandate the terms of insurance and reinsurance policies; |
| |
| • | expand the proposed scope of the FIO or establish a new federal insurance regulator; |
| |
| • | revise laws, regulations, or contracts under which we operate; |
| |
| • | disproportionately benefit the companies of one country over those of another; or |
| |
| • | repeal or diminish the insurance company antitrust exemption from the McCarran Ferguson Act. |
With respect to the Dodd-Frank Act, it is difficult to predict the extent to which this Act or the regulations resulting therefrom will impact our business. However, compliance with these new laws and regulations will result in additional costs, which may adversely impact our results of operations, financial condition or liquidity. Although we do not expect these costs to be material to RenaissanceRe as a whole, we cannot assure you this expectation will prove accurate or that the Dodd-Frank Act or other legislation will not impact our business more adversely than we currently estimate.
While the timing for the implementation of Solvency II in the EU Member States by the European Commission remains uncertain, implementation of Solvency II will also require us to utilize a significant amount of resources to ensure compliance. The EU is in the process of considering the Solvency II equivalence of Bermuda's insurance regulatory and supervisory regime. The EU equivalence assessment considers whether Bermuda's regulatory regime provides a similar level of policyholder protection as provided under Solvency II. While we currently expect that Bermuda's insurance regulatory regime will be found equivalent in respect of oversight of internationally operating reinsurers and insurers such as RenaissanceRe, an adverse or highly qualified finding could have an adverse effect on our reinsurance operations and on our group solvency calculations. We are monitoring the ongoing legislative and regulatory steps following adoption of Solvency II. The principles, standards and requirements of Solvency II may also, directly or indirectly, impact the future supervision of additional operating subsidiaries of ours.
We are incorporated in Bermuda and are therefore subject to changes in Bermuda law and regulation that may have an adverse impact on our operations, including imposition of tax liability or increased regulatory supervision or change in regulation. In addition, we are subject to changes in the political environment in Bermuda, which could make it difficult to operate in, or attract talent to, Bermuda. The Bermuda insurance and reinsurance regulatory framework recently has become subject to increased scrutiny in many jurisdictions, including in the U.S. and in various states within the U.S. We are unable to predict the future impact on our operations of changes in the laws and regulations to which we are or may become subject. Moreover, our exposure to potential regulatory initiatives could be heightened by the fact that our principal operating companies are domiciled in, and operate exclusively from, Bermuda. For example, Bermuda, a small jurisdiction, may be disadvantaged in participating in global or cross border regulatory matters as compared with larger jurisdictions such as the U.S. or the leading EU countries. In addition, Bermuda, which is currently an overseas territory of the U.K., may consider changes to its relationship with the U.K. in the future. These changes could adversely affect Bermuda or the international reinsurance market focused
there, either of which could adversely impact us commercially. Further, as we continue to expand our business operations to different regions of the world outside of Bermuda, we are increasingly subject to new and additional regulations with respect to our operations, including, for example, laws relating to anti-corruption and anti-bribery which have received increasing scrutiny in recent years.
We operate in a highly competitive environment.
The reinsurance industry is highly competitive. We compete, and will continue to compete, with major U.S. and non-U.S. insurers and property catastrophe reinsurers, including other Bermuda-based reinsurers. Many of our competitors have greater financial, marketing and management resources than we do. Historically, periods of increased capacity levels in our industry generally have led to increased competition, and decreased prices for our products.
We believe that our principal competitors in the property catastrophe reinsurance market include other companies active in the Bermuda market, currently including ACE Limited, Allied World Assurance Company, AG, Alterra Capital Holdings Limited, Arch Capital Group Ltd., Aspen Insurance Holdings Limited, Axis Capital Holdings Limited, Endurance Specialty Holdings Ltd., Everest Re Group, Ltd., Montpelier Re Holdings Ltd., PartnerRe Ltd., Platinum Underwriters Holdings, Ltd., Validus Holdings, Ltd., White Mountains Insurance Group, Ltd. and XL Group plc, as well as a growing number of private, unrated reinsurers offering predominately collateralized reinsurance. We also compete with certain Lloyd's syndicates active in the London market, as well as with a number of other industry participants, such as American International Group, Inc., Berkshire Hathaway Inc., Hannover Rückversicherung AG (also known as "Hannover Re"), Ironshore Inc., Münchener Rückversicherungs-Gesellschaft Aktiengesellschaft in München (also known as "Munich Re") and Swiss Re Ltd. As our business evolves over time, we expect our competitors to change as well. Also, hedge funds and investment banks have been increasingly active in the reinsurance market, either through the formation of reinsurance companies (which include new Bermuda-based entrants SAC Re and Third Point Reinsurance Ltd.) or through the use of other financial products, such as catastrophe bonds, other insurance-linked securities and collateralized reinsurance investment funds. In addition, we may not be aware of other companies that may be planning to enter the reinsurance market or of existing companies that may be planning to raise additional capital. We cannot predict what effect any of these developments may have on our businesses.
Consolidation in the (re) insurance industry could adversely impact us.
The (re)insurance industry has been consolidating and we believe that several (re)insurance industry participants are seeking to consolidate. These consolidated entities may try to use their enhanced market power to negotiate price reductions for our products and services and/or obtain a larger market share through increased line sizes. If competitive pressures reduce our prices, we would generally expect to reduce our future underwriting activities thus resulting in reduced premiums and a reduction in expected earnings. As the insurance industry consolidates, competition for customers will become more intense and the importance of acquiring and properly servicing each customer will become greater. We could incur greater expenses relating to customer acquisition and retention, further reducing our operating margins. In addition, insurance companies that merge may be able to spread their risks across a consolidated, larger capital base so that they require less reinsurance. The number of companies offering retrocessional reinsurance may decline. Reinsurance intermediaries could also continue to consolidate, potentially adversely impacting our ability to access business and distribute our products. We could also experience more robust competition from larger, better capitalized competitors. Any of the foregoing could adversely affect our business or our results of operation.
The Organization for Economic Cooperation and Development (the "OECD") and the EU may pursue measures that might increase our taxes and reduce our net income.
The OECD has published reports and launched a global dialogue among member and non-member countries on measures to limit harmful tax competition. These measures are largely directed at counteracting the effects of jurisdictions perceived by the OECD to be tax havens or to offer preferential tax regimes. The OECD's has not listed Bermuda as an uncooperative tax haven jurisdiction because Bermuda has committed to eliminate harmful tax practices and to embrace international tax standards for transparency, exchange of information and the elimination of any aspects of the regimes for financial and other services that attract business with no substantial domestic activity. We are not able to predict what changes will arise from the commitment or whether such changes will subject us to additional taxes.
Regulatory regimes and changes to accounting rules may adversely impact financial results irrespective of business operations.
Accounting standards and regulatory changes may require modifications to our accounting principles, both prospectively and for prior periods and such changes could have an adverse impact on our financial results. In particular, the SEC continues to discuss the potential to either converge or transition to an international set of accounting standards that would be applied to financial statements filed with the SEC. Such changes, if ultimately adopted, could have a significant impact on our financial reporting, impacting key matters such as our loss reserving policies and premium and expense recognition. For example, the Financial Accounting Standards Board and the International Accounting Standards Board are considering adopting respective accounting standards that would require all reinsurance and insurance contracts to be accounted for under a new measurement basis, which standards are considered to be more closely related to fair value than the current measurement basis. We are currently evaluating how the above initiatives will impact us, including with respect to our loss reserving policy and the effect it might have on recognizing premium revenue and policy acquisition costs. Required modification of our existing principles, either with respect to these issues or other issues in the future, could have an impact on our results of operations, including changing the timing of the recognition of underwriting income, increasing the volatility of our reported earnings and changing our overall financial statement presentation and increasing our expenses in order to implement and comply with any new requirements.
Heightened scrutiny of issues and practices in the insurance industry may adversely affect our business.
Certain government authorities, including state officials in Florida, New York and Connecticut, as well as U.S. Federal agencies, have from time to time scrutinized and investigated a number of issues and practices within the insurance and reinsurance industry. It is possible such scrutiny could expand to include us in the future, and it is also possible that these investigations or related regulatory developments will mandate or otherwise give rise to changes in industry practices in a fashion that increases our costs or requires us to alter how we conduct our business.
We cannot predict the ultimate effect that these investigations, and any changes in industry practice, including future legislation or regulations that may become applicable to us, will have on the insurance industry, the regulatory framework, or our business.
As noted above, because we frequently assume the credit risk of the counterparties with whom we do business throughout our insurance and reinsurance operations, our results of operations could be adversely affected if the credit quality of these counterparties is severely impacted by investigations in the insurance industry or by changes to industry practices.
ITEM 1B. UNRESOLVED STAFF COMMENTS
None.
ITEM 2. PROPERTIES
We lease office space in Bermuda, which houses our executive offices and operations for our Reinsurance and Lloyd's segments. In addition, certain U.S. based subsidiaries, including but not limited to, Renaissance Trading and REAL, lease office space in a number of U.S. states. Both our Reinsurance and Lloyd's segments also lease office space in Dublin, Ireland and London, U.K. While we believe that for the foreseeable future our current office space is sufficient for us to conduct our operations, it is likely that we will expand into additional facilities and perhaps new locations to accommodate future growth. To date, the cost of acquiring and maintaining our office space has not been material to us as a whole.
ITEM 3. LEGAL PROCEEDINGS
We and our subsidiaries are subject to lawsuits and regulatory actions in the normal course of business that do not arise from or directly relate to claims on reinsurance treaties or contracts or direct surplus lines insurance policies. This category of business litigation may involve allegations of underwriting or claims-handling errors or misconduct, employment claims, regulatory actions or disputes arising from our business ventures. Our operating subsidiaries are subject to claims litigation involving disputed interpretations of policy coverages. Generally, our direct surplus lines insurance operations are subject to greater frequency and diversity of claims and claims-related litigation than our reinsurance operations and, in some jurisdictions, may be subject to direct actions by allegedly injured persons or entities seeking damages from policyholders. These lawsuits, involving claims on policies issued by our subsidiaries which are typical to the insurance industry in general and in the normal course of business, are considered in the Company's loss and loss expense reserves which are discussed in our loss reserves discussion. In addition, we may from time to time engage in litigation or arbitration related to claims for payment in respect of ceded reinsurance. Any such litigation or arbitration contains an element of uncertainty, and we believe the inherent uncertainty in such matters may have increased recently and will likely continue to increase. Currently, we believe that no individual litigation or arbitration to which we are presently a party is likely to have a material adverse effect on our financial condition, business or results of operations.
ITEM 4. MINE SAFETY DISCLOSURES
Not applicable.
PART II
ITEM 5. MARKET FOR REGISTRANT'S COMMON EQUITY, RELATED SHAREHOLDER MATTERS AND ISSUER REPURCHASES OF EQUITY SECURITIES
PRICE RANGE OF COMMON SHARES
Our common shares began publicly trading on June 27, 1995 on the New York Stock Exchange under the symbol "RNR." The following table sets forth, for the periods indicated, the high and low prices per share of our common shares as reported in composite New York Stock Exchange trading: |
| | | | | | | | | |
| | | | | | |
| | | Price Range of Common Shares | |
| | | High | | Low | |
| | 2012 | | | | |
| | First Quarter | $ | 79.11 |
| | $ | 71.18 |
| |
| | Second Quarter | 80.53 |
| | 72.41 |
| |
| | Third Quarter | 78.39 |
| | 70.00 |
| |
| | Fourth Quarter | 82.76 |
| | 75.29 |
| |
| | 2011 | | | | |
| | First Quarter | $ | 70.58 |
| | $ | 60.64 |
| |
| | Second Quarter | 73.93 |
| | 67.58 |
| |
| | Third Quarter | 72.30 |
| | 59.50 |
| |
| | Fourth Quarter | 75.16 |
| | 60.34 |
| |
| | | | | | |
On February 20, 2013, the last reported sale price for our common shares was $84.23 per share and there were 149 holders of record of our common shares.
PERFORMANCE GRAPH
The following graph compares the cumulative return on our common shares including reinvestment of our dividends on our common shares to such return for the S&P 500 Composite Stock Price Index ("S&P 500") and S&P's Property-Casualty Industry Group Stock Price Index ("S&P P/C"), for the five-year period commencing January 1, 2008 and ending December 31, 2012, assuming $100 was invested on January 1, 2008. Each measurement point on the graph below represents the cumulative shareholder return as measured by the last sale price at the end of each calendar year during the period from January 1, 2008 through December 31, 2012. As depicted in the graph below, during this period, the cumulative return was (1) 46.7% on our common shares; (2) 8.6% for the S&P 500; and (3) 4.0% for the S&P P&C.
DIVIDEND POLICY
Historically, we have paid dividends on our common shares every quarter, and have increased our dividend during each year since our initial public offering. The Board of Directors declared regular quarterly dividends of $0.27 per common share to shareholders of record on March 15, June 15, September 14 and December 14, 2012, respectively. The Board of Directors of RenaissanceRe declared regular quarterly dividends of $0.26 per common share to shareholders of record on March 15, June 15, September 15 and December 15, 2011, respectively. On February 20, 2013, the Board of Directors approved an increased dividend of $0.28 per common share, payable on March 28, 2013, to shareholders of record on March 15, 2013. The declaration and payment of dividends are subject to the discretion of the Board and depend on, among other things, our financial condition, general business conditions, legal, contractual and regulatory restrictions regarding the payment of dividends by us and our subsidiaries and other factors which the Board may in the future consider to be relevant.
ISSUER REPURCHASES OF EQUITY SECURITIES
The Company's share repurchase program may be effected from time to time, depending on market conditions and other factors, through open market purchases and privately negotiated transactions. On February 20, 2013, the Company approved an increase in its authorized share repurchase program to an aggregate amount of $500.0 million. Unless terminated earlier by resolution of the Company's Board of Directors, the program will expire when the Company has repurchased the full value of the shares authorized. The table below details the repurchases that were made under the program during the three months ended December 31, 2012, and also includes other shares purchased which represents withholdings from employees surrendered in respect of withholding tax obligations on the vesting of restricted stock, or in lieu of cash payments for the exercise price of employee stock options.
|
| | | | | | | | | | | | | | | | | | | | | | | | | | |
| | | | | | | | | | | | | | | | |
| | | Total shares purchased | | Other shares purchased | | Shares purchased under repurchase program | | Dollar amount still available under repurchase program | |
| | | Shares purchased | | Average price per share | | Shares purchased | | Average price per share | | Shares purchased | | Average price per share | | |
| | | | | | | | | | | | | | | (in millions) | |
| | Beginning dollar amount available to be repurchased | | | | | | | | | | | | | $ | 459.6 |
| |
| | October 1 - 31, 2012 | 111,016 |
| | $ | 77.01 |
| | — |
| | $ | — |
| | 111,016 |
| | $ | 77.01 |
| | (8.5 | ) | |
| | November 1 - 30, 2012 | 4,736 |
| | $ | 77.30 |
| | 4,736 |
| | $ | 77.30 |
| | — |
| | $ | — |
| | — |
| |
| | November 13, 2012 - increased authorized share repurchase program to $500.0 million | | | | | | | | | | | | | 48.9 |
| |
| | Dollar amount available to be repurchased | | | | | | | | | | | | | 500.0 |
| |
| | December 1 - 31, 2012 | 2,669,951 |
| | $ | 80.16 |
| | 495 |
| | $ | 82.63 |
| | 2,669,456 |
| | $ | 80.16 |
| | (214.0 | ) | |
| | Total | 2,785,703 |
| | $ | 80.03 |
| | 5,231 |
| | $ | 77.80 |
| | 2,780,472 |
| | $ | 80.03 |
| | $ | 286.0 |
| |
| | | | | | | | | | | | | | | | |
In the future, the Company may adopt additional trading plans or authorize purchase activities under the remaining authorization, which the Board may increase in the future. During the year ended December 31, 2012, the Company repurchased 6.4 million common shares in open market transactions and a privately negotiated transaction at an aggregate cost of $494.4 million and at an average share price of $77.26.
Subsequent to December 31, 2012 and through the period ending February 20, 2013, the Company has repurchased 1.4 million common shares in open market transactions at an aggregate cost of $111.3 million and at an average share price of $81.29.
ITEM 6. SELECTED CONSOLIDATED FINANCIAL DATA
The following tables set forth our selected consolidated financial data and other financial information at the end of and for each of the years in the five-year period ended December 31, 2012. The selected consolidated financial data should be read in conjunction with our consolidated financial statements and related notes thereto and "Management's Discussion and Analysis of Financial Condition and Results of Operations" included in this filing and all other information appearing elsewhere or incorporated into this filing by reference.
|
| | | | | | | | | | | | | | | | | | | | | |
| | | | | | | | | | | | |
| | Year ended December 31, | 2012 | | 2011 | | 2010 | | 2009 | | 2008 | |
| | (in thousands, except share and per share data and percentages) | | | | | | | | | | |
| | Statements of Operations Data: | | | | | | | | | | |
| | Gross premiums written | $ | 1,551,591 |
| | $ | 1,434,976 |
| | $ | 1,165,295 |
| | $ | 1,228,881 |
| | $ | 1,242,287 |
| |
| | Net premiums written | 1,102,657 |
| | 1,012,773 |
| | 848,965 |
| | 838,333 |
| | 935,500 |
| |
| | Net premiums earned | 1,069,355 |
| | 951,049 |
| | 864,921 |
| | 882,204 |
| | 984,448 |
| |
| | Net investment income | 167,375 |
| | 118,000 |
| | 203,955 |
| | 318,179 |
| | 13,879 |
| |
| | Net realized and unrealized gains on investments | 163,991 |
| | 70,668 |
| | 144,444 |
| | 93,679 |
| | 11,462 |
| |
| | Net other-than-temporary impairments | (343 | ) | | (552 | ) | | (829 | ) | | (22,450 | ) | | (214,897 | ) | |
| | Net claims and claim expenses incurred | 325,211 |
| | 861,179 |
| | 129,345 |
| | (70,698 | ) | | 481,498 |
| |
| | Acquisition expenses | 113,542 |
| | 97,376 |
| | 94,961 |
| | 104,150 |
| | 141,616 |
| |
| | Operational expenses | 179,301 |
| | 169,666 |
| | 166,042 |
| | 153,552 |
| | 94,414 |
| |
| | Underwriting income (loss) | 451,301 |
| | (177,172 | ) | | 474,573 |
| | 695,200 |
| | 266,920 |
| |
| | Income (loss) from continuing operations | 746,662 |
| | (74,502 | ) | | 798,482 |
| | 1,045,959 |
| | 50,307 |
| |
| | Income (loss) from discontinued operations | 2,287 |
| | (15,890 | ) | | 62,670 |
| | 6,700 |
| | 33,846 |
| |
| | Net income (loss) | 748,949 |
| | (90,392 | ) | | 861,152 |
| | 1,052,659 |
| | 84,153 |
| |
| | Net income (loss) available (attributable) to RenaissanceRe common shareholders | 566,014 |
| | (92,235 | ) | | 702,613 |
| | 838,858 |
| | (13,280 | ) | |
| | Income (loss) from continuing operations available (attributable) to RenaissanceRe common shareholders per common share – diluted | 11.18 |
| | (1.53 | ) | | 11.18 |
| | 13.29 |
| | (0.75 | ) | |
| | Net income (loss) available (attributable) to RenaissanceRe common shareholders per common share – diluted | 11.23 |
| | (1.84 | ) | | 12.31 |
| | 13.40 |
| | (0.21 | ) | |
| | Dividends per common share | 1.08 |
| | 1.04 |
| | 1.00 |
| | 0.96 |
| | 0.92 |
| |
| | Weighted average common shares outstanding – diluted | 49,603 |
| | 50,747 |
| | 55,641 |
| | 61,210 |
| | 63,411 |
| |
| | Return on average common equity | 17.7 | % | | (3.0 | )% | | 21.7 | % | | 30.2 | % | | (0.5 | )% | |
| | Combined ratio | 57.8 | % | | 118.6 | % | | 45.1 | % | | 21.2 | % | | 72.9 | % | |
| | | | | | | | | | | | |
| | At December 31, | 2012 | | 2011 | | 2010 | | 2009 | | 2008 | |
| | Balance Sheet Data: | | | | | | | | | | |
| | Total investments | $ | 6,360,647 |
| | $ | 6,209,252 |
| | $ | 6,100,212 |
| | $ | 6,015,259 |
| | $ | 5,833,816 |
| |
| | Total assets | 7,928,628 |
| | 7,744,912 |
| | 8,138,278 |
| | 7,926,212 |
| | 8,155,609 |
| |
| | Reserve for claims and claim expenses | 1,879,377 |
| | 1,992,354 |
| | 1,257,843 |
| | 1,344,433 |
| | 1,758,776 |
| |
| | Unearned premiums | 399,517 |
| | 347,655 |
| | 286,183 |
| | 317,592 |
| | 360,684 |
| |
| | Debt | 351,775 |
| | 353,620 |
| | 549,155 |
| | 300,000 |
| | 450,000 |
| |
| | Capital leases | 27,428 |
| | 25,366 |
| | 25,706 |
| | 26,014 |
| | 26,292 |
| |
| | Preferred shares | 400,000 |
| | 550,000 |
| | 550,000 |
| | 650,000 |
| | 650,000 |
| |
| | Total shareholders' equity attributable to RenaissanceRe | 3,503,065 |
| | 3,605,193 |
| | 3,936,325 |
| | 3,840,786 |
| | 3,032,743 |
| |
| | Common shares outstanding | 45,542 |
| | 51,543 |
| | 54,110 |
| | 61,745 |
| | 61,503 |
| |
| | Book value per common share | $ | 68.14 |
| | $ | 59.27 |
| | $ | 62.58 |
| | $ | 51.68 |
| | $ | 38.74 |
| |
| | Accumulated dividends | 12.00 |
| | 10.92 |
| | 9.88 |
| | 8.88 |
| | 7.92 |
| |
| | Book value per common share plus accumulated dividends | $ | 80.14 |
| | $ | 70.19 |
| | $ | 72.46 |
| | $ | 60.56 |
| | $ | 46.66 |
| |
| | Change in book value per common share plus change in accumulated dividends | 16.8 | % | | (3.6 | )% | | 23.0 | % | | 35.9 | % | | (3.3 | )% | |
| | | | | | | | | | | | |
ITEM 7. MANAGEMENT'S DISCUSSION AND ANALYSIS OF FINANCIAL CONDITION AND RESULTS OF OPERATIONS
The following is a discussion and analysis of our results of operations for 2012, compared to 2011, and 2011, compared to 2010, respectively. The following also includes a discussion of our liquidity and capital resources at December 31, 2012. This discussion and analysis should be read in conjunction with the audited consolidated financial statements and notes thereto included in this filing. This filing contains forward-looking statements that involve risks and uncertainties. Actual results may differ materially from the results described or implied by these forward-looking statements. See "Note on Forward-Looking Statements."
OVERVIEW
RenaissanceRe was established in Bermuda in 1993 to write principally property catastrophe reinsurance and today is a leading global provider of reinsurance and insurance coverages and related services. Our aspiration is to be the world's best underwriter of high-severity, low frequency risks. Through our operating subsidiaries, we seek to produce superior returns for our shareholders by being a trusted, long-term partner to our customers, for assessing and managing risk, delivering responsive solutions, and keeping our promises. We accomplish this by leveraging our core capabilities of risk assessment and information management, and by investing in our capabilities to serve our customers across the cycles that have historically characterized our markets. Overall, our strategy focuses on superior risk selection, superior customer relationships and superior capital management. We provide value to our customers and joint venture partners in the form of financial security, innovative products, and responsive service. We are known as a leader in paying valid reinsurance claims promptly. We principally measure our financial success through long-term growth in tangible book value per common share plus the change in accumulated dividends, which we believe is the most appropriate measure of our Company's financial performance, and believe we have delivered superior performance in respect of this measure over time.
Since a substantial portion of the reinsurance and insurance we write provides protection from damages relating to natural and man-made catastrophes, our results depend to a large extent on the frequency and severity of such catastrophic events, and the coverages we offer to customers affected by these events. We are exposed to significant losses from these catastrophic events and other exposures that we cover. Accordingly, we expect a significant degree of volatility in our financial results and our financial results may vary significantly from quarter-to-quarter or from year-to-year, based on the level of insured catastrophic losses occurring around the world.
Our revenues are principally derived from three sources: 1) net premiums earned from the reinsurance and insurance policies we sell; 2) net investment income and realized and unrealized gains from the investment of our capital funds and the investment of the cash we receive on the policies which we sell; and 3) other income received from our joint ventures, advisory services, weather and energy risk management operations and various other items.
Our expenses primarily consist of: 1) net claims and claim expenses incurred on the policies of reinsurance and insurance we sell; 2) acquisition costs which typically represent a percentage of the premiums we write; 3) operating expenses which primarily consist of personnel expenses, rent and other operating expenses; 4) corporate expenses which include certain executive, legal and consulting expenses, costs for research and development, and other miscellaneous costs, including those associated with operating as a publicly traded company; 5) redeemable noncontrolling interest - DaVinciRe, which represents the interest of third parties with respect to the net income (loss) of DaVinciRe; and 6) interest and dividend costs related to our debt and preference shares. We are also subject to taxes in certain jurisdictions in which we operate; however, since the majority of our income is currently earned in Bermuda, a non-taxable jurisdiction, the tax impact to our operations has historically been minimal.
The operating results, also known as the underwriting results, of an insurance or reinsurance company are discussed frequently by reference to its net claims and claim expense ratio, underwriting expense ratio, and combined ratio. The net claims and claim expense ratio is calculated by dividing net claims and claim expenses incurred by net premiums earned. The underwriting expense ratio is calculated by dividing underwriting expenses (acquisition expenses and operational expenses) by net premiums earned. The combined ratio is the sum of the net claims and claim expense ratio and the underwriting expense ratio. A combined ratio below 100% generally indicates profitable underwriting prior to the consideration of
investment income. A combined ratio over 100% generally indicates unprofitable underwriting prior to the consideration of investment income. We also discuss our net claims and claim expense ratio on an accident year basis. This ratio is calculated by taking net claims and claim expenses, excluding development on net claims and claim expenses from events that took place in prior fiscal years, divided by net premiums earned.
As described in more detail below under "Segments", our reportable segments include: (1) Reinsurance, which includes catastrophe reinsurance, specialty reinsurance and certain property catastrophe and specialty joint ventures and (2) Lloyd's, which includes reinsurance and insurance business written through Syndicate 1458. In addition, our Other category primarily reflects our: strategic investments; weather and energy risk management operations; investments unit; corporate expenses, capital servicing costs and noncontrolling interests; results of our discontinued operations and the remnants of our Bermuda-based insurance operations not sold pursuant to the Stock Purchase Agreement with QBE.
Segments
Our reportable segments include: (1) Reinsurance and (2) Lloyd's.
As of December 31, 2012, we undertook a review of our reportable segments and concluded that our former Insurance segment no longer met the quantitative thresholds defined in FASB ASC Topic Segment Reporting. These operations are not actively involved in pursuing business opportunities and are in run-off; therefore we determined they no longer require, nor warrant, separate disclosure as a reportable segment. As such, the results of operations for the former Insurance segment have been included in our Other category as noted above, and all prior periods presented herein have been reclassified to conform with the current year presentation.
Reinsurance
Our Reinsurance segment has two main units:
| |
| (1) | Property catastrophe reinsurance, principally written for our own account, and for DaVinci, is our traditional core business. We believe we are one of the world's leading providers of this coverage, based on catastrophe gross premiums written. This coverage protects against large natural catastrophes, such as earthquakes, hurricanes and tsunamis, as well as claims arising from other natural and man-made catastrophes such as winter storms, freezes, floods, fires, wind storms, tornadoes, explosions and acts of terrorism. We offer this coverage to insurance companies and other reinsurers primarily on an excess of loss basis. This means that we begin paying when our customers' claims from a catastrophe exceed a certain retained amount. |
| |
| (2) | Specialty reinsurance, also principally written for our own account, and for DaVinci, covering certain targeted classes of business where we believe we have a sound basis for underwriting and pricing the risk that we assume. Our portfolio includes various classes of business, such as catastrophe exposed workers' compensation, surety, terrorism, energy, aviation, crop, political risk, trade credit, financial, mortgage guarantee, catastrophe-exposed personal lines property, casualty clash, certain other casualty lines and other specialty lines of reinsurance that we collectively refer to as specialty reinsurance. We believe that we are seen as a market leader in certain of these classes of business. We are seeking to expand our specialty reinsurance operations over time, although we cannot assure you that we will do so, particularly in light of current and forecasted market conditions. Our specialty reinsurance business is typically significantly impacted by a comparably small number of relatively large transactions. |
Lloyd's
Our Lloyd's segment includes insurance and reinsurance business written for our own account through Syndicate 1458. Syndicate 1458 commenced business by writing certain lines of insurance and reinsurance business incepting on or after June 1, 2009. The syndicate was established to enhance our underwriting platform by providing access to Lloyd's extensive distribution network and worldwide licenses. RenaissanceRe CCL, an indirect wholly owned subsidiary of the Company, is the sole corporate member of Syndicate 1458. RSML, a wholly owned subsidiary of RenaissanceRe, is the managing agent for Syndicate
1458. We anticipate that Syndicate 1458's absolute and relative contributions to our consolidated results of operations may have a meaningful impact over time.
Other
Our Other category primarily includes the results of: (1) our share of strategic investments in certain markets we believe offer attractive risk-adjusted returns or where we believe our investment adds value, and where, rather than assuming exclusive management responsibilities ourselves, we partner with other market participants; (2) our weather and energy risk management operations primarily through Renaissance Trading and REAL; (3) our investment unit which manages and invests the funds generated by our consolidated operations; (4) corporate expenses, capital services costs and noncontrolling interests; (5) the results of our discontinued operations; and (6) as described in more details above, the remnants of our Bermuda-based insurance operations not sold pursuant to the Stock Purchase Agreement with QBE.
New Business
From time to time we consider diversification into new ventures, either through organic growth, the formation of new joint ventures, or the acquisition of or the investment in other companies or books of business of other companies. This potential diversification includes opportunities to write targeted, additional classes of risk-exposed business, both directly for our own account and through possible new joint venture opportunities. We also regularly evaluate potential strategic opportunities that we believe might utilize our skills, capabilities, proprietary technology and relationships to support possible expansion into further risk-related coverages, services and products. Generally, we focus on underwriting or trading risks where reasonably sufficient data may be available, and where our analytical abilities may provide us a competitive advantage, in order for us to seek to model estimated probabilities of losses and returns in accordance with our approach in respect of our then current portfolio of risks.
We regularly review potential strategic transactions that might improve our portfolio of business, enhance or focus our strategies, expand our distribution or capabilities, or to seek other benefits. In evaluating potential new ventures or investments, we generally seek an attractive estimated return on equity, the ability to develop or capitalize on a competitive advantage, and opportunities which we believe will not detract from our core operations. While we regularly review potential strategic transactions and periodically engage in discussions regarding possible transactions, there can be no assurance that we will complete any such transactions or that any such transaction would be successful or materially enhance our results of operations or financial condition. We believe that our ability to potentially attract investment and operational opportunities is supported by our strong reputation and financial resources, and by the capabilities and track record of our ventures unit.
Risk Management
We seek to develop and effectively utilize sophisticated computer models and other analytical tools to assess and manage the risks that we underwrite and attempt to optimize our portfolio of reinsurance and insurance contracts and other financial risks. Our policies, procedures, tools and resources to monitor and assess our operational risks companywide, as well as our global enterprise-wide risk management practices, are overseen by our Chief Risk Officer, who reports directly to our Chief Financial Officer.
With respect to our Reinsurance operations, since 1993 we have developed and continuously seek to improve our proprietary, computer-based pricing and exposure management system, REMS©. We believe that REMS©, as updated from time to time, is a more robust underwriting and risk management system than is currently commercially available elsewhere in the reinsurance industry and offers us a significant competitive advantage. REMS© was originally developed to analyze catastrophe risks, though we continuously seek ways to enhance the program in order to analyze other classes of risk. For information related to Risk Management, refer to "Item 1. Business, Underwriting and Enterprise Risk Management".
Discontinued Operations
During the fourth quarter of 2010, we made the strategic decision to divest substantially all of our U.S.-based insurance operations in order to focus on the business encompassed within our Reinsurance and Lloyd's segments and our other businesses. Except as explicitly described as held for sale or as discontinued operations, and unless otherwise noted, all discussions and amounts presented herein relate
to our continuing operations. Prior years presented have been reclassified to conform to this new presentation.
On November 18, 2010, we entered into a Stock Purchase Agreement with QBE to sell substantially all of our U.S.-based insurance operations, including our U.S. property and casualty business underwritten through managing general agents, our crop insurance business underwritten through Agro National Inc. ("Agro National"), our commercial property insurance operations and our claims operations. We have classified the assets and liabilities associated with this transaction as held for sale. The financial results for these operations have been presented as discontinued operations in our Consolidated Statements of Operations.
Consideration for the transaction was book value at December 31, 2010, for the aforementioned businesses, payable in cash at closing and subject to adjustment for certain tax and other items. The transaction closed on March 4, 2011 and we received net consideration of $269.5 million.
Pursuant to the Stock Purchase Agreement, RenaissanceRe was subject to a post-closing review following December 31, 2011 of the net reserve for claims and claim expenses for loss events occurring on or prior to December 31, 2010 (the "Reserve Collar"). Subsequent to the post-closing review, RenaissanceRe was liable to pay, or otherwise reimburse QBE amounts up to $10.0 million for net adverse development on prior accident years net claims and claim expenses. Conversely, if prior accident years net claims and claim expenses experienced net favorable development, QBE was liable to pay, or otherwise reimburse RenaissanceRe amounts up to $10.0 million.
During 2011, RenaissanceRe recognized a $10.0 million liability and corresponding expense in liabilities of discontinued operations held for sale and income (loss) from discontinued operations, respectively, due to purported net adverse development on prior accident years net claims and claim expenses associated with the Reserve Collar. Effective May 23, 2012, RenaissanceRe and QBE reached an agreement in respect of the Reserve Collar, and RenaissanceRe paid QBE the sum of $9.0 million on June 1, 2012, representing full and final settlement of the Reserve Collar and recorded a gain of $1.0 million in income from discontinued operations during the second quarter of 2012.
See "Note 3. Discontinued Operations in our Notes to Consolidated Financial Statements" for additional information.
SUMMARY OF CRITICAL ACCOUNTING ESTIMATES
Claims and Claim Expense Reserves
General Description
We believe the most significant accounting judgment made by management is our estimate of claims and claim expense reserves. Claims and claim expense reserves represent estimates, including actuarial and statistical projections at a given point in time, of the ultimate settlement and administration costs for unpaid claims and claim expenses arising from the insurance and reinsurance contracts we sell. We establish our claims and claim expense reserves by taking claims reported to us by insureds and ceding companies, but which have not yet been paid ("case reserves"), adding the costs for additional case reserves ("additional case reserves") which represent our estimates for claims previously reported to us which we believe may not be adequately reserved as of that date, and adding estimates for the anticipated cost of IBNR.
The following table summarizes our claims and claim expense reserves by line of business and split between case reserves, additional case reserves and IBNR: |
| | | | | | | | | | | | | | | | | |
| | | | | | | | | | |
| | At December 31, 2012 | Case Reserves | | Additional Case Reserves | | IBNR | | Total | |
| | (in thousands) | | | | | | | | |
| | Catastrophe | $ | 706,264 |
| | $ | 222,208 |
| | $ | 255,786 |
| | $ | 1,184,258 |
| |
| | Specialty | 111,234 |
| | 80,971 |
| | 286,108 |
| | 478,313 |
| |
| | Total Reinsurance | 817,498 |
| | 303,179 |
| | 541,894 |
| | 1,662,571 |
| |
| | Lloyd's | 29,260 |
| | 10,548 |
| | 109,662 |
| | 149,470 |
| |
| | Other | 17,016 |
| | 8,522 |
| | 41,798 |
| | 67,336 |
| |
| | Total | $ | 863,774 |
| | $ | 322,249 |
| | $ | 693,354 |
| | $ | 1,879,377 |
| |
| | | | | | | | | | |
| | At December 31, 2011 | | | | | | | | |
| | (in thousands) | | | | | | | | |
| | Catastrophe | $ | 681,771 |
| | $ | 271,990 |
| | $ | 388,147 |
| | $ | 1,341,908 |
| |
| | Specialty | 120,189 |
| | 49,840 |
| | 301,589 |
| | 471,618 |
| |
| | Total Reinsurance | 801,960 |
| | 321,830 |
| | 689,736 |
| | 1,813,526 |
| |
| | Lloyd's | 17,909 |
| | 14,459 |
| | 55,127 |
| | 87,495 |
| |
| | Other | 32,944 |
| | 3,515 |
| | 54,874 |
| | 91,333 |
| |
| | Total | $ | 852,813 |
| | $ | 339,804 |
| | $ | 799,737 |
| | $ | 1,992,354 |
| |
| | | | | | | | | | |
Activity in the liability for unpaid claims and claim expenses is summarized as follows: |
| | | | | | | | | | | | | |
| | | | | | | | |
| | Year ended December 31, | 2012 | | 2011 | | 2010 | |
| | Net reserves as of January 1 | $ | 1,588,325 |
| | $ | 1,156,132 |
| | $ | 1,260,334 |
| |
| | Net incurred related to: | | | | | | |
| | Current year | 483,180 |
| | 993,168 |
| | 431,476 |
| |
| | Prior years | (157,969 | ) | | (131,989 | ) | | (302,131 | ) | |
| | Total net incurred | 325,211 |
| | 861,179 |
| | 129,345 |
| |
| | Net paid related to: | | | | | | |
| | Current year | 84,056 |
| | 299,299 |
| | 50,793 |
| |
| | Prior years | 142,615 |
| | 129,687 |
| | 182,754 |
| |
| | Total net paid | 226,671 |
| | 428,986 |
| | 233,547 |
| |
| | Net reserves as of December 31 | 1,686,865 |
| | 1,588,325 |
| | 1,156,132 |
| |
| | Reinsurance recoverable as of December 31 | 192,512 |
| | 404,029 |
| | 101,711 |
| |
| | Gross reserves as of December 31 | $ | 1,879,377 |
| | $ | 1,992,354 |
| | $ | 1,257,843 |
| |
| | | | | | | | |
Our reserving methodology for each line of business uses a loss reserving process that calculates a point estimate for the Company's ultimate settlement and administration costs for claims and claim expenses. We do not calculate a range of estimates. We use this point estimate, along with paid claims and case reserves, to record our best estimate of additional case reserves and IBNR in our consolidated financial statements. Under GAAP, we are not permitted to establish estimates for catastrophe claims and claim expense reserves until an event occurs that gives rise to a loss.
Reserving for our reinsurance claims involves other uncertainties, such as the dependence on information from ceding companies, which among other matters, includes the time lag inherent in reporting information from the primary insurer to us or to our ceding companies and differing reserving practices among ceding companies. The information received from ceding companies is typically in the form of bordereaux, broker notifications of loss and/or discussions with ceding companies or their brokers. This information can be received on a monthly, quarterly or transactional basis and normally includes estimates of paid claims and case reserves. We sometimes also receive an estimate or provision for IBNR. This information is often updated and adjusted from time to time during the loss settlement period as new data or facts in respect of
initial claims, client accounts, industry or event trends may be reported or emerge in addition to changes in applicable statutory and case laws.
Our estimates of losses from large events are based on factors including currently available information derived from the Company's claims information from certain customers and brokers, industry assessments of losses from the events, proprietary models, and the terms and conditions of our contracts. The uncertainty of our estimates for certain of these large events is additionally impacted by the preliminary nature of the information available, the magnitude and relative infrequency of the events, the expected duration of the respective claims development period, inadequacies in the data provided thus far by industry participants and the potential for further reporting lags or insufficiencies (particularly in respect of the Chilean, 2010 New Zealand, 2011 New Zealand and Tohoku earthquakes); and in the case of storm Sandy and the Thailand flooding, significant uncertainty as to the form of the claims and legal issues, under the relevant terms of insurance contracts and reinsurance treaties. In addition, a significant portion of the net claims and claim expenses associated with storm Sandy and the New Zealand and Tohoku earthquakes are concentrated with a few large clients and therefore the loss estimates for these events may vary significantly based on the claims experience of those clients. Loss reserve estimation in respect of our retrocessional contracts poses further challenges compared to directly assumed reinsurance. A significant portion of our reinsurance recoverable relates to the New Zealand and Tohoku earthquakes. There is inherent uncertainty and complexity in evaluating loss reserve levels and reinsurance recoverable amounts, due to the nature of the losses relating to earthquake events, including that loss development time frames tend to take longer with respect to earthquake events. The contingent nature of business interruption and other exposures will also impact losses in a meaningful way, especially with regard to storm Sandy, the Tohoku earthquake and Thailand flooding, which we believe may give rise to significant complexity in respect of claims handling, claims adjustment and other coverage issues, over time. Given the magnitude and relatively recent occurrence of these large events, meaningful uncertainty remains regarding total covered losses for the insurance industry and, accordingly, several of the key assumptions underlying our loss estimates. In addition, our actual net losses from these events may increase if our reinsurers or other obligors fail to meet their obligations.
Because of the inherent uncertainties discussed above, we have developed a reserving philosophy which attempts to incorporate prudent assumptions and estimates, and we have generally experienced favorable net development on prior year reserves in the last several years. However, there is no assurance that this will occur in future periods.
Prior Year Development of Reserve for Net Claims and Claim Expenses
Our estimates of claims and claim expense reserves are not precise in that, among other matters, they are based on predictions of future developments and estimates of future trends and other variable factors. Some, but not all, of our reserves are further subject to the uncertainty inherent in actuarial methodologies and estimates. Because a reserve estimate is simply an insurer's estimate at a point in time of its ultimate liability, and because there are numerous factors which affect reserves and claims payments that cannot be determined with certainty in advance, our ultimate payments will vary, perhaps materially, from our estimates of reserves. If we determine in a subsequent period that adjustments to our previously established reserves are appropriate, such adjustments are recorded in the period in which they are identified.
As detailed in the table and discussed in further detail below, changes to prior year estimated claims reserves increased our net income by $158.0 million during the year ended December 31, 2012, (2011 - decreased our net loss by $132.0 million, 2010 - increased our net income by $302.1 million), excluding the consideration of changes in reinstatement premium, profit commissions, redeemable noncontrolling interest - DaVinciRe, equity in net claims and claim expenses of Top Layer Re and income tax. |
| | | | | | | | | | | | | |
| | | | | | | | |
| | Year ended December 31, | 2012 | | 2011 | | 2010 | |
| | Catastrophe | $ | 110,568 |
| | $ | 59,137 |
| | $ | 157,458 |
| |
| | Specialty | 34,146 |
| | 77,761 |
| | 128,561 |
| |
| | Reinsurance | 144,714 |
| | 136,898 |
| | 286,019 |
| |
| | Lloyd's | 16,202 |
| | (478 | ) | | 197 |
| |
| | Other | (2,947 | ) | | (4,431 | ) | | 15,915 |
| |
| | Total | $ | 157,969 |
| | $ | 131,989 |
| | $ | 302,131 |
| |
| | | | | | | | |
Our reserving techniques, assumptions and processes differ between our property catastrophe reinsurance, specialty reinsurance and insurance businesses within our Reinsurance and Lloyd's segments. Following is a discussion of the risks we insure and reinsure, the reserving techniques, assumptions and processes we follow to estimate our claims and claim expense reserves, and our current estimates versus our initial estimates of our claims reserves, for each of these units.
Reinsurance Segment
Property Catastrophe Reinsurance
Within our catastrophe unit, we principally write property catastrophe excess of loss reinsurance contracts to insure insurance and reinsurance companies against natural and man-made catastrophes. Under these contracts, we indemnify an insurer or reinsurer when its aggregate paid claims and claim expenses from a single occurrence of a covered peril exceed the attachment point specified in the contract, up to an amount per loss specified in the contract. Our most significant exposure is to losses from earthquakes and hurricanes and other windstorms, although we are also exposed to claims arising from other catastrophes, such as tsunamis, freezes, floods, fires, tornadoes, explosions and acts of terrorism. Our predominant exposure under such coverage is to property damage. However, other risks, including business interruption and other non-property losses, may also be covered under our property catastrophe reinsurance contracts when arising from a covered peril. Our coverages are offered on either a worldwide basis or are limited to selected geographic areas.
Coverage can also vary from "all property" perils to limited coverage on selected perils, such as "earthquake only" coverage. We also enter into retrocessional contracts that provide property catastrophe coverage to other reinsurers or retrocedants. This coverage is generally in the form of excess of loss retrocessional contracts and may cover all perils and exposures on a worldwide basis or be limited in scope to selected geographic areas, perils and/or exposures. The exposures we assume from retrocessional business can change within a contract term as the underwriters of a retrocedant may alter their book of business after the retrocessional coverage has been bound. We also offer dual trigger reinsurance contracts which require us to pay claims based on claims incurred by insurers and reinsurers in addition to the estimate of insured industry losses as reported by referenced statistical reporting agencies.
Our property catastrophe reinsurance business is generally characterized by loss events of low frequency and high severity. Initial reporting of paid and incurred claims in general, tends to be relatively prompt. We consider this business "short-tail" as compared to the reporting of claims for "long-tail" products, which tends to be slower. However, the timing of claims payment and reporting also varies depending on various factors, including: whether the claims arise under reinsurance of primary insurance companies or reinsurance of other reinsurance companies; the nature of the events (e.g., hurricanes, earthquakes or terrorism); the geographic area involved; post-event inflation which may cause the cost to repair damaged property to increase significantly from current estimates, or for property claims to remain open for a longer period of time, due to limitations on the supply of building materials, labor and other resources; complex policy coverage and other legal issues; and the quality of each client's claims management and reserving practices. Management's judgments regarding these factors are reflected in our claims reserve estimates.
Reserving for most of our property catastrophe reinsurance business does not involve the use of traditional actuarial techniques. Rather, claims and claim expense reserves are estimated by management after a catastrophe occurs by completing an in-depth analysis of the individual contracts which may potentially be impacted by the catastrophic event. The in-depth analysis generally involves: 1) estimating the size of insured industry losses from the catastrophic event; 2) reviewing our portfolio of reinsurance contracts to identify those contracts which are exposed to the catastrophic event; 3) reviewing information reported by customers and brokers; 4) discussing the event with our customers and brokers; and 5) estimating the ultimate expected cost to settle all claims and administrative costs arising from the catastrophic event on a contract-by-contract basis and in aggregate for the event. Once an event has occurred, during the then current reporting period we record our best estimate of the ultimate expected cost to settle all claims arising from the event. Our estimate of claims and claim expense reserves is then determined by deducting cumulative paid losses from our estimate of the ultimate expected loss for an event and our estimate of IBNR is determined by deducting cumulative paid losses, case reserves and additional case reserves from our estimate of the ultimate expected loss for an event. Once we receive a notice of loss or payment request under a catastrophe reinsurance contract, we are generally able to process and pay such claims promptly.
Because the events from which claims arise under policies written by our property catastrophe reinsurance business are typically prominent, public occurrences such as hurricanes and earthquakes, we are often able to use independent reports as part of our loss reserve estimation process. We also review catastrophe bulletins published by various statistical reporting agencies to assist us in determining the size of the industry loss, although these reports may not be available for some time after an event. In addition to the loss information and estimates communicated by cedants and brokers, we also use industry information which we gather and retain in our REMS© modeling system. The information stored in our REMS© modeling system enables us to analyze each of our policies in relation to a loss and compare our estimate of the loss with those reported by our policyholders. The REMS© modeling system also allows us to compare and analyze individual losses reported by policyholders affected by the same loss event. Although the REMS© modeling system assists with the analysis of the underlying loss and provides us with the information and ability to perform increased analysis, the estimation of claims resulting from catastrophic events is inherently difficult because of the variability and uncertainty associated with property catastrophe claims and the unique characteristics of each loss.
For smaller events including localized severe weather events such as windstorms, hail, ice, snow, flooding, freezing and tornadoes, which are not necessarily prominent, public occurrences, we initially place greater reliance on catastrophe bulletins published by statistical reporting agencies to assist us in determining what events occurred during the reporting period than we do for large events. This includes reviewing catastrophe bulletins published by Property Claim Services for U.S. catastrophes. We set our initial estimates of reserves for claims and claim expenses for these smaller events based on a combination of our historical market share for these types of losses and the estimate of the total insured industry property losses as reported by statistical reporting agencies, although we generally make significant adjustments based on our current exposure to the geographic region involved as well as the size of the loss and the peril involved. This approach supplements our approach for estimating losses for larger catastrophes, which as discussed above, includes discussions with brokers and ceding companies, reviewing individual contracts impacted by the event, and modeling the loss in our REMS© system. Approximately one year from the date of loss for these small events, we estimate IBNR for these events by using an actuarial technique. The actuarial technique used to estimate IBNR is the paid Bornhuetter-Ferguson actuarial method. The paid Bornhuetter-Ferguson actuarial method loss development factors are selected based on a review of our historical experience and these factors are reviewed at least annually. There were no changes to the paid loss development factors over the last three years.
In general, our property catastrophe reinsurance reserves for our more recent reinsured catastrophic events are subject to greater uncertainty and, therefore, greater potential variability, and are likely to experience material changes from one period to the next. This is due to the uncertainty as to the size of the industry losses from the event, uncertainty as to which contracts have been exposed to the catastrophic event, uncertainty due to complex legal and coverage issues that can arise out of large or complex catastrophic events such as the events of September 11, 2001, hurricane Katrina and storm Sandy, and uncertainty as to the magnitude of claims incurred by our customers. As our property catastrophe reinsurance claims age,
more information becomes available and we believe our estimates become more certain, although there is no assurance this trend will continue in the future.
Prior Year Development of Reserve for Net Claims and Claim Expenses
Within our property catastrophe reinsurance business, we seek to review substantially all of our claims and claim expense reserves quarterly. Our quarterly review procedures include identifying events that have occurred up to the latest balance sheet date, determining our best estimate of the ultimate expected cost to settle all claims and administrative costs associated with those new events which have arisen during the reporting period, reviewing the ultimate expected cost to settle claims and administrative costs associated with those events which occurred during previous periods, and considering new estimation techniques, such as additional actuarial methods or other statistical techniques, that can assist us in developing a best estimate. This process is judgmental in that it involves reviewing changes in paid and reported losses each period and adjusting our estimates of the ultimate expected losses for each event if there are developments that are different from our previous expectations. If we determine that adjustments to an earlier estimate are appropriate, such adjustments are recorded in the period in which they are identified. As noted above, the level of our claims and claim expenses associated with certain catastrophes can be very large. As a result, small percentage changes in the estimated ultimate claims and large catastrophe events can significantly impact our reserves for claims and claim expenses in subsequent periods.
The following table details the development of our liability for unpaid claims and claim expenses for the catastrophe reinsurance unit for the year ended December 31, 2012: |
| | | | | |
| | | | |
| | Year ended December 31, 2012 | Catastrophe Reinsurance Unit | |
| | Catastrophe claims and claim expenses | | |
| | Large catastrophe events | | |
| | Chile Earthquake (2010) | $ | 24,575 |
| |
| | Hurricanes Gustav & Ike (2008) | 17,541 |
| |
| | U.K. Floods (2007) | 17,271 |
| |
| | Hurricanes Katrina, Rita and Wilma (2005) | 6,420 |
| |
| | Hurricane Irene (2011) | 4,630 |
| |
| | Thailand Floods (2011) | 3,933 |
| |
| | Tohoku Earthquake and Tsunami (2011) | 3,896 |
| |
| | Windstorm Kyrill (2007) | 3,417 |
| |
| | New Zealand Earthquake (2010) | (3,570 | ) | |
| | New Zealand Earthquake (2011) | (17,912 | ) | |
| | Other | 2,542 |
| |
| | Total large catastrophe events | 62,743 |
| |
| | Small catastrophe events | | |
| | Danish Floods (2011) | 5,000 |
| |
| | U.S. PCS 63 Winter Storm (2011) | 5,000 |
| |
| | U.S. PCS 42 Winter Storm (2011) | 2,560 |
| |
| | U.S. PCS 53 Winter Storm (2011) | 2,558 |
| |
| | Other | 32,707 |
| |
| | Total small catastrophe events | 47,825 |
| |
| | Total favorable development of prior accident years claims and claim expenses | $ | 110,568 |
| |
| | | | |
The favorable development of prior accident years claims and claim expenses within the Company's catastrophe reinsurance unit in the year ended December 31, 2012 of $110.6 million was primarily due to reductions in estimated ultimate losses on the 2010 Chilean earthquake of $24.6 million, the 2008 hurricanes of $17.5 million, the U.K. floods of $17.3 million, the 2005 hurricanes of $6.4 million, hurricane Irene of $4.6 million, the Tohoku earthquake of $3.9 million and a number of other catastrophes totaling $57.7 million, and partially offset by adverse development related to the 2010 and 2011 New Zealand earthquakes of $21.5 million primarily due to increase in estimated ultimate losses.
The following table details the development of our liability for unpaid claims and claim expenses for the catastrophe reinsurance unit for the year ended December 31, 2011: |
| | | | | |
| | | | |
| | Year ended December 31, 2011 | Catastrophe Reinsurance Unit | |
| | (in thousands) | | |
| | Catastrophe claims and claim expenses | | |
| | Large catastrophe events | | |
| | Tropical Cyclone Tasha (2010) | $ | 13,922 |
| |
| | Hurricanes Katrina, Rita and Wilma (2005) | 10,008 |
| |
| | Chilean Earthquake (2010) | 8,455 |
| |
| | World Trade Center (2001) | 4,701 |
| |
| | Hurricanes Charley, Francis, Ivan and Jeanne (2004) | 4,076 |
| |
| | U.K. Floods (2007) | 3,635 |
| |
| | Windstorm Kyrill (2007) | 2,494 |
| |
| | New Zealand Earthquake (2010) | (15,179 | ) | |
| | Total large catastrophe events | 32,112 |
| |
| | Small catastrophe events | | |
| | U.S. PCS 21 Wildland Fire (2007) | 4,554 |
| |
| | U.S. PCS 33 Great Midwest Storm (2010) | 3,125 |
| |
| | U.S. PCS 31 Wind and Thunderstorm (2010) | 3,039 |
| |
| | U.S. PCS 96 Wind and Thunderstorm (2010) | 2,288 |
| |
| | Other | 14,019 |
| |
| | Total small catastrophe events | 27,025 |
| |
| | Total favorable development of prior accident years claims and claim expenses | $ | 59,137 |
| |
| | | | |
The favorable development on prior year reserves in 2011 within the Company's catastrophe reinsurance unit of $59.1 million was due to $27.0 million related to reductions in the estimated ultimate losses of smaller catastrophe events, $32.1 million related to net reductions arising from the estimated ultimate losses of large catastrophe events, including $13.9 million, $10.0 million, $8.5 million and $4.7 million related to tropical cyclone Tasha, the 2005 hurricanes, the Chilean earthquake and the World Trade Center, and partially offset by $15.2 million of adverse development related to the 2010 New Zealand earthquake.
The following table details the development of our liability for unpaid claims and claim expenses for the catastrophe reinsurance unit for the year ended December 31, 2010: |
| | | | | |
| | | | |
| | Year ended December 31, 2010 | Catastrophe Reinsurance Unit | |
| | (in thousands) | | |
| | Catastrophe claims and claim expenses | | |
| | Large catastrophe events | | |
| | Mature, large catastrophe events | | |
| | European Windstorm Erwin (2005) | $ | 10,593 |
| |
| | World Trade Center (2001) | 9,914 |
| |
| | Hurricanes Martin and Floyd (1999) | 4,822 |
| |
| | European Floods (2002) | 4,361 |
| |
| | U.S. PCS 88 Wind and Thunderstorm (2003) | 2,873 |
| |
| | Hurricane Isabel (2003) | 1,995 |
| |
| | U.S. PCS 97 Wildland Fire (2003) | 1,231 |
| |
| | Windstorm Anatol (1999) | 971 |
| |
| | Northridge Earthquake (1993) | 1,094 |
| |
| | Total mature, large catastrophe events | 37,854 |
| |
| | Buncefield Oil Depot (2005) | 27,418 |
| |
| | Hurricanes Katrina, Rita and Wilma (2005) | 25,482 |
| |
| | Hurricanes Gustav and Ike (2008) | 10,878 |
| |
| | Hurricanes Charley, Francis, Ivan and Jeanne (2004) | 8,149 |
| |
| | European Windstorm Klaus (2009) | 8,000 |
| |
| | Total large catastrophe events | 117,781 |
| |
| | Small catastrophe events | | |
| | U.S. PCS 78 Wind and Thunderstorm (2009) | 3,215 |
| |
| | U.S. PCS 66 Wind and Thunderstorm (2009) | 3,149 |
| |
| | U.S. Winter Storm (2009) | 3,000 |
| |
| | Hurricane Bill (2009) | 2,500 |
| |
| | U.S. PCS 82 Wind and Thunderstorm (2009) | 2,429 |
| |
| | Austrian Floods (2009) | 2,356 |
| |
| | Other | 23,028 |
| |
| | Total small catastrophe events | 39,677 |
| |
| | Total favorable development of prior accident years claims and claim expenses | $ | 157,458 |
| |
| | | | |
The favorable development of prior accident years claims and claim expenses within the Company's catastrophe reinsurance unit in 2010 of $157.5 million was due in part to reductions of $37.9 million to the estimated ultimate claims of mature, large catastrophe events, such as the 2001 World Trade Center, European windstorm Erwin and the large European windstorms of 1999, for which the claims are principally paid and the amount of additional reported claims had slowed considerably and therefore the ultimate claims were reduced. In addition, the 2005 Buncefield Oil Depot claim was reduced by $27.4 million in 2010, principally due to the underlying insured subrogating its liability and subsequently reimbursing the Company for claims the Company had previously paid to the insured. The ultimate claims associated with the 2005 hurricanes, Katrina, Rita and Wilma, and the 2004 hurricanes, Charley, Frances, Ivan and Jeanne, were reduced by $25.5 million and $8.1 million, respectively, as reported claims came in better than expected in 2010. As discussed below, the Company adopted a new actuarial technique in 2009 to reserve for these hurricanes and the level of reported claims in 2010 was less than the actuarial technique would have indicated, resulting in formulaic decreases to the ultimate claims for these large hurricanes. The
ultimate claims associated with the 2008 hurricanes, Gustav and Ike, were reduced by $10.9 million and the 2009 European windstorm Klaus were reduced by $8.0 million in 2010, due to better than expected reported claims activity. The remainder of the favorable development of prior accident years claims and claim expenses was due to a reduction in ultimate claims on a large number of relatively small catastrophes, all principally the result of reported claims coming in less than expected, resulting in formulaic decreases to the ultimate claims for these events.
Actual Results vs. Initial Estimates
The table below summarizes our initial assumptions and changes in those assumptions for claims and claim expense reserves within our catastrophe unit. As discussed above, the key assumption in estimating reserves for our catastrophe unit is our estimate of ultimate claims and claim expenses. The table shows our initial estimates of ultimate claims and claim expenses for each accident year and how these initial estimates have developed over time. The initial estimate of accident year claims and claim expenses represents our estimate of the ultimate settlement and administration costs for claims incurred from catastrophic events occurring during a particular accident year, and as reported as of December 31 of that year. The re-estimated ultimate claims and claim expenses as of December 31, 2010, 2011 and 2012, represent our revised estimates as reported as of those dates. The cumulative favorable (adverse) development shows how our most recent estimates as reported at December 31, 2012 differ from our initial accident year estimates. Favorable development implies that our current estimates are lower than our initial estimates while adverse development implies that our current estimates are higher than our original estimates. Total reserves as of December 31, 2012 reflect the unpaid portion of our estimates of ultimate claims and claim expenses. The table is presented on a gross basis and therefore does not include the benefit of reinsurance recoveries. It also does not consider the impact of loss related premium or redeemable noncontrolling interest – DaVinciRe.
Actual vs. Initial Estimated Property Catastrophe Reinsurance Claims and Claim Expense Reserve Analysis |
| | | | | | | | | | | | | | | | | | | | | | | | | | | | | | | | |
| | (in thousands, except percentages) | | Re-estimated Claims and Claim Expenses as of December 31, | | Cumulative Favorable (Adverse) Development | | % Decrease (Increase) from Initial Ultimate | | Claims and Claim Expense Reserves as of December 31, 2012 | | % of Claims and Claim Expenses Unpaid as of December 31, 2012 | |
| | Accident Year | | Initial Estimate of Accident Year Claims and Claim Expenses | 2010 | | 2011 | | 2012 | | |
| | 1994 | | $ | 100,816 |
| | $ | 137,135 |
| | $ | 137,498 |
| | $ | 137,130 |
| | $ | (36,314 | ) | | (36.0 | )% | | $ | 310 |
| | 0.2 | % | |
| | 1995 | | 72,561 |
| | 61,348 |
| | 61,345 |
| | 61,345 |
| | 11,216 |
| | 15.5 | % | | 48 |
| | 0.1 | % | |
| | 1996 | | 67,671 |
| | 45,214 |
| | 45,209 |
| | 45,219 |
| | 22,452 |
| | 33.2 | % | | 14 |
| | — | % | |
| | 1997 | | 43,050 |
| | 9,046 |
| | 9,040 |
| | 9,041 |
| | 34,009 |
| | 79.0 | % | | 5 |
| | 0.1 | % | |
| | 1998 | | 129,171 |
| | 151,755 |
| | 151,951 |
| | 152,038 |
| | (22,867 | ) | | (17.7 | )% | | 564 |
| | 0.4 | % | |
| | 1999 | | 267,981 |
| | 199,097 |
| | 198,257 |
| | 197,849 |
| | 70,132 |
| | 26.2 | % | | 304 |
| | 0.2 | % | |
| | 2000 | | 54,600 |
| | 17,794 |
| | 17,803 |
| | 17,787 |
| | 36,813 |
| | 67.4 | % | | 27 |
| | 0.2 | % | |
| | 2001 | | 257,285 |
| | 212,678 |
| | 205,078 |
| | 201,140 |
| | 56,145 |
| | 21.8 | % | | 8,756 |
| | 4.4 | % | |
| | 2002 | | 155,573 |
| | 65,486 |
| | 65,436 |
| | 65,118 |
| | 90,455 |
| | 58.1 | % | | 277 |
| | 0.4 | % | |
| | 2003 | | 126,312 |
| | 68,892 |
| | 69,057 |
| | 67,608 |
| | 58,704 |
| | 46.5 | % | | 218 |
| | 0.3 | % | |
| | 2004 | | 762,392 |
| | 821,350 |
| | 815,773 |
| | 815,915 |
| | (53,523 | ) | | (7.0 | )% | | 2,267 |
| | 0.3 | % | |
| | 2005 | | 1,473,974 |
| | 1,283,225 |
| | 1,272,485 |
| | 1,263,198 |
| | 210,776 |
| | 14.3 | % | | 7,936 |
| | 0.6 | % | |
| | 2006 | | 121,754 |
| | 60,413 |
| | 60,313 |
| | 58,392 |
| | 63,362 |
| | 52.0 | % | | 1,028 |
| | 1.8 | % | |
| | 2007 | | 245,892 |
| | 150,809 |
| | 138,329 |
| | 116,568 |
| | 129,324 |
| | 52.6 | % | | 17,609 |
| | 15.1 | % | |
| | 2008 | | 599,481 |
| | 480,907 |
| | 481,878 |
| | 455,909 |
| | 143,572 |
| | 23.9 | % | | 41,903 |
| | 9.2 | % | |
| | 2009 | | 90,800 |
| | 53,991 |
| | 47,189 |
| | 42,288 |
| | 48,512 |
| | 53.4 | % | | 7,433 |
| | 17.6 | % | |
| | 2010 | | 385,207 |
| | 385,207 |
| | 355,564 |
| | 321,522 |
| | 63,685 |
| | 16.5 | % | | 175,570 |
| | 54.6 | % | |
| | 2011 | | 1,243,138 |
| | — |
| | 1,243,138 |
| | 1,246,752 |
| | (3,614 | ) | | (0.3 | )% | | 641,316 |
| | 51.4 | % | |
| | 2012 | | 345,776 |
| | — |
| | — |
| | 345,776 |
| | — |
| | — | % | | 278,673 |
| | 80.6 | % | |
| | | | $ | 6,543,434 |
| | $ | 4,204,347 |
| | $ | 5,375,343 |
| | $ | 5,620,595 |
| | $ | 922,839 |
| | 14.9 | % | | $ | 1,184,258 |
| | 21.1 | % | |
| | | | | | | | | | | | | | | | | | | |
As quantified in the table above, since the inception of the Company in 1993, while we have experienced adverse development from time to time, on a cumulative basis we have experienced $922.8 million of net favorable development on the run-off of our gross reserves within our catastrophe unit. This represents 14.9% of our initial estimated gross claims and claim expenses for accident years 2011 and prior of $6.2 billion and is calculated based on our estimates of claims and claim expense reserves as of December 31, 2012, compared to our initial estimates of ultimate claims and claim expenses, as of the end of each accident year. As described above, given the complexity in reserving for claims and claims expenses associated with catastrophe losses for property catastrophe excess of loss reinsurance contracts, we have experienced development, both favorable and unfavorable, in any given accident year. For example, our 2005 accident year developed favorably by $210.8 million, which is 14.3% better than our initial estimates of claims and claim expenses for the 2005 accident year as estimated as of December 31, 2005, while our 2004 accident year developed unfavorably by $53.5 million, or negative 7.0%. On a net basis our cumulative favorable or unfavorable development is generally reduced by offsetting changes in our reinsurance recoverables, as well as changes to loss related premiums such as reinstatement premiums, and redeemable noncontrolling interest for changes in claims and claim expenses that impact DaVinciRe, all of which generally move in the opposite direction to changes in our ultimate claims and claim expenses.
The percentage of claims unpaid at December 31, 2012 for each accident year reflects both the speed at which claims and claim expenses for each accident year have been paid and our estimate of claims and claim expenses for that accident year. As seen above, claims and claim expenses for the 2006 and prior accident years have generally been paid, with 2001 having 4.4% remaining unpaid. This is driven in part by the mix of our business, which primarily included property catastrophe excess of loss reinsurance for personal lines property coverage, rather than commercial property coverage or retrocessional coverage, and the speed of the settlement and payment of claims by our underlying cedants. In contrast, our 2001 accident year, which includes losses from the events of September 11, 2001, includes a higher mix of commercial business and retrocessional coverage where the underlying claims of our cedants tend to be settled and paid more slowly. In addition, our 2007 accident year has also paid out more slowly due to increased complexity surrounding claims of our underlying cedants as a result of the notable losses during 2007, including European windstorm Kyrill. As noted in the table above, the percentage of claims and claims expenses unpaid as of December 31, 2012 related to more recent years, such as 2009 through 2012, range from 17.6% to 80.6%, which higher percentages are driven by the recency of these accident years, combined with the complexity surrounding claims of our underlying cedants and the nature of the events, such as the 2010 and 2011 New Zealand earthquakes, the Tohoku earthquake and storm Sandy.
Sensitivity Analysis
The table below shows the impact on our ultimate claims and claim expenses, net income and shareholders' equity as of and for the year ended December 31, 2012 of reasonably likely changes to our estimates of ultimate losses for claims and claim expenses incurred from catastrophic events within our property catastrophe reinsurance business unit. The reasonably likely changes are based on an historical analysis of the period-to-period variability of our ultimate costs to settle claims from catastrophic events, giving due consideration to changes in our reserving practices over time. In general, our claim reserves for our more recent catastrophic events are subject to greater uncertainty and, therefore, greater variability and are likely to experience material changes from one period to the next. This is due to the uncertainty as to the size of the industry losses from the event, uncertainty as to which contracts have been exposed to the catastrophic event, and uncertainty as to the magnitude of claims incurred by our clients. As our claims age, more information becomes available and we believe our estimates become more certain, although there is no assurance this trend will continue in the future. As a result, the sensitivity analysis below is based on the age of each accident year, our current estimated ultimate claims and claim expenses for the catastrophic events occurring in each accident year, and the reasonably likely variability of our current estimates of claims and claim expenses by accident year. The impact on net income and shareholders' equity assumes no increase or decrease in reinsurance recoveries, loss related premium or redeemable noncontrolling interest – DaVinciRe.
Property Catastrophe Reinsurance Claims and Claim Expense Reserve Sensitivity Analysis |
| | | | | | | | | | | | | | | | | | |
| | | | | | | | | | | | |
| | (in thousands, except percentages) | Ultimate Claims and Claim Expenses at December 31, 2012 | | $ Impact of Change on Ultimate Claims and Claim Expenses at December 31, 2012 | | % Impact of Change on Reserve for Claims and Claim Expenses at December 31, 2012 | | % Impact of Change on Net Income for the Year Ended December 31, 2012 | | % Impact of Change on Shareholders' Equity at December 31, 2012 | |
| | Higher | $ | 6,205,941 |
| | $ | 585,346 |
| | 31.1 | % | | (78.2 | )% | | (16.7 | )% | |
| | Recorded | 5,620,595 |
| | — |
| | — | % | | — | % | | — | % | |
| | Lower | $ | 5,035,249 |
| | $ | (585,346 | ) | | (31.1 | )% | | 78.2 | % | | 16.7 | % | |
| | | | | | | | | | | | |
We believe the changes we made to our estimated ultimate claims and claim expenses represent reasonably likely outcomes based on our experience to date and our future expectations. While we believe these are reasonably likely outcomes, we do not believe the reader should consider the above sensitivity analysis an actuarial reserve range. In addition, the sensitivity analysis only reflects reasonably likely changes in our underlying assumptions. It is possible that our estimated ultimate claims and claim expenses could be significantly higher or lower than the sensitivity analysis described above. For example, we could be liable for events for which we have not estimated claims and claim expenses or for exposures we do not currently believe are covered under our policies. These changes could result in significantly larger changes to our estimated ultimate claims and claim expenses, net income and shareholders' equity than those noted above. We also caution the reader that the above sensitivity analysis is not used by management in developing our reserve estimates and is also not used by management in managing the business.
Specialty Reinsurance
Within our specialty reinsurance business unit we write a number of reinsurance lines such as catastrophe exposed workers' compensation, surety, terrorism, energy, aviation, crop, political risk, trade credit, financial, mortgage guarantee, catastrophe-exposed personal lines property, casualty clash, certain other casualty lines and other specialty lines of reinsurance that we collectively refer to as specialty reinsurance. We offer our specialty reinsurance products principally on an excess of loss basis, as described above with respect to our property catastrophe reinsurance products, and we also provide some proportional coverage. In a proportional reinsurance arrangement (also referred to as quota share reinsurance or pro-rata reinsurance), the reinsurer shares a proportional part of the original premiums and losses of the reinsured. We offer our specialty reinsurance products to insurance companies and other reinsurance companies and provide coverage for specific geographic regions or on a worldwide basis. We expanded our specialty reinsurance business in 2002 and have increased our presence in the specialty reinsurance market since that time.
Our specialty reinsurance business can generally be characterized as providing coverage for low frequency and high severity losses, similar to our property catastrophe reinsurance business. As with our property catastrophe reinsurance business, our specialty reinsurance contracts frequently provide coverage for relatively large limits or exposures. As a result of the foregoing, our specialty reinsurance business is subject to significant claims volatility. In periods of low claims frequency or severity, our results will generally be favorably impacted while in periods of high claims frequency or severity our results will generally be negatively impacted.
Our processes and methodologies in respect of loss estimation for the coverages we offer through our specialty reinsurance operation differ from those used for our property catastrophe-oriented coverages. For example, our specialty reinsurance coverages are more likely to be impacted by factors such as long-term inflation and changes in the social and legal environment, which we believe gives rise to greater uncertainty in our claims reserves. Moreover, in reserving for our specialty reinsurance coverages we do not have the benefit of a significant amount of our own historical experience in certain of these lines and may have little or no related corporate reserving history in new lines. We believe this makes our specialty reinsurance reserving subject to greater uncertainty than our catastrophe unit.
When initially developing our reserving techniques for our specialty reinsurance coverages, we considered estimating reserves utilizing several actuarial techniques such as paid and reported loss development
methods. We elected to use the Bornhuetter-Ferguson actuarial method because this method is appropriate for lines of business, such as our specialty reinsurance business, where there is a lack of historical claims experience. This method allows for greater weight to be applied to expected results in periods where little or no actual experience is available, and, hence, is less susceptible to the potential pitfall of being excessively swayed by one year or one quarter of actual paid and/or reported loss data. This method uses initial expected loss ratio expectations to the extent that the expected paid or reported losses are zero, and it assumes that past experience is not fully representative of the future. As our reserves for claims and claim expenses age, and actual claims experience becomes available, this method places less weight on expected experience and places more weight on actual experience. This experience, which represents the difference between expected reported claims and actual reported claims is reflected in the respective reporting period as a change in estimate. We reevaluate our actuarial reserving techniques on a periodic basis.
The utilization of the Bornhuetter-Ferguson actuarial method requires us to estimate an expected ultimate claims and claim expense ratio and select an expected loss reporting pattern. We select our estimates of the expected ultimate claims and claim expense ratios and expected loss reporting patterns by reviewing industry results for similar business and adjusting for the terms of the coverages we offer. The estimated expected claims and claim expense ratio may be modified to the extent that reported losses at a given point in time differ from what would be expected based on the selected loss reporting pattern. Our estimate of IBNR is the product of the premium we have earned, the initial expected ultimate claims and claim expense ratio and the percentage of estimated unreported losses. In addition, certain of our specialty reinsurance coverages may be impacted by natural and man-made catastrophes. We estimate claim reserves for these losses after the event giving rise to these losses occur, following a process that is similar to our catastrophe unit described above.
Prior Year Development of Reserve for Net Claims and Claim Expenses
Within our specialty reinsurance business, we seek to review substantially all of our claims and claim expense reserves quarterly. Typically, our quarterly review procedures include reviewing paid and reported claims in the most recent reporting period, reviewing the development of paid and reported claims from prior periods, and reviewing our overall experience by underwriting year and in the aggregate. We monitor our expected ultimate claims and claim expense ratios and expected loss reporting assumptions on a quarterly basis and compare them to our actual experience. These actuarial assumptions are generally reviewed annually, based on input from our actuaries, underwriters, claims personnel and finance professionals, although adjustments may be made more frequently if needed. Assumption changes are made to adjust for changes in the pricing and terms of coverage we provide, changes in industry results for similar business, as well as our actual experience, to the extent we have enough data to rely on our own experience. If we determine that adjustments to an earlier estimate are appropriate, such adjustments are recorded in the period in which they are identified.
The following table details the development of our liability for unpaid claims and claim expenses for the specialty reinsurance unit for the year ended December 31, 2012 split between catastrophe claims and claim expenses and attritional claims and claim expenses: |
| | | | | |
| | | | |
| | Year ended December 31, 2012 | Specialty Reinsurance Unit | |
| | Catastrophe claims and claim expenses | | |
| | Large catastrophe events | | |
| | Hurricanes Katrina, Rita and Wilma (2005) | $ | 3,000 |
| |
| �� | Total catastrophe claims and claim expenses | $ | 3,000 |
| |
| | Attritional claims and claim expenses | | |
| | Bornhuetter-Ferguson actuarial method - actual reported claims less than expected claims | $ | 16,747 |
| |
| | Actuarial assumption changes | 14,399 |
| |
| | Total attritional claims and claim expenses | $ | 31,146 |
| |
| | Total favorable development of prior accident years claims and claim expenses | $ | 34,146 |
| |
| | | | |
The favorable development of prior accident years claims and claim expenses within our specialty reinsurance unit in the year ended December 31, 2012 of $34.1 million includes $14.4 million associated with actuarial assumption changes, principally in our casualty and medical malpractice lines of business, and primarily as a result of revised initial expected claims ratios and claim development factors due to actual experience coming in better than expected, $16.7 million related to actual reported loss activity coming in better than expected, as a result of the application of our formulaic actuarial reserving methodology, and $3.0 million due to a reduction in ultimate losses on the 2005 hurricanes.
The following table details the development of our liability for unpaid claims and claim expenses for the specialty reinsurance unit for the year ended December 31, 2011 split between catastrophe claims and claim expenses and attritional claims and claim expenses: |
| | | | | |
| | | | |
| | Year ended December 31, 2011 | Specialty Reinsurance Unit | |
| | (in thousands) | | |
| | Catastrophe claims and claim expenses | | |
| | Hurricanes Katrina, Rita and Wilma (2005) | $ | 6,215 |
| |
| | Chilean Earthquake (2010) | 4,688 |
| |
| | Tropical Cyclone Tasha (2010) | 3,000 |
| |
| | Total catastrophe claims and claim expenses | $ | 13,903 |
| |
| | Attritional claims and claim expenses | | |
| | Bornhuetter-Ferguson actuarial method - actual reported claims less than expected claims | $ | 37,058 |
| |
| | Actuarial assumption changes | 26,800 |
| |
| | Total attritional claims and claim expenses | $ | 63,858 |
| |
| | Total favorable development of prior accident years claims and claim expenses | $ | 77,761 |
| |
| | | | |
The favorable development on prior year reserves in 2011 within our specialty unit of $77.8 million includes: $26.8 million associated with actuarial assumption changes, principally in our workers' compensation quota share and risk, property risk and energy risk lines of business, and primarily as a result of revised initial expected claims ratios and claim development factors due to actual experience coming in better than expected; $13.9 million due to reductions in case reserves and additional case reserves for certain large catastrophe events; and the remainder of $37.1 million due to reported claims coming in better than expected in 2011 on prior accident years events, as a result of the application of our formulaic actuarial reserving methodology.
The following table details the development of our liability for unpaid claims and claim expenses for the specialty reinsurance unit for the year ended December 31, 2010 split between catastrophe claims and claim expenses and attritional claims and claim expenses: |
| | | | | |
| | | | |
| | Year ended December 31, 2010 | Specialty Reinsurance Unit | |
| | (in thousands) | | |
| | Catastrophe claims and claim expenses | | |
| | Large catastrophe events | | |
| | Hurricanes Katrina, Rita and Wilma (2005) | $ | 5,350 |
| |
| | Buncefield Oil Depot (2005) | 2,073 |
| |
| | Total catastrophe claims and claim expenses | $ | 7,423 |
| |
| | Attritional claims and claim expenses | | |
| | Bornhuetter-Ferguson actuarial method - actual reported claims less than expected claims | $ | 71,261 |
| |
| | Actuarial assumption changes | 31,400 |
| |
| | Reductions in specific events | 18,477 |
| |
| | Total attritional claims and claim expenses | $ | 121,138 |
| |
| | Total favorable development of prior accident years claims and claim expenses | $ | 128,561 |
| |
| | | | |
The favorable development of prior accident years claims and claim expenses within the Company's specialty reinsurance unit in 2010 of $128.6 million includes $31.4 million associated with actuarial assumption changes, principally in the Company's casualty clash and surety lines of business, and partially offset by an increase in reserves within the Company's workers compensation per risk line of business, principally as a result of revised initial expected claims ratios and claim development factors due to actual experience coming in better than expected; $18.5 million due to reductions in case reserves and additional case reserves, which are reserves established at the contract level for specific events; $7.4 million due to reductions in case reserves and additional case reserves for certain large catastrophe events; and the remainder of $71.3 million due to reported claims coming in better than expected in 2010 on prior accident years events, principally the 2005 through 2009 underwriting years, as a result of the application of the Company's formulaic actuarial reserving methodology.
Actual Results vs. Initial Estimates
The Actual vs. Initial Estimated Ultimate Claims and Claim Expense Ratio table below summarizes our key actuarial assumptions in reserving for our specialty reinsurance business. As noted above, the key actuarial assumptions include the estimated ultimate claims and claim expense ratios and the estimated loss reporting patterns. The table shows our initial estimates of the ultimate claims and claim expense ratio by underwriting year. The table shows how our initial estimates of these ratios have developed over time, with the re-estimated ratios reflecting a combination of the amount and timing of paid and reported losses compared to our initial estimates. The initial estimate is based on the actuarial assumptions that were in place at the end of that year. A decrease in the ultimate claims and claim expense ratio implies that our current estimates are lower than our initial estimates while an increase in the ultimate claims and claim expense ratio implies that our current estimates are higher than our initial estimates. The result would be a corresponding favorable impact on shareholders' equity and net income or a corresponding unfavorable impact on shareholders' equity and net income, respectively. The table also shows how our initial estimated ultimate claims and claim expense ratios have changed from one underwriting year to the next. The table below reflects a summary of the weighted average assumptions for all classes of business written within our specialty reinsurance unit. The table is presented on a gross loss basis and therefore does not include the benefit of reinsurance recoveries or loss related premium.
Actual vs. Initial Estimated Specialty Reinsurance Claims and Claim Expense Reserve Analysis – Estimated Ultimate Claims and Claim Expense Ratio |
| | | | | | | | | | |
| | | | | | | | | | | |
| | | | Estimated Ultimate Claims and Claim Expenses Ratio | |
| | Underwriting Year | | Initial Estimate | | Re-estimate at | |
| | December 31, 2010 | | December 31, 2011 | | December 31, 2012 | |
| | 2002 | | 77.2% | | 21.5% | | 20.5% | | 19.6% | |
| | 2003 | | 76.8% | | 28.1% | | 26.2% | | 25.3% | |
| | 2004 | | 78.2% | | 40.1% | | 36.9% | | 37.0% | |
| | 2005 | | 78.2% | | 31.6% | | 29.1% | | 28.1% | |
| | 2006 | | 76.6% | | 36.9% | | 31.7% | | 29.8% | |
| | 2007 | | 62.9% | | 55.5% | | 55.6% | | 56.1% | |
| | 2008 | | 57.9% | | 77.1% | | 74.9% | | 63.9% | |
| | 2009 | | 68.6% | | 50.9% | | 38.0% | | 35.8% | |
| | 2010 | | 57.7% | | 84.1% | | 67.1% | | 60.8% | |
| | 2011 | | 56.8% | | —% | | 73.0% | | 61.4% | |
| | 2012 | | 55.3% | | —% | | —% | | 88.1% | |
| | | | | | | | | | | |
The table above shows our initial estimated ultimate claims and claim expense ratios for attritional losses for each new underwriting year within our specialty reinsurance unit as of the end of each calendar year. Until 2007, our initial estimated ultimate remained relatively constant between 76.6% in 2006 and 78.2% in 2004 and 2005. This reflects the fact that management had not made significant changes to its initial estimates of expected ultimate claims and claim expense ratios from one underwriting year to the next. The principal reason for the modest changes from one underwriting year to the next is that the mix of business has changed. For example, the mix of business for the 2007 through 2012 underwriting years have a lower initial expected ultimate claims and claim expense ratio than in prior years as it is more heavily weighted to business that is expected to produce a lower level of losses. The decrease in the initial estimated ultimate claims and claim expense ratio from 2006 and prior, to 2007 through 2012, also reflects assumption changes made for certain classes of business where our experience, and the industry experience in general, has been better than expected and, as a result, we decreased our initial estimated ultimate claims and claim expense ratio for these classes of business. The decrease in the initial estimated ultimate claims and claim expense ratio for 2010 through 2012, compared to 2009, is principally due to assumption changes for modeled expected loss ratios and expected reporting patterns. The estimated ultimate net claims and claim expense ratio related to the 2011 underwriting year at December 31, 2012 of 61.4%, increased from the initial estimate of 56.8% primarily as a result of several relatively large claims incurred in 2011. The estimated ultimate net claims and claim expense ratio related to the 2012 underwriting year at December 31, 2012 of 88.1%, increased from the initial estimate of 55.3% primarily as a result of storm Sandy.
As each underwriting year has developed, our re-estimated expected ultimate claims and claim expense ratios have changed. In particular, our re-estimated ultimate claims and claim expense ratios decreased significantly from the initial estimates for the 2002 through 2006 underwriting years. This was principally due to our 2005 reserve review. During our 2005 reserve review, we further segmented the specialty business with the aim of grouping risks into more homogeneous categories which respond to the evolution of actual exposures. This became possible as the volume of this business increased over the three preceding years. This further segmentation required the selection of loss reporting patterns to be applied to these new groups. We also updated our assumptions for our original loss reporting patterns based on a combination of new industry information and actual experience accumulated over the three preceding years. The assumptions for the new loss reporting patterns were applied to all prior underwriting years. In addition, we made explicit allowances for commuted contracts whereas previously these were considered in the overall reserving assumptions. We also reviewed substantially all of our case reserves and additional case reserves. The result of the foregoing was a decrease in our specialty reinsurance re-estimated ultimate claims and claim expense reserves in 2005. Subsequent to this reserve review, the results of our specialty book of business have been mixed. The 2006 underwriting year includes favorable development as actual paid and reported losses during 2006 have overall been less than expected, which has resulted in
a reduction in our expected ultimate claims and claim expense ratio for this year. However, the 2008, 2010, 2011 and 2012 underwriting years have performed worse than expected and our current estimates are higher than our initial estimates. This is due in part to the losses in our casualty clash line of business in 2008, associated with exposure to the deterioration of the credit and capital markets in 2008 as well as the Madoff matter discovered in the fourth quarter of 2008. In comparison, our 2010 and 2011 underwriting years were impacted by a number of relatively large catastrophe events, including the 2010 New Zealand and Chilean earthquakes in 2010, and in 2011, the 2011 New Zealand and Tohoku earthquakes, the large U.S. tornadoes, the Australian floods, losses arising from certain aggregate contracts, hurricane Irene and the Thailand floods (collectively referred to as the "2011 Large Losses"). In addition, our 2012 underwriting year was impacted by storm Sandy. As noted above, our specialty reinsurance business is in general characterized by events of low frequency and high severity which results in actual experience that can be significantly better or worse than long-term trends or industry results for similar business may imply.
As noted above, some of our specialty reinsurance contracts are exposed to net claims and claim expenses from large natural and man-made catastrophes. Net claims and claim expenses from these large catastrophes are reserved for after the events which gave rise to the claims in a manner which is consistent with our property catastrophe reinsurance reserving practices as discussed above. The large catastrophes occurring during the period from 2002 to 2012 impacting our specialty unit principally include hurricanes Katrina, Rita and Wilma, which occurred in 2005. Our estimate of ultimate net claims and claim expenses from hurricanes Katrina, Rita and Wilma, within our specialty reinsurance unit, net of reinsurance recoveries and assumed and ceded loss related premium, totaled $48.6 million at December 31, 2012 (2011 - $51.6 million, 2010 - $57.8 million).
Sensitivity Analysis
The table below quantifies the impact on our reserves for claims and claim expenses, net income and shareholders' equity as of and for the year ended December 31, 2012 of reasonably likely changes to the actuarial assumptions used to estimate our December 31, 2012 claims and claim expense reserves within our specialty reinsurance business unit. The table quantifies reasonably likely changes in our initial estimated ultimate claims and claim expense ratios and estimated loss reporting patterns. The changes to the initial estimated ultimate claims and claim expense ratios represent percentage increases or decreases to our current estimated ultimate claims and claim expense ratios. The change to the reporting patterns represent claims reporting that is both faster and slower than our current estimated claims reporting patterns. The impact on net income and shareholders' equity assumes no increase or decrease in reinsurance recoveries, loss related premium or redeemable noncontrolling interest – DaVinciRe.
Specialty Reinsurance Claims and Claim Expense Reserve Sensitivity Analysis |
| | | | | | | | | | | | | | | | |
| | | | | | | | | | | | |
| | (in thousands,except percentages) | Estimated Loss Reporting Pattern | | $ Impact of Change on Reserves for Claims and Claim Expenses at December 31, 2012 | | % Impact of Change on Reserve for Claims and Claim Expenses at December 31, 2012 | | % Impact of Change on Net Income for the Year Ended December 31, 2012 | | % Impact of Change on Shareholders' Equity at December 31, 2012 | |
| | Increase expected claims and claim expense ratio by 25% | Slower reporting | | $ | 153,397 |
| | 8.2 | % | | (20.5 | )% | | (4.4 | )% | |
| | Increase expected claims and claim expense ratio by 25% | Expected reporting | | 71,455 |
| | 3.8 | % | | (9.5 | )% | | (2.0 | )% | |
| | Increase expected claims and claim expense ratio by 25% | Faster reporting | | 2,404 |
| | 0.1 | % | | (0.3 | )% | | (0.1 | )% | |
| | Expected claims and claim expense ratio | Slower reporting | | 65,554 |
| | 3.5 | % | | (8.8 | )% | | (1.9 | )% | |
| | Expected claims and claim expense ratio | Expected reporting | | — |
| | — | % | | — | % | | — | % | |
| | Expected claims and claim expense ratio | Faster reporting | | (55,240 | ) | | (2.9 | )% | | 7.4 | % | | 1.6 | % | |
| | Decrease expected claims and claim expense ratio by 25% | Slower reporting | | (22,289 | ) | | (1.2 | )% | | 3.0 | % | | 0.6 | % | |
| | Decrease expected claims and claim expense ratio by 25% | Expected reporting | | (71,455 | ) | | (3.8 | )% | | 9.5 | % | | 2.0 | % | |
| | Decrease expected claims and claim expense ratio by 25% | Faster reporting | | (112,885 | ) | | (6.0 | )% | | 15.1 | % | | 3.2 | % | |
| | | | | | | | | | | | |
We believe that ultimate claims and claim expense ratios 25.0 percentage points above or below our estimated assumptions constitute reasonably likely outcomes based on our experience to date and our future expectations. In addition, we believe that the adjustments that we made to speed up or slow down our estimated loss reporting patterns are reasonably likely changes. While we believe these are reasonably likely changes, we do not believe the reader should consider the above sensitivity analysis an actuarial reserve range. In addition, we caution the reader that the above sensitivity analysis only reflects reasonably likely changes. It is possible that our initial estimated claims and claim expense ratios and loss reporting patterns could be significantly different from the sensitivity analysis described above. For example, we could be liable for events which we have not estimated reserves for or for exposures we do not currently think are covered under our contracts. These changes could result in significantly larger changes to reserves for claims and claim expenses, net income and shareholders' equity than those noted above. We also caution the reader that the above sensitivity analysis is not used by management in developing our reserve estimates and is also not used by management in managing the business.
Lloyd's Segment
Within our Lloyd's segment, we write property catastrophe excess of loss reinsurance contracts to insure insurance and reinsurance companies against natural and man-made catastrophes, a number of specialty reinsurance lines and insurance policies and quota share reinsurance that involves understanding the characteristics of the underlying insurance policy.
We use the Bornhuetter-Ferguson actuarial method to estimate claims and claim expenses within our Lloyd's segment for our specialty reinsurance and insurance lines of business. The comments discussed above relating to our reserving techniques and processes for our specialty reinsurance unit apply to the specialty reinsurance and insurance lines of business within our Lloyd's segment. In addition, certain of our coverages may be impacted by natural and man-made catastrophes. We estimate claim reserves for these losses after the event giving rise to these losses occurs, following a process that is similar to our catastrophe unit as noted above.
Prior Year Development of Reserve for Net Claims and Claim Expenses
The following table details the development of our liability for unpaid claims and claim expenses for our Lloyd's segment: |
| | | | | | | | | | | | | |
| | | | | | | | |
| | Year ended December 31, | 2012 | | 2011 | | 2010 | |
| | Attritional claims and claim expenses | $ | 8,011 |
| | $ | (478 | ) | | $ | 197 |
| |
| | Catastrophe events - property catastrophe reinsurance | 5,726 |
| | — |
| | — |
| |
| | Catastrophe events - other | 3,750 |
| | — |
| | — |
| |
| | Actuarial assumption changes | (1,285 | ) | | — |
| | — |
| |
| | Total | $ | 16,202 |
| | $ | (478 | ) | | $ | 197 |
| |
| | | | | | | | |
The favorable development of prior accident years claims and claim expenses within our Lloyd's segment of $16.2 million during the year ended December 31, 2012 was principally due to decreases in estimated ultimate losses on certain specific events, including $9.5 million of catastrophe losses, principally related to the Thailand floods and $2.5 million related to hurricane Irene, with the remainder due to reported claims coming in lower than expected on a number of prior accident years events, as a result of the application of our formulaic actuarial reserving methodology, partially offset by adverse development of $1.3 million due to assumption changes used in our formulaic actuarial reserving methodology.
Actual Results vs. Initial Estimates
The table below summarizes our initial assumptions and changes in those assumptions for catastrophe claims and claim expense reserves associated with our property catastrophe reinsurance business within our Lloyd's segment. Similar to our catastrophe unit included in our Reinsurance segment above, the key assumption in estimating reserves for property catastrophe reinsurance losses in our Lloyd's segment is our estimate of the ultimate claims and claim expenses. The table shows our initial estimates of ultimate claims and claim expenses for each accident year and how these initial estimates have developed over time. The initial estimate of accident year claims and claim expenses represents our estimate of the ultimate settlement and administration costs for claims incurred from catastrophic events occurring during a particular accident year, and as reported as of December 31 of that year. The re-estimated ultimate claims and claim expenses as of December 31, 2010, 2011 and 2012, represent our revised estimates as reported as of those dates. The cumulative favorable (adverse) development shows how our most recent estimates as reported at December 31, 2012 differ from our initial accident year estimates. Favorable development implies that our current estimates are lower than our initial estimates while adverse development implies that our current estimates are higher than our original estimates. Total reserves as of December 31, 2012 reflect the unpaid portion of our estimates of ultimate claims and claim expenses. The table is presented on a gross basis and therefore does not include the benefit of reinsurance recoveries or loss related premium such as reinstatement premium.
Actual vs. Initial Estimated Lloyd's Segment Catastrophe Claims and Claim Expense Reserve Analysis for Property Catastrophe Reinsurance Business |
| | | | | | | | | | | | | | | | | | | | | | | | | | | | | | | | |
| | | | | | | | | | | | | | | | | | | |
| | (in thousands, except percentages) | | | | | | | | | | | | | |
| | Accident Year | | Initial Estimate of Accident Year Claims and Claim Expenses | | Re-estimated Claims and Claim Expenses as of December 31, | | Cumulative Favorable (Adverse) Development | | % Decrease (Increase) from Initial Ultimate | | Claims and Claim Expense Reserves at December 31, 2012 | | % of Claims and Claim Expenses Unpaid at December 31, 2011 | |
| | 2010 | | 2011 | | 2012 | | |
| | 2010 | | $ | 5,277 |
| | $ | 5,277 |
| | $ | 5,986 |
| | $ | 6,310 |
| | $ | (1,033 | ) | | (19.6 | )% | | $ | 6,310 |
| | 100.0 | % | |
| | 2011 | | 30,121 |
| | — |
| | 30,121 |
| | 24,037 |
| | 6,084 |
| | 20.2 | % | | 8,256 |
| | 34.3 | % | |
| | 2012 | | 10,957 |
| | — |
| | — |
| | 10,957 |
| | — |
| | — | % | | 9,355 |
| | 85.4 | % | |
| | | | $ | 46,355 |
| | $ | 5,277 |
| | $ | 36,107 |
| | $ | 41,304 |
| | $ | 5,051 |
| | 14.3 | % | | $ | 23,921 |
| | 57.9 | % | |
| | | | | | | | | | | | | | | | | | | |
As quantified in the table above, since our Lloyd's segment commenced writing business in mid-2009, we have experienced $5.1 million of net favorable development on the run-off of our gross reserves related to catastrophe events for our property catastrophe reinsurance business within our Lloyd's segment. As described above and similar to our catastrophe unit, given the complexity in reserving for claims and claims expenses associated with catastrophe losses for property catastrophe reinsurance business, we have experienced development, both favorable and unfavorable, in any given accident year. For example, our 2011 accident year has developed favorably by $6.1 million, which is 20.2% better than our initial estimates of claims and claim expenses for the 2011 accident year as estimated as of December 31, 2011, while our 2010 accident year developed unfavorably by $1.0 million, or negative 19.6%. On a net basis our cumulative favorable or unfavorable development is generally reduced by offsetting changes in our reinsurance recoverables, as well as changes to loss related premiums such as reinstatement premiums, all of which generally move in the opposite direction to changes in our ultimate claims and claim expenses.
The percentage of claims unpaid at December 31, 2012 for each accident year reflects both the speed at which claims and claim expenses for each accident year have been paid and our estimate of claims and claim expenses for that accident year. This is driven in part by the mix of our business and the speed of the settlement and payment of claims by our underlying cedants.
Actual vs. Initial Estimated Lloyd's Segment Attritional Claims and Claim Expense Reserve Analysis – Estimated Ultimate Claims and Claim Expense Ratio
The Actual vs. Initial Estimated Ultimate Claims and Claim Expense Ratio table below summarizes our key actuarial assumptions in reserving for attritional losses for our specialty reinsurance and insurance lines of business in our Lloyd's segment. As noted above, the key actuarial assumptions include the estimated ultimate claims and claim expense ratios and the estimated loss reporting patterns. The table shows our initial estimates of the ultimate claims and claim expense ratio by underwriting year. The initial estimate is based on the actuarial assumptions that were in place at the end of that year. A decrease in the ultimate claims and claim expense ratio implies that our current estimates are lower than our initial estimates while an increase in the ultimate claims and claim expense ratio implies that our current estimates are higher than our initial estimates. The result would be a corresponding favorable impact on shareholders' equity and net income or a corresponding unfavorable impact on shareholders' equity and net income, respectively. The table below reflects a summary of the weighted average assumptions for all classes of specialty reinsurance and insurance business in our Lloyd's segment for which we reserve for attritional losses using the Bornhuetter-Ferguson actuarial method. The table is presented on a gross loss basis and therefore does not include the benefit of reinsurance recoveries or loss related premium such as reinstatement premium. |
| | | | | | | | | | | |
| | | | | | | | | | | |
| | | | Estimated Ultimate Claims and Claim Expenses Ratio | |
| | Underwriting Year | | Initial Estimate | | Re-estimate at | |
| | December 31, 2010 | | December 31, 2011 | | December 31, 2012 | |
| | 2010 | | 63.3% | | 62.7% | | 56.5% | | 53.5 | % | |
| | 2011 | | 66.0% | | —% | | 83.0% | | 60.6 | % | |
| | 2012 | | 58.4% | | —% | | —% | | 87.4 | % | |
| | | | | | | | | | | |
The table above shows our initial estimated ultimate claims and claim expense ratios for attritional losses for each new underwriting year within specialty insurance and reinsurance in our Lloyd's segment as of the end of each calendar year. The principal reason for changes from one underwriting year to the next is changes in the mix and relative volume of business.
As each underwriting year has developed, our re-estimated expected ultimate claims and claim expense ratios have changed. In particular, our re-estimated ultimate claims and claim expense ratios decreased from the initial estimates for the 2010 and 2011 underwriting years. This was principally due to the application of our formulaic actuarial reserving methodology with the reductions being due to actual paid and reported claim activity being more favorable to date than what was originally anticipated when setting the initial reserves combined with reductions to estimated ultimate claims and claim expenses on certain large events. However, the 2012 underwriting year has performed worse than expected and our current estimates are higher than our initial estimates. This is due in part to experiencing claims and claim
expenses related to large property losses in 2012 which added 15.4 percentage points to the 2012 underwriting year ultimate claims and claim expenses ratio. As noted above, our specialty reinsurance and insurance lines of business are in general characterized by events of low frequency and high severity which results in actual experience that can be significantly better or worse than long-term trends or industry results for similar business may imply.
Sensitivity Analysis
The table below shows the impact on our ultimate claims and claim expenses, net income and shareholders' equity as of and for the year ended December 31, 2012 of reasonably likely changes to our estimates of ultimate losses for claims and claim expenses incurred from catastrophic events associated with property catastrophe reinsurance business within our Lloyd's segment. The reasonably likely changes are based on a historical analysis of the period-to-period variability of our ultimate costs to settle claims from catastrophic events, giving due consideration to changes in our reserving practices over time. In general, our claim reserves for our more recent catastrophic events are subject to greater uncertainty and, therefore, greater variability and are likely to experience material changes from one period to the next. This is due to the uncertainty as to the size of the industry losses from the event, uncertainty as to which contracts have been exposed to the catastrophic event, and uncertainty as to the magnitude of claims incurred by our clients. As our claims age, more information becomes available and we believe our estimates become more certain, although there is no assurance this trend will continue in the future. As a result, the sensitivity analysis below is based on the age of each accident year, our current estimated ultimate claims and claim expenses for the catastrophic events occurring in each accident year, and the reasonably likely variability of our current estimates of claims and claim expenses by accident year.
Lloyd's Segment Property Catastrophe Reinsurance Claims and Claim Expense Reserve Sensitivity Analysis |
| | | | | | | | | | | | | | | | | | |
| | | | | | | | | | | | |
| | (in thousands, except percentages) | Ultimate Claims and Claim Expenses at December 31, 2012 | | $ Impact of Change on Ultimate Claims and Claim Expenses at December 31, 2012 | | % Impact of Change on Reserve for Claims and Claim Expenses at December 31, 2012 | | % Impact of Change on Net Income for the Year Ended December 31, 2012 | | % Impact of Change on Shareholders' Equity at December 31, 2012 | |
| | Higher | $ | 51,608 |
| | $ | 10,304 |
| | 0.5 | % | | (1.4 | )% | | (0.3 | )% | |
| | Recorded | 41,304 |
| | — |
| | — | % | | — | % | | — | % | |
| | Lower | $ | 31,000 |
| | $ | (10,304 | ) | | (0.5 | )% | | 1.4 | % | | 0.3 | % | |
| | | | | | | | | | | | |
We believe the changes we made to our estimated ultimate claims and claim expenses represent reasonably likely outcomes based on our experience to date and our future expectations. While we believe these are reasonably likely outcomes, we do not believe the reader should consider the above sensitivity analysis an actuarial reserve range. In addition, the sensitivity analysis only reflects reasonably likely changes in our underlying assumptions. It is possible that our estimated ultimate claims and claim expenses could be significantly higher or lower than the sensitivity analysis described above. For example, we could be liable for events for which we have not estimated claims and claim expenses or for exposures we do not currently believe are covered under our policies. These changes could result in significantly larger changes to our estimated ultimate claims and claim expenses, net income and shareholders' equity than those noted above. We also caution the reader that the above sensitivity analysis is not used by management in developing our reserve estimates and is also not used by management in managing the business.
Lloyd's Segment Attritional Claims and Claim Expense Reserve Sensitivity Analysis |
| | | | | | | | | | | | | | | | |
| | | | | | | | | | | | |
| | (in thousands,except percentages) | Estimated Loss Reporting Pattern | | $ Impact of Change on Reserves for Claims and Claim Expenses at December 31, 2012 | | % Impact of Change on Reserves for Claims and Claim Expenses at December 31, 2012 | | % Impact of Change on Net Income for the Year Ended December 31, 2012 | | % Impact of Change on Shareholders' Equity at December 31, 2012 | |
| | Increase expected claims and claim expense ratio by 25% | Slower reporting | | $ | 45,302 |
| | 2.4 | % | | (6.0 | )% | | (1.3 | )% | |
| | Increase expected claims and claim expense ratio by 25% | Expected reporting | | 22,761 |
| | 1.2 | % | | (3.0 | )% | | (0.6 | )% | |
| | Increase expected claims and claim expense ratio by 25% | Faster reporting | | (7,138 | ) | | (0.4 | )% | | 1.0 | % | | 0.2 | % | |
| | Expected claims and claim expense ratio | Slower reporting | | 18,033 |
| | 1.0 | % | | (2.4 | )% | | (0.5 | )% | |
| | Expected claims and claim expense ratio | Expected reporting | | — |
| | — | % | | — | % | | — | % | |
| | Expected claims and claim expense ratio | Faster reporting | | (23,919 | ) | | (1.3 | )% | | 3.2 | % | | 0.7 | % | |
| | Decrease expected claims and claim expense ratio by 25% | Slower reporting | | (9,236 | ) | | (0.5 | )% | | 1.2 | % | | 0.3 | % | |
| | Decrease expected claims and claim expense ratio by 25% | Expected reporting | | (22,761 | ) | | (1.2 | )% | | 3.0 | % | | 0.6 | % | |
| | Decrease expected claims and claim expense ratio by 25% | Faster reporting | | (40,700 | ) | | (2.2 | )% | | 5.4 | % | | 1.2 | % | |
| | | | | | | | | | | | |
We believe that ultimate claims and claim expense ratios 25.0 percentage points above or below our estimated assumptions constitute reasonably likely outcomes based on our experience to date and our future expectations. In addition, we believe that the adjustments that we made to speed up or slow down our estimated loss reporting patterns are reasonably likely changes. While we believe these are reasonably likely changes, we do not believe the reader should consider the above sensitivity analysis an actuarial reserve range. In addition, we caution the reader that the above sensitivity analysis only reflects reasonably likely changes. It is possible that our initial estimated claims and claim expense ratios and loss reporting patterns could be significantly different from the sensitivity analysis described above. For example, we could be liable for events which we have not estimated reserves for or for exposures we do not currently think are covered under our contracts. These changes could result in significantly larger changes to reserves for claims and claim expenses, net income and shareholders' equity than those noted above. We also caution the reader that the above sensitivity analysis is not used by management in developing our reserve estimates and is also not used by management in managing the business.
Other
Included in the Other category are the remnants of our Bermuda-based insurance operations not sold pursuant to the Stock Purchase Agreement with QBE. These operations are in run-off and no new business is being underwritten. Our outstanding claims and claim expense reserves for these operations include insurance policies and quota share reinsurance with respect to risks including: 1) commercial property, which principally included catastrophe-exposed commercial property products; 2) commercial multi-line, which included commercial property and liability coverage, such as general liability, automobile liability and physical damage, building and contents, professional liability and various specialty products; and 3) personal lines property, which principally included homeowners personal lines property coverage and catastrophe exposed personal lines property coverage.
We use the Bornhuetter-Ferguson actuarial method to estimate claims and claim expenses within the Other category for our property and casualty insurance and quota share reinsurance business. The comments discussed above relating to our reserving techniques and processes for our specialty reinsurance unit within our Reinsurance segment also apply to our Other category. In addition, certain of our coverages may be impacted by natural and man-made catastrophes. We estimate claim reserves for these losses after the event giving rise to these losses occurs, following a process that is similar to our catastrophe unit.
Development of Prior Year Liability for Unpaid Claims and Claim Expenses
The following table details the development of our liability for unpaid claims and claim expenses for our Other category split between large catastrophe events and attritional claims and claim expenses: |
| | | | | | | | | | | | | |
| | | | | | | | |
| | | 2012 | | 2011 | | 2010 | |
| | Catastrophe events | $ | 1,171 |
| | $ | 4,243 |
| | $ | 300 |
| |
| | Attritional claims and claim expenses | 3,265 |
| | 1,389 |
| | 15,615 |
| |
| | Loss portfolio transfer | (7,383 | ) | | — |
| | — |
| |
| | Actuarial assumption changes | — |
| | (10,063 | ) | | — |
| |
| | Total | $ | (2,947 | ) | | $ | (4,431 | ) | | $ | 15,915 |
| |
| | | | | | | | |
The adverse development on prior accident years of $2.9 million for the year ended December 31, 2012 within our Other category was principally the result of a loss portfolio transfer entered into by the Company on October 1, 2012, in respect of its contractor's liability book of business within Glencoe, whereby the Company paid consideration of $36.5 million to transfer net liabilities of $29.1 million, resulting in a loss of $7.4 million which is recorded above as prior accident years attritional claims and claims expenses in the Company's Other category, partially offset by reductions in reported losses on certain attritional loss contracts and favorable development related to catastrophe events, primarily the 2008 hurricanes.
The adverse development on prior accident years of $4.4 million in 2011 within the Company's Other category was principally due to the construction defect book of business, which experienced higher than expected reported losses, and was subsequently subject to a comprehensive actuarial review during the fourth quarter of 2011, which review resulted in an increase of $10.1 million to the estimated ultimate claims and claim expenses related to this book of business due to changes in the actuarial assumptions. The total gross reserve for claims and claim expenses for the construction defect book of business at December 31, 2011 is $58.8 million. Partially offsetting the adverse development on prior accident years within the construction defect book of business, noted above, was favorable development of $4.2 million related to large catastrophe events, of which $4.6 million related to the 2005 hurricanes, and $1.4 million related to the application of our formulaic actuarial reserving methodology with the reductions being due to actual paid and reported claim activity being more favorable to date than what was originally anticipated when setting the initial reserves.
The favorable development of $15.9 million in 2010 on prior accident year claims and claim expenses within the Company's Other category was principally driven by the application of the Company's formulaic actuarial reserving methodology for this business with the reductions being due to actual paid and reported claim activity being more favorable to date than what was originally anticipated when setting the initial reserves. There were no significant changes made to the actuarial assumptions in 2010 or to the ultimate claims associated with the large catastrophe events.
Actual Results vs. Initial Estimates
The Actual vs. Initial Estimated Ultimate Claims and Claim Expense Ratio table below summarizes our key actuarial assumptions in reserving for our Other category. As noted above, the key actuarial assumptions include the estimated ultimate claims and claim expense ratios and the estimated loss reporting patterns. The table shows our initial estimates of the ultimate claims and claim expense ratios by accident year. The table shows how our initial estimates of these ratios have developed over time with the re-estimated ratios reflecting a combination of the amount and timing of paid and reported losses compared to our initial estimates. The initial estimate is based on the actuarial assumptions that were in place at the end of that year. A decrease in the ultimate claims and claim expense ratio implies that our current estimates are lower than our initial estimates while an increase in the ultimate claims and claim expense ratio implies that our
current estimates are higher than our initial estimates. The result would be a corresponding favorable impact on shareholders' equity and net income or a corresponding unfavorable impact on shareholders' equity and net income, respectively. The table also shows how our initial estimated ultimate claims and claim expense ratios have changed from one accident year to the next. The table below reflects a summary of the weighted average assumptions for all classes of business written within our Other category. The table is presented on a gross loss basis and therefore does not include the benefit of reinsurance recoveries or loss related premium.
Actual vs. Initial Estimated Other Category Claims and Claim Expense Reserve Analysis – Estimated Ultimate Claims and Claim Expense Ratio |
| | | | | | | | | | |
| | | | | | | | | | | |
| | | | Estimated Ultimate Claims and Claim Expenses Ratio | |
| | Underwriting Year | | Initial Estimate | | Re-estimate at | |
| | December 31, 2010 | | December 31, 2011 | | December 31, 2012 | |
| | 2003 | | 55.3% | | 30.6% | | 32.6% | | 32.8% | |
| | 2004 | | 50.2% | | 45.1% | | 45.6% | | 46.3% | |
| | 2005 | | 45.0% | | 46.5% | | 46.5% | | 45.8% | |
| | 2006 | | 47.4% | | 36.6% | | 40.6% | | 40.6% | |
| | 2007 | | 45.7% | | 24.3% | | 24.7% | | 24.8% | |
| | 2008 | | 46.0% | | 68.0% | | 64.4% | | 63.2% | |
| | 2009 | | 53.0% | | 66.7% | | 61.5% | | 63.1% | |
| | 2010 | | 57.9% | | 129.5% | | 68.9% | | 64.8% | |
| | 2011 | | —% | | —% | | —% | | —% | |
| | 2012 | | —% | | —% | | —% | | —% | |
| | | | | | | | | | | |
The table above shows our initial estimated ultimate claims and claim expense ratios for attritional losses for each new underwriting year within our Other category as of the end of each calendar year. Our initial estimated ultimate remained relatively constant between 2005 and 2008. This reflects the fact that management has not made significant changes to its estimated initial expected ultimate claims and claim expense ratio from one period to the next during that period. The principal reason for the changes from one year to the next, for example, the 2009 through 2010 underwriting years, is that the mix of business has changed. As each underwriting year has developed, our re-estimated ultimate claims and claim expense ratios have generally been reduced until recently. This reflects the impact of actual experience where actual paid and reported losses to date for attritional losses are less than originally expected. For the years 2008 through 2010, our re-estimated ultimate claims and claim expense ratios increased from the initial estimate due to reported losses exceeding our initial estimate within our Other category's commercial property line of business, combined with a relatively low level of net premiums earned during those periods for our commercial property line of business. As described above, under the Bornhuetter-Ferguson actuarial method less weight is placed on initial estimates and more weight is placed on actual experience as our claims and claim expense reserves age.
As noted above, some of the contracts were exposed to claims and claim expenses from large natural and man-made catastrophes. Claims and claim expenses from these large catastrophes are reserved for after the event which gave rise to the claims in a manner which is consistent with our property catastrophe reinsurance reserving practices as discussed above. The large catastrophes occurring during the period from 2004 to 2008 principally include hurricanes Charley, Frances, Ivan and Jeanne in 2004, hurricanes Katrina, Rita and Wilma in 2005, and hurricanes Gustav and Ike in 2008. Our ultimate claims and claim expenses from these events within our Other category are shown in the table below. |
| | | | | | | | | | | | | | | | | | | | | | | | | | | | | | | | |
| | | | | | | | | | | | | | | | | | | |
| | (in thousands, except percentages) | | Re-estimated Claims and Claim Expenses at | | | | | | | | | |
| | Events (Accident Year) | | Initial Estimate of Accident Year Claims and Claim Expenses | | December 31, 2010 | | December 31, 2011 | | December 31, 2012 | | Cumulative Favorable (Adverse) Development | | % Decrease (Increase) from Initial Estimate | | Claims and Claim Expense Reserves at December 31, 2012 | | % of Claims and Claim Expenses Unpaid at December 31, 2012 | |
| | Charley, Frances, Ivan and Jeanne (2004) | | $ | 210,323 |
| | $ | 249,949 |
| | $ | 249,456 |
| | $ | 249,500 |
| | $ | (39,177 | ) | | (18.6 | )% | | $ | 585 |
| | 0.2 | % | |
| | Katrina, Rita and Wilma (2005) | | 311,312 |
| | 297,596 |
| | 293,477 |
| | 296,801 |
| | 14,511 |
| | 4.7 | % | | 5,278 |
| | 1.8 | % | |
| | Gustav and Ike (2008) | | 19,258 |
| | 19,849 |
| | 18,500 |
| | 18,500 |
| | 758 |
| | 3.9 | % | | 5,949 |
| | 32.2 | % | |
| | | | $ | 540,893 |
| | $ | 567,394 |
| | $ | 561,433 |
| | $ | 564,801 |
| | $ | (23,908 | ) | | (4.4 | )% | | $ | 11,812 |
| | 2.1 | % | |
| | | | | | | | | | | | | | | | | | | |
Sensitivity Analysis
The table below quantifies the impact on our reserves for claims and claim expenses, net income and shareholders' equity as of and for the year ended December 31, 2012 of reasonably likely changes to the actuarial assumptions used to estimate our December 31, 2012 claims and claim expense reserves within our Other category. The table quantifies reasonably likely changes in our initial estimated ultimate claims and claim expense ratios and estimated loss reporting patterns. The changes to the initial estimated ultimate claims and claim expense ratios represent percentage increases or decreases to our current estimated ultimate claims and claim expense ratios. The change to the reporting patterns represent claims reporting that is both faster and slower than our current estimated reporting patterns. The impact on net income and shareholders' equity assumes no increase or decrease in reinsurance recoveries or loss related premium and is before tax.
Other Category Claims and Claim Expense Reserve Sensitivity Analysis |
| | | | | | | | | | | | | | | | |
| | | | | | | | | | | | |
| | (in thousands,except percentages) | Estimated Loss Reporting Pattern | | $ Impact of Change on Reserves for Claims and Claim Expenses at December 31, 2012 | | % Impact of Change on Reserves for Claims and Claim Expenses at December 31, 2012 | | % Impact of Change on Net Income for the Year Ended December 31, 2012 | | % Impact of Change on Shareholders' Equity at December 31, 2012 | |
| | Increase expected claims and claim expense ratio by 25% | Slower reporting | | $ | 27,914 |
| | 1.5 | % | | (3.7 | )% | | (0.8 | )% | |
| | Increase expected claims and claim expense ratio by 25% | Expected reporting | | 10,450 |
| | 0.6 | % | | (1.4 | )% | | (0.3 | )% | |
| | Increase expected claims and claim expense ratio by 25% | Faster reporting | | (1,541 | ) | | (0.1 | )% | | 0.2 | % | | — | % | |
| | Expected claims and claim expense ratio | Slower reporting | | 13,971 |
| | 0.7 | % | | (1.9 | )% | | (0.4 | )% | |
| | Expected claims and claim expense ratio | Expected reporting | | — |
| | — | % | | — | % | | — | % | |
| | Expected claims and claim expense ratio | Faster reporting | | (9,592 | ) | | (0.5 | )% | | 1.3 | % | | 0.3 | % | |
| | Decrease expected claims and claim expense ratio by 25% | Slower reporting | | 29 |
| | — | % | | — | % | | — | % | |
| | Decrease expected claims and claim expense ratio by 25% | Expected reporting | | (10,450 | ) | | (0.6 | )% | | 1.4 | % | | 0.3 | % | |
| | Decrease expected claims and claim expense ratio by 25% | Faster reporting | | (17,644 | ) | | (0.9 | )% | | 2.4 | % | | 0.5 | % | |
| | | | | | | | | | | | |
We believe that ultimate claims and claim expense ratios 25.0 percentage points above or below our estimated assumptions constitute reasonably likely outcomes based on our experience to date and our future expectations. In addition, we believe that the adjustments that we made to speed up or slow down our estimated loss reporting patterns are reasonably likely changes. While we believe these are reasonably likely changes, we do not believe the reader should consider the above sensitivity analysis an actuarial reserve range. In addition, we caution the reader that the above sensitivity analysis only reflects reasonably likely changes. It is possible that our initial estimated claims and claim expense ratios and loss reporting patterns could be significantly different from the sensitivity analysis described above. For example, we could be liable for events which we have not estimated reserves for or for exposures we do not currently think are covered under our contracts. These changes could result in significantly larger changes to our reserves for claims and claim expenses, net income and shareholders' equity than those noted above. We also caution the reader that the above sensitivity analysis is not used by management in developing our reserve estimates and is also not used by management in managing the business.
Reinsurance Recoverable
We enter into reinsurance agreements in order to help reduce our exposure to large losses and to help manage our risk portfolio. Amounts recoverable from reinsurers are estimated in a manner consistent with the claims and claim expense reserves associated with the related assumed reinsurance. For multi-year retrospectively rated contracts, we accrue amounts (either assets or liabilities) that are due to or from assuming companies based on estimated contract experience. If we determine that adjustments to earlier estimates are appropriate, such adjustments are recorded in the period in which they are determined.
The estimate of reinsurance recoverable can be more subjective than estimating the underlying claims and claim expense reserves as discussed under the heading "Claims and Claim Expense Reserves" above. In particular, reinsurance recoverable may be affected by deemed inuring reinsurance, industry losses reported by various statistical reporting services, and other factors. Reinsurance recoverable on dual trigger reinsurance contracts require us to estimate our ultimate losses applicable to these contracts as well as estimate the ultimate amount of insured losses for the industry as a whole that will be reported by the applicable statistical reporting agency, as per the contract terms. In addition, the level of our additional case
reserves and IBNR reserves has a significant impact on reinsurance recoverable. These factors can impact the amount and timing of the reinsurance recoverable to be recorded.
The majority of the balance we have accrued as recoverable will not be due for collection until some point in the future. The amounts recoverable ultimately collected are open to uncertainty due to the ultimate ability and willingness of reinsurers to pay our claims, for reasons including insolvency and elective run-off, contractual dispute and various other reasons. In addition, because the majority of the balances recoverable will not be collected for some time, economic conditions as well as the financial and operational performance of a particular reinsurer may change, and these changes may affect the reinsurer's willingness and ability to meet their contractual obligations to us. To reflect these uncertainties, we estimate and record a valuation allowance for potential uncollectible reinsurance recoverable which reduces reinsurance recoverable and net earnings.
We estimate our valuation allowance by applying specific percentages against each recovery based on our counterparty's credit rating. The percentages applied are based on historical industry default statistics developed by major rating agencies and are then adjusted by us based on industry knowledge and our judgment and estimates. We also apply case-specific valuation allowances against certain recoveries that we deem unlikely to be collected in full. We then evaluate the overall adequacy of the valuation allowance based on other qualitative and judgmental factors. The valuation allowance recorded against reinsurance recoverable was $4.5 million at December 31, 2012 (2011 - $7.3 million). The reinsurers with the three largest balances accounted for 14.3%, 14.3% and 12.6%, respectively, of our reinsurance recoverable balance at December 31, 2012 (2011 - 27.3%, 14.9% and 12.4%, respectively). The three largest company-specific components of the valuation allowance represented 44.1%, 26.7% and 6.1%, respectively, of our total valuation allowance at December 31, 2012 (2011 - 34.2%, 27.3% and 12.0%, respectively).
Fair Value Measurements and Impairments
Fair Value
The use of fair value to measure certain assets and liabilities with resulting unrealized gains or losses is pervasive within our financial statements. Fair value is defined under accounting guidance currently applicable to us to be the price that would be received upon the sale of an asset or paid to transfer a liability in an orderly transaction between open market participants at the measurement date. We recognize the change in unrealized gains and losses arising from changes in fair value in our consolidated statements of operations, with the exception of changes in unrealized gains and losses on our fixed maturity investments available for sale, which are recognized as a component of accumulated other comprehensive income in shareholders' equity.
FASB ASC Topic Fair Value Measurements and Disclosures prescribes a fair value hierarchy that prioritizes the inputs to the respective valuation techniques used to measure fair value. The hierarchy gives the highest priority to unadjusted quoted prices in active markets for identical assets or liabilities (Level 1) and the lowest priority to valuation techniques that use at least one significant input that is unobservable (Level 3). The three levels of the fair value hierarchy are described below:
| |
| • | Fair values determined by Level 1 inputs utilize unadjusted quoted prices obtained from active markets for identical assets or liabilities for which we have access. The fair value is determined by multiplying the quoted price by the quantity held by us; |
| |
| • | Fair values determined by Level 2 inputs utilize inputs other than quoted prices included in Level 1 that are observable for the asset or liability, either directly or indirectly. Level 2 inputs include quoted prices for similar assets and liabilities in active markets, and inputs other than quoted prices that are observable for the asset or liability, such as interest rates and yield curves that are observable at commonly quoted intervals, broker quotes and certain pricing indices; and |
| |
| • | Level 3 inputs are based all or in part on significant unobservable inputs for the asset or liability, and include situations where there is little, if any, market activity for the asset or liability. In these cases, significant management assumptions can be used to establish management's best estimate of the assumptions used by other market participants in determining the fair value of the asset or liability. |
In certain cases, the inputs used to measure fair value may fall into different levels of the fair value hierarchy. In such cases, the level in the fair value hierarchy within which the fair value measurement in its entirety falls has been determined based on the lowest level input that is significant to the fair value measurement of the asset or liability. Our assessment of the significance of a particular input to the fair value measurement in its entirety requires judgment, and we consider factors specific to the asset or liability.
In order to determine if a market is active or inactive for a security, we consider a number of factors, including, but not limited to, the spread between what a seller is asking for a security and what a buyer is bidding for the same security, the volume of trading activity for the security in question, the price of the security compared to its par value (for fixed maturity investments), and other factors that may be indicative of market activity.
There have been no material changes in our valuation techniques, nor have there been any transfers between Level 1 and Level 2, during the period represented by these consolidated financial statements.
Below is a summary of the assets and liabilities that are measured at fair value on a recurring basis and also represents the carrying amount of such assets and liabilities on our consolidated balance sheet: |
| | | | | | | | | | | | | | | | | |
| | | | | | | | | | |
| | At December 31, 2012 | Total | | Quoted Prices in Active Markets for Identical Assets (Level 1) | | Significant Other Observable Inputs (Level 2) | | Significant Unobservable Inputs (Level 3) | |
| | Fixed maturity investments | | | | | | | | |
| | U.S. treasuries | $ | 1,259,800 |
| | $ | 1,259,800 |
| | $ | — |
| | $ | — |
| |
| | Agencies | 315,154 |
| | — |
| | 315,154 |
| | — |
| |
| | Non-U.S. government (Sovereign debt) | 133,198 |
| | — |
| | 133,198 |
| | — |
| |
| | Non-U.S. government-backed corporate | 349,514 |
| | — |
| | 349,514 |
| | — |
| |
| | Corporate | 1,615,207 |
| | — |
| | 1,587,415 |
| | 27,792 |
| |
| | Agency mortgage-backed | 408,531 |
| | — |
| | 408,531 |
| | — |
| |
| | Non-agency mortgage-backed | 248,339 |
| | — |
| | 248,339 |
| | — |
| |
| | Commercial mortgage-backed | 406,166 |
| | — |
| | 406,166 |
| | — |
| |
| | Asset-backed | 12,954 |
| | — |
| | 12,954 |
| | — |
| |
| | Total fixed maturity investments | 4,748,863 |
| | 1,259,800 |
| | 3,461,271 |
| | 27,792 |
| |
| | Short term investments | 821,163 |
| | — |
| | 821,163 |
| | — |
| |
| | Equity investments trading | 58,186 |
| | 58,186 |
| | — |
| | — |
| |
| | Other investments | | | | | | | | |
| | Private equity partnerships | 344,669 |
| | — |
| | — |
| | 344,669 |
| |
| | Senior secured bank loan funds | 202,929 |
| | — |
| | 172,334 |
| | 30,595 |
| |
| | Catastrophe bonds | 91,310 |
| | — |
| | 91,310 |
| | — |
| |
| | Hedge funds | 5,803 |
| | — |
| | — |
| | 5,803 |
| |
| | Total other investments | 644,711 |
| | — |
| | 263,644 |
| | 381,067 |
| |
| | Other assets and (liabilities) | | | | | | | | |
| | Assumed and ceded (re)insurance contracts | 2,647 |
| | — |
| | — |
| | 2,647 |
| |
| | Derivatives (1) | 19,123 |
| | (125 | ) | | 14,821 |
| | 4,427 |
| |
| | Other | 7,315 |
| | — |
| | (11,551 | ) | | 18,866 |
| |
| | Total other assets and (liabilities) | 29,085 |
| | (125 | ) | | 3,270 |
| | 25,940 |
| |
| | | $ | 6,302,008 |
| | $ | 1,317,861 |
| | $ | 4,549,348 |
| | $ | 434,799 |
| |
| | | | | | | | | | |
| |
| (1) | See "Note 19. Derivative Instruments in our Notes to Consolidated Financial Statements" for additional information related to the fair value by type of contract, of derivatives entered into by us. |
As at December 31, 2012, we classified $449.3 million and $14.5 million of assets and liabilities, respectively, at fair value on a recurring basis using Level 3 inputs. This represented 5.7% and 0.4% of our total assets and liabilities, respectively. Level 3 fair value measurements are based on valuation techniques that use at least one significant input that is unobservable. These measurements are made under circumstances in which there is little, if any, market activity for the asset or liability. We use valuation models or other pricing techniques that require a variety of inputs including contractual terms, market prices and rates, yield curves, credit curves, measures of volatility, prepayment rates and correlations of such inputs, some of which may be unobservable, to value these Level 3 assets and liabilities. Our assessment of the significance of a particular input to the fair value measurement in its entirety requires judgment. In making the assessment, we considered factors specific to the asset or liability. In certain cases, the inputs used to measure fair value of an asset or a liability may fall into different levels of the fair value hierarchy. In such cases, the level in the fair value hierarchy within which the fair value measurement in its entirety is classified is determined based on the lowest level input that is significant to the fair value measurement of the asset or liability.
See to "Note 6. Fair Value Measurements in our Notes to Consolidated Financial Statements" for additional information about fair value measurements.
Impairments
The amount and timing of asset impairment is subject to significant estimation techniques and asset impairment is a critical accounting estimate for us. The more significant impairment reviews we complete are for our fixed maturity investments available for sale, equity method investments and goodwill and other intangible assets as described in more detail below.
Fixed Maturity Investments Available For Sale
Our quarterly process for assessing whether declines in the fair value of our fixed maturity investments available for sale represent impairments that are other-than-temporary includes reviewing each fixed maturity investment available for sale that is impaired and determining: (i) if we have the intent to sell the debt security or (ii) if it is more likely than not that we will be required to sell the debt security before its anticipated recovery; and (iii) whether a credit loss exists, that is, where we expect that the present value of the cash flows expected to be collected from the security are less than the amortized cost basis of the security.
In assessing our intent to sell securities, our procedures may include actions such as discussing planned sales with our third party investment managers, reviewing sales that have occurred shortly after the balance sheet date, and consideration of other qualitative factors that may be indicative of our intent to sell or hold the relevant securities. We recognized a total of $Nil of other-than-temporary impairments due to our intent to sell these securities during the year ended December 31, 2012 (2011 - $Nil, 2010 - $Nil).
In assessing whether it is more likely than not that we will be required to sell a security before its anticipated recovery, we consider various factors including our future cash flow forecasts and requirements, legal and regulatory requirements, the level of our cash, cash equivalents, short term investments, fixed maturity investments trading and fixed maturity investments available for sale in an unrealized gain position, and other relevant factors. For the year ended December 31, 2012, we recognized $Nil of other-than-temporary impairments due to required sales (2011 – $Nil, 2010 - $Nil).
In evaluating credit losses, we consider a variety of factors in the assessment of a security including: (i) the time period during which there has been a significant decline below cost; (ii) the extent of the decline below cost and par; (iii) the potential for the security to recover in value; (iv) an analysis of the financial condition of the issuer; (v) the rating of the issuer; (vi) the implied rating of the issuer based on an analysis of option adjusted spreads; (vii) the absolute level of the option adjusted spread for the issuer; and (viii) an analysis of the collateral structure and credit support of the security, if applicable.
Once we determine that it is possible that a credit loss may exist for a security, we perform a detailed review of the cash flows expected to be collected from the issuer. We estimate expected cash flows by applying estimated default probabilities and recovery rates to the contractual cash flows of the issuer, with such default and recovery rates reflecting long-term historical averages adjusted to reflect current credit, economic and market conditions, giving due consideration to collateral and credit support, if applicable, and
discounting the expected cash flows at the purchase yield on the security. In instances in which a determination is made that an impairment exists but we do not intend to sell the security and it is not more likely than not that we will be required to sell the security before the anticipated recovery of its remaining amortized cost basis, the impairment is separated into: (i) the amount of the total other-than-temporary impairment related to the credit loss; and (ii) the amount of the total other-than-temporary impairment related to all other factors. The amount of the other-than-temporary impairment related to the credit loss is recognized in earnings. The amount of the other-than-temporary impairment related to all other factors is recognized in other comprehensive income. For the year ended December 31, 2012, we recognized $0.3 million and $0.1 million of credit related other-than-temporary impairments which were recognized in earnings and other than-temporary impairments related to other factors which were recognized in other comprehensive income, respectively (2011 – $0.6 million and $0.1 million, respectively, 2010 - $0.8 million and $2 thousand, respectively). At December 31, 2012, our gross unrealized losses on fixed maturity investments available for sale totaled $0.1 million.
Investments in Other Ventures, Under Equity Method
Investments in which we have significant influence over the operating and financial policies of the investee are classified as investments in other ventures, under equity method, and are accounted for under the equity method of accounting. Under this method, we record our proportionate share of income or loss from such investments in our results for the period. Any decline in the value of investments in other ventures, under equity method, including goodwill and other intangible assets arising upon acquisition of the investee, considered by management to be other-than-temporary, is impaired and is reflected in our consolidated statements of operations in the period in which it is determined. As of December 31, 2012, we had $87.7 million (2011 - $70.7 million) in investments in other ventures, under equity method on our consolidated balance sheets, including $10.8 million of goodwill and $19.6 million of other intangible assets (2011 – $9.0 million and $24.5 million).
In determining whether an equity method investment is impaired, we look at a variety of factors including the operating and financial performance of the investee, the investee's future business plans and projections, recent transactions and market valuations of publicly traded companies where available, discussions with the investee's management, and our intent and ability to hold the investment until it recovers in value. In doing this, we make assumptions and estimates in assessing whether an impairment has occurred and if, in the future, our assumptions and estimates made in assessing the fair value of these investments change, this could result in a material decrease in the carrying value of these investments. This would cause us to write-down the carrying value of these investments and could have a material adverse effect on our results of operations in the period the impairment charge is taken. During the year ended December 31, 2012, we recorded $Nil (2011 - $Nil, 2010 - $0.8 million) other-than-temporary impairment charges related to investments in other ventures, under the equity method.
Goodwill and Other Intangible Assets
Goodwill and other intangible assets acquired are initially recorded at fair value. Subsequent to initial recognition, finite lived other intangible assets are amortized over their estimated useful life, subject to impairment, and goodwill and indefinite lived other intangible assets are carried at the lower of cost or fair value. If goodwill or other intangible assets are impaired, they are written down to their estimated fair values with a corresponding expense reflected in our consolidated statements of operations.
We test goodwill and other intangible assets for impairment in the fourth quarter of each year, or more frequently if events or changes in circumstances indicate that the carrying amount may not be recoverable. For purposes of the annual impairment evaluation, goodwill is assigned to the applicable reporting unit of the acquired entities giving rise to the goodwill and other intangible assets and is tested based on the cash flows they produce. There are generally many assumptions and estimates underlying the fair value calculation. Principally, we identify the reporting unit or business entity that the goodwill or other intangible asset is attributed to, and review historical and forecasted operating and financial performance and other underlying factors affecting such analysis, including market conditions. Other assumptions used could produce significantly different results which may result in a change in the value of goodwill or our other intangible assets and related charge in our consolidated statements of operations. An impairment charge could be recognized in the event of a significant decline in the implied fair value of those operations where the goodwill or other intangible assets are applicable. As at December 31, 2012, excluding the amounts
recorded in investments in other ventures, under equity method, as noted above, our consolidated balance sheets include $5.9 million of goodwill (2011 - $5.9 million) and $2.6 million of other intangible assets (2011 - $3.0 million). Impairment charges were $Nil during the year ended December 31, 2012 (2011 - $5.2 million, 2010 - $Nil).
Income Taxes
Income taxes have been provided in accordance with the provisions of FASB ASC Topic Income Taxes. Deferred tax assets and liabilities result from temporary differences between the amounts recorded in our consolidated financial statements and the tax basis of the Company's assets and liabilities. Such temporary differences are primarily due to net operating loss carryforwards and GAAP versus tax basis accounting differences related to interest expense, underwriting results, accrued expenses and investments. The effect on deferred tax assets and liabilities of a change in tax rates is recognized in income in the period that includes the enactment date. A valuation allowance against deferred tax assets is recorded if it is more likely than not that all, or some portion, of the benefits related to deferred tax assets will not be realized.
At December 31, 2012, our net deferred tax asset (prior to our valuation allowance) and valuation allowance were $48.0 million (2011 - $34.6 million) and $48.2 million (2011 - $35.0 million), respectively (see "Note 15. Taxation in our Notes to Consolidated Financial Statements" for additional information). At each balance sheet date, we assess the need to establish a valuation allowance that reduces the net deferred tax asset when it is more likely than not that all, or some portion, of the deferred tax assets will not be realized. The valuation allowance is based on all available information including projections of future GAAP taxable income from each tax-paying component in each tax jurisdiction. Losses incurred within our U.S. tax-paying subsidiaries in the fourth quarter of 2011 were significant enough to result in a cumulative GAAP taxable loss at the U.S. tax-paying subsidiaries for the three year period ended December 31, 2011. We reassess our valuation allowance on a quarterly basis and commencing with our reassessment effective December 31, 2011, we determined that it is more likely than not that we would not be able to recover our U.S. net deferred tax asset and as a result, recognized a full valuation allowance in the fourth quarter of 2011. At December 31, 2012, our U.S. tax-paying subsidiaries had a net deferred tax asset of $37.7 million (2011 - $26.4 million), for which a full valuation allowance has been provided as we continued to remain in a cumulative three year GAAP taxable loss position at our U.S. tax-paying subsidiaries throughout 2012, among other facts. Our Ireland and U.K. operations have produced GAAP taxable losses and we currently do not believe it is more likely than not that we will be able to recover our net deferred tax assets from these operations.
The Company has unrecognized tax benefits of $Nil as of December 31, 2012 (2011 - $3.3 million). Interest and penalties related to unrecognized tax benefits, would be recognized in income tax expense. At December 31, 2012, interest and penalties accrued on unrecognized tax benefits was $Nil (2011 - $Nil). Income tax returns filed for tax years 2009 through 2011, 2008 through 2011 and 2011, are open for examination by the Internal Revenue Service, Irish tax authorities and U.K. tax authorities, respectively. The Company does not expect the resolution of these open years to have a significant impact on its consolidated statements of operations and financial condition.
SUMMARY OF RESULTS OF OPERATIONS |
| | | | | | | | | | | | | |
| | | | | | | | |
| | Year ended December 31, | 2012 | | 2011 | | 2010 | |
| | (in thousands, except per share amounts and percentages) | | | | | | |
| | Statements of operations highlights | | | | | | |
| | Gross premiums written | $ | 1,551,591 |
| | $ | 1,434,976 |
| | $ | 1,165,295 |
| |
| | Net premiums written | 1,102,657 |
| | 1,012,773 |
| | 848,965 |
| |
| | Net premiums earned | 1,069,355 |
| | 951,049 |
| | 864,921 |
| |
| | Net claims and claim expenses incurred | 325,211 |
| | 861,179 |
| | 129,345 |
| |
| | Underwriting income (loss) | 451,301 |
| | (177,172 | ) | | 474,573 |
| |
| | Net investment income | 167,375 |
| | 118,000 |
| | 203,955 |
| |
| | Net realized and unrealized gains on investments | 163,991 |
| | 70,668 |
| | 144,444 |
| |
| | Income (loss) from continuing operations | 746,662 |
| | (74,502 | ) | | 798,482 |
| |
| | Income (loss) from discontinued operations | 2,287 |
| | (15,890 | ) | | 62,670 |
| |
| | Net income (loss) | 748,949 |
| | (90,392 | ) | | 861,152 |
| |
| | Net income (loss) available (attributable) to RenaissanceRe common shareholders | 566,014 |
| | (92,235 | ) | | 702,613 |
| |
| | | | | | | | |
| | Income (loss) from continuing operations available (attributable) to RenaissanceRe common shareholders per common share – diluted | $ | 11.18 |
| | $ | (1.53 | ) | | $ | 11.18 |
| |
| | Income (loss) from discontinued operations per common share – diluted | 0.05 |
| | (0.31 | ) | | 1.13 |
| |
| | Net income (loss) available (attributable) to RenaissanceRe common shareholders per common share – diluted | $ | 11.23 |
| | $ | (1.84 | ) | | $ | 12.31 |
| |
| | Dividends per common share | $ | 1.08 |
| | $ | 1.04 |
| | $ | 1.00 |
| |
| | | | | | | | |
| | Key ratios | | | | | | |
| | Net claims and claim expense ratio – current accident year | 45.2 | % | | 104.4 | % | | 49.9 | % | |
| | Net claims and claim expense ratio – prior accident years | (14.8 | )% | | (13.8 | )% | | (34.9 | )% | |
| | Net claims and claim expense ratio – calendar year | 30.4 | % | | 90.6 | % | | 15.0 | % | |
| | Underwriting expense ratio | 27.4 | % | | 28.0 | % | | 30.1 | % | |
| | Combined ratio | 57.8 | % | | 118.6 | % | | 45.1 | % | |
| | | | | | | | |
| | Return on average common equity | 17.7 | % | | (3.0 | )% | | 21.7 | % | |
| | | | | | | | |
| | Book value | December 31,
2012 | | December 31,
2011 | | December 31,
2010 | |
| | Book value per common share | $ | 68.14 |
| | $ | 59.27 |
| | $ | 62.58 |
| |
| | Accumulated dividends per common share | 12.00 |
| | 10.92 |
| | 9.88 |
| |
| | Book value per common share plus accumulated dividends | $ | 80.14 |
| | $ | 70.19 |
| | $ | 72.46 |
| |
| | Change in book value per common share plus change in accumulated dividends | 16.8 | % | | (3.6 | )% | | 23.0 | % | |
| | | | | | | | |
| | Balance sheet highlights | December 31,
2012 | | December 31,
2011 | | December 31,
2010 | |
| | Total assets | $ | 7,928,628 |
| | $ | 7,744,912 |
| | $ | 8,138,278 |
| |
| | Total shareholders' equity attributable to RenaissanceRe | $ | 3,503,065 |
| | $ | 3,605,193 |
| | $ | 3,936,325 |
| |
| | | | | | | | |
Below is a discussion of the results of operations for the year ended December 31, 2012 compared to the year ended December 31, 2011.
Net income available to RenaissanceRe common shareholders was $566.0 million in 2012, compared to a net loss attributable to RenaissanceRe common shareholders of $92.2 million in 2011, an improvement of $658.2 million. As a result of our net income available to RenaissanceRe common shareholders in 2012, we generated an annualized return on average common equity of 17.7% and our book value per common share increased from $59.27 at December 31, 2011 to $68.14 at December 31, 2012, a 16.8% increase, after considering the change in accumulated dividends paid to our common shareholders.
The most significant events affecting our financial performance during 2012, on a comparative basis to 2011, include:
| |
| • | Increased Gross Premiums Written - gross premiums written increased $116.6 million, or 8.1%, to $1,551.6 million. Excluding the impact of $20.1 million and $160.3 million of net reinstatement premiums written from large losses in 2012 and 2011, respectively, gross premiums written increased $256.8 million, or 20.1% for the year, due to a combination of improved pricing during the 2012 renewals within our core markets, and continued growth across most lines of business within our specialty unit and Lloyd's segment; |
| |
| • | Significantly Improved Underwriting Results - underwriting income of $451.3 million and a combined ratio of 57.8% in 2012, compared to an underwriting loss of $177.2 million and a combined ratio of 118.6% in 2011, was positively impacted by the increase in gross premiums written, noted above, and a decrease in net claims and claim expenses of $536.0 million due to significantly lower insured losses with respect of large events. Included in underwriting income for 2012 was $149.1 million and $26.3 million of underwriting losses related to storm Sandy and hurricane Isaac, respectively, which added a total of 19.0 percentage points to our 2012 combined ratio. In 2011, a number of large losses, namely the 2011 New Zealand and Tohoku earthquakes, the large U.S. tornadoes, the Australian floods, losses arising from aggregate contracts, hurricane Irene and the Thailand floods (collectively referred to as the "2011 Large Losses") resulted in $725.2 million of underwriting losses and added 85.4 percentage points to the Company's combined ratio, as detailed in the table below; |
| |
| • | Higher Investment Results - our net investment income and net realized and unrealized gains on investments increased $49.4 million and $93.3 million, respectively, in 2012, compared to 2011, primarily due to higher total returns in our fixed maturity investments portfolio as a result of the significant tightening of credit spreads combined with higher average invested assets and improved valuations in our portfolio of other investments, specifically our senior secured bank loan funds; |
| |
| • | Equity in Earnings of Other Ventures - our equity in earnings of other ventures improved to earnings of $23.2 million in 2012, compared to a loss of $36.5 million in 2011. The $59.8 million improvement is primarily due to our equity investment in Top Layer Re which generated income of $20.8 million in 2012, compared to a loss of $37.5 million in 2011, an improvement of $58.3 million, principally due to the absence of large losses during 2012, compared to claims and claim expenses incurred in 2011 in Top Layer Re related to the 2011 New Zealand and Tohoku earthquakes; and partially offset by |
| |
| • | Other Loss - our other loss deteriorated $22.2 million to a loss of $22.9 million in 2012, compared to a loss of $0.7 million in 2011, primarily the result of ceded reinsurance contracts accounted for at fair value which incurred a loss of $4.6 million in 2012, compared to income of $37.4 million in 2011, due to net recoverables on the Tohoku earthquake in the first quarter of 2011 which did not reoccur in 2012 and partially offset by $20.8 million of trading losses within the Company's weather and energy risk management operations, compared to trading losses of $45.0 million in 2011; and |
| |
| • | Net (Income) Loss Attributable to Redeemable Noncontrolling Interest - DaVinciRe - our net income attributable to redeemable noncontrolling interest - DaVinciRe was $147.5 million in 2012, compared to net loss attributable to redeemable noncontrolling interest - DaVinciRe of $33.7 million in 2011, a change of $181.2 million, principally due to a significant improvement in underwriting income as a result of the decrease in current accident year net claims and claim expenses and higher investment results, as noted above, which also impacted DaVinciRe, and together resulted in net income of $212.5 million for DaVinciRe in 2012, compared to net loss of $61.3 million for DaVinciRe in 2011. In addition, our ownership in DaVinciRe decreased from 42.8% at December 31, 2011 to 30.8% at December 31, 2012, consequently increasing redeemable noncontrolling interest - DaVinciRe. |
Below is a discussion of the results of operations for the year ended December 31, 2011 compared to the year ended December 31, 2010.
Net loss attributable to RenaissanceRe common shareholders was $92.2 million in 2011, compared to $702.6 million of net income available to RenaissanceRe common shareholders in 2010, a decrease of $794.8 million. As a result of our net loss attributable to RenaissanceRe common shareholders in 2011, we generated a negative return on average common equity of 3.0% and our book value per common share decreased from $62.58 at December 31, 2010 to $59.27 at December 31, 2011, a 3.6% decrease, after considering the change in accumulated dividends paid to our common shareholders. In 2010, we generated returns on average common equity of 21.7%, and increased our book value per common share plus the change in accumulated dividends by 23.0%, respectively.
The most significant events affecting our financial performance during 2011, on a comparative basis to 2010 include:
| |
| • | Significant Catastrophe Events and Corresponding Underwriting Losses - our underwriting loss of $177.2 million in 2011 deteriorated $651.7 million from underwriting income of $474.6 million in 2010, primarily due to $725.2 million of underwriting losses as a result of a number of large losses, namely the 2011 Large Losses, and resulted in $559.5 million of net negative impact, compared to $211.7 million of net negative impact from the large losses of 2010, an increase of $347.9 million, as detailed below; |
| |
| • | Lower Favorable Development on Prior Years Claims and Claim Expenses - favorable development on prior years claims and claim expenses decreased $170.1 million to $132.0 million in 2011, compared to $302.1 million in 2010, and was comprised primarily of $136.9 million related to our Reinsurance segment, as detailed below; |
| |
| • | Lower Investment Results - net investment income and net realized and unrealized gains on investments deteriorated $86.0 million and $73.8 million, respectively, compared to 2010. The decrease in our investment results was primarily due to lower total returns on the fixed maturity investments portfolio, a decrease in the returns from our hedge fund and private equity investments due to relatively weaker performance, and lower returns on certain non-investment grade allocations included in other investments; |
| |
| • | Other (Loss) Income - our other (loss) income deteriorated $41.8 million to a loss of $0.7 million in 2011, compared to income of $41.1 million in 2010, primarily the result of $45.0 million of trading losses within the Company's weather and energy risk management operations due to the unusually warm weather experienced in the United Kingdom and certain parts of the the United States during the fourth quarter of 2011, compared to trading income of $8.1 million in 2010, more than offsetting our ceded reinsurance contracts accounted for at fair value which generated $37.4 million in income in 2011, compared to $5.2 million in 2010, principally as a result of net recoverables from the Tohoku earthquake; |
| |
| • | Equity in Losses of Other Ventures - our equity in losses of other ventures deteriorated to a loss of $36.5 million in 2011, compared to a loss of $11.8 million in 2010. The decrease is primarily due to our equity investment in Top Layer Re which incurred a loss of $37.5 million in 2011, compared to a loss of $12.1 million in 2010, a deterioration of $25.4 million, principally due to current accident year claims and claim expenses in Top Layer Re related to the 2011 New Zealand earthquake and the Tohoku earthquake; |
| |
| • | Loss from Discontinued Operations - our loss from discontinued operations is $15.9 million in 2011, compared to income from discontinued operations of $62.7 million in 2010, and is primarily due to certain tax related adjustments and the recognition of a $10.0 million expense related to a contractually agreed obligation to pay, or otherwise reimburse, QBE for amounts up to $10.0 million in respect of net adverse development on prior accident years net claims and claims expenses for reserves that were sold to QBE. Income from discontinued operations in 2010 is primarily due to underwriting income of $57.0 million which was principally attributable to strong underwriting results for the 2010 crop year; and partially offset by |
| |
| • | Net Loss Attributable to Redeemable Noncontrolling Interest - DaVinciRe - our net loss attributable to redeemable noncontrolling interest - DaVinciRe was $33.7 million in 2011, compared to net income attributable to redeemable noncontrolling interest - DaVinciRe of $116.5 million in 2010, a change of $150.2 million, and principally due to a significant reduction in underwriting income, due to the increase in current accident year net claims and claim expenses, combined with lower investment results, as noted above, which also impacted DaVinciRe and together resulted in a net loss for 2011, compared to net income in 2010, and consequently decreased redeemable noncontrolling interest - DaVinciRe. |
Net Negative Impact of Hurricane Isaac and storm Sandy and the 2011 Large Losses
Net negative impact of hurricane Isaac and storm Sandy and the 2011 Large Losses includes the sum of estimates of net claims and claim expenses incurred, earned reinstatement premiums assumed and ceded, lost profit commissions and redeemable noncontrolling interest - DaVinci Re. Net negative impact of the 2011 Large Losses also includes equity in the net claims and claim expenses of Top Layer Re, and other income in respect of ceded reinsurance contracts accounted for at fair value. Our estimates are based on a review of our potential exposures, preliminary discussions with certain counterparties and catastrophe modeling techniques. Given the magnitude and recent occurrence of these events, delays in receiving claims data, the contingent nature of business interruption and other exposures, potential uncertainties relating to reinsurance recoveries and other uncertainties inherent in loss estimation, meaningful uncertainty remains regarding losses from these events. In addition, a significant portion of the net claims and claim expenses associated with the 2011 New Zealand and Tohoku earthquakes and storm Sandy are concentrated with a few large clients and therefore the loss estimates for these events may vary significantly based on the claims experience of those clients. Accordingly, our actual net negative impact from the these events will vary from these preliminary estimates, perhaps materially so. Changes in these estimates will be recorded in the period in which they occur.
See the financial data below for additional information detailing the net negative impact of hurricane Isaac and storm Sandy on our consolidated financial statements in 2012. |
| | | | | | | | | | | | | |
| | | | | | | | |
| | Year ended December 31, 2012 | Hurricane Isaac | | Storm Sandy | | Total | |
| | (in thousands, except percentages) | | | | | | |
| | Net claims and claim expenses incurred | $ | (33,185 | ) | | $ | (187,944 | ) | | $ | (221,129 | ) | |
| | Reinstatement premiums earned | 8,863 |
| | 37,437 |
| | 46,300 |
| |
| | Ceded reinstatement premiums earned | — |
| | (385 | ) | | (385 | ) | |
| | Lost profit commissions | (2,016 | ) | | 1,771 |
| | (245 | ) | |
| | Net negative impact on underwriting result | (26,338 | ) | | (149,121 | ) | | (175,459 | ) | |
| | Redeemable noncontrolling interest - DaVinciRe | 8,925 |
| | 22,160 |
| | 31,085 |
| |
| | Net negative impact | $ | (17,413 | ) | | $ | (126,961 | ) | | $ | (144,374 | ) | |
| | Percentage point impact on consolidated combined ratio | 2.8 |
| | 16.0 |
| | 19.0 |
| |
| | | | | | | | |
| | Net negative impact on Reinsurance segment underwriting result | $ | (25,857 | ) | | $ | (132,061 | ) | | $ | (157,918 | ) | |
| | Net negative impact on Lloyd's segment underwriting result | (481 | ) | | (17,060 | ) | | (17,541 | ) | |
| | Net negative impact on underwriting result | $ | (26,338 | ) | | $ | (149,121 | ) | | $ | (175,459 | ) | |
| | | | | | | | |
See the financial data below for additional information detailing the net negative impact of the 2011 Large Losses on our consolidated financial statements in 2011. |
| | | | | | | | | | | | | | | | | | | | | | | | | | | | | | | | | |
| | | | | | | | | | | | | | | | | | |
| | | 2011 Large Losses | |
| | Year ended December 31, 2011 | 2011 New Zealand Earthquake | | Tohoku Earthquake | | Australian Floods | | Large U.S. Tornadoes | | Aggregate Contracts | | Hurricane Irene | | Thailand Floods | | Total | |
| | (in thousands, except percentages) | | | | | | | | | | | | | | | | |
| | Net claims and claim expenses incurred | $ | (273,596 | ) | | $ | (284,348 | ) | | $ | (12,273 | ) | | $ | (135,090 | ) | | $ | (33,080 | ) | | $ | (32,530 | ) | | $ | (76,437 | ) | | $ | (847,354 | ) | |
| | Assumed reinstatement premiums earned | 49,878 |
| | 60,914 |
| | 1,694 |
| | 23,273 |
| | 1,524 |
| | 5,874 |
| | 17,144 |
| | 160,301 |
| |
| | Ceded reinstatement premiums earned | (3,542 | ) | | (26,004 | ) | | — |
| | — |
| | — |
| | — |
| | — |
| | (29,546 | ) | |
| | Lost profit commissions | (7,522 | ) | | (331 | ) | | (348 | ) | | (151 | ) | | — |
| | — |
| | (245 | ) | | (8,597 | ) | |
| | Net negative impact on underwriting result | (234,782 | ) | | (249,769 | ) | | (10,927 | ) | | (111,968 | ) | | (31,556 | ) | | (26,656 | ) | | (59,538 | ) | | (725,196 | ) | |
| | Equity in net claims and claim expenses of Top Layer Re | (23,757 | ) | | (26,243 | ) | | — |
| | — |
| | — |
| | — |
| | — |
| | (50,000 | ) | |
| | Recoveries from ceded reinsurance contracts accounted for at fair value | — |
| | 45,000 |
| | — |
| | — |
| | — |
| | — |
| | — |
| | 45,000 |
| |
| | Redeemable noncontrolling interest - DaVinciRe | 55,748 |
| | 53,669 |
| | 1,182 |
| | 32,941 |
| | 4,944 |
| | 7,698 |
| | 14,474 |
| | 170,656 |
| |
| | Net negative impact | $ | (202,791 | ) | | $ | (177,343 | ) | | $ | (9,745 | ) | | $ | (79,027 | ) | | $ | (26,612 | ) | | $ | (18,958 | ) | | $ | (45,064 | ) | | $ | (559,540 | ) | |
| | Percentage point impact on consolidated combined ratio | 25.0 |
| | 26.5 |
| | 1.1 |
| | 11.6 |
| | 3.3 |
| | 2.7 |
| | 6.0 |
| | 85.4 |
| |
| | | | | | | | | | | | | | | | | | |
| | Net negative impact on Reinsurance segment underwriting result | $ | (228,756 | ) | | $ | (237,480 | ) | | $ | (10,927 | ) | | $ | (109,043 | ) | | $ | (31,556 | ) | | (24,156 | ) | | (53,538 | ) | | (695,456 | ) | |
| | Net negative impact on Lloyd's segment underwriting result | (6,026 | ) | | (12,289 | ) | | — |
| | (2,925 | ) | | — |
| | (2,500 | ) | | (6,000 | ) | | (29,740 | ) | |
| | Net negative impact on underwriting result | $ | (234,782 | ) | | $ | (249,769 | ) | | $ | (10,927 | ) | | $ | (111,968 | ) | | $ | (31,556 | ) | | $ | (26,656 | ) | | $ | (59,538 | ) | | $ | (725,196 | ) | |
| | | | | | | | | | | | | | | | | | |
Underwriting Results by Segment
Reinsurance Segment
Below is a summary of the underwriting results and ratios for our Reinsurance segment followed by an analysis of our catastrophe unit and specialty reinsurance unit underwriting results and ratios: |
| | | | | | | | | | | | | |
| | | | | | | | |
| | Reinsurance segment overview | | | | | | |
| | Year ended December 31, | 2012 | | 2011 | | 2010 | |
| | (in thousands, except percentages) | | | | | | |
| | Gross premiums written (1) | $ | 1,392,094 |
| | $ | 1,323,187 |
| | $ | 1,123,619 |
| |
| | Net premiums written | $ | 967,587 |
| | $ | 913,499 |
| | $ | 809,719 |
| |
| | Net premiums earned | $ | 946,423 |
| | $ | 873,088 |
| | $ | 838,790 |
| |
| | Net claims and claim expenses incurred | 242,022 |
| | 783,704 |
| | 113,804 |
| |
| | Acquisition expenses | 90,491 |
| | 82,978 |
| | 77,954 |
| |
| | Operational expenses | 132,935 |
| | 131,251 |
| | 129,990 |
| |
| | Underwriting income (loss) | $ | 480,975 |
| | $ | (124,845 | ) | | $ | 517,042 |
| |
| | | | | | | | |
| | Net claims and claim expenses incurred – current accident year | $ | 386,736 |
| | $ | 920,602 |
| | $ | 399,823 |
| |
| | Net claims and claim expenses incurred – prior accident years | (144,714 | ) | | (136,898 | ) | | (286,019 | ) | |
| | Net claims and claim expenses incurred – total | $ | 242,022 |
| | $ | 783,704 |
| | $ | 113,804 |
| |
| | | | | | | | |
| | Net claims and claim expense ratio – current accident year | 40.9 | % | | 105.4 | % | | 47.7 | % | |
| | Net claims and claim expense ratio – prior accident years | (15.3 | )% | | (15.6 | )% | | (34.1 | )% | |
| | Net claims and claim expense ratio – calendar year | 25.6 | % | | 89.8 | % | | 13.6 | % | |
| | Underwriting expense ratio | 23.6 | % | | 24.5 | % | | 24.8 | % | |
| | Combined ratio | 49.2 | % | | 114.3 | % | | 38.4 | % | |
| | | | | | | | |
| |
| (1) | Includes gross premiums written of $Nil assumed from the Other category for the year ended December 31, 2012 (2011 - $Nil, 2010 - $9.5 million). |
Reinsurance Segment Gross Premiums Written – Gross premiums written in our Reinsurance segment were $1,392.1 million in 2012, an increase of $68.9 million, or 5.2%, compared to $1,323.2 million in 2011. Excluding the impact of $18.7 million and $159.8 million of net reinstatement premiums written from large losses in 2012 and 2011, respectively, gross premiums written increased $210.0 million or 18.1%, primarily due to the catastrophe unit experiencing improved market conditions on a risk-adjusted basis within its core lines of business during the 2012 renewals and due to the inception of several new contracts during 2012 which met our risk-adjusted return thresholds within our specialty unit. Included in net reinstatement premiums written of $18.7 million in 2012 is $36.0 million related to storm Sandy, partially offset by $16.3 million and $9.9 million of negative reinstatement premiums written related to the 2011 New Zealand earthquake and Tohoku, respectively.
Gross premiums written in our Reinsurance segment increased by $199.6 million, or 17.8%, to $1,323.2 million in 2011, compared to $1,123.6 million in 2010, primarily due to an increase in gross premiums written in the catastrophe unit which was positively impacted by reinstatement premiums written on the 2011 Large Losses. Excluding the impact of $159.8 million and $28.0 million of reinstatement premiums written in 2011 and 2010, respectively, gross premiums written increased $67.8 million, or 6.2%, primarily due to improving market conditions in our core catastrophe markets during the June and July 2011 renewals, and partially offset by the softer market conditions in our core markets during the January 2011 renewals. In addition, our specialty reinsurance gross premiums written increased $16.5 million, or 12.8%, to $145.9 million, compared to $129.4 million in 2010, primarily due to the inception of new contracts during 2011 which met our risk-adjusted return thresholds.
Our Reinsurance segment premiums are prone to significant volatility due to the timing of contract inception and also due to the business being characterized by a relatively small number of relatively large transactions. In addition, our property catastrophe reinsurance gross premiums written continue to be characterized by a large percentage of U.S. and Caribbean premium as we have found business derived from exposures in Europe and the rest of the world to be, in general, less attractive on a risk-adjusted basis during recent periods. A significant amount of our U.S. and Caribbean premium provides coverage against windstorms, mainly U.S. Atlantic hurricanes, as well as earthquakes and other natural and man-made catastrophes.
Ceded Premiums Written |
| | | | | | | | | | | | | |
| | | | | | | | |
| | Year ended December 31, | 2012 | | 2011 | | 2010 | |
| | (in thousands) | | | | | | |
| | Ceded premiums written – Reinsurance segment | $ | 424,507 |
| | $ | 409,688 |
| | $ | 313,900 |
| |
| | | | | | | | |
Due to the potential volatility of the property catastrophe reinsurance contracts which we sell, we purchase reinsurance to reduce our exposure to large losses and to help manage our risk portfolio. We use our REMS© modeling system to evaluate how each purchase interacts with our portfolio of reinsurance contracts we write, and with the other ceded reinsurance contracts we purchase, to determine the appropriateness of the pricing of each contract and whether or not it helps us to balance our portfolio of risks.
Ceded premiums written increased by $14.8 million in 2012, compared to 2011. Excluding the impact of $1.0 million and $28.0 million of reinstatement premiums related to recoveries on certain large losses in 2012 and 2011, respectively, ceded premiums written increased by $41.8 million or 10.9%, primarily due to ceded premiums written of $48.5 million related to our managed joint ventures, Upsilon and Tim Re III.
Ceded premiums written increased by $95.8 million in 2011, compared to 2010, principally due to our decision to purchase additional reinsurance protection, combined with $28.0 million of reinstatement premiums related to recoveries on certain programs impacted by the 2011 New Zealand and Tohoku earthquakes.
To the extent that appropriately priced coverage is available, we anticipate continued use of reinsurance to reduce the impact of large losses on our financial results and to manage our portfolio of risk; however, the buying of ceded reinsurance in our Reinsurance segment is based on market opportunities and is not based on placing a specific reinsurance program each year. In addition, in future periods we may utilize the growing market for insurance-linked securities to expand our ceded reinsurance buying if we find the pricing and terms of such coverages attractive.
Reinsurance Segment Underwriting Results – Our Reinsurance segment generated underwriting income of $481.0 million in 2012, compared to incurring an underwriting loss of $124.8 million in 2011, an improvement of $605.8 million. In 2012, our Reinsurance segment generated a net claims and claim expense ratio of 25.6%, an underwriting expense ratio of 23.6% and a combined ratio of 49.2%, compared to 89.8%, 24.5% and 114.3%, respectively, in 2011.
The $605.8 million improvement in the Reinsurance segment's underwriting result and 65.1 percentage point decrease in the combined ratio was principally due to a decrease in current accident year claims and claim expenses in 2012, compared to 2011. During 2012, hurricane Isaac and storm Sandy had a net negative impact of $157.9 million, or 20.0 percentage points, on our Reinsurance segment's underwriting result and combined ratio, respectively, as detailed in the table below. In addition, current accident year net claims and claim expenses in 2012 included $16.0 million of estimated ultimate losses related to potential exposure to LIBOR related claims attributable to the current accident year.
See the financial data below for additional information detailing the net negative impact of hurricane Isaac and storm Sandy on our Reinsurance segment in 2012. |
| | | | | | | | | | | | | |
| | | | | | | | |
| | Year ended December 31, 2012 | Hurricane Isaac | | Storm Sandy | | Total | |
| | (in thousands, except percentages) | | | | | | |
| | Net claims and claim expenses incurred | $ | (32,685 | ) | | $ | (169,477 | ) | | $ | (202,162 | ) | |
| | Reinstatement premiums earned | 8,844 |
| | 36,030 |
| | 44,874 |
| |
| | Ceded reinstatement premiums earned | — |
| | (385 | ) | | (385 | ) | |
| | Lost profit commissions | (2,016 | ) | | 1,771 |
| | (245 | ) | |
| | Net negative impact on Reinsurance segment underwriting result | (25,857 | ) | | (132,061 | ) | | (157,918 | ) | |
| | Percentage point impact on Reinsurance segment combined ratio | 3.3 |
| | 16.5 |
| | 20.0 |
| |
| | | | | | | | |
| | Net negative impact on catastrophe unit underwriting result | $ | (25,857 | ) | | $ | (121,061 | ) | | $ | (146,918 | ) | |
| | Net negative impact on specialty unit underwriting result | — |
| | (11,000 | ) | | (11,000 | ) | |
| | Net negative impact on Reinsurance segment underwriting result | $ | (25,857 | ) | | $ | (132,061 | ) | | $ | (157,918 | ) | |
| | | | | | | | |
Our Reinsurance segment incurred an underwriting loss of $124.8 million in 2011, compared to $517.0 million of underwriting income in 2010, a decrease of $641.9 million. In 2011, our Reinsurance segment generated a net claims and claim expense ratio of 89.8%, an underwriting expense ratio of 24.5% and a combined ratio of 114.3%, compared to 13.6%, 24.8% and 38.4%, respectively, in 2010.
The $641.9 million decrease in the Reinsurance segment's underwriting result and 75.9 percentage point increase in the combined ratio was principally due to a $520.8 million increase in current accident year losses and a $149.1 million decrease in favorable development on prior years reserves in 2011, compared to 2010. The increase in current accident year losses was primarily due to the 2011 Large Losses, which negatively impacted the Reinsurance segment's underwriting result and combined ratio by $695.5 million and 91.3 percentage points, respectively, after considering the impact of net reinstatement premiums earned and net lost profit commission related to these events, as detailed in the table below. |
| | | | | | | | | | | | | | | | | | | | | | | | | | | | | | | | | |
| | | | | | | | | | | | | | | | | | |
| | | 2011 Large Losses | |
| | Year ended December 31, 2011 | 2011 New Zealand Earthquake | | Tohoku Earthquake | | Australian Floods | | Large U.S. Tornadoes | | Aggregate Contracts | | Hurricane Irene | | Thailand Floods | | Total | |
| | (in thousands, except percentages) | | | | | | | | | | | | | | | | |
| | Net claims and claim expenses incurred | $ | (267,570 | ) | | $ | (273,334 | ) | | $ | (12,273 | ) | | $ | (131,965 | ) | | $ | (33,080 | ) | | $ | (30,030 | ) | | $ | (70,437 | ) | | $ | (818,689 | ) | |
| | Assumed reinstatement premiums earned | 49,878 |
| | 60,603 |
| | 1,694 |
| | 23,073 |
| | 1,524 |
| | 5,874 |
| | 17,144 |
| | 159,790 |
| |
| | Ceded reinstatement premiums earned | (3,542 | ) | | (24,418 | ) | | — |
| | — |
| | — |
| | — |
| | — |
| | (27,960 | ) | |
| | Lost profit commissions | (7,522 | ) | | (331 | ) | | (348 | ) | | (151 | ) | | — |
| | — |
| | (245 | ) | | (8,597 | ) | |
| | Net negative impact on Reinsurance segment underwriting result | $ | (228,756 | ) | | $ | (237,480 | ) | | $ | (10,927 | ) | | $ | (109,043 | ) | | $ | (31,556 | ) | | $ | (24,156 | ) | | $ | (53,538 | ) | | $ | (695,456 | ) | |
| | Percentage point impact on Reinsurance segment combined ratio | 26.9 |
| | 27.8 |
| | 1.2 |
| | 12.4 |
| | 3.6 |
| | 2.7 |
| | 6.0 |
| | 91.3 |
| |
| | | | | | | | | | | | | | | | | | |
| | Net negative impact on catastrophe unit underwriting result | $ | (222,256 | ) | | $ | (229,980 | ) | | $ | (4,927 | ) | | $ | (109,043 | ) | | $ | (31,556 | ) | | $ | (24,156 | ) | | $ | (47,538 | ) | | $ | (669,456 | ) | |
| | Net negative impact on specialty unit underwriting result | (6,500 | ) | | (7,500 | ) | | (6,000 | ) | | — |
| | — |
| | — |
| | (6,000 | ) | | (26,000 | ) | |
| | Net negative impact on Reinsurance segment underwriting result | $ | (228,756 | ) |
| $ | (237,480 | ) | | $ | (10,927 | ) | | $ | (109,043 | ) | | $ | (31,556 | ) | | $ | (24,156 | ) | | $ | (53,538 | ) | | $ | (695,456 | ) | |
| | | | | | | | | | | | | | | | | | |
Losses from our property catastrophe reinsurance and specialty reinsurance policies can be infrequent, but severe, as demonstrated by our 2011 results. Although 2012 is generally considered to be the third most costly year for insured property catastrophe losses, behind only 2011 and 2005, we incurred a relatively low level of net claims and claim expenses. During periods with relatively low levels of property catastrophe loss activity, we have the potential to produce a low level of losses and a related increase in underwriting income. As described above, we believe there is likely to be an increase in the severity, and possibly the frequency, of weather related natural disasters and catastrophes relative to the historical experience over the past 100 years, including the frequency and severity of hurricanes that have the potential to make landfall in the U.S., potentially as a result of decadal ocean water temperature cyclical trends, changes in expected sea levels and a longer-term trend towards global warming.
Our Reinsurance segment prior year reserves experienced $144.7 million of net favorable development in 2012. The favorable development on prior year reserves in 2012 included $110.6 million related to our catastrophe reinsurance unit and $34.1 million related to our specialty reinsurance unit. Favorable development within the catastrophe unit is primarily due to reductions in estimated ultimate losses on the 2010 Chilean earthquake of $24.6 million, the 2008 hurricanes of $17.5 million, the June 2007 U.K. floods of $17.3 million, the 2005 hurricanes of $6.4 million, hurricane Irene of $4.6 million, the Tohoku earthquake of $3.9 million and a number of other catastrophes totaling $57.7 million, and partially offset by adverse development related to the 2010 and 2011 New Zealand earthquakes of $21.5 million primarily due to an increase in estimated ultimate losses. Favorable development within the specialty unit included $14.4 million associated with actuarial assumption changes, principally in our casualty and medical malpractice lines of business, and primarily as a result of revised initial expected claims ratios and claim development factors due to actual experience coming in better than expected and $19.7 million related to actual reported loss activity coming in better than expected.
Our Reinsurance segment prior year reserves experienced $136.9 million of net favorable development in 2011. The favorable development on prior year reserves in 2011 included $59.1 million related to our catastrophe reinsurance unit and $77.8 million related to our specialty reinsurance unit. The favorable development on prior year reserves in 2011 within the catastrophe reinsurance unit of $59.1 million was due to $27.0 million related to reductions in the estimated ultimate losses of smaller catastrophe events, $32.1 million arising from net reductions to the estimated ultimate losses of large catastrophe events, including $13.9 million, $10.0 million, $8.5 million and $4.7 million related to tropical cyclone Tasha, the 2005 hurricanes, the Chilean earthquake and the World Trade Center, respectively, and partially offset by $15.2 million of adverse development related to the 2010 New Zealand earthquake. The favorable development within the specialty reinsurance unit included $37.1 million due to reported losses developing more favorably than expected during 2011 on prior accident years events, $26.8 million associated with actuarial assumption changes, principally in our workers' compensation quota share and risk, property risk and energy risk lines of business, and primarily as a result of revised initial expected claims ratios and claim development factors due to actual experience coming in better than expected, and $13.9 million related to a decrease in case reserves and additional case reserves, which are established at the contract level for specific loss or large events.
Our underwriting expenses consist of acquisition expenses and operational expenses. Acquisition expenses consist of the costs to acquire premiums and are principally comprised of broker commissions and excise taxes. Acquisition expenses are driven by contract terms and are normally a set percentage of premiums and, accordingly, these costs will normally move in line with the fluctuation in gross premiums earned. Our acquisition expense ratio has remained relatively constant at 9.6%, 9.5% and 9.3% in 2012, 2011 and 2010, respectively.
Operating expenses consist primarily of salaries and other general and administrative expenses and have remained relatively constant at $132.9 million, $131.3 million and $130.0 million in 2012, 2011 and 2010, respectively. Our operating expense ratio may increase over time, as a result of factors including the absolute and comparative growth of our operating expenses, further refinements to internal expense allocations, market trends and market dynamics.
We have entered into joint ventures and specialized quota share cessions of our book of business. In accordance with the joint venture and quota share agreements, we are entitled to certain profit commissions and fee income. We record these profit commissions and fees as a reduction in acquisition and operating expenses and, accordingly, these fees have reduced our underwriting expense ratios. These fees totaled
$65.4 million, $58.3 million and $56.5 million in 2012, 2011 and 2010, respectively, and resulted in a corresponding decrease to the Reinsurance segment underwriting expense ratio of 6.9%, 6.7% and 6.7%, respectively. In addition, we are entitled to certain fee income and profit commissions from DaVinci. Because the results of DaVinci, and its parent DaVinciRe, are consolidated in our results of operations, these fees and profit commissions are eliminated in our consolidated financial statements and are principally reflected in redeemable noncontrolling interest – DaVinciRe. The net impact of all fees and profit commissions related to these joint ventures and specialized quota share cessions within our Reinsurance segment was $120.0 million, $64.6 million and $91.6 million in 2012, 2011 and 2010, respectively.
Catastrophe
Below is a summary of the underwriting results and ratios for our catastrophe unit: |
| | | | | | | | | | | | | |
| | | | | | | | |
| | Catastrophe unit overview | | | | | | |
| | Year ended December 31, | 2012 | | 2011 | | 2010 | |
| | (in thousands, except percentages) | | | | | | |
| | Property catastrophe gross premiums written | | | | | | |
| | Renaissance | $ | 733,963 |
| | $ | 742,236 |
| | $ | 630,080 |
| |
| | DaVinci | 448,244 |
| | 435,060 |
| | 364,153 |
| |
| | Total property catastrophe gross premiums written (1) | $ | 1,182,207 |
| | $ | 1,177,296 |
| | $ | 994,233 |
| |
| | Net premiums written | $ | 766,035 |
| | $ | 773,560 |
| | $ | 685,393 |
| |
| | Net premiums earned | $ | 781,738 |
| | $ | 737,545 |
| | $ | 721,419 |
| |
| | Net claims and claim expenses incurred | 165,209 |
| | 770,350 |
| | 153,290 |
| |
| | Acquisition expenses | 66,665 |
| | 62,882 |
| | 63,889 |
| |
| | Operational expenses | 103,811 |
| | 100,932 |
| | 104,535 |
| |
| | Underwriting income (loss) | $ | 446,053 |
| | $ | (196,619 | ) | | $ | 399,705 |
| |
| | | | | | | | |
| | Net claims and claim expenses incurred – current accident year | $ | 275,777 |
| | $ | 829,487 |
| | $ | 310,748 |
| |
| | Net claims and claim expenses incurred – prior accident years | (110,568 | ) | | (59,137 | ) | | (157,458 | ) | |
| | Net claims and claim expenses incurred – total | $ | 165,209 |
| | $ | 770,350 |
| | $ | 153,290 |
| |
| | | | | | | | |
| | Net claims and claim expense ratio – current accident year | 35.3 | % | | 112.5 | % | | 43.1 | % | |
| | Net claims and claim expense ratio – prior accident years | (14.2 | )% | | (8.1 | )% | | (21.9 | )% | |
| | Net claims and claim expense ratio – calendar year | 21.1 | % | | 104.4 | % | | 21.2 | % | |
| | Underwriting expense ratio | 21.8 | % | | 22.3 | % | | 23.4 | % | |
| | Combined ratio | 42.9 | % | | 126.7 | % | | 44.6 | % | |
| | | | | | | | |
| |
| (1) | Includes gross premiums written of $Nil assumed from the Other category for the year ended December 31, 2012 (2011 - $Nil, 2010 - $9.5 million). |
Catastrophe Reinsurance Gross Premiums Written – In 2012, our catastrophe reinsurance gross premiums written increased by $4.9 million, or 0.4%, to $1,182.2 million, compared to $1,177.3 million in 2011. Excluding the impact of $17.1 million and $159.8 million of net reinstatement premiums written in 2012 and 2011, our catastrophe unit gross premiums written increased $147.6 million, or 14.5%, in 2012, primarily due to improved market conditions on a risk-adjusted basis within our core lines of business during the key January and June 2012 renewals, and inclusive of $37.4 million and $37.7 million of gross premiums written on behalf of our recent fully-collateralized joint ventures, Upsilon Re and Tim Re III.
In 2011, our catastrophe reinsurance gross premiums written increased by $183.1 million, or 18.4%, to $1,177.3 million, compared to $994.2 million in 2010. The increase is due in part to reinstatement premiums written on 2011 Large Losses, and the improving market conditions in our core markets during the June and July 2011 renewals, partially offset by the then softer market conditions in our core markets during the January 2011 renewals. Excluding the impact of $159.8 million and $28.0 million of
reinstatement premiums written in 2011 and 2010, respectively, our catastrophe unit gross premiums written increased $51.3 million, or 5.3%, in 2011.
Our property catastrophe reinsurance gross premiums written continue to be characterized by a large percentage of U.S. and Caribbean premium, as we have found business derived from exposures in Europe or the rest of the world to be, in general, less attractive on a risk-adjusted basis during recent periods. A significant amount of our U.S. and Caribbean premium provides coverage against windstorms, mainly U.S. Atlantic hurricanes, as well as earthquakes and other natural and man-made catastrophes.
Catastrophe Reinsurance Underwriting Results – Our catastrophe unit generated underwriting income of $446.1 million in 2012, compared to incurring an underwriting loss of $196.6 million in 2011, an improvement of $642.7 million. The improvement in underwriting income was driven by an increase in net premiums earned of $44.2 million principally due to the increase in gross premiums written noted above and a $553.7 million decrease in current accident year claims and claim expenses as a result of the relatively low level of insured catastrophe losses during 2012 which included $191.2 million of net claims and claim expenses related to hurricane Isaac and storm Sandy, compared to 2011 which was negatively impacted by net claims and claim expenses related to the 2011 Large Losses of $792.7 million. In addition, favorable development on prior accident years claims and claim expenses within our catastrophe unit was $110.6 million in 2012, compared to $59.1 million in 2011, an increase of $51.4 million, as discussed below.
In 2012, our catastrophe unit generated a net claims and claim expense ratio of 21.1%, an underwriting expense ratio of 21.8% and a combined ratio of 42.9%, compared to 104.4%, 22.3% and 126.7%, respectively, in 2011. Current accident year net claims and claim expenses of $275.8 million includes $158.5 million related to storm Sandy, $35.0 million related to the tornado outbreaks across the Midwestern region of the U.S. during late February and early March (PCS 66 and 67, respectively), $32.7 million related to hurricane Isaac and $8.2 million related to the June 29, 2012 derecho (PCS 83) which impacted the Midwest to Mid-Atlantic coast of the U.S., with the remainder due primarily to a number of other relatively small events throughout the U.S. During 2012, hurricane Isaac and storm Sandy had a net negative impact of $146.9 million, or 23.3 percentage points, on our catastrophe unit's underwriting result and combined ratio, respectively, as detailed in the table below. Operating expenses of $103.8 million in 2012 remained relatively flat compared to $100.9 million in 2011.
See the financial data below for additional information detailing the net negative impact of hurricane Isaac and storm Sandy on our catastrophe unit in 2012. |
| | | | | | | | | | | | | |
| | | | | | | | |
| | Year ended December 31, 2012 | Hurricane Isaac | | Storm Sandy | | Total | |
| | (in thousands, except percentages) | | | | | | |
| | Net claims and claim expenses incurred | $ | (32,685 | ) | | $ | (158,477 | ) | | $ | (191,162 | ) | |
| | Reinstatement premiums earned | 8,844 |
| | 36,030 |
| | 44,874 |
| |
| | Ceded reinstatement premiums earned | — |
| | (385 | ) | | (385 | ) | |
| | Lost profit commissions | (2,016 | ) | | 1,771 |
| | (245 | ) | |
| | Net negative impact on catastrophe unit underwriting result | $ | (25,857 | ) | | $ | (121,061 | ) | | $ | (146,918 | ) | |
| | Percentage point impact on catastrophe unit combined ratio | 4.8 |
| | 21.0 |
| | 23.3 |
| |
| | | | | | | | |
In comparison, our catastrophe unit incurred an underwriting loss of $196.6 million in 2011, compared to underwriting income of $399.7 million in 2010, a decrease of $596.3 million. The decrease in underwriting income was primarily due to a $518.7 million increase in current accident year claims and claim expenses as a result of the 2011 Large Losses and a decrease of $98.3 million in favorable development on prior accident years claims and claim expenses, and partially offset by a $16.1 million increase in net premiums earned due to the reinstatement premiums written and earned, noted above.
In 2011, our catastrophe unit generated a net claims and claim expense ratio of 104.4%, an underwriting expense ratio of 22.3% and a combined ratio of 126.7%, compared to 21.2%, 23.4% and 44.6%, respectively, in 2010. The decrease in the underwriting expense ratio to 22.3% in 2011, from 23.4% in 2010, was driven in part by an increase in net premiums earned as a result of the reinstatement premiums
written and earned, which do not incur additional acquisition expenses, as well as a $3.6 million reduction in operating expenses. The increase in current accident year losses was primarily due to the 2011 Large Losses, which negatively impacted the catastrophe unit's underwriting results and combined ratio by $669.5 million and 104.8 percentage points, respectively, after considering the impact of net reinstatement premiums earned and lost profit commissions related to these events, as detailed in the table below. |
| | | | | | | | | | | | | | | | | | | | | | | | | | | | | | | | | |
| | | | | | | | | | | | | | | | | | |
| | | 2011 Large Losses | |
| | Year ended December 31, 2011 | 2011 New Zealand Earthquake | | Tohoku Earthquake | | Large U.S. Tornadoes | | Australian Floods | | Aggregate Contracts | | Hurricane Irene | | Thailand Floods | | Total | |
| | (in thousands, except percentages) | | | | | | | | | | | | | | | | |
| | Net claims and claim expenses incurred | $ | (261,070 | ) | | $ | (265,834 | ) | | $ | (131,965 | ) | | $ | (6,273 | ) | | $ | (33,080 | ) | | $ | (30,030 | ) | | $ | (64,437 | ) | | $ | (792,689 | ) | |
| | Assumed reinstatement premiums earned | 49,878 |
| | 60,603 |
| | 23,073 |
| | 1,694 |
| | 1,524 |
| | 5,874 |
| | 17,144 |
| | 159,790 |
| |
| | Ceded reinstatement premiums earned | (3,542 | ) | | (24,418 | ) | | — |
| | — |
| | — |
| | — |
| | — |
| | (27,960 | ) | |
| | Lost profit commissions | (7,522 | ) | | (331 | ) | | (151 | ) | | (348 | ) | | — |
| | — |
| | (245 | ) | | (8,597 | ) | |
| | Net negative impact on catastrophe unit underwriting result | $ | (222,256 | ) | | $ | (229,980 | ) | | $ | (109,043 | ) | | $ | (4,927 | ) | | $ | (31,556 | ) | | $ | (24,156 | ) | | $ | (47,538 | ) | | $ | (669,456 | ) | |
| | Percentage point impact on catastrophe unit combined ratio | 30.4 |
| | 31.5 |
| | 14.4 |
| | 0.6 |
| | 4.3 |
| | 3.1 |
| | 6.0 |
| | 104.8 |
| |
| | | | | | | | | | | | | | | | | | |
During 2012, we experienced $110.6 million of favorable development on prior year reserves, compared to $59.1 million of favorable development on prior years reserves in 2011. The favorable development on prior year reserves in 2012 was primarily due to reductions in estimated ultimate losses on the 2010 Chilean earthquake of $24.6 million, the 2008 hurricanes of $17.5 million, the June 2007 U.K. floods of $17.3 million, the 2005 hurricanes of $6.4 million, hurricane Irene of $4.6 million, the Tohoku earthquake of $3.9 million and a number of other catastrophes totaling $57.7 million, and partially offset by adverse development related to the 2010 and 2011 New Zealand earthquakes of $21.5 million primarily due to increase in estimated ultimate losses.
During 2011, we experienced $59.1 million of favorable development on prior year reserves, compared to $157.5 million of favorable development on prior years reserves in 2010. The favorable development on prior year reserves in 2011 within the catastrophe reinsurance unit of $59.1 million was due to $27.0 million related to reductions in the estimated ultimate losses of smaller catastrophe events, $32.1 million arising from net reductions to the estimated ultimate losses of large catastrophe events, including $13.9 million, $10.0 million, $8.5 million and $4.7 million related to tropical cyclone Tasha, the 2005 hurricanes, the Chilean earthquake and the World Trade Center, respectively, and partially offset by $15.2 million of adverse development related to the 2010 New Zealand earthquake.
See “Item 7. Summary of Critical Accounting Estimates, Claims and Claim Expense Reserves” for additional discussion of our reserving techniques and prior year development of net claims and claim expenses.
Specialty
Below is a summary of the underwriting results and ratios for our specialty reinsurance unit: |
| | | | | | | | | | | | | |
| | | | | | | | |
| | Specialty unit overview | | | | | | |
| | Year ended December 31, | 2012 | | 2011 | | 2010 | |
| | (in thousands, except percentages) | | | | | | |
| | Specialty gross premiums written | | | | | | |
| | Renaissance | $ | 207,387 |
| | $ | 144,192 |
| | $ | 126,848 |
| |
| | DaVinci | 2,500 |
| | 1,699 |
| | 2,538 |
| |
| | Total specialty gross premiums written | $ | 209,887 |
| | $ | 145,891 |
| | $ | 129,386 |
| |
| | Net premiums written | $ | 201,552 |
| | $ | 139,939 |
| | $ | 124,326 |
| |
| | Net premiums earned | $ | 164,685 |
| | $ | 135,543 |
| | $ | 117,371 |
| |
| | Net claims and claim expenses incurred | 76,813 |
| | 13,354 |
| | (39,486 | ) | |
| | Acquisition expenses | 23,826 |
| | 20,096 |
| | 14,065 |
| |
| | Operational expenses | 29,124 |
| | 30,319 |
| | 25,455 |
| |
| | Underwriting income | $ | 34,922 |
| | $ | 71,774 |
| | $ | 117,337 |
| |
| | | | | | | | |
| | Net claims and claim expenses incurred – current accident year | $ | 110,959 |
| | $ | 91,115 |
| | $ | 89,075 |
| |
| | Net claims and claim expenses incurred – prior accident years | (34,146 | ) | | (77,761 | ) | | (128,561 | ) | |
| | Net claims and claim expenses incurred – total | $ | 76,813 |
| | $ | 13,354 |
| | $ | (39,486 | ) | |
| | | | | | | | |
| | Net claims and claim expense ratio – current accident year | 67.4 | % | | 67.2 | % | | 75.9 | % | |
| | Net claims and claim expense ratio – prior accident years | (20.8 | )% | | (57.3 | )% | | (109.5 | )% | |
| | Net claims and claim expense ratio – calendar year | 46.6 | % | | 9.9 | % | | (33.6 | )% | |
| | Underwriting expense ratio | 32.2 | % | | 37.1 | % | | 33.6 | % | |
| | Combined ratio | 78.8 | % | | 47.0 | % | | — | % | |
| | | | | | | | |
Specialty Reinsurance Gross Premiums Written – In 2012, our specialty reinsurance gross premiums written increased $64.0 million, or 43.9%, to $209.9 million, compared to $145.9 million in 2011, primarily due to the inception of a number of new contracts during 2012 which met our risk-adjusted return thresholds. During 2012, we experienced growth in a number of our specialty lines of business within Glencoe and will continue to seek to expand our specialty reinsurance operations through this platform, although we cannot assure you that we will do so. Our specialty reinsurance premiums are prone to significant volatility as this business is characterized by a relatively small number of comparably large transactions.
In 2011, our specialty reinsurance gross premiums written increased $16.5 million, or 12.8%, to $145.9 million, compared to $129.4 million in 2010, primarily due to the inception of new contracts during 2011 which met our risk-adjusted return thresholds.
Specialty Reinsurance Underwriting Results – Our specialty unit generated $34.9 million of underwriting income in 2012, compared to $71.8 million in 2011, a decrease of $36.9 million, principally due to a $63.5 million increase in net claims and claim expenses, partially offset by a $29.1 million increase in net premiums earned due to the increase in gross premiums written noted above. The $63.5 million increase in net claims and claim expenses is driven by a $43.6 million decrease in favorable development on prior accident year net claims and claim expenses and a $19.8 million increase in current accident year net claims and claim expenses, both as discussed below.
In 2012, our specialty unit generated a net claims and claim expense ratio of 46.6%, an underwriting expense ratio of 32.2% and a combined ratio of 78.8%, compared to 9.9%, 37.1% and 47.0%, respectively, in 2011. The 4.9 percentage point decrease in the underwriting expense ratio was principally driven by a $29.1 million increase in net premiums earned and partially offset by a $3.7 million increase in acquisition expenses, both as a result of the increase in gross premiums written noted above. Operating expenses of $29.1 million in 2012 remained relatively flat compared to $30.3 million in 2011.
Current accident year net claims and claim expenses of $111.0 million in 2012 includes $16.0 million related to estimated ultimate losses related to potential exposure to LIBOR related claims attributable to the current accident year, $11.0 million related to storm Sandy and $5.0 million related to the grounding of the Costa Concordia cruise ship, with the remainder principally due to reported attritional losses and the application of our formulaic reserving methodologies for establishing incurred but not reported reserves for net claims and claim expenses. In comparison, 2011 experienced $91.1 million of current accident year net claims and claim expenses including estimated losses associated with the Tohoku earthquake, 2011 New Zealand earthquake, the Australian flooding and the Thailand flooding of $7.5 million, $6.5 million, $6.0 million and $6.0 million, respectively.
Our specialty unit generated $71.8 million of underwriting income in 2011, compared to $117.3 million in 2010, a decrease of $45.6 million, principally due to a $52.8 million increase in net claims and claim expenses. The $52.8 million increase in net claims and claim expenses is primarily driven by a $50.8 million decrease in favorable development on prior accident year net claims and claim expenses, as discussed below. Included in current accident year net claims and claim expenses of $91.1 million are estimated losses associated with several large events including the Tohoku earthquake of $7.5 million, the 2011 New Zealand earthquake of $6.5 million, the Australian floods of $6.0 million and the Thailand floods of $6.0 million. In 2011, our specialty unit generated a net claims and claim expense ratio of 9.9%, an underwriting expense ratio of 37.1% and a combined ratio of 47.0%, compared to negative 33.6%, 33.6% and 0.0%, respectively, in 2010. The 3.5 percentage point increase in the underwriting expense ratio was principally driven by an increase in operational expenses due to higher allocated operating expenses and a relative increase in contracts with higher acquisition expense ratios during 2011.
The favorable development of $34.1 million within our specialty reinsurance unit in 2012 included $14.4 million associated with actuarial assumption changes, principally in our casualty and medical malpractice lines of business, and primarily as a result of revised initial expected claims ratios and claim development factors due to actual experience coming in better than expected, $3.0 million of favorable development on the 2005 hurricanes and $16.7 million of reported losses developing more favorably than expected during 2012 on prior accident years events.
The favorable development of $77.8 million within our specialty reinsurance unit in 2011 included $37.1 million due to reported losses developing more favorably than expected during 2011 on prior accident years events, $26.8 million associated with actuarial assumption changes, principally in our workers' compensation quota share and risk, property risk and energy risk lines of business, and primarily as a result of revised initial expected claims ratios and claim development factors due to actual experience coming in better than expected, and $13.9 million related to a decrease in case reserves and additional case reserves, which are established at the contract level for specific loss or large events.
See “Item 7. Summary of Critical Accounting Estimates, Claims and Claim Expense Reserves” for additional discussion of our reserving techniques and prior year development of net claims and claim expenses.
Lloyd's Segment
Below is a summary of the underwriting results and ratios for our Lloyd's segment: |
| | | | | | | | | | | | | |
| | | | | | | | |
| | Lloyd's segment overview | | | | | | |
| | Year ended December 31, | 2012 | | 2011 | | 2010 | |
| | (in thousands, except percentages) | | | | | | |
| | Lloyd's gross premiums written | | | | | | |
| | Specialty | $ | 123,099 |
| | $ | 83,641 |
| | $ | 34,065 |
| |
| | Catastrophe | 36,888 |
| | 27,943 |
| | 14,724 |
| |
| | Insurance | — |
| | — |
| | 17,420 |
| |
| | Total Lloyd's gross premiums written (1) | $ | 159,987 |
| | $ | 111,584 |
| | $ | 66,209 |
| |
| | Net premiums written | $ | 135,131 |
| | $ | 98,617 |
| | $ | 61,189 |
| |
| | Net premiums earned | $ | 122,968 |
| | $ | 76,386 |
| | $ | 50,204 |
| |
| | Net claims and claim expenses incurred | 80,242 |
| | 73,259 |
| | 25,676 |
| |
| | Acquisition expenses | 22,864 |
| | 14,031 |
| | 10,784 |
| |
| | Operational expenses | 45,680 |
| | 36,732 |
| | 24,837 |
| |
| | Underwriting loss | $ | (25,818 | ) | | $ | (47,636 | ) | | $ | (11,093 | ) | |
| | | | | | | | |
| | Net claims and claim expenses incurred – current accident year | $ | 96,444 |
| | $ | 72,781 |
| | $ | 25,873 |
| |
| | Net claims and claim expenses incurred – prior accident years | (16,202 | ) | | 478 |
| | (197 | ) | |
| | Net claims and claim expenses incurred – total | $ | 80,242 |
| | $ | 73,259 |
| | $ | 25,676 |
| |
| | | | | | | | |
| | Net claims and claim expense ratio – current accident year | 78.4 | % | | 95.3 | % | | 51.5 | % | |
| | Net claims and claim expense ratio – prior accident years | (13.1 | )% | | 0.6 | % | | (0.4 | )% | |
| | Net claims and claim expense ratio – calendar year | 65.3 | % | | 95.9 | % | | 51.1 | % | |
| | Underwriting expense ratio | 55.7 | % | | 66.5 | % | | 71.0 | % | |
| | Combined ratio | 121.0 | % | | 162.4 | % | | 122.1 | % | |
| | | | | | | | |
| |
| (1) | Includes gross premiums written of $Nil and $0.5 million assumed from the Other category and Reinsurance segment, respectively, for the year ended December 31, 2012 (2011 - $Nil and $0.1 million, 2010 - $17.4 million and $0.2 million, respectively). |
Lloyd's Gross Premiums Written – Gross premiums written in our Lloyd's segment increased by $48.4 million, or 43.4% to $160.0 million in 2012, compared to $111.6 million in 2011, primarily due to Syndicate 1458 growing its book of business across the majority of its lines of business and the impact of rate increases, most notably in its casualty lines of business.
Gross premiums written in our Lloyd's segment increased by $45.4 million, or 68.5% to $111.6 million in 2011, compared to $66.2 million in 2010. Excluding the impact of an intercompany quota share agreement in the second quarter of 2010, gross premiums written in the Lloyd's segment increased $63.0 million, or 129.7%, primarily due to Syndicate 1458 growing its book of business across the majority of its lines of business, most notably its casualty lines of business.
Lloyd's Underwriting Results – Our Lloyd's segment incurred an underwriting loss of $25.8 million and a combined ratio of 121.0% in 2012, compared to $47.6 million and a combined ratio of 162.4% in 2011. Current accident year net claims and claim expenses increased $23.7 million, while favorable development of prior accident years net claims and claim expenses increased $16.7 million, during 2012, compared to 2011, resulting in net claims and claims expenses increasing to $80.2 million in 2012, compared to $73.3 million in 2011. Included in current accident year net claims and claim expenses during 2012 is $18.5 million related to storm Sandy, $4.5 million due to the U.S. drought impacting the 2012 crop season and
estimated ultimate losses of $2.5 million associated with potential exposure to LIBOR related claims attributable to the current accident year, with the remainder due to reported attritional losses and the application of our formulaic reserving methodologies for establishing incurred but not reported reserves for net claims and claim expenses. Operational expenses increased $8.9 million, to $45.7 million in 2012, compared to 2011, principally driven by an increase in compensation and related operating expenses as a result of growth in headcount as Syndicate 1458 continues to expand its operations. The decrease in the underwriting expense ratio to 55.7% in 2012, from 66.5% in 2011, was primarily driven by the increase in net premiums earned.
Our Lloyd's segment incurred an underwriting loss of $47.6 million and a combined ratio of 162.4% in 2011, compared to an underwriting loss of $11.1 million and a combined ratio of 122.1% in 2010. Our Lloyd's segment was negatively impacted by the 2011 Large Losses which resulted in $29.7 million of underwriting losses and increased the combined ratio by 39.3 percentage points, as detailed in the table below. Operational expenses increased $11.9 million, to $36.7 million in 2011, compared to 2010, and principally include compensation and related operating expenses. The decrease in the underwriting expense ratio to 66.5% in 2011, from 71.0% in 2010, was primarily driven by the increase in net premiums earned. |
| | | | | | | | | | | | | | | | | | | | | | | | | |
| | | | | | | | | | | | | | |
| | | 2011 Large Losses | |
| | Year ended December 31, 2011 | 2011 New Zealand Earthquake | | Tohoku Earthquake | | Large U.S. Tornadoes | | Hurricane Irene | | Thailand Floods | | Total | |
| | (in thousands, except percentages) | | | | | | | | | | | | |
| | Net claims and claim expenses incurred | $ | (6,026 | ) | | $ | (11,014 | ) | | $ | (3,125 | ) | | $ | (2,500 | ) | | $ | (6,000 | ) | | $ | (28,665 | ) | |
| | Assumed reinstatement premiums earned | — |
| | 311 |
| | 200 |
| | — |
| | — |
| | 511 |
| |
| | Ceded reinstatement premiums earned | — |
| | (1,586 | ) | | — |
| | — |
| | — |
| | (1,586 | ) | |
| | Net negative impact on Lloyd's segment underwriting result | $ | (6,026 | ) | | $ | (12,289 | ) | | $ | (2,925 | ) | | $ | (2,500 | ) | | $ | (6,000 | ) | | $ | (29,740 | ) | |
| | Percentage point impact on Lloyd's segment combined ratio | 7.9 |
| | 16.9 |
| | 3.7 |
| | 3.3 |
| | 7.9 |
| | 39.3 |
| |
| | | | | | | | | | | | | | |
The favorable development of $16.2 million within our Lloyd's segment in 2012 included $5.5 million related to the 2011 Thailand floods, $2.5 million related to hurricane Irene and $1.3 million related to actuarial assumption changes, with the remainder primarily due to reported claims coming in lower than expected on a number of prior accident years events, as a result of the application of our formulaic actuarial reserving methodology.
See “Item 7. Summary of Critical Accounting Estimates, Claims and Claim Expense Reserves” for additional discussion of our reserving techniques and prior year development of net claims and claim expenses.
Other Underwriting Loss |
| | | | | | | | | | | | | |
| | | | | | | | |
| | Year ended December 31, | 2012 | | 2011 | | 2010 | |
| | (in thousands) | | | | | | |
| | Underwriting loss | $ | (3,856 | ) | | $ | (4,691 | ) | | $ | (31,376 | ) | |
| | | | | | | | |
Included in our Other category are the underwriting results related to the remnants of our Bermuda-based insurance operations not sold pursuant to the Stock Purchase Agreement with QBE. Included in our Other category was an underwriting loss of $3.9 million in 2012, primarily due to us entering into a loss portfolio transfer in respect of our contractor's liability book of business within Glencoe, whereby we transfered net liabilities of $29.1 million, resulting in a loss of $7.4 million which was recorded as prior accident years net claims and claims expenses, partially offset by favorable development related to the application of our formulaic actuarial reserving methodology with the reductions being due to actual paid and reported claim activity being more favorable to date than what was originally anticipated when setting the initial reserves.
In 2011 our Other category experienced an underwriting loss of $4.7 million in 2011, compared to $31.4 million in 2010, due primarily to adverse development on prior accident years of $4.4 million. The adverse development in 2011 was principally due to the contractor's liability book of business, which experienced higher than expected reported losses of $11.5 million, and was subsequently subject to a comprehensive
actuarial review during the fourth quarter of 2011, which review resulted in an increase of $10.1 million to the estimated ultimate claims and claim expenses related to this book of business due to changes in the actuarial assumptions. The total gross reserve for claims and claim expenses for the construction defect book of business at December 31, 2011 was $58.8 million and $40.8 million of net claims and claim expenses after reinsurance recoverables. Partially offsetting the adverse development on prior accident years within the construction defect book of business, noted above, was favorable development of $4.2 million related to large catastrophe events primarily related to the 2005 hurricanes, and $12.9 million related to the application of our formulaic actuarial reserving methodology with the reductions being due to actual paid and reported claim activity being more favorable to date than what was originally anticipated when setting the initial reserves.
Net Investment Income |
| | | | | | | | | | | | | |
| | | | | | | | |
| | Year ended December 31, | 2012 | | 2011 | | 2010 | |
| | (in thousands) | | | | | | |
| | Fixed maturity investments | $ | 102,476 |
| | $ | 89,858 |
| | $ | 108,195 |
| |
| | Short term investments | 1,007 |
| | 1,666 |
| | 2,318 |
| |
| | Equity investments trading | 1,086 |
| | 471 |
| | — |
| |
| | Other investments | | | | | | |
| | Hedge funds and private equity investments | 36,635 |
| | 27,541 |
| | 64,419 |
| |
| | Other | 37,784 |
| | 8,458 |
| | 39,305 |
| |
| | Cash and cash equivalents | 194 |
| | 163 |
| | 277 |
| |
| | | 179,182 |
| | 128,157 |
| | 214,514 |
| |
| | Investment expenses | (11,807 | ) | | (10,157 | ) | | (10,559 | ) | |
| | Net investment income | $ | 167,375 |
| | $ | 118,000 |
| | $ | 203,955 |
| |
| | | | | | | | |
Net investment income was $167.4 million in 2012, compared to $118.0 million in 2011. The $49.4 million increase in net investment income in 2012 was driven by a $29.3 million increase in the returns from our allocation to senior secured bank loan funds and insurance-linked securities included in other in the table above, a $12.6 million increase from our fixed maturity investments portfolio where higher average invested assets benefited from the tightening credit spreads during 2012 and a $9.1 million increase in the returns from our portfolio of hedge funds and private equity investments, with the increase primarily from our private equity investments due to higher fund valuations. Historically low interest rates as compared to recent years have lowered the yields at which we invest our assets relative to historical levels. We expect these developments, combined with the current composition of our investment portfolio and other factors, to continue to put downward pressure on our net investment income for the near term. The hedge fund, private equity and other investment portfolios are accounted for at fair value with the change in fair value recorded in net investment income which included net unrealized gains of $38.2 million in 2012, compared to $12.7 million of net unrealized gains in 2011.
Net investment income was $118.0 million in 2011, compared to $204.0 million in 2010. The $86.0 million decrease in net investment income was principally driven by a $36.9 million decrease in the returns from our hedge fund and private equity investments due to lower returns in 2011, a $30.8 million decrease in the returns on certain non-investment grade investments included in other investments, and an $18.3 million decrease in net investment income related to fixed maturity investments, which was driven by a widening in credit spreads during 2011, and included $26.7 million of losses on derivatives and futures used to hedge the interest rate exposure of credit sensitive fixed maturity investments. The hedge fund, private equity and other investment portfolios are accounted for at fair value with the change in fair value recorded in net investment income which included net unrealized gains of $12.7 million in 2011, compared to $57.5 million in 2010.
Commencing in the first quarter of 2011, we established a portfolio of certain publicly traded equities which are reflected in our consolidated balance sheet as equity investments trading. This portfolio of equity investments is carried at fair value with dividend income included in net investment income, and realized and unrealized gains included in net realized and unrealized gains on investments, in our consolidated statements of operations and generated $1.1 million of net investment income in 2012, compared to $0.5
million in 2011. We do not expect it to represent a material portion of our invested assets or our financial results for the reasonably foreseeable period.
Net Realized and Unrealized Gains on Investments and Net Other-Than-Temporary Impairments |
| | | | | | | | | | | | | |
| | | | | | | | |
| | Year ended December 31, | 2012 | | 2011 | | 2010 | |
| | (in thousands) | | | | | | |
| | Gross realized gains | $ | 97,787 |
| | $ | 79,358 |
| | $ | 138,814 |
| |
| | Gross realized losses | (16,705 | ) | | (30,659 | ) | | (19,147 | ) | |
| | Net realized gains on fixed maturity investments | 81,082 |
| | 48,699 |
| | 119,667 |
| |
| | Net unrealized gains on fixed maturity investments trading | 75,283 |
| | 19,404 |
| | 24,777 |
| |
| | Net unrealized gains on equity investments trading | 7,626 |
| | 2,565 |
| | — |
| |
| | Net realized and unrealized gains on investments | $ | 163,991 |
| | $ | 70,668 |
| | $ | 144,444 |
| |
| | Total other-than-temporary impairments | (395 | ) | | (630 | ) | | (831 | ) | |
| | Portion recognized in other comprehensive income, before taxes | 52 |
| | 78 |
| | 2 |
| |
| | Net other-than-temporary impairments | $ | (343 | ) | | $ | (552 | ) | | $ | (829 | ) | |
| | | | | | | | |
Our investment portfolio is structured to preserve capital and provide us with a high level of liquidity. A large majority of our investments are invested in the fixed income markets and, therefore, our realized and unrealized holding gains and losses on investments are highly correlated to fluctuations in interest rates. Therefore, as interest rates decline, we will tend to have realized and unrealized gains from our investment portfolio, and as interest rates rise, we will tend to have realized and unrealized losses from our investment portfolio. We experienced net realized and unrealized gains on investments of $164.0 million during 2012, the majority of which were derived from our portfolio of fixed maturity investments. However, the trend towards historically low interest rates (as compared to recent years) may reverse, resulting in a rising interest rate environment which would tend to diminish our ability to generate net realized gains on our portfolio of fixed maturity investments, and may result in significant realized and unrealized losses on our investments in the future.
Net realized and unrealized gains on investments were $164.0 million in 2012, compared to $70.7 million in 2011, an improvement of $93.3 million. In addition to increased turnover in our fixed maturity investments portfolio generating $81.1 million of net realized gains in 2012, unrealized gains on our fixed maturity investments trading of $75.3 million during 2012 increased $55.9 million, compared to $19.4 million of unrealized gains in 2011, primarily due to the net appreciation of our fixed maturity investment portfolio as a result of tightening credit spreads during 2012. Included in net realized and unrealized gains on investments in 2012 is $7.6 million of net unrealized gains on equity investments trading due to increases in the share prices of our equity positions.
Net realized and unrealized gains on investments were $70.7 million in 2011, compared to $144.4 million in 2010, a decrease of $73.8 million. The unrealized gains on our fixed maturity investments trading of $19.4 million during 2011 decreased $5.4 million, compared to $24.8 million in 2010, primarily as a result of an increase in credit spreads during 2011.
Equity in Earnings (Losses) of Other Ventures |
| | | | | | | | | | | | | |
| | | | | | | | |
| | Year ended December 31, | 2012 | | 2011 | | 2010 | |
| | (in thousands) | | | | | | |
| | Top Layer Re | $ | 20,792 |
| | $ | (37,471 | ) | | $ | (12,103 | ) | |
| | Tower Hill Companies | 4,965 |
| | 2,923 |
| | 1,151 |
| |
| | Other | (2,519 | ) | | (1,985 | ) | | (862 | ) | |
| | Total equity in earnings (losses) of other ventures | $ | 23,238 |
| | $ | (36,533 | ) | | $ | (11,814 | ) | |
| | | | | | | | |
Equity in earnings (losses) of other ventures primarily represents our pro-rata share of the net income (loss) from our investments in Top Layer Re and the Tower Hill Companies with the equity in earnings from the Tower Hill Companies recorded one quarter in arrears.
Equity in earnings of other ventures was $23.2 million in 2012, compared to losses of $36.5 million in 2011. The $59.8 million improvement in equity in earnings of other ventures was primarily due to our equity in earnings of Top Layer Re of $20.8 million during 2012, as a result of the absence of net claims and claim expenses in Top Layer Re 2012, compared to 2011, which was negatively impacted by net claims and claim expenses related to the 2011 New Zealand and Tohoku earthquakes.
Equity in losses of other ventures was $36.5 million in 2011, compared to $11.8 million in 2010. The $24.7 million deterioration in equity in losses of other ventures was primarily due to our equity in losses of Top Layer Re of $37.5 million during 2011, primarily as a result of Top Layer Re experiencing net claims and claim expenses related to the 2011 New Zealand and Tohoku earthquakes. During 2011, we sold our entire ownership interest in NBIC Holdings, Inc. ("NBIC"), a holding company for a specialty underwriter of homeowners' insurance products and services, for $12.0 million. Included in Other in the table above, is equity in losses of NBIC of $2.8 million in 2011.
Other (Loss) Income |
| | | | | | | | | | | | | |
| | | | | | | | |
| | Year ended December 31, | 2012 | | 2011 | | 2010 | |
| | (in thousands) | | | | | | |
| | Gain on NBIC | $ | — |
| | $ | 4,836 |
| | $ | — |
| |
| | Mark-to-market on Platinum warrant | — |
| | 2,975 |
| | 10,054 |
| |
| | Gain on sale of ChannelRe | — |
| | — |
| | 15,835 |
| |
| | Assumed and ceded reinsurance contracts accounted for as derivatives and deposits | (4,648 | ) | | 37,414 |
| | 5,214 |
| |
| | Weather and energy risk management operations | (20,785 | ) | | (45,030 | ) | | 8,149 |
| |
| | Other | 2,528 |
| | (880 | ) | | 1,868 |
| |
| | Total other (loss) income | $ | (22,905 | ) | | $ | (685 | ) | | $ | 41,120 |
| |
| | | | | | | | |
In 2012 we incurred an other loss of $22.9 million, compared to an other loss of $0.7 million in 2011. The $22.2 million deterioration in other income is primarily due to:
| |
| • | a $42.1 million decrease in other income generated by our assumed and ceded reinsurance contracts accounted for at fair value, principally as a result of $45.0 million of net recoverables from the Tohoku earthquake during 2011 not reoccurring in 2012; |
| |
| • | the absence in 2012 of a mark-to-market adjustment on the Platinum warrant due to its sale during the first quarter of 2011 and the sale of NBIC in the third quarter of 2011; and partially offset by |
| |
| • | a relatively lower level of losses from our weather and energy risk management operations of $20.8 million due to the unusually warm weather experienced in parts of the United Kingdom and parts of the United States during the first quarter of 2012, compared to losses from these operations of $45.0 million in 2011. |
In 2011, we incurred an other loss of $0.7 million, compared to generating $41.1 million of other income in 2010. The $41.8 million decrease is primarily due to losses from our weather and energy risk management operations of $45.0 million due to the unusually warm weather experienced in the United Kingdom and certain parts of the United States during the fourth quarter of 2011, compared to income of $8.1 million in 2010, combined with two nonrecurring items: a decrease in the mark-to-market adjustment on the Platinum warrant due to its sale during the first quarter of 2011, and the absence of a gain of $15.8 million which occurred in the third quarter of 2010 on the sale of our entire ownership in ChannelRe Holdings Ltd. ("ChannelRe"), as noted below. Offsetting the items noted above, was other income of $37.4 million generated by our assumed and ceded reinsurance contracts accounted for at fair value, compared to $5.2 million in 2010, principally as a result of net recoverables from the Tohoku earthquake and a gain on sale of NBIC of $4.8 million, as noted above.
In 2010, we sold our entire ownership interest in ChannelRe, a financial guaranty reinsurance company, for $15.8 million and recorded other income of $15.8 million as a result of the sale. We no longer have an ownership interest in ChannelRe and have no contractual obligations to provide capital or other financial support to ChannelRe.
Certain contracts we enter into in our weather and energy risk operations are informed in part on proprietary weather forecasts provided by our Weather Predict subsidiary. The weather and energy risk operations in which we engage are both seasonal and volatile, and there is no assurance that our performance to date will be indicative of future periods. We continue to allocate capital to our weather and energy risk management operations. This operation continually seeks new markets and relationships for its weather and energy risk products, including leveraging strategic affiliations and ceding risk where appropriate. Given current market opportunities, we have ceded a substantial portion of this operation's risk portfolio under a master swap agreement with a highly rated counterparty. Our results from these activities will therefore fluctuate on an absolute or relative basis over time. We have expanded our weather and energy risk management operations in the last several years to include weather contingent energy products and by increasing the size and volume of transactions with respect to our previously existing weather and energy risk management operations. The weather and energy risk management operations results include net realized and unrealized gains and losses on agreements with end users and net realized and unrealized gains and losses on hedging and trading activities. These activities present certain operational as well as financial risks, which we seek to mitigate, although there can be no assurance that we will be able to successfully mitigate such risks.
Corporate Expenses |
| | | | | | | | | | | | | |
| | | | | | | | |
| | Year ended December 31, | 2012 | | 2011 | | 2010 | |
| | (in thousands) | | | | | | |
| | Total corporate expenses | $ | 16,692 |
| | $ | 18,264 |
| | $ | 20,136 |
| |
| | | | | | | | |
Corporate expenses include certain executive, director, legal and consulting expenses, costs for research and development, impairment charges related to goodwill and other intangible assets, and other miscellaneous costs, including those associated with operating as a publicly traded company. Corporate expenses were $16.7 million in 2012, compared to $18.3 million in 2011, with the decrease driven by the absence of certain goodwill and intangible asset impairments of $5.2 million which were incurred in 2011, and partially offset by a corporate insurance recovery of $1.7 million, recorded in 2011, which did not reoccur in 2012. Corporate expenses were $18.3 million in 2011, compared to $20.1 million in 2010, with the decrease primarily due to a decrease in legal and consulting expenses. Included in corporate expenses during 2011, was $5.2 million of impairment charges related to goodwill and intangible assets and a corporate insurance recovery of $1.7 million which reduced our corporate expenses by a like amount.
Interest Expense and Preferred Share Dividends |
| | | | | | | | | | | | | |
| | | | | | | | |
| | Year ended December 31, | 2012 | | 2011 | | 2010 | |
| | (in thousands) | | | | | | |
| | Interest expense | | | | | | |
| | DaVinciRe revolving credit facility | $ | — |
| | $ | 474 |
| | $ | 2,029 |
| |
| | $100 million 5.875% Senior Notes | 5,875 |
| | 5,875 |
| | 5,875 |
| |
| | $250 million 5.75% Senior Notes | 14,375 |
| | 14,375 |
| | 11,373 |
| |
| | Other | 2,847 |
| | 2,644 |
| | 2,552 |
| |
| | Total interest expense | 23,097 |
| | 23,368 |
| | 21,829 |
| |
| | Preferred share dividends | | | | | | |
| | $100 million 7.30% Series B Preference Shares | — |
| | — |
| | 7,118 |
| |
| | $250 million 6.08% Series C Preference Shares | 15,200 |
| | 15,200 |
| | 15,200 |
| |
| | $150 million 6.60% Series D Preference Shares (1) | 19,695 |
| | 19,800 |
| | 19,800 |
| |
| | Total preferred share dividends | 34,895 |
| | 35,000 |
| | 42,118 |
| |
| | Total interest expense and preferred share dividends | $ | 57,992 |
| | $ | 58,368 |
| | $ | 63,947 |
| |
| | | | | | | | |
| |
| (1) | On November 27, 2012, we announced mandatory partial redemption of 6.0 million of our outstanding Series D Preference Shares at a redemption price of $25.00 per Series D Preference Share. The partial redemption was allocated by random lottery in accordance with the Depository Trust Company's rules and procedures and on December 27, 2012 we redeemed the 6.0 million Series D Preference Shares called for redemption for $150.0 million plus accrued and unpaid dividends thereon. Following this transaction, 6.0 million Series D Preference Shares remain outstanding. |
Interest expense was relatively flat at $23.1 million in 2012, compared to $23.4 million in 2011. In addition, our preferred share dividends were also relatively flat at $34.9 million in 2012, compared to $35.0 million in 2011; however with the redemption of 6.0 million of our outstanding Series D Preference Shares as noted in the table above, and in the absence of issuing new preference shares, we expect our future preference share dividends to decrease in 2013.
Interest expense increased $1.5 million to $23.4 million in 2011, compared to $21.8 million in 2010, primarily due to a full year of interest expense on the $250.0 million of 5.75% Senior Notes which were issued by RRNAH on March 17, 2010. During 2011, our preferred share dividends decreased $7.1 million to $35.0 million, compared to $42.1 million in 2010, principally due to the redemption of our 7.30% Series B Preference Shares on December 20, 2010, as noted below.
Income Tax Benefit (Expense) |
| | | | | | | | | | | | | |
| | | | | | | | |
| | Year ended December 31, | 2012 | | 2011 | | 2010 | |
| | (in thousands) | | | | | | |
| | Income tax (expense) benefit | $ | (1,429 | ) | | $ | 315 |
| | $ | 6,124 |
| |
| | | | | | | | |
We are subject to income taxes in certain jurisdictions in which we operate; however, since the majority of our income is currently earned in Bermuda, a non-taxable jurisdiction, the tax impact to our operations has historically been minimal. During 2012, we incurred an income tax expense of $1.4 million, and in 2011 and 2010 we generated an income tax benefit of $0.3 million and $6.1 million, respectively, which was principally the result of our U.S. operations incurring pretax losses.
Losses incurred within our U.S. tax-paying subsidiaries in the fourth quarter of 2011 were significant enough to result in a cumulative GAAP taxable loss for the three year period ended December 31, 2011. We reassess our valuation allowance on a quarterly basis and commencing with our reassessment effective December 31, 2011, we determined that it was more likely than not that we would not be able to recover our U.S. net deferred tax asset and increased our valuation allowance in the fourth quarter of 2011 to reduce our net deferred tax asset to $Nil. At December 31, 2012, our U.S. tax-paying subsidiaries had a net deferred tax asset of $37.7 million, for which a full valuation allowance has been provided. The remaining valuation allowance as of December 31, 2012 relates exclusively to our operations in Ireland and the U.K. Our Ireland and U.K. operations have produced GAAP taxable losses and we currently do not believe it is
more likely than not that we will be able to recover our net deferred tax assets from these jurisdictions. Our valuation allowance totaled $48.2 million and $35.0 million at December 31, 2012 and 2011, respectively.
Our effective income tax rate, which we calculate as income tax expense divided by net income before taxes, may fluctuate significantly from period to period depending on the geographic distribution of pre-tax net income in any given period between different jurisdictions with comparatively higher tax rates and those with comparatively lower tax rates. The geographic distribution of pre-tax net income can vary significantly between periods due to, but not limited to, the following factors: the business mix of net premiums written and earned; the size and nature of net claims and claim expenses incurred; the amount and geographic location of operating expenses, net investment income, net realized and unrealized gains (losses) on investments; outstanding debt and related interest expense; and the amount of specific adjustments to determine the income tax basis in each of our operating jurisdictions. In addition, a significant portion of our gross and net premiums are currently written and earned in Bermuda, a non-taxable jurisdiction, including the majority of our catastrophe business, which can result in significant volatility to our pre-tax net income (loss) in any given period. We expect our consolidated effective tax rate to increase in the future, as our global operations outside of Bermuda expand. In addition, it is possible that we could be adversely affected by changes in tax laws, regulation, or enforcement, any of which could increase our effective tax rate more rapidly or steeply than we currently anticipate.
The preponderance of our revenue, and pre-tax income is generated by our domestic operations (i.e. Bermuda) in the form of underwriting income and net investment income, when compared to our foreign operations. The geographic distribution of pre-tax net income can vary significantly between periods due to, but not limited, to the following factors: the business mix of net premiums written and earned; the size and nature of net claims and claim expenses incurred; the amount and geographic location of operating expenses, net investment income, net realized and unrealized gains (losses) on investments; and the amount of specific adjustments to determine the income tax basis in each of our operating jurisdictions. Pre-tax income for our domestic operations (i.e. Bermuda) was higher compared to our foreign operations for the years ended December 31, 2012 and 2010 primarily as a result of the more volatile catastrophe business underwritten in our Bermuda operations during these periods being relatively free of catastrophe losses and thus generating higher levels of net underwriting income than our foreign operations, which underwrite primarily less volatile business and as a result produce lower levels of net underwriting income in benign loss years. During the year ended December 31, 2011, our domestic operations incurred a loss from continuing operations primarily as a result of significant catastrophe losses experienced during the period resulting in underwriting losses. In addition, our U.S. operations, which principally includes our weather and energy risk management operations, experienced pre-tax losses during the years ended December 31, 2012, 2011 and 2010.
Net (Income) Loss Attributable to Noncontrolling Interests |
| | | | | | | | | | | | | |
| | | | | | | | |
| | Year ended December 31, | 2012 | | 2011 | | 2010 | |
| | (in thousands) | | | | | | |
| | Net (income) loss attributable to noncontrolling interests | $ | (148,040 | ) | | $ | 33,157 |
| | $ | (116,421 | ) | |
| | | | | | | | |
Our net income attributable to the noncontrolling interests was $148.0 million in 2012, compared to a net loss attributable to noncontrolling interests of $33.2 million in 2011. The $181.2 million change is primarily due to increased profits at DaVinciRe as a result of significantly lower insured losses in respect of large events, improved investment results and partially offset by a decrease in our ownership percentage in DaVinciRe from 42.8% at December 31, 2011 to 30.8% at December 31, 2012. We expect our ownership in DaVinciRe to fluctuate over time.
Our net loss attributable to the noncontrolling interests was $33.2 million in 2011, compared to net income attributable to noncontrolling interests of $116.4 million in 2010. The change is primarily due to net losses of DaVinciRe as DaVinciRe incurred an underwriting loss in 2011, compared to underwriting income in 2010, principally due to the 2011 Large Losses, as discussed above.
Income (Loss) from Discontinued Operations |
| | | | | | | | | | | | | |
| | | | | | | | |
| | Year ended December 31, | 2012 | | 2011 | | 2010 | |
| | (in thousands) | | | | | | |
| | Income (loss) from discontinued operations | $ | 2,287 |
| | $ | (15,890 | ) | | $ | 62,670 |
| |
| | | | | | | | |
Income (loss) from discontinued operations includes the financial results of substantially all of our U.S.-based insurance operations sold to QBE. Income from discontinued operations of $2.3 million in 2012 is primarily due to recognizing a gain of $1.0 million on the settlement of the Reserve Collar, as noted below, compared to a loss from discontinued operations of $15.9 million in 2011 which was primarily due to the recognition of a $10.0 million expense related to the contractually agreed obligation to pay, or otherwise reimburse, QBE for amounts potentially up to $10.0 million in respect of net adverse development on prior accident years net claims and claim expenses. Effective May 23, 2012, RenaissanceRe and QBE reached an agreement in respect of the Reserve Collar, and RenaissanceRe paid QBE the sum of $9.0 million on June 1, 2012, representing full and final settlement of the Reserve Collar. We had recognized a $10.0 million liability and corresponding expense related to the Reserve Collar due to purported net adverse development on prior accident years net claims and claim expenses. The $10.0 million represented the maximum amount payable under the Reserve Collar.
Included in income from discontinued operations in 2010 is underwriting income of $57.0 million primarily attributable to strong underwriting results for the 2010 crop year. Included in the underwriting result for 2010 was favorable development on prior accident years of $56.0 million primarily related to the crop insurance line of business which experienced a decrease in the frequency and severity of reported loss activity in 2010 on the 2009 crop year.
LIQUIDITY AND CAPITAL RESOURCES
Financial Condition
RenaissanceRe is a holding company, and we therefore rely on dividends from our subsidiaries and investment income to make principal and interest payments on our debt and to make dividend payments to our preference and common shareholders.
The payment of dividends by our subsidiaries is, under certain circumstances, limited under statutory regulations and insurance law, which require our insurance subsidiaries to maintain certain measures of solvency and liquidity. In addition, Bermuda regulations require approval from the Bermuda Monetary Authority ("BMA") for any reduction of capital in excess of 15% of statutory capital, as defined in the Insurance Act. The Insurance Act also requires these Bermuda insurance subsidiaries of the Company to maintain certain measures of solvency and liquidity. At December 31, 2012, the statutory capital and surplus of our Bermuda insurance subsidiaries was $3.1 billion (December 31, 2011 - $2.7 billion) and the minimum amount required to be maintained under Bermuda law, the Minimum Solvency Margin, was $554.8 million (December 31, 2011 - $552.9 million). During 2012, Renaissance Reinsurance, DaVinciRe and the operating subsidiaries of RenRe Insurance Holdings Ltd. returned capital to our holding company, which included dividends declared and return of capital, net of capital contributions received of $282.0 million, $133.3 million and $Nil, respectively (2011 – $6.7 million, $77.9 million and $547.3 million, respectively).
As discussed in the "Capital Resources" section below, Renaissance Reinsurance is obligated to make a mandatory capital contribution of up to $50.0 million in the event that a loss reduces Top Layer Re's capital below a specified level.
Under the Insurance Act, Renaissance Reinsurance and DaVinci are classified as Class 4 insurers, and therefore must maintain capital at a level equal to its Enhanced Capital Requirement ("ECR") which is established by reference to the Bermuda Solvency and Capital Requirement ("BSCR") model. The BSCR is a standard mathematical model designed to give the BMA more advanced methods for determining an insurer's capital adequacy. Underlying the BSCR is the belief that all insurers should operate on an ongoing basis with a view to maintaining their capital at a prudent level in excess of the minimum solvency margin otherwise prescribed under the Insurance Act. Alternatively, under the Insurance Act, insurers may, subject to the terms of the Insurance Act and to the BMA's oversight, elect to utilize an approved internal
capital model to determine regulatory capital. In either case, the ECR shall at all times equal or exceed the Class 4 insurer's Minimum Solvency Margin and may be adjusted in circumstances where the BMA concludes that the insurer's risk profile deviates significantly from the assumptions underlying its ECR or the insurer's assessment of its risk management policies and practices used to calculate the ECR applicable to it. While not specifically referred to in the Insurance Act, the BMA has also established a Target Capital Level ("TCL") for each Class 4 insurer equal to 120% of its ECR. While a Class 4 insurer is not currently required to maintain its statutory capital and surplus at this level, the TCL serves as an early warning tool for the BMA and failure to maintain statutory capital at least equal to the TCL will likely result in increased BMA regulatory oversight. The 2012 BSCR for Renaissance Reinsurance and DaVinci must be filed with the BMA on or before April 30, 2013; at this time, we believe both companies will exceed the target level of required capital.
RenaissanceRe Corporate Capital (UK) Limited and Syndicate 1458 are subject to oversight by the Council of Lloyd's. RenaissanceRe Syndicate Management Limited is subject to regulation by the Financial Services Authority ("FSA") under the Financial Services and Markets Act 2000. Underwriting capacity of a member of Lloyd's must be supported by providing a deposit in the form of cash, securities or letters of credit, which are referred to as Funds at Lloyd's ("FAL"). This amount is determined by Lloyd's and is based on Syndicate 1458's solvency and capital requirement as calculated through its internal model. In addition, if the FAL are not sufficient to cover all losses, the Lloyd's Central Fund provides an additional level of security for policyholders. At December 31, 2012, the FAL requirement set by Lloyd's for Syndicate 1458 is £183.2 million based on its business plan, approved in November 2012 (2011 – £93.8 million based on its business plan, approved November 2011). Actual FAL posted for Syndicate 1458 at December 31, 2012 by RenaissanceRe CCL is $222.0 million and £45.5 million supported 100% by letters of credit (2011 – $118.5 million and £24.5 million).
As discussed in the "Capital Resources" section below, Renaissance Reinsurance is obligated to make a mandatory capital contribution of up to $50.0 million in the event that a loss reduces Top Layer Re's capital below a specified level. Although not required to maintain Top Layer Re's minimum solvency margin as defined by the BMA, nor contractually obligated to, Renaissance Reinsurance contributed $38.5 million in additional paid-in capital to Top Layer Re during 2011, following the 2011 New Zealand and Tohoku earthquakes.
In the aggregate, our operating subsidiaries have historically produced sufficient cash flows to meet their expected claims payments and operational expenses and to provide dividend payments to us. Our subsidiaries also maintain a concentration of investments in high quality liquid securities, which management believes will provide additional liquidity for extraordinary claims payments should the need arise. See "Capital Resources" section below.
Liquidity and Cash Flows
Holding Company Liquidity
As a Bermuda-domiciled holding company, RenaissanceRe has no operations of its own and its assets consist primarily of investments in subsidiaries. Accordingly, RenaissanceRe's future cash flows largely depend on the availability of dividends or other statutorily permissible payments from subsidiaries. The ability to pay such dividends is limited by the applicable laws and regulations of the various countries and states in which these subsidiaries operate, including, among others, Bermuda, the U.S., Ireland, and the U.K. Refer to "Item 7. Management's Discussion and Analysis of Financial Condition and Results of Operations, Liquidity and Capital Resources, Financial Condition" for further discussion and details regarding dividend capacity of our major operating subsidiaries.
RenaissanceRe's principal uses of liquidity are common share related transactions including dividend payments to holders of its common shareholders as well as share buybacks, preference share related transactions including dividend payments to its preference shareholders as well as preference share buybacks from time to time, interest and principal payments on debt, capital investments in its subsidiaries and certain corporate operating expenses.
We attempt to structure our organization such that it facilitates efficient capital movements between RenaissanceRe and its operating subsidiaries and to ensure that adequate liquidity is available when required, giving consideration to applicable laws and regulations, and the domiciliary location of sources of liquidity and related obligations.
Sources of Liquidity
Historically, cash receipts from operations, consisting of premiums and investment income, generally have provided sufficient funds to pay losses as well as operating expenses of our subsidiaries and to fund dividends to RenaissanceRe. Cash receipts from operations are generally derived from the receipt of investment income on our investment portfolio as well as the net receipt of premiums less claims and claims expenses related to our underwriting activities. The Company's operating subsidiaries provide liquidity in that premiums are generally received months or even years before losses are paid under the policies related to such premiums. Premiums and acquisition expenses are settled based on terms of trade as stipulated by an underwriting contract, and generally are received within the first year of inception of a policy when the premium is written, but can be longer on certain reinsurance business assumed. Operating expenses are generally paid within a year of being incurred. Claims and claims expenses, may take a much longer time before they are reported and ultimately settled, requiring the establishment of reserves for claims and claim expenses. Therefore, the amount of claims paid in any one year is not necessarily related to the amount of net claims incurred, as reported in the consolidated statement of operations.
As a result of the combination of current market conditions, lower investment yields, and a large portion of the coverages we provide can produce losses of high severity and low frequency, it is not possible to accurately predict our future cash flows from operating activities. As a consequence, cash flows from operating activities may fluctuate, perhaps significantly, between individual quarters and years. Due to the magnitude and relatively recent occurrence of certain large loss events, meaningful uncertainty remains regarding losses from these events and our actual ultimate net losses from these events may vary from preliminary estimates, perhaps materially. As a result, our cash flows from operations would be impacted accordingly.
We are a "well-known seasoned issuer" as defined by the rules promulgated under the Securities Act and we maintain a "shelf" Registration Statement on Form S-3 (the "Shelf Registration Statement") under the Securities Act and are eligible to file additional automatically effective Registration Statements of Form S-3 in the future for the potential offering and sale of an unlimited amount of debt and equity securities. The Shelf Registration Statement allows for various types of securities to be offered, including, but not limited to the following: common shares, preference shares and debt securities.
In addition we maintain letter of credit facilities which provide liquidity. Refer to "Item 7. Management's Discussion and Analysis of Financial Condition and Results of Operations, Liquidity and Capital Resources, Capital Resources" for details of these facilities.
Cash Flows |
| | | | | | | | | | | | | |
| | | | | | | | |
| | Year ended December 31, | 2012 | | 2011 | | 2010 | |
| | (in thousands) | | | | | | |
| | Net cash provided by operating activities | $ | 716,929 |
| | $ | 165,933 |
| | $ | 494,720 |
| |
| | Net cash (used in) provided by investing activities | (71,677 | ) | | 315,031 |
| | 108,610 |
| |
| | Net cash used in financing activities | (538,570 | ) | | (542,236 | ) | | (531,592 | ) | |
| | Effect of exchange rate changes on foreign currency cash | 1,692 |
| | 518 |
| | (1,003 | ) | |
| | Net increase (decrease) in cash and cash equivalents | 108,374 |
| | (60,754 | ) | | 70,735 |
| |
| | Cash and cash equivalents, beginning of period | 216,984 |
| | 277,738 |
| | 203,112 |
| |
| | Cash and cash equivalents, end of period | $ | 325,358 |
| | $ | 216,984 |
| | $ | 277,738 |
| |
| | | | | | | | |
During 2012, our cash and cash equivalents increased $108.4 million, to $325.4 million at December 31, 2012, compared to $217.0 million at December 31, 2011.
Cash flows provided by operating activities. Cash flows provided by operating activities during 2012 were $716.9 million, compared to $165.9 million in 2011. Cash flows provided by operating activities during 2012 were primarily the result of certain adjustments to reconcile our net income of $748.9 million to net cash provided by operating activities, including: a reduction in reinsurance recoverable of $211.5 million primarily due to the collection of those balances, an increase in unearned premiums of $51.9 million due to the timing of, and growth in, our gross premiums written, and a $33.5 million increase in reinsurance balances payable due to the timing of, and increase in, our premiums ceded, and partially offset by an adjustment for net realized and unrealized gains on investments of $164.0 million due to improved total returns in our portfolios of fixed maturity and other investments, a decrease in our reserve for claims and claim expenses of $113.0 million driven by the payment of claims and by favorable development on prior accident years net claims and claims expenses during 2012, an increase in premiums receivable of $19.5 million due to increased gross premiums written and an increase in our prepaid reinsurance premiums of $18.6 million due to the timing of, and increase in, our premiums ceded. As discussed under "Summary of Results of Operations", we generated higher underwriting income and higher investment results in 2012 compared to 2011, which contributed to the increase in cash flows provided by operating activities.
Cash flows used in investing activities. During 2012, our cash flows used in investing activities were $71.7 million, principally reflecting our net investment in fixed maturity investments trading of $343.4 million, which was funded primarily by cash provided by our operating activities and net sales of other investments, short term investments and fixed maturity investments available for sale of $150.8 million, $68.8 million and $65.2 million, respectively.
Cash flows used in financing activities. Our cash flows used in financing activities in 2012 were $538.6 million, and were principally the result of the settlement of $463.3 million of our common share repurchases, the payment of $53.4 million and $34.9 million in dividends to our common and preferred shareholders, respectively, and the redemption of $150.0 million of our Series D preference shares during the fourth quarter, partially offset by net inflows of $164.9 million related to additional third party equity capital raised during 2012 in our redeemable noncontrolling interest - DaVinciRe.
During 2011, our cash and cash equivalents decreased $60.8 million, to $217.0 million at December 31, 2011, compared to $277.7 million at December 31, 2010.
Cash flows provided by operating activities. Cash flows provided by operating activities during 2011 were $165.9 million, compared to $494.7 million in 2010. Cash flows provided by operating activities during 2011 were primarily the result of certain adjustments to reconcile our net loss of $90.4 million to net cash provided by operating activities, including: an increase in our reserve for claims and claim expenses of $734.5 million driven by the significant catastrophes in 2011; an increase in unearned premiums of $61.5 million due to growth in our gross premiums written; and partially offset by an increase in premiums receivable and reinsurance recoverable of $149.8 million and $302.3 million, respectively; a decrease in reinsurance balances payable of $61.1 million; and net realized and unrealized gains on investments of $70.7 million. As discussed under "Summary of Results of Operations", in 2011 we incurred significant underwriting losses and lower investment results, which contributed to the decrease in cash flows provided by operating activities.
Cash flows provided by investing activities. During 2011, our cash flows provided by investing activities were $315.0 million, which principally reflected $269.5 million in net proceeds from the sale of substantially all of our U.S.-based insurance operations to QBE and $47.9 million related to the sale of our Platinum warrant during the first quarter of 2011. In response to the large catastrophes of 2011 and our payment of valid claims quickly, we had net sales of short term investments of $103.1 million. In addition, we invested a portion of our net cash provided by operating activities in fixed maturity investments and investments in other ventures.
Cash flows used in financing activities. Our cash flows used in financing activities in 2011 were $542.2 million, principally comprised of the repurchase of $191.6 million of our common shares, the payment of $53.5 million and $35.0 million in dividends to our common and preferred shareholders, respectively, the repurchase of $132.2 million of DaVinciRe shares and the repayment of the outstanding principal of the DaVinciRe revolving credit facility of $200.0 million, as discussed below in the "Capital Resources" section. Partially offsetting the above cash flows used in financing activities was a $70.0 million cash inflow attributable to redeemable noncontrolling interest related to the DaVinciRe equity capital raise executed during the second quarter of 2011.
Reserves for Claims and Claim Expenses
We believe the most significant accounting judgment made by management is our estimate of claims and claim expense reserves. Claims and claim expense reserves represent estimates, including actuarial and statistical projections at a given point in time, of the ultimate settlement and administration costs for unpaid claims and claim expenses arising from the insurance and reinsurance contracts we sell. We establish our claims and claim expense reserves by taking claims reported to us by insureds and ceding companies, but which have not yet been paid ("case reserves"), adding the costs for additional case reserves ("additional case reserves") which represent our estimates for claims previously reported to us which we believe may not be adequately reserved as of that date, and adding estimates for the anticipated cost of IBNR.
The following table summarizes our claims and claim expense reserves by line of business and split between case reserves, additional case reserves and IBNR:
|
| | | | | | | | | | | | | | | | | |
| | | | | | | | | | |
| | At December 31, 2012 | Case Reserves | | Additional Case Reserves | | IBNR | | Total | |
| | (in thousands) | | | | | | | | |
| | Catastrophe | $ | 706,264 |
| | $ | 222,208 |
| | $ | 255,786 |
| | $ | 1,184,258 |
| |
| | Specialty | 111,234 |
| | 80,971 |
| | 286,108 |
| | 478,313 |
| |
| | Total Reinsurance | 817,498 |
| | 303,179 |
| | 541,894 |
| | 1,662,571 |
| |
| | Lloyd's | 29,260 |
| | 10,548 |
| | 109,662 |
| | 149,470 |
| |
| | Other | 17,016 |
| | 8,522 |
| | 41,798 |
| | 67,336 |
| |
| | Total | $ | 863,774 |
| | $ | 322,249 |
| | $ | 693,354 |
| | $ | 1,879,377 |
| |
| | | | | | | | | | |
| | At December 31, 2011 | | | | | | | | |
| | (in thousands) | | | | | | | | |
| | Catastrophe | $ | 681,771 |
| | $ | 271,990 |
| | $ | 388,147 |
| | $ | 1,341,908 |
| |
| | Specialty | 120,189 |
| | 49,840 |
| | 301,589 |
| | 471,618 |
| |
| | Total Reinsurance | 801,960 |
| | 321,830 |
| | 689,736 |
| | 1,813,526 |
| |
| | Lloyd's | 17,909 |
| | 14,459 |
| | 55,127 |
| | 87,495 |
| |
| | Other | 32,944 |
| | 3,515 |
| | 54,874 |
| | 91,333 |
| |
| | Total | $ | 852,813 |
| | $ | 339,804 |
| | $ | 799,737 |
| | $ | 1,992,354 |
| |
| | | | | | | | | | |
Our estimates of claims and claim expense reserves are not precise in that, among other matters, they are based on predictions of future developments and estimates of future trends and other variable factors. Some, but not all, of our reserves are further subject to the uncertainty inherent in actuarial methodologies and estimates. Because a reserve estimate is simply an insurer's estimate at a point in time of its ultimate liability, and because there are numerous factors which affect reserves and claims payments that cannot be determined with certainty in advance, our ultimate payments will vary, perhaps materially, from our estimates of reserves. If we determine in a subsequent period that adjustments to our previously established reserves are appropriate, such adjustments are recorded in the period in which they are identified. During the year ended December 31, 2012, changes to prior year estimated claims reserves increased our net income by $158.0 million (2011 - decreased our net loss by $132.0 million, 2010 - increased out net income by $302.1 million), excluding the consideration of changes in reinstatement premium, profit commissions, redeemable noncontrolling interest - DaVinciRe, equity in net claims and claim expenses of Top Layer Re and income tax.
Our reserving methodology for each line of business uses a loss reserving process that calculates a point estimate for the Company's ultimate settlement and administration costs for claims and claim expenses. We do not calculate a range of estimates. We use this point estimate, along with paid claims and case reserves, to record our best estimate of additional case reserves and IBNR in our consolidated financial statements. Under GAAP, we are not permitted to establish estimates for catastrophe claims and claim expense reserves until an event occurs that gives rise to a loss.
Reserving for our reinsurance claims involves other uncertainties, such as the dependence on information from ceding companies, which among other matters, includes the time lag inherent in reporting information from the primary insurer to us or to our ceding companies and differing reserving practices among ceding companies. The information received from ceding companies is typically in the form of bordereaux, broker notifications of loss and/or discussions with ceding companies or their brokers. This information can be received on a monthly, quarterly or transactional basis and normally includes estimates of paid claims and case reserves. We sometimes also receive an estimate or provision for IBNR. This information is often updated and adjusted from time to time during the loss settlement period as new data or facts in respect of initial claims, client accounts, industry or event trends may be reported or emerge in addition to changes in applicable statutory and case laws.
Our estimates of losses from large events are based on factors including currently available information derived from the Company's claims information from certain customers and brokers, industry assessments of losses from the events, proprietary models, and the terms and conditions of our contracts. The
uncertainty of our estimates for certain of these large events is additionally impacted by the preliminary nature of the information available, the magnitude and relative infrequency of the events, the expected duration of the respective claims development period, inadequacies in the data provided thus far by industry participants and the potential for further reporting lags or insufficiencies (particularly in respect of the Chilean, 2010 New Zealand, 2011 New Zealand and Tohoku earthquakes); and in the case of storm Sandy and the Thailand flooding, significant uncertainty as to the form of the claims and legal issues, under the relevant terms of insurance contracts and reinsurance treaties. In addition, a significant portion of the net claims and claim expenses associated with storm Sandy and the New Zealand and Tohoku earthquakes are concentrated with a few large clients and therefore the loss estimates for these events may vary significantly based on the claims experience of those clients. Loss reserve estimation in respect of our retrocessional contracts poses further challenges compared to directly assumed reinsurance. A significant portion of our reinsurance recoverable relates to the New Zealand and Tohoku earthquakes. There is inherent uncertainty and complexity in evaluating loss reserve levels and reinsurance recoverable amounts, due to the nature of the losses relating to earthquake events, including that loss development time frames tend to take longer with respect to earthquake events. The contingent nature of business interruption and other exposures will also impact losses in a meaningful way, especially with regard to storm Sandy, the Tohoku earthquake and Thailand flooding, which we believe may give rise to significant complexity in respect of claims handling, claims adjustment and other coverage issues, over time. Given the magnitude and relatively recent occurrence of these large events, meaningful uncertainty remains regarding total covered losses for the insurance industry and, accordingly, several of the key assumptions underlying our loss estimates. In addition, our actual net losses from these events may increase if our reinsurers or other obligors fail to meet their obligations.
Because of the inherent uncertainties discussed above, we have developed a reserving philosophy which attempts to incorporate prudent assumptions and estimates, and we have generally experienced favorable net development on prior year reserves in the last several years. However, there is no assurance that this will occur in future periods
Our reserving techniques, assumptions and processes differ between our property catastrophe reinsurance and specialty reinsurance units within our Reinsurance segment and within our Lloyd's segment. Refer to "Item 7. Management's Discussion and Analysis of Financial Condition and Results of Operations, Summary of Critical Accounting Estimates, Claims and Claim Expense Reserves" for more information on the risks we insure and reinsure, the reserving techniques, assumptions and processes we follow to estimate our claims and claim expense reserves, and our current estimates versus our initial estimates of our claims reserves, for each of these units.
Capital Resources
Our total capital resources are as follows: |
| | | | | | | | | | | | | |
| | | | | | | | |
| | At December 31, | 2012 | | 2011 | | Change | |
| | (in thousands) | | | | | | |
| | Common shareholders' equity | $ | 3,103,065 |
| | $ | 3,055,193 |
| | $ | 47,872 |
| |
| | Preference shares | 400,000 |
| | 550,000 |
| | (150,000 | ) | |
| | Total shareholders' equity attributable to RenaissanceRe | 3,503,065 |
| | 3,605,193 |
| | (102,128 | ) | |
| | 5.875% Senior Notes | 100,000 |
| | 100,000 |
| | — |
| |
| | 5.750% Senior Notes | 249,339 |
| | 249,247 |
| | 92 |
| |
| | RenaissanceRe revolving credit facility – borrowed | — |
| | — |
| | — |
| |
| | RenaissanceRe revolving credit facility – unborrowed | 150,000 |
| | 150,000 |
| | — |
| |
| | Renaissance Trading credit facility – borrowed | 2,436 |
| | 4,373 |
| | (1,937 | ) | |
| | Renaissance Trading credit facility – unborrowed | 17,564 |
| | 5,627 |
| | 11,937 |
| |
| | Total capital resources | $ | 4,022,404 |
| | $ | 4,114,440 |
| | $ | (92,036 | ) | |
| | | | | | | | |
In 2012, our capital resources decreased by $92.0 million, principally due to the redemption of 6.0 million of our Series D Preferences Shares, or $150.0 million, as discussed below, $53.4 million of dividends on our common shares, $494.4 million of common share repurchases as discussed in more detail in "Part II, Item 2. Unregistered Sales of Equity Securities and Use of Proceeds", and partially offset by comprehensive income of $602.8 million.
Preference Shares
In December 2006, we raised $300.0 million through the issuance of 12.0 million Series D Preference Shares; in March 2004, we raised $250.0 million through the issuance of 10.0 million Series C Preference Shares; and in February 2003, we raised $100.0 million through the issuance of 4.0 million Series B Preference Shares. On November 17, 2010, we gave redemption notices to the holders of the 7.30% Series B Preference Shares to redeem such shares for $25.00 per share. On December 20, 2010, we redeemed all of the issued and outstanding 7.30% Series B Preference Shares for $100.0 million plus accrued and unpaid dividends thereon. On November 27, 2012, we announced mandatory partial redemption of 6.0 million of our outstanding Series D Preference Shares at a redemption price of $25.00 per Series D Preference Share. The partial redemption was allocated by random lottery in accordance with the Depository Trust Company's rules and procedures and on December 27, 2012 we redeemed the 6.0 million Series D Preference Shares called for redemption for $150.0 million plus accrued and unpaid dividends thereon. Following this transaction, 6.0 million Series D Preference Shares remain outstanding. The Series D and Series C Preference Shares may be redeemed at $25.00 per share at our option. Dividends on the Series D and Series C Preference Shares are cumulative from the date of original issuance and are payable quarterly in arrears at 6.60% and 6.08%, respectively, when, if and as declared by the Board of Directors. The preference shares have no stated maturity and are not convertible into any other of our securities.
5.875% Senior Notes
In January 2003, the Company issued $100.0 million, which represented the carrying amount on the Company's consolidated balance sheet, of 5.875% Senior Notes due February 15, 2013, with interest on the notes payable on February 15 and August 15 of each year. The Company repaid the notes in full upon their scheduled maturity on February 15, 2013 using available cash and investments. The Company does not have current plans to replace the notes with additional indebtedness.
5.75% Senior Notes
On March 17, 2010, RRNAH issued $250.0 million of 5.75% Senior Notes due March 15, 2020, with interest on the notes payable on March 15 and September 15 of each year. The notes, which are senior obligations, are guaranteed by RenaissanceRe and can be redeemed by RRNAH prior to maturity, subject to the payment of a "make-whole" premium. The Notes were issued pursuant to an Indenture, dated as of March 17, 2010, by and among RenaissanceRe, RRNAH, and Deutsche Bank Trust Company Americas, as trustee (the "Trustee"), as supplemented by the First Supplemental Indenture, dated as of March 17, 2010 (as so supplemented, the "Indenture").
RenaissanceRe Revolving Credit Facility (the "Credit Agreement")
Effective May 17, 2012, RenaissanceRe entered into a credit agreement with various banks and financial institutions parties thereto (collectively, the "Lenders"), Wells Fargo Bank, National Association ("Wells Fargo"), as fronting bank, letter of credit administrator and administrative agent for the Lenders, Citibank, N.A. ("Citibank"), as syndication agent, and Wells Fargo Securities, LLC and Citigroup Global Markets Inc., as joint lead arrangers and joint lead bookrunners (the "Credit Agreement"). The Credit Agreement replaced the prior credit agreement, dated as of April 22, 2010, which was terminated concurrently with the effectiveness of the Credit Agreement.
The Credit Agreement provides for a revolving commitment to RenaissanceRe of $150.0 million, including the issuance of letters of credit for the account of RenaissanceRe and RenaissanceRe's insurance subsidiaries of up to $150.0 million and the issuance of letters of credit for the account of RenaissanceRe's non-insurance subsidiaries of up to $50.0 million. RenaissanceRe has the right, subject to satisfying certain conditions, to increase the size of the facility to $250.0 million. Amounts borrowed under the Credit
Agreement bear interest at a rate selected by RenaissanceRe equal to the Base Rate or LIBOR (each as defined in the Credit Agreement) plus a margin, all as more fully set forth in the Credit Agreement.
The Credit Agreement contains representations, warranties and covenants customary for bank loan facilities of this type. In addition to customary covenants which limit RenaissanceRe and its subsidiaries' ability to merge, consolidate, enter into negative pledge agreements, sell a substantial amount of assets, incur liens and declare or pay dividends under certain circumstances, the Credit Agreement also contains certain financial covenants. These financial covenants generally provide that consolidated debt to capital shall not exceed the ratio of 0.35:1 and that the consolidated net worth of RenaissanceRe and Renaissance Reinsurance shall equal or exceed approximately $2.1 billion and $1.1 billion, respectively (the "Net Worth Requirements"). The Net Worth Requirements are recalculated effective as of the end of each fiscal year, all as more fully set forth in the Credit Agreement. The scheduled commitment maturity date of the Credit Agreement is May 17, 2015.
In the event of the occurrence and continuation of certain events of default, the administrative agent shall, at the request of the Required Lenders (as defined in the Credit Agreement), or may, with the consent of the Required Lenders, among other things, take any or all of the following actions: terminate the Lenders' obligations to make loans or issue letters of credit, accelerate the outstanding obligations of RenaissanceRe under the Credit Agreement and require RenaissanceRe to cash collateralize the outstanding letter of credit obligations in an amount equal to 103% thereof.
DaVinciRe Revolving Credit Facility
DaVinciRe was a party to a Third Amended and Restated Credit Agreement, dated as of April 5, 2006 (the "DaVinciRe Credit Agreement"), which provided for a revolving credit facility in an aggregate amount of up to $200.0 million and was scheduled to mature on April 5, 2011. On April 1, 2011, DaVinciRe repaid in full the $200.0 million borrowed under the DaVinciRe Credit Agreement and terminated the lenders' lending commitment thereunder. In connection with such repayment and termination, on March 30, 2011, DaVinciRe entered into a loan agreement with RenaissanceRe (the "Loan Agreement") under which RenaissanceRe made a loan to DaVinciRe in the principal amount of $200.0 million on April 1, 2011. The loan matures on March 31, 2021 and interest on the loan is payable at a rate of three month LIBOR plus 3.5% and is due at the end of each March, June, September and December, commencing on June 30, 2011. Under the terms of the Loan Agreement, DaVinciRe is required to maintain a debt to capital ratio of no greater than 0.40:1 and a net worth of no less than $500.0 million. On December 21, 2012, DaVinciRe repaid $100.0 million of principal under the Loan Agreement and at December 31, 2012, $100.0 million remained outstanding under the Loan Agreement. No additional amounts may be borrowed by DaVinciRe under the Loan Agreement.
Principal Letter of Credit Facility
Effective May 17, 2012, RenaissanceRe and certain of its affiliates, Renaissance Reinsurance, ROE, Glencoe and DaVinci (such affiliates, collectively, the "Account Parties"), entered into a Fourth Amended and Restated Reimbursement Agreement with various banks and financial institutions parties thereto (collectively, the "Banks"), Wells Fargo, as issuing bank, administrative agent and collateral agent for the Banks, and certain other agents (the "Reimbursement Agreement"). The Reimbursement Agreement amended and restated in its entirety the Third Amended and Restated Reimbursement Agreement, dated as of April 22, 2010 (the "Prior Reimbursement Agreement"), which was terminated concurrently with the effectiveness of the Reimbursement Agreement.
The Reimbursement Agreement continues to serve as RenaissanceRe's principal secured letter of credit facility and the commitments thereunder expire on May 17, 2015. The Reimbursement Agreement provides a commitment from the Banks in an aggregate amount of $450.0 million, which may be increased up to an amount not to exceed $800.0 million, subject to RenaissanceRe satisfying certain conditions. The Reimbursement Agreement contains representations, warranties and covenants in respect of RenaissanceRe, the Account Parties and their respective subsidiaries that are customary for facilities of this type, including customary covenants limiting the ability to merge, consolidate and sell a substantial amount of assets. The Reimbursement Agreement contains certain financial covenants requiring RenaissanceRe and DaVinci to maintain a minimum net worth of approximately $1.8 billion and $749.1 million, respectively,
which requirements are recalculated effective as of the end of each fiscal year, all as more fully set forth in the Reimbursement Agreement.
Under the Reimbursement Agreement, each Account Party is required to pledge eligible collateral having a value sufficient to cover all of its obligations under the Reimbursement Agreement, including reimbursement obligations for outstanding letters of credit issued for its account. In the case of an event of default under the Reimbursement Agreement, and in certain other circumstances set forth in the Reimbursement Agreement, including, among others, a decrease in the net worth of an Account Party below the level specified therein for such Account Party, a decline in collateral value, and certain failures to maintain specified ratings, the Banks may exercise certain remedies, including conversion of collateral into cash.
Under the Reimbursement Agreement, redeemable preference shares of Renaissance Investment Holdings Ltd. are no longer eligible collateral. Therefore, the Second Amended and Restated RIHL Undertaking and Agreement, dated as of April 22, 2010, entered into in connection with the Prior Reimbursement Agreement, was terminated concurrently with the execution of the Reimbursement Agreement.
At December 31, 2012, we had $204.6 million of letters of credit with effective dates on or before December 31, 2012 outstanding under the Reimbursement Agreement.
Bilateral Letter of Credit Facility ("Bilateral Facility")
Effective September 17, 2010, each of Renaissance Reinsurance, DaVinci and Glencoe (collectively, the "Bilateral Facility Participants"), entered into a secured letter of credit facility with Citibank Europe plc ("CEP"). The Bilateral Facility provides a commitment from CEP to issue letters of credit for the account of one or more of the Bilateral Facility Participants and their respective subsidiaries in multiple currencies and in an aggregate amount of up to $300.0 million. The Bilateral Facility expires on December 31, 2013 and is evidenced by a Facility Letter (as amended) and three separate Master Agreements between CEP and each of the Bilateral Facility Participants, as well as certain ancillary agreements. At December 31, 2012, $292.9 million remained unused and available to the Bilateral Facility Participants under the Bilateral Facility.
Under the Bilateral Facility, each of the Bilateral Facility Participants is severally obligated to pledge to CEP at all times during the term of the Bilateral Facility certain securities with a collateral value (as determined as therein provided) that equals or exceeds 100% of the aggregate amount of its then-outstanding letters of credit. In the case of an event of default under the Bilateral Facility with respect to a Bilateral Facility Participant, CEP may exercise certain remedies with respect to such Bilateral Facility Participant, including terminating its commitment to such Bilateral Facility Participant under the Bilateral Facility and taking certain actions with respect to the collateral pledged by such Bilateral Facility Participant (including the sale thereof). In the Facility Letter, each of Renaissance Reinsurance, DaVinci and Glencoe makes, as to itself, representations and warranties that are customary for facilities of this type and severally agrees that it will comply with certain informational and other undertakings, including those regarding the delivery of quarterly and annual financial statements.
Funds at Lloyd's Letter of Credit Facility
On April 26, 2010, Renaissance Reinsurance and CEP entered into an Amended and Restated Pledge Agreement (the "Pledge Agreement") in respect of its letter of credit facility with CEP which is evidenced by the Master Reimbursement Agreement, dated as of April 29, 2009, which provides for the issuance and renewal of letters of credit used to support business written by Syndicate 1458. At December 31, 2012, two letters of credit issued by CEP under the Reimbursement Agreement were outstanding, in the amount of $222.0 million and £45.5 million, respectively. Pursuant to the Pledge Agreement, Renaissance Reinsurance has agreed to pledge to CEP at all times during the term of the Reimbursement Agreement certain securities with a collateral value equal to 100% of the aggregate amount of the then-outstanding letters of credit issued under the Reimbursement Agreement.
Letters of Credit
At December 31, 2012, we had total letters of credit outstanding under all facilities of $507.2 million.
Renaissance Reinsurance is also party to a collateralized letter of credit and reimbursement agreement in the amount of $37.5 million that supports our Top Layer Re joint venture. Renaissance Reinsurance is obligated to make a mandatory capital contribution of up to $50.0 million in the event that a loss reduces Top Layer Re's capital below a specified level.
Multi-Beneficiary Reinsurance Trusts
Effective March 15, 2011, each of Renaissance Reinsurance and DaVinci was approved as a Trusteed Reinsurer in the State of New York and established a multi-beneficiary reinsurance trust ("MBRT") to collateralize its respective (re)insurance liabilities associated with U.S. domiciled cedants. The MBRTs are subject to the rules and regulations of the State of New York and the respective deed of trust, including but not limited to certain minimum capital funding requirements, investment guidelines, capital distribution restrictions and regulatory reporting requirements. Following the initial approval in the State of New York, Renaissance Reinsurance and DaVinci submitted applications to all U.S. states to become Trusteed Reinsurers. As of December 31, 2012, Renaissance Reinsurance and DaVinci are approved in 51 and 50 U.S. states, respectively. We expect, over time, to transition cedants with existing outstanding letters of credit, to the appropriate MBRT as determined by cedant state of domicile, thereby reducing our absolute and relative reliance on letters of credit. New business incepting with cedants domiciled in approved states will be collateralized using a MBRT. Cedants collateralized with a MBRT will be eligible for automatic reinsurance credit in their respective U.S. regulatory filings. Assets held under trust at December 31, 2012 with respect to the MBRTs totaled $508.7 million and $180.1 million for Renaissance Reinsurance and DaVinci, respectively, compared to the minimum amount required under U.S. state regulations of $494.9 million and $169.1 million, respectively.
Multi-Beneficiary Reduced Collateral Reinsurance Trusts
Effective December 31, 2012, each of Renaissance Reinsurance and DaVinci was approved as an Accredited Reinsurer in the state of New York and established a multi-beneficiary reduced collateral reinsurance trust ("RCT") to collateralize its (re)insurance liabilities associated with U.S. domiciled cedants in certain states where Renaissance Reinsurance or DaVinci is approved as an Accredited Reinsurer, thereby providing for a reduction in collateral requirements to 20% of the net outstanding insurance liabilities. The RCTs are subject to the rules and regulations of the state of New York and the respective deed of trust, including but not limited to certain minimum capital funding requirements, investment guidelines, capital distribution restrictions and regulatory reporting requirements. Assets held under trust at December 31, 2012 with respect to the RCTs totaled $11.0 million and $11.0 million for Renaissance Reinsurance and DaVinci, respectively, compared to the minimum amount required under U.S. state regulations of $10.0 million and $10.0 million, respectively.
Renaissance Trading Margin Facility and Guarantees
Renaissance Trading maintains a brokerage facility with a prime broker, which has an associated margin facility of $20.0 million. This margin facility, which allows Renaissance Trading to manage its cash position related to its exchange traded products, is supported by a $25.0 million guarantee issued by RenaissanceRe. Interest on amounts outstanding under this facility is at overnight LIBOR plus 200 basis points. At December 31, 2012, $2.4 million was outstanding under the facility.
At December 31, 2012, RenaissanceRe had provided guarantees in the aggregate amount of $304.3 million to certain counterparties of the weather and energy risk operations of Renaissance Trading. In the future, RenaissanceRe may issue guarantees for other purposes or increase the amount of guarantees issued to counterparties of Renaissance Trading.
Redeemable Noncontrolling Interest – DaVinciRe
DaVinciRe shareholders are party to a shareholders agreement (the "Shareholders Agreement") which provides DaVinciRe shareholders, excluding us, with certain redemption rights that enable each shareholder to notify DaVinciRe of such shareholder's desire for DaVinciRe to repurchase up to half of such shareholder's aggregate number of shares held, subject to certain limitations, such as limiting the aggregate
of all share repurchase requests to 25% of DaVinciRe's capital in any given year and satisfying all applicable regulatory requirements. If total shareholder requests exceed 25% of DaVinciRe's capital, the number of shares repurchased will be reduced among the requesting shareholders pro-rata, based on the amounts desired to be repurchased. Shareholders desiring to have DaVinciRe repurchase their shares must notify DaVinciRe before March 1 of each year. The repurchase price will be based on GAAP book value as of the end of the year in which the shareholder notice is given, and the repurchase will be effective as of such date. Payment will be made by April 1 of the following year, following delivery of the audited financial statements for the year in which the repurchase was effective. The repurchase price is subject to a true-up for development on outstanding loss reserves after settlement of all claims relating to the applicable years.
Effective January 1, 2012, an existing third party shareholder sold a portion of its shares in DaVinciRe to a new third party shareholder. In connection with the sale by the existing third party shareholder, DaVinciRe retained a $4.9 million holdback. In addition, effective January 1, 2012, we sold a portion of our shares of DaVinci Re to a separate new third party shareholder. We sold these shares for $98.9 million, net of a $10.0 million reserve holdback due from DaVinciRe.
Certain third party shareholders of DaVinciRe submitted repurchase notices on or before the required annual redemption notice date of March 1, 2012, in accordance with the Shareholders Agreement. The repurchase notices submitted on or before March 1, 2012, were for shares of DaVinciRe with a GAAP book value of $53.2 million at December 31, 2012.
On June 1, 2012, DaVinciRe completed an equity raise of $49.3 million from a new third party investor. In addition, the Company and an existing third party investor each sold $24.7 million in common shares of DaVinciRe to another existing third party investor, for a total of $49.4 million. In connection with the sale by the Company and the existing third party investor, DaVinciRe retained a $5.0 million holdback. As a result of the above transactions, the Company's ownership in DaVinciRe decreased to 31.5% effective retroactively to January 1, 2012.
On October 1, 2012, the Company sold a portion of its shares of DaVinciRe to a new third party shareholder for $9.8 million. The Company's ownership in DaVinciRe decreased to 30.8% effective October 1, 2012 as a result of this sale.
During January 2013 DaVinciRe redeemed shares from certain DaVinciRe shareholders, including the Company, while certain other existing DaVinciRe shareholders purchased additional shares in DaVinciRe. The net redemption as a result of these transactions was $150.0 million. In connection with the redemptions, DaVinciRe retained a $20.5 million holdback. Our ownership in DaVinciRe was 30.8% at December 31, 2012 and subsequent to the above transactions, our ownership in DaVinciRe increased to 32.9% effective January 1, 2013. We expect our ownership in DaVinciRe to fluctuate over time.
Ratings
Financial strength ratings are an important factor in respect of the competitive position of reinsurance and insurance companies. Rating organizations continually review the financial positions of our reinsurers and insurers. We continue to receive high claims-paying and financial strength ratings from A.M. Best, S&P, Moody's and Fitch. These ratings represent independent opinions of an insurer's financial strength, operating performance and ability to meet policyholder obligations, and are not an evaluation directed toward the protection of investors or a recommendation to buy, sell or hold any of our securities.
Presented below are the ratings of our principal operating subsidiaries and joint ventures by segment and the ERM rating of RenaissanceRe as of February 20, 2013. |
| | | | | | | | | |
| | | | | | | | | | |
| | February 20, 2013 | A.M. Best | | S&P (4) | | Moody's | | Fitch | |
| | REINSURANCE SEGMENT (1) | | | | | | | | |
| | Renaissance Reinsurance | A+ | | AA- | | A1 | | A+ | |
| | DaVinci | A | | A+ | | A3 | | — | |
| | Glencoe | A | | A | | — | | — | |
| | Top Layer Re | A+ | | AA | | — | | — | |
| | ROE | A+ | | AA- | | — | | — | |
| | LLOYD'S SEGMENT | | | | | | | | |
| | Syndicate 1458 | — | | — | | — | | — | |
| | Lloyd's Overall Market Rating (2) | A | | A+ | | — | | A+ | |
| | RENAISSANCERE (3) | — | | Excellent | | — | | — | |
| | | | | | | | | | |
| |
| (1) | The A.M. Best, S&P, Moody's and Fitch ratings for the companies in the Reinsurance segment reflect the insurer's financial strength rating. |
| |
| (2) | The A.M. Best, S&P and Fitch ratings for the Lloyd's Overall Market Rating represent its financial strength rating. |
| |
| (3) | The S&P rating for RenaissanceRe represents rating on its Enterprise Risk Management practices. |
| |
| (4) | The S&P ratings for the companies in the Reinsurance segment reflect, in addition to the insurer's financial strength rating, the insurer's issuer credit rating. |
A.M. Best. "A+" is the second highest designation of A.M. Best's sixteen rating levels. "A+" rated insurance companies are defined as "Superior" companies and are considered by A.M. Best to have a very strong ability to meet their obligations to policyholders. "A" is the third highest designation assigned by A.M. Best, representing A.M. Best's opinion that the insurer has an "Excellent" ability to meet its ongoing obligations to policyholders.
On May 21, 2012, A.M. Best affirmed the financial strength rating ("FSR") of "A+" (Superior) of each of Renaissance Reinsurance and ROE. Concurrently, A.M. Best affirmed the FSR of "A" (Excellent) of each of DaVinci and Glencoe. The outlook is stable for these ratings.
On May 23, 2011, A.M. Best affirmed the FSR of A+ (Superior) of Top Layer Re. The outlook is stable for this rating.
S&P. The "AA" range ("AA+", "AA", AA-"), which has been assigned by S&P to Renaissance Reinsurance, ROE and Top Layer Re, is the second highest rating assigned by S&P, and indicates that S&P believes the insurers have very strong financial security characteristics, differing only slightly from those rated higher. S&P assigns an issuer credit rating to an entity which is an opinion on the credit worthiness of the obligor with respect to a specific financial obligation.
On June 23, 2011, S&P affirmed its "A" issuer credit rating ("ICR") on RenaissanceRe. At the same time, S&P affirmed its "A" senior debt rating on our senior unsecured notes. In addition, S&P affirmed its "AA-" ICR and FSR on Renaissance Reinsurance and ROE and its "A+" and "A" ICR and FSR on DaVinci and Glencoe, respectively. The outlook is stable for these ratings.
On May 17, 2011, following the sale of substantially all of our U.S.-based insurance operations, S&P lowered Glencoe's ICR to "A" from "A+". The outlook is stable for this rating.
On November 1, 2010, S&P revised its outlook on Top Layer to stable from negative and at the same time, affirmed Top Layer's ICR and FSR of "AA".
In addition, S&P assesses companies' ERM practices, which is an opinion on the many critical dimensions of risk that determine overall creditworthiness. RenaissanceRe has been assigned an ERM rating of "Excellent", which is the highest rating assigned by S&P, and indicates that S&P believes RenaissanceRe has extremely strong capabilities to consistently identify, measure, and manage risk exposures and losses within RenaissanceRe's predetermined tolerance guidelines.
Moody's. Moody's Insurance Financial Strength Ratings and Moody's Credit Ratings represent its opinions of the ability of insurance companies to pay punctually policyholder claims and obligations and senior unsecured debt instruments. Moody's believes that insurance companies rated "A1", such as Renaissance Reinsurance, and companies rated "A3", such as DaVinci, offer good financial security. However, Moody's believes that elements may be present which suggest a susceptibility to impairment sometime in the future.
On June 30, 2011, Moody's assigned an "A3" insurance FSR to DaVinci and a "Baa2" long-term issuer rating to DaVinciRe Holdings Ltd. The outlook is stable for this rating.
On November 18, 2010, following the public announcement that we entered into a definitive agreement with QBE to sell substantially all of our U.S. based insurance operations, Moody's affirmed the "A1" insurance FSR of Renaissance Reinsurance. The outlook is stable for this rating.
Fitch. Fitch's Issuer Financial Strength ("IFS") ratings provide an assessment of the financial strength of an insurance organization. Fitch believes that insurance companies rated "A+", such as Renaissance Reinsurance, have "Strong" capacity to meet policyholders and contract obligations on a timely basis with a low expectation of ceased or interrupted payments.
On January 3, 2013, Fitch affirmed the IFS of Renaissance Reinsurance at "A+". The outlook is stable for this rating.
Lloyd's Overall Market Rating
A.M. Best, S&P and Fitch have each assigned an FSR to the Lloyd's overall market. The financial risks to policy holders of syndicates within the Lloyd's market are partially mutualized through the Lloyd's Central Fund, to which all underwriting members contribute. Because of the presence of the Lloyd's Central Fund, and the current legal and regulatory structure of the Lloyd's market, FSRs on individual syndicates would not be particularly meaningful and in any event would not be lower than the FSR of the Lloyd's overall market.
While the ratings of our principal operating subsidiaries and joint ventures remain among the highest in our business, adverse ratings actions could have a negative effect on our ability to fully realize current or future market opportunities. In addition, it is common for our reinsurance contracts to contain provisions permitting our customers to cancel coverage pro-rata if our relevant operating subsidiary is downgraded below a certain rating level. Whether a client would exercise this right would depend, among other factors, on the reason for such a downgrade, the extent of the downgrade, the prevailing market conditions and the pricing and availability of replacement reinsurance coverage. Therefore, in the event of a downgrade, it is not possible to predict in advance the extent to which this cancellation right would be exercised, if at all, or what effect such cancellations would have on our financial condition or future operations, but such effect potentially could be material. To date we are not aware that we have experienced such a cancellation. Our ratings are subject to periodic review and may be revised or revoked by the agencies which issue them. None of our operating subsidiaries which conduct the trading activities of REAL are currently rated by any of the nationally recognized rating agencies.
Investments
The table below shows the aggregate amounts of our invested assets: |
| | | | | | | | | | | | | | | |
| | | | | | | | | | |
| | At December 31, | 2012 | | 2011 | |
| | (in thousands, except percentages) | | | | | | | | |
| | U.S. treasuries | $ | 1,259,800 |
| | 19.8 | % | | $ | 885,152 |
| | 14.3 | % | |
| | Agencies | 315,154 |
| | 5.0 | % | | 158,561 |
| | 2.6 | % | |
| | Non-U.S. government (Sovereign debt) | 133,198 |
| | 2.1 | % | | 227,912 |
| | 3.7 | % | |
| | FDIC guaranteed corporate | — |
| | — | % | | 423,630 |
| | 6.8 | % | |
| | Non-U.S. government-backed corporate | 349,514 |
| | 5.5 | % | | 641,082 |
| | 10.3 | % | |
| | Corporate | 1,615,207 |
| | 25.4 | % | | 1,206,904 |
| | 19.4 | % | |
| | Agency mortgage-backed | 408,531 |
| | 6.4 | % | | 441,749 |
| | 7.1 | % | |
| | Non-agency mortgage-backed | 248,339 |
| | 3.9 | % | | 104,771 |
| | 1.7 | % | |
| | Commercial mortgage-backed | 406,166 |
| | 6.4 | % | | 325,729 |
| | 5.2 | % | |
| | Asset-backed | 12,954 |
| | 0.2 | % | | 18,027 |
| | 0.3 | % | |
| | Total fixed maturity investments, at fair value | 4,748,863 |
| | 74.7 | % | | 4,433,517 |
| | 71.4 | % | |
| | Short term investments, at fair value | 821,163 |
| | 12.9 | % | | 905,477 |
| | 14.6 | % | |
| | Equity investments trading, at fair value | 58,186 |
| | 0.9 | % | | 50,560 |
| | 0.8 | % | |
| | Other investments, at fair value | 644,711 |
| | 10.1 | % | | 748,984 |
| | 12.1 | % | |
| | Total managed investment portfolio | 6,360,647 |
| | 98.6 | % | | 6,138,538 |
| | 98.9 | % | |
| | Investments in other ventures, under equity method | 87,724 |
| | 1.4 | % | | 70,714 |
| | 1.1 | % | |
| | Total investments | $ | 6,360,647 |
| | 100.0 | % | | $ | 6,209,252 |
| | 100.0 | % | |
| | | | | | | | | | |
At December 31, 2012, we held investments totaling $6.4 billion, compared to $6.2 billion at December 31, 2011, with net unrealized appreciation included in accumulated other comprehensive income of $13.6 million at December 31, 2012, compared to $11.8 million at December 31, 2011. Our investment guidelines stress preservation of capital, market liquidity, and diversification of risk. Notwithstanding the foregoing, our investments are subject to market-wide risks and fluctuations, as well as to risks inherent in particular securities. Refer to "Note 6. Fair Value Measurements" in our notes to the consolidated financial statements for additional information regarding the fair value of measurement of our investments.
As the reinsurance coverages we sell include substantial protection for damages resulting from natural and man-made catastrophes, we expect from time to time to become liable for substantial claim payments on short notice. Accordingly, our investment portfolio as a whole is structured to seek to preserve capital and provide a high level of liquidity which means that the large majority of our investment portfolio consists of highly rated fixed income securities, including U.S. treasuries, agencies, highly rated sovereign and supranational securities, high-grade corporate securities and mortgage-backed and asset-backed securities. We also have an allocation to other investments, including hedge funds, private equity partnerships, senior secured bank loan funds and other investments. At December 31, 2012, these other investments totaled $644.7 million, or 10.1%, of our total investments (2011 – $749.0 million or 12.1%).
The following table summarizes the composition of the amortized cost and fair value of our investment portfolio at the dates indicated by ratings as assigned by S&P, or Moody's and/or other rating agencies when S&P ratings were not available, and the respective effective yield.
|
| | | | | | | | | | | | | | | | | | | | | | | | | | | | | | | | | | | | | | | |
| | | |
| | | | | | | | | Credit Rating (1) | |
| | December 31, 2012 | Amortized
Cost | | Fair Value | | % of Total
Investment
Portfolio | | Weighted Average Effective Yield | | AAA | | AA | | A | | BBB | | Non-
Investment
Grade | | Not Rated | |
| | Short term investments | $ | 821,163 |
| | $ | 821,163 |
| | 12.9 | % | | 0.2 | % | | $ | 753,883 |
| | $ | 63,737 |
| | $ | 163 |
| | $ | 3,371 |
| | $ | 9 |
| | $ | — |
| |
| | | | | 100.0 | % | | | | | | 91.8 | % | | 7.8 | % | | — | % | | 0.4 | % | | — | % | | — | % | |
| | Fixed maturity investments | | | | | | | | | | | | | | | | | | | | |
| | U.S. treasuries | 1,256,607 |
| | 1,259,800 |
| | 19.8 | % | | 0.4 | % | | — |
| | 1,259,800 |
| | — |
| | — |
| | — |
| | — |
| |
| | Agencies | | | | | | | | | | | | | | | | | | | | |
| | Fannie Mae & Freddie Mac | 289,884 |
| | 292,098 |
| | 4.6 | % | | 0.6 | % | | — |
| | 292,098 |
| | — |
| | — |
| | — |
| | — |
| |
| | Other agencies | 22,865 |
| | 23,056 |
| | 0.4 | % | | 0.7 | % | | — |
| | 23,056 |
| | — |
| | — |
| | — |
| | — |
| |
| | Total agencies | 312,749 |
| | 315,154 |
| | 5.0 | % | | 0.7 | % | | — |
| | 315,154 |
| | — |
| | — |
| | — |
| | — |
| |
| | Non-U.S. government (Sovereign debt) | 128,207 |
| | 133,198 |
| | 2.1 | % | | 1.9 | % | | 66,653 |
| | 23,914 |
| | 6,828 |
| | 21,767 |
| | 13,793 |
| | 243 |
| |
| | Non-U.S. government-backed corporate | 343,924 |
| | 349,514 |
| | 5.5 | % | | 0.7 | % | | 287,288 |
| | 56,059 |
| | 6,167 |
| | — |
| | — |
| | — |
| |
| | Corporate | 1,552,194 |
| | 1,615,207 |
| | 25.4 | % | | 2.6 | % | | 25,361 |
| | 263,541 |
| | 765,050 |
| | 280,598 |
| | 265,045 |
| | 15,612 |
| |
| | Mortgage-backed | | | | | | | | | | | | | | | | | | | | |
| | Residential mortgage-backed | | | | | | | | | | | | | | | | | | | | |
| | Agency securities | 404,423 |
| | 408,531 |
| | 6.4 | % | | 1.3 | % | | — |
| | 408,531 |
| | — |
| | — |
| | — |
| | — |
| |
| | Non-agency securities - Prime | 124,832 |
| | 131,819 |
| | 2.1 | % | | 3.6 | % | | 17,159 |
| | 7,402 |
| | 6,247 |
| | 8,286 |
| | 92,725 |
| | — |
| |
| | Non-agency securities - Alt A | 107,485 |
| | 116,520 |
| | 1.8 | % | | 5.2 | % | | 5,152 |
| | 1,951 |
| | 13,385 |
| | 11,876 |
| | 84,156 |
| | — |
| |
| | Total residential mortgage-backed | 636,740 |
| | 656,870 |
| | 10.3 | % | | 2.5 | % | | 22,311 |
| | 417,884 |
| | 19,632 |
| | 20,162 |
| | 176,881 |
| | — |
| |
| | Commercial mortgage-backed | 383,176 |
| | 406,166 |
| | 6.4 | % | | 1.7 | % | | 266,325 |
| | 92,820 |
| | 47,021 |
| | — |
| | — |
| | — |
| |
| | Total mortgage-backed | 1,019,916 |
| | 1,063,036 |
| | 16.7 | % | | 2.2 | % | | 288,636 |
| | 510,704 |
| | 66,653 |
| | 20,162 |
| | 176,881 |
| | — |
| |
| | Asset-backed | | | | | | | | | | | | | | | | | | | | |
| | Credit cards | 4,270 |
| | 4,623 |
| | 0.1 | % | | 1.7 | % | | 4,623 |
| | — |
| | — |
| | — |
| | — |
| | — |
| |
| | Auto loans | 2,119 |
| | 2,238 |
| | — | % | | 0.9 | % | | 2,238 |
| | — |
| | — |
| | — |
| | — |
| | — |
| |
| | Student loans | 1,626 |
| | 1,650 |
| | — | % | | 1.0 | % | | 1,650 |
| | — |
| | — |
| | — |
| | — |
| | — |
| |
| | Other | 4,195 |
| | 4,443 |
| | 0.1 | % | | 2.7 | % | | 4,443 |
| | — |
| | — |
| | — |
| | — |
| | — |
| |
| | Total asset-backed | 12,210 |
| | 12,954 |
| | 0.2 | % | | 1.8 | % | | 12,954 |
| | — |
| | — |
| | — |
| | — |
| | — |
| |
| | Total securitized assets | 1,032,126 |
| | 1,075,990 |
| | 16.9 | % | | 2.2 | % | | 301,590 |
| | 510,704 |
| | 66,653 |
| | 20,162 |
| | 176,881 |
| | — |
| |
| | Total fixed maturity investments | 4,625,807 |
| | 4,748,863 |
| | 74.7 | % | | 1.6 | % | | 680,892 |
| | 2,429,172 |
| | 844,698 |
| | 322,527 |
| | 455,719 |
| | 15,855 |
| |
| | | | | 100.0 | % | | | | | | 14.3 | % | | 51.2 | % | | 17.8 | % | | 6.8 | % | | 9.6 | % | | 0.3 | % | |
| | Equity investments trading | | | 58,186 |
| | 0.9 | % | | | | — |
| | — |
| | — |
| | — |
| | — |
| | 58,186 |
| |
| | | | | 100.0 | % | | | | | | — | % | | — | % | | — | % | | — | % | | — | % | | 100.0 | % | |
| | Other investments | | | | | | | | | | | | | | | | | | | | |
| | Private equity partnerships | | | 344,669 |
| | 5.4 | % | | | | — |
| | — |
| | — |
| | — |
| | — |
| | 344,669 |
| |
| | Senior secured bank loan funds | | | 202,929 |
| | 3.2 | % | | | | — |
| | — |
| | — |
| | — |
| | 172,334 |
| | 30,595 |
| |
| | Catastrophe bonds | | | 91,310 |
| | 1.4 | % | | | | — |
| | — |
| | — |
| | — |
| | 91,310 |
| | — |
| |
| | Hedge funds | | | 5,803 |
| | 0.1 | % | | | | — |
| | — |
| | — |
| | — |
| | — |
| | 5,803 |
| |
| | Total other investments | | | 644,711 |
| | 10.1 | % | | | | — |
| | — |
| | — |
| | — |
| | 263,644 |
| | 381,067 |
| |
| | | | | 100.0 | % | | | | | | — | % | | — | % | | — | % | | — | % | | 40.9 | % | | 59.1 | % | |
| | Investments in other ventures | | | 87,724 |
| | 1.4 | % | | | | — |
| | — |
| | — |
| | — |
| | — |
| | 87,724 |
| |
| | | | | 100.0 | % | | | | | | — | % | | — | % | | — | % | | — | % | | — | % | | 100.0 | % | |
| | Total investment portfolio | | | $ | 6,360,647 |
| | 100.0 | % | | | | $ | 1,434,775 |
| | $ | 2,492,909 |
| | $ | 844,861 |
| | $ | 325,898 |
| | $ | 719,372 |
| | $ | 542,832 |
| |
| | | |
| | 100.0 | % | | |
| | |
| | 22.6 | % | | 39.2 | % | | 13.3 | % | | 5.1 | % | | 11.3 | % | | 8.5 | % | |
| | | | | | | | | | | | | | | | | | | | | | |
| |
| (1) | The credit ratings included in this table are those assigned by S&P. When ratings provided by S&P were not available, ratings from other nationally recognized rating agencies were used. The Company has grouped short term investments with an A-1+ and A-1 short term issue credit rating as AAA, short term investments with A-2 short term issue credit rating as AA and short term investments with an A-3 short term issue credit rating as A. |
Fixed Maturity Investments and Short Term Investments
At December 31, 2012, our fixed maturity investments and short term investment portfolio had a dollar-weighted average credit quality rating of AA (2011 – AA) and a weighted average effective yield of 1.4% (2011 – 1.9%). At December 31, 2012, our non-investment grade and not rated fixed maturity investments totaled $471.6 million or 9.9% of our fixed maturity investments (2011 - $199.1 million or 4.5%, respectively). In addition, within our other investments category we have several funds that invest in non-investment grade and not rated fixed income securities and non-investment grade cat-linked securities. At December 31, 2012, the funds that invest in non-investment grade and not rated fixed income securities and non-investment grade cat-linked securities totaled $294.2 million (2011 – $328.9 million).
At December 31, 2012, we had $821.2 million of short term investments (2011 – $905.5 million). Short term investments are managed as part of our investment portfolio and have a maturity of one year or less when purchased. Short term investments are carried at amortized cost, which approximates fair value.
Our duration for our fixed maturity investments and short term investments at December 31, 2012 was 2.2 years (2011 – 2.6 years). From time to time, we may reevaluate the duration of our portfolio in light of the duration of our liabilities and market conditions.
As with other fixed income investments, the value of our fixed maturity investments will fluctuate with changes in the interest rate environment and when changes occur in the overall investment market and in overall economic conditions. Additionally, our differing asset classes expose us to other risks which could cause a reduction in the value of our investments. Examples of some of these risks include:
| |
| • | Changes in the overall interest rate environment can expose us to "prepayment risk" on our mortgage-backed investments. When interest rates decline, consumers will generally make prepayments on their mortgages and, as a result, our investments in mortgage-backed securities will be repaid to us more quickly than we might have originally anticipated. When we receive these prepayments, our opportunities to reinvest these proceeds back into the investment markets will likely be at reduced interest rates. Conversely, when interest rates increase, consumers will generally make fewer prepayments on their mortgages and, as a result, our investments in mortgage-backed securities will be repaid to us less quickly than we might have originally anticipated. This will increase the duration of our portfolio, which is disadvantageous to us in a rising interest rate environment. |
| |
| • | Our investments in mortgage-backed securities are also subject to default risk. This risk is due in part to defaults on the underlying securitized mortgages, which would decrease the market value of the investment and be disadvantageous to us. Similar risks apply to other asset-backed securities in which we may invest from time to time. |
| |
| • | Our investments in debt securities of other corporations are exposed to losses from insolvencies of these corporations, and our investment portfolio can also deteriorate based on reduced credit quality of these corporations. We are also exposed to the impact of widening credit spreads even if specific securities are not downgraded. |
| |
| • | Our investments in asset-backed securities are subject to prepayment risks, as noted above, and to the structural risks of these securities. The structural risks primarily emanate from the priority of each security in the issuer's overall capital structure. We are also exposed to the impact of widening credit spreads. |
| |
| • | Within our other investments category, we have several funds that invest in non-investment grade fixed income securities as well as securities denominated in foreign currencies. These investments expose us to losses from insolvencies and other credit-related issues. We are also exposed to fluctuations in foreign exchange rates that may result in realized losses to us if our exposures are not hedged or if our hedging strategies are not effective and also to widening of credit spreads. |
The following table summarizes the fair value by contractual maturity of our fixed maturity investment portfolio at the dates indicated. Actual maturities may differ from contractual maturities because borrowers may have the right to call or prepay obligations with or without penalty.
|
| | | | | | | | | | | | | | | |
| | | | | | | | | | |
| | At December 31, | 2012 | | 2011 | |
| | (in thousands, except percentages) | | | | | | | | |
| | Due in less than one year | $ | 433,074 |
| | 9.1 | % | | $ | 619,845 |
| | 14.0 | % | |
| | Due after one through five years | 2,389,856 |
| | 50.3 | % | | 2,035,383 |
| | 45.9 | % | |
| | Due after five through ten years | 711,844 |
| | 15.0 | % | | 742,050 |
| | 16.7 | % | |
| | Due after ten years | 138,099 |
| | 2.9 | % | | 145,963 |
| | 3.3 | % | |
| | Mortgage-backed | 1,063,036 |
| | 22.4 | % | | 872,249 |
| | 19.7 | % | |
| | Asset-backed | 12,954 |
| | 0.3 | % | | 18,027 |
| | 0.4 | % | |
| | Total fixed maturity investments, at fair value | $ | 4,748,863 |
| | 100.0 | % | | $ | 4,433,517 |
| | 100.0 | % | |
| | | | | | | | | | |
Corporate Fixed Maturity Investments
The following table summarizes the composition of the fair value of our corporate fixed maturity investments at the date indicated by ratings as assigned by S&P, or Moody's and/or other rating agencies when S&P ratings were not available. |
| | | | | | | | | | | | | | | | | | | | | | | | | | | | | |
| | | | | | | | | | | | | | | | |
| | At December 31, 2012 | | | | | | | | | | | | | |
| | (in thousands) | | | | | | | | | | | | | | |
| | Sector | Total | | AAA | | AA | | A | | BBB | | Non-Investment Grade | | Not Rated | |
| | Financials | $ | 697,161 |
| | $ | 15,908 |
| | $ | 148,549 |
| | $ | 417,084 |
| | $ | 61,095 |
| | $ | 41,534 |
| | $ | 12,991 |
| |
| | Industrial, utilities and energy | 342,474 |
| | 6,908 |
| | 32,997 |
| | 125,294 |
| | 103,725 |
| | 71,852 |
| | 1,698 |
| |
| | Communications and technology | 229,444 |
| | 1,656 |
| | 13,866 |
| | 106,747 |
| | 51,493 |
| | 55,682 |
| | — |
| |
| | Consumer | 157,828 |
| | — |
| | 11,036 |
| | 54,766 |
| | 37,648 |
| | 53,533 |
| | 845 |
| |
| | Health care | 110,827 |
| | — |
| | 52,523 |
| | 30,802 |
| | 3,372 |
| | 24,130 |
| | — |
| |
| | Basic materials | 60,068 |
| | — |
| | — |
| | 22,649 |
| | 21,258 |
| | 16,083 |
| | 78 |
| |
| | Other | 17,405 |
| | 889 |
| | 4,570 |
| | 7,708 |
| | 2,007 |
| | 2,231 |
| | — |
| |
| | Total corporate fixed maturity investments, at fair value (1) | $ | 1,615,207 |
| | $ | 25,361 |
| | $ | 263,541 |
| | $ | 765,050 |
| | $ | 280,598 |
| | $ | 265,045 |
| | $ | 15,612 |
| |
| | | | | | | | | | | | | | | | |
| |
| (1) | Excludes non-U.S. government-backed corporate fixed maturity investments, at fair value.
|
The following table summarizes the composition of the fair value of the fixed maturity investments and short term investments of our top ten corporate issuers at the date indicated. |
| | | | | | | | | | | | | |
| | | | | | | | |
| | At December 31, 2012 | | | | | | |
| | (in thousands) | | |
| | Issuer | Total | | Short term investments | | Fixed maturity investments | |
| | JP Morgan Chase & Co. | $ | 64,532 |
| | $ | 1,552 |
| | $ | 62,980 |
| |
| | General Electric Company | 56,039 |
| | — |
| | 56,039 |
| |
| | Bank of America Corp. | 53,290 |
| | 163 |
| | 53,127 |
| |
| | Goldman Sachs Group Inc. | 52,126 |
| | — |
| | 52,126 |
| |
| | Citigroup Inc. | 47,160 |
| | — |
| | 47,160 |
| |
| | HSBC Holdings PLC | 37,872 |
| | — |
| | 37,872 |
| |
| | Morgan Stanley | 32,984 |
| | — |
| | 32,984 |
| |
| | AT&T Inc. | 27,881 |
| | — |
| | 27,881 |
| |
| | BP PLC | 21,920 |
| | — |
| | 21,920 |
| |
| | Wells Fargo & Co. | 20,587 |
| | — |
| | 20,587 |
| |
| | Total (1) | $ | 414,391 |
| | $ | 1,715 |
| | $ | 412,676 |
| |
| | | | | | | | |
| |
| (1) | Excludes non-U.S. government-backed corporate fixed maturity investments, repurchase agreements and commercial paper, at fair value.
|
European Debt Exposures
The table below presents our exposure by country to European government and corporate issuers within our fixed maturity and short term investments portfolio, further segregated by sector, subsector and credit rating. For corporate issuers, the country of issuer is determined by assessing both the location of principal management as well as the primary country of business activity.
|
| | | | | | | | | | | | | | | | | | | | | | | | | | | | | | | | | | | | | | | | | |
| | | | | | | | | | | | | | | | | | | | | | |
| | | | | | | Sector | | Credit Rating |
| | At December 31, 2012 | Amortized
Cost (1) | | Fair Value (1) | | Non-U.S. Government (Sovereign debt) | | Non-U.S. Government-backed Corporate | | Corporate | | AAA | | AA | | A | | BBB | | Non-Investment Grade | |
| | (in thousands) | | | | | | | | | | | | | | | | | | | | |
| | Country of Issuer | | | | | | | | | | | | | | | | | | | | |
| | Non-Eurozone | | | | | | | | | | | | | | | | | | | | |
| | United Kingdom | $ | 135,475 |
| | $ | 140,486 |
| | $ | 10,296 |
| | $ | 26,730 |
| | $ | 103,460 |
| | $ | 37,026 |
| | $ | 19,500 |
| | $ | 68,618 |
| | $ | 10,467 |
| | $ | 4,875 |
| |
| | Sweden | 27,751 |
| | 28,531 |
| | — |
| | 10,155 |
| | 18,376 |
| | 10,155 |
| | 17,846 |
| | 530 |
| | — |
| | — |
| |
| | Norway | 26,068 |
| | 26,799 |
| | — |
| | 8,047 |
| | 18,752 |
| | 11,260 |
| | 7,368 |
| | 988 |
| | — |
| | 7,183 |
| |
| | Denmark | 36,256 |
| | 36,498 |
| | 7,787 |
| | 28,590 |
| | 121 |
| | 36,498 |
| | — |
| | — |
| | — |
| | — |
| |
| | Switzerland | 42,771 |
| | 44,157 |
| | — |
| | — |
| | 44,157 |
| | — |
| | 19,197 |
| | 23,886 |
| | 1,074 |
| | — |
| |
| | Russian Federation | 14,139 |
| | 15,220 |
| | 4,628 |
| | — |
| | 10,592 |
| | — |
| | — |
| | — |
| | 14,217 |
| | 1,003 |
| |
| | Other | 8,814 |
| | 9,441 |
| | 7,419 |
| | — |
| | 2,022 |
| | — |
| | — |
| | 1,372 |
| | 3,930 |
| | 4,139 |
| |
| | Non-Eurozone Total | $ | 291,274 |
| | $ | 301,132 |
| | $ | 30,130 |
| | $ | 73,522 |
| | $ | 197,480 |
| | $ | 94,939 |
| | $ | 63,911 |
| | $ | 95,394 |
| | $ | 29,688 |
| | $ | 17,200 |
| |
| | Eurozone | | | | | | | | | | | | | | | | | | | | |
| | Netherlands | $ | 119,744 |
| | $ | 122,049 |
| | $ | 8,134 |
| | $ | 79,944 |
| | $ | 33,971 |
| | $ | 89,123 |
| | $ | 11,532 |
| | $ | 18,688 |
| | $ | 1,552 |
| | $ | 1,154 |
| |
| | France | 45,042 |
| | 46,149 |
| | — |
| | 23,824 |
| | 22,325 |
| | — |
| | 28,978 |
| | 16,148 |
| | 517 |
| | 506 |
| |
| | Austria | 40,214 |
| | 40,342 |
| | 7,721 |
| | 32,621 |
| | — |
| | — |
| | 40,342 |
| | — |
| | — |
| | — |
| |
| | Germany | 57,900 |
| | 58,645 |
| | 142 |
| | 29,447 |
| | 29,056 |
| | 32,997 |
| | — |
| | 22,345 |
| | 744 |
| | 2,559 |
| |
| | Finland | 21,352 |
| | 21,414 |
| | 21,414 |
| | — |
| | — |
| | 21,414 |
| | — |
| | — |
| | — |
| | — |
| |
| | Luxembourg | 6,249 |
| | 6,167 |
| | — |
| | — |
| | 6,167 |
| | — |
| | — |
| | — |
| | — |
| | 6,167 |
| |
| | Belgium | 17,433 |
| | 17,640 |
| | — |
| | — |
| | 17,640 |
| | — |
| | — |
| | 14,938 |
| | 2,702 |
| | — |
| |
| | | 307,934 |
| | 312,406 |
| | 37,411 |
| | 165,836 |
| | 109,159 |
| | 143,534 |
| | 80,852 |
| | 72,119 |
| | 5,515 |
| | 10,386 |
| |
| | Ireland | 1,042 |
| | 1,049 |
| | — |
| | — |
| | 1,049 |
| | — |
| | — |
| | — |
| | 1,049 |
| | — |
| |
| | Italy | 834 |
| | 902 |
| | — |
| | — |
| | 902 |
| | — |
| | — |
| | — |
| | — |
| | 902 |
| |
| | Spain | 4,047 |
| | 4,110 |
| | — |
| | — |
| | 4,110 |
| | — |
| | — |
| | 1,341 |
| | 674 |
| | 2,095 |
| |
| | Greece | — |
| | — |
| | — |
| | — |
| | — |
| | — |
| | — |
| | — |
| | — |
| | — |
| |
| | Portugal | — |
| | — |
| | — |
| | — |
| | — |
| | — |
| | — |
| | — |
| | — |
| | — |
| |
| | | $ | 5,923 |
| | $ | 6,061 |
| | $ | — |
| | $ | — |
| | $ | 6,061 |
| | $ | — |
| | $ | — |
| | $ | 1,341 |
| | $ | 1,723 |
| | $ | 2,997 |
| |
| | Eurozone Total | $ | 313,857 |
| | $ | 318,467 |
| | $ | 37,411 |
| | $ | 165,836 |
| | $ | 115,220 |
| | $ | 143,534 |
| | $ | 80,852 |
| | $ | 73,460 |
| | $ | 7,238 |
| | $ | 13,383 |
| |
| | European Issuer Total | $ | 605,131 |
| | $ | 619,599 |
| | $ | 67,541 |
| | $ | 239,358 |
| | $ | 312,700 |
| | $ | 238,473 |
| | $ | 144,763 |
| | $ | 168,854 |
| | $ | 36,926 |
| | $ | 30,583 |
| |
| | | | | | | | | | | | | | | | | | | | | | |
| | Subsector | | | | | | | | | | | | | | | | | | | | |
| | Non-US Government | $ | 65,710 |
| | $ | 67,541 |
| | $ | 67,541 |
| | $ | — |
| | $ | — |
| | $ | 47,774 |
| | $ | 7,721 |
| | $ | 1,371 |
| | $ | 6,924 |
| | $ | 3,751 |
| |
| | Financial | 336,178 |
| | 343,669 |
| | — |
| | 198,747 |
| | 144,922 |
| | 174,077 |
| | 70,397 |
| | 81,941 |
| | 8,252 |
| | 9,002 |
| |
| | Industrial, Utilities & Energy | 92,963 |
| | 95,659 |
| | — |
| | 23,990 |
| | 71,669 |
| | — |
| | 44,018 |
| | 41,247 |
| | 7,574 |
| | 2,820 |
| |
| | Other | 110,280 |
| | 112,730 |
| | — |
| | 16,621 |
| | 96,109 |
| | 16,622 |
| | 22,627 |
| | 44,295 |
| | 14,176 |
| | 15,010 |
| |
| | Total | $ | 605,131 |
| | $ | 619,599 |
| | $ | 67,541 |
| | $ | 239,358 |
| | $ | 312,700 |
| | $ | 238,473 |
| | $ | 144,763 |
| | $ | 168,854 |
| | $ | 36,926 |
| | $ | 30,583 |
| |
| | | | | | | | | | | | | | | | | | | | | | |
| |
| (1) | Included in amortized cost and fair value is $0.2 million and $0.3 million, respectively, of fixed maturity investments available for sale. |
At December 31, 2012, we held fixed maturity and short term investments with a fair value of $619.6 million and weighted average credit rating of AA in European issuers, including holdings of $67.5 million, $239.4 million and $312.7 million related to non-U.S. government (Sovereign debt), non-U.S. government backed corporates and corporates, respectively. Our holdings of fixed maturity investment and short term investments in Ireland, Italy, Spain, Greece and Portugal was comprised entirely of corporate securities and had a fair value of $6.1 million at December 31, 2012.
At December 31, 2012, we had European foreign currency forward contracts outstanding, primarily related to the Euro, British pound sterling and Norwegian krone, with $103.5 million in notional long positions, $130.7 million in notional short positions and fair value liability position of $0.1 million. From time to time, we enter into foreign currency forward contracts to economically hedge our exposure to currency fluctuations from certain non-U.S. denominated investments. We typically use these hedges to hedge fixed maturity investments with exposure to European currencies. In certain instances, we may assume foreign exchange risk as part of our investment strategy.
In addition to our Eurozone sovereign debt exposure noted above, we have investments in private equity funds, hedge funds, bank loan funds and a non-U.S. dollar fixed income fund that may have exposure to European sovereign debt. We also have exposure to European sovereign debt directly and indirectly through our underwriting portfolio. This portfolio contains insurance and reinsurance risks that we have assumed and ceded in respect of risks related to companies located within Europe, to companies that provide coverage within Europe, and to companies that have investments in European sovereign debt. We underwrite these risks in accordance with our underwriting standards as described in "Item 1. Business, Underwriting and Enterprise Risk Management". As a result of the underwriting operations noted above, our cash and cash equivalents, premiums receivable, reinsurance recoverable, reserve for claims and claim expenses may be indirectly impacted by European debt exposure. In addition, see "Note. 19 Derivative Instruments of our Notes to Consolidated Financial Statements" for additional information regarding underwriting operations related foreign currency contracts outstanding related to the balances noted above. We will continue to monitor our Eurozone risks, but to date, the financial turmoil within Europe has not materially impacted our results of operations or financial condition.
Other Investments
The table below shows our portfolio of other investments:
|
| | | | | | | | | | | | | |
| | | | | | | | |
| | At December 31, | 2012 | | 2011 | | Change | |
| | (in thousands) | | | | | | |
| | Private equity partnerships | $ | 344,669 |
| | $ | 367,909 |
| | $ | (23,240 | ) | |
| | Senior secured bank loan funds | 202,929 |
| | 257,870 |
| | (54,941 | ) | |
| | Catastrophe bonds | 91,310 |
| | 70,999 |
| | 20,311 |
| |
| | Hedge funds | 5,803 |
| | 21,344 |
| | (15,541 | ) | |
| | Non-U.S. fixed income funds | — |
| | 28,862 |
| | (28,862 | ) | |
| | Miscellaneous other investments | — |
| | 2,000 |
| | (2,000 | ) | |
| | Total other investments | $ | 644,711 |
| | $ | 748,984 |
| | $ | (104,273 | ) | |
| | | | | | | | |
We account for our other investments at fair value in accordance with FASB ASC Topic Financial Instruments. The fair value of certain of our fund investments, which principally include hedge funds, private equity funds, senior secured bank loan funds and non-U.S. fixed income funds, are recorded on our balance sheet in other investments, and is generally established on the basis of the net valuation criteria established by the managers of such investments, if applicable. The net valuation criteria established by the managers of such investments is established in accordance with the governing documents of such investments. Many of our fund investments are subject to restrictions on redemptions and sales which are determined by the governing documents and limit our ability to liquidate these investments in the short term. Certain of our fund managers, fund administrators, or both, are unable to provide final fund valuations as of our current reporting date. The typical reporting lag experienced by us to receive a final net asset value report is one month for hedge funds, senior secured bank loan funds and non-U.S. fixed income funds and three months for private equity funds, although, in the past, in respect of certain of our private equity funds, we have on occasion experienced delays of up to six months at year end, as the private equity funds typically complete their respective year-end audits before releasing their final net asset value statements.
In circumstances where there is a reporting lag between the current period end reporting date and the reporting date of the latest fund valuation, we estimate the fair value of these funds by starting with the prior month or quarter-end fund valuations, adjusting these valuations for actual capital calls, redemptions or distributions, as well as the impact of changes in foreign currency exchange rates, and then estimating the
return for the current period. In circumstances in which we estimate the return for the current period, all information available to us is utilized. This principally includes preliminary estimates reported to us by our fund managers, obtaining the valuation of underlying portfolio investments where such underlying investments are publicly traded and therefore have a readily observable price, using information that is available to us with respect to the underlying investments, reviewing various indices for similar investments or asset classes, as well as estimating returns based on the results of similar types of investments for which we have obtained reported results, or other valuation methods, where possible. Actual final fund valuations may differ, perhaps materially so, from our estimates and these differences are recorded in our statement of operations in the period in which they are reported to us as a change in estimate. Included in net investment income for the year ended December 31, 2012 is a loss of $4.7 million (2011 - loss of $1.4 million, 2010 - income of $5.3 million) representing the change in estimate during the period related to the difference between our estimated net investment income due to the lag in reporting discussed above and the actual amount as reported in the final net asset values provided by our fund managers.
Our estimate of the fair value of catastrophe bonds are based on quoted market prices, or when such prices are not available, by reference to broker or underwriter bid indications. Refer to "Note 6. Fair Value Measurements" in our notes to the consolidated financial statements for additional information regarding the fair value of measurement of our other investments.
Interest income, income distributions and realized and unrealized gains (losses) on other investments are included in net investment income and resulted in $74.4 million of net investment income for the year ended December 31, 2012 (2011 - $36.0 million, 2010 - $103.7 million). Of this amount, $38.2 million relates to net unrealized gains (2011 - unrealized gains of $12.7 million, 2010 - unrealized gains of $57.5 million).
We have committed capital to private equity partnerships and other entities of $708.9 million, of which $655.5 million has been contributed at December 31, 2012. Our remaining commitments to these investments at December 31, 2012 totaled $133.2 million. In the future, we may enter into additional commitments in respect of private equity partnerships or individual portfolio company investment opportunities.
Measuring the Fair Value of Other Investments Using Net Asset Valuations
The table below shows our portfolio of other investments measured using net asset valuations: |
| | | | | | | | | | | | | | | |
| | | | | | | | | | | | |
| | At December 31, 2012 | Fair Value | | Unfunded
Commitments | | Redemption Frequency | | Redemption
Notice Period (Minimum Days) | | Redemption
Notice Period (Maximum Days) | |
| | Private equity partnerships | $ | 344,669 |
| | $ | 91,762 |
| | See below | | See below | | See below | |
| | Senior secured bank loan funds | 202,929 |
| | 17,506 |
| | See below | | See below | | See below | |
| | Hedge funds | 5,803 |
| | — |
| | See below | | See below | | See below | |
| | Total other investments measured using net asset valuations | $ | 553,401 |
| | $ | 109,268 |
| | | | | | | |
| | | | | | | | | | | | |
Private equity partnerships – Included in our investments in private equity partnerships are alternative asset limited partnerships (or similar corporate structures) that invest in certain private equity asset classes including U.S. and global leveraged buyouts; mezzanine investments; distressed securities; real estate; and oil, gas and power. The fair values of the investments in this category have been estimated using the net asset value of the investments, as discussed in detail above. We generally have no right to redeem our interest in any of these private equity partnerships in advance of dissolution of the applicable partnership. Instead, the nature of these investments is that distributions are received by us in connection with the liquidation of the underlying assets of the applicable limited partnership. It is estimated that the majority of the underlying assets of the limited partnerships would liquidate over 7 to 10 years from inception of the limited partnership.
Senior secured bank loan funds – Our investment in senior secured bank loan funds includes funds that invest primarily in bank loans and other senior debt instruments. The fair values of the investments in this category have been determined using the net asset value per share of the funds or the estimated net asset per share where applicable, as discussed in detail above. Investments of $172.3 million are redeemable, in part on a monthly basis, or in whole over a three month period.
We also have $30.6 million invested in closed end funds which invest in loans. We have no right to require redemption of our investment in these funds.
Hedge funds – We invest in hedge funds that pursue multiple strategies. The fair values of the investments in this category are estimated using the net asset value per share of the funds, as discussed in detail above. Our investments in hedge funds at December 31, 2012, are $5.8 million of so called "side pocket" investments which are not redeemable at the option of the shareholder. We fully redeemed the remaining non-side pocket investments in hedge funds in June 2012. We have retained our interest in the side pocket investments until the underlying investments attributable to such side pockets are liquidated, realized or deemed realized at the discretion of the fund manager.
Investments in Other Ventures, under Equity Method
The table below shows our investments in other ventures, under equity method:
|
| | | | | | | | | | | | | | | | | | | | | | | |
| | | | | | | | | | | | | | |
| | At December 31, | 2012 | | 2011 | |
| | (in thousands, except percentages) | Investment | | Ownership % | | Carrying Value | | Investment | | Ownership % | | Carrying Value | |
| | THIG | $ | 50,000 |
| | 25.0 | % | | $ | 28,303 |
| | $ | 50,000 |
| | 25.0 | % | | $ | 32,645 |
| |
| | Tower Hill | 10,000 |
| | 28.6 | % | | 13,969 |
| | 10,000 |
| | 28.6 | % | | 14,173 |
| |
| | Tower Hill Signature | 500 |
| | 25.0 | % | | 896 |
| | 500 |
| | 25.0 | % | | — |
| |
| | Total Tower Hill Companies | 60,500 |
| | | | 43,168 |
| | 60,500 |
| | | | 46,818 |
| |
| | Top Layer Re | 65,375 |
| | 50.0 | % | | 36,664 |
| | 65,375 |
| | 50.0 | % | | 15,872 |
| |
| | Other | 8,226 |
| | 38.8 | % | | 7,892 |
| | 6,000 |
| | 40.0 | % | | 8,024 |
| |
| | Total investments in other ventures, under equity method | $ | 134,101 |
| | | | $ | 87,724 |
| | $ | 131,875 |
| | | | $ | 70,714 |
| |
| | | | | | | | | | | | | | |
Top Layer Re incurred net claims and claims expenses from the 2011 New Zealand and Tohoku earthquakes; subsequently, the Company contributed $38.5 million of additional paid-in capital to Top Layer Re to replenish its capital position.
Our equity in earnings of the Tower Hill Companies are reported one quarter in arrears.
Effects of Inflation
The potential exists, after a catastrophe loss, for the development of inflationary pressures in a local economy. The anticipated effects on us are considered in our catastrophe loss models. Our estimates of the potential effects of inflation are also considered in pricing and in estimating reserves for unpaid claims and claim expenses. In addition, it is possible that the risk of general economic inflation has increased which could, among other things, cause claims and claim expenses to increase and also impact the performance of our investment portfolio. The actual effects of this potential increase in inflation on our results cannot be accurately known until, among other items, claims are ultimately settled. The onset, duration and severity of an inflationary period cannot be estimated with precision.
Off-Balance Sheet and Special Purpose Entity Arrangements
At December 31, 2012, we have not entered into any off-balance sheet arrangements, as defined by Item 303(a)(4) of Regulation S-K.
Contractual Obligations
In the normal course of its business, the Company is a party to a variety of contractual obligations and these are considered by the Company when assessing its liquidity requirements.
The table below shows our contractual obligations: |
| | | | | | | | | | | | | | | | | | | | | |
| | | | | | | | | | | | |
| | At December 31, 2012 | Total | | Less than 1 year | | 1-3 years | | 3-5 years | | More than 5 years | |
| | (in thousands) | | | | | | | | | | |
| | Long term debt obligations (1) | | | | | | | | | | |
| | 5.875% Senior Notes | $ | 100,740 |
| | $ | 100,740 |
| | $ | — |
| | $ | — |
| | $ | — |
| |
| | 5.75% Senior Notes | 363,539 |
| | 14,375 |
| | 28,750 |
| | 38,750 |
| | 281,664 |
| |
| | Private equity and investment commitments (2) | 133,161 |
| | 133,161 |
| | — |
| | — |
| | — |
| |
| | Operating lease obligations | 26,267 |
| | 6,829 |
| | 10,647 |
| | 5,777 |
| | 3,014 |
| |
| | Capital lease obligations | 43,082 |
| | 3,017 |
| | 6,034 |
| | 5,434 |
| | 28,597 |
| |
| | Payable for investments purchased | 278,787 |
| | 278,787 |
| | — |
| | — |
| | — |
| |
| | Reserve for claims and claim expenses (3) | 1,879,377 |
| | 642,819 |
| | 659,865 |
| | 230,006 |
| | 346,687 |
| |
| | Renaissance Trading credit facility | 2,436 |
| | 2,436 |
| | — |
| | — |
| | — |
| |
| | Other | 7,324 |
| | 5,915 |
| | 1,206 |
| | 203 |
| | — |
| |
| | Total contractual obligations | $ | 2,834,713 |
| | $ | 1,188,079 |
| | $ | 706,502 |
| | $ | 280,170 |
| | $ | 659,962 |
| |
| | | | | | | | | | | | |
| |
| (1) | Includes contractual interest payments. |
| |
| (2) | The private equity and investment commitments do not have a defined contractual commitment date and we have therefore included them in the less than one year category. |
| |
| (3) | We caution the reader that the information provided above related to estimated future payment dates of our reserves for claims and claim expenses is not prepared or utilized for internal purposes and that we currently do not estimate the future payment dates of claims and claim expenses. Because of the nature of the coverages that we provide, the amount and timing of the cash flows associated with our policy liabilities will fluctuate, perhaps significantly, and therefore are highly uncertain. We have based our estimates of future claim payments upon benchmark industry payment patterns, drawing upon available relevant sources of loss and allocated loss adjustment expense development data. These benchmarks are revised periodically as new trends emerge. We believe that it is likely that this benchmark data will not be predictive of our future claim payments and that material fluctuations can occur due to the nature of the losses which we insure and the coverages which we provide. |
In certain circumstances, many of our contractual obligations may be accelerated to dates other than those reflected in the table, due to defaults under the agreements governing those obligations (including pursuant to cross-default provisions in such agreements) or in connection with certain changes in control of the Company, if applicable. In addition, in connection with any such default under the agreement governing these obligations, in certain circumstances, these obligations may bear an increased interest rate or be subject to penalties as a result of such a default.
CURRENT OUTLOOK
Catastrophe Exposed Market Developments
Notwithstanding the severe global catastrophic losses during 2011, the advent in late 2012 of storm Sandy, one of the most significant insured losses on record, and the increased frequency of severe weather events during this period in many high-insurance-penetration regions, the global insurance and reinsurance markets entered 2013 with near-record levels of industry wide capital held by private market insurers and reinsurers, and diminished growth of demand for many coverages and solutions, outside of the impacted regions and in respect of certain products and lines. During the January 2013 and June and July 2012 reinsurance renewals, we believe that supply, principally from traditional market participants and complemented by alternative capital providers, more than offset market demand, resulting in a dampening of overall market pricing on a risk-adjusted basis, except for, in general, loss impacted treaties and contracts. Moreover, we believe that many of the positive factors that had previously impacted market conditions have now been absorbed by the market and, we believe, are unlikely to drive further improvement in our core catastrophe-exposed markets absent new developments. Moreover, we believe that supply of capital remains at historically high levels, from both traditional and alternative market
participants, and may well increase in respect of the June and July 2013 renewals. Accordingly, we cannot assure you that the recent level of market demand and renewals will be sustained, or that we can continue to improve the size and portfolio quality of our book of business.
According to the National Oceanic and Atmospheric Administration ("NOAA"), whose records date back to 1895, 2012 continued a period of high Atlantic basin hurricane activity, with 19 named storms, of which 10 became hurricanes, with one major hurricane. In late October, storm Sandy impacted the Mid-Atlantic and Northeast coasts of the U.S., ultimately making landfall in New Jersey, with tropical storm force or greater winds at landfall extending over approximately 550,000 square miles. In addition, storm Sandy generated significant storm surge, which contributed substantially to loss of life, widespread power outages, significant disruptions to travel and devastating flooding throughout a number of states, including New York and New Jersey. Storm Sandy is currently estimated to have been the largest Atlantic hurricane in diameter ever recorded and to have produced the lowest barometric pressure readings for an Atlantic windstorm north of North Carolina. In addition, according to NOAA, 2012 was the hottest year ever recorded in the U.S., continuing a period of increasing air and water temperatures at measured locations. Among other things, the extreme weather experienced, particularly including the severe and ongoing drought conditions throughout most of the Midwestern region of the U.S., adversely impacted the production of a range of crops, including those subject to the U.S. federal government's multi-peril crop insurance program.
General Economic Conditions
Meaningful uncertainty remains regarding the strength, duration and comprehensiveness of any economic recovery in the U.S. and our other key markets. In particular, global economic markets, including many of the key markets which we serve, may continue to be adversely impacted by the financial and fiscal instability of several European jurisdictions and, increasingly, the Eurozone market as a whole. Accordingly, we continue to believe that meaningful risk remains for continued uncertainty or disruptions in general economic and financial market conditions, which could give rise to increased economic uncertainty, or to further deterioration of economic conditions. Moreover, if economic growth were to return, such growth may be only at a comparably suppressed rate for a relatively extended period of time. Declining or weak economic conditions could reduce demand for the products sold by us or our customers, or our overall ability to write business at risk-adequate rates could weaken. In addition, persistent low levels of economic activity could adversely impact other areas of our financial performance, such as by contributing to unforeseen premium adjustments, mid-term policy cancellations or commutations, or asset devaluation. Any of the foregoing or other outcomes of a prolonged period of relative economic weakness could adversely impact our financial position or results of operations. In addition, during a period of extended economic weakness, we believe our consolidated credit risk, reflecting our counterparty dealings with customers, agents, brokers, retrocessionaires, capital providers and parties associated with our investment portfolio, among others, is likely to be increased. Several of these risks could materialize, and our financial results could be negatively impacted, even after the end of any economic downturn.
Moreover, we continue to monitor the risk that our principal markets will experience increased inflationary conditions, which would, among other things, cause costs related to our claims and claim expenses to increase, and impact the performance of our investment portfolio. The onset, duration and severity of an inflationary period cannot be estimated with precision. The sovereign debt crisis in Europe and the related financial restructuring efforts has, among other factors, made it more difficult to predict the inflationary environment.
Our catastrophe-exposed operations are subject to the ever-present potential for significant volatility in capital due primarily to our exposure to severe catastrophic events. Our specialty reinsurance portfolio is also exposed to emerging risks arising from the ongoing relative economic weakness, including with respect to a potential increase of claims in directors and officers, errors and omissions, surety, casualty clash and other lines of business.
Historically low interest rates and lower spreads have lowered the yields at which we invest our assets relative to historical levels. We expect these developments, combined with the current composition of our investment portfolio and other factors, to continue to put substantial downward pressure on our net investment income for the near term. In addition to impacting our reported net income, potential future losses on our investment portfolio, including potential future mark-to-market results, would adversely impact our equity capital. Moreover, as we invest cash from new premiums written or reinvest the proceeds of
invested assets that mature or that we choose to sell, the yield on our portfolio is impacted by the prevailing environment of comparably low yields. While it is possible yields will improve in future periods, we currently expect the challenging economic conditions to persist and we are unable to predict with certainty when conditions will substantially improve, or the pace of any such improvement.
Market Conditions and Competition
Leading global intermediaries and other sources have generally reported that the U.S. casualty reinsurance market continues to reflect a relatively soft pricing environment, with pockets of niche or specialty casualty renewals providing more attractive opportunities for stronger or well-positioned reinsurers. We anticipate that persistent low investment returns and, to a degree, balance sheet issues in the broader market may favorably impact demand for coverages on terms that we find attractive. However, we cannot assure you that any increased demand will indeed materialize or that we will be successful in consummating new or expanded transactions.
We currently anticipate a continued level of demand for our catastrophe coverages over coming periods, offset by ample and likely increasing supplies of private market capital. Even in the aftermath of storm Sandy and continued capital return initiatives by many market participants, the primary insurance and reinsurance sectors each continue to hold historically high levels of capital. While we do not anticipate industry capital to diminish, or the impairment of meaningful market participants, as a result of storm Sandy, it is possible that storm Sandy will contribute to enhanced perceptions of risk, particularly of mid-Atlantic and Northeastern windstorm exposure, the risks which arise from business interruption and commercial interruption exposure, and the penetration of U.S. flood risk in the private insurance market. Moreover, it is possible consumer demand will increase compared to market expectations prior to storm Sandy. However, it is possible that none of these factors may be borne out or influence the market in any meaningful way; moreover, the relatively attractive prevailing market conditions for many of the products in which we specialize could in any case also be offset by adverse or unforeseen factors, including the availability of alternative capital and the high levels of capital held by traditional reinsurers. Renewal terms vary widely by insured account and our ability to shape our portfolio to improve its risk and return characteristics as estimated by us is subject to a range of competitive and commercial factors. While we believe that our strong relationships, and track record of superior claims paying ability and other client service will enable us to compete for the business we find attractive, we may not succeed in doing so; moreover, our relationships in emerging markets are not as developed as they are in our current core markets.
The market for our catastrophe reinsurance products is generally dynamic and volatile. The market dynamics noted above, increased or decreased catastrophe loss activity, and changes in the amount of capital in the industry can result in significant changes to the pricing, policy terms and demand for our catastrophe reinsurance products over a relatively short period of time. In addition, changes in state-sponsored catastrophe funds, or residual markets, which have generally grown dramatically in recent years, or the implementation of new government-subsidized or sponsored programs, can dramatically alter market conditions. We believe that the overall trend of increased frequency and severity of tropical cyclones experienced in recent years may continue for the foreseeable future. Increased understanding of the potential increase in frequency and severity of storms may contribute to increased demand for protection in respect of coastal risks which could impact pricing and terms and conditions in coastal areas over time. Overall, we expect higher property loss cost trends, driven by increased severity and by the potential for increased frequency, to continue in the future. At the same time, certain markets we target continue to be impacted by fundamental weakness experienced by primary insurers, due to ongoing economic weakness and, in many cases, inadequate primary insurance rate levels, including without limitation insurers operating on an admitted basis in Florida. These conditions, which occurred in a period characterized by relatively low insured catastrophic losses for these respective regions, have contributed to certain publicly announced instances of insolvency, regulatory supervision and other regulatory actions, and have weakened the ability of certain carriers to invest in reinsurance and other protections for coming periods, and in some cases to meet their existing premium obligations. It is possible that these dynamics will continue in future periods.
In addition, we continue to explore potential strategic transactions or investments, and other opportunities, from time to time that are presented to us or that we originate. In evaluating these potential investments and opportunities, we seek to improve the portfolio optimization of our business as a whole, to enhance our strategy, to achieve an attractive estimated return on equity in respect of investments, to develop or capitalize on a competitive advantage, and to source business opportunities that will not detract from our core operations.
Legislative and Regulatory Update
In August 2012, Congressman Albio Sires introduced the Taxpayers' Protection Act (HR 6477). The bill would establish a federal catastrophe fund where eligible states can purchase reinsurance directly from the federal government. In January 2013, Congresswoman Frederica Wilson introduced the Homeowners' Defense Act which would, if enacted, provide for the creation of (i) a federal reinsurance catastrophe fund; (ii) a federal consortium to facilitate qualifying state residual markets and catastrophe funds in securing reinsurance; and (iii) a federal bond guarantee program for state catastrophe funds in qualifying state residual markets. In January 2013, Congressman Dennis Ross introduced the Homeowners' Insurance Protection Act (HR 240). The bill would create a federal catastrophe reinsurance program to back up federal reinsurance programs.
If enacted, any of these bills, or legislation similar to these proposals, would, we believe, likely contribute to the growth of state entities offering below market priced insurance and reinsurance in a manner adverse to us and market participants more generally. While none of this legislation has been enacted to date, and although we believe such legislation will continue to be vigorously opposed, if adopted these bills would likely diminish the role of private market catastrophe reinsurers and could adversely impact our financial results, perhaps materially.
In June 2012, Congress passed the Biggert-Waters Flood Insurance Reform and Modernization Act of 2012, which provided for a five-year renewal of the NFIP and effected substantial reforms in the program. The NFIP had not been subject to a long-term renewal since 2004. Among other things, pursuant to this statute, the Federal Emergency Management Agency ("FEMA") is explicitly authorized to carry out initiatives to determine the capacity of private insurers, reinsurers, and financial markets to assume a greater portion of the flood risk exposure in the U.S., and to assess the capacity of the private reinsurance market to assume some of the program's risk. FEMA is required to submit a report on this assessment within six months of enactment. The bill also increased the annual limitation on program premium increases from 10% to 20% of the average of the risk premium rates for certain properties concerned; established a four-year phase-in, after the first year, in annual 20% increments, of full actuarial rates for a newly mapped risk premium rate area; instructed FEMA to establish new flood insurance rate maps; allows multi-family properties to purchase NFIP polices; and introduces minimum deductibles for flood claims. We believe that these reforms could increase the role of private risk-bearing capital in respect of U.S. flood perils, perhaps significantly. However, we cannot assure you that the bill will materially benefit private carriers, or that we will succeed in participating in any positive market developments that may transpire.
In 2007, the State of Florida enacted legislation to expand the Florida Hurricane Catastrophe Fund's ("FHCF") provision of below-market rate reinsurance to up to $28.0 billion per season (the "2007 Florida Bill"). In May of 2009, the Florida legislature enacted Bill No. CS/HB 1495 (the "2009 Bill"), which will gradually phase out $12.0 billion in optional reinsurance coverage under the FHCF over the succeeding five years. The 2009 Bill similarly allows the state-sponsored property insurer, Citizens Property Insurance Corporation ("Citizens"), to raise its rates up to 10% starting in 2010 and every year thereafter, until such time that it has sufficient funds to pay its claims and expenses. The rate increases and cut back on coverage by FHCF and Citizens are expected to support, over time, a relatively increased role of the private insurers in Florida, a market in which we have established substantial market share.
In May 2011, the Florida legislature passed Florida Senate bill 408 ("SB 408"), relating principally to property insurance. Among other things, SB 408 requires an increase in minimum capital and surplus for newly licensed Florida domestic insurers from $5.0 million to $15.0 million; institutes a 3-year claims filing deadline for new and reopened claims from the date of a hurricane or windstorm; allows an insurer to offer coverage where replacement cost value is paid, but initial payment is limited to actual cash value; allows admitted insurers to seek rate increases up to 15% to adjust for third party reinsurance costs; and institutes a range of reforms relating to various matters that have increased the costs of insuring sinkholes in Florida.
While we believe SB 408 should contribute over time to stabilization of the Florida market, legislation intended to further reform and stabilize Citizens was not passed in the 2011 or 2012 legislative sessions and is uncertain in 2013.
On February 16, 2012, the Florida Senate Banking and Insurance Committee approved, with one dissenting vote, legislation to reform the FHCF and solidify its financial fund. The bill provided for incremental reductions in the FHCF limit which admitted carriers are mandated to buy from the FHCF from an industry aggregate of $17.0 billion to $12.0 billion by 2015; would have reduced the 90% purchase option (the percentage of the FHCF mandatory coverage layer a company purchases) which is selected by most insurers to 75% by 2015; and would have increased the industry wide "retention", or deductible, from $7.3 to $8.0 billion. While the bill did not pass the full legislature in 2012, its sponsor has announced an intention to reintroduce the legislation in 2013. We cannot estimate the likelihood of enactment, or the possible final form of this or similar legislation.
We believe the 2007 Florida Bill caused a substantial decline in the private reinsurance and insurance markets in and relating to Florida, and contributed to the ongoing instability in the Florida primary insurance market, where many insurers have reported substantial and continuing losses from 2009 through 2012, an unusually low period for catastrophe losses in the state. Because of our position as one of the largest providers of catastrophe-exposed coverage, both on a global basis and in respect of the Florida market, the 2007 Florida Bill and the weakened financial position of Florida insurers may have a disproportionate adverse impact on us compared to other reinsurance market participants. The advent of a large windstorm, or of multiple smaller storms, could challenge the assessment-based claims paying capacity of Citizens and the FHCF. In May 2012, the FHCF Advisory Council approved official bonding capacity estimates in respect of the current contract year, reflecting the amount of post-catastrophe bonding currently estimated to be achievable by the FHCF's management and lead financial advisor. The FHCF projected a 2012 year-end fund balance of approximately $8.5 billion, and a total bonding capacity estimate of $7.0 billion; given the FHCF's total potential claims-paying obligation of $17.3 billion, this estimated claims-paying capacity of approximately $15.6 billion was therefore estimated by the FHCF's lead adviser to reflect a potential shortfall of $1.8 billion in respect of an initial season or event. Any inability, or delay, in the claims paying ability of these entities or of private market participants could further weaken or destabilize the Florida market, potentially giving rise to an unpredictable range of adverse impacts. The FHCF and the Florida Office of Insurance Regulation ("OIR") have each estimated that even partial failure, or deferral, of the FHCF's ability to pay claims in full could substantially weaken numerous private insurers, with the OIR having estimated that a 25% shortfall in the FHCF's claims-paying capacity could cause as many as 24 of the top 50 insurers in the state to have less than the statutory minimum surplus of $5.0 million, with such insurers representing approximately 35% of the market based on premium volume, or approximately 2.2 million policies. Adverse market, regulatory or legislative changes impacting Florida could affect our ability to sell certain of our products, to collect premiums we may be owed on policies we have already written, to renew business with our customers for future periods, or have other adverse impacts, some of which may be difficult to foresee, and could therefore have a material adverse effect on our operations.
Internationally, in the wake of the large natural catastrophes in 2011 a number of proposals have been introduced to alter the financing of natural catastrophes in several of the markets in which we operate. For example, the Thailand government has announced it is studying proposals for a natural catastrophe fund, under which the government would provide coverage for natural disasters in excess of an industry retention and below a certain limit, after which private reinsurers would continue to participate. The government of the Philippines has announced that it is considering similar proposals. A range of proposals from varying stakeholders have been reported to have been made to alter the current regimes for insuring flood risk in the U.K., flood risk in Australia and earthquake risk in New Zealand. If these proposals are enacted and reduce market opportunities for our clients or for the reinsurance industry, we could be adversely impacted.
Over the past few years the U.S. Congress has considered legislation which, if passed, would deny U.S. insurers and reinsurers the deduction for reinsurance placed with non-U.S. affiliates. In February 2012, the Obama administration included a formal proposal for such a provision in its budget proposal. As described in the administration's 2012 budget request, the proposal would deny an insurance company a deduction for premiums and other amounts paid to affiliated foreign companies with respect to reinsurance of property and casualty risks to the extent that the foreign reinsurer (or its parent company) is not subject to U.S. income tax with respect to the premiums received; and would exclude from the insurance company's income (in the same proportion in which the premium deduction was denied) any return premiums, ceding
commissions, reinsurance recovered, or other amounts received with respect to reinsurance policies for which a premium deduction is wholly or partially denied. We believe that the passage of such legislation could adversely affect the reinsurance market broadly and potentially impact our own current or future operations in particular.
On February 11, 2013, U.S. Senators Carl Levin and Sheldon Whitehouse introduced legislation in the U.S. Senate entitled the "Cut Unjustified Tax Loopholes Act". Similar legislation was also proposed earlier in 2013 as well as in 2012, 2011 and 2010. If enacted, this legislation would, among other things, cause to be treated as a U.S. corporation for U.S. tax purposes generally, certain corporate entities if the “management and control” of such a corporation is, directly or indirectly, treated as occurring primarily within the U.S. The proposed legislation provides that a corporation will be so treated if substantially all of the executive officers and senior management of the corporation who exercise day-to-day responsibility for making decisions involving strategic, financial, and operational policies of the corporation are located primarily within the U.S. To date, this legislation has not been approved by either the House of Representatives or the Senate. However, we can provide no assurance that this legislation or similar legislation will not ultimately be adopted. While we do not believe that the legislation would negatively impact us, it is possible that an adopted bill would include additional or expanded provisions which could negatively impact us, or that the interpretation or enforcement of the current proposal, if enacted, would be more expansive or adverse than we currently estimate.
ITEM 7A. QUANTITATIVE AND QUALITATIVE DISCLOSURES ABOUT MARKET RISK
The following risk management discussion and the estimated amounts generated from sensitivity and value-at-risk ("VaR") analysis presented are forward-looking statements of market risk assuming certain market conditions occur. Actual results in the future may differ materially from these estimated results due to, among other things, actual developments in the global financial markets and changes in the composition of our investment portfolio and product offerings. The results of analysis used by us to assess and mitigate risk should not be considered projections of future events or losses. See "Note On Forward-Looking Statements" for additional discussion regarding forward-looking statements included herein.
We are principally exposed to five types of market risk: interest rate risk; foreign currency risk; credit risk; energy and weather-related risk; and equity price risk. Our policies to address these risks in 2012 were not materially different than those used in 2011, and we do not currently anticipate significant changes in our market risk exposures or in how those exposures are managed in future reporting periods based upon what is known or expected to be in effect in future reporting periods. The Company's guidelines permit investments in derivative instruments such as futures, forward contracts, options, swap agreements and other derivative contracts which may be used to assume risk or for hedging purposes. Refer to "Note 19. Derivative Instruments in our Notes to Consolidated Financial Statements" for additional information related to derivatives entered into by us.
Interest Rate Risk
Interest rate risk is the price sensitivity of a security to changes in interest rates. Our investment portfolio includes fixed maturity investments and short term investments, whose fair values will fluctuate with changes in interest rates. We attempt to maintain adequate liquidity in our fixed maturity investments portfolio to fund operations, pay reinsurance and insurance liabilities and claims and provide funding for unexpected events. We seek to manage our interest rate risk in part by monitoring the duration and structure of our investment portfolio.
The following table summarizes the aggregate hypothetical increase (decrease) in fair value from an immediate parallel shift in the treasury yield curve, assuming credit spreads remain constant, reflecting the use of an immediate time horizon, since this presents the worst-case scenario, in our fixed maturity investment and short term investments portfolio for the years indicated: |
| | | | | | | | | | | | | | | | | | | | | |
| | | | | | | | | | | | |
| | | Interest Rate Shift in Basis Points | |
| | At December 31, 2012 | -100 | | -50 | | Base | | 50 | | 100 | |
| | (in thousands, except percentages) | | | | | | | | | | |
| | Fair value of fixed income and short term investments | $ | 5,714,441 |
| | $ | 5,642,460 |
| | $ | 5,570,026 |
| | $ | 5,497,140 |
| | $ | 5,423,801 |
| |
| | Net increase (decrease) in fair value | $ | 144,415 |
| | $ | 72,434 |
| | $ | — |
| | $ | (72,886 | ) | | $ | (146,225 | ) | |
| | Percentage change in fair value | 2.6 | % | | 1.3 | % | | — | % | | (1.3 | )% | | (2.6 | )% | |
| | | | | | | | | | | | |
|
| | | | | | | | | | | | | | | | | | | | | |
| | | | | | | | | | | | |
| | | Interest Rate Shift in Basis Points | |
| | At December 31, 2011 | -100 | | -50 | | Base | | 50 | | 100 | |
| | (in thousands, except percentages) | | | | | | | | | | |
| | Fair value of fixed income and short term investments | $ | 5,477,626 |
| | $ | 5,408,377 |
| | $ | 5,338,994 |
| | $ | 5,269,479 |
| | $ | 5,199,831 |
| |
| | Net increase (decrease) in fair value | $ | 138,632 |
| | $ | 69,383 |
| | $ | — |
| | $ | (69,515 | ) | | $ | (139,163 | ) | |
| | Percentage change in fair value | 2.6 | % | | 1.3 | % | | — | % | | (1.3 | )% | | (2.6 | )% | |
| | | | | | | | | | | | |
We use interest rate futures within our portfolio of fixed maturity investments to manage our exposure to interest rate risk, which can include increasing or decreasing our exposure to this risk. At December 31, 2012, we had $377.8 million of notional long positions and $310.7 million of notional short positions of primarily U.S. Treasury and non-U.S. dollar futures contracts (2011 - $3.2 billion and $285.7 million, respectively). Refer to "Note 19. Derivative Instruments in our Notes to Consolidated Financial Statements" for additional information related to interest rate futures entered into by us. The aggregate hypothetical loss generated from an immediate upward parallel shift in the treasury yield curve of 100 basis points would cause a decrease in market value of our net position in these derivatives of approximately $10.4 million at December 31, 2012. The foregoing reflects the use of an immediate time horizon, since this presents the worst-case scenario. Credit spreads are assumed to remain constant in these hypothetical examples.
Foreign Currency Risk
Our functional currency is the U.S. dollar. We routinely write a portion of our business in currencies other than U.S. dollars and may, from time to time, experience foreign exchange gains and losses in our consolidated financial statements. All changes in exchange rates, with the exception of non-U.S. dollar denominated investments classified as available for sale, are recognized currently in our consolidated statements of operations. We are primarily impacted by the foreign currency risk exposures noted below, and may, from time to time, enter into foreign currency forward and option contracts to minimize the effect of fluctuating foreign currencies on the value of non-U.S. denominated assets and liabilities. Refer to "Note 19. Derivative Instruments in our Notes to Consolidated Financial Statements" for additional information related to foreign currency forward and option contracts entered into by us. As a result of the current financial and economic environment, we may not match a portion of our projected liabilities in foreign currencies with investments in the same currencies, which would increase our exposure to foreign currency fluctuations and increase the volatility of our results of operations.
Underwriting Operations
Our foreign currency policy with regard to our underwriting operations is generally to hold foreign currency assets, including cash, investments and receivables that approximate the foreign currency liabilities, including claims and claim expense reserves and reinsurance balances payable. When necessary, we may use foreign currency forward and option contracts to minimize the effect of fluctuating foreign currencies on the value of non-U.S. dollar denominated assets and liabilities associated with our underwriting operations.
Investment Portfolio
Our investment operations are exposed to currency fluctuations through our investments in non-U.S. dollar fixed maturity investments, short term investments and other investments. The principal currencies creating foreign exchange risk for us are the British pound sterling, the euro, the yen and the Canadian dollar. To economically hedge our exposure to currency fluctuations from these investments, we have entered into foreign currency forward contracts. In certain instances, we may assume foreign exchange risk as part of our investment strategy. Unrealized foreign exchange gains or losses arising from non-U.S. dollar investments classified as available for sale are recorded in accumulated other comprehensive income. Realized foreign exchange gains or losses from the sale of our non-U.S. dollar fixed maturity investments available for sale, realized and unrealized foreign exchange gains or losses from the sale of our non-U.S. dollar fixed maturity investments trading and other investments, and foreign exchange gains or losses associated with our hedging of these non-U.S. dollar investments are recorded in net foreign exchange gains (losses) in our consolidated statements of operations. In the future, we may choose to increase our exposure to non-U.S. dollar investments.
Energy and Risk Management Operations
Our energy and risk management operations are exposed to currency fluctuations through certain derivative transactions we enter into that are denominated in non-U.S. dollars. The Company may, from time to time, use foreign currency forward and option contracts to minimize the effect of fluctuating foreign currencies on the value of non-U.S. dollar denominated assets and liabilities associated with these operations.
The following tables summarizes our net foreign currency exposures and the impact of a hypothetical 10% change in our net foreign currency exposure, keeping all other variables constant, as of the dates indicated: |
| | | | | | | | | | | | | | | | | | | | | | | | | | | | | |
| | | | | | | | | | | | | | | | |
| | At December 31, 2012 | CAD | | EUR | | GBP | | JPY | | NZD | | Other | | Total | |
| | (in thousands, except for percentages) | | | | | | | | | | | | | | |
| | Net assets denominated in foreign currencies | $ | 25,472 |
| | $ | (83,501 | ) | | $ | 75,391 |
| | $ | (40,935 | ) | | $ | (217,506 | ) | | $ | 19,909 |
| | $ | (221,170 | ) | |
| | Net foreign currency derivatives notional amounts | (18,159 | ) | | 98,159 |
| | (74,091 | ) | | 32,705 |
| | 211,981 |
| | (2,759 | ) | | 247,836 |
| |
| | Total net foreign currency exposure | $ | 7,313 |
| | $ | 14,658 |
| | $ | 1,300 |
| | $ | (8,230 | ) | | $ | (5,525 | ) |
| $ | 17,150 |
|
| $ | 26,666 |
| |
| | Net foreign currency exposure as a percentage of total shareholders' equity attributable to RenaissanceRe | 0.2 | % | | 0.4 | % | | — | % | | (0.2 | )% | | (0.2 | )% | | 0.5 | % | | 0.8 | % | |
| | Impact of a hypothetical 10% change in total net foreign currency exposure | $ | (731 | ) | | $ | (1,466 | ) | | $ | (130 | ) | | $ | 823 |
| | $ | 553 |
| | $ | (1,715 | ) | | $ | (2,667 | ) | |
| | | | | | | | | | | | | | | | |
|
| | | | | | | | | | | | | | | | | | | | | | | | | | | | | |
| | | | | | | | | | | | | | | | |
| | At December 31, 2011 | CAD | | EUR | | GBP | | JPY | | NZD | | Other | | Total | |
| | (in thousands, except for percentages) | | | | | | | | | | | | | | |
| | Net assets denominated in foreign currencies | $ | 8,722 |
| | $ | 2,969 |
| | $ | 9,693 |
| | $ | (147,479 | ) | | $ | (293,076 | ) | | $ | 16,578 |
| | $ | (402,593 | ) | |
| | Net foreign currency derivatives notional amounts | (6,723 | ) | | (43,550 | ) | | (22,425 | ) | | 151,874 |
| | 290,324 |
| | (3,260 | ) | | 366,240 |
| |
| | Total net foreign currency exposure | $ | 1,999 |
| | $ | (40,581 | ) | | $ | (12,732 | ) | | $ | 4,395 |
| | $ | (2,752 | ) | | $ | 13,318 |
| | $ | (36,353 | ) | |
| | Net foreign currency exposure as a percentage of total shareholders' equity attributable to RenaissanceRe | 0.1 | % | | (1.1 | )% | | (0.4 | )% | | 0.1 | % | | (0.1 | )% | | 0.4 | % | | (1.0 | )% | |
| | Impact of a hypothetical 10% change in total net foreign currency exposure | $ | (200 | ) | | $ | 4,058 |
| | $ | 1,273 |
| | $ | (440 | ) | | $ | 275 |
| | $ | (1,332 | ) | | $ | 3,635 |
| |
| | | | | | | | | | | | | | | | |
Credit Risk
Credit risk relates to the uncertainty of a counterparty's ability to make timely payments in accordance with contractual terms of the instrument or contract. We are exposed to direct credit risk within our portfolios of fixed maturity and short term investments, and through customers and reinsurers in the form of premiums receivable and reinsurance recoverables, respectively, as discussed below.
Fixed Maturity Investments and Short Term Investments
Credit risk related to our fixed maturity investments and short term investments is the exposure to adverse changes in the creditworthiness of individual investment holdings, issuers, groups of issuers, industries and countries. We manage credit risk in our fixed maturity investments and short term investments through the credit research performed primarily by the investment management service providers and our evaluation of these investment managers adherence to investment mandates provided to them. The management of credit risk in the investment portfolio is integrated in our credit risk management governance framework and the management of credit exposures and concentrations within the investment portfolio are carried out in accordance with our risk policies, limits and risk concentrations as overseen by our Investment Risk Management Committee. In the investment portfolio, we review on a regular basis our asset concentration, credit quality and adherence to credit limit guidelines. At December 31, 2012, our invested asset portfolio had a dollar weighted average rating of AA (2011 - AA). In addition, we limit the amount of credit exposure to any one financial institution and, except for U.S. Government securities, none of our investments exceeded 10% of shareholders' equity at December 31, 2012.
The following table summarizes our fixed maturity investments and short term investments as indicated by ratings assigned by S&P, or Moody's and/or other rating agencies when S&P ratings were not available as a percentage of total fixed maturity investments and short term investments as of the dates indicated: |
| | | | | | | |
| | | | | | |
| | At December 31, | 2012 | | 2011 | |
| | | | | | |
| | AAA | 25.8 | % | | 32.7 | % | |
| | AA | 44.7 | % | | 45.4 | % | |
| | A | 15.2 | % | | 11.9 | % | |
| | BBB | 5.8 | % | | 6.3 | % | |
| | Non-investment grade | 8.2 | % | | 3.5 | % | |
| | Not rated | 0.3 | % | | 0.2 | % | |
| | Total | 100.0 | % | | 100.0 | % | |
| | | | | | |
We consider the impact of credit spread movements on the fair value of our fixed maturity and short term investments portfolio. As credit spreads widen, the fair value of our fixed maturity and short term investments decreases, and vice versa.
The following table summarizes the aggregate hypothetical increase (decrease) in fair value from an immediate parallel shift in credit spreads, assuming the treasury yield curve remains constant, reflecting the use of an immediate time horizon, since this presents the worst-case scenario, in our fixed maturity investment and short term investments portfolio for the years indicated: |
| | | | | | | | | | | | | | | | | | | | | |
| | | | | | | | | | | | |
| | | Credit Spread Shift in Basis Points | |
| | At December 31, 2012 | -100 | | -50 | | Base | | 50 | | 100 | |
| | (in thousands, except percentages) | | | | | | | | | | |
| | Fair value of fixed income and short term investments | $ | 5,691,346 |
| | $ | 5,630,687 |
| | $ | 5,570,026 |
| | $ | 5,509,367 |
| | $ | 5,448,707 |
| |
| | Net increase (decrease) in fair value | $ | 121,320 |
| | $ | 60,661 |
| | $ | — |
| | $ | (60,659 | ) | | $ | (121,319 | ) | |
| | Percentage change in fair value | 2.2 | % | | 1.1 | % | | — | % | | (1.1 | )% | | (2.2 | )% | |
| | | | | | | | | | | | |
|
| | | | | | | | | | | | | | | | | | | | | |
| | | | | | | | | | | | |
| | | Credit Spread Shift in Basis Points | |
| | At December 31, 2011 | -100 | | -50 | | Base | | 50 | | 100 | |
| | (in thousands, except percentages) | | | | | | | | | | |
| | Fair value of fixed income and short term investments | $ | 5,452,249 |
| | $ | 5,395,622 |
| | $ | 5,338,994 |
| | $ | 5,282,367 |
| | $ | 5,225,740 |
| |
| | Net increase (decrease) in fair value | $ | 113,255 |
| | $ | 56,628 |
| | $ | — |
| | $ | (56,627 | ) | | $ | (113,254 | ) | |
| | Percentage change in fair value | 2.1 | % | | 1.1 | % | | — | % | | (1.1 | )% | | (2.1 | )% | |
| | | | | | | | | | | | |
We also employ credit derivatives in our investment portfolio to either assume credit risk or hedge our credit exposure. At December 31, 2012, we had outstanding credit derivatives of $46.1 million in notional long positions and $24.0 million in notional short positions, denominated in U.S. dollars (2011 - $15.0 million and $38.1 million respectively). Refer to "Note 19. Derivative Instruments in our Notes to Consolidated Financial Statements" for additional information related to credit derivatives entered into by us.
Premiums Receivable and Reinsurance Recoverable
Premiums receivable from ceding companies are subject to credit risk. To mitigate credit risk related to reinsurance premiums receivable, we have established standards for ceding companies and, in most cases, have a contractual right of offset thereby allowing us to settle claims net of any such reinsurance premiums receivable. We also have reinsurance recoverable amounts from our reinsurers. To mitigate credit risk related to our reinsurance recoverable amounts, we consider the financial strength of our reinsurers when determining whether to purchase coverage from them. We generally obtain reinsurance coverage from companies rated "A-" or better by S&P unless the obligations are collateralized. We routinely monitor
the financial performance and rating status of all material reinsurers. Refer to "Part II, Item 7 - Management's Discussion and Analysis of Financial Condition and Results of Operations, Summary of Critical Accounting Estimates" for additional information with respect to reinsurance recoverable.
Energy and Weather-Related Risk
Energy and Risk Management Operations
We regularly transact in certain derivative-based risk management products primarily to address weather and energy risks and engage in hedging and trading activities related to these risks. The trading markets for these derivatives are generally linked to energy and agriculture commodities, weather and other natural phenomena. The unit which conducts these activities also transacts business which contemplates the physical delivery of energy-related commodities, including natural gas. Currently, a significant percentage of our derivative-based risk management products are transacted on a dual-trigger basis combining weather or other natural phenomenon, with prices for commodities or securities related to energy or agriculture. The fair value of these contracts is obtained through the use of quoted market prices, or in the absence of such quoted prices, industry or internal valuation models. Generally, our current portfolio of such derivative contracts is of comparably short duration and such contracts are predominantly seasonal in nature. Over time, we currently expect that our participation in these markets, and the impact of these operations on our financial results, is likely to increase on both an absolute and relative basis. It is possible the duration of derivative contracts in this portfolio will lengthen in the future.
We use, among other things, VaR analysis to monitor the risks associated with our energy and weather derivatives trading portfolio. VaR is a tool that measures the potential loss that could occur if our trading positions were maintained over a defined period of time, calculated at a given statistical confidence level. Due to the seasonal nature of our energy and weather derivatives trading activities, the VaR is based on a rolling two season (one-year) holding period assuming no dynamic trading during the holding period. A 99% confidence level is used for the VaR analysis. A 99% confidence level implies that within a one-year period, the potential loss in our portfolio is not expected to exceed the VaR estimate in 99% of the possible modeled outcomes. In the remaining estimated 1% of the possible outcomes, the anticipated potential loss is expected to be higher than the VaR figure, and on average substantially higher.
The VaR model, based on a Monte Carlo simulation methodology, seeks to take into account correlations between different positions and potential for movements to offset one another within the portfolio. The expected value of the risk factors in our portfolio is generally obtained from exchange-traded futures markets. For most of the risk factors, the volatility is derived from exchange-traded options markets. For those risk factors for which exchange-traded options might not exist, the volatility is based on historical analysis matched to broker quotes from the over-the-counter market, where available. The joint distribution of outcomes is based on our estimate of the historical seasonal dependence among the underlying risk factors, scaled to the current market levels. We then estimate the expected outcomes by applying a Monte Carlo simulation to these risk factors. The joint distribution of the simulated risk factors is then filtered through the portfolio positions, and then the distribution of the outcomes is realized. The 99th percentile of this distribution is then calculated as the portfolio VaR. The major limitation of this methodology is that the market data used to forecast parameters of the model may not be an appropriate proxy of those parameters. The VaR methodology uses a number of assumptions, such as (i) risks are measured under average market conditions, assuming normal distribution of market risk factors, (ii) future movements in market risk factors follow estimated historical movements, and (iii) the assessed exposures do not change during the holding period. There is no guarantee that these assumptions will prove correct. We expect that, for any given period, our actual results will differ from our assumptions, including with respect to previously estimated potential losses and that such losses could be substantially higher than the estimated VaR.
At December 31, 2012, the estimated VaR for our portfolio of energy and weather-related derivatives, as described above, calculated at an estimated 99% confidence level, was $19.5 million (2011 - $33.8 million). The average, low and high amounts calculated by our VaR analysis during the year ended December 31, 2012 were $23.4 million, $9.7 million and $37.0 million, respectively (2011 - $31.5 million, $10.8 million and $74.0 million, respectively). Refer to "Note 19. Derivative Instruments in our Notes to Consolidated Financial Statements" for additional information related to derivative-based risk management products entered into by us.
Equity Price Risk
Equity price risk is the potential loss arising from changes in the market value of equities. As detailed in the table below, we are directly exposed to this risk through our investment in equity investments trading which are traded on nationally recognized stock exchanges; and indirectly exposed to this risk through our investments in: private equity partnerships whose exit strategies often depend on the equity markets; certain hedge funds that have net long equity positions; and other ventures, under equity method. The following table summarizes a hypothetical 10 percent increase and decline in the carrying value of our equity investments trading, private equity partnerships, hedge funds and investments in other ventures, holding all other factors constant, at the dates indicated: |
| | | | | | | | | |
| | | | | | |
| | At December 31, | 2012 | | 2011 | |
| | (in thousands, except for percentages) | | | | |
| | Equity investments trading, at fair value | $ | 58,186 |
| | $ | 50,560 |
| |
| | Private equity investments, at fair value | 344,669 |
| | 367,909 |
| |
| | Hedge funds, at fair value | 5,803 |
| | 21,344 |
| |
| | Investments in other ventures, under equity method | 87,724 |
| | 70,714 |
| |
| | Total carrying value of investments exposed to equity price risk | $ | 496,382 |
| | $ | 510,527 |
| |
| | | | | | |
| | Impact of a hypothetical 10% increase in the carrying value of investments exposed to equity price risk | $ | 49,638 |
| | $ | 51,053 |
| |
| | Impact of a hypothetical 10% decrease in the carrying value of investments exposed to equity price risk | $ | (49,638 | ) | | $ | (51,053 | ) | |
| | | | | | |
ITEM 8. FINANCIAL STATEMENTS AND SUPPLEMENTARY DATA
Reference is made to Item 15(a) of this Report for the Consolidated Financial Statements of RenaissanceRe and the Notes thereto, as well as the Schedules to the Consolidated Financial Statements.
ITEM 9. CHANGES IN AND DISAGREEMENTS WITH ACCOUNTANTS ON ACCOUNTING AND FINANCIAL DISCLOSURE
None.
ITEM 9A. CONTROLS AND PROCEDURES
Disclosure Controls and Internal Controls: We have designed various disclosure controls and procedures (as defined in Rules 13a-15(e) and Rule 15d-15(e) under the Exchange Act), to help ensure that information required to be disclosed in our periodic Exchange Act reports, such as this annual report, is recorded, processed, summarized and reported on a timely and accurate basis. Our disclosure controls and procedures are also designed with the objective of ensuring that such information is accumulated and communicated to our senior management, including our Chief Executive Officer and Chief Financial Officer, as appropriate to allow timely decisions regarding required disclosure. Our internal control over financial reporting is a process designed to provide reasonable assurance regarding the reliability of financial reporting and the preparation of financial statements for external purposes in accordance with generally accepted accounting principles and includes those policies and procedures that: (1) pertain to the maintenance of records that in reasonable detail accurately and fairly reflect the transactions and dispositions of the assets of the issuer; (2) provide reasonable assurance that transactions are recorded as necessary to permit preparation of financial statements in accordance with generally accepted accounting principles, and that receipts and expenditures of the issuer are being made only in accordance with authorizations of management and directors of the issuer; and (3) provide reasonable assurance regarding prevention or timely detection of unauthorized acquisition, use or disposition of the Company's assets that could have a material effect on the financial statements.
Limitations on the Effectiveness of Controls: Our Board of Directors and management, including our Chief Executive Officer and Chief Financial Officer, do not expect that our disclosure controls and procedures or internal control over financial reporting will prevent all errors and all fraud. Controls, no matter how well conceived and operated, can provide only reasonable, not absolute, assurance that the objectives of the controls are met. Further, we believe that the design of prudent controls must reflect appropriate resource constraints, such that the benefits of controls must be considered relative to their costs. Because of the inherent limitations in all controls, there can be no absolute assurance that all control issues and instances of fraud, if any, applicable to us have been or will be detected. These inherent limitations include the realities that judgments in decision-making can be faulty, and that breakdowns can occur because of simple errors or mistakes. Additionally, controls can be circumvented by the individual acts of some individuals, by collusion of more than one person, or by management override of the control. The design of any system of controls also is based in part upon certain assumptions about the likelihood of future events, and there can be no assurance that any design will succeed in achieving its stated goals under all potential future conditions; over time, controls may become inadequate because of changes in conditions, or the degree of compliance with the policies or procedures may deteriorate. Because of the inherent limitations in a cost-effective control system, misstatements due to error or fraud may occur and not be detected.
Evaluation: An evaluation was performed under the supervision and with the participation of the Company's management, including our Chief Executive Officer and Chief Financial Officer, of the effectiveness of the design and operation of the Company's disclosure controls and procedures as required by Rules 13a-15(b) and 15d-15(b) of the Exchange Act. Based upon that evaluation, the Company's management, including our Chief Executive Officer and Chief Financial Officer, concluded that, at December 31, 2012, the Company's disclosure controls and procedures were effective at the reasonable assurance level in ensuring that information required to be disclosed in Company reports filed under the Exchange Act is (i) recorded, processed, summarized and reported within the time periods specified in the SEC rules and forms and (ii) accumulated and communicated to management, including the Company's Chief Executive Officer and Chief Financial Officer, as appropriate to allow timely decisions regarding required disclosure. There has been no change in the Company's internal control over financial reporting during the three months ended December 31, 2012 that has materially affected, or is reasonably likely to materially affect, the Company's internal control over financial reporting.
ITEM 9B. OTHER INFORMATION
None.
PART III
ITEM 10. DIRECTORS, EXECUTIVE OFFICERS AND CORPORATE GOVERNANCE
This item is omitted because a definitive proxy statement that involves the election of directors will be filed with the Securities and Exchange Commission not later than 120 days after the close of the fiscal year pursuant to Regulation 14A, which proxy statement is incorporated by reference.
RenaissanceRe has adopted a Code of Ethics that applies to its directors and executive officers. The Code of Ethics is available free of charge on our website http://www.renre.com. We will also provide a printed version of the Code of Ethics to any shareholder who requests it. We intend to disclose any amendments to our Code of Ethics by posting such information on our website. As outlined in the Code of Ethics, any waivers of our Code of Ethics applicable to our directors, principal executive officer, principal financial officer, principal accounting officer or controller and other executive officers who perform similar functions will be disclosed by filing a Form 8-K.
ITEM 11. EXECUTIVE COMPENSATION
This item is omitted because a definitive proxy statement that involves the election of directors will be filed with the Securities and Exchange Commission not later than 120 days after the close of the fiscal year pursuant to Regulation 14A, which proxy statement is incorporated by reference.
ITEM 12. SECURITY OWNERSHIP OF CERTAIN BENEFICIAL OWNERS AND MANAGEMENT AND RELATED SHAREHOLDER MATTERS
This item is omitted because a definitive proxy statement that involves the election of directors will be filed with the Securities and Exchange Commission not later than 120 days after the close of the fiscal year pursuant to Regulation 14A, which proxy statement is incorporated by reference.
ITEM 13. CERTAIN RELATIONSHIPS AND RELATED TRANSACTIONS, AND DIRECTOR INDEPENDENCE
This item is omitted because a definitive proxy statement that involves the election of directors will be filed with the Securities and Exchange Commission not later than 120 days after the close of the fiscal year pursuant to Regulation 14A, which proxy statement is incorporated by reference.
ITEM 14. PRINCIPAL ACCOUNTANT FEES AND SERVICES
This item is omitted because a definitive proxy statement that involves the election of directors will be filed with the Securities and Exchange Commission not later than 120 days after the close of the fiscal year pursuant to Regulation 14A, which proxy statement is incorporated by reference.
PART IV
ITEM 15. EXHIBITS AND FINANCIAL STATEMENT SCHEDULES
| |
| (a) | Financial Statements, Financial Statement Schedules and Exhibits. |
The Consolidated Financial Statements of RenaissanceRe Holdings Ltd. and related Notes thereto are listed in the accompanying Index to Consolidated Financial Statements and are filed as part of this Form 10-K.
| |
| 2 | Financial Statement Schedules |
The Schedules to the Consolidated Financial Statements of RenaissanceRe Holdings Ltd. are listed in the accompanying Index to Schedules to Consolidated Financial Statements and are filed as a part of this Form 10-K.
| |
| 3.1 | Memorandum of Association. (1) |
| |
| 3.2 | Amended and Restated Bye-Laws. (2) |
| |
| 3.3 | Memorandum of Increase in Share Capital of RenaissanceRe Holdings Ltd. (3) |
| |
| 3.4 | Specimen Common Share certificate. (1) |
| |
| 10.1 | Form of Director Retention Agreement, dated as of November 8, 2002, entered into by each of the non-employee directors of RenaissanceRe Holdings Ltd. (4) |
| |
| 10.2 | Further Amended and Restated Employment Agreement, dated as of February 19, 2009, between RenaissanceRe Holdings Ltd. and Neill A. Currie. (8) |
| |
| 10.3 | Amendment No. 1 to the Further Amended and Restated Employment Agreement, dated January 8, 2010, by and among RenaissanceRe Holdings Ltd. and Neill A. Currie. (9) |
| |
| 10.4 | Employment Agreement, dated as of June 10, 2009, by and between RenaissanceRe Holdings Ltd. and Jeffrey D. Kelly. (11) |
| |
| 10.5 | Memorandum of Agreement by and between the Company and Neill A. Currie, dated February 21, 2012 (5). |
| |
| 10.6 | Amendment No. 1 the Employment Agreement, dated January 8, 2010, by and among RenaissanceRe Holdings Ltd. and Jeffrey D. Kelly. (9) |
| |
| 10.7 | Form of Employment Agreement for Executive Officers. (10) |
| |
| 10.8 | Form of Amendment to Employment Agreement for Executive Officers. (13) |
| |
| 10.9 | Form of Amendment No. 2 to Employment Agreement for Executive Officers. (7) |
| |
| 10.10 | Form of Amendment No. 3 to the Amended and Restated Employment Agreement for Executive Officers. (9) |
| |
| 10.11 | RenaissanceRe Holdings Ltd. 2001 Stock Incentive Plan. (18) |
| |
| 10.12 | Amendment No. 1 to the RenaissanceRe Holdings Ltd. 2001 Stock Incentive Plan. (19) |
| |
| 10.13 | Amendment No. 2 to the RenaissanceRe Holdings Ltd. 2001 Stock Incentive Plan. (19) |
| |
| 10.14 | Amendment No. 3 to the RenaissanceRe Holdings Ltd. 2001 Stock Incentive Plan. (20) |
| |
| 10.15 | Amendment No. 4 to the RenaissanceRe Holdings Ltd. 2001 Stock Incentive Plan. (40) |
| |
| 10.16 | Amendment No. 5 to the RenaissanceRe Holdings Ltd. 2001 Stock Incentive Plan. (37) |
| |
| 10.17 | UK Schedule to the RenaissanceRe Holdings Ltd. 2001 Stock Incentive Plan. (20) |
| |
| 10.18 | UK Sub-Plan to the RenaissanceRe Holdings 2001 Stock Incentive Plan. (20) |
| |
| 10.19 | Form of Option Grant Notice and Agreement pursuant to which option grants are made under the RenaissanceRe Holdings Ltd. 2001 Stock Incentive Plan. (21) |
| |
| 10.20 | Form of Restricted Stock Grant Notice and Agreement pursuant to which Restricted Stock grants are made under the RenaissanceRe Holdings Ltd. 2001 Stock Incentive Plan. (21) |
| |
| 10.21 | RenaissanceRe Holdings Ltd. 2004 Stock Option Incentive Plan. (22) |
| |
| 10.22 | Amendment No. 1 to the RenaissanceRe Holdings Ltd. 2004 Stock Option Incentive Plan. (23) |
| |
| 10.23 | Form of Option Agreement pursuant to which option grants are made under the RenaissanceRe Holdings 2004 Stock Option Incentive Plan to executive officers. (22) |
| |
| 10.24 | Amended and Restated RenaissanceRe Holdings Ltd. Non-Employee Director Stock Plan. (25) |
| |
| 10.25 | Amendment No. 1 to the RenaissanceRe Holdings Ltd. Non-Employee Director Stock Plan. (25) |
| |
| 10.26 | Amendment No. 2 to the RenaissanceRe Holdings Ltd. Non-Employee Director Stock Plan. (26) |
| |
| 10.27 | Amendment No. 3 to the RenaissanceRe Holdings Ltd. Non-Employee Director Stock Plan. (31) |
| |
| 10.28 | Form of Restricted Stock Grant Agreement for Directors. (5) |
| |
| 10.29 | Form of Option Grant Agreement for Directors. (5) |
| |
| 10.30 | Certificate of Designation, Preferences and Rights of 6.08% Series C Preference Shares. (29) |
| |
| 10.31 | Certificate of Designation, Preferences and Rights of 6.60% Series D Preference Shares. (30) |
| |
| 10.32 | Senior Indenture, dated as of July 1, 2001, between RenaissanceRe Holdings Ltd., as Issuer, and Bankers Trust Company, as Trustee. (12) |
| |
| 10.33 | Second Supplemental Indenture, by and between RenaissanceRe Holdings Ltd. and Deutsche Bank Trust Company Americas (f/k/a Bankers Trust Company), dated as of January 31, 2003. (14) |
| |
| 10.34 | Master Reimbursement Agreement, dated as of April 29, 2009, by and between Renaissance Reinsurance Ltd. and Citibank Europe PLC. (20) |
| |
| 10.35 | Pledge Agreement, dated as of April 29, 2009, by and between Renaissance Reinsurance Ltd. and Citibank Europe PLC. (20) |
| |
| 10.36 | Agreement Regarding Use of Aircraft Interest, dated as of November 17, 2009, by and between RenaissanceRe Holdings Ltd. and Neill A. Currie. (42) |
| |
| 10.37 | RenaissanceRe Holdings Ltd. 2010 Restricted Stock Unit Plan. (42) |
| |
| 10.38 | Form of Restricted Stock Unit Agreement, pursuant to which restricted stock unit grants are made under the RenaissanceRe Holdings Ltd. 2010 Restricted Stock Unit Plan. (42) |
| |
| 10.39 | Senior Indenture, dated as of March 17, 2010, among RenRe North America Holdings Inc., as Issuer, RenaissanceRe Holdings Ltd., as Guarantor, and Deutsche Bank Trust Companies America, as Trustee. (33) |
| |
| 10.40 | First Supplemental Indenture, dated as of March 17, 2010, among RenRe North America Holdings Inc., as Insurer, RenaissanceRe Holdings Ltd., as Guarantor, and Deutsche Bank Trust Companies America, as Trustee. (33) |
| |
| 10.41 | Senior Debt Securities Guarantee Agreement, dated as of March 17, 2010, between RenaissanceRe Holdings Ltd., as Guarantor, and Deutsche Bank Trust Companies America, as Guarantee Trustee. (33) |
| |
| 10.42 | Waiver Agreement, dated as of January 21, 2011, by and among RenRe North America Holdings Inc., RenaissanceRe Holdings Ltd. and Deutsche Bank Trust Company Americas, as Trustee. (41) |
| |
| 10.43 | Credit Agreement, dated as of May 17, 2012, by and among RenaissanceRe Holdings Ltd., various banks and financial institutions parties thereto, Wells Fargo Bank, National Association, as Fronting Bank, LC Administrator and Administrative Agent for the Lenders, Citibank, N.A., as Syndication Agent, and Wells Fargo Securities, LLC and Citigroup Global Markets Inc., as Joint Lead Arrangers and Joint Lead Bookrunners (43). |
| |
| 10.44 | Fourth Amended and Restated Reimbursement Agreement, dated as of May 17, 2012, by and among RenaissanceRe Holdings Ltd., Renaissance Reinsurance Ltd., Renaissance Reinsurance of Europe, Glencoe Insurance Ltd., DaVinci Reinsurance Ltd., the banks and financial institutions parties thereto, Wells Fargo Bank, National Association, as issuing bank, administrative agent and collateral agent for the lenders, and certain other agents (43). |
| |
| 10.45 | Form of Letter Agreement with Neill A. Currie Regarding Performance Share Awards. (35) |
| |
| 10.46 | Form of Letter Agreement with the Named Executive Officers Regarding Performance Share Awards. (35) |
| |
| 10.47 | Form of Tax Reimbursement Waiver Letter with the Named Executive Officers. (45) |
| |
| 10.48 | Form of Performance-Based Restricted Stock Grant Notice and Agreement pursuant to which performance-based restricted stock awards are made under the RenaissanceRe Holdings Ltd. 2010 Performance-Based Equity Incentive Plan. (36) |
| |
| 10.49 | Performance-Based Restricted Stock Grant Notice and Agreement under the RenaissanceRe Holdings Ltd. 2010 Performance-Based Equity Incentive Plan, dated June 9, 2010, between RenaissanceRe Holdings Ltd. and Neill A. Currie. (36) |
| |
| 10.50 | Facility Letter, dated September 17, 2010, from Citibank Europe plc to Renaissance Reinsurance Ltd., DaVinci Reinsurance Ltd. and Glencoe Insurance Ltd. (38) |
| |
| 10.51 | Insurance Letters of Credit - Master Agreement, dated September 17, 2010, between Renaissance Reinsurance Ltd. and Citibank Europe plc. DaVinci Reinsurance Ltd. and Glencoe Insurance Ltd. have each entered into an agreement with Citibank Europe plc that is identical to the foregoing agreement, except with respect to party names. (38) |
| |
| 10.52 | Stock Purchase Agreement, dated as of November 18, 2010, by and between RenRe North America Holdings Inc., and QBE Holdings Inc. (39) |
| |
| 10.53 | Memorandum of Agreement by and between RenaissanceRe Holdings Ltd. and Neill A. Currie, dated February 21, 2012. (44) |
| |
| 10.54 | RenaissanceRe Holdings Ltd. 2010 Performance-Based Equity Incentive Plan. (40) |
| |
| 10.55 | Amendment No. 2 to Further Amended and Restated Employment Agreement by and between RenaissanceRe Holdings Ltd. and Neill A. Currie, dated February 19, 2013. |
| |
| 10.56 | Form of Agreement Regarding Use of Aircraft Interest by and between RenaissanceRe Holdings Ltd. and Certain Executive Officers of RenaissanceRe Holdings Ltd. |
| |
| 21.1 | List of Subsidiaries of the Registrant. |
| |
| 23.1 | Consent of Ernst & Young Ltd. |
| |
| 31.1 | Certification of Neill A. Currie, Chief Executive Officer of RenaissanceRe Holdings Ltd., pursuant to Rule 13a-14(a) or Rule 15d-14(a) of the Securities Exchange Act of 1934, as amended. |
| |
| 31.2 | Certification of Jeffrey D. Kelly, Chief Financial Officer of RenaissanceRe Holdings Ltd., pursuant to Rule 13a-14(a) or Rule 15d-14(a) of the Securities Exchange Act of 1934, as amended. |
| |
| 32.1 | Certification of Neill A. Currie, Chief Executive Officer of RenaissanceRe Holdings Ltd., pursuant to 18 U.S.C. Section 1350, as adopted pursuant to Section 906 of the Sarbanes-Oxley Act of 2002. |
| |
| 32.2 | Certification of Jeffrey D. Kelly, Chief Financial Officer of RenaissanceRe Holdings Ltd., pursuant to 18 U.S.C. Section 1350, as adopted pursuant to Section 906 of the Sarbanes-Oxley Act of 2002. |
| |
| 101.INS | XBRL Instance Document |
| |
| 101.SCH | XBRL Taxonomy Extension Schema Document |
| |
| 101.CAL | XBRL Taxonomy Extension Calculation Linkbase Document |
| |
| 101.LAB | XBRL Taxonomy Extension Label Linkbase Document |
| |
| 101.PRE | XBRL Taxonomy Extension Presentation Linkbase Document |
| |
| 101.DEF | XBRL Taxonomy Extension Definition Linkbase Document |
| |
| (1) | Incorporated by reference to the Registration Statement on Form S-1 of RenaissanceRe Holdings Ltd. (Registration No. 33-70008) which was declared effective by the SEC on July 26, 1995. |
| |
| (2) | Incorporated by reference to RenaissanceRe Holdings Ltd.'s Quarterly Report on Form 10-Q for the period ended June 30, 2002, filed with the SEC on August 14, 2002. |
| |
| (3) | Incorporated by reference to RenaissanceRe Holdings Ltd.'s Quarterly Report on Form 10-Q for the period ended March 31, 1998, filed with the SEC on May 14, 1998 (SEC File Number 000-26512) |
| |
| (4) | Incorporated by reference to RenaissanceRe Holdings Ltd.'s Annual Report on Form 10-K for the year ended December 31, 2002, filed with the SEC on March 31, 2003 (SEC File Number 001-14428) |
| |
| (5) | Incorporated by reference to RenaissanceRe Holdings Ltd.'s Current Report on Form 8-K, filed with the SEC on February 27, 2006 |
| |
| (6) | Incorporated by reference to RenaissanceRe Holdings Ltd.'s Quarterly Report on Form 10-Q for the period ended March 31, 2007, filed with the SEC on May 2, 2007. |
| |
| (7) | Incorporated by reference to RenaissanceRe Holdings Ltd.'s Current Report on Form 8-K, filed with the SEC on November 25, 2008. |
| |
| (8) | Incorporated by reference to RenaissanceRe Holdings Ltd.'s Current Report on Form 8-K, filed with the SEC on February 25, 2009. |
| |
| (9) | Incorporated by reference to RenaissanceRe Holdings Ltd.'s Current Report on Form 8-K, filed with the SEC on January 14, 2010. |
| |
| (10) | Incorporated by reference to RenaissanceRe Holdings Ltd.'s Current Report on Form 8-K, filed with the SEC on July 21, 2006, relating to certain events which occurred on July 19, 2006. Other than with respect to the Percent and Lump Sum Percent (as defined and disclosed in the Form 8-K) and matters such as names and titles, the employment agreements for Messrs. O'Donnell and Ashley are identical to the form filed as Exhibit 10.9. |
| |
| (11) | Incorporated by reference to RenaissanceRe Holdings Ltd.'s Current Report on Form 8-K, filed with the SEC on June 15, 2009. |
| |
| (12) | Incorporated by reference to RenaissanceRe Holdings Ltd.'s Current Report on Form 8-K, filed with the SEC on July 17, 2001. |
| |
| (13) | Incorporated by reference to RenaissanceRe Holdings Ltd.'s Quarterly Report on Form 10-Q for the period ended March 31, 2008, filed with the SEC on May 2, 2008. |
| |
| (14) | Incorporated by reference to RenaissanceRe Holdings Ltd.'s Current Report on Form 8-K, filed with the SEC on January 31, 2003. |
| |
| (15) | Incorporated by reference to RenaissanceRe Holdings Ltd.'s Current Report on Form 8-K, filed with the SEC on April 14, 2009. |
| |
| (16) | Incorporated by reference to RenaissanceRe Holdings Ltd.'s Current Report on Form 8-K, filed with the SEC on April 11, 2006, relating to certain events which occurred on April 5, 2006. |
| |
| (17) | Incorporated by reference to RenaissanceRe Holdings Ltd.'s Current Report on Form 8-K, filed with the SEC on May 3, 2007. |
| |
| (18) | Incorporated by reference to Exhibit 99.2 to the Registration Statement on Form S-8 (Registration No. 333-90758) dated June 19, 2002. |
| |
| (19) | Incorporated by reference to RenaissanceRe Holdings Ltd.'s Quarterly Report on Form 10-Q for the period ended March 31, 2007, filed with the SEC on May 2, 2007. |
| |
| (20) | Incorporated by reference to RenaissanceRe Holdings Ltd.'s Quarterly Report on Form 10-Q for the period ended March 31, 2009, filed with the SEC on May 1, 2009. |
| |
| (21) | Incorporated by reference to RenaissanceRe Holdings Ltd.'s Quarterly Report on Form 10-Q for the period ended September 30, 2004, filed with the SEC on November 9, 2004. |
| |
| (22) | Incorporated by reference to RenaissanceRe Holdings Ltd.'s Current Report on Form 8-K, filed with the SEC on September 2, 2004. |
| |
| (23) | Incorporated by reference to RenaissanceRe Holdings Ltd.'s Annual Report on Form 10-K for the year ended December 31, 2004, filed with the SEC on March 31, 2005 (SEC File Number 001-14428). |
| |
| (24) | Incorporated by reference to Exhibit 99.1 to the Registration Statement on Form S-8 (Registration No. 333-90758) dated June 19, 2002. |
| |
| (25) | Incorporated by reference to RenaissanceRe Holdings Ltd.'s Quarterly Report on Form 10-Q for the period ended March 31, 2007, filed with the SEC on May 2, 2007. |
| |
| (26) | Incorporated by reference to RenaissanceRe Holdings Ltd.'s Quarterly Report on Form 10-Q for the period ended September 30, 2008, filed with the SEC on October 30, 2008. |
| |
| (27) | Incorporated by reference to RenaissanceRe Holdings Ltd.'s Annual Report on Form 10-K for the year ended December 31, 2001, filed with the SEC on April 1, 2002. |
| |
| (28) | Incorporated by reference to RenaissanceRe Holdings Ltd.'s Current Report on Form 8-K, filed with the SEC on February 4, 2003. |
| |
| (29) | Incorporated by reference to RenaissanceRe Holdings Ltd.'s Current Report on Form 8-K, filed with the SEC on March 18, 2004. |
| |
| (30) | Incorporated by reference to RenaissanceRe Holdings Ltd.'s Form 8-A, filed with the SEC on December 14, 2006. |
| |
| (31) | Incorporated by reference to RenaissanceRe Holdings Ltd.'s Annual Report on Form 10-K for the year ended December 31, 2008, filed with the SEC on February 20, 2009. |
| |
| (32) | Incorporated by reference to RenaissanceRe Holdings Ltd.'s Current Report on Form 8-K, filed with the SEC on March 11, 2010. |
| |
| (33) | Incorporated by reference to RenaissanceRe Holdings Ltd.'s Current Report on Form 8-K, filed with the SEC on March 18, 2010. |
| |
| (34) | Incorporated by reference to RenaissanceRe Holdings Ltd.'s Current Report on Form 8-K, filed with the SEC on April 27, 2010. |
| |
| (35) | Incorporated by reference to RenaissanceRe Holdings Ltd.'s Quarterly Report on Form 10-Q, filed with the SEC on April 29, 2010. |
| |
| (36) | Incorporated by reference to RenaissanceRe Holdings Ltd.'s Current Report on Form 8-K, filed with the SEC on June 11, 2010. |
| |
| (37) | Incorporated by reference to RenaissanceRe Holdings Ltd.'s Current Report on Form 8-K, filed with the SEC on August 13, 2010. |
| |
| (38) | Incorporated by reference to RenaissanceRe Holdings Ltd.'s Current Report on Form 8-K, filed with the SEC on September 23, 2010. |
| |
| (39) | Incorporated by reference to RenaissanceRe Holdings Ltd.'s Current Report on Form 8-K, filed with the SEC on November 18, 2010. |
| |
| (40) | Incorporated by reference to RenaissanceRe Holdings Ltd.'s Definitive Proxy Statement filed with the Commission on April 8, 2010. |
| |
| (41) | Incorporated by reference to RenaissanceRe Holdings Ltd.'s Current Report on Form 8-K, filed with the SEC on January 24, 2011. |
| |
| (42) | Incorporated by reference to RenaissanceRe Holdings Ltd.'s Annual Report on Form 10-K for the year ended December 31, 2009, filed with the SEC on February 19, 2010. |
| |
| (43) | Incorporated by reference to RenaissanceRe Holdings Ltd.'s Current Report on Form 8-K, filed with the SEC on May 22, 2012. |
| |
| (44) | Incorporated by reference to RenaissanceRe Holdings Ltd.'s Current Report on Form 8-K, filed with the SEC on February 27, 2012. |
| |
| (45) | Incorporated by reference to RenaissanceRe Holdings Ltd.'s Annual Report on Form 10-K for the year ended December 31, 2011, filed with the SEC on February 23, 2012. |
SIGNATURES
Pursuant to the requirements of Section 13 or 15(d) of the Securities Exchange Act of 1934, the Registrant has duly caused this report to be signed on its behalf by the undersigned, thereunto duly authorized, in Hamilton, Bermuda on February 21, 2013.
RENAISSANCERE HOLDINGS LTD.
|
| | | | | | |
| | | | /s/ Neill A. Currie | |
| | | | Neill A. Currie | |
| | | | Chief Executive Officer, Director |
| | | | | |
| | | | | | | |
| Signature | | Title | | | Date | |
| | | | |
| /s/ Neill A. Currie | | Chief Executive Officer, Director | | February 21, 2013 | |
| Neill A. Currie | | | | | | |
| | | | | |
| /s/ Jeffrey D. Kelly | | Executive Vice President, Chief Financial Officer | | February 21, 2013 | |
| Jeffrey D. Kelly | | | | |
| | | | | | | |
/s/ Mark A. Wilcox | | Senior Vice President, Corporate Controller and Chief Accounting Officer | | February 21, 2013 | |
| Mark A. Wilcox | | | | |
| | | | | | | |
| /s/ Ralph B. Levy | | Chairman of the Board of Directors | | | February 21, 2013 | |
| Ralph B. Levy | | | |
| | | | | | | |
| /s/ David C. Bushnell | | Director | | | February 21, 2013 | |
| David C. Bushnell | | | |
| | | | | | | |
| /s/ Thomas A. Cooper | | Director | | | February 21, 2013 | |
| Thomas A. Cooper | | | |
| | | | | | | |
| /s/ James L. Gibbons | | Director | | | February 21, 2013 | |
| James L. Gibbons | | | |
| | | | | | | |
| /s/ Jean D. Hamilton | | Director | | | February 21, 2013 | |
| Jean D. Hamilton | | | |
| | | | | | | |
| /s/ Henry Klehm, III | | Director | | | February 21, 2013 | |
| Henry Klehm, III | | | |
| | | | | | | |
| /s/ W. James MacGinnitie | | Director | | | February 21, 2013 | |
| W. James MacGinnitie | | | |
| | | | | | | |
| /s/ Anthony M. Santomero | | Director | | | February 21, 2013 | |
| Anthony M. Santomero | | | |
| | | | | | | |
| /s/ Nicholas L. Trivisonno | | Director | | | February 21, 2013 | |
| Nicholas L. Trivisonno | | | | | | |
| | | | |
| /s/ Edward J. Zore | | Director | | | February 21, 2013 | |
| Edward J. Zore | | | | | | |
INDEX TO CONSOLIDATED FINANCIAL STATEMENTS
MANAGEMENT'S REPORT ON INTERNAL CONTROL OVER FINANCIAL REPORTING
Management at RenaissanceRe Holdings Ltd. ("RenaissanceRe") is responsible for establishing and maintaining effective internal control over financial reporting as defined in Rules 13a-15(f) and 15d-15(f) under the Securities Exchange Act of 1934, as amended. RenaissanceRe's internal control over financial reporting was designed to provide reasonable assurance regarding the reliability of financial reporting and the preparation of financial statements for external purposes in accordance with U.S. generally accepted accounting principles and to reflect management's judgments and estimates concerning effects of events and transactions that are accounted for or disclosed. There are inherent limitations to the effectiveness of any controls. Controls, no matter how well conceived and operated, can provide only reasonable assurance that its objectives are met. No evaluation of controls can provide absolute assurance that all control issues and instances of fraud, if any, within RenaissanceRe have been detected.
Management, with the participation of the Chief Executive Officer and Chief Financial Officer, assessed its internal control over financial reporting as of December 31, 2012. In making this assessment, management used the criteria set forth by the Committee of Sponsoring Organizations of the Treadway Commission (COSO) in Internal Control-Integrated Framework. Based on this assessment, management believes that RenaissanceRe maintained effective internal control over financial reporting as of December 31, 2012.
RenaissanceRe's effectiveness of internal control over financial reporting as of December 31, 2012, has been audited by Ernst & Young Ltd., the Independent Registered Public Accountants who also audited RenaissanceRe's consolidated financial statements. Ernst & Young Ltd.'s attestation report on the effectiveness of RenaissanceRe's internal control over financial reporting appears on page F-4.
REPORT OF INDEPENDENT REGISTERED PUBLIC ACCOUNTING FIRM
TO THE BOARD OF DIRECTORS AND SHAREHOLDERS OF RENAISSANCERE HOLDINGS LTD.
We have audited the accompanying consolidated balance sheets of RenaissanceRe Holdings Ltd. and Subsidiaries as of December 31, 2012 and 2011, and the related consolidated statements of operations, comprehensive income (loss), changes in shareholders' equity and cash flows for each of the three years in the period ended December 31, 2012. These financial statements are the responsibility of the Company's management. Our responsibility is to express an opinion on these financial statements based on our audits.
We conducted our audits in accordance with the standards of the Public Company Accounting Oversight Board (United States). Those standards require that we plan and perform the audit to obtain reasonable assurance about whether the financial statements are free of material misstatement. An audit includes examining, on a test basis, evidence supporting the amounts and disclosures in the financial statements. An audit also includes assessing the accounting principles used and significant estimates made by management, as well as evaluating the overall financial statement presentation. We believe that our audits provide a reasonable basis for our opinion.
In our opinion, the financial statements referred to above present fairly, in all material respects, the consolidated financial position of RenaissanceRe Holdings Ltd. and Subsidiaries at December 31, 2012 and 2011, and the consolidated results of their operations and their cash flows for each of the three years in the period ended December 31, 2012, in conformity with U.S. generally accepted accounting principles.
We also have audited, in accordance with the standards of the Public Company Accounting Oversight Board (United States), RenaissanceRe Holdings Ltd.'s internal control over financial reporting as of December 31, 2012, based on criteria established in Internal Control-Integrated Framework issued by the Committee of Sponsoring Organizations of the Treadway Commission and our report dated February 21, 2013 expressed an unqualified opinion thereon.
/s/ Ernst & Young Ltd.
Hamilton, Bermuda
February 21, 2013
REPORT OF INDEPENDENT REGISTERED PUBLIC ACCOUNTING FIRM
TO THE BOARD OF DIRECTORS AND SHAREHOLDERS OF RENAISSANCERE HOLDINGS LTD.
We have audited RenaissanceRe Holdings Ltd. and Subsidiaries' internal control over financial reporting as of December 31, 2012, based on criteria established in Internal Control – Integrated Framework issued by the Committee of Sponsoring Organizations of the Treadway Commission (the COSO criteria). RenaissanceRe Holdings Ltd. and Subsidiaries' management is responsible for maintaining effective internal control over financial reporting, and for its assessment of the effectiveness of internal control over financial reporting included in the accompanying Management's Report on Internal Control over Financial Reporting. Our responsibility is to express an opinion on the Company's internal control over financial reporting based on our audit.
We conducted our audit in accordance with the standards of the Public Company Accounting Oversight Board (United States). Those standards require that we plan and perform the audit to obtain reasonable assurance about whether effective internal control over financial reporting was maintained in all material respects. Our audit included obtaining an understanding of internal control over financial reporting, assessing the risk that a material weakness exists, testing and evaluating the design and operating effectiveness of internal control based on the assessed risk, and performing such other procedures as we considered necessary in the circumstances. We believe that our audit provides a reasonable basis for our opinion.
A company's internal control over financial reporting is a process designed to provide reasonable assurance regarding the reliability of financial reporting and the preparation of financial statements for external purposes in accordance with generally accepted accounting principles. A company's internal control over financial reporting includes those policies and procedures that (1) pertain to the maintenance of records that, in reasonable detail, accurately and fairly reflect the transactions and dispositions of the assets of the company; (2) provide reasonable assurance that transactions are recorded as necessary to permit preparation of financial statements in accordance with generally accepted accounting principles, and that receipts and expenditures of the company are being made only in accordance with authorizations of management and directors of the company; and (3) provide reasonable assurance regarding prevention or timely detection of unauthorized acquisition, use or disposition of the company's assets that could have a material effect on the financial statements.
Because of its inherent limitations, internal control over financial reporting may not prevent or detect misstatements. Also, projections of any evaluation of effectiveness to future periods are subject to the risk that controls may become inadequate because of changes in conditions, or that the degree of compliance with the policies or procedures may deteriorate.
In our opinion, RenaissanceRe Holdings Ltd. and Subsidiaries maintained, in all material respects, effective internal control over financial reporting as of December 31, 2012, based on the COSO criteria.
We also have audited, in accordance with the standards of the Public Company Accounting Oversight Board (United States), the consolidated balance sheets of RenaissanceRe Holdings Ltd. and Subsidiaries as of December 31, 2012 and 2011, and the related consolidated statements of operations, comprehensive income (loss), changes in shareholders' equity and cash flows for each of the three years in the period ended December 31, 2012 of RenaissanceRe Holdings Ltd. and Subsidiaries and our report dated February 21, 2013 expressed an unqualified opinion thereon.
/s/ Ernst & Young Ltd.
Hamilton, Bermuda
February 21, 2013
RenaissanceRe Holdings Ltd. and Subsidiaries
Consolidated Balance Sheets
(in thousands of United States Dollars, except per share amounts)
|
| | | | | | | |
| | December 31,
2012 | | December 31,
2011 |
| Assets | | | |
| Fixed maturity investments trading, at fair value | | | |
| (Amortized cost $4,554,362 and $4,265,929 at December 31, 2012 and December 31, 2011, respectively) (Notes 5 and 6) | $ | 4,665,421 |
| | $ | 4,291,465 |
|
| Fixed maturity investments available for sale, at fair value | | | |
| (Amortized cost $71,445 and $130,669 at December 31, 2012 and December 31, 2011, respectively) (Notes 5 and 6) | 83,442 |
| | 142,052 |
|
| Short term investments, at fair value (Notes 5 and 6) | 821,163 |
| | 905,477 |
|
| Equity investments trading, at fair value (Notes 5 and 6) | 58,186 |
| | 50,560 |
|
| Other investments, at fair value (Notes 5 and 6) | 644,711 |
| | 748,984 |
|
| Investments in other ventures, under equity method (Note 5) | 87,724 |
| | 70,714 |
|
| Total investments | 6,360,647 |
| | 6,209,252 |
|
| Cash and cash equivalents | 325,358 |
| | 216,984 |
|
| Premiums receivable | 491,365 |
| | 471,878 |
|
| Prepaid reinsurance premiums (Note 7) | 77,082 |
| | 58,522 |
|
| Reinsurance recoverable (Notes 7 and 8) | 192,512 |
| | 404,029 |
|
| Accrued investment income | 33,478 |
| | 33,523 |
|
| Deferred acquisition costs | 52,622 |
| | 43,721 |
|
| Receivable for investments sold | 168,673 |
| | 117,117 |
|
| Other assets | 218,405 |
| | 180,992 |
|
| Goodwill and other intangible assets (Note 4) | 8,486 |
| | 8,894 |
|
| Total assets | $ | 7,928,628 |
| | $ | 7,744,912 |
|
| Liabilities, Noncontrolling Interests and Shareholders’ Equity | | | |
| Liabilities | | | |
| Reserve for claims and claim expenses (Note 8) | $ | 1,879,377 |
| | $ | 1,992,354 |
|
| Unearned premiums | 399,517 |
| | 347,655 |
|
| Debt (Note 9) | 351,775 |
| | 353,620 |
|
| Reinsurance balances payable | 290,419 |
| | 256,883 |
|
| Payable for investments purchased | 278,787 |
| | 303,264 |
|
| Other liabilities | 253,438 |
| | 211,369 |
|
| Liabilities of discontinued operations held for sale (Note 3) | — |
| | 13,507 |
|
| Total liabilities | 3,453,313 |
| | 3,478,652 |
|
| Commitments and Contingencies (Note 20) |
| |
|
| Redeemable noncontrolling interest – DaVinciRe (Note 10) | 968,259 |
| | 657,727 |
|
| Shareholders’ Equity (Note 12) | | | |
| Preference Shares: $1.00 par value – 16,000,000 shares issued and outstanding at December 31, 2012 (December 31, 2011 – 22,000,000) | 400,000 |
| | 550,000 |
|
| Common shares: $1.00 par value – 45,542,203 shares issued and outstanding at December 31, 2012 (December 31, 2011 – 51,542,955) | 45,542 |
| | 51,543 |
|
| Accumulated other comprehensive income | 13,622 |
| | 11,760 |
|
| Retained earnings | 3,043,901 |
| | 2,991,890 |
|
| Total shareholders’ equity attributable to RenaissanceRe | 3,503,065 |
| | 3,605,193 |
|
| Noncontrolling interest (Note 10) | 3,991 |
| | 3,340 |
|
| Total shareholders’ equity | 3,507,056 |
| | 3,608,533 |
|
| Total liabilities, noncontrolling interests and shareholders’ equity | $ | 7,928,628 |
| | $ | 7,744,912 |
|
See accompanying notes to the consolidated financial statements
RenaissanceRe Holdings Ltd. and Subsidiaries
Consolidated Statements of Operations
For the years ended December 31, 2012, 2011, and 2010
(in thousands of United States Dollars, except per share amounts)
|
| | | | | | | | | | | |
| | 2012 | | 2011 | | 2010 |
| Revenues | | | | | |
| Gross premiums written | $ | 1,551,591 |
| | $ | 1,434,976 |
| | $ | 1,165,295 |
|
| Net premiums written (Note 7) | $ | 1,102,657 |
| | $ | 1,012,773 |
| | $ | 848,965 |
|
| (Increase) decrease in unearned premiums | (33,302 | ) | | (61,724 | ) | | 15,956 |
|
| Net premiums earned (Note 7) | 1,069,355 |
| | 951,049 |
| | 864,921 |
|
| Net investment income (Note 5) | 167,375 |
| | 118,000 |
| | 203,955 |
|
| Net foreign exchange gains (losses) | 5,223 |
| | (6,911 | ) | | (17,126 | ) |
| Equity in earnings (losses) of other ventures (Note 5) | 23,238 |
| | (36,533 | ) | | (11,814 | ) |
| Other (loss) income | (22,905 | ) | | (685 | ) | | 41,120 |
|
| Net realized and unrealized gains on investments (Note 5) | 163,991 |
| | 70,668 |
| | 144,444 |
|
| Total other-than-temporary impairments | (395 | ) | | (630 | ) | | (831 | ) |
| Portion recognized in other comprehensive income (loss), before taxes | 52 |
| | 78 |
| | 2 |
|
| Net other-than-temporary impairments (Note 5) | (343 | ) | | (552 | ) | | (829 | ) |
| Total revenues | 1,405,934 |
| | 1,095,036 |
| | 1,224,671 |
|
| Expenses | | | | | |
| Net claims and claim expenses incurred (Notes 7 and 8) | 325,211 |
| | 861,179 |
| | 129,345 |
|
| Acquisition expenses | 113,542 |
| | 97,376 |
| | 94,961 |
|
| Operational expenses | 179,301 |
| | 169,666 |
| | 166,042 |
|
| Corporate expenses | 16,692 |
| | 18,264 |
| | 20,136 |
|
| Interest expense (Note 9) | 23,097 |
| | 23,368 |
| | 21,829 |
|
| Total expenses | 657,843 |
| | 1,169,853 |
| | 432,313 |
|
| Income (loss) from continuing operations before taxes | 748,091 |
| | (74,817 | ) | | 792,358 |
|
| Income tax (expense) benefit (Note 15) | (1,429 | ) | | 315 |
| | 6,124 |
|
| Income (loss) from continuing operations | 746,662 |
| | (74,502 | ) | | 798,482 |
|
| Income (loss) from discontinued operations (Note 3) | 2,287 |
| | (15,890 | ) | | 62,670 |
|
| Net income (loss) | 748,949 |
| | (90,392 | ) | | 861,152 |
|
| Net (income) loss attributable to noncontrolling interests (Note 10) | (148,040 | ) | | 33,157 |
| | (116,421 | ) |
| Net income (loss) attributable to RenaissanceRe | 600,909 |
| | (57,235 | ) | | 744,731 |
|
| Dividends on preference shares (Note 12) | (34,895 | ) | | (35,000 | ) | | (42,118 | ) |
| Net income (loss) available (attributable) to RenaissanceRe common shareholders | $ | 566,014 |
| | $ | (92,235 | ) | | $ | 702,613 |
|
| Income (loss) from continuing operations available (attributable) to RenaissanceRe common shareholders per common share – basic | $ | 11.35 |
| | $ | (1.53 | ) | | $ | 11.28 |
|
| Income (loss) from discontinued operations available (attributable) to RenaissanceRe common shareholders per common share – basic | 0.05 |
| | (0.31 | ) | | 1.14 |
|
| Net income (loss) available (attributable) to RenaissanceRe common shareholders per common share – basic (Note 13) | $ | 11.40 |
| | $ | (1.84 | ) | | $ | 12.42 |
|
| Income (loss) from continuing operations available (attributable) to RenaissanceRe common shareholders per common share – diluted | $ | 11.18 |
| | $ | (1.53 | ) | | $ | 11.18 |
|
| Income (loss) from discontinued operations available (attributable) to RenaissanceRe common shareholders per common share – diluted | 0.05 |
| | (0.31 | ) | | 1.13 |
|
| Net income (loss) available (attributable) to RenaissanceRe common shareholders per common share – diluted (Note 13) | $ | 11.23 |
| | $ | (1.84 | ) | | $ | 12.31 |
|
| Dividends per common share (Note 12) | $ | 1.08 |
| | $ | 1.04 |
| | $ | 1.00 |
|
See accompanying notes to the consolidated financial statements
RenaissanceRe Holdings Ltd. and Subsidiaries
Consolidated Statements of Comprehensive Income (Loss)
For the years ended December 31, 2012, 2011 and 2010
(in thousands of United States Dollars)
|
| | | | | | | | | | | |
| | 2012 | | 2011 | | 2010 |
| Comprehensive income (loss) | | | | | |
| Net income (loss) | $ | 748,949 |
| | $ | (90,392 | ) | | $ | 861,152 |
|
| Change in net unrealized gains on investments | 1,914 |
| | (7,991 | ) | | (25,040 | ) |
| Portion of other-than-temporary impairments recognized in other comprehensive income (loss), before taxes | (52 | ) | | (78 | ) | | (2 | ) |
| Comprehensive income (loss) | 750,811 |
| | (98,461 | ) | | 836,110 |
|
| Net (income) loss attributable to noncontrolling interests | (148,040 | ) | | 33,157 |
| | (116,421 | ) |
| Change in net unrealized gains on fixed maturity investments available for sale attributable to noncontrolling interests | — |
| | 6 |
| | 3,427 |
|
| Comprehensive (income) loss attributable to noncontrolling interests | (148,040 | ) | | 33,163 |
| | (112,994 | ) |
| Comprehensive income (loss) attributable to RenaissanceRe | $ | 602,771 |
| | $ | (65,298 | ) | | $ | 723,116 |
|
| Disclosure regarding net unrealized gains | | | | | |
| Total realized and net unrealized holding gains (losses) on investments and net other-than-temporary impairments | $ | 5,100 |
| | $ | (2,426 | ) | | $ | 58,284 |
|
| Net realized gains on fixed maturity investments available for sale (1) | (3,529 | ) | | (6,111 | ) | | (80,726 | ) |
| Net other-than-temporary impairments recognized in earnings | 343 |
| | 552 |
| | 829 |
|
| Change in net unrealized gains on investments | $ | 1,914 |
| | $ | (7,985 | ) | | $ | (21,613 | ) |
| |
| (1) | Included in net realized gains on fixed maturity investments available for sale is $Nil, $Nil and $7.7 million of net realized gains on fixed maturity investments available for sale included within the Company's discontinued operations for the years ended December 31, 2012, 2011 and 2010, respectively. |
See accompanying notes to the consolidated financial statements
RenaissanceRe Holdings Ltd. and Subsidiaries
Consolidated Statements of Changes in Shareholders' Equity
For the years ended December 31, 2012, 2011 and 2010
(in thousands of United States Dollars)
|
| | | | | | | | | | | |
| | 2012 | | 2011 | | 2010 |
| Preference shares | | | | | |
| Balance – January 1 | $ | 550,000 |
| | $ | 550,000 |
| | $ | 650,000 |
|
| Repurchase of shares | (150,000 | ) | | — |
| | (100,000 | ) |
| Balance – December 31 | 400,000 |
| | 550,000 |
| | 550,000 |
|
| Common shares | | | | | |
| Balance – January 1 | 51,543 |
| | 54,110 |
| | 61,745 |
|
| Repurchase of shares | (6,399 | ) | | (2,889 | ) | | (8,198 | ) |
| Exercise of options and issuance of restricted stock awards (Notes 12 and 17) | 398 |
| | 322 |
| | 563 |
|
| Balance – December 31 | 45,542 |
| | 51,543 |
| | 54,110 |
|
| Additional paid-in capital | | | | | |
| Balance – January 1 | — |
| | — |
| | — |
|
| Repurchase of shares | (27,376 | ) | | (13,923 | ) | | (30,284 | ) |
| Change in redeemable noncontrolling interest | 9,091 |
| | (473 | ) | | 5,200 |
|
| Exercise of options and issuance of restricted stock awards (Notes 12 and 17) | 18,285 |
| | 14,396 |
| | 25,084 |
|
| Balance – December 31 | — |
| | — |
| | — |
|
| Accumulated other comprehensive income | | | | | |
| Balance – January 1 | 11,760 |
| | 19,823 |
| | 41,438 |
|
| Change in net unrealized gains on investments | 1,914 |
| | (7,985 | ) | | (21,613 | ) |
| Portion of other-than-temporary impairments recognized in other comprehensive income (loss) | (52 | ) | | (78 | ) | | (2 | ) |
| Balance – December 31 | 13,622 |
| | 11,760 |
| | 19,823 |
|
| Retained earnings | | | | | |
| Balance – January 1 | 2,991,890 |
| | 3,312,392 |
| | 3,087,603 |
|
| Net income (loss) | 748,949 |
| | (90,392 | ) | | 861,152 |
|
| Net (income) loss attributable to noncontrolling interests (Note 10) | (148,040 | ) | | 33,157 |
| | (116,421 | ) |
| Repurchase of shares | (460,647 | ) | | (174,807 | ) | | (421,888 | ) |
| Dividends on common shares | (53,356 | ) | | (53,460 | ) | | (55,936 | ) |
| Dividends on preference shares | (34,895 | ) | | (35,000 | ) | | (42,118 | ) |
| Balance – December 31 | 3,043,901 |
| | 2,991,890 |
| | 3,312,392 |
|
| Noncontrolling interest (Note 10) | 3,991 |
| | 3,340 |
| | 2,889 |
|
| Total shareholders' equity | $ | 3,507,056 |
| | $ | 3,608,533 |
| | $ | 3,939,214 |
|
See accompanying notes to the consolidated financial statements
RenaissanceRe Holdings Ltd. and Subsidiaries
Consolidated Statements of Cash Flows
For the years ended December 31, 2012, 2011 and 2010
(in thousands of United States Dollars)
|
| | | | | | | | | | | |
| | 2012 | | 2011 | | 2010 |
| Cash flows provided by operating activities | | | | | |
| Net income (loss) | $ | 748,949 |
| | $ | (90,392 | ) | | $ | 861,152 |
|
| Adjustments to reconcile net income (loss) to net cash provided by operating activities | | | | | |
| Amortization, accretion and depreciation | 59,695 |
| | 42,298 |
| | 59,719 |
|
| Equity in undistributed (earnings) losses of other ventures | (19,316 | ) | | 39,581 |
| | 23,959 |
|
| Net realized and unrealized gains on investments | (163,991 | ) | | (70,668 | ) | | (151,213 | ) |
| Net other-than-temporary impairments | 343 |
| | 552 |
| | 829 |
|
| Net unrealized gains included in net investment income | (39,832 | ) | | (22,683 | ) | | (57,540 | ) |
| Net unrealized (gains) losses included in other (loss) income | (330 | ) | | 1,553 |
| | (12,337 | ) |
| Change in: | | | | | |
| Premiums receivable | (19,487 | ) | | (149,798 | ) | | (23,215 | ) |
| Prepaid reinsurance premiums | (18,560 | ) | | 2,121 |
| | 14,030 |
|
| Reinsurance recoverable | 211,517 |
| | (302,318 | ) | | 10,110 |
|
| Deferred acquisition costs | (8,901 | ) | | (8,073 | ) | | 10,479 |
|
| Reserve for claims and claim expenses | (112,977 | ) | | 734,511 |
| | (169,974 | ) |
| Unearned premiums | 51,862 |
| | 61,472 |
| | (46,023 | ) |
| Reinsurance balances payable | 33,536 |
| | (61,141 | ) | | (29,432 | ) |
| Other | (5,579 | ) | | (11,082 | ) | | 4,176 |
|
| Net cash provided by operating activities | 716,929 |
| | 165,933 |
| | 494,720 |
|
| Cash flows (used in) provided by investing activities | | | | | |
| Proceeds from sales and maturities of fixed maturity investments trading | 8,192,867 |
| | 6,089,468 |
| | 7,795,587 |
|
| Purchases of fixed maturity investments trading | (8,536,238 | ) | | (6,271,623 | ) | | (11,122,823 | ) |
| Proceeds from sales and maturities of fixed maturity investments available for sale | 65,168 |
| | 106,362 |
| | 3,751,669 |
|
| Purchases of fixed maturity investments available for sale | — |
| | (4,107 | ) | | (403,660 | ) |
| Purchases of equity investments trading | — |
| | (47,995 | ) | | — |
|
| Net sales (purchases) of short term investments | 68,777 |
| | 103,148 |
| | (26,752 | ) |
| Net sales of other investments | 150,828 |
| | 50,940 |
| | 122,065 |
|
| Net purchases of investments in other ventures | — |
| | (39,000 | ) | | (1,915 | ) |
| Net (purchases) sales of other assets | (4,079 | ) | | 58,318 |
| | (5,561 | ) |
| Net (payments) proceeds related to sale of discontinued operations | (9,000 | ) | | 269,520 |
| | — |
|
| Net cash (used in) provided by investing activities | (71,677 | ) | | 315,031 |
| | 108,610 |
|
| Cash flows used in financing activities | | | | | |
| Dividends paid – RenaissanceRe common shares | (53,356 | ) | | (53,460 | ) | | (55,936 | ) |
| Dividends paid – preference shares | (34,895 | ) | | (35,000 | ) | | (42,118 | ) |
| RenaissanceRe common share repurchases | (463,309 | ) | | (191,619 | ) | | (448,882 | ) |
| Net (repayment) drawdown of debt | (1,937 | ) | | (200,000 | ) | | 249,046 |
|
| Redemption of preference shares | (150,000 | ) | | — |
| | (100,000 | ) |
| Net third party DaVinciRe share transactions | 164,927 |
| | (62,157 | ) | | (136,702 | ) |
| Third party investment in noncontrolling interest | — |
| | — |
| | 3,000 |
|
| Net cash used in financing activities | (538,570 | ) | | (542,236 | ) | | (531,592 | ) |
| Effect of exchange rate changes on foreign currency cash | 1,692 |
| | 518 |
| | (1,003 | ) |
| Net increase (decrease) in cash and cash equivalents | 108,374 |
| | (60,754 | ) | | 70,735 |
|
| Net decrease in cash and cash equivalents of discontinued operations | — |
| | — |
| | 3,891 |
|
| Cash and cash equivalents, beginning of period | 216,984 |
| | 277,738 |
| | 203,112 |
|
| Cash and cash equivalents, end of period | $ | 325,358 |
| | $ | 216,984 |
| | $ | 277,738 |
|
See accompanying notes to the consolidated financial statements
RENAISSANCERE HOLDINGS LTD. AND SUBSIDIARIES
NOTES TO THE CONSOLIDATED FINANCIAL STATEMENTS
December 31, 2012
(unless otherwise noted, amounts in tables expressed in thousands of United States ("U.S.") dollars, except per share amounts and percentages)
NOTE 1. ORGANIZATION
RenaissanceRe Holdings Ltd. ("RenaissanceRe") was formed under the laws of Bermuda on June 7, 1993. Together with its wholly owned and majority-owned subsidiaries and DaVinciRe (as defined below), which are collectively referred to herein as the "Company", RenaissanceRe provides reinsurance and insurance coverages and related services to a broad range of customers.
| |
| • | Renaissance Reinsurance Ltd. ("Renaissance Reinsurance"), the Company's principal reinsurance subsidiary, provides property catastrophe and specialty reinsurance coverages to insurers and reinsurers on a worldwide basis. |
| |
| • | The Company also manages property catastrophe and specialty reinsurance business written on behalf of joint ventures, which principally include Top Layer Reinsurance Ltd. ("Top Layer Re"), recorded under the equity method of accounting, and DaVinci Reinsurance Ltd. ("DaVinci"). Because the Company owns a noncontrolling equity interest in, but controls a majority of the outstanding voting power of DaVinci's parent, DaVinciRe Holdings Ltd. ("DaVinciRe"), the results of DaVinci and DaVinciRe are consolidated in the Company's financial statements. Redeemable noncontrolling interest – DaVinciRe represents the interests of external parties with respect to the net (income) loss and shareholders' equity of DaVinciRe. Renaissance Underwriting Managers, Ltd. ("RUM"), a wholly owned subsidiary, acts as exclusive underwriting manager for these joint ventures in return for fee-based income and profit participation. |
| |
| • | Glencoe Insurance Ltd. ("Glencoe") is a Bermuda domiciled excess and surplus lines insurance company that is currently eligible to do business on an excess and surplus lines basis in 49 U.S. states, the District of Columbia, Puerto Rico and the U.S. Virgin Islands. |
| |
| • | RenaissanceRe Syndicate 1458 ("Syndicate 1458") is the Company's Lloyd's syndicate. RenaissanceRe Corporate Capital (UK) Limited ("RenaissanceRe CCL"), a wholly owned subsidiary of RenaissanceRe, is Syndicate 1458's sole corporate member and RenaissanceRe Syndicate Management Ltd. ("RSML"), a wholly owned subsidiary of RenaissanceRe, is the managing agent for Syndicate 1458. |
| |
| • | The Company, through Renaissance Trading Ltd. ("Renaissance Trading") and RenRe Energy Advisors Ltd. ("REAL"), transacts certain derivative-based risk management products primarily to address weather and energy risk and engages in hedging and trading activities related to those transactions. |
NOTE 2. SIGNIFICANT ACCOUNTING POLICIES
BASIS OF PRESENTATION
The consolidated financial statements have been prepared on the basis of accounting principles generally accepted in the United States ("GAAP"). All significant intercompany accounts and transactions have been eliminated from these statements. Except as discussed in "Note 3. Discontinued Operations," and unless otherwise noted, the notes to the consolidated financial statements reflect the Company's continuing operations.
Certain comparative information has been reclassified to conform to the current presentation.
USE OF ESTIMATES IN FINANCIAL STATEMENTS
The preparation of financial statements in conformity with GAAP requires management to make estimates and assumptions that affect the reported and disclosed amounts of assets and liabilities and disclosure of contingent assets and liabilities at the date of the financial statements and the reported amounts of revenues and expenses during the reporting period. Actual results could differ materially from those
estimates. The major estimates reflected in the Company's consolidated financial statements include, but are not limited to, the reserve for claims and claim expenses, reinsurance recoverables, including allowances for reinsurance recoverables deemed uncollectible, estimates of written and earned premiums, fair value, including the fair value of investments, financial instruments and derivatives, impairment charges and the Company's deferred tax valuation allowance.
DISCONTINUED OPERATIONS
The results of operations of substantially all of the Company's former U.S.-based insurance operations sold to QBE Holdings, Inc. ("QBE") are classified as held for sale and are reported as discontinued operations in accordance with Financial Accounting Standards Board ("FASB") Accounting Standards Codification ("ASC") Topic Discontinued Operations. The consolidated financial statements and notes thereto are presented excluding the operations and cash flows of the discontinued operations from the continuing operations of the Company since the Company does not have any significant continuing involvement in the operations after the sale. The financial position and results of operations of discontinued operations are presented as single line items on the consolidated balance sheets and statements of operations, respectively.
PREMIUMS AND RELATED EXPENSES
Premiums are recognized as income, net of any applicable reinsurance or retrocessional coverage purchased, over the terms of the related contracts and policies. Premiums written are based on contract and policy terms and include estimates based on information received from both insureds and ceding companies. Subsequent differences arising on such estimates are recorded in the period in which they are determined. Unearned premiums represents the portion of premiums written that relate to the unexpired terms of contracts and policies in force. Amounts are computed by pro-rata methods based on statistical data or reports received from ceding companies. Reinstatement premiums are estimated after the occurrence of a significant loss and are recorded in accordance with the contract terms based upon paid losses and case reserves. Reinstatement premiums are earned when written.
Acquisition costs, consisting principally of commissions, brokerage and premium tax expenses incurred at the time a contract or policy is issued, are deferred and amortized over the period in which the related premiums are earned. Deferred policy acquisition costs are limited to their estimated realizable value based on the related unearned premiums. Anticipated claims and claim expenses, based on historical and current experience, and anticipated investment income related to those premiums are considered in determining the recoverability of deferred acquisition costs.
CLAIMS AND CLAIM EXPENSES
The reserve for claims and claim expenses includes estimates for unpaid claims and claim expenses on reported losses as well as an estimate of losses incurred but not reported. The reserve is based on individual claims, case reserves and other reserve estimates reported by insureds and ceding companies as well as management estimates of ultimate losses. Inherent in the estimates of ultimate losses are expected trends in claim severity and frequency and other factors which could vary significantly as claims are settled. Also, during the past few years, the Company has increased its specialty reinsurance business, but does not have the benefit of a significant amount of its own historical experience in certain of these lines of business. Accordingly, the setting and reserving for incurred losses in these lines of business could be subject to greater variability.
Ultimate losses may vary materially from the amounts provided in the consolidated financial statements. These estimates are reviewed regularly and, as experience develops and new information becomes known, the reserves are adjusted as necessary. Such adjustments, if any, are reflected in the consolidated statements of operations in the period in which they become known and are accounted for as changes in estimates.
REINSURANCE
Amounts recoverable from reinsurers are estimated in a manner consistent with the claim liability associated with the reinsured policies. For multi-year retrospectively rated contracts, the Company accrues amounts (either assets or liabilities) that are due to or from assuming companies based on estimated contract experience. If the Company determines that adjustments to earlier estimates are appropriate, such adjustments are recorded in the period in which they are determined. Reinsurance recoverables on dual trigger reinsurance contracts require the Company to estimate its ultimate losses applicable to these contracts as well as estimate the ultimate amount of insured industry losses that will be reported by the applicable statistical reporting agency, as per the contract terms. Amounts recoverable from reinsurers are recorded net of a valuation allowance for estimated uncollectible recoveries.
Assumed and ceded reinsurance contracts that lack a significant transfer of risk are treated as deposits.
INVESTMENTS, CASH AND CASH EQUIVALENTS
Fixed Maturity Investments
Investments in fixed maturities are classified as available for sale or trading and are reported at fair value. Investment transactions are recorded on the trade date with balances pending settlement reflected in the balance sheet as a receivable for investments sold or a payable for investments purchased. Net investment income includes interest and dividend income together with amortization of market premiums and discounts and is net of investment management and custody fees. The amortization of premium and accretion of discount for fixed maturity securities is computed using the effective yield method. For mortgage-backed securities and other holdings for which there is prepayment risk, prepayment assumptions are evaluated quarterly and revised as necessary. Any adjustments required due to the change in effective yields and maturities are recognized on a prospective basis through yield adjustments. Fair values of investments are based on quoted market prices, or when such prices are not available, by reference to broker or underwriter bid indications and/or internal pricing valuation techniques. The net unrealized appreciation or depreciation on fixed maturity investments available for sale is included in accumulated other comprehensive income. The net unrealized appreciation or depreciation on fixed maturity investments trading is included in net realized and unrealized gains on investments in the consolidated statements of operations. Realized gains or losses on the sale of investments are determined on the basis of the first in first out cost method and, for fixed maturity investments available for sale, include adjustments to the cost basis of investments for declines in value that are considered to be other-than-temporary.
Other-Than-Temporary Impairments
The Company recognizes other-than-temporary impairments in earnings for its impaired fixed maturity securities available for sale (i) for which the Company has the intent to sell the security or (ii) it is more likely than not that the Company will be required to sell the debt security before its anticipated recovery and (iii) for those securities which have a credit loss. In assessing whether a credit loss exists, the Company compares the present value of the cash flows expected to be collected from the security with the amortized cost basis of the security. In instances in which a determination is made that an impairment exists but the Company does not intend to sell the security and it is not more likely than not that the Company will be required to sell the security before the anticipated recovery of its remaining amortized cost basis, the impairment is separated into (i) the amount of the total impairment related to the credit loss and (ii) the amount of the total impairment related to all other factors. The amount of the total other-than-temporary impairment related to the credit loss is recognized in earnings. The amount of the total other-than-temporary impairment related to all other factors is recognized in other comprehensive income. In periods after the recognition of other-than-temporary impairments on the Company's fixed maturity securities available for sale, the Company accounts for such securities as if they had been purchased on the measurement date of the other-than-temporary impairment at an amortized cost basis equal to the previous amortized cost basis less the other-than-temporary impairment recognized in earnings. For debt securities in which other-than-temporary impairments were recognized in earnings, the difference between the new amortized cost basis and the cash flows expected to be collected will be amortized into net investment income.
Equity Investments, Classified as Trading
Equity investments are accounted for at fair value in accordance with FASB ASC Topic Financial Instruments. Fair values are primarily priced by pricing services, reflecting the closing price quoted for the final trading day of the period. Net investment income includes dividend income and the net realized and unrealized appreciation or depreciation on equity investments is included in net realized and unrealized gains on investments in the consolidated statements of operations.
Short Term Investments and Cash and Cash Equivalents
Short term investments, which are managed as part of the Company's investment portfolio and have a maturity of one year or less when purchased, are carried at amortized cost, which approximates fair value. The net unrealized appreciation or depreciation on short term investments is included in net realized and unrealized gains on investments in the consolidated statements of operations. Cash equivalents include money market instruments with a maturity of ninety days or less when purchased.
Other Investments
The Company accounts for its other investments at fair value in accordance with FASB ASC Topic Financial Instruments. The fair value of certain of the Company's fund investments, which principally include hedge funds, private equity funds, senior secured bank loan funds and non-U.S. fixed income funds, are recorded on its balance sheet in other investments, and is generally established on the basis of the net valuation criteria established by the managers of such investments, if applicable. The net valuation criteria established by the managers of such investments is established in accordance with the governing documents of such investments. Certain of the Company's fund managers, fund administrators, or both, are unable to provide final fund valuations as of the Company's current reporting date. The typical reporting lag experienced by the Company to receive a final net asset value report is one month for hedge funds, senior secured bank loan funds and non-U.S. fixed income funds and three months for private equity funds, although, in the past, in respect of certain of the Company's private equity funds, the Company has on occasion experienced delays of up to six months at year end, as the private equity funds typically complete their respective year-end audits before releasing their final net asset value statements.
In circumstances where there is a reporting lag between the current period end reporting date and the reporting date of the latest fund valuation, the Company estimates the fair value of these funds by starting with the prior month or quarter-end fund valuations, adjusting these valuations for actual capital calls, redemptions or distributions, as well as the impact of changes in foreign currency exchange rates, and then estimating the return for the current period. In circumstances in which the Company estimates the return for the current period, all information available to the Company is utilized. This principally includes preliminary estimates reported to the Company by its fund managers, obtaining the valuation of underlying portfolio investments where such underlying investments are publicly traded and therefore have a readily observable price, using information that is available to the Company with respect to the underlying investments, reviewing various indices for similar investments or asset classes, as well as estimating returns based on the results of similar types of investments for which the Company has obtained reported results, or other valuation methods, where possible. Actual final fund valuations may differ, perhaps materially so, from the Company's estimates and these differences are recorded in the Company's statement of operations in the period in which they are reported to the Company as a change in estimate.
The Company's other investments also include investments in catastrophe bonds which are recorded at fair value and is based on broker or underwriter bid indications.
Investments in Other Ventures
Investments in which the Company has significant influence over the operating and financial policies of the investee are classified as investments in other ventures, under equity method, and are accounted for under the equity method of accounting. Under this method, the Company records its proportionate share of income or loss from such investments in its results for the period. Any decline in value of investments in other ventures, under equity method considered by management to be other-than-temporary is charged to income in the period in which it is determined.
STOCK INCENTIVE COMPENSATION
The Company is authorized to issue restricted stock awards and units, stock options and other equity-based awards to its employees and directors. The fair value of the compensation cost is measured at the grant date and expensed over the period for which the employee is required to provide services in exchange for the award. Forfeiture benefits are estimated on a quarterly basis and incorporated in the determination of stock-based compensation.
DERIVATIVES
The Company enters into derivative instruments such as futures, options, swaps, forward contracts and other derivative contracts in order to manage its foreign currency exposure, obtain exposure to a particular financial market, for yield enhancement, or for trading and speculation. The Company accounts for its derivatives in accordance with FASB ASC Topic Derivatives and Hedging, which requires all derivatives to be recorded at fair value on the Company's balance sheet as either assets or liabilities, depending on their rights or obligations, with changes in fair value reflected in current earnings. The Company does not currently apply hedge accounting. The fair value of the Company's derivatives are estimated by reference to quoted prices or broker quotes, where available, or in the absence of quoted prices or broker quotes, the use of industry or internal valuation models.
FAIR VALUE
The Company accounts for certain of its assets and liabilities at fair value in accordance with FASB ASC Topic Fair Value Measurements and Disclosures. The Company recognizes the change in unrealized gains and losses arising from changes in fair value in its statements of operations, with the exception of changes in unrealized gains and losses on its fixed maturity investments available for sale, which are recognized as a component of accumulated other comprehensive income (loss) in shareholders' equity.
BUSINESS COMBINATIONS, GOODWILL AND OTHER INTANGIBLE ASSETS
The Company accounts for business combinations in accordance with FASB ASC Topic Business Combinations, and goodwill and other intangible assets that arise from business combinations in accordance with FASB ASC Topic Intangibles – Goodwill and Other. A purchase price that is in excess of the fair value of the net assets acquired arising from a business combination is recorded as goodwill, and is not amortized. Other intangible assets with a finite life are amortized over the estimated useful life of the asset. Other intangible assets with an indefinite useful life are not amortized.
Goodwill and other indefinite life intangible assets are tested for impairment on an annual basis or more frequently if events or changes in circumstances indicate that the carrying amount may not be recoverable. Definite life intangible assets are reviewed for indicators of impairment on an annual basis or more frequently if events or changes in circumstances indicate that the carrying amount may not be recoverable, and tested for impairment if appropriate. For purposes of the annual impairment evaluation, goodwill is assigned to the applicable reporting unit of the acquired entities giving rise to the goodwill. Goodwill and other intangible assets recorded in connection with investments accounted for under the equity method, are recorded as "Investments in other ventures, under equity method" on the Company's consolidated balance sheets.
The Company has established the beginning of the fourth quarter as the date for performing its annual impairment tests. If goodwill or other intangible assets are impaired, they are written down to their estimated fair value with a corresponding expense reflected in the Company's consolidated statements of operations.
NONCONTROLLING INTERESTS
The Company accounts for its noncontrolling interest in the shareholders' equity section of the Company's consolidated balance sheet in accordance with FASB ASC Topic Consolidations, and presents such noncontrolling shareholders' interest in the net assets of the subsidiary. Net (income) loss attributable to noncontrolling interests is presented separately in the Company's consolidated statements of operations.
In addition, the Company accounts for its redeemable noncontrolling interest in DaVinciRe in the mezzanine section of the Company's consolidated balance sheet in accordance with Securities and Exchange
Commission ("SEC") guidance which is applicable to SEC registrants. The SEC guidance requires shares, not required to be accounted for in accordance with FASB ASC Topic Distinguishing Liabilities from Equity, and having redemption features that are not solely within the control of the issuer, to be classified outside of permanent equity in the mezzanine section of the balance sheet. Because the share classes related to the redeemable noncontrolling interest portion of DaVinciRe are not considered liabilities in accordance with FASB ASC Topic Distinguishing Liabilities from Equity and have redemption features that are not solely within the control of DaVinciRe, the redeemable noncontrolling interest in DaVinciRe is presented in the mezzanine section on the Company's consolidated balance sheet in accordance with the SEC guidance noted above. The SEC guidance does not impact the accounting for redeemable noncontrolling interest on the consolidated statements of operations; therefore, the provisions of FASB ASC Topic Consolidation with respect to the consolidated statements of operations still apply. Refer to "Note 10. Noncontrolling Interests" for more information.
VARIABLE INTEREST ENTITIES
The Company accounts for variable interest entities ("VIE") in accordance with FASB ASC Topic Consolidation, which requires the consolidation of all VIE's by the primary beneficiary, that being the investor that has the power to direct the activities of the VIE and will absorb a majority of the VIE's expected losses or residual returns. The Company determines whether it is the primary beneficiary of a VIE by performing an analysis that principally considers: (i) the VIE's purpose and design, including the risks the VIE was designed to create and pass through to its variable interest holders; (ii) the VIE's capital structure; (iii) the terms between the VIE and its variable interest holders and other parties involved with the VIE; (iv) which variable interest holders have the power to direct the activities of the VIE that most significantly impact the VIE's economic performance; (v) which variable interest holders have the obligation to absorb losses or the right to receive benefits from the VIE that could potentially be significant to the VIE; and (vi) related party relationships. The Company reassesses its initial determination of whether the Company is the primary beneficiary of a VIE upon changes in facts and circumstances that could potentially alter the Company's assessment. Refer to "Note 11. Variable Interest Entities" for additional information.
EARNINGS PER SHARE
The Company calculates earnings per share in accordance with FASB ASC Topic Earnings per Share. Basic earnings per share are based on weighted average common shares and exclude any dilutive effects of options and restricted stock. Diluted earnings per share assumes the exercise of all dilutive stock options and restricted stock grants.
The two-class method is used to determine earnings per share based on dividends declared on common stock and participating securities (i.e. distributed earnings) and participation rights of participating securities in any undistributed earnings. Unvested restricted stock granted by the Company to its employees is considered a participating security and the Company uses the two-class method to calculate its net income (loss) available (attributable) to RenaissanceRe common shareholders per common share – basic and diluted.
FOREIGN EXCHANGE
The Company's functional currency is the U.S. dollar. Revenues and expenses denominated in foreign currencies are translated at the prevailing exchange rate at the transaction date. Monetary assets and liabilities denominated in foreign currencies are translated at exchange rates in effect at the balance sheet date, which may result in the recognition of exchange gains or losses which are included in the determination of net income (loss).
TAXATION
Income taxes have been provided in accordance with the provisions of FASB ASC Topic Income Taxes. Deferred tax assets and liabilities result from temporary differences between the amounts recorded in the consolidated financial statements and the tax basis of the Company's assets and liabilities. Such temporary differences are primarily due to net operating loss carryforwards and GAAP versus tax basis accounting differences relating to interest expense, underwriting results, accrued expenses and investments. The effect on deferred tax assets and liabilities of a change in tax rates is recognized in income in the period
that includes the enactment date. A valuation allowance against deferred tax assets is recorded if it is more likely than not that all, or some portion, of the benefits related to deferred tax assets will not be realized.
Uncertain tax positions are also accounted for in accordance with FASB ASC Topic Income Taxes. Uncertain tax positions must meet a more-likely-than-not recognition threshold to be recognized.
RECENTLY ADOPTED ACCOUNTING PRONOUNCEMENTS
Accounting for Costs Associated with Acquiring or Renewing Insurance Contracts
In October 2010, the FASB issued Accounting Standards Update ("ASU") No. 2010-26, Accounting for Costs Associated with Acquiring or Renewing Insurance Contracts ("ASU 2010-26"), which amends FASB ASC Topic Financial Services - Insurance. ASU 2010-26 modifies the definition of the types of costs that can be capitalized in relation to the acquisition of new and renewal insurance contracts. The amended guidance requires costs to be incremental and directly related to the successful acquisition of new or renewal contracts in order to be capitalized as a deferred acquisition cost. Capitalized costs would include incremental direct costs, such as commissions paid to brokers. Additionally, the portion of employee salaries and benefits directly related to time spent for acquired contracts would be capitalized. Costs that fall outside the revised definition must be expensed when incurred. ASU 2010-26 became effective for fiscal periods beginning on or after December 15, 2011, and as a result, the Company adopted ASU 2010-26 effective January 1, 2012. The adoption of ASU 2010-26 did not have a material impact on the Company's consolidated statements of operations and financial condition.
Amendments to Achieve Common Fair Value Measurement and Disclosure Requirements in U.S. GAAP and IFRSs
In May 2011, the FASB issued ASU No. 2011-04, Amendments to Achieve Common Fair Value Measurement and Disclosure Requirements in U.S. GAAP and IFRSs ("ASU 2011-04"), which amends FASB ASC Topic Fair Value Measurement. ASU 2011-04 was issued to provide largely identical guidance about fair value measurement and disclosure requirements with the International Accounting Standards Board's new International Financial Reporting Standards ("IFRS") 13, Fair Value Measurement. ASU 2011-04 does not extend the use of fair value but, rather, provides guidance about how fair value should be applied where it is already required or permitted under GAAP and requires enhanced disclosures covering all transfers between Levels 1 and 2 of the fair value hierarchy. Additional disclosures covering Level 3 assets are also required. ASU 2011-04 became effective for fiscal years, and interim periods within those years, beginning after December 15, 2011 and as a result, the Company adopted ASU 2011-04 effective January 1, 2012. The adoption of ASU 2011-04 did not have a material impact on the Company's consolidated statements of operations and financial condition. The additional disclosures required by ASU 2011-04 have been provided in "Note 6. Fair Value Measurements" of the Company's Notes to Consolidated Financial Statements.
Presentation of Comprehensive Income
In June 2011, the FASB issued ASU No. 2011-05, Presentation of Comprehensive Income ("ASU 2011-05"), which amends FASB ASC Topic Comprehensive Income. ASU 2011-05 increases the prominence of items reported in other comprehensive income and eliminates the option to present components of other comprehensive income as part of the statement of changes in shareholders' equity. ASU 2011-05 requires that all non-owner changes in shareholders' equity be presented either in a single continuous statement of comprehensive income or in two separate but consecutive statements. ASU 2011-05 became effective for fiscal years, and interim periods within those years, beginning after December 15, 2011, with retroactive application required. The Company adopted ASU 2010-26 effective January 1, 2012 and it did not have a material impact on the Company's consolidated statements of operations and financial condition.
RECENTLY ISSUED ACCOUNTING PRONOUNCEMENTS NOT YET ADOPTED
Disclosures About Offsetting Assets and Liabilities
In December 2011, the FASB issued ASU No. 2011-11, Disclosures about Offsetting Assets and Liabilities ("ASU 2011-11"). The objective of ASU 2011-11 is to enhance disclosures by requiring improved information about financial instruments and derivative instruments in relation to netting arrangements. ASU 2011-11 is effective for interim and annual periods beginning on or after January 1, 2013, with retrospective presentation of the new disclosure required. The Company is currently evaluating the impact of this guidance; however, since this update affects disclosures only, it is not expected to have a material impact on the Company's consolidated financial statements.
Testing Indefinite-Lived Intangible Assets for Impairment
In July 2012, the FASB issued ASU No. 2012-02, Intangibles - Goodwill and Other (Topic 350): Testing Indefinite-Lived Intangible Assets for Impairment ("ASU 2012-02"). ASU 2012-02 simplifies the guidance for testing the decline in the realizable value of indefinite-lived intangible assets other than goodwill. ASU 2012-02 allows an organization the option to first assess the qualitative factors to determine whether it is necessary to perform the quantitative impairment test. An organization electing to perform a qualitative assessment is no longer required to calculate the fair value of an indefinite-lived intangible asset unless the organization determines, based on a qualitative assessment, that it is "more likely than not" that the asset is impaired. ASU 2012-02 is effective for annual and interim impairment tests performed for fiscal years beginning after September 15, 2012. The Company is currently evaluating the impact of this guidance; however, it is not expected to have a material impact on the Company's consolidated financial statements.
Reporting of Amounts Reclassified Out of Accumulated Other Comprehensive Income
In February 2013, the FASB issued ASU No. 2013-02, Reporting of Amounts Reclassified Out of Accumulated Other Comprehensive Income ("ASU 2013-02"). The objective of ASU 2013-02 is to improve the reporting of classifications out of accumulated other comprehensive income by requiring an entity to report the effect of significant reclassifications out of accumulated other comprehensive income on the respective line items in net income if the amount being reclassified is required under GAAP to be reclassified in its entirety. For other amounts that are not required under GAAP to be reclassified in their entirety to net income in the same reporting period, an entity is required to cross-reference other disclosures required under GAAP that provide additional details about those amounts. ASU 2013-02 is effective for interim and annual reporting periods beginning after December 15, 2012. The Company is currently evaluating the impact of this guidance; however, since this update affects disclosures only, it is not expected to have a material impact on the Company's consolidated financial statements.
NOTE 3. DISCONTINUED OPERATIONS
U.S.-Based Insurance Operations
On November 18, 2010, RenaissanceRe entered into a Stock Purchase Agreement with QBE to sell substantially all of its U.S.-based insurance operations, including its U.S. property and casualty business underwritten through managing general agents, its crop insurance business underwritten through Agro National, its commercial property insurance operations and its claims operations. At December 31, 2010, the Company classified the assets and liabilities associated with this transaction as held for sale and the assets and liabilities were recorded at the lower of the carrying value or fair value less costs to sell. The financial results for these operations have been presented as discontinued operations in the Company's consolidated statements of operations for all periods presented.
Consideration for the transaction was book value at December 31, 2010, for the aforementioned businesses, payable in cash at closing and subject to adjustment for certain tax and other items.
The transaction closed on March 4, 2011 and net consideration of $269.5 million was received by RenaissanceRe.
Pursuant to the Stock Purchase Agreement, RenaissanceRe was subject to a post-closing review following December 31, 2011 of the net reserve for claims and claim expenses for loss events occurring on or prior to December 31, 2010 (the "Reserve Collar"). Subsequent to the post-closing review, RenaissanceRe was
liable to pay, or otherwise reimburse QBE amounts up to $10.0 million for net adverse development on prior accident years net claims and claim expenses. Conversely, if prior accident years net claims and claim expenses experienced net favorable development, QBE was liable to pay, or otherwise reimburse RenaissanceRe amounts up to $10.0 million.
During 2011, the Company recognized a $10.0 million liability and corresponding expense in liabilities of discontinued operations held for sale and (loss) income from discontinued operations, respectively, due to purported net adverse development on prior accident years net claims and claim expenses associated with the Reserve Collar. Effective May 23, 2012, RenaissanceRe and QBE reached an agreement in respect of the Reserve Collar, and RenaissanceRe paid QBE the sum of $9.0 million on June 1, 2012, representing full and final settlement of the Reserve Collar and recorded a gain of $1.0 million in income from discontinued operations during the second quarter of 2012.
The Company has reclassified the assets and liabilities of the discontinued operations to assets of discontinued operations and liabilities of discontinued operations, respectively, on its consolidated balance sheets. Included in liabilities of discontinued operations held for sale on the Company's consolidated balance sheet are other liabilities of $Nil and $13.5 million at December 31, 2012 and 2011, respectively.
The Company has reclassified the results of operations of the discontinued operations to income (loss) from discontinued operations in its consolidated statements of operations. Details of the income (loss) from discontinued operations for the years ended December 31, 2012, 2011 and 2010 are as follows: |
| | | | | | | | | | | | | |
| | | | | | | | |
| | Year ended December 31, | 2012 | | 2011 | | 2010 | |
| | Revenues | | | | | | |
| | Gross premiums written | $ | — |
| | $ | 21,546 |
| | $ | 478,308 |
| |
| | Net premiums written | $ | — |
| | $ | (44,935 | ) | | $ | 290,188 |
| |
| | Decrease in unearned premiums | — |
| | 66,137 |
| | 16,037 |
| |
| | Net premiums earned | $ | — |
| | $ | 21,202 |
| | $ | 306,225 |
| |
| | Net investment income | — |
| | 339 |
| | 5,082 |
| |
| | Other income (loss) | 2,730 |
| | (9,904 | ) | | 5,811 |
| |
| | Net realized and unrealized gains on fixed maturity investments | — |
| | 42 |
| | 6,769 |
| |
| | Total revenues | 2,730 |
| | 11,679 |
| | 323,887 |
| |
| | Expenses | | | | | | |
| | Net claims and claim expenses incurred | — |
| | 8,430 |
| | 113,186 |
| |
| | Acquisition expenses | — |
| | 6,059 |
| | 68,777 |
| |
| | Operational expenses | 436 |
| | 7,272 |
| | 67,236 |
| |
| | Corporate expenses | — |
| | 770 |
| | 5,567 |
| |
| | Total expenses | 436 |
| | 22,531 |
| | 254,766 |
| |
| | Income (loss) before taxes | 2,294 |
| | (10,852 | ) | | 69,121 |
| |
| | Income tax expense | (7 | ) | | (5,038 | ) | | (6,451 | ) | |
| | Income (loss) from discontinued operations | $ | 2,287 |
| | $ | (15,890 | ) | | $ | 62,670 |
| |
| | | | | | | | |
NOTE 4. GOODWILL AND OTHER INTANGIBLE ASSETS
The following table shows an analysis of goodwill and other intangible assets for the years ended December 31, 2011 and 2012: |
| | | | | | | | | | | | | |
| | | | | | | | |
| | | Goodwill and other intangibles | |
| | | Goodwill | | Other intangible assets | | Total | |
| | Balance as of December 31, 2010 (1) | | | | | | |
| | Gross amount | $ | 8,160 |
| | $ | 12,999 |
| | $ | 21,159 |
| |
| | Accumulated impairment losses and amortization | — |
| | (6,469 | ) | | (6,469 | ) | |
| �� | | 8,160 |
| | 6,530 |
| | 14,690 |
| |
| | Acquired during the year | — |
| | — |
| | — |
| |
| | Amortization | — |
| | (563 | ) | | (563 | ) | |
| | Impairment losses | (2,299 | ) | | (2,934 | ) | | (5,233 | ) | |
| | Balance as of December 31, 2011 | | | | | | |
| | Gross amount | 8,160 |
| | 12,999 |
| | 21,159 |
| |
| | Accumulated impairment losses and amortization | (2,299 | ) | | (9,966 | ) | | (12,265 | ) | |
| | | 5,861 |
| | 3,033 |
| | 8,894 |
| |
| | Acquired during the year | — |
| | — |
| | — |
| |
| | Amortization | — |
| | (408 | ) | | (408 | ) | |
| | Impairment losses | — |
| | — |
| | — |
| |
| | Balance as of December 31, 2012 | | | | | | |
| | Gross amount | 8,160 |
| | 12,999 |
| | 21,159 |
| |
| | Accumulated impairment losses and amortization | (2,299 | ) | | (10,374 | ) | | (12,673 | ) | |
| | | $ | 5,861 |
| | $ | 2,625 |
| | $ | 8,486 |
| |
| | | | | | | | |
| |
| (1) | Excludes goodwill and intangible assets of $23.7 million and $33.3 million, respectively, at December 31, 2010 associated with the assets of discontinued operations held for sale. |
The following table shows an analysis of goodwill and other intangible assets included in investments in other ventures, under equity method for the years ended December 31, 2011 and 2012:
|
| | | | | | | | | | | | | |
| | | | | | | | |
| | | Goodwill and other intangible assets included in investments in other ventures, under equity method | |
| | | Goodwill | | Other intangible assets | | Total | |
| | Balance as of December 31, 2010 | | | | | | |
| | Gross amount | $ | 8,477 |
| | $ | 44,323 |
| | $ | 52,800 |
| |
| | Accumulated impairment losses and amortization | — |
| | (14,659 | ) | | (14,659 | ) | |
| | | 8,477 |
| | 29,664 |
| | 38,141 |
| |
| | Acquired during the year | 544 |
| | — |
| | 544 |
| |
| | Amortization | — |
| | (5,161 | ) | | (5,161 | ) | |
| | Impairment losses | — |
| | — |
| | — |
| |
| | Balance as of December 31, 2011 | | | | | | |
| | Gross amount | 9,021 |
| | 44,323 |
| | 53,344 |
| |
| | Accumulated impairment losses and amortization | — |
| | (19,820 | ) | | (19,820 | ) | |
| | | 9,021 |
| | 24,503 |
| | 33,524 |
| |
| | Acquired during the year | 1,819 |
| | — |
| | 1,819 |
| |
| | Amortization | — |
| | (4,949 | ) | | (4,949 | ) | |
| | Impairment losses | — |
| | — |
| | — |
| |
| | Balance as of December 31, 2012 | | | | | | |
| | Gross amount | 10,840 |
| | 44,323 |
| | 55,163 |
| |
| | Accumulated impairment losses and amortization | — |
| | (24,769 | ) | | (24,769 | ) | |
| | | $ | 10,840 |
| | $ | 19,554 |
| | $ | 30,394 |
| |
| | | | | | | | |
The gross carrying value and accumulated amortization by major category of other intangible assets is shown below:
|
| | | | | | | | | | | | | |
| | | | | | | | |
| | | Other intangible assets | |
| | At December 31, 2012 | Gross carrying value | | Accumulated amortization and impairment losses | | Total | |
| | Customer relationships and customer lists | $ | 39,485 |
| | $ | (20,936 | ) | | $ | 18,549 |
| |
| | Lloyd's managing agency license | 1,867 |
| | — |
| | 1,867 |
| |
| | Covenants not-to-compete | 2,130 |
| | (1,369 | ) | | 761 |
| |
| | Trademarks and trade names | 610 |
| | (110 | ) | | 500 |
| |
| | Software | 8,730 |
| | (8,395 | ) | | 335 |
| |
| | Patents and intellectual property | 4,500 |
| | (4,333 | ) | | 167 |
| |
| | | $ | 57,322 |
| | $ | (35,143 | ) | | $ | 22,179 |
| |
| | | | | | | | |
The useful life of intangible assets with finite lives ranges from one to 25 years, with a weighted-average amortization period of 11 years. Expected amortization of the other intangible assets, including other intangible assets recorded in investments in other ventures, under equity method, is shown below: |
| | | | | | | | | | | | | |
| | | | | | | | |
| | | Other intangibles | | Other intangible assets included in investments in other ventures, under equity method | | Total | |
| | 2013 | $ | 375 |
| | $ | 3,927 |
| | $ | 4,302 |
| |
| | 2014 | 209 |
| | 3,253 |
| | 3,462 |
| |
| | 2015 | 174 |
| | 2,592 |
| | 2,766 |
| |
| | 2016 | — |
| | 2,100 |
| | 2,100 |
| |
| | 2017 | — |
| | 1,931 |
| | 1,931 |
| |
| | 2018 and thereafter | — |
| | 5,751 |
| | 5,751 |
| |
| | Total remaining amortization expense | $ | 758 |
| | $ | 19,554 |
| | $ | 20,312 |
| |
| | Indefinite lived | 1,867 |
| | — |
| | 1,867 |
| |
| | Total | $ | 2,625 |
| | $ | 19,554 |
| | $ | 22,179 |
| |
| | | | | | | | |
NOTE 5. INVESTMENTS
Fixed Maturity Investments Trading
The following table summarizes the fair value of fixed maturity investments trading: |
| | | | | | | | | |
| | | | | | |
| | | December 31,
2012 | | December 31,
2011 | |
| | U.S. treasuries | $ | 1,259,800 |
| | $ | 885,152 |
| |
| | Agencies | 315,154 |
| | 158,561 |
| |
| | Non-U.S. government (Sovereign debt) | 133,198 |
| | 216,916 |
| |
| | FDIC guaranteed corporate | — |
| | 423,630 |
| |
| | Non-U.S. government-backed corporate | 349,514 |
| | 640,757 |
| |
| | Corporate | 1,607,233 |
| | 1,187,437 |
| |
| | Agency mortgage-backed | 399,619 |
| | 428,042 |
| |
| | Non-agency mortgage-backed | 230,747 |
| | 82,096 |
| |
| | Commercial mortgage-backed | 361,645 |
| | 255,885 |
| |
| | Asset-backed | 8,511 |
| | 12,989 |
| |
| | Total fixed maturity investments trading | $ | 4,665,421 |
| | $ | 4,291,465 |
| |
| | | | | | |
Fixed Maturity Investments Available For Sale
The following table summarizes the amortized cost, fair value and related unrealized gains and losses and non-credit other-than-temporary impairments of fixed maturity investments available for sale: |
| | | | | | | | | | | | | | | | | | | | | |
| | | | | | | | | | | | |
| | | | | Included in Accumulated Other Comprehensive Income | | | | | |
| | At December 31, 2012 | Amortized Cost | | Gross Unrealized Gains | | Gross Unrealized Losses | | Fair Value | | Non-Credit Other-Than- Temporary Impairments (1) | |
| | Corporate | $ | 7,065 |
| | $ | 1,002 |
| | $ | (93 | ) | | $ | 7,974 |
| | $ | (85 | ) | |
| | Agency mortgage-backed | 8,280 |
| | 632 |
| | — |
| | 8,912 |
| | — |
| |
| | Non-agency mortgage-backed | 14,613 |
| | 2,989 |
| | (10 | ) | | 17,592 |
| | (835 | ) | |
| | Commercial mortgage-backed | 37,292 |
| | 7,229 |
| | — |
| | 44,521 |
| | — |
| |
| | Asset-backed | 4,195 |
| | 248 |
| | — |
| | 4,443 |
| | — |
| |
| | Total fixed maturity investments available for sale | $ | 71,445 |
| | $ | 12,100 |
| | $ | (103 | ) | | $ | 83,442 |
| | $ | (920 | ) | |
| | | | | | | | | | | | |
|
| | | | | | | | | | | | | | | | | | | | | |
| | | | | | | | | | | | |
| | | | | Included in Accumulated Other Comprehensive Income | | | | | |
| | At December 31, 2011 | Amortized Cost | | Gross Unrealized Gains | | Gross Unrealized Losses | | Fair Value | | Non-Credit Other-Than- Temporary Impairments (1) | |
| | Non-U.S. government (Sovereign debt) | $ | 10,087 |
| | $ | 921 |
| | $ | (12 | ) | | $ | 10,996 |
| | $ | — |
| |
| | Non-U.S. government-backed corporate | 312 |
| | 13 |
| | — |
| | 325 |
| | — |
| |
| | Corporate | 18,449 |
| | 1,535 |
| | (517 | ) | | 19,467 |
| | (873 | ) | |
| | Agency mortgage-backed | 12,636 |
| | 1,071 |
| | — |
| | 13,707 |
| | — |
| |
| | Non-agency mortgage-backed | 21,097 |
| | 1,862 |
| | (284 | ) | | 22,675 |
| | (1,837 | ) | |
| | Commercial mortgage-backed | 63,269 |
| | 6,576 |
| | (1 | ) | | 69,844 |
| | — |
| |
| | Asset-backed | 4,819 |
| | 219 |
| | — |
| | 5,038 |
| | — |
| |
| | Total fixed maturity investments available for sale | $ | 130,669 |
| | $ | 12,197 |
| | $ | (814 | ) | | $ | 142,052 |
| | $ | (2,710 | ) | |
| | | | | | | | | | | | |
| |
| (1) | Represents the non-credit component of other-than-temporary impairments recognized in accumulated other comprehensive income since the adoption of guidance related to the recognition and presentation of other-than-temporary impairments under FASB ASC Topic Financial Instruments – Debt and Equity Securities, during the second quarter of 2009, adjusted for subsequent sales of securities. It does not include the change in fair value subsequent to the impairment measurement date. |
Contractual maturities of fixed maturity investments are as follows. Expected maturities will differ from contractual maturities because borrowers may have the right to call or prepay obligations with or without call or prepayment penalties. |
| | | | | | | | | | | | | | | | | | | | | | | | | |
| | | | | | | | | | | | | | |
| | | Trading | | Available for Sale | | Total Fixed Maturity Investments | |
| | At December 31, 2012 | Amortized Cost | | Fair Value | | Amortized Cost | | Fair Value | | Amortized Cost | | Fair Value | |
| | Due in less than one year | $ | 431,824 |
| | $ | 432,400 |
| | $ | 501 |
| | $ | 674 |
| | $ | 432,325 |
| | $ | 433,074 |
| |
| | Due after one through five years | 2,357,902 |
| | 2,386,475 |
| | 3,043 |
| | 3,381 |
| | 2,360,945 |
| | 2,389,856 |
| |
| | Due after five through ten years | 674,560 |
| | 709,307 |
| | 2,331 |
| | 2,537 |
| | 676,891 |
| | 711,844 |
| |
| | Due after ten years | 122,330 |
| | 136,717 |
| | 1,190 |
| | 1,382 |
| | 123,520 |
| | 138,099 |
| |
| | Mortgage-backed | 959,731 |
| | 992,011 |
| | 60,185 |
| | 71,025 |
| | 1,019,916 |
| | 1,063,036 |
| |
| | Asset-backed | 8,015 |
| | 8,511 |
| | 4,195 |
| | 4,443 |
| | 12,210 |
| | 12,954 |
| |
| | Total | $ | 4,554,362 |
| | $ | 4,665,421 |
| | $ | 71,445 |
| | $ | 83,442 |
| | $ | 4,625,807 |
| | $ | 4,748,863 |
| |
| | | | | | | | | | | | | | |
Equity Investments Trading
The following table summarizes the fair value of equity investments trading: |
| | | | | | | | | |
| | | | | | |
| | | December 31,
2012 | | December 31,
2011 | |
| | Financial institution securities | $ | 58,186 |
| | $ | 50,560 |
| |
| | | | | | |
Pledged Investments
At December 31, 2012, $1,490.9 million of cash and investments at fair value were on deposit with, or in trust accounts for the benefit of various counterparties, including with respect to the Company's principal letter of credit facility (2011 - $1,292.7 million). Of this amount, $581.2 million is on deposit with, or in trust accounts for the benefit of, U.S. state regulatory authorities (2011 - $403.4 million).
Net Investment Income, Net Realized and Unrealized Gains on Investments and Net Other-Than-Temporary Impairments
The components of net investment income are as follows: |
| | | | | | | | | | | | | |
| | | | | | | | |
| | Year ended December 31, | 2012 | | 2011 | | 2010 | |
| | Fixed maturity investments | $ | 102,476 |
| | $ | 89,858 |
| | $ | 108,195 |
| |
| | Short term investments | 1,007 |
| | 1,666 |
| | 2,318 |
| |
| | Equity investments | 1,086 |
| | 471 |
| | — |
| |
| | Other investments | | | | | | |
| | Hedge funds and private equity investments | 36,635 |
| | 27,541 |
| | 64,419 |
| |
| | Other | 37,784 |
| | 8,458 |
| | 39,305 |
| |
| | Cash and cash equivalents | 194 |
| | 163 |
| | 277 |
| |
| | | 179,182 |
| | 128,157 |
| | 214,514 |
| |
| | Investment expenses | (11,807 | ) | | (10,157 | ) | | (10,559 | ) | |
| | Net investment income | $ | 167,375 |
| | $ | 118,000 |
| | $ | 203,955 |
| |
| | | | | | | | |
Net realized and unrealized gains on investments and net other-than-temporary impairments are as follows: |
| | | | | | | | | | | | | |
| | | | | | | | |
| | Year ended December 31, | 2012 | | 2011 | | 2010 | |
| | Gross realized gains | $ | 97,787 |
| | $ | 79,358 |
| | $ | 138,814 |
| |
| | Gross realized losses | (16,705 | ) | | (30,659 | ) | | (19,147 | ) | |
| | Net realized gains on fixed maturity investments | 81,082 |
| | 48,699 |
| | 119,667 |
| |
| | Net unrealized gains on fixed maturity investments trading | 75,283 |
| | 19,404 |
| | 24,777 |
| |
| | Net unrealized gains on equity investments trading | 7,626 |
| | 2,565 |
| | — |
| |
| | Net realized and unrealized gains on investments | $ | 163,991 |
| | $ | 70,668 |
| | $ | 144,444 |
| |
| | Total other-than-temporary impairments | $ | (395 | ) | | $ | (630 | ) | | $ | (831 | ) | |
| | Portion recognized in other comprehensive income, before taxes | 52 |
| | 78 |
| | 2 |
| |
| | Net other-than-temporary impairments | $ | (343 | ) | | $ | (552 | ) | | $ | (829 | ) | |
| | | | | | | | |
The following table provides an analysis of the length of time the Company's fixed maturity investments available for sale in an unrealized loss have been in a continual unrealized loss position. |
| | | | | | | | | | | | | | | | | | | | | | | | | |
| | | | | | | | | | | | | | |
| | | Less than 12 Months | | 12 Months or Greater | | Total | |
| | At December 31, 2012 | Fair Value | | Unrealized Losses | | Fair Value | | Unrealized Losses | | Fair Value | | Unrealized Losses | |
| | Corporate | $ | 598 |
| | $ | (30 | ) | | $ | 440 |
| | $ | (63 | ) | | $ | 1,038 |
| | $ | (93 | ) | |
| | Non-agency mortgage-backed | — |
| | — |
| | 101 |
| | (10 | ) | | 101 |
| | (10 | ) | |
| | Total | $ | 598 |
| | $ | (30 | ) | | $ | 541 |
| | $ | (73 | ) | | $ | 1,139 |
| | $ | (103 | ) | |
| | | | | | | | | | | | | | |
|
| | | | | | | | | | | | | | | | | | | | | | | | | |
| | | | | | | | | | | | | | |
| | | Less than 12 Months | | 12 Months or Greater | | Total | |
| | At December 31, 2011 | Fair Value | | Unrealized Losses | | Fair Value | | Unrealized Losses | | Fair Value | | Unrealized Losses | |
| | Non-U.S. government (Sovereign debt) | $ | 915 |
| | $ | (9 | ) | | $ | 42 |
| | $ | (3 | ) | | $ | 957 |
| | $ | (12 | ) | |
| | Corporate | 3,935 |
| | (385 | ) | | 412 |
| | (132 | ) | | 4,347 |
| | (517 | ) | |
| | Non-agency mortgage-backed | 8,024 |
| | (224 | ) | | 798 |
| | (60 | ) | | 8,822 |
| | (284 | ) | |
| | Commercial mortgage-backed | — |
| | — |
| | 455 |
| | (1 | ) | | 455 |
| | (1 | ) | |
| | Total | $ | 12,874 |
| | $ | (618 | ) | | $ | 1,707 |
| | $ | (196 | ) | | $ | 14,581 |
| | $ | (814 | ) | |
| | | | | | | | | | | | | | |
At December 31, 2012, the Company held 28 fixed maturity investments available for sale securities that were in an unrealized loss position (2011 - 85), including 11 fixed maturity investments available for sale securities that were in an unrealized loss position for twelve months or greater (2011 - 14). The Company does not intend to sell these securities and it is not more likely than not that the Company will be required to sell these securities before the anticipated recovery of the remaining amortized cost basis. The Company performed reviews of its fixed maturity investments available for sale for the year ended December 31, 2012 and 2011, respectively, in order to determine whether declines in the fair value below the amortized cost basis were considered other-than-temporary in accordance with the applicable guidance, as discussed below.
Other-Than-Temporary Impairment Process
The Company's process for assessing whether declines in the fair value of its fixed maturity investments available for sale represent impairments that are other-than-temporary includes reviewing each fixed maturity investment available for sale that is impaired and determining: (i) if the Company has the intent to sell the debt security or (ii) if it is more likely than not that the Company will be required to sell the debt security before its anticipated recovery; and (iii) whether a credit loss exists, that is, where the Company expects that the present value of the cash flows expected to be collected from the security are less than the amortized cost basis of the security.
In assessing the Company's intent to sell securities, the Company's procedures may include actions such as discussing planned sales with its third party investment managers, reviewing sales that have occurred shortly after the balance sheet date, and consideration of other qualitative factors that may be indicative of the Company's intent to sell or hold the relevant securities. For the year ended December 31, 2012, the Company recognized $Nil other-than-temporary impairments due to the Company's intent to sell these securities as of December 31, 2012 (2011 – $Nil, 2010 - $Nil).
In assessing whether it is more likely than not that the Company will be required to sell a security before its anticipated recovery, the Company considers various factors including its future cash flow forecasts and requirements, legal and regulatory requirements, the level of its cash, cash equivalents, short term investments, fixed maturity investments trading and fixed maturity investments available for sale in an unrealized gain position, and other relevant factors. For the year ended December 31, 2012, the Company recognized $Nil of other-than-temporary impairments due to required sales (2011 – $Nil, 2010 - $Nil).
In evaluating credit losses, the Company considers a variety of factors in the assessment of a security including: (i) the time period during which there has been a significant decline below cost; (ii) the extent of the decline below cost and par; (iii) the potential for the security to recover in value; (iv) an analysis of the financial condition of the issuer; (v) the rating of the issuer; (vi) the implied rating of the issuer based on an analysis of option adjusted spreads; (vii) the absolute level of the option adjusted spread for the issuer; and (viii) an analysis of the collateral structure and credit support of the security, if applicable.
Once the Company determines that it is possible that a credit loss may exist for a security, the Company performs a detailed review of the cash flows expected to be collected from the issuer. The Company estimates expected cash flows by applying estimated default probabilities and recovery rates to the contractual cash flows of the issuer, with such default and recovery rates reflecting long-term historical averages adjusted to reflect current credit, economic and market conditions, giving due consideration to collateral and credit support, if applicable, and discounting the expected cash flows at the purchase yield on the security. In instances in which a determination is made that an impairment exists but the Company does not intend to sell the security and it is not more likely than not that the Company will be required to sell the security before the anticipated recovery of its remaining amortized cost basis, the impairment is separated into: (i) the amount of the total other-than-temporary impairment related to the credit loss; and (ii) the amount of the total other-than-temporary impairment related to all other factors. The amount of the other-than-temporary impairment related to the credit loss is recognized in earnings. The amount of the other-than-temporary impairment related to all other factors is recognized in other comprehensive income. For the year ended December 31, 2012, the Company recognized $0.3 million of other-than-temporary impairments which were recognized in earnings and $52 thousand related to other factors which were recognized in other comprehensive income (2011 – $0.6 million and $78 thousand, respectively, 2010 - $0.8 million and $2 thousand, respectively).
The following table provides a rollforward of the amount of other-than-temporary impairments related to credit losses recognized in earnings for which a portion of an other-than-temporary impairment was recognized in accumulated other comprehensive income: |
| | | | | | | | | |
| | | | | | |
| | | 2012 | | 2011 | |
| | Balance – January 1 | $ | 2,370 |
| | $ | 3,098 |
| |
| | Additions: | | | | |
| | Amount related to credit loss for which an other-than-temporary impairment was not previously recognized | 8 |
| | 134 |
| |
| | Amount related to credit loss for which an other-than-temporary impairment was previously recognized | 110 |
| | 145 |
| |
| | Reductions: | | | | |
| | Securities sold during the period | (1,650 | ) | | (1,007 | ) | |
| | Securities for which the amount previously recognized in other comprehensive income was recognized in earnings, because the Company intends to sell the security or is more likely than not the Company will be required to sell the security | — |
| | — |
| |
| | Increases in cash flows expected to be collected that are recognized over the remaining life of the security | — |
| | — |
| |
| | Balance – December 31 | $ | 838 |
| | $ | 2,370 |
| |
| | | | | | |
Other Investments
The table below shows the fair value of the Company's portfolio of other investments: |
| | | | | | | | | |
| | | | | | |
| | At December 31, | 2012 | | 2011 | |
| | Private equity partnerships | $ | 344,669 |
| | $ | 367,909 |
| |
| | Senior secured bank loan funds | 202,929 |
| | 257,870 |
| |
| | Catastrophe bonds | 91,310 |
| | 70,999 |
| |
| | Hedge funds | 5,803 |
| | 21,344 |
| |
| | Non-U.S. fixed income funds | — |
| | 28,862 |
| |
| | Miscellaneous other investments | — |
| | 2,000 |
| |
| | Total other investments | $ | 644,711 |
| | $ | 748,984 |
| |
| | | | | | |
Interest income, income distributions and net realized and unrealized gains on other investments are included in net investment income and totaled $74.4 million (2011 – $36.0 million, 2010 – $103.7 million) of which $38.2 million was related to net unrealized gains (2011 – $12.7 million, 2010 – $57.5 million). Included in net investment income for the year ended December 31, 2012 is a loss of $4.7 million (2011 - loss of $1.4 million, 2010 - gain of $5.3 million) representing the change in estimate during the period related to the difference between the Company's estimated net investment income due to the lag in reporting, as discussed in "Note 2. Significant Accounting Policies", and the actual amount as reported in the final net asset values provided by the Company's fund managers.
The Company has committed capital to private equity partnerships and other entities of $708.9 million, of which $655.5 million has been contributed at December 31, 2012. The Company's remaining commitments to these funds at December 31, 2012 totaled $133.2 million. In the future, the Company may enter into additional commitments in respect of private equity partnerships or individual portfolio company investment opportunities.
Investments in Other Ventures, under Equity Method
The table below shows the Company's portfolio of investments in other ventures, under equity method: |
| | | | | | | | | | | | | | | | | | | | | | | |
| | | | | | | | | | | | | | |
| | | 2012 | | 2011 | |
| | At December 31, | Investment | | Ownership % | | Carrying Value | | Investment | | Ownership % | | Carrying Value | |
| | THIG | $ | 50,000 |
| | 25.0 | % | | $ | 28,303 |
| | $ | 50,000 |
| | 25.0 | % | | $ | 32,645 |
| |
| | Tower Hill | 10,000 |
| | 28.6 | % | | 13,969 |
| | 10,000 |
| | 28.6 | % | | 14,173 |
| |
| | Tower Hill Signature | 500 |
| | 25.0 | % | | 896 |
| | 500 |
| | 25.0 | % | | — |
| |
| | Total Tower Hill Companies | 60,500 |
| | | | 43,168 |
| | 60,500 |
| | | | 46,818 |
| |
| | Top Layer Re | 65,375 |
| | 50.0 | % | | 36,664 |
| | 65,375 |
| | 50.0 | % | | 15,872 |
| |
| | Other | 8,226 |
| | 38.8 | % | | 7,892 |
| | 6,000 |
| | 40.0 | % | | 8,024 |
| |
| | Total investments in other ventures, under equity method | $ | 134,101 |
| | | | $ | 87,724 |
| | $ | 131,875 |
| | | | $ | 70,714 |
| |
| | | | | | | | | | | | | | |
On July 1, 2008, the Company invested $50.0 million in Tower Hill Insurance Group, LLC. ("THIG") representing a 25.0% equity ownership. Included in the purchase price was $40.0 million of other intangibles and $7.8 million of goodwill, which, in accordance with generally accepted accounting principles, are recorded as "Investments in other ventures, under equity method" rather than "Goodwill and other intangibles" on the Company's consolidated balance sheet.
The Company originally invested $13.1 million and $10.0 million in Top Layer Re and Tower Hill Holdings, Inc. ("Tower Hill"), respectively, representing a 50.0% and 28.6% ownership, respectively. In December 2010, March 2011 and December 2011, primarily as a result of the September 2010, February 2011 New Zealand and Tohoku earthquakes, respectively, the Company invested an additional $13.8 million, $20.5 million and $18.0 million respectively, in Top Layer Re, maintaining the Company's 50% ownership interest.
The table below shows the Company's equity in earnings (losses) of other ventures, under equity method: |
| | | | | | | | | | | | | |
| | | | | | | | |
| | Year ended December 31, | 2012 | | 2011 | | 2010 | |
| | Top Layer Re | $ | 20,792 |
| | $ | (37,471 | ) | | $ | (12,103 | ) | |
| | Tower Hill Companies | 4,965 |
| | 2,923 |
| | 1,151 |
| |
| | Other | (2,519 | ) | | (1,985 | ) | | (862 | ) | |
| | Total equity in earnings (losses) of other ventures | $ | 23,238 |
| | $ | (36,533 | ) | | $ | (11,814 | ) | |
| | | | | | | | |
Undistributed earnings in the Company's investments in other ventures, under equity method were $19.3 million at December 31, 2012 (2011 - undistributed losses of $39.6 million). During 2012, the Company received $9.9 million of dividends from its investments in other ventures, under equity method (2011 – $9.5 million, 2010 – $17.9 million). During the third quarter of 2011, the Company sold its entire ownership interest in NBIC Holdings, Inc. ("NBIC"), a holding company for a specialty underwriter of homeowners' insurance products and services, for $12.0 million. Included in Other in the table above for the year ended December 31, 2011 is equity in losses of NBIC of $2.8 million, which was accounted for under the equity method of accounting prior to its sale. As a result of the sale, the Company recorded a $4.8 million gain, included in other income for the year ended December 31, 2011.
The equity in earnings of the Tower Hill Companies are reported one quarter in arrears.
NOTE 6. FAIR VALUE MEASUREMENTS
The use of fair value to measure certain assets and liabilities with resulting unrealized gains or losses is pervasive within the Company's financial statements. Fair value is defined under accounting guidance currently applicable to the Company to be the price that would be received upon the sale of an asset or paid to transfer a liability in an orderly transaction between open market participants at the measurement date. The Company recognizes the change in unrealized gains and losses arising from changes in fair value in its consolidated statements of operations, with the exception of changes in unrealized gains and losses on its fixed maturity investments available for sale, which are recognized as a component of accumulated other comprehensive income in shareholders' equity.
FASB ASC Topic Fair Value Measurements and Disclosures prescribes a fair value hierarchy that prioritizes the inputs to the respective valuation techniques used to measure fair value. The hierarchy gives the highest priority to unadjusted quoted prices in active markets for identical assets or liabilities (Level 1) and the lowest priority to valuation techniques that use at least one significant input that is unobservable (Level 3). The three levels of the fair value hierarchy are described below:
| |
| • | Fair values determined by Level 1 inputs utilize unadjusted quoted prices obtained from active markets for identical assets or liabilities for which the Company has access. The fair value is determined by multiplying the quoted price by the quantity held by the Company; |
| |
| • | Fair values determined by Level 2 inputs utilize inputs other than quoted prices included in Level 1 that are observable for the asset or liability, either directly or indirectly. Level 2 inputs include quoted prices for similar assets and liabilities in active markets, and inputs other than quoted prices that are observable for the asset or liability, such as interest rates and yield curves that are observable at commonly quoted intervals, broker quotes and certain pricing indices; and |
| |
| • | Level 3 inputs are based all or in part on significant unobservable inputs for the asset or liability, and include situations where there is little, if any, market activity for the asset or liability. In these cases, significant management assumptions can be used to establish management's best estimate of the assumptions used by other market participants in determining the fair value of the asset or liability. |
In certain cases, the inputs used to measure fair value may fall into different levels of the fair value hierarchy. In such cases, the level in the fair value hierarchy within which the fair value measurement in its entirety falls has been determined based on the lowest level input that is significant to the fair value measurement of the asset or liability. The Company's assessment of the significance of a particular input to the fair value measurement in its entirety requires judgment, and the Company considers factors specific to the asset or liability.
In order to determine if a market is active or inactive for a security, the Company considers a number of factors, including, but not limited to, the spread between what a seller is asking for a security and what a buyer is bidding for the same security, the volume of trading activity for the security in question, the price of the security compared to its par value (for fixed maturity investments), and other factors that may be indicative of market activity.
There have been no material changes in the Company's valuation techniques, nor have there been any transfers between Level 1 and Level 2, during the period represented by these consolidated financial statements. The Company transferred $6.6 million of so called "side pocket" investments which are not redeemable at the option of the shareholder to Level 3, from Level 2, at the end of the period ended December 31, 2011.
Below is a summary of the assets and liabilities that are measured at fair value on a recurring basis and also represents the carrying amount on the Company's consolidated balance sheet: |
| | | | | | | | | | | | | | | | | |
| | | | | | | | | | |
| | At December 31, 2012 | Total | | Quoted Prices in Active Markets for Identical Assets (Level 1) | | Significant Other Observable Inputs (Level 2) | | Significant Unobservable Inputs (Level 3) | |
| | Fixed maturity investments | | | | | | | | |
| | U.S. treasuries | $ | 1,259,800 |
| | $ | 1,259,800 |
| | $ | — |
| | $ | — |
| |
| | Agencies | 315,154 |
| | — |
| | 315,154 |
| | — |
| |
| | Non-U.S. government (Sovereign debt) | 133,198 |
| | — |
| | 133,198 |
| | — |
| |
| | Non-U.S. government-backed corporate | 349,514 |
| | — |
| | 349,514 |
| | — |
| |
| | Corporate | 1,615,207 |
| | — |
| | 1,587,415 |
| | 27,792 |
| |
| | Agency mortgage-backed | 408,531 |
| | — |
| | 408,531 |
| | — |
| |
| | Non-agency mortgage-backed | 248,339 |
| | — |
| | 248,339 |
| | — |
| |
| | Commercial mortgage-backed | 406,166 |
| | — |
| | 406,166 |
| | — |
| |
| | Asset-backed | 12,954 |
| | — |
| | 12,954 |
| | — |
| |
| | Total fixed maturity investments | 4,748,863 |
| | 1,259,800 |
| | 3,461,271 |
| | 27,792 |
| |
| | Short term investments | 821,163 |
| | — |
| | 821,163 |
| | — |
| |
| | Equity investments trading | 58,186 |
| | 58,186 |
| | — |
| | — |
| |
| | Other investments | | | | | | | | |
| | Private equity partnerships | 344,669 |
| | — |
| | — |
| | 344,669 |
| |
| | Senior secured bank loan funds | 202,929 |
| | — |
| | 172,334 |
| | 30,595 |
| |
| | Catastrophe bonds | 91,310 |
| | — |
| | 91,310 |
| | — |
| |
| | Hedge funds | 5,803 |
| | — |
| | — |
| | 5,803 |
| |
| | Total other investments | 644,711 |
| | — |
| | 263,644 |
| | 381,067 |
| |
| | Other assets and (liabilities) | | | | | | | | |
| | Assumed and ceded (re)insurance contracts | 2,647 |
| | — |
| | — |
| | 2,647 |
| |
| | Derivatives (1) | 19,123 |
| | (125 | ) | | 14,821 |
| | 4,427 |
| |
| | Other | 7,315 |
| | — |
| | (11,551 | ) | | 18,866 |
| |
| | Total other assets and (liabilities) | 29,085 |
| | (125 | ) | | 3,270 |
| | 25,940 |
| |
| | | $ | 6,302,008 |
| | $ | 1,317,861 |
| | $ | 4,549,348 |
| | $ | 434,799 |
| |
| | | | | | | | | | |
| |
| (1) | See "Note 19. Derivative Instruments" for additional information related to the fair value by type of contract, of derivatives entered into by the Company. |
|
| | | | | | | | | | | | | | | | | |
| | | | | | | | | | |
| | At December 31, 2011 | Total | | Quoted Prices in Active Markets for Identical Assets (Level 1) | | Significant Other Observable Inputs (Level 2) | | Significant Unobservable Inputs (Level 3) | |
| | Fixed maturity investments | | | | | | | | |
| | U.S. treasuries | $ | 885,152 |
| | $ | 885,152 |
| | $ | — |
| | $ | — |
| |
| | Agencies | 158,561 |
| | — |
| | 158,561 |
| | — |
| |
| | Non-U.S. government (Sovereign debt) | 227,912 |
| | — |
| | 227,912 |
| | — |
| |
| | FDIC guaranteed corporate | 423,630 |
| | — |
| | 423,630 |
| | — |
| |
| | Non-U.S. government-backed corporate | 641,082 |
| | — |
| | 641,082 |
| | — |
| |
| | Corporate | 1,206,904 |
| | — |
| | 1,179,143 |
| | 27,761 |
| |
| | Agency mortgage-backed | 441,749 |
| | — |
| | 441,749 |
| | — |
| |
| | Non-agency mortgage-backed | 104,771 |
| | — |
| | 104,771 |
| | — |
| |
| | Commercial mortgage-backed | 325,729 |
| | — |
| | 325,729 |
| | — |
| |
| | Asset-backed | 18,027 |
| | — |
| | 18,027 |
| | — |
| |
| | Total fixed maturity investments | 4,433,517 |
| | 885,152 |
| | 3,520,604 |
| | 27,761 |
| |
| | Short term investments | 905,477 |
| | — |
| | 905,477 |
| | — |
| |
| | Equity investments trading | 50,560 |
| | 50,560 |
| | — |
| | — |
| |
| | Other investments | | | | | | | | |
| | Private equity partnerships | 367,909 |
| | — |
| | — |
| | 367,909 |
| |
| | Senior secured bank loan funds | 257,870 |
| | — |
| | 237,815 |
| | 20,055 |
| |
| | Catastrophe bonds | 70,999 |
| | — |
| | 70,999 |
| | — |
| |
| | Non-U.S. fixed income funds | 28,862 |
| | — |
| | 28,862 |
| | — |
| |
| | Hedge funds | 21,344 |
| | — |
| | 14,782 |
| | 6,562 |
| |
| | Miscellaneous other investments | 2,000 |
| | — |
| | — |
| | 2,000 |
| |
| | Total other investments | 748,984 |
| | — |
| | 352,458 |
| | 396,526 |
| |
| | Other assets and (liabilities) | | | | | | | | |
| | Assumed and ceded (re)insurance contracts | 2,115 |
| | — |
| | — |
| | 2,115 |
| |
| | Derivatives (1) | 3,312 |
| | 707 |
| | (6,293 | ) | | 8,898 |
| |
| | Other | 10,644 |
| | (6,869 | ) | | — |
| | 17,513 |
| |
| | Total other assets and (liabilities) | 16,071 |
| | (6,162 | ) | | (6,293 | ) | | 28,526 |
| |
| | | $ | 6,154,609 |
| | $ | 929,550 |
| | $ | 4,772,246 |
| | $ | 452,813 |
| |
| | | | | | | | | | |
(1) See "Note 19. Derivative Instruments" for additional information related to the fair value by type of contract, of derivatives entered into by the Company.
Level 1 and Level 2 Assets and Liabilities Measured at Fair Value
Fixed Maturity Investments
Fixed maturity investments included in Level 1 consist of the Company's investments in U.S. treasuries. Fixed maturity investments included in Level 2 are agencies, non-U.S. government, Federal Deposit Insurance Company guaranteed corporate, non-U.S. government-backed corporate, corporate, agency mortgage-backed, non-agency mortgage-backed, commercial mortgage-backed and asset-backed fixed maturity investments.
The Company's fixed maturity investment portfolios are primarily priced using pricing services, such as index providers and pricing vendors, as well as broker quotations. In general, the pricing vendors provide pricing for a high volume of liquid securities that are actively traded. For securities that do not trade on an exchange, the pricing services generally utilize market data and other observable inputs in matrix pricing
models to determine month end prices. Observable inputs include benchmark yields, reported trades, broker-dealer quotes, issuer spreads, bids, offers, reference data and industry and economic events. Index pricing generally relies on market traders as the primary source for pricing, however models are also utilized to provide prices for all index eligible securities. The models use a variety of observable inputs such as benchmark yields, transactional data, dealer runs, broker-dealer quotes and corporate actions. Prices are generally verified using third party data. Securities which are priced by an index provider are generally included in the index.
In general, broker-dealers value securities through their trading desks based on observable inputs. The methodologies include mapping securities based on trade data, bids or offers, observed spreads, and performance on newly issued securities. Broker-dealers also determine valuations by observing secondary trading of similar securities. Prices obtained from broker quotations are considered non-binding, however they are based on observable inputs and by observing secondary trading of similar securities obtained from active, non-distressed markets.
The Company considers these Level 2 inputs as they are corroborated with other market observable inputs. The techniques generally used to determine the fair value of the Company's fixed maturity investments are detailed below by asset class.
U.S. treasuries
Level 1 - At December 31, 2012, the Company's U.S. treasuries fixed maturity investments are primarily priced by pricing services and had a weighted average effective yield of 0.4% and a weighted average credit quality of AA (2011 - 0.6% and AA, respectively). When pricing these securities, the pricing services utilize daily data from many real time market sources, including active broker dealers. Certain data sources are regularly reviewed for accuracy to attempt to ensure the most reliable price source is used for each issue and maturity date.
Agencies
Level 2 - At December 31, 2012, the Company's agency fixed maturity investments had a weighted average effective yield of 0.7% and a weighted average credit quality of AA (2011 - 0.5% and AA, respectively). The issuers of the Company's agency fixed maturity investments primarily consist of the Federal National Mortgage Association, the Federal Home Loan Mortgage Corporation and other agencies. Fixed maturity investments included in agencies are primarily priced by pricing services. When evaluating these securities, the pricing services gather information from market sources and integrate other observations from markets and sector news. Evaluations are updated by obtaining broker dealer quotes and other market information including actual trade volumes, when available. The fair value of each security is individually computed using analytical models which incorporate option adjusted spreads and other daily interest rate data.
Non-U.S. government (Sovereign debt)
Level 2 - Non-U.S. government fixed maturity investments held by the Company at December 31, 2012, had a weighted average effective yield of 1.9% and a weighted average credit quality of AA (2011 - 2.3% and AA, respectively). The issuers of securities in this sector are non-U.S. governments and their respective agencies as well as supranational organizations. Securities held in these sectors are primarily priced by pricing services who employ proprietary discounted cash flow models to value the securities. Key quantitative inputs for these models are daily observed benchmark curves for treasury, swap and high issuance credits. The pricing services then apply a credit spread for each security which is developed by in-depth and real time market analysis. For securities in which trade volume is low, the pricing services utilize data from more frequently traded securities with similar attributes. These models may also be supplemented by daily market and credit research for international markets.
Non-U.S. government-backed corporate
Level 2 - Non-U.S. government-backed corporate fixed maturity investments had a weighted average effective yield of 0.7% and a weighted average credit quality of AAA at December 31, 2012 (2011 - 1.4% and AAA, respectively). Non-U.S. government-backed fixed maturity investments are primarily priced by pricing services who employ proprietary discounted cash flow models to value the securities. Key
quantitative inputs for these models are daily observed benchmark curves for treasury, swap and high issuance credits. The pricing services then apply a credit spread to the respective curve for each security which is developed by in-depth and real time market analysis. For securities in which trade volume is low, the pricing services utilize data from more frequently traded securities with similar attributes. These models may also be supplemented by daily market and credit research for international markets.
Corporate
Level 2 - At December 31, 2012, the Company's corporate fixed maturity investments principally consist of U.S. and international corporations and had a weighted average effective yield of 2.6% and a weighted average credit quality of A (2011 - 4.2% and A, respectively). The Company's corporate fixed maturity investments are primarily priced by pricing services. When evaluating these securities, the pricing services gather information from market sources regarding the issuer of the security and obtain credit data, as well as other observations, from markets and sector news. Evaluations are updated by obtaining broker dealer quotes and other market information including actual trade volumes, when available. The pricing services also consider the specific terms and conditions of the securities, including any specific features which may influence risk. In certain instances, securities are individually evaluated using a spread which is added to the U.S. treasury curve or a security specific swap curve as appropriate.
Agency mortgage-backed
Level 2 - At December 31, 2012, the Company's agency mortgage-backed fixed maturity investments included agency residential mortgage-backed securities with a weighted average effective yield of 1.3%, a weighted average credit quality of AA and a weighted average life of 3.3 years (2011 - 1.5%, AA and 2.6 years, respectively). The Company's agency mortgage-backed fixed maturity investments are primarily priced by pricing services using a mortgage pool specific model which utilizes daily inputs from the active to be announced ("TBA") market which is very liquid, as well as the U.S. treasury market. The model also utilizes additional information, such as the weighted average maturity, weighted average coupon and other available pool level data which is provided by the sponsoring agency. Valuations are also corroborated with daily active market quotes.
Non-agency mortgage-backed
Level 2 - The Company's non-agency mortgage-backed fixed maturity investments include non-agency prime residential mortgage-backed and non-agency Alt-A fixed maturity investments. The Company has no fixed maturity investments classified as sub-prime held in its fixed maturity investments portfolio. At December 31, 2012, the Company's non-agency prime residential mortgage-backed fixed maturity investments have a weighted average effective yield of 3.6%, a weighted average credit quality of BBB, and a weighted average life of 4.5 years (2011 - 8.0%, BBB and 3.3 years, respectively). The Company's non-agency Alt-A fixed maturity investments held at December 31, 2012 have a weighted average effective yield of 5.2%, a weighted average credit quality of non-investment grade and a weighted average life of 4.7 years (2011 - 9.1%, A and 3.8 years, respectively) . Securities held in these sectors are primarily priced by pricing services using an option adjusted spread ("OAS") model or other relevant models, which principally utilize inputs including benchmark yields, available trade information or broker quotes, and issuer spreads. The pricing services also review collateral prepayment speeds, loss severity and delinquencies among other collateral performance indicators for the securities valuation, when applicable.
Commercial mortgage-backed
Level 2 - The Company's commercial mortgage-backed fixed maturity investments held at December 31, 2012 have a weighted average effective yield of 1.7%, a weighted average credit quality of AA, and a weighted average life of 3.7 years (2011 - 3.2%, AA and 4.2 years, respectively). Securities held in these sectors are primarily priced by pricing services. The pricing services apply dealer quotes and other available trade information such as bid and offers, prepayment speeds which may be adjusted for the underlying collateral or current price data, the U.S. treasury curve and swap curve as well as cash settlement. The pricing services discount the expected cash flows for each security held in this sector using a spread adjusted benchmark yield based on the characteristics of the security.
Asset-backed
Level 2 - At December 31, 2012, the Company's asset-backed fixed maturity investments had a weighted average effective yield of 1.8%, a weighted average credit quality of AAA and a weighted average life of 3.5 years (2011 - 0.9%, AAA and 1.8 years, respectively). The underlying collateral for the Company's asset-backed fixed maturity investments primarily consists of student loans, credit card receivables, auto loans and other receivables. Securities held in these sectors are primarily priced by pricing services. The pricing services apply dealer quotes and other available trade information such as bids and offers, prepayment speeds which may be adjusted for the underlying collateral or current price data, the U.S. treasury curve and swap curve as well as cash settlement. The pricing services determine the expected cash flows for each security held in this sector using historical prepayment and default projections for the underlying collateral and current market data. In addition, a spread is applied to the relevant benchmark and used to discount the cash flows noted above to determine the fair value of the securities held in this sector.
Short Term Investments
Level 2 - The fair value of the Company's portfolio of short term investments are generally determined using amortized cost which approximates fair value and, in certain cases, in a manner similar to the Company's fixed maturity investments noted above.
Equity Investments, Classified as Trading
Level 1 - The fair value of the Company's portfolio of equity investments, classified as trading are primarily priced by pricing services, reflecting the closing price quoted for the final trading day of the period. When pricing these securities, the pricing services utilize daily data from many real time market sources, including active broker dealers and applicable securities exchanges. All data sources are regularly reviewed for accuracy to attempt to ensure the most reliable price source is used for each issue.
Other investments
Senior secured bank loan funds
Level 2 - At December 31, 2012, the Company's investments in senior secured bank loan funds include funds that invest primarily in bank loans and other senior debt instruments. The fair value of the Company's senior secured bank loan funds are determined using the net asset value per share of the funds. Investments of $172.3 million are redeemable, in part on a monthly basis, or in whole over a three month period.
Catastrophe bonds
Level 2 - The Company's other investments include investments in catastrophe bonds which are recorded at fair value and are based on broker or underwriter bid indications.
Non-U.S. fixed income funds
Level 2 - The Company's non-U.S. fixed income funds invested primarily in non-U.S. convertible securities. The fair values of the investments in this category were estimated using the net asset value per share of the investments which were provided by third parties such as the relevant investment manager or administrator. In April 2012, the Company fully redeemed its remaining investment in non-U.S. fixed income funds at the then net asset value per share.
Hedge funds
Level 2 - The Company has investments in hedge funds that pursue multiple strategies. The fair values of the Company's hedge funds are determined by adjusting the previous period's reported net asset value, which is generally one month in arrears, for an estimated periodic rate of return obtained from the respective investment manager.
For each respective hedge fund investment, the Company obtains and reviews the valuation methodology used by the investment manager and the latest audited financial statements to attempt to ensure that the hedge fund investment is following fair value principles consistent with GAAP in determining the net asset value of each investor's interest.
During June 2012, the Company fully redeemed the portion of its investment in hedge funds which the Company had considered Level 2 in the fair value hierarchy, at the then net asset value per share.
Other assets and liabilities
Derivatives
Level 1 and Level 2 - Other assets and liabilities include certain other derivatives entered into by the Company. The fair value of these transactions include certain exchange traded foreign currency forward contracts which are considered Level 1, and certain credit derivatives, determined using standard industry valuation models and considered Level 2, as the inputs to the valuation model are based on observable market inputs, including credit spreads, credit ratings of the underlying referenced security, the risk free rate and the contract term. In addition, included in Level 2 are certain exchange traded weather and energy related derivatives primarily to address weather and energy risks, and hedging and trading activities related to these risks. The trading markets for these derivatives are generally linked to energy and agriculture commodities, weather and other natural phenomena and can be illiquid in nature. In these instances, the Company utilizes information from the most recent trade to establish fair value.
Other
Level 2 - The liabilities measured at fair value and included in Level 2 at December 31, 2012 of $11.6 million are principally cash settled restricted stock units ("CSRSU") that form part of the Company's compensation program. The fair value of the Company's CSRSUs is determined using observable exchange traded prices for the Company's common shares.
Level 3 Assets and Liabilities Measured at Fair Value
Below is a summary of quantitative information regarding the significant observable and unobservable inputs (Level 3) used in determining the fair value of assets and liabilities measured at fair value on a recurring basis: |
| | | | | | | | | | | | | | | | | | | | |
| | | | | | | | | | | | | | |
| | At December 31, 2012 | Fair Value (Level 3) | | Valuation Technique | | Unobservable (U) and Observable (O) Inputs | | Low | | High | | Weighted Average or Actual | |
| | Fixed maturity investments | | | | | | | | | | | | |
| | Corporate | $ | 17,538 |
| | Discounted cash flow ("DCF") | | Credit spread (U) | | n/a | | n/a | | 4.6 | % | |
| | | | | | | Illiquidity premium (U) | | n/a | | n/a | | 1.0 | % | |
| | | | | | | Risk-free rate (O) | | n/a | | n/a | | 0.1 | % | |
| | | | | | | Dividend rate (O) | | n/a | | n/a | | 5.9 | % | |
| | | 10,254 |
| | Internal valuation model | | Private transaction (U) | | n/a | | n/a | | See below |
| |
| | Total fixed maturity investments | 27,792 |
| | | | | | | | | | | |
| | Other investments | | | | | | | | | | | | |
| | Private equity partnerships | 344,669 |
| | Net asset valuation | | Estimated performance (U) | | (8.8 | )% | | 30.0 | % | | 2.6 | % | |
| | Senior secured bank loan funds | 30,595 |
| | Net asset valuation | | Estimated performance (U) | | 0.3 | % | | 1.0 | % | | 0.8 | % | |
| | Hedge funds | 5,803 |
| | Net asset valuation | | Estimated performance (U) | | 0.0 | % | | 0.0 | % | | 0.0 | % | |
| | Total other investments | 381,067 |
| | | | | | | | | | | |
| | Other assets and (liabilities) | | | | | | | | | | | | |
| | Assumed and ceded (re)insurance contracts | 2,647 |
| | Internal valuation model | | Net premiums written (O) | | $ | — |
| | $ | 12,250 |
| | See below |
| |
| | | | | | | Contract period (O) | | 183 days |
| | 365 days |
| | See below |
| |
| | | | | | | Net reserve for claims and claim expenses (U) | | — |
| | — |
| | See below |
| |
| | Weather and energy related derivatives | 4,427 |
| | Spread option; Quanto; Black Scholes; Simulation | | Correlation (U) | | 0 |
| | 1 |
| | See below |
| |
| | | | | | | Volatility (U) | | 21.0 | % | | 185.0 | % | | See below |
| |
| | | | | | | Commodity curve (U) | | $ | 3.19 |
| | $ | 84.32 |
| | See below |
| |
| | | | | | | Weather curve (U) | | 6 |
| | 5,555 |
| | See below |
| |
| | | | | | | Counterparty default risk (U) | | 0.0 | % | | 22.5 | % | | See below |
| |
| | Other | 18,241 |
| | Net asset valuation | | Estimated performance (U) | | n/a | | n/a | | (0.1 | )% | |
| | | 625 |
| | Internal valuation model | | Private transaction (U) | | n/a | | n/a | | See below |
| |
| | Total other assets and (liabilities) | 25,940 |
| | | | | | | | | | | |
| | | $ | 434,799 |
| | | | | | | | | | | |
| | | | | | | | | | | | | | |
Fixed Maturity Investments
Corporate
Level 3 - Included in the Company's corporate fixed maturity investments is an investment with a fair value of $17.5 million in the preferred equity of a property and casualty insurance group organized to market residential property insurance in North America. The Company measures the fair value of this investment using a DCF model and seeks to incorporate all relevant information reasonably available to it. The Company considers the contractual agreement which stipulates the methodology for calculating a dividend
rate to be paid upon liquidation, conversion or redemption. At December 31, 2012, the dividend rate was 5.9%. In addition, the Company has estimated an illiquidity premium of 1.0%, a risk-free rate of 0.1% and a credit spread of 4.6%. To ensure the estimate for fair value determined using the DCF model is reasonable, the Company reviews private market comparables of similar investments, if available, and in particular, credit ratings of other private market comparables for similar investments to determine the appropriateness of its estimate of fair value using a DCF model. The fair value of the Company's investment in corporate fixed maturity investments determined by a DCF model is positively correlated to the dividend rate, and inversely correlated to the credit spread, illiquidity premium and the risk-free rate.
In addition, the Company's corporate fixed maturity investments include an investment with a fair value of $10.3 million at December 31, 2012 in the preferred equity of a company that provides insurance for a variety of veterinarian costs, including surgeries, medication and diagnostic testing. When utilizing an internal valuation model to determine the fair value of this investment, the Company uses a combination of quantitative and qualitative factors, which may include, but are not limited to, discounted cash flow analysis, financial statement analysis, budgets and forecasts, capital transactions and third party valuations. In circumstances where a private market transaction has recently occurred, the Company will evaluate the comparableness of that transaction and incorporate it into its internal valuation model accordingly. Recent private market transactions of investments similar to that held by the Company have been used to determine the fair value of $10.3 million at December 31, 2012, as the Company believes it represents the price that would be received upon the sale of its investment in an orderly transaction among market participants. Consequently, should future relevant private market transactions occur, the Company will re-evaluate the information available used to determine fair value of this investment and record any adjustments to fair value in its consolidated statements of operations.
Other investments
Private equity partnerships
Level 3 - Included in the Company's $344.7 million of investments in private equity partnerships at December 31, 2012 are alternative asset limited partnerships (or similar corporate structures) that invest in certain private equity asset classes including U.S. and global leveraged buyouts; mezzanine investments; distressed securities; real estate; and oil, gas and power. The fair value of private equity partnership investments is based on current estimated net asset values established in accordance with the governing documents of such investments and is obtained from the investment manager or general partner of the respective entity. The type of underlying investments held by the investee which form the basis of the net asset valuation include assets such as private business ventures, for which the Company does not have access to financial information. As a result, the Company is unable to corroborate the fair value measurement of the underlying investments of the private equity partnership and therefore requires significant management judgment to determine the fair value of the private equity partnership. In circumstances where there is a reporting lag between the current period end reporting date and the reporting date of the latest fund valuation, the Company estimates the fair value of these funds by starting with the prior month or quarter-end fund valuations, adjusting these valuations for actual capital calls, redemptions or distributions, as well as the impact of changes in foreign currency exchange rates, and then estimating the return for the current period. In circumstances in which the Company estimates the return for the current period, all relevant information reasonably available to the Company is utilized. This principally includes preliminary estimates reported to the Company by its fund managers, obtaining the valuation of underlying portfolio investments where such underlying investments are publicly traded and therefore have a readily observable price, using information that is available to the Company with respect to the underlying investments, reviewing various indices for similar investments or asset classes, as well as estimating returns based on the results of similar types of investments for which the Company has obtained reported results, or other valuation methods, where possible. The range of such current estimated periodic returns for the three months ended December 31, 2012 was negative 8.8% to positive 30.0% with a weighted average of positive 2.6%. The fair value of the Company's investment in private equity partnerships is positively correlated to the estimated periodic rate of return. The Company also considers factors such as recent financial information, the value of capital transactions with the partnership and management's judgment regarding whether any adjustments should be made to the net asset value. For each respective private equity partnership, the Company obtains and reviews the valuation methodology used by the investment manager or general partner and the latest audited financial statements to ensure that the
investment partnership is following fair value principles consistent with GAAP in determining the net asset value of each limited partner's interest.
Senior secured bank loan funds
Level 3 - The Company has $30.6 million invested in closed end funds which invest primarily in loans. The Company has no right to redeem its investment in these funds. The Company's investments in these funds are valued using estimated monthly net asset valuations received from the investment manager. The lock up provisions in these funds result in a lack of current observable market transactions between the fund participants and the funds, and therefore, the Company considers the fair value of its investment in these funds to be determined using Level 3 inputs. The Company obtains and reviews the latest audited financial statements to attempt to ensure that these funds are following fair value principles consistent with GAAP in determining the net asset value.
Hedge funds
Level 3 - The Company has $5.8 million of hedge fund investments that are invested in so called "side pockets" or illiquid investments. In these instances, the Company generally does not have the right to redeem its interest, and as such, the Company classifies this portion of its investment as Level 3. The fair value of these illiquid investments are determined by adjusting the previous periods' reported net asset value (generally one month in arrears) for an estimated periodic rate of return obtained from the respective investment manager.
For each respective hedge fund investment, the Company obtains and reviews the valuation methodology used by the investment manager and the latest audited financial statements to ensure that the hedge fund investment is following fair value principles consistent with GAAP in determining the net asset value.
Other assets and liabilities
Assumed and ceded (re)insurance contracts
Level 3 - The $2.6 million fair value of the Company's assumed and ceded (re)insurance contracts accounted for at fair value is obtained through the use of an internal valuation model with the inputs to the internal valuation model based on proprietary data as observable market inputs are not available. The most significant unobservable inputs are the reserve for claims and claim expenses and losses recoverable. Generally, an increase (decrease) in the reserve for claims and claim expenses, or a decrease (increase) in losses recoverable, would result in a decrease (increase) to the fair value of the Company's assumed and ceded (re)insurance contracts.
Weather and Energy Related Derivatives
Level 3 - Derivatives measured at fair value include net assets of $4.4 million related to proprietary, non-exchange traded derivative-based risk management products primarily to address weather and energy risks, and hedging and trading activities related to these risks. The trading markets for these derivatives are generally linked to energy and agriculture commodities, weather and other natural phenomena and in instances where market prices are not available, the Company uses industry or internally developed valuation techniques such as spread option, Black Scholes, quanto and simulation modeling to determine fair value and are considered Level 3. These models may reference prices for similar instruments.
Observable and unobservable inputs to these valuation techniques vary by contract requirements and commodity type, are validated using market-based or independently sourced parameters where applicable and would typically include the following, if applicable, dependent on contract requirements and commodity type:
| |
| • | observable inputs: contract price, notional, option strike, term to expiry, interest rate, contractual limits; |
| |
| • | unobservable inputs: correlation; and |
| |
| • | both observable and unobservable: spot and forward volatilities, forward commodity price, forward weather curve, counterparty credit risk. |
The range of each unobservable input could vary based on the specific commodity, including, but not limited to natural gas, electricity, crude, liquids, temperature or precipitation. Due to the diversity of the portfolio, the range of unobservable inputs could be wide-spread as reflected in the above table on quantitative information.
If a trade has one or more significant valuation inputs that are unobservable, such trades are initially valued at the transaction price, which is considered to be the best initial estimate of fair value. Subsequent to the initial valuation, the Company updates market observable inputs to reflect observable market changes. The unobservable inputs are validated at each reporting period and are only changed when corroborated by evidence such as similar market transactions, third-party pricing services and/or broker or dealer quotations or other empirical market data. The Company seeks to use broker quotes in less liquid markets.
Changes in any or all of the unobservable inputs listed above may contribute positively or negatively to the overall portfolio fair value depending upon the underlying position. In general, movements in weather curves are the largest contributing factor that impact fair value. However, trades valued using unobservable inputs represent a small percentage of the total number of transactions in the portfolio.
Pricing models are internally approved by the Company's Risk Committee prior to implementation and are reviewed periodically.
Other
Level 3 - The Company has an investment of $18.2 million at December 31, 2012 in the common equity of a mortgage insurance company which provides private capital to lenders and investors that supports financing for homeowner mortgages. The fair value of this investment is based on the net asset value obtained from the management of the mortgage insurance company and incorporates both actual and expected results for the current period. The fair value of the Company's investment is positively correlated to the net asset valuation. The Company also considers factors such as recent financial information, the value of capital transactions with the mortgage insurance company and management's judgment regarding whether any adjustments should be made to the net asset value.
The Company also has an investment in the preferred equity of a company that develops online risk management products primarily focused on motor fuels risk, more specifically, structuring products, sourcing the risk and facilitating the settlement of capital. The fair value of this investment at December 31, 2012 of $0.6 million was determined using recent private market transactions. In instances where private market transactions are not available, the fair value is measured using a number of qualitative and quantitative factors, including but not limited to a net asset estimation of the company, projected earnings, and any other information that may be available to the Company. At December 31, 2012, the Company determined that the fair value of its investment was appropriate when compared to the net asset position of the company and recent private market transactions. Should the net asset position of the company increase, the fair value of the Company's investment would also increase.
Below is a reconciliation of the beginning and ending balances, for the periods shown, of assets and liabilities measured at fair value on a recurring basis using Level 3 inputs. Interest and dividend income are included in net investment income and are excluded from the reconciliation. |
| | | | | | | | | | | | | | | | | |
| | | | | | | | | | |
| | | Fair Value Measurements Using Significant Unobservable Inputs
(Level 3) | |
| | | Fixed maturity
investments
trading | | Other
investments | | Other assets and (liabilities) | | Total | |
| | Balance – January 1, 2011 | $ | 21,785 |
| | $ | 362,102 |
| | $ | 16,499 |
| | $ | 400,386 |
| |
| | Total unrealized gains (losses) | | | | | | | | |
| | Included in net investment income | 5,976 |
| | 23,473 |
| | — |
| | 29,449 |
| |
| | Included in other (loss) income | — |
| | — |
| | (4,528 | ) | | (4,528 | ) | |
| | Total realized (losses) gains | | | | | | | | |
| | Included in net investment income | — |
| | (223 | ) | | — |
| | (223 | ) | |
| | Included in other (loss) income | — |
| | — |
| | 38,318 |
| | 38,318 |
| |
| | Total foreign exchange losses | — |
| | (1,635 | ) | | (95 | ) | | (1,730 | ) | |
| | Purchases | — |
| | 74,293 |
| | 56,543 |
| | 130,836 |
| |
| | Sales | — |
| | — |
| | (44,562 | ) | | (44,562 | ) | |
| | Settlements | — |
| | (68,046 | ) | | (33,649 | ) | | (101,695 | ) | |
| | Net transfers into Level 3 | — |
| | 6,562 |
| | — |
| | 6,562 |
| |
| | Balance – December 31, 2011 | $ | 27,761 |
| | $ | 396,526 |
| | $ | 28,526 |
| | $ | 452,813 |
| |
| | Change in unrealized gains for the period included in earnings for assets held at the end of the period included in net investment income | $ | 5,976 |
| | $ | 23,473 |
| | $ | — |
| | $ | 29,449 |
| |
| | Change in unrealized losses for the period included in earnings for assets held at the end of the period included in other (loss) income | $ | — |
| | $ | — |
| | $ | 4,932 |
| | $ | 4,932 |
| |
| | | | | | | | | | |
|
| | | | | | | | | | | | | | | | | |
| | | | | | | | | | |
| | | Fair Value Measurements Using Significant Unobservable Inputs
(Level 3) | |
| | | Fixed maturity investments, trading | | Other investments | | Other assets and (liabilities) | | Total | |
| | Balance – January 1, 2012 | $ | 27,761 |
| | $ | 396,526 |
| | $ | 28,526 |
| | $ | 452,813 |
| |
| | Total unrealized gains | | | | | | | | |
| | Included in net investment income | 31 |
| | 24,947 |
| | — |
| | 24,978 |
| |
| | Included in other (loss) income | — |
| | — |
| | 330 |
| | 330 |
| |
| | Total realized losses | | | | | | | | |
| | Included in net investment income | — |
| | — |
| | — |
| | — |
| |
| | Included in other (loss) income | — |
| | — |
| | (28,308 | ) | | (28,308 | ) | |
| | Total foreign exchange gains | — |
| | 699 |
| | 42 |
| | 741 |
| |
| | Purchases | — |
| | 48,631 |
| | 69,181 |
| | 117,812 |
| |
| | Sales | — |
| | (2,842 | ) | | (116,059 | ) | | (118,901 | ) | |
| | Settlements | — |
| | (86,894 | ) | | 72,228 |
| | (14,666 | ) | |
| | Net transfers into Level 3 | — |
| | — |
| | — |
| | — |
| |
| | Balance – December 31, 2012 | $ | 27,792 |
| | $ | 381,067 |
| | $ | 25,940 |
| | $ | 434,799 |
| |
| | Change in unrealized gains for the period included in earnings for assets held at the end of the period included in net investment income | $ | 31 |
| | $ | 24,947 |
| | $ | — |
| | $ | 24,978 |
| |
| | Change in unrealized gains for the period included in earnings for assets held at the end of the period included in other (loss) income | $ | — |
| | $ | — |
| | $ | 10,892 |
| | $ | 10,892 |
| |
| | | | | | | | | | |
Financial Instruments Disclosed, But Not Carried, at Fair Value
The Company uses various financial instruments in the normal course of its business. The Company's insurance contracts are excluded from fair value of financial instruments accounting guidance, unless the Company elects the fair value option, and therefore, are not included in the amounts discussed herein. The carrying values of cash, accrued interest, receivables for investments sold, certain other assets, payables for investments purchased, certain other liabilities, and other financial instruments not included herein approximated their fair values.
Senior Notes
In January 2003, RenaissanceRe issued $100.0 million, which represented the carrying amount on the Company's consolidated balance sheet, of 5.875% Senior Notes due February 15, 2013, with interest on the notes payable on February 15 and August 15 of each year. See "Note 23. Subsequent Events" for additional information related to the repayment of these notes. At December 31, 2012, the fair value of the 5.875% Senior Notes was $100.6 million (2011 – $103.4 million).
In March 2010, RenRe North America Holdings Inc. ("RRNAH") issued $250.0 million of 5.75% Senior Notes due March 15, 2020, with interest on the notes payable on March 15 and September 15 of each year. At December 31, 2012, the fair value of the 5.75% Senior Notes was $281.2 million (2011 - $263.0 million).
The fair value of RenaissanceRe's 5.875% Senior Notes and RRNAH's 5.75% Senior Notes is determined using indicative market pricing obtained from third-party service providers, which the Company considers Level 2 in the fair value hierarchy. There have been no changes during the period in the Company's valuation technique used to determine the fair value of its Senior Notes.
The Fair Value Option for Financial Assets and Financial Liabilities
The Company has elected to account for certain assets and liabilities at fair value using the guidance under FASB ASC Topic Financial Instruments as the Company believes it represents the most meaningful measurement basis for these assets and liabilities. Below is a summary of the balances the Company has elected to account for at fair value: |
| | | | | | | | | |
| | | | | | |
| | | 2012 | | 2011 | |
| | Other investments | $ | 644,711 |
| | $ | 748,984 |
| |
| | Other assets | $ | 21,513 |
| | $ | 19,628 |
| |
| | | | | | |
Included in net investment income for the year ended December 31, 2012 was net unrealized gains of $38.2 million related to the changes in fair value of other investments (2011 – $12.7 million, 2010 – $57.5 million). Net unrealized losses related to the changes in the fair value of other assets and liabilities recorded in other (loss) income was $3.2 million for the year ended December 31, 2012 (2011 – $2.8 million, 2010 – $2.2 million).
Measuring the Fair Value of Other Investments Using Net Asset Valuations
The table below shows the Company's portfolio of other investments measured using net asset valuations: |
| | | | | | | | | | | | | | | |
| | | | | | | | | | | | |
| | At December 31, 2012 | Fair Value | | Unfunded
Commitments | | Redemption Frequency | | Redemption
Notice Period (Minimum Days) | | Redemption
Notice Period (Maximum Days) | |
| | Private equity partnerships | $ | 344,669 |
| | $ | 91,762 |
| | See below | | See below | | See below | |
| | Senior secured bank loan funds | 202,929 |
| | 17,506 |
| | See below | | See below | | See below | |
| | Hedge funds | 5,803 |
| | — |
| | See below | | See below | | See below | |
| | Total other investments measured using net asset valuations | $ | 553,401 |
| | $ | 109,268 |
| | | | | | | |
| | | | | | | | | | | | |
Private equity partnerships – Included in the Company's investments in private equity partnerships are alternative asset limited partnerships (or similar corporate structures) that invest in certain private equity asset classes including U.S. and global leveraged buyouts; mezzanine investments; distressed securities; real estate; and oil, gas and power. The fair values of the investments in this category have been estimated using the net asset value of the investments, as discussed in detail above. The Company generally has no right to redeem its interest in any of these private equity partnerships in advance of dissolution of the applicable partnership. Instead, the nature of these investments is that distributions are received by the Company in connection with the liquidation of the underlying assets of the applicable limited partnership. It is estimated that the majority of the underlying assets of the limited partnerships would liquidate over 7 to 10 years from inception of the limited partnership.
Senior secured bank loan funds – The Company's investment in senior secured bank loan funds includes funds that invest primarily in bank loans and other senior debt instruments. The fair values of the investments in this category have been determined using the net asset value per share of the funds or the estimated net asset per share where applicable, as discussed in detail above. Investments of $172.3 million are redeemable, in part on a monthly basis, or in whole over a three month period.
The Company also has $30.6 million invested in closed end funds which invest in loans. The Company has no right to require redemption of its investment in these funds.
Hedge funds – The Company invests in hedge funds that pursue multiple strategies. The fair values of the investments in this category are estimated using the net asset value per share of the funds. The Company's investments in hedge funds at December 31, 2012, are $5.8 million of so called "side pocket" investments which are not redeemable at the option of the shareholder. The Company fully redeemed the remaining non-side pocket investments in hedge funds in June 2012. The Company has retained its interest in the side pocket investments until the underlying investments attributable to such side pockets are liquidated, realized or deemed realized at the discretion of the fund manager.
NOTE 7. CEDED REINSURANCE
The Company purchases reinsurance and other protection to manage its risk portfolio and to reduce its exposure to large losses. The Company currently has in place contracts that provide for recovery of a portion of certain claims and claim expenses, generally in excess of various retentions or on a proportional basis. In addition to loss recoveries, certain of the Company's ceded reinsurance contracts provide for recoveries of additional premiums, reinstatement premiums and for lost no-claims bonuses, which are incurred when losses are ceded to other reinsurance contracts. The Company remains liable to the extent that any reinsurance company fails to meet its obligations.
The following tables set forth the effect of reinsurance and retrocessional activity on premiums written and earned and on net claims and claim expenses incurred: |
| | | | | | | | | | | | | |
| | | | | | | | |
| | Year ended December 31, | 2012 | | 2011 | | 2010 | |
| | Premiums written | | | | | | |
| | Direct | $ | 36,367 |
| | $ | 29,725 |
| | $ | 9,133 |
| |
| | Assumed | 1,515,224 |
| | 1,405,251 |
| | 1,156,162 |
| |
| | Ceded | (448,934 | ) | | (422,203 | ) | | (316,330 | ) | |
| | Net premiums written | $ | 1,102,657 |
| | $ | 1,012,773 |
| | $ | 848,965 |
| |
| | Premiums earned | | | | | | |
| | Direct | $ | 34,028 |
| | $ | 17,794 |
| | $ | 5,329 |
| |
| | Assumed | 1,465,701 |
| | 1,356,205 |
| | 1,191,375 |
| |
| | Ceded | (430,374 | ) | | (422,950 | ) | | (331,783 | ) | |
| | Net premiums earned | $ | 1,069,355 |
| | $ | 951,049 |
| | $ | 864,921 |
| |
| | Claims and claim expenses | | | | | | |
| | Gross claims and claim expenses incurred | $ | 403,491 |
| | $ | 1,270,487 |
| | $ | 178,422 |
| |
| | Claims and claim expenses recovered | (78,280 | ) | | (409,308 | ) | | (49,077 | ) | |
| | Net claims and claim expenses incurred | $ | 325,211 |
| | $ | 861,179 |
| | $ | 129,345 |
| |
| | | | | | | | |
The reinsurers with the three largest balances accounted for 14.3%, 14.3% and 12.6%, respectively, of the Company's reinsurance recoverable balance at December 31, 2012 (2011 - 27.3%, 14.9% and 12.4%, respectively). The valuation allowance recorded against reinsurance recoverable was $4.5 million at December 31, 2012 (2011 - $7.3 million). The three largest company-specific components of the valuation allowance represented 44.1%, 26.7% and 6.1%, respectively, of the Company's total valuation allowance at December 31, 2012 (2011 - 34.2%, 27.3% and 12.0%, respectively).
NOTE 8. RESERVE FOR CLAIMS AND CLAIM EXPENSES
The Company uses statistical and actuarial methods to estimate ultimate expected claims and claim expenses. The period of time from the reporting of a claim to the Company and the settlement of the Company's liability may be many years. During this period, additional facts and trends will be revealed. As these factors become apparent, case reserves will be adjusted, sometimes requiring an increase or decrease in the overall reserve for claims and claim expenses of the Company, and at other times requiring a reallocation of incurred but not reported ("IBNR") reserves to specific case reserves or additional case reserves. These estimates are reviewed regularly, and such adjustments, if any, are reflected in the results of operations in the period in which they become known and are accounted for as changes in estimates. Adjustments to the Company's reserve for claims and claim expenses can impact current year net income (loss) by increasing net income or decreasing net loss if the estimates of prior year claims and claim expense reserves prove to be overstated or by decreasing net income or increasing net loss if the estimates of prior year claims and claim expense reserves prove to be insufficient.
The Company's estimates of claims and claim expenses are also based in part upon the estimation of claims resulting from natural and man-made disasters such as hurricanes, earthquakes, tsunamis, tornadoes, floods, winter storms, terrorist attacks and other catastrophic events. Estimation by the Company of claims resulting from catastrophic events is inherently difficult because of the potential severity of property catastrophe claims. Additionally, the Company has recently increased its specialty reinsurance business but does not have the benefit of a significant amount of its own historical experience in certain of these lines. Therefore, the Company uses both proprietary and commercially available models, as well as historical (re)insurance industry claims experience, for purposes of evaluating future trends and providing an estimate of ultimate claims costs.
Activity in the liability for unpaid claims and claim expenses is summarized as follows: |
| | | | | | | | | | | | | |
| | | | | | | | |
| | Year ended December 31, | 2012 | | 2011 | | 2010 | |
| | Net reserves as of January 1 | $ | 1,588,325 |
| | $ | 1,156,132 |
| | $ | 1,260,334 |
| |
| | Net incurred related to: | | | | | | |
| | Current year | 483,180 |
| | 993,168 |
| | 431,476 |
| |
| | Prior years | (157,969 | ) | | (131,989 | ) | | (302,131 | ) | |
| | Total net incurred | 325,211 |
| | 861,179 |
| | 129,345 |
| |
| | Net paid related to: | | | | | | |
| | Current year | 84,056 |
| | 299,299 |
| | 50,793 |
| |
| | Prior years | 142,615 |
| | 129,687 |
| | 182,754 |
| |
| | Total net paid | 226,671 |
| | 428,986 |
| | 233,547 |
| |
| | Net reserves as of December 31 | 1,686,865 |
| | 1,588,325 |
| | 1,156,132 |
| |
| | Reinsurance recoverable as of December 31 | 192,512 |
| | 404,029 |
| | 101,711 |
| |
| | Gross reserves as of December 31 | $ | 1,879,377 |
| | $ | 1,992,354 |
| | $ | 1,257,843 |
| |
| | | | | | | | |
The following table details the Company's prior year development by unit and segment of its liability for unpaid claims and claim expenses: |
| | | | | | | | | | | | | |
| | | | | | | | |
| | Year ended December 31, | 2012 | | 2011 | | 2010 | |
| | Catastrophe | $ | (110,568 | ) | | $ | (59,137 | ) | | $ | (157,458 | ) | |
| | Specialty | (34,146 | ) | | (77,761 | ) | | (128,561 | ) | |
| | Reinsurance | (144,714 | ) | | (136,898 | ) | | (286,019 | ) | |
| | Lloyd's | (16,202 | ) | | 478 |
| | (197 | ) | |
| | Other | 2,947 |
| | 4,431 |
| | (15,915 | ) | |
| | Total | $ | (157,969 | ) | | $ | (131,989 | ) | | $ | (302,131 | ) | |
| | | | | | | | |
Reinsurance Segment
The Company reviews substantially all of its catastrophe reinsurance claims and claim expense reserves quarterly. The Company's quarterly review procedures include identifying events that have occurred up to the latest balance sheet date, determining the Company's best estimate of the ultimate expected cost to settle all claims and administrative costs associated with those new events which have arisen during the reporting period, reviewing the ultimate expected cost to settle claims and administrative costs associated with those events which occurred during previous periods, and considering new estimation techniques, such as additional actuarial methods or other statistical techniques, that can assist the Company in developing its best estimate. This process is judgmental in that it involves reviewing changes in paid and reported claims each period and adjusting the Company's estimates of the ultimate expected claims for each event where there are developments that are different from the Company's previous expectations. If the Company determines that adjustments to an earlier estimate are appropriate, such adjustments are recorded in the period in which they are identified. The level of the Company's claims associated with certain catastrophes can be very large. For example, within the Company's Reinsurance segment, initial estimated ultimate claims associated with the 2005 hurricanes, Katrina, Rita and Wilma, were over $1.5 billion, the 2008 hurricanes, Gustav and Ike, were over $530 million and the large losses of 2011 (including the 2011 New Zealand earthquake, the Tohoku earthquake, the large U.S. tornadoes, flooding in Australia, certain aggregate losses, hurricane Irene and the Thailand floods) were over $1.2 billion. As a result, small percentage changes in the estimated ultimate claims of large catastrophic events can significantly impact the Company's reserves for claims and claim expenses in subsequent periods.
When initially developing reserving techniques for the Company's specialty reinsurance coverages, the Company considered estimating reserves utilizing several actuarial techniques such as paid and reported claims development methods. The Company elected to use the Bornhuetter-Ferguson actuarial method because this method is appropriate for lines of business, such as its specialty reinsurance business, where there is a lack of historical claims experience. This method allows for greater weight to be applied to
expected results in periods where little or no actual experience is available, and, hence, is less susceptible to the potential pitfall of being excessively impacted by one particular year or quarter of actual paid and/or reported claims data. This method uses initial expected claims ratio expectations to the extent that claims are not paid or reported, and it assumes that past experience is not fully representative of the future. As the Company's reserves for claims and claim expenses age, and actual claims experience becomes available, this method places less weight on expected experience and places more weight on actual experience. This experience, which represents the difference between expected reported claims and actual reported claims is reflected in the respective reporting period as a change in estimate. The Company reevaluates its actuarial reserving techniques on a periodic basis.
The Company reviews substantially all of its specialty reinsurance claims and claim expense reserves quarterly. Typically, the quarterly review procedures include reviewing paid and reported claims in the most recent reporting period, reviewing the development of paid and reported claims from prior periods, and reviewing the Company's overall experience by underwriting year and in the aggregate. The Company monitors its expected ultimate claims and claim expense ratios and expected claims reporting assumptions on a quarterly basis and compares them to its actual experience. These actuarial assumptions are generally reviewed annually, based on input from the Company's actuaries, underwriters, claims personnel and finance professionals, although adjustments may be made more frequently if needed. Assumption changes are made to adjust for changes in the pricing and terms of coverage the Company provides, changes in industry results for similar business, as well as its actual experience, to the extent the Company has enough data to rely on its own experience. If the Company determines that adjustments to an earlier estimate are appropriate, such adjustments are recorded in the period in which they are identified.
The following table details the development of the Company's liability for unpaid claims and claim expenses for its Reinsurance segment for the year ended December 31, 2012 split between its catastrophe reinsurance unit and its specialty reinsurance unit and then further split between catastrophe claims and claim expenses and attritional claims and claim expenses: |
| | | | | | | | | | | | | |
| | | | | | | | |
| | Year ended December 31, 2012 | Catastrophe Reinsurance Unit | | Specialty Reinsurance Unit | | Reinsurance Segment | |
| | Catastrophe claims and claim expenses | | | | | | |
| | Large catastrophe events | | | | | | |
| | Chile Earthquake (2010) | $ | 24,575 |
| | $ | — |
| | $ | 24,575 |
| |
| | Hurricanes Gustav & Ike (2008) | 17,541 |
| | — |
| | 17,541 |
| |
| | U.K. Floods (2007) | 17,271 |
| | — |
| | 17,271 |
| |
| | Hurricanes Katrina, Rita and Wilma (2005) | 6,420 |
| | 3,000 |
| | 9,420 |
| |
| | Hurricane Irene (2011) | 4,630 |
| | — |
| | 4,630 |
| |
| | Thailand Floods (2011) | 3,933 |
| | — |
| | 3,933 |
| |
| | Tohoku Earthquake and Tsunami (2011) | 3,896 |
| | — |
| | 3,896 |
| |
| | Windstorm Kyrill (2007) | 3,417 |
| | — |
| | 3,417 |
| |
| | New Zealand Earthquake (2010) | (3,570 | ) | | — |
| | (3,570 | ) | |
| | New Zealand Earthquake (2011) | (17,912 | ) | | — |
| | (17,912 | ) | |
| | Other | 2,542 |
| | — |
| | 2,542 |
| |
| | Total large catastrophe events | 62,743 |
| | 3,000 |
| | 65,743 |
| |
| | Small catastrophe events | | | | | | |
| | Danish Floods (2011) | 5,000 |
| | — |
| | 5,000 |
| |
| | U.S. PCS 63 Winter Storm (2011) | 5,000 |
| | — |
| | 5,000 |
| |
| | U.S. PCS 42 Winter Storm (2011) | 2,560 |
| | — |
| | 2,560 |
| |
| | U.S. PCS 53 Winter Storm (2011) | 2,558 |
| | — |
| | 2,558 |
| |
| | Other | 32,707 |
| | — |
| | 32,707 |
| |
| | Total small catastrophe events | 47,825 |
| | — |
| | 47,825 |
| |
| | Total catastrophe claims and claim expenses | $ | 110,568 |
| | $ | 3,000 |
| | $ | 113,568 |
| |
| | Attritional claims and claim expenses | | | | | | |
| | Bornhuetter-Ferguson actuarial method - actual reported claims less than expected claims | $ | — |
| | $ | 16,747 |
| | $ | 16,747 |
| |
| | Actuarial assumption changes | — |
| | 14,399 |
| | 14,399 |
| |
| | Total attritional claims and claim expenses | $ | — |
| | $ | 31,146 |
| | $ | 31,146 |
| |
| | Total favorable development of prior accident years claims and claim expenses | $ | 110,568 |
| | $ | 34,146 |
| | $ | 144,714 |
| |
| | | | | | | | |
Catastrophe Reinsurance Unit
The favorable development of prior accident years claims and claim expenses within the Company's catastrophe reinsurance unit in the year ended December 31, 2012 of $110.6 million was primarily due to net reductions of $62.7 million arising from the estimated ultimate claims of large catastrophe events, including the 2010 Chilean earthquake, the 2008 hurricanes, the 2007 U.K. flooding, the 2005 hurricanes, hurricane Irene of 2011, the 2011 Thailand floods and the Tohoku earthquake, as reported claims came in better than expected. The remainder of the favorable development of prior accident years claims and claim expenses was due to a reduction in ultimate claims on a number of relatively small catastrophes, all principally the result of reported claims coming in less than expected, principally resulting in formulaic decreases to the ultimate claims for these events. Partially offsetting the reductions noted above was a $17.9 million and $3.6 million increase in net claims and claim expenses from the 2011 and 2010 New Zealand earthquake, respectively, primarily as a result of increased cedant gross ultimate loss estimates.
Specialty Reinsurance Unit
The favorable development of prior accident years claims and claim expenses within the Company's specialty reinsurance unit in the year ended December 31, 2012 of $34.1 million includes $14.4 million associated with actuarial assumption changes, principally in the Company's casualty and medical malpractice lines of business, and primarily as a result of revised initial expected claims ratios and claim development factors due to actual experience coming in better than expected, and $16.7 million due to reported claims coming in lower than expected on prior accident years events, as a result of the application of the Company's formulaic actuarial reserving methodology, and $3.0 million related to reductions in the estimated ultimate losses from the 2005 hurricanes.
The following table details the development of the Company's liability for unpaid claims and claim expenses for its Reinsurance segment for the year ended December 31, 2011 split between its catastrophe reinsurance unit and its specialty reinsurance unit and then further split between catastrophe claims and claim expenses and attritional claims and claim expenses: |
| | | | | | | | | | | | | |
| | | | | | | | |
| | Year ended December 31, 2011 | Catastrophe Reinsurance Unit | | Specialty Reinsurance Unit | | Reinsurance Segment | |
| | Catastrophe claims and claim expenses | | | | | | |
| | Large catastrophe events | | | | | | |
| | Tropical Cyclone Tasha (2010) | $ | 13,922 |
| | $ | 3,000 |
| | $ | 16,922 |
| |
| | Hurricanes Katrina, Rita and Wilma (2005) | 10,008 |
| | 6,215 |
| | 16,223 |
| |
| | Chilean Earthquake (2010) | 8,455 |
| | 4,688 |
| | 13,143 |
| |
| | World Trade Center (2001) | 4,701 |
| | — |
| | 4,701 |
| |
| | Hurricanes Charley, Francis, Ivan and Jeanne (2004) | 4,076 |
| | — |
| | 4,076 |
| |
| | U.K. Floods (2007) | 3,635 |
| | — |
| | 3,635 |
| |
| | Windstorm Kyrill (2007) | 2,494 |
| | — |
| | 2,494 |
| |
| | New Zealand Earthquake (2010) | (15,179 | ) | | — |
| | (15,179 | ) | |
| | Total large catastrophe events | 32,112 |
| | 13,903 |
| | 46,015 |
| |
| | Small catastrophe events | | | | | | |
| | U.S. PCS 21 Wildland Fire (2007) | 4,554 |
| | — |
| | 4,554 |
| |
| | U.S. PCS 33 Great Midwest Storm (2010) | 3,125 |
| | — |
| | 3,125 |
| |
| | U.S. PCS 31 Wind and Thunderstorm (2010) | 3,039 |
| | — |
| | 3,039 |
| |
| | U.S. PCS 96 Wind and Thunderstorm (2010) | 2,288 |
| | — |
| | 2,288 |
| |
| | Other | 14,019 |
| | — |
| | 14,019 |
| |
| | Total small catastrophe events | 27,025 |
| | — |
| | 27,025 |
| |
| | Total catastrophe claims and claim expenses | $ | 59,137 |
| | $ | 13,903 |
| | $ | 73,040 |
| |
| | Attritional claims and claim expenses | | | | | | |
| | Bornhuetter-Ferguson actuarial method - actual reported claims less than expected claims | $ | — |
| | $ | 37,058 |
| | $ | 37,058 |
| |
| | Actuarial assumption changes | — |
| | 26,800 |
| | 26,800 |
| |
| | Total attritional claims and claim expenses | $ | — |
| | $ | 63,858 |
| | $ | 63,858 |
| |
| | Total favorable development of prior accident years claims and claim expenses | $ | 59,137 |
| | $ | 77,761 |
| | $ | 136,898 |
| |
| | | | | | | | |
Catastrophe Reinsurance Unit
The favorable development of prior accident years claims and claim expenses within the Company's catastrophe reinsurance unit in 2011 of $59.1 million was due to net reductions of $32.1 million arising from the estimated ultimate claims of large catastrophe events, including the 2005 hurricanes and the World Trade Center, for which the claims are principally paid and the amount of additional reported claims had slowed considerably and therefore the ultimate claims were reduced, and tropical cyclone Tasha and the
Chilean earthquake, as reported claims came in better than expected in 2011. Partially offsetting the above reductions in estimated ultimate claims during 2011, the Company increased its estimated ultimate claims for the 2010 New Zealand earthquake due to additional claims reporting information being available to the Company. The remainder of the favorable development of prior accident years claims and claim expenses was due to a reduction in ultimate claims on a large number of relatively small catastrophes, all principally the result of reported claims coming in less than expected, resulting in formulaic decreases to the ultimate claims for these events.
Specialty Reinsurance Unit
The favorable development of prior accident years claims and claim expenses within the Company's specialty reinsurance unit in 2011 of $77.8 million includes: $26.8 million associated with actuarial assumption changes, principally in the Company's workers' compensation quota share and per risk and property risk and energy lines of business, and primarily as a result of revised initial expected claims ratios and claim development factors due to actual experience coming in better than expected; $13.9 million due to reductions in case reserves and additional case reserves for certain large catastrophe events; and the remainder of $37.1 million due to reported claims coming in better than expected in 2011 on prior accident years events, as a result of the application of the Company's formulaic actuarial reserving methodology.
The following table details the development of the Company's liability for unpaid claims and claim expenses for its Reinsurance segment for the year ended December 31, 2010 split between its catastrophe reinsurance unit and its specialty reinsurance unit and then further split between catastrophe claims and claim expenses and attritional claims and claim expenses: |
| | | | | | | | | | | | | |
| | | | | | | | |
| | Year ended December 31, 2010 | Catastrophe Reinsurance Unit | | Specialty Reinsurance Unit | | Reinsurance Segment | |
| | Catastrophe claims and claim expenses | | | | | | |
| | Large catastrophe events | | | | | | |
| | Mature, large catastrophe events | | | | | | |
| | European Windstorm Erwin (2005) | $ | 10,593 |
| | $ | — |
| | $ | 10,593 |
| |
| | World Trade Center (2001) | 9,914 |
| | — |
| | 9,914 |
| |
| | Hurricanes Martin and Floyd (1999) | 4,822 |
| | — |
| | 4,822 |
| |
| | European Floods (2002) | 4,361 |
| | — |
| | 4,361 |
| |
| | U.S. PCS 88 Wind and Thunderstorm (2003) | 2,873 |
| | — |
| | 2,873 |
| |
| | Hurricane Isabel (2003) | 1,995 |
| | — |
| | 1,995 |
| |
| | U.S. PCS 97 Wildland Fire (2003) | 1,231 |
| | — |
| | 1,231 |
| |
| | Northridge Earthquake (1993) | 1,094 |
| | — |
| | 1,094 |
| |
| | Windstorm Anatol (1999) | 971 |
| | — |
| | 971 |
| |
| | Total mature, large catastrophe events | 37,854 |
| | — |
| | 37,854 |
| |
| | Hurricanes Katrina, Rita and Wilma (2005) | 25,482 |
| | 5,350 |
| | 30,832 |
| |
| | Buncefield Oil Depot (2005) | 27,418 |
| | 2,073 |
| | 29,491 |
| |
| | Hurricanes Gustav and Ike (2008) | 10,878 |
| | — |
| | 10,878 |
| |
| | Hurricanes Charley, Francis, Ivan and Jeanne (2004) | 8,149 |
| | — |
| | 8,149 |
| |
| | European Windstorm Klaus (2009) | 8,000 |
| | — |
| | 8,000 |
| |
| | Total large catastrophe events | 117,781 |
| | 7,423 |
| | 125,204 |
| |
| | Small catastrophe events | | | | | | |
| | U.S. PCS 78 Wind and Thunderstorm (2009) | 3,215 |
| | — |
| | 3,215 |
| |
| | U.S. PCS 66 Wind and Thunderstorm (2009) | 3,149 |
| | — |
| | 3,149 |
| |
| | U.S. Winter Storm (2009) | 3,000 |
| | — |
| | 3,000 |
| |
| | Hurricane Bill (2009) | 2,500 |
| | — |
| | 2,500 |
| |
| | U.S. PCS 82 Wind and Thunderstorm (2009) | 2,429 |
| | — |
| | 2,429 |
| |
| | Austrian Floods (2009) | 2,356 |
| | — |
| | 2,356 |
| |
| | Other | 23,028 |
| | — |
| | 23,028 |
| |
| | Total small catastrophe events | 39,677 |
| | — |
| | 39,677 |
| |
| | Total catastrophe claims and claim expenses | $ | 157,458 |
| | $ | 7,423 |
| | $ | 164,881 |
| |
| | Attritional claims and claim expenses | | | | | | |
| | Bornhuetter-Ferguson actuarial method - actual reported claims less than expected claims | $ | — |
| | $ | 71,261 |
| | $ | 71,261 |
| |
| | Actuarial assumption changes | — |
| | 31,400 |
| | 31,400 |
| |
| | Reductions in specific events | — |
| | 18,477 |
| | 18,477 |
| |
| | Total attritional claims and claim expenses | $ | — |
| | $ | 121,138 |
| | $ | 121,138 |
| |
| | Total favorable development of prior accident years claims and claim expenses | $ | 157,458 |
| | $ | 128,561 |
| | $ | 286,019 |
| |
| | | | | | | | |
Catastrophe Reinsurance Unit
The favorable development of prior accident years claims and claim expenses within the Company's catastrophe reinsurance unit in 2010 of $157.5 million was due to reductions of $37.9 million to the estimated ultimate claims of mature, large catastrophe events, such as the 2001 World Trade Center, European windstorm Erwin and the large European windstorms of 1999, for which the claims are principally paid and the amount of additional reported claims had slowed considerably and therefore the ultimate claims were reduced. In addition, the 2005 Buncefield Oil Depot claim was reduced by $27.4 million in 2010, principally due to the underlying insured subrogating its liability and subsequently reimbursing the Company for claims the Company had previously paid to the insured. The ultimate claims associated with the 2005 hurricanes, Katrina, Rita and Wilma, and the 2004 hurricanes, Charley, Frances, Ivan and Jeanne, were reduced by $25.5 million and $8.1 million, respectively, as reported claims came in better than expected in 2010. The Company adopted a new actuarial technique in 2009 to reserve for these hurricanes and the level of reported claims in 2010 was less than the actuarial technique would have indicated, resulting in formulaic decreases to the ultimate claims for these large hurricanes. The ultimate claims associated with the 2008 hurricanes, Gustav and Ike, were reduced by $10.9 million and the 2009 European windstorm Klaus were reduced by $8.0 million in 2010, due to better than expected reported claims activity. The remainder of the favorable development of prior accident years claims and claim expenses was due to a reduction in ultimate claims on a large number of relatively small catastrophes, all principally the result of reported claims coming in less than expected, resulting in formulaic decreases to the ultimate claims for these events.
Specialty Reinsurance Unit
The favorable development of prior accident years claims and claim expenses within the Company's specialty reinsurance unit in 2010 of $128.6 million includes $31.4 million associated with actuarial assumption changes, principally in the Company's casualty clash and surety lines of business, and partially offset by an increase in reserves within the Company's workers compensation per risk line of business, principally as a result of revised initial expected claims ratios and claim development factors due to actual experience coming in better than expected; $18.5 million due to reductions in case reserves and additional case reserves, which are reserves established at the contract level for specific events; $7.4 million due to reductions in case reserves and additional case reserves for certain large catastrophe events; and the remainder of $71.3 million due to reported claims coming in better than expected in 2010 on prior accident years events, principally the 2005 through 2009 underwriting years, as a result of the application of the Company's formulaic actuarial reserving methodology.
Lloyd's Segment
The Company uses the Bornhuetter-Ferguson actuarial method to estimate claims and claim expenses within its Lloyd's segment for its property and casualty (re)insurance contracts and quota share reinsurance business. The comments discussed above relating to the Company's reserving techniques and processes for the Company's specialty reinsurance unit within the Company's Reinsurance segment also apply to the Company's Lloyd's segment. In addition, certain of the Company's coverages may be impacted by natural and man-made catastrophes. The Company estimates claim reserves for these claims after the event giving rise to these claims occurs, following a process that is similar to the Company's catastrophe reinsurance unit discussed above.
The following table details the development of the Company's liability for unpaid claims and claim expenses for its Lloyd's segment for the years ended December 31, 2012, 2011 and 2010: |
| | | | | | | | | | | | | |
| | | | | | | | |
| | Year ended December 31, | 2012 | | 2011 | | 2010 | |
| | Attritional claims and claim expenses | $ | 8,011 |
| | $ | (478 | ) | | $ | 197 |
| |
| | Catastrophe events - property catastrophe reinsurance | 5,726 |
| | — |
| | — |
| |
| | Catastrophe events - other | 3,750 |
| | — |
| | — |
| |
| | Actuarial assumption changes | (1,285 | ) | | — |
| | — |
| |
| | Total | $ | 16,202 |
| | $ | (478 | ) | | $ | 197 |
| |
| | | | | | | | |
The favorable development of prior accident years claims and claim expenses within the Company's Lloyd's segment of $16.2 million during the year ended December 31, 2012 was principally due to favorable development of $5.5 million related to the 2011 Thailand floods and $2.5 million related to hurricane Irene, $1.3 million of adverse development related to actuarial assumption changes, with the remainder primarily due to reported claims coming in lower than expected on a number of prior accident years events, as a result of the application of the Company's formulaic actuarial reserving methodology and lower than expected reported claims for catastrophe losses within the Lloyd's segment property catastrophe reinsurance book of business.
The Company commenced its Lloyd's operations in mid-2009 and the prior accident years reserve development in this segment since that time was not significant for the years ended December 31, 2011 and 2010.
Other Category
The Company uses the Bornhuetter-Ferguson actuarial method to estimate claims and claim expenses within its Other category for its property and casualty insurance contracts and quota share reinsurance business. The comments discussed above relating to the Company's reserving techniques and processes for its specialty reinsurance unit within the Company's Reinsurance segment also apply to the Company's Other category. In addition, certain of the Company's coverages may be impacted by natural and man-made catastrophes. The Company estimates claim reserves for these claims after the event giving rise to these claims occurs, following a process that is similar to the Company's catastrophe reinsurance unit discussed above.
The following table details the development of the Company's liability for unpaid claims and claim expenses for its Other category for the years ended December 31, 2012, 2011 and 2010: |
| | | | | | | | | | | | | |
| | | | | | | | |
| | Year ended December 31, | 2012 | | 2011 | | 2010 | |
| | Catastrophe events | $ | 1,171 |
| | $ | 4,243 |
| | $ | 300 |
| |
| | Attritional claims and claim expenses | 3,265 |
| | 1,389 |
| | 15,615 |
| |
| | Loss portfolio transfer | (7,383 | ) | | — |
| | — |
| |
| | Actuarial assumption changes | — |
| | (10,063 | ) | | — |
| |
| | Total | $ | (2,947 | ) | | $ | (4,431 | ) | | $ | 15,915 |
| |
| | | | | | | | |
The adverse development on prior accident years of $2.9 million for the year ended December 31, 2012 within the Company's Other category was principally the result of a loss portfolio transfer entered into by the Company on October 1, 2012, in respect of its contractor's liability book of business within Glencoe, whereby the Company paid consideration of $36.5 million to transfer net liabilities of $29.1 million, resulting in a loss of $7.4 million which is recorded above as prior accident years attritional claims and claims expenses in the Company's Other category, partially offset by reductions in reported losses on certain attritional loss contracts and favorable development related to catastrophe events, primarily the 2008 hurricanes.
The adverse development on prior accident years of $4.4 million in 2011 within the Company's Other category was principally due to the contractor's liability book of business, which experienced higher than expected reported losses, and was subsequently subject to a comprehensive actuarial review during the fourth quarter of 2011, which review resulted in an increase of $10.1 million to the estimated ultimate claims
and claim expenses related to this book of business due to changes in the actuarial assumptions. The total gross reserve for claims and claim expenses for the construction defect book of business at December 31, 2011 is $58.8 million. Partially offsetting the adverse development on prior accident years within the construction defect book of business, noted above, was favorable development of $4.2 million related to large catastrophe events, of which $4.6 million related to the 2005 hurricanes, and $1.4 million related to the application of the Company's formulaic actuarial reserving methodology with the reductions being due to actual paid and reported claim activity being more favorable to date than what was originally anticipated when setting the initial reserves.
The favorable development of $15.9 million in 2010 on prior accident year claims and claim expenses within the Company's Other category was principally driven by the application of the Company's formulaic actuarial reserving methodology for this business with the reductions being due to actual paid and reported claim activity being more favorable to date than what was originally anticipated when setting the initial reserves. There were no significant changes made to the actuarial assumptions in 2010 or to the ultimate claims associated with the large catastrophe events.
Assumed Reinsurance Contracts Classified As Deposit Contracts
Net claims and claim expenses incurred were reduced by $0.1 million during 2012 (2011 – $0.2 million, 2010 – $0.2 million) related to income earned on assumed reinsurance contracts that were classified as deposit contracts with underwriting risk only. Other loss was decreased by $7.5 million during 2012 (2011 – other loss increased by $0.1 million, 2010 – other income increased by $8.1 million) related to premiums and losses incurred on assumed reinsurance contracts that were classified as deposit contracts with timing risk only. Aggregate deposit liabilities of $41.2 million are included in reinsurance balances payable at December 31, 2012 (2011 – $50.0 million) and aggregate deposit assets of $Nil are included in other assets at December 31, 2012 (2011 – $Nil) associated with these contracts.
NOTE 9. DEBT
5.875% Senior Notes
In January 2003, the Company issued $100.0 million, which represented the carrying amount on the Company's consolidated balance sheet, of 5.875% Senior Notes due February 15, 2013, with interest on the notes payable on February 15 and August 15 of each year. See "Note 23. Subsequent Events" for additional information related to the repayment of these notes. The notes, which were senior obligations, contained various covenants, including limitations on mergers and consolidations, restrictions as to the disposition of the stock of designated subsidiaries and limitations on liens of the stock of designated subsidiaries.
5.75% Senior Notes
On March 17, 2010, RRNAH issued $250.0 million of 5.75% Senior Notes due March 15, 2020, with interest on the notes payable on March 15 and September 15 of each year. The notes, which are senior obligations, are guaranteed by RenaissanceRe and can be redeemed by RRNAH prior to maturity, subject to the payment of a "make-whole" premium. The notes were issued pursuant to an Indenture, dated as of March 17, 2010, by and among RenaissanceRe, RRNAH, and Deutsche Bank Trust Company Americas, as trustee (the "Trustee"), as supplemented by the First Supplemental Indenture, dated as of March 17, 2010 (as so supplemented, the "Indenture"). The notes, which are senior obligations, contain various covenants, including limitations on mergers and consolidations, restrictions as to the disposition of the stock of designated subsidiaries and limitations on liens of the stock of designated subsidiaries.
RenaissanceRe Revolving Credit Facility (the "Credit Agreement")
Effective May 17, 2012, RenaissanceRe entered into a credit agreement with various banks and financial institutions parties thereto (collectively, the "Lenders"), Wells Fargo Bank, National Association ("Wells Fargo"), as fronting bank, letter of credit administrator and administrative agent for the Lenders, Citibank, N.A. ("Citibank"), as syndication agent, and Wells Fargo Securities, LLC and Citigroup Global Markets Inc., as joint lead arrangers and joint lead bookrunners (the "Credit Agreement"). The Credit Agreement
replaced the Credit Agreement, dated as of April 22, 2010, which was terminated concurrently with the effectiveness of the Credit Agreement.
The Credit Agreement provides for a revolving commitment to RenaissanceRe of $150.0 million, including the issuance of letters of credit for the account of RenaissanceRe and RenaissanceRe's insurance subsidiaries of up to $150.0 million and the issuance of letters of credit for the account of RenaissanceRe's non-insurance subsidiaries of up to $50.0 million. RenaissanceRe has the right, subject to satisfying certain conditions, to increase the size of the facility to $250.0 million. Amounts borrowed under the Credit Agreement bear interest at a rate selected by RenaissanceRe equal to the Base Rate or LIBOR (each as defined in the Credit Agreement) plus a margin, all as more fully set forth in the Credit Agreement. At December 31, 2012, the Company has not borrowed any amounts under the Credit Agreement.
The Credit Agreement contains representations, warranties and covenants customary for bank loan facilities of this type. In addition to customary covenants which limit RenaissanceRe and its subsidiaries' ability to merge, consolidate, enter into negative pledge agreements, sell a substantial amount of assets, incur liens and declare or pay dividends under certain circumstances, the Credit Agreement also contains certain financial covenants. These financial covenants generally provide that consolidated debt to capital shall not exceed the ratio of 0.35:1 and that the consolidated net worth of RenaissanceRe and Renaissance Reinsurance shall equal or exceed approximately $2.1 billion and $1.1 billion, respectively (the "Net Worth Requirements"). The Net Worth Requirements are recalculated effective as of the end of each fiscal year, all as more fully set forth in the Credit Agreement. The scheduled commitment maturity date of the Credit Agreement is May 17, 2015.
In the event of the occurrence and continuation of certain events of default, the administrative agent shall, at the request of the Required Lenders (as defined in the Credit Agreement), or may, with the consent of the Required Lenders, among other things, take any or all of the following actions: terminate the Lenders' obligations to make loans or issue letters of credit, accelerate the outstanding obligations of RenaissanceRe under the Credit Agreement and require RenaissanceRe to cash collateralize the outstanding letter of credit obligations in an amount equal to 103% thereof.
DaVinciRe Revolving Credit Facility
DaVinciRe was a party to a Third Amended and Restated Credit Agreement, dated as of April 5, 2006 (the "DaVinciRe Credit Agreement"), which provided for a revolving credit facility in an aggregate amount of up to $200.0 million and was scheduled to mature on April 5, 2011. On April 1, 2011, DaVinciRe repaid in full the $200.0 million borrowed under the DaVinciRe Credit Agreement and terminated the lenders' lending commitment thereunder. In connection with such repayment and termination, on March 30, 2011, DaVinciRe entered into a loan agreement with RenaissanceRe (the "Loan Agreement") under which RenaissanceRe made a loan to DaVinciRe in the principal amount of $200.0 million on April 1, 2011. The loan matures on March 31, 2021 and interest on the loan is payable at a rate of three month LIBOR plus 3.5% and is due at the end of each March, June, September and December, commencing on June 30, 2011. Under the terms of the Loan Agreement, DaVinciRe is required to maintain a debt to capital ratio of no greater than 0.40:1 and a net worth of no less than $500.0 million. On December 21, 2012, DaVinciRe repaid $100.0 million of principal under the Loan Agreement and at December 31, 2012, $100.0 million remained outstanding under the Loan Agreement. No additional amounts may be borrowed by DaVinciRe under the Loan Agreement.
Principal Letter of Credit Facility
Effective May 17, 2012, RenaissanceRe and certain of its affiliates, Renaissance Reinsurance, Renaissance Reinsurance of Europe ("ROE"), Glencoe and DaVinci (such affiliates, collectively, the "Account Parties"), entered into a Fourth Amended and Restated Reimbursement Agreement with various banks and financial institutions parties thereto (collectively, the "Banks"), Wells Fargo, as issuing bank, administrative agent and collateral agent for the Banks, and certain other agents (the "Reimbursement Agreement"). The Reimbursement Agreement amended and restated in its entirety the Third Amended and Restated Reimbursement Agreement, dated as of April 22, 2010 (the "Prior Reimbursement Agreement"), which was terminated concurrently with the effectiveness of the Reimbursement Agreement.
The Reimbursement Agreement continues to serve as RenaissanceRe's principal secured letter of credit facility and the commitments thereunder expire on May 17, 2015. The Reimbursement Agreement provides
a commitment from the Banks in an aggregate amount of $450.0 million, which may be increased up to an amount not to exceed $800.0 million, subject to RenaissanceRe satisfying certain conditions. The Reimbursement Agreement contains representations, warranties and covenants in respect of RenaissanceRe, the Account Parties and their respective subsidiaries that are customary for facilities of this type, including customary covenants limiting the ability to merge, consolidate and sell a substantial amount of assets. The Reimbursement Agreement contains certain financial covenants requiring RenaissanceRe and DaVinci to maintain a minimum net worth of approximately $1.8 billion and $749.1 million, respectively, which requirements are recalculated effective as of the end of each fiscal year, all as more fully set forth in the Reimbursement Agreement.
Under the Reimbursement Agreement, each Account Party is required to pledge eligible collateral having a value sufficient to cover all of its obligations under the Reimbursement Agreement, including reimbursement obligations for outstanding letters of credit issued for its account. In the case of an event of default under the Reimbursement Agreement, and in certain other circumstances set forth in the Reimbursement Agreement, including, among others, a decrease in the net worth of an Account Party below the level specified therein for such Account Party, a decline in collateral value, and certain failures to maintain specified ratings, the Banks may exercise certain remedies, including conversion of collateral into cash.
At December 31, 2012, the Company had $204.6 million of letters of credit with effective dates on or before December 31, 2012 outstanding under the Reimbursement Agreement.
Bilateral Letter of Credit Facility ("Bilateral Facility")
Effective September 17, 2010, each of Renaissance Reinsurance, DaVinci and Glencoe (collectively, the "Bilateral Facility Participants"), entered into a secured letter of credit facility with Citibank Europe plc ("CEP"). The Bilateral Facility provides a commitment from CEP to issue letters of credit for the account of one or more of the Bilateral Facility Participants and their respective subsidiaries in multiple currencies and in an aggregate amount of up to $300.0 million. The Bilateral Facility expires on December 31, 2013 and is evidenced by a Facility Letter (as amended) and three separate Master Agreements between CEP and each of the Bilateral Facility Participants, as well as certain ancillary agreements. At December 31, 2012, the Bilateral Facility of $292.9 million remained unused and available to the Bilateral Facility Participants.
Under the Bilateral Facility, each of the Bilateral Facility Participants is severally obligated to pledge to CEP at all times during the term of the Bilateral Facility certain securities with a collateral value (as determined as therein provided) that equals or exceeds 100% of the aggregate amount of its then-outstanding letters of credit. In the case of an event of default under the Bilateral Facility with respect to a Bilateral Facility Participant, CEP may exercise certain remedies with respect to such Bilateral Facility Participant, including terminating its commitment to such Bilateral Facility Participant under the Bilateral Facility and taking certain actions with respect to the collateral pledged by such Bilateral Facility Participant (including the sale thereof). In the Facility Letter, each of Renaissance Reinsurance, DaVinci and Glencoe makes, as to itself, representations and warranties that are customary for facilities of this type and severally agrees that it will comply with certain informational and other undertakings, including those regarding the delivery of quarterly and annual financial statements.
Funds at Lloyd's Letter of Credit Facility
On April 26, 2010, Renaissance Reinsurance and CEP entered into an Amended and Restated Pledge Agreement (the "Pledge Agreement") in respect of its letter of credit facility with CEP which is evidenced by the Master Reimbursement Agreement, dated as of April 29, 2009, and provides for the issuance and renewal of letters of credit which are used to support business written by Syndicate 1458. At December 31, 2012, letters of credit issued by CEP under the Reimbursement Agreement were outstanding in the amount of $222.0 million and £45.5 million, respectively. Pursuant to the Pledge Agreement, Renaissance Reinsurance has agreed to pledge to CEP at all times during the term of the Reimbursement Agreement certain securities with a collateral value equal to 100% of the aggregate amount of the then-outstanding letters of credit issued under the Reimbursement Agreement.
Letters of Credit
At December 31, 2012, the Company had total letters of credit outstanding under all facilities of $507.2 million.
Renaissance Reinsurance is also party to a collateralized letter of credit and reimbursement agreement in the amount of $37.5 million that supports the Company's Top Layer Re joint venture. Renaissance Reinsurance is obligated to make a mandatory capital contribution of up to $50.0 million in the event that a loss reduces Top Layer Re's capital below a specified level.
Renaissance Trading Margin Facility and Guarantees
Renaissance Trading maintains a brokerage facility with a prime broker, which has an associated margin facility of $20.0 million. This margin facility, which allows Renaissance Trading to manage its cash position related to its exchange traded products, is supported by a $25.0 million guarantee issued by RenaissanceRe. Interest on amounts outstanding under this facility is at overnight LIBOR plus 200 basis points. At December 31, 2012, $2.4 million was outstanding under the facility.
At December 31, 2012, RenaissanceRe had provided guarantees in the aggregate amount of $304.3 million to certain counterparties of the weather and energy risk operations of Renaissance Trading. In the future, RenaissanceRe may issue guarantees for other purposes or increase the amount of guarantees issued to counterparties of Renaissance Trading.
Interest paid on the Company's debt totaled $23.1 million for the year ended December 31, 2012 (2011 – $23.8 million, 2010 – $17.7 million).
The following table sets forth the Company's aggregate amount of maturities related to the Company's debt obligations reflected on its consolidated balance sheet at December 31, 2012: |
| | | | | |
| | | | |
| | 2013 | $ | 102,436 |
| |
| | 2014 | — |
| |
| | 2015 | — |
| |
| | 2016 | — |
| |
| | 2017 | — |
| |
| | After 2017 | 250,000 |
| |
| | Unamortized debt issuance expenses | (661 | ) | |
| | | $ | 351,775 |
| |
| | | | |
NOTE 10. NONCONTROLLING INTERESTS
Redeemable Noncontrolling Interest – DaVinciRe
In October 2001, the Company formed DaVinciRe and DaVinci with other equity investors. RenaissanceRe owns a noncontrolling economic interest in DaVinciRe; however, because RenaissanceRe controls a majority of DaVinciRe's outstanding voting rights, the consolidated financial statements of DaVinciRe are included in the consolidated financial statements of the Company. The portion of DaVinciRe's earnings owned by third parties is recorded in the consolidated statements of operations as net (income) loss attributable to noncontrolling interests. The Company's ownership in DaVinciRe was 30.8% at December 31, 2012 (2011 - 42.8%).
DaVinciRe shareholders are party to a shareholders agreement (the "Shareholders Agreement") which provides DaVinciRe shareholders, excluding RenaissanceRe, with certain redemption rights that enable each shareholder to notify DaVinciRe of such shareholder's desire for DaVinciRe to repurchase up to half of such shareholder's initial aggregate number of shares held, subject to certain limitations, such as limiting the aggregate of all share repurchase requests to 25% of DaVinciRe's capital in any given year and satisfying all applicable regulatory requirements. If total shareholder requests exceed 25% of DaVinciRe's capital, the number of shares repurchased will be reduced among the requesting shareholders pro-rata, based on the amounts desired to be repurchased. Shareholders desiring to have DaVinci repurchase their shares must notify DaVinciRe before March 1 of each year. The repurchase price will be based on GAAP book value as of the end of the year in which the shareholder notice is given, and the repurchase will be effective as of such date. Payment will be made by April 1 of the following year, following delivery of the audited financial statements for the year in which the repurchase was effective. The repurchase price is
subject to a true-up for development on outstanding loss reserves after settlement of all claims relating to the applicable years.
Certain third party shareholders of DaVinciRe submitted repurchase notices on or before the required annual redemption notice date of March 1, 2011, in accordance with the Shareholders Agreement. The repurchase notices submitted on or before March 1, 2011, were for shares of DaVinciRe with a GAAP book value of $9.2 million at December 31, 2011. Effective January 1, 2012, DaVinciRe redeemed the shares for $9.2 million, less a $1.8 million reserve holdback.
On June 1, 2011, DaVinciRe completed an equity raise of $100.0 million from new and existing shareholders, including $30.0 million contributed by the Company. As a result of the equity raise, the Company's ownership in DaVinciRe decreased to 42.8% effective June 1, 2011.
Effective January 1, 2012, an existing third party shareholder sold a portion of its shares in DaVinciRe to a new third party shareholder. In connection with the sale by the existing third party shareholder, DaVinciRe retained a $4.9 million holdback. In addition, effective January 1, 2012, the Company sold a portion of its shares of DaVinciRe to a separate new third party shareholder. The Company sold these shares for $98.9 million, net of a $10.0 million reserve holdback due from DaVinciRe. The Company's ownership in DaVinciRe was 42.8% at December 31, 2011 and subsequent to the above transactions, its ownership interest in DaVinciRe decreased to 34.7% effective January 1, 2012.
Certain third party shareholders of DaVinciRe submitted repurchase notices on or before the required annual redemption notice date of March 1, 2012, in accordance with the Shareholders Agreement. The repurchase notices submitted on or before March 1, 2012, were for shares of DaVinciRe with a GAAP book value of $53.2 million at December 31, 2012.
On June 1, 2012, DaVinciRe completed an equity raise of $49.3 million from a new third party investor. In addition, the Company and an existing third party investor each sold $24.7 million in common shares of DaVinciRe to another existing third party investor, for a total of $49.4 million. In connection with the sale by the Company and the existing third party investor, DaVinciRe retained a $5.0 million holdback. As a result of the above transactions, the Company's ownership in DaVinciRe decreased to 31.5% effective January 1, 2012.
On October 1, 2012, the Company sold a portion of its shares of DaVinciRe to a new third party shareholder for $9.8 million. The Company's ownership in DaVinciRe decreased to 30.8% effective October 1, 2012 as a result of this sale.
See "Note 23. Subsequent Events" for additional information related to DaVinciRe shareholder transactions which occurred during January 2013.
The Company expects its ownership in DaVinciRe to fluctuate over time.
The activity in redeemable noncontrolling interest – DaVinciRe is detailed in the table below: |
| | | | | | | | | |
| | | | | | |
| | | 2012 | | 2011 | |
| | Balance – January 1 | $ | 657,727 |
| | $ | 757,655 |
| |
| | Purchase of shares from redeemable noncontrolling interest | — |
| | (136,225 | ) | |
| | Sale of shares to redeemable noncontrolling interests | 163,033 |
| | 70,000 |
| |
| | Comprehensive income: | | | | |
| | Net income (loss) attributable to redeemable noncontrolling interest | 147,499 |
| | (33,697 | ) | |
| | Other comprehensive loss attributable to redeemable noncontrolling interest | — |
| | (6 | ) | |
| | Balance – December 31 | $ | 968,259 |
| | $ | 657,727 |
| |
| | | | | | |
Noncontrolling Interest - Angus Fund L.P. (the "Angus Fund")
In December 2010, REAL and RenRe Commodity Advisors Inc. ("RRCA"), both wholly owned subsidiaries of the Company, formed the Angus Fund with other equity investors. REAL, the general partner of the Angus Fund, has invested $55 thousand in the Angus Fund, representing a 1.1% ownership interest at December 31, 2012 (December 31, 2011 - $41 thousand and 1.0%, respectively), and RRCA, a limited partner, has invested $2.0 million in the Angus Fund, representing a 35.1% ownership interest at December 31, 2012 (December 31, 2011 - $1.0 million and 24.2%, respectively). The Angus Fund was formed to provide capital to and make investments in companies primarily in the heating oil and propane distribution industries to supplement the Company's weather and energy risk management operations. The Angus Fund meets the definition of a VIE, therefore the Company evaluated its ownership in the Angus Fund to determine if it is the primary beneficiary. The Company concluded it is the primary beneficiary of the Angus Fund as it has the power to direct, and has a more than insignificant economic interest in, the activities of the Angus Fund and as such, the financial position and results of operations of the Angus Fund are consolidated. The portion of the Angus Fund's earnings owned by third parties is recorded in the consolidated statements of operations as net (income) loss attributable to noncontrolling interests.
The Company expects its ownership in the Angus Fund to fluctuate over time.
The activity in noncontrolling interest is detailed in the table below: |
| | | | | | | | | |
| | | | | | |
| | | 2012 | | 2011 | |
| | Balance – January 1 | $ | 3,340 |
| | $ | 2,889 |
| |
| | Sale of shares to noncontrolling interest | 300 |
| | 100 |
| |
| | Net income attributable to noncontrolling interest | 541 |
| | 540 |
| |
| | Dividends on common shares | (190 | ) | | (189 | ) | |
| | Balance – December 31 | $ | 3,991 |
| | $ | 3,340 |
| |
| | | | | | |
NOTE 11. VARIABLE INTEREST ENTITIES
Effective January 1, 2012, the Company formed and launched a managed joint venture, Upsilon Reinsurance Ltd. ("Upsilon Re"), a Bermuda domiciled special purpose insurer ("SPI"), to provide additional capacity to the worldwide aggregate and per-occurrence retrocessional property catastrophe excess of loss market for the 2012 underwriting year. The original business was written by ROE, a wholly owned subsidiary of RenaissanceRe, and included $37.4 million of gross premiums written incepting between January 1, 2012 and June 1, 2012. A portion of this business was in turn ceded to Upsilon Re under a fully-collateralized retrocessional reinsurance contract, effective January 1, 2012. In conjunction with the formation and launch of Upsilon Re, $16.8 million of non-voting Class B shares were sold to external investors, and the Company invested $48.8 million in Upsilon Re's non-voting Class B shares, representing a 74.5% ownership interest in Upsilon Re. The Class B shareholders participate in substantially all of the profits or losses of Upsilon Re while the Class B shares remain outstanding. The holders of Class B shares indemnify Upsilon Re against losses relating to insurance risk and therefore these shares have been accounted for as prospective reinsurance under FASB ASC Topic Financial Services - Insurance. In addition, another third party investor supplied $17.6 million of capital through a reinsurance participation (a third party quota share agreement) with ROE alongside Upsilon Re. Inclusive of the reinsurance participation, the Company has a 61.4% participation in the original risks assumed by ROE. Both Upsilon Re and the reinsurance participation are managed by RUM in return for an expense override, as well as a potential underwriting profit commission. Upsilon Re is considered a VIE and the Company is considered the primary beneficiary. As a result, Upsilon Re is consolidated by the Company and all significant inter-company transactions have been eliminated.
Effective June 1, 2012, the Company formed and launched a managed joint venture, Timicuan Reinsurance III Limited ("Tim Re III"), a Bermuda domiciled SPI, to provide collateralized reinsurance in respect of a portfolio of Florida reinstatement premium protection ("RPP") contracts. The original business was written by Renaissance Reinsurance and DaVinci, and included $41.1 million of gross premiums written incepting June 1, 2012 and Renaissance Reinsurance and DaVinci ceded $37.7 million to Tim Re III under a fully-collateralized reinsurance contract. In conjunction with the formation and launch of Tim Re III, $44.8 million of non-voting Class B shares were sold to external investors. Additionally, $10.3 million of the non-voting
Class B shares were acquired by the Company, representing an 18.6% ownership interest in Tim Re III. The Class B shareholders participate in substantially all of the profits or losses of Tim Re III while the Class B shares remain outstanding. The holders of Class B shares indemnify Tim Re III against losses relating to insurance risk and therefore these shares have been accounted for as prospective reinsurance under FASB ASC Topic Financial Services - Insurance. In addition, another third party investor supplied $5.2 million of capital through a reinsurance participation with Renaissance Reinsurance and DaVinci, alongside Tim Re III. Inclusive of the reinsurance participation, the Company has a 17.1% participation in the original risks assumed by Renaissance Reinsurance and DaVinci related to Tim Re III. Both Tim Re III and reinsurance participation are managed by RUM in return for a potential underwriting profit commission. Tim Re III is considered a VIE and the Company is considered the primary beneficiary. As a result, Tim Re III is consolidated by the Company and all significant inter-company transactions have been eliminated.
See "Note 23. Subsequent Events" for additional information related to the Company's formation and launch of a managed joint venture, Upsilon Reinsurance II Ltd. ("Upsilon Re II"), effective January 1, 2013, and additional transactions related to Upsilon Re during February 2013.
NOTE 12. SHAREHOLDERS’ EQUITY
The aggregate authorized capital of the Company is 325 million shares consisting of 225 million common shares and 100 million preference shares. The following table is a summary of changes in common shares issued and outstanding: |
| | | | | | | | | | |
| | | | | | | | |
| | Year ended December 31, | 2012 | | 2011 | | 2010 | |
| | (thousands of shares) | | | | | | |
| | Issued and outstanding shares – January 1 | 51,543 |
| | 54,110 |
| | 61,745 |
| |
| | Shares repurchased | (6,399 | ) | | (2,889 | ) | | (8,198 | ) | |
| | Exercise of options and issuance of restricted stock awards | 398 |
| | 322 |
| | 563 |
| |
| | Issued and outstanding shares – December 31 | 45,542 |
| | 51,543 |
| | 54,110 |
| |
| | | | | | | | |
The Board of Directors of RenaissanceRe declared, and RenaissanceRe paid, a dividend of $0.27 per common share to shareholders of record on March 15, June 15, September 14 and December 14, 2012, respectively. Dividends declared and paid on common shares amounted to $1.08, $1.04 and $1.00 per common share for the years ended December 31, 2012, 2011 and 2010, respectively, or $53.4 million, $53.5 million and $55.9 million, respectively, on all common shares outstanding.
The Company's share repurchase program may be effected from time to time, depending on market conditions and other factors, through open market purchases and privately negotiated transactions. Unless terminated earlier by resolution of the Company's Board of Directors, the program will expire when the Company has repurchased the full value of the shares authorized. The Company's decision to repurchase common shares will depend on, among other matters, the market price of the common shares and the capital requirements of the Company. During the year ended December 31, 2012, the Company repurchased 6.4 million shares in open market transactions and a privately negotiated transaction, at an aggregate cost of $494.4 million, and at an average share price of $77.26. On November 13, 2012, the Company approved an increase in its authorized share repurchase program to an aggregate amount of $500.0 million. At December 31, 2012, $286.0 million remained available for repurchase under the Board authorized share repurchase program. See "Note 23. Subsequent Events" for additional information related to share repurchases subsequent to December 31, 2012 and an increase in the Company's authorized share repurchase program.
In December 2006, the Company raised $300.0 million through the issuance of 12 million Series D Preference Shares at $25 per share and in March 2004, the Company raised $250.0 million through the issuance of 10 million Series C Preference Shares at $25 per share. The Series D and Series C Preference Shares may be redeemed at $25 per share at the Company's option on or after December 1, 2011 and March 23, 2009, respectively. Dividends on the Series D and Series C Preference Shares are cumulative from the date of original issuance and are payable quarterly in arrears at 6.60% and 6.08%, respectively, when, if, and as declared by the Board of Directors. The preference shares have no stated maturity and are not convertible into any other securities of the Company. Generally, the preference shares have no voting rights. Whenever dividends payable on the preference shares are in arrears (whether or not
such dividends have been earned or declared) in an amount equivalent to dividends for six full dividend periods (whether or not consecutive), the holders of the preference shares, voting as a single class regardless of class or series, will have the right to elect two directors to the Board of Directors of the Company. On November 27, 2012, the Company announced a mandatory partial redemption of 6.0 million of its outstanding Series D Preference Shares at a redemption price of $25.00 per Series D Preference Share. The partial redemption was allocated by random lottery in accordance with the Depository Trust Company's rules and procedures and on December 27, 2012 the Company redeemed the 6.0 million Series D Preference Shares called for redemption for $150.0 million plus accrued and unpaid dividends thereon. Following this transaction, 6.0 million Series D Preference Shares remain outstanding.
During the year ended December 31, 2012, the Company declared and paid $34.9 million in preference share dividends (2011 – $35.0 million, 2010 – $42.1 million).
NOTE 13. EARNINGS PER SHARE
The following table sets forth the computation of basic and diluted earnings per common share: |
| | | | | | | | | | | | | |
| | | | | | | | |
| | Year ended December 31, | 2012 | | 2011 | | 2010 | |
| | (thousands of shares) | | | | | | |
| | Numerator: | | | | | | |
| | Net income (loss) available (attributable) to RenaissanceRe common shareholders | $ | 566,014 |
| | $ | (92,235 | ) | | $ | 702,613 |
| |
| | Amount allocated to participating common shareholders (1) | (8,973 | ) | | (990 | ) | | (17,765 | ) | |
| | Net income (loss) allocated to RenaissanceRe common shareholders | $ | 557,041 |
| | $ | (93,225 | ) | | $ | 684,848 |
| |
| | Denominator: | | | | | | |
| | Denominator for basic income (loss) per RenaissanceRe common share - weighted average common shares | 48,873 |
| | 50,747 |
| | 55,145 |
| |
| | Per common share equivalents of employee stock options and restricted shares | 730 |
| | — |
| | 496 |
| |
| | Denominator for diluted income (loss) per RenaissanceRe common share - adjusted weighted average common shares and assumed conversions | 49,603 |
| | 50,747 |
| | 55,641 |
| |
| | Basic income (loss) per RenaissanceRe common share | $ | 11.40 |
| | $ | (1.84 | ) | | $ | 12.42 |
| |
| | Diluted income (loss) per RenaissanceRe common share | $ | 11.23 |
| | $ | (1.84 | ) | | $ | 12.31 |
| |
| | | | | | |
|
| |
| |
| (1) | Represents earnings attributable to holders of unvested restricted shares issued under the Company's 2001 Stock Incentive Plan and Non-Employee Director Stock Incentive Plan. |
NOTE 14. RELATED PARTY TRANSACTIONS AND MAJOR CUSTOMERS
During 2010, the Company issued a $5.0 million promissory note to THIG. Interest is due quarterly and is accrued on the unpaid principal balance at LIBOR plus 6.0%. THIG can voluntarily prepay the loan in whole, or in part, plus accrued interest, without premium or penalty at any time. Included in other assets on the Company's consolidated balance sheet at December 31, 2012 is the promissory note principal balance of $4.0 million (2011 - $4.5 million). Interest income earned on the promissory note of $0.3 million (2011 - $0.3 million) is included in other income on the Company's consolidated statements of operations.
The Company has entered into reinsurance agreements with certain subsidiaries and affiliates of Tower Hill and has also entered into reinsurance agreements with respect to business produced by the Tower Hill Companies. For the year ended December 31, 2012, the Company recorded $41.1 million (2011 - $29.8 million, 2010 - $29.7 million) of gross premium written assumed from Tower Hill and its subsidiaries and affiliates. Gross premiums earned totaled $36.1 million (2011 - $28.9 million, 2010 - $38.4 million) and expenses incurred were $3.9 million (2011 - $3.3 million, 2010 - $4.1 million) for the year ended December 31, 2012. The Company had a net related outstanding receivable balance of $8.6 million as of December 31, 2012 (2011 – $12.2 million). During 2012, the Company assumed net claims and claims expenses of $4.0 million (2011 - recovered $8.0 million, 2010 - assumed $15.5 million) and, as of
December 31, 2012, had a net reserve for claims and claim expenses of $15.3 million (2011 - $11.6 million). In addition, the Company received distributions of $9.5 million from THIG during 2012 (2011 - $9.5 million).
The Company has invested $8.2 million in Angus Partners LLC ("Angus"), representing a 38.8% equity interest, which is accounted for under the equity method of accounting. Angus primarily provides commodity related risk management products to third party customers. The Company had an outstanding net asset position of $1.6 million at December 31, 2012 (2011 - net asset position of $3.8 million) related to certain derivative trades with Angus. For the year ended December 31, 2012, the Company generated other income of $7.9 million (2011 - $3.4 million, 2010 - $8.3 million) associated with Angus related transactions.
During 2012, the Company received distributions from Top Layer Re of $Nil (2011 – $Nil, 2010 – $12.9 million), and a management fee of $4.1 million (2011 – $3.7 million, 2010 – $3.3 million). The management fee reimburses the Company for services it provides to Top Layer Re. In addition, during 2012, the Company contributed additional paid in capital of $Nil to Top Layer Re (2011 - $38.5 million).
During 2012, the Company received 84.6% of its Reinsurance segment gross premiums written (2011 – 90.7%, 2010 – 88.2%) from three brokers. Subsidiaries and affiliates of AON Benfield, Marsh Inc., and the Willis Group accounted for approximately 51.5%, 21.4% and 11.7%, respectively, of gross premiums written for the Reinsurance segment in 2012 (2011 – 56.1%, 21.9% and 12.7%, respectively, 2010 – 53.5%, 23.1% and 11.6%, respectively).
NOTE 15. TAXATION
Under current Bermuda law, the Company and its Bermuda subsidiaries are not subject to any income or capital gains taxes. In the event that such taxes are imposed, the Company and its Bermuda subsidiaries would be exempted from any such tax until March 2035 pursuant to the Bermuda Exempted Undertakings Tax Protection Act 1966, and Amended Acts of 1987 and 2011, respectively.
RenRe North America Holdings Inc. ("RenRe North America") and its subsidiaries are subject to income taxes imposed by U.S. federal and state authorities and file a consolidated U.S. federal income tax return. Should the U.S. subsidiaries pay a dividend to the Company, withholding taxes would apply to the extent of current year or accumulated earnings and profits. The Company also has operations in Ireland and the U.K. which are subject to income taxes imposed by the respective jurisdictions in which they operate.
The Company is not subject to income taxation other than as stated above. There can be no assurance that there will not be changes in applicable laws, regulations or treaties, which might require the Company to change the way it operates or become subject to taxation.
The following is a summary of the Company's income (loss) from continuing operations before taxes allocated between domestic and foreign operations: |
| | | | | | | | | | | | | |
| | | | | | | | |
| | Year ended December 31, | 2012 | | 2011 | | 2010 | |
| | Domestic | | | | | | |
| | Bermuda | $ | 795,361 |
| | $ | 18,259 |
| | $ | 808,715 |
| |
| | Foreign | | | | | | |
| | United Kingdom | (15,404 | ) | | (22,895 | ) | | (7,929 | ) | |
| | U.S. | (35,197 | ) | | (70,157 | ) | | (10,938 | ) | |
| | Ireland | 3,318 |
| | (24 | ) | | 2,510 |
| |
| | Other | 13 |
| | — |
| | — |
| |
| | Income (loss) from continuing operations before taxes | $ | 748,091 |
| | $ | (74,817 | ) | | $ | 792,358 |
| |
| | | | | | | | |
Income tax (expense) benefit is comprised as follows: |
| | | | | | | | | | | | | |
| | | | | | | | |
| | Year ended December 31, 2012 | Current | | Deferred | | Total | |
| | Total income tax (expense) benefit | $ | (1,693 | ) | | $ | 264 |
| | $ | (1,429 | ) | |
| | Year ended December 31, 2011 | | | | | | |
| | Total income tax benefit (expense) | $ | 13,467 |
| | $ | (13,152 | ) | | $ | 315 |
| |
| | Year ended December 31, 2010 | | | | | | |
| | Total income tax (expense) benefit | $ | (1,384 | ) | | $ | 7,508 |
| | $ | 6,124 |
| |
| | | | | | | | |
The Company's expected income tax provision computed on pre-tax income at the weighted average tax rate has been calculated as the sum of the pre-tax income in each jurisdiction multiplied by that jurisdiction's applicable statutory tax rate. Statutory tax rates of 0.0%, 35.0%, 12.5%, 23.0% and 17.0% have been used for Bermuda, the U.S., Ireland, the U.K. and Other, respectively.
The Company's effective income tax rate, which it calculates as income tax expense divided by net income before taxes, may fluctuate significantly from period to period depending on the geographic distribution of pre-tax net income in any given period between different jurisdictions with comparatively higher tax rates and those with comparatively lower tax rates. The geographic distribution of pre-tax net income can vary significantly between periods due to, but not limited to, the following factors: the business mix of net premiums written and earned; the geographic location, the size and nature of net claims and claim expenses incurred; the amount and geographic location of operating expenses, net investment income, net realized and unrealized gains (losses) on investments; outstanding debt and related interest expense; and the amount of specific adjustments to determine the income tax basis in each of the Company's operating jurisdictions. In addition, a significant portion of the Company's gross and net premiums are currently written and earned in Bermuda, a non-taxable jurisdiction, including the majority of the Company's catastrophe business, which can result in significant volatility to its pre-tax net income (loss) in any given period.
A reconciliation of the difference between the provision for income taxes and the expected tax provision at the weighted average tax rate is as follows: |
| | | | | | | | | | | | | |
| | | | | | | | |
| | Year ended December 31, | 2012 | | 2011 | | 2010 | |
| | Expected income tax benefit | $ | 15,445 |
| | $ | 30,589 |
| | $ | 5,647 |
| |
| | Change in valuation allowance | (13,190 | ) | | (27,601 | ) | | (1,175 | ) | |
| | Other | (3,684 | ) | | (2,673 | ) | | 1,652 |
| |
| | Income tax (expense) benefit | $ | (1,429 | ) | | $ | 315 |
| | $ | 6,124 |
| |
| | | | | | | | |
The tax effects of temporary differences that give rise to significant portions of the deferred tax assets and deferred tax liabilities are presented below: |
| | | | | | | | | |
| | | | | | |
| | At December 31, | 2012 | | 2011 | |
| | Deferred tax assets | | | | |
| | Tax loss and credit carryforwards | $ | 27,658 |
| | $ | 15,692 |
| |
| | Accrued expenses | 2,716 |
| | 2,983 |
| |
| | Investments | 3,720 |
| | 7,744 |
| |
| | Deferred interest expense | 8,448 |
| | 4,011 |
| |
| | Deferred underwriting results | 4,366 |
| | 3,538 |
| |
| | Amortization and depreciation | 1,490 |
| | 1,256 |
| |
| | | 48,398 |
| | 35,224 |
| |
| | Deferred tax liabilities | | | | |
| | Amortization and depreciation | (369 | ) | | (649 | ) | |
| | | (369 | ) | | (649 | ) | |
| | Net deferred tax asset before valuation allowance | 48,029 |
| | 34,575 |
| |
| | Valuation allowance | (48,173 | ) | | (34,983 | ) | |
| | Net deferred tax liability | $ | (144 | ) | | $ | (408 | ) | |
| | | | | | |
During 2012, the Company recorded a net increase to the valuation allowance of $13.2 million (2011 – $31.4 million, 2010 – $1.2 million). The Company's net deferred tax asset primarily relates to net operating loss carryforwards and GAAP versus tax basis accounting differences relating to interest expense, underwriting results, accrued expenses and investments. The Company's U.S. operations generated a cumulative GAAP taxable loss for the three year periods ended December 31, 2012 and 2011. Accordingly, the Company believes that it is more likely than not that the U.S. net deferred tax asset will not be realized and as a result has provided a full valuation allowance against its U.S. net deferred tax asset. In addition, a valuation allowance has been provided against deferred tax assets in Ireland and the U.K. These deferred tax assets relate primarily to net operating loss carryforwards and deferred underwriting results.
In the U.S., the Company has net operating loss carryforwards of $54.5 million. Under applicable law, the U.S. net operating loss carryforwards will begin to expire in 2031. In Ireland, the Company has net operating loss carryforwards of $12.0 million. Under applicable law, the Irish net operating loss can be carried forward for an indefinite period. In the U.K., the Company has net operating loss carryforwards of $19.1 million. Under applicable law, the U.K. net operating loss can be carried forward for an indefinite period.
The Company had a net refund for U.S. federal, Irish and U.K. income taxes of $13.2 million for the year ended 2012 (2011 – net payments of $11.0 million, 2010 – net payments of $3.5 million).
The Company has unrecognized tax benefits of $Nil as of December 31, 2012 (2011 – $3.3 million). Interest and penalties related to unrecognized tax benefits, would be recognized in income tax expense. At December 31, 2012, interest and penalties accrued on unrecognized tax benefits was $Nil. Income tax returns filed for tax years 2009 through 2011, 2008 through 2011 and 2011, are open for examination by the Internal Revenue Service, Irish tax authorities and U.K. tax authorities, respectively. The Company does not expect the resolution of these open years to have a significant impact on its consolidated statements of operations and financial condition.
NOTE 16. SEGMENT REPORTING
The Company currently has two reportable segments: Reinsurance and Lloyd's.
As of December 31, 2012, the Company undertook a review of its reportable segments and concluded that its former Insurance segment no longer met the quantitative thresholds defined in FASB ASC Topic Segment Reporting. These operations are not actively involved in pursuing business opportunities and are in run-off; therefore the Company determined it no longer requires, nor warrant, separate disclosure as a reportable segment. As such, the results of operations of the former Insurance segment have been included in the Other category, and all prior periods presented herein have been reclassified to conform with the current year presentation.
The Company's Reinsurance operations are comprised of: 1) property catastrophe reinsurance, principally written through Renaissance Reinsurance and DaVinci; 2) specialty reinsurance, principally written through Renaissance Reinsurance, DaVinci and Glencoe; and 3) certain property catastrophe and specialty joint ventures, as described herein. The Reinsurance segment is managed by the Company's President and Global Chief Underwriting Officer, who leads a team of underwriters, risk modelers and other industry professionals, who have access to the Company's proprietary risk management, underwriting and modeling resources and tools.
The Company's Lloyd's segment includes reinsurance and insurance business written through Syndicate 1458. Syndicate 1458 started writing certain lines of insurance and reinsurance business incepting on or after June 1, 2009. The syndicate was established to enhance the Company's underwriting platform by providing access to Lloyd's extensive distribution network and worldwide licenses and is managed by the Chief Underwriting Officer Lloyd's. RenaissanceRe Corporate Capital (UK) Limited ("RenaissanceRe CCL"), an indirect wholly owned subsidiary of RenaissanceRe, is the sole corporate member of Syndicate 1458.
The financial results of the Company's strategic investments, weather and energy risk management operations, former Insurance segment and noncontrolling interests are included in the Other category of the Company's segment results. Also included in the Other category of the Company's segment results are the Company's investments in other ventures, investments unit, corporate expenses and capital servicing costs.
The Company does not manage its assets by segment; accordingly, net investment income and total assets are not allocated to the segments.
A summary of the significant components of the Company's revenues and expenses is as follows: |
| | | | | | | | | | | | | | | | | | | | | |
| | | | | | | | | | | | |
| | Year ended December 31, 2012 | Reinsurance | | Lloyd's | | Other | | Eliminations (1) | | Total | |
| | Gross premiums written | $ | 1,392,094 |
| | $ | 159,987 |
| | $ | — |
| | $ | (490 | ) | | $ | 1,551,591 |
| |
| | Net premiums written | $ | 967,587 |
| | $ | 135,131 |
| | $ | (61 | ) | | | | $ | 1,102,657 |
| |
| | Net premiums earned | $ | 946,423 |
| | $ | 122,968 |
| | $ | (36 | ) | | | | $ | 1,069,355 |
| |
| | Net claims and claim expenses incurred | 242,022 |
| | 80,242 |
| | 2,947 |
| | | | 325,211 |
| |
| | Acquisition expenses | 90,491 |
| | 22,864 |
| | 187 |
| | | | 113,542 |
| |
| | Operational expenses | 132,935 |
| | 45,680 |
| | 686 |
| | | | 179,301 |
| |
| | Underwriting income (loss) | $ | 480,975 |
| | $ | (25,818 | ) | | $ | (3,856 | ) | | | | 451,301 |
| |
| | Net investment income | | | | | 167,375 |
| | | | 167,375 |
| |
| | Net foreign exchange gains | | | | | 5,223 |
| | | | 5,223 |
| |
| | Equity in earnings of other ventures | | | | | 23,238 |
| | | | 23,238 |
| |
| | Other loss | | | | | (22,905 | ) | | | | (22,905 | ) | |
| | Net realized and unrealized gains on investments | | | | | 163,991 |
| | | | 163,991 |
| |
| | Net other-than-temporary impairments | | | | | (343 | ) | | | | (343 | ) | |
| | Corporate expenses | | | | | (16,692 | ) | | | | (16,692 | ) | |
| | Interest expense | | | | | (23,097 | ) | | | | (23,097 | ) | |
| | Income from continuing operations before taxes | | | | | | | | | 748,091 |
| |
| | Income tax expense | | | | | (1,429 | ) | | | | (1,429 | ) | |
| | Income from discontinued operations | | | | | 2,287 |
| | | | 2,287 |
| |
| | Net income attributable to noncontrolling interests | | | | | (148,040 | ) | | | | (148,040 | ) | |
| | Dividends on preference shares | | | | | (34,895 | ) | | | | (34,895 | ) | |
| | Net income available to RenaissanceRe common shareholders | | | | | | | | | $ | 566,014 |
| |
| | | | | | | | | | | | |
| | Net claims and claim expenses incurred – current accident year | $ | 386,736 |
| | $ | 96,444 |
| | $ | — |
| | | | $ | 483,180 |
| |
| | Net claims and claim expenses incurred – prior accident years | (144,714 | ) | | (16,202 | ) | | 2,947 |
| | | | (157,969 | ) | |
| | Net claims and claim expenses incurred – total | $ | 242,022 |
| | $ | 80,242 |
| | $ | 2,947 |
| | | | $ | 325,211 |
| |
| | | | | | | | | | | | |
| | Net claims and claim expense ratio – current accident year | 40.9 | % | | 78.4 | % | | — | % | | | | 45.2 | % | |
| | Net claims and claim expense ratio – prior accident years | (15.3 | )% | | (13.1 | )% | | (8,186.1 | )% | | | | (14.8 | )% | |
| | Net claims and claim expense ratio – calendar year | 25.6 | % | | 65.3 | % | | (8,186.1 | )% | | | | 30.4 | % | |
| | Underwriting expense ratio | 23.6 | % | | 55.7 | % | | (2,425.0 | )% | | | | 27.4 | % | |
| | Combined ratio | 49.2 | % | | 121.0 | % | | (10,611.1 | )% | | | | 57.8 | % | |
| | | | | | | | | | | | |
| |
| (1) | Represents $0.5 million of gross premiums ceded from the Reinsurance segment to the Lloyd's segment. |
|
| | | | | | | | | | | | | | | | | | | | | |
| | | | | | | | | | | | |
| | Year ended December 31, 2011 | Reinsurance | | Lloyd's | | Other | | Eliminations (1) | | Total | |
| | Gross premiums written | $ | 1,323,187 |
| | $ | 111,584 |
| | $ | 282 |
| | $ | (77 | ) | | $ | 1,434,976 |
| |
| | Net premiums written | $ | 913,499 |
| | $ | 98,617 |
| | $ | 657 |
| | | | $ | 1,012,773 |
| |
| | Net premiums earned | $ | 873,088 |
| | $ | 76,386 |
| | $ | 1,575 |
| | | | $ | 951,049 |
| |
| | Net claims and claim expenses incurred | 783,704 |
| | 73,259 |
| | 4,216 |
| | | | 861,179 |
| |
| | Acquisition expenses | 82,978 |
| | 14,031 |
| | 367 |
| | | | 97,376 |
| |
| | Operational expenses | 131,251 |
| | 36,732 |
| | 1,683 |
| | | | 169,666 |
| |
| | Underwriting loss | $ | (124,845 | ) | | $ | (47,636 | ) | | $ | (4,691 | ) | | | | (177,172 | ) | |
| | Net investment income | | | | | 118,000 |
| | | | 118,000 |
| |
| | Net foreign exchange losses | | | | | (6,911 | ) | | | | (6,911 | ) | |
| | Equity in losses of other ventures | | | | | (36,533 | ) | | | | (36,533 | ) | |
| | Other loss | | | | | (685 | ) | | | | (685 | ) | |
| | Net realized and unrealized gains on investments | | | | | 70,668 |
| | | | 70,668 |
| |
| | Net other-than-temporary impairments | | | | | (552 | ) | | | | (552 | ) | |
| | Corporate expenses | | | | | (18,264 | ) | | | | (18,264 | ) | |
| | Interest expense | | | | | (23,368 | ) | | | | (23,368 | ) | |
| | Loss from continuing operations before taxes | | | | | | | | | (74,817 | ) | |
| | Income tax benefit | | | | | 315 |
| | | | 315 |
| |
| | Loss from discontinued operations | | | | | (15,890 | ) | | | | (15,890 | ) | |
| | Net loss attributable to noncontrolling interests | | | | | 33,157 |
| | | | 33,157 |
| |
| | Dividends on preference shares | | | | | (35,000 | ) | | | | (35,000 | ) | |
| | Net loss attributable to RenaissanceRe common shareholders | | | | | | | | | $ | (92,235 | ) | |
| | | | | | | | | | | | |
| | Net claims and claim expenses incurred – current accident year | $ | 920,602 |
| | $ | 72,781 |
| | $ | (215 | ) | | | | $ | 993,168 |
| |
| | Net claims and claim expenses incurred – prior accident years | (136,898 | ) | | 478 |
| | 4,431 |
| | | | (131,989 | ) | |
| | Net claims and claim expenses incurred – total | $ | 783,704 |
| | $ | 73,259 |
| | $ | 4,216 |
| | | | $ | 861,179 |
| |
| | | | | | | | | | | | |
| | Net claims and claim expense ratio – current accident year | 105.4 | % | | 95.3 | % | | (13.7 | )% | | | | 104.4 | % | |
| | Net claims and claim expense ratio – prior accident years | (15.6 | )% | | 0.6 | % | | 281.4 | % | | | | (13.8 | )% | |
| | Net claims and claim expense ratio – calendar year | 89.8 | % | | 95.9 | % | | 267.7 | % | | | | 90.6 | % | |
| | Underwriting expense ratio | 24.5 | % | | 66.5 | % | | 130.1 | % | | | | 28.0 | % | |
| | Combined ratio | 114.3 | % | | 162.4 | % | | 397.8 | % | | | | 118.6 | % | |
| | | | | | | | | | | | |
| |
| (1) | Represents $0.1 million of gross premiums ceded from the Reinsurance segment to the Lloyd's segment. |
|
| | | | | | | | | | | | | | | | | | | | | |
| | | | | | | | | | | | |
| | Year ended December 31, 2010 | Reinsurance | | Lloyd's | | Other | | Eliminations
(1) | | Total | |
| | Gross premiums written | $ | 1,123,619 |
| | $ | 66,209 |
| | $ | 2,585 |
| | $ | (27,118 | ) | | $ | 1,165,295 |
| |
| | Net premiums written | $ | 809,719 |
| | $ | 61,189 |
| | $ | (21,943 | ) | | | | $ | 848,965 |
| |
| | Net premiums earned | $ | 838,790 |
| | $ | 50,204 |
| | $ | (24,073 | ) | | | | $ | 864,921 |
| |
| | Net claims and claim expenses incurred | 113,804 |
| | 25,676 |
| | (10,135 | ) | | | | 129,345 |
| |
| | Acquisition expenses | 77,954 |
| | 10,784 |
| | 6,223 |
| | | | 94,961 |
| |
| | Operational expenses | 129,990 |
| | 24,837 |
| | 11,215 |
| | | | 166,042 |
| |
| | Underwriting income (loss) | $ | 517,042 |
| | $ | (11,093 | ) | | $ | (31,376 | ) | | | | 474,573 |
| |
| | Net investment income | | | | | 203,955 |
| | | | 203,955 |
| |
| | Net foreign exchange losses | | | | | (17,126 | ) | | | | (17,126 | ) | |
| | Equity in losses of other ventures | | | | | (11,814 | ) | | | | (11,814 | ) | |
| | Other income | | | | | 41,120 |
| | | | 41,120 |
| |
| | Net realized and unrealized gains on investments | | | | | 144,444 |
| | | | 144,444 |
| |
| | Net other-than-temporary impairments | | | | | (829 | ) | | | | (829 | ) | |
| | Corporate expenses | | | | | (20,136 | ) | | | | (20,136 | ) | |
| | Interest expense | | | | | (21,829 | ) | | | | (21,829 | ) | |
| | Income from continuing operations before taxes | | | | | | | | | 792,358 |
| |
| | Income tax benefit | | | | | 6,124 |
| | | | 6,124 |
| |
| | Income from discontinued operations | | | | | 62,670 |
| | | | 62,670 |
| |
| | Income attributable to redeemable noncontrolling interest – DaVinciRe | | | | | (116,421 | ) | | | | (116,421 | ) | |
| | Dividends on preference shares | | | | | (42,118 | ) | | | | (42,118 | ) | |
| | Net income available to RenaissanceRe common shareholders | | | | | | | | | $ | 702,613 |
| |
| | | | | | | | | | | | |
| | Net claims and claim expenses incurred – current accident year | $ | 399,823 |
| | $ | 25,873 |
| | $ | 5,780 |
| | | | $ | 431,476 |
| |
| | Net claims and claim expenses incurred – prior accident years | (286,019 | ) | | (197 | ) | | (15,915 | ) | | | | (302,131 | ) | |
| | Net claims and claim expenses incurred – total | $ | 113,804 |
| | $ | 25,676 |
| | $ | (10,135 | ) | | | | $ | 129,345 |
| |
| | | | | | | | | | | | |
| | Net claims and claim expense ratio – current accident year | 47.7 | % | | 51.5 | % | | (24.0 | )% | | | | 49.9 | % | |
| | Net claims and claim expense ratio – prior accident years | (34.1 | )% | | (0.4 | )% | | 66.1 | % | | | | (34.9 | )% | |
| | Net claims and claim expense ratio – calendar year | 13.6 | % | | 51.1 | % | | 42.1 | % | | | | 15.0 | % | |
| | Underwriting expense ratio | 24.8 | % | | 71.0 | % | | (72.4 | )% | | | | 30.1 | % | |
| | Combined ratio | 38.4 | % | | 122.1 | % | | (30.3 | )% | | | | 45.1 | % | |
| | | | | | | | | | | | |
| |
| (1) | Represents $9.5 million, $17.4 million and $0.2 million of gross premiums ceded from the Other category to the Reinsurance segment, from the Other category to the Lloyd's segment and from the Reinsurance segment to the Lloyd's segment, respectively. |
The following is a summary of the Company's gross premiums written allocated to the territory of coverage exposure: |
| | | | | | | | | | | | | |
| | | | | | | | |
| | Year ended December 31, | 2012 | | 2011 | | 2010 | |
| | Catastrophe | | | | | | |
| | U.S. and Caribbean | $ | 857,740 |
| | $ | 786,721 |
| | $ | 720,250 |
| |
| | Worldwide (excluding U.S.) (1) | 139,265 |
| | 164,112 |
| | 113,270 |
| |
| | Worldwide | 81,595 |
| | 124,797 |
| | 65,500 |
| |
| | Japan | 43,238 |
| | 49,021 |
| | 26,188 |
| |
| | Europe | 37,113 |
| | 31,888 |
| | 59,480 |
| |
| | Australia and New Zealand | 18,578 |
| | 16,818 |
| | 6,269 |
| |
| | Other | 4,678 |
| | 3,939 |
| | 3,276 |
| |
| | Total catastrophe | 1,182,207 |
| | 1,177,296 |
| | 994,233 |
| |
| | Specialty | | | | | | |
| | Worldwide | 96,081 |
| | 91,032 |
| | 59,636 |
| |
| | U.S. and Caribbean | 69,070 |
| | 49,832 |
| | 57,461 |
| |
| | Australia and New Zealand | 28,307 |
| | 792 |
| | 8,934 |
| |
| | Europe | 16,429 |
| | 3,595 |
| | 2,786 |
| |
| | Other | — |
| | 640 |
| | 569 |
| |
| | Total specialty | 209,887 |
| | 145,891 |
| | 129,386 |
| |
| | Total Reinsurance | 1,392,094 |
| | 1,323,187 |
| | 1,123,619 |
| |
| | Lloyd's | | | | | | |
| | Worldwide | 75,132 |
| | 47,605 |
| | 16,207 |
| |
| | U.S. and Caribbean | 57,332 |
| | 48,435 |
| | 43,178 |
| |
| | Europe | 14,456 |
| | 8,044 |
| | 3,174 |
| |
| | Worldwide (excluding U.S.) (1) | 6,064 |
| | 238 |
| | 1,049 |
| |
| | Australia and New Zealand | 2,152 |
| | 2,060 |
| | 91 |
| |
| | Other | 4,851 |
| | 5,202 |
| | 2,510 |
| |
| | Total Lloyd's | 159,987 |
| | 111,584 |
| | 66,209 |
| |
| | Other category (2) | — |
| | 282 |
| | 2,585 |
| |
| | Eliminations (3) | (490 | ) | | (77 | ) | | (27,118 | ) | |
| | Total gross premiums written | $ | 1,551,591 |
| | $ | 1,434,976 |
| | $ | 1,165,295 |
| |
| | | | | | | | |
| |
| (1) | The category "Worldwide (excluding U.S.)" consists of contracts that cover more than one geographic region (other than the U.S.). The exposure in this category for gross premiums written to date is predominantly from Europe and Japan. |
| |
| (2) | The Other category consists of contracts that are primarily exposed to U.S. risks. |
| |
| (3) | Represents $0.5 million of gross premiums ceded from the Reinsurance segment to the Lloyd's segment for the year ended December 31, 2012 (2011 - $0.1 million of gross premiums ceded from the Reinsurance segment to the Lloyd's segment, 2010 - $9.5 million, $17.4 million and $0.2 million of gross premiums ceded from the Other category to the Reinsurance segment, from the Other category to the Lloyd's segment and from the Reinsurance segment to the Lloyd's segment). |
NOTE 17. STOCK INCENTIVE COMPENSATION AND EMPLOYEE BENEFIT PLANS
2001 Stock Incentive Plan and Non-Employee Director Stock Incentive Plan
The Company has a stock incentive plan (the "2001 Stock Incentive Plan") under which employees of the Company and its subsidiaries may be granted stock options and restricted stock awards. A stock option award under the Company's 2001 Stock Incentive Plan allows for the purchase of the Company's common shares at a price that is equal to the fair market value of the Company's common shares as of the grant effective date. Options to purchase common shares are granted periodically by the Board of Directors, generally vest over four years and generally expire 10 years from the date of grant. Restricted common shares are granted periodically by the Board of Directors and generally vest ratably over a four year period. In addition, awards granted under the Company's prior 1993 stock incentive plan remain outstanding, with terms similar to the 2001 Stock Incentive Plan. The Company has also established a Non-Employee Director Stock Incentive Plan to issue stock options and shares of restricted stock to the Company's non-employee directors.
The Company's 2001 Stock Incentive Plan also allows for the issuance of share-based awards, the issuance of restricted common shares and shares tendered in connection with option exercises. For purposes of determining the number of shares reserved for issuance under the 2001 Stock Plan, shares tendered to or withheld by the Company in connection with certain option exercises will again be available for issuance.
Premium Option Plan
In August 2004, the Company's shareholders approved the RenaissanceRe Holdings Ltd. 2004 Stock Option Incentive Plan (the "Premium Option Plan") under which 6.0 million common shares were reserved for issuance upon the exercise of options granted under the Premium Option Plan. On August 15, 2007, the Company terminated the Premium Option Plan, such that no further option grants will be made thereunder. However, options outstanding at the time of the termination will, unless otherwise subsequently amended pursuant to the terms of the Premium Option Plan, remain outstanding and unmodified until they expire, subject to the terms of the Premium Option Plan and any applicable award agreement. The Premium Option Plan provides for, among other things, mandatory premium pricing such that options can generally only be issued thereunder with a strike price at a minimum of 150% of the fair market value on the date of grant, minimum five year cliff vesting (subject to waiver by the compensation committee of the Board of Directors), and no discretionary repricing. The Premium Option Plan includes a dividend protection feature that reduces the strike price for extraordinary dividends and a change in control feature that reduces the strike price based on a pre-established formula in the event of a change in control. Other terms are substantially similar to the 2001 Stock Incentive Plan.
2010 Cash Settled Restricted Stock Unit Plan
In 2010, the Company instituted a restricted stock unit plan (the "2010 Cash Settled Restricted Stock Unit Plan") allowing for the issuance of equity awards in the form of restricted stock units which will, subject to vesting requirements consistent with those utilized by the Company in respect of restricted shares, be settled in cash. Restricted stock units are liability awards with fair value measurement based on the market price of RenaissanceRe common stock at the end of each reporting period. Restricted share units are granted periodically by the Board of Directors and generally vest ratably over a four year period. During 2010, there were 900,000 restricted stock units reserved under the 2010 Restricted Stock Unit Plan.
2010 Performance-Based Equity Incentive Plan
In May 2010, the Company's shareholders approved the 2010 Performance-Based Equity Incentive Plan ("2010 Performance Plan") under which 750,000 shares have been reserved (the "Performance Shares"). The Compensation Committee determined that, beginning in 2010 with the Company's annual target-level incentive award grant cycle, 25% of the annual equity incentive award grants to each member of the Company's Executive Committee, which includes the Company's Named Executive Officers excluding the Chief Executive Officer ("CEO"), will be subject to vesting conditions based on both continued service and the attainment of pre-established performance goals. If performance goals are achieved, the Performance Shares will vest up to a maximum of 250% of target. The 2010 grants vest over a period of three years and
are based on annual performance periods. All subsequent grants cliff vest at the end of a three year vesting period. The Performance Shares have a market condition which is the Company's total shareholder return relative to its peer group. Total shareholder return is based on the average closing share price over the 20 trading days preceding and including the start and end of the performance period.
The CEO received 100% of a special retention award in the form of Performance Shares in 2010. If performance goals are achieved, the Performance Shares for the CEO will vest up to a maximum of 175% of target. This grant vests over a period of four years and is based on annual performance periods.
Valuation Assumptions
Performance Shares
The fair value of the Performance Shares is measured on the date of grant using a Monte Carlo simulation model which requires certain of the same inputs underlying the Black-Scholes methodology, that being: share price; expected volatility; expected term; expected dividend yield; and risk-free interest rates. The following are the weighted average-assumptions used to estimate the fair value for all Performance Shares issued in each respective year. |
| | | | | |
| | | | | | |
| | | Performance Shares | |
| | Year ended December 31, | 2012 | | 2011 | |
| | Expected volatility (1) | 19.8% - 24.4% | | 35% | |
| | Expected term (in years) | n/a | | n/a | |
| | Expected dividend yield | n/a | | n/a | |
| | Risk-free interest rate (1) | 0.16% - 0.64% | | 0.16% - 2.11% | |
| | | | | | |
| |
| (1) | The expected volatility and risk-free interest rate applied are specific to each tranche of Performance Shares. |
Expected volatility: The expected volatility is estimated by the Company based on the Company's historical stock volatility.
Expected term: The expected term is not applicable as the length of the performance periods are fixed and not subject to future employee behavior.
Expected dividend yield: The expected dividend yield is not applicable to Performance Shares as dividends are paid at the end of the vesting period and do not affect the value of the Performance Shares.
Risk-free interest rate: The risk free rate is estimated based on the yield on a U.S. treasury zero-coupon issue with a remaining term equal to the vesting period of the performance shares.
The total cost of the Performance Shares is determined on the grant date based on the fair value calculated by the Monte Carlo simulation model. The Company recognizes cost equal to fair value per Performance Share multiplied by the target number of Performance Shares on the grant date. The cost is then recognized over the requisite service period net of estimated service-based forfeitures. When estimating forfeitures, the Company considers its historical forfeitures as well as expectations about employee behavior. The Company currently uses an 0% forfeiture rate for performance shares (2011 - 0%).
Restricted Shares
The fair value of restricted shares is determined based on the market value of the Company's shares on the grant date. The estimated fair value of restricted shares, net of estimated forfeitures, is amortized as an expense over the requisite service period. When estimating forfeitures, the Company considers its historical forfeitures as well as expectations about employee behavior. The Company currently uses an 8% forfeiture rate for restricted shares (2011 - 8%).
CSRSUs
CSRSUs are revalued at the end of each quarterly reporting period based on the then value of the Company's stock price. The total cost is adjusted each quarter for unvested CSRSUs to reflect the current share price, and this total cost is amortized as an expense over the requisite service period, net of estimated forfeitures. When estimating forfeitures, the Company considers its historical forfeitures as well as expectations about employee behavior. The Company currently uses an 8% forfeiture rate for its CSRSUs (2011 - 8%).
Summary of Stock Compensation Activity
The following is a summary of activity under the Company's existing stock compensation plans.
2001 Stock Incentive and Non-Employee Director Stock Incentive Plans |
| | | | | | | | | | | | | | | | | |
| | | | | | | | | | | | |
| | | Weighted options outstanding | | Weighted average exercise price | | Weighted average remaining contractual life | | Aggregate intrinsic value | | Range of exercise prices | |
| | Balance, December 31, 2009 | 3,572,979 |
| | $ | 46.42 |
| | 5.9 | | $ | 24,891 |
| | $12.40 – $59.66 |
| |
| | Options granted | — |
| | — |
| | | | | | — |
| |
| | Options forfeited | (35,942 | ) | | 54.11 |
| | | | | | | |
| | Options expired | (42,029 | ) | | 53.86 |
| | | | | | | |
| | Options exercised | (653,673 | ) | | 41.77 |
| | | | $ | 10,491 |
| | | |
| | Balance, December 31, 2010 | 2,841,335 |
| | $ | 47.28 |
| | 4.8 | | $ | 46,616 |
| | $33.85 – $59.66 |
| |
| | Options granted | — |
| | — |
| | | | | | — |
| |
| | Options forfeited | (40,010 | ) | | 52.68 |
| | | | | | | |
| | Options expired | (4,404 | ) | | 53.86 |
| | | | | | | |
| | Options exercised | (823,614 | ) | | 46.88 |
| | | | $ | 18,155 |
| | | |
| | Balance, December 31, 2011 | 1,973,307 |
| | $ | 47.33 |
| | 4.6 | | $ | 53,363 |
| | $37.51 - $59.66 |
| |
| | Options granted | — |
| | — |
| | | | | | — |
| |
| | Options forfeited | — |
| | — |
| | | | | | | |
| | Options expired | — |
| | — |
| | | | | | | |
| | Options exercised | (240,668 | ) | | $ | 45.30 |
| | | | $ | 7,910 |
| | | |
| | Balance, December 31, 2012 | 1,732,639 |
| | $ | 47.61 |
| | 3.7 | | $ | 58,305 |
| | $37.51 - $59.66 |
| |
| | Total options exercisable at December 31, 2012 | 1,732,639 |
| | $ | 47.61 |
| | 3.7 | | $ | 58,305 |
| | $37.51 - $59.66 |
| |
| | | | | | | | | | | | |
Premium Option Plan |
| | | | | | | | | | | | | | | | |
| | | | | | | | | | | | |
| | | Weighted options outstanding | | Weighted average exercise price | | Weighted average remaining contractual life | | Aggregate intrinsic value | | Range of exercise prices | |
| | Balance, December 31, 2009 | 1,274,000 |
| | $ | 73.96 |
| | | | $ | — |
| | $73.06 – $74.24 | |
| | Options granted | — |
| | — |
| | | | | | | |
| | Options forfeited | (82,000 | ) | | 74.24 |
| | | | | | | |
| | Options expired | — |
| | — |
| | | | | | | |
| | Options exercised | — |
| | — |
| | | | | | | |
| | Balance, December 31, 2010 | 1,192,000 |
| | $ | 73.94 |
| | | | $ | — |
| | $73.06 – $74.24 | |
| | Options granted | — |
| | — |
| | | | | | | |
| | Options forfeited | — |
| | — |
| | | | | | | |
| | Options expired | — |
| | — |
| | | | | | | |
| | Options exercised | — |
| | — |
| | | | | | | |
| | Balance, December 31, 2011 | 1,192,000 |
| | $ | 73.94 |
| | | | $ | — |
| | $73.06 - $74.24 | |
| | Options granted | — |
| | — |
| | | | | | | |
| | Options forfeited | — |
| | — |
| | | | | | | |
| | Options expired | — |
| | — |
| | | | | | | |
| | Options exercised | (350,000 | ) | | 74.24 |
| | | | $ | 1,250 |
| | | |
| | Balance, December 31, 2012 | 842,000 |
| | $ | 73.82 |
| | 2.0 | | $ | 6,265 |
| | $73.06 - $74.24 | |
| | Total options exercisable at December 31, 2012 | 842,000 |
| | $ | 73.82 |
| | 2.0 | | $ | 6,265 |
| | $73.06 - $74.24 | |
| | | | | | | | | | | | |
The Premium Option Plan was terminated, as to new issuances, at the August 2007 Board of Directors meeting and consequently, the shares available for grant under the plan are zero.
2010 Cash Settled Restricted Stock Unit Plan and 2010 Performance-Based Equity Incentive Plan |
| | | | | | | | | | | |
| | | | | | | | |
| | | Cash Settled Restricted Stock Unit Plan | | Performance Shares | |
| | | Number of shares | | Number of shares | | Weighted average grant-dated fair value | |
| | Nonvested at December 31, 2010 | 371,788 |
| | 275,813 |
| | $ | 56.76 |
| |
| | Awards granted | 215,711 |
| | 89,037 |
| | $ | 79.83 |
| |
| | Awards vested | (98,676 | ) | | (63,562 | ) | | | |
| | Awards forfeited | (65,850 | ) | | (11,421 | ) | | | |
| | Nonvested at December 31, 2011 | 422,973 |
| | 289,867 |
| | $ | 63.24 |
| |
| | Awards granted | 225,105 |
| | 144,635 |
| | $ | 70.43 |
| |
| | Awards vested | (128,401 | ) | | (70,843 | ) | | | |
| | Awards forfeited | (26,121 | ) | | (4,139 | ) | | | |
| | Nonvested at December 31, 2012 | 493,556 |
| | 359,520 |
| | $ | 67.31 |
| |
| | | | | | | | |
Restricted Stock |
| | | | | | | | | | | | | | | | | | | | | | |
| | | | | | | | | | | | | | |
| | | Employee restricted stock | | Non-employee director restricted stock | | Total restricted stock | |
| | | Number of shares | | Weighted average grant- dated fair value | | Number of shares | | Weighted average grant- dated fair value | | Number of shares | | Weighted average grant- dated fair value | |
| | Nonvested at December 31, 2009 | 1,348,794 |
| | $ | 46.64 |
| | 44,615 |
| | $ | 47.81 |
| | 1,393,409 |
| | $ | 46.68 |
| |
| | Awards granted | 284,873 |
| | 55.80 |
| | 23,327 |
| | 56.15 |
| | 308,200 |
| | 55.83 |
| |
| | Awards vested | (561,086 | ) | | 46.81 |
| | (25,134 | ) | | 49.46 |
| | (586,220 | ) | | 46.92 |
| |
| | Awards forfeited | (68,155 | ) | | 49.89 |
| | — |
| | — |
| | (68,155 | ) | | 49.89 |
| |
| | Nonvested at December 31, 2010 | 1,004,426 |
| | $ | 48.93 |
| | 42,808 |
| | $ | 51.38 |
| | 1,047,234 |
| | $ | 49.03 |
| |
| | Awards granted | 200,745 |
| | 66.21 |
| | 18,272 |
| | 66.21 |
| | 219,017 |
| | 66.21 |
| |
| | Awards vested | (362,234 | ) | | 48.74 |
| | (21,495 | ) | | 50.66 |
| | (383,729 | ) | | 48.84 |
| |
| | Awards forfeited | (78,176 | ) | | 47.71 |
| | — |
| | — |
| | (78,176 | ) | | 47.71 |
| |
| | Nonvested at December 31, 2011 | 764,761 |
| | $ | 53.68 |
| | 39,585 |
| | $ | 58.43 |
| | 804,346 |
| | $ | 53.91 |
| |
| | Awards granted | 226,827 |
| | 72.46 |
| | 16,874 |
| | 71.69 |
| | 243,701 |
| | 72.40 |
| |
| | Awards vested | (337,683 | ) | | 51.06 |
| | (20,536 | ) | | 54.62 |
| | (358,219 | ) | | 51.26 |
| |
| | Awards forfeited | (7,157 | ) | | 53.90 |
| | — |
| | — |
| | (7,157 | ) | | 53.90 |
| |
| | Nonvested at December 31, 2012 | 646,748 |
| | $ | 61.63 |
| | 35,923 |
| | $ | 66.83 |
| | 682,671 |
| | $ | 61.90 |
| |
| | | | | | | | | | | | | | |
Shares available for issuance under the Company's 2001 Stock Incentive Plan, Non-Employee Director Stock Incentive Plan, 2010 Performance Share Plan and 2010 Restricted Stock Unit Plan totaled 2.8 million at December 31, 2012. The total fair value of shares and share units vested during the year ended December 31, 2012 was $43.3 million (2011 – $36.5 million, 2010 – $32.5 million). Cash in the amount of $0.9 million was received from employees as a result of employee stock option exercises during the year ended December 31, 2012 (2011 – $0.1 million, 2010 – $1.1 million). In connection with share vestings and option exercises, there was no excess windfall tax benefit realized by the Company due to its net operating loss position in the taxable jurisdictions in which it operates. The Company issues new shares upon the exercise of an option.
The total stock compensation expense recognized in the Company's consolidated statements of operations for the year ended December 31, 2012 was $38.4 million (2011 – $33.1 million, 2010 – $33.8 million). As of December 31, 2012, there was $26.0 million of total unrecognized compensation cost related to restricted stock awards, $28.8 million related to restricted stock units and $4.4 million related to performance shares expense which will be recognized during the next 1.7, 2.3 and 1.4 years, respectively.
All of the Company's employees are eligible for defined contribution pension plans. Contributions are primarily based upon a percentage of eligible compensation. The Company contributed $3.4 million to its defined contribution pension plans in 2012 (2011 – $3.2 million, 2010 – $3.2 million).
NOTE 18. STATUTORY REQUIREMENTS
Bermuda-Based Insurance Entities
Under the Insurance Act 1978, amendments thereto and Related Regulations of Bermuda (the "Insurance Act"), certain subsidiaries of the Company are required to prepare statutory financial statements and to file in Bermuda a statutory financial return. The Insurance Act also requires these Bermuda insurance subsidiaries of the Company to maintain certain measures of solvency and liquidity. At December 31, 2012, the statutory capital and surplus of the Company's Bermuda insurance subsidiaries was $3.1 billion (2011 –
$2.7 billion) and the minimum amount required to be maintained under Bermuda law, the Minimum Solvency Margin, was $554.8 million (2011 – $552.9 million).
Under the Insurance Act, Glencoe is defined as a Class 3A insurer, and Renaissance Reinsurance and DaVinci are classified as Class 4 insurers, and therefore must maintain capital at a level equal to its enhanced capital requirement ("ECR") which is established by reference to the Bermuda Solvency Capital Requirement ("BSCR") model. The BSCR is a standard mathematical model designed to give the Bermuda Monetary Authority ("BMA") more advanced methods for determining an insurer's capital adequacy. Underlying the BSCR is the belief that all insurers should operate on an ongoing basis with a view to maintaining their capital at a prudent level in excess of the minimum solvency margin otherwise prescribed under the Insurance Act. Alternatively, under the Insurance Act, insurers may, subject to the terms of the Insurance Act and to the BMA's oversight, elect to utilize an approved internal capital model to determine regulatory capital. In either case, the ECR shall at all times equal or exceed the respective Class 3A and Class 4 insurer's Minimum Solvency Margin and may be adjusted in circumstances where the BMA concludes that the insurer's risk profile deviates significantly from the assumptions underlying its ECR or the insurer's assessment of its risk management policies and practices used to calculate the ECR applicable to it. While not specifically referred to in the Insurance Act, the BMA has also established a target capital level ("TCL") for each Class 3A and Class 4 insurer equal to 120% of its respective ECR. While a Class 3A and Class 4 insurer is not currently required to maintain its statutory capital and surplus at this level, the TCL serves as an early warning tool for the BMA and failure to maintain statutory capital at least equal to the TCL will likely result in increased BMA regulatory oversight.
Class 3A and Class 4 insurers are prohibited from declaring or paying any dividends if in breach of the required Minimum Solvency Margin or Minimum Liquidity Ratio (the "Relevant Margins") or if the declaration or payment of such dividend would cause the insurer to fail to meet the Relevant Margins. Where an insurer fails to meet its Relevant Margins on the last day of any financial year, it is prohibited from declaring or paying any dividends during the next financial year without the prior approval of the BMA. Further, a Class 4 insurer is prohibited from declaring or paying in any financial year dividends of more than 25% of its total statutory capital and surplus (as shown on its previous financial year's statutory balance sheet) unless it files (at least seven days before payment of such dividends) with the BMA an affidavit stating that it will continue to meet its Relevant Margins. Class 3A and Class 4 insurers must obtain the BMA's prior approval for a reduction by 15% or more of the total statutory capital as set forth in its previous year's financial statements. These restrictions on declaring or paying dividends and distributions under the Insurance Act are in addition to the solvency requirements under the Companies Act which apply to all Bermuda companies.
During 2012, Renaissance Reinsurance, DaVinci and Glencoe declared aggregate cash dividends of $482.0 million, $108.0 million, and $Nil, respectively (2011 – $180.7 million, $6.8 million and $15.9 million, respectively). In addition, Glencoe returned capital of $Nil during 2012 (2011 - $234.1 million).
In addition, Glencoe is also eligible as an excess and surplus lines insurer in a number of states in the U.S. and under the various capital and surplus requirements in these states is required to maintain a minimum amount of capital and surplus. In this regard, the declaration of dividends from retained earnings and distributions from additional paid-in capital are limited to the extent that the above requirement is met.
The Company is currently completing its 2012 Bermuda-based statutory filings for Renaissance Reinsurance, DaVinci and Glencoe, which must be filed with the BMA on or before April 30, 2013, and at this time, the Company believes each of Renaissance Reinsurance, DaVinci and Glencoe will exceed the target level of required statutory capital.
Syndicate 1458
RenaissanceRe CCL and Syndicate 1458 are subject to oversight by the Council of Lloyd's. RSML is subject to regulation by the Financial Services Authority ("FSA") under the Financial Services and Markets Act 2000. Underwriting capacity of a member of Lloyd's must be supported by providing a deposit in the form of cash, securities or letters of credit, which are referred to as Funds at Lloyd's ("FAL"). This amount is determined by Lloyd's and is based on Syndicate 1458's solvency and capital requirement as calculated through its internal model. In addition, if the FAL are not sufficient to cover all losses, the Lloyd's Central Fund provides an additional level of security for policyholders. At December 31, 2012, the FAL requirement set by Lloyd's for Syndicate 1458 is £183.2 million based on its business plan, approved in November 2012
(2011 – £93.8 million based on its business plan, approved November 2011). Actual FAL posted for Syndicate 1458 at December 31, 2012 by RenaissanceRe CCL is $222.0 million and £45.5 million supported 100% by letters of credit (2011 – $118.5 million and £24.5 million).
Multi-Beneficiary Reinsurance Trusts
Effective March 15, 2011, each of Renaissance Reinsurance and DaVinci was approved as a Trusteed Reinsurer in the state of New York and established a multi-beneficiary reinsurance trust ("MBRT") to collateralize its (re)insurance liabilities associated with U.S. domiciled cedants. The MBRTs are subject to the rules and regulations of the state of New York and the respective deed of trust, including but not limited to certain minimum capital funding requirements, investment guidelines, capital distribution restrictions and regulatory reporting requirements. Assets held under trust at December 31, 2012 with respect to the MBRTs totaled $508.7 million and $180.1 million for Renaissance Reinsurance and DaVinci, respectively (2011 – $450.8 million and $101.9 million, respectively), compared to the minimum amount required under U.S. state regulations of $494.9 million and $169.1 million, respectively (2011 – $274.5 million and $73.9 million, respectively).
Multi-Beneficiary Reduced Collateral Reinsurance Trusts
Effective December 31, 2012, each of Renaissance Reinsurance and DaVinci was approved as an Accredited Reinsurer in the state of New York and established a multi-beneficiary reduced collateral reinsurance trust ("RCT") to collateralize its (re)insurance liabilities associated with U.S. domiciled cedants in certain states where Renaissance Reinsurance or DaVinci are approved as an Accredited Reinsurer, thereby providing for a reduction in collateral requirements to 20% of the net outstanding insurance liabilities. The RCTs are subject to the rules and regulations of the state of New York and the respective deed of trust, including but not limited to certain minimum capital funding requirements, investment guidelines, capital distribution restrictions and regulatory reporting requirements. Assets held under trust at December 31, 2012 with respect to the RCTs totaled $11.0 million and $11.0 million for Renaissance Reinsurance and DaVinci, respectively, compared to the minimum amount required under U.S. state regulations of $10.0 million and $10.0 million, respectively.
NOTE 19. DERIVATIVE INSTRUMENTS
The Company enters into derivative instruments such as futures, options, swaps, forward contracts and other derivative contracts primarily to manage its foreign currency exposure, obtain exposure to a particular financial market, for yield enhancement, or for trading and speculation. The Company accounts for its derivatives in accordance with FASB ASC Topic Derivatives and Hedging, which requires all derivatives to be recorded at fair value on the Company's balance sheet as either assets or liabilities, depending on the rights or obligations of the derivatives, with changes in fair value reflected in current earnings. The Company does not currently apply hedge accounting in respect of any positions reflected in its consolidated financial statements. Where the Company has entered into master netting agreements with counterparties, or the Company has the legal and contractual right to offset positions, the derivative positions are generally netted by counterparty and are reported accordingly in other assets and other liabilities.
The table below shows the location on the consolidated balance sheets and fair value of the Company's principal derivative instruments: |
| | | | | | | | | | | | | |
| | | | | | | | | | |
| | | Derivative Assets | |
| | | December 31,
2012 | | December 31,
2011 | |
| | | Balance Sheet Location | | Fair Value | | Balance Sheet Location | | Fair Value | |
| | Interest rate futures | Other assets | | $ | 441 |
| | Other assets | | $ | 612 |
| |
| | Foreign currency forward contracts (1) | Other assets | | 7,191 |
| | Other assets | | — |
| |
| | Foreign currency forward contracts (2) | Other liabilities | | 2,534 |
| | Other liabilities | | 7,219 |
| |
| | Foreign currency forward contracts (3) | Other assets | | — |
| | Other assets | | 387 |
| |
| | Credit default swaps | Other assets | | 784 |
| | Other assets | | — |
| |
| | Energy and weather contracts (4) | Other assets | | 30,060 |
| | Other assets | | 52,721 |
| |
| | Total | | | $ | 41,010 |
| | | | $ | 60,939 |
| |
| | | | | | | | | | |
| | | Derivative Liabilities | |
| | | December 31,
2012 | | December 31,
2011 | |
| | | Balance Sheet Location | | Fair Value | | Balance Sheet Location | | Fair Value | |
| | Interest rate futures | Other liabilities | | $ | 41 |
| | Other liabilities | | $ | 339 |
| |
| | Foreign currency forward contracts (1) | Other liabilities | | 4,173 |
| | Other liabilities | | 11,754 |
| |
| | Foreign currency forward contracts (2) | Other liabilities | | 2,296 |
| | Other liabilities | | 1,606 |
| |
| | Foreign currency forward contracts (3) | Other assets | | 526 |
| | Other assets | | — |
| |
| | Credit default swaps | Other assets | | 333 |
| | Other assets | | 539 |
| |
| | Energy and weather contracts (4) | Other liabilities | | 14,518 |
| | Other liabilities | | 43,389 |
| |
| | Total | | | $ | 21,887 |
| | | | $ | 57,627 |
| |
| | | | | | | | | | |
| |
| (1) | Contracts used to manage foreign currency risks in underwriting and non-investment operations. |
| |
| (2) | Contracts used to manage foreign currency risks in investment operations. Included in other liabilities are derivative assets of $2.5 million (2011 – $7.2 million) which are netted with derivative liabilities of $2.3 million (2011 – $1.6 million) under master netting arrangements. |
| |
| (3) | Contracts used to manage foreign currency risks in energy and risk operations. |
| |
| (4) | Included in other assets is $43.4 million of derivative assets (2011 – $104.6 million) and $13.4 million of derivative liabilities (2011 – $51.9 million). Included in other liabilities is $19.2 million of derivative assets (2011 – $8.8 million) and $33.7 million of derivative liabilities (2011 – $52.2 million). |
The location and amount of the gain (loss) recognized in the Company's consolidated statements of operations related to its derivative instruments is shown in the following table: |
| | | | | | | | | | | | | | | |
| | | | | | | | | | |
| | | Location of gain (loss) recognized on derivatives | | Amount of gain (loss) recognized on derivatives | |
| | Year ended December 31, | | | 2012 | | 2011 | | 2010 | |
| | Interest rate futures | Net investment income | | $ | (1,746 | ) | | $ | (25,256 | ) | | $ | (9,124 | ) | |
| | Foreign currency forward contracts (1) | Net foreign exchange gains (losses) | | 13,804 |
| | (5,443 | ) | | 4,242 |
| |
| | Foreign currency forward contracts (2) | Net foreign exchange gains (losses) | | (3,445 | ) | | (4,335 | ) | | 20,111 |
| |
| | Foreign currency forward contracts (3) | Net foreign exchange gains (losses) | | (415 | ) | | 620 |
| | 498 |
| |
| | Credit default swaps | Net investment income | | 1,074 |
| | (1,467 | ) | | 1,265 |
| |
| | Energy and weather contracts | Other (loss) income | | 4,058 |
| | (22,978 | ) | | 28,976 |
| |
| | Platinum warrant | Other (loss) income | | — |
| | 2,975 |
| | 10,054 |
| |
| | Total | | | $ | 13,330 |
| | $ | (55,884 | ) | | $ | 56,022 |
| |
| | | | | | | | | | |
| |
| (1) | Contracts used to manage foreign currency risks in underwriting and non-investment operations. |
| |
| (2) | Contracts used to manage foreign currency risks in investment operations. |
| |
| (3) | Contracts used to manage foreign currency risks in energy and risk operations. |
The Company is not aware of the existence of any credit-risk related contingent features that it believes would be triggered in its derivative instruments that are in a net liability position at December 31, 2012.
Interest Rate Futures
The Company uses interest rate futures within its portfolio of fixed maturity investments to manage its exposure to interest rate risk, which can include increasing or decreasing its exposure to this risk. At December 31, 2012, the Company had $377.8 million of notional long positions and $310.7 million of notional short positions of primarily Eurodollar, U.S. treasury and non-U.S. dollar futures contracts (2011 – $3.2 billion and $285.7 million, respectively). The fair value of these derivatives is determined using exchange traded prices.
Foreign Currency Derivatives
The Company's functional currency is the U.S. dollar. The Company writes a portion of its business in currencies other than U.S. dollars and may, from time to time, experience foreign exchange gains and losses in the Company's consolidated financial statements. All changes in exchange rates, with the exception of non-U.S. dollar denominated investments classified as available for sale and non-monetary assets and liabilities, are recognized currently in the Company's consolidated statements of operations.
Underwriting Operations Related Foreign Currency Contracts
The Company's foreign currency policy with regard to its underwriting operations is generally to hold foreign currency assets, including cash, investments and receivables that approximate the foreign currency liabilities, including claims and claim expense reserves and reinsurance balances payable. When necessary, the Company may use foreign currency forward and option contracts to minimize the effect of fluctuating foreign currencies on the value of non-U.S. dollar denominated assets and liabilities associated with its underwriting operations. The fair value of the Company's underwriting operations related foreign currency contracts is determined using indicative pricing obtained from counterparties or broker quotes.
At December 31, 2012, the Company had outstanding underwriting related foreign currency contracts of $446.2 million in notional long positions and $119.5 million notional in short positions, denominated in U.S. dollars (2011 – $700.8 million and $160.5 million, respectively).
Investment Portfolio Related Foreign Currency Forward Contracts
The Company's investment operations are exposed to currency fluctuations through its investments in non-U.S. dollar fixed maturity investments, short term investments and other investments. To economically hedge its exposure to currency fluctuations from these investments, the Company has entered into foreign currency forward contracts. Foreign exchange gains (losses) associated with the Company's hedging of these non-U.S. dollar investments are recorded in net foreign exchange (losses) gains in its consolidated statements of operations. The fair value of the Company's investment portfolio related foreign currency forward contracts is determined using an interpolated rate based on closing forward market rates. At December 31, 2012, the Company had outstanding investment portfolio related foreign currency contracts of $176.7 million in notional long positions and $217.4 million in notional short positions, denominated in U.S. dollars (2011 – $48.7 million and $217.9 million, respectively).
Energy and Risk Operations Related Foreign Currency Contracts
The Company's energy and risk operations are exposed to currency fluctuations through certain derivative transactions it enters into that are denominated in non-U.S. dollars. The Company may, from time to time, use foreign currency forward and option contracts to minimize the effect of fluctuating foreign currencies on the value of non-U.S. dollar denominated assets and liabilities associated with these operations. The fair value of the Company's energy and risk operations related foreign currency contracts is based on exchange traded prices. At December 31, 2012, the Company's energy and risk operations had foreign currency contracts of $Nil in notional long positions and $38.2 million in notional short positions, denominated in U.S. dollars (2011 – $7.8 million and $12.7 million, respectively).
Credit Derivatives
The Company's exposure to credit risk is primarily due to its fixed maturity investments, short term investments, premiums receivable and reinsurance recoverable. From time to time, the Company purchases credit derivatives to hedge its exposures in the insurance industry, and to assist in managing the credit risk associated with ceded reinsurance. The Company also employs credit derivatives in its investment portfolio to either assume credit risk or hedge its credit exposure. The fair value of credit derivatives is determined using industry valuation models, broker bid indications or internal pricing valuation techniques. The fair value of these credit derivatives can change based on a variety of factors including changes in credit spreads, default rates and recovery rates, the correlation of credit risk between the referenced credit and the counterparty, and market rate inputs such as interest rates. At December 31, 2012, the Company had outstanding credit derivatives of $46.1 million in notional long positions and $24.0 million in notional short positions, denominated in U.S. dollars (2011 – $15.0 million and $38.1 million, respectively).
Energy and Weather-Related Derivatives
The Company regularly transacts in certain derivative-based risk management products primarily to address weather and energy risks and engages in hedging and trading activities related to these risks.
The trading markets for these derivatives are generally linked to energy and agriculture commodities, weather and other natural phenomena. Currently, a percentage of the Company's derivative-based risk management products are transacted on a dual-trigger basis combining weather or other natural phenomenon, with prices for commodities or securities related to energy or agriculture. The fair value of these contracts is obtained through the use of quoted market prices, or in the absence of such quoted prices, industry or internal valuation models. Generally, the Company's current portfolio of such derivative contracts is of comparably short duration and such contracts are predominantly seasonal in nature. Over time, the Company currently expects that its participation in these markets, and the impact of these operations on its financial results, is likely to increase on both an absolute and relative basis.
As of the dates set forth below, the Company had the following gross derivative contract positions outstanding relating to its energy and weather derivatives trading activities. |
| | | | | | | | | |
| | | | | | | | |
| | | Quantity (1) | | | |
| | | December 31,
2012 | | December 31, 2011 | | Unit of measurement | |
| | Energy | 107,521,592 |
| | 240,363,364 |
| | One million British thermal units ("MMBTUs") | |
| | Temperature | 8,168,052 |
| | 14,917,438 |
| | $ per Degree Day Fahrenheit | |
| | Precipitation | 4,453,934 |
| | 65,000 |
| | $ per Inch | |
| | Agriculture | — |
| | 6,098,000 |
| | Bushels | |
| | Wind | — |
| | 712 |
| | $ per Meters per Second Hour | |
| | | | | | | | |
| |
| (1) | Represents the sum of gross long and gross short derivative contracts. |
Platinum Warrant
The Company held a warrant to purchase up to 2.5 million common shares of Platinum for $27.00 per share. The Company recorded its investment in the Platinum warrant at fair value. The fair value of the warrant was estimated using either the Black-Scholes option pricing model or the in-the-money value, the greater of which the Company considered the best estimate of the exit value of the warrant. On January 20, 2011, the Company sold its warrant to Platinum for an aggregate of $47.9 million, and recognized a $3.0 million gain on the sale, which is included in other income during the year ended December 31, 2011.
NOTE 20. COMMITMENTS AND CONTINGENCIES
CONCENTRATION OF CREDIT RISK
Instruments which potentially subject the Company to concentration of credit risk consist principally of investments, including the Company's equity method investments, cash, premiums receivable and reinsurance balances. The Company limits the amount of credit exposure to any one financial institution and, except for U.S. Government securities, none of the Company's investments exceeded 10% of shareholders' equity at December 31, 2012. See "Note 7. Ceded Reinsurance", for information with respect to reinsurance recoverable.
EMPLOYMENT AGREEMENTS
The Board of Directors has authorized the execution of employment agreements between the Company and certain officers. These agreements provide for, among other things, severance payments under certain circumstances, as well as accelerated vesting of options and restricted stock grants, upon a change in control, as defined therein and under the terms of the Company's 2001 Stock Incentive Plan, Premium Option Plan and 2010 Performance-Based Equity Incentive Plan.
LETTERS OF CREDIT AND OTHER COMMITMENTS
At December 31, 2012, the Company's banks have issued letters of credit of approximately $507.2 million in favor of certain ceding companies. In connection with the Company's Top Layer Re joint venture, the Company has committed $37.5 million of collateral to support a letter of credit and is obligated to make a mandatory capital contribution of up to $50.0 million in the event that a loss reduces Top Layer Re's capital and surplus below a specified level. The letters of credit are secured by cash and investments of similar amounts. The Company's principal letter of credit facility contains certain financial covenants.
At December 31, 2012, RenaissanceRe has provided guarantees in the amount of $304.3 million to certain counterparties of the weather and energy risk operations of Renaissance Trading. In the future, RenaissanceRe may issue guarantees for other purposes or increase the amount of guarantees issued to counterparties of Renaissance Trading. In addition, the Company's weather and energy risk operations have entered into certain service contract commitments as at December 31, 2012 of $7.3 million.
On April 26, 2010, Renaissance Reinsurance and CEP entered into a Pledge Agreement in respect of its letter of credit facility with CEP which is evidenced by the Master Reimbursement Agreement, dated as of April 29, 2009, and provides for the issuance and renewal of letters of credit which are used to support business written by Syndicate 1458. Letter of credit fees will be payable pursuant to the terms of the Reimbursement Agreement. At December 31, 2012, these letters of credit amounted to $222.0 million and £45.5 million, respectively. Pursuant to the Pledge Agreement, Renaissance Reinsurance has agreed to pledge and maintain certain securities with a collateral value equal to 75% of the aggregate amount of the then outstanding letters of credit. In respect of the 25% unsecured portion, Renaissance Reinsurance is required to comply with certain financial covenants, including maintaining a certain minimum financial strength rating, minimum net worth, and a maximum consolidated debt to capital ratio for the consolidated group. In the event Renaissance Reinsurance is unable to satisfy any of these financial covenants, it will be required to pledge additional collateral in respect of the unsecured portion.
PRIVATE EQUITY AND INVESTMENT COMMITMENTS
The Company has committed capital to private equity partnerships and other entities of $708.9 million, of which $655.5 million has been contributed at December 31, 2012. The Company's remaining commitments to these funds at December 31, 2012 totaled $133.2 million. These commitments do not have a defined contractual commitment date.
INDEMNIFICATIONS AND WARRANTIES
In the ordinary course of its business, the Company may enter into contracts or agreements that contain indemnifications or warranties. Future events could occur that lead to the execution of these provisions against the Company. Based on past experience, management currently believes that the likelihood of such an event is remote.
OPERATING LEASES
The Company and its subsidiaries lease office space under operating leases which expire at various dates through 2019. Future minimum lease payments under existing operating leases are expected to be as follows: |
| | | | | |
| | | | |
| | | Minimum lease payments | |
| | 2013 | $ | 6,829 |
| |
| | 2014 | 5,646 |
| |
| | 2015 | 5,001 |
| |
| | 2016 | 4,105 |
| |
| | 2017 | 1,672 |
| |
| | After 2017 | 3,014 |
| |
| | Future minimum lease payments under existing operating leases | $ | 26,267 |
| |
| | | | |
CAPITAL LEASES
The Company's capital leases primarily relate to office space in Bermuda. The initial lease term is for 20 years, with a bargain renewal option for an additional 30 years. The future minimum lease payments of the Company's capital leases are detailed below, and relate principally to the transaction noted above, excluding the bargain renewal option. |
| | | | | |
| | | | |
| | | Minimum lease payments | |
| | 2013 | $ | 3,017 |
| |
| | 2014 | 3,017 |
| |
| | 2015 | 3,017 |
| |
| | 2016 | 3,017 |
| |
| | 2017 | 2,417 |
| |
| | After 2017 | 28,597 |
| |
| | Future minimum lease payments under existing capital leases | $ | 43,082 |
| |
| | | | |
LITIGATION
The Company and its subsidiaries are subject to lawsuits and regulatory actions in the normal course of business that do not arise from or directly relate to claims on reinsurance treaties or contracts or direct surplus lines insurance policies. This category of business litigation may involve allegations of underwriting or claims-handling errors or misconduct, employment claims, regulatory actions or disputes arising from the Company's business ventures. The Company's operating subsidiaries are subject to claims litigation involving disputed interpretations of policy coverages. Generally, the Company's direct surplus lines insurance operations are subject to greater frequency and diversity of claims and claims-related litigation than its reinsurance operations and, in some jurisdictions, may be subject to direct actions by allegedly injured persons or entities seeking damages from policyholders. These lawsuits, involving claims on policies issued by the Company's subsidiaries which are typical to the insurance industry in general and in the normal course of business, are considered in its loss and loss expense reserves which are discussed in its loss reserves discussion. In addition, the Company may from time to time engage in litigation or arbitration related to its claims for payment in respect of ceded reinsurance. Any such litigation or arbitration contains an element of uncertainty, and the Company believes the inherent uncertainty in such matters may have increased recently and will likely continue to increase. Currently, the Company believes that no individual litigation or arbitration to which it is presently a party is likely to have a material adverse effect on its financial condition, business or results of operations.
NOTE 21. QUARTERLY FINANCIAL INFORMATION (UNAUDITED) |
| | | | | | | | | | | | | | | | | | | | | | | | | | | | | | | | | |
| | | | | | | | | | | | | | | | | | |
| | | Quarter Ended March 31, | | Quarter Ended June 30, | | Quarter Ended September 30, | | Quarter Ended December 31, | |
| | | 2012 | | 2011 | | 2012 | | 2011 | | 2012 | | 2011 | | 2012 | | 2011 | |
| | Revenues | | | | | | | | | | | | | | | | |
| | Gross premiums written | $ | 664,151 |
| | $ | 610,505 |
| | $ | 667,336 |
| | $ | 641,563 |
| | $ | 136,359 |
| | $ | 139,938 |
| | $ | 83,745 |
| | $ | 42,970 |
| |
| | Net premiums written | $ | 492,575 |
| | $ | 452,575 |
| | $ | 427,630 |
| | $ | 427,995 |
| | $ | 105,035 |
| | $ | 103,010 |
| | $ | 77,417 |
| | $ | 29,193 |
| |
| | (Increase) decrease in unearned premiums | (213,910 | ) | | (147,034 | ) | | (183,214 | ) | | (210,820 | ) | | 157,588 |
| | 126,214 |
| | 206,234 |
| | 169,916 |
| |
| | Net premiums earned | 278,665 |
| | 305,541 |
| | 244,416 |
| | 217,175 |
| | 262,623 |
| | 229,224 |
| | 283,651 |
| | 199,109 |
| |
| | Net investment income (loss) | 66,971 |
| | 60,281 |
| | 14,743 |
| | 33,328 |
| | 45,164 |
| | (27,940 | ) | | 40,497 |
| | 52,331 |
| |
| | Net foreign exchange (losses) gains | (1,460 | ) | | 660 |
| | 2,410 |
| | (4,521 | ) | | 3,001 |
| | (2,650 | ) | | 1,272 |
| | (400 | ) | |
| | Equity in earnings (losses) of other ventures | 5,470 |
| | (23,753 | ) | | 6,846 |
| | 5,128 |
| | 4,310 |
| | 4,794 |
| | 6,612 |
| | (22,702 | ) | |
| | Other (loss) income | (39,094 | ) | | 50,145 |
| | 11,289 |
| | (5,167 | ) | | (881 | ) | | (2,015 | ) | | 5,781 |
| | (43,648 | ) | |
| | Net realized and unrealized gains (losses) on investments | 46,113 |
| | (5,214 | ) | | 31,003 |
| | 34,979 |
| | 76,258 |
| | 16,983 |
| | 10,617 |
| | 23,920 |
| |
| | Total other-than-temporary impairments | (161 | ) | | — |
| | (234 | ) | | — |
| | — |
| | (498 | ) | | — |
| | (132 | ) | |
| | Portion recognized in other comprehensive income, before taxes | 27 |
| | — |
| | 25 |
| | — |
| | — |
| | 49 |
| | — |
| | 29 |
| |
| | Net other-than-temporary impairments | (134 | ) | | — |
| | (209 | ) | | — |
| | — |
| | (449 | ) | | — |
| | (103 | ) | |
| | Total revenues | 356,531 |
| | 387,660 |
| | 310,498 |
| | 280,922 |
| | 390,475 |
| | 217,947 |
| | 348,430 |
| | 208,507 |
| |
| | Expenses | | | | | | | | | | | | | | | | |
| | Net claims and claim expenses incurred | 15,552 |
| | 628,537 |
| | 49,551 |
| | 151,261 |
| | 73,215 |
| | 77,830 |
| | 186,893 |
| | 3,551 |
| |
| | Acquisition costs | 24,111 |
| | 32,335 |
| | 25,608 |
| | 13,883 |
| | 24,438 |
| | 26,057 |
| | 39,385 |
| | 25,101 |
| |
| | Operational expenses | 42,383 |
| | 41,830 |
| | 41,407 |
| | 42,299 |
| | 42,390 |
| | 42,169 |
| | 53,121 |
| | 43,368 |
| |
| | Corporate expenses | 4,811 |
| | 2,064 |
| | 4,067 |
| | 4,011 |
| | 3,850 |
| | 3,582 |
| | 3,964 |
| | 8,607 |
| |
| | Interest expense | 5,718 |
| | 6,195 |
| | 5,716 |
| | 5,730 |
| | 5,891 |
| | 5,722 |
| | 5,772 |
| | 5,721 |
| |
| | Total expenses | 92,575 |
| | 710,961 |
| | 126,349 |
| | 217,184 |
| | 149,784 |
| | 155,360 |
| | 289,135 |
| | 86,348 |
| |
| | Income (loss) from continuing operations before taxes | 263,956 |
| | (323,301 | ) | | 184,149 |
| | 63,738 |
| | 240,691 |
| | 62,587 |
| | 59,295 |
| | 122,159 |
| |
| | Income tax benefit (expense) | 37 |
| | 52 |
| | (898 | ) | | 1,773 |
| | (144 | ) | | 1,435 |
| | (424 | ) | | (2,945 | ) | |
| | Income (loss) from continuing operations | 263,993 |
| | (323,249 | ) | | 183,251 |
| | 65,511 |
| | 240,547 |
| | 64,022 |
| | 58,871 |
| | 119,214 |
| |
| | (Loss) income from discontinued operations | (173 | ) | | (1,526 | ) | | 1,393 |
| | (10,094 | ) | | (54 | ) | | (965 | ) | | 1,121 |
| | (3,305 | ) | |
| | Net income (loss) | 263,820 |
| | (324,775 | ) | | 184,644 |
| | 55,417 |
| | 240,493 |
| | 63,057 |
| | 59,992 |
| | 115,909 |
| |
| | Net (income) loss attributable to noncontrolling interests | (53,641 | ) | | 85,492 |
| | (33,624 | ) | | (21,903 | ) | | (51,083 | ) | | (5,044 | ) | | (9,692 | ) | | (25,388 | ) | |
| | Net income (loss) available (attributable) to RenaissanceRe | 210,179 |
| | (239,283 | ) | | 151,020 |
| | 33,514 |
| | 189,410 |
| | 58,013 |
| | 50,300 |
| | 90,521 |
| |
| | Dividends on preference shares | (8,750 | ) | | (8,750 | ) | | (8,750 | ) | | (8,750 | ) | | (8,750 | ) | | (8,750 | ) | | (8,645 | ) | | (8,750 | ) | |
| | Net income (loss) available (attributable) to RenaissanceRe common shareholders | $ | 201,429 |
| | $ | (248,033 | ) | | $ | 142,270 |
| | $ | 24,764 |
| | $ | 180,660 |
| | $ | 49,263 |
| | $ | 41,655 |
| | $ | 81,771 |
| |
| | Income (loss) from continuing operations available (attributable) to RenaissanceRe common shareholders per common share – basic | $ | 3.93 |
| | $ | (4.66 | ) | | $ | 2.75 |
| | $ | 0.68 |
| | $ | 3.67 |
| | $ | 0.98 |
| | $ | 0.86 |
| | $ | 1.66 |
| |
| | (Loss) income from discontinued operations (attributable) available to RenaissanceRe common shareholders per common share – basic | — |
| | (0.03 | ) | | 0.03 |
| | (0.20 | ) | | — |
| | (0.02 | ) | | 0.02 |
| | (0.07 | ) | |
| | Net income (loss) available (attributable) to RenaissanceRe common shareholders per common share – basic | $ | 3.93 |
| | $ | (4.69 | ) | | $ | 2.78 |
| | $ | 0.48 |
| | $ | 3.67 |
| | $ | 0.96 |
| | $ | 0.88 |
| | $ | 1.59 |
| |
| | Income (loss) from continuing operations available (attributable) to RenaissanceRe common shareholders per common share – diluted | $ | 3.88 |
| | $ | (4.66 | ) | | $ | 2.72 |
| | $ | 0.68 |
| | $ | 3.62 |
| | $ | 0.97 |
| | $ | 0.85 |
| | $ | 1.64 |
| |
| | (Loss) income from discontinued operations (attributable) available to RenaissanceRe common shareholders per common share – diluted | — |
| | (0.03 | ) | | 0.03 |
| | (0.20 | ) | | — |
| | (0.02 | ) | | 0.02 |
| | (0.06 | ) | |
| | Net income (loss) available (attributable) to RenaissanceRe common shareholders per common share – diluted | $ | 3.88 |
| | $ | (4.69 | ) | | $ | 2.75 |
| | $ | 0.48 |
| | $ | 3.62 |
| | $ | 0.95 |
| | $ | 0.87 |
| | $ | 1.58 |
| |
| | Average shares outstanding – basic | 50,377 |
| | 51,504 |
| | 50,278 |
| | 50,493 |
| | 48,394 |
| | 50,501 |
| | 46,442 |
| | 50,501 |
| |
| | Average shares outstanding – diluted | 50,981 |
| | 51,504 |
| | 51,012 |
| | 51,050 |
| | 49,119 |
| | 50,973 |
| | 47,297 |
| | 50,860 |
| |
| | | | | | | | | | | | | | | | | | |
NOTE 22. CONDENSED CONSOLIDATING FINANCIAL INFORMATION PROVIDED IN CONNECTION WITH OUTSTANDING DEBT OF SUBSIDIARIES
The following tables present condensed consolidating balance sheets at December 31, 2012 and 2011, condensed consolidating statements of operations and condensed consolidating statements of comprehensive income (loss) for the years ended December 31, 2012, 2011 and 2010, and condensed consolidating statements of cash flows for the years ended December 31, 2012, 2011 and 2010, respectively, for RenaissanceRe, RRNAH and RenaissanceRe's other subsidiaries. RRNAH is a 100% owned subsidiary of RenaissanceRe.
On March 17, 2010, RRNAH issued, and RenaissanceRe guaranteed, $250.0 million of 5.75% Senior Notes due March 15, 2020, with interest on the notes payable on March 15 and September 15. The notes can be redeemed by RRNAH prior to maturity, subject to payment of a "make-whole" premium. The notes, which are senior obligations, contain various covenants, including limitations on mergers and consolidations, restrictions as to the disposition of the stock of designated subsidiaries and limitations on liens of the stock of designated subsidiaries.
|
| | | | | | | | | | | | | | | | | | | |
| Condensed Consolidating Balance Sheet at December 31, 2012 | RenaissanceRe Holdings Ltd. (Parent Guarantor) | | RenRe North America Holdings Inc. (Subsidiary Issuer) | | Other RenaissanceRe Holdings Ltd. Subsidiaries and Eliminations (Non-guarantor Subsidiaries) (1) | | Consolidating Adjustments (2) | | RenaissanceRe Consolidated |
| Assets | | | | | | | | | |
| Total investments | $ | 572,139 |
| | $ | 49,618 |
| | $ | 5,738,890 |
| | $ | — |
| | $ | 6,360,647 |
|
| Cash and cash equivalents | 6,298 |
| | 1,528 |
| | 317,532 |
| | — |
| | 325,358 |
|
| Investments in subsidiaries | 2,864,793 |
| | 113,856 |
| | — |
| | (2,978,649 | ) | | — |
|
| Due from subsidiaries and affiliates | 53,296 |
| | 117 |
| | — |
| | (53,413 | ) | | — |
|
| Premiums receivable | — |
| | — |
| | 491,365 |
| | — |
| | 491,365 |
|
| Prepaid reinsurance premiums | — |
| | — |
| | 77,082 |
| | — |
| | 77,082 |
|
| Reinsurance recoverable | — |
| | — |
| | 192,512 |
| | — |
| | 192,512 |
|
| Accrued investment income | 2,535 |
| | 69 |
| | 30,874 |
| | — |
| | 33,478 |
|
| Deferred acquisition costs | — |
| | — |
| | 52,622 |
| | — |
| | 52,622 |
|
| Other assets | 175,105 |
| | 15,754 |
| | 320,198 |
| | (115,493 | ) | | 395,564 |
|
| Total assets | $ | 3,674,166 |
| | $ | 180,942 |
| | $ | 7,221,075 |
| | $ | (3,147,555 | ) | | $ | 7,928,628 |
|
| Liabilities, Noncontrolling Interests and Shareholders' Equity | | | | | | | | | |
| Liabilities | | | | | | | | | |
| Reserve for claims and claim expenses | $ | — |
| | $ | — |
| | $ | 1,879,377 |
| | $ | — |
| | $ | 1,879,377 |
|
| Unearned premiums | — |
| | — |
| | 399,517 |
| | — |
| | 399,517 |
|
| Debt | 100,000 |
| | 249,339 |
| | 2,436 |
| | — |
| | 351,775 |
|
| Amounts due to subsidiaries and affiliates | 11,371 |
| | 5,593 |
| | — |
| | (16,964 | ) | | — |
|
| Reinsurance balances payable | — |
| | — |
| | 290,419 |
| | — |
| | 290,419 |
|
| Other liabilities | 59,730 |
| | 4,572 |
| | 469,381 |
| | (1,458 | ) | | 532,225 |
|
| Total liabilities | 171,101 |
| | 259,504 |
| | 3,041,130 |
| | (18,422 | ) | | 3,453,313 |
|
| Redeemable noncontrolling interest – DaVinciRe | — |
| | — |
| | 968,259 |
| | — |
| | 968,259 |
|
| Shareholders' Equity | | | | | | | | | |
| Total shareholders' equity | 3,503,065 |
| | (78,562 | ) | | 3,211,686 |
| | (3,129,133 | ) | | 3,507,056 |
|
| Total liabilities, noncontrolling interests and shareholders' equity | $ | 3,674,166 |
| | $ | 180,942 |
| | $ | 7,221,075 |
| | $ | (3,147,555 | ) | | $ | 7,928,628 |
|
| |
| (1) | Includes all other subsidiaries of RenaissanceRe Holdings Ltd. and eliminations. |
| |
| (2) | Includes Parent Guarantor and Subsidiary Issuer consolidating adjustments. |
|
| | | | | | | | | | | | | | | | | | | |
| Condensed Consolidating Balance Sheet at December 31, 2011 | RenaissanceRe Holdings Ltd. (Parent Guarantor) | | RenRe North America Holdings Inc. (Subsidiary Issuer) | | Other RenaissanceRe Holdings Ltd. Subsidiaries and Eliminations (Non-guarantor Subsidiaries) (1) | | Consolidating Adjustments (2) | | RenaissanceRe Consolidated |
| Assets | | | | | | | | | |
| Total investments | $ | 593,973 |
| | $ | 104,869 |
| | $ | 5,510,410 |
| | $ | — |
| | $ | 6,209,252 |
|
| Cash and cash equivalents | 10,606 |
| | 4,920 |
| | 201,458 |
| | — |
| | 216,984 |
|
| Investments in subsidiaries | 2,776,997 |
| | 83,031 |
| | — |
| | (2,860,028 | ) | | — |
|
| Due from subsidiaries and affiliates | 172,069 |
| | 846 |
| | — |
| | (172,915 | ) | | — |
|
| Premiums receivable | — |
| | — |
| | 471,878 |
| | — |
| | 471,878 |
|
| Prepaid reinsurance premiums | — |
| | — |
| | 58,522 |
| | — |
| | 58,522 |
|
| Reinsurance recoverable | — |
| | — |
| | 404,029 |
| | — |
| | 404,029 |
|
| Accrued investment income | 4,106 |
| | 311 |
| | 29,106 |
| | — |
| | 33,523 |
|
| Deferred acquisition costs | — |
| | — |
| | 43,721 |
| | — |
| | 43,721 |
|
| Other assets | 206,171 |
| | 27,198 |
| | 275,092 |
| | (201,458 | ) | | 307,003 |
|
| Total assets | $ | 3,763,922 |
| | $ | 221,175 |
| | $ | 6,994,216 |
| | $ | (3,234,401 | ) | | $ | 7,744,912 |
|
| Liabilities, Redeemable Noncontrolling Interest and Shareholders' Equity | | | | | | | | | |
| Liabilities | | | | | | | | | |
| Reserve for claims and claim expenses | $ | — |
| | $ | — |
| | $ | 1,992,354 |
| | $ | — |
| | $ | 1,992,354 |
|
| Unearned premiums | — |
| | — |
| | 347,655 |
| | — |
| | 347,655 |
|
| Debt | 100,000 |
| | 249,247 |
| | 4,373 |
| | — |
| | 353,620 |
|
| Amounts due to subsidiaries and affiliates | 30,519 |
| | 6,081 |
| | — |
| | (36,600 | ) | | — |
|
| Reinsurance balances payable | — |
| | — |
| | 256,883 |
| | — |
| | 256,883 |
|
| Other liabilities | 28,210 |
| | 3,755 |
| | 482,668 |
| | — |
| | 514,633 |
|
| Liabilities of discontinued operations held for sale | — |
| | 13,507 |
| | — |
| | — |
| | 13,507 |
|
| Total liabilities | 158,729 |
| | 272,590 |
| | 3,083,933 |
| | (36,600 | ) | | 3,478,652 |
|
| Redeemable noncontrolling interest – DaVinciRe | — |
| | — |
| | 657,727 |
| | — |
| | 657,727 |
|
| Shareholders' Equity | | | | | | | | | |
| Total shareholders' equity | 3,605,193 |
| | (51,415 | ) | | 3,252,556 |
| | (3,197,801 | ) | | 3,608,533 |
|
| Total liabilities, redeemable noncontrolling interest and shareholders' equity | $ | 3,763,922 |
| | $ | 221,175 |
| | $ | 6,994,216 |
| | $ | (3,234,401 | ) | | $ | 7,744,912 |
|
| |
| (1) | Includes all other subsidiaries of RenaissanceRe Holdings Ltd. and eliminations. |
| |
| (2) | Includes Parent Guarantor and Subsidiary Issuer consolidating adjustments. |
|
| | | | | | | | | | | | | | | | | | | |
Condensed Consolidating Statement of Operations for
the year ended December 31, 2012 | RenaissanceRe Holdings Ltd. (Parent Guarantor) | | RenRe North America Holdings Inc. (Subsidiary Issuer) | | Other RenaissanceRe Holdings Ltd. Subsidiaries and Eliminations (Non-guarantor Subsidiaries) (1) | | Consolidating Adjustments (2) | | RenaissanceRe Consolidated |
| Revenues | | | | | | | | | |
| Net premiums earned | $ | — |
| | $ | — |
| | $ | 1,069,355 |
| | $ | — |
| | $ | 1,069,355 |
|
| Net investment income | 14,305 |
| | 829 |
| | 152,451 |
| | (210 | ) | | 167,375 |
|
| Net foreign exchange gains | 33 |
| | — |
| | 5,190 |
| | — |
| | 5,223 |
|
| Equity in earnings of other ventures | — |
| | — |
| | 23,238 |
| | — |
| | 23,238 |
|
| Other income (loss) | 2,822 |
| | — |
| | (25,727 | ) | | — |
| | (22,905 | ) |
| Net realized and unrealized gains on investments | 14,752 |
| | 1,556 |
| | 147,683 |
| | — |
| | 163,991 |
|
| Net other-than-temporary impairments | — |
| | — |
| | (343 | ) | | — |
| | (343 | ) |
| Total revenues | 31,912 |
| | 2,385 |
| | 1,371,847 |
| | (210 | ) | | 1,405,934 |
|
| Expenses | | | | | | | | | |
| Net claims and claim expenses incurred | — |
| | — |
| | 325,211 |
| | — |
| | 325,211 |
|
| Acquisition expenses | — |
| | — |
| | 113,542 |
| | — |
| | 113,542 |
|
| Operational expenses | (5,103 | ) | | 7,013 |
| | 177,391 |
| | — |
| | 179,301 |
|
| Corporate expenses | 14,282 |
| | 273 |
| | 2,137 |
| | — |
| | 16,692 |
|
| Interest expense | 5,875 |
| | 14,467 |
| | 2,755 |
| | — |
| | 23,097 |
|
| Total expenses | 15,054 |
| | 21,753 |
| | 621,036 |
| | — |
| | 657,843 |
|
| Income (loss) before equity in net income (loss) of subsidiaries and taxes | 16,858 |
| | (19,368 | ) | | 750,811 |
| | (210 | ) | | 748,091 |
|
| Equity in net income (loss) of subsidiaries | 584,051 |
| | (17,113 | ) | | — |
| | (566,938 | ) | | — |
|
| Income (loss) from continuing operations before taxes | 600,909 |
| | (36,481 | ) | | 750,811 |
| | (567,148 | ) | | 748,091 |
|
| Income tax expense | — |
| | (499 | ) | | (930 | ) | | — |
| | (1,429 | ) |
| Income (loss) from continuing operations | 600,909 |
| | (36,980 | ) | | 749,881 |
| | (567,148 | ) | | 746,662 |
|
| Income from discontinued operations | — |
| | 2,287 |
| | — |
| | — |
| | 2,287 |
|
| Net income (loss) | 600,909 |
| | (34,693 | ) | | 749,881 |
| | (567,148 | ) | | 748,949 |
|
| Net income attributable to noncontrolling interests | — |
| | — |
| | (148,040 | ) | | — |
| | (148,040 | ) |
| Net income (loss) attributable to RenaissanceRe | 600,909 |
| | (34,693 | ) | | 601,841 |
| | (567,148 | ) | | 600,909 |
|
| Dividends on preference shares | (34,895 | ) | | — |
| | — |
| | — |
| | (34,895 | ) |
| Net income (loss) attributable to RenaissanceRe common shareholders | $ | 566,014 |
| | $ | (34,693 | ) | | $ | 601,841 |
| | $ | (567,148 | ) | | $ | 566,014 |
|
| |
| (1) | Includes all other subsidiaries of RenaissanceRe Holdings Ltd. and eliminations. |
| |
| (2) | Includes Parent Guarantor and Subsidiary Issuer consolidating adjustments. |
|
| | | | | | | | | | | | | | | | | | | |
| Condensed Consolidating Statement of Comprehensive Income (Loss) for the year ended December 31, 2012 | RenaissanceRe Holdings Ltd. (Parent Guarantor) | | RenRe North America Holdings Inc. (Subsidiary Issuer) | | Other RenaissanceRe Holdings Ltd. Subsidiaries and Eliminations (Non-guarantor Subsidiaries) (1) | | Consolidating Adjustments (2) | | RenaissanceRe Consolidated |
| Comprehensive income (loss) | | | | | | | | | |
| Net income (loss) | $ | 600,909 |
| | $ | (34,693 | ) | | $ | 749,881 |
| | $ | (567,148 | ) | | $ | 748,949 |
|
| Change in net unrealized gains on investments | — |
| | — |
| | 1,914 |
| | — |
| | 1,914 |
|
| Portion of other-than-temporary impairments recognized in other comprehensive income (loss) | — |
| | — |
| | (52 | ) | | — |
| | (52 | ) |
| Comprehensive income (loss) | 600,909 |
| | (34,693 | ) | | 751,743 |
| | (567,148 | ) | | 750,811 |
|
| Net income attributable to noncontrolling interests | — |
| | — |
| | (148,040 | ) | | — |
| | (148,040 | ) |
| Comprehensive income attributable to noncontrolling interests | — |
| | — |
| | (148,040 | ) | | — |
| | (148,040 | ) |
| Comprehensive income (loss) attributable to RenaissanceRe | $ | 600,909 |
| | $ | (34,693 | ) | | $ | 603,703 |
| | $ | (567,148 | ) | | $ | 602,771 |
|
| |
| (1) | Includes all other subsidiaries of RenaissanceRe Holdings Ltd. and eliminations. |
| |
| (2) | Includes Parent Guarantor and Subsidiary Issuer consolidating adjustments. |
|
| | | | | | | | | | | | | | | | | | | |
Condensed Consolidating Statement of Operations
for the year ended December 31, 2011 | RenaissanceRe Holdings Ltd. (Parent Guarantor) | | RenRe North America Holdings Inc. (Subsidiary Issuer) | | Other RenaissanceRe Holdings Ltd. Subsidiaries and Eliminations (Non-guarantor Subsidiaries) (1) | | Consolidating Adjustments (2) | | RenaissanceRe Consolidated |
| Revenues | | | | | | | | | |
| Net premiums earned | $ | — |
| | $ | — |
| | $ | 951,049 |
| | $ | — |
| | $ | 951,049 |
|
| Net investment income | 20,845 |
| | 944 |
| | 102,023 |
| | (5,812 | ) | | 118,000 |
|
| Net foreign exchange gains (losses) | 112 |
| | — |
| | (7,023 | ) | | — |
| | (6,911 | ) |
| Equity in losses of other ventures | — |
| | — |
| | (36,533 | ) | | — |
| | (36,533 | ) |
| Other loss | (11 | ) | | — |
| | (674 | ) | | — |
| | (685 | ) |
| Net realized and unrealized gains on investments | 11,377 |
| | 1,217 |
| | 58,074 |
| | — |
| | 70,668 |
|
| Net other-than-temporary impairments | — |
| | — |
| | (552 | ) | | — |
| | (552 | ) |
| Total revenues | 32,323 |
| | 2,161 |
| | 1,066,364 |
| | (5,812 | ) | | 1,095,036 |
|
| Expenses | | | | | | | | | |
| Net claims and claim expenses incurred | — |
| | — |
| | 861,179 |
| | — |
| | 861,179 |
|
| Acquisition expenses | — |
| | — |
| | 97,376 |
| | — |
| | 97,376 |
|
| Operational expenses | (4,842 | ) | | 7,910 |
| | 166,598 |
| | — |
| | 169,666 |
|
| Corporate expenses | 11,486 |
| | 229 |
| | 6,549 |
| | — |
| | 18,264 |
|
| Interest expense | 10,472 |
| | 14,568 |
| | 3,026 |
| | (4,698 | ) | | 23,368 |
|
| Total expenses | 17,116 |
| | 22,707 |
| | 1,134,728 |
| | (4,698 | ) | | 1,169,853 |
|
| Income (loss) before equity in net loss of subsidiaries and taxes | 15,207 |
| | (20,546 | ) | | (68,364 | ) | | (1,114 | ) | | (74,817 | ) |
| Equity in net loss of subsidiaries | (73,066 | ) | | (52,358 | ) | | — |
| | 125,424 |
| | — |
|
| Loss from continuing operations before taxes | (57,859 | ) | | (72,904 | ) | | (68,364 | ) | | 124,310 |
| | (74,817 | ) |
| Income tax benefit (expense) | 624 |
| | 1,677 |
| | (1,986 | ) | | — |
| | 315 |
|
| Loss from continuing operations | (57,235 | ) | | (71,227 | ) | | (70,350 | ) | | 124,310 |
| | (74,502 | ) |
| Loss from discontinued operations | — |
| | (15,890 | ) | | — |
| | — |
| | (15,890 | ) |
| Net loss | (57,235 | ) | | (87,117 | ) | | (70,350 | ) | | 124,310 |
| | (90,392 | ) |
| Net loss attributable to redeemable noncontrolling interest – DaVinciRe | — |
| | — |
| | 33,157 |
| | — |
| | 33,157 |
|
| Net loss attributable to RenaissanceRe | (57,235 | ) | | (87,117 | ) | | (37,193 | ) | | 124,310 |
| | (57,235 | ) |
| Dividends on preference shares | (35,000 | ) | | — |
| | — |
| | — |
| | (35,000 | ) |
| Net loss attributable to RenaissanceRe common shareholders | $ | (92,235 | ) | | $ | (87,117 | ) | | $ | (37,193 | ) | | $ | 124,310 |
| | $ | (92,235 | ) |
| |
| (1) | Includes all other subsidiaries of RenaissanceRe Holdings Ltd. and eliminations. |
| |
| (2) | Includes Parent Guarantor and Subsidiary Issuer consolidating adjustments. |
|
| | | | | | | | | | | | | | | | | | | |
| Condensed Consolidating Statement of Comprehensive Loss for the year ended December 31, 2011 | RenaissanceRe Holdings Ltd. (Parent Guarantor) | | RenRe North America Holdings Inc. (Subsidiary Issuer) | | Other RenaissanceRe Holdings Ltd. Subsidiaries and Eliminations (Non-guarantor Subsidiaries) (1) | | Consolidating Adjustments (2) | | RenaissanceRe Consolidated |
| Comprehensive loss | | | | | | | | | |
| Net loss | $ | (57,235 | ) | | $ | (87,117 | ) | | $ | (70,350 | ) | | $ | 124,310 |
| | $ | (90,392 | ) |
| Change in net unrealized gains on investments | — |
| | — |
| | (7,991 | ) | | — |
| | (7,991 | ) |
| Portion of other-than-temporary impairments recognized in other comprehensive loss | — |
| | — |
| | (78 | ) | | — |
| | (78 | ) |
| Comprehensive loss | (57,235 | ) | | (87,117 | ) | | (78,419 | ) | | 124,310 |
| | (98,461 | ) |
| Net loss attributable to noncontrolling interests | — |
| | — |
| | 33,157 |
| | — |
| | 33,157 |
|
| Change in net unrealized gains on fixed maturity investments available for sale attributable to noncontrolling interests | — |
| | — |
| | 6 |
| | — |
| | 6 |
|
| Comprehensive loss attributable to noncontrolling interests | — |
| | — |
| | 33,163 |
| | — |
| | 33,163 |
|
| Comprehensive loss attributable to RenaissanceRe | $ | (57,235 | ) | | $ | (87,117 | ) | | $ | (45,256 | ) | | $ | 124,310 |
| | $ | (65,298 | ) |
| |
| (1) | Includes all other subsidiaries of RenaissanceRe Holdings Ltd. and eliminations. |
| |
| (2) | Includes Parent Guarantor and Subsidiary Issuer consolidating adjustments. |
|
| | | | | | | | | | | | | | | | | | | |
Condensed Consolidating Statement of Operations
for the year ended December 31, 2010 | RenaissanceRe Holdings Ltd. (Parent Guarantor) | | RenRe North America Holdings Inc. (Subsidiary Issuer) | | Other RenaissanceRe Holdings Ltd. Subsidiaries and Eliminations (Non-guarantor Subsidiaries) (1) | | Consolidating Adjustments (2) | | RenaissanceRe Consolidated |
| Revenues | | | | | | | | | |
| Net premiums earned | $ | — |
| | $ | — |
| | $ | 864,921 |
| | $ | — |
| | $ | 864,921 |
|
| Net investment income | 16,101 |
| | 914 |
| | 186,981 |
| | (41 | ) | | 203,955 |
|
| Net foreign exchange losses | (523 | ) | | — |
| | (16,603 | ) | | — |
| | (17,126 | ) |
| Equity in losses of other ventures | — |
| | — |
| | (11,814 | ) | | — |
| | (11,814 | ) |
| Other income | 631 |
| | — |
| | 40,489 |
| | — |
| | 41,120 |
|
| Net realized and unrealized gains (losses) on investments | 10,107 |
| | (2,432 | ) | | 136,769 |
| | — |
| | 144,444 |
|
| Net other-than-temporary impairments | — |
| | — |
| | (829 | ) | | — |
| | (829 | ) |
| Total revenues | 26,316 |
| | (1,518 | ) | | 1,199,914 |
| | (41 | ) | | 1,224,671 |
|
| Expenses | | | | | | | | | |
| Net claims and claim expenses incurred | — |
| | — |
| | 129,345 |
| | — |
| | 129,345 |
|
| Acquisition expenses | — |
| | — |
| | 94,961 |
| | — |
| | 94,961 |
|
| Operational expenses | (3,819 | ) | | 5,014 |
| | 164,847 |
| | — |
| | 166,042 |
|
| Corporate expenses | 13,022 |
| | 199 |
| | 6,915 |
| | — |
| | 20,136 |
|
| Interest expense | 15,464 |
| | 14,518 |
| | 1,510 |
| | (9,663 | ) | | 21,829 |
|
| Total expenses | 24,667 |
| | 19,731 |
| | 397,578 |
| | (9,663 | ) | | 432,313 |
|
| Income (loss) before equity in net loss of subsidiaries and taxes | 1,649 |
| | (21,249 | ) | | 802,336 |
| | 9,622 |
| | 792,358 |
|
| Equity in net income (loss) of subsidiaries | 744,492 |
| | (66,323 | ) | | — |
| | (678,169 | ) | | — |
|
| Income (loss) from continuing operations before taxes | 746,141 |
| | (87,572 | ) | | 802,336 |
| | (668,547 | ) | | 792,358 |
|
| Income tax (expense) benefit | (1,410 | ) | | 20,733 |
| | (13,199 | ) | | — |
| | 6,124 |
|
| Income (loss) from continuing operations | 744,731 |
| | (66,839 | ) | | 789,137 |
| | (668,547 | ) | | 798,482 |
|
| Loss from discontinued operations | — |
| | 62,670 |
| | — |
| | — |
| | 62,670 |
|
| Net income (loss) | 744,731 |
| | (4,169 | ) | | 789,137 |
| | (668,547 | ) | | 861,152 |
|
| Net income attributable to redeemable noncontrolling interest – DaVinciRe | — |
| | — |
| | (116,421 | ) | | — |
| | (116,421 | ) |
| Net income (loss) available (attributable) to RenaissanceRe | 744,731 |
| | (4,169 | ) | | 672,716 |
| | (668,547 | ) | | 744,731 |
|
| Dividends on preference shares | (42,118 | ) | | — |
| | — |
| | — |
| | (42,118 | ) |
| Net income (loss) available (attributable) to RenaissanceRe common shareholders | $ | 702,613 |
| | $ | (4,169 | ) | | $ | 672,716 |
| | $ | (668,547 | ) | | $ | 702,613 |
|
| |
| (1) | Includes all other subsidiaries of RenaissanceRe Holdings Ltd. and eliminations. |
| |
| (2) | Includes Parent Guarantor and Subsidiary Issuer consolidating adjustments. |
|
| | | | | | | | | | | | | | | | | | | |
| Condensed Consolidating Statement of Comprehensive Income (Loss) for the year ended December 31, 2010 | RenaissanceRe Holdings Ltd. (Parent Guarantor) | | RenRe North America Holdings Inc. (Subsidiary Issuer) | | Other RenaissanceRe Holdings Ltd. Subsidiaries and Eliminations (Non-guarantor Subsidiaries) (1) | | Consolidating Adjustments (2) | | RenaissanceRe Consolidated |
| Comprehensive income (loss) | | | | | | | | | |
| Net income (loss) | $ | 744,731 |
| | $ | (4,169 | ) | | $ | 789,137 |
| | $ | (668,547 | ) | | $ | 861,152 |
|
| Change in net unrealized gains on investments | — |
| | — |
| | (25,040 | ) | | — |
| | (25,040 | ) |
| Portion of other-than-temporary impairments recognized in other comprehensive loss | — |
| | — |
| | (2 | ) | | — |
| | (2 | ) |
| Comprehensive income (loss) | 744,731 |
| | (4,169 | ) | | 764,095 |
| | (668,547 | ) | | 836,110 |
|
| Net income attributable to noncontrolling interests | — |
| | — |
| | (116,421 | ) | | — |
| | (116,421 | ) |
| Change in net unrealized gains on fixed maturity investments available for sale attributable to noncontrolling interests | — |
| | — |
| | 3,427 |
| | — |
| | 3,427 |
|
| Comprehensive income attributable to noncontrolling interests | — |
| | — |
| | (112,994 | ) | | — |
| | (112,994 | ) |
| Comprehensive income attributable to RenaissanceRe | $ | 744,731 |
| | $ | (4,169 | ) | | $ | 651,101 |
| | $ | (668,547 | ) | | $ | 723,116 |
|
| |
| (1) | Includes all other subsidiaries of RenaissanceRe Holdings Ltd. and eliminations. |
| |
| (2) | Includes Parent Guarantor and Subsidiary Issuer consolidating adjustments. |
|
| | | | | | | | | | | | | | | |
Condensed Consolidating Statement of Cash Flows
for the year ended December 31, 2012 | RenaissanceRe Holdings Ltd. (Parent Guarantor) | | RenRe North America Holdings Inc. (Subsidiary Issuer) | | Other RenaissanceRe Holdings Ltd. Subsidiaries and Eliminations (Non-guarantor Subsidiaries) (1) | | RenaissanceRe Consolidated |
| Cash flows provided by (used in) operating activities | | | | | | | |
| Net cash provided by (used in) operating activities | $ | 128,567 |
| | $ | (10,376 | ) | | $ | 598,738 |
| | $ | 716,929 |
|
| Cash flows provided by (used in) investing activities | | | | | | | |
| Proceeds from sales and maturities of fixed maturity investments trading | 744,211 |
| | 140,626 |
| | 7,308,030 |
| | 8,192,867 |
|
| Purchases of fixed maturity investments trading | (692,783 | ) | | (73,800 | ) | | (7,769,655 | ) | | (8,536,238 | ) |
| Proceeds from sales and maturities of fixed maturity investments available for sale | — |
| | — |
| | 65,168 |
| | 65,168 |
|
| Net (purchases) sales of short term investments | (80,485 | ) | | (10,624 | ) | | 159,886 |
| | 68,777 |
|
| Net sales of other investments | — |
| | — |
| | 150,828 |
| | 150,828 |
|
| Net purchases of other assets | — |
| | — |
| | (4,079 | ) | | (4,079 | ) |
| Dividends and return of capital from subsidiaries | 979,311 |
| | 9,541 |
| | (988,852 | ) | | — |
|
| Contributions to subsidiaries | (366,210 | ) | | (50,000 | ) | | 416,210 |
| | — |
|
| Due (from) to subsidiary | (15,359 | ) | | 241 |
| | 15,118 |
| | — |
|
| Net payments related to sale of discontinued operations | — |
| | (9,000 | ) | | — |
| | (9,000 | ) |
| Net cash provided by (used in) investing activities | 568,685 |
| | 6,984 |
| | (647,346 | ) | | (71,677 | ) |
| Cash flows used in financing activities | | | | | | | |
| Dividends paid – RenaissanceRe common shares | (53,356 | ) | | — |
| | — |
| | (53,356 | ) |
| Dividends paid – preference shares | (34,895 | ) | | — |
| | — |
| | (34,895 | ) |
| RenaissanceRe common share repurchases | (463,309 | ) | | — |
| | — |
| | (463,309 | ) |
| Net drawdown of debt | — |
| | — |
| | (1,937 | ) | | (1,937 | ) |
| Redemption of preference shares | (150,000 | ) | | — |
| | — |
| | (150,000 | ) |
| Third party DaVinciRe share transactions | — |
| | — |
| | 164,927 |
| | 164,927 |
|
| Net cash used in financing activities | (701,560 | ) | | — |
| | 162,990 |
| | (538,570 | ) |
| Effect of exchange rate changes on foreign currency cash | — |
| | — |
| | 1,692 |
| | 1,692 |
|
| Net (decrease) increase in cash and cash equivalents | (4,308 | ) | | (3,392 | ) | | 116,074 |
| | 108,374 |
|
| Cash and cash equivalents, beginning of period | 10,606 |
| | 4,920 |
| | 201,458 |
| | 216,984 |
|
| Cash and cash equivalents, end of period | $ | 6,298 |
| | $ | 1,528 |
| | $ | 317,532 |
| | $ | 325,358 |
|
| |
| (1) | Includes all other subsidiaries of RenaissanceRe Holdings Ltd. and eliminations. |
|
| | | | | | | | | | | | | | | |
Condensed Consolidating Statement of Cash Flows
for the year ended December 31, 2011 | RenaissanceRe Holdings Ltd. (Parent Guarantor) | | RenRe North America Holdings Inc. (Subsidiary Issuer) | | Other RenaissanceRe Holdings Ltd. Subsidiaries and Eliminations (Non-guarantor Subsidiaries) (1) | | RenaissanceRe Consolidated |
| Cash flows (used in) provided by operating activities | | | | | | | |
| Net cash (used in) provided by operating activities | $ | (58,721 | ) | | $ | (56,438 | ) | | $ | 281,092 |
| | $ | 165,933 |
|
| Cash flows provided by investing activities | | | | | | | |
| Proceeds from sales and maturities of fixed maturity investments trading | 532,864 |
| | 221,189 |
| | 5,335,415 |
| | 6,089,468 |
|
| Purchases of fixed maturity investments trading | (684,951 | ) | | (322,318 | ) | | (5,264,354 | ) | | (6,271,623 | ) |
| Proceeds from sales and maturities of fixed maturity investments available for sale | — |
| | — |
| | 106,362 |
| | 106,362 |
|
| Purchases of fixed maturity investments available for sale | — |
| | — |
| | (4,107 | ) | | (4,107 | ) |
| Net purchases of equity investments trading | — |
| | — |
| | (47,995 | ) | | (47,995 | ) |
| Net (purchases) sales of short term investments | (6,014 | ) | | 9,184 |
| | 99,978 |
| | 103,148 |
|
| Net sales of other investments | 102,717 |
| | — |
| | (51,777 | ) | | 50,940 |
|
| Net purchases of investments in other ventures | — |
| | — |
| | (39,000 | ) | | (39,000 | ) |
| Net sales of other assets | — |
| | — |
| | 58,318 |
| | 58,318 |
|
| Dividends and return of capital from subsidiaries | 945,195 |
| | 9,306 |
| | (954,501 | ) | | — |
|
| Contributions to subsidiaries | (272,366 | ) | | (8,294 | ) | | 280,660 |
| | — |
|
| Due to (from) subsidiaries | 6,059 |
| | 3,780 |
| | (9,839 | ) | | — |
|
| Net proceeds from sale of discontinued operations | — |
| | 269,520 |
| | — |
| | 269,520 |
|
| Net cash provided by investing activities | 623,504 |
| | 182,367 |
| | (490,840 | ) | | 315,031 |
|
| Cash flows used in financing activities | | | | | | | |
| Dividends paid – RenaissanceRe common shares | (53,460 | ) | | — |
| | — |
| | (53,460 | ) |
| Dividends paid – preference shares | (35,000 | ) | | — |
| | — |
| | (35,000 | ) |
| RenaissanceRe common share repurchases | (191,619 | ) | | — |
| | — |
| | (191,619 | ) |
| Net repayment of debt | (277,512 | ) | | (124,949 | ) | | 202,461 |
| | (200,000 | ) |
| Third party DaVinciRe share transactions | — |
| | — |
| | (62,157 | ) | | (62,157 | ) |
| Net cash used in financing activities | (557,591 | ) | | (124,949 | ) | | 140,304 |
| | (542,236 | ) |
| Effect of exchange rate changes on foreign currency cash | — |
| | — |
| | 518 |
| | 518 |
|
| Net increase (decrease) in cash and cash equivalents | 7,192 |
| | 980 |
| | (68,926 | ) | | (60,754 | ) |
| Cash and cash equivalents, beginning of period | 3,414 |
| | 3,940 |
| | 270,384 |
| | 277,738 |
|
| Cash and cash equivalents, end of period | $ | 10,606 |
| | $ | 4,920 |
| | $ | 201,458 |
| | $ | 216,984 |
|
| |
| (1) | Includes all other subsidiaries of RenaissanceRe Holdings Ltd. and eliminations. |
|
| | | | | | | | | | | | | | | |
Condensed Consolidating Statement of Cash Flows
for the year ended December 31, 2010 | RenaissanceRe Holdings Ltd. (Parent Guarantor) | | RenRe North America Holdings Inc. (Subsidiary Issuer) | | Other RenaissanceRe Holdings Ltd. Subsidiaries and Eliminations (Non-guarantor Subsidiaries) (1) | | RenaissanceRe Consolidated |
| Cash flows (used in) provided by operating activities | | | | | | | |
| Net cash (used in) provided by operating activities | $ | (112,852 | ) | | $ | (7,561 | ) | | $ | 615,133 |
| | $ | 494,720 |
|
| Cash flows provided by (used in) investing activities | | | | | | | |
| Proceeds from sales and maturities of investments available for sale | 37,457 |
| | 244,147 |
| | 3,470,065 |
| | 3,751,669 |
|
| Purchases of investments available for sale | (240 | ) | | (246,570 | ) | | (156,850 | ) | | (403,660 | ) |
| Proceeds from sales and maturities of investments trading | 528,662 |
| | — |
| | 7,266,925 |
| | 7,795,587 |
|
| Purchases of investments trading | (610,276 | ) | | — |
| | (10,512,547 | ) | | (11,122,823 | ) |
| Net sales (purchases) of short term investments | 16,339 |
| | (12,150 | ) | | (30,941 | ) | | (26,752 | ) |
| Net (purchases) sales of other investments | (3,814 | ) | | — |
| | 125,879 |
| | 122,065 |
|
| Net purchases of investments in other ventures | — |
| | — |
| | (1,915 | ) | | (1,915 | ) |
| Net purchases of other assets | — |
| | — |
| | (5,561 | ) | | (5,561 | ) |
| Dividends and return of capital from subsidiaries | 941,878 |
| | 11,676 |
| | (953,554 | ) | | — |
|
| Contributions to subsidiaries | (301,555 | ) | | (47,493 | ) | | 349,048 |
| | — |
|
| Due to (from) subsidiary | 23,329 |
| | (312 | ) | | (23,017 | ) | | — |
|
| Net cash provided by (used in) investing activities | 631,780 |
| | (50,702 | ) | | (472,468 | ) | | 108,610 |
|
| Cash flows (used in) provided by financing activities | | | | | | | |
| Dividends paid – RenaissanceRe common shares | (55,936 | ) | | — |
| | — |
| | (55,936 | ) |
| Dividends paid – preference shares | (42,118 | ) | | — |
| | — |
| | (42,118 | ) |
| RenaissanceRe common share repurchases | (448,882 | ) | | — |
| | — |
| | (448,882 | ) |
| Return of additional paid in capital to parent company | — |
| | (239,599 | ) | | 239,599 |
| | — |
|
| Net issuance (repayment) of debt | 253,512 |
| | 294,196 |
| | (298,662 | ) | | 249,046 |
|
| Redemption of 7.30% Series B preference shares | (100,000 | ) | | — |
| | — |
| | (100,000 | ) |
| Third party investment in noncontrolling interest | — |
| | — |
| | 3,000 |
| | 3,000 |
|
| Third party DaVinciRe share repurchases | (136,702 | ) | | — |
| | — |
| | (136,702 | ) |
| Net cash (used in) provided by financing activities | (530,126 | ) | | 54,597 |
| | (56,063 | ) | | (531,592 | ) |
| Effect of exchange rate changes on foreign currency cash | (594 | ) | | — |
| | (409 | ) | | (1,003 | ) |
| Net (decrease) increase in cash and cash equivalents | (11,792 | ) | | (3,666 | ) | | 86,193 |
| | 70,735 |
|
| Net decrease in cash and cash equivalents of discontinued operations | — |
| | — |
| | 3,891 |
| | 3,891 |
|
| Cash and cash equivalents, beginning of year | 15,206 |
| | 7,606 |
| | 180,300 |
| | 203,112 |
|
| Cash and cash equivalents, end of year | $ | 3,414 |
| | $ | 3,940 |
| | $ | 270,384 |
| | $ | 277,738 |
|
| |
| (1) | Includes all other subsidiaries of RenaissanceRe Holdings Ltd. and eliminations. |
NOTE 23. SUBSEQUENT EVENTS
During January 2013, DaVinciRe redeemed shares from certain DaVinciRe shareholders while certain other DaVinciRe shareholders purchased additional shares in DaVinciRe. The net redemption as a result of these transactions was $150.0 million. In connection with the redemptions, DaVinciRe retained a $20.5 million holdback. The Company's ownership in DaVinciRe was 30.8% at December 31, 2012 and subsequent to the above transactions, the Company's ownership in DaVinciRe increased to 32.9% effective January 1, 2013.
Effective January 1, 2013, the Company formed and launched a managed joint venture, Upsilon Re II, a Bermuda domiciled SPI, to provide additional capacity to the worldwide aggregate and per-occurrence retrocessional property catastrophe excess of loss market for the 2013 underwriting year. Original business will be written directly by Upsilon Re II and included $53.5 million of gross premiums written incepting January 1, 2013 under fully-collateralized reinsurance contracts. In conjunction with the formation and launch of Upsilon Re II, $61.0 million of Upsilon Re II non-voting Class B shares were sold to external investors. Additionally, $76.4 million of the non-voting Class B shares were acquired by the Company, representing a 55.6% ownership interest in Upsilon Re II. The Class B shareholders participate in substantially all of the profits or losses of Upsilon Re II while the Class B shares remain outstanding. The holders of Class B shares indemnify Upsilon Re II against losses relating to insurance risk and therefore these shares have been accounted for as prospective reinsurance under FASB ASC Topic Financial Services - Insurance. In addition, another third party investor supplied $17.5 million of capital through an insurance contract with the Company related to Upsilon Re II's reinsurance portfolio. Inclusive of the insurance contract, the Company has a 42.9% participation in the original risks assumed by Upsilon Re II. Both Upsilon Re II and the insurance contract are managed by RUM in return for an expense override, as well as a potential underwriting profit commission. Upsilon Re II is considered a VIE and the Company is considered the primary beneficiary. As a result, Upsilon Re II will be consolidated by the Company and all significant inter-company transactions will be eliminated.
The Company repaid the full $100.0 million of its outstanding 5.875% Senior Notes upon their scheduled maturity of February 15, 2013 using available cash and investments.
Subsequent to December 31, 2012 and through the period ending February 20, 2013, the Company repurchased 1.4 million common shares in open market transactions at an aggregate cost of $111.3 million and at an average share price of $81.29.
On February 20, 2013, the Company approved an increase in its authorized share repurchase program to an aggregate amount of $500.0 million. Unless terminated earlier by resolution of the Company's Board of Directors, the program will expire when the Company has repurchased the full value of the shares authorized.
During February 2013, Upsilon Re redeemed a portion of its outstanding third party non-voting Class B shares for $20.5 million as a result of the scheduled expiration of certain risks underwritten by Upsilon Re, subject to a holdback for development of claims and claim expenses. Following the redemption, third-party non-voting Class B Shares with a GAAP book value of $2.2 million as at December 31, 2012, remained outstanding. In addition, the Company has authorized the release of $21.9 million of collateral to a third party investor who participated in risks underwritten by ROE related to Upsilon Re through a reinsurance participation.
RENAISSANCERE HOLDINGS LTD. AND SUBSIDIARIES
INDEX TO SCHEDULES TO CONSOLIDATED FINANCIAL STATEMENTS
Schedules other than those listed above are omitted for the reason that they are not applicable.
REPORT OF INDEPENDENT REGISTERED PUBLIC ACCOUNTING FIRM
TO THE BOARD OF DIRECTORS AND SHAREHOLDERS OF RENAISSANCERE HOLDINGS LTD.
We have audited the consolidated financial statements of RenaissanceRe Holdings Ltd. as of December 31, 2012 and 2011, and for each of the three years in the period ended December 31, 2012, and have issued our report thereon dated February 21, 2013 included elsewhere in this Annual Report on Form 10-K. Our audits also included the financial statement schedules listed in Item 15(a) (2) of this Annual Report on Form 10-K for the year ended December 31, 2012. These schedules are the responsibility of the Company's management. Our responsibility is to express an opinion based on our audits.
In our opinion, the financial statement schedules referred to above, when considered in relation to the basic financial statements taken as a whole, present fairly in all material respects the information set forth therein.
/s/ Ernst & Young Ltd.
Hamilton, Bermuda
February 21, 2013
SCHEDULE I
RENAISSANCERE HOLDINGS LTD. AND SUBSIDIARIES
SUMMARY OF INVESTMENTS
OTHER THAN INVESTMENTS IN RELATED PARTIES
(THOUSANDS OF UNITED STATES DOLLARS)
|
| | | | | | | | | | | |
| | December 31, 2012 |
| | Amortized Cost | | Market Value | | Amount at which shown in the Balance Sheet |
| Type of investment: | | | | | |
| Fixed maturity investments | | | | | |
| U.S. treasuries | $ | 1,256,607 |
| | $ | 1,259,800 |
| | $ | 1,259,800 |
|
| Agencies | 312,749 |
| | 315,154 |
| | 315,154 |
|
| Non-U.S. government (Sovereign debt) | 128,207 |
| | 133,198 |
| | 133,198 |
|
| Non-U.S. government-backed corporate | 343,924 |
| | 349,514 |
| | 349,514 |
|
| Corporate | 1,552,194 |
| | 1,615,207 |
| | 1,615,207 |
|
| Agency mortgage-backed | 404,423 |
| | 408,531 |
| | 408,531 |
|
| Non-agency mortgage-backed | 232,317 |
| | 248,339 |
| | 248,339 |
|
| Commercial mortgage-backed | 383,176 |
| | 406,166 |
| | 406,166 |
|
| Asset-backed | 12,210 |
| | 12,954 |
| | 12,954 |
|
| Total fixed maturity investments | $ | 4,625,807 |
| | 4,748,863 |
| | 4,748,863 |
|
| Short term investments | | | 821,163 |
| | 821,163 |
|
| Equity investments | | | 58,186 |
| | 58,186 |
|
| Other investments | | | 644,711 |
| | 644,711 |
|
| Investments in other ventures, under equity method | | | 87,724 |
| | 87,724 |
|
| Total investments | | | $ | 6,360,647 |
| | $ | 6,360,647 |
|
SCHEDULE II
RENAISSANCERE HOLDINGS LTD.
CONDENSED FINANCIAL INFORMATION OF REGISTRANT
RENAISSANCERE HOLDINGS LTD.
BALANCE SHEETS
AT DECEMBER 31, 2012 AND 2011
(PARENT COMPANY)
(THOUSANDS OF UNITED STATES DOLLARS)
|
| | | | | | | |
| | At December 31, |
| | 2012 | | 2011 |
| Assets | | | |
| Fixed maturity investments trading, at fair value (Amortized cost $324,160 and $421,278 at December 31, 2012 and 2011, respectively) | $ | 337,376 |
| | $ | 430,007 |
|
| Short term investments, at fair value | 234,763 |
| | 163,966 |
|
| Total investments | 572,139 |
| | 593,973 |
|
| Cash and cash equivalents | 6,298 |
| | 10,606 |
|
| Investments in subsidiaries | 2,864,793 |
| | 2,776,997 |
|
| Due from subsidiaries | 32,467 |
| | 17,108 |
|
| Dividends due from subsidiaries | 20,829 |
| | 154,961 |
|
| Accrued investment income | 2,535 |
| | 4,106 |
|
| Other assets | 175,105 |
| | 206,171 |
|
| Total Assets | $ | 3,674,166 |
| | $ | 3,763,922 |
|
| Liabilities and Shareholders' Equity | | | |
| Liabilities | | | |
| Notes and bank loans payable | $ | 100,000 |
| | $ | 100,000 |
|
| Contributions due to subsidiaries | 11,371 |
| | 30,519 |
|
| Other liabilities | 59,730 |
| | 28,210 |
|
| Total Liabilities | 171,101 |
| | 158,729 |
|
| Shareholders' Equity | | | |
| Preference Shares: $1.00 par value – 16,000,000 shares issued and outstanding at December 31, 2012 (2011 – 22,000,000 shares) | 400,000 |
| | 550,000 |
|
| Common Shares: $1.00 par value – 45,542,203 shares issued and outstanding at December 31, 2012 (2011 – 51,542,955 shares) | 45,542 |
| | 51,543 |
|
| Accumulated other comprehensive income | 13,622 |
| | 11,760 |
|
| Retained earnings | 3,043,901 |
| | 2,991,890 |
|
| Total Shareholders' Equity | 3,503,065 |
| | 3,605,193 |
|
| Total Liabilities and Shareholders' Equity | $ | 3,674,166 |
| | $ | 3,763,922 |
|
SCHEDULE II
RENAISSANCERE HOLDINGS LTD.
CONDENSED FINANCIAL INFORMATION OF REGISTRANT – CONTINUED
RENAISSANCERE HOLDINGS LTD.
STATEMENTS OF OPERATIONS
FOR THE YEARS ENDED DECEMBER 31, 2012, 2011 AND 2010
(PARENT COMPANY)
(THOUSANDS OF UNITED STATES DOLLARS)
|
| | | | | | | | | | | |
| | Year ended December 31, |
| | 2012 | | 2011 | | 2010 |
| Revenues | | | | | |
| Net investment income | $ | 14,305 |
| | $ | 20,845 |
| | $ | 16,101 |
|
| Net foreign exchange gains (losses) | 33 |
| | 112 |
| | (523 | ) |
| Other income (loss) | 2,822 |
| | (11 | ) | | 631 |
|
| Net realized and unrealized gains on investments | 14,752 |
| | 11,377 |
| | 10,107 |
|
| Total revenues | 31,912 |
| | 32,323 |
| | 26,316 |
|
| Expenses | | | | | |
| Interest expense | 5,875 |
| | 10,472 |
| | 15,464 |
|
| Operating and corporate expenses | 9,179 |
| | 6,644 |
| | 9,203 |
|
| Total expenses | 15,054 |
| | 17,116 |
| | 24,667 |
|
| Income before equity in net income (losses) of subsidiaries and taxes | 16,858 |
| | 15,207 |
| | 1,649 |
|
| Equity in net income (losses) of subsidiaries | 584,051 |
| | (73,066 | ) | | 744,492 |
|
| Income (loss) before taxes | 600,909 |
| | (57,859 | ) | | 746,141 |
|
| Income tax benefit (expense) | — |
| | 624 |
| | (1,410 | ) |
| Net income (loss) | 600,909 |
| | (57,235 | ) | | 744,731 |
|
| Dividends on preference shares | (34,895 | ) | | (35,000 | ) | | (42,118 | ) |
| Net income (loss) available (attributable) to RenaissanceRe common shareholders | $ | 566,014 |
| | $ | (92,235 | ) | | $ | 702,613 |
|
RENAISSANCERE HOLDINGS LTD.
STATEMENTS OF COMPREHENSIVE INCOME (LOSS)
FOR THE YEARS ENDED DECEMBER 31, 2012, 2011 AND 2010
(PARENT COMPANY)
(THOUSANDS OF UNITED STATES DOLLARS)
|
| | | | | | | | | | | |
| | Year ended December 31, |
| | 2012 | | 2011 | | 2010 |
| Comprehensive income (loss) | | | | | |
| Net income (loss) | $ | 600,909 |
| | $ | (57,235 | ) | | $ | 744,731 |
|
| Comprehensive income (loss) attributable to RenaissanceRe | $ | 600,909 |
| | $ | (57,235 | ) | | $ | 744,731 |
|
SCHEDULE II
RENAISSANCERE HOLDINGS LTD.
CONDENSED FINANCIAL INFORMATION OF REGISTRANT – CONTINUED
RENAISSANCERE HOLDINGS LTD.
STATEMENTS OF CASH FLOWS
FOR THE YEARS ENDED DECEMBER 31, 2012, 2011 AND 2010
(PARENT COMPANY)
(THOUSANDS OF UNITED STATES DOLLARS)
|
| | | | | | | | | | | |
| | Year ended December 31, |
| | 2012 | | 2011 | | 2010 |
| Cash flows provided by (used in) operating activities: | | | | | |
| Net income (loss) | $ | 600,909 |
| | $ | (57,235 | ) | | $ | 744,731 |
|
| Less: equity in net (income) loss of subsidiaries | (584,051 | ) | | 73,066 |
| | (744,492 | ) |
| | 16,858 |
| | 15,831 |
| | 239 |
|
| Adjustments to reconcile net income (loss) to net cash provided by (used in) operating activities | | | | | |
| Net unrealized losses (gains) included in net investment income | 348 |
| | (1,696 | ) | | (4,462 | ) |
| Net unrealized (gains) losses included in other (loss) income | (193 | ) | | 304 |
| | (267 | ) |
| Net realized and unrealized gains on investments | (14,752 | ) | | (11,377 | ) | | (10,107 | ) |
| Other | 126,306 |
| | (61,783 | ) | | (98,255 | ) |
| Net cash provided by (used in) operating activities | 128,567 |
| | (58,721 | ) | | (112,852 | ) |
| Cash flows provided by investing activities: | | | | | |
| Proceeds from maturities and sales of fixed maturity investments trading | 744,211 |
| | 532,864 |
| | 528,662 |
|
| Purchases of fixed maturity investments trading | (692,783 | ) | | (684,951 | ) | | (610,276 | ) |
| Proceeds from maturities and sales of fixed maturity investments available for sale | — |
| | — |
| | 37,457 |
|
| Purchases of fixed maturity investments available for sale | — |
| | — |
| | (240 | ) |
| Contributions to subsidiaries | (366,210 | ) | | (272,366 | ) | | (301,555 | ) |
| Dividends and return of capital from subsidiaries | 979,311 |
| | 945,195 |
| | 941,878 |
|
| Net (purchases) sales of short term investments | (80,485 | ) | | (6,014 | ) | | 16,339 |
|
| Net sales (purchases) of other investments | — |
| | 102,717 |
| | (3,814 | ) |
| Due (from) to subsidiary | (15,359 | ) | | 6,059 |
| | 23,329 |
|
| Net cash provided by investing activities | 568,685 |
| | 623,504 |
| | 631,780 |
|
| Cash flows used in financing activities: | | | | | |
| Dividends paid – RenaissanceRe common shares | (53,356 | ) | | (53,460 | ) | | (55,936 | ) |
| Dividends paid – preference shares | (34,895 | ) | | (35,000 | ) | | (42,118 | ) |
| RenaissanceRe common share repurchases | (463,309 | ) | | (191,619 | ) | | (448,882 | ) |
| Redemption of preference shares | (150,000 | ) | | — |
| | (100,000 | ) |
| Net (repayment) issuance of debt | — |
| | (277,512 | ) | | 253,512 |
|
| Third party DaVinciRe share repurchases | — |
| | — |
| | (136,702 | ) |
| Net cash used in financing activities | (701,560 | ) | | (557,591 | ) | | (530,126 | ) |
| Effect of exchange rate changes on foreign currency cash | — |
| | — |
| | (594 | ) |
| Net (decrease) increase in cash and cash equivalents | (4,308 | ) | | 7,192 |
| | (11,792 | ) |
| Cash and cash equivalents, beginning of year | 10,606 |
| | 3,414 |
| | 15,206 |
|
| Cash and cash equivalents, end of year | $ | 6,298 |
| | $ | 10,606 |
| | $ | 3,414 |
|
SCHEDULE III
RENAISSANCERE HOLDINGS LTD. AND SUBSIDIARIES
SUPPLEMENTARY INSURANCE INFORMATION
(THOUSANDS OF UNITED STATES DOLLARS)
|
| | | | | | | | | | | | | | | | | | | | | | | | | | | | | | | | | | | |
| | December 31, 2012 | | Year ended December 31, 2012 |
| | Deferred Policy Acquisition Costs | | Future Policy Benefits, Losses, Claims and Loss Expenses | | Unearned Premiums | | Premium Revenue | | Net Investment Income | | Benefits, Claims, Losses and Settlement Expenses | | Amortization of Deferred Policy Acquisition Costs | | Other Operating Expenses | | Net Written Premiums |
| Reinsurance | $ | 43,316 |
| | $ | 1,662,571 |
| | $ | 345,514 |
| | $ | 946,423 |
| | $ | — |
| | $ | 242,022 |
| | $ | 90,491 |
| | $ | 132,935 |
| | $ | 967,587 |
|
| Lloyd's | 9,306 |
| | 149,470 |
| | 54,003 |
| | 122,968 |
| | — |
| | 80,242 |
| | 22,864 |
| | 45,680 |
| | 135,131 |
|
| Other | — |
| | 67,336 |
| | — |
| | (36 | ) | | 167,375 |
| | 2,947 |
| | 187 |
| | 686 |
| | (61 | ) |
| Total | $ | 52,622 |
| | $ | 1,879,377 |
| | $ | 399,517 |
| | $ | 1,069,355 |
| | $ | 167,375 |
| | $ | 325,211 |
| | $ | 113,542 |
| | $ | 179,301 |
| | $ | 1,102,657 |
|
| | | | | | | | | | | | | | | | | | |
| | December 31, 2011 | | Year ended December 31, 2011 |
| | Deferred Policy Acquisition Costs | | Future Policy Benefits, Losses, Claims and Loss Expenses | | Unearned Premiums | | Premium Revenue | | Net Investment Income | | Benefits, Claims, Losses and Settlement Expenses | | Amortization of Deferred Policy Acquisition Costs | | Other Operating Expenses | | Net Written Premiums |
| Reinsurance | $ | 34,923 |
| | $ | 1,813,526 |
| | $ | 301,845 |
| | $ | 873,088 |
| | $ | — |
| | $ | 783,704 |
| | $ | 82,978 |
| | $ | 131,251 |
| | $ | 913,499 |
|
| Lloyd's | 8,039 |
| | 87,495 |
| | 43,367 |
| | 76,386 |
| | — |
| | 73,259 |
| | 14,031 |
| | 36,732 |
| | 98,617 |
|
| Other | 759 |
| | 91,333 |
| | 2,443 |
| | 1,575 |
| | 118,000 |
| | 4,216 |
| | 367 |
| | 1,683 |
| | 657 |
|
| Total | $ | 43,721 |
| | $ | 1,992,354 |
| | $ | 347,655 |
| | $ | 951,049 |
| | $ | 118,000 |
| | $ | 861,179 |
| | $ | 97,376 |
| | $ | 169,666 |
| | $ | 1,012,773 |
|
| | | | | | | | | | | | | | | | | | |
| | December 31, 2010 | | Year ended December 31, 2010 |
| | Deferred Policy Acquisition Costs | | Future Policy Benefits, Losses, Claims and Loss Expenses | | Unearned Premiums | | Premium Revenue | | Net Investment Income | | Benefits, Claims, Losses and Settlement Expenses | | Amortization of Deferred Policy Acquisition Costs | | Other Operating Expenses | | Net Written Premiums |
| Reinsurance | $ | 31,685 |
| | $ | 1,130,670 |
| | $ | 264,113 |
| | $ | 838,790 |
| | $ | — |
| | $ | 113,804 |
| | $ | 77,954 |
| | $ | 129,990 |
| | $ | 809,719 |
|
| Lloyd's | 3,585 |
| | 20,031 |
| | 21,162 |
| | 50,204 |
| | — |
| | 25,676 |
| | 10,784 |
| | 24,837 |
| | 61,189 |
|
| Other | 378 |
| | 107,142 |
| | 908 |
| | (24,073 | ) | | 203,955 |
| | (10,135 | ) | | 6,223 |
| | 11,215 |
| | (21,943 | ) |
| Total | $ | 35,648 |
| | $ | 1,257,843 |
| | $ | 286,183 |
| | $ | 864,921 |
| | $ | 203,955 |
| | $ | 129,345 |
| | $ | 94,961 |
| | $ | 166,042 |
| | $ | 848,965 |
|
SCHEDULE IV
RENAISSANCERE HOLDINGS LTD. AND SUBSIDIARIES
SUPPLEMENTAL SCHEDULE OF REINSURANCE PREMIUMS
(THOUSANDS OF UNITED STATES DOLLARS)
|
| | | | | | | | | | | | | | | | | | |
| | Gross Amounts | | Ceded to Other Companies | | Assumed From Other Companies | | Net Amount | | Percentage of Amount Assumed to Net |
| Year ended December 31, 2012 | | | | | | | | | |
| Property and liability premiums earned | $ | 34,028 |
| | $ | 430,374 |
| | $ | 1,465,701 |
| | $ | 1,069,355 |
| | 137 | % |
| Year ended December 31, 2011 | | | | | | | | | |
| Property and liability premiums earned | $ | 17,794 |
| | $ | 422,950 |
| | $ | 1,356,205 |
| | $ | 951,049 |
| | 143 | % |
| Year ended December 31, 2010 | | | | | | | | | |
| Property and liability premiums earned | $ | 5,329 |
| | $ | 331,783 |
| | $ | 1,191,375 |
| | $ | 864,921 |
| | 138 | % |
SCHEDULE VI
RENAISSANCERE HOLDINGS LTD. AND SUBSIDIARIES
SUPPLEMENTARY INSURANCE INFORMATION CONCERNING
PROPERTY-CASUALTY INSURANCE OPERATIONS
(THOUSANDS OF UNITED STATES DOLLARS)
|
| | | | | | | | | | | | | | | | | | | | | | | |
| Affiliation with Registrant | Deferred Policy Acquisition Costs | | Reserves for Unpaid Claims and Claim Adjustment Expenses | | Discount, if any, Deducted | | Unearned Premiums | | Earned Premiums | | Net Investment Income |
| Consolidated Subsidiaries | | | | | | | | | | | |
| Year ended December 31, 2012 | $ | 52,622 |
| | $ | 1,879,377 |
| | $ | — |
| | $ | 399,517 |
| | $ | 1,069,355 |
| | $ | 167,375 |
|
| Year ended December 31, 2011 | $ | 43,721 |
| | $ | 1,992,354 |
| | $ | — |
| | $ | 347,655 |
| | $ | 951,049 |
| | $ | 118,000 |
|
| Year ended December 31, 2010 | $ | 35,648 |
| | $ | 1,257,843 |
| | $ | — |
| | $ | 286,183 |
| | $ | 864,921 |
| | $ | 203,955 |
|
| | | | | | | | | | | | |
| | Claims and Claim Adjustment Expenses Incurred Related to | | Amortization of Deferred Policy Acquisition Costs | | Paid Claims and Claim Adjustment Expenses | | Net Premiums Written | | |
| Affiliation with Registrant | Current Year | | Prior Year | |
| Consolidated Subsidiaries | | | | | | | | | | | |
| Year ended December 31, 2012 | $ | 483,180 |
| | $ | (157,969 | ) | | $ | 113,542 |
| | $ | 226,671 |
| | $ | 1,102,657 |
| | |
| Year ended December 31, 2011 | $ | 993,168 |
| | $ | (131,989 | ) | | $ | 97,376 |
| | $ | 428,986 |
| | $ | 1,012,773 |
| | |
| Year ended December 31, 2010 | $ | 431,476 |
| | $ | (302,131 | ) | | $ | 94,961 |
| | $ | 233,547 |
| | $ | 848,965 |
| | |
UNITED STATES
SECURITIES AND EXCHANGE COMMISSION
WASHINGTON, D.C. 20549
EXHIBITS
TO
FORM 10-K
Annual Report pursuant to Section 13 or 15(d) of the Securities Exchange Act of 1934 for the fiscal year ended December 31, 2012.
RenaissanceRe Holdings Ltd.
Exhibits
| |
| (a) | Financial Statements, Financial Statement Schedules and Exhibits. |
The Consolidated Financial Statements of RenaissanceRe Holdings Ltd. and related Notes thereto are listed in the accompanying Index to Consolidated Financial Statements and are filed as part of this Form 10-K.
| |
| 2 | Financial Statement Schedules |
The Schedules to the Consolidated Financial Statements of RenaissanceRe Holdings Ltd. are listed in the accompanying Index to Schedules to Consolidated Financial Statements and are filed as a part of this Form 10-K.
| |
| 3.1 | Memorandum of Association. (1) |
| |
| 3.2 | Amended and Restated Bye-Laws. (2) |
| |
| 3.3 | Memorandum of Increase in Share Capital of RenaissanceRe Holdings Ltd. (3) |
| |
| 3.4 | Specimen Common Share certificate. (1) |
| |
| 10.1 | Form of Director Retention Agreement, dated as of November 8, 2002, entered into by each of the non-employee directors of RenaissanceRe Holdings Ltd. (4) |
| |
| 10.2 | Further Amended and Restated Employment Agreement, dated as of February 19, 2009, between RenaissanceRe Holdings Ltd. and Neill A. Currie. (8) |
| |
| 10.3 | Amendment No. 1 to the Further Amended and Restated Employment Agreement, dated January 8, 2010, by and among RenaissanceRe Holdings Ltd. and Neill A. Currie. (9) |
| |
| 10.4 | Employment Agreement, dated as of June 10, 2009, by and between RenaissanceRe Holdings Ltd. and Jeffrey D. Kelly. (11) |
| |
| 10.5 | Memorandum of Agreement by and between the Company and Neill A. Currie, dated February 21, 2012 (5). |
| |
| 10.6 | Amendment No. 1 the Employment Agreement, dated January 8, 2010, by and among RenaissanceRe Holdings Ltd. and Jeffrey D. Kelly. (9) |
| |
| 10.7 | Form of Employment Agreement for Executive Officers. (10) |
| |
| 10.8 | Form of Amendment to Employment Agreement for Executive Officers. (13) |
| |
| 10.9 | Form of Amendment No. 2 to Employment Agreement for Executive Officers. (7) |
| |
| 10.10 | Form of Amendment No. 3 to the Amended and Restated Employment Agreement for Executive Officers. (9) |
| |
| 10.11 | RenaissanceRe Holdings Ltd. 2001 Stock Incentive Plan. (18) |
| |
| 10.12 | Amendment No. 1 to the RenaissanceRe Holdings Ltd. 2001 Stock Incentive Plan. (19) |
| |
| 10.13 | Amendment No. 2 to the RenaissanceRe Holdings Ltd. 2001 Stock Incentive Plan. (19) |
| |
| 10.14 | Amendment No. 3 to the RenaissanceRe Holdings Ltd. 2001 Stock Incentive Plan. (20) |
| |
| 10.15 | Amendment No. 4 to the RenaissanceRe Holdings Ltd. 2001 Stock Incentive Plan. (40) |
| |
| 10.16 | Amendment No. 5 to the RenaissanceRe Holdings Ltd. 2001 Stock Incentive Plan. (37) |
| |
| 10.17 | UK Schedule to the RenaissanceRe Holdings Ltd. 2001 Stock Incentive Plan. (20) |
| |
| 10.18 | UK Sub-Plan to the RenaissanceRe Holdings 2001 Stock Incentive Plan. (20) |
| |
| 10.19 | Form of Option Grant Notice and Agreement pursuant to which option grants are made under the RenaissanceRe Holdings Ltd. 2001 Stock Incentive Plan. (21) |
| |
| 10.20 | Form of Restricted Stock Grant Notice and Agreement pursuant to which Restricted Stock grants are made under the RenaissanceRe Holdings Ltd. 2001 Stock Incentive Plan. (21) |
| |
| 10.21 | RenaissanceRe Holdings Ltd. 2004 Stock Option Incentive Plan. (22) |
| |
| 10.22 | Amendment No. 1 to the RenaissanceRe Holdings Ltd. 2004 Stock Option Incentive Plan. (23) |
| |
| 10.23 | Form of Option Agreement pursuant to which option grants are made under the RenaissanceRe Holdings 2004 Stock Option Incentive Plan to executive officers. (22) |
| |
| 10.24 | Amended and Restated RenaissanceRe Holdings Ltd. Non-Employee Director Stock Plan. (25) |
| |
| 10.25 | Amendment No. 1 to the RenaissanceRe Holdings Ltd. Non-Employee Director Stock Plan. (25) |
| |
| 10.26 | Amendment No. 2 to the RenaissanceRe Holdings Ltd. Non-Employee Director Stock Plan. (26) |
| |
| 10.27 | Amendment No. 3 to the RenaissanceRe Holdings Ltd. Non-Employee Director Stock Plan. (31) |
| |
| 10.28 | Form of Restricted Stock Grant Agreement for Directors. (5) |
| |
| 10.29 | Form of Option Grant Agreement for Directors. (5) |
| |
| 10.30 | Certificate of Designation, Preferences and Rights of 6.08% Series C Preference Shares. (29) |
| |
| 10.31 | Certificate of Designation, Preferences and Rights of 6.60% Series D Preference Shares. (30) |
| |
| 10.32 | Senior Indenture, dated as of July 1, 2001, between RenaissanceRe Holdings Ltd., as Issuer, and Bankers Trust Company, as Trustee. (12) |
| |
| 10.33 | Second Supplemental Indenture, by and between RenaissanceRe Holdings Ltd. and Deutsche Bank Trust Company Americas (f/k/a Bankers Trust Company), dated as of January 31, 2003. (14) |
| |
| 10.34 | Master Reimbursement Agreement, dated as of April 29, 2009, by and between Renaissance Reinsurance Ltd. and Citibank Europe PLC. (20) |
| |
| 10.35 | Pledge Agreement, dated as of April 29, 2009, by and between Renaissance Reinsurance Ltd. and Citibank Europe PLC. (20) |
| |
| 10.36 | Agreement Regarding Use of Aircraft Interest, dated as of November 17, 2009, by and between RenaissanceRe Holdings Ltd. and Neill A. Currie. (42) |
| |
| 10.37 | RenaissanceRe Holdings Ltd. 2010 Restricted Stock Unit Plan. (42) |
| |
| 10.38 | Form of Restricted Stock Unit Agreement, pursuant to which restricted stock unit grants are made under the RenaissanceRe Holdings Ltd. 2010 Restricted Stock Unit Plan. (42) |
| |
| 10.39 | Senior Indenture, dated as of March 17, 2010, among RenRe North America Holdings Inc., as Issuer, RenaissanceRe Holdings Ltd., as Guarantor, and Deutsche Bank Trust Companies America, as Trustee. (33) |
| |
| 10.40 | First Supplemental Indenture, dated as of March 17, 2010, among RenRe North America Holdings Inc., as Insurer, RenaissanceRe Holdings Ltd., as Guarantor, and Deutsche Bank Trust Companies America, as Trustee. (33) |
| |
| 10.41 | Senior Debt Securities Guarantee Agreement, dated as of March 17, 2010, between RenaissanceRe Holdings Ltd., as Guarantor, and Deutsche Bank Trust Companies America, as Guarantee Trustee. (33) |
| |
| 10.42 | Waiver Agreement, dated as of January 21, 2011, by and among RenRe North America Holdings Inc., RenaissanceRe Holdings Ltd. and Deutsche Bank Trust Company Americas, as Trustee. (41) |
| |
| 10.43 | Credit Agreement, dated as of May 17, 2012, by and among RenaissanceRe Holdings Ltd., various banks and financial institutions parties thereto, Wells Fargo Bank, National Association, as Fronting Bank, LC Administrator and Administrative Agent for the Lenders, Citibank, N.A., as Syndication Agent, and Wells Fargo Securities, LLC and Citigroup Global Markets Inc., as Joint Lead Arrangers and Joint Lead Bookrunners (43). |
| |
| 10.44 | Fourth Amended and Restated Reimbursement Agreement, dated as of May 17, 2012, by and among RenaissanceRe Holdings Ltd., Renaissance Reinsurance Ltd., Renaissance Reinsurance of Europe, Glencoe Insurance Ltd., DaVinci Reinsurance Ltd., the banks and financial institutions parties thereto, Wells Fargo Bank, National Association, as issuing bank, administrative agent and collateral agent for the lenders, and certain other agents (43). |
| |
| 10.45 | Form of Letter Agreement with Neill A. Currie Regarding Performance Share Awards. (35) |
| |
| 10.46 | Form of Letter Agreement with the Named Executive Officers Regarding Performance Share Awards. (35) |
| |
| 10.47 | Form of Tax Reimbursement Waiver Letter with the Named Executive Officers. (45) |
| |
| 10.48 | Form of Performance-Based Restricted Stock Grant Notice and Agreement pursuant to which performance-based restricted stock awards are made under the RenaissanceRe Holdings Ltd. 2010 Performance-Based Equity Incentive Plan. (36) |
| |
| 10.49 | Performance-Based Restricted Stock Grant Notice and Agreement under the RenaissanceRe Holdings Ltd. 2010 Performance-Based Equity Incentive Plan, dated June 9, 2010, between RenaissanceRe Holdings Ltd. and Neill A. Currie. (36) |
| |
| 10.50 | Facility Letter, dated September 17, 2010, from Citibank Europe plc to Renaissance Reinsurance Ltd., DaVinci Reinsurance Ltd. and Glencoe Insurance Ltd. (38) |
| |
| 10.51 | Insurance Letters of Credit - Master Agreement, dated September 17, 2010, between Renaissance Reinsurance Ltd. and Citibank Europe plc. DaVinci Reinsurance Ltd. and Glencoe Insurance Ltd. have each entered into an agreement with Citibank Europe plc that is identical to the foregoing agreement, except with respect to party names. (38) |
| |
| 10.52 | Stock Purchase Agreement, dated as of November 18, 2010, by and between RenRe North America Holdings Inc., and QBE Holdings Inc. (39) |
| |
| 10.53 | Memorandum of Agreement by and between RenaissanceRe Holdings Ltd. and Neill A. Currie, dated February 21, 2012. (44) |
| |
| 10.54 | RenaissanceRe Holdings Ltd. 2010 Performance-Based Equity Incentive Plan. (40) |
| |
| 10.55 | Amendment No. 2 to Further Amended and Restated Employment Agreement by and between RenaissanceRe Holdings Ltd. and Neill A. Currie, dated February 19, 2013. |
| |
| 10.56 | Form of Agreement Regarding Use of Aircraft Interest by and between RenaissanceRe Holdings Ltd. and Certain Executive Officers of RenaissanceRe Holdings Ltd. |
| |
| 21.1 | List of Subsidiaries of the Registrant. |
| |
| 23.1 | Consent of Ernst & Young Ltd. |
| |
| 31.1 | Certification of Neill A. Currie, Chief Executive Officer of RenaissanceRe Holdings Ltd., pursuant to Rule 13a-14(a) or Rule 15d-14(a) of the Securities Exchange Act of 1934, as amended. |
| |
| 31.2 | Certification of Jeffrey D. Kelly, Chief Financial Officer of RenaissanceRe Holdings Ltd., pursuant to Rule 13a-14(a) or Rule 15d-14(a) of the Securities Exchange Act of 1934, as amended. |
| |
| 32.1 | Certification of Neill A. Currie, Chief Executive Officer of RenaissanceRe Holdings Ltd., pursuant to 18 U.S.C. Section 1350, as adopted pursuant to Section 906 of the Sarbanes-Oxley Act of 2002. |
| |
| 32.2 | Certification of Jeffrey D. Kelly, Chief Financial Officer of RenaissanceRe Holdings Ltd., pursuant to 18 U.S.C. Section 1350, as adopted pursuant to Section 906 of the Sarbanes-Oxley Act of 2002. |
| |
| 101.INS | XBRL Instance Document |
| |
| 101.SCH | XBRL Taxonomy Extension Schema Document |
| |
| 101.CAL | XBRL Taxonomy Extension Calculation Linkbase Document |
| |
| 101.LAB | XBRL Taxonomy Extension Label Linkbase Document |
| |
| 101.PRE | XBRL Taxonomy Extension Presentation Linkbase Document |
| |
| 101.DEF | XBRL Taxonomy Extension Definition Linkbase Document |
| |
| (1) | Incorporated by reference to the Registration Statement on Form S-1 of RenaissanceRe Holdings Ltd. (Registration No. 33-70008) which was declared effective by the SEC on July 26, 1995. |
| |
| (2) | Incorporated by reference to RenaissanceRe Holdings Ltd.'s Quarterly Report on Form 10-Q for the period ended June 30, 2002, filed with the SEC on August 14, 2002. |
| |
| (3) | Incorporated by reference to RenaissanceRe Holdings Ltd.'s Quarterly Report on Form 10-Q for the period ended March 31, 1998, filed with the SEC on May 14, 1998 (SEC File Number 000-26512) |
| |
| (4) | Incorporated by reference to RenaissanceRe Holdings Ltd.'s Annual Report on Form 10-K for the year ended December 31, 2002, filed with the SEC on March 31, 2003 (SEC File Number 001-14428) |
| |
| (5) | Incorporated by reference to RenaissanceRe Holdings Ltd.'s Current Report on Form 8-K, filed with the SEC on February 27, 2006 |
| |
| (6) | Incorporated by reference to RenaissanceRe Holdings Ltd.'s Quarterly Report on Form 10-Q for the period ended March 31, 2007, filed with the SEC on May 2, 2007. |
| |
| (7) | Incorporated by reference to RenaissanceRe Holdings Ltd.'s Current Report on Form 8-K, filed with the SEC on November 25, 2008. |
| |
| (8) | Incorporated by reference to RenaissanceRe Holdings Ltd.'s Current Report on Form 8-K, filed with the SEC on February 25, 2009. |
| |
| (9) | Incorporated by reference to RenaissanceRe Holdings Ltd.'s Current Report on Form 8-K, filed with the SEC on January 14, 2010. |
| |
| (10) | Incorporated by reference to RenaissanceRe Holdings Ltd.'s Current Report on Form 8-K, filed with the SEC on July 21, 2006, relating to certain events which occurred on July 19, 2006. Other than with respect to the Percent and Lump Sum Percent (as defined and disclosed in the Form 8-K) and matters such as names and titles, the employment agreements for Messrs. O'Donnell and Ashley are identical to the form filed as Exhibit 10.9. |
| |
| (11) | Incorporated by reference to RenaissanceRe Holdings Ltd.'s Current Report on Form 8-K, filed with the SEC on June 15, 2009. |
| |
| (12) | Incorporated by reference to RenaissanceRe Holdings Ltd.'s Current Report on Form 8-K, filed with the SEC on July 17, 2001. |
| |
| (13) | Incorporated by reference to RenaissanceRe Holdings Ltd.'s Quarterly Report on Form 10-Q for the period ended March 31, 2008, filed with the SEC on May 2, 2008. |
| |
| (14) | Incorporated by reference to RenaissanceRe Holdings Ltd.'s Current Report on Form 8-K, filed with the SEC on January 31, 2003. |
| |
| (15) | Incorporated by reference to RenaissanceRe Holdings Ltd.'s Current Report on Form 8-K, filed with the SEC on April 14, 2009. |
| |
| (16) | Incorporated by reference to RenaissanceRe Holdings Ltd.'s Current Report on Form 8-K, filed with the SEC on April 11, 2006, relating to certain events which occurred on April 5, 2006. |
| |
| (17) | Incorporated by reference to RenaissanceRe Holdings Ltd.'s Current Report on Form 8-K, filed with the SEC on May 3, 2007. |
| |
| (18) | Incorporated by reference to Exhibit 99.2 to the Registration Statement on Form S-8 (Registration No. 333-90758) dated June 19, 2002. |
| |
| (19) | Incorporated by reference to RenaissanceRe Holdings Ltd.'s Quarterly Report on Form 10-Q for the period ended March 31, 2007, filed with the SEC on May 2, 2007. |
| |
| (20) | Incorporated by reference to RenaissanceRe Holdings Ltd.'s Quarterly Report on Form 10-Q for the period ended March 31, 2009, filed with the SEC on May 1, 2009. |
| |
| (21) | Incorporated by reference to RenaissanceRe Holdings Ltd.'s Quarterly Report on Form 10-Q for the period ended September 30, 2004, filed with the SEC on November 9, 2004. |
| |
| (22) | Incorporated by reference to RenaissanceRe Holdings Ltd.'s Current Report on Form 8-K, filed with the SEC on September 2, 2004. |
| |
| (23) | Incorporated by reference to RenaissanceRe Holdings Ltd.'s Annual Report on Form 10-K for the year ended December 31, 2004, filed with the SEC on March 31, 2005 (SEC File Number 001-14428). |
| |
| (24) | Incorporated by reference to Exhibit 99.1 to the Registration Statement on Form S-8 (Registration No. 333-90758) dated June 19, 2002. |
| |
| (25) | Incorporated by reference to RenaissanceRe Holdings Ltd.'s Quarterly Report on Form 10-Q for the period ended March 31, 2007, filed with the SEC on May 2, 2007. |
| |
| (26) | Incorporated by reference to RenaissanceRe Holdings Ltd.'s Quarterly Report on Form 10-Q for the period ended September 30, 2008, filed with the SEC on October 30, 2008. |
| |
| (27) | Incorporated by reference to RenaissanceRe Holdings Ltd.'s Annual Report on Form 10-K for the year ended December 31, 2001, filed with the SEC on April 1, 2002. |
| |
| (28) | Incorporated by reference to RenaissanceRe Holdings Ltd.'s Current Report on Form 8-K, filed with the SEC on February 4, 2003. |
| |
| (29) | Incorporated by reference to RenaissanceRe Holdings Ltd.'s Current Report on Form 8-K, filed with the SEC on March 18, 2004. |
| |
| (30) | Incorporated by reference to RenaissanceRe Holdings Ltd.'s Form 8-A, filed with the SEC on December 14, 2006. |
| |
| (31) | Incorporated by reference to RenaissanceRe Holdings Ltd.'s Annual Report on Form 10-K for the year ended December 31, 2008, filed with the SEC on February 20, 2009. |
| |
| (32) | Incorporated by reference to RenaissanceRe Holdings Ltd.'s Current Report on Form 8-K, filed with the SEC on March 11, 2010. |
| |
| (33) | Incorporated by reference to RenaissanceRe Holdings Ltd.'s Current Report on Form 8-K, filed with the SEC on March 18, 2010. |
| |
| (34) | Incorporated by reference to RenaissanceRe Holdings Ltd.'s Current Report on Form 8-K, filed with the SEC on April 27, 2010. |
| |
| (35) | Incorporated by reference to RenaissanceRe Holdings Ltd.'s Quarterly Report on Form 10-Q, filed with the SEC on April 29, 2010. |
| |
| (36) | Incorporated by reference to RenaissanceRe Holdings Ltd.'s Current Report on Form 8-K, filed with the SEC on June 11, 2010. |
| |
| (37) | Incorporated by reference to RenaissanceRe Holdings Ltd.'s Current Report on Form 8-K, filed with the SEC on August 13, 2010. |
| |
| (38) | Incorporated by reference to RenaissanceRe Holdings Ltd.'s Current Report on Form 8-K, filed with the SEC on September 23, 2010. |
| |
| (39) | Incorporated by reference to RenaissanceRe Holdings Ltd.'s Current Report on Form 8-K, filed with the SEC on November 18, 2010. |
| |
| (40) | Incorporated by reference to RenaissanceRe Holdings Ltd.'s Definitive Proxy Statement filed with the Commission on April 8, 2010. |
| |
| (41) | Incorporated by reference to RenaissanceRe Holdings Ltd.'s Current Report on Form 8-K, filed with the SEC on January 24, 2011. |
| |
| (42) | Incorporated by reference to RenaissanceRe Holdings Ltd.'s Annual Report on Form 10-K for the year ended December 31, 2009, filed with the SEC on February 19, 2010. |
| |
| (43) | Incorporated by reference to RenaissanceRe Holdings Ltd.'s Current Report on Form 8-K, filed with the SEC on May 22, 2012. |
| |
| (44) | Incorporated by reference to RenaissanceRe Holdings Ltd.'s Current Report on Form 8-K, filed with the SEC on February 27, 2012. |
| |
| (45) | Incorporated by reference to RenaissanceRe Holdings Ltd.'s Annual Report on Form 10-K for the year ended December 31, 2011, filed with the SEC on February 23, 2012. |

Senior Officers
RenaissanceRe Holdings Ltd. and Subsidiaries
Bermuda
Currie, Neill A.
Chief Executive Officer, RenaissanceRe Holdings Ltd.
O’Donnell, Kevin J.
President,
Global Chief Underwriting Officer, RenaissanceRe Holdings Ltd.
Durhager, Peter C.
Executive Vice President,
Chief Administrative Officer, RenaissanceRe Holdings Ltd.
Kelly, Jeffrey D.
Executive Vice President,
Chief Financial Officer, RenaissanceRe Holdings Ltd.
Branagan, Ian D.
Senior Vice President,
Chief Risk Officer,
RenaissanceRe Holdings Ltd.
Cuffe, Dana J.
Senior Vice President,
Chief Information Officer, RenaissanceRe Holdings Ltd.
Curtis, Ross A.
Senior Vice President, RenaissanceRe Holdings Ltd., Chief Underwriting Officer of European Operations
Dutt, Aditya K.
Senior Vice President, RenaissanceRe Holdings Ltd., President,
Renaissance Underwriting
Managers, Ltd.
Marra, David E.
Senior Vice President, RenaissanceRe Holdings Ltd.
O’Keefe, Justin D.
Senior Vice President, RenaissanceRe Holdings Ltd.
Paradine, Jonathan D. A.
Senior Vice President, RenaissanceRe Holdings Ltd., Principal Officer,
Renaissance Reinsurance Ltd., Singapore Representative Office
Weinstein, Stephen H.
Senior Vice President,
General Counsel,
Chief Compliance Officer and Secretary,
RenaissanceRe Holdings Ltd.
Wilcox, Mark A.
Senior Vice President,
Chief Accounting Officer, Corporate Controller, RenaissanceRe Holdings Ltd.
Dalton, Bryan M.
Senior Vice President, RenaissanceRe Underwriting Management Ltd.
Doak, Michael J.
Senior Vice President, RenaissanceRe Ventures Ltd.
James, Helen L.
Senior Vice President, RenaissanceRe Ventures Ltd.
Roberts, Rebecca J.
Senior Vice President, RenaissanceRe Underwriting Management Ltd.
A’Zary, Angela H.
Vice President, RenaissanceRe Services Ltd.
Bonanno, Laura
Vice President, RenaissanceRe Services Ltd.
Cahill, W. Jay
Vice President, RenaissanceRe Underwriting Management Ltd.
Carr, Cathal J.
Vice President, RenaissanceRe Underwriting Management Ltd.
Chaves, Natalie C.
Vice President, RenaissanceRe Services Ltd.
Fraser, Jamie C.
Vice President,
Head of Internal Audit, RenaissanceRe Services Ltd.
Freisenbruch, W. Justin
Vice President, RenaissanceRe Underwriting Management Ltd.
Gunther, Keil A.
Vice President, RenaissanceRe Services Ltd.
Manson, Jeff H.
Vice President, RenaissanceRe Underwriting Management Ltd.
McCue, Keith A.
Vice President,
Renaissance Reinsurance Ltd.
Mitchell, James A.
Vice President, RenaissanceRe Underwriting Management Ltd.
Morgenstern, Kai H.
Vice President,
Managing Director, RenaissanceRe Ventures Ltd.
Nusum, Maureen B.
Vice President, RenaissanceRe Services Ltd.
Regan, Michael E.
Vice President,
Global Tax Director, RenaissanceRe Services Ltd.
Reingevurts, Vadim V.
Vice President, RenaissanceRe Services Ltd.
Smith, Josephine A.
Vice President, RenaissanceRe Services Ltd.
Valdes, Humberto M.
Vice President, RenaissanceRe Underwriting Management Ltd.
Fonner, Todd R.
Senior Vice President,
Chief Investment Officer, Treasurer,
RenaissanceRe Holdings Ltd.
Moore, Sean M.
Senior Vice President, RenaissanceRe Services Ltd.
Komposch, Caroline M.
Vice President, RenaissanceRe Services Ltd.
Walker, Blythe W.
Vice President, RenaissanceRe Services Ltd.
Werner, Loral L.
Vice President, RenaissanceRe Services Ltd.
Ireland
United Kingdom
Britchfield, Ian D.
Managing Director,
Renaissance Services of Europe Limited
Brosnan, Sean G.
Managing Director, Investments, Renaissance Services of Europe Limited
De Vere, Gerard
Vice President,
Renaissance Services of Europe Limited
Finnan, Orla M.
Vice President,
Renaissance Services of Europe Limited
Curtis, Ross A.
Active Underwriter,
Chief Underwriting Officer of European Operations, RenaissanceRe Syndicate Management Limited
Murphy, Richard J.
Chief Executive Officer, RenaissanceRe Syndicate Management Limited
McMenamin, Conor S.
Senior Vice President, Chief Risk Officer of European Operations, RenaissanceRe Syndicate Management Limited
Fox, Kim T.
Chief Operating Officer, RenaissanceRe Syndicate Management Limited
Heatherly, David A.
Executive Director, RenaissanceRe Syndicate Management Limited
Mann, James W.
Executive Director, RenaissanceRe Syndicate Management Limited
Brennan, Hugh R.
Finance Director, RenaissanceRe Syndicate Management Limited
Burr, Stephen D.
Senior Specialty Actuary, RenaissanceRe Syndicate Management Limited
Cruttenden, Edward J.
Underwriter,
RenaissanceRe Syndicate Management Limited
Lang, Robin J.
Vice President, RenaissanceRe Services Ltd.
Oakley, Ian R.
Underwriter,
RenaissanceRe Syndicate Management Limited
O’Leary, John Paul
Underwriter,
RenaissanceRe Syndicate Management Limited
Shepherd, Alex H.
Underwriter,
RenaissanceRe Syndicate Management Limited
United States
Tawney, Mark R.
President,
RenRe Energy Advisors Ltd.
Carrick, George M.
Vice President,
RenRe Energy Advisors Ltd.
Kaplan, Paul E.
Vice President,
RenRe Energy Advisors Ltd.
Williford, Eric C.
Senior Scientist, WeatherPredict Consulting Inc.
Tillman, Craig W.
President,
WeatherPredict Consulting Inc.
Bachiochi, David R.
Senior Scientist, WeatherPredict Consulting Inc.
Cohen, Michael N.
Regulatory and Government Affairs, Vice President,
RenRe North America Employee Services Inc.
Rowe, G. Dail
Senior Scientist, WeatherPredict Consulting Inc.
Windle, William W.
Vice President,
RenRe Energy Advisors Ltd.
Board of Directors
RenaissanceRe Holdings Ltd.
Neill A. Currie
Chief Executive Officer RenaissanceRe Holdings Ltd.
Ralph B. Levy
Chairman
RenaissanceRe Holdings Ltd.
David C. Bushnell
Retired Chief Administrative Officer Citigroup Inc.
Thomas A. Cooper*
Chief Executive Officer TAC Associates
James L. Gibbons
President, CEO and Chairman CAPITAL G Bank Limited
Brian G. J. Gray*
Retired Group Chief Underwriting Officer Swiss Reinsurance Company Ltd.
Jean D. Hamilton
Private Investor Independent Consultant
Henry Klehm III
Partner Jones Day
W. James MacGinnitie
Former Chairman RenaissanceRe Holdings Ltd.
Independent Consultant
Anthony M. Santomero
Former Senior Advisor McKinsey & Company
Nicholas L. Trivisonno
Retired Chairman and CEO ACNielsen Corporation
Edward J. Zore
Retired Chairman and CEO
The Northwestern Mutual Life Insurance Company
*Mr. Cooper will retire from the Board and Mr. Gray is nominated to fill the vacancy created by the retirement of Mr. Cooper from the Board, each to occur in conjunction with the Company’s Annual General Meeting of Shareholders in May 2013.
Financial and Investor Information
RenaissanceRe Holdings Ltd. and Subsidiaries
General Information About the Company
For the Company’s Annual Report, press releases, Forms 10-K and 10-Q or other filings, please visit our website: www.renre.com
Or contact:
Kekst and Company, 437 Madison Avenue,
19th Floor, New York, NY 10022 Tel: +1 212 521 4800
Investor inquiries should be directed to:
Investor Relations, RenaissanceRe Holdings Ltd.
Tel: +1 441 295 4513 E-mail: investorrelations@renre.com
Additional requests can be directed to:
The Company Secretary, RenaissanceRe Holdings Ltd.
Tel: +1 441 295 4513 E-mail: secretary@renre.com
Stock Information
The Company’s stock is listed on The New York Stock Exchange under the symbol ‘RNR’.
The following table sets forth, for the period indicated, the high and low closing prices per share of our common shares as reported in composite New York Stock Exchange trading.
Price Range of Common Shares
2012
2011
Period
High
Low
High
Low
1st Quarter
$79.11
$71.18
$70.58
$60.64
2nd Quarter
80.53
72.41
73.93
67.58
3rd Quarter
78.39
70.00
72.30
59.50
4th Quarter
82.76
75.26
75.16
60.34
Certifications
The Chief Executive Officer and Chief Financial Officer have certified in writing to the Securities and Exchange Commission (SEC) as to the integrity of the Company’s financial statements included in this Annual Report and in the Company’s Annual Report on Form 10-K for the fiscal year ended December 31, 2012 filed with the SEC and as to the effectiveness of the Company’s disclosure controls and procedures and internal control over financial reporting.
The certifications are filed as Exhibit 31 and Exhibit 32 to our Form 10-K. The Chief Executive Officer has also certified to the New York Stock Exchange in 2012 that he is not aware of any violation by the Company of the New York Stock Exchange corporate governance listing standards.
Independent Registered Public Accounting Firm
Ernst & Young Ltd., Hamilton, Bermuda
Registrar and Transfer Agent
Computershare Shareowner Services LLC
480 Washington Boulevard
Jersey City, NJ 07310
Tel: +1 866 245 5019 or + 1 201 680 6578
www.computershare.com
The cover stock is Green Seal Certified and contains 30% post consumer waste. The narrative stock is FSC certified and contains 10% recycled fiber with chlorine free (TCF/ECF) pulp using timber from managed forests. The financial stock is FSC certified, elemental chlorine free and contains 30% post consumer waste.
Printed at a zero-discharge facility using soy-based inks.
Please recycle this publication. Printed on paper containing post consumer materials.

RenaissanceRe
RenaissanceRe Holdings Ltd. Renaissance House 12 Crow Lane Pembroke HM19 Bermuda
Telephone:+1 441 295 4513 Fax: +1 441 295 4327 www.renre.com
