EXHIBIT 99.2

$FFHOHUDWLQJ VXFFHVV Third Quarter 2022 Financial Results November 1, 2022

Colliers 2 This presentation includes or may include forward - looking statements. Forward - looking statements include the Company’s financial performance outlook and statements regarding goals, beliefs, strategies, objectives, plans or current expectations. These sta tem ents involve known and unknown risks, uncertainties and other factors which may cause the actual results to be materially differen t f rom any future results, performance or achievements contemplated in the forward - looking statements. Such factors include: economic condi tions, especially as they relate to commercial and consumer credit conditions and business spending; commercial real estate property va lues, vacancy rates and general conditions of financial liquidity for real estate transactions; the effects of changes in foreign e xch ange rates in relation to the US dollar on Canadian dollar, Australian dollar, UK pound sterling and Euro denominated revenues and expenses ; competition in markets served by the Company; labor shortages or increases in commission, wage and benefit costs; the impact of higher than expected inflation could impact profitability of certain contracts; impact of pandemics on client demand, ability to del ive r services and ensure the health and productivity of employees; disruptions or security failures in information technology systems; cybersec uri ty risks; a change in/loss of our relationship with US government agencies could significantly impact our ability to originate mortgage l oan s; default on loans originated under the Fannie Mae Delegated Underwriting and Servicing program could materially affect our profitabili ty; the effect of increases in interest rates on our cost of borrowing and political conditions or events, including elections, referenda, c han ges to international trade and immigration policies and any outbreak or escalation of terrorism or hostilities. Additional factors and explanatory information are identified in the Company’s Annual Information Form for the year ended Dec emb er 31, 2021 under the heading “Risk Factors” (which factors are adopted herein, and which can be accessed at www.sedar.com) and othe r p eriodic filings with Canadian and US securities regulators. Forward looking statements contained in this presentation are made as of the date hereof and are subject to change. All forward - looking statements in this press release are qualified by these cautionary stateme nts. Except as required by applicable law, Colliers undertakes no obligation to publicly update or revise any forward - looking statement, whe ther as a result of new information, future events or otherwise. This presentation does not constitute an offer to sell or a solicitation of an offer to purchase an interest in any fund. Non - GAAP measures This presentation makes reference to certain non - GAAP measures, including local currency (“LC”) revenue growth rate, internal re venue growth rate, Adjusted EBITDA (“AEBITDA”), Adjusted EPS (“AEPS”) and assets under management (“AUM”). Please refer to Appendi x f or reconciliations to GAAP measures.

Highlights Colliers 3 USD LC (1) Revenue 1,108.3 1,022.8 8% 12% Adjusted EBITDA 145.1 123.6 17% 21% Adjusted EBITDA Margin 13.1% 12.1% Adjusted EPS 1.41 1.27 11% GAAP Operating Earnings (2) 84.0 76.0 11% GAAP Operating Earnings Margin 7.6% 7.4% GAAP diluted EPS (2) 0.27 0.40 -33% Three months ended September 30 2022 2021 %Change Growing recurring revenues and broader diversification bring more resilience Outsourcing & Advisory, Investment Management and Leasing up strongly more than offsetting softness in Capital Markets Investment Management represents nearly 30% of pro forma consolidated Adjusted EBITDA • Completed four acquisitions year to date • Pro forma AUM now exceeds $92 billion, with 85% in perpetual or long - dated investment strategies and 70% in highly defensive ass et classes (US$ millions, except per share amounts) (1) Local Currency (2) For the nine months ended September 30, 2021, GAAP operating earnings and GAAP diluted EPS include a $471.9 million settlemen t of Long - Term Incentive Arrangement (“LTIA”) with the Company's Chairman & CEO USD LC (1) Revenue 3,237.1 2,743.7 18% 21% Adjusted EBITDA 427.8 352.3 21% 24% Adjusted EBITDA Margin 13.2% 12.8% Adjusted EPS 4.69 3.91 20% GAAP Operating Earnings (2) 228.7 -269.9 NM GAAP Operating Earnings Margin 7.1% -9.8% GAAP diluted EPS (2) 0.54 -10.19 NM Nine months ended September 30 2022 2021 % Change

Trailing Twelve Months Ended September 30, 2022 Broad Diversification Colliers 4 Shown on a proforma basis including announced acquisitions 28% 45% 27% 40% 23% 26% 11% Leasing Outsourcing & Advisory Capital Markets Investment Management Leasing & Capital Markets 55% Recurring TTM Q3 2022 Revenue By Service TTM Q3 2022 AEBITDA By Service 51% Recurring

275.7 310.6 273.7 242.9 462.8 390.9 96.1 78.3 1,108.3 1,022.8 Q3 2022 Q3 2021 Third Quarter Consolidated Revenues Colliers 5 Outsourcing & Advisory Investment Management (1) Capital Markets Leasing (US$ millions) % Change over Q3 2021 USD LC Investment Management (1) 23% 23% Outsourcing & Advisory 18% 24% Leasing 13% 16% Capital Markets -11% -8% Total 8% 12% Revenue Mix Q3 2022 Q3 2021 Investment Management 8% 8% Outsourcing & Advisory 42% 38% Leasing 25% 24% Capital Markets 25% 30% Total 100% 100% Local currency internal growth: 4% (1) Investment Management LC revenue growth, excluding pass - through carried interest, was 62%

Americas 695.1 EMEA 164.2 Asia Pacific 152.8 Investment Management 96.1 63% 15% 14% 8% Americas 617.1 EMEA 154.9 Asia Pacific 172.3 Investment Management 78.3 60% 15% 17% 8% Americas 65.8 EMEA 15.0 Asia Pacific 20.7 Investment Management 27.8 51% 12% 16% 21% 12% Americas 66.8 EMEA 13.3 Asia Pacific 21.1 Investment Management 36.9 48% 10% 15% 27% Third Quarter Geographic Mix (1) Q3 2022 GAAP Operating Earnings: $59.9M Americas, $6.1M EMEA, $17.5M Asia Pacific, $19.5M Investment Management (2) Q3 2021 GAAP Operating Earnings: $48.9M Americas, $11.4M EMEA, $18.3M Asia Pacific, $19.8M Investment Management Colliers 6 Q3 2022 Revenues Q3 2021 Revenues Q3 2022 AEBITDA Q3 2021 AEBITDA (US$ millions)

Growth led by Outsourcing & Advisory, particularly Engineering & Design (including recent acquisitions) Leasing benefitted from increased office and industrial activity Margin impacted by higher discretionary and variable costs and reduction in high - margin Capital Markets revenues Americas Colliers 7 GAAP Operating Earnings: Q3 2022 $59.9M at 8.6% margin; Q3 2021 $48.9M at 7.9% margin 194.7 213.4 210.6 175.0 289.8 228.7 695.1 617.1 Q3 2022 Q3 2021 Revenue AEBITDA and Margin (US$ millions) (US$ millions) USD LC Revenue Growth 13% 13% Outsourcing & Advisory Leasing Capital Markets

Significant foreign exchange headwinds impacted revenues 17% LC Growth across all services lines but unevenly distributed across countries EMEA Colliers 8 GAAP Operating Earnings: Q3 2022 $6.1M at 3.7% margin; Q3 2021 $11.4M at 7.4% margin 38.4 40.4 32.1 34.7 93.8 79.8 164.2 154.9 Q3 2022 Q3 2021 Revenue AEBITDA and Margin (US$ millions) (US$ millions) USD LC Revenue Growth 6% 23% Outsourcing & Advisory Leasing Capital Markets

Foreign exchange headwinds impacted revenues 7% Revenue impacted by COVID - 19 restrictions in several Asian markets and delays in certain transactions APAC Colliers 9 GAAP Operating Earnings: Q3 2022 $17.5M at 11.4% margin; Q3 2021 $18.3M at 10.6% margin 42.6 56.9 31.1 33.2 79.1 82.3 152.8 172.3 Q3 2022 Q3 2021 Revenue AEBITDA and Margin (US$ millions) (US$ millions) USD LC Revenue Growth -11% -4% Outsourcing & Advisory Leasing Capital Markets

Revenue growth driven by acquisitions and management fee growth from increased AUM AUM of $86.2 billion as of September 30, 2022 ($92.2 billion including Versus Capital, closed on October 12, 2022), up significantly from $46.1 billion in the prior year Investment Management Colliers 10 GAAP Operating Earnings: Q3 2022 $19.5M at 20.3% margin; Q3 2021 $19.8M at 25.3% margin 96.1 59.7 18.6 96.1 78.3 Q3 2022 Q3 2021 Revenue AEBITDA and Margin (US$ millions) (US$ millions) Investment Management USD LC Revenue Growth 23% 23% Revenue Growth 61% 62% (excluding pass - through carried interest) Pass - through carried interest

Investment Management Colliers 11 Focus on long - duration, highly differentiated AUM Shown as of September 30, 2022, pro forma including acquisitions 52% 18% 30% Alternatives Infrastructure Traditional Real Estate AUM by Asset Class 38% 47% 15% Perpetual Capital Long-dated Funds Managed Accounts AUM by Strategy 78% 22% North America EMEA AUM by Geography AUM: $92.2B FPAUM: $51.2B

(US$ millions) Capitalization & Capital Allocation (1) Net debt for financial leverage ratio excludes restricted cash, warehouse credit facilities and convertible notes, in acc ord ance with debt agreements (2) Includes business acquisitions, contingent acquisition consideration and purchases of non - controlling interests in subsidiar ies Colliers 12 Cash $ 190.5 $ 396.7 $ 134.1 Total Debt 1,152.3 531.1 378.7 Net Debt $ 961.8 $ 134.3 $ 244.6 Convertible Notes 226.2 225.2 224.9 Redeemable non-controlling interests 869.4 536.9 474.6 Shareholders' equity 481.3 585.3 542.6 Total capitalization $ 2,538.7 $ 1,481.7 $ 1,486.7 Net debt / pro forma adjusted EBITDA - Leverage Ratio (1) 1.5x 0.3x 0.5x Capital Expenditures $ 41.8 $ 44.5 Acquisition Spend (2) $ 753.2 $ 41.6 Nine months ended September 30, 2022 September 30, 2021 September 30, 2022 December 31, 2021 September 30, 2021 Highlights • Leverage ratio of 1.5x • Pro forma leverage ratio, including all announced acquisitions, of 2.0x • Ample liquidity to fund acquisition and internal growth • Versus, Pangea (expected) and Arcadia acquisitions in Q4 • Repurchased 372,888 CIGI shares in September and October at cost of $34.6 million • Anticipating capital expenditures of $75 - $80 million in 2022
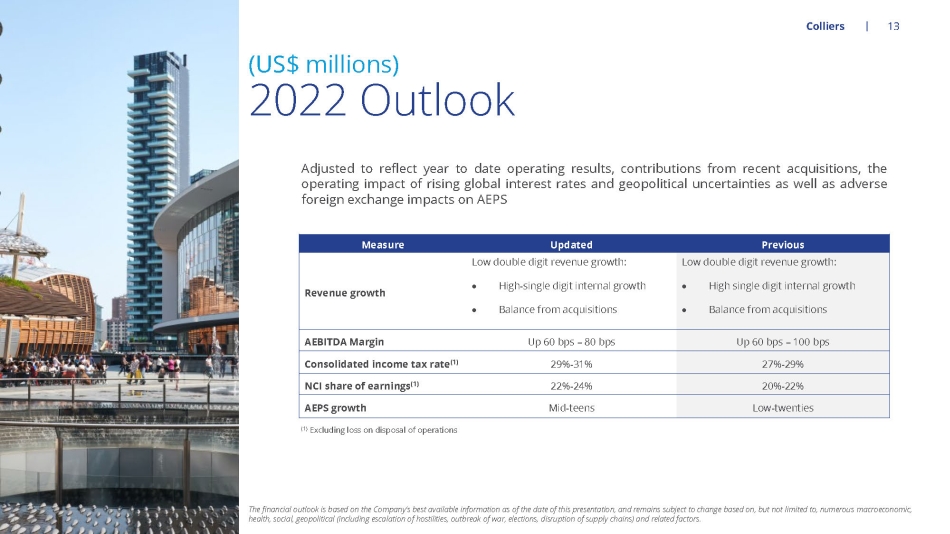
(US$ millions) 2022 Outlook Colliers 13 Measure Updated Previous Revenue growth Low double digit revenue growth: High - single digit internal growth Balance from acquisitions Low double digit revenue growth: High single digit internal growth Balance from acquisitions AEBITDA Margin Up 60 bps – 80 bps Up 60 bps – 100 bps Consolidated income tax rate ( 1 ) 29% - 31% 27% - 29% NCI share of earnings ( 1 ) 22% - 24% 20% - 22% AEPS growth Mid - teens Low - twenties The financial outlook is based on the Company’s best available information as of the date of this presentation, and remains s ubj ect to change based on, but not limited to, numerous macroeconomic, health, social, geopolitical (including escalation of hostilities, outbreak of war, elections, disruption of supply chains) a nd related factors. Adjusted to reflect year to date operating results, contributions from recent acquisitions, the operating impact of rising global interest rates and geopolitical uncertainties as well as adverse foreign exchange impacts on AEPS (1) Excluding loss on disposal of operations

Appendix 14 Reconciliation of non - GAAP measures

Reconciliation of GAAP earnings to adjusted EBITDA Colliers 15 (US$ thousands) Net earnings (loss) $ 44,524 $ 50,496 $ 132,572 $ (337,298) Income tax 25,097 18,771 70,034 48,490 Other income, including equity earnings from non-consolidated investments 874 (1,601) (3,316) (5,547) Interest expense, net 13,535 8,300 29,424 24,500 Operating earnings (loss) 84,030 75,966 228,714 (269,855) Settlement of long-term incentive arrangement ("LTIA") - - - 471,928 Loss on disposal of business operations 318 - 27,358 - Depreciation and amortization 45,142 34,588 125,879 106,939 Gains attributable to MSRs (16,391) (5,812) (24,214) (20,728) Equity income from non-consolidated entites 755 1,487 4,821 4,625 Acquisition-related items 26,290 14,231 50,738 49,773 Restructuring costs 191 523 462 1,466 Stock-based compensation expense 4,730 2,658 14,081 8,180 Adjusted EBITDA $ 145,065 $ 123,641 $ 427,839 $ 352,328 Three months ended Nine months ended September 30, 2022 September 30, 2021 September 30, 2022 September 30, 2021

Reconciliation of GAAP earnings to adjusted net earnings and adjusted earnings per share Adjusted EPS is calculated using the “if - converted” method of calculating earnings per share in relation to the Convertible Note s, which were issued on May 19, 2020 Colliers 16 (US$ thousands) Net earnings (loss) $ 44,524 $ 50,496 $ 132,572 $ (337,298) Non-controlling interest share of earnings (17,375) (13,623) (37,697) (33,148) Interest on Convertible Notes 2,300 2,300 6,900 6,900 Settlement of LTIA - - - 471,928 Loss on disposal of Russian operations 318 - 27,358 - Amortization of intangible assets 32,760 23,148 89,630 74,019 Gains attributable to MSRs (16,391) (5,812) (24,214) (20,728) Acquisition-related items 26,290 14,231 50,738 49,773 Restructuring costs 191 523 462 1,466 Stock-based compensation expense 4,730 2,658 14,081 8,180 Income tax on adjustments (6,341) (8,934) (22,651) (27,117) Non-controlling interest on adjustments (3,519) (3,125) (11,458) (9,920) Adjusted net earnings $ 67,487 $ 61,862 $ 225,721 $ 184,055 (US$) Diluted net (loss) earnings per common share $ 0.25 $ 0.37 $ 0.49 $ (9.20) Interest on Convertible Notes, net of tax 0.04 0.04 0.11 0.11 Non-controlling interest redemption increment 0.32 0.39 1.48 1.34 Settlement of LTIA - - - 10.02 Loss on disposal of operations - - 0.56 - Amortization expense, net of tax 0.42 0.28 1.13 0.94 Gains attributable to MSRs, net of tax (0.19) (0.07) (0.28) (0.25) Acquisition-related items 0.49 0.20 0.94 0.75 Restructuring costs, net of tax - 0.01 - 0.02 Stock-based compensation expense, net of tax 0.08 0.05 0.26 0.18 Adjusted EPS $ 1.41 $ 1.27 $ 4.69 $ 3.91 Diluted weighted average shares for Adjusted EPS (thousands) 47,743 48,722 48,121 47,111 Three months ended Nine months ended September 30, 2022 September 30, 2021 September 30, 2022 September 30, 2021 Three months ended Nine months ended September 30, 2022 September 30, 2021 September 30, 2022 September 30, 2021

Reconciliation of net cash flow from operations to free cash flow Colliers 17 (US$ thousands) Net cash provided by (used in) operating activities $ 76,840 $ 192,524 $ (171,470) $ 211,072 Contingent acquisition consideration paid 8,129 - 68,939 10,472 Settlement of LTIA (cash portion) - - - 96,186 Purchase of fixed assets (18,391) (11,847) (41,807) (44,450) Cash collections on AR Facility deferred purchase price 88,627 11,563 345,056 34,295 Free cash flow $ 155,205 $ 192,240 $ 200,718 $ 307,575 Three months ended Nine months ended September 30, 2022 September 30, 2021 September 30, 2022 September 30, 2021

Other Non - GAAP Measures Colliers 18 Local currency revenue growth rate and internal revenue growth rate measures Percentage revenue variances presented on a local currency basis are calculated by translating the current period results of our non - US dollar denominated operations to US dollars using the foreign currency exchange rates from the periods against which the current period results are being compared . Percentage revenue variances presented on an internal growth basis are calculated assuming no impact from acquired entities in the current and prior periods . Revenue from acquired entities, including any foreign exchange impacts, are treated as acquisition growth until the respective anniversaries of the acquisitions . We believe that these revenue growth rate methodologies provide a framework for assessing the Company’s performance and operations excluding the effects of foreign currency exchange rate fluctuations and acquisitions . Since these revenue growth rate measures are not calculated under GAAP, they may not be comparable to similar measures used by other issuers . Assets under management We use the term assets under management (“AUM”) as a measure of the scale of our Investment Management operations . AUM is defined as the gross market value of operating assets and the projected gross cost of development assets of the funds, partnerships and accounts to which we provide management and advisory services, including capital that such funds, partnerships and accounts have the right to call from investors pursuant to capital commitments . Our definition of AUM may differ from those used by other issuers and as such may not be directly comparable to similar measures used by other issuers . Fee paying assets under management We use the term fee paying assets under management (“FPAUM”) to represent only the AUM on which the Company is entitled to receive management fees . We believe this measure is useful in providing additional insight into the capital base upon which the Company earns management fees . Our definition of FPAUM may differ from those used by other issuers and as such may not be directly comparable to similar measures used by other issuers . Adjusted EBITDA from recurring revenue percentage Adjusted EBITDA from recurring revenue percentage is computed on a trailing twelve - month basis and represents the proportion of adjusted EBITDA (slide 14) that is derived from Outsourcing & Advisory and Investment Management service lines. Both these service lines represent medium to lon g - t erm duration revenue streams that are either contractual or repeatable in nature. We report this metric on a pro forma basis, incorporating the expected f ull year impact of business acquisitions and dispositions.