Searchable text section of graphics shown above
Financial Security Assurance Inc.
Investors’ Overview
December 31, 2004
March 16, 2005
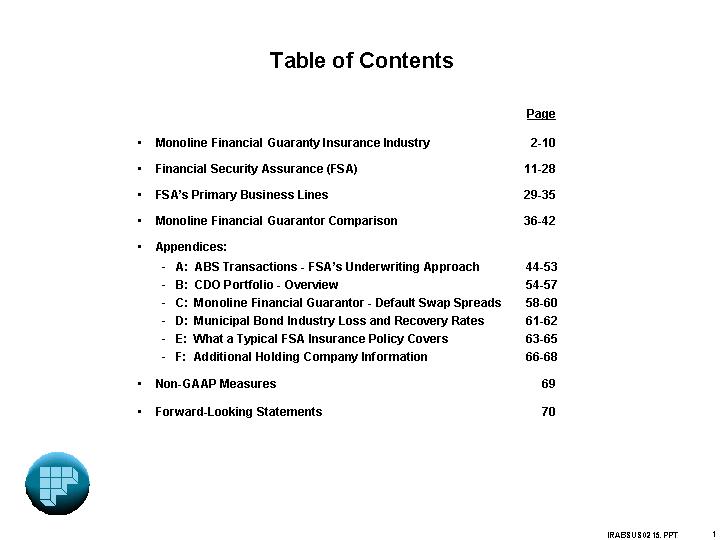
Table of Contents
[LOGO]
1
Monoline Financial Guaranty Insurance Industry
2
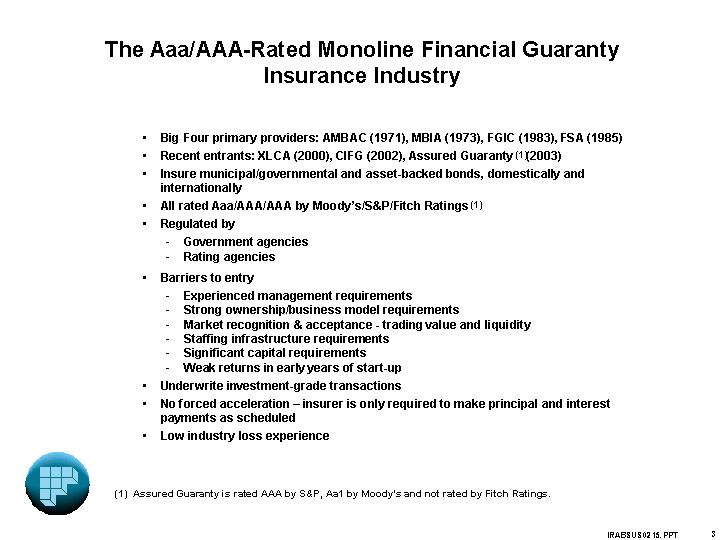
The Aaa/AAA-Rated Monoline Financial Guaranty
Insurance Industry
• Big Four primary providers: AMBAC (1971), MBIA (1973), FGIC (1983), FSA (1985)
• Recent entrants: XLCA (2000), CIFG (2002), Assured Guaranty (1)(2003)
• Insure municipal/governmental and asset-backed bonds, domestically and internationally
• All rated Aaa/AAA/AAA by Moody’s/S&P/Fitch Ratings(1)
• Regulated by
• Government agencies
• Rating agencies
• Barriers to entry
• Experienced management requirements
• Strong ownership/business model requirements
• Market recognition & acceptance - trading value and liquidity
• Staffing infrastructure requirements
• Significant capital requirements
• Weak returns in early years of start-up
• Underwrite investment-grade transactions
• No forced acceleration – insurer is only required to make principal and interest payments as scheduled
• Low industry loss experience
(1) Assured Guaranty is rated AAA by S&P, Aa1 by Moody’s and not rated by Fitch Ratings.
3
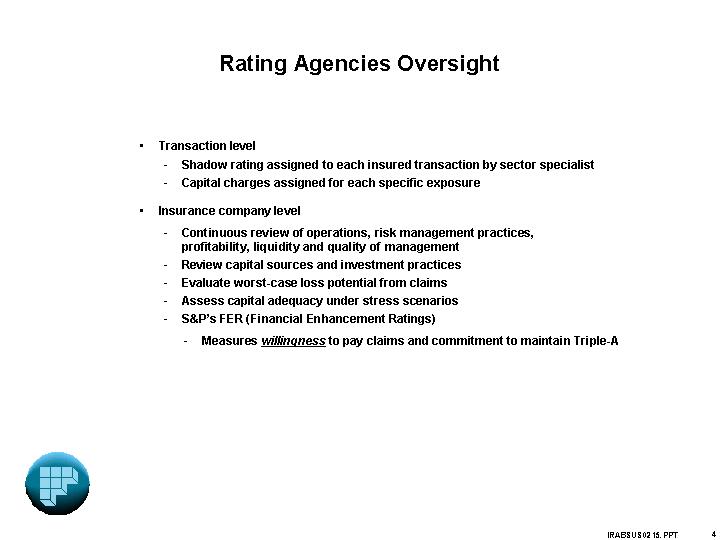
Rating Agencies Oversight
• Transaction level
• Shadow rating assigned to each insured transaction by sector specialist
• Capital charges assigned for each specific exposure
• Insurance company level
• Continuous review of operations, risk management practices, profitability, liquidity and quality of management
• Review capital sources and investment practices
• Evaluate worst-case loss potential from claims
• Assess capital adequacy under stress scenarios
• S&P’s FER (Financial Enhancement Ratings)
• Measures willingness to pay claims and commitment to maintain Triple-A
4
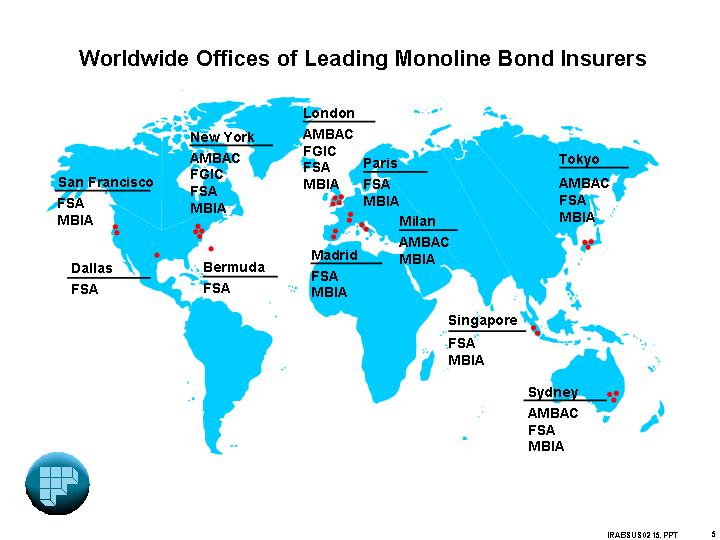
Worldwide Offices of Leading Monoline Bond Insurers
[GRAPHIC]
5
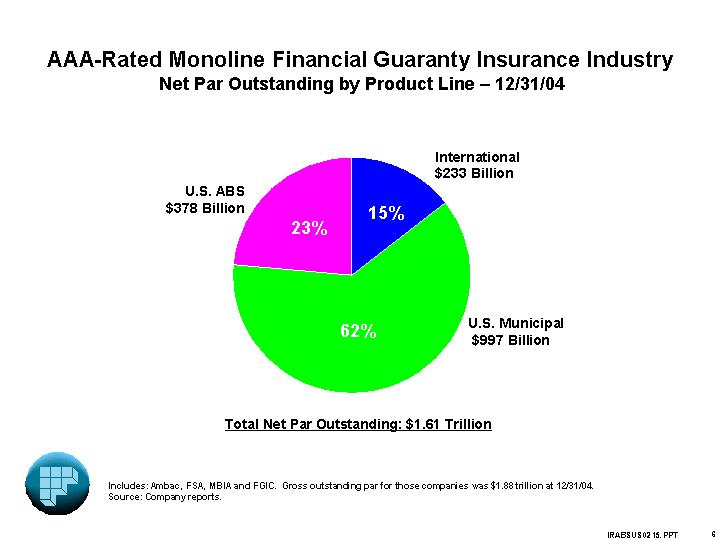
AAA-Rated Monoline Financial Guaranty Insurance Industry
Net Par Outstanding by Product Line – 12/31/04
[CHART]
Total Net Par Outstanding: $1.61 Trillion
Includes: Ambac, FSA, MBIA and FGIC. Gross outstanding par for those companies was $1.88 trillion at 12/31/04.
Source: Company reports.
6
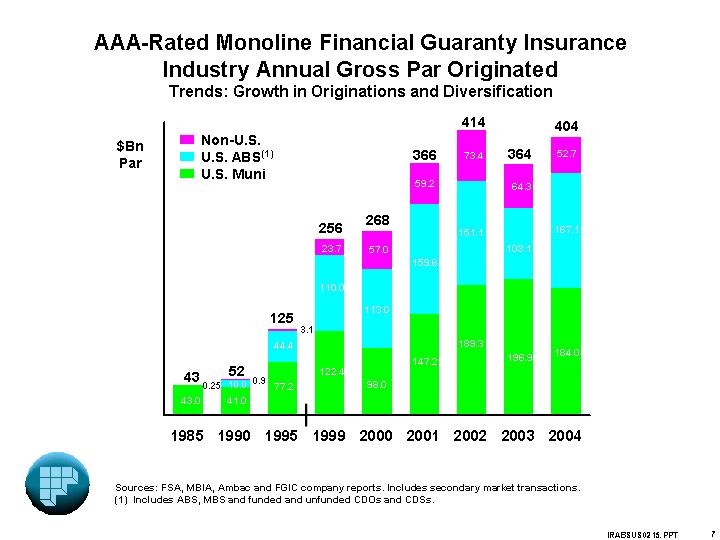
AAA-Rated Monoline Financial Guaranty Insurance
Industry Annual Gross Par Originated
Trends: Growth in Originations and Diversification
[CHART]
Sources: FSA, MBIA, Ambac and FGIC company reports. Includes secondary market transactions.
(1) Includes ABS, MBS and funded and unfunded CDOs and CDSs.
7
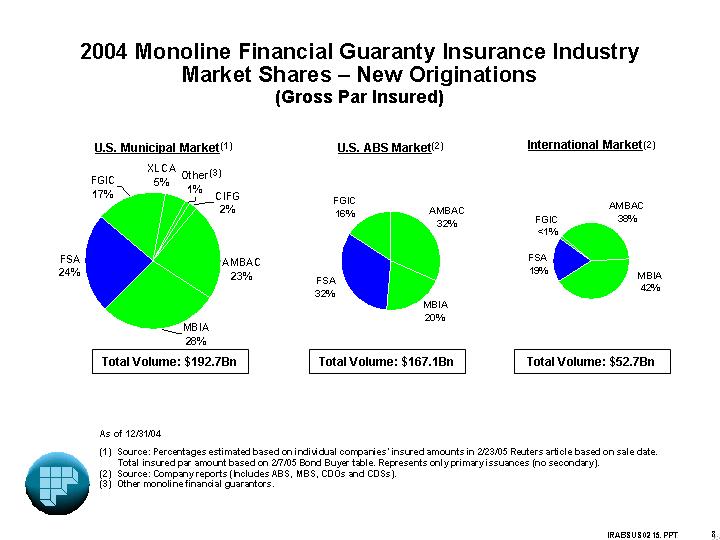
2004 Monoline Financial Guaranty Insurance Industry
Market Shares – New Originations
(Gross Par Insured)
U.S. Municipal Market(1) | | U.S. ABS Market(2) | | International Market(2) |
| | | | |
[CHART] | | [CHART] | | [CHART] |
| | | | |
Total Volume: $192.7Bn | | Total Volume: $167.1Bn | | Total Volume: $52.7Bn |
As of 12/31/04
(1) Source: Percentages estimated based on individual companies’ insured amounts in 2/23/05 Reuters article based on sale date.
Total insured par amount based on 2/7/05 Bond Buyer table. Represents only primary issuances (no secondary).
(2) Source: Company reports (Includes ABS, MBS, CDOs and CDSs).
(3) Other monoline financial guarantors.
8
U.S. ABS Insured Penetration Rate
for Monoline Bond Insurers
(Public and 144A ABS Market - Par Insured)(1)
2002 | | 2003 | | 2004(2) | |
$411 Billion | | $467 Billion | | $637 Billion | |
| | | | | |
[CHART] | | [CHART] | | [CHART] | |
(1) Source: Asset-Backed Alert: ABS Database. Represents only primary issuance (no secondary). Figures exclude collateralized bond obligations and MBS (agency and jumbos) as well as U.S. dollar-denominated issues backed by non-U.S. collateral. Insurers receive credit for only the insured amount.
(2) For 2004, the insured penetration rate for certain sectors was: home equity lines of credit 87%, subprime auto loans 47%, high-LTV (RMBS) loans 37%, aircraft lease receivables 35%, auto leases 29%.
9
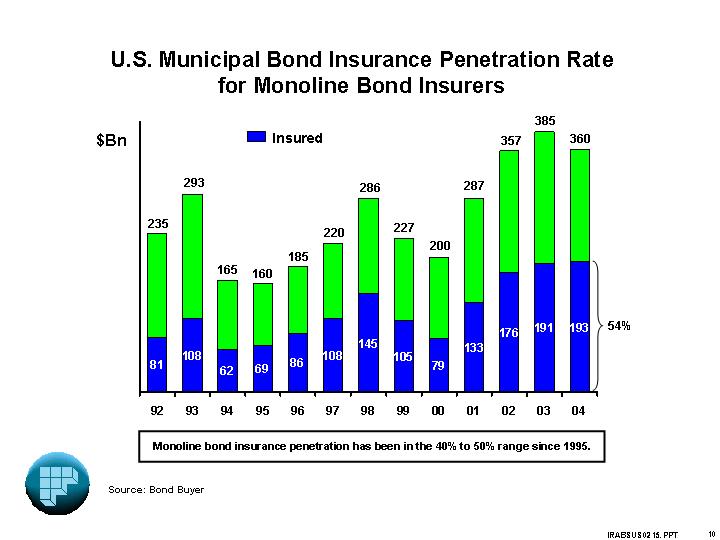
U.S. Municipal Bond Insurance Penetration Rate
for Monoline Bond Insurers
[CHART]
Monoline bond insurance penetration has been in the 40% to 50% range since 1995.
Source: Bond Buyer
10
Financial Security Assurance (FSA)
11
FSA - The Company
• FSA is a monoline financial guaranty company which was founded in 1985
• Rated Triple-A by S&P, Moody’s, Fitch Ratings, and Rating and Investment Information (Japan)
• Pioneered the asset-backed securities market
• Since inception, FSA has insured in excess of $422 billion of gross principal in ABS transactions
• Entered municipal market in 1990
• Since inception, FSA has insured in excess of $367 billion of gross principal related to municipal transactions
• Holding company: Financial Security Assurance Holdings Ltd. (FSA Holdings)
• Independent public company (NYSE) from 1994-2000
• Acquired by Dexia in July 2000
• Continues as a separately managed franchise, with oversight from Dexia
As of 12/31/04
12
Benefits of Dexia Ownership
• Enhanced stability
• FSA’s access to capital not dependent on stock market
• Dexia shares FSA’s conservative credit culture
• Opportunities for growth
• Incremental capital if needed
• Synergies, new products
• Increased visibility in the European market
• FSA has key role in Dexia’s global strategy
• Dexia is a world leader in public finance
13
FSA – Loss History
• Proven track record in quality underwriting and loss mitigation controls
Net par insured since inception: | | $ | 604Bn | |
Total Losses & LAE incurred: (1) | | $ | 208MM | |
Losses paid: | | $ | 160MM | |
Case reserve: | | $ | 48MM | (2) |
Total Losses & LAE incurred as % of net principal insured: 3.4 bps | |
• Average annual losses of only 0.7 bps of weighted average par outstanding over the past five years (2000-2004), and 1.3 bps of weighted average par outstanding over FSA’s 20 year history (1985-2004)
• FSA losses since inception by product line:
| | Net Par Insured | | Cumulative
Loss & LAE | | | |
Municipals | | $ | 265 billion | | $ | 20 million | | = 0.7 bps | |
Asset-backed Securities | | $ | 339 billion | | $ | 188 million | (3) | = 5.6 bps | |
• FSA’s GAAP non-specific loss reserve balance is $99 million at 12/31/04
As of 12/31/04. Statutory basis.
(1) Loss and LAE (Loss Adjustment Expense) incurred = includes claims paid and case reserves for expected future losses.
(2) GAAP net case reserve is $45 million
(3) Approximately 43% of this figure reflects losses associated with commercial real estate exposure. FSA discontinued that product line in the early 1990’s.
14
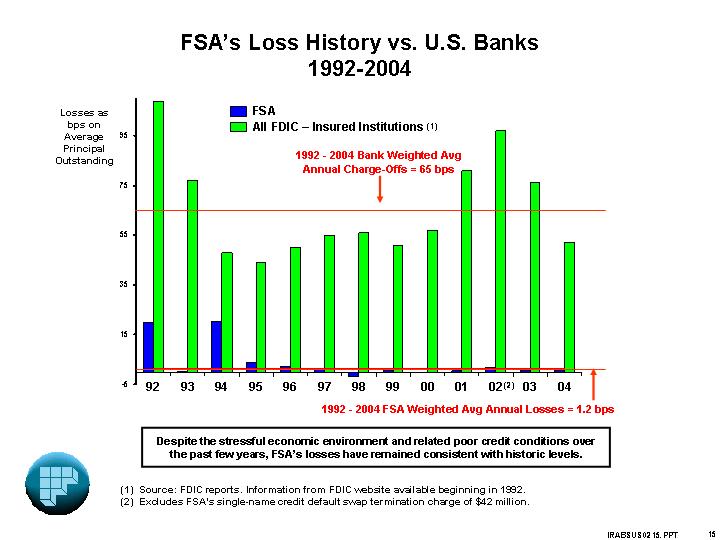
FSA’s Loss History vs. U.S. Banks
1992-2004
[CHART]
Despite the stressful economic environment and related poor credit conditions over the past few years, FSA’s losses have remained consistent with historic levels.
(1) Source: FDIC reports. Information from FDIC website available beginning in 1992.
(2) Excludes FSA’s single-name credit default swap termination charge of $42 million.
15
Priority Number One:
Preservation of Aaa/AAA Capital Strength
• Risk management
• Investment grade underwriting standard – low loss probability
• Low loss severity and high recovery potential
• Single and aggregate risk limitations
• Reinsurance
• Capital resources
• Hard and soft capital
• Unearned premium reserve and future installment premiums
• Large and high-quality investments
• Earnings stability
• Future revenue from business already written creates stable earning base. Approximately 90% of any year’s revenues known at the start of that year.
• No forced acceleration under financial guaranty policies
16
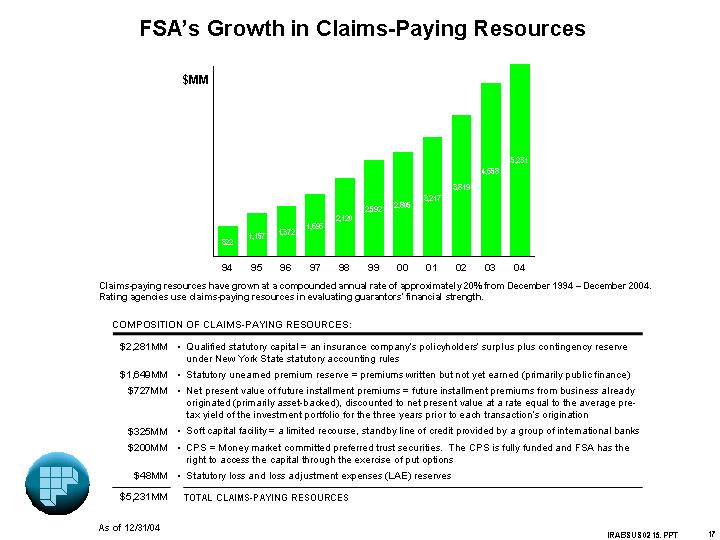
FSA’s Growth in Claims-Paying Resources
[CHART]
Claims-paying resources have grown at a compounded annual rate of approximately 20% from December 1994 –December 2004. Rating agencies use claims-paying resources in evaluating guarantors’ financial strength.
COMPOSITION OF CLAIMS-PAYING RESOURCES:
$ | 2,281MM | • | Qualified statutory capital = an insurance company’s policyholders’ surplus plus contingency reserve under New York State statutory accounting rules |
| | |
$ | 1,649MM | • | Statutory unearned premium reserve = premiums written but not yet earned (primarily public finance) |
| | |
$ | 727MM | • | Net present value of future installment premiums = future installment premiums from business already originated (primarily asset-backed), discounted to net present value at a rate equal to the average pre-tax yield of the investment portfolio for the three years prior to each transaction’s origination |
| | |
$ | 325MM | • | Soft capital facility = a limited recourse, standby line of credit provided by a group of international banks |
| | |
$ | 200MM | • | CPS = Money market committed preferred trust securities. The CPS is fully funded and FSA has the right to access the capital through the exercise of put options |
| | |
$ | 48MM | • | Statutory loss and loss adjustment expenses (LAE) reserves |
| | |
$ | 5,231MM | | TOTAL CLAIMS-PAYING RESOURCES |
As of 12/31/04
17
FSA’s Portfolio of Insured Transactions
is Highly Diversified
[CHART]
Total Net Par Outstanding: $326 Billion
As of 12/31/04. Statutory basis.
(1) CDS of CBOs and CDS of CLOs are included in CBOs and CLOs, respectively.
18
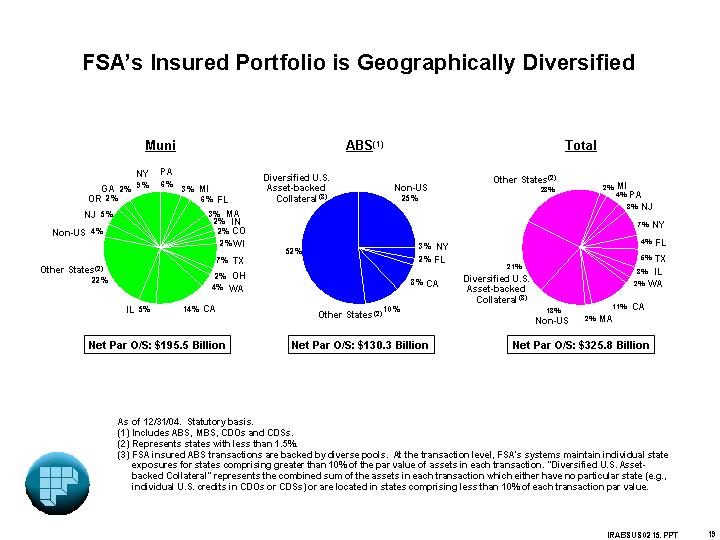
FSA’s Insured Portfolio is Geographically Diversified
Muni | | ABS(1) | | Total | |
| | | | | |
[CHART] | | [CHART] | | [CHART] | |
| | | | | |
Net Par O/S: $195.5 Billion | | Net Par O/S: $130.3 Billion | | Net Par O/S: $325.8 Billion | |
As of 12/31/04. Statutory basis.
(1) Includes ABS, MBS, CDOs and CDSs.
(2) Represents states with less than 1.5%.
(3) FSA insured ABS transactions are backed by diverse pools. At the transaction level, FSA’s systems maintain individual state exposures for states comprising greater than 10% of the par value of assets in each transaction. “Diversified U.S. Asset-backed Collateral” represents the combined sum of the assets in each transaction which either have no particular state (e.g., individual U.S. credits in CDOs or CDSs) or are located in states comprising less than 10% of each transaction par value.
19
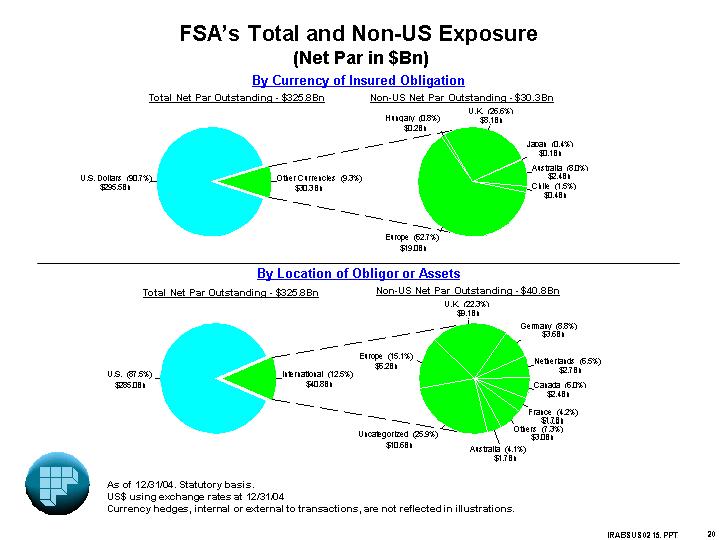
FSA’s Total and Non-US Exposure
(Net Par in $Bn)
By Currency of Insured Obligation
Total Net Par Outstanding - $325.8Bn
[CHART]
Non-US Net Par Outstanding - $30.3Bn
[CHART]
By Location of Obligor or Assets
Total Net Par Outstanding - $325.8Bn
[CHART]
Non-US Net Par Outstanding - $40.8Bn
[CHART]
As of 12/31/04. Statutory basis.
US$ using exchange rates at 12/31/04
Currency hedges, internal or external to transactions, are not reflected in illustrations.
20
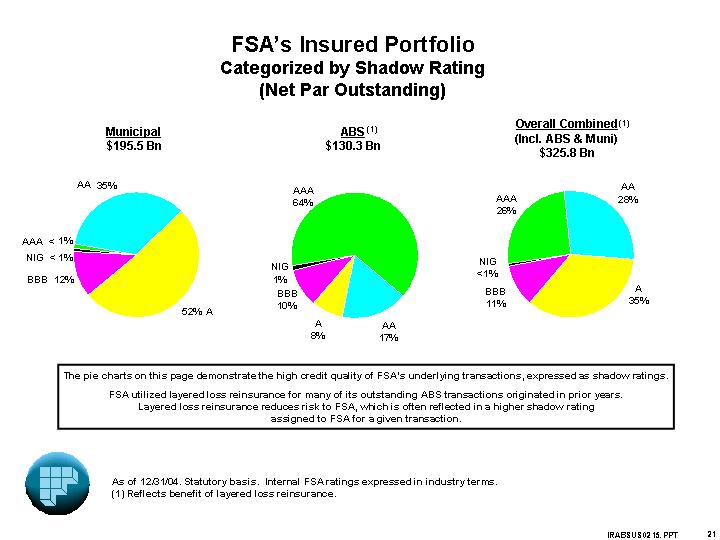
FSA’s Insured Portfolio
Categorized by Shadow Rating
(Net Par Outstanding)
Municipal | | ABS(1) | | Overall Combined(1) | |
$195.5 Bn | | $130.3 Bn | | $325.8 Bn | |
| | | | | |
[CHART] | | [CHART] | | [CHART] | |
The pie charts on this page demonstrate the high credit quality of FSA’s underlying transactions, expressed as shadow ratings.
FSA utilized layered loss reinsurance for many of its outstanding ABS transactions originated in prior years.
Layered loss reinsurance reduces risk to FSA, which is often reflected in a higher shadow rating
assigned to FSA for a given transaction.
As of 12/31/04. Statutory basis. Internal FSA ratings expressed in industry terms.
(1) Reflects benefit of layered loss reinsurance.
21
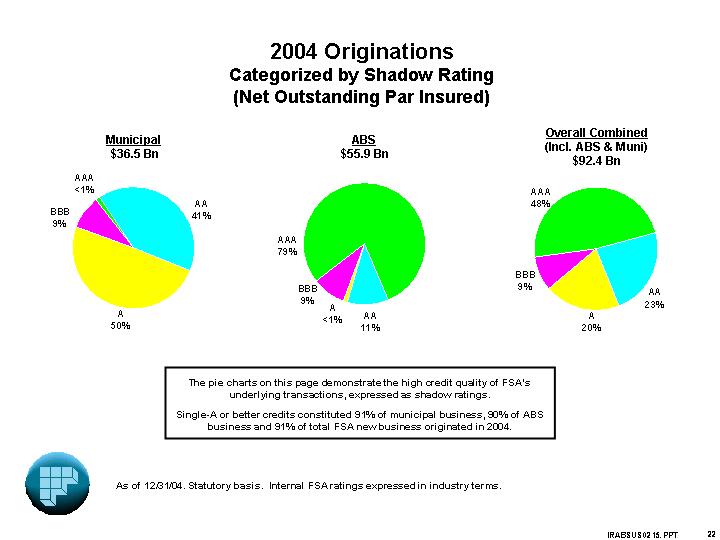
2004 Originations
Categorized by Shadow Rating
(Net Outstanding Par Insured)
Municipal | | ABS | | Overall Combined | |
$36.5 Bn | | $55.9 Bn | | $92.4 Bn | |
| | | | | |
[CHART] | | [CHART] | | [CHART] | |
The pie charts on this page demonstrate the high credit quality of FSA’s underlying transactions, expressed as shadow ratings.
Single-A or better credits constituted 91% of municipal business, 90% of ABS business and 91% of total FSA new business originated in 2004.
As of 12/31/04. Statutory basis. Internal FSA ratings expressed in industry terms.
22
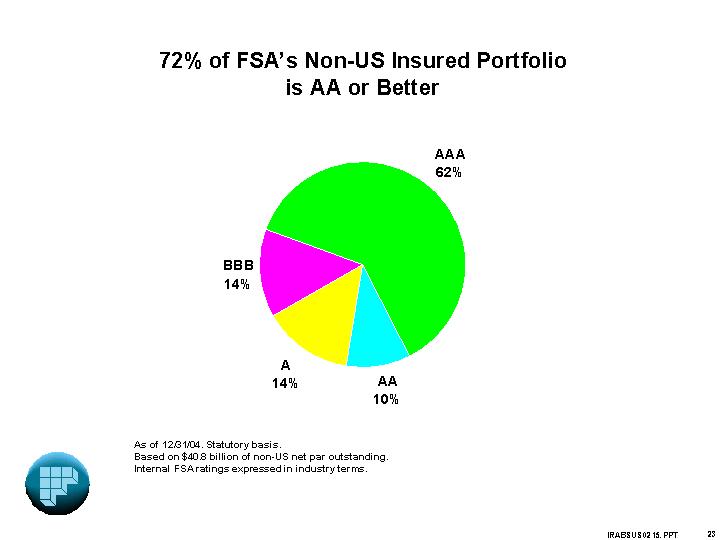
72% of FSA’s Non-US Insured Portfolio
is AA or Better
[CHART]
As of 12/31/04. Statutory basis.
Based on $40.8 billion of non-US net par outstanding.
Internal FSA ratings expressed in industry terms.
23
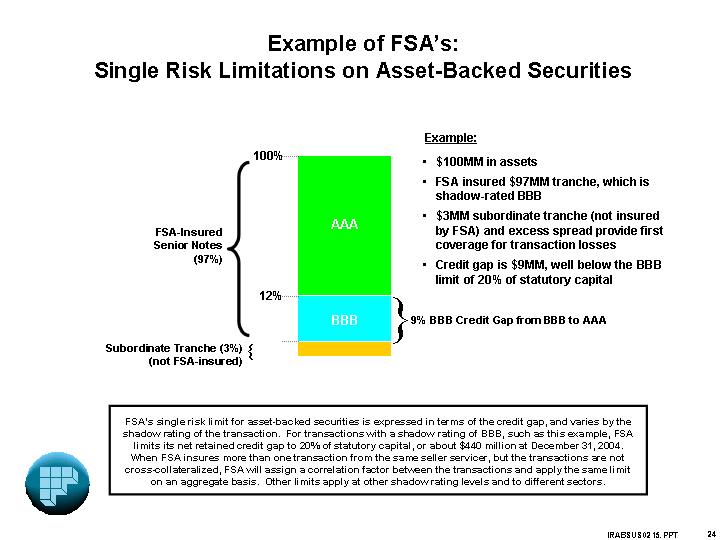
Example of FSA’s:
Single Risk Limitations on Asset-Backed Securities
| | | Example: |
| | | | |
| | | • | $100MM in assets |
| | | | |
| | | • | FSA insured $97MM tranche, which is |
| | | | shadow-rated BBB |
| | [CHART] | | |
| | | • | $3MM subordinate tranche (not insured |
| | | | by FSA) and excess spread provide first |
| | | | coverage for transaction losses |
| | | | |
| | | • | Credit gap is $9MM, well below the BBB |
| | | | limit of 20% of statutory capital |
| | | | |
FSA’s single risk limit for asset-backed securities is expressed in terms of the credit gap, and varies by the shadow rating of the transaction. For transactions with a shadow rating of BBB, such as this example, FSA limits its net retained credit gap to 20% of statutory capital, or about $440 million at December 31, 2004. When FSA insures more than one transaction from the same seller servicer, but the transactions are not cross-collateralized, FSA will assign a correlation factor between the transactions and apply the same limit on an aggregate basis. Other limits apply at other shadow rating levels and to different sectors.
24
Reinsurers of FSA’s Portfolio
| | | | Ratings(1) | | % of Total
FSA
Portfolio(2) | |
| | | | | | | |
• | | The Tokio Marine and Nichido Fire Insurance Co., Ltd. | | Aa2/AA- | | 6.4 | % |
• | | Assured Guaranty Corp. (3) | | Aa1/AAA | | 4.9 | % |
• | | Radian Asset Assurance Inc. (4) | | Aa3/AA | | 4.4 | % |
• | | RAM Reinsurance Company. Ltd. | | Aa3/AAA | | 2.1 | % |
• | | XL Financial Assurance Ltd. | | Aaa/AAA | | 1.4 | % |
• | | Assured Guaranty Re International Ltd. (5) | | Aa2/AA | | 1.1 | % |
• | | Blue Point Re Ltd. | | Aa3/AA | | 0.8 | % |
• | | CDC IXIS Financial Guaranty N.A. | | Aaa/AAA | | 0.6 | % |
• | | Other/Bank CDS | | | | 4.7 | % |
| | | | | | 26.4 | % |
(1) Ratings as of 1/26/05
(2) As of 12/31/04
(3) Ace Guaranty Re Inc. became Assured Guaranty Corp. in April 2004
(4) Radian Reinsurance merged with Radian Asset Assurance in June 2004
(5) Ace Capital Re International Ltd. became Assured Guaranty Re International Ltd. In April 2004
25
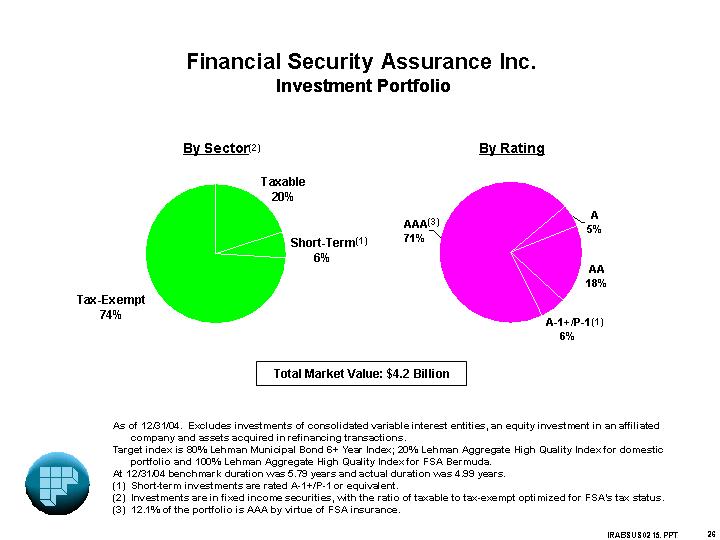
Financial Security Assurance Inc.
Investment Portfolio
By Sector(2) | | By Rating |
| | |
[CHART] | | [CHART] |
| | |
Total Market Value: $4.2 Billion |
As of 12/31/04. Excludes investments of consolidated variable interest entities, an equity investment in an affiliated company and assets acquired in refinancing transactions.
Target index is 80% Lehman Municipal Bond 6+ Year Index; 20% Lehman Aggregate High Quality Index for domestic portfolio and 100% Lehman Aggregate High Quality Index for FSA Bermuda.
At 12/31/04 benchmark duration was 5.79 years and actual duration was 4.99 years.
(1) Short-term investments are rated A-1+/P-1 or equivalent.
(2) Investments are in fixed income securities, with the ratio of taxable to tax-exempt optimized for FSA’s tax status.
(3) 12.1% of the portfolio is AAA by virtue of FSA insurance.
26
FSA’s New Business Revenue Growth
is Strong and Diverse…
[CHART]
27
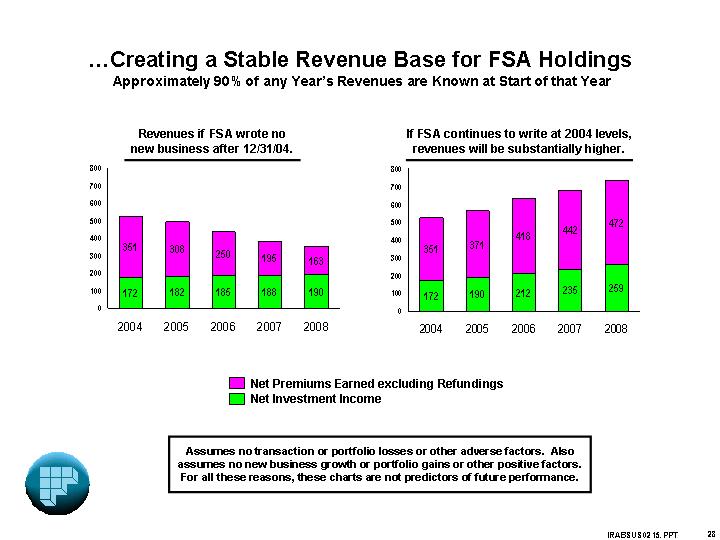
…Creating a Stable Revenue Base for FSA Holdings
Approximately 90% of any Year’s Revenues are Known at Start of that Year
Revenues if FSA wrote no
new business after 12/31/04. | | If FSA continues to write at 2004 levels,
revenues will be substantially higher. |
| | |
[CHART] | | [CHART] |
Assumes no transaction or portfolio losses or other adverse factors. Also assumes no new business growth or portfolio gains or other positive factors. For all these reasons, these charts are not predictors of future performance.
28
FSA’s Primary Business Lines
29
Primary Business Lines
• Municipal / Governmental: Financial guaranty insurance policies on municipal securities
• Public Finance: bonds issued by governmental entities (general obligation, revenue bonds)
• Other Municipal Finance: bonds issued by not-for-profit entities operating essential public services (e.g., healthcare)
• Infrastructure Finance: essential infrastructure financings (PFI / PPP / Project Finance)
• ABS: Financial guaranty insurance policies on asset-backed securities
• Consumer receivables (auto loans, credit cards, etc.)
• Residential mortgage-backed securities
• Pooled corporate (primarily funded and synthetic CDOs)
• Other asset-backed
• Variable Interest Entities (VIEs)
• Financial Products(1)
• Guaranteed Investment Contracts (GICs)
(1) GICs are issued by subsidiaries of FSA Holdings.
30
Public Finance
• General Obligations
• Secured by municipality’s pledge to levy taxes to service debt
• Other Tax-Supported Issues
• Secured by specific tax revenues, such as sales taxes or special assessments
• Revenue Bonds
• Secured by dedicated revenue streams from essential public services such as highway tolls, mass transit fares, airport revenues, electricity receivables, etc.
• Affordable Housing Bonds
• Secured by revenues from single-family and multi-family housing programs of state and local housing finance agencies (generally subsidized to produce below-market rents or loans)
• FSA losses from inception through 12/31/04 (including case reserves for expected losses) 0.7 bps ($20MM)
• According to Moody’s, from 1970 to 2000, municipal bonds experienced lower loss rates and higher recovery rates than Aaa rated corporate bonds (only 18 issuers)(1)
(1) “Moody’s U.S. Municipal Bond Rating Scale”, November 2002. (Most recent Moody’s report update)
31
International Infrastructure Finance
(PFI / Project Finance)
• Net exposure of 1.1% of total portfolio
• Conservative underwriting standards
• No currency mismatch
• Sovereign foreign and local currency ratings to be at least investment grade (100% A or better domestic currency ratings)
• Essential public facilities
• Appropriate structures to mitigate risks
• Extensive use of reinsurance arrangements
• PFI: UK-type Public Private Partnership with no material revenue risk
• Project Finance: limited to essential infrastructure concession-based projects (e.g., government accommodations, public hospitals, toll roads)
• No losses to date
As of 12/31/04
32
Asset-Backed Securities
• Consumer Receivables (autos and credit cards) - secured by diversified pools of loans to individuals, collateralized by:
• Security interests in automobiles in the case of autos
• Overcollateralization of insured obligations
• Cash reserves
• Excess interest spread
• Mortgages - secured by diversified pools of residential mortgage loans to homeowners. Includes home equity loans, home equity lines of credit, NIMs, jumbo and Alt. A mortgages collateralized by:
• Mortgage filed against the homes
• Overcollateralization of insured obligations
• Excess interest spread
• Pooled corporates - secured by diversified pools of corporate loans or other corporate obligations, collateralized by:
• Overcollateralization of insured notes and excess interest spread with CLOs
• First loss deductibles with CDS
• FSA losses from inception through 12/31/04 (including case reserves for expected losses) 5.6 bps ($188MM)(1)
(1) Approximately 43% of this figure reflects losses associated with commercial real estate exposure. FSA discontinued that product line in the early 1990’s.
33
Variable Interest Entities (VIEs)
Since all investments (other than high-quality, short-term investments in the VIEs) are insured by FSA, the rating agencies incorporate these risks in their analysis of FSA’s insured portfolio.
Assets in these programs go through the same underwriting and senior management approval process as all other securities insured by FSA.
Credit exposure of the VIE invested assets are included in FSA’s reported leverage.
In January 2003, FASB issued Interpretation No. 46 on “Consolidation of Variable Interest Entities”. As a result, effective July 1, 2003, FSA consolidated FSA Global Funding Limited. In addition, FSA obtained control provisions of another VIE, Premier International Funding, on July 1, 2003 and accordingly consolidated Premier beginning July 1, 2003.
• FSA Global Funding Limited (“FSA Global”): Established in 1998, FSA Global issues FSA-insured medium-term notes through a process known as “reverse inquiry” (meaning that the investor requests the issuance of a note to suit its own specific investments needs – resulting in lower-than-market funding costs for FSA). Proceeds from these notes are invested in FSA-insured obligations, have cash flows that substantially match those of the FSA-issued notes (matched funding of assets and liabilities) and produce a positive interest margin, which results in additional remuneration on an existing risk. At 12/31/04, FSA’s consolidated financial statements include $2.1Bn principal amount outstanding related to this entity, with an additional $300MM of obligations related to Premier.
34
Guaranteed Investment Contracts (GICs)
• This business combines low cost of funding with investments in high-quality, liquid ABS/MBS to earn an attractive Net Interest Margin (NIM) for the holding company
• Structure
• FSA Capital Management Services receives funds and, in return, issues an FSA-guaranteed GIC
• Proceeds are invested to earn NIM
• Exposure of the invested assets are included in FSA’s reported leverage
• The rating agencies review and apply capital charges to all risks embedded in this business
• Two primary funding channels
• Municipal GICs – low-cost funding available because of municipal issuers’ need for reliable investment returns along with high-quality credit protection and flexibility
• Structured GICs – attractive funding available because of need for AAA credit enhancement and the added value of FSA’s structuring expertise
• Strategy
• At 12/31/04, $8.6Bn in GIC principal outstanding
• Assets and liabilities converted to floating rate – eliminating material interest rate risk
• Asset duration equal to or shorter than funding
• Focus on ABS investments to maximize use of FSA analytical skills and market knowledge
• Very high credit standards (underlying ratings currently 91% AAA or equivalent)(1)
(1) 17.0% of the portfolio is AAA by virtue of FSA insurance which includes 8.7% of inter-company notes issued as a result of FSA refinanced transactions.
35
Monoline Financial Guarantor Comparison
36
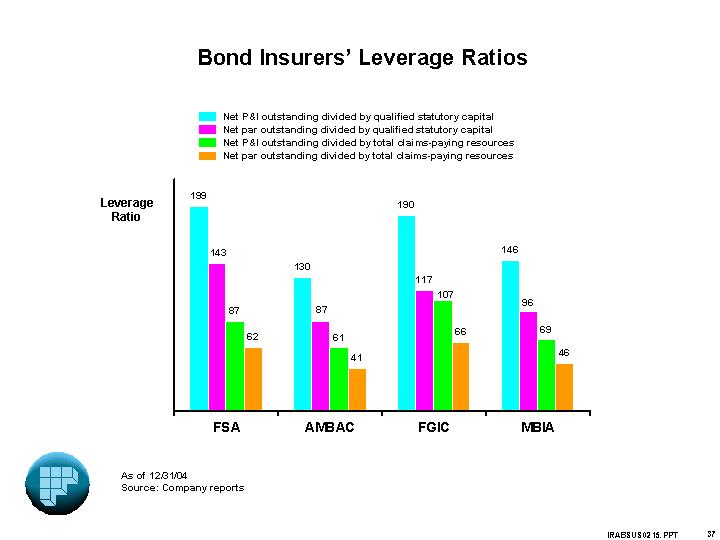
Bond Insurers’ Leverage Ratios
[CHART]
As of 12/31/04
Source: Company reports
37
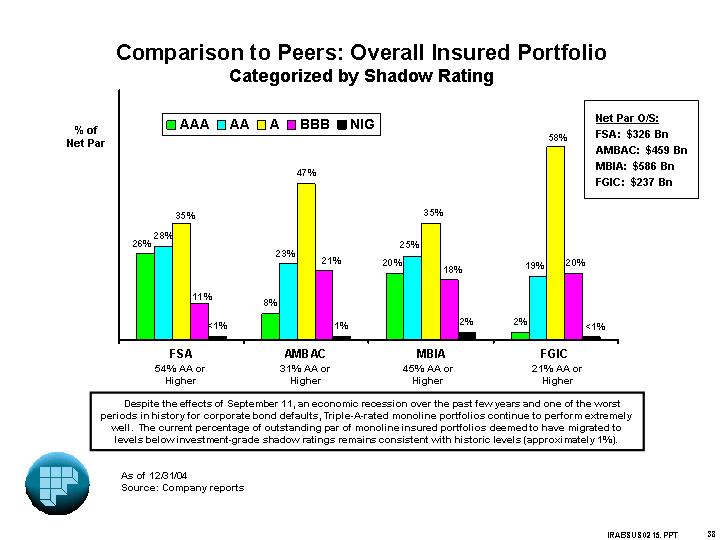
Comparison to Peers: Overall Insured Portfolio
Categorized by Shadow Rating
[CHART]
Net Par O/S:
FSA: $326 Bn
AMBAC: $459 Bn
MBIA: $586 Bn
FGIC: $237 Bn
Despite the effects of September 11, an economic recession over the past few years and one of the worst periods in history for corporate bond defaults, Triple-A-rated monoline portfolios continue to perform extremely well. The current percentage of outstanding par of monoline insured portfolios deemed to have migrated to levels below investment-grade shadow ratings remains consistent with historic levels (approximately 1%).
As of 12/31/04
Source: Company reports
38
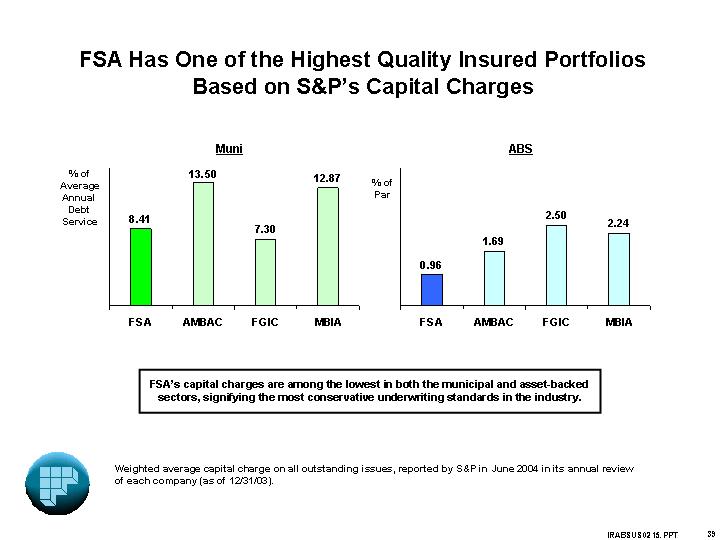
FSA Has One of the Highest Quality Insured Portfolios
Based on S&P’s Capital Charges
FSA’s capital charges are among the lowest in both the municipal and asset-backed sectors, signifying the most conservative underwriting standards in the industry.
Weighted average capital charge on all outstanding issues, reported by S&P in June 2004 in its annual review of each company (as of 12/31/03).
39
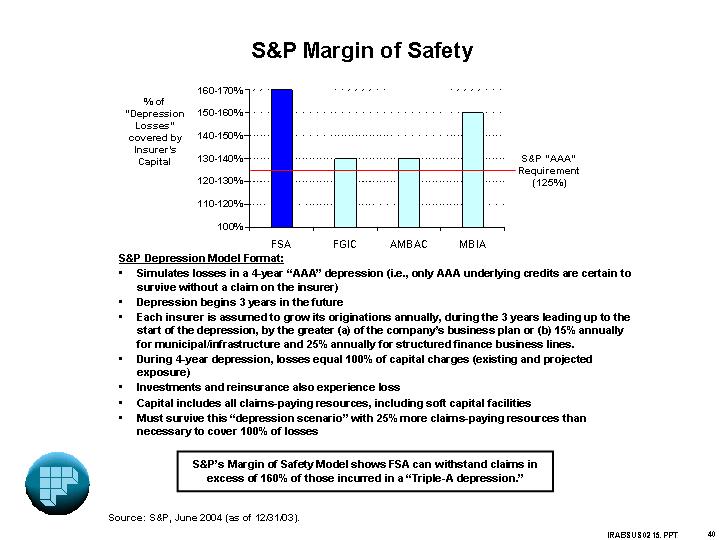
S&P Margin of Safety
[CHART]
S&P Depression Model Format:
• Simulates losses in a 4-year “AAA” depression (i.e., only AAA underlying credits are certain to survive without a claim on the insurer)
• Depression begins 3 years in the future
• Each insurer is assumed to grow its originations annually, during the 3 years leading up to the start of the depression, by the greater (a) of the company’s business plan or (b) 15% annually for municipal/infrastructure and 25% annually for structured finance business lines.
• During 4-year depression, losses equal 100% of capital charges (existing and projected exposure)
• Investments and reinsurance also experience loss
• Capital includes all claims-paying resources, including soft capital facilities
• Must survive this “depression scenario” with 25% more claims-paying resources than necessary to cover 100% of losses
S&P’s Margin of Safety Model shows FSA can withstand claims in excess of 160% of those incurred in a “Triple-A depression.”
Source: S&P, June 2004 (as of 12/31/03).
40
Moody’s Portfolio Risk Model
• Monte Carlo estimate of the probability distribution of potential credit losses on the existing portfolio
• Each (obligor-based) exposure is defined by its
• Net par (adjusted for benefit from reinsurance)
• Expected default rate (rating, maturity, sector-specific)
• Expected loss severity (PV concept, sector-specific)
• Sources of correlation risk explicitly modeled
• Seller/servicer risk concentrations
• Country-level emerging-market concentrations
• Industry risk concentrations
• Macroeconomic volatility
41
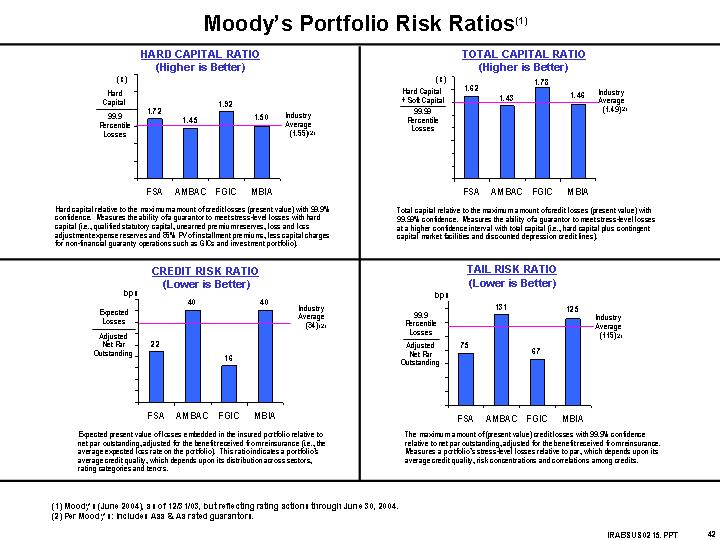
Moody’s Portfolio Risk Ratios(1)
HARD CAPITAL RATIO | | TOTAL CAPITAL RATIO |
(Higher is Better) | | (Higher is Better) |
| | |
[CHART] | | [CHART] |
| | |
Hard capital relative to the maximum amount of credit losses (present value) with 99.9% confidence. Measures the ability of a guarantor to meet stress-level losses with hard capital (i.e., qualified statutory capital, unearned premium reserves, loss and loss adjustment expense reserves and 85% PV of installment premiums, less capital charges for non-financial guaranty operations such as GICs and investment portfolio). | | Total capital relative to the maximum amount of credit losses (present value) with 99.99% confidence. Measures the ability of a guarantor to meet stress-level losses at a higher confidence interval with total capital (i.e., hard capital plus contingent capital market facilities and discounted depression credit lines). |
| | |
CREDIT RISK RATIO | | TAIL RISK RATIO |
(Lower is Better) | | (Lower is Better) |
| | |
[CHART] | | [CHART] |
| | |
Expected present value of losses embedded in the insured portfolio relative to net par outstanding, adjusted for the benefit received from reinsurance (i.e., the average expected loss rate on the portfolio). This ratio indicates a portfolio’s average credit quality, which depends upon its distribution across sectors, rating categories and tenors. | | The maximum amount of (present value) credit losses with 99.9% confidence relative to net par outstanding, adjusted for the benefit received from reinsurance. Measures a portfolio’s stress-level losses relative to par, which depends upon its average credit quality, risk concentrations and correlations among credits. |
(1) Moody’s (June 2004), as of 12/31/03, but reflecting rating actions through June 30, 2004.
(2) Per Moody’s: Includes Aaa & Aa rated guarantors.
42
APPENDICES:
A: ABS Transactions – FSA’s Underwriting Approach
B: CDO Portfolio – Overview
C: Monoline Default Swap Spreads
D: Municipal Bond Industry Loss and Recovery Rates
E: What a Typical Guaranty Covers
F: Additional Holding Company Information
43
APPENDIX A
ABS Transactions – FSA’s Underwriting Approach
44
Transaction Structures
FSA uses the following protections and remedies, as appropriate for its various transactions types.
• Minimize direct corporate exposures
• Bankruptcy remote SPVs
• Term to term servicing agreements
• Maintain active relationship with back-up servicers
• Transactions structured to improve over time
• Credit enhancement levels of approximately 2-5x coverage of expected losses
• Use of excess spread and reserves to create additional protection
• Use of performance trigger events to increase collateral protection
• 3-Month rolling average delinquency test
• Cumulative net losses as a % of original principal balance test
• Cumulative gross defaults as a % of original principal balance test
• 3-Month rolling average net losses as a % of declining principal balance test
• “Step-up” required reserves and/or overcollateralization levels
• Use technical default triggers to protect FSA and bondholders in instances of negative performance
• Servicer termination rights
• FSA is the controlling party
• Supplemental premiums
• Use of 100% of asset cash flows to build enhancement for insured bonds or “turbo” principal payments on insured bonds
45
Extensive Due Diligence
• Due diligence staff responsible for conducting loan file reviews
• On-site operational reviews to evaluate the quality of the originator and the servicers’ operations and management expertise
• Loan charge-off reviews to evaluate servicers’ adherence to collection procedures and to develop expected loss severity assumptions
• Corporate Underwriting Research Group responsible for performing extensive corporate credit review of the issuer and/or servicer to ascertain their financial stability
• In-house attorneys responsible for legal aspects of document review and legal structuring of transaction
46
ABS Surveillance
Organization
• 25+ professionals organized into teams of specialists that are responsible for monitoring each ABS transaction through maturity
Objectives
• Identify and intervene early in transactions not performing up to expectations
• Provide feedback to underwriting process to benefit future transactions
• Handle all post-closing matters (amendments, waivers, etc.)
• Conduct on-site servicing reviews
• Monitor payments and compliance
• Update internal shadow ratings on transactions based upon actual versus originally expected performance and FSA coverage levels
• Recommend case-specific reserves for transactions in which loss is probable and can be reasonably estimated
Performance
• Have successfully transferred servicing in auto, mortgage and CDO transactions
• Have detected misapplication of funds in transactions which led to corrective action prior to a “problem” developing
• Have worked with servicers to develop creative solutions to deficiencies
47
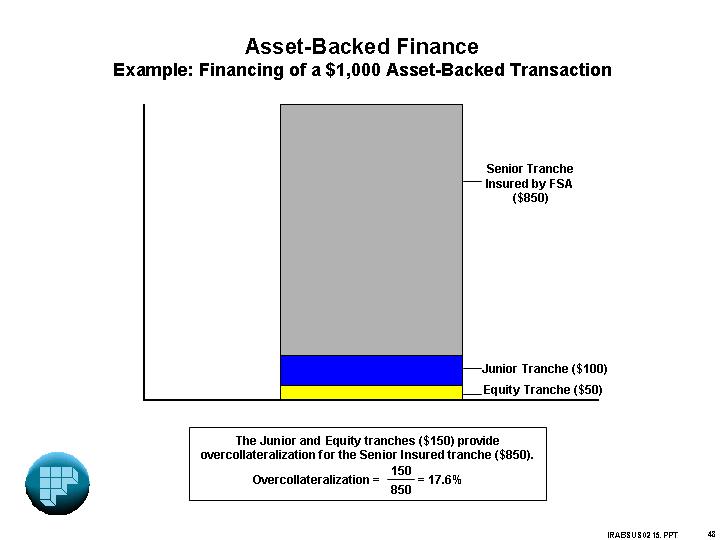
Asset-Backed Finance
Example: Financing of a $1,000 Asset-Backed Transaction
[CHART]
The Junior and Equity tranches ($150) provide overcollateralization for the Senior Insured tranche ($850).
Overcollateralization = | 150 | = 17.6% |
850 |
48
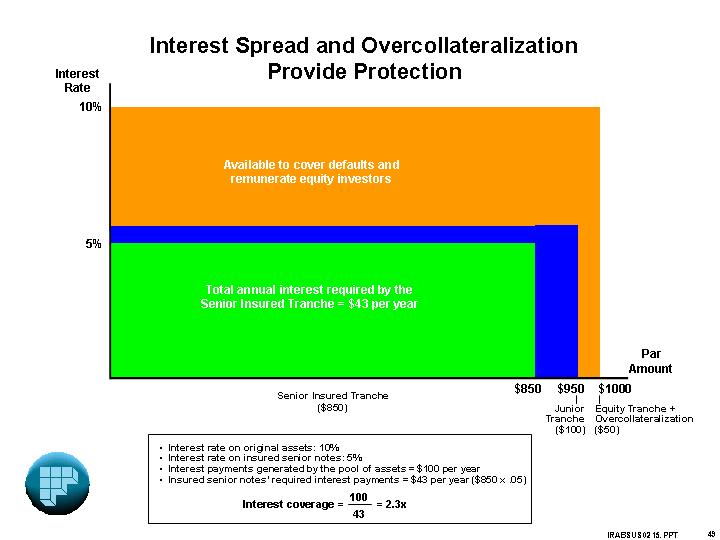
Interest Spread and Overcollateralization
Provide Protection
[CHART]
• Interest rate on original assets: 10%
• Interest rate on insured senior notes: 5%
• Interest payments generated by the pool of assets = $100 per year
• Insured senior notes’ required interest payments = $43 per year ($850 x .05)
Interest coverage = | 100 | = 2.3x |
43 |
49
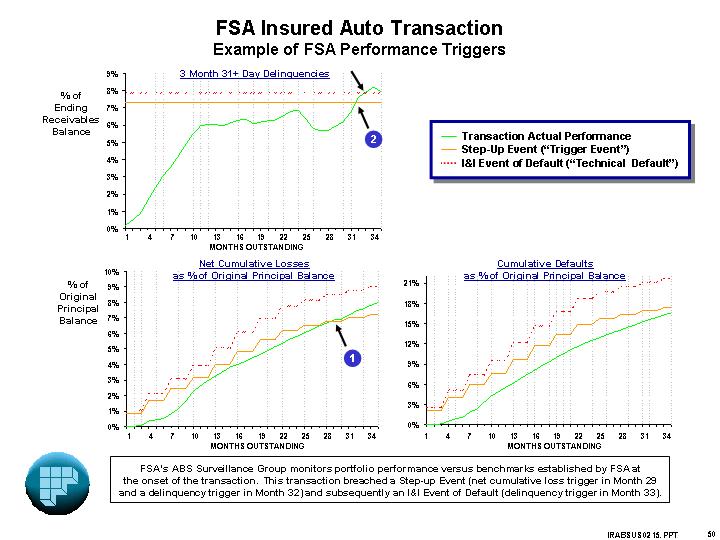
FSA Insured Auto Transaction
Example of FSA Performance Triggers
3 Month 31 + Day Delinquencies | | |
| | |
[CHART] | | |
| | |
Net Cumulative Losses | | Cumulative Defaults |
as % of Original Principal Balance | | as % of Original Principal Balance |
| | |
[CHART] | | [CHART] |
FSA’s ABS Surveillance Group monitors portfolio performance versus benchmarks established by FSA at the onset of the transaction. This transaction breached a Step-up Event (net cumulative loss trigger in Month 29 and a delinquency trigger in Month 32) and subsequently an I&I Event of Default (delinquency trigger in Month 33).
50
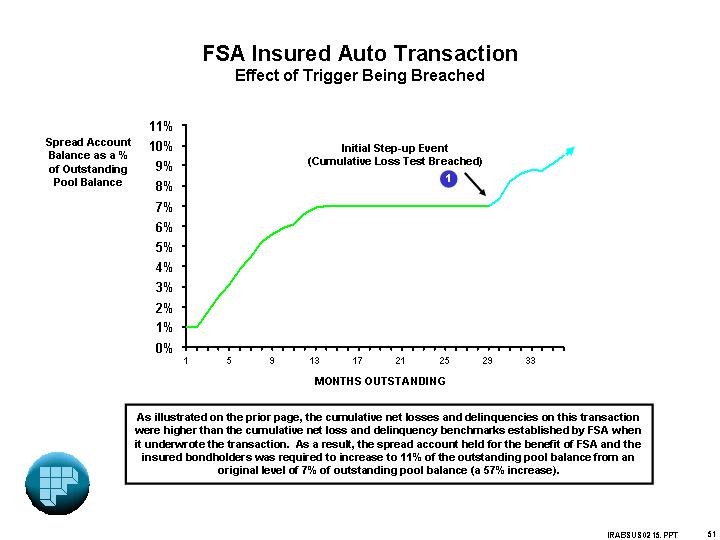
FSA Insured Auto Transaction
Effect of Trigger Being Breached
[CHART]
As illustrated on the prior page, the cumulative net losses and delinquencies on this transaction were higher than the cumulative net loss and delinquency benchmarks established by FSA when it underwrote the transaction. As a result, the spread account held for the benefit of FSA and the insured bondholders was required to increase to 11% of the outstanding pool balance from an original level of 7% of outstanding pool balance (a 57% increase).
51
FSA Insured Auto Transaction
Cumulative Losses and FSA Breakeven Levels
[CHART]
During the period when the deal was performing within tolerance levels, spread (i.e., protection) was released. However, once the performance deteriorated past trigger levels, additional spread was captured. Therefore, despite FSA’s Revised Expected Losses on this transaction being more than double Original Expected Losses, the remaining protection on this transaction at 35 months was still 2.1 times the remaining expected losses (see diagram with dotted lines in upper right corner). Additionally, at the 35th month, deal had paid down over 70% of its original par.
52
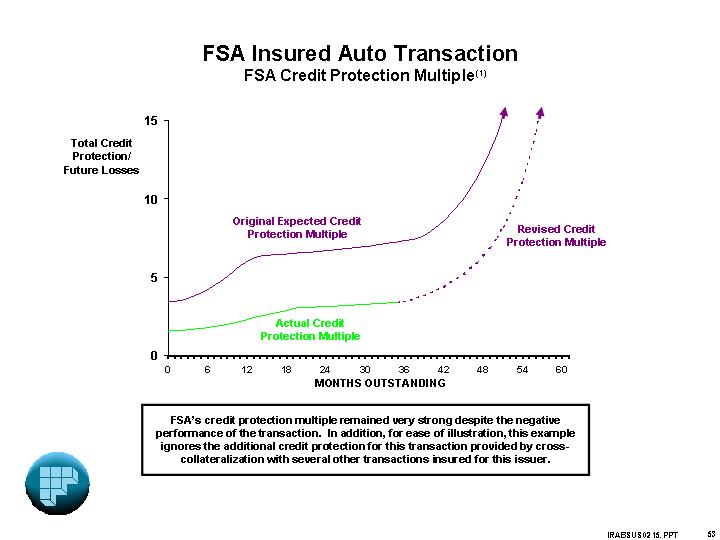
FSA Insured Auto Transaction
FSA Credit Protection Multiple(1)
[CHART]
FSA’s credit protection multiple remained very strong despite the negative performance of the transaction. In addition, for ease of illustration, this example ignores the additional credit protection for this transaction provided by cross-collateralization with several other transactions insured for this issuer.
53
APPENDIX B
CDO Portfolio - Overview
54
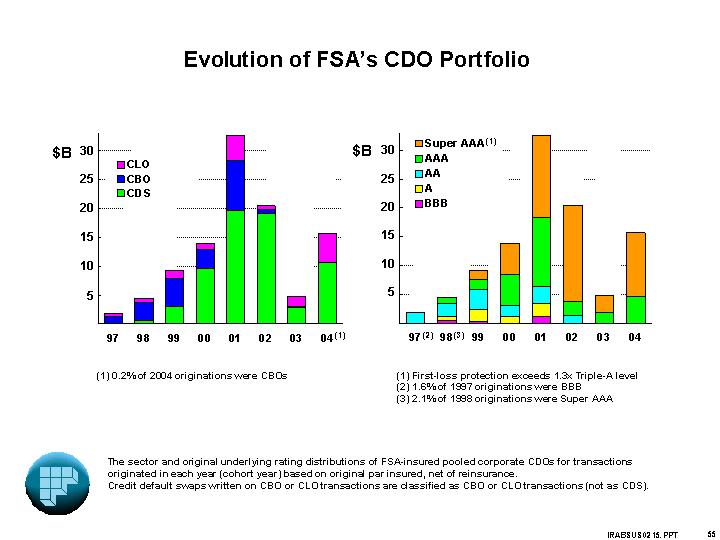
Evolution of FSA’s CDO Portfolio
[CHART] | | [CHART] |
| | |
| |
|
(1) 0.2% of 2004 originations were CBOs | | (1) First-loss protection exceeds 1.3x Triple-A level |
| | (2) 1.6% of 1997 originations were BBB |
| | (3) 2.1% of 1998 originations were Super AAA |
The sector and original underlying rating distributions of FSA-insured pooled corporate CDOs for transactions originated in each year (cohort year) based on original par insured, net of reinsurance.
Credit default swaps written on CBO or CLO transactions are classified as CBO or CLO transactions (not as CDS).
55
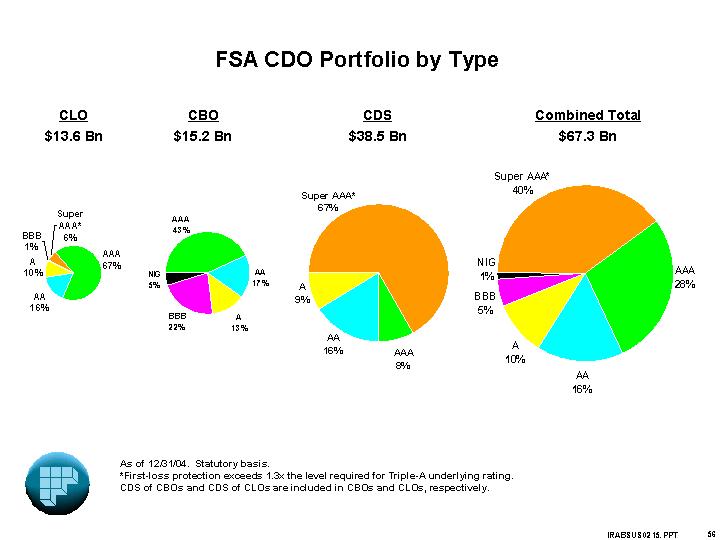
FSA CDO Portfolio by Type
CLO | | CBO | | CDS | | Combined Toral | |
$13.6 Bn | | $15.2 Bn | | $38.5 Bn | | $67.3 Bn | |
| | | | | | | |
[CHART] | | [CHART] | | [CHART] | | [CHART] | |
As of 12/31/04. Statutory basis.
*First-loss protection exceeds 1.3x the level required for Triple-A underlying rating.
CDS of CBOs and CDS of CLOs are included in CBOs and CLOs, respectively.
56
Moody’s U.S One-Year Speculative-Grade Default Rate
[CHART]
Moody’s U.S. speculative default rate peaked at 11.1% in 2001 and declined to 2.69% for the 12 months ending December 31, 2004.
57
APPENDIX C
Monoline Default Swap Spreads
58
Monoline Default Swap Spreads
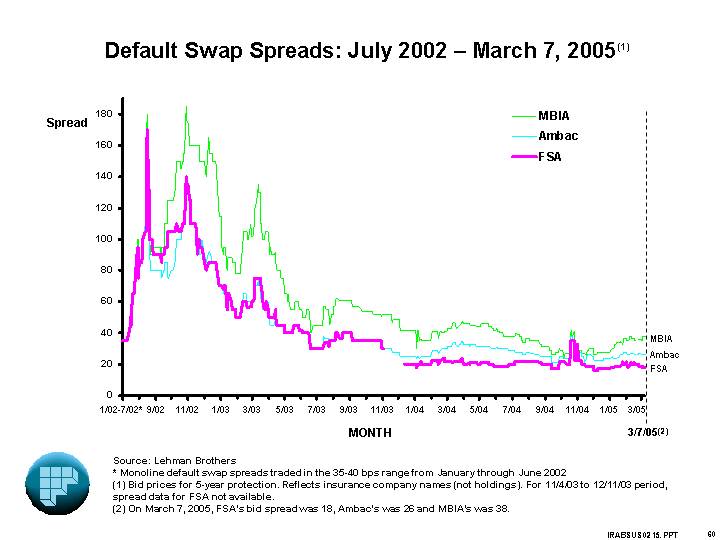
• Despite some volatility of default swap spreads on the monolines over the last 2.5 years, FSA’s spreads have remained relatively stable since the beginning of 2004. At March 7, 2005 FSA’s spread was the tightest in the industry at 18 bps.
• Drivers of monoline default swap spreads
• Few natural sellers of monoline protection (supply/demand inbalance)
• Thinly traded market
• Difficulty of quantifying “credit event” risk across the full spectrum of the monoline’s insured book
• Wide array of potential reference obligations and deliverable obligations (for settling a loss protection amount)
• Hedgers of specific obligations must evaluate joint probability of default of FSA and the insured underlying obligation
• Hedge fund speculation activity
• Spreads on monoline wrapped funded securities remain stable despite volatility in monoline default swap spreads.
59
Default Swap Spreads: July 2002 –March 7, 2005(1)
[CHART]
Source: Lehman Brothers
*Monoline default swap spreads traded in the 35-40 bps range from January through June 2002
(1) Bid prices for 5-year protection. Reflects insurance company names (not holdings). For 11/4/03 to 12/11/03 period, spread data for FSA not available.
(2) On March 7, 2005, FSA’s bid spread was 18, Ambac’s was 26 and MBIA’s was 38.
60
APPENDIX D
Municipal Bond Industry Loss and Recovery Rates
61
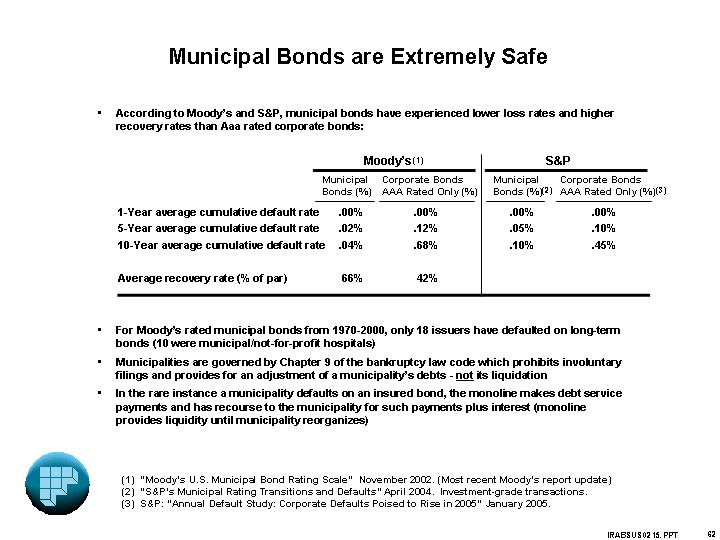
Municipal Bonds are Extremely Safe
• According to Moody’s and S&P, municipal bonds have experienced lower loss rates and higher recovery rates than Aaa rated corporate bonds:
| | Moody’s(1) | | S&P | |
| | Municipal
Bonds (%) | | Corporate Bonds
AAA Rated Only (%) | | Municipal
Bonds (%)(2) | | Corporate Bonds
AAA Rated Only (%)(3) | |
1-Year average cumulative default rate | | .00% | | .00% | | .00% | | .00% | |
5-Year average cumulative default rate | | .02% | | .12% | | .05% | | .10% | |
10-Year average cumulative default rate | | .04% | | .68% | | .10% | | .45% | |
| | | | | | | | | |
Average recovery rate (% of par) | | 66% | | 42% | | | | | |
• For Moody’s rated municipal bonds from 1970-2000, only 18 issuers have defaulted on long-term bonds (10 were municipal/not-for-profit hospitals)
• Municipalities are governed by Chapter 9 of the bankruptcy law code which prohibits involuntary filings and provides for an adjustment of a municipality’s debts - not its liquidation
• In the rare instance a municipality defaults on an insured bond, the monoline makes debt service payments and has recourse to the municipality for such payments plus interest (monoline provides liquidity until municipality reorganizes)
(1) “Moody’s U.S. Municipal Bond Rating Scale” November 2002. (Most recent Moody’s report update)
(2) “S&P’s Municipal Rating Transitions and Defaults” April 2004. Investment-grade transactions.
(3) S&P: “Annual Default Study: Corporate Defaults Poised to Rise in 2005” January 2005.
62
APPENDIX E
What a Typical Guaranty Covers
63
What a Typical FSA Guaranty Covers*
Mortgage Transactions
• Timely payment of monthly interest at the note rate
• Timely payment of monthly scheduled principal (based on reductions to the mortgage pool balance) such that the outstanding principal balance of the FSA-Insured Notes is not greater than the outstanding principal balance of the mortgage pool collateral
• Ultimate payment of any outstanding principal balance of the FSA-Insured Notes on the final legal maturity date
Automobile Loan Transactions
• Timely payment of monthly interest at the note rate
• Timely payment of monthly scheduled principal (as defined in policy) such that the outstanding principal balance of the FSA-Insured Notes is not greater than the outstanding principal balance of the pool collateral
• Ultimate payment of any outstanding principal balance of the FSA-Insured Notes on the final legal maturity date
Collateralized Debt Obligations
• Timely payment of current interest at the note rate
• Ultimate payment of the outstanding principal balance of the FSA-Insured Notes on the stated maturity date
* This page is intended to provide a general description of the most common forms of coverage provided by an FSA insurance policy within each of FSA’s three main ABS product lines. Certain policies issued by FSA may contain forms of coverage that differ from the forms described above.
64
The Value of FSA Insurance
• Irrevocable and unconditional guaranty of principal and interest
• FSA waives ALL defenses - including fraud, and non-payment of premiums
• Downgrade protection/market value protection
• 7.51% of U.S. ABS securities were downgraded by S&P in the 12 months ending Dec. 31, 2004(1)
• FSA’s underwriting process includes intensive due diligence and documentation which provides remedies and, as appropriate, establishes FSA as the “controlling party”
• Unlike a trustee, FSA has capital at risk, and interests aligned with bondholders
• Active surveillance
• FSA’s surveillance team provides ongoing oversight of transaction servicer’s operations
• FSA’s quick remedial action (e.g. transfer of servicing) in certain ABS transactions has mitigated “headline risk” to bondholders
• FSA provides consultation for investors
(1) Source: S&P “Ratings Transitions 2004: U.S. ABS Rating Stability Improves Despite Adverse Behavior of Manufactured Housing Securities.” January 2005.
65
APPENDIX F
Additional Holding Company Information
66
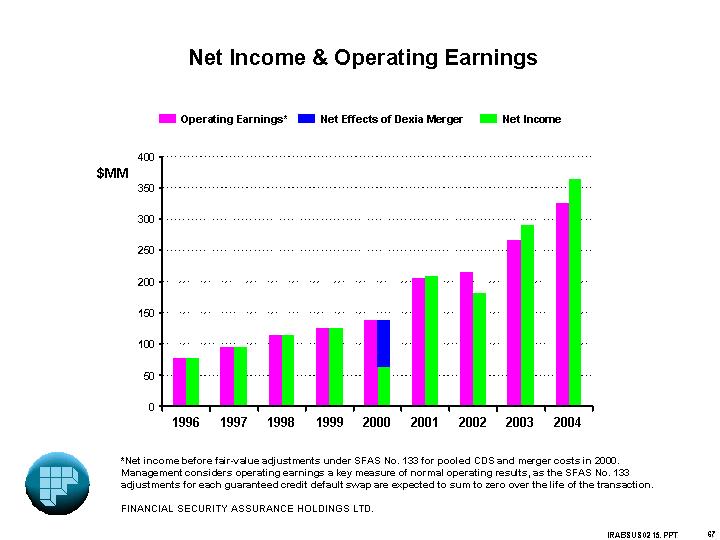
Net Income & Operating Earnings
[CHART]
*Net income before fair-value adjustments under SFAS No. 133 for pooled CDS and merger costs in 2000. Management considers operating earnings a key measure of normal operating results, as the SFAS No. 133 adjustments for each guaranteed credit default swap are expected to sum to zero over the life of the transaction.
FINANCIAL SECURITY ASSURANCE HOLDINGS LTD.
67
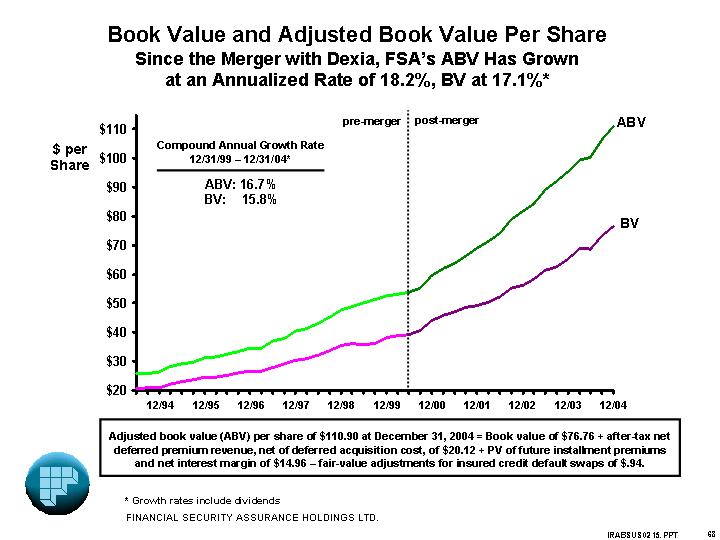
Book Value and Adjusted Book Value Per Share
Since the Merger with Dexia, FSA’s ABV Has Grown
at an Annualized Rate of 18.2%, BV at 17.1%*
[CHART]
Adjusted book value (ABV) per share of $110.90 at December 31, 2004 = Book value of $76.76 + after-tax net deferred premium revenue, net of deferred acquisition cost, of $20.12 + PV of future installment premiums and net interest margin of $14.96 – fair-value adjustments for insured credit default swaps of $.94.
* Growth rates include dividends
FINANCIAL SECURITY ASSURANCE HOLDINGS LTD.
68
NON-GAAP MEASURES
This presentation includes measures that are promulgated in accordance with accounting principles generally accepted in the United States of America (GAAP measures) and measures not so promulgated (non-GAAP measures). This presentation is meant to be read in conjunction with the most recent Annual Report on Form 10-K for Financial Security Assurance Holdings Ltd. (the Company), which contains, for non-GAAP measures, a presentation of and reconciliation to the most comparable GAAP measures.
This presentation contains information about the non-GAAP measures “operating earnings” and “adjusted book value.” The Company defines operating earnings as net income before the effects of fair-value adjustments for FSA-insured credit default swaps (CDS) that are required to be marked to fair value under GAAP accounting principles. The Company views insured CDS risks as comparable to other insured risks and enters into such non-cancelable contracts fully intending to hold them to maturity. Management expects that the mark-to-market adjustments for each guaranteed CDS will sum to zero over the life of the transaction. Management therefore considers operating earnings a key measure of normal operating results.
Management defines the non-GAAP measure, “adjusted book value” (ABV), as GAAP book value
plus the after-tax effect of:
(1) unearned premium revenues, net of amounts ceded to reinsurers
(2) the present value of installment-based premiums, net of amounts ceded to reinsurers
(3) the present value of future net interest margin from the Company’s Financial Products operations
less the after-tax effect of
(1) the deferred costs of acquiring policies
(2) fair-value adjustments for insured CDS.
Management believes that the intrinsic value of the Company comprises not only book value and franchise value, but also the estimated present value of future income from business it has already originated. Such future income is substantial because premiums are earned over the life of each insured transaction. For this reason, management considers ABV, which captures these forms of deferred income, to be a reasonable proxy for the intrinsic value of the Company, exclusive of franchise value.
This presentation also contains certain other non-GAAP measures, such as total claims-paying resources, which are based on statutory accounting principles applicable to insurance companies. Management uses such measures because the measures are required by regulators or used by rating agencies to assess the capital adequacy of the Company.
69
FORWARD-LOOKING STATEMENTS
The Company relies on the safe harbor for forward-looking statements provided by the Private Securities Litigation Reform Act of 1995. This safe harbor requires that the Company specify important factors that could cause actual results to differ materially from those contained in forward-looking statements made by or on behalf of the Company. Accordingly, forward-looking statements by the Company and its affiliates are qualified by reference to the following cautionary statements.
In its filings with the SEC, reports to shareholders, press releases and other written and oral communications, the Company from time to time makes forward-looking statements. Such forward-looking statements include, but are not limited to, (1) projections of revenues, income (or loss), earnings (or loss) per share, dividends, market share or other financial forecasts; (2) statements of plans, objectives or goals of the Company or its management, including those related to growth in adjusted book value or return on equity; and (3) expected losses on, and adequacy of loss reserves for, insured transactions. Words such as “believes,” “anticipates,” “expects,” “intends” and “plans” and similar expressions are intended to identify forward-looking statements but are not the exclusive means of identifying such statements.
The Company cautions that a number of important factors could cause actual results to differ materially from the plans, objectives, expectations, estimates and intentions expressed in forward-looking statements made by the Company. These factors include:
• changes in capital requirements or other criteria of securities rating agencies applicable to financial guaranty insurers in general or to FSA specifically
• competitive forces, including the conduct of other financial guaranty insurers in general
• changes in domestic or foreign laws or regulations applicable to the Company, its competitors or its clients
• changes in accounting principles or practices that may result in a decline in securitization transactions
• an economic downturn or other economic conditions (such as a rising interest rate environment) adversely affecting transactions insured by FSA or its investment portfolio
• inadequacy of reserves established by the Company for losses and loss adjustment expenses
• temporary or permanent disruptions in cash flow on FSA-insured structured transactions attributable to legal challenges to such structures
• downgrade or default of one or more of FSA’s reinsurers
• the amount and nature of business opportunities that may be presented to the Company
• market conditions, including the credit quality and market pricing of securities issued
• capacity limitations that may impair investor appetite for FSA-insured obligations
• market spreads and pricing on insured credit default swap exposures, which may result in gain or loss due to mark-to-market accounting requirements
• prepayment speeds on FSA-insured asset-backed securities and other factors that may influence the amount of installment premiums paid to FSA
• changes in the value or performance of strategic investments made by the Company
• other factors, most of which are beyond the Company’s control.
The Company cautions that the foregoing list of important factors is not exhaustive. In any event, such forward-looking statements made by the Company speak only as of the date on which they are made, and the Company does not undertake any obligation to update or revise such statements as a result of new information, future events or otherwise.
70