Exhibit 99.2
Photo cover: New Jiang Wan Cultural Center
Nestled in the city’s last wetland preserve, Shanghai’s latest and most comprehensive urban development, New Jiangwan Town, is a model for a sustainable community for the 21st Century. In its heart is a new cultural center, designed to showcase the area’s environmental sensitivity and celebrate the vibrant and evolving community. The center was designed by RTKL.
ARCADIS NV
Nieuwe Stationsstraat 10, 6811 KS, Arnhem, The Netherlands
P.O. Box 33, 6800 LE, Arnhem, The Netherlands
Tel +31 26 3778911
Fax +31 26 4438381
E-mail ir@arcadis.nl
Internet www.arcadis-global.com
Chamber of Commerce Arnhem, The Netherlands Trade registry no. 09051284
VAT: NL 0062.93.700.B.01
For other company addresses see page 146 of this report.
Safe Harbor Provision
Except for the historical information contained herein, the statements in this report are forward-looking statements that are made pursuant to the safe harbor provisions of the Private Securities Litigation Reform Act of 1995. Forward-looking statements involve known and unknown risks and uncertainties that may cause the Company’s actual results in future periods to differ materially from forecasted results. Those risks include, among others, risks associated with possible changes in environmental legislation, changes in investment flow for infrastructure, changes in the investment climate for buildings, and more generally, risks related to the Company’s ability to acquire and execute projects. These and other risks are described in the Report by the Executive Board and in ARCADIS’ filings with the Securities and Exchange Commission (SEC) over the last 12 months, copies of which are available from the SEC, upon request from the Company, or on the Company’s website.
Table of contents
Highlights 2007 | 4 |
Selected financial data | 5 |
The ARCADIS Share | 6 |
Position in the market | 10 |
Mission and Profile | 12 |
Brief overview of |
|
Company activities |
|
Introduction | 14 |
Report by the Executive Board | 17 |
Vision and strategy | 17 |
Results and financing | 27 |
Developments by business line | 34 |
· Infrastructure | 34 |
· Environment | 38 |
· Buildings | 42 |
Developments by region | 46 |
· The Netherlands | 46 |
· Europe excluding the Netherlands | 47 |
· United States | 48 |
· Rest of the world | 49 |
Human Resources Management | 50 |
Risk management | 53 |
Sustainable business conduct | 57 |
Outlook 2008 | 63 |
Report by the Supervisory Board | 65 |
Information on members of the Supervisory and Executive Boards | 72 |
Remuneration Report | 75 |
Corporate Governance | 81 |
Financial Statements 2007 | 87 |
Consolidated balance sheet | 88 |
Consolidated statement of income | 89 |
Consolidated statement of cash flows | 90 |
Consolidated statement of changes in equity | 91 |
Notes to the consolidated financial statements | 92 |
Company balance sheet | 132 |
Company statement of income | 133 |
Notes to the Company balance sheet | 133 |
Notes to the Company statement of income | 137 |
Other information | 139 |
Auditor’s report | 140 |
Ten-year summary | 142 |
Other financial data | 144 |
Company addresses | 145 |
Geographical distribution/ Organization structure | 146 |
3
Highlights 2007

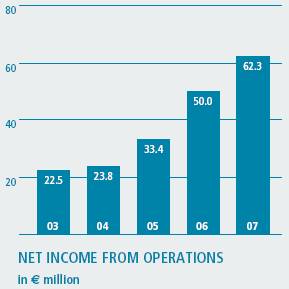
Net income from operations
25% higher (before amortization and non-operational items)
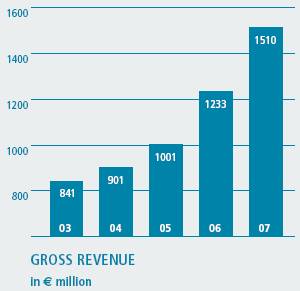
Gross revenue
rose 22% to € 1.5 billion
Organic growth
at record level of 16% and strong across business lines and geographies
Margin improves further
to 10.5%, well beyond the goal of 10%
Environment shows exceptional organic growth
at 22%, mainly coming from the United States where we gained market share
Infrastructure market strong
with organic growth of 13%, mainly from the Netherlands and Brazil
Strong expansion in Buildings
with 71% growth, mainly through acquisitions, but also good organic growth of 11%
Milestone acquisition of RTKL
puts ARCADIS on the world map in architecture and high end urban planning
Seven new acquisitions
add in total € 192 million in gross revenue and almost 1500 new colleagues
Breakthrough contract in water management for New Orleans
of (maximum) US$ 150 million establishes global reputation in this field
Strategy sharpened
growth goal increased to 15% of which at least half organic
Divisional structure introduced in operating companies
to be better aligned with key clients and markets across geographies
NASDAQ listing ended
because of low trading volumes and relatively high costs
4
Selected financial data
Amounts in millions of euros unless otherwise stated
Revenue |
| 2007 |
| 2006 |
| 2005 |
| 2004 |
| 2003 |
|
Gross revenue |
| 1,510 |
| 1,233 |
| 1,001 |
| 901 |
| 841 |
|
Net revenue |
| 1,004 |
| 837 |
| 703 |
| 633 |
| 595 |
|
Operating results |
|
|
|
|
|
|
|
|
|
|
|
EBITA |
| 107.2 |
| 78.8 |
| 60.4 |
| 35.9 |
| 36.0 |
|
EBITA recurring |
| 105.9 |
| 78.8 |
| 57.3 |
| 39.1 |
| 36.0 |
|
Operating income |
| 95.0 |
| 70.5 |
| 54.4 |
| 35.5 |
| 34.9 |
|
Associates |
| (0.8 | ) | (0.5 | ) | 1.4 |
| 2.4 |
| 2.6 |
|
Net income from operations(1) |
| 62.3 |
| 50.0 |
| 33.4 |
| 23.8 |
| 22.5 |
|
Net income |
| 54.9 |
| 44.9 |
| 33.4 |
| 22.2 |
| 21.4 |
|
Return on average invested capital (in %) |
| 20.1 |
| 20.3 |
| 20.6 |
| 17.2 |
| 15.9 |
|
Capital employed |
|
|
|
|
|
|
|
|
|
|
|
Balance sheet total |
| 921.7 |
| 736.5 |
| 650.1 |
| 442.3 |
| 347.3 |
|
Total long-term capital employed |
| 428.9 |
| 366.2 |
| 346.3 |
| 197.9 |
| 193.8 |
|
Total equity |
| 199.2 |
| 200.7 |
| 188.1 |
| 145.4 |
| 144.1 |
|
Total equity as % of balance sheet total |
| 22 |
| 27 |
| 29 |
| 33 |
| 41 |
|
Interest coverage ratio |
| 14 |
| 17 |
| 17 |
| 10 |
| 13 |
|
Net debt to EBITDA ratio |
| 1.0 |
| 0.4 |
| 0.6 |
| (0.1 | ) | 0.1 |
|
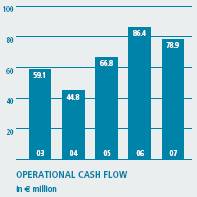
Net cash provided by operating activities |
| 78.9 |
| 86.4 |
| 66.8 |
| 44.8 |
| 59.1 |
|
|
|
|
|
|
|
|
|
|
|
|
|
Total shares outstanding at December 31 (in thousands) |
| 20,167 |
| 20,305 |
| 20,270 |
| 20,299 |
| 20,017 |
|
|
|
|
|
|
|
|
|
|
|
|
|
Data per share (in euros) |
|
|
|
|
|
|
|
|
|
|
|
Net income from operations |
| 3.06 |
| 2.47 |
| 1.65 |
| 1.18 |
| 1.13 |
|
Net income |
| 2.70 |
| 2.22 |
| 1.65 |
| 1.10 |
| 1.07 |
|
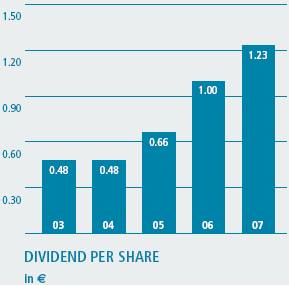
Dividend proposal |
| 1.23 |
| 1.00 |
| 0.66 |
| 0.48 |
| 0.48 |
|
Shareholders’ equity |
| 9.09 |
| 9.15 |
| 8.53 |
| 6.61 |
| 6.68 |
|
Personnel(2) |
|
|
|
|
|
|
|
|
|
|
|
Average number of contract employees |
| 11,304 |
| 9,685 |
| 9,208 |
| 9,419 |
| 8,827 |
|
Average number of employees total(3) |
| 12,408 |
| 10,728 |
| 10,043 |
| 9,972 |
| 9,203 |
|
Total number of employees at December 31(3) |
| 13,391 |
| 11,533 |
| 10,101 |
| 10,474 |
| 9,724 |
|
(1) Net income excluding amortization and non-recurring items
(2) The headcount includes the total number of employees of proportionally consolidated companies
(3) Including temporary staff
The 2003 financial data are not adjusted to comply with the International Financial Reporting Standards (IFRS).
5
The ARCADIS share
Stock exchange listings
ARCADIS shares are listed at Euronext Amsterdam under the symbol ARCAD. The shares are no longer listed at the NASDAQ Stock Exchange, since the delisting became effective on June 7, 2007. The decision to delist was based on the relatively low trading volume of ARCADIS shares on the NASDAQ and the fact that the costs associated with a NASDAQ listing and the reporting requirements of the U.S. Securities and Exchange Commission outweigh the benefits of such a listing. The Company remains committed to the U.S. market and to U.S. shareholders. After the NASDAQ delisting, U.S. shareholders are able to trade ARCADIS shares in the United States in the over-the-counter (OTC) market under the symbol ARCAY. ARCADIS has offered to cover conversion fees and expenses for a period of 6 months following delisting for those shareholders who decided to convert their shares from New York registry shares to shares that are eligible for trading on the Euronext. As a result of delisting from the NASDAQ, the Company expects the liquidity of share trading in the U.S. to be reduced substantially, allowing for deregistration with the Securities and Exchange Commission on or about June 8, 2008.
On the Euronext Amsterdam exchange, two liquidity providers are active in the ARCADIS share: ABN AMRO Bank and Rabo Securities. As of March 4, 2008, the ARCADIS share is part of the Amsterdam Midkap Index® (AMX) of the Euronext.
Investor Relations
ARCADIS has an active investor relations (IR) policy aimed at keeping existing and potential shareholders well informed about the strategy and recent developments in the Company. ARCADIS follows a quarterly reporting cycle for its financials and, in addition, informs the market through press releases on important developments and positioning project wins. Twice a year, at the presentation of the annual and semiannual results, ARCADIS organizes a financial press conference and an analyst meeting, which are broadcast live over the internet. At the presentation of the first and third quarter results, a conference call is held for financial analysts, also accessible through a live audio link through the ARCADIS website.
6
Annual General Meeting of Shareholders
The Annual General Meeting of Shareholders (GMS) is scheduled for May 7, 2008 at 2:00 p.m. and will be held at the Company headquarters in the Rijntoren building in Arnhem, the Netherlands. The agenda for this meeting will be available on April 7, 2008 upon request from the Company and/or can be found on the Company’s website.
Dividend
It is proposed that the 2007 cash dividend be € 1.23 per share, compared to € 1.00 for 2006. This equals 40% of net income from operations. ARCADIS’ dividend policy is to pay an annual dividend ranging from 30% to 40% of net income from operations.
Historical development of the number of outstanding shares
|
|
|
| Issuance of |
|
|
|
|
|
|
|
|
|
|
| new shares |
|
|
|
|
| At |
|
|
|
|
| related to |
|
|
|
|
| December |
|
|
| At January 1 |
| options |
| Repurchase |
| Reissuance |
| 31 |
|
2003 |
| 19,996,674 |
| 133,703 |
| 112,972 |
| — |
| 20,017,405 |
|
2004 |
| 20,017,405 |
| 215,238 |
| 11,900 |
| 78,000 |
| 20,298,743 |
|
2005 |
| 20,298,743 |
| — |
| 332,046 |
| 303,239 |
| 20,269,936 |
|
2006 |
| 20,269,936 |
| — |
| 494,838 |
| 529,890 |
| 20,304,988 |
|
2007 |
| 20,304,988 |
| — |
| 350,000 |
| 212,197 |
| 20,167,185 |
|
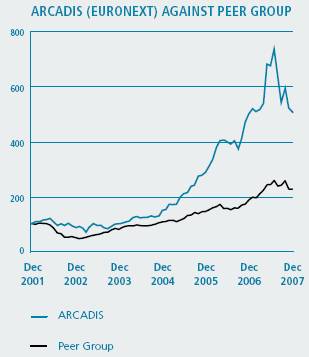
Share price development
On the first trading day of 2007, the share price on the Euronext Amsterdam exchange closed at € 46.81, while at the end of the year, it closed at € 47.30, only a slight increase. In mid-July, the stock price reached an all time high of € 70.00 on the back of strong Company performance and a positive newsflow. After that date, market sentiment turned away from small cap stocks primarily under influence of the subprime crisis. Despite continued solid Company performance and the acquisition of RTKL Inc., ARCADIS stock development was negatively influenced by this subprime effect, probably also as a result of the Company’s exposure to the U.S. market. In 2007, the Amsterdam Smallcap Index (AScX) of which ARCADIS was a part in 2007, decreased 6% during the same period.
7

Closing prices per share on Euronext Amsterdam NV
In € |
| High |
| Low |
| Year-end |
|
2003 |
| 10.50 |
| 6.41 |
| 9.34 |
|
2004 |
| 13.75 |
| 9.40 |
| 13.70 |
|
2005 |
| 27.18 |
| 13.08 |
| 26.80 |
|
2006 |
| 46.70 |
| 26.60 |
| 46.70 |
|
2007 |
| 68.85 |
| 42.92 |
| 47.30 |
|
Liquidity increased further
The liquidity of ARCADIS shares saw a 15% increase. The average daily trading volume on Euronext Amsterdam in 2007 was 69,231 shares, compared to 60,122 shares per day in 2006. In combination with a higher average share price, the total trading volume expressed in euros in 2007 was enough to propel ARCADIS into the Amsterdam Midkap Index®, after having spent only two years in the Amsterdam Smallcap Index (AScX).
Data per share in €
|
| 2007 |
| 2006 |
| 2005 |
| 2004 |
| 2003(2) |
| 2002(2) |
| 2001(2) |
|
Net income from operations |
| 3.06 |
| 2.47 |
| 1.65 |
| 1.18 |
| 1.13 |
| 1.23 |
| 1.14 |
|
Net income |
| 2.70 |
| 2.22 |
| 1.65 |
| 1.10 |
| 1.07 |
| 1.23 |
| 1.24 |
|
Dividend |
| 1.23 | (1) | 1.00 |
| 0.66 |
| 0.48 |
| 0.48 |
| 0.48 |
| 0.44 |
|
Shareholder’s equity |
| 9.09 |
| 9.15 |
| 8.53 |
| 6.61 |
| 6.68 |
| 6.64 |
| 6.59 |
|
(1) Proposed dividend
(2) Not adjusted for IFRS
Peer group
To benchmark its performance, ARCADIS has selected a group of peer companies. This group consists of international, public companies in the consulting and engineering business with activities and a size comparable to ARCADIS. This peer group includes the following companies: Grontmij (Euronext Exchange); Atkins (London Stock Exchange); Pöyry (Helsinki Stock Exchange); TRC Companies (New York Stock Exchange); Tetra Tech (NASDAQ Stock Market); URS Corporation (New York Stock Exchange); Sweco (The Nordic Exchange); Alten (Euronext Paris); WSP (London Stock Exchange).
8
“The total trading volume was enough to propel ARCADIS into the Amsterdam Midkap Index®”
Ownership information
Under the Disclosure of Major Holdings in Listed Companies Act, we received the following notifications of the status of capital interest:
Stichting Lovinklaan |
| 20.2% (in the Company register year-end 2007) |
Vereniging KNHM |
| 5.2% (in the Company register year-end 2007) |
Fortis NV |
| 6.1% (situation end 2007) |
Delta Deelnemingen Fonds |
| 5.2% (situation end 2007) |
Reach Capital |
| 5.8% (notification 2007) |
Delta Lloyd |
| 5.5% (notification 2008) |
Financial calendar 2008 (tentative)
May 7 |
| First quarter 2008, conference call and live web cast |
May 7 |
| Annual General Meeting of Shareholders |
May 9 |
| Ex-dividend quotation |
May 23 |
| Dividend payment date |
August 7 |
| Second quarter 2008, Press conference, analyst meeting and live web cast |
November 12 |
| Third quarter 2008, conference call and live web cast |
9
Position in the market
Clients
ARCADIS works for a broad range of clients from the public and private sectors.
· Infrastructure: numerous government entities, such as municipalities, provinces, states, water boards, national governments or management organizations for railroads and roads. Also work for utility companies, project developers, contractors or other companies and for consortia in public-private partnership (PPP) projects.
· Environment: primarily companies (oil and gas, chemical industry, transportation, etc.), of which many multinationals. Also work for governments at different levels, such as the U.S. Department of Defense.
· Buildings: primarily real estate owners, managers or operators: companies, developers, banks, hotel operators, etc. and semi-public institutions such as hospitals and schools. But also governments, for urban planning or institutional real estate – such as museums or work for governments as regulators.
Active in the entire value chain
ARCADIS provides services in the entire value chain: consultancy, planning, design, engineering and management services based on the knowledge and experience of highly educated professionals. The focus lies in providing services with higher added value. The key is an

10
early involvement in projects based on solid client relationships. In the contracting phase of projects, we perform construction management services. In turnkey projects, the execution is primarily outsourced. For the management and maintenance phase, we provide facility management services in which the execution is outsourced.
Competitive position
Many markets in which we operate have a local character. To compete effectively with the many small and larger players, solid client relationships and a thorough knowledge of local conditions are key. That is why ARCADIS wants to belong in local markets to the top five, and in the United States, to the top ten. In most European countries where we operate and in Brazil and Chile, we have a top five position. In the United States, we are currently in the top 20.
In larger projects and in sectors of the environmental and buildings markets, the competition is more international. In environment, ARCADIS is positioned in the global top three, and in environmental services for private-sector firms, we are number one. Only a limited number of companies can internationally deliver environmental services to multinationals. ARCADIS has a similar competitive advantage in the buildings market for international developers or investors.
Top ten in the world*
1 |
|
| URS |
| United States |
|
2 |
|
| AECOM |
| United States |
|
3 |
|
| Altran Technologies |
| France |
|
4 |
|
| CH2M HILL |
| United States |
|
5 |
|
| Atkins |
| United Kingdom |
|
6 |
|
| SNC-Lavalin Group |
| Canada |
|
7 |
|
| Parsons Corporation |
| United States |
|
8 |
|
| Parsons Brinckerhoff |
| United States |
|
9 |
|
| ARCADIS |
| The Netherlands |
|
10 |
|
| Fugro |
| The Netherlands |
|
Top three in Europe*
1 |
|
| Altran Technologies |
| France |
|
2 |
|
| Atkins |
| United Kingdom |
|
3 |
|
| ARCADIS |
| The Netherlands |
|
*) Source: Swedish Federation of Consulting Engineers and Architects (STD), November 2007
11
Mission
Our mission as consultants, designers, planners, engineers and project managers is to contribute to the quality of life by creating places of distinction and providing sustainable solutions that improve the built and natural environments and by doing so produce exceptional value for our clients, employees and shareholders.
Profile
ARCADIS is an international company that delivers consulting, architectural design, planning, engineering and management services for infrastructure, environment and buildings. Our proficient and dedicated professionals are focused on improving mobility, enhancing sustainability and raising the quality of life in every project we do around the world. We define our success by both surpassing our clients’ expectations and making a positive, significant and lasting impact on the environments, people and places we touch.
ARCADIS ranks third in Europe and ninth in the world. Because of our home market positions in Europe, the United States and South America we combine a deep knowledge of the local conditions where we work with fresh global perspectives for unique, integrated solutions. From feasibility studies through implementation and maintenance, ARCADIS is all about balance: of the creative and the functional, of possibility and reality, of the local and global, of present needs and future legacy. ARCADIS imagines the results - and re-shapes the future.
12


Brief overview of company activities
At ARCADIS, we divide our services into three distinct segments in an effort to distinguish our lines of business. That said, in today’s complex world, we are increasingly exploring the benefits of working across these segments and across geographies, to improve the human condition by establishing a balance between the natural and built environment.
Infrastructure
High-quality infrastructure provides more than simply railroads, highways, bridges and waterways; it helps to improve mobility, facilitate modes of travel and communication, and generate sources of commerce. ARCADIS provides consultancy, design and construction management for rural and urban infrastructure. Whether we are developing utilities for rail safety, designing tunnels, creating water management systems, or constructing wind energy parks, we operate with one key mission in mind: Create the foundations for healthier places to live and work.
Environment
ARCADIS has long led the industry in environmental services, delivering projects that protect the Earth’s resources while meeting our clients’ economic objectives. Ranging from soil and groundwater contamination investigations to consultancy on corporate energy and waste management issues, our services support environmental policy for companies and governments, reflect environmental impact assessments and uphold environmental management and environmental legislation. Our environmental segment is driven by our corporate mission to leave the Earth better than we found it.
Buildings
ARCADIS approaches the planning, design, development and maintenance of buildings with the understanding that we are providing legacies for our clients. Every office, hospital, residential building, school, museum, stadium and railway station plays a key role in a larger urban design scheme that contributes to quality of life and sends a message about our clients’ mission. We deliver world-class architecture, full-cycle project and program management, cost management and facility management services that create value and help our clients achieve their business objectives. Ultimately, we aim to balance function and aesthetics with environment and social stewardship, creating iconic buildings that withstand the test of time.
13
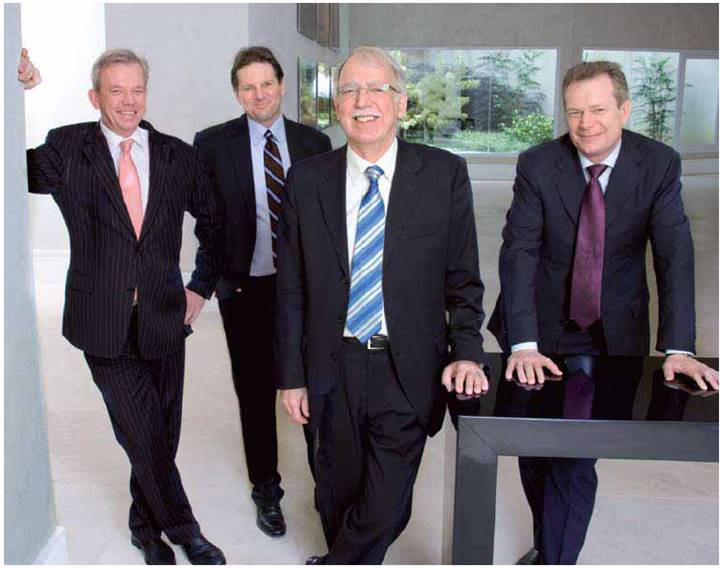
The Executive Board
From left to right Michiel Jaski - Ben van der Klift - Harrie Noy (Chief Executive Officer) - Friedrich Schneider
14
Introduction
ARCADIS had a magnificent year in 2007, scoring record results, reaching unprecedented organic growth levels and completing a milestone acquisition in our history. We are truly on our way to fulfilling the goal of becoming a global leader in the markets in which we compete.
Gross revenue surpassed € 1.5 billion; net revenue € 1.0 billion and EBITA € 100 million. We did well across the breadth of our activities, scoring double-digit growth in all business lines and regions. We improved margins to a level that exceeds our 10% goal. We capitalized well on favorable market conditions thanks to our strong local network, the synergies created by our entrepreneurial people and our leading positions. We are the pre-eminent provider of environmental services to private industry globally. We have strongly increased our visibility and skills in the water market. And we became a leading global player in architectural design and urban planning through the strategic acquisition of RTKL.
Our goal in recent years has been to be active higher in the value chain and divest businesses that yield insufficient returns. By acquiring companies with better returns and focusing on existing activities with higher added value, we have structurally raised margins.
We are an attractive employer, offering many opportunities to people who are up to a challenge. Our leading professionals do groundbreaking work in some of the world’s most difficult projects: projects that touch the heart of communities, find the right balance between economy and ecology and integrate sustainability in our designs and activities.
ARCADIS has arrived at a breakthrough point. We introduced a revised strategy titled ‘Building Global Leadership’, with the sharpened ambition to reach leading positions in each of the three business lines in which we operate. We raised our overall growth goal to 15%, at least half of which should be generated organically.
We are positive about 2008 as markets offer room for growth. More multinational clients look for international service providers with global solutions – we are ready to help them. Our client-focused approach helps us to continue to gain market share. Our strong environmental capabilities, rail and water design skills, extensive project and program management experience and expertise in architecture and urban planning provide an excellent basis for further expansion of our company.
Growth through acquisitions remains high on the agenda. Our focus is on strengthening our home market positions, aspiring toward a top ten position in the United States and top five positions in other markets, while simultaneously strengthening business lines to fulfill our global ambitions. In addition, we seek to expand in Asia/India which offer strong growth prospects.
We are proud of the achievements of our company in 2007 and share this pride with the 13,000 people who actually produced this success – our employees. We truly value and want to thank them for their contributions, enthusiasm and dedication. That, together with the trust of our clients and shareholders, is the basis for the continued success of our company.
On behalf of the Executive Board,
Harrie L.J. Noy,
Chief Executive Officer
15
Report by the Executive Board
Vision and strategy
The ARCADIS vision
ARCADIS has created one of the strongest transnational firms of professionals who work across segments and geographies to deliver real-life solutions to the complex challenges of today’s infrastructure, environment and buildings. Today, we stand at a crucial point: business is stronger than ever; we have grown rapidly but thoughtfully; and we’re in a position now, more than ever, to truly leverage our knowledge to deliver real value-added services to our clients across the globe.
We are, as ever, steadfastly committed to challenging our clients to think beyond today’s reality and delivering on that promise. At the same time, we never lose sight of the larger responsibility: to the earth, to respond to and improve the human condition, to produce strong and viable cities, to support business and commerce, to serve the world today and well into the future.
The following key elements of ARCADIS’ vision drive our long-term strategy:
Focus on three business lines: infrastructure, environment and buildings. This offers the opportunity to provide clients integrated business solutions through one-stop shopping. A broad range of disciplines with expertise and experience at the international level also allows us to capitalize on new market trends and grow through innovation.
16
Global network based on strong home market positions. Our global network enables us to leverage expertise across the globe and provide services to multinational clients that increasingly are looking for service providers who can deliver services of consistent quality globally. Because client relationships and solid understanding of local conditions are essential in our business, we aim for strong home market positions as the basis for our global network. Our goal is to build these positions in Europe, the United States, South America and Asia and to be ranked in the top five of our industry in the countries in which we are active, except for the United States where the goal is to be in the top ten.
One firm concept. ARCADIS operates as one firm around the globe, with a brand that reflects our mission and is recognizable for quality and reliability. Internal collaboration to meet client demands is part of our culture. By leveraging client relationships and exchanging knowledge, we create synergy that provides maximum benefit to our clients.
Employees are the key to our success. Their capabilities, entrepreneurship, results focus and commitment are the basis for the combination of thinking and acting that distinguishes ARCADIS (Imagine the result). Engaging, coaching and developing employees, therefore, play an important role in our company policy.
Attracting, retaining and developing talented people, together with delivering added value to clients, are the basis for profitable growth. That’s how we create value for shareholders who on that basis want to invest in our company. This is the best guarantee for continuity, which is in the interest of all stakeholders.
“Engaging, coaching and developing employees play an important role in our company policy.”
17
Market trends
Market conditions for ARCADIS are strongly influenced by investments of governments, private-sector corporations and institutions. Although these investments partly depend on economic cycles, in the longer run, our markets offer ample opportunities for growth as demand for our services is increasing.
Societal issues drive demand for our services
ARCADIS’ work involves the physical conditions for human life, the built and natural environments. Issues include:
Quality of life. Quality standards for the human habitat are increasing, with the emphasis on sustainability and livability of the built environment and the quality of nature and landscape.
Mobility is an issue in all countries in which ARCADIS is active. Poor accessibility causes constraints for economic development and is experienced by the public as a serious restriction on freedom of movement. Therefore governments are evaluating ways to accelerate investment programs for roads and public transportation.
Urbanization means investments in residential areas, industrial sites, commercial properties and other facilities. Deteriorated inner city areas need revitalization, requiring large investments in redevelopment programs, including remediation.
Sustainability. This rapidly growing issue for both governments and private-sector companies is about preserving the quality of life for future generations. As a consequence everything has to be evaluated on its potential impact on the environment. This drives growth in the environmental market but also influences our work in infrastructure and buildings (e.g. “green buildings”).
Climate change is going faster and stronger than initially expected and is having serious consequences especially in delta areas where more than 50% of the world’s population lives. This issue will greatly impact our work in all three of our business lines – from determining ways to reduce greenhouse gases to limiting the potential consequences of flood events through water management and flood protection.
18
Water. The lack of clean, safe, potable water leads to a growing demand for water supply and treatment facilities.
In most of these areas, ARCADIS is well positioned to capitalize on the growing demand for services.
Changing client needs create opportunities
ARCADIS works for a broad range of clients, from governments to the private sector. Our clients’ needs are changing and include:
Globalization of industry. International companies increasingly seek service providers who can provide services internationally. Many of these companies have vendor reduction programs in place to limit the number of service providers to safeguard quality standards across their operations and increase efficiency.
Outsourcing and privatization. More and more, companies are focusing on their core business, while non-core functions such as facility management or environmental activities are outsourced. A comparable trend is apparent in government, where the focus shifts to policy making while the implementation is left to companies like ARCADIS.
Private financing of public facilities. To finance the growing need for investments in public facilities, many governments seek private investors to expedite programs, often in the form of PPP. This leads to overall market growth because investments no longer depend solely on government budgets.
Supply-chain integration. Clients are increasingly looking for an integrated seamless construction process: design/build, DBFO - Design, Build, Finance and Operate, or similar approaches. A consortium of private-sector companies develops, designs and builds a project and provides the financing and operations management.
Risk participation. An increasing number of clients are asking us to share in project risks. In these instances, our fee is dependent on our performance. ARCADIS has internal procedures to control the related risks (see page 53 of this report).
Many of these changing client needs are favorable to ARCADIS as more work is outsourced to the market. In addition, we are capable of serving multinational clients internationally; only a limited number of competitors
19
have this capability. New types of contracts require a broad, multidisciplinary service offering and good risk management. ARCADIS is able to leverage the experience with such contracts and gain advantage on competitors.
Strategic positioning
Major shift in portfolio accomplished
In mid-2000, we changed our strategy by introducing value creation for shareholders as an important goal in an effort to improve our long-term position. By focusing on three service areas and on our home markets in Europe and North and South America, we intended to increase growth levels, as well as margins. Since then, approximately € 190 million in gross revenue have been divested, predominantly non-core activities with lower margins, while more than € 650 million in gross revenue have been added through acquisitions of companies providing services with higher added value, higher margins and more growth potential. The revised strategy has paid off. In the period 2003 – 2007, gross revenue has shown a compound average growth rate of more than 15%, while margins improved from 6.0% in 2003 to 10.5% in 2007.
Acquisition of RTKL in 2007 milestone for ARCADIS
In July 2007, we acquired RTKL, one of the world’s leading design and planning firms, with some 1.050 professionals, about $200 million in revenues and offices across the United States, in Europe (London, Madrid) and China (Shanghai). RTKL provides architectural design, master planning and specialized engineering services and has a well-diversified international portfolio of award-winning work across the commercial, health, workplace and civic markets in some 50 countries. RTKL joined ARCADIS to be able to build a global design and planning practice (faster) and to offer their clients an integrated service package.
The company will not be integrated into our existing operations, but will operate separately.
The merger with RTKL fits very well in our strategic goals. It is the next step in expanding the buildings business with high added-value services, which allows us to build a leadership position in this segment and to participate more in large property investments across the world. Together, we offer a full range of services: planning, design, program and cost management, property consulting and specialized engineering, separately or as an integrated package. RTKL’s world class brand, based on consistent quality and high profile projects, will substantially enhance ARCADIS’ reputation and visibility.
20
Strategic positioning improved strongly
As a result of the shift in portfolio and our strong focus, ARCADIS is now positioned as a premier international professional services firm, providing high added-value services with strong growth potential. The acquisition in 2005 of Blasland, Bouck and Lee (BBL) in the United States brought ARCADIS into a leading position in the global environmental market. In the infrastructure market, we have a recognizable position with several specialties at the international level, including water management. In the buildings market, a transition has taken place to services with higher added value, first management services and in 2007, with the acquisition of RTKL, high-level architectural design and planning services.
ARCADIS is positioned in the top five in our industry in many European countries and in Brazil. However, in the United Kingdom and the United States, we have yet to achieve our desired position. In Asia, our position is still modest. We have proven that we are able to generate substantial synergies through internal cooperation. Our name awareness has increased, and we have a solid reputation in the labor market; however, significant progress is still possible in both these areas. Despite major investments in acquisitions, our financial position is healthy with ample room for further expansion.
SWOT analysis shows ARCADIS’ strong position
The SWOT analysis for ARCADIS as a whole is presented below.
Strengths |
| Weaknesses |
Home market positions in Europe, the United States and South America |
| Limited position in Asia |
|
|
|
Focus on three business lines with growth potential |
| Relatively high fixed costs, labor-intensive services |
|
|
|
Extensive client list with multinationals Stable cash flow and healthy balance sheet |
| Visibility outside the Netherlands |
Opportunities |
| Threats |
Synergy based on expertise and client relationships |
| Shortage in labor market |
|
|
|
Climate change and sustainability push demand |
| Rapid market decline caused by credit crisis |
|
|
|
Outsourcing by companies and privatization by governments |
| Weakening of U.S. dollar (translation risk) |
|
|
|
Further expansion through acquisitions |
|
|
21
2008 – 2011 Strategy :
Building Global Leadership
As we update our strategy every two to three years, a new strategy review process was started during 2007, which culminated in the revised strategy Building Global Leadership. Each of the three markets in which ARCADIS is active was evaluated. With the help of key business staff, market attractiveness of different activities, as well as ARCADIS’ competitive position, was analyzed. This resulted in a revised overall ambition for the company, including adjusted financial goals.
ARCADIS’ overall ambition
ARCADIS aims for a leadership position in its three business lines — Infrastructure, Environment and Buildings. For each business line, a more specific ambition has been developed consistent with the overall company goal. But leadership goes beyond the ambitions for the business lines. It also entails:
Superior growth and profitability. In relative terms, we want to be in the upper quartile of our peer group.
Employer of choice. We can only be leading when we are able to attract and retain the best people. Therefore, we aim to be positioned as employer of choice, with an international and inspiring workplace where innovation and teamwork offer clients the best achievable solutions and where talent is provided optimal opportunities for growth.
Leading in sustainability in the sector. Sustainability is part of our mission and is (therefore) at the heart of our business. Being a leader in this regard not only has a positive impact on our market position, but also helps to attract and retain good people.
Key elements in achieving our ambition
We have identified three key elements for achieving our ambition of being a leading company globally:
Client focus. To deliver services to clients across boundaries, client focus is essential. Through systematic account management, we aim to build long-term relationships with select multinational and key national/local clients who appreciate the value-added services we provide. Cross-selling services and satisfying client’s previously unmet needs will help them realize their goals.
22
“We want the full extent of our knowledge and capabilities to be available to our clients.”
Seamless delivery. Our ability to seamlessly deliver services of consistently high quality in different countries is critical in serving multinational clients and leveraging our expertise across geographies.
One firm based on strong local positions. On the one hand, we need strong local positions to maintain and build relationships with clients; on the other hand, we want the full extent of our knowledge and capabilities to be available to our clients, based on a culture of internal collaboration and resource sharing.
What it takes to realize our goals
For each of the business lines, tailored strategies have been developed to achieve our goals. (More information regarding these strategies is provided in the section on business lines.) In addition, the revised strategy includes:
Continued focus on higher added-value services
This focus has greatly contributed to our improved margins over the past years and will continue, also through the outsourcing or off-shoring of lower added-value activities.
Aligning the organization to meet changed needs
To successfully implement the strategy, the organization will be adjusted by introducing a division-type structure in each of the operating companies, reflecting the three business lines. In the United States and the Netherlands, this has already been completed, and the other countries will follow in 2008. In addition, Global Business Line Teams (GBLT) have been established for each business line, bringing together global leadership and operating company leadership. These teams will drive the global business line strategy. For Environment, coordinating client development and delivering global seamless service will be the focus; for Infrastructure, sharing and developing technical knowledge and expertise for business development; and for Buildings, developing synergies in the business line and further developing a global delivery platform for project management.
Strengthening of supporting processes
People are critical to the successful implementation of our strategy. Therefore, the Human Resource Management function has been enhanced. To facilitate seamless delivery and the one firm concept, knowledge management will be further strengthened, additionally by completing the required IT infrastructure. In addition, initiatives will be developed to create greater brand visibility and recognition, based on
23
sharpening our positioning by including the strength of the RTKL brand. A global sustainability program will be introduced that will confirm our commitment to improving the environment and help differentiate our brand even further.
Acquisitions remain high on the priority list
To achieve our strategic goals, we will continue with acquisitions. Priorities are driven by building and expanding home market positions and by the strategy for each of the business lines. With respect to home markets, we want to further strengthen our position in the United States and the United Kingdom and expand in select European countries, as well as in Asia and India. In Infrastructure, we look for acquisitions to build a stronger position in the United States and to expand in public transportation and water. In Environment, strengthening in Europe and Brazil and adding specialized services are the main goals, while in Buildings, expanding project management services in the United States, France and the Middle East and growing RTKL’s premier design and planning practice are high on the list. We are specifically looking for larger acquisitions to fulfill multiple goals simultaneously.
In addition to strategic fit, reputation of the company and quality of management are important criteria. Financially, we aim for acquisitions that are earnings accretive, have margins compatible with ARCADIS’ goals and are value enhancing with a return on investment of 15% or more.
Financial goals
Growth goal raised to 15%
Given ARCADIS’ improved growth profile as a result of the portfolio change, the attractiveness of market conditions over a longer term and the strength of our market positions, we have increased our growth target for both revenue and earnings per share to 15% (excluding currency impacts).
“We have increased our growth target for both revenue and earnings per share.”
24
This results in the following financial goals for the mid- to long-term (three years):
· Gross revenue: average annual growth of 15% (was 10%), at least half of which is organic.
· Operational margin: at least 10% (was 10%) (EBITA as a percentage of net revenue).
· Earnings per share: average annual growth of 15% (was 10%) (based on net income from operations and present financing structure).
· Return on invested capital of 15% (was 15%). This is net income from operations, excluding interest charges, as a percentage of shareholders’ equity plus net interest-bearing debt, calculated as an average over four quarters.
These goals exclude the impact of currency exchange rate differences. Net income from operations is before amortization and non-recurring items like book gains. Goodwill has been capitalized on the balance sheet since 2001; as of 2004, the figures are based on IFRS.
Reaching our goals also depends on market conditions. Targets for organic growth and margin for each of the business lines are specified in the section on business lines.
Currency risks in the business are generally hedged. Because the currency translation risk has no effect on the business, this risk is not hedged.
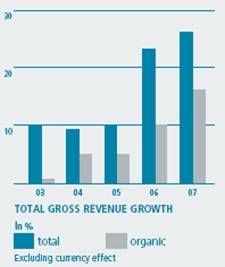
Performance in comparison to financial goals
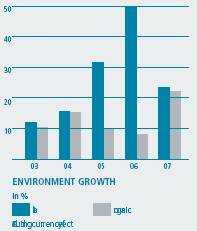
Below are the results of previous years compared to the goals, excluding currency impacts.
In % |
| Goal(1) |
| 2003(2) |
| 2004 |
| 2005 |
| 2006 |
| 2007 |
|
Gross revenue |
| 15 |
| 10 |
| 9 | (3) | 10 |
| 23 |
| 26 |
|
- Organic |
| 7.5 |
| 1 |
| 5 |
| 5 |
| 10 |
| 16 |
|
- Acquisitions |
| 7.5 |
| 9 |
| 4 |
| 5 |
| 13 |
| 10 |
|
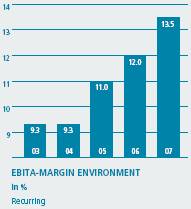
Operational margin |
| 10 |
| 6.0 |
| 6.2 | (4) | 8.2 |
| 9.4 |
| 10.5 | (4) |
Earnings per share |
| 15 |
| (4 | ) | 9 |
| 40 |
| 50 |
| 28 |
|
Return on invested capital |
| 15 |
| 15.9 |
| 17.2 |
| 20.6 |
| 20.3 |
| 20.1 |
|
(1) As from 2008
(2) Figures based on NL-GAAP
(3) Excluding book profit on sales
(4) Excluding non-recurring items
25
Results and financing
Excellent performance leads to record year
In 2007, ARCADIS continued its excellent performance with another record year. Gross revenue rose 22% to € 1.5 billion. At 16%, organic growth was very strong, demonstrating we successfully capitalized on favorable market conditions. Net income from operations (before amortization and non-operational items) was 25% higher at € 62.3 million. Per share, this is € 3.06 against € 2.47 in 2006. This excellent result is attributable to high organic growth, a continued improvement of margins and a strong contribution from acquisitions. Performance was strong across the board. All three business lines produced increased margins and organic growth well above our targets. Geographically, all regions contributed to the improved profits, with a particularly strong performance in the Netherlands, Brazil and the United States.
Dividend € 1.23 per share
ARCADIS proposes to raise its cash dividend to € 1.23 per share from the € 1.00 per share distributed last year. This represents 40% of net income from operations. The dividend policy is aimed at a payout ratio of 30% to 40% of net income from operations and is designed to provide shareholders with an attractive dividend yield, while providing the Company sufficient resources to finance growth through, among other things, acquisitions.
Strong growth in gross revenue
Gross revenue increased 22% to € 1,510 million (2006: € 1,233 million). The 10% acquisition growth was mainly the result of the acquisitions of PinnacleOne and more significantly RTKL, both in the United States, as well as various smaller acquisitions, partially offset by the divestment of
26
Euroconsult. The currency impact was more substantial than in previous years at a negative 4%, primarily the result of a decline in the U.S. dollar. At 16%, organic growth was well above our goal of 5%. Almost all countries showed double-digit organic growth, with the largest contributions coming from the Netherlands, the United States and Brazil.
Net revenue up by 20%
Net revenue, the portion of revenue produced by ARCADIS’ staff, grew by 20% and for the first time surpassed one billion euros: € 1.004 million (2006: € 837 million). On balance, the contribution from acquisitions and divestments was 12%; the currency effect was a negative 3%, while organic growth totaled a very strong 11%. This is lower than the organic growth in gross revenue due to high levels of subcontracting in turnkey hydropower projects in Brazil and in several large remediation contracts in the U.S. environmental market.
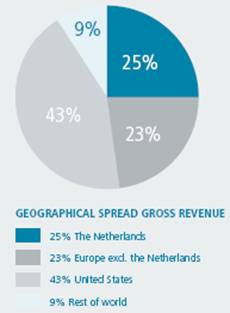
Geographical mix relatively stable
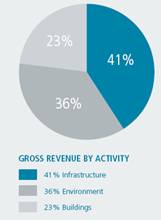
Despite the strong growth in the United States, both through acquisitions and organically, the share of total revenue coming from the U.S. only slightly increased because of a substantial negative currency effect of 10%. So on balance, 43% of gross revenue came from U.S. operations (2006: 42%); the Netherlands contributed 25% (2006: 26%); other European countries, 23% (2006: 23%); and Rest of World, 9% (2006: 9%). So, roughly half of revenue was generated in Europe and the other half in the United States and Rest of World (mainly Brazil).
More balanced portfolio
The acquisitions of PinnacleOne and especially RTKL boosted revenue in the buildings business line, which represented 23% of total 2007 sales (2006: 17%). Partially the result of divestments, the relative position of infrastructure declined to 41% (2006: 45%). Strong organic growth in environment was partially offset by the decline in the U.S. dollar, resulting in a total revenue share for environment of 36% (2006: 38%).
Favorable development of cost
Personnel cost increased by 19% to € 693 million (2006: € 581 million), while other operational cost rose 16% to € 185 million (2006: € 160 million). The organic increase of personnel cost and other operational cost totaled 10.4% and 10.8%, respectively. This is lower than the organic growth in net revenue of 11.0%. The difference is the result of productivity and efficiency improvements.
27
“Positive impact from acquisitions on the margin; in the ongoing business the margin also improved.”
Relative decline in depreciation
Depreciation (excluding amortization) rose 15% to € 20.4 million (2006: € 17.7 million) through a combination of strong organic growth and expansion through acquisitions. As a percentage of net revenue, depreciation decreased slightly from 2.1% in 2006 to 2.0% in 2007.
Higher amortization of identifiable intangible assets
Under IFRS, identifiable intangible assets related to acquisitions must be separated from goodwill and amortized separately. For ARCADIS, this primarily relates to the profit included in the backlog of acquired companies. These assets are amortized over their economic lifetime (on average one to two years). In 2007, amortization increased 48% to € 12.2 million (2006: € 8.3 million), mainly because of the acquisition of RTKL.
Strong increase in operating income and EBITA
Operating income increased 35% to € 95.0 million (2006: € 70.5 million). ARCADIS uses EBITA (operating income before amortization) and recurring EBITA (excluding non-operational items) to measure the financial performance of operations. For 2006 and 2007, these measures have been determined as follows:
In € millions |
| 2007 |
| 2006 |
|
Operating income reported |
| 95.0 |
| 70.5 |
|
Amortization |
| 12.2 |
| 8.3 |
|
EBITA |
| 107.2 |
| 78.8 |
|
Book gain from sale of assets |
| (1.4 | ) | — |
|
U.K. Sharesave plan |
| 0.1 |
| — |
|
Recurring EBITA |
| 105.9 |
| 78.8 |
|
Included from sale of carbon credits |
| 2.6 |
| 0.6 |
|
In France, an office building was sold, resulting in a book gain of € 1.4 million. Since September 2007, our U.K. staff have been able to participate in the employee stock purchase program. Although this program is totally funded by the Lovinklaan Foundation, the U.K.-specific structure of the program requires under IFRS the (imaginary) costs to be taken on the company’s accounts. In recurring EBITA, this has been taken out as a non-operational item.
EBITA increased by 36%. On a recurring basis, the increase was 34%, resulting in a recurring EBITA of € 105.9 million (2006: € 78.8 million). The currency effect was a negative 4%, while acquisitions contributed 20%, considerably higher than the contribution to net revenue (12%).
28
This demonstrates the positive impact of the acquisitions and divestments on the margin. Organically, recurring EBITA increased 18%, also more than net revenue (11%), indicating that the margin also improved in the ongoing business. In EBITA, an amount of € 2.6 million (2006: € 0.6 million) is included related to the sale of carbon credits in Brazil. Excluding the contribution of carbon credits, organic growth in EBITA was 16%.
Further improvement of margins
The margin (EBITA as % of net revenue) improved further to 10.7%, on a recurring basis to 10.5% (2006: 9.4%), clearly demonstrating that ARCADIS operates higher in the value chain with activities that create more added value. With the 2007 margin, we have achieved the 10% target that was introduced in 2006. The margin improved in all three business lines, to a level at or above target, driven by higher productivity and efficiency, divestments of low-margin business, and acquisitions of higher margin companies.
Financing charges higher as a result of acquisitions
On balance, financing charges totaled € 8.6 million, € 5.1 million more than the € 3.5 million in 2006. The currency and interest rate risks on loans are (partially) hedged using financial derivatives. This had a negative impact on financing charges of € 0.5 million, while this impact in 2006 was a positive € 1.1 million. Excluding this impact, financing charges increased to € 8.1 million compared to € 4.6 million in 2006, primarily the result of investments in acquisitions. In addition, the 2006 figure was positively impacted by a one-off interest gain of € 0.5 million.
Tax rate increased
The effective tax rate came out to a normal level of 32.8%, compared to the 30.2% in 2006, which was rather low due to one-off impacts. In addition, taxes were higher because of shifts in the geographical distribution of taxable income and the fact that, as of 2007, option costs in the Netherlands are no longer tax deductible.
Negative contribution from associated companies
The loss in associated companies of € 0.8 million, compared to a loss of € 0.5 million in 2006, was the result of a few Brazilian energy projects that experienced start-up problems and delays in contract renewals. These are not expected to be issues in 2008.
Strong increase in minority interest
Minority interest, the part of profits that flows back to the co-owners of the less-than-100%-owned ARCADIS companies, increased strongly to
29
€ 2.6 million (2006: € 1.5 million). This was mainly the result of positive developments in Brazil, where ARCADIS owns 50.01% of ARCADIS Logos shares.
Strong gains in net income and net income from operations
Net income totaled € 54.9 million, or € 2.70 per share, compared to the € 44.9 million, or € 2.22 per share, in 2006. Net income from operations (before amortization and non-operational items) was € 62.3 million, 25% more than the € 50.0 million that was realized in 2006. Per share, this equals € 3.06 compared to € 2.47 in 2006.
Solid cash flow
Net income plus depreciation and amortization totaled € 87 million (2006: € 71 million). As a result of slightly higher working capital needs caused by the strong organic growth and, more importantly, higher tax-related cash outflows, cash flow from operational activities declined slightly to € 79 million (2006: € 86 million).
Investment levels higher as a result of increased acquisition activity Investments in (in)tangible assets (excluding acquisitions) were € 33 million (2006: € 19 million). The increase is mainly the result of investments in Brazilian energy projects and office renovations. Other investments, related to communications and computer equipment and office furniture, increased to facilitate growth. The sale of property in France, the United States and the Netherlands resulted in a cash inflow of € 14 million.
In 2007, the following companies were acquired:
Name |
| Country |
| Staff |
| Gross revenue |
| Consolidated as of |
|
|
|
|
|
|
| in € million |
|
|
|
BFB |
| The Netherlands |
| 65 |
| 6 |
| January 2007 |
|
HL-S |
| Germany |
| 20 |
| 2 |
| January 2007 |
|
Aeolus |
| Belgium |
| 30 |
| 3 |
| April 2007 |
|
Alkyon |
| The Netherlands |
| 45 |
| 5 |
| July 2007 |
|
RTKL |
| United States |
| 1,050 |
| 144 |
| July 2007 |
|
APS |
| United Kingdom |
| 70 |
| 13 |
| Mid-August 2007 |
|
Vectra |
| United Kingdom |
| 110 |
| 15 |
| Mid-November 2007 |
|
Idesol |
| Chile |
| 70 |
| 4 |
| Mid-November 2007 |
|
Total acquisitions |
|
|
| 1,460 |
| 192 |
|
|
|
The background of these acquisitions is discussed in the business line sections. The investments in new acquisitions, the expansion of our interest in some consolidated companies and after-payments for earlier acquisitions
30
totaled € 103 million (after deduction of cash at closing), of which € 18 million represents deferred payments, resulting in a cash outflow of € 85 million. Goodwill acquired amounted to € 85 million and identifiable intangible assets to € 15 million. In addition, € 13 million (2006: € 7 million) was invested in associated companies and other financial non-current assets, which included an investment in a Brazilian hydropower project. The sale of our interest in Euroconsult and some smaller consolidated companies resulted in a cash outflow of € 2 million, while the divestment of non-consolidated entities, including the interest in a Brazilian energy project, resulted in a cash inflow of € 4 million.
Number of shares remains nearly unchanged
The number of outstanding shares remained almost unchanged at 20.2 million (2006: 20.3 million). To cover obligations related to option plans, 350,000 shares were repurchased, while 212,197 previously repurchased shares were used for the exercising of options. No new share capital was issued. The average number of outstanding shares (used to calculate net income per share) was 20.3 million (2006: 20.2 million). For more information on the number of outstanding shares and options and on share purchase plans, please refer to Note 17 of the financial statements.
Balance sheet remains healthy
The balance sheet total rose to € 922 million (2006: € 736 million), the result of organic growth in activities (€ 39 million), acquisitions (€ 176 million) and currency effects (negative € 29 million).
Goodwill increased to € 210 million (2006: € 139 million) as a result of the balance of acquisitions and currency effects. Identifiable intangible assets were € 12 million (2006: € 10 million). As of 2004, goodwill is no longer amortized but subject to an impairment test once a year. In 2007, this test determined that no goodwill loss had occurred, emphasizing the continued value of the cash-generating units.
Despite the strong organic growth, net working capital (work in progress plus accounts receivables minus accounts payable) decreased slightly by € 7 million. As a percentage of gross revenue (measured at the fourth quarter level times four), net working capital again declined from 12.5% in 2006 to 11.9% in 2007.
Cash and cash equivalents totaled € 93 million (€ 2006: € 101 million). Net debt (cash and cash equivalents minus interest-bearing debt) increased to € 134 million (2006: € 45 million), primarily the result of the investments in
31

new acquisitions, which were financed with debt. Interest-bearing debt also includes the after-payment obligations to former shareholders of acquired companies, totaling € 40 million (2006: € 22 million).
At year-end 2007, € 234 million in short-term credit and guarantee facilities was available (2006: € 196 million), of which € 50 million was used. In addition, banks issued project bonds for € 62 million (2006: € 41 million). Long-term debt rose to € 165 million (2006: € 119 million), while short-term debt increased to € 62 million (2006: € 27 million), of which € 27 million was the result of acquisition-related after-payments payable in 2008.
Shareholders’ equity was € 188 million, almost level with the € 189 million at year-end 2006. The table below details the change:
In € million |
| Effect |
|
Net income over the book-year 2007 |
| 54.9 |
|
Dividend payment over the book-year 2006 |
| (20.4 | ) |
Currency exchange rate differences |
| (22.2 | ) |
Exercising of options |
| 2.2 |
|
Temporary purchase of shares to cover option plan obligations |
| (19.8 | ) |
Option costs |
| 4.2 |
|
Fiscal effects related to options plans |
| (0.1 | ) |
Total change |
| (1.2 | ) |
The balance sheet ratios remained strong. The net debt to equity ratio at year-end 2007 was 0.7 (2006: 0.2); the net debt to EBITDA ratio was 1.0 (2006: 0.4); and the interest coverage ratio was 14 (2006: 17).
“The balance sheet ratios remained strong with net debt to equity at 0.7 and net debt to EBITDA at 1.0.”
32

Developments by business line Infrastructure
This business line involves activities for designing the physical living environment. Themes include Living and Working (land development for residential, work and recreational areas, urban and rural planning); Mobility (traffic management, highways, railroads, waterways, bridges and tunnels); Water (water management, water quality and hydraulic engineering) and Energy (hydropower plants, biogas installations). This segment contributed 41% to 2007 revenues (2006: 45%).
Building on local strength with specialties at the international level
The infrastructure market is predominantly a local market with national, regional or local governments as the principal customers, as well as developers, contractors and other companies, such as mining firms or utilities. Understanding local conditions and clients, including their organizations and goals, is critical for success in this market. Therefore, ARCADIS has built strong local positions that allow us to anticipate developments, deliver tailor-made solutions and leverage our global expertise to clients at the local level. Strong local positions also create visibility and brand recognition, which is helpful in marketing and important in attracting high-quality staff. In rail infrastructure, water management and large transportation corridors, including bridges and tunnels, ARCADIS has specialist expertise that can be leveraged internationally.
33
Following is the SWOT analysis for infrastructure:
Strengths |
| Weaknesses |
Strong local positions and broad service offering |
| Insufficient recognition internationally |
|
|
|
Specialist in rail, water management and large transportation corridors, including bridges and tunnels |
| Reputation in water limited to water management |
Opportunities |
| Threats |
Major investments in (public) transportation |
| Sudden reductions in government spending |
|
|
|
Climate change pushes water management in delta areas |
| Increasing competition based on price |
|
|
|
Increase in public-private partnership projects |
|
|
|
|
|
Privatization by governments |
|
|
Recognized global infrastructure player based on local strength
This is the ambition for infrastructure as has been defined in our revised strategy. It means:
• Building leadership positions in rail, water management and large transportation corridors (including bridges and tunnels) by focusing on knowledge exchange and development through our newly established Global Knowledge Networks. The focus for each of these activities is different. For rail, the focus is on the Netherlands, the United Kingdom, France and Poland; for water-related services, on the United States and Europe; and for large transportation corridors, on large, multidisciplinary projects, including design-build or PPP schemes.
• Growing select mining accounts, especially in South America and the United States, by leveraging the relationships we have with major clients.
• Continue expanding our strong home market positions through organic growth, as well as acquisitions.
The goal for organic growth is 6%; the target margin is 8% to 9%.
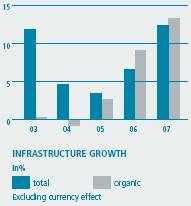
Strong organic growth; margin improved further
Gross revenue grew 10%. The currency impact was a negative 2%. Acquisitions and divestments produced on balance a decline of 1%, due to the divestment of Euroconsult, active in the donor-funded market. At 13%, organic growth increased considerably compared to 2006 (9%). Net revenue growth totaled 9%, organically 9% as well. The lower organic growth in net revenue resulted from high levels of subcontracting, especially caused by turnkey projects in Brazil. The margin rose to 8.8% (2006: 8.4%), mainly from enhanced profitability in the Netherlands.
34
Positioned as a leader in water management
2007 began with an excellent start when the ARCADIS-led joint venture with Bioengineering Group won a contract valued at a maximum of $150 million for flood protection services in New Orleans. Later, a similar contract for a maximum $50 million followed from the same client, the U.S. Army Corps of Engineers. Both contract wins were based on our strong local presence in the United States, combined with our Dutch experience and reputation in water management. In addition, we also won water projects in Florida and Louisiana, as well as California.
As a consequence of climate change, the water management market is expected to grow significantly. The 2007 project wins clearly demonstrate ARCADIS’ leadership position in this market. To further expand our capabilities, we acquired Alkyon, a Netherlands-based specialist in water management, providing high-level consultancy services for coastal and river management, flood protection and harbor and delta development. With Alkyon’s extensive international experience, we are even better positioned to capitalize on the growing demand for water management services.
Strong growth in Dutch infrastructure market
Organic growth was well above 10%, demonstrating that ARCADIS did very well in this market. In rail engineering, we benefited from large investments in upgrading existing railway systems. The government policy favoring a PPP approach for all major infrastructure projects positively impacts the market. In 2007, the consortium with ARCADIS as design and engineering partner was selected as the preferred bidder for the renovation and extension of the Coentunnel, the first big DBFO infrastructure project under the new program (contract value almost € 500 million). Increased outsourcing by the Ministry of Public Works provided us two large framework contracts for consultancy and engineering services.
Market in other European countries improved
After some slowdown in 2006, growth in Belgium was again strong. Market conditions in France remained positive, allowing for stable growth. Although in Germany, public investments in infrastructure are increasing, the market is still highly competitive. In Poland, the delay in project execution is gradually disappearing, resulting in solid revenue growth, while in the Czech Republic, our activities continued to grow.
Mining and energy drive growth in South America
Both in Brazil and Chile, our infrastructure practice did very well. Strong demand for raw materials boosts investments by mining companies and contributes to favorable economic conditions that support government
35
“In many countries there is an urgent need to improve and expand infrastructure.”
infrastructure spending. In Chile, our position was further strengthened with the acquisition of Idesol, active in mining projects, from feasibility studies, conceptual design and engineering to construction management.
In Brazil, we are also involved in the rapidly growing market for energy projects. ARCADIS Logos works on several small and larger hydropower projects, which are usually developed together with other partners based on a DBFO approach. In 2007, construction began on Retiro Baixo, a midsized hydropower project in which ARCADIS Logos holds 25%. After the successful completion of a biogas installation at the Bandeirantes Landfill, a similar project was finished at the São João Landfill, also near São Paulo, and a concession for a third project at the Gramacho Landfill near Rio de Janeiro was won.
Decline in U.S. land development compensated by water and transportation
Our U.S. land development practice suffered severely from the housing market crisis, resulting in a revenue decline of 22%. In the fourth quarter, revenue was down almost 50% compared to a year ago. Meanwhile, capacity has been adjusted to the lower revenue levels. In water and transportation, we grew 10% (combined), resulting in a slight organic growth for our total U.S. infrastructure business.
Outlook
In many countries, there is an urgent need to improve and expand infrastructure, both roads/highways and public transportation. Government investments provide a stable basis in this market, while private financing is used to accelerate infrastructure development programs. In the Netherlands, we expect continued growth on the back of a solid economy, a continuous flow of PPP projects, ongoing investments in rail and road infrastructure, a good municipal market and government outsourcing. Also in other European countries, the outlook is favorable. In Belgium and France, we can benefit from large investments, partly through PPP projects. European funds will continue to positively impact infrastructure investments in Central Europe.
The U.S. land development practice now represents less than 1% of our global revenue, and we expect a continued downward trend, especially on a year-to-year basis. As transportation budgets are allocated for a longer period, that market is expected to be stable. Concerns about climate change will drive the water market, especially in water management. Although growth in Brazil and Chile might be lower compared to the very high levels in 2007, market conditions in these countries are expected to remain positive, allowing for solid growth.
36
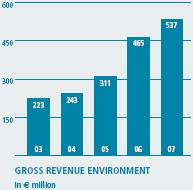
Developments by business line Environment
This business line represents 36% of revenue (2006: 38%) and focuses on sustainability. The largest activity involves the cleanup of legacy issues related to land, air and water pollution. We also assist clients with environmental assessments, site closures and reuse, product stewardship issues, climate change mitigation – including carbon footprint minimization, energy efficiency and renewable energy – and health and safety issues and provide services for noise abatement, solid waste disposal and the preservation of nature and landscape.
ARCADIS has strong positions in environment
A large part of the environmental market involves legacy issues related to soil and groundwater contamination. In that market, ARCADIS is globally positioned in the top 3. In environmental services to private-sector companies, we are the leading company in the world. Our competitive strength is based on our global network, allowing us to serve multinational clients internationally; our advanced, cost-effective remediation technology; our GRiP® program for guaranteed solutions; and our health and safety culture. Our strong client base positions us well to expand our services related to sustainability and climate change.
37
Following is the SWOT analysis for environment:
Strengths |
| Weaknesses |
International footprint with home-country strength |
| Developing position in Asia and the Middle East |
|
|
|
Strong client base and client-focused approach |
| Gaps in our network where we need to rely on strategic partners |
|
|
|
Cost-effective remediation technology and GRiP® |
| Visibility outside the Netherlands |
|
|
|
Health and safety culture |
|
|
Opportunities |
| Threats |
Vendor reduction by multinational clients who look for global service providers |
| Economic decline: less environmental spending |
|
|
|
Redevelopment of contaminated industrial sites |
| Reduction in environmental spending by the U.S. Department of Defense |
Services related to climate change and sustainability |
|
|
Global leadership in environment
Our goal is to expand our position as the world’s single leading provider of environmental services to private-sector clients. We plan to achieve this by:
• A clear, relentless focus on multinational and key national clients, who will largely be private-sector clients but will also include important public-sector clients.
• Truly operating as one firm, sharing clients and knowledge across borders while seamlessly delivering an increasing array of services.
• Expanding services especially in strategic environmental consultancy and D4 (Deactivation, Decommissioning, Decontamination, Demolition) services, with a continued investment in our site evaluation and remediation capabilities.
• Strengthening our geographic presence in Europe and Brazil while expanding into Asia.
• Continued development and sharing of innovative technologies.
• Leveraging our strength in Environment into other business lines.
The goal for organic growth is 12%; the target margin is 12% to 13%.
Excellent organic growth; margin increased further
2007 has been a breakout year for our environmental business, with a 22% organic growth. Acquisitions contributed 1%. Offsetting this were negative currency effects of 8%, resulting in gross revenue growth of 16%. Net revenue grew 9%, organically by 14%. The difference between gross and net revenue growth stems from several large U.S. remediation contracts with substantial subcontracting. The strongest performance was in our U.S. operations, with a 23% organic growth. In other parts of the world, organic
38
growth was also positive and especially strong in Poland, the United Kingdom, Brazil and Chile. Margin improved to 13.5% (2006: 12.0%); excluding the impact of carbon credits, the margin was at 12.7% (2006: 11.8%).
Niche acquisitions strengthen our position
Acquisition growth was minimal in 2007 as we focused successfully on integrating the acquisitions of the past several years. Two smaller firms were added: in Belgium, Aeolus, a niche player in environmental impact assessments; and in the United Kingdom, Vectra, a specialist in health, safety, risk management and other environmental consultancy services for clients in the oil, gas and nuclear industries and in transportation.
Multinational client focus pays off
A growing number of companies take environmental issues and corporate stewardship seriously and want to control them at the highest levels in their organizations. Generally, these clients select suppliers who can help them across their operations to meet their long-term goals. Many have vendor reduction programs in place for consistent quality and efficiency gains. With our client-focused approach, we focus on those multinational and key national clients who match our value proposition. This approach has been very successful. In 2007, the growth rate of the 60 global accounts in our Multinational Clients Program was almost 30%.
Gaining market share, especially in the United States
With our 2007 level of organic growth, we are outpacing our competitors and gaining market share, especially in the United States. To integrate BBL within our U.S. organization, we introduced early in 2007 a client-focused business model with a very positive impact on staff utilization and revenue synergy. BBL took advantage of ARCADIS’ advanced remediation technology and cross selling of services in their remedial implementation group, while ARCADIS benefited from BBL’s client-focused process and health and safety culture.
The GRiP® market was tempered by delays in development of complex projects in the private market, while the U.S. Army released few guaranteed cleanup contracts. As a consequence, GRiP® backlog decreased to $230 million (2006: $290 million). Order intake in traditional contracts was strong, but with lower levels of subcontracting. As a result, U.S. backlog in gross revenue remained relatively stable, but backlog in net revenue increased by 16% compared to the end of 2006.
Product stewardship opportunities abound
ARCADIS advises companies about the human health, environmental and sustainability aspects of their products and services, stemming from significant regulatory drivers such as the REACH and GHS programs. Proprietary tools and systems and providing seamless global product stewardship services have enabled us to more than double our revenue in this practice, finishing 2007 with more than 70 staff globally engaged in this service offering.
39
“Climate concerns will further enhance sustainability as important driver in the global environmental market.”
Deal making drives due diligence work
Mergers and acquisitions require assessments of environmental liabilities. In 2007, ARCADIS provided environmental due diligence services to more than 100 clients in 33 countries at approximately 800 locations ranging from chemical plants and refineries to warehouses.
Climate change offers new opportunities
Influenced by the Kyoto Protocol and the internal sustainability programs of our clients, our activities related to assessing carbon footprints and sustainability issues were significant. In Brazil, we are involved in projects that use methane gas from two large landfills near Sao Paulo for power production. More than 80% of the carbon credits from landfill projects in the world come from these two landfills.
Acquisition of LFR further strengthens our position
At the end of January 2008, we acquired LFR Inc., a U.S. environmental firm with more than 480 staff in 34 offices nationwide, producing a 2007 gross revenue of $127 million (net revenue $63 million). Through this acquisition, we establish a more substantial presence in California, a premier environmental market, while adding capabilities in geotechnical services and air pollution. Similarly to BBL, we expect to benefit from cross selling services both nationally and internationally and from operational synergies over time.
Outlook
In 2007, our backlog changed as some large remediation projects with high levels of subcontracting were finished. That’s why we expect our 2008 gross revenue to develop at a slower pace than our net revenue. We have indications that the federal government will revitalize the guaranteed remediation program, creating new opportunities for GRiP®. Last year, we demonstrated we can gain market share based on strong market positions and trends with corporations to centralize environmental management and reduce vendors. As we expect these trends to strengthen, we can continue to take market share and produce solid growth.
The broad global acceptance of climate concerns will further enhance sustainability as an important driver in the global environmental market. This will trigger new legislation, pressure on compliance and initiatives of private-sector firms to integrate sustainability in their operations and to understand the options they have for dealing with their carbon footprints. As a global leader in the environmental market, with extensive capabilities, a strong client-focus and a proven track record in seamless global delivery, we see ample opportunity to capitalize on these market developments.
40
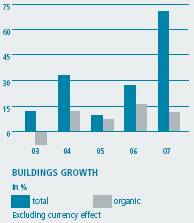
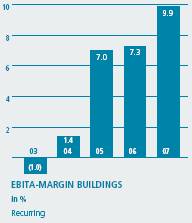
Developments by business line Buildings
Activities in this business line relate to buildings in which people live, work, shop, relax or otherwise spend time. Our services include architectural design and master planning, management services, consultancy and specialized engineering. Projects that we work on are office buildings, manufacturing facilities, hotels, resorts and other leisure facilities, shopping centers, hospitals, schools, museums and public buildings. Our work also includes master planning for urban areas. 23% of our 2007 revenue was in this business line (2006: 17%).
RTKL: next step in transition to services higher in the value chain
The buildings market is largely determined by real estate investments. Clients include private investors and developers (commercial real estate), institutions (hospitals, schools), but also the government (court houses, government offices). Over the past several years, we implemented a transition process toward services with higher added value in an effort to improve profitability. Initially, we focused on expanding management services by acquiring project and program management companies, while at the same time reducing detailed engineering activities. In 2007, we took the next step with the acquisition of RTKL Associates Inc., which added world-class design and planning capabilities, allowing us to build a leadership position in the buildings market. Our services can be offered separately or as an integrated package.
41
Following is the SWOT analysis for buildings:
Strengths |
| Weaknesses |
Strong in project management across countries |
| Limited presence in specific countries |
|
|
|
Global brand in architecture/planning with RTKL |
| Limited number of facility management clients |
|
|
|
Independent position in facility management |
|
|
Opportunities |
| Threats |
Demand for integrated services, including sustainability |
| Sensitivity to economic cycles |
|
|
|
Demand from international property investors |
| Sudden declines in real estate investments |
|
|
|
Outsourcing of facility management by companies |
|
|
A leap forward in Buildings
The buildings’ goal as defined in our revised strategy is to achieve leadership by providing differentiating value to clients: design excellence, successful delivery and global reach.
• Design excellence stands for high-profile design and superior functionality created by the best. It will be achieved by growing the RTKL design and master planning activities and leveraging these across the Company.
• Successful delivery has to be established through our network of project and program management companies and an investment in a globally consistent project execution process that meets the high standards required by our rapidly growing international client base. Successful delivery is also key to the facilities management business, which is expected to achieve strong growth by adding several large clients and expanding the business beyond the Netherlands.
• Global reach translates to seamless delivery internationally and implies expansion of our project management capabilities (United States, France and Middle East), broadening the RTKL business geographically and offering tailored and packaged solutions to clients globally, using ARCADIS Worldwide Project Consulting (AWwPC).
The organic growth goal is 8%, with a margin target of 10% to 11%.
Strong expansion of activities, strong margin improvement
Gross revenue growth totaled 71%, of which 60% came from acquisitions, including RTKL, some smaller acquisitions in 2007 and earlier acquisitions in 2006 such as Berkeley in the United Kingdom and PinnacleOne in the United States. The currency impact was limited. Organic growth was 11%. Net revenue grew 68%, of which 9% was organic. The margin jumped to 9.9% (2006: 7.3%).
42
“The merger with RTKL offers ample opportunities for top line synergies.”
Smaller acquisitions to strengthen portfolio
Besides RTKL, several specialized niche companies were acquired to strengthen our portfolio and positions in home markets. With BFB we strengthened our cost management practice in the Netherlands, and with HL-S, we added facility consulting capabilities in Germany. In the United Kingdom, APS was acquired, specializing in project management, cost control and consultancy services for property development and having activities in the Middle East.
Organic growth driven by project management and consultancy services
The 2007, organic growth of 11% primarily came from management and consultancy services, capitalizing well on market conditions in the Netherlands, the United Kingdom, Germany and Belgium. AWwPC, launched in autumn 2006 to bundle our project management capabilities internationally, took off strongly in 2007. In the United Kingdom. we developed a survey model for testing buildings for the forthcoming mandatory environmental certification. In addition, we consult corporate clients on LEED issues (Leadership in Energy and Environmental Design), a green building rating system developed by the U.S. Green Building Council.
RTKL develops well and offers ample opportunities for synergy
RTKL developed well and showed solid growth, aided by particularly strong demand in the U.S. health care market. The U.S. housing market crisis had no real effect on RTKL, as the company’s exposure to the residential market is limited. While work continued on the high-profile U.S. Capitol visitor center in Washington, DC, another large federal project was won, as a partner in a consortium: the new eastern headquarters for the National Geospatial Intelligence Agency, having a construction value of approximately $ 1.2 billion.
The merger with RTKL offers ample opportunities for top-line synergies: combining RTKL’s design and planning skills with ARCADIS’ project management capabilities, using ARCADIS’ local positions and client base to leverage RTKL’s services, revitalizing old industrial or inner city sites by combining RTKL’s master planning and ARCADIS’ remediation, and developing concepts for ‘green’ buildings and ‘green’ urban planning.
Expanding into the Middle East
With newly acquired APS’ presence in the Middle East and RTKL’s experience with projects in that region, we are combining efforts and capitalizing on the booming market. A good example of the exciting opportunities is the Noor Al Ain mixed-use development project in the United Arab Emirates,
43
in which APS is the project manager. This project has a construction value of approximately € 500 million and includes residential and retail facilities, a 300-room business hotel, luxury offices and exclusive entertainment facilities.
Major step forward in facility management
Facility management services are offered through ARCADIS AQUMEN, a joint venture of ARCADIS and the U.K. firm Carillion. The company aims to benefit from the trend in major organizations to outsource non-core activities. In 2007, activities grew as a result of, among other things, the extension of the contract with computer chip producer NXP.
In February 2008, it was announced that ARCADIS AQUMEN won a new five-year contract with Philips, which includes sites in the Netherlands and Belgium. With an expected 1.2 to 1.5 million square meters (m2) under management, this contract is a considerable expansion of the previous contract that covered 0.6 million m2.
Outlook
Although to date, we see little impact on our buildings business from the international credit crisis, this segment is likely the first that could be impacted. With our diverse portfolio of services, primarily high in the value chain, our market position is much stronger and more defensible than ever before. RTKL’s backlog at year-end 2007 was up more than 40% compared to a year ago and covers more than one year of revenue. To compensate for consolidation in the U.S. commercial real estate market, RTKL is focusing on opportunities with the U.S. government; in health; and on work in China, Central Europe and the Middle East, where demand remains strong for high-end commercial property.
ARCADIS’ project and program management activities are concentrated in Europe. With a healthy backlog and opportunities to expand in the Middle East, we expect a continued positive development of these activities. U.S.-based PinnacleOne, acquired in 2006, primarily works for public-sector clients. AWwPC – our international brand for project management – is expected to continue its success. We see a growing interest among international investors for a global approach with local execution. A growing theme in European markets is green building consultancy where we can combine our property and environmental consultancy in a distinctive offering to clients.
In facility management, we expect further growth, fueled by the new five-year contract with Philips in the Benelux and interest from other organizations to outsource this activity.
44
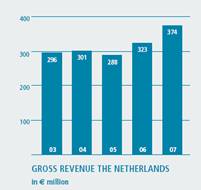
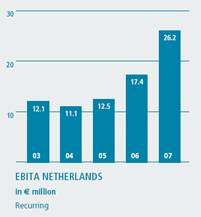
Developments by region
The Netherlands
Strong market conditions
After a strong recovery in 2006, the Dutch market continued to be favourable in 2007. The economy was in good shape, which had a positive impact on public and private sector investments. Gross revenue increased by 16% to € 374 million (2006: € 323 million). Organically gross revenue grew by 13%, driven by investments in road infrastructure, rail improvements, PPP projects, a good municipal market and more governmental outsourcing. Acquisitions contributed 3% to growth. Alkyon strengthened our position in the water market, also internationally, while BFB, acquired by PRC, added cost management capabilities. PRC developed favourably as demand for management and consultancy services was high. The company benefited from synergies internationally but also with other activities in the Netherlands. In summer a new interim management unit was established.
At the end of 2007, the Dutch organization was changed from a regional to a divisional structure. This will ensure better alignment with key markets and clients and will allow the Company to use specialized resources more effectively.
Considerable growth in profitability
Profitability rose markedly. EBITA was 51% higher at € 26.2 million, compared to € 17.4 million in 2006, primarily because of growth and higher billability and to a lesser extent price improvements.
45
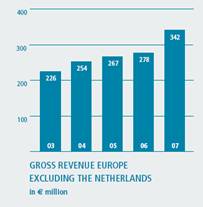
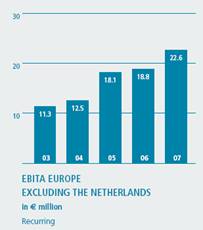
Europe excluding the Netherlands
Back on the growth path
In Europe excluding the Netherlands (Belgium, Germany, France, the United Kingdom, Poland, the Czech Republic and Romania), revenue grew strongly and was 23% higher at € 342 million (2006: € 278 million). Acquisitions contributed 13%. These included a facility management company in Germany, an environmental consultancy in Belgium, and two companies in the United Kingdom: one in environmental, health and safety consulting, and one in project management.
Organic growth was high at 10% with most countries contributing. The German market improved, particularly for environmental services and for project management and consultancy in the property market, while the infrastructure market remained highly competitive. In Poland, project start-up delays appear to have ended, resulting in accelerated growth. In the Czech Republic and Romania, activities saw strong growth as EU funds back up investment programs. In the United Kingdom, organic growth was solid in environment and project management. In Belgium, larger projects moved into the next phase, creating strong growth. In France, growth continued at a more moderate level.
Increase in profits
EBITA (recurring) increased 21% to € 22.6 million compared with € 18.8 million in 2006. Almost all countries contributed to this improved profitability, with the largest contributions coming from Germany and Poland.
46
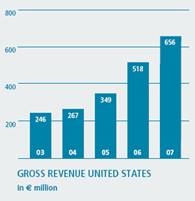

United States
Strong expansion in environment and buildings
Gross revenue increased 27% to € 656 million (2006: € 518 million), despite a currency effect of negative 10%. The contribution from acquisitions was 20%, mainly from RTKL and to a lesser extent PinnacleOne (acquired in November 2006), both primarily operating in the buildings market. Organic growth amounted to an impressive 17% and was mainly realized in the environmental market. In infrastructure, the water and transportation markets showed growth, but this was largely offset by the strong decline in land development.
By the end of 2007, the integration of BBL, acquired as per October 2005, was finalized. A new division structure was introduced based on a client-focused business model, with a division for environment and infrastructure. The buildings division is represented by RTKL, which will continue to operate separately. BBL has been successfully integrated into the environment division and its operations will continue under the ARCADIS brand. It increased productivity while at the same time delivering substantial revenue synergies. With infrastructure activities combined in one division, we are better positioned for continued growth in that field, also through acquisitions.
Strong profit growth
EBITA was 28% higher at € 44.6 million (2006: € 34.8 million). This was the result of strong organic revenue growth, acquisitions and increased productivity, offset by negative results in land development in the second half of 2007.
47

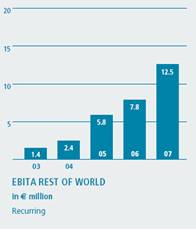
Rest of world
Activities in the rest of the world include Brazil, Chile and the Far and Middle East. Gross revenue rose 22% to € 138 million (2006: € 113 million). In March 2007, Euroconsult (staff 125, gross revenue € 33 million) was sold, as the company no longer fit ARCADIS’ strategy. Euroconsult worked on donor-financed projects in developing countries while ARCADIS’ focus is on building strong home market positions. Acquisitions and divestments on balance produced a revenue decline of 19%. The currency effect was positive 2%. Organic growth was 39%, primarily driven by strong growth in Brazil and Chile on the back of a high demand for raw materials and energy.
In the Far East, our position was strengthened through the acquisition of RTKL, with offices in Shanghai (China) and Tokyo (Japan).
We established a position in the Middle East with the acquisition of the project management firm APS with an office in Dubai. RTKL has since located staff in that office, aiming to capitalize on their previous work in the region.
Good profit growth
EBITA totalled € 12.5 million (2006: € 7.8 million), an increase of 60%. The largest contribution came from Brazil, which in addition to the solid growth in its normal business, also benefited from the contribution of carbon credits amounting to € 2.6 million (2006: € 0.6 million).
48

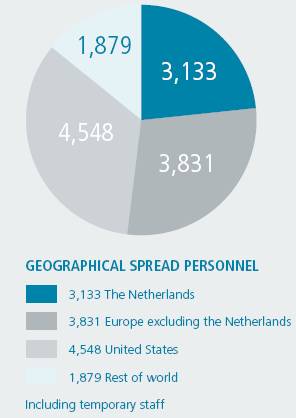
Human Resources Management
ARCADIS’ success is largely determined by the engagement and commitment of our more than 13,000 professionals around the world.
Our global human resources policy is aimed at attracting, engaging and retaining high-performing professionals, at all levels, by:
• Providing challenging assignments and the opportunity to work on cutting-edge projects.
• Focusing on long-term relations with clients who appreciate the added value we provide.
• Respecting the wishes of employees to balance work and personal life
• Stimulating open, two-way communication.
• Providing development opportunities through on-the-job and more formal training.
• Offering the opportunity to participate in ARCADIS’ success, including financially.
• Stimulating a healthy and safe work environment, where colleagues respect each other and feel proud to work for ARCADIS.
• Increasing diversity at the various levels in the organization.
Strengthening and reinforcing ARCADIS’ core values is an important cornerstone of our human resources policy. We envisage a culture in which integrity, entrepreneurship and agility are the basis for daily behavior. These important principles are anchored in ARCADIS’ General Business Principles.
Major recruitment effort
Achieving the current levels of organic growth in the competitive labor market required considerable efforts in the recruitment and engagement of staff. In 2007, we recruited more than 2,500 people, using our strong profile in the labor market. We are able to offer new employees opportunities in which they can learn a lot while contributing to solving complex issues that have a visible impact on society; in a professional, international
49
environment with stimulating colleagues; in a company that is well established, with good growth prospects. According to a Dutch survey of the most popular employers among graduates, ARCADIS’ ranking rose from 72 to 29, indicating our strength in the Dutch labor market. In several operating companies, recruitment success was fueled by our own employees acting as ambassadors, helping to find new colleagues through professional and private networks.
Engagement is key to retaining people
In the current labor market, engaging employees is a high priority. The primary drivers of engagement in a professional services organization are a professional work environment with ample development opportunities, the potential to make a valuable contribution and the quality of leadership. During the U.S. organizational changes to a divisional structure, focused attention was given to retention, including workshops for managers and the introduction of career development based on career tracks. In different operating companies, new training programs were organized, such as a professional development program in Belgium and a managing-for-excellence program in our U.K. operations. In Brazil, more systematic performance reviews were introduced, as well as a talent bank tool for career planning.
Have the best people in key positions, now and in the future
An important corporate human resources goal is to have the best people in global key positions. These are the people in operating companies and global business lines who drive our client-focused strategy. Key positions other than general management include top specialist, top project management and global account management positions. In 2007, a new succession management system was introduced to further improve the succession management process. In addition, we identified a pool of young professionals with the capabilities and aspirations to develop into ARCADIS’ key positions. The Top Potential Program, aimed at accelerating the development of identified top potentials, was continued.
Leadership development
To develop management capabilities and simultaneously strengthen the internal network, we started in October 2007 the ninth edition of our Advanced Management Program (AMP). The program gives participants a broader perspective of ARCADIS’ strategy. They have extensive interaction with senior management and are involved in a project of strategic importance. In addition, a new international training program, the European Network Program (ENP) was established. Its aim is to explore
50
new international business opportunities, to learn how to (net)work in an international environment and to enrich project management skills. Thirty-nine individuals from various European operating companies participated.
Number of employees and performance indicators
The total number of employees increased from 10,418 at year-end 2006 to 12,305 at year-end 2007. Including temporary staff, capacity at year-end 2007 increased by more than 15% to 13,391 (2006: 11,533). The increase resulted from both acquisitions and a strong organic growth.
Absenteeism improved slightly and totaled 1.9% (2006: 2.0%). Annual voluntary staff turnover was, compared to local benchmarks, at good levels, especially in the United States and the Netherlands.
Employee share purchase program
In 2001, together with the Lovinklaan Foundation, an employee share purchase program was established that allows employees to purchase ARCADIS shares from the Lovinklaan Foundation at a discount. The program is intended to increase employee involvement in ARCADIS. The Lovinklaan Foundation, with more than 20% of the shares, is our largest shareholder and represents the employees. The shares for the program, including the discount, are provided by the Lovinklaan Foundation. The plan therefore does not lead to the purchase or issuance of shares by ARCADIS. In 2007, employees bought 92,219 shares under the program. Of our total staff, nearly 25% currently participates in the share purchase plan.
“Of our total staff, nearly 25% currently participates in the share purchase plan.”
51
Risk management
Increased emphasis on risk management
As a result of the increasing complexity of projects, changing roles of market participants and more stringent regulations and reporting requirements, the emphasis on risk management has substantially increased.
Risks for ARCADIS include:
• Market risks: markets in which ARCADIS operates may decline, temporarily or structurally, and changes in market conditions may lead to increased competition. These risks can be caused by cyclical downturns, changes in political priorities, changes in legislation and regulations, political instability, consolidation of clients and changes in tendering procedures.
• Operational risks: these occur during contract execution and include project overruns; claims as a result of errors or omissions; underutilization of staff and properties; and risks related to partners and subcontractors, IT systems and health and safety.
• Financial risks: in general, these have a direct financial impact and include seasonal effects; currency exchange rate and interest rate risks; project development risks; and risks related to work in progress, receivables, taxes, liquidity, pensions, options, as well as risks related to acquisitions.
• Financial reporting risks: this concerns the risks that the financial statements do not correctly represent the financial condition of the company.
• Other risks: these involve labor market risks and risks related to reputation, integrity, fraud and compliance.
Besides these risks, other risks might occur that could seriously impact ARCADIS or its business. For a more extensive overview of risks and contract types under which services are offered, please refer to the governance section of the ARCADIS website.
Entrepreneurship is one of ARCADIS’ core values. It includes recognizing, assessing and managing risks involved. In general, frequent communication between the different levels of management in the organization is important for early identification and addressing of (potential) risks. Internal approval
52
“ARCADIS has General Business Principles in place as a guideline for business decisions for all employees.”
procedures and control systems are used to stimulate and maintain risk awareness and to systematically address risk issues. ARCADIS has General Business Principles in place as a guideline for business decisions for all employees. In 2007, a global policy and management system to manage health and safety risks were implemented. The abovementioned section of our website provides an overview of ARCADIS’ risk management processes.
The Executive Board is responsible for the design and functioning of the internal risk management and control systems. Although such systems are intended to optimally control risks, they can never, however well designed or functioning, provide absolute certainty that human errors, unforeseen circumstances, material losses, fraud or infringements of laws or regulations will not occur. In addition, the impact of risk management and control systems should be balanced with the costs of their implementation and maintenance.
Main risks and how these are managed
Based on our experience, we have identified three main risk categories in our business. These risks and the way they are managed can be summarized as follows:
• Imbalance between work load and staffing levels.
A decrease in work load will lead to staff underutilization. Experience indicates that strong market downturns could lead to a 15% decrease in revenue within one year for a particular business line within a country. This obviously has a serious impact on margin and profitability. Risk management includes: monitoring order intake and billability; 10% to 15% of staff under flexible contracts, particularly in Europe (in the United States, adjusting staff levels is easier); and on a more strategic level: portfolio management to get a good balance geographically between business lines and between client categories in order to spread market and strategic risks.
• Project-related risks.
ARCADIS works on thousands of projects/contracts annually. Although in most cases project risks are limited, projects may have serious cost overruns; errors or omissions may lead to substantial claims; contractual conditions may cause considerable liabilities; and staff involved may be seriously injured in executing projects. Risk management involves project approval procedures, including the review of contract conditions; special procedures for projects with higher risk profiles; regular project reviews; selection, training and procedures for project management; quality management systems; procedures for claims reporting and management; insurance policy and health and safety management. Project risks and claims are assessed on a quarterly basis, and using the valuation principles under IFRS, provisions are taken to cover those risks.
53
• Risks related to acquisitions.
Growth through acquisitions is part of ARCADIS’ strategy. All acquisitions involve risks, such as balance sheet misrepresentations, unforeseen claims, lagging performance, integration risks and retention of key people. Risk management includes central management of acquisition processes; verification of management quality and reputation; appropriate due diligence, usually with outside support, including a business review and an assessment of human resources conditions; proper representations and warranties; escrows to cover guarantees; employment and non–compete contracts; and dedicated management of a post-acquisition plan. Occasionally after-payments are used, but only for a limited period, so that integration and synergy are not hampered.
Although the above are considered the most relevant, it cannot be excluded that other risks have a similar or greater impact on the Company.
ARCADIS reported SOX compliance for its 2006 Annual Report
As ARCADIS was until mid-2007 a NASDAQ listed, the Company had to comply with Section 404 of the Sarbanes-Oxley Act. Therefore in 2004, a project was started to develop and implement a control framework to prevent or timely discover and repair - with a reasonable degree of certainty - material weaknesses in financial reporting. The internationally acknowledged COSO framework was used in this process. The relevant operating companies evaluated their operational processes and, for risks identified, established controls to manage these risks. Explicit attention was given to the prevention of fraud. By the end of 2006, the quality of this control framework was tested by management and later verified and certified by the external auditor. As a result, ARCADIS reported compliance with the requirements of SOX 404 in the 2006 Annual Report on Form 20-F.
From SOX to ARCADIS Control Framework
After publishing the 2006 Annual Report on Form 20-F, ARCADIS announced its withdrawal from the NASDAQ stock exchange as of June 2007, to be followed by deregistration from the U.S. Securities and Exchange Commission in June 2008. The reasons were the low trading volume of our shares on the NASDAQ and the high costs compared to the benefits. As we are no longer required to comply with SOX, we have developed the ARCADIS control framework, which is based on the SOX requirements but with more focus and without unnecessary paperwork. It will apply to all operating companies and will regularly be verified by our internal auditors.
54
Risk management further improved
The introduction of SOX 404 helped improve risk and control awareness, not only in relation to financial reporting but also for business risks. In 2007, good progress was made in expanding the scope of ARCADIS’ control framework to all operating companies. The new financial consolidation system that was introduced in 2006 helped to further improve the quality of consolidation and financial reporting. The internal audit function became effective, and in addition to performing audits, an internal ‘audit pool’ was created. The internal audit reports and measures to address recommendations were discussed with the Audit Committee.
Statement regarding financial reporting risks
Based on an evaluation of the functioning of the internal control framework, we are of the opinion that the risk management and control systems provide a reasonable certainty that the financial reports do not contain any errors of material impact and that these systems have performed as required in the reporting year. There are no indications that these systems will not properly function in 2008 as well. Similar to the practices under SOX, we allow one year to bring sizeable acquisitions into our control framework.
“Good progress was made in expanding the scope of ARCADIS’ control framework to all operating companies.”
55
Sustainable business conduct
ARCADIS conducts business in a sustainable way, taking responsibility for the impact of our activities on the human habitat. Sustainable business conduct is anchored in our General Business Principles, which state that ARCADIS wants to compete and conduct business honestly. Employees support this by signing the code. At least as important, however, is the attitude of our people, which reflects the role ARCADIS has fulfilled in society throughout its 120- year history: committed and passionately contributing to the sustainable development of the human habitat, in open communication with all stakeholders.
The environmental balance of our company is positive. Much of our business involves cleaning up contamination and otherwise working to reduce the impact of projects and processes on the environment. We limit to the extent possible the impact of our own business conduct. In addition, we are involved in the communities across our global footprint. Integrity is one of our core values, and we have a health and safety program that we consider to be one of the best in our industry. Also our corporate governance and human resources policy are in line with social responsible business conduct.
The impact of our work on the human habitat
Impact of our projects
By far, the largest impact of our work is through the projects that we execute for our clients. Sustainability concepts are considered an integral part of
56
our work. In infrastructure, our goal is to design and implement projects with minimizing potential impacts on the environment and to be as energy and resource efficient as possible. Our work involves mass transportation, renewable energy development, replacing congested systems, sustainable land development, clean water supply and wastewater treatment. In environment, a significant part of our activities relates to the cleanup of the historical environmental legacies of our clients. In addition, we provide clients with services related to current and future environmental topics including air, water and land pollution, climate change, and the entire spectrum of services related to efficient energy development, transmission, and use. In buildings, as with infrastructure, we are mindful of the potential environmental impact of projects, which we address with designs that include energy-efficiency and other sustainable or “green” components, including the reuse of building materials.
We continually invest in new technologies, products and services that create environmental benefits for our clients; for example, a solid waste gasification plant in Poland to minimize solid waste dumping, while creating energy; or the remediation of Biscayne Bay where a complex natural situation requires new thinking to ensure mangrove forests are not affected; or the development of sustainable office buildings in Belgium and the statistical work for the European Commission on pesticide risk indicators.
Sustainability in our own business conduct
During 2007, we continued our internal sustainability activities in the operating companies, across our global footprint, with progress reported on the following aspects:
· Energy conservation, including equipment substitution for higher efficiency.
· Development of energy off-sets.
· Renewable energy purchase.
· Water conservation.
· Reduction, recycling, and recovery of paper, electronic equipment, chemicals, etc.
· Waste minimization for non-recyclable wastes.
· Maximization of office space efficiency.
· Paper selection for increased use of recycled or sustainably-developed paper.
· Tele-commuting.
· Travel minimization and optimization.
· Selection of sustainable purchased materials and products.
57
In addition, 2007 has been a planning year for a global Sustainability Program, which will be introduced across ARCADIS in 2008. This program builds on our existing successes with the objective to reduce our “corporate” impact on the environment. We will measure and monitor progress against our program goals and report that progress in transparent terms. Our internal sustainability program is focused on the following components:
· Energy and water usage in our offices/facilities.
· Paper usage and paper type.
· Waste reduction and disposal or recycling.
· Transportation - ground and air.
· Selection of purchased materials and products.
· In each of these areas, we aim to meet the needs of our business while minimizing the environmental impact of our activities.
Social involvement
Working on projects in the community
Together with the Koninklijke Nederlandsche Heidemaatschappij Foundation – a large shareholder in ARCADIS and the Company’s predecessor – employees of ARCADIS worked on projects that aim at improving the human habitat. Employees can use a portion of Company time to participate in these types of volunteer projects, which was done in a project called “Community with Spirit,” supplying technical advice to participating groups.
Another example is the recuperation of the Macambira and Anicuns water streams in Brazil where we worked on drainage and sanitation works and the creation of parks along the banks of waterways. In Poland, ARCADIS sponsored a scholarship program in cooperation with the Institute of Geology of the University of Wroclaw. In addition, our Polish company supported orphanages by providing assistance from our employees.
Supporting cultural goals
ARCADIS actively supports community activities and cultural developments. The Company has its own art collection for which it purchases modern art to encourage young artists. In the Netherlands, talented young artists are supported for a study program at the Dutch Academy of Arts, and we sponsored the Prinses Christina competition for young musicians. In Brazil, we produced a cultural calendar to promote local artists and sponsored the restoration of paintings of the Cristo Operario Church, in São Paulo.
58
“We commit to offering personal development and career opportunities in healthy and safe working conditions.”
Integrity as a principle
The ARCADIS General Business Principles
This code serves as a guideline for our business decisions and activities and is applicable to all employees. The Business Principles describe our responsibilities to our stakeholders. With regard to society, we commit to comply with national laws and respect local cultures but also to respect the environment when executing projects. With regard to clients, professional integrity is key: reliability, independent professional judgment, as well as transparency regarding potential conflicts of interest. With regard to employees, we commit to being an equal opportunity employer, offering personal development and career opportunities in healthy and safe working conditions. With regard to shareholders, the focus is on increasing shareholder value. The full text of the business principles can be found on our website.
Dealing with dilemmas
The integrity code cannot possibly provide a tailored solution for every dilemma we may face in our day-to-day practices. An active integrity policy implies making dilemmas subject to discussion and taking responsibility for the choices made. Employees are therefore encouraged to discuss dilemmas with their management.
Accountability
The management of each operating company certifies compliance with the Business Principles by signing a Letter of Representation. Employees are not held responsible for the loss of work resulting from compliance with the Business Principles. ARCADIS has also introduced a whistle blower procedure, whereby employees will not suffer negative consequences from reporting violations of the code. A breach of the Business Principles can lead to sanctions, including termination of employment.
59
Health and safety
Health and safety are part of the company culture
In ARCADIS’ General Business Principles, we have committed to providing a healthy and safe work environment for all our employees. To that end, we have a firm-wide health and safety vision and policy in place, based on a proactive and preventative behavior-based approach. Working healthy and safely is an integral part of the overall company culture and should be reflected in the behavior of our employees. Our goal is to protect our staff from injury and illness. To realize this, health and safety has the same priority as our other core values and is an integral part of the solutions we provide to our clients.
Health and safety management system
According to our plan, we have implemented in 2007 a globally compatible, systematic approach for the management of health and safety risks throughout the entire company. This means that ARCADIS companies:
· Comply with applicable legal and other requirements.
· Assign responsibilities for health and safety to line management.
· Identify and meet client-specific health and safety expectations.
· Assure the necessary health and safety competence of all staff.
· Recognize positive health and safety behavior among employees, suppliers and clients.
· Set targets for continuous improvement and implement systems to achieve them.
· Actively promote subcontractors to be in alignment with our health and safety policy.
· Track and report health and safety performance.
· Include health and safety into projects to reduce impacts to our clients and stakeholders.
Strong health and safety performance
The aggressive implementation of the global health and safety management system contributes to protecting our most valuable resource, our employees, but also makes health and safety a differentiator with clients. Increasingly, clients are stating that solid health and safety programs with continuous improvement, management stewardship and employee engagement are conditions for working for them.
60
ARCADIS’ health and safety metrics continued to improve. Since the second quarter of 2007, the reporting system for commonly tracked Key Performance Indicators (KPIs) is on line. Taken globally, ARCADIS reduced its Total Recordable Case Frequency (TRCF) by 31%, while the Lost Time Frequency (LTIF), a measure of the seriousness of an injury or illness, dropped by 51%. Additionally, by the end of 2007, all of the ARCADIS operating companies reported TRCF’s below the publicly available U.S. benchmark for the Architecture and Engineering Industry.
2008 global health and safety objectives will focus on:
· Continuing to drive down our TRCF and LTIF.
· Increasing near-miss reporting in order to proactively implement preventive measures.
· Improving the stewardship of health and safety throughout the organization.
61
Outlook 2008
In all countries where ARCADIS is active, expansion and improvement of infrastructure is an important priority. In Europe, the solid economic conditions positively impact the investments in infrastructure, while PPP initiatives are used to solve bottlenecks quicker with private-sector money. In the United States, the transportation market is expected to be stable, while the framework contract that was won in New Orleans last year is a good basis for further growth in the water market. Meanwhile, less than 1% of total revenue comes from the U.S. market for land development, rendering its impact limited. Raw material demand drives continued favorable market conditions in Brazil and Chile.
The considerable attention to sustainability and climate change is positive for the environmental market. Many multinational companies want international service providers, as a result of which our market share in the environmental market can increase further. It is expected that new opportunities will arise in 2008 for GRiP®, both with the U.S. Department of Defense and in the redevelopment of contaminated sites. The acquisition of LFR ($ 127 million gross revenue, 480 employees), completed at the end of January 2008, has strengthened our position in the western United States and in air quality and will allow us to create synergy benefits similar to BBL.
In the buildings market, our position has been considerably strengthened in recent years with services high in the value chain. RTKL has a backlog that is 40% higher than a year ago and concentrates on opportunities with hospitals, government buildings and the international market. For project management and consultancy services, the backlog is good. Activities in the Middle East will be expanded. With the recently won five-year facility management contract for Philips, we can further expand these services.
The outlook for ARCADIS is positive. The markets in which we operate offer a lot of prospects. Our strong home market positions, client-focused approach and internal synergy provide a solid basis for growth and an increase in our market share. In addition, acquisitions remain high on our priority list. Barring unforeseen circumstances, we expect further growth of revenue and income for 2008.
Arnhem, the Netherlands, February 29, 2008 Executive Board
62
Report by the Supervisory Board
2007 financial statements
This annual report has been prepared by the Executive Board and consists of the consolidated financial statements and the financial statements of ARCADIS NV, including the Executive Board’s report, for the book-year 2007. The financial statements have been audited by KPMG Accountants N.V. The auditor’s report and certification are included on page 141.
The Audit Committee discussed the financial statements in detail in a meeting with the Chief Executive Officer (CEO), the Chief Financial Officer (CFO) and the auditor. The Audit Committee also had a discussion with the auditor, without management being present, and found no discrepancies. In addition, the complete Supervisory and Executive boards in the presence of the auditor discussed the financial statements. In that meeting, the auditor’s report and the quality of internal risk management and control systems were also discussed. Based on the Audit Committee’s recommendation, we concluded that the auditor is independent.
We agree with the financial statements and the accompanying documents. We also agree with the Executive Board’s proposal to set the dividend at € 1.23 per share to be distributed in cash. We recommend the GMS adopt the 2007 ARCADIS NV financial statements, including the dividend, as stated in the Executive Board’s proposal. Additionally, we request the GMS to discharge the members of the Executive Board for their management during 2007 and the members of the Supervisory Board for their supervision during 2007.
63
Supervisory Board Meetings
The Supervisory Board had seven meetings with the Executive Board. Two meetings were preceded by a closed meeting with no Executive Board members present. During 2007, Board members were rarely absent from either the Supervisory Board meetings or committee meetings. The Chairman had regular contact with the CEO between Supervisory Board meetings. During the meetings, a number of recurring topics were discussed, such as financial performance, claims and potential risks, working capital and cash flow, important project wins and developments in the operating companies. Press releases related to quarterly results were discussed prior to publication. Following is an overview of the specific topics discussed in each of the meetings.
In March, we discussed the 2006 financial statements and agreed with them, including the 2006 dividend. We also discussed the management letter of the external auditor, legal claims and regulatory issues and the Executive Board’s assessment of the structure and operation of internal risk management and control systems. Considerable time was spent reviewing the Executive Board’s report on compliance with the regulations regarding reliability in financial reporting (Section 404 Sarbanes-Oxley Act). We agreed with the divestment of ARCADIS Euroconsult as it no longer fit the Company’s strategy. Furthermore, we approved the granting of bonuses to the members of the Executive Board and the Senior Management Committee based on the 2006 performance. The newly appointed Corporate Director of Environment presented the global business plan.
In the April meeting, held in Prague, we approved the amendment to the Articles of Association involving the facilitation of electronic voting by shareholders and several technical amendments and agreed with the agenda for the Annual GMS. We extensively discussed the strategic rationale, potential risks and financial and organizational implications of the acquisition of RTKL and agreed to continue the acquisition process. The acquisition of Dutch-based Alkyon was approved. Furthermore, the conclusions from the investigation regarding the NASDAQ delisting and deregistration with the U.S. Securities and Exchange Commission were discussed, and we agreed with the proposed approach. A substantial part of the meeting was dedicated to an initial discussion on the update of the ARCADIS strategy, in particular assessing ARCADIS’ strategic position, exploring potential directions and identifying issues to be resolved. After the meeting, local management briefed us on the development of our Czech operations, and we visited projects.
64
“In June, after extensive discussion, we approved the acquisition of RTKL, which we consider an important step for ARCADIS.”
In May, the first quarter results were discussed, and the proposed granting of performance-based shares and options to the members of the Executive Board and the Senior Management Committee, and the granting of performance-based options to key staff, were approved. In a closed meeting, we evaluated our own operations and functioning, as well as the functioning of the Executive Board. Based on a presentation by the Corporate Director of Human Resources Management, we discussed talent management and succession planning.
In June, an extra meeting regarding the acquisition of RTKL was held by conference call. After extensive discussion about the due diligence outcome, the financial case, the risks involved, the main transaction terms and potential synergies, we approved the acquisition, which we consider an important step for ARCADIS.
In August, the second quarter results and the half-year review letter by the external auditor were discussed. We also discussed and approved the acquisition of APS. Furthermore, the financing and currency risk policies were discussed and agreed upon. The Executive Board presented the headings of the revised strategy, and we provided our input.
In November, the third quarter results were discussed. We also extensively discussed the updated three-year strategy as proposed by the Executive Board, and we agreed with the content.
In December, we discussed and approved the 2008 plan. The Corporate Director of the Multinational Clients Program presented the status and progress of that program. In a closed meeting, we evaluated the functioning of the Executive Board and its individual members. Subsequently, we discussed our own functioning, including that of the committees, and the preferred profile, composition and competences of our board. It was concluded that both the Supervisory Board and the Executive Board operate well as a team, with the members adequately fulfilling their respective roles.
Result and strategy
ARCADIS’ 2007 performance was excellent. The high organic growth, in combination with increased margins and value-enhancing acquisitions, demonstrates the success of the Company’s strategy, which is focused on growth of high added-value services in three business lines, based on strong home market positions.
65
During 2007, we spent a good deal of time discussing and reviewing progress on the revised strategy titled “Building Global Leadership.” We discussed, among other things, the composition of the portfolio; the strategy by business line; the financial aspects; the risks involved; the proposed organizational changes; and the implications on positioning, knowledge management, human resources, information technology and sustainability. We fully agree with the Executive Board’s focus on creating shareholder value on the longer term, while optimizing results in the short term. We are of the opinion that the revised strategy will enable the Company to develop a leadership position, which will create benefits for our clients and staff while simultaneously generating value for our shareholders.
Independence and board memberships
The Supervisory Board meets the requirement of the Dutch Corporate Governance Code that no more than one Supervisory Board member be non-independent. Mr. Rijnhard W.F. van Tets qualifies as non-independent under the Code because until April 2007 he was employed by ABN-AMRO Bank as an advisor to its Executive Board. However, as he has not been involved in any operational activities since January 2002, the Supervisory Board considers him to be independent. According to the provisions and stipulations of the Sarbanes-Oxley Act, Mr. van Tets qualifies as independent. The Supervisory Board also complies with the rule that its members do not hold more than five supervisory board positions at Dutch stock-listed companies (a chairmanship counts as two memberships).
Committees of the Supervisory Board
Audit Committee
This Committee met five times. All meetings were attended by the CEO, CFO and the external auditor. The committee met once with the external auditor without management. No discrepancies were identified. In a closed meeting, the performance, independence, scope of the audit and the external auditor’s fee were evaluated, as was the performance of the committee itself.
The Audit Committee discussed the full-year 2006 financial statements and the external auditor’s report and management letter and reviewed and discussed the reports from the Executive Board and KPMG on the quality of the control framework implemented to fulfill the requirements under Section 404 of the Sarbanes-Oxley Act. Also the Executive Board’s statement on internal control and risk management was reviewed. Every quarter, the quarterly results were discussed and the press release reviewed, and the half-year 2007 figures also the report from the external auditor
66
was discussed. The Audit Committee reviewed the internal audit reports and potential claims and specific risks. Regular updates were provided on integrity matters, claims and regulatory matters and the progress of implementing the ARCADIS control framework.
The Audit Committee also reviewed ARCADIS’ treasury, financing and currency risk policies, as well as compliance with the policy for external auditor independence.
One meeting in May was entirely focused on the 2006 annual report as filed with the U.S. Securities and Exchange Commission (ARCADIS Annual Report 2006 on Form 20-F). In the November meeting, the Audit Committee discussed with KPMG the 2007 audit plan and the proposed audit fee and approved both. The Audit Committee also approved the 2008 internal audit plan and reviewed the expenses of Executive and Supervisory Board members. The Committee reviewed the ARCADIS General Business Principles, Whistleblower Policy and Audit Committee charter and assessed the independence and financial literacy of its members. The Audit Committee members are considered independent based on the criteria outlined in the Sarbanes-Oxley Act. The Supervisory Board has appointed Mr. van Tets as the “Financial Expert” as intended by the Sarbanes-Oxley Act and the Code.
Selection and Remuneration Committee
This Committee had three meetings, usually in the presence of the CEO and the Corporate Director of Human Resources Management. Topics discussed included the granting of 2007 bonuses to the Executive Board and senior management based on the 2006 performance, the granting of performance-based shares and options to the Executive Board and senior management and the granting of performance-based options to key staff. Based on the 2008 plan and the existing remuneration policy, the performance criteria for 2008 bonuses of the Executive Board and senior management were discussed and established.
Further, the Committee discussed the new U.S. management structure and reviewed the assessment of key positions in the Company and the process to better identify high potentials. The Committee also prepared the performance evaluation of Executive Board members for discussion with the complete Supervisory Board.
As the remuneration policy for the Executive Board was developed three years ago, the Committee decided to evaluate the policy as the basis for a proposal for the 2008-2011 remuneration policy. An external consultant
67
was retained primarily to review the labor market reference group and to provide benchmark data. The Committee discussed the results and decided on the new, somewhat adjusted reference group. It was concluded that the headings of the remuneration policy can remain in place, with some adjustments based on the benchmark data and experience over the past period. The adjusted remuneration policy will be on the agenda of the General Meeting of Shareholders in May 2008.
For the remuneration report, please refer to page 75.
Composition of Supervisory Board and committees
Mr. Gerrit Ybema was reappointed by the GMS on May 16, 2007 for a second four-year term.
In accordance with the reappointment schedule, Mr. Jan Peelen’s and Mr. Thomas Cohn’s terms will expire at the close of the Annual GMS on May 7, 2008. Mr. Cohn is not available for reappointment. We want to thank him for his contribution, especially as chairman of the Audit Committee. Mr. Peelen is eligible for a third term. and the Supervisory Board has decided to nominate him for reappointment.
For information about the Supervisory Board members, please refer to page 72.
Word of thanks
The Company’s success in achieving its goals is largely the result of the commitment and contribution of the ARCADIS staff. We want to compliment all ARCADIS people on the outstanding results achieved in 2007 and thank them for their efforts and contribution.
Arnhem, the Netherlands, February 29, 2008
On behalf of the Supervisory Board
Rijnhard W.F. van Tets, Chairman
68
Supervisory Board

Rijnhard van Tets
Rijnhard W.F. van Tets MSc. (1947) - chairman
Dutch nationality, term 2002-2010
Audit Committee, Selection and Remuneration Committee (Chairman)
Current position:
Managing Partner of Laaken Asset Management
Previous positions:
Advisor to the Executive Board of ABN AMRO Bank (2002-2007); Member of the Executive Board of ABN AMRO Bank (1988-2002); Sogen Swiss and First Boston Corporation (New York, 1975-1983); Banque Européenne de Credit (Brussels) and Société Générale (Paris, 1973-1975).
Non-executive board functions:
· Chairman of the Supervisory Board of Euronext N.V. · Chairman of the Supervisory Board of Euronext Amsterdam N.V. · Member of the Supervisory Board of NYSE Euronext Inc. · Chairman of the Supervisory Board of Equity Trust SARL · Member of the Board of Petrofac Plc. · Member of the Supervisory Board of International Flavors & Fragrances I.F.F. (The Netherlands) Holding B.V.

Thomas Cohn
Thomas M. Cohn (1942)
Belgian and Israeli nationality, term 2004-2008
Audit Committee (Chairman)
Previous positions:
Chairman and CEO of the Executive Board, Siemens Nederland N.V. (1994-2003); CFO and Member of the Executive Board of Siemens Nederland N.V. (1987-1994); various functions, i.e. Director of Economic Affairs, Siemens Belgium (1967-1987); “Industriekaufmann” for Siemens AG, Germany (1964-1967)
Non-executive board functions:
· Chairman of the Supervisory Board of Getronics Holdings B.V.· Member of the Supervisory Board of Corus Nederland B.V. · Member of the Supervisory Board of KEMA N.V.· Member of the Supervisory Board of Recontec B.V.
Other functions:
· Chairman of the Advisory Board of Oracle Nederland B.V. · Advisor of the Foundation Techniek en Marketing-STEM · Board Member of Het Expertise Centrum (HEC) · Chairman of the Advisory Board of Pereira Van Vliet & Partners · Member of the Advisory Board of COMSEC Consulting Group (Israel) · Senior Advisor for Siemens Israel Ltd. · Senior Advisor for ControlGuard Ltd. (Israel) · Senior Advisor for Blue I Water Technologies (Israel)

Carlos Espinosa de
Los Monteros
Carlos Espinosa de Los Monteros (1944)
Spanish nationality, term 1998-2010
Selection and Remuneration Committee
Current position:
Chairman and CEO DaimlerCrysler España (since 1990),
Deputy Chairman for Inditex S.A. (ZARA)
Previous positions:
Chairman IBERIA Airlines (1983-1985).
Non-executive board functions:
· Member Supervisory Board Acciona S.A.

George Nethercutt
George R. Nethercutt, Jr. (1944)
U.S. nationality, term 2005-2009
Audit Committee
Previous positions:
Member of the United States House of Representatives (1995-2005). During that time, he served on the Appropriations Committee and the Defense, Interior and Agriculture Subcommittees, as well as on the Science Committee and the Energy and Space Subcommittees. Practiced law in the private sector, focusing on corporate, estate and probate and adoption law (1977-1994). Worked for the U.S. Senator Ted Stevens in Washington, concentrating on oil and gas, natural resources, mining and trading affairs (1972-1977).
Other functions:
· Member of the Board of Directors of Hecla Mining Company · Member of the Board of Directors of The Washington Policy Center · Member of the Board of Directors of the Juvenile Diabetes Foundation International · Chairman of the Permanent Joint Board on Defense, U.S./Canada · Chairman of the Board of Directors of The George Nethercutt Foundation · Member of the Advisory Board of Antelum Partners

Jan Peelen
Jan Peelen MSc. (1940)
Dutch nationality, term 2000-2008
Selection and Remuneration Committee
Previous positions:
Member of the Executive Committee of Unilever (1996-2000); several management positions within Unilever or subsidiary companies therein (since 1966).
Non-executive board functions:
· Chairman of the Supervisory Board of VVAA Group BV · Member of the Supervisory Board of Corporate Expre N.V. · Member of the Supervisory Board of Albron BV · Member of the Supervisory Board of Royal Friesland Foods NV
Other functions:
· Member of the Monitoring Board of the Netherlands Genomics Initiative

Gerrit Ybema
Gerrit Ybema MSc. (1945)
Dutch nationality, term 2003-2011
Selection and Remuneration Committee
Previous positions:
Several functions at the local authority and provincial levels. Member of the Dutch Parliament (1989-1998). Chairman of the Standing Committee of Finance (1994). During membership in the Dutch Parliament, also a member of several inquiry committees. State Secretary for Economic Affairs (1998-2002).
Non-executive board functions:
· Chairman of the Supervisory Board of Ventus Group B.V. · Member of the Supervisory Board of n.v. NUON · Member of the Supervisory Board of CORDIS Europe N.V.
Other functions:
· Chairman of the Monitoring Board of Zorggroep Noorderbreedte · Chairman of the Monitoring Board of Noordelijke Hogeschool Leeuwarden (NHL) · Chairman of the Monitoring Board of West Holland Foreign Investment Agency (WFIA) · Chairman of the Fair Wear Foundation · Chairman of the Frisian Harbour Days Foundation · Chairman of the Consultative Organ Frisian Language and Culture · Chairman of the Guarantee Committee of the VBO Real Estate Agents Certification Foundation (SCVM) · Chairman of the Dutch Foundation of Cinema Operators (NVB) · Chairman of the Health Innovation Forum Foundation (ZIF) · Member of the Monitoring Board of ROC Friese Poort
69
Executive Board

Harrie Noy
Harrie L.J. Noy, MEng. (1951)
Dutch nationality
Current position:
Chairman of the Executive Board since 2000.
Previous positions:
Has worked for ARCADIS in various management positions throughout his career, most recently as a member of the Executive Board.
Non-executive board functions:
· Member of the Supervisory Board of NV Nederlandse Gasunie
Other functions:
· Board member of the PSIB Foundation · Member of the Advisory Board of Euronext · Board member of VEUO (The Dutch Association of Listed Companies) · Board member of the Management Studies (SMS) Foundation · Board member of VNO-NCW · Chairman of the Supervisory Board of the College of Arnhem-Nijmegen · Chairman of the Supervisory Board of the Vilente Foundation

Michiel Jaski
C. Michiel Jaski, MEng. (1959)
Dutch nationality
Current position:
Member of the Executive Board since 2000.
Previous positions:
Before joining ARCADIS, he held various management positions at Shell and Philips.
Other functions:
· Chairman of the Monitoring Board of the Delta Foundation (primary education) �� Member of the IUCN Netherlands Committee, Leaders for Nature · Board member of the STT (Foundation Toekomstbeeld der Techniek) · Member of the Advisory Board of the Delft University Fund · Board member of the Dutch-German Chamber of Commerce
Friedrich Schneider
Friedrich M.T. Schneider, MA. PhD. (1962)
German nationality
Current position:
Member of the Executive Board since 2006.
Previous positions:
Before joining ARCADIS, he held various management positions at Rheinhold & Mahla, Bilfinger Berger, Bentec and Preussag.

Ben van der Klift
Ben A. van der Klift, MSc. (1959)
Dutch nationality
Current position:
Chief Financial Officer since 2006.
Previous positions:
Before joining ARCADIS, he held various financial positions at DHV and PRC Bouwcentrum. In August 2004, he joined ARCADIS N.V.; since January 1, 2005, he has been the Corporate Director of Finance.
Other functions:
· Board member of the Foundation for the ARCADIS Nederland Pension Fund
70
Remuneration report
This report has been prepared by the Selection and Remuneration Committee of the Supervisory Board and is based on the remuneration policy adopted at the GMS on May 11, 2005.
Remuneration of Executive Board
Remuneration policy
Compensation for Executive Board members is determined by the Supervisory Board, on the Selection and Remuneration Committee’s advice, within the framework of the remuneration policy. This policy is aimed at attracting, motivating and retaining qualified management for an international company of ARCADIS’ size and complexity. The total compensation package should be in line with the median remuneration level of a selected labor market reference group. Compensation consists of a base salary, variable remuneration (short-term and long-term) and a pension plan. Variable remuneration is an important component of the total package and is based on performance criteria that are aimed at value creation in the short and longer term.
The labor market reference group was selected in 2005 and consists of a number of Dutch companies that are comparable in complexity and size and a number of foreign companies operating in the same industry as ARCADIS. These companies are Ballast Nedam (NL), Ten Cate (NL), Boskalis (NL), Draka Holding (NL), Fugro (NL), Grontmij (NL), PinkRoccade (NL), Pöyry (Fin), Alten (Fr), Tetra Tech (U.S.), Sweco (S) and WSP (U.K.).
The 2005 remuneration policy has been designed in such a way that when all goals are achieved, the variable remuneration, on average, is expected to be 40% to 50% of total remuneration (excluding pensions and fringe benefits). Because the numbers of conditional shares and options included in the package are fixed for three years, the actual percentage of variable remuneration may (materially) differ. The Selection and Remuneration
71
Committee reviews the remuneration policy every three years to verify its market conformity. Such a review has recently been finished. Material amendments will be submitted to the GMS in May 2008.
Annual base salary
In accordance with the 2005 remuneration policy, 2004 base salaries were increased twice by 5% (on July 1, 2005 and on July 1, 2006) to achieve the median level of the reference group. On July 1, 2007, base salaries were increased by 2%.
Short-term variable remuneration: bonus
The bonus may vary from 0% to 60% of the annual base salary, with 40% (the target bonus) being applicable when targets are achieved. Financial targets are related to the Company’s financial goals and determine 75% of the bonus. Non-financial targets determine the remaining 25% and cannot be overachieved. The targets are preset annually by the Supervisory Board. Targets for 2007 and performance against these targets were as follows:
· Net income from operations per share (EPS), excluding currency impacts; weight: 45%.
· The EPS target was based on the 2007 budget. With actual EPS growth (excluding currency impact) at 28%, the maximum of 30% of base salary was achieved for this target.
· Return on capital invested (ROCI); weight: 30%.
· The target is in principle 15% but is annually reviewed based on the budget. With actual ROCI at 20.1%, the maximum of 20% of base salary was achieved for this target.
· Non-financial targets are tuned to the specific responsibilities of individual Executive Board members. Based on performance, the bonus varied from 7% to 10% of base salary.
This resulted in bonuses varying between 57% and 60% of annual base salary.
Long-term variable remuneration: ARCADIS options and shares
This part of remuneration consists of performance-based options and shares that are granted each year and become vested upon the condition of the Company achieving a certain performance measure after three years. The performance measure is Total Shareholder Return (TSR), defined as share price increase, including reinvested dividends. This measure stimulates creating shareholder value for the longer term.
Each year, a three-year cycle begins, with performance being measured at the end of each period against a peer group of nine listed companies in our industry: URS (U.S.), WSP (U.K.), Atkins (U.K.), Alten (Fr), Tetra Tech
72
(U.S.), TRC (U.S.), Grontmij (NL), Sweco (S) and Pöyry (Fin). Performance is based on the average share price in the fourth quarter, including reinvested dividends. ARCADIS’ ranking compared to the peer group determines whether and to what extent the originally granted options and shares become unconditional, according to the table below.
|
| Number of options and shares |
|
ARCADIS ranking against peer group |
| that become unconditional |
|
First |
| 150 | % |
Fourth |
| 100 | % |
Seventh |
| 50 | % |
Below seventh |
| 0 | % |
Between first and seventh |
| Determined by interpolation |
|
In 2005, the number of conditional options and shares to be granted each year was set for three years (2005-2007) at 25,000 options and 10,000 shares for the CEO and 15,000 options and 7,000 shares for other Executive Board members. These numbers were approved by the GMS in 2005. When granting the 2006 awards, a change in numbers was considered because of the strong increase in ARCADIS’ stock price. It was decided not to change the numbers for Messrs. Noy and Jaski because of their contribution to the positive development of ARCADIS’ stock. For Messrs. van der Klift and Schneider, who were appointed to the Executive Board in 2006, the numbers were adjusted to 12,500 options and 5,000 shares.
The exercise price for options granted is the closing price of the ARCADIS share on the first trading day after the GMS on which the shares are quoted ex-dividend. Options are valid for a ten-year period. Shares must be retained for a period of at least two years after vesting.
ARCADIS’ performance in the period 2004-2007 resulted in second place among our peer group, which means that the shares and options that were granted in May 2005 will become unconditional in May 2008 at 133% of the originally granted numbers.
Pensions and other benefits
Executive Board members participate in the ARCADIS Netherlands pension plan. This is a collective defined contribution plan with the premium based on the ambition of a pension payment that, under certain conditions, is comparable to an average pay scheme with a retirement age of 63 years. The contribution from the participants is 6% of the pension basis. Mr. Schneider, who is a German citizen, receives compensation for the limited
73
tax deductibility of his own contribution to the pension fund. Executive Board members receive a fixed allowance for expenses, as well as other customary fringe benefits including the use of a company car. They may also participate in the Employee Share Purchase Plan, under which they may purchase a maximum of € 400 per month of ARCADIS shares from the Lovinklaan Foundation at a discount.
Employment contracts and severance pay
Messrs. Noy and Jaski have been appointed for an indefinite period. Their contracts do not contain severance pay provisions. For Executive Board members appointed in 2006, Messrs. van der Klift and Schneider, a four-year term and a maximum severance pay of one year’s base salary were agreed. No arrangements have been made in the event of the termination of employment resulting from a public bid for ARCADIS.
For information on remuneration and share and option ownership of Executive Board members, please refer to page 138 of this annual report.
Remuneration of Supervisory Board
The GMS determines remuneration for Supervisory Board members. This was last done in 2004. Remuneration consists of a fixed base compensation, a compensation for Committee memberships and an allowance for costs. Remuneration is not dependent on Company results. Supervisory Board members are not eligible to receive shares or options as part of their remuneration. Possible share ownership of ARCADIS shares by a Supervisory Board member is meant as a long-term investment.
For information on remuneration and share ownership of Supervisory Board members, please refer to page 139 of this annual report.
74
Other information
The Company has not granted any loans, advances or guarantees to Executive and Supervisory board members. In 2005, ARCADIS NV provided Executive Board members an indemnification for all costs and expenses from and against any claim, action or lawsuit related to actions and/or omissions in their function as Executive Board members. As approved by the GMS, in 2005, a similar indemnification was provided to Supervisory Board members.
During 2007, no transactions involving conflicts of interest for Executive Board or Supervisory Board members which were material to the Company occurred.
On behalf of the Selection and Remuneration Committee Rijnhard W.F. van Tets, Chairman
75
Corporate Governance
Integrity, transparency, accountability and proper supervision are key components of good corporate governance. ARCADIS is committed to the principles and best practices of the Dutch Corporate Governance Code (the “Code”) that became effective in 2003, with a few deviations. At the GMS on May 12, 2004, the way in which ARCADIS would apply the Code was discussed and accepted. This means that ARCADIS is in compliance with the Code. Since that 2004 meeting, no changes have been made to the corporate governance structure. Material changes will be submitted to the GMS for consideration.
An overview of ARCADIS’ corporate governance structure and an explanation of ARCADIS’ departures from the principles and best practices of the Code are provided below. For more detailed information, please visit the ARCADIS website (www.arcadis-global.com).
Organizational structure
ARCADIS NV is a public limited company (“naamloze vennootschap”) under Dutch law. The company is managed by the Executive Board under the supervision of the Supervisory Board. Since the amendment of its Articles of Association in 2003, ARCADIS is an international holding company according to Dutch regulations. This means that shareholder rights are not limited by the Dutch structure regime, and Executive Board members and Supervisory Board members are appointed and dismissed by the GMS.
Based on a proposal by the Executive Board, and with prior Supervisory Board and ARCADIS Priority Foundation approval, the GMS can amend the Articles of Association. Such a decision requires a majority of at least
76
three-fourths of the votes in a meeting where at least three-fourths of the outstanding capital is represented. If such a quorum is not present, a second meeting is needed, during which amendments can be passed with at least three-fourths of the votes, regardless of the capital represented.
Executive Board
The Executive Board manages the Company and is responsible for achieving the Company’s goals and objectives, strategy and policy and results. The Supervisory Board determines the number of Executive Board members who are appointed by the GMS. For every appointment, the Supervisory Board is entitled to make a nomination. If the nomination is binding, the GMS may only defeat the nomination by a resolution passed by at least a two-thirds majority of the votes, representing more than one-half of the outstanding capital. If the nomination is non-binding, the GMS decides by simple majority. The GMS can suspend or dismiss an Executive Board member. Such a decision, other than proposed by the Supervisory Board, requires at least a two-thirds majority of the votes, representing more than one-half of the outstanding capital.
The Supervisory Board appoints a chairman from among the members of the Executive Board and determines in consultation with the Executive Board the distribution of tasks. The current composition of the Executive Board and information about its members are provided on page 73 of this report. The Executive Board members hold no Supervisory Board positions at other stock-listed companies. In 2007, no conflicts of interest were reported between the Company and Executive Board members.
Supervisory Board
The Supervisory Board supervises and advises the Executive Board in performing its management tasks and supervises the overall development of the Company and its affiliates. In doing so, the Supervisory Board is guided by the interests of the Company and its stakeholders. The Supervisory Board consists of at least three members (currently six) who are appointed by the GMS in the same way as Executive Board members are appointed, provided that defeating a binding nomination requires at least two-thirds of the votes, representing more than one-third of the outstanding capital. The GMS can suspend or dismiss a member of the Supervisory Board. Such a decision, other than proposed by the Supervisory Board, requires a majority of at least two-thirds of the votes, representing at least one-third of the outstanding capital.
77
The Supervisory Board appoints one of its members as chairman. Members are appointed for a maximum of four years and are eligible for reappointment for two additional four-year terms up to a maximum 12-year term of office. The Supervisory Board has established from its members two committees — an Audit Committee and a Selection and Remuneration Committee — that prepare the decisions of the Supervisory Board. The tasks and procedures of the committees are outlined in charters, which can be accessed on our website (www.arcadis-global.com).
The current composition of the Supervisory Board and information about its members are provided on page 72 of this report.
General Meeting of Shareholders
A GMS is held at least once a year. Meetings may be convened by the Executive Board or the Supervisory Board and can also be held at the request of shareholders jointly representing at least 10% of the Company’s outstanding capital. Shareholders who represent at least 1% of the Company’s outstanding capital may submit a proposal for the agenda at least 60 days prior to the meeting. Each shareholder is entitled to attend a GMS in person or be represented by written proxy and to exercise voting rights with due observance of the provisions in the Articles of Association. Each share of outstanding capital stock is entitled to one vote. Resolutions are adopted by a simple majority of votes unless the Articles of Association or the law mandates otherwise.
ARCADIS advocates active shareholder participation at shareholders’ meetings. The option of a “record date” has been incorporated into ARCADIS’ Articles of Association since 2002, and since 2007, the Articles of Association also provide for communication and voting by electronic means.
For an overview of the main powers of the GMS, as well as the Articles of Association of the Company, please visit the ARCADIS website.
78
Share capital
ARCADIS has ordinary shares, cumulative financing preference shares, priority shares and cumulative preferred (protective) shares. For a further explanation of the capital structure and the issuance or purchasing of shares, please refer to note 17 in the Financial Statements. Priority shares and cumulative preferred shares have a special meaning for the governance of the Company.
Priority shares
The 200 priority shares, held by the ARCADIS Priority Foundation (Stichting Prioriteit ARCADIS NV), give the right of prior approval for important decisions such as the issuance, acquisition or disposal of shares; amendments to the Articles of Association; dissolution or filing for bankruptcy; cooperative ventures of far-reaching significance; and major divestments and acquisitions. The board of the Foundation is composed of ten members from the Executive and Supervisory Boards and ten members from ARCADIS’ international employee base. Decisions require a majority of at least 60% of the votes. The Foundation can be seen as providing a test of employee support for far-reaching decisions. For more information, please see note 17 of the Financial Statements.
Cumulative Preferred Shares
In the event of an unfriendly or a hostile takeover attempt, these shares are intended to prevent major changes in the control of the Company without due consideration of the interests of the Company and all stakeholders involved. To this end, an option agreement has been signed with the ARCADIS Preferred Stock Foundation (Stichting Preferente Aandelen ARCADIS NV). For more information, please see note 17 of the Financial Statements.
Regulation concerning securities
ARCADIS has a regulation concerning the ownership of and transactions in securities, which applies to all employees unless the regulation provides otherwise. The regulation prohibits Executive and Supervisory Board members from executing transactions in the securities of certain other listed companies, regardless of their having any inside information.
79
Financial reporting and the external auditor
Before being presented to the GMS for adoption, the Company’s annual financial statements as prepared by the Executive Board must be examined by an external registered auditor. The external auditor is appointed each year by the GMS, based on a proposal from the Supervisory Board, after receiving the recommendation of the Audit Committee and the Executive Board. The external auditor’s assignment, including his remuneration, is proposed by the Audit Committee and approved by the Supervisory Board after consultation with the Executive Board.
Pursuant to the Sarbanes-Oxley Act, all services by the external auditor outside the audit of the financial statements are verified and approved in advance by the Audit Committee to ensure the auditor’s independence. In addition, the Sarbanes-Oxley Act stipulates certain services that may not be provided by the external auditor, and it also requires companies to change their external audit partner every five years. ARCADIS changed its partner in 2001 and 2006.
Prior to publication, the quarterly financial statements and quarterly reports are discussed with the Audit Committee, in the presence of the external auditor, in preparation for their consideration by the Supervisory Board. The external auditor attends the meetings of the Supervisory Board in which the annual financial statement and the half-year results are discussed.
80
Compliance with the Dutch Corporate Governance Code
ARCADIS complies with the Code by either applying its principles and best practices or by explaining the deviations. ARCADIS deviates from the Code on the following items, as explained below:
· II.1.1: The maximum four-year term of office will not be observed for the members of the Executive Board who were appointed in 1994 and 2000 for an indefinite period. This complies with the preamble to the Code that indicates that existing contracts may be honored. For the two members appointed to the Executive Board in 2006, the four-year term has been applied.
· II.2.7: The contracts of the two Executive Board members who were appointed prior to the introduction of the Code do not contain (maximum) severance pay provisions. Consequently, in the event of involuntary dismissal, the severance payment will be determined by taking into account applicable laws and regulations; the grounds for dismissal; the level of remuneration; and the legal position of the individual as determined, inter alia, by length of service at the Company. For the two members of the Executive Board appointed in 2006, a maximum severance payment consistent with the Code has been included in their contracts.
· III.5: ARCADIS does not have a separate remuneration committee and selection and appointment committee but combines both committees in the Selection and Remuneration Committee, consistent with the practice established in 1998. The current size of the Supervisory Board, the allocation of responsibilities among its members and the fact that the current committee is functioning satisfactorily justify this deviation. The Chairman of the Supervisory Board also chairs this committee, which we consider necessary given the selection and nomination task of this committee. This is a departure from best practice provision III.5.11.
· IV.1.1: The GMS can cancel the binding nature of nominations for the appointment or dismissal of an Executive Board member or Supervisory Board member only with a qualified majority. When the Articles of Association were amended in 2003 to abandon the statutory structure regime of the Company, this rule was established in view of the percentage of share ownership of the Lovinklaan Foundation. It was stated that nominations to the Executive Board would normally be binding, whereas nominations to the Supervisory Board would, under normal circumstances, be non-binding. The GMS approved this practice explicitly by approving the amendments in their 2003 meeting.
81
Financial Statements 2007
82
Consolidated balance sheet at December 31
Assets |
| Note |
| 2007 |
| 2006 |
|
Non-current assets |
|
|
|
|
|
|
|
Intangible assets |
| 7 |
| 227,487 |
| 154,170 |
|
Property, plant & equipment |
| 8 |
| 63,869 |
| 55,006 |
|
Investments in associates |
| 9 |
| 17,892 |
| 5,227 |
|
Other investments |
| 10 |
| 2,543 |
| 6,202 |
|
Other non-current assets |
| 11 |
| 7,009 |
| 5,810 |
|
Deferred tax assets |
| 20 |
| 14,073 |
| 8,291 |
|
Total non-current assets |
|
|
| 332,873 |
| 234,706 |
|
Current assets |
|
|
|
|
|
|
|
Inventories |
| 12 |
| 676 |
| 451 |
|
Derivatives |
| 13 |
| — |
| — |
|
(Un) billed receivables |
| 14 |
| 464,844 |
| 373,428 |
|
Other current assets |
| 15 |
| 27,520 |
| 23,836 |
|
Corporate tax assets |
|
|
| 3,152 |
| 2,561 |
|
Cash and cash equivalents |
| 16 |
| 92,608 |
| 101,488 |
|
Total current assets |
|
|
| 588,800 |
| 501,764 |
|
Total assets |
|
|
| 921,673 |
| 736,470 |
|
|
|
|
|
|
|
|
|
Equity and liabilities |
|
|
|
|
|
|
|
Shareholders’ equity |
|
|
|
|
|
|
|
Share capital |
|
|
| 1,030 |
| 1,030 |
|
Share premium |
|
|
| 44,153 |
| 44,153 |
|
Cumulative translation reserve |
|
|
| (29,829 | ) | (7,659 | ) |
Retained earnings |
|
|
| 117,509 |
| 106,421 |
|
Net income |
|
|
| 54,852 |
| 44,936 |
|
Total equity attributable to equity holders of the Company |
|
|
| 187,715 |
| 188,881 |
|
Minority interest |
|
|
| 11,483 |
| 11,836 |
|
Total equity |
| 17 |
| 199,198 |
| 200,717 |
|
Non-current liabilities |
|
|
|
|
|
|
|
Provisions |
| 19 |
| 28,661 |
| 19,943 |
|
Deferred tax liabilities |
| 20 |
| 14,693 |
| 20,444 |
|
Loans and borrowings |
| 21 |
| 165,153 |
| 119,286 |
|
Derivatives |
| 13 |
| 21,188 |
| 5,829 |
|
Total non-current liabilities |
|
|
| 229,695 |
| 165,502 |
|
Current liabilities |
|
|
|
|
|
|
|
Billing in excess of cost |
| 14 |
| 142,896 |
| 111,882 |
|
Corporate tax liabilities |
|
|
| 17,190 |
| 1,913 |
|
Current portion of loans and borrowings |
|
|
| 36,468 |
| 1,580 |
|
Accounts payable |
|
|
| 119,538 |
| 87,052 |
|
Accrued expenses |
|
|
| 16,394 |
| 24,885 |
|
Other current liabilities |
| 22 |
| 160,294 |
| 142,939 |
|
Total current liabilities |
|
|
| 492,780 |
| 370,251 |
|
Total liabilities |
|
|
| 722,475 |
| 535,753 |
|
|
|
|
|
|
|
|
|
Total equity and liabilities |
|
|
| 921,673 |
| 736,470 |
|
The notes on pages 92 to 131 are an integral part of these consolidated financial statements.
Amounts in thousands of euros
83
Consolidated statement of income for the year ended December 31
|
| Note |
| 2007 |
| 2006 |
|
Revenue |
|
|
| 1,497,516 |
| 1,235,479 |
|
Change in work in progress |
|
|
| 12,722 |
| (2,436 | ) |
Gross revenue |
|
|
| 1,510,238 |
| 1,233,043 |
|
Materials, services of third parties and subcontractors |
|
|
| (505,785 | ) | (395,583 | ) |
Net revenue |
|
|
| 1,004,453 |
| 837,460 |
|
Personnel costs |
| 24 |
| (693,334 | ) | (581,333 | ) |
Other operational costs |
| 24 |
| (185,156 | ) | (159,643 | ) |
Depreciation |
| 7, 8 |
| (20,405 | ) | (17,733 | ) |
Amortization identifiable intangible assets |
| 7 |
| (12,224 | ) | (8,270 | ) |
Other income |
| 25 |
| 1,635 |
| — |
|
Total operational costs |
|
|
| (909,484 | ) | (766,979 | ) |
Operating income |
|
|
| 94,969 |
| 70,481 |
|
Finance income |
|
|
| 22,289 |
| 14,116 |
|
Finance expenses |
|
|
| (15,536 | ) | (10,063 | ) |
Fair value change of derivatives |
| 13 |
| (15,370 | ) | (7,552 | ) |
Net finance expense |
| 26 |
| (8,617 | ) | (3,499 | ) |
Income from associates |
|
|
| (822 | ) | (458 | ) |
Profit before taxes |
|
|
| 85,530 |
| 66,524 |
|
Income taxes |
| 27 |
| (28,032 | ) | (20,119 | ) |
Profit for the period |
|
|
| 57,498 |
| 46,405 |
|
Attributable to: |
|
|
|
|
|
|
|
Equity holders of the Company (net income) |
|
|
| 54,852 |
| 44,936 |
|
Minority interest |
|
|
| 2,646 |
| 1,469 |
|
Profit for the period |
|
|
| 57,498 |
| 46,405 |
|
In euros: |
|
|
|
|
|
|
|
Basic earnings per share |
|
|
| 2.70 |
| 2.22 |
|
Diluted earnings per share |
|
|
| 2.61 |
| 2.13 |
|
Weighted average number of shares used to |
|
|
|
|
|
|
|
compute income per share: |
|
|
|
|
|
|
|
Basic |
|
|
| 20,330,078 |
| 20,234,295 |
|
Diluted |
|
|
| 20,996,064 |
| 21,074,137 |
|
Net income from operations |
| 2007 |
| 2006 |
|
Profit for the period attributable to equity holders of the Company (net income) |
| 54,852 |
| 44,936 |
|
Net effect of financial instruments (1) |
| 400 |
| (802 | ) |
Option costs UK share save scheme (2) |
| 116 |
| — |
|
Non-recurring income, net of taxes (3) |
| (961 | ) | — |
|
Amortization identifiable intangible assets, net of taxes |
| 7,886 |
| 5,901 |
|
Net income from operations |
| 62,293 |
| 50,035 |
|
Net income from operations per share (in euros) |
|
|
|
|
|
Basic |
| 3.06 |
| 2.47 |
|
Diluted |
| 2.97 |
| 2.37 |
|
(1) Net effect of financial instruments: The currency translation adjustment of the US$200 million loan and the fair value change of the swaps, after taxes (2006: US$120 million loan).
(2) The UK sharesave scheme is controlled by the Lovinklaan Foundation, and the Company has no influence on this scheme. Accordingly, the Company does consider the related share-based payments expenses that need to be recorded under IFRS as a non-operational expense.
(3) Non-recurring income relates to the book gain on the sale of assets in France, net of movement costs related to this sale.
Amounts in thousands of euros unless otherwise stated
84
Consolidated statement of cash flows for the year ended December 31
Cash flow from operating activities |
| Note |
| 2007 |
| 2006 |
|
Profit for the period |
|
|
| 57,498 |
| 46,405 |
|
Adjustments for: |
|
|
|
|
|
|
|
Income from associates |
|
|
| 822 |
| 458 |
|
Taxes on income |
| 27 |
| 28,032 |
| 20,119 |
|
Net finance expense |
| 26 |
| 8,617 |
| 3,499 |
|
Depreciation and amortization |
| 7, 8 |
| 32,629 |
| 26,003 |
|
|
|
|
| 127,598 |
| 96,484 |
|
Share-based compensation |
| 17, 24 |
| 4,195 |
| 1,751 |
|
Dividend received |
|
|
| 156 |
| 1,532 |
|
Sale of activities, net of cost |
|
|
| (3,284 | ) | — |
|
Interest received |
|
|
| 7,533 |
| 8,703 |
|
Interest paid |
|
|
| (15,202 | ) | (12,975 | ) |
Corporate tax paid |
|
|
| (28,319 | ) | (19,634 | ) |
Change in inventories |
|
|
| (268 | ) | (77 | ) |
Change in receivables |
|
|
| (43,319 | ) | (36,850 | ) |
Change in deferred taxes |
|
|
| (10,887 | ) | 1,361 |
|
Change in provisions |
|
|
| (1,461 | ) | (1,475 | ) |
Change in billing in excess of costs |
|
|
| 20,807 |
| 25,000 |
|
Change in current liabilities |
|
|
| 21,347 |
| 22,536 |
|
Net cash from operating activities |
|
|
| 78,896 |
| 86,356 |
|
|
|
|
|
|
|
|
|
Cash flow from investing activities |
|
|
|
|
|
|
|
Investments in (in)tangible assets |
| 7, 8 |
| (33,326 | ) | (19,292 | ) |
Divestments of (in)tangible assets |
| 7, 8 |
| 14,183 |
| 870 |
|
Investments in consolidated companies |
| 6 |
| (85,290 | ) | (46,082 | ) |
Divestments of consolidated companies |
| 6 |
| (2,408 | ) | (23 | ) |
Investments in associates and other investments |
| 9,10 |
| (9,773 | ) | (4,045 | ) |
Divestments of associates and other investments |
| 9, 10 |
| 2,308 |
| 98 |
|
Investments in other non-current assets |
|
|
| (2,939 | ) | (2,662 | ) |
Divestments of other non-current assets |
|
|
| 1,724 |
| 2,280 |
|
Net cash used in investing activities |
|
|
| (115,521 | ) | (68,856 | ) |
|
|
|
|
|
|
|
|
Cash flow from financing activities |
|
|
|
|
|
|
|
Issued shares by subsidiaries |
|
|
| — |
| 30 |
|
Options exercised |
| 17 |
| 2,215 |
| 4,611 |
|
Purchase of own shares |
| 17 |
| (19,770 | ) | (17,596 | ) |
New long-term loans and borrowings |
|
|
| 78,553 |
| 26,062 |
|
Repayment of long-term loans and borrowings |
|
|
| (6,419 | ) | (8,664 | ) |
Changes in short-term borrowings |
|
|
| (997 | ) | 19,639 |
|
Dividends paid |
|
|
| (22,453 | ) | (13,590 | ) |
Other changes in equity |
|
|
| 871 |
| 2,171 |
|
Net cash from financing activities |
|
|
| 32,000 |
| 12,663 |
|
|
|
|
|
|
|
|
|
Net change in cash and cash equivalents |
|
|
| (4,625 | ) | 30,163 |
|
Exchange rate differences |
|
|
| (4,255 | ) | (2,559 | ) |
Cash and cash equivalents at January 1 |
|
|
| 101,488 |
| 73,884 |
|
Cash and cash equivalents at December 31 |
|
|
| 92,608 |
| 101,488 |
|
Amounts in thousands of euros
85
Consolidated statement of changes in equity
|
| Attributable to equity holders of the parent company |
| ||||||||||||||||
|
| Number |
| Number of |
| Share |
| Share |
| Cumula- |
| Retained |
| Total |
| Minority |
| Total |
|
Balance at January 1, 2006 |
| 200 |
| 20,645,615 |
| 1,030 |
| 44,153 |
| 6,403 |
| 124,617 |
| 176,203 |
| 11,885 |
| 188,088 |
|
Exchange rate differences |
|
|
|
|
|
|
|
|
| (14,062 | ) |
|
| (14,062 | ) | (9 | ) | (14,071 | ) |
Taxes related to share-based payments |
|
|
|
|
|
|
|
|
|
|
| 6,416 |
| 6,416 |
|
|
| 6,416 |
|
Income directly recognized in equity |
|
|
|
|
|
|
|
|
| (14,062 | ) | 6,416 |
| (7,646 | ) | (9 | ) | (7,655 | ) |
Profit for the period |
|
|
|
|
|
|
|
|
|
|
| 44,936 |
| 44,936 |
| 1,469 |
| 46,405 |
|
Total income/(expenses) for the period |
|
|
|
|
|
|
|
|
| (14,062 | ) | 51,352 |
| 37,290 |
| 1,460 |
| 38,750 |
|
Share-based payments |
|
|
|
|
|
|
|
|
|
|
| 1,751 |
| 1,751 |
|
|
| 1,751 |
|
Dividends to shareholders |
|
|
|
|
|
|
|
|
|
|
| (13,378 | ) | (13,378 | ) | (312 | ) | (13,690 | ) |
Own shares purchased for granted options |
|
|
|
|
|
|
|
|
|
|
| (17,596 | ) | (17,596 | ) |
|
| (17,596 | ) |
Share options exercised |
|
|
|
|
|
|
|
|
|
|
| 4,611 |
| 4,611 |
|
|
| 4,611 |
|
Expansion ownership |
|
|
|
|
|
|
|
|
|
|
|
|
|
|
| (910 | ) | (910 | ) |
Capital increase |
|
|
|
|
|
|
|
|
|
|
|
|
|
|
| 30 |
| 30 |
|
Other changes |
|
|
|
|
|
|
|
|
|
|
|
|
|
|
| (317 | ) | (317 | ) |
Balance at December 31, 2006 |
| 200 |
| 20,645,615 |
| 1,030 |
| 44,153 |
| (7,659 | ) | 151,357 |
| 188,881 |
| 11,836 |
| 200,717 |
|
Exchange rate differences |
|
|
|
|
|
|
|
|
| (22,170 | ) |
|
| (22,170 | ) | 704 |
| (21,466 | ) |
Taxes related to share-based payments |
|
|
|
|
|
|
|
|
|
|
| (74 | ) | (74 | ) |
|
| (74 | ) |
Income directly recognized in equity |
|
|
|
|
|
|
|
|
| (22,170 | ) | (74 | ) | (22,244 | ) | 704 |
| (21,540 | ) |
Profit for the period |
|
|
|
|
|
|
|
|
|
|
| 54,852 |
| 54,852 |
| 2,646 |
| 57,498 |
|
Total income/(expenses) for the period |
|
|
|
|
|
|
|
|
| (22,170 | ) | 54,778 |
| 32,608 |
| 3,350 |
| 35,958 |
|
Share-based payments |
|
|
|
|
|
|
|
|
|
|
| 4,195 |
| 4,195 |
|
|
| 4,195 |
|
Dividends to shareholders |
|
|
|
|
|
|
|
|
|
|
| (20,414 | ) | (20,414 | ) | (2,039 | ) | (22,453 | ) |
Own shares purchased for granted options |
|
|
|
|
|
|
|
|
|
|
| (19,770 | ) | (19,770 | ) |
|
| (19,770 | ) |
Share options exercised |
|
|
|
|
|
|
|
|
|
|
| 2,215 |
| 2,215 |
|
|
| 2,215 |
|
Expansion ownership |
|
|
|
|
|
|
|
|
|
|
|
|
|
|
| (1,664 | ) | (1,664 | ) |
Balance at December 31, 2007 |
| 200 |
| 20,645,615 |
| 1,030 |
| 44,153 |
| (29,829 | ) | 172,361 |
| 187,715 |
| 11,483 |
| 199,198 |
|
Amounts in thousands of euros unless otherwise stated
86
Financial Statements 2007
Notes to the consolidated financial statements
Notes to the consolidated financial statements
1 Reporting Entity
ARCADIS NV is a public company organized under Dutch law. Its principal office is located at: Nieuwe Stationsstraat 10, 6811 KS, Arnhem, the Netherlands. Phone: +31-26-3778911.
ARCADIS NV and its consolidated subsidiaries (“ARCADIS” or the “Company”) is an international provider of comprehensive knowledge-based consulting services in the areas of infrastructure, environment and buildings.
2 Basis of preparation
The consolidated financial statements have been prepared in accordance with International Financial Reporting Standards (IFRSs) as endorsed by the European Union and in conformity with the Dutch Civil Code, Book 2, Title 9.
The financial statements were authorized for issue by the Executive Board and Supervisory Board on February 29, 2008. The financial statements as presented in this report are subject to adoption by the General Meeting of Shareholders.
The consolidated financial statements have been prepared on a historical cost basis, unless stated otherwise in the principles of valuation of assets and liabilities. Exceptions to the historical cost basis include derivative financial instruments and share-based payment arrangements, which are measured at fair value.
The consolidated financial statements are presented in euros, which is the Company’s functional currency. All amounts shown in the financial statements are in thousands of euros unless otherwise stated.
The preparation of the financial statements requires management to make judgments, estimates and assumptions that affect the application of accounting policies and the reported amounts of assets, liabilities, income and expenses. The key accounting estimates and judgments in preparing the financial statements are explained in note 3. Actual results may differ from these estimates.
Estimates and underlying assumptions are reviewed on an ongoing basis. Revisions to accounting estimates are recognized in the period in which the estimate is revised and in any future periods affected.
3 Significant accounting policies
The accounting policies detailed below have been applied consistently to all periods presented in these consolidated financial statements, and by all subsidiaries. Certain comparative amounts have been reclassified to conform with the current year’s presentation. This mainly concerns the statutory reserves in the Company financial statements.
Basis of consolidation
The consolidated financial statements include the accounts of ARCADIS NV and its subsidiaries. Subsidiaries are companies over which ARCADIS NV has control. Control exists when the Company has the power, directly or indirectly,
87
Financial Statements 2007
Notes to the consolidated financial statements
to govern the financial and operating policies of an entity so as to obtain benefits from its activities. In assessing control, potential voting rights that presently are exercisable or convertible are taken into account. The financial statements of subsidiaries are included in the consolidated financial statements from the date that control commences until the date control ceases.
One hundred percent of the operations of subsidiaries are included, with the minority interest in group equity and group income shown separately.
Jointly controlled entities are those entities over whose activities the Company has joint control, established by contractual agreement.
The consolidated financial statements include the Company’s proportionate share of the entities’ assets, liabilities, revenue and expenses with items of a similar nature on a line-by-line basis, from the date that joint control commences until the date that joint control ceases.
Business combinations
The Company uses the purchase accounting method in accounting for acquisitions. The cost of an acquisition is measured as the fair value of the assets given, equity instruments issued and liabilities incurred or assumed at the date of exchange, plus costs directly attributable to the acquisition. Identifiable assets acquired and liabilities and contingent liabilities assumed in a business combination are initially measured at fair value at the acquisition date. The excess of the cost of acquisition over the fair value of ARCADIS’ share of the identifiable net assets acquired is recorded as goodwill. If the cost of acquisition is less than the fair value of the net assets of the subsidiary acquired, the difference is recognized directly in the statement of income.
Business combinations arising from transfers of interest in entities that are under the control of the Company are accounted for at the carrying amounts recognized previously. These business combinations are accounted for as if the acquisition had occurred at the beginning of the earliest comparative period presented or, if later, at the date that common control was established. For this purpose, comparative amounts are restated.
Transactions eliminated on consolidation
Intra-group balances and transactions and any unrealized gains and losses or income and expenses arising from intra-group transactions are eliminated in preparing the consolidated financial statements. Unrealized gains arising from transactions with associates and jointly controlled entities are eliminated to the extent of the Company’s interest in the investee. Unrealized losses are eliminated in the same way as unrealized gains, but only to the extent that there is no evidence of impairment.
Foreign currency
Foreign currency transactions
Transactions in foreign currencies are translated into the functional currency of entities using the foreign exchange rate at transaction date. The functional currency of the foreign entities in general is the local currency. Assets and liabilities denominated in foreign currencies are translated to the functional currency of the entity using the exchange rates at the balance sheet date. Exchange rate differences are included in the statement of income.
Foreign operations
The statements of income of foreign operations are translated into euros using the foreign exchange rates at transaction date, approximating average exchange rates. The assets and liabilities of foreign operations, including
88
Financial Statements 2007
Notes to the consolidated financial statements
goodwill and fair value adjustments arising on acquisition, are translated to euros at exchange rates at the reporting date.
Foreign currency differences are recognized directly in equity. Since January 1, 2004, the Company’s date of transition to IFRSs, such differences have been recognized in the cumulative translation reserve. When a foreign operation is disposed of, in part or in full, the relevant amount in the cumulative translation reserve is transferred to the statement of income.
Derivative Financial Instruments
Only for specific purposes are derivative financial instruments used to hedge the Company’s exposure to foreign exchange and interest rate risks arising from operational, financing and investment activities. In accordance with its treasury policy, the Company does not hold or issue derivative financial instruments for trading purposes.
Derivatives are recognized initially at fair value. Attributable transaction costs are recognized in the statement of income when incurred. The gain or loss on remeasurement to fair value is recognized immediately in the statement of income. The fair value of interest rate swaps is the estimated amount that the Company would receive or pay to terminate the swap at the balance sheet date, taking into account current interest rates and the current credit worthiness of the swap counterparties. The fair value of forward exchange contracts is their quoted market price at the balance sheet date, being the present value of the quoted forward price.
The Company does not apply hedge accounting.
Intangible assets
Goodwill
Goodwill arises on the acquisition of subsidiaries, associates and joint ventures. All acquisitions are accounted for by applying the purchase accounting method. Goodwill represents the excess of the cost of the acquisition over the Company’s interest in the net fair value of the identifiable assets, liabilities and contingent liabilities of the acquiree. When the excess is negative (negative goodwill), it is recognized immediately in the statement of income. Goodwill has an indefinite useful life and is annually tested for impairment. Goodwill is measured at cost less any accumulated impairment losses.
Goodwill is only recognized for acquisitions on or after January 1, 2003, since the Company selected as part of its transition to IFRS to restate only those business combinations that occurred on or after January 1, 2003.
Software
Software is measured at cost less accumulated amortization and impairment losses. Software has a finite life and is amortized on a straight-line basis over the estimated useful life, which is 3 to 5 years.
Subsequent costs are recognized in the carrying amount of software only when it increases the future economic benefits. All other expenditures are recognized in the statement of income as incurred.
Other intangible assets
Other intangible assets, mainly consisting of expected profits in the backlog of the acquired companies at the moment of acquisition, are measured at cost less accumulated amortization and impairment losses. These other intangibles are amortized over the estimated useful life, which varies from
89
Financial Statements 2007
Notes to the consolidated financial statements
0.5 to 5 years. At initial recognition, the backlog is recognized at the fair value at the moment of acquisition.
Amortization is recognized in the statement of income on a straight-line basis over the estimated useful lives of intangible assets. The amortization methods and useful lives, as well as residual values, are reassessed annually.
Property, plant & equipment
Property, plant & equipment are measured at cost less accumulated depreciation and impairment losses. Cost includes expenditures that are directly attributable to the acquisition of the asset.
Subsequent costs are recognized in the carrying amount of property, plant & equipment if it is probable that future economic benefits will be obtained. The costs of day-to-day servicing of property, plant & equipment are expensed when they occur.
Depreciation is recognized in the statement of income on a straight-line basis over the estimated useful lives. The estimated useful life of buildings ranges from 30 to 40 years; for furniture and fixtures, this varies from 3 to 8 years. Land is not depreciated. Depreciation methods and useful lives, as well as residual values, are reassessed annually.
When portions of an item of property, plant & equipment have different useful lives, they are accounted for as separate items (major components) of property, plant & equipment.
Gains and losses on the sale of an item of property, plant & equipment are determined by comparing the proceeds from disposal with the carrying amount of property, plant & equipment and are recognized net within other income in the statement of income.
Leased assets
Leases in which the Company assumes substantially all the risks and rewards of ownership are classified as finance leases. Upon initial recognition and the leased asset is measured at an amount equal to the lower of its fair value and the present value of the minimum lease payments. Subsequent to initial recognition, the asset is accounted for in accordance with the accounting policy applicable to that asset.
Other leases are operating leases, and the leased assets are not recognized on the Company’s balance sheet.
Investments in associates and jointly controlled companies
Associates are those entities in which ARCADIS has significant influence but not control over the financial and operating management. Significant influence is presumed to exist when 20% to 50% of the voting power is held. Joint ventures are those entities in which ARCADIS has joint control, established by contractual agreement and requiring unanimous consent for strategic, financial and operation decisions.
Associates are accounted for using the equity method from the date that significant influence commences until the date that significant influence ceases. Goodwill identified on acquisition of the associate is included in the investment. Jointly controlled companies are proportionally consolidated.
90
Financial Statements 2007
Notes to the consolidated financial statements
The consolidated financial statements include ARCADIS’ share of the income and expenses of the equity-accounted investments, whereby the calculation is based as much as possible on the ARCADIS accounting principles. When the share of losses exceeds the interest in a company, the carrying amount is reduced to zero, and recognition of further losses is discontinued unless ARCADIS has an obligation or has made payments on behalf of the company.
Other investments
Companies in which ARCADIS has no significant influence are measured at cost less any impairment losses. Long-term receivables are measured at amortized cost less any impairment losses.
Deferred taxes
Deferred tax assets and liabilities are recognized on the balance sheet, providing for temporary differences between the carrying amount of the assets and liabilities for financial reporting purposes and the amounts used for taxation purposes. Deferred tax is measured at the tax rates that are expected to be applied to the temporary differences when they reverse, based on enacted or substantially enacted tax rates and tax laws at the reporting date. Deferred tax assets are only recognized when it is more likely than not that there will be future fiscal profits against which to settle the temporary differences or not-yet-compensated fiscal losses. Deferred tax assets are reviewed at each reporting date and are reduced to the extent that it is no longer probable that the related tax benefit will be realized. Deferred taxes are not discounted. Deferred taxes are not recognized for the initial recognition of goodwill, the initial recognition of assets or liabilities that affect neither accounting nor taxable profit, and the differences relating to investments in subsidiaries to the extent that they will probably not reverse in the foreseeable future.
For share-based payments, the deferred tax is determined based on the manner in which the award is expected to be settled and in accordance with applicable tax legislation. The information used in estimating the deductions available in future periods is consistent with the information used to determine the share-based payment expense. If the estimated future tax deduction exceeds the amount of the related cumulative share-based payment expense, the excess of the associated income tax is recognized directly in equity.
Additional income taxes that arise from the distribution of dividends are recognized at the same time that the liability to pay the related dividend is recognized.
Inventories
Inventories are measured at the lower of cost or net realizable value. Cost of inventories comprises all cost of purchase, cost of conversion and other cost incurred in bringing the inventories to the present location and condition. Net realizable value is the estimated selling price in the ordinary course of business, less the estimated cost of completion and selling expenses.
(Un)billed receivables
Unbilled receivables are measured at cost plus profit recognized to date less progress billings and a provision for foreseeable losses. Cost includes all expenditures related directly to specific projects and an allocation of fixed and variable overheads incurred in the Company’s contract activities based on normal operating capacity. Billed receivables are measured at amortized cost less any impairment losses. If payments received from customers
91
Financial Statements 2007
Notes to the consolidated financial statements
exceed the income recognized, the difference is presented as deferred income in the balance sheet.
Other receivables
Other receivables are measured at amortized cost less any impairment losses.
Cash and cash equivalents
Cash and cash equivalents comprise cash balances and call deposits.
Equity
Repurchase of shares
The consideration paid for temporarily repurchased shares, which are repurchased to prevent dilution through the share option plan, is deducted from equity at cost.
Dividends
Dividends are recognized as a liability in the period in which they are declared.
Provisions
Provisions are recognized when there is a present obligation (legal or constructive) as a result of a past event for which it is probable that an outflow of economic benefits will be required to settle the obligation and a reliable estimate can be made of the amount of the obligation. Provisions are measured at the net present value, taking into account the timing of the cash outflows. The discount rate reflects the current market assessments of the time value of money and the risks specific to the liability.
Employee benefits
Pensions
Most pension plans within ARCADIS qualify as a defined contribution plan. Obligations for contributions to defined contribution plans are recognized as a cost in the statement of income as incurred.
In some countries, minor plans exist that qualify as defined benefit plans. For these minor defined benefit plans, a provision is created, which is based on actuarial calculations. The net obligation with respect to these defined benefit pension plans is calculated separately for each plan by estimating the amount of future benefit that employees have earned in return for their service in the current and prior periods; that benefit is discounted to determine its present value, and any unrecognized past service costs and the fair value of any plan assets are deducted. The discount rate is the yield at the reporting date on bonds that have maturity dates approximating the terms of the obligations. The calculation is performed by a qualified actuary using the projected unit credit method. When the calculation results in a benefit, the recognized asset is limited to the net total of any unrecognized past service costs and the present value of any future refunds from the plan or reductions in future contributions to the plan.
When the benefits of a plan are improved, the portion of the increased benefit relating to past service by employees is recognized in the statement of income on a straight-line basis over the average period until the benefits become vested. To the extent that the benefits vest immediately, the expense is recognized immediately in the statement of income.
Actuarial gains and losses are recognized to the extent that any cumulative unrecognized actuarial gain or loss exceeds 10% of the greater of the present
92
Financial Statements 2007
Notes to the consolidated financial statements
value of the defined benefit obligation and the fair value of plan assets. That portion is recognized in the statement of income over the expected average remaining working lives of the employees participating in the plan.
Other long-term employee benefits
The Company’s net obligation for long-term service benefits, other than pension plans, is the amount of future benefit that employees have earned in return for their service in the current and prior periods. The obligation is calculated using the projected unit credit method and is discounted to its present value of any related assets that are deducted. Any actuarial gains or losses are recognized in the statement of income in the period in which they arise.
Share-based payments
Within ARCADIS, equity-settled, share-based compensation plans exist. The grant date fair value of share-based payments under the ARCADIS long-term incentive plan is recognized as an employee expense, with a corresponding increase in equity, over the period in which the employees become unconditionally entitled to the options. The amount recognized as an expense is adjusted to reflect the actual number of share options that vest.
The fair value of the granted options is determined using the binominal model taking into account the effect of the applications. The cost charged will be adjusted for the actual number of share-based incentives that are canceled. The vesting and exercise of shares may be conditional on the satisfaction of performance conditions or on continued employment, or both, as set by the Supervisory Board.
Loans and borrowings
Interest-bearing debts are measured at amortized cost, in which the difference between the proceeds and the final repayment amount is charged to the statement of income over the duration of the debts. The portion of long-term debt that has to be repaid within one year after the balance sheet date is presented as the current portion of long-term debt under current liabilities.
Impairment
The carrying amounts of the assets of ARCADIS, other than work in progress and deferred tax assets, are reviewed at each balance sheet date to determine whether there is any indication of impairment.
For goodwill and assets that have an indefinite useful life, the recoverable amount is estimated at each balance sheet date.
An impairment loss is recognized whenever the carrying amount of an asset or its cash-generating unit exceeds its recoverable amount. Impairment losses are recognized in the statement of income. Impairment losses recognized with regard to cash-generating units are allocated first to reduce the carrying amount of any goodwill allocated to cash-generating units and then to reduce the carrying amount of the other assets in the unit on a pro-rata basis.
The recoverable amount is the greater of the net selling price and value in use. In assessing the value in use, estimated future cash flows are discounted to present value using a discount rate that reflects current market assessments of the time value of money and the risks specific to the asset.
93
Financial Statements 2007
Notes to the consolidated financial statements
An impairment loss of goodwill cannot be reversed. Regarding other assets, an impairment loss can be reversed if there has been a change in the estimates used to determine the recoverable amount. An impairment loss is reversed only to the extent that the asset’s carrying amount does not exceed the carrying amount that would have been determined, net of depreciation or amortization, if no impairment loss had been recognized.
Revenue
As soon as the outcome of a construction contract can be estimated reliably, contract revenue and expenses are recognized in the statement of income in proportion to the stage of completion of the contract. Contract revenue includes the initial amount agreed in the contract plus any variations in contract work, claims and incentive payments to the extent that it is probable that they will result in revenue and can be measured reliably.
The stage of completion is assessed by reference to surveys of work performed. When the outcome of a construction contract cannot be estimated reliably, contract revenue is recognized only to the extent of contract costs incurred that are likely to be recoverable. An expected loss on a contract is recognized immediately in the statement of income.
The balances of the projects on which no confirmation of order has been received are recognized in the statement of income.
Advance investments that can be separately identified, measured reliably and are attributable to design, build, finance and operate contracts are accounted for as contract costs only when it is probable that the contract will be obtained. Advance investments in the development of a contract that do not meet these criteria are expensed. It is only considered probable that a design, build, finance and operate contract will be obtained upon receipt of a contract signed by the client.
In case of a partnership, the consolidated financial statements include the Company’s proportionate share of the contract costs for jointly controlled entities. Investments in which the Company has significant influence but not control over the financial and operating management are measured using the equity method.
Furthermore, investments in partnership projects are evaluated for potential beneficial interest.
Carbon credits
ARCADIS produces carbon credits. The number of carbon credits produced is formally confirmed by verification reports from external parties, stating that in a period a certain number of carbon credits have been produced. Revenue on the sale of these carbon credits is recognized only after the moment the risks and rewards have been transferred to the buyer.
Change in work in progress
The invoicing of projects in progress in most instances does not equal the project costs and project results at the balance sheet date. The difference between these amounts at year end, compared to the same amount at the beginning of the year, is shown separately as part of gross revenue.
94
Financial Statements 2007
Notes to the consolidated financial statements
Materials, services of third parties and subcontractors
Under materials, services of third parties and subcontracts, project-related costs of materials and services charged by third parties, including the costs of subcontractors, are recognized.
Sale of investments
When the sale of a group company classified as a continued operation, a jointly controlled entity or an associate leads to a gain, this gain is shown separately as part of other income. A loss is recorded under other business costs.
Operational cost
All employee-related cost, as well as non-project-related out-of-pocket expenses, are recognized as operational cost as incurred.
Net finance expense
The net finance expense comprises finance income, finance expense and the fair value change of derivatives. Finance income and finance expenses are recognized in the statement of income as it accrues, using the effective interest method.
Income from associates
ARCADIS’ share in earnings from associates is recognized in the statement of income. For investments at cost in which ARCADIS does not have significant influence, only dividends received are included in income.
Income taxes
Income taxes comprise both current and deferred tax. Income tax is recognized in the statement of income except to the extent that it relates to items recognized directly in equity, in which case it is recognized in equity.
Current tax is the expected tax payable on the taxable income for the year, using enacted or substantially enacted tax rates at the reporting date, and any adjustments to tax payable related to previous years.
Earnings per share
Basic earnings per share is calculated by dividing the profit or loss attributable to the equity holders of the Company by the weighted average number of ordinary shares outstanding during the period, excluding the temporarily repurchased shares used to cover option plans. Diluted earnings per share is calculated using the weighted average number of shares and options outstanding during the period, as far as the exercise price of these options is lower than the share price.
Segment reporting
ARCADIS adopted early IFRS 8, “Operating Segments”, that introduces the management approach to segment reporting. The operating segment reporting follows the internal reporting used by the chief decision- maker to manage the business, assess the performance and allocate resources. The Company is operated on a geographic basis and considers those geographical areas with economic and operating similarities to be separate primary operating segments. The Company mainly operates in a local-to-local market; therefore, risks and rates of returns are reflected predominately by the geographical market. Management reporting systems, legal structures and consolidation are largely based on geographic segments. The differentiation in the type of services provided by the various
95
Financial Statements 2007
Notes to the consolidated financial statements
group companies is limited. These services extend in general to consulting, engineering and project management services.
Determination of fair values and management judgments
Property, Plant & Equipment
Measurement of property, plant & equipment involves the use of estimates for determining the fair value of property, plant & equipment acquired in a business combination. The fair value of property, plant & equipment recognized as a result of a business combination is based on market values. The market value of property is the estimated amount for which a property could be exchanged on the date of valuation between willing parties in an arm’s length transaction. The market value of items of plant, equipment, fixtures and furnitures is based on the quoted market prices for similar items.
Intangible assets
Measurement of intangible assets acquired in a business combination involves the use of estimates for determining the fair value at acquisition date. This mainly relates to the expected profits in the backlog of the acquired companies at the moment of acquisition. The fair value is based on discounted cash flows expected to be received from these identifiable intangible assets.
Impairments of property, plant & equipment and intangible assets
The determination of impairments of property, plant and equipment and intangible assets involves the use of estimates. The recoverable amount and the fair values are determined by discounting the estimated future cash flows to present value using a discount rate that reflects the current market assessments of the time value of money and the risks specific to the asset. The identification of impairment indicators, as well as the estimation of future cash flows and the determination of the fair value for the assets, requires management to make significant judgments, specifically for the estimation of cash flows.
(Un)billed receivables
The fair value of (un)billed receivables is estimated as the present value of future cash flows, discounted at the applicable market rate of interest at the reporting date.
Derivatives
The fair value of interest rate swaps is based on broker quotes. Those quotes are tested for reasonableness by discounting estimated future cash flows based on the term and maturity of the contract, using market interest rates.
Non-derivative financial liabilities
Fair value, which is determined for disclosure purposes, is calculated based on the present value of future cash flows, discounted at the market rate of interest at the reporting date.
Share-based payment transactions
The fair value of share-based payment transactions is measured using a binomial model. Measurement inputs include the share price on the measurement date, exercise price of the instrument, the expected volatility, weighted average expected life of the instrument and the risk-free interest rate.
96
Financial Statements 2007
Notes to the consolidated financial statements
New standards and interpretations not yet adopted
A number of new standards, amendments to standards and interpretations are not yet effective for the year ended December 31, 2007, and have not been applied in preparing these consolidated financial statements. The Company assessed that the following standard might be applicable and could have an impact on the consolidated financial statements:
IFRIC 11 IFRS 2 – Group and Treasury Share Transactions requires a share-based payment arrangement in which an entity receives goods or services as consideration for its own equity instruments to be accounted for as an equity-settled, share-based payment transaction, regardless of how the equity instruments are obtained. IFRIC 11 becomes effective for the 2008 financial statements, with retrospective application required. It is not expected to have a material impact on the consolidated financial statements.
4 Segment information
Presented below is the segment information based on the reporting structure. The segments are based on the operational companies. Inter-segment pricing is determined on an arm’s length basis.
|
| The Netherlands |
| Europe excluding |
| United States |
| Rest of World |
| Others and Eliminations |
| Consolidated |
| ||||||||||||
|
| 2007 |
| 2006 |
| 2007 |
| 2006 |
| 2007 |
| 2006 |
| 2007 |
| 2006 |
| 2007 |
| 2006 |
| 2007 |
| 2006 |
|
Gross revenue |
| 373.6 |
| 323.3 |
| 331.0 |
| 277.9 |
| 669.5 |
| 518.4 |
| 136.1 |
| 113.4 |
|
|
|
|
| 1,510.2 |
| 1,233.0 |
|
Revenue between regions |
| 2.2 |
| 2.7 |
| 5.2 |
| 4.3 |
| 0.7 |
| 0.3 |
| 0.1 |
| 0.3 |
| (8.2 | ) | (7.6 | ) | — |
| — |
|
Total revenue regions |
| 375.8 |
| 326.0 |
| 336.2 |
| 282.2 |
| 670.2 |
| 518.7 |
| 136.2 |
| 113.7 |
| (8.2 | ) | (7.6 | ) | 1,510.2 |
| 1,233.0 |
|
Materials, services of third parties and subcontractors |
| 120.3 |
| 103.1 |
| 69.2 |
| 55.4 |
| 252.4 |
| 186.8 |
| 72.0 |
| 57.9 |
| (8.2 | ) | (7.6 | ) | 505.7 |
| 395.6 |
|
Net revenue |
| 255.5 |
| 222.9 |
| 267.0 |
| 226.8 |
| 417.8 |
| 331.9 |
| 64.2 |
| 55.8 |
|
|
|
|
| 1,004.5 |
| 837.4 |
|
Operating costs |
| 223.9 |
| 199.9 |
| 238.4 |
| 203.1 |
| 364.5 |
| 290.7 |
| 50.1 |
| 47.2 |
|
|
|
|
| 876.9 |
| 740.9 |
|
Depreciation |
| 5.4 |
| 5.6 |
| 5.2 |
| 4.9 |
| 8.8 |
| 6.4 |
| 1.0 |
| 0.8 |
|
|
|
|
| 20.4 |
| 17.7 |
|
EBITA |
| 26.2 |
| 17.4 |
| 23.4 |
| 18.8 |
| 44.5 |
| 34.8 |
| 13.1 |
| 7.8 |
|
|
|
|
| 107.2 |
| 78.8 |
|
Amortization identifiable intangible assets |
| 1.0 |
| 2.6 |
| 4.0 |
| 1.5 |
| 6.2 |
| 3.7 |
| 1.0 |
| 0.5 |
|
|
|
|
| 12.2 |
| 8.3 |
|
Operating income |
| 25.2 |
| 14.8 |
| 19.4 |
| 17.3 |
| 38.3 |
| 31.1 |
| 12.1 |
| 7.3 |
|
|
|
|
| 95.0 |
| 70.5 |
|
Net finance expense |
| 0.5 |
| (0.9 | ) | (1.7 | ) | (0.7 | ) | (5.6 | ) | (0.5 | ) | (1.8 | ) | (1.4 | ) |
|
|
|
| (8.6 | ) | (3.5 | ) |
Income from associates |
| — |
| 0.2 |
| 0.5 |
| — |
| — |
| — |
| (1.3 | ) | (0.7 | ) |
|
|
|
| (0.8 | ) | (0.5 | ) |
Taxes |
| (3.0 | ) | (2.7 | ) | (7.1 | ) | (6.0 | ) | (13.7 | ) | (9.6 | ) | (4.3 | ) | (1.8 | ) |
|
|
|
| (28.1 | ) | (20.1 | ) |
Profit for the period |
| 22.7 |
| 11.4 |
| 11.1 |
| 10.6 |
| 19.0 |
| 21.0 |
| 4.7 |
| 3.4 |
|
|
|
|
| 57.5 |
| 46.4 |
|
Minority interest |
| — |
| 0.3 |
| (0.2 | ) | (0.1 | ) | — |
| — |
| (2.4 | ) | (1.7 | ) |
|
|
|
| (2.6 | ) | (1.5 | ) |
Net income |
| 22.7 |
| 11.7 |
| 10.9 |
| 10.5 |
| 19.0 |
| 21.0 |
| 2.3 |
| 1.7 |
|
|
|
|
| 54.9 |
| 44.9 |
|
EBTA on recurring basis |
| 26.2 |
| 17.4 |
| 22.1 |
| 18.8 |
| 44.5 |
| 34.8 |
| 13.1 |
| 7.8 |
|
|
|
|
| 105.9 |
| 78.8 |
|
Net income from operations |
| 23.3 |
| 14.0 |
| 12.8 |
| 11.7 |
| 23.1 |
| 22.2 |
| 3.1 |
| 2.1 |
|
|
|
|
| 62.3 |
| 50.0 |
|
|
|
|
|
|
|
|
|
|
|
|
|
|
|
|
|
|
|
|
|
|
|
|
|
|
|
Total assets |
| 501.4 |
| 433.9 |
| 243.0 |
| 193.9 |
| 424.3 |
| 284.4 |
| 78.9 |
| 60.5 |
| (325.9 | ) | (236.2 | ) | 921.7 |
| 736.5 |
|
Investments in associates |
| 0.1 |
| 0.1 |
| 0.6 |
| — |
| 0.1 |
| 0.1 |
| 17.1 |
| 5.0 |
|
|
|
|
| 17.9 |
| 5.2 |
|
Other financial assets |
| 2.1 |
| 1.8 |
| 1.9 |
| 1.3 |
| 1.1 |
| 0.9 |
| 22.4 |
| 13.2 |
|
|
|
|
| 27.5 |
| 17.2 |
|
Total liabilites |
| 305.7 |
| 247.7 |
| 176.8 |
| 132.3 |
| 383.0 |
| 233.1 |
| 54.4 |
| 36.5 |
| (197.4 | ) | (113.8 | ) | 722.5 |
| 535.8 |
|
Total investments |
| 7.4 |
| 7.8 |
| 6.7 |
| 3.9 |
| 11.0 |
| 6.5 |
| 8.2 |
| 1.1 |
|
|
|
|
| 33.3 |
| 19.3 |
|
Total number of employees |
| 2,822 |
| 2,587 |
| 3,393 |
| 3,044 |
| 4,703 |
| 3,557 |
| 1,387 |
| 1,230 |
| |
|
|
| 12,305 |
| 10,418 |
|
Amounts in millions of euros unless otherwise stated
97
Financial Statements 2007
Notes to the consolidated financial statements
Geographical information only differs from the segment information above because of the activities of RTKL, which geographically is also represented in Europe and Rest of the World. The geographical information is as follows:
|
| Net revenue by origin |
| Non-current assets |
| ||||
|
| 2007 |
| 2006 |
| 2007 |
| 2006 |
|
The Netherlands |
| 255.3 |
| 224.6 |
| 52.0 |
| 43.8 |
|
Europe excluding the Netherlands |
| 277.2 |
| 238.1 |
| 90.4 |
| 64.2 |
|
United States |
| 408.3 |
| 331.0 |
| 148.0 |
| 102.3 |
|
Rest of world |
| 63.7 |
| 43.8 |
| 42.5 |
| 24.4 |
|
Total |
| 1,004.5 |
| 837.5 |
| 332.9 |
| 234.7 |
|
5 Group companies
In accordance with articles 379, 392 and 414, Book 2 of the Dutch Civil Code, the list of subsidiaries and associates is filed with the Chamber of Commerce in Arnhem.
Consolidated interests
The main consolidated companies are listed below, stating the country in which they are domiciled, if outside the Netherlands, and the percentage of ownership (these percentages have not changed in 2007).
ARCADIS Nederland BV, (100%) Arnhem
ARCADIS Aqumen Facility Management BV, (50%) Arnhem
PRC Holding BV, (100%) Bodegraven
ARCADIS U.S. Inc., (100%) Denver, Colorado, United States
RTKL Associates Inc., (100%) Baltimore, Maryland, United States
ARCADIS Belgium Holding NV, (100%) Deurne, Belgium
ARCADIS Deutschland GmbH, (100%) Darmstadt, Germany
ARCADIS FC International S.A.S., (100%) Paris, France
AYH Plc, (100%) London, United Kingdom
ARCADIS Geragthy & Miller International Ltd., (100%) Newmarket, United Kingdom
ARCADIS Profil Sp. z o.o., (100%), Warsaw, Poland
ARCADIS Geotecnica Consultores SA, (100%) Santiago, Chile
ARCADIS Logos Engenharia S.A., (50% + 1 share) São Paulo, Brazil
6 Changes in consolidated interests
During 2007, the following companies were divested:
January 1, 2007, Labor für Geotechnik und Umwelt GmbH, Darmstadt, Germany
January 1, 2007, ARCADIS Grabowski Grabowska, Lodz, Poland
March 31, 2007, ARCADIS Euroconsult B.V., Arnhem
July 6, 2007, Sobesol, Paris, France
During 2007, the following companies were acquired:
January 1, 2007, Bofabu Holding BV, Zwolle
January 1, 2007, HL-Service Management GmbH, Siegen, Germany
April 1, 2007, Aeolus bvba, Diest, Belgium
June 29, 2007, Alkyon Holding BV, Marknesse
July 6, 2007, RTKL Associates Inc., Baltimore, Maryland, United States
August 10, 2007, APS Project Management Ltd, Bristol, United Kingdom
November 14, 2007, Vectra Group Ltd., Warrington, United Kingdom
November 15, 2007, Idesol Ingenieros S.A., Santiago, Chile
Amounts in millions of euros unless otherwise stated
98
Financial Statements 2007
Notes to the consolidated financial statements
These acquisitions contributed € 79.4 million to annual net revenue in 2007. The contribution to the consolidated profit for the period amounted to € 2.7 million, which is excluding financing expenses related to these acquisitions and after net amortization of identifiable intangible assets of € 4.1 million. If the acquisitions had occurred on January 1, 2007, the addition to ARCADIS’ consolidated net revenue would have been € 158.5 million and the addition to ARCADIS’ profit for the period would have been € 7.2 million, excluding financing expenses related to these acquisitions and after amortization of identifiable intangible assets.
The total investment in acquisitions in 2007 was € 107.0 million, including goodwill of € 85.0 million. This goodwill was assigned to our geographic segments as follows:
Goodwill per geographic segment |
|
|
|
The Netherlands |
| 6.0 |
|
Europe excluding the Netherlands |
| 24.3 |
|
United States |
| 53.7 |
|
Rest of world |
| 1.0 |
|
Total goodwill paid |
| 85.0 |
|
Of the € 107.0 million invested in acquisitions in 2007, up to € 18.2 million will be paid after 2007 and is consequently recorded as a liability.
No equity instruments were issued with respect to the financing of the 2007 acquisitions.
For certain acquisitions, the purchase accounting is included on a provisional basis at the reporting date due to the fact that underlying details for the determination of fair value of the assets and liabilities at the acquisition date were not completely available before the issue of this annual report.
Amounts in millions of euros unless otherwise stated
99
Financial Statements 2007
Notes to the consolidated financial statements
The acquisitions and disposal of interests had the following effect on assets and liabilities.
|
| Acquisitions |
| Divestments |
| Total |
|
Assets |
|
|
|
|
|
|
|
Non-current assets |
|
|
|
|
|
|
|
Intangible assets |
| 16,341 |
| (28 | ) | 16,313 |
|
Property, plant & equipment |
| 11,776 |
| (689 | ) | 11,087 |
|
Investments in associates |
| 43 |
| 100 |
| 143 |
|
Other investments |
| — |
| (3 | ) | (3 | ) |
Other non-current assets |
| 481 |
| (48 | ) | 433 |
|
Deferred tax assets |
| 5,917 |
| (122 | ) | 5,795 |
|
Total non-current assets |
| 34,558 |
| (790 | ) | 33,768 |
|
Current assets |
|
|
|
|
|
|
|
(Un)billed receivables |
| 70,582 |
| (15,950 | ) | (54,632 | ) |
Other current assets |
| 3,956 |
| (791 | ) | (3,165 | ) |
Corporate tax asset |
| 660 |
| (4 | ) | 656 |
|
Cash and cash equivalents |
| 5,000 |
| (5,832 | ) | (832 | ) |
Total current assets |
| 80,198 |
| (22,577 | ) | 57,621 |
|
Total assets |
| 114,756 |
| (23,367 | ) | 91,389 |
|
|
|
|
|
|
|
|
|
Equity and liabilities |
|
|
|
|
|
|
|
Minority interest |
| (1,368 | ) | (20 | ) | (1,388 | ) |
Non-current liabilities |
|
|
|
|
|
|
|
Provisions |
| 11,943 |
| (440 | ) | 11,503 |
|
Deferred tax liabilities |
| 6,940 |
| (1 | ) | 6,939 |
|
Loans and borrowings |
| 1,251 |
| (275 | ) | 976 |
|
Total non-current liabilities |
| 20,134 |
| (716 | ) | 19,418 |
|
Current liabilities |
|
|
|
|
|
|
|
Billing in excess of cost |
| 30,997 |
| (13,702 | ) | 17,295 |
|
Corporate tax liabilities |
| 4,360 |
| — |
| 4,360 |
|
Trade and other liabilities |
| 38,643 |
| (5,505 | ) | 33,138 |
|
Total current liabilities |
| 74,000 |
| (19,207 | ) | 54,793 |
|
Total equity and liabilities |
| 92,766 |
| (19,943 | ) | 72,823 |
|
Total net value |
| 21,990 |
| (3,424) |
| 18,566 |
|
Recorded goodwill |
| 85,027 |
| — |
| 85,027 |
|
Consideration paid/(received) |
| 107,017 |
| (3,424 | ) | 103,593 |
|
After-payments unpaid |
| (18,182 | ) | — |
| (18,182 | ) |
After-payment paid related to 2006 acquisition |
| 1,455 |
| — |
| 1,455 |
|
Cash (acquired)/disposed |
| (5,000 | ) | 5,832 |
| 832 |
|
Net cash outflow/(inflow) |
| 85,290 |
| 2,408 |
| 87,698 |
|
Amounts in thousands of euros unless otherwise stated
100
Financial Statements 2007
Notes to the consolidated financial statements
7 Intangible assets
|
| Goodwill |
| Other |
| Software |
| Total |
|
Cost |
|
|
|
|
|
|
|
|
|
Balance at January 1, 2006 |
| 115,983 |
| 14,679 |
| 20,133 |
| 150,795 |
|
Acquisitions through business combinations |
| 29,858 |
| 10,793 |
| 81 |
| 40,732 |
|
Investments |
| — |
| — |
| 2,928 |
| 2,928 |
|
Divestments |
| (59 | ) | — |
| (1,655 | ) | (1,714 | ) |
Exchange rate differences |
| (6,535 | ) | (764 | ) | (711 | ) | (8,010 | ) |
Other changes |
| 186 |
| — |
| 2,210 |
| 2,396 |
|
Balance at December 31, 2006 |
| 139,433 |
| 24,708 |
| 22,986 |
| 187,127 |
|
|
|
|
|
|
|
|
|
|
|
Balance at January 1, 2007 |
| 139,433 |
| 24,708 |
| 22,986 |
| 187,127 |
|
Acquisitions through business combinations |
| 85,027 |
| 14,807 |
| 1,534 |
| 101,368 |
|
Investments |
| — |
| — |
| 3,639 |
| 3,639 |
|
Divestments |
| — |
| — |
| (28 | ) | (28 | ) |
Disposals |
| — |
| — |
| (3,078 | ) | (3,078 | ) |
Exchange rate differences |
| (14,970 | ) | (2,441 | ) | (792 | ) | (18,203 | ) |
Other changes |
| 133 |
| (1,519 | ) | 115 |
| (1,271 | ) |
Balance at December 31, 2007 |
| 209,623 |
| 35,555 |
| 24,376 |
| 269,554 |
|
Amortization and depreciation |
|
|
|
|
|
|
|
|
|
Balance at January 1, 2006 |
| — |
| 6,416 |
| 16,518 |
| 22,934 |
|
Amortization and depreciation charge for the year |
| — |
| 8,270 |
| 2,302 |
| 10,572 |
|
Divestments |
| — |
| — |
| (1,586 | ) | (1,586 | ) |
Exchange rate differences |
| — |
| (390 | ) | (580 | ) | (970 | ) |
Other changes |
| — |
| 15 |
| 1,992 |
| 2,007 |
|
Balance at December 31, 2006 |
| — |
| 14,311 |
| 18,646 |
| 32,957 |
|
|
|
|
|
|
|
|
|
|
|
Balance at January 1, 2007 |
| — |
| 14,311 |
| 18,646 |
| 32,957 |
|
Amortization charge for the year |
| — |
| 12,224 |
| 3,213 |
| 15,437 |
|
Disposals |
| — |
| — |
| (2,986 | ) | (2,986 | ) |
Exchange rate differences |
| — |
| (1,561 | ) | (599 | ) | (2,160 | ) |
Other changes |
| — |
| (1,207 | ) | 26 |
| (1,181 | ) |
Balance at December 31, 2007 |
| — |
| 23,767 |
| 18,300 |
| 42,067 |
|
Carrying amounts |
|
|
|
|
|
|
|
|
|
At January 1, 2006 |
| 115,983 |
| 8,263 |
| 3,615 |
| 127,861 |
|
At December 31, 2006 |
| 139,433 |
| 10,397 |
| 4,340 |
| 154,170 |
|
|
|
|
|
|
|
|
|
|
|
At January 1, 2007 |
| 139,433 |
| 10,397 |
| 4,340 |
| 154,170 |
|
At December 31, 2007 |
| 209,623 |
| 11,788 |
| 6,076 |
| 227,487 |
|
During 2007 and 2006, no changes were made in the useful lives, amortization methods and the residual values of the intangible assets.
Amounts in thousands of euros unless otherwise stated
101
Financial Statements 2007 |
Notes to the consolidated financial statements |
The total goodwill capitalized was assigned to our geographic segments as follows:
|
| 2007 |
| 2006 |
|
The Netherlands |
| 22,513 |
| 17,118 |
|
Europe excluding the Netherlands |
| 66,291 |
| 45,218 |
|
United States |
| 113,902 |
| 71,841 |
|
Rest of world |
| 6,917 |
| 5,256 |
|
Total goodwill |
| 209,623 |
| 139,433 |
|
The amortization and depreciation charge is recognized in the following line items in the statement of income:
|
| 2007 |
| 2006 |
|
Amortization identifiable intangible assets |
| 12,224 |
| 8,270 |
|
Depreciation |
| 3,213 |
| 2,302 |
|
Impairment testing for cash-generating units containing goodwill
An impairment test for goodwill is performed at the balance sheet date, or whenever there is an indication for impairment. For all other intangible assets, an impairment test is performed whenever an indicator for impairment exists.
The impairment test compares the carrying value of the cash-generating units with the recoverable amounts. The cash-generating unit is the lowest level within ARCADIS at which goodwill is monitored for internal management purposes. The recoverable value is determined based on a calculation of the value in use and compared to recent multiples of comparable activities on the stock exchange. Those calculations use cash flow projections based on actual operating results and the three-year strategic plan as approved by the Executive Board. Projections are extrapolated beyond this three-year period using an appropriate perpetual growth rate that is consistent with the long-term average market growth rate and that typically does not exceed 3% (2006: 3%) in our calculations. The estimated post-tax cash flows are discounted to their present value using a post-tax weighted average cost of capital (WACC). The post-tax WACC used is 8% (2006: 8%), and where applicable, a surcharge is added for specific country risks.
The key assumptions used in the predictions are:
· Revenue growth: based on actual experience and market analysis;
· Margin development: based on actual experience and management’s long-term projections.
The impairment test for cash-generating units performed in 2007 showed that the recoverable amount for each cash-generating unit exceeds the carrying amount; hence, the test did not result in impairment.
Amounts in thousands of euros unless otherwise stated
102
Financial Statements 2007 |
Notes to the consolidated financial statements |
8 Property, plant & equipment
|
| Land and |
| Furniture |
| Total |
|
Cost |
|
|
|
|
|
|
|
Balance at January 1, 2006 |
| 28,369 |
| 109,204 |
| 137,573 |
|
Acquisitions through business combinations |
| — |
| 1,757 |
| 1,757 |
|
Investments |
| 950 |
| 15,414 |
| 16,364 |
|
Divestments |
| (236 | ) | (13,469 | ) | (13,705 | ) |
Exchange rate differences |
| (1,498 | ) | (5,436 | ) | (6,934 | ) |
Other changes |
| 412 |
| (3,018 | ) | (2,606 | ) |
Balance at December 31, 2006 |
| 27,997 |
| 104,452 |
| 132,449 |
|
|
|
|
|
|
|
|
|
Balance at January 1, 2007 |
| 27,997 |
| 104,452 |
| 132,449 |
|
Acquisitions through business combinations |
| 34 |
| 11,742 |
| 11,776 |
|
Investments |
| 6,504 |
| 23,183 |
| 29,687 |
|
Divestments |
| (123 | ) | (3,285 | ) | (3,408 | ) |
Disposals |
| (14,913 | ) | (13,339 | ) | (28,252 | ) |
Exchange rate differences |
| (281 | ) | (5,847 | ) | (6,128 | ) |
Other changes |
| (5,981 | ) | 6,338 |
| 357 |
|
Balance at December 31, 2007 |
| 13,237 |
| 123,244 |
| 136,481 |
|
Depreciation |
|
|
|
|
|
|
|
Balance at January 1, 2006 |
| 6,074 |
| 75,505 |
| 81,579 |
|
Depreciation charge for the year |
| 1,498 |
| 13,933 |
| 15,431 |
|
Disposals |
| (212 | ) | (12,749 | ) | (12,961 | ) |
Exchange rate differences |
| (367 | ) | (3,913 | ) | (4,280 | ) |
Other changes |
| 758 |
| (3,084 | ) | (2,326 | ) |
Balance at December 31, 2006 |
| 7,751 |
| 69,692 |
| 77,443 |
|
|
|
|
|
|
|
|
|
Balance at January 1, 2007 |
| 7,751 |
| 69,692 |
| 77,443 |
|
Depreciation charge for the year |
| 653 |
| 16,539 |
| 17,192 |
|
Divestments |
| — |
| (2,719 | ) | (2,719 | ) |
Disposals |
| (3,797 | ) | (12,250 | ) | (16,047 | ) |
Exchange rate differences |
| (105 | ) | (3,510 | ) | (3,615 | ) |
Other changes |
| (1,681 | ) | 2,039 |
| 358 |
|
Balance at December 31, 2007 |
| 2,821 |
| 69,791 |
| 72,612 |
|
Carrying amounts |
|
|
|
|
|
|
|
At January 1, 2006 |
| 22,295 |
| 33,699 |
| 55,994 |
|
At December 31, 2006 |
| 20,246 |
| 34,760 |
| 55,006 |
|
|
|
|
|
|
|
|
|
At January 1, 2007 |
| 20,246 |
| 34,760 |
| 55,006 |
|
At December 31, 2007 |
| 10,416 |
| 53,453 |
| 63,869 |
|
During 2007, no changes were made in the useful lives, depreciation methods and the residual values of the property, plant & equipment.
At December 31, 2007, the carrying amount of tangible fixed assets financed by financial lease, was € 1,114 (2006: € 1,665). Both at December 31, 2007 and December 31, 2006, no properties were registered as security for bank loans.
Amounts in thousands of euros unless otherwise stated
103
Financial Statements 2007 |
Notes to the consolidated financial statements |
9 Investments in associates
|
| 2007 |
| 2006 |
|
Balance at January 1 |
| 5,227 |
| 7,451 |
|
Equity share in income |
| (822 | ) | (505 | ) |
Investments |
| 9,788 |
| 156 |
|
Divestments |
| (886 | ) | (819 | ) |
Disposal |
| — |
| (13 | ) |
Received dividends |
| (150 | ) | (1,485 | ) |
Other changes* and exchange rate differences |
| 4,735 |
| 442 |
|
Balance at December 31 |
| 17,892 |
| 5,227 |
|
* see note 10: some investments measured at cost were reclassified to equity-accounted associates due to a change in effective control on the associates.
Summary of financial information on the main equity-accounted associates on a 100% basis, in millions:
Associates |
| % of |
| Assets |
| Liabilities |
| Equity |
| Gross Revenue |
| Net income |
| ||||||||||
| equity |
| 2007 |
| 2006 |
| 2007 |
| 2006 |
| 2007 |
| 2006 |
| 2007 |
| 2006 |
| 2007 |
| 2006 |
| |
Hidropower Energia |
| 16.0 | * | 27.8 |
| — |
| 16.9 |
| — |
| 10.9 |
| — |
| 4.1 |
| — |
| 0.1 |
| — |
|
Retiro Baixo Energetica |
| 25.5 |
| 54.5 |
| — |
| 17.9 |
| — |
| 36.6 |
| — |
| — |
| — |
| — |
| — |
|
Tupan Energia Eletrica |
| 16.0 | * | 35.1 |
| — |
| 28.6 |
| — |
| 6.5 |
| — |
| — |
| — |
| — |
| — |
|
Geodynamique |
| 42.7 |
| 1.7 |
| — |
| 0.6 |
| — |
| 1.1 |
| — |
| 1.7 |
| — |
| 0.3 |
| — |
|
PIE-RP Termelétrica S.A. |
| 25.0 |
| 22.9 |
| 8.6 |
| 18.0 |
| 0.5 |
| 4.9 |
| 8.1 |
| 11.6 |
| — |
| (2.7 | ) | (1.1 | ) |
Breitener Energética S.A. |
| 5.5 | * | 190.6 |
| 126.2 |
| 147.2 |
| 42.5 |
| 43.4 |
| 83.7 |
| 93.1 |
| — |
| (12.2 | ) | (13.5 | ) |
VOF De Ruyterkade |
| 50.0 |
| 0.8 |
| 0.8 |
| 0.8 |
| 0.8 |
| — |
| — |
| 1.6 |
| 1.9 |
| — |
| — |
|
VOF EMC Starc |
| 35.0 |
| 2.2 |
| 3.2 |
| 1.1 |
| 2.8 |
| 1.1 |
| 0.4 |
| — |
| — |
| (0.3 | ) | — |
|
VOF X-pact |
| 12.0 | * | 6.3 |
| 7.7 |
| 1.4 |
| 3.9 |
| 4.9 |
| 3.8 |
| 4.1 |
| 1.6 |
| 1.1 |
| 2.0 |
|
|
|
|
| 341.9 |
| 146.5 |
| 232.5 |
| 50.5 |
| 109.4 |
| 96.0 |
| 116.2 |
| 3.5 |
| (13.7 | ) | (12.6 | ) |
* These companies are measured using the equity method, as ARCADIS has significant influence because the Company is represented on the board of directors and participates in policy making.
10 Other investments
|
| 2007 |
| 2006 |
|
Investments measured at amortized cost |
|
|
|
|
|
Balance at January 1 |
| 4,357 |
| 501 |
|
Investments |
| 28 |
| 3,921 |
|
Acquisitions/Divestments |
| (10 | ) | — |
|
Disposals |
| — |
| (85 | ) |
Other changes* and exchange rate differences |
| (4,305 | ) | 20 |
|
Balance at December 31 |
| 70 |
| 4,357 |
|
|
|
|
|
|
|
Loans to associates and investments at amortized cost |
|
|
|
|
|
Balance at January 1 |
| 1,845 |
| 1,438 |
|
New receivables |
| 717 |
| 525 |
|
Received |
| (100 | ) | (119 | ) |
Other changes and exchange rate differences |
| 11 |
| 1 |
|
Balance at December 31 |
| 2,473 |
| 1,845 |
|
|
|
|
|
|
|
Other investments |
| 2,543 |
| 6,202 |
|
* See note 9: Some investments measured at cost were reclassified to equity-accounted associates due to a change in effective control on the associates.
Amounts in thousands of euros unless otherwise stated
104
Financial Statements 2007 |
Notes to the consolidated financial statements |
11 Other non-current assets
|
| 2007 |
| 2006 |
|
Balance at January 1 |
| 5,810 |
| 10,683 |
|
Acquisitions/Divestments |
| 433 |
| 13 |
|
New receivables |
| 2,222 |
| 2,137 |
|
Received |
| (1,624 | ) | (2,139 | ) |
Offsetting* |
| — |
| (3,765 | ) |
Other changes and exchange rate differences |
| 168 |
| (1,119 | ) |
Balance at December 31 |
| 7,009 |
| 5,810 |
|
* See note 19
Other non-current assets include long-term receivables.
12 Inventories
|
| 2007 |
| 2006 |
|
Goods for resale |
| 14 |
| 8 |
|
Raw materials and supplies |
| 662 |
| 443 |
|
Balance at December 31 |
| 676 |
| 451 |
|
13 Derivatives
The Company has purchased cross-currency interest rate swaps to hedge the currency risk, as well as the interest rate risk, on the $ 200 million long-term loan (2006: $ 120 million). Furthermore, at the end of December, the Company entered into two currency swap contracts to hedge the currency risk on $ 65 million and £ 3.5 million short-term borrowings. These derivatives do not qualify for hedge accounting and are accounted for as trading instruments, with all fair value changes recognized immediately in the statement of income. Accordingly, the swaps are recorded at their fair value, and the unrealized gain or loss on remeasurement is recognized immediately in the statement of income.
The fair value of the derivatives decreased in 2007 from a liability of € 5.8 million to a liability of € 21.2 million. The difference of € 15.4 million is recognized as a loss from fair value changes of derivatives under financing items. The currency translation adjustment of the related U.S.-dollar loan is also recognized under financing items as financial income for a positive effect of € 14.7 million (see note 26).
Amounts in thousands of euros unless otherwise stated
105
Financial Statements 2007 |
Notes to the consolidated financial statements |
14 (Un)billed receivables
Includes items maturing within one year
|
| 2007 |
| 2006 |
|
Unbilled receivables |
| 185,539 |
| 151,238 |
|
Trade receivables |
| 284,673 |
| 228,385 |
|
Provision for bad debts |
| (11,709 | ) | (8,715 | ) |
Receivables from associates |
| 6,341 |
| 2,520 |
|
Total receivables |
| 464,844 |
| 373,428 |
|
The provision for bad debts has developed as follows:
|
| 2007 |
| 2006 |
|
Balance at January 1 |
| 8,715 |
| 11,140 |
|
Acquisitions/divestments |
| 2,160 |
| 317 |
|
Additions charged to income |
| 4,660 |
| 1,346 |
|
Deductions/write-offs |
| (3,223 | ) | (3,738 | ) |
Exchange rate differences |
| (603 | ) | (350 | ) |
Balance at December 31 |
| 11,709 |
| 8,715 |
|
Work in progress
Costs and estimated earnings on uncompleted contracts are as follows:
|
| 2007 |
| 2006 |
|
Cost incurred on uncompleted contracts and estimated earnings |
| 2,805,447 |
| 809,848 |
|
Billings to date |
| (2,762,804 | ) | (770,492 | ) |
Total work in progress |
| 42,643 |
| 39,356 |
|
All amounts are expected to be collected within one year.
|
| 2007 |
| 2006 |
|
Cost incurred and estimated earnings in excess of billings |
| 185,539 |
| 151,238 |
|
Billings in excess of costs incurred and estimated earnings |
| (142,896 | ) | (111,882 | ) |
Balance at December 31 |
| 42,643 |
| 39,356 |
|
Amount of advances received |
| 17,665 |
| 21,149 |
|
Amount of retentions held by clients |
| 335 |
| 933 |
|
15 Other current assets
|
| 2007 |
| 2006 |
|
Other receivables |
| 13,005 |
| 11,635 |
|
Prepaid expenses |
| 14,515 |
| 12,201 |
|
Balance at December 31 |
| 27,520 |
| 23,836 |
|
16 Cash and cash equivalents
The Company’s policy is to invest cash in excess of operating requirements in highly liquid investments. Cash and cash equivalents at December 31,2007 and 2006 consisted of the following:
|
| 2007 |
| 2006 |
|
Deposits |
| 16,223 |
| 3,540 |
|
Cash in banks restricted for taxes /social premiums |
| 178 |
| 167 |
|
Bank and cash |
| 76,207 |
| 97,781 |
|
Balance at December 31 |
| 92,608 |
| 101,488 |
|
The effective interest rates for cash at the balance sheet date were 4.4% (2006: 4.4%). At December 31, 2007, € 91,069 of cash and cash-equivalents were freely available.
Amounts in thousands of euros unless otherwise stated
106
Financial Statements 2007
Notes to the consolidated financial statements
17 Issued share capital
At December 31, 2007, the Company’s authorized share capital amounts to € 5,000,010 divided into 40,000,000 shares of common stock, 50,000,000 shares of cumulative preferred stock, and 10,000,000 shares of cumulative financing preferred stock (divided over four series of 2,500,000 shares each) and 200 priority shares, all with a nominal value of € 0.05 each.
At December 31, 2007, 20,645,615 (2006: 20,645,615) shares of common stock and 200 (2006: 200) priority shares were issued. During 2007, no shares of cumulative preferred or cumulative financing preferred stock were issued or outstanding.
Priority shares
The priority shares have been issued since 1987 and are held by the Stichting Prioriteit ARCADIS NV, a foundation established in Arnhem. The special statutory right under ARCADIS’ Articles of Association to these priority shares is decision making related to:
1 The issuance, acquisition and disposal of shares in the Company;
2 Amendments to the Articles of Association
3 The dissolution of the Company and the filing for bankruptcy;
4 The entry into or termination of long-term cooperative ventures of substantial significance; and
5 Investments (including entering into participations) for an amount equal to at least 25% of the shareholders’ equity.
The board of the Stichting Prioriteit ARCADIS NV is administered by 20 board members: 7 members of ARCADIS’ Supervisory Board, 3 members of ARCADIS’ Executive Board, and 10 members from the board of Bellevue Foundation (a foundation established in Arnhem, whose board members are appointed by and from the international employees of the ARCADIS Group). At the balance sheet date, the board of the Stichting Prioriteit ARCADIS NV is comprised of the following individuals:
· Rijnhard W.F. van Tets, Chairman
· Harrie L.J. Noy, Secretary
· Jürgen C. Boenecke, Deputy Chairman
· Thomas M. Cohn
· Marc A. Elbers
· Carlos Espinosa de los Monteros
· Pascal P.L. Guedon
· C. Michiel Jaski
· Piotr Miaso
· George R. Nethercutt
· Jan Peelen
· Marc F.M. van Put
· Friedrich M.T. Schneider
· Ewoud R. van der Sluis
· Marcel P. Stuart
· Peter E. Yakimowich
· Gerrit Ybema
· Patrick J. Keaney
· Two vacancies
107
Financial Statements 2007
Notes to the consolidated financial statements
The Executive Board of ARCADIS NV and the Board of the Stichting Prioriteit ARCADIS NV are both of the opinion that, regarding the exercising of the voting right on the priority shares by the Stichting Prioriteit ARCADIS NV, there is full compliance with the requirements stipulated in Section 5:71c of the “Wet op het financieel toezicht” and Section 2:118a, paragraph 3 of the Dutch Civil Code.
Cumulative Preferred Shares
The Stichting Preferente Aandelen ARCADIS NV (Preferred Stock Foundation ARCADIS NV), established in Arnhem in 1995, has as its objective the protection and promotion of the interests of ARCADIS NV and its affiliated companies and all parties involved. The Foundation has been granted the right to acquire ARCADIS’ preferred (protection) shares up to a maximum equal to the number of outstanding shares issued at the date in question. ARCADIS NV has been granted the right to issue the same number of preferred shares to the Foundation. Both options may only be exercised provided the interests of ARCADIS NV, its affiliated enterprises, and all parties involved were to warrant this. In the event of an unfriendly hostile takeover attempt, these shares are provided to prevent any major changes in the control of the Company without due consideration of the interests of the Company and all those involved with it. The Board of the Foundation consists of four persons appointed by the Company’s Executive Board.
At the balance sheet date, the Board of the Foundation is comprised of the following individuals:
· Bram A. Anbeek van der Meijden, Chairman
· Fritz F. Fröhlich
· Liesbeth E. M. Kneppers-Heijnert, Secretary
· Gert Jan Kramer, Deputy Chairman
The Executive Board of ARCADIS NV and the Board of the Stichting Preferente Aandelen ARCADIS NV are both of the opinion that, regarding the independence of management, there is full compliance with the requirements stipulated in 5:71c of the “Wet op het financieel toezicht” and Section 2:118a, paragraph 3 of the Dutch Civil Code.
Cumulative Financing Preferred Shares
Since 2002, the Articles of Association incorporate the possibility to issue shares of cumulative financing preferred stock. Currently, no cumulative financing preferred stock has been issued.
Agreements with shareholders
The Articles of Association of the Stichting Lovinklaan stipulate that its board needs prior approval of the Stichting Prioriteit ARCADIS NV for any decisions concerning the disposal or pledge of the Foundation’s shares in ARCADIS NV, or to transfer them as security or otherwise encumber them.
Option and share purchase plans
To stimulate the realization of long-term Company objectives and goals, ARCADIS NV has option and share plans, as well as a share purchase plan. Following is an overview.
ARCADIS NV 1994 and 1996 Incentive Plan
At the time of the merger with Geraghty & Miller in 1993, ARCADIS took over and later in 1994 and 1996 expanded the existing employee option
108
Financial Statements 2007
Notes to the consolidated financial statements
plans. These employee stock option plans were dedicated to employees of the American subsidiaries and ended in 2003 and 2005, respectively, so that since then, no new options can be granted under these plans. The options granted under these plans are valid for a ten-year period and generally become vested after a three-year period. At December 31, 2007, 36,612 (2006: 79,787) options were outstanding. These can be exercised at prices ranging from $ 6.75 to $ 15.00 (2006: $ 6.75 to $ 15.00); the average exercise price is $ 12.15 (2006: $ 11.78). During 2007, 42,325 options were exercised (2006: 207,877) with exercise prices between $ 6.75 and $ 15.00 (2006: $ 6.75 and $ 14.60). During 2007, 850 options were canceled. The closing price of ARCADIS shares on NASDAQ on December 31, 2007, was $ 68.15 (2006: $ 61.16). One option entitles the holder to one share. On December 31, 2007, all outstanding options were exercisable.
ARCADIS NV 2001 Long-Term Incentive Share Option Plan
In the General Meeting of Shareholders in May 2001, the ARCADIS 2001 Long-Term Incentive Share Option Plan was introduced. Under this plan, a maximum of 2,500,000 options were expected to be granted from 2001 to 2006 to key staff members of ARCADIS NV and its subsidiaries. Options under this plan are conditional and can be exercised three years after the issue date, provided the staff member is still employed by the Company. The options are valid for a period of ten years starting on the issue date. On January 1, 2007, the number of outstanding options was 568,572 with exercise prices ranging from € 8.50 to € 21.77. During 2007, 142,830 options were exercised, while 19,640 options were canceled. At December 31, 2007, 406,102 options were outstanding with exercise prices between € 8.50 and € 21.77. The average exercise price is € 14.57. On December 31, 2007, option holders had the opportunity to exercise 183,212 options against prices varying from € 8.50 to € 21.77. The closing price of ARCADIS shares on Euronext on December 31, 2007 was € 47.30. In May 2005, this plan was replaced by the ARCADIS NV Long-Term Incentive Plan.
ARCADIS NV 2005 Long-Term Incentive Plan
In May 2005, the General Meeting of Shareholders agreed to a number of changes in the 2001 plan. These changes are the result of the implementation of the Dutch Corporate Governance Code, as well as the expiration of the ARCADIS 1996 Incentive Plan. Following are the primary changes that were introduced:
· In addition to rights to shares (option rights), other share-related incentives can be granted, such as Stock Appreciation Rights, Restricted Stock (units) and Incentive shares.
· The granting of (rights to) shares can be related to the goals or performance criteria as set by the ARCADIS NV Supervisory Board. This Committee also determines the moment at which the granted (rights to) shares can be exercised.
· The number of (rights to) shares totals 2,500,000; the plan is valid until December 31, 2011.
In its December 2005 meeting, the Supervisory Board approved the revised text of the 2001 plan, now titled the ARCADIS NV 2005 Long-Term Incentive Plan.
On May 18, 2007, 279,700 options were granted under this plan and accepted by 154 employees worldwide with an exercise price of € 59.68. To the members of the Executive Board on the same date, a total of 65,000 conditional options were granted, and to the members of the Senior Management Committee, 41,150 conditional options were granted, all
109
Financial Statements 2007
Notes to the consolidated financial statements
with an exercise price of € 59.68. In addition on May 18, 2007, under the 2005 Plan, the members of the Executive Board were granted 27,000 conditional shares, in line with the remuneration policy for the Executive Board as agreed to by the General Meeting of Shareholders in May 2005, and 20,050 conditional options were granted for the members of the Senior Management Committee.
Several times during 2007, a total of 97,899 options with exercise prices ranging from € 47.05 to € 64.47 were granted to the Corporate Director of Mergers & Acquisitions. In January 2007, 20,000 options were granted to the management and key staff of Pinnacle One, related to the acquisition of this company. The exercise price is € 46.81. In July 2007, 198,500 options were granted to the management and key staff of RTKL, related to the acquisition of this company. On December 31, 2007, a total number of 1,262,896 options were outstanding under the 2005 plan. The average exercise price is € 39.50. Of the options granted under the 2005 plan, 24,916 options were exercisable at December 31.
Overview of incentive shares granted
|
|
|
|
|
| Total amount to be |
|
|
|
|
|
|
|
|
| expensed over the |
|
|
|
Provisional (rights to) shares granted on |
| Granted |
| Unconditional in |
| vesting period, in € |
| Canceled |
|
May 11, 2005 |
| 17,000 |
| 2008 |
| 191,000 |
| — |
|
May 19, 2006 |
| 47,400 |
| 2009 |
| 1,105,000 |
| 2,233 |
|
October 1, 2006 |
| 1,000 |
| 2009 |
| 22,000 |
| — |
|
May 18, 2007 |
| 47,050 |
| 2010 |
| 1,763,000 |
| — |
|
A summary of the combined activities under ARCADIS Stock Option Plans for each year in the two-year period ended December 31, 2007 is as follows:
|
| Number of |
| Exercise price |
| Number of |
| Exercise price |
|
|
| options |
| range in $ |
| options |
| range in € |
|
Balance at January 1, 2006 |
| 310,724 |
| 6.75 to 23.01 |
| 1,126,299 |
| 8.50 to 21.77 |
|
Granted |
| — |
| — |
| 389,749 |
| 34.59 to 38.20 |
|
Exercised |
| (215,564 | ) | 6.75 to 23.01 |
| (314,326 | ) | 8.50 to 21.77 |
|
Forfeited |
| — |
| — |
| (26,490 | ) | 8.50 to 37.13 |
|
Balance at December 31, 2006 |
| 95,160 |
| 6.75 to 23.01 |
| 1,175,232 |
| 8.50 to 38.20 |
|
Granted |
| — |
| — |
| 702,249 |
| 46.81 to 64.47 |
|
Exercised |
| (42,325 | ) | 6.75 to 15.00 |
| (169,872 | ) | 8.50 to 21.14 |
|
Forfeited |
| (850 | ) | 15.00 |
| (53,984 | ) | 17.94 to 46.81 |
|
Balance at December 31, 2007 |
| 51,985 |
| 6.75 to 23.01 |
| 1,653,625 |
| 8.50 to 64.47 |
|
At December 31, 2007 and 2006, options to purchase 244,740 and 388,647 shares, respectively, were exercisable. No granted options expired in 2007.
110
Financial Statements 2007
Notes to the consolidated financial statements
Total options outstanding and exercisable at December 31, 2007 were as follows:
|
| Options Outstanding |
| Options Exercisable |
| ||||||||
|
|
|
|
|
| Weighted average |
|
|
| Weighted average |
| ||
|
|
|
| Weighted |
| exercise price |
|
|
| exercise price |
| ||
Option price per share |
| Number |
| average life |
| per share |
| Number |
| per share |
| ||
$ 6.75-8.50 |
| 5,100 |
| 3.3 |
| $ | 7.83 |
| 5,100 |
| $ | 7.83 |
|
$ 8.51-10.00 |
| 7,062 |
| 4.4 |
| $ | 9.44 |
| 7,062 |
| $ | 9.44 |
|
$ 10.01-11.50 |
| 8,100 |
| 5.4 |
| $ | 11.50 |
| 8,100 |
| $ | 11.50 |
|
$ 11.51-15.00 |
| 16,350 |
| 6.8 |
| $ | 15.00 |
| 16,350 |
| $ | 15.00 |
|
$ 15.01-20.00 |
| — |
| — |
| — |
| — |
| — |
| ||
$ 20.01-24.00 |
| 15,373 |
| 7.5 |
| $ | 23.01 |
| 7,687 |
| $ | 23.01 |
|
Total |
| 51,985 |
|
|
| Average $15.36 |
| 44,299 |
| Average $14.04 |
| ||
|
|
|
|
|
|
|
|
|
|
|
| ||
€ 8.50-11.00 |
| 172,085 |
| 5.2 |
| € | 9.11 |
| 172,085 |
| € | 9.11 |
|
€ 11.01-22.00 |
| 423,866 |
| 7.5 |
| € | 19.35 |
| 17,440 |
| € | 21.16 |
|
€ 34.00-39.00 |
| 363,425 |
| 8.5 |
| € | 37.10 |
| 10,916 |
| € | 37.14 |
|
€ 46.00-65.00 |
| 694,249 |
| 9.4 |
| € | 60.97 |
| — |
| — |
| |
Total |
| 1,653,625 |
|
|
| Average € 39.66 |
| 200,441 |
| Average € 11.68 |
| ||
Issuance of shares
The General Meeting of Shareholders decides, under the approval of the Stichting Prioriteit ARCADIS NV, about the issuance of shares. The meeting can also appoint the Supervisory Board to issue shares, and as long as this appointment stands, the meeting cannot decide to issue. Issuance of shares to someone who has an earlier right to take shares can be decided by the Executive Board and does not fall under the stipulations outlined above.
Purchase of shares
The Executive Board can, as mandated by the General Meeting of Shareholders and with approval from the Supervisory Board and the Stichting Prioriteit ARCADIS NV, purchase issued and paid-in shares in ARCADIS NV. The mandate is not needed in case the shares are purchased to be issued to employees in line with existing employee, share or option plans.
Regarding the ARCADIS Incentive plans, the intention is to minimize dilution by purchasing (a portion of) the shares needed for these plans. In 2007, no shares were issued as a result of options being exercised (2006: zero). The following numbers of shares were purchased.
Year |
| Number of shares |
| Price at time of purchase |
|
2002 |
| 300,000 |
| € 10.75 |
|
2003 |
| 112,972 |
| € 7.74 to € 8.65 |
|
2004 |
| 500 |
| € 8.65 |
|
2004 |
| 11,400 |
| $ 18.40 to $ 18.65 |
|
2005 |
| 217,013 |
| € 18.25 to € 27.24 |
|
2005 |
| 115,033 |
| $ 17.00 to $ 30.94 |
|
2006 |
| 454,838 |
|
| |
2006 |
| 40,000 |
| $ 44.10 to $ 47.69 |
|
2007 |
| 350,000 |
| € 48.08 to € 61.71 |
|
The repurchased shares are to cover the options granted. This temporary repurchase has been deducted from the Retained Earnings.
Of the shares purchased throughout 2007, a total number of 212,197 have
111
Financial Statements 2007
Notes to the consolidated financial statements
been placed back in the market through the exercise of options. The net proceeds were € 2,215.
At December 31, 2007, the number of repurchased shares that was in possession was 478,430.
Outstanding shares of common stock:
|
|
|
|
|
| Repurchase |
| Reissuing |
|
|
|
|
| January 1 |
| Issuing shares |
| shares |
| shares |
| December 31 |
|
2004 |
| 20,017,405 |
| 215,238 |
| 11,900 |
| 78,000 |
| 20,298,743 |
|
2005 |
| 20,298,743 |
| — |
| 332,046 |
| 303,239 |
| 20,269,936 |
|
2006 |
| 20,269,936 |
| — |
| 494,838 |
| 529,890 |
| 20,304,988 |
|
2007 |
| 20,304,988 |
| — |
| 350,000 |
| 212,197 |
| 20,167,185 |
|
Additional paid-in capital
Additional paid-in capital represents the premium paid in excess of the par value of shares at the time of the issuance of new shares or the exercise of stock options. If ARCADIS declared a distribution to shareholders of additional paid-in capital, at least € 17.6 million of the additional paid-in capital would not be taxable under the 1964 Dutch income tax legislation.
Cumulative translation reserves
Cumulative translation reserves (a statutory reserve) comprise all foreign exchange differences arising as of 2004 from the translation of the net assets of foreign operations outside the eurozone.
Retained earnings
The Executive Board is authorized to propose to the Annual General Meeting of Shareholders, with the approval of the Supervisory Board, which part of the profit shall be paid as dividend. That which remains shall be added to the equity of the Company. The holder of the priority shares is entitled to a dividend of 5% of the par value of the priority shares. For the fiscal year 2007, the Executive Board with the approval of the Supervisory Board proposes to add the amount of € 30.0 million to the retained earnings. The remainder of € 24.82 million can be distributed as a dividend, which represents a dividend of € 1.23 per outstanding share of common stock. For the fiscal year 2006, a dividend was proposed and accepted amounting to € 1.00 per outstanding share of common stock. There are no restrictions on the distribution of retained earnings.
112
Financial Statements 2007
Notes to the consolidated financial statements
18 Earnings per share
For calculating the earnings per share, the following numbers of shares were used:
|
|
|
|
|
| Diluted number of shares |
|
Year |
| Priority shares |
| Shares of common stock |
| of common stock |
|
2007 |
| 200 |
| 20,329,878 |
| 20,995,864 |
|
2006 |
| 200 |
| 20,234,095 |
| 21,073,937 |
|
The diluted number of shares is calculated by using the monthly number of options outstanding and the monthly average stock price on the Euronext Amsterdam Stock Market and the U.S. Nasdaq Market. Only options with exercise prices below the average stock price are taken into account. In June 2007, the Company delisted from the U.S. Nasdaq Market.
The weighted average number of ordinary shares used for the calculation of earnings per share for the years 2007 and 2006 is calculated as follows:
|
| 2007 |
| 2006 |
|
Average number of issued shares |
| 20,645,815 |
| 20,645,815 |
|
Average number of repurchased shares |
| 315,737 |
| 411,520 |
|
Average number of outstanding shares |
| 20,330,078 |
| 20,234,295 |
|
Of which priority shares |
| 200 |
| 200 |
|
Shares of common stock |
| 20,329,878 |
| 20,234,095 |
|
For the calculation of earnings per share, no distinction is made between the different classes of shares.
Total earnings of ARCADIS:
|
| 2007 |
| 2006 |
|
Net income from operations |
| 62,293 |
| 50,035 |
|
Net income |
| 54,852 |
| 44,936 |
|
Earnings per share (in euros): |
|
|
|
|
|
Net income from operations |
| 3.06 |
| 2.47 |
|
Net income |
| 2.70 |
| 2.22 |
|
As mentioned on page 113 of this annual report, at December 31, 2007, the number of outstanding options is 1,705,610 (2006: 1,270,392). Of the outstanding options at December 31, 2007, 1,003,361 options were in the money, although not all options were exercisable. Exercising options may lead to dilution. This dilution is calculated on a monthly average basis. To avoid dilution as much as possible, ARCADIS repurchases its own shares that are reissued at the time of option exercises.
|
| 2007 |
| 2006 |
|
Average number of outstanding shares |
| 20,330,078 |
| 20,234,295 |
|
Average number of diluting shares |
| 665,986 |
| 839,842 |
|
Average number of diluted shares |
| 20,996,064 |
| 21,074,137 |
|
Earnings per diluted share (in euros): |
|
|
|
|
|
Net income from operations |
| 2.97 |
| 2.37 |
|
Net income |
| 2.61 |
| 2.13 |
|
113
Financial Statements 2007
Notes to the consolidated financial statements
19 Provisions
|
| Pension |
| Deferred |
| Restructuring |
| Litigation |
| Others |
| Total |
|
Balance at January 1, 2006 |
| 7,584 |
| 1,262 |
| 2,760 |
| 3,699 |
| 513 |
| 15,818 |
|
Acquisitions |
| — |
| — |
| — |
| — |
| 32 |
| 32 |
|
Additions |
| 1,377 |
| 17 |
| 669 |
| 1,259 |
| 344 |
| 3,666 |
|
Amounts used |
| (1,265 | ) | (27 | ) | (1,691 | ) | (1,955 | ) | (203 | ) | (5,141 | ) |
Release of unused amounts |
| — |
| — |
| (25 | ) | — |
| (35 | ) | (60 | ) |
Offsetting |
| (3,765 | ) | — |
| — |
| — |
| — |
| (3,765 | ) |
Other changes |
| — |
| — |
| — |
| 9,706 |
| 169 |
| 9,875 |
|
Exchange rate differences |
| (418 | ) | — |
| (45 | ) | (10 | ) | (9 | ) | (482 | ) |
Balance at December 31, 2006 |
| 3,513 |
| 1,252 |
| 1,668 |
| 12,699 |
| 811 |
| 19,943 |
|
|
|
|
|
|
|
|
|
|
|
|
|
|
|
Balance at January 1, 2007 |
| 3,513 |
| 1,252 |
| 1,668 |
| 12,699 |
| 811 |
| 19,943 |
|
Acquisitions |
| 9,410 |
| — |
| — |
| 2,474 |
| 59 |
| 11,943 |
|
Additions |
| 2,357 |
| 64 |
| 1,089 |
| 1,365 |
| 422 |
| 5,297 |
|
Amounts used |
| (2,840 | ) | (28 | ) | (1,638 | ) | (1,716 | ) | (234 | ) | (6,456 | ) |
Release of unused amounts |
| — |
| — |
| — |
| (366 | ) | (234 | ) | (600 | ) |
Divestments |
| (371 | ) | — |
| — |
| (69 | ) | — |
| (440 | ) |
Exchange rate differences |
| (717 | ) | — |
| (25 | ) | (277 | ) | (7 | ) | (1,026 | ) |
Balance at December 31, 2007 |
| 11,352 |
| 1,288 |
| 1,094 |
| 14,110 |
| 817 |
| 28,661 |
|
Pension obligations
In the German and French operating companies for limited groups of (ex)employees, pension plans are in place. For these plans, provisions have been made based on IAS 19. At year-end 2007, these provisions amounted to € 2.8 million. Additionally, there is a provision of € 8.1 million related to the termination of defined benefit pension plans existing in RTKL at the moment of acquisition. The expected cash outflow of this provision is in 2008.
The United States operating company has a plan for deferred compensation. The management of the company can elect not to have its salary paid out, but rather invested in a fund by the company, and is offered a choice of three different portfolio types: risk averse, neutral and risky. The risk is the responsibility of the participants. At the end of 2007, the amount recognized under pension obligations for these deferred salaries was € 0.4 million. This amount is offset by a receivable on the fund, which in 2005 was included in other non-current assets. In 2006, the receivable was offset against the provision.
Deferred compensation
A provision in the amount of € 1.3 million has been recorded related to an early retirement plan for a former manager of an acquired company and to future jubilee payments based on the current agreements in the collective labor agreements and the related staff levels.
Provisions for restructuring
Provisions for restructuring include costs related to certain compensation to staff and cost directly related to the existing plans to execute certain restructurings. A provision can only be taken if the decision to execute said restructuring has been taken, its costs can be reasonably and fairly estimated and its intended execution has been announced. Existing plans currently include small restructurings in certain parts of the company that are expected to be phased in on a step-by-step basis in the coming 24 months.
Amounts in thousands of euros unless otherwise stated
114
Financial Statements 2007
Notes to the consolidated financial statements
Provisions for litigation
ARCADIS has global professional liability insurance coverage and, in addition, has local insurance in a number of countries. In general, these insurance policies have a self-insured retention and a maximum payout level. Clients sometimes claim, justified or not, that they are not satisfied with the services provided by ARCADIS. Estimates by management and external advisors lead to an indication of the potential financial risk and whether or not that risk is covered by the insurance policies. This, in turn, determines the amount of the provision ARCADIS itself has to take. Other changes mainly consist of a movement from a project-related loss provision recorded under (un)billed receivables to a litigation provision and movements from provisions of a short-term nature to a long-term nature.
Other provisions
In some cases, ARCADIS may extend warranties after the completion of activities. In such cases, a provision is recognized, based on estimated cash out flows. Because settlement in these cases generally takes place with in a brief time frame and because the amounts are relatively limited, no discounts are made.
20 Deferred tax assets and liabilities
In assessing the valuation of the deferred tax assets, management considers whether it is probable that some portion or all of the deferred tax assets will be realized. The ultimate realization of the deferred tax assets is dependent upon the generation of future taxable income during the periods in which those temporary differences become deductible. Management considers the scheduled reversal of deferred tax liabilities, projected future taxable income, and tax planning strategies in making this assessment. The amount of the deferred tax assets considered realizable, however, could change in the near term if future estimates of projected taxable income during the carry-forward period are revised.
Deferred tax assets and liabilities relate to the following balance sheet items:
|
| Assets |
| Liabilities |
| Net |
| ||||||
|
| 2007 |
| 2006 |
| 2007 |
| 2006 |
| 2007 |
| 2006 |
|
Goodwill/identifiables |
| 2,248 |
| 2,297 |
| 3,089 |
| 2,158 |
| (841 | ) | 139 |
|
Work in progress |
| 996 |
| 745 |
| 18,008 |
| 23,907 |
| (17,012 | ) | (23,162 | ) |
Accrued expenses |
| 10,666 |
| 281 |
| 987 |
| (5,486 | ) | 9,679 |
| 5,767 |
|
Share-based compensation |
| 3,292 |
| 3,097 |
| — |
| — |
| 3,292 |
| 3,097 |
|
Deferred compensation |
| 1,265 |
| 1,340 |
| — |
| — |
| 1,265 |
| 1,340 |
|
Net operating losses |
| 1,826 |
| 642 |
| — |
| — |
| 1,826 |
| 642 |
|
Others |
| 2,240 |
| (111 | ) | 1,069 |
| (135 | ) | 1,171 |
| 24 |
|
Offsetting |
| (8,460 | ) | — |
| (8,460 | ) | — |
| — |
| — |
|
Balance at December 31 |
| 14,073 |
| 8,291 |
| 14,693 |
| 20,444 |
| (620 | ) | (12,153 | ) |
Deferred tax assets and liabilities are offset only when there is a legally enforceable right to set off tax assets against tax liabilities and when the deferred tax assets and liabilities relate to the same tax authority.
Approximately € 22.4 million of the deferred tax liabilities at December 31, 2007 will be utilized within one year. The utilization of deferred tax assets at December 31, 2007, will be, € 14.8 million.
The gross operating losses that might be compensated by future profits amount to € 8,247 at December 31, 2007, and € 5,857 at December 31, 2006. For these pre-tax losses, there is no expiration date.
Amounts in thousands of euros unless otherwise stated
115
Financial Statements 2007
Notes to the consolidated financial statements
In 2007, a deferred tax asset of € 1.5 million (2006: € 1.9 million) of net operating losses was not recognized. The opinion of management is that these losses will not be compensated by future profits in the companies where these losses were made.
The movement in temporary differences during the year is as follows:
|
| Balance at |
| Recognized |
| Recognized |
| (De)- |
| Exchange |
| Balance at |
|
Goodwill/identifiables |
| 139 |
| 3,027 |
| — |
| (4,011 | ) | 4 |
| (841 | ) |
Work in progress |
| (23,162 | ) | 4,362 |
| — |
| — |
| 1,788 |
| (17,012 | ) |
Accrued expenses |
| 5,767 |
| 2,310 |
| — |
| 2,450 |
| (848 | ) | 9,679 |
|
Share-based compensation |
| 3,097 |
| 1,195 |
| (1,000 | ) | — |
| — |
| 3,292 |
|
Deferred compensation |
| 1,340 |
| 44 |
| — |
| (121 | ) | 2 |
| 1,265 |
|
Net operating losses |
| 642 |
| 735 |
| — |
| 449 |
| — |
| 1,826 |
|
Others |
| 24 |
| 524 |
| — |
| 659 |
| (36 | ) | 1,171 |
|
Tax assets/(liabilities) |
| (12,153 | ) | 12,197 |
| (1,000 | ) | (574 | ) | 910 |
| (620 | ) |
21 Loans and borrowings
|
| 2007 |
| 2006 |
|
Bank loans |
| 145,999 |
| 97,190 |
|
(interest rates between 3.2% and 18.0%) |
|
|
|
|
|
Financial lease contracts |
| 3,014 |
| 780 |
|
(interest rates between 3.0% and 6.8%) |
|
|
|
|
|
Other long-term debt |
| 52,608 |
| 22,896 |
|
(interest rates between 3.0% and 6.1%) |
|
|
|
|
|
Subtotal |
| 201,621 |
| 120,866 |
|
Current portion |
| 36,468 |
| 1,580 |
|
Balance at December 31 |
| 165,153 |
| 119,286 |
|
Aggregate maturities of long-term debt are as follows:
2009 |
| 20,451 |
|
|
|
2010 |
| 2,500 |
|
|
|
2011 |
| 52,521 |
|
|
|
2012 |
| 28,623 |
|
|
|
2013 |
| 30,899 |
|
|
|
after 2013 |
| 30,159 |
|
|
|
|
| 165,153 |
|
|
|
The fair value of the long-term debt components approximates the carrying amount. The weighted average interest rate for 2007 and 2006 on interest- bearing debt (including the interest effect of the swaps) was 4.6% and 3.6%, respectively. From the total amount of bank loans at December 31, 2007, € 137,451 has interest rates in the range of 3.27% to 6%. The remainder of € 8,548 has interest rates in the range of 10% to 18%.
Under this heading, retentions for the acquisition of BBL and RTKL and expected after-payments are included, amounting to € 39.6 million.
The long-term loan amounts to $ 200 million with US LIBOR denominated interest rate. The full amount of $ 200 million is swapped to a EURIBOR-denominated interest rate, of which a euro equivalent of $ 45 million is swapped to a fixed rate of 3.18%, and a euro equivalent of $ 40 million is swapped to a fixed rate of 4.97%. For the disclosure on the derivatives, please refer to note 13. The debt covenants are disclosed under note 22.
116
Financial Statements 2007
Notes to the consolidated financial statements
22 Other current liabilities
|
| 2007 |
| 2006 |
|
Taxes and social security contributions |
| 32,046 |
| 34,110 |
|
Payable to employees |
| 68,384 |
| 56,686 |
|
Bank overdrafts and short-term borrowings |
| 24,761 |
| 22,342 |
|
After-payments for acquisitions |
| 2,175 |
| 8,016 |
|
Other liabilities |
| 32,928 |
| 21,785 |
|
|
| 160,294 |
| 142,939 |
|
On April 4, 2006, ARCADIS entered into a short-term multi-currency debt facility of € 100 million with a consortium of four banks and a € 50 million guarantee facility with one bank. The interest rate on this short-term facility is EONIA-denominated and is used for the financing of working capital and general purposes of the ARCADIS Group. The debt covenant for the short-term facility states that the net debt to EBITDA ratio is not to exceed the maximum ratio of 3, which is verified twice a year.
The total short-term facilities amount to € 233.9 million, which includes the multi-currency and guarantee facility of € 150.0 million with the consortium. The effective interest rates for bank overdrafts are between 4.1% and 16.2%.
By the end of the year 2007, the total amount of bank guarantees and letters of credit that were outstanding under the € 50 million short-term guarantee facility amounted to € 29.8 million. The total amount of outstanding guarantees and letters of credit amounted to € 62.4 million (2006: € 41.0 million).
23 Commitments and contingent liabilities
Operational leases
Future minimum payments for the non-cancelable operating leases during the next five years and thereafter are as follows:
Years ending December 31 |
| Amount of operational lease |
|
2008 |
| 47,658 |
|
2009 |
| 42,078 |
|
2010 |
| 34,622 |
|
2011 |
| 24,232 |
|
Thereafter |
| 42,978 |
|
|
| 191,568 |
|
The Company’s lease arrangements relate to contracts for leased cars and buildings.
During the year ended December 31, 2007, € 34.9 million was recognized as an expense in the statement of income with regard to operating leases (2006: € 34.4 million).
Litigation
The Company is involved in various legal and regulatory claims and proceedings arising in the normal course of its business. In some of these proceedings claimants allegedly claim amounts for project contract breaches that are significant to the financial statements. In consultation with in-house and outside legal counsels, management regularly evaluates relevant facts and circumstances of those claims and, based on the analysis of possible outcomes of litigation and settlements, provisions are accrued to the extent that cash outflow of related proceedings is probable, including defense costs and reimbursements by our insurance policies. Since the
Amounts in thousands of euros unless otherwise stated
117
Financial Statements 2007
Notes to the consolidated financial statements
ultimate disposition of asserted claims and proceedings cannot be predicted with certainty, an adverse outcome of such proceedings could have a material adverse effect on the Company’s consolidated financial position and consolidated results of operations for a particular period.
Guarantees
As a partner in a number of partnerships, ARCADIS is liable for the contractual obligations these companies enter into. The potential risk pertaining to these obligations amounted to € 1.8 million (2006: € 0.1 million).
24 Operational costs
|
| 2007 |
| 2006 |
|
Salaries and wages |
| 522,928 |
| 435,470 |
|
Social charges |
| 73,380 |
| 62,749 |
|
Pension and early retirement charges |
| 21,130 |
| 19,143 |
|
Other personnel costs including temporary labor |
| 75,896 |
| 63,971 |
|
Total personnel costs |
| 693,334 |
| 581,333 |
|
Occupancy expenses |
| 50,831 |
| 50,574 |
|
Travel expenses |
| 44,378 |
| 38,749 |
|
Office expenses |
| 35,717 |
| 24,887 |
|
Audit and consultants, costs |
| 13,640 |
| 18,818 |
|
Insurance costs |
| 9,977 |
| 10,144 |
|
Marketing and advertising expenses |
| 6,801 |
| 5,528 |
|
Other operational costs |
| 23,812 |
| 10,943 |
|
Total other operational costs |
| 185,156 |
| 159,643 |
|
Total operational costs |
| 878,490 |
| 740,976 |
|
The average number of employees in 2007 was 11,304 (2006: 9,685). The headcount includes the total number of employees of the proportionately consolidated company ARCADIS Aqumen Facility Management B.V. (2007: 272; 2006: 228).
Share-based compensation
In accordance with IFRS 2, the Company’s stock option plans qualify as so-called equity-settled plans. As a consequence, the Company has to charge the fair value of the stock options against income (spread over the vesting period). The corresponding amount is directly credited to equity.
Under other personnel cost, an amount of € 3.3 million is included for the options granted to personnel in 2007, 2006 and 2005 under the different option plans. In calculating the cost, the fair value of each option was estimated as of the date of grant, using the binominal option-pricing model with the following weighted average assumptions:
|
| 2007 |
| 2006 |
|
Expected dividend yield |
| 1.68 |
| 2.09 |
|
Risk-free interest rate (%) |
| 4.3 |
| 3.9 |
|
Expected volatility (%) |
| 26.9 |
| 25.0 |
|
Expected life of option (years) |
| 5 |
| 5 |
|
Expected forfeitures (%) |
| 9.2 |
| 9.2 |
|
Incentive shares
On May 11, 2005, the Annual General Meeting of Shareholders approved the conditional granting of 17,000 incentive shares to the members of the Executive Board. The costs of this grant amount to € 0.2 million. These
Amounts in thousands of euros unless otherwise stated
118
Financial Statements 2007
Notes to the consolidated financial statements
costs are spread over the three-year vesting period. The expenses for 2007 amount to € 0.1 million and are included in the other personnel costs. In May 2006, 47,400 incentive shares were granted to the members of the Executive Board and senior management. The expenses for 2007 amount to € 0.4 million. In May 2007, 47,050 incentive shares were granted. The expenses for 2007 amount to € 0.4 million.
The following parameters were used to calculate the costs:
Share price at grant date 2005 | € | 17.94 |
|
Share price at grant date 2006 | € | 37.13 |
|
Share price at grant date 2007 | € | 59.68 |
|
Foregone dividend | 7.2 | % | |
Performance discount | 30.0 | % | |
Options and shares granted are conditional in nature and depend on attaining a performance measure after three years. The performance measure is Total Shareholder Return (TSR), defined as share price increase plus dividend. This measure stimulates the creation of shareholder value in the longer term. Each year, a three-year cycle begins, whereby achievements are measured at the end of the period against a peer group of companies of comparable size and breadth. ARCADIS’ position in the peer group (10 companies including ARCADIS) determines whether the (conditional) options and shares granted earlier become unconditional.
The following table indicates the number of options and shares that can become unconditional at the end of each three-year period depending on ARCADIS’ relative position in comparison to the peer group.
Position against peer group |
| Number of conditional |
| Number of conditional |
|
First |
| 150 |
| 115 |
|
Second |
| 133.3 |
| 110 |
|
Third |
| 116.7 |
| 105 |
|
Fourth |
| 100 |
| 100 |
|
Fifth |
| 83.3 |
| 95 |
|
Sixth |
| 66.7 |
| 90 |
|
Seventh |
| 50 |
| 85 |
|
Eighth |
| 0 |
| 80 |
|
Below Eighth |
| — |
| 0 |
|
Principal accountant fees and services
The following table details the aggregate fees billed by our principal accountant, KPMG Accountants N.V., for the last two fiscal years for various services (in millions of €):
Type of services provided |
| 2007 |
| 2006 |
|
Audit fees |
| 1.8 |
| 2.4 |
|
Audit-related fees (1) |
| 0.7 |
| 0.8 |
|
Tax fees (2) |
| 0.3 |
| 0.3 |
|
(1) | Audit-related fees for the years ended December 31, 2007 and 2006 consist of fees for services that are traditionally performed by the independent accountants. These services include accounting consultations, internal control reviews on implementation of information systems, services related to the implementation of § 404 of the Sarbanes-Oxley Act of 2002 regarding management’s report over internal control over financial reporting and other similar services, consultations concerning financial accounting and reporting standards (especially related to the transition to International Financial Reporting Standards), and due diligence and audits in connection with acquisitions or divestments. |
(2) | Tax fees as of the years ended December 31, 2007 and 2006 consist of fees expensed for tax planning services and tax. |
119
Financial Statements 2007
Notes to the consolidated financial statements
25 Other income
|
| 2007 |
| 2006 |
|
Book gain on sale of assets |
| 1,635 |
| — |
|
26 Net finance expense
|
| 2007 |
| 2006 |
|
Financial income |
| 22,289 |
| 14,116 |
|
Financial expenses |
| (15,536 | ) | (10,063 | ) |
Fair value changes of derivatives |
| (15,370 | ) | (7,552 | ) |
|
| (8,617 | ) | (3,499 | ) |
27 Income taxes
ARCADIS NV is for income tax purposes the parent of the fiscal unit ARCADIS NV and is therefore liable for the liabilities of the fiscal unit as a whole. The weighted average tax rate on profit before taxes was 32.8% (2006: 30.2%).
|
| 2007 |
| 2006 |
| ||||||||
Explanation of effective tax rate |
| Gross amount |
| Taxes |
| In % |
| Gross amount |
| Taxes |
| In % |
|
Profit before taxes from operations |
| 86,352 |
| 28,032 |
| 32.5 |
| 66,982 |
| 20,119 |
| 30.0 |
|
Profit before taxes from associates |
| (822 | ) |
|
| 0.3 |
| (458 | ) |
|
| 0.2 |
|
Profit before taxes |
| 85,530 |
| 28,032 |
| 32.8 |
| 66,524 |
| 20,119 |
| 30.2 |
|
Nominal tax rate in the Netherlands |
|
|
|
|
| 25.5 |
|
|
|
|
| 29.6 |
|
Foreign tax rate differences |
|
|
|
|
| 8.2 |
|
|
|
|
| 4.6 |
|
Tax losses previously not recognized |
|
|
|
|
| (0.6 | ) |
|
|
|
| (0.1 | ) |
Settlements related to previous years |
|
|
|
|
| (1.0 | ) |
|
|
|
| 0.2 |
|
Income from associates |
|
|
|
|
| 0.3 |
|
|
|
|
| 0.2 |
|
Non-taxable amounts and others |
|
|
|
|
| 0.4 |
|
|
|
|
| (2.9 | ) |
Change in corporate tax rate in the Netherlands |
|
|
|
|
|
|
|
|
|
|
| (1.4 | ) |
Effective tax rate |
|
|
|
|
| 32.8 |
|
|
|
|
| 30.2 |
|
Explanation taxes |
|
| 2007 |
|
| 2006 |
| |||||||
Current year |
|
|
|
|
| 41,116 |
|
|
|
|
| 20,019 |
| |
Adjustments for previous years |
|
|
|
|
| (887 | ) |
|
|
|
| 122 |
| |
Total current tax |
|
|
|
|
| 40,229 |
|
|
|
|
| 20,141 |
| |
Deferred tax |
|
|
|
|
| (12,197 | ) |
|
|
|
| (22 | ) | |
|
|
|
|
|
| 28,032 |
|
|
|
|
| 20,119 |
| |
The tax effects of significant timing differences that give rise to year-end deferred tax assets and liabilities are offset within each taxable entity. Deferred tax assets in excess of these amounts are recognized if their realization is more likely than not.
The geographic breakdown of profit before taxes, including profit before taxes from associates and long-term investments, in 2007 and 2006 is as follows:
|
| 2007 |
| 2006 |
|
The Netherlands |
| 13,590 |
| 14,921 |
|
Foreign |
| 71,938 |
| 51,603 |
|
Profit before taxes |
| 85,528 |
| 66,524 |
|
120
Financial Statements 2007
Notes to the consolidated financial statements
The geographic breakdown of income taxes in the Consolidated Statements of Income is as follows:
|
| 2007 |
| 2006 |
|
Current tax |
|
|
|
|
|
The Netherlands |
| 9,068 |
| 2,289 |
|
Foreign |
| 31,161 |
| 17,852 |
|
|
| 40,229 |
| 20,141 |
|
Deferred tax |
|
|
|
|
|
The Netherlands |
| (8,181 | ) | (130 | ) |
Foreign |
| (4,016 | ) | 108 |
|
|
| (12,197 | ) | (22 | ) |
Total income taxes |
| 28,032 |
| 20,119 |
|
At December 31, 2007, operating loss carry-forwards for tax purposes amounted to € 8.2 million, which can be carried forward indefinitely. Net operating losses of € 3.4 million were utilized during 2007 and € 6.8 million in 2006.
28 Subsequent events
No events have occurred after December 31, 2007 that would have changed the judgment and analysis by management of the financial condition of the Company at December 31, 2007 or the profit for the period of the year 2007. On January 31, 2008, the Company announced the acquisition of LFR Inc., a U.S.-based environmental services company with 2007 gross revenues of $ 127 million and margins close to ARCADIS’ target for environment. It is expected that the acquisition will be immediately accretive to earnings per share.
29 Related party transactions
From time to time, the Company entered into related party transactions with associates. These transactions are conducted on an arm’s length basis with terms comparable to transactions with third parties. Intercompany transactions, balances and unrealized gains on transactions between group companies are eliminated on consolidation and are not disclosed in this note. In 2007, ARCADIS was no party to any transaction or loan with other parties who hold at least 10% of the shares in ARCADIS.
30 Interests in jointly controlled entities
The group has several interests in jointly controlled entities, of which the most important are a 50% interest in the jointly controlled entity ARCADIS Aqumen Facility Management BV and a 33.3% interest in the jointly controlled entity Biogás Energia Ambiental S.A. The financial statements of all jointly controlled entities are (in millions of euros):
|
| 2007 |
| 2006 |
|
Non-current assets |
| 32.9 |
| 8.6 |
|
Current assets |
| 60.9 |
| 28.6 |
|
Total assets |
| 93.8 |
| 37.2 |
|
Non-current liabilities |
| 22.6 |
| 4.4 |
|
Current liabilities |
| 59.8 |
| 27.7 |
|
Minority interest |
| — |
| — |
|
Total liabilities |
| 82.4 |
| 32.1 |
|
Gross revenue |
| 128.6 |
| 89.0 |
|
Expenses |
| 114.7 |
| 85.1 |
|
121
Financial Statements 2007
Notes to the consolidated financial statements
31 Financial risk management
ARCADIS has exposure to the following risks from its use of financial instruments:
· credit risk
· liquidity risk
· market risk
The exposure to each of the above-mentioned risks, ARCADIS’ objectives, policies and processes for measuring and managing risk, and ARCADIS’ management of capital are disclosed in this note. Further quantitative disclosures are included throughout these consolidated financial statements.
The Executive Board is responsible for the design and functioning of the internal risk management systems. Although such systems are intended to optimally control risks, they can never, however well designed or functioning, provide absolute certainty that human error, unforeseen circumstances, material losses, fraud or infringements of laws or regulations will not occur. In addition, continuous evaluations of the effects of risk management systems and the cost incurred must be performed.
ARCADIS’ Audit Committee oversees how management monitors compliance with ARCADIS’ risk management policies and procedures/control framework and reviews the adequacy of the risk management framework in relation to the risks faced by ARCADIS.
Credit risk
Credit risk is the risk of financial loss to ARCADIS if a customer or counterparty to a financial instrument fails to meet its contractual obligations and arises principally from ARCADIS’ receivables from customers. We usually invoice clients for our services according to the progress of the work (percentage of completion – method). If our clients refuse or are unable to meet their contractual payment obligations, we may not have sufficient cash to satisfy our liabilities, and our growth rate and continued operations could be adversely impacted. ARCADIS strongly increases the focus on clients by strengthening the relationship, consequently increasing revenues and reducing the related credit risk. New customers are generally analysed individually for creditworthiness before services are offered.
The aging of trade receivables and provision for bad debts at the reporting date were:
|
| Gross |
| Provision |
| Gross |
| Provision |
|
|
| 2007 |
| 2007 |
| 2006 |
| 2006 |
|
Not past due |
| 135,765 |
| (325 | ) | 134,784 |
| (1,317 | ) |
Past due 0-30 days |
| 67,573 |
| (593 | ) | 44,776 |
| (86 | ) |
Past due 31-120 days |
| 40,534 |
| (602 | ) | 27,756 |
| (570 | ) |
More than 120 days |
| 40,801 |
| (10,189 | ) | 21,069 |
| (6,742 | ) |
Total |
| 284,673 |
| (11,709 | ) | 228,385 |
| (8,715 | ) |
A provision for the impairment of trade and other receivables is established, representing specific loss components for individually significant exposures and a collective loss component established for groups of similar assets with respect to losses incurred but not yet identified. The collective loss allowance is based on historical data of payment statistics for similar assets.
122
Financial Statements 2007
Notes to the consolidated financial statements
The Company provided bank guarantees and letters of credit. At December 31, 2007, the total amount of outstanding guarantees was
€ 62.4 million.
The carrying amount of financial assets represents the maximum credit exposure. At the balance sheet date, the maximum exposure to credit risk was:
|
| 2007 |
| 2006 |
|
Loans and receivables |
| 487,331 |
| 392,718 |
|
Cash and cash equivalents |
| 92,608 |
| 101,488 |
|
|
| 579,939 |
| 494,206 |
|
Liquidity risk
Liquidity risk is the risk that ARCADIS will not be able to meet its financial obligations as they fall due. ARCADIS’ approach to managing liquidity is to ensure that it will always have sufficient liquidity to meet its liabilities when due, under both normal and stressed conditions, without incurring unacceptable losses or risking damage to ARCADIS.
In addition, the Company maintains the following lines of credit:
· A short-term multi-currency debt facility of € 100 million with a consortium of four banks. The interest rate on this short-term facility is EONIA-denominated.
· A € 50 million guarantee facility with one bank. The interest paid on this guarantee facility amounts to 0.25% of the outstanding facility.
Over the course of the year, considerable fluctuations occur in the working capital needed to finance operations. Also acquisitions may lead to increases in borrowed capital. ARCADIS strives to have a good liquidity position at all times, strictly controlling working capital and maintaining a healthy interest coverage and debt/EBITDA ratio.
The following table describes, as of December 31, 2007, our commitments and contractual obligations for the following five years and thereafter. The long-term debt obligations are our cash debt service obligations. Operating lease obligations are the future minimum rental payments required under the operating leases that have initial or remaining non-cancelable lease terms in excess of one year as of December 31, 2007.
|
| Payments due by period |
| ||||||||
|
| Carrying |
| Less than |
| 1-3 |
| 3-5 |
| More than |
|
Contractual obligations 2007 |
| amount |
| 1 year |
| years |
| years |
| 5 years |
|
Operating lease obligations |
| 191,568 |
| 47,658 |
| 76,700 |
| 41,561 |
| 25,649 |
|
Capital (finance) lease obligations |
| 1,599 |
| — |
| 1,442 |
| 153 |
| 4 |
|
Purchase obligations |
| 42,237 |
| 29,314 |
| 12,923 |
| — |
| — |
|
Interest |
| 38,763 |
| 9,765 |
| 15,519 |
| 10,655 |
| 2,824 |
|
Other long-term liabilites |
| 157,527 |
| 9,759 |
| 3,698 |
| 54,461 |
| 89,609 |
|
Subordinated loans |
| 54 |
| — |
| 54 |
| — |
| — |
|
Short-term bank debt |
| 4,303 |
| 4,303 |
| — |
| — |
| — |
|
Total |
| 436,051 |
| 100,799 |
| 110,336 |
| 106,830 |
| 118,086 |
|
|
| Payments due by period |
| ||||||||
|
| Carrying |
| Less than |
| 1-3 |
| 3-5 |
| More than |
|
Contractual obligations 2006 |
| amount |
| 1 year |
| years |
| years |
| 5 years |
|
Operating lease obligations |
| 160,505 |
| 34,935 |
| 61,297 |
| 40,550 |
| 23,723 |
|
Capital (finance) lease obligations |
| 780 |
| 198 |
| 538 |
| 30 |
| 14 |
|
Purchase obligations |
| 31,562 |
| 10,782 |
| 19,907 |
| 873 |
| — |
|
Interest |
| 21,697 |
| 4,621 |
| 8,323 |
| 6,175 |
| 2,578 |
|
Other long-term liabilites |
| 99,307 |
| 1,381 |
| 3,689 |
| 58,589 |
| 35,648 |
|
Short-term bank debt |
| 2,769 |
| 2,769 |
| — |
| — |
| — |
|
Total |
| 316,620 |
| 54,686 |
| 93,754 |
| 106,217 |
| 61,963 |
|
123
Financial Statements 2007
Notes to the consolidated financial statements
Market risk
Market risk is the risk that changes in market prices, such as foreign exchange rates, and interest rates will affect ARCADIS’ income or the value of its holdings of financial instruments. The objective of market risk management is to manage and control market risk exposures within acceptable parameters, while optimizing the return on risk.
Currency risk
The subsidiaries of ARCADIS mainly operate in local markets. As a result, the exposure to currency risk on sales and costs denominated in another currency than the respective functional currencies of the subsidiaries is very limited. However, the Company has some exposure to currency risk for borrowings that are denominated in another currency than the functional currency. This relates to a $ 200 million dollar loan in a company that has the euro as functional currency, and a loan of € 41 million for a company that has the British pound as functional currency. For the $ 200 million dollar loan, cross-currency interest rate swaps have been concluded.
Interest on borrowings is denominated in currencies that match the cash flow generated by the underlying operations of the Company, primarily the euro and US dollar.
The following foreign currencies, which are denominated in another currency than the functional currency of the respective operational companies, are included in the balance sheet:
|
| December 31, 2007 |
| December 31, 2006 |
|
Loans and borrowings in $ |
| 135,860 |
| 91,116 |
|
Loans and borrowings in € |
| 41,005 |
| 14,162 |
|
Cash and cash equivalents in $ |
| 3,481 |
| 8 |
|
Cash and cash equivalents in £ |
| (8,457 | ) | 3,729 |
|
Other cash and cash equivalents |
| 1,629 |
| 7 |
|
The following significant exchange rates applied during the year:
Euro per unit |
| 2007 |
| 2006 |
|
$, average |
| 0.73091 |
| 0.79713 |
|
$, ultimo |
| 0.67930 |
| 0.75930 |
|
£, average |
| 1.46235 |
| 1.46719 |
|
£, ultimo |
| 1.36360 |
| 1.48920 |
|
124
Financial Statements 2007
Notes to the consolidated financial statements
Sensitivity analysis
A 10% strengthening of the euro against the following currencies at December 31 would have increased (decreased) equity and profit or loss by the amounts shown below. This analysis assumes that all other variables, in particular interest rates, remain constant. The analysis is performed on the same basis for 2006. Loans and borrowings in the U.K. subsidiary, which were denominated in euros, relate to inter-company financing, and the related exchange rate differences are recognized directly in equity as part of the investment in that company. The impact of a 10% increase of the euro against the dollar has a limited impact as a result of the netting with the related cross-currency interest rate swap.
|
| Equity |
| Profit or loss |
|
December 31, 2007 |
|
|
|
|
|
$ |
| — |
| (348 | ) |
£ |
| 5,591 |
| 846 |
|
Other |
| — |
| (163 | ) |
December 31, 2006 |
|
|
|
|
|
$ |
| — |
| (1 | ) |
£ |
| 1,931 |
| (373 | ) |
Other |
| — |
| (1 | ) |
A 10% weakening of the euro against the above currencies at December 31 would have had the equal but opposite effect on the above currencies to the amounts shown above, on the basis that all the other variables remain constant.
Interest rate risk
ARCADIS manages interest rate risks by financing fixed assets and part of current assets with shareholders’ equity, provisions and long-term debt. The remainder of current assets is financed with short-term debt including revolving bank credits with variable interest rates. Based on our interest risk profile, limited financial instruments were used during 2007 to cover the interest rate risk on long-term financing. This risk is only applicable to long-term debt and bank overdrafts in our balance sheet amounting to € 136 million at year-end 2007. A movement in interest rate by 100 basis points would, based on our financial instruments that are subject to changes in interest rates, have a negative or positive effect on net income of less than € 0.9 million.
Capital management
ARCADIS’ objectives when managing capital are to safeguard ARCADIS’ ability to continue as a going concern in order to provide returns for shareholders and benefits for other stakeholders and to maintain an optimal capital structure to reduce the cost of capital.
ARCADIS sets the amount of capital in proportion to risk. ARCADIS manages the capital structure and makes adjustments to it in light of changes in economic conditions and the risk characteristics of the underlying assets. From time to time, ARCADIS purchases its own shares on the market, which are intended to be used for issuing shares under the ARCADIS’ share option program.
125
Financial Statements 2007
Notes to the consolidated financial statements
Consistently with the debt covenants, ARCADIS monitors capital on the basis of the net debt to EBITDA ratio. This ratio is calculated as interest-bearing debt minus cash and cash equivalents divided by EBITDA. EBITDA is calculated as earnings before interest, tax, depreciation and amortization.
During 2007, ARCADIS’ strategic goals on financing, which were unchanged from 2006, was to maintain a net debt to EBITDA ratio not greater than 2.0 in order to secure access to financing at a reasonable cost. The net debt to EBITDA ratios at December 31, 2007 and at December 31, 2006 were as follows:
In millions of euros |
| December 31, 2007 |
| December 31, 2006 |
|
Long-term debts |
| 165.2 |
| 119.3 |
|
Current portion of long-term debt |
| 36.5 |
| 1.6 |
|
Bank overdraft and short-term bank debt |
| 24.8 |
| 22.3 |
|
Total debt |
| 226.5 |
| 143.2 |
|
Less: cash and cash equivalents |
| (92.6 | ) | (101.5 | ) |
Net debt |
| 133.9 |
| 41.7 |
|
EBITDA |
| 127.6 |
| 96.5 |
|
Net debt to EBITDA ratio * |
| 1.0 |
| 0.4 |
|
* The calculation of the net debt to EBITDA ratio is adjusted for income acquired through business combinations in order to bring the nominator and denominator both to the same level of activities.
The increase in the net debt to EBITDA ratio during 2007 resulted primarily from an increase in long-term debts. New long-term debts in 2007 were for the most part contracted for acquisitions and energy-projects in Brazil.
Financial income and expense
Recognized in profit or loss |
| 2007 |
| 2006 |
|
Interest income on bank deposits |
| 7,602 |
| 5,425 |
|
Foreign exchange differences on financial liabilities |
| 14,687 |
| 8,691 |
|
Fair value changes of derivatives |
| (15,370 | ) | (7,552 | ) |
Financial expense |
| (15,536 | ) | (10,063 | ) |
Net finance cost |
| (8,617 | ) | (3,499 | ) |
Recognized directly in equity |
| 2007 |
| 2006 |
|
Currency translation differences for foreign operations |
| (22,170 | ) | (14,062 | ) |
The foreign currency translation differences are recognized in equity under cumulative translation reserves.
126
Company balance sheet at
December 31
|
| Note |
| 2007 |
| 2006 |
|
Assets |
|
|
|
|
|
|
|
Non-current assets |
|
|
|
|
|
|
|
Intangible assets*) |
| 32 |
| 271 |
| 444 |
|
Property, plant & equipment |
| 33 |
| 724 |
| 750 |
|
Investment in subsidiaries |
| 34 |
| 140,393 |
| 133,561 |
|
Other investments |
| 35 |
| 59,180 |
| 18,502 |
|
Deferred tax assets |
| 39 |
| 3,828 |
| 3,371 |
|
Total non-current assets |
|
|
| 204,396 |
| 156,628 |
|
Current assets |
|
|
|
|
|
|
|
Derivatives |
| 13 |
| — |
| — |
|
Receivables |
| 36 |
| 84,003 |
| 80,303 |
|
Corporate tax receivables |
|
|
| 27 |
| 8,114 |
|
Cash and cash equivalents |
|
|
| 4,280 |
| 7,606 |
|
Total current assets |
|
|
| 88,310 |
| 96,023 |
|
Total |
|
|
| 292,706 |
| 252,651 |
|
|
|
|
|
|
|
|
|
Equity and liabilities |
|
|
|
|
|
|
|
Shareholders’ equity |
|
|
|
|
|
|
|
Share capital |
|
|
| 1,030 |
| 1,030 |
|
Share premium |
|
|
| 44,153 |
| 44,153 |
|
Cumulative translation reserve |
|
|
| (29,829 | ) | (7,659 | ) |
Retained earnings |
|
|
| 117,509 |
| 106,421 |
|
Undistributed profits |
|
|
| 54,852 |
| 44,936 |
|
Total shareholders’ equity |
| 37 |
| 187,715 |
| 188,881 |
|
Non-current liabilities |
|
|
|
|
|
|
|
Provisions |
| 38 |
| 7,500 |
| 7,363 |
|
Deferred tax liabilities |
| 39 |
| 298 |
| 570 |
|
Long-term debt |
|
|
| 372 |
| 148 |
|
Derivatives |
| 13 |
| 21,188 |
| 5,829 |
|
Total non-current liabilities |
|
|
| 29,358 |
| 13,910 |
|
Current liabilities |
|
|
|
|
|
|
|
Corporate tax liabilites |
|
|
| 2,300 |
| 2,500 |
|
Trade and other liabilities |
| 40 |
| 73,333 |
| 47,360 |
|
Total current liabilities |
|
|
| 75,633 |
| 49,860 |
|
Total |
|
|
| 292,706 |
| 252,651 |
|
*) Goodwill is included in the line item Investments in subsidiaries as the Company is using the equity method for valuation of its investments in subsidiaries.
127
Company statement of income at
December 31
|
| 2007 |
| 2006 |
|
Net income of subsidiaries |
| 62,652 |
| 50,881 |
|
Other results |
| (7,800 | ) | (5,945 | ) |
Net income |
| 54,852 |
| 44,936 |
|
Notes to the Company balance sheet
General
The Company financial statements have been prepared in accordance with Title 9 of Book 2 of the Dutch Civil Code using article 362, paragraph 8 that implies that the accounting policies of the consolidated financial statements are used. Subsidiaries are measured using the net equity method.
The conversion of foreign currencies, the valuation of assets and liabilities, and the method of determination of income are the same as those used in the consolidated financial statements.
As a result of the application of the option in section 362 of Book 2 of the Dutch Civil Code to use the same accounting principles as for the consolidated financial statements, the financial statements of ARCADIS NV have been prepared in accordance with IFRS and its interpretations as adopted by the International Accounting Standards Board (IASB) and endorsed by the European Union. By making use of this option, reconciliation is maintained between the consolidated and the Company’s shareholders’ equity.
The Company’s statement of income is condensed in accordance with article 402 Book 2 of the Dutch Civil Code.
32 Intangible assets
|
| Identifiable |
|
|
|
|
|
|
| intangible |
|
|
|
|
|
|
| assets |
| Software |
| Total |
|
Cost |
|
|
|
|
|
|
|
Balance at January 1, 2006 |
| 4,492 |
| 3,402 |
| 7,894 |
|
Investments |
| — |
| 563 |
| 563 |
|
Divestments |
| — |
| (151 | ) | (151 | ) |
Transfer to consolidated companies |
| (4,492 | ) | — |
| (4,492 | ) |
Balance at December 31, 2006 |
| — |
| 3,814 |
| 3,814 |
|
Balance at January 1, 2007 |
| — |
| 3,814 |
| 3,814 |
|
Investments |
| — |
| 35 |
| 35 |
|
Balance at December 31, 2007 |
| — |
| 3,849 |
| 3,849 |
|
Amortization and depreciation |
|
|
|
|
|
|
|
Balance at January 1, 2006 |
| 1,901 |
| 3,307 |
| 5,208 |
|
Amortization and depreciation charge for the year |
| — |
| 119 |
| 119 |
|
Divestments |
| — |
| (56 | ) | (56 | ) |
Transfer to consolidated companies |
| (1,901 | ) | — |
| (1,901 | ) |
Balance at December 31, 2006 |
| — |
| 3,370 |
| 3,370 |
|
Balance at January 1, 2007 |
| — |
| 3,370 |
| 3,370 |
|
Amortization and depreciation charge for the year |
| — |
| 208 |
| 208 |
|
Balance at December 31, 2007 |
| — |
| 3,578 |
| 3,578 |
|
Carrying amounts |
|
|
|
|
|
|
|
At January 1, 2006 |
| 2,591 |
| 95 |
| 2,686 |
|
At December 31, 2006 |
| — |
| 444 |
| 444 |
|
At January 1, 2007 |
| — |
| 444 |
| 444 |
|
At December 31, 2007 |
| — |
| 271 |
| 271 |
|
128
33 Property, plant & equipment
|
| Furniture and fixtures |
|
Cost |
|
|
|
Balance at January 1, 2006 |
| 1,735 |
|
Investments |
| 622 |
|
Divestments |
| (1,512 | ) |
Balance at December 31, 2006 |
| 845 |
|
|
|
|
|
Balance at January 1, 2007 |
| 845 |
|
Investments |
| 71 |
|
Balance at December 31, 2007 |
| 916 |
|
Depreciation |
|
|
|
Balance at January 1, 2006 |
| 1,505 |
|
Depreciation charge for the year |
| 74 |
|
Divestments |
| (1,484 | ) |
Balance at December 31, 2006 |
| 95 |
|
|
|
|
|
Balance at January 1, 2007 |
| 95 |
|
Depreciation charge for the year |
| 97 |
|
Balance at December 31, 2007 |
| 192 |
|
Carrying amounts |
|
|
|
At January 1, 2006 |
| 230 |
|
At December 31, 2006 |
| 750 |
|
|
|
|
|
At January 1, 2007 |
| 750 |
|
At December 31, 2007 |
| 724 |
|
34 Investments in subsidiaries
|
| 2007 |
| 2006 |
|
Balance at January 1 |
| 133,561 |
| 136,887 |
|
Share in income |
| 65,348 |
| 50,881 |
|
Changes to consolidated companies |
| — |
| (28,955 | ) |
Exchange rate differences |
| (22,132 | ) | (13,941 | ) |
Dividends received |
| (37,311 | ) | (22,757 | ) |
Other changes |
| 927 |
| 11,446 |
|
Balance at December 31 |
| 140,393 |
| 133,561 |
|
35 Other investments
|
| 2007 |
| 2006 |
|
Balance at January 1 |
| 18,502 |
| 9,130 |
|
Loans issued |
| 48,528 |
| 9,372 |
|
Redemptions |
| (7,850 | ) |
|
|
Balance at December 31 |
| 59,180 |
| 18,502 |
|
36 Receivables
|
| 2007 |
| 2006 |
|
Receivables from subsidiaries |
| 81,980 |
| 79,880 |
|
Taxes and social security contributions |
| 1,491 |
| — |
|
Other receivables |
| 532 |
| 423 |
|
|
| 84,003 |
| 80,303 |
|
129
37 Shareholders’ equity
|
|
|
|
|
| Cumulative |
|
|
|
|
| Undis- |
|
|
|
|
| Share |
| Share |
| translation |
| Statutory |
| Retained |
| tributed |
|
|
|
|
| capital |
| premium |
| reserve |
| reserve |
| earnings |
| profits |
| Total |
|
Balance at January 1, 2006 |
| 1,030 |
| 44,153 |
| 6,403 |
| 16,707 |
| 74,496 |
| 33,414 |
| 176,203 |
|
Exchange rate differences |
|
|
|
|
| (14,062 | ) |
|
|
|
|
|
| (14,062 | ) |
Tax related to share-based payments |
|
|
|
|
|
|
|
|
| 6,416 |
|
|
| 6,416 |
|
Income directly recognized in equity |
|
|
|
|
| (14,062 | ) |
|
| 6,416 |
|
|
| (7,646 | ) |
Profit for the period |
|
|
|
|
|
|
|
|
|
|
| 44,936 |
| 44,936 |
|
Total income/(expenses) for the period net of tax |
|
|
|
|
| (14,062 | ) |
|
| 6,416 |
| 44,936 |
| 37,290 |
|
Share-based payments |
|
|
|
|
|
|
|
|
| 1,751 |
|
|
| 1,751 |
|
Dividends to shareholders |
|
|
|
|
|
|
|
|
|
|
| (13,378 | ) | (13,378 | ) |
Addition to other (statutory) reserves |
|
|
|
|
|
|
| (5,083 | ) | 25,119 |
| (20,036 | ) | — |
|
Own shares purchase for granted options |
|
|
|
|
|
|
|
|
| (17,596 | ) |
|
| (17,596 | ) |
Options exercised |
|
|
|
|
|
|
|
|
| 4,611 |
|
|
| 4,611 |
|
Balance at December 31, 2006 |
| 1,030 |
| 44,153 |
| (7,659 | ) | 11,624 |
| 94,797 |
| 44,936 |
| 188,881 |
|
Balance at January 1, 2007 |
| 1,030 |
| 44,153 |
| (7,659 | ) | 11,624 |
| 94,797 |
| 44,936 |
| 188,881 |
|
Exchange rate differences |
|
|
|
|
| (22,170 | ) |
|
|
|
|
|
| (22,170 | ) |
Tax related to share-based payments |
|
|
|
|
|
|
|
|
| (74 | ) |
|
| (74 | ) |
Income directly recognized in equity |
|
|
|
|
| (22,170 | ) |
|
| (74 | ) |
|
| (22,244 | ) |
Profit for the period |
|
|
|
|
|
|
|
|
|
|
| 54,852 |
| 54,852 |
|
Total income/(expenses) for the period net of tax |
|
|
|
|
| (22,170 | ) |
|
| (74 | ) | 54,852 |
| 32,608 |
|
Share-based payments |
|
|
|
|
|
|
|
|
| 4,195 |
|
|
| 4,195 |
|
Dividends to shareholders |
|
|
|
|
|
|
|
|
|
|
| (20,414 | ) | (20,414 | ) |
Addition to other (statutory) reserves |
|
|
|
|
|
|
| 12,828 |
| 11,694 |
| (24,522 | ) | — |
|
Own share purchase for granted options |
|
|
|
|
|
|
|
|
| (19,770 | ) |
|
| (19,770 | ) |
Options exercised |
|
|
|
|
|
|
|
|
| 2,215 |
|
|
| 2,215 |
|
Balance at December 31, 2007 |
| 1,030 |
| 44,153 |
| (29,829 | ) | 24,452 |
| 93,057 |
| 54,852 |
| 187,715 |
|
38 Provisions
|
| Deferred compensation |
| Litigation |
| Total |
|
Balance at January 1, 2006 |
| 1,000 |
| — |
| 1,000 |
|
Other changes |
| — |
| 6,363 |
| 6,363 |
|
Balance at December 31, 2006 |
| 1,000 |
| 6,363 |
| 7,363 |
|
Balance at January 1, 2007 |
| 1,000 |
| 6,363 |
| 7,363 |
|
Additions |
| — |
| 137 |
| 137 |
|
Balance at December 31, 2007 |
| 1,000 |
| 6,500 |
| 7,500 |
|
The provision is for a relatively small number of staff who are eligible for jubilee payments and a provision for litigation that is recorded at a consolidated level. The significant increase in 2006 is a movement from a project-related loss provision recorded under (un)billed receivables to a litigation provision.
39 Deferred tax assets and liabilities
|
| Deferred |
| Deferred |
| Total |
|
Balance at January 1, 2007 |
| (3,371 | ) | 570 |
| (2,801 | ) |
Additions |
| (476 | ) | — |
| (476 | ) |
Deductions |
| — |
| (272 | ) | (272 | ) |
Change in corporate tax rate in the Netherlands |
| 19 |
| — |
| 19 |
|
Balance at December 31, 2007 |
| (3,828 | ) | 298 |
| (3,530 | ) |
130
40 Trade and other liabilities
|
| 2007 |
| 2006 |
|
Bank overdrafts |
| 10,391 |
| 17,546 |
|
Suppliers |
| 1,262 |
| 1,169 |
|
Payable to group companies |
| 53,169 |
| 13,904 |
|
Other liabilities |
| 8,511 |
| 14,741 |
|
Balance at December 31, 2007 |
| 73,333 |
| 47,360 |
|
The short-term credit facilities total € 162 million. No current receivables or other assets have been pledged.
Commitments and contingent liabilities
The Company is for income tax purposes the parent of the fiscal unit ARCADIS NV and is therefore liable for the liabilities of the fiscal unit as a whole.
Warranties
ARCADIS NV has pledged warranties for the short-term credit facilities that are available for use to its operating companies. The total amount available under these facilities is € 65 million, of which € 25.5 million was used at the balance sheet date.
131
Financial Statements 2007
Notes to the Company statement of income
Notes to the Company statement of Income
41 Net income of subsidiaries
Net income of subsidiaries is the share of ARCADIS NV in the results of its subsidiaries.
42 Remuneration of Executive Board and Supervisory Board
In 2007, an amount of € 2,019,000 (2006: € 1,442,000) was charged to the Company for remuneration of Executive Board members including pension charges. As variable remuneration, 27,000 performance shares and 65,000 performance options were granted. In the schedule below, the different components of the remuneration for each Executive Board member are provided. For an explanation of the remuneration policy, please refer to the remuneration report included in this report.
|
| Year |
| Salary(1) |
| Bonus(2) |
| Pension |
| Performance shares |
|
|
| Performance |
| ||
|
|
|
|
|
|
|
|
|
| Number |
| Amount(3) |
| Number |
| Amount(3) |
|
Harrie L.J. Noy |
| 2007 |
| 369 |
| 223 |
| 82 |
| 10,000 |
| 375 |
| 25,000 |
| 250 |
|
|
| 2006 |
| 356 |
| 219 |
| 76 |
| 10,000 |
| 233 |
| 25,000 |
| 216 |
|
|
|
|
|
|
|
|
|
|
|
|
|
|
|
|
|
|
|
C. Michiel Jaski |
| 2007 |
| 276 |
| 159 |
| 45 |
| 7,000 |
| 262 |
| 15,000 |
| 150 |
|
|
| 2006 |
| 266 |
| 159 |
| 42 |
| 7,000 |
| 163 |
| 15,000 |
| 129 |
|
|
|
|
|
|
|
|
|
|
|
|
|
|
|
|
|
|
|
Ben A. van der Klift |
| 2007 |
| 276 |
| 159 |
| 44 |
| 5,000 |
| 187 |
| 12,500 |
| 125 |
|
|
| 2006(4) |
| 168 |
| 153 |
| 17 |
| 5,000 |
| 117 |
| 12,500 |
| 108 |
|
|
|
|
|
|
|
|
|
|
|
|
|
|
|
|
|
|
|
Friedrich M.T. Schneider |
| 2007 |
| 215 |
| 159 |
| 38 |
| 5,000 |
| 187 |
| 12,500 |
| 125 |
|
|
| 2006(4) |
| 137 |
| 145 |
| 22 |
| 5,000 |
| 117 |
| 12,500 |
| 108 |
|
(1) On July 1, 2007, the salaries of the members of the Executive Board were raised by 2% (2006: 5%).
(2) The bonus is based on the results achieved in 2007 respectively 2006. This bonus is paid in 2008 respectively 2007.
(3) This amount is charged over a three-year period to the company’s profit and loss account.
(4) The salaries mentioned are the amounts as of the date of appointment as member of the Executive Board (May 17, 2006).
Interests held by members of the Executive Board
The interests held in the share capital of ARCADIS NV by those who in 2007 were a member of the Executive Board are noted in the table below:
|
| December 31, 2007 |
| December 31, 2006 |
|
Shares ARCADIS NV |
|
|
|
|
|
Harrie L.J. Noy |
| 41,167 |
| 37,305 |
|
C. Michiel Jaski |
| 3,017 |
| 1,870 |
|
Ben A. van der Klift(1) |
| 810 |
| 699 |
|
Friedrich M.T. Schneider(1) |
| 26 |
| — |
|
Conditional shares ARCADIS NV(2) |
|
|
|
|
|
Harrie L.J. Noy |
| 30,000 |
| 20,000 |
|
C. Michiel Jaski |
| 21,000 |
| 14,000 |
|
Ben A. van der Klift |
| 10,000 |
| 5,000 |
|
Friedrich M.T. Schneider |
| 10,000 |
| 5,000 |
|
(1) Ben A. van der Klift and Friedrich M.T. Schneider were appointed members of the Executive Board on May 17, 2006
(2) Amounts based on granting of 100% of the reference numbers, with maximal extention to 150%. Please refer to note 17.
For description of the plan, please refer to the paragraph “long-term flexible remuneration” on page 76 of this annual report.
132
Overview of options outstanding to members of the Executive Board at December 31, 2007
|
| Option plan |
|
|
|
|
|
|
| Exercised |
|
|
|
|
| |
|
| from year |
| Granted in |
| Granted |
| Exercise price |
| to date |
| Outstanding |
| Expiration |
| |
Harrie L.J. Noy |
| 2001 |
| 2002 |
| 15,000 |
| € | 10.79 |
| 15,000 |
| — |
| 05-15-2012 |
|
|
|
|
| 2003 |
| 17,500 |
| € | 8.93 |
| — |
| 17,500 |
| 05-13-2013 |
|
|
| 2005 |
| 2005 |
| 25,000 | * | € | 17.94 |
| — |
| 25,000 |
| 05-10-2015 |
|
|
|
|
| 2006 |
| 25,000 | * | € | 37.13 |
| — |
| 25,000 |
| 05-18-2016 |
|
|
|
|
| 2007 |
| 25,000 | * | € | 59.68 |
| — |
| 25,000 |
| 05-18-2017 |
|
|
|
|
|
|
|
|
|
|
|
|
|
|
|
|
|
|
C.Michiel Jaski |
| 2001 |
| 2003 |
| 14,000 |
| € | 8.93 |
| 7,000 |
| 7,000 |
| 05-13-2013 |
|
|
| 2005 |
| 2005 |
| 15,000 | * | € | 17.94 |
| — |
| 15,000 |
| 05-10-2015 |
|
|
|
|
| 2006 |
| 15,000 | * | € | 37.13 |
| — |
| 15,000 |
| 05-18-2016 |
|
|
|
|
| 2007 |
| 15,000 | * | € | 59.68 |
| — |
| 15,000 |
| 05-18-2017 |
|
|
|
|
|
|
|
|
|
|
|
|
|
|
|
|
|
|
Ben A. van der Klift |
| 2001 |
| 2003 |
| 12,285 |
| € | 8.50 |
| 4,000 |
| 8,285 |
| 10-16-2013 |
|
|
|
|
| 2005 |
| 9,000 |
| € | 17.94 |
| — |
| 9,000 |
| 05-10-2015 |
|
|
| 2005 |
| 2006 |
| 12,500 | * | € | 37.13 |
| — |
| 12,500 |
| 05-18-2016 |
|
|
|
|
| 2007 |
| 12,500 | * | € | 59.68 |
| — |
| 12,500 |
| 05-18-2017 |
|
|
|
|
|
|
|
|
|
|
|
|
|
|
|
|
|
|
Friedrich M.T. Schneider |
| 2005 |
| 2006 |
| 12,500 | * | € | 37.13 |
| — |
| 12,500 |
| 05-18-2016 |
|
|
|
|
| 2007 |
| 12,500 | * | € | 59.68 |
| — |
| 12,500 |
| 05-18-2017 |
|
* Amounts based on granting of 100% of the referenced numbers, with maximal extention to 150%. See note 17.
Currently, the Supervisory Board consists of six members. The joint fixed remuneration for 2007 totaled € 197,500 (2006: € 213,000), specified as follows.
|
| 2007 |
| 2006 |
|
Rijnhard W.F. van Tets |
| 48 |
| 49 |
|
Thomas M. Cohn |
| 30 |
| 30 |
|
Carlos Espinosa de los Monteros |
| 30 |
| 30 |
|
George R. Nethercutt |
| 30 |
| 28 |
|
Jan Peelen |
| 30 |
| 30 |
|
Ross A. Webber (until May 17, 2006) |
|
|
| 15 |
|
Gerrit Ybema |
| 30 |
| 31 |
|
Shares and options held by members of the Supervisory Board
Members of the Supervisory Board hold no ARCADIS options or shares.
Arnhem, the Netherlands, February 29, 2008
Executive Board |
| Supervisory Board |
Harrie L.J. Noy |
| Rijnhard W.F. van Tets |
C. Michiel Jaski |
| Thomas M. Cohn |
Ben A. van der Klift |
| Carlos Espinosa de los Monteros |
Friedrich M.T. Schneider |
| George R. Nethercutt |
|
| Jan Peelen |
|
| Gerrit Ybema |
133
Other information
Profit allocation
Article 27 of the Articles of Association stipulates, among other things, that the Executive Board with the approval of the Supervisory Board shall annually propose which part of the profit shall be allocated to the reserves. The remaining part of the profit shall be at the disposal of the Annual General Meeting of Shareholders.
The Executive Board with the approval of the Supervisory Board proposes to present for acceptance to the Annual General Meeting of Shareholders to reserve an amount of € 30.0 million and distribute a dividend amount of € 24.8 million from the profits of the fiscal year 2007, amounting to € 54.8 million, which represents a dividend of € 1.23 per share.
Audit Committee pre-approval policies and procedures.
The Audit Committee of our Supervisory Board has adopted a charter that details the duties and responsibilities of our Audit Committee. These duties and responsibilities include, among other things, reviewing and monitoring our financial statements and internal accounting procedures, approving the scope and terms of audit services to be provided by our independent auditor and monitoring the services provided by our independent auditor. All non-audit services provided by our independent auditor must be pre-approved by our Audit Committee. The Audit Committee will consider whether the provision of such services by our auditor is compatible with our auditor’s independence.
134
Auditor’s report
Report of the independent auditors to the shareholders of ARCADIS NV
Report on the financial statements
We have audited the accompanying financial statements 2007 of ARCADIS NV, Arnhem on page 88 to 138. The financial statements consist of the consolidated financial statements and the company financial statements. The consolidated financial statements comprise the consolidated balance sheet at December 31, 2007, consolidated profit and loss account, consolidated statement of changes in equity and consolidated cash flow statement for the year then ended, and a summary of significant accounting policies and other explanatory notes. The company financial statements comprise the company balance sheet at December 31, 2007, the company profit and loss account for the year then ended and the Notes.
Management’s responsibility
Management is responsible for the preparation and fair presentation of the financial statements in accordance with International Financial Reporting Standards as adopted by the European Union and with Part 9 of Book 2 of the Netherlands Civil Code, and for the preparation of the management board report in accordance with Part 9 of Book 2 of the Netherlands Civil Code. This responsibility includes designing, implementing and maintaining internal control relevant to the preparation and fair presentation of the financial statements that are free from material misstatement, whether due to fraud or error; selecting and applying appropriate accounting policies; and making accounting estimates that are reasonable in the circumstances.
Auditor’s responsibility
Our responsibility is to express an opinion on the financial statements based on our audit. We conducted our audit in accordance with Dutch law. This law requires that we comply with ethical requirements and plan and perform the audit to obtain reasonable assurance whether the financial statements are free from material misstatement.
An audit involves performing procedures to obtain audit evidence about the amounts and disclosures in the financial statements. The procedures selected depend on the auditor’s judgment, including the assessment of the risks of material misstatement of the financial statements, whether due to fraud or error. In making those risk assessments, the auditor considers internal control relevant to the entity’s preparation and fair presentation of the financial statements in order to design audit procedures that are appropriate to the circumstances, but not for the purpose of expressing an opinion on the effectiveness of the entity’s internal control. An audit also includes evaluating the appropriateness of accounting policies used and the reasonableness of accounting estimates made by management, as well as evaluating the overall presentation of the financial statements.
We believe that the audit evidence we have obtained is sufficient and appropriate to provide a basis for our audit opinion.
135
Opinion with respect to the consolidated financial statements
In our opinion, the consolidated financial statements give a true and fair view of the financial position of ARCADIS NV at December 31, 2007, and of its result and its cash flow for the year then ended in accordance with International Financial Reporting Standards as adopted by the European Union and with Part 9 of Book 2 of the Netherlands Civil Code.
Opinion with respect to the company financial statements
In our opinion, the company financial statements give a true and fair view of the financial position of ARCADIS NV at December 31, 2007, and of its result for the year then ended in accordance with Part 9 of Book 2 of the Netherlands Civil Code.
Report on other legal and regulatory requirements
Pursuant to the legal requirement under 2:393 sub 5 part e of the Netherlands Civil Code, we report, to the extent of our competence, that the management board report is consistent with the financial statements as required by 2:391 sub 4 of the Netherlands Civil Code.
Amstelveen, February 29, 2008 |
|
KPMG ACCOUNTANTS N.V. |
|
F.A.C.M. van Kasteren RA |
|
136
Ten-year summary
These figures are derived from the published financial statements of the years concerned.
Consolidated balance sheet |
| 2007 |
| 2006 |
| 2005 |
| 2004 |
| 2003 |
| 2002 |
| 2001 |
| 2002 |
| 1999 |
| 1998 |
|
Intangible assets |
| 227.5 |
| 154.2 |
| 127.9 |
| 55.4 |
| 41.4 |
| 12.7 |
| 7.6 |
| 7.1 |
| 6.4 |
| 4.9 |
|
Tangible assets |
| 63.9 |
| 55.0 |
| 56.0 |
| 43.6 |
| 44.9 |
| 41.2 |
| 37.8 |
| 40.6 |
| 46.3 |
| 44.5 |
|
Investments in non-consolidated companies |
| 17.9 |
| 5.2 |
| 7.5 |
| 5.6 |
| — |
| — |
| — |
| — |
| — |
| — |
|
Other non-current assets |
| 9.5 |
| 12.0 |
| 12.6 |
| 8.1 |
| 12.4 |
| 9.6 |
| 6.4 |
| 10.5 |
| 10.4 |
| 7.7 |
|
Deferred tax assets |
| 14.1 |
| 8.3 |
| 13.2 |
| 9.7 |
| — |
| — |
| — |
| — |
| — |
| — |
|
Total non-current assets |
| 332.9 |
| 234.7 |
| 217.1 |
| 122.4 |
| 98.7 |
| 63.4 |
| 51.8 |
| 58.2 |
| 63.1 |
| 57.1 |
|
Inventories |
| 0.7 |
| 0.5 |
| 0.4 |
| 0.5 |
| 15.2 |
| 21.5 |
| 27.5 |
| 30.2 |
| 44.6 |
| 33.2 |
|
Derivatives |
| — |
| — |
| 1.7 |
| — |
| — |
| — |
| — |
| — |
| — |
| — |
|
(Un)billed Receivables |
| 492.3 |
| 397.3 |
| 353.0 |
| 271.3 |
| 202.1 |
| 205.7 |
| 187.0 |
| 192.1 |
| 176.6 |
| 152.8 |
|
Corporate tax receivable |
| 3.2 |
| 2.6 |
| 4.0 |
| — |
| — |
| — |
| — |
| — |
| — |
| — |
|
Cash and cash equivalents |
| 92.6 |
| 101.5 |
| 73.9 |
| 48.2 |
| 31.3 |
| 53.2 |
| 43.7 |
| 18.3 |
| 12.0 |
| 10.0 |
|
Total current assets |
| 588.8 |
| 501.8 |
| 433.0 |
| 320.0 |
| 248.6 |
| 280.4 |
| 258.2 |
| 240.6 |
| 233.2 |
| 196.0 |
|
Total assets |
| 921.7 |
| 736.5 |
| 650.1 |
| 442.3 |
| 347.3 |
| 343.8 |
| 310.0 |
| 298.8 |
| 296.3 |
| 253.1 |
|
Share capital |
| 1.0 |
| 1.0 |
| 1.0 |
| 1.0 |
| 1.0 |
| 1.0 |
| 1.0 |
| 1.0 |
| 1.0 |
| 0.4 |
|
Additional paid-in capital |
| 44.2 |
| 44.2 |
| 44.2 |
| 37.6 |
| 36.0 |
| 35.1 |
| 34.9 |
| 34.9 |
| 27.4 |
| 27.8 |
|
Revaluation reserve real estate |
| — |
| — |
| — |
| — |
| — |
| — |
| — |
| 0.1 |
| 0.1 |
| 0.4 |
|
Reserve exchange rate differences |
| (29.8 | ) | (7.7 | ) | 6.4 |
| (3.6 | ) | — |
| — |
| — |
| — |
| — |
| — |
|
Retained Earnings |
| 117.4 |
| 106.4 |
| 91.2 |
| 79.2 |
| 99.5 |
| 98.6 |
| 97.8 |
| 79.2 |
| 71.9 |
| 58.7 |
|
Net income |
| 54.9 |
| 44.9 |
| 33.4 |
| 22.2 |
| — |
| — |
| — |
| — |
| — |
| — |
|
Total shareholders’ equity |
| 187.7 |
| 188.9 |
| 176.2 |
| 136.4 |
| 136.5 |
| 134.7 |
| 133.7 |
| 115.2 |
| 100.4 |
| 87.3 |
|
Minority interest |
| 11.5 |
| 11.8 |
| 11.9 |
| 9.0 |
| 7.6 |
| 7.1 |
| 6.1 |
| 4.4 |
| 3.3 |
| 5.6 |
|
Total group equity |
| 199.2 |
| 200.7 |
| 188.1 |
| 145.4 |
| 144.1 |
| 141.8 |
| 139.8 |
| 119.6 |
| 103.7 |
| 92.9 |
|
Provisions |
| 28.7 |
| 19.9 |
| 15.8 |
| 27.4 |
| 20.0 |
| 13.5 |
| 13.1 |
| 14.4 |
| 16.4 |
| 16.9 |
|
Deferred tax liabilities |
| 14.7 |
| 20.4 |
| 26.3 |
| 12.1 |
| — |
| — |
| — |
| — |
| — |
| — |
|
Long-term debts |
| 165.1 |
| 119.3 |
| 116.1 |
| 13.0 |
| 29.7 |
| 27.6 |
| 22.0 |
| 23.1 |
| 5.7 |
| 6.4 |
|
Derivatives |
| 21.2 |
| 5.8 |
| — |
| — |
| — |
| — |
| — |
| — |
| — |
|
|
|
Total non-current liabilities |
| 229.7 |
| 165.5 |
| 158.2 |
| 52.5 |
| 49.7 |
| 41.1 |
| 35.1 |
| 37.5 |
| 22.1 |
| 23.3 |
|
Billing in excess of cost |
| 142.9 |
| 111.9 |
| 89.3 |
| 40.3 |
| — |
| — |
| — |
| — |
| — |
| — |
|
Corporate tax payable |
| 17.2 |
| 1.9 |
| 8.2 |
| 9.9 |
| — |
| — |
| — |
| — |
| — |
| — |
|
Trade and other liabilities |
| 332.7 |
| 256.5 |
| 206.4 |
| 194.3 |
| 153.5 |
| 160.9 |
| 135.1 |
| 141.7 |
| 170.5 |
| 136.9 |
|
Total current liabilities |
| 492.8 |
| 370.3 |
| 303.8 |
| 244.5 |
| 153.5 |
| 160.9 |
| 135.1 |
| 141.7 |
| 170.5 |
| 136.9 |
|
Total equity and liabilities |
| 921.7 |
| 736.5 |
| 650.1 |
| 442.3 |
| 347.3 |
| 343.8 |
| 310.0 |
| 298.8 |
| 296.3 |
| 253.1 |
|
Total equity as % of balance sheet total |
| 22 |
| 27 |
| 29 |
| 33 |
| 41 |
| 41 |
| 45 |
| 40 |
| 35 |
| 37 |
|
Interest coverage ratio |
| 14 |
| 17 |
| 17 |
| 10 |
| 13 |
| 19 |
| 15 |
| 11 |
| 12 |
| 9 |
|
Net Debt/EBITDA ratio |
| 1.0 |
| 0.4 |
| 0.6 |
| (0.1 | ) | 0.7 |
| 0.7 |
| 0.6 |
| 0.7 |
| 1.3 |
| 1.2 |
|
|
|
|
|
|
|
|
|
|
|
|
|
|
|
|
|
|
|
|
|
|
|
Acquisitions |
| 98.0 |
| 53.8 |
| 80.9 |
| 17.3 |
| 46.1 |
| 16.2 |
| 5.6 |
| 7.3 |
| 13.3 |
| 6.5 |
|
Investments |
| 33.3 |
| 19.3 |
| 17.7 |
| 12.5 |
| 18.2 |
| 14.2 |
| 15.3 |
| 17.2 |
| 18.2 |
| 20.3 |
|
Depreciation |
| 20.4 |
| 17.7 |
| 15.2 |
| 15.7 |
| 16.1 |
| 15.9 |
| 15.4 |
| 17.9 |
| 16.2 |
| 13.8 |
|
Cash flow (net income + amortization and depreciation) |
| 87.5 |
| 70.9 |
| 54.6 |
| 38.3 |
| 38.6 |
| 40.8 |
| 40.6 |
| 38.7 |
| 33.7 |
| 27.5 |
|
Net cash provided by operating activities |
| 78.9 |
| 86.4 |
| 66.8 |
| 44.8 |
| 59.1 |
| 45.8 |
| 49.7 |
| 49.7 |
| 23.9 |
| 24.6 |
|
|
|
|
|
|
|
|
|
|
|
|
|
|
|
|
|
|
|
|
|
|
|
Average number of employees (in thousands) |
| 11,304 |
| 9,685 |
| 9,208 |
| 9,419 |
| 8,827 |
| 8,020 |
| 7,619 |
| 7,657 |
| 7,217 |
| 6,635 |
|
Total shares issued (x 1,000) |
| 20,646 |
| 20,646 |
| 20,646 |
| 20,646 |
| 20,431 |
| 20,297 |
| 20,285 |
| 20,275 |
| 19,769 |
| 19,256 |
|
Maximum increase from exercising options |
| 1,706 |
| 1,270 |
| 1,437 |
| 1,267 |
| 1,561 |
| 1,134 |
| 692 |
| 719 |
| 718 |
| 853 |
|
The 2003 and prior financial data are not adjusted to comply with the International Financial Reporting Standards (IFRS).
These figures are derived from the published financial statements of the years concerned.
Amounts in millions of euros unless otherwise stated
137
Consolidated statement of income |
| 2007 |
| 2006 |
| 2005 |
| 2004 |
| 2003 |
| 2002 |
| 2001 |
| 2000 |
| 1999 |
| 1998 |
|
Net sales |
| 1,497.5 |
| 1,235.5 |
| 999.7 |
| 894.4 |
| 848.5 |
| 817.1 |
| 806.2 |
| 798.2 |
| 656.4 |
| 571.1 |
|
Gain on sale of investments |
| — |
| — |
| 2.9 |
| 6.5 |
| — |
| — |
| — |
| — |
| — |
| — |
|
Change in work in progress |
| 12.7 |
| (2.4 | ) | (1.5 | ) | (0.1 | ) | (7.8 | ) | 2.0 |
| (8.8 | ) | (22.0 | ) | (0.9 | ) | 7.5 |
|
Gross revenue |
| 1,510.2 |
| 1,233.0 |
| 1,001.1 |
| 900.8 |
| 840.6 |
| 819.1 |
| 797.4 |
| 776.2 |
| 655.5 |
| 578.6 |
|
Materials, services of third parties and subcontractors |
| (505.8 | ) | (395.6 | ) | (297.8 | ) | (268.2 | ) | (245.2 | ) | (241.4 | ) | (233.9 | ) | (225.3 | ) | (195.7 | ) | (167.8 | ) |
Net revenue |
| 1,004.5 |
| 837.5 |
| 703.3 |
| 632.5 |
| 595.4 |
| 577.8 |
| 563.5 |
| 550.9 |
| 459.8 |
| 410.8 |
|
Personnel costs |
| (693.3 | ) | (581.3 | ) | (484.5 | ) | (448.7 | ) | (428.8 | ) | (413.4 | ) | (404.4 | ) | (397.4 | ) | (329.1 | ) | (288.0 | ) |
Other business costs |
| (185.2 | ) | (159.6 | ) | (143.2 | ) | (132.3 | ) | (114.5 | ) | (105.5 | ) | (104.8 | ) | (100.4 | ) | (86.7 | ) | (81.8 | ) |
Depreciation |
| (20.4 | ) | (17.7 | ) | (15.2 | ) | (15.7 | ) | (16.1 | ) | (15.9 | ) | (15.4 | ) | (17.9 | ) | (16.2 | ) | (13.8 | ) |
Other income |
| 1.6 |
| — |
| — |
| — |
| — |
| — |
| — |
| — |
| — |
| — |
|
EBITA |
| 107.2 |
| 78.8 |
| 60.4 |
| 35.9 |
| 36.0 |
| 42.9 |
| 38.9 |
| 35.2 |
| 27.8 |
| 27.2 |
|
Amortization goodwill and identifiable intangible assets |
| (12.2 | ) | (8.3 | ) | (6.0 | ) | (0.4 | ) | (1.2 | ) | (0.2 | ) | (0.1 | ) | — |
| — |
| — |
|
Operating income |
| 95.0 |
| 70.5 |
| 54.4 |
| 35.5 |
| 34.9 |
| 42.7 |
| 38.8 |
| 35.2 |
| 27.8 |
| 27.2 |
|
Operational margin% |
| 9.5 |
| 8.4 |
| 7.7 |
| 5.6 |
| 5.9 |
| 7.4 |
| 6.9 |
| 6.4 |
| 6.1 |
| 6.6 |
|
Financial items |
| (8.6 | ) | (3.5 | ) | (1.8 | ) | (3.5 | ) | (2.8 | ) | (2.2 | ) | (2.7 | ) | (3.3 | ) | (2.3 | ) | (2.9 | ) |
Income from associates |
| (0.8 | ) | (0.5 | ) | 1.4 |
| 2.4 |
| 2.6 |
| 0.7 |
| 0.5 |
| 0.8 |
| 1.4 |
| 0.2 |
|
Income before taxes |
| 85.5 |
| 66.5 |
| 53.9 |
| 34.5 |
| 34.6 |
| 41.2 |
| 36.6 |
| 32.7 |
| 26.9 |
| 24.5 |
|
|
|
|
|
|
|
|
|
|
|
|
|
|
|
|
|
|
|
|
|
|
|
Taxes |
| (28.0 | ) | (20.1 | ) | (17.3 | ) | (10.4 | ) | (11.7 | ) | (14.4 | ) | (12.5 | ) | (11.2 | ) | (8.5 | ) | (7.8 | ) |
Income after taxes |
| 57.5 |
| 46.4 |
| 36.6 |
| 24.1 |
| 22.9 |
| 26.7 |
| 24.1 |
| 21.5 |
| 18.4 |
| 16.7 |
|
Extraordinary items after taxes |
| — |
| — |
| — |
| — |
| — |
| — |
| 2.0 |
| — |
| — |
| (1.8 | ) |
Income after taxes |
| 57.5 |
| 46.4 |
| 36.6 |
| 24.1 |
| 22.9 |
| 26.7 |
| 26.1 |
| 21.5 |
| 18.4 |
| 14.9 |
|
Attributable to: |
|
|
|
|
|
|
|
|
|
|
|
|
|
|
|
|
|
|
|
|
|
Net income (Equity holders of the parent) |
| 54.9 |
| 44.9 |
| 33.4 |
| 22.2 |
| 21.4 |
| 24.7 |
| 25.1 |
| 20.7 |
| 17.6 |
| 13.7 |
|
Minority interest |
| 2.6 |
| 1.5 |
| 3.2 |
| 1.9 |
| 1.5 |
| 2.1 |
| 1.0 |
| 0.8 |
| 0.8 |
| 1.2 |
|
Net income from operations |
| 62.3 |
| 50.0 |
| 33.4 |
| 23.8 |
| 22.5 |
| 24.9 |
| 23.2 |
| 20.7 |
| 17.6 |
| 15.5 |
|
EBITA as % of net sales |
| 10.7 |
| 9.4 |
| 8.6 |
| 5.7 |
| 6.0 |
| 7.4 |
| 6.9 |
| 6.4 |
| 6.0 |
| 6.6 |
|
Return on equity% |
| 29.2 |
| 24.6 |
| 21.4 |
| 16.3 |
| 15.8 |
| 18.4 |
| 20.2 |
| 19.2 |
| 18.8 |
| 16.3 |
|
Return on assets% |
| 10.3 |
| 9.6 |
| 9.9 |
| 8.7 |
| 10.0 |
| 12.6 |
| 12.0 |
| 11.0 |
| 9.8 |
| 9.8 |
|
Dividend proposal |
| 24.8 |
| 20.3 |
| 13.4 |
| 9.9 |
| 9.8 |
| 9.7 |
| 8.9 |
| 7.9 |
| 6.5 |
| 5.8 |
|
Data per share (in euros, unless otherwise stated) |
|
|
|
|
|
|
|
|
|
|
|
|
|
|
|
|
|
|
|
|
|
Earnings per share from operations |
| 3.06 |
| 2.47 |
| 1.65 |
| 1.18 |
| 1.13 |
| 1.23 |
| 1.14 |
| 1.04 |
| 0.90 |
| 0.81 |
|
Net earnings per share |
| 2.70 |
| 2.22 |
| 1.65 |
| 1.10 |
| 1.07 |
| 1.23 |
| 1.24 |
| 1.04 |
| 0.90 |
| 0.72 |
|
Dividend proposal |
| 1.23 |
| 1.00 |
| 0.66 |
| 0.48 |
| 0.48 |
| 0.48 |
| 0.44 |
| 0.39 |
| 0.33 |
| 0.30 |
|
Shareholders’ equity |
| 9.09 |
| 9.15 |
| 8.53 |
| 6.61 |
| 6.68 |
| 6.64 |
| 6.59 |
| 5.68 |
| 5.08 |
| 4.53 |
|
Closing price Amsterdam Euronext |
| 47.30 |
| 46.70 |
| 26.80 |
| 13.70 |
| 9.34 |
| 7.94 |
| 9.35 |
| 8.55 |
| 7.85 |
| 6.67 |
|
Closing price NASDAQ in $ |
| 68.150 |
| 61.160 |
| 31.600 |
| 18.418 |
| 11.800 |
| 8.380 |
| 8.390 |
| 7.625 |
| 6.825 |
| 7.750 |
|
Amounts in millions of euros unless otherwise stated
138
Other financial data
Net revenue = 100% |
|
|
|
|
|
|
|
|
|
|
|
Consolidated statement of income in % |
| 2007 |
| 2006 |
|
Gross revenue |
| 150.4 |
| 147.2 |
|
Materials, services of third parties, and subcontractors |
| (50.4 | ) | (47.2 | ) |
Net revenue |
| 100.0 |
| 100.0 |
|
Operational cost |
| (87.5 | ) | (88.5 | ) |
Depreciation |
| (2.0 | ) | (2.1 | ) |
Amortization identifiable intangible assets |
| (1.2 | ) | (1.0 | ) |
Other income |
| (0.2 | ) | — |
|
|
|
|
|
|
|
Operating income |
| 9.5 |
| 8.4 |
|
Financial items |
| (0.9 | ) | (0.4 | ) |
|
|
|
|
|
|
Income before taxes |
| 8.6 |
| 8.0 |
|
Taxes |
| (2.8 | ) | (2.4 | ) |
|
|
|
|
|
|
Income of consolidated companies after taxes |
| 5.8 |
| 5.6 |
|
Income of equity-accounted associates and cost-accounted associates |
| (0.1 | ) | (0.1 | ) |
|
|
|
|
|
|
Group income after taxes |
| 5.7 |
| 5.5 |
|
|
|
|
|
|
|
Attributable to: |
|
|
|
|
|
Income for the period (equity holders of the parent) |
| 5.4 |
| 5.3 |
|
Minority interest |
| 0.3 |
| 0.2 |
|
|
|
|
|
|
|
Net income from operations |
| 6.2 |
| 6.0 |
|
|
|
|
|
|
|
EBITA margin recurring |
| 10.5 |
| 9.4 |
|
|
| 2007 |
| 2006 |
| ||||||||||||
Quarterly financial data |
| Quarter 1 |
| Quarter 2 |
| Quarter 3 |
| Quarter 4 |
| Quarter 1 |
| Quarter 2 |
| Quarter 3 |
| Quarter 4 |
|
Gross Revenue |
|
|
|
|
|
|
|
|
|
|
|
|
|
|
|
|
|
Quarterly |
| 332,137 |
| 347,984 |
| 407,825 |
| 422,292 |
| 287,273 |
| 293,316 |
| 310,912 |
| 341,542 |
|
Cumulative |
| 332,137 |
| 680,121 |
| 1,087,946 |
| 1,510,238 |
| 287,273 |
| 580,589 |
| 891,501 |
| 1,233,043 |
|
Quarterly (%) |
| 22.0 |
| 23.0 |
| 27.0 |
| 28.0 |
| 23.3 |
| 23.8 |
| 25.2 |
| 27.7 |
|
Cumulative (%) |
| 22.0 |
| 45.0 |
| 72.0 |
| 100.0 |
| 23.3 |
| 47.1 |
| 72.3 |
| 100.0 |
|
|
|
|
|
|
|
|
|
|
|
|
|
|
|
|
|
|
|
Net income from operations |
|
|
|
|
|
|
|
|
|
|
|
|
| ||||
Quarterly |
| 12,759 |
| 14,061 |
| 16,313 |
| 19,160 |
| 9,421 |
| 11,826 |
| 12,253 |
| 16,535 |
|
Cumulative |
| 12,759 |
| 26,820 |
| 43,133 |
| 62,293 |
| 9,421 |
| 21,247 |
| 33,500 |
| 50,035 |
|
Quarterly (%) |
| 20.5 |
| 22.6 |
| 26.2 |
| 30.7 |
| 18.8 |
| 23.7 |
| 24.5 |
| 33.0 |
|
Cumulative (%) |
| 20.5 |
| 43.1 |
| 69.3 |
| 100.0 |
| 18.8 |
| 42.5 |
| 67.0 |
| 100.0 |
|
|
|
|
|
|
|
|
|
|
|
|
|
|
|
|
|
|
|
Net income from operations per share (in euros) |
|
|
|
|
|
|
|
|
|
|
| ||||||
Quarterly |
| 0.63 |
| 0.69 |
| 0.80 |
| 0.94 |
| 0.47 |
| 0.58 |
| 0.61 |
| 0.81 |
|
Cumulative |
| 0.63 |
| 1.32 |
| 2.12 |
| 3.06 |
| 0.47 |
| 1.05 |
| 1.65 |
| 2.47 |
|
Amounts in millions of euros unless otherwise stated
139
Head office |
| France |
| United Kingdom |
|
| ARCADIS ESG |
| ARCADIS G&M International Ltd. |
ARCADIS NV |
| 9 Avenue Réaumur |
| Craven Court |
Nieuwe Stationsstraat 10 |
| 92354 Le Plessis Robinson Cedex |
| Willie Snaith Road |
6811 KS Arnhem |
| France |
| Newmarket |
P.O. Box 33 |
| Phone +33 1 46012468 |
| Suffolk CB8 7FA |
6800 LE Arnhem |
| Fax +33 1 46013585 |
| United Kingdom |
The Netherlands |
| Managing Directors |
| Phone +44 1638 674767 |
Phone +31 26 3778911 |
| Yann Leblais, Civ. Ing. (CEO) |
| Fax +44 1638 668191 |
Fax +31 26 3515235 |
| Jean-Claude Popelard, Civ. Ing. |
| Managing Director |
|
|
|
| Dr. Brian Crook |
Principal offices |
| Germany |
|
|
|
| ARCADIS Deutschland GmbH |
| AYH plc |
Belgium |
| Europaplatz 3 |
| 10 Furnival Street |
ARCADIS Belgium |
| 64293 Darmstadt |
| London EC4A 1YH |
Clara Snellingsstraat 27 |
| P.O. Box 100331 |
| United Kingdom |
2100 Antwerpen |
| 64203 Darmstadt |
| Phone +44 20 72161000 |
Belgium |
| Germany |
| Fax +44 20 72161001 |
Phone +32 3 3608300 |
| Phone +49 6151 3880 |
| Managing Director |
Fax +32 3 3608301 |
| Fax +49 6151 388992 |
| Peter Vince |
CEO |
| Managing Directors |
|
|
Marc van Put |
| Ir. Hans van Dord (a.i.) |
| United States |
|
| Adam Mahr |
| ARCADIS U.S., Inc. |
Brazil |
|
|
| 630 Plaza Drive |
ARCADIS Logos Ltda. |
| The Netherlands |
| Suite 200 |
Rua Líbero Badaró, 377 - 6º andar |
| ARCADIS Nederland BV |
| Highlands Ranch |
CEP 01009-906, São Paulo |
| Piet Mondriaanlaan 26 |
| Colorado 80129 |
Brazil |
| 3812 GV Amersfoort |
| United States |
Phone +55 11 3117 3171 |
| P.O. Box 220 |
| Phone +1 720 344 3500 |
Fax +55 11 3105 7351 |
| 3800 AE Amersfoort |
| Fax +1 720 344 3535 |
CEO |
| The Netherlands |
| CEO |
Eng. Antonio João Oliveira Rocha |
| Phone +31 33 4771000 |
| Steve Blake, PE, PG |
|
| Fax +31 33 4772000 |
|
|
Chile |
| CEO |
| LFR Inc. |
ARCADIS Geotécnica SA |
| Drs. ing. Douwe Kras |
| 1900 Powell Street |
Av. Eliodoro Yáñez 1893 |
|
|
| 12th Floor |
Providencia, Santiago |
| PRC BV |
| Emeryville CA 94608 |
Chile |
| Goudseweg 181 |
| United States |
Phone +56 2 3816000 |
| 2411 HK Bodegraven |
| Phone +1 510 652 4500 |
Fax +56 2 3816001 |
| P.O. Box 1051 |
| Fax +1 510 652 2246 |
CEO |
| 2410 CB Bodegraven |
| CEO |
Hernán Bezamat Cuadra, Civ. Eng., DPA |
| The Netherlands |
| Frank Lorincz |
|
| Phone +31 172 631414 |
|
|
China |
| Fax +31 172 611902 |
| PinnacleOne Inc. |
ARCADIS Asia |
| Managing Director |
| 950 West Elliot Road |
Zhongrong Plaza, Unit 1203 |
| Ir. Leo van der Kemp |
| Suite 220 |
1088 South Pu Dong Road, Pudong New Area |
|
|
| Tempe, Arizona 85284 |
Shanghai, China 200122 |
| Poland |
| United States |
Phone +86 21 587 61 451 |
| ARCADIS Polska Sp. z o.o. |
| Phone +1 480 296 7540 |
Fax +86 21 587 82 738 |
| ul. Pulawska 182 |
| Fax + 1 480 296 7541 |
Managing Director |
| 02-670 Warsaw |
| Toll Free +1 800 229 9050 |
Theo Tombeur |
| Poland |
| President |
|
| Phone +48 22 203 2000 |
| Charles Dahill |
Czech Republic |
| Fax +48 22 203 2001 |
|
|
ARCADIS CZ, a.s. |
| CEO |
| RTKL Inc. |
Na Strži 1702/65 |
| Marek Adamek, MSc |
| 901 South Bond Street |
140 62 Praha 4 |
|
|
| Baltimore, MD 21231 |
Czech Republic |
| Romania |
| United States |
Phone + 42 296 330 111 |
| ARCADIS Eurométudes |
| Phone +1 410 537 6000 |
Fax + 42 224 236 313 |
| Calea Grivitei nr. 136 |
| Fax +1 410 276 2136 |
Managing Director |
| Corp B, etaj 2 |
| Chairman |
Václav Hořejší |
| Sector 1 Bucharest |
| Paul Jabob III, AIA |
|
| Romania |
| CEO, President |
|
| Phone +40 21 31 22699 |
| David Hudson, AIA |
|
| Fax +40 21 31 22697 |
|
|
|
| Managing Director |
|
|
|
| Nicolae Micu |
|
|
140
Geographical distribution
A. The Netherlands |
Gross revenue: € 374 million |
Percentage of total gross revenue: 25% |
EBITA: € 26.2 million |
Of total EBITA: 25% |
|
B. Europe excl. the Netherlands |
Gross revenue: € 342 million |
Percentage of total gross revenue: 23% |
EBITA: € 22.6 million |
Of total EBITA: 21% |
C. United States |
Gross revenue: € 657 million |
Percentage of total gross revenue: 43% |
EBITA: € 44.6 million |
Of total EBITA: 42% |
|
D. Rest of world |
Gross revenue: € 138 million |
Percentage of total gross revenue: 9% |
EBITA: € 12.5 million |
Of total EBITA: 12% |
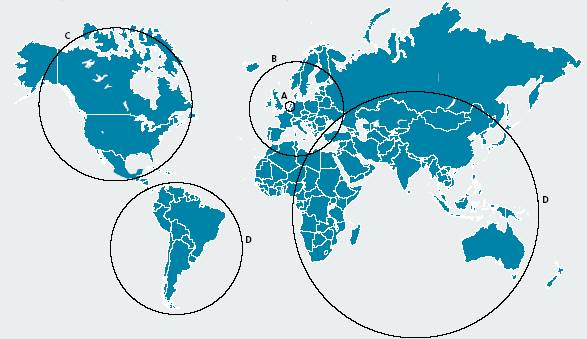
Organization structure ARCADIS NV
The Netherlands |
|
ARCADIS Nederland |
PRC |
Europe excl. the Netherlands |
|
Belgium |
ARCADIS Belgium |
|
Czech Republic |
ARCADIS CZ |
|
France |
ARCADIS FCI |
|
Germany |
ARCADIS Deutschland |
|
Poland |
ARCADIS Polska |
|
Romania |
ARCADIS Eurométudes |
|
Spain |
RTKL |
|
United Kingdom |
ARCADIS G&M International |
|
AYH |
|
RTKL |
|
APS |
|
Vectra |
United States |
|
ARCADIS US |
|
PinnacleOne |
|
RTKL |
|
LFR |
Rest of world |
|
Brazil |
ARCADIS Logos |
|
Chile |
ARCADIS Geotécnica |
|
China |
ARCADIS Asia |
|
RTKL |
|
Japan |
RTKL |
141
Publication:
ARCADIS NV, March 2008
Editing:
Karen Bernhard
Design and layout:
Interbrand Zintzmeyer & Lux B.V., Amsterdam,
The Netherlands
RTKL Inc., Baltimore, Maryland, United States
Typesetting and DTP:
Océ Business Services, Arnhem,
The Netherlands
Photography:
Reinier Gerritsen, Amsterdam, The Netherlands
John Voermans, Arnhem, The Netherlands
Cover photo: Fu Xing, Beijing, China
(www.fuxing-photo.com.cn)
Lithography and printing:
Hollandia Printing, Heerhugowaard,
The Netherlands
Edition:
4700 copies
This Annual Report is printed on:
150 grs Eurobulk
142

143