Exhibit 99.2
| Imagine the result |

Shape the future. Push boundaries. Develop.
A global network of business professionals creating benefits for communities and companies everywhere.
We drive progress by making complexity simple.
We give life to ideas.
Your success is our commitment.
Imagine the result.
ARCADIS NV
Nieuwe Stationsstraat 10, 6811 KS Arnhem, The Netherlands
P.O. Box 33, 6800 LE Arnhem, The Netherlands
Tel +31 26 3778911
Fax +31 26 4438381
E-mail ir@arcadis.nl
Internet www.arcadis-global.com
Chamber of Commerce Arnhem, The Netherlands Trade registry no. 09051284
BTW: NL 0062.93.700.B.01
For other company addresses see page 136 of this report.
Table of contents
2 |
| Highlights 2006 |
3 |
| Selected financial data |
4 |
| The ARCADIS share |
7 |
| Position in the market |
8 |
| Mission and Profile |
9 |
| Brief overview of Company activities |
10 |
| Introduction |
14 |
| Report by the Executive Board |
14 |
| Vision and strategy |
24 |
| Results and financing |
32 |
| Developments by service area |
32 |
| · Infrastructure |
36 |
| · Environment |
40 |
| · Facilities |
44 |
| Developments by region |
44 |
| · The Netherlands |
45 |
| · Europe excluding the Netherlands |
46 |
| · United States |
47 |
| · Rest of world |
48 |
| Human Resources Management |
50 |
| Risk management |
52 |
| Sustainable business conduct |
57 |
| Outlook 2007 |
60 |
| Report by the Supervisory Board |
65 |
| Supervisory Board |
66 |
| Executive Board, Staff Directors and Senior Management Committee |
70 |
| Remuneration Report |
78 |
| Corporate Governance |
85 |
| Financial Statements 2006 |
86 |
| Consolidated balance sheet |
87 |
| Consolidated statement of income |
88 |
| Consolidated cash flow statement |
89 |
| Consolidated statement of changes in equity |
90 |
| Valuation principles |
97 |
| Notes to the consolidated financial statements |
98 |
| Notes to the consolidated balance sheet |
116 |
| Notes to the consolidated statement of income |
122 |
| Company balance sheet |
123 |
| Company statement of income |
123 |
| Notes to the Company balance sheet |
128 |
| Notes to the Company statement of income |
131 |
| Other information |
132 |
| Auditor’s report |
133 |
| Other financial data |
134 |
| Ten-year summary |
136 |
| Company addresses |
137 |
| Geographical spread / Organization structure |
139 |
| Glossary |
This is a true and correct translation of the Dutch Annual Report 2006 of ARCADIS NV. If different interpretations regarding the contents arise, the Dutch version will prevail.
Safe Harbor Provision
Except for the historical information contained herein, the statements in this report are forward-looking statements that are made pursuant to the safe harbor provisions of the Private Securities Litigation Reform Act of 1995. Forward-looking statements involve known and unknown risks and uncertainties that may cause the Company’s actual results in future periods to differ materially from forecasted results. Those risks include, among others, risks associated with possible changes in environmental legislation, changes in investment flow for infrastructure, changes in the investment climate for buildings, and more generally, risks related to the Company’s ability to acquire and execute projects. These and other risks are described in this annual report on page 50 and in ARCADIS’ filings with the Securities and Exchange Commission (SEC) over the last 12 months, copies of which are available from the SEC, upon request from the Company, or on the Company’s website.
1
Highlights 2006
Highlights 2006
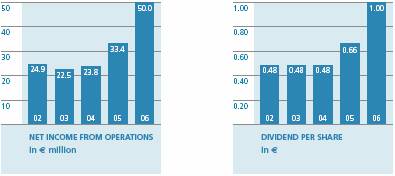
Net income from operations _50% higher (before amortization and non-recurring items)
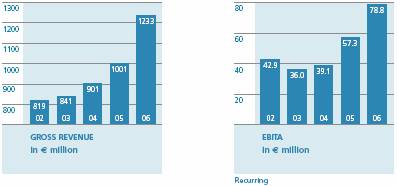
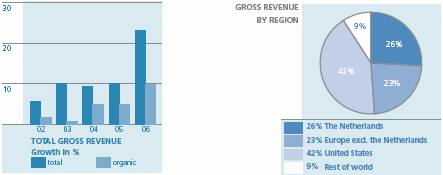
Gross revenue_rose 23% to € 1.2 billion
Organic growth_at 10%, double our goal
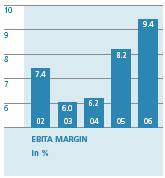
Margin improves further_to 9.4%, taking us an important step closer to our new goal of 10%
Solid contribution from acquisitions_BBL and AYH acquired in 2005 contribute strongly to profit increase
Environment main growth market_with a growth of 50%, of which 8% was organic, mainly from the United States
Infrastructure organic growth to 9%_the result of market recovery in the Netherlands and continued growth in the United States and Brazil
New initiative in facilities_the launch of ARCADIS’ Worldwide Project Consulting, aimed at international real estate investors
Dutch market shows strong recovery_which, combined with earlier restructurings, leads to strong profit improvement
Integration of BBL is progressing well_cooperation is yielding more synergy than expected
Six new acquisitions_add over € 50 million in revenue and strengthen our portfolio and position in home markets
Control framework for financial reporting improved_related to the American Sarbanes-Oxley Act.
2
Selected financial data
Selected financial data
Revenue |
| 2006 |
| 2005 |
| 2004 |
| 2003 |
| 2002 |
|
Gross revenue |
| 1,233 |
| 1,001 |
| 901 |
| 841 |
| 819 |
|
Net revenue |
| 837 |
| 703 |
| 633 |
| 595 |
| 578 |
|
Operating results |
|
|
|
|
|
|
|
|
|
|
|
EBITA |
| 78.8 |
| 60.4 |
| 35.9 |
| 36.0 |
| 42.9 |
|
EBITA recurring |
| 78.8 |
| 57.3 |
| 39.1 |
| 36.0 |
| 42.9 |
|
Operating income |
| 70.5 |
| 54.4 |
| 35.5 |
| 34.9 |
| 42.7 |
|
Associates |
| (0.5 | ) | 1.4 |
| 2.4 |
| 2.6 |
| 0.7 |
|
Net income from operations(1) |
| 50.0 |
| 33.4 |
| 23.8 |
| 22.5 |
| 24.9 |
|
Net income |
| 44.9 |
| 33.4 |
| 22.2 |
| 21.4 |
| 24.7 |
|
Return on average invested capital |
| 20.3 | % | 20.6 | % | 17.2 | % | 15.9 | % | 18.8 | % |
Capital employed |
|
|
|
|
|
|
|
|
|
|
|
Balance sheet total |
| 736.5 |
| 650.1 |
| 442.3 |
| 347.3 |
| 343.8 |
|
Total long-term capital employed |
| 366.2 |
| 346.3 |
| 197.9 |
| 193.8 |
| 182.9 |
|
Total equity |
| 200.7 |
| 188.1 |
| 145.4 |
| 144.1 |
| 141.8 |
|
Total equity as % of balance sheet total |
| 27 | % | 29 | % | 33 | % | 41 | % | 41 | % |
Interest coverage ratio |
| 17 |
| 17 |
| 10 |
| 13 |
| 19 |
|
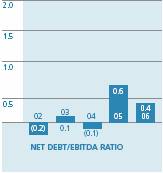
Net debt to EBITDA ratio |
| 0.4 |
| 0.6 |
| (0.1 | ) | 0.1 |
| (0.2 | ) |
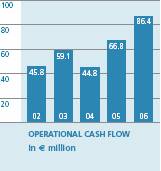
Net cash provided by operating activities |
| 86.4 |
| 66.8 |
| 44.8 |
| 59.1 |
| 45.8 |
|
|
|
|
|
|
|
|
|
|
|
|
|
Total shares outstanding at December 31 (in thousands) |
| 20,234 |
| 20,270 |
| 20,299 |
| 20,017 |
| 19,997 |
|
|
|
|
|
|
|
|
|
|
|
|
|
Data per share of € 0.05 (in euros) |
|
|
|
|
|
|
|
|
|
|
|
Net income from operations |
| 2.47 |
| 1.65 |
| 1.18 |
| 1.13 |
| 1.23 |
|
Net income |
| 2.22 |
| 1.65 |
| 1.10 |
| 1.07 |
| 1.23 |
|
Dividend proposal |
| 1.00 |
| 0.66 |
| 0.48 |
| 0.48 |
| 0.48 |
|
Shareholders’ equity |
| 9.34 |
| 8.53 |
| 6.61 |
| 6.68 |
| 6.64 |
|
Personnel(2) |
|
|
|
|
|
|
|
|
|
|
|
Average number of contract employees |
| 9,685 |
| 9,208 |
| 9,419 |
| 8,827 |
| 8,020 |
|
Average number of employees total |
| 10,728 |
| 10,043 |
| 9,972 |
| 9,203 |
| 8,362 |
|
Total number of employees at December 31 |
| 11,533 |
| 10,101 |
| 10,474 |
| 9,724 |
| 8,704 |
|
(1) Net income excluding amortization and non-recurring items
(2) The headcount includes the total number of employees of proportionally consolidated companies
Amounts in millions of euros unless otherwise stated
The 2003 and prior financial data are not adjusted to comply with the International Financial Reporting Standards (IFRS).
3
The ARCADIS share
The ARCADIS share
Stock exchange listings
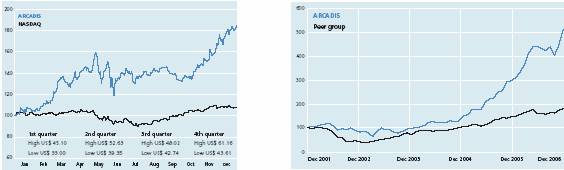
ARCADIS shares are listed on the Euronext Amsterdam under the symbol ARCAD and on the U.S. NASDAQ Stock Market currently under the symbol ARCAF (in 2007, the symbol will be changed to ARCA). On the Euronext Amsterdam exchange, two liquidity providers are active in the ARCADIS share: ABN AMRO Bank and Rabo Securities. Since 2006, the ARCADIS share has been part of the Amsterdam Small Cap Index (AScX) of Euronext.
An active Investor Relations policy
ARCADIS has an active investor relations (IR) policy aimed at keeping existing and potential shareholders – institutional as well as private – well informed about the strategy and recent developments in the Company. ARCADIS follows a quarterly reporting cycle for its financials and, in addition, informs the market through press releases on important developments and positioning project wins. Twice a year, at the presentation of the annual and semi-annual results, ARCADIS organizes a financial press conference and an analyst meeting, which are broadcast live over the internet. At the presentation of the first and third quarter results, a conference call is held for financial analysts, also accessible through a live audio webcast.
Recognition for financial communication
Investors (private as well as institutional), financial analysts and representatives of the financial media are positive about ARCADIS’ IR work according to a study conducted by the independent research firm Rematch. ARCADIS was chosen for the fifth consecutive time as the second best small-cap firm for delivering IR programs. The Company was also – for the second consecutive year – nominated for the prestigious Sijthoff award for financial reporting. The ARCADIS website was evaluated for this award by Jungle Rating. Of the fifty stock exchange-listed company websites evaluated, ARCADIS was the best small-cap firm, scoring higher than a considerable number of AEX index firms and all the mid-cap companies.
Historical development of the number of outstanding shares of ARCADIS
|
|
|
| Issuance |
|
|
|
|
|
|
|
|
|
|
|
|
| of new shares |
| Stock |
|
|
|
|
|
|
|
|
| At |
| related to |
| purchase |
|
|
|
|
| At |
|
|
| January 1 |
| options |
| plans |
| Repurchase |
| Reissuance |
| December 31 |
|
2002 |
| 20,284,441 |
| 7,993 |
| 4,240 |
| 300,000 |
| — |
| 19,996,674 |
|
2003 |
| 19,996,674 |
| 133,703 |
| — |
| 112,972 |
| — |
| 20,017,405 |
|
2004 |
| 20,017,405 |
| 215,238 |
| — |
| 11,900 |
| 78,000 |
| 20,298,743 |
|
2005 |
| 20,298,743 |
| — |
| — |
| 332,046 |
| 303,239 |
| 20,269,936 |
|
2006 |
| 20,269,936 |
| — |
| — |
| 494,838 |
| 529,890 |
| 20,304,988 |
|
4
Annual General Meeting of Shareholders
The Annual General Meeting of Shareholders is scheduled for May 16, 2007 at 2:00 p.m. and will be held at the Company headquarters in the Rijntoren building in Arnhem, the Netherlands. The agenda for this meeting will be available on April 16, 2007 upon request from the Company and/or can be found on the Company’s website.
Dividend
It is proposed that the 2006 cash dividend be € 1.00 per share, compared to € 0.66 for 2005. This equals more than 40% of net income from operations. ARCADIS’ dividend policy is to recommend payment of an annual dividend ranging from 30% to 40% of net income from operations.
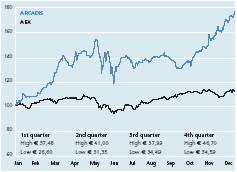
Share price development
On the first trading day of 2006, the share price on the Euronext was € 26.80, while the year closed at € 46.70, an increase of 74%. In 2006, the Dutch AEX index increased 13%.
In 2006, the ARCADIS share opened on the NASDAQ at a price of $31.600 and closed year-end 2006 at $61.160, an increase of 94%. On the NASDAQ, the index rose 10% in 2006.
Price per share on Euronext
In € |
| High |
| Low |
| Close |
|
2002 |
| 11.19 |
| 7.94 |
| 7.94 |
|
2003 |
| 10.50 |
| 6.41 |
| 9.34 |
|
2004 |
| 13.75 |
| 9.40 |
| 13.70 |
|
2005 |
| 27.18 |
| 13.08 |
| 26.80 |
|
2006 |
| 46.70 |
| 26.60 |
| 46.70 |
|
Price per share on NASDAQ
In US$ |
| High |
| Low |
| Close |
|
2002 |
| 10.350 |
| 8.000 |
| 8.380 |
|
2003 |
| 12.600 |
| 7.000 |
| 11.800 |
|
2004 |
| 18.700 |
| 11.650 |
| 18.418 |
|
2005 |
| 32.300 |
| 16.780 |
| 31.600 |
|
2006 |
| 61.160 |
| 33.000 |
| 61.160 |
|
Liquidity
The liquidity of ARCADIS shares saw a further improvement in 2006, making the share profile more attractive for institutional investors. The average daily trading volume on the Euronext in 2006 was 60,122 shares, almost double the volume of 31,395 shares per day in 2005. On the NASDAQ, liquidity in the average daily volume in ARCADIS shares in 2006 was 4,683, compared to an average 7,300 shares per day in 2005.
Data per share in €
|
| 2006 |
| 2005 |
| 2004 |
| 2003(2) |
| 2002(2) |
| 2001(2) |
|
Net income from operations |
| 2.47 |
| 1.65 |
| 1.18 |
| 1.13 |
| 1.23 |
| 1.14 |
|
Net income |
| 2.22 |
| 1.65 |
| 1.10 |
| 1.07 |
| 1.23 |
| 1.24 |
|
Dividend |
| 1.00 | (1) | 0.66 |
| 0.48 |
| 0.48 |
| 0.48 |
| 0.44 |
|
Shareholder’s equity |
| 9.34 |
| 8.53 |
| 6.61 |
| 6.68 |
| 6.64 |
| 6.59 |
|
(1) Proposed dividend
(2) Not adjusted for IFRS
5
Peer group
To benchmark its performance, ARCADIS has selected a group of peer companies. This group consists of international, public companies in the consulting and engineering business with activities and a size comparable to ARCADIS. This peer group includes the following companies:
Grontmij, Euronext Exchange; Atkins, London Stock Exchange; Pöyry, Helsinki Stock Exchange; TRC Companies, New York Stock Exchange; Tetra Tech, NASDAQ Stock Market; URS Corporation, New York Stock Exchange; Sweco, The Nordic Exchange; Alten, Euronext Paris; WSP, London Stock Exchange.
Ownership information
Under the Disclosure of Major Holdings in Listed Companies Act, we received the following notifications of the status of capital interest:
· Stichting Lovinklaan 20.2% (in the Company register year-end 2006)
· Vereniging KNHM 5.2% (in the Company register year-end 2006)
· Fortis NV 6.1% (situation end 2006)
· Delta Deelnemingen Fonds 5.3% (situation end 2006)
Financial calendar (tentative)
May 8, 2007_First quarter 2007, Conference call-live webcast
May 16, 2007_Annual General Meeting of Shareholders
May 18, 2007_Ex-dividend quotation
May 30, 2007_Dividend payment date
August 8, 2007_Second quarter 2007, Press conference (morning), Financial analyst meeting (afternoon)-both live webcast
November 15, 2007_Third quarter 2007, Conference call-live webcast
Contact information
For general information about ARCADIS, please visit our website. Or you may call or email Investor Relations:
Joost Slooten, phone: +31 26 377 8604; email: j.slooten@arcadis.nl
after business hours +31 6 27061880 (also press contact);
Evelien Hamelink, phone: +31 26 377 8337; email: e.a.hamelink@arcadis.nl
Registrar and common stock transfer agent
Euronext Amsterdam: ABN AMRO Bank, Amsterdam, the Netherlands
NASDAQ Stock Market: Bank of New York; New York, New York; United States
6
Position in the market
Top ten in the world
1 |
| URS |
| United States |
2 |
| Atkins |
| United Kingdom |
3 |
| AECOM |
| United States |
4 |
| Jacobs |
| United States |
5 |
| Fluor |
| United States |
6 |
| CH2M HILL |
| United States |
7 |
| Fugro |
| The Netherlands |
8 |
| ARCADIS |
| The Netherlands |
9 |
| Tetra Tech |
| United States |
10 |
| Parsons |
| United States |
Top three in Europe
1 |
| Atkins |
| United Kingdom |
2 |
| Fugro |
| The Netherlands |
3 |
| ARCADIS |
| The Netherlands |
Position in the market
Clients
ARCADIS works for a broad range of clients from the public and private sectors.
Infrastructure market: numerous government entities, such as municipalities, provinces, states, water boards, national governments or (privatized) managers of infrastructure such as railroad and road management administrations. Also includes work for utility companies, project developers, contractors or other companies and consortia in Public-Private Partnership projects.
Environmental market: primarily companies (oil and gas, chemical industry, transportation, etc.), many multinationals. Also includes work for governments at different levels, such as the U.S. Department of Defense.
Facilities market: primarily real estate owners, managers or operators of: companies, developers, banks, hotel operators, etc. and semi-public institutions such as hospitals and schools. Also includes work for governments as owners or regulators of real estate.
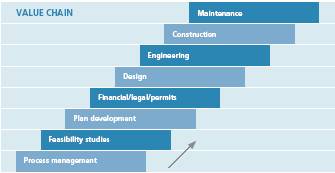
Active in the entire value chain
ARCADIS provides services in the entire value chain. Services include consultancy, engineering and management services based on the knowledge and experience of highly educated professionals. The focus lies in providing services with higher added value. The key is an early involvement in projects based on solid client relationships. In the contracting phase of projects, we perform construction management services. In turnkey projects, the execution is primarily outsourced to third parties. For the management and maintenance phase, we provide facility management services in which the execution is outsourced.
Competitive position
An important element of the markets in which we operate is the local character. To compete effectively with the many small and larger players in these markets, solid client relationships and a thorough knowledge of local conditions are essential. That is why ARCADIS strives to belong to the top five in local markets, and in the United States to the top ten. In most European countries where we are active and in Brazil and Chile, we have a top ten position. In the United States, we are currently in the top 20.
In larger projects and in sectors of the environmental and facilities markets, the competition is more international in nature. In the environmental market, ARCADIS is positioned in the global top three, and in environmental services for private-sector firms, we are number one. The number of companies that can deliver environmental services for multinationals is limited. ARCADIS has a similar advantage when it comes to the facilities market for international real estate investors.
Globally, ARCADIS is positioned in the top ten, and in Europe, in the top three in our field.
7
Mission and Profile

Mission
We strive to contribute to the sustainable quality of the built and natural environments and, in the process, create value for our clients, employees and shareholders.
Profile
ARCADIS is an international company that delivers consulting, engineering and project management services for infrastructure, environment and facilities. Focused on mobility, sustainability and quality of life. Companies and governments benefit daily from the proficiency, professionalism and dedication of our people. We are committed to their success.
We understand the challenges of our clients, and we truly deliver value. We do this through feasibility studies, consultancy, design, engineering, project and process management, implementation and maintenance. We have strong home market positions in Europe, the United States and South America and a close-knit network of offices. This local presence, combined with specialist expertise and international experience, enables us to offer tailormade integrated solutions. Creative yet practical and feasible solutions. Think and act. We have a clear vision of developments in society and work with our clients to redefine the realities of today. To be prepared for the future. ARCADIS looks ahead. Imagines. Develops. Delivers results.
8
Brief overview of Company activities


Brief overview of Company activities
Infrastructure_ARCADIS improves mobility. Consults, designs and manages the construction of infrastructure: railroads, highways, airports, harbors, waterways, dikes and retention ponds. In rail: utilities for safety, signaling, communications and energy supply. Specialist in bridges and tunnels. In small power plants, wind energy and hydropower plants. For municipalities: industrial parks and residential areas, renovation and restoration programs. In rural areas: water management, landscape reconstruction and recreational projects.
Environment_ARCADIS is a world leader in environmental services. Consults on environmental policy for companies and governments, conducts environmental impact assessments and supports in environmental management and legislation. Investigates soil and groundwater contamination, develops cost-effective remedial solutions and completes these remediation projects. Advises corporations on waste management issues and on the reduction of energy and water usage. Activities in the area of waste management, ecology and nature development.
Facilities_ARCADIS develops and maintains buildings. Offices, stores and commercial properties. Also hospitals, schools, museums, prisons, stadiums or railway stations. Alleviating our client’s worries through excellent project and program management, from identifying requirements through the final operational phase. Cost management: providing services that create value and help clients achieve their business objectives of staying within budget cost-effectively. Complete facility management: providing our clients with more time to focus on their core activities.
9
Introduction
Executive Board_Harrie Noy-CEO, Ben van der Klift-CFO, Friedrich Schneider, Michiel Jaski (from left to right)

10
Introduction
ARCADIS again has had an excellent year, with results to be proud of. Net income from operations rose 50% to record levels. Organic growth at 10% was twice the level of our goal. Margins improved to 9.4%, taking a major step toward our goal of 10%.
A solid performance was realized across the board. In all service areas, growth was at or above our goal, while margins improved. Geographically, the United States, the Netherlands and the United Kingdom were the primary contributors to the increased profit. BBL and AYH, acquired in 2005, performed beyond expectations. With BBL, we achieved a great deal of revenue synergy. AYH initiated the ARCADIS Worldwide Project Consulting effort to service international real estate investors and users.
The striking results demonstrate the success of our strategy aimed at activities with higher added value and more growth potential. Leveraging internal cooperation and synergy to capitalize on market opportunities gives us a competitive edge, as was demonstrated with the award of a $150 million framework contract for water management in New Orleans, won through the combination of our strong U.S. presence and our Dutch water expertise.
The portfolio changes in recent years have improved ARCADIS’ position. We are now market leader in the global environmental market for private-sector firms. In infrastructure, we have strong local positions and rail, bridges, tunnels and water expertise at the international level. In facilities we made a transition to services higher in the value chain.
ARCADIS is stronger than ever. The outlook for 2007 continues to be positive. We will continue on the selected course. The market offers plenty of opportunities. Awareness of sustainability and the environment is rapidly growing. Climate change requires top level water management expertise. Private funding for PPP increases the speed with which infrastructure problems are solved. Investments in facilities grow as a result of the favorable economy. An increasing number of internationally active clients want service providers who are active in multiple countries and provide a consistent level of quality.
Organic growth remains an important priority. We achieve this by strengthening our client focus and through internal cooperation aimed at providing added value to our clients. In addition, acquisitions are high on the priority list again. Here we focus on strengthening in the United States and the United Kingdom, expanding our presence in Asia and adding services higher in the value chain. Our goal is to be a unified company with a leading global position, a preferred supplier for multinationals, an employer of choice for talented employees, an attractive brand, and a top performer.
These goals can only be achieved through the drive and entrepreneurship of our employees. We greatly appreciate their dedication, and the enthusiasm with which they deliver their contribution. That, together with the trust of our clients and shareholders, determines the success of our company.
On behalf of the Executive Board,
Harrie L.J. Noy, Chief Executive Officer
11
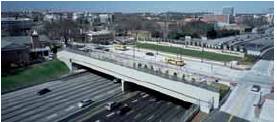
ARCADIS was honored with a design award for the Atlanta 5th Street Bridge replacement project. The project was recognized for its outstanding bridge and structural design. It was the first design-build project led by Georgia Department of Transportation in the Atlanta metro area.
12
Connectivity
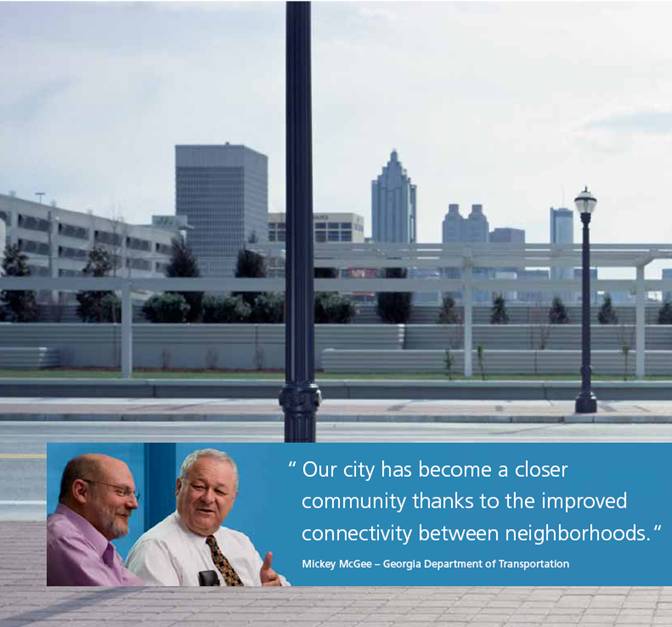
Connectivity – Many cities face similar problems. Highways cut through the urban landscape, isolating neighborhoods. The city becomes a collection of small towns. Here, connectivity is the key. Reconnecting communities to the center. Providing easier and better access. Making urban life more attractive.
Mickey McGee (l) – Metropolitan Atlanta District Construction Engineer - Georgia Department of Transportation
Frank Danchetz (r) – Business Practice Director, Transportation Design - ARCADIS
McGee – The 5th Street Bridge in Atlanta is about as wide as it is long and reconnects neighborhoods that were once isolated from downtown Atlanta.
Danchetz – The bridge provides a vital link between the main Georgia Tech campus on the west side of I-75/85 and Technology Square in midtown Atlanta. It features cars and trolley lanes and also wider pedestrian sidewalks and green amenities for student activities.
McGee – The elevated park makes the freeway less obvious as it blocks the view of and reduces the noise from the highway traffic below. It really contributes to the aesthetics of the setting.
Danchetz – What’s more, the bridge improves connectivity and reduces traffic congestion as it encourages more pedestrians to walk between the central campus and Technology Square. Additionally, a trolley runs between Midtown and the campus every five minutes.
McGee – The bridge has transformed Midtown into a dynamic live-learn-work-play community. Projects like these pave the way to transform Atlanta and reconnect neighborhoods into a community setting.

13
Report by the Executive Board
Report by the Executive Board_Vision and strategy
The ARCADIS vision
Push boundaries. Innovate. Deliver consistent quality. With a focus on client needs. To help them realize their goals. With a feel for local conditions and a clear vision for the future. Proactive and engaged. Proposing sustainable solutions. In infrastructure, environment and facilities. That is ARCADIS’ ambition. Doing business for the world of tomorrow. By offering services that contribute to the quality of the human habitat. Project management, consulting and engineering services. For companies and governments. Worldwide.
Following are the key elements of ARCADIS’ vision:
Client focus We work hard to understand our clients’ goals and provide solutions that help them realize those goals.
Strong home market positions ARCADIS ‘lives’ from the trust that clients have in the quality of our services. Maintaining close client relationships and adeptness in understanding local conditions are essential. This requires strong home market positions and close-knit office networks in the countries in which we are active.
Multinational clients These clients have an increasing need for service providers such as ARCADIS who can deliver services of consistent quality in a multitude of countries. Our international presence eminently qualifies us to fulfill this need.
One-stop shopping Clients want integrated total business solutions for their problems. By offering a broad range of services with specialist expertise and experience at the international level, we can provide clients unique integrated solutions.
One firm concept ARCADIS operates as one firm around the globe. This makes us recognizable to clients everywhere. Internal synergy and cooperation are important priorities that allow us to offer our clients nothing but the best.
Employees are the key to our success Their knowledge, entrepreneurship, results focus and involvement are the basis for the combination of thinking and acting that distinguishes ARCADIS (Imagine the result). Coaching and developing employees therefore plays an important role in company policy.
14
Market trends
Market conditions for ARCADIS are strongly influenced by the investments of governments and corporations. These investments in part depend on economic cycles. But in the longer run, demand for our services is increasing, and our markets offer clear growth opportunities. This results from current themes in society, as well as changes in client needs.
WuGuang PDL Company in China
Fast and safe connections


China is investing heavily in rail infrastructure through an expansion program that envisions about 7,456 miles of high-speed rail lines. ARCADIS is assisting China on one of its first high-speed railway lines between Wuhan and Guangzhou by providing construction management and quality control during the construction of a 155-mile section of the high-speed railway line to ensure that the rail line meets international standards.
15
Municipality of Enschede in the Netherlands
Revitalizing communities sustainably

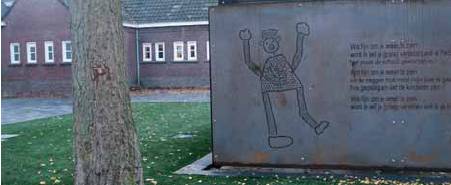
With its small green courtyards, Pathmos in Enschede is a typical example of a 1920s garden neighborhood. Over the years, however, it has deteriorated and the area has become one of increased social conflicts. In 2001, revitalization of the neighborhood began. From the onset, ARCADIS – as a consultant to the municipality and the housing corporation – has been involved with the revitalization and been the point of contact for residents. Working closely with the residents, public areas were developed with a focus on improving the living environment. A school with a nursery, bathhouse and cultural center was completed around a major square. Lighting and green amenities such as the restoration of a pond and rose garden in the central park were given special attention. Through recycling of old material and sustainable water management, the redevelopment was completed in a responsible way. Residents are extremely pleased with the improvements, and for the first time in years, there is a waiting list for rental houses in the quarter.
Current themes in society
ARCADIS’ work involves the design and realization of the natural and built environment. Therefore, current themes in society have a large impact on the demand for our services. Themes include:
Quality of life Demand for high-quality human habitat is on the rise. The emphasis lies on the sustainability and liveability of the built environment and the quality of nature and rural areas.
Mobility In many countries, this is an issue, necessitating investments in roads and public transportation, as well as increasing numbers of alternative financing options such as public-private partnerships (PPP).
Urbanization Investments in living areas, commercial properties and other facilities are increasing as inner cities deteriorate and require redevelopment. Large investments are needed in buildings, as well as infrastructure.
Sustainability Earth and the processes and activities that take place on it must be designed in a sustainable way, so that the quality of life is also guaranteed for future generations. This is a driver for growth in the environmental market.
Water Lack of clean, safe, potable water supplies leads to a growing demand in water supply and treatment facilities. In addition, flood protection measures create growth.
Climate change Happening faster and with greater force than expected, changing climates present serious consequences: sea levels rise, precipitation patterns change, etc. These changes create increased demand for environmental services to reduce carbon dioxide (CO2) emissions and also focus more attention on flood protection.
16
In many of these areas — infrastructure, the design of living areas and commercial properties, environmental services and water management — ARCADIS is well positioned to benefit from the growing demand for services. In other areas — water quality and urban planning — further strengthening or broadening of our capabilities is needed.
Changing client needs
ARCADIS works for a broad range of clients, from governments to the private sector.
The needs of these clients are changing and involve:
Globalization of industry International companies increasingly seek service providers who can provide strong service offerings internationally. In part, this is intensified by regulations requiring companies to valuate their liabilities according to unified standards (SOX).
Outsourcing and privatization More and more, companies are concentrating on core activities. Non-core functions such as facility management or environmental activities are outsourced. A comparable trend is apparent in government, where the focus is on policy making while implementation of policy is left to companies like ARCADIS.
Private investment in public services. This trend in many countries is often in the form of PPP. Private investment leads to overall market growth because investments no longer depend solely on government budgets.
Supply-chain integration Many clients want an integrated construction process with no delays between preparation and execution. Design/build or DBFO —Design, Build, Finance and Operate — offers this continuity. A consortium of private-sector companies develops, designs and builds projects, providing financing and operations management also.
Risk participation An increasing number of clients are asking us to share in project risk. Our fee then is determined by the added value we deliver — a common component in DBFO projects. ARCADIS has internal procedures to control these risks (see page 50 of this report).
Many of these changing client needs are favorable to ARCADIS as more work is outsourced to the market. In addition, we are capable of serving multinational clients internationally. Worldwide, there are only a few companies with comparable skills. Finally, many new client needs require a broad, multidisciplinary service offering and good risk management. ARCADIS can export our experience in one country to other countries and with that take the lead in certain markets.
17
Goals
Together with its vision, ARCADIS has selected seven goals that direct its strategy:
Value creation for shareholders. This means investing in employees and services, to deliver more added value for clients. This results in profitable growth, which is the basis for value creation.
Leading positions in infrastructure, environment and facilities. This offers the opportunity to provide clients integrated business solutions. A broad scope of disciplines also allows us to capitalize on new market trends and to grow through innovation.
Home market positions in Europe, the United States, South America and Asia. In the countries in which we are active, we strive to be positioned in the top 5, and in the United States to be positioned in the top 10, in our industry.
Global leadership in services for multinational clients, specifically in environmental and management services.
One seamless company, where internal cooperation is part of the culture directed at creating synergy. With a brand that is recognizable around the globe for quality and reliability.
Employer of choice with an international and inspiring workplace where innovation and teamwork offer clients the best achievable solutions and where talent is provided maximum opportunities for growth.
A healthy financial position with enough strength to grow through acquisitions.
Strategic progress
Profitable growth in home markets
In mid-2000, value creation for shareholders became a leading element in our strategy in an effort to improve the Company’s long-term position. Since then, the ARCADIS strategy has been aimed at the realization of the goals mentioned above. Profitable growth in home markets in Europe and North and South America are key to that process as are organic growth, margin improvement and expansion of activities through acquisitions. In recent years, organic growth has increased, and margins have improved considerably. Acquisitions and divestments have led to a strong change in the portfolio. From 2000 to 2005, approximately € 150 million in gross revenue was divested. These divestments were predominantly non-core activities with lower margins. They were replaced with more than € 400 million in gross revenue in consultancy and management services with higher added value, higher margins and more growth potential.
18
Recurring
Strategic positioning strongly improved
The portfolio changes have strongly improved ARCADIS’ strategic positioning.
The acquisition in 2005 of BBL in the United States brought ARCADIS into the top 3 in the global environmental market, and we are now the global market leader in environmental services to companies. In the infrastructure market, we have a recognizable position with several specialties at the international level. In the facilities market, a transition was completed to higher value management services. Meanwhile, ARCADIS has a top 5 position in many European countries and Brazil. Even though our activities in the United Kingdom have expanded considerably, and our presence in the United States has doubled since 2000, we still have not reached our desired position in those markets. In Asia, our position is still modest. Internal cooperation has improved considerably. ARCADIS’ name awareness has increased considerably, and in the labor market, ARCADIS has a solid reputation. Nevertheless, in both of these areas, significant progress can still be made. Despite investments in acquisitions, our financial position is very healthy with ample room for further expansion.
Considerable value creation
Thanks to the contribution of many within ARCADIS, developments in recent years have led to a considerable creation of value. The market capitalization of the Company rose from € 173 million at year-end 2000 to € 945 million at year-end 2006.
Good progress in 2006
In 2006, considerable progress was achieved in realizing our strategic goals.
Integration of BBL is progressing well The integration of BBL – acquired as of October 1, 2005 – within our existing U.S. organization, was a main priority in 2006. The basis for this integration is BBL’s successful client-focused business model. As of January 1, 2007, organizational changes have been implemented, targeting enhanced efficiency, increased marketing power, and greater synergy in both the U.S. and internationally. A logical next step will be the introduction of a divisional structure that offers opportunity for the planned future expansion of our position in the United States.
Strong organic growth and higher margin At 10%, organic growth was much higher than our goal of 5%. The margin improved further to 9.4%, a clear demonstration that ARCADIS is now active higher in the value chain with activities that create more added value.
Strong growth with multinational clients BBL’s objective to serve their clients outside the United States drove their decision to join ARCADIS. ARCADIS’ Multinational Clients (MNC) program makes it possible to serve global companies in multiple countries with consistent quality, directed through an account management program. The BBL acquisition has increased the gross revenue in the MNC program to € 171 million. The organic growth amounted to 15%.
19
PKP Polskie Linie Kolejowe in Poland
Improved connectivity

Poland will invest heavily in rail infrastructure in the coming years. In central Poland, ARCADIS is providing project management and supervision services for the modernization of a 37- mile railway track between Skierniewice and Lodz. The track is part of the 79-mile railway line between Warsaw and Lodz, two Polish urban areas having more than 3 million inhabitants. The modernization will lead to increased speed for passenger trains from 87 to 99 miles per hour, which will considerably lower the travel time for passengers. The comfort of passengers is also taken into account. A great deal of attention will be paid to safety and the elimination of noise and vibrations.
Transnational Growth Platforms formed These initiatives were introduced in 2006 based on our revised 2005 strategy. The Transnational Growth Platforms (TGPs) are horizontal business lines that target the creation of additional growth across operating company borders. More information is provided in the sections on market developments by service area.
Strengthening portfolio and home markets through acquisitions Even though the 2006 priority was the integration of already acquired companies, considerable expansion through acquisitions was achieved in 2006 and includes:
|
|
|
|
|
| Gross revenue |
| Consolidated |
|
Name |
| Country |
| Staff |
| in € million |
| as of |
|
In Situ Technieken |
| The Netherlands |
| 10 |
| 1.5 |
| 4/1/2006 |
|
Dresdner Grundwasser Consulting |
| Germany |
| 20 |
| 1.5 |
| 7/1/2006 |
|
Berkeley Consulting |
| United Kingdom |
| 100 |
| 10 |
| 8/1/2006 |
|
ECOLAS |
| Belgium |
| 60 |
| 6 |
| 10/1/2006 |
|
BCT |
| Belgium |
| 65 |
| 6 |
| 10/1/2006 |
|
PinnacleOne |
| United States |
| 230 |
| 28 |
| 11/1/2006 |
|
Total |
|
|
| 485 |
| 53 |
|
|
|
In Situ Technieken strengthens our position in soil remediation. The company has a technology that in certain soils leads to quicker and more cost-effective results. In Germany, Dresdner Grundwasser Consulting was added, specializing in water management and wastewater treatment. Through the acquisition of Berkeley Consulting in England — active in project management, construction management and conflict resolution — AYH was able to expand its client base to the public sector. In Belgium, the acquisition of ECOLAS strengthened our position in the European environmental market, while the acquisition of the engineering company BCT expands the activities in the Walloon region of Belgium. The acquisition of PinnacleOne considerably strengthens our position in project and program management in the United States. This acquisition fits into the ARCADIS Worldwide Project Consulting initiative, aimed at serving international real estate investors globally.
20
Strategy
The 2005 revised strategy titled Choices for growth, generally continues the 2000 strategy, which was aimed at profitable growth in home markets. For each of the three markets in which ARCADIS is active, a strategic goal was formulated based on a portfolio analysis that listed both the attractiveness of the market and ARCADIS’ competitive position for each of our different activities. In addition, SWOT analyses were completed for service areas and ARCADIS as a whole. The latter is as follows.
Strengths |
| Weaknesses |
Strong home market positions in Europe, the United States and South America |
| Limited position in Asia |
Focus on three service areas with growth potential |
| Visibility outside the Netherlands |
Extensive client list with multinationals |
|
|
Stable cash flow and healthy balance sheet |
|
|
Opportunities |
| Threats |
Synergy based on expertise and client contacts |
| Shortage in labor market |
Growth of investments in Central Europe and Asia |
| Rapid market decline |
Outsourcing (companies) and privatization (governments) |
| Weakening of U.S. dollar (conversion risk) |
Further expansion through acquisitions |
|
|
The three service area goals are listed elsewhere in this report.
The strategy for ARCADIS as a whole consists of the following core elements:
Strengthening of organic growth through:
· Expansion of local positions in home markets. ARCADIS’ strong home market positions offer excellent opportunities to capitalize on the changes offered by local markets, thus using ARCADIS’ global knowledge and experience. Through strong positions in Poland and the Czech Republic, we can benefit from the considerable investments of European funds in Central Europe.
· Application of Transnational Growth Platforms. Through this initiative, we aim to generate additional growth in areas where the market is attractive and ARCADIS has strength – in rail, tunnels and bridges, environment and project and program management.
· Leveraging of good relationships with multinational clients to further expand our services to these clients through cross selling.
· Combining of knowledge and experience into new products to benefit from certain market developments (e.g., facility management in response to the outsourcing of building maintenance activities by companies).
Focus on activities with higher added value The sooner ARCADIS becomes involved in a project, the higher the added value it can create. Management services and front-end consultancy therefore have a higher added value. This is also true for alternative contract types such as the Guaranteed Remediation Program (GRiP®), RECLAIMSM or
21
Koch Industries worldwide
Superior environmental consultancy for an industry leader

With a presence in some 60 countries in a variety of industries, Koch Industries is the largest privately held company in the United States. Koch companies strive to be industry leaders in environmental stewardship and health and safety performance, focusing on the creation of long-term value for customers and society. ARCADIS’ relationship with Koch Industries began more than 10 years ago with the successful execution of a single environmental project in the U.S. Thanks to ARCADIS’ client-focused strategy, shared values and a strong global geographical match, the relationship expanded into hundreds of projects worldwide. ARCADIS provides Koch with superior environmental consultancy including remediation and environmental compliance support.
DBFO projects. ARCADIS’ strategy is aimed at growing these types of activities, while outsourcing lower added value services such as detailed engineering. This policy should lead to improved margins.
Expansion through acquisitions aimed at:
· Further strengthening home markets, particularly in the United States and the United Kingdom.
· Strengthening the portfolio, beginning with expanding services higher in the value chain — management services, broadening of environmental services, planning services, rail activities and water.
· Developing a position in Asia.
Acquisitions must have a good strategic fit, while the target company has to have a solid reputation and strong management. Financial criteria include positive contribution to earnings per share, a margin compatible with ARCADIS’ goals and a return on investment of 15% or more.
Enhance name awareness through a proactive public relations and communications policy, publications in trade magazines, and lectures at trade fairs. In 2007, an investment will be made to strengthen this discipline, particularly in the United States.
Active Human Resources policy This policy is aimed at attracting, compelling and retaining talented employees, as competition is predominantly won in the labor market. For more information on this policy, please see the section on Human Resources Management.
Financial goals
Margin target raised to 10%
In 2005, the margin target of 8% that was established in 2000 was reached. From 2000 to 2005, the margin improved by almost 40%: from 6.0% in 1999 to 8.2% in 2005. Portfolio changes and a focus on activities with higher added value pushed the
22
margin structurally higher. This was the basis for reevaluating the margin targets. An internal and external benchmark was completed as part of this reevaluation, leading to a new margin target of 10% (EBITA as a percentage of net revenue). The service areas have the following margin targets:
Infrastructure |
| 8% - 9 | % |
Environment |
| 12% - 13 | % |
Facilities |
| 10% - 11 | % |
Total |
| 10 | % |
The Company will reevaluate its margin targets when structural changes take place in the portfolio (e.g., as a result of the addition of newly acquired companies). To meet the targets, the policy remains aimed on productivity improvements and activities with higher added value. Reaching these targets also depends on market conditions.
Other goals
The other financial goals for the mid to long term (3 years) remain unchanged:
· Gross revenue: average annual growth of 10% or more, half of which is organic.
· Operational margin: 10% (EBITA as a percentage of net revenue).
· Earnings per share: average annual growth of 10% or more (based on net income from operations).
· Return on invested capital of 15% or more. This is net income from operations, excluding interest charges, compared to shareholders’ equity plus net interest-bearing debt, calculated as an average over four quarters.
The goals listed above exclude the effects of currency exchange rate differences. Net income from operations is before amortization and non-recurring items like book gains. Goodwill is capitalized on the balance sheet as of 2001; as of 2004, the figures are based on IFRS.
Currency risks in the business are generally hedged. Because the translation risk has no effect on the business, this risk is not hedged.
Performance in comparison to financial goals
Below are the results of previous years compared to the above goals, excluding currency effects.
|
| Goal |
| 2001 |
| 2002 |
| 2003 |
| 2004(3) |
| 2005(3) |
| 2006(3) |
|
Gross revenue |
| 10 | % | 3 | % | 6 | % | 10 | % | 9 | %(1) | 10 | % | 23 | % |
·Organic |
| 5 | % | 3 | % | 2 | % | 1 | % | 5 | % | 5 | % | 10 | % |
·Acquisitions |
| 5 | % | 0 | % | 4 | % | 9 | % | 4 | % | 5 | % | 13 | % |
Operational margin |
| 10 | % | 6.9 | % | 7.4 | % | 6.0 | % | 6.2 | %(2) | 8.2 | % | 9.4 | % |
Earnings per share |
| 10 | % | 10 | % | 11 | % | (4 | )% | 9 | % | 40 | % | 50 | % |
Return on invested capital |
| 15 | % | 17.6 | % | 18.8 | % | 15.9 | % | 17.2 | % | 20.6 | % | 20.3 | % |
(1) Excluding book profit on sales
(2) Excluding non-recurring items
(3) Figures based on IFRS
23
Excluding currency effect
Results and Financing
Record year 2006 was another record year for ARCADIS. Gross revenue rose 23% to € 1.2 billion. At 10%, organic growth was especially strong. Net income from operations (before amortization and non-operational items) rose 50% to € 50.0 million. Per share, this is € 2.47 against € 1.65 in 2005. This excellent result is attributable to strong growth in our service areas, continued margin improvement and a solid contribution from acquisitions. Across the board, performance was good. In all three service areas, organic growth was on or above target, while margins improved. Geographically, the profit gains were primarily strong in the Netherlands, the United States and the United Kingdom.
Dividend € 1.00 per share ARCADIS proposes to raise its cash dividend to € 1.00 per share from the € 0.66 per share distributed over 2005, an increase of over 50%. This represents more than 40% of net income from operations. The Company’s dividend policy is aimed at a payout ratio of 30% to 40% of net income from operations and is designed to provide shareholders with an attractive dividend yield, while providing the Company sufficient resources to finance growth through, among other things, acquisitions.
Strong growth in gross revenue Gross revenue increased 23% to € 1.233 billion (2005: € 1.001 billion). On balance, 14% of this increase came from acquisitions and divestments. The acquisitions in 2005 of AYH in the United Kingdom and BBL in the United States contributed significantly, while the sale in mid-2005 of our 50% participation in a Spanish firm had the largest negative effect. The currency effect was limited. Organic growth was at 10%, well over our 5% goal. The largest contribution to growth came from the Netherlands, the United States and Brazil, while France and United Kingdom also saw solid growth.
Net revenue increases 19% Net revenue, the portion of revenue produced by ARCADIS’ staff, grew by 19% to € 837 million (2005: € 703 million). On balance, the contribution from acquisitions and divestments was 13%; the currency effect was almost zero. Organic growth totaled 6%, which is less than the growth in gross revenue, among other things the result of the commencement in 2006 of the DSM/Sabic facility management contract that includes a large subcontractor component.
24
Geographical mix shifts As a result of vigorous expansion through acquisitions, the U.S. share of total revenue grew. In 2006, 42% of gross revenue was generated from operations in the United States (2005: 35%); the Netherlands contributed 26% (2005: 29%); Europe excluding the Netherlands, 23% (2005: 26%); and Rest of World, 9% (2005: 10%). Therefore, approximately half of the gross revenue is generated from European operations and the other half from operations in the United States and Rest of World.
Red Bull in United Kingdom
Realizing an exceptional office

Red Bull’s striking new office was a tremendous project to manage. The exciting design led to many cost and health and safety conundrums for AYH. It required careful and innovative planning and a creative project approach. To get from one floor to another, Red Bull workers can enjoy an exhilarating ride down a fiberglass slide or take a floating staircase. The award-winning open office promotes interaction and is unlike any office in London.
25
Umicore in Belgium
Cost-effective remediation solutions
The Umicore-plant in Balen has been operational for more than a century. Historical production activities have resulted in heavy metals contamination (zinc and cadmium). Part of the contamination plume extends beneath an adjacent neighborhood. In addition, the plant is built atop the largest drinking water supply in Flanders. To prevent further seepage of the contamination into the ground and to contain the groundwater contamination at the site boundaries, Umicore retained ARCADIS to evaluate various remediation options and determine the most appropriate remedy. Simulation models were used to predict the effects of the various remediation techniques on the fate and transport of groundwater contamination. Hydrological isolation was determined to be a cost-effective solution, preventing further migration of the contaminated groundwater.
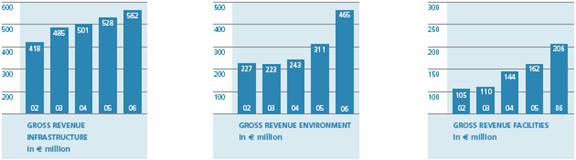
Environment revenue increases As a result of the acquisitions in 2005 of BBL and Greystone, environment’s share of total revenue grew to 38% (2005: 31%). Partially the result of divestments in 2005, infrastructure declined to 45% (2005: 53%). Facilities totaled 17% (2005: 16%) as a result of acquisitions in that service area, remaining relatively stable.
Development of cost Operational cost (staff cost and other operational cost) increased by 18% to € 741 million (2005: € 628 million). The effect of acquisitions and divestments was 12.3%. Organically, the increase was 5.8%. This is lower than the increase in net revenue of 6.3%. The difference is the result of efficiency improvements.
Personnel cost increased by 20% to € 581 million (2005: € 485 million) while the other operational costs increased 12% to € 160 million (2005: € 143 million). Costs include € 5.4 million for external costs related to the Sarbanes Oxley Act (SOX 404) compliance and for the integration of BBL. This relates to temporary extra staff hires, consultants and auditor costs. Both operations also required a lot of time from ARCADIS’ own staff.
Relative decline in depreciation Depreciation (excluding amortization) rose 16% to € 17.7 million (2005: € 15.2 million), primarily the result of expansion through acquisitions. As a percentage of net revenue, depreciation decreased slightly from 2.2% in 2005 to 2.1% in 2006.
Amortization of identifiable intangible assets higher Under IFRS, identifiable intangible assets related to acquisitions must be separated from goodwill and amortized separately. For ARCADIS, this generally relates to the profit in the acquired company’s backlog. These assets are amortized over their economic lifetime (on average one to two years). In 2006, the amortization increased to € 8.3 million (2005: € 6.0 million) as a result of completed acquisitions.
26
Strong increase in operating income and EBITA Operating income rose 30% to € 70.5 million (2005: € 54.4 million). Of this amount, € 0.6 million is related to the sale of carbon credits in Brazil.
EBITA (operating income before amortization) and recurring EBITA are often used to measure the financial performance of operations. In 2005 and 2006, these measures developed as follows:
In € millions |
| 2006 |
| 2005 |
|
Operating income reported |
| 70.5 |
| 54.4 |
|
Amortization |
| 8.3 |
| 6.0 |
|
EBITA |
| 78.8 |
| 60.4 |
|
Book gain from divestments |
| — |
| 2.5 |
|
Non-operation pension gain |
| — |
| 0.6 |
|
Recurring EBITA |
| 78.8 |
| 57.3 |
|
EBITA rose 31%. On a recurring basis, the gain was 38%, totaling € 78.8 million (2005: € 57.3 million). The currency effect was zero. The contribution from acquisitions and divestments was 24%, considerably higher than the contribution to net revenue (14%). This clearly demonstrates the positive effect of the acquisitions and divestments on the margin. Organically, EBITA increased 14%, also more than net revenue (6%). Thus, the margin also improved organically.
Financing charges higher as a result of acquisitions On balance, financing charges rose to € 3.5 million, an increase of € 1.7 million compared to the € 1.8 million in 2005. This increase is mainly the result of investments in acquisitions, which are financed with loans. Using financial derivatives, currency and interest rate risks on these loans are hedged. On balance, this effect on financing charges was a positive € 1.1 million (2005: positive € 1.7 million). Excluding this effect, financing charges were € 4.6 million (2005: € 3.6 million). This includes a non-recurring interest gain of € 0.5 million.
In 2006, group financing for the majority of the operating companies was introduced, optimizing the financing structure. This also has a positive effect on financing charges.
Tax rate lower The effective tax rate of 30.2% was lower than the 32.2% in 2005. A reduction in the Dutch corporate tax rate that became effective on January 1, 2007 has a favorable effect on the tax rate resulting in a lowering of the deferred tax reserve by € 1.0 million, which was added to the 2006 net income.
27
Negative contribution from associated companies A loss of € 0.5 million was realized from associated companies in 2006. In 2005, the contribution was € 1.4 million. The decline is the result of delays in project awards and new sales contracts for a number of energy projects in Brazil.
Strong decline in minority interest Minority interest – that part of the profit that flows back to the co-owners of the less-than-100%-owned ARCADIS companies – declined considerably to € 1.5 million (2005: € 3.2 million). To a large extent, this was the result of developments in Brazil, where ARCADIS owns 50.01% of the shares of ARCADIS Logos. The profit from our own activities rose strongly, but this was insufficient to offset the decline resulting from non-consolidated energy projects. In addition, results declined in other companies in which ARCADIS does not have a 100% ownership (e.g., in Poland and the Czech Republic), while elsewhere interests were expanded (the United Kingdom and Germany) or divested (Spain).
Strong gains in net income and net income from operations Net income was € 44.9 million, or € 2.22 per share, against € 33.4 million, or € 1.65 per share in 2005. Net income from operations (before amortization and non-operational items) was € 50.0 million, 50% more than the € 33.4 million in 2005. Per share, this is € 2.47 against € 1.65 in 2005.
Solid cash flow Net income plus depreciation and amortization totaled € 71 million (2005: € 55 million). Cash flow from operational activities increased considerably to € 86 million (2005: € 67 million). After subtracting replacement investments, a free cash flow remained of more than € 68 million (2005: € 52 million).
Investment levels lower as a result of fewer acquisitions Investments in intangible fixed assets, excluding acquisitions, were € 18 million (2005: € 15 million) - equivalent to the level of depreciation. The investments primarily relate to communications and computer equipment, as well as office furniture.
An amount of € 53 million (2005: € 121 million) was invested in new acquisitions or expansion efforts in consolidated companies, of which € 30 million relates to goodwill and € 11 million to identifiable intangible assets. In addition, € 7 million was invested in associated companies and other financial fixed assets (2005: € 6 million).
28
Number of shares remains nearly unchanged The number of outstanding shares at year-end 2006 was 20.3 million, almost equal to the number at year-end 2005. To cover obligations related to option plans, approximately 495,000 shares were repurchased, while approximately 530,000 shares that had been purchased earlier were used for the exercising of options by employees. No new shares were issued. The average number of outstanding shares (used to calculate net income per share) was 20.2 million (2005: 20.3 million). For more information on the number of outstanding shares, please refer to page 109 of this report. For more information about options and share purchase plans, please refer to page 105 of this report.
Lufthansa in Germany
Concept for an attractive working environment

ARCADIS Homola played a key role in the realization of Lufthansa’s new Aviation Center in Frankfurt, assisting them in developing long-term architectural concepts, which ultimately lead to this open, healthy and attractive working environment for Lufthansa’s administration staff. The exceptional building structure required close cooperation between the project management teams of ARCADIS and Lufthansa throughout all construction phases.
29
Samarco in Brazil
Management partner in booming business


The mining market in Brazil is booming as a result of global demand for raw materials. Thanks to our extensive experience in the project management of major projects in Brazil, ARCADIS is well equipped to manage the country’s most significant new mining projects. ARCADIS is currently providing overall project management services to CVRD’s subsidiary Samarco for the construction of a new pelletizing plant and an iron ore beneficiation plant at the mine. The two units will be linked by a 249-mile iron ore pipeline that passes through 25 cities. The municipalities will profit from these new activities through increased tax revenue. What’s more, Samarco – known as a socially responsible company – has invested in the development of local educational and cultural centers.
Balance sheet remains healthy The balance sheet total rose to € 736 million at year-end 2006 (2005: € 650 million) - the result of organic growth of activities (€ 54 million), acquisitions (€ 60 million) and currency effects (negative € 28 million).
Goodwill increased to € 139 million (2005: € 116 million) as a result of the balance of acquisitions and currency effects. Identifiable intangible assets at year-end 2006 were € 10 million (2005: € 8 million). As of 2004, goodwill is no longer amortized but subject to an impairment test once a year. In 2006, this test determined that no goodwill loss had occurred.
Influenced by the strong organic growth, working capital, consisting of work in progress plus accounts receivables minus accounts payable, increased slightly by € 6 million. As a percentage of gross revenue (measured at the level of the fourth quarter times four), working capital declined from 12.7% in 2005 to 12.5% in 2006.
Cash and cash equivalents at year-end 2006 were € 101 million (€ 2005: € 74 million). Net debt (cash and cash equivalents minus interest-bearing debt) at year-end 2006 was € 45 million (2005: € 52 million). As a result of the favorable cash flow, the net debt improved despite the investments in new acquisitions. Interest-bearing debt also includes the after-payment obligations to former shareholders of acquired companies, totaling € 21 million.
30
At year-end 2006, € 196 million in short-term credit facilities was available (2005: € 182 million). At the balance sheet date, € 22 million of these facilities were used. In addition, banks have pledged project bonds for € 41 million (2005: € 40 million). At year-end 2006, ARCADIS had € 119 million in long-term debt (2005: € 116 million). Current liabilities rose from € 304 million in 2005 to € 370 million in 2006. Of this increase, € 23 million was a result of shorter billing cycles.
Shareholders’ equity rose € 12.7 million to € 188.9 million at year-end 2006 as follows:
In € million |
| Effect |
|
Net income over the book-year 2006 |
| 44.9 |
|
Dividend payment over the book-year 2005 |
| (13.4 | ) |
Currency exchange rate differences |
| (14.1 | ) |
Exercising of options |
| 4.6 |
|
Temporary purchase of shares to cover option plan obligations |
| (17.6 | ) |
Option costs |
| 1.8 |
|
Fiscal effects related to options plans |
| 6.4 |
|
The balance sheet ratios remained strong. The net debt to equity ratio at year-end 2006 was 0.2 (2005: 0.3). The net debt to EBITDA ratio was 0.4 (2005: 0.6). The interest coverage ratio remained unchanged at 17.
31
Developments by service area_Infrastructure
This segment is comprised of all ARCADIS activities that are focused on designing physical living environments. Themes include Living and Working (planning for living, working and recreational areas, as well as urban and rural environments); Mobility (traffic management, highway, railroad and waterway connections, bridges and tunnels); Water (water management, water quality and hydraulic engineering); and Energy (hydropower plants, biogas installations). This segment contributed 45% of ARCADIS’ total 2006 revenue (2005: 53%).
Strong local positions with specialties at the international level In the infrastructure market, government entities are our principal customers. Additionally, we work for developers, construction companies or other corporations. In this market, ARCADIS has strong local positions, with a solid knowledge and understanding of local conditions and long-term client relationships. This allows us to react early to developments, deliver tailor-made services and leverage our global expertise and experience to clients at the local level. In rail infrastructure, bridges and tunnels, as well as water management, ARCADIS has specialist expertise and experience that can be applied internationally.
Following is the SWOT analysis for infrastructure:
Strengths |
| Weaknesses |
Strong local positions and broad service offerings |
| Limited recognition in large projects |
Specialization in rail infrastructure (including rail systems), bridges and tunnels, water management |
| Limited master planning experience for front-end project involvement |
|
| Limited reputation in the water market (water quality) |
Opportunities |
| Threats |
Privatization by governments, more PPP projects |
| Sudden reductions in government investment |
Major investments in rail and subway networks |
| Increases in competition based on price |
Increased focus on water management in delta areas |
|
|
Infrastructure market goals The following infrastructure goals have been set:
· Further expansion and growth of strong local positions;
· A recognizable market leadership position in rail infrastructure;
· The application of our unique expertise in bridges and tunnels;
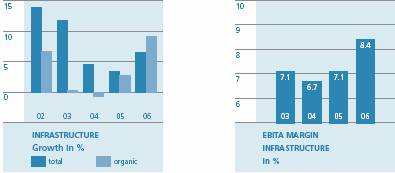
· An organic growth of 4 to 6% per year; a margin of 8 to 9%.
Strong local positions make us an attractive partner in PPP projects. We are also able to benefit from the trend among government clients to outsource more work to the private sector. For rail and bridges and tunnels, we have developed Transnational Growth Platforms to more fully capitalize on market opportunities. We are striving to further strengthen our master planning capabilities for earlier entry into projects, thereby avoiding competing solely on price. We are also focusing on expanding our position in the water market in 2007.
32
Excluding currency effect
Strong organic growth; improved margin Activities grew 7%. The effect of acquisitions and divestments on balance was a negative 3%, specifically as a result of the divestment of our Spanish holdings mid-2005. The currency effect was 1%. The 9% organic growth is a strong improvement over prior years. This can be attributed to favorable market conditions in the Netherlands, the United States and Brazil. The margin rose to 8.4% (2005: 7.1%), mainly as a result of enhanced profitability in the Netherlands.
The Dutch market recovery was stronger and quicker than expected, resulting in 10% growth. In the United States, the land development market softened, but this was more than compensated for by growth in water and transportation. On balance, organic growth totaled over 15%. In Brazil, investment in both the private and public sectors remained strong, continuing the healthy growth there.
Flemish Ministry in Belgium
Let the traffic flow


Traffic jams are a structural issue on the Brussels beltway. Fast-moving commuter traffic converges onto this beltway merging with lower speed local traffic that frequently uses the numerous approaches and exits. ARCADIS proposed to split the beltway so that each traffic flow could move unimpeded. A continuous beltway will provide access to the highways, while a parallel road will serve local traffic.
33
Toulouse District in France
Providing better access

Beneath the central business center of southwest France, ARCADIS is working on an impressive project. In the densely populated city center of Toulouse, the subway network will undergo a 9-mile north-south extension, with 20 station stops. ARCADIS prepared the detailed design for many of the stations, controlled the tunnel design and provided consulting services for the tunnel boring. ARCADIS applied various tunneling techniques based on the geotechnical conditions. Construction beneath the famous Canal du Midi – a Unesco World Heritage listed site – required an innovative approach. When completed, the new subway line will cross the existing east-west subway line in the heart of the city center, providing access for travel in all directions.
Poland lagged behind expectations. Despite a large number of new project awards, increasing the backlog, delays plagued projects in the first half of the year. In France, market conditions remained positive, allowing for stable growth. In Belgium, several large projects are in a transition to a subsequent phase, resulting in a temporary flat organic growth. Even though gross revenue in Germany declined, signals indicate market improvement. In the fourth quarter, we won a large project management assignment from Deutsche Bahn. In the donor-financed market, gross revenue declined.
Breakthrough of Public-Private Partnership initiatives In 2006, the number of PPP initiatives grew strongly, a trend seen in many countries where ARCADIS is active. With more frequency, the design, construction, operation and financing components of large projects are being offered in an integrated approach. The advantage is twofold: financing is not burdening government budgets at a single time, and private-sector parties are increasing efficiency by integrating activities and applying life cycle concepts. Institutional investors are very interested in these initiatives because of the stable cash flow. These initiatives also offer opportunities for ARCADIS: as an advisor to the government or as a partner in a consortium that develops the project. ARCADIS serves as an advisor on the Zuidas project in Amsterdam, a large area development in which the infrastructure is constructed underground. This project is partially financed by the projected future value of the developed real estate. As a partner in a consortium, we primarily contribute our knowledge and understanding of local conditions and our expertise in developing creative solutions. Additionally, we are willing to share risks that are offset by the profit potential.
Building a leadership position in rail To benefit from the strong growth in the rail market, a Rail Business Team was assembled in 2006 to further penetrate the international market. Focusing on the Netherlands, France, Poland, the United Kingdom and China, services include modernizing rail systems and expanding high-speed rail networks and regular rail systems. In the Netherlands, Asset Rail, a joint venture with Imtech and Dura Vermeer, was awarded its first project for the maintenance and management of a section of rail track. In China, we were awarded a construction management project for a 153-mile section of a high-speed-railway between Wuhan and Hwadu, and in Poland, we were awarded a program management contract for
34
updating a 40-mile section of railway between Warsaw and Lodz. In France, we contributed expertise on the high-speed railway line between Paris and Strasbourg. In 2006, we obtained the certification to work on the British rail systems.
Bundled expertise in bridges and tunnels Our center of excellence for bridges is housed in France, while our tunnel expertise resides in a network of specialists located in several countries. In 2006, the center of excellence for bridges, which previously designed the Millau Bridge in France and the Lange Wapper Bridge in Antwerp, Belgium, won the French engineering award for the design of the sixth bridge over the Seine River in Rouen. The spectacular “butterfly” construction of this lift bridge attracted significant attention. In the Netherlands, the longest ecoduct in the world and the longest wooden bicycle bridge in the Netherlands were completed. In the Czech Republic, we conducted work on several large tunnel projects, while in Toulouse, France, we conducted work on the tunnel that expands the tram and subway network. Our work on the Detroit Upper Rouge Tunnel has provided us a solid position in the growing U.S. tunneling market.
Water is a growth market In the Netherlands, ARCADIS has extensive experience in the water market, among other things, developed while designing the river dike improvements for the Deltaplan Dutch rivers in the middle of the nineties. In early January 2007, ARCADIS in a joint venture with Bioengineering Group won an Indefinite Delivery Indefinite Quantity contract, having a maximum value of $150 million, from the U.S. Army Corps of Engineers for services to provide solutions for hurricane protection for New Orleans and the surrounding Gulf Coast. Our local presence combined with our Dutch water expertise and reputation won us the project. This assignment will generate significant work in the future and strengthens our position in this growth market.
Outlook The positive trend in the Dutch market is expected to continue, in part as a result of favorable economic conditions. Although rail renewal projects are seeing some delays, we are continuing to be awarded PPP projects, and the government is continuing to outsource additional work. In the municipal market, demand for integrated land development is rising. In other European countries, the outlook is also positive. In Belgium and France, large investments are being made in the form of PPP projects. In the United Kingdom, ARCADIS can contribute to the renewal of rail infrastructure. After a series of project delays in Poland, European investments offer good prospects for Poland, the Czech Republic and Romania.
In the United States, the large U.S. Army Corps of Engineers’ contract for water management services for New Orleans and the surrounding Gulf Coast will provide opportunities for additional growth in these activities. The federal investment program (SAFETEA) continues to have a positive effect on the transportation market. In that market, we are also seeing an increase in the number of PPP projects. The market for land development is not expected to improve until the second half of 2007. Market conditions in Brazil are expected to remain favorable. In Chile, further growth is also anticipated in 2007, particularly in mining-related activities.
35

Developments by service area_Environment
This service area - 38% of revenue (2005: 31%) – relates to the theme of Sustainability: ensuring that the earth remains livable for future generations. Activities are aimed at improving and maintaining air, soil, groundwater and surface-water quality, as well as nature and ecology projects. Also included in this service area are projects related to climate change, product stewardship, noise abatement, solid waste disposal and health and safety.
ARCADIS is a market leader in environment With the acquisition of the American firm Blasland, Bouck & Lee (BBL) in 2005, ARCADIS holds market leadership positions in the global environmental market. A considerable portion of this market relates to investigation and remediation of soil and groundwater contamination, as well as contaminated sediments. In this market, ARCADIS is positioned in the global top 3. With its strong international presence, ARCADIS already was a large service provider to the private sector, and together with BBL, we are the leading company in the world in this sector.
Following is the SWOT analysis for environment:
Strengths |
| Weaknesses |
International network for services to multinational clients |
| Limited position in Asia |
Cost-effective remediation technologies and GRiP® |
| Too limited a portfolio in front-end consultancy services |
Integrated approach with other disciplines |
|
|
Opportunities |
| Threats |
More attention for sustainability and climate change |
| Economic decline: less environmental spending |
Demand from multinational companies for international services Redevelopment of contaminated industrial properties |
| Reduced environmental spending by the Department of Defense in the United States |
Goals in the environmental market In this service area, ARCADIS has the following goals:
· A global market leadership position in remediation;
· �� Leveraging this position to add front-end consultancy services;
· Market leadership in environmental services for private-sector firms;
· Organic growth: 8 to 12% per year; margin: 12 to 13%.
Our strong competitive position provides ample opportunity to benefit from the growing attention for sustainability and climate change. It is for that reason that the environment service area has been designated a Transnational Growth Platform. In 2006, a European environmental team was established to support the country organizations in business development activities at a European level. Similarly, the already existing American team supports Brazil and Chile. Beginning in 2007, this approach has been strengthened by the appointment of the former CEO of BBL to the position of Corporate Director of
36
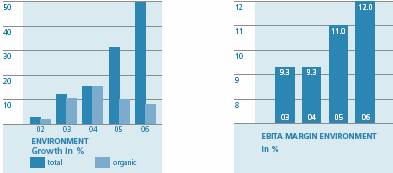
Excluding currency effect
Environment. The goal is to generate additional growth in Europe using American technology and GRiP® solutions and globally through the expansion of our services to multinational clients. In Asia, we are looking to strengthen ourselves through acquisitions and to improve services to multinational clients.
Growth continues, margin increased further With 50% growth, environment was again the fastest growing service area. Of this growth, 43% resulted from acquisitions. The acquisitions of BBL and Greystone in the United States were the largest contributors. The currency effect was a negative 2%. Organic growth was 8% and in large part came from the United States. The margin rose to 12.0% (2005: 11.0%), making environment the service area with the highest margin.
MDEQ in the United States
Redeveloping a wasteland into valuable property


Along the scenic banks of the Mississippi River, a 540-acre area, formerly a chemical plant, awaits a new purpose. ARCADIS together with its project partner is working to remediate and redevelop the area into a high-end commercial and residential site. By combining a guaranteed cleanup with attractive development opportunities, the trustee, the Mississippi Department of Environmental Quality, can be certain that remediation will begin immediately.
37
General Electric worldwide
Turning REACH into a competitive gain

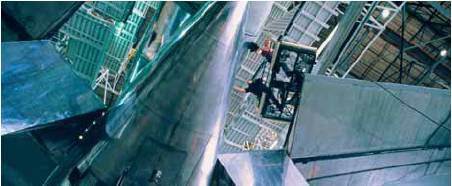
A sweeping new European chemical control law represents a significant business challenge for most ARCADIS/BBL industrial clients. The law – REACH – involves the registration, evaluation and authorization of at least 30,000 chemicals in the European Union between 2008 and 2018. If companies cannot provide sufficient information about their chemical products, these may be banned from commerce in Europe. REACH has been a strategic focus area for the Global Product Stewardship practice at BBL for many years. We assisted General Electric in developing and deploying a REACH management framework and tool chest. And we provided them insight into the potential impacts REACH may have for GE’s global businesses. By preparing GE well for REACH, we help them gain a competitive advantage.
In the United States, organic growth remained solid at 11%. This particularly was the result of increased revenues from GRiP® projects, more services to private-sector clients related to permitting and growth in due diligence consultancy related to acquisitions. In Europe, the strongest growth in activities occurred in the Netherlands and the United Kingdom. In the Netherlands, a large volume of work related to environmental impact assessments for energy infrastructure was performed. In the United Kingdom, ARCADIS was named the environmental consultant for the cleanup of the Buncefield oil terminal near London, where a huge explosion and fire occurred at the end of 2005. In Poland, a sharp revenue decline was experienced as a result of the completion of a number of projects and delays in new contracts. Brazil and Chile underwent strong growth particularly in industrial services, and Chile saw additional growth from mining companies.
GRiP® scores with private-sector clients Gross revenue under the GRiP® program in the United States again grew by 20%. As in 2005, the U.S. Department of Defense brought almost no new projects to market. However, ARCADIS was able to win one of the few assignments awarded: the remediation of the Picatinny Arsenal site in New Jersey, a $26 million contract. In addition, projects primarily for private-sector clients were won. In total, the number of new projects amounted to $94 million (2005: $60 million), bringing the backlog in GRiP® projects to $290 million (2005: $250 million). In Europe, GRiP® served as a good starting point for discussions with clients. However, in the end, a traditional remediation approach was often chosen, leading to additional work for ARCADIS.
RECLAIMSM applied in Vicksburg, USA Remediation of contaminated sites in combination with redevelopment is marketed by ARCADIS under the RECLAIMSM program. The fixed price remediation using GRiP® makes contaminated sites transferable and available for redevelopment. A good example is the former Vicksburg Chemical Company site in Mississippi. Together with a developer, ARCADIS arrived at a
38
solution whereby ARCADIS will perform the remediation and the developer the redevelopment. The project, encompassing 540 acres, is situated on the Mississippi River and will include commercial real estate, residential developments and an 18-hole golf course.
Strong revenue synergy with BBL The integration of BBL progressed well and will be completed during 2007. The first year after acquisition focused strongly on synergy through cooperation both in the United States and internationally. The result was approximately $25 million in synergy projects. With a growth of 20%, BBL also developed very well.
Portfolio in Europe strengthened With the acquisition of In Situ Technieken in the Netherlands and ECOLAS in Belgium, the European portfolio was strengthened. In Situ possesses an additional technology for soil remediation. ECOLAS offers a wide range of environmental services including, among other things, global product stewardship. This entails providing consulting services to companies related to the human and environmental health and safety risks of their products. BBL also has experience in this field. This is a fast-growing market as a result of new and changing legislation.
Outlook The growing attention for the environment is expected to lead to further growth in the global environmental market in the coming years. Greater environmental awareness globally leads to the development of new legislation and regulation, better compliance and additional initiatives among private-sector companies to manage environmental issues as part of their continuing emphasis on financial transparency, sustainability, and social consciousness. It also means further integration of environment into other activities: assessing investments on their environmental impact, sustainable construction and product stewardship. ARCADIS anticipates broadening its range of services to meet this rise in demand for a broad range of environmental services.
The backlog in GRiP® provides a solid basis for continued growth in the American market. Many companies want to dispose of older sites, offering opportunities for GRiP® in combination with redevelopment in both the United States and Europe. As a result of the integration of BBL, the client-focused business model was introduced. This is expected to help strengthen our position with large companies in the United States and internationally. With a coordinated market approach and global account management for multinational clients, a more rapid growth is achievable in Europe. The Brazilian market also offers ample opportunity for the expansion of activities. Chile remains focused on offering services to mining companies and multinational clients.
39

Developments by service area_Facilities
Activities in this service area involve facilities in which people live, work, shop, relax or otherwise spend time. Projects include office buildings, manufacturing facilities, hotels, shopping malls, hospitals, schools and stadiums. This service area comprises 17% of total revenues (2005: 16%).
Transition to higher added value successful The facilities market is mainly determined by real estate investments. Clients are often private investors (offices, commercial real estate) or institutions (hospitals, schools). However, the government can also be a client as an investor or market regulator.
In the past few years, a transition to activities with higher added value, to improve profitability, has been underway. The focus in this process was on expanding management services: project and program management and facility management. At the same time, detailed engineering activities were reduced through divestment, closure or outsourcing. As a result of this transition, our position in the facilities market was strengthened considerably.
Following is the SWOT analysis for facilities:
Strengths |
| Weaknesses |
Project, program and cost management |
| Limited presence in specific countries |
International network |
| Portfolio one-sided |
Independent position in facility management |
|
|
Opportunities |
| Threats |
Demand for integrated services, among other things through PPP |
| Sensitivity to economic cycles |
Growth of international real estate portfolios |
| Sudden declines in real estate investment |
Outsourcing of non-core activities by companies |
|
|
Goals in the facilities service area In this market, ARCADIS has the following goals:
· To become the benchmark project and program management firm for real estate investors;
· To be strong in facility management in select countries (the Netherlands, Belgium, Germany);
· Portfolio expansion with services with high added value;
· Organic growth: 5 to 10% per year; margin: 10 to 11%.
Through project and program management services, ARCADIS assists real estate investors in executing their investment programs. That is a solid basis for portfolio expansion, focusing on integrated services, high in the value chain. The ARCADIS network will be used to service international real estate investors and end users
40
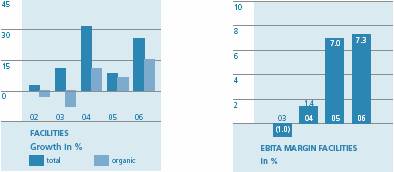
Excluding currency effect
throughout the world. To this end, the Worldwide Project Consulting (WwPC) initiative was launched and functions as a Transnational Growth Platform. Through facility management, we are able to capitalize on the growing trend among companies to outsource non-core activities. This often involves multiple-year contracts, thereby reducing the sensitivity to economic cycles in this service area.
Strong activity growth, slight margin improvement The activities grew 27%. Of this, on balance, 11% came from acquisitions and divestments. The decline resulting from the sale of the detailed engineering activities in the United States and our interest in Spain (both in the first half of 2005) was more than offset by the acquisitions of AYH (mid-2005) and Berkeley (mid-2006) in the United Kingdom, as well as PinnacleOne
Sabic in the Netherlands
Facilitating comfortable work space
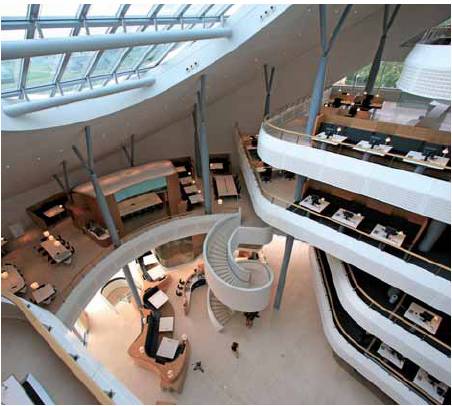

Sabic’s new headquarters is a landmark in the Limburg region’s landscape. Inside, the building fascinates with a splendid atrium that, thanks to its transparency and openness, fits Sabic’s values. ARCADIS provided the project management, supervision and engineering, with unique challenges: constructing the large pitched roof and achieving a comfortable interior climate. ARCADIS is now providing facility management services for the premises.
41
Arcelor in Belgium
Close partnership for quality improvements


Our relationship with steel giant Arcelor in Belgium is really a close partnership. Begun a few decades ago with the outsourcing of engineering and design work to a few ARCADIS project team members on-site, the relationship has since grown into a full-service facility management and building contract for technical installations and facilities with some ARCADIS employees working full time at Arcelor. Thanks to their long-term relationship with Arcelor, our employees have a thorough knowledge of the organizational structure and production processes, enabling us to proactively present proposals that optimize production processes and guarantee long-term quality improvements and cost reductions. This is a win-win situation for both companies.
(fall 2006) in the United States. The 16% organic growth was affected by the facility management contract with DSM/Sabic, including a considerable amount of services by third parties. Excluding this contract, organic growth was 9%. The margin increased to 7.3% (2005: 7.0%).
AYH, mainly active in the United Kingdom, had an excellent year. London’s selection as the 2012 Olympic city has already positively affected market demand. Because the new Arsenal stadium was finished on time and within budget, AYH is strongly positioned to become involved with some of the projects for the Olympic Games.
In the Netherlands, gross revenue (excluding the facility management contract with DSM/Sabic) grew 10%. The new head office of Sabic in Sittard, for which ARCADIS provided project management and construction supervision, as well as engineering services, was completed. Pre-qualification work also was completed for a number of large PPP projects, among which is the Kromhoutkazerne in Utrecht.
Belgium and France also saw healthy activity growth. In Belgium, services were provided at a Corus Aluminium site, part of the Aleris Groep, for which ARCADIS delivers projects in multiple countries. In Germany, growth occurred in the management services provided by ARCADIS Homola, but on balance, this was offset by the closure of the detailed engineering activities, leading to an overall decline in revenue.
ARCADIS Worldwide Project Consulting launched An increasing number of large real estate investors have international portfolios. Through ARCADIS’ WwPC initiative that was launched in 2006, we are striving to assist these international investors with their investment programs and the management of their real estate portfolios. This approach has already proven successful for clients like American Express, Cisco Systems and Isle of Capri Casinos. By adding strategic alliances to the already available ARCADIS network, coverage is now available in more than 60 countries.
42
United Kingdom further strengthened through acquisitions In the United Kingdom, Berkeley Consulting with approximately 100 employees active in project management, construction management and conflict mediation, mainly for infrastructure, was acquired. This acquisition is a solid addition for AYH, which mainly works for private sector clients. With this acquisition, AYH has grown to 500 employees, representing a solid position in the U.K. management services market.
Foothold in the United States After the sale – early 2005 – of the detailed engineering activities for buildings, activities in the facility segment in the United States were very limited. This changed with the acquisition in November 2006 of PinnacleOne, headquartered in Phoenix, Arizona. This company with 230 employees provides management services and functions as a consultant and construction project manager. The goal is to create solid growth in the coming years by, among other things, providing PinnacleOne access to the ARCADIS client base. In addition, we can now also serve international clients in the United States through our WwPC initiative.
Strong growth in facility management The joint venture ARCADIS Aqumen Facility Management (AAFM) saw strong growth, especially as a result of the new contract that became operational in early 2006 for DSM/Sabic in the Netherlands. In addition, activities grew as existing clients added new locations or as a result of expansion with new clients on sites where we were already active. Opportunities in the public sector are increasing, particularly related to PPP projects where facility management is a component of the project. Because AAFM concentrates on management services and outsources all other services, it has an independent position in the market.
Outlook A considerable portion of ARCADIS’ activities in the facilities market is located in Europe. The growing European economy has a positive effect on the real estate investment climate. With our strong focus on project management and cost consulting, we can benefit from this growing economy in the United Kingdom, the Netherlands and Germany. Markets in Belgium and France are also expected to remain favorable. In the Netherlands and the United Kingdom, the market for PPP projects in the semi-public sector is growing.
Recently acquired PinnacleOne has a large backlog and provides an excellent basis for further expansion in the United States. With the WwPC initiative, we can serve clients in multiple countries. Because of the considerable investment taking place in the Middle East, we are looking to add a partner in that area. Because no new large contracts were added to our backlog, growth in facility management is expected to be lower than in 2006. Many companies are interested in this concept, but outsourcing takes a great deal of time.
43

Developments by region
The Netherlands
Strong market recovery The Dutch market recovery was stronger and faster than expected. After a slight decline in 2005, gross revenue in 2006 rose 12% to € 323 million (2005: € 288 million). This strong growth was in part the result of the improved economy, increased outsourcing by government agencies and a breakthrough in PPP initiatives. The facility management contract for DSM/Sabic also contributed to the growth.
From 2003 to 2005, greater emphasis was placed on core activities, and non-core activities were sold. In addition, efforts to streamline the organization were successful, and a more entrepreneurial culture was developed. As a result, our position in the Netherlands was strengthened, enabling us to profit from the market recovery. Activities in all three service areas grew. PRC also expanded considerably, capitalizing on the increased demand for management and consultancy services and the greater emphasis on healthcare and education.
Considerable profit improvement Profitability improved considerably. EBITA rose 39% to € 17.4 million, compared to € 12.5 million on a recurring basis in 2005. This strong profit improvement was the result of activity growth, efficiency improvements from earlier restructurings and improved billability due to a higher workload.
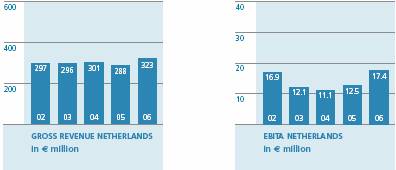
Recurring
44

Europe excluding the Netherlands
Slight revenue growth In Europe excluding the Netherlands (Belgium, Germany, France, the United Kingdom, Poland, the Czech Republic and Romania), revenue rose by 4% to € 278 million (2005: € 267 million). On balance, acquisitions and divestments contributed 2% to growth. The sale of our 50% interest in the Spanish company Grupo EP in mid-2005 continued to erode revenue but was offset by the solid contribution from acquisitions, especially from AYH in the U.K. (acquired mid-2005).
Organic growth was 2%. This relatively modest increase resulted from the reduction of detailed engineering in Germany, the delay of project starts in Poland and the transition to subsequent phases of work in several large projects in Belgium. In France, solid growth continued. The strongest increase occurred in the United Kingdom, where acquisitions and organic growth led to an overall increase in activities of 79%. In Belgium, Germany and the United Kingdom, smaller companies were acquired as valuable expansions of our existing portfolio.
Increase in profits limited EBITA rose 4% to € 18.8 million compared with € 18.1 million on a recurring basis in 2005. The contribution from acquisitions was largely offset by the 9% organic decline, which resulted from the same factors that contributed to the decline in revenues.
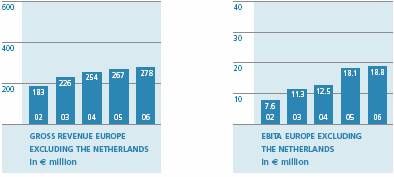
45

United States
Strong expansion of activities In the United States, gross revenue increased 49% to € 518 million (2005: € 349 million). Acquisitions, primarily of Greystone (in mid-2005) and BBL (in fall 2005) in the environmental market, contributed 39% to this strong growth. The currency effect was a negative 2%. The combined environmental and infrastructure markets saw an organic growth of 12%. The environmental market saw an organic growth of 11% – the third consecutive year above 10%. Infrastructure experienced pressure in the land development market, but this was more than offset by the growth in the water and transportation markets, resulting in an organic growth of more than 15%. The SAFETEA program that was signed into law in late 2005 resulted in a considerable number of new projects coming to market. The win – in early 2007 – of a 5-year IDIQ contract, with a maximum value of $150 million for hurricane protection for New Orleans, positions us strongly for 2007.
Acquisitions have served to strengthen our position and visibility in the U.S. market considerably. ARCADIS is now one of the key companies in the U.S. environmental market. The positive synergy and good strategic fit of the acquisitions resulted in revenue numbers that exceeded first-year expectations. BBL’s successful client-focused business model forms the basis for the integration and will be leveraged to further expand our activities for private-sector clients internationally. The acquisition of PinnacleOne strengthened our position in the American facilities market, providing the foundation for a new growth segment.
Strong profit growth EBITA rose 66%, totaling € 34.8 million (2005: € 20.9 million). Although a good deal of time was spent on the integration process, margins rose as a result of the excellent contribution to profits from the acquisitions and an organic income improvement of 14%.
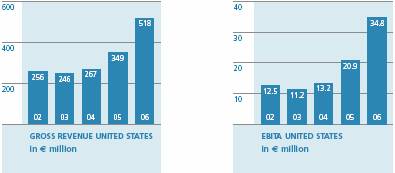
46

Rest of world
Organic growth mainly in Brazil Activities in the rest of the world include Brazil and Chile, as well as projects financed by donors such as the World Bank and the European Union in developing countries. Gross revenue increased 17% to € 113 million (2005: € 97 million). Divestments produced a revenue decline of 4%. The currency effect was 6% as a result of the strong increase in the value of the Brazilian real. The 15% organic growth primarily came from Brazil. Chile also saw healthy growth. Conditions in the donor-financed market were unfavorable, resulting in a decline of 12%.
Good profit growth EBITA was € 7.8 million (2005: € 5.8 million) and rose 34%. Of the organic profit increase, 28% was attributable to positive business conditions in Brazil, while Chile and the donor-financed activities also contributed to the profit improvement.
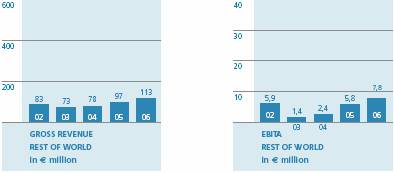
47
Human Resources Management
ARCADIS’ success is strongly determined by the knowledge, skills and the entrepreneurialism of our employees. Recruiting and retaining qualified, talented people is, especially in the current favorable market conditions, one of our main challenges. Key elements in our Human Resources Management (HRM) policy are:
· Professional recruitment and selection;
· Creating a stimulating work environment;
· Positive connection between performance and remuneration;
· Encouraging personal development and offering career opportunities;
· Training and education;
· Increasing diversity on various levels;
· Open communication;
· No discrimination or intimidation; and
· Healthy and safe working conditions.
Important principles are anchored in the ARCADIS General Business Principles.
At the corporate level, human resources activities are focused on designing effective succession plans for our key strategic positions, now and in the future. This involves early identification and the development of potential and successful leadership skills in staff. ARCADIS’ three core values are the basic principles of our human resources policy. We envisage a culture in which integrity, entrepreneurialism and agility are the bases for daily operations.
Recruitment and retention In many countries, labor market pressure is increasing. As a rapidly growing international company that - through its clients - is involved in appealing and innovative projects, ARCADIS is an attractive employer. To meet the increasing market demand, recruiting and retaining talented staff is a high priority. Our own employees are the best ambassadors of ARCADIS. In a number of countries, recruitment programs have been established so employees who refer qualified applicants then earn a referral bonus for the placement of that applicant. In addition, programs have been developed to encourage employees to stay with ARCADIS.
These include:
· Targeted career planning;
· Intensive coaching;
· Individual training programs;
· National and international networks of professionals within ARCADIS;
· Increasing (international) mobility, aimed at business and competence development.
Acclimating new employees quickly into the ARCADIS organization and culture is also a key goal. In Brazil for instance, the employee base grew from 400 to over 1,000 employees in two years time. Through interactive satellite trainings, new employees are familiarized with the organization and trained in specific knowledge and skills.
48
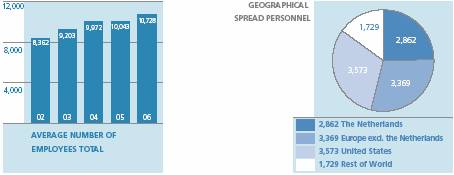
Including temporary staff Including temporary staff
Filling key positions To select and retain the right people in key positions, in 2005 ARCADIS began using a method to assess the personality, attitude and skills of applicants. In 2006, strengthening staffing for the strategically important Transnational Growth Platforms was given much attention.
Leadership development In 2006, 22 participants from seven countries began the eighth round of the Advanced Management Program (AMP). Apart from an introduction in strategy, marketing, human resources management and finance, the participants debate company policy with senior management. They work in teams on topics that are of strategic importance to the Company. Furthermore, ARCADIS initiated its Top Potential Program: the identification and assessment of top potentials, followed by the formulation of challenging development plans. This program will be enlarged in 2007.
Number of employees The total number of employees increased from 9,143 at year-end 2005 to 10,418 at year-end 2005. Including temporary and other staff, capacity at year-end 2005 totaled 11,533 employees (at year-end 2005: 10,101 employees). These increases resulted from acquisitions and strong organic growth.
Absenteeism Absenteeism strongly decreased. Overall, absenteeism declined from 2.4% in 2005 to 1.9% in 2006. The strongest declines appeared in Belgium, Poland, Germany and Brazil. The Netherlands experienced a slight increase.
Employee share purchase plan Since 2001, ARCADIS and the Lovinklaan Foundation have an employee share purchase plan. This allows employees to purchase ARCADIS shares from the Lovinklaan Foundation at a (predetermined) discount. The plan is intended to increase employee involvement in ARCADIS. The Lovinklaan Foundation, as a shareholder, represents the ARCADIS employees and had a stock interest of 20.9% at year-end 2006.
The plan currently applies to employees in the Netherlands, the United States, Belgium, Germany and France and is expected to become available to employees in the United Kingdom starting in mid-2007. The discounts are based on differences in legislation on a country-by-country basis. The shares and the discount related to them are provided by the Lovinklaan Foundation. The plan therefore does not lead to the purchase or issuance of shares by ARCADIS.
In 2006, employees bought 91,035 shares from the Lovinklaan Foundation. Of ARCADIS’ total staff, nearly 25% currently participate in the share purchase plan. The aim is to increase this participation to 30%. In the participating countries, the average level of participation is 29%.
49
Risk management
Increased emphasis on risk management Increasingly complex projects, changing roles of market participants and more stringent regulation and reporting demands underscore the importance of risk management.
Risks for ARCADIS include:
· Market risks: these include the risks that markets in which ARCADIS is active, temporarily or not, may decline and that change in market conditions can lead to increased competition. These risks can occur as a result of cyclical downturns, changes in political priorities or legislation and regulations, political instability or the consolidation/increase in proportion of clients and changes in their bidding behavior.
· Operational risks: these occur during the execution of our work. These include claims as a result of errors or shortcomings in activities, project losses, underutilization and vacant properties and risks related to partners and subcontractors, work in progress and receivables, as well as special projects, information and communication technology systems and health and safety.
· Financial risks: in general, these risks have a direct financial impact. They include seasonal effects, goodwill impairment, currency exchange rate and interest rate risks, project development risks, risks related to project assessments, taxes, liquidity, pensions, options, as well as risks related to acquisitions.
· Other risks: including risks related to the employment market, as well as risks related to reputation, integrity, fraud and compliance.
Risk management requires a healthy balance between entrepreneurship and recognizing and managing the risks that are associated with entrepreneurship. Important for good risk management at ARCADIS are (adherence to) internal approval and control systems, regular meetings with operating companies about business progress (including risks), the portfolio policy and account management, as well as measures related to information systems. The primary pillars in the management of operational risk are quality systems, the health and safety policy, contract management, project management, insurances, quality of employees and flexibility in staffing levels. For an extensive explanation of the risks mentioned above and the way in which these risks are managed, please refer to the Company’s website. This section of the website also includes a description of the different contract types under which ARCADIS offers its services.
The Executive Board is responsible for the design and functioning of the internal risk management systems. Although such systems are intended to optimally control risks, they can never, however well designed or functioning, provide absolute certainty that human error, unforeseen circumstances, material losses, fraud or infringements of laws or regulations will not occur. In addition, continuous evaluations of the effects of risk management systems and the costs incurred must occur.
50
Implementation of SOX 404 To comply with Section 404 of the Sarbanes-Oxley Act, a system of unidirectional procedures and related controls for core processes was introduced in 2004 to, with a degree of certainty, prevent or timely discover and repair material weaknesses in financial reporting. The internal control systems and procedures were evaluated to ensure proper financial reporting. In this process, the internationally acknowledged COSO framework was used. The general controls of all our relevant operating companies were assessed in the areas of management and supervision, risk management, information systems, project control and human resources management.
For the risks identified in specific operational processes, controls were established to manage the identified risks in operational processes. Explicit attention was given to the prevention of fraud. ARCADIS verified the effective functioning of these controls. Non-effective controls were evaluated for their impact and probability for material weaknesses in financial reporting and where necessary were adjusted. Through this process, we are able to assess whether or not the primary financial reporting risks are sufficiently under control.
The quality of this control framework is tested annually by management and verified and certified annually by the external auditor, and the results are reported in the Annual Report on Form 20-F. This will occur for the first time in spring 2007 for the situation at year-end 2006. Based on the process through preparation of the IFRS financial statements for 2006, the internal risk management systems for financial reporting are adequate and effective.
Risk management improved The introduction of SOX 404 helped improve awareness of risks and their control. Processes were modified, and management systems and procedures for procurement and authorization, documenting completed controls and tax and treasury guidelines were improved. 2006 also saw the introduction of a new consolidation system that improved the quality of the consolidation and financial reporting. Finally in 2006, preparations were completed for an Internal Audit function, which becomes effective in 2007. All these measures were discussed with the Audit Committee and the Supervisory Board.
Declaration regarding financial reporting risks Based on our evaluation, we are of the opinion that the risk management and control systems provide a reasonable certainty that the financial reports do not contain any errors of material impact and that these systems have performed as required in the reporting year. There are no indications that these systems will not properly function in 2007 as well.
51
Sustainable business conduct
ARCADIS conducts its business in a sustainable way, taking responsibility for the effects our activities have on the human habitat. Sustainable business conduct is anchored in our General Business Principles, which state that ARCADIS strives to compete and conduct its business honestly. Employees indicate support for this concept by signing our Integrity Code. More important, however, is the attitude and behavior of our people. This typifies the role ARCADIS has fulfilled in society throughout its more than 100-year history. Involved and inspired, contributing to the sustainable development of the human habitat. We do this in open communication with all stakeholders.
The environmental balance of our company is positive. This is because much of our business involves cleaning up contamination and reducing the environmental impact of activities and processes. We limit, to the extent possible, the environmental effects of our own activities. In addition, we are involved in society because social responsibility in part determines the success of our business. Integrity is one of our core values, and employees subscribe to this tenet by signing the Integrity Code. We have an active health and safety policy. And our corporate governance and social policy are in line with sustainable business conduct. More information on the latter two can be found elsewhere in this report. The other factors are discussed below.
The effect of our work on its surroundings
Impact of our projects The largest impact ARCADIS has on its surroundings is through the projects we execute for our clients. We consider sustainability to be part and parcel of our responsibility in these projects. Environmental projects often provide direct contributions to environmental improvement. In projects related to infrastructure or facilities, the consequences of these projects on the environment or the human habitat are an important consideration in our work.
We continually invest in the development of new technologies, products and services that create environmental benefits. In Germany, a floating windmill technology was developed, making the production of wind energy more economical by constructing wind towers that can be installed farther offshore in deeper sea beds. In the Netherlands, ARCADIS designed the recently opened 2,625-foot long nature bridge near Zanderij Crailo, the longest wildlife crossing in the world. In Belgium and the United States, we are assisting clients in understanding, managing and complying with REACH, the new European legislation for the registration, assessment and permitting of chemical substances. In the United Kingdom, we have received three sustainability awards for projects.
52
Sustainability in our own business conduct Due to the nature of our business, the environmental impact of our company’s activities is limited. We strive to operate in an environmentally friendly manner by encouraging double-sided copying, separating and/or recycling paper, limiting mileage usage on company cars (by fostering the use of video conferencing), encouraging the use of public transportation and using energy-efficient offices. To date, the company has not systematically managed and reported on all of these efforts as the costs involved would far outweigh the environmental benefit achieved.
Chinese Government at Leizhou Peninsula
Sustainable solution for a vulnerable coastline


Large-scale exploitation of the mangrove forests, conversion into farmland and urbanization have made the Leizhou peninsula vulnerable to typhoon damage. ARCADIS assisted the Chinese government reestablish its largest remaining mangrove forest to protect the coastline from typhoon damage. Enhancing the coastal mangrove ecosystem with fisheries and aquaculture will also improve the socio-economic conditions of local communities.
53
Art collection in ARCADIS
Supporting cultural goals

ARCADIS actively supports community activities and cultural developments. The Company has its own art collection. Its purchasing policy is aimed at the acquisition of modern art with the purpose of encouraging young artists. In the Netherlands, talented young artists receive grant money to participate in a resident study program at the Dutch Academy of the Arts, and we also sponsor the Prinses Christina competition for young musicians. In Brazil, we are producing a cultural calendar to promote local artists for the 20th consecutive year. In addition, ARCADIS sponsors the São Paulo Art Collection Center. Cole Morgan, 1950, USA ‘Where you live’, 2006 Mixed media ARCADIS Art Collection.
Social involvement
Working on projects in the community Together with the KNHM Foundation – a large shareholder in ARCADIS – we worked on a number of innovative projects aimed at contributing to the improvement of the human habitat. Employees are allowed to use a portion of Company time to participate in these types of volunteer projects. PRC employees worked in Hengelo, the Netherlands to complete improvements at a senior citizen nursing home. In Brazil, we contributed to the renovation of three historical church buildings.
Working on disaster relief and rebuilding In 2006, we completed projects that provided support to the victims of the 2004 tsunami. Donations collected in a company-wide fundraising effort and from the Lovinklaan Foundation, with cooperation from ABN AMRO bank, were invested in the construction of a solid waste collection system and ecological tourism facilities, as well as the reconstruction of rice paddies and irrigation systems. In New Orleans, we contributed to local repair and relief efforts for citizens. In Brazil, we donated to relief efforts for the flood victims in the southern Brazilian state of Santa Catarina.
Integrity as a principle
The ARCADIS General Business Principles This code serves as a guideline for our business decisions and activities and is applicable to all employees. The Business Principles detail our responsibilities to all stakeholders. With regard to society, this responsibility not only implies a commitment to abide by national laws and respect
54
local cultures but also implies a commitment to respect the environment when implementing a project. With regard to clients, our responsibility is to maintain professional integrity: reliability linked to an independent professional judgment and objectivity, as well as full transparency regarding possible conflicts of interest. With regard to employees, ARCADIS commits itself to being an equal opportunity employer, offering personal development and career opportunities in healthy and safe working conditions. With regard to shareholders, ARCADIS focuses on increasing shareholder value by achieving a responsible return on capital invested. The full text of the business principles can be found on the Company website.
Dealing with dilemmas Although the integrity code is prescriptive, it cannot possibly provide a solution for every dilemma we may face in our day-to-day activities. An active integrity policy ensures that possible problems are discussed and that responsibility is taken for the choices made. Employees are therefore encouraged to discuss issues with their supervisors.
Accountability The management of each operating company certifies the implementation of the Business Principles in a Letter of Representation. Employees will not be held responsible for the loss of work resulting from abiding by the General Business Principles. ARCADIS has also introduced a whistle blower policy for employees, so they will not suffer negative consequences for reporting violations of the code. However, an offense against these principles can lead to sanctions up to and including termination of employment with the Company.
Health and safety
Vision for a healthy and safe work environment In ARCADIS’ Business Principles, we have committed to offering a healthy and safe work environment for all our employees. To that end, a firm-wide health and safety policy was developed in 2006 that will be implemented in 2007. A proactive and preventative approach is the starting point for the policy. A culture of working healthy and safely has to be an integral part of the overall company culture and be reflected in the behavior of our employees.
Our goal is that no one gets hurt. To realize this, health and safety have been given the same priority as our other core values and are an integral part of the solutions we provide to our clients.
55
Uniform policy for the whole of ARCADIS In 2007, we will adopt a systematic approach for the management of health and safety risks throughout the entire company. This means that ARCADIS companies will:
· Comply with the applicable legal requirements;
· Define and assign responsibility for health and safety to line management;
· Identify and meet client-specific health and safety expectations without compromising our values;
· Assure the necessary health and safety competence of all staff and evaluate staff for positive health and safety behavior;
· Set meaningful targets for continuous improvement and develop and implement systems to achieve them;
· Actively promote our subcontractors to be in alignment with this health and safety policy;
· Track and report our health and safety performance.
Risk analysis and risk management are key To reach our health and safety goals, a management system comparable to a quality system was designed. Key to this system is the analysis of dangers and risks and the management of those risks. Our health and safety management system is linked with our existing quality systems. In addition, all near-misses of accidents will be reviewed to learn from them and prevent repetition. Finally, in 2007 ARCADIS will report on a number of health and safety key performance indicators.
Awards for healthy and safe behavior In the United Kingdom, ExxonMobil awarded ARCADIS the 2006 Award for Outstanding Safety, Health and Environment Achievement for Europe, Africa and the Middle East. In addition, the Royal Society for the Prevention of Accidents Silver Award for Occupational Safety 2006 was won, and an ARCADIS employee received the ExxonMobil Field Engineer Award, the third time this award was won by an ARCADIS employee.
56
Outlook 2007
Economic growth in Europe creates room for investments by governments and private sector companies. The number of PPP initiatives is growing internationally, allowing infrastructure bottlenecks to be remedied more quickly with private funding. In the Netherlands, demand for integrated area development is on the rise, while Belgium and France have large investments in the pipeline. Because of the availability of European funding, the market in Central Europe will remain attractive. Brazil also expects favorable market conditions. The IDIQ contract that was won in New Orleans early in 2007, will produce additional revenues.
The increased attention for environmental issues and climate change is positive for the environmental market. The backlog in GRiP® is large, and interest for this approach in combination with redevelopment is growing, in Europe also. The trend among multinational companies to outsource more work to international service providers offers opportunities to expand and diversify the services for private-sector firms. In facilities, growth will come from project management and cost consulting. The recently launched WwPC initiative was well received in the market.
The outlook for ARCADIS continues to be positive. Market conditions are favorable and offer ample opportunity to create further growth through synergy based on our strong home market positions. We continue to focus on higher added value activities and a strong client-oriented approach. Acquisitions are high on the priority list. Barring unforeseen circumstances, we expect continued growth in revenues and income for 2007.
Arnhem, the Netherlands, March 2, 2007
Executive Board
57

ARCADIS advised Akzo Nobel about ways to optimize the value of their site in Stuttgart, Germany, assisting them in making divestment decisions. In addition, we provided in-situ remediation services for cleaning up part of the site, earmarked for redevelopment.

Innovation
Innovation – Old industrial sites no longer need to be automatic write-offs. They have value. To the end-user and owner. Innovation can unlock that value. Smart remedial technology. A vision for the intended end-use. And plans to realize that vision. Redevelopment. Value created for the owner and community.
Dave Maggs (r) – Manager Productions & Logistics Decorative Coatings - Akzo Nobel
Thomas Mezger (c) – Manager Environmental Liabilities – Akzo Nobel
Karl Noe (l) – Project Manager ARCADIS
Mezger – Our Stuttgart plant suffered from overcapacity, so we decided to divest half of it. Local authorities wanted us to remediate the site before selling it. We needed a partner to do the remediation and advise us on asset management.
Maggs – Over the past years, ARCADIS had achieved major success for us at several sites, especially in reducing remediation costs and providing potential buyers.
Their global account team has been able to serve us wherever needed.
Noe – We provided Akzo Nobel with redevelopment scenarios and calculated the value of each option. This really added value in negotiations with the property developer.
Mezger – What’s more, by applying modern remedial technology, ARCADIS significantly reduced cleanup costs and liabilities.
Noe – We are able to do the job for substantially less than the projected costs. Our innovative in-situ technology destroys contamination in a natural way and is faster and more cost effective than traditional methods.
Maggs – Finally, our local stakeholders are also convinced of the sustainable value of the project.

Report by the Supervisory Board
2006 annual financial statements
This annual report has been prepared by the Executive Board and consists of the consolidated financial statements and the Company financial statements of ARCADIS NV over the book year 2006 with explanatory notes, as well as the report by the Executive Board covering the same period. Both of the financial statements have been audited by KPMG Accountants N.V. You will find the auditor’s approving report on page 132 of this annual report.
The ARCADIS Audit Committee has discussed the financial statements in detail with the auditor, the Chairman of the Executive Board and the Chief Financial Officer. The Audit Committee has also discussed the financial statements with the auditor, without the Executive Board, and found no discrepancies. In addition, the complete Supervisory Board and the Executive Board in the presence of the auditor discussed the financial statements. Also discussed with the Executive Board and the external auditor were the accountants’ report and the quality of the internal risk management and control systems. Based on a proposal by the Audit Committee, we agreed that the external auditor is independent.
We agree with the Executive Board’s proposal to set the dividend at € 1.00 per share to be distributed in cash. With this, we earmark € 20.3 million of the net income from operations for distribution to shareholders.
We agree with the financial statements and the accompanying documents. We recommend that shareholders adopt the 2006 financial statements of ARCADIS NV, including the dividend, as stated in the Executive Board’s proposal. Additionally, we request that shareholders discharge from all liability the members of the Executive Board with respect to their management of the Company during 2006 and the members of the Supervisory Board with respect to their supervision during 2006.
Result and strategy
ARCADIS achieved excellent results in 2006. Organic growth was well above target; margins improved considerably; and recent acquisitions contributed positively. This demonstrates that the ongoing strategy of focusing on core activities in home markets is yielding success and results in the creation of value growth for shareholders.
Our April Board meeting primarily concentrated on discussions regarding the Company’s long-term goals. Recent years’ developments and results were evaluated based on the Company’s strategy and goals, and its position in relation to competitors was discussed. Scenarios for meeting the Company’s specific goals and objectives were discussed, as were the risks associated with each scenario. In December, we discussed the outcome of the strategic planning process in the operating companies.
60
In 2006, the integration of acquisitions completed in 2005 was a priority. Nevertheless, several new acquisitions, which we consider to be valuable additions in ARCADIS’ home markets, were completed. These acquisitions were proposed for discussion by the Executive Board early in the process. Strategic and financial aspects were considered, as well as possible risks and future management.
Supervision and advice
Following a fixed schedule, six meetings were held between the Supervisory Board and the Executive Board in 2006. At these meetings, a number of recurring topics were discussed, including financial performance, possible risks and claims, the management of working capital and cash flow, progress in realizing the strategic goals and developments in the various operating companies. Press releases related to quarterly results were discussed with the Executive Board prior to publication. The Supervisory Board received the 2007 budget, including financial and operational goals, for review and agreed with it. Because the Company reached its margin goal in 2005, the Executive Board reevaluated the goal and discussed the conclusion with us. We find the new goal to be both ambitious and realistic. In addition, we agree with the change in the financing structure, from a decentralized financing approach to a more group financing system. In October, one additional (telephone) meeting was held regarding the acquisition of PinnacleOne Inc.
We received two updates, in the presence of the CEO of U.S. operations, about organizational developments in the United States related to the integration of Blasland, Bouck & Lee, acquired in 2005. The strategy and organizational development in the Netherlands was discussed by the ARCADIS Nederland management. PRC management arranged a presentation on public-private partnerships (PPP) for the redevelopment of the Zuidas in Amsterdam. In April, we visited Brazil, where ARCADIS Logos management updated us on business performance, economic development and the outlook in markets relevant to the Company.
We consider Human Resources Management a critical success factor for ARCADIS. In the presence of the Corporate Director of Human Resources Management, the senior management succession program for top potentials was discussed. Our Board agreed with the proposals of the Selection and Remuneration Committee with regard to:
· The granting of bonuses to the members of the Executive Board and the Senior Management Committee in March 2006 based on the results achieved in 2005;
· The variable remuneration policy in place for members of the Senior Management Committee, as of 2006, and for members of the Executive Board;
· The granting of performance-based shares and options to the members of the Executive Board and the Senior Management Committee in May 2006; and
· The issuance of performance-based options to key staff in May 2006.
61
Corporate Governance
Our Board endorses the framework and principles and best practice provisions of the Dutch Corporate Governance Code (the Code), with a few exceptions. These exceptions wherein ARCADIS applies different principles and practices, as well as the reasons, are provided in a separate section of this annual report. The way in which ARCADIS has implemented the Code was discussed and agreed to at the May 2004 General Meeting of Shareholders. With these steps taken, ARCADIS is in compliance with the Code.
ARCADIS is NASDAQ listed and therefore must comply with the Sarbanes-Oxley Act. In 2006, considerable effort went into ensuring compliance with the regulations regarding the reliability of financial reporting (Section 404).
The Supervisory Board considers ARCADIS compliant with the provision of the Code that stipulates that no more than one Supervisory Board member be non-independent. Mr. Rijnhard W.F. van Tets qualifies as non-independent under the Code because he is employed by ABN-AMRO Bank as an advisor to its Management Board. However, as he has not been involved in any operational activities since January 2002, the Supervisory Board considers him to be independent. According to the provisions and stipulations in the Sarbanes-Oxley Act, Mr. van Tets qualifies as independent.
In 2006, the Supervisory Board met twice in the absence of the Executive Board. On those occasions, the functioning of our Board, its members and committees was evaluated, and the preferred profile and composition of the Supervisory Board were discussed. It was concluded that, with few exceptions, members were able to attend the Supervisory Board meetings. The performance of the Executive Board and individual members was also evaluated. In addition, we discussed the qualitative goals for Executive Board members in 2007 as part of the bonus program.
Committees of the Supervisory Board
The Supervisory Board has created from its members an Audit Committee and a Selection and Remuneration Committee. These committees are tasked with preparing the work and decisions of the Supervisory Board. Both committees have charters outlining tasks and procedures. These charters are published on the ARCADIS website. Until May 2006, our Board also had an Integrity Committee. This Committee met once in 2006; its tasks and activities have now been integrated in the Audit Committee.
62
Audit Committee Members: Thomas M. Cohn (chairman), George R. Nethercutt and Rijnhard W.F. van Tets.
This committee met five times in 2006 with the Chairman of the Executive Board, the Chief Financial Officer and the external auditor. The committee met once with the external auditor without management. No discrepancies were identified during this discussion. In a closed meeting, the performance, independence, scope of the audit and the fee were evaluated, as was the performance of the committee itself.
The committee also discussed the financial statements, the related external auditor’s report and management letter, the quarterly reports and press releases, and potential claims and specific risks. Progress on implementing the compliance process for the Sarbanes-Oxley Act (Section 404) was discussed in every meeting. In addition, the creation of an Internal Audit function, the financing structure and the management information systems policy were discussed. We also discussed the application of the ARCADIS General Business Principles and the addition of a whistle blower regulation to the principles. One meeting was specifically focused on the 2005 annual report (ARCADIS Annual Report 2005 on Form 20-F) as filed with the Securities and Exchange Commission (SEC) in Washington, DC.
The Supervisory Board considers the Audit Committee members independent based on the criteria outlined in the Sarbanes-Oxley Act. The Supervisory Board has appointed from its members Mr. Rijnhard W.F. van Tets as the “Financial Expert” of the Audit Committee for both the Sarbanes-Oxley Act and the Code.
Selection and Remuneration Committee Members: Rijnhard W.F. van Tets (chairman), Carlos Espinosa de los Monteros, Jan Peelen and Gerrit Ybema.
The Selection and Remuneration Committee met four times in the reporting year, mainly in the presence of the Chairman of the Executive Board and the Corporate Director of Human Resources Management. Topics discussed included the variable remuneration for members of the Senior Management Committee, in which performance-based shares, in addition to a cash bonus, were introduced, consistent with the variable remuneration policy that was approved in 2005 for the Executive Board. Also discussed were the criteria for bonuses for the Executive Board and senior management in 2006, the granting of bonuses for that group based on 2005 financial results, the granting of options and shares to the Executive Board and the granting of options to key staff. The Committee was closely involved in the selection of the two new members of the Executive Board and their terms of employment.
For the 2006 remuneration report, please refer to page 70 of this annual report.
63
Composition Executive Board and Supervisory Board
In 2006, the Executive Board was expanded from two to four members in light of the growth and added complexity of the Company. In the Annual General Meeting of Shareholders on May 17, 2006, Mr. Friedrich M.T. Schneider was appointed a member, and Mr. Ben A. van der Klift was appointed a member and Chief Financial Officer of the Executive Board. We have approved the Charter of the Executive Board and the underlying division of tasks.
In accordance with the reappointment schedule, Mr. Rijnhard W.F. van Tets, Mr. Carlos Espinosa de los Monteros and Mr. Ross A. Webber stepped down at the conclusion of the Annual General Meeting of Shareholders on May 17, 2006. Mr. Espinosa de los Monteros and Mr. van Tets have been reappointed for a third term and second term, respectively. The Supervisory Board has reappointed Mr. van Tets as chairman. Mr. Espinosa de los Monteros has succeeded Mr. Webber as vice chairman. Mr. Webber was not eligible for reappointment because he had served the maximum three terms. He had been a member of the Supervisory Board since the merger with Geraghty & Miller, Inc. at the end of 1993. We are very grateful to him for his contributions from a U.S. perspective and particularly for his contribution related to U.S. integration activities. Mr. George R. Nethercutt has succeeded him as a member of the Audit Committee.
In accordance with the reappointment schedule, Mr. Gerrit Ybema’s term will end at the conclusion of the Annual General Meeting of Shareholders on May 16, 2007. Mr. Ybema is eligible for a second term. The Supervisory Board has decided to nominate him for reappointment.
For information on the members of the Supervisory Board, please refer to page 65 of this report.
Word of thanks
The successes achieved by the Company are largely the result of the quality, knowledge and dedication of the ARCADIS staff. We would, therefore, like to express our great appreciation to all employees for their contribution to the excellent results.
Arnhem, the Netherlands, March 2, 2007
On behalf of the Supervisory Board
Rijnhard W.F. van Tets, Chairman
64
Supervisory Board
1_Rijnhard W.F. van Tets, MSc (1947)-chairman_Dutch nationality
Audit Committee, Selection and Remuneration Committee (Chairman), term 2002-2006
Current position: Advisor to the Executive Board of ABN AMRO Bank (2002).
Previous positions: Banque Europeenne de Credit (Brussels) and Societe Generale (Paris) (1973-1975), Sogen Swiss and First Boston Corporation (New York: 1975-1983). Member of the Executive Board of ABN AMRO Bank (1988-2002).
Non-Executive Board functions: Chairman of the Supervisory Board of Wegener N.V. - Chairman of the Supervisory Board of Equity Trust SARL - Chairman of the Supervisory Board of Euronext Amsterdam N.V. Member of the Supervisory Board of Euronext N.V. - Member of the Supervisory Board of International Flavors & Fragrances I.F.F. (The Netherlands) Holding B.V.
Other functions: Chairman of the Investment Committee for the Building Industry Pension Fund
2_Thomas M. Cohn (1942)_Belgian and Israeli nationality
Audit Committee (Chairman) term 2004-2008
Previous positions: Chairman and CEO of the Executive Board, Siemens Nederland N.V. (1994-2003); CFO and Member of the Executive Board of Siemens Nederland N.V. (1987-1994); Various functions, i.e., Director of Economic Affairs for Siemens Belgium (1967-1987); “Industriekaufmann” for Siemens AG, Germany (1964-1967)
Non-Executive Board functions: Chairman of the Supervisory Board of Getronics Holdings B.V. - Member of the Supervisory Board of Corus Nederland B.V. - Member of the Supervisory Board of KEMA N.V. Member of the Supervisory Board of Recontec B.V.
Other functions: Chairman of the Advisory Board of Oracle Nederland B.V. - Board Member of the Foundation Techniek en Marketing (STEM) - Member of the Advisory Board of Fortis Bank, Rotterdam - Chairman of the Advisory Board of Pereira Van Vliet & Partners - Member of the Advisory Board of COMSEC Consulting Group (Israel) - - Member of the Monitoring Board of the University of Technology, Delft - Senior Advisor for ControlGuard Ltd. (Israel)
3_Carlos Espinosa de Los Monteros (1944)_Spanish nationality
Selection and Remuneration Committee, term 1998-2006
Current position: Chairman and CEO of DaimlerChrysler España (since 1990), Deputy Chairman for Inditex S.A. (ZARA)
Previous positions: Chairman of IBERIA Airlines (1983-1985).
Non-Executive Board functions: Member of the Supervisory Board of Acciona S.A.
4_George R. Nethercutt Jr. (1944)_U.S. nationality
Audit Committee, term 2005-2009
Previous positions: Member of the United States House of Representatives (1994-2005). During that time, he served on the Appropriations Committee and the Defense, Interior and Agriculture Subcommittees, as well as on the Science Committee and the Energy and Space Subcommittees. Practiced law in the private sector, focusing on corporate, estate and probate and adoption law (1977-1994). Worked for the U.S. Senator Ted Stevens in Washington, concentrating on oil and gas, natural resources, mining and trading affairs (1972-1977).
Other functions: Member of the Board of Directors of Hecla Mining Company - Member of the Board of Directors of The Washington Policy Center - Member of the Board of Directors of Juvenile Diabetes Foundation International - Chairman of the Permanent Joint Board on Defense, U.S./Canada
5_Jan Peelen, MSc (1940)_Dutch nationality
Selection and Remuneration Committee, term 2000-2008
Previous positions: Member of the Executive Committee of Unilever (1996-2000); several management positions within Unilever or subsidiary companies therein (since 1966).
Non-Executive Board functions: Chairman of the Supervisory Board of VVAA Group BV - Member of the Supervisory Board of Buhrmann NV - Member of the Supervisory Board of Albron BV - Member of the Supervisory Board of Royal Friesland Foods NV
Other functions: Member of the Monitoring Board of the Netherlands Genomics Initiative
6_Gerrit Ybema, MSc (1945)_Dutch nationality
Selection and Remuneration Committee, term 2003-2007
Previous positions: Several functions at the local authority and provincial levels. Member of the Dutch Parliament (1989-1998). Chairman of the Standing Committee of Finance (1994). During membership in the Dutch Parliament, also a member of several inquiry committees. State Secretary for Economic Affairs (1998-2002).
Non-Executive Board functions: Member of the Supervisory Board of n.v. NUON - Member of the Supervisory Board of CORDIS Europe N.V.
Other functions: Chairman of the Advisory Board for the Market - Chairman of the Monitoring Board of Zorggroep Noorderbreedte - Chairman of the Fair Wear Foundation - Chairman of the Frisian Harbour Days Foundation - Chairman of the Consultative Organ Frisian Language and Culture - Chairman of the Guarantee Committee of the VBO Real Estate Agents Certification Foundation (SCVM) - Member of the Monitoring Board of ROC Friese Poort
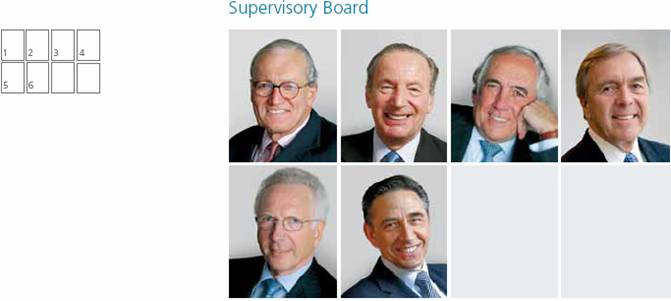
65
Executive Board and Staff Directors
1_Harrie L.J. Noy, MEng (1951)_Dutch nationality
Current position: Chairman of the Executive Board since 2000.
Previous positions: Has worked for ARCADIS in various management positions throughout his career, most recently as a member of the Executive Board.
Non-Executive Board functions: Member Supervisory Board NV Nederlandse Gasunie/Gas Transport Services BV
Other functions: Board member PSIB Foundation - Member Advisory Board Euronext - Board member VEUO (Dutch Association of Listed Companies) - Board member Management Studies (SMS) Foundation - Board member VNO-NCW - Member Supervisory Board College of Arnhem-Nijmegen - Chairman Supervisory Board Vilente Foundation
2_C. Michiel Jaski, MEng (1959)_Dutch nationality
Current position: Member of the Executive Board since 2000.
Previous positions: Various management positions at Shell and Philips.
Other functions: Chairman Monitoring Board Delta Foundation (primary education) - Member IUCN Netherlands Committee, Leaders for Nature - Board member STT (Foundation Toekomstbeeld der Techniek) - Member Advisory Board Delft University Fund - Board member Dutch-German Chamber of Commerce
3_Ben A. van der Klift, MSc (1959)_Dutch nationality
Current position: Chief Financial Officer since 2006.
Previous positions: Various financial positions at DHV and PRC Bouwcentrum. Joined ARCADIS in August 2004, Corporate Director of Finance since January 1, 2005.
Other functions: Board member Foundation ARCADIS Nederland Pension Fund
4_Friedrich M.T. Schneider, MA, PhD (1962)_German nationality
Current position: Member of the Executive Board since 2006.
Previous positions: Various management positions at Rheinhold & Mahla, Bilfinger Berger, Bentec and Preussag.
5_Craig E. Eisen, MSc (1951)_U.S. nationality
Director of Mergers and Acquisitions since 2002
6_Robert K. Goldman (1957)_U.S. nationality
Global Director Environment since 2007
7_Tom W. Haak, MSc (1956) _Dutch nationality
Director of Human Resources since 2006
8_Hans van Dord, MEng (1944)_Dutch nationality
Director of Business Development since 2000
9_Anja M. van Bergen-van Kruijsbergen, LLM (1961)_Dutch nationality
Company Secretary / General Counsel since 1996
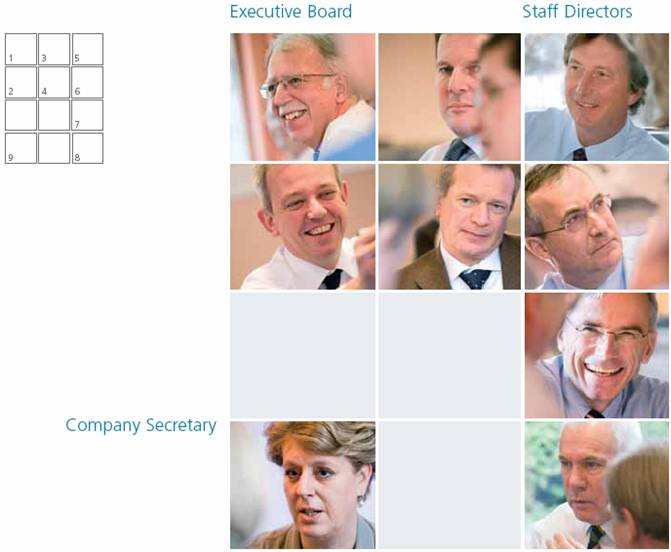
66
Other members Senior Management Committee
10_Marek Adamek, MSc (1960)_Polish nationality
CEO, ARCADIS Polska Sp.zo.o. since 2004
11_Ulrich Behr, Dipl.-Ing. (1952)_German nationality
CEO, ARCADIS Deutschland GmbH since 2005
12_Hernán Bezamat Cuadra, Civ. Eng. (1954)_Chilean nationality
CEO, ARCADIS Geotecnica Consultores SA since 2007
13_Steven B. Blake, MSc (1956)_U.S. nationality
CEO, ARCADIS U.S., Inc. since 2003
14_Leo van der Kemp, MSc (1956)_Dutch nationality
Managing Director of PRC BV since 2004
15_Douwe Kras, MSc (1948)_Dutch nationality
CEO, ARCADIS Nederland BV since 2004
16_Yann Leblais, MEng (1952)_French nationality
CEO, ARCADIS FCI SA since 2000
17_Antonio João Oliveira Rocha, BEng (1941)_Brazilian nationality
CEO, ARCADIS Logos Ltda. since 1999
18_Ludo Smans (1947)_Belgian nationality
Managing Director of ARCADIS Belgium since 1995
19_Peter Vince, MRICS (1958)_British nationality
Managing Director of AYH plc. since 2003
67
AYH provides project and cost management for the (re)development of casinos, hotels and restaurants for the Isle of Capri. Having established a close working relationship - with design teams also - we can meet the Isle’s goals anywhere.
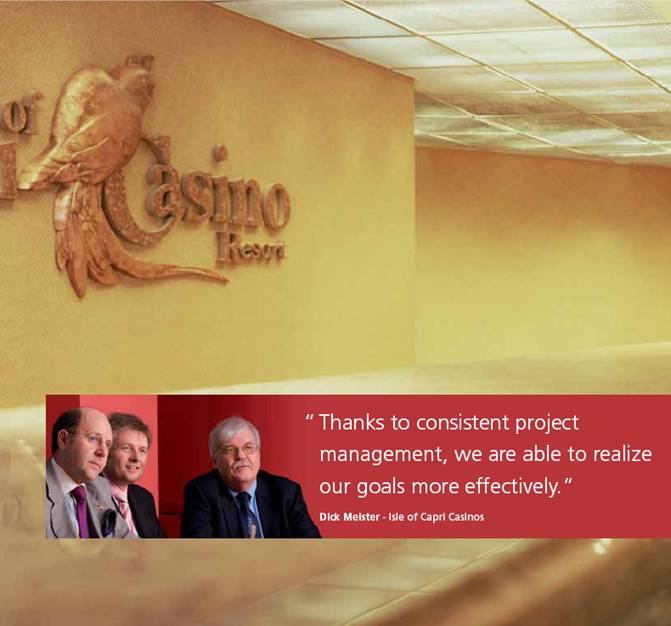
Consistency
Consistency — How to copy success. Apply a formula that works. Multiple times, exactly the same. Consistency counts. In every market, regardless of where you are. Investment projects managed to perfection. To ensure each client’s experience is great. To create a taste for luxury. Every time.
Dick Meister (l) — Vice President of Design and Construction — Isle of Capri
Peter Vince (c) — Managing Director AYH
Michael Calvert (r) — Project manager AYH
Meister — We approached AYH in 2003 to assist us with developing new casinos in the UK. We needed a partner to select design teams and provide project management services for the development process from feasibility to opening.
Vince — The Isle philosophy was to work with consultants who understand the Isle’s corporate aspirations.
Calvert — I worked closely with Dick to learn the needs of the Isle and translate them into a UK approach. After we selected teams, we began producing designs, documents and scheduling for the selected locations.
Meister — Following the UK experience, we asked AYH to project manage a bid for a casino license in the U.S. Through this developing relationship, AYH’s core values of management and cost control were seamlessly transferred to the U.S.
Calvert — We were contracted to provide cost management for a new casino. We involved CDG, our U.S. colleagues, and used AYH staff to supplement their expertise.
Vince — This way, we assured a consistent approach and added value and efficiency to the Isle’s developing business.

Remuneration Report
Remuneration Report
The Selection and Remuneration Committee of the ARCADIS NV Supervisory Board prepared this remuneration report, which is based on the remuneration policy that was accepted in the General Meeting of Shareholders on May 11, 2005.
Previously, the annual report contained the justification of bonuses granted to the Executive Board in the year under report, for the preceding year. Beginning with this annual report, a statement indicating the justification of bonuses granted for the year under report will be made. Following therefore is a discussion of the 2005 and 2006 achievements.
Remuneration Executive Board
Starting points for the remuneration policy
The Supervisory Board determines compensation for members of the Executive Board based on recommendations by the Selection and Remuneration Committee and within the boundaries of the remuneration policy. The policy aims at providing a compensation package to attract, motivate and retain qualified management. The total compensation package is generally commensurate with the average remuneration packages of a select labor market reference group. The remuneration package consists of a fixed salary, variable remuneration (based on short- and long-term criteria) and a pension plan. Variable remuneration is an important component of the total package and is based on performance criteria that are aimed at value creation in the short- and longer-term.
The labor market reference group consists of a number of Dutch companies that are comparable in complexity and size and a number of foreign companies active in the same sector as ARCADIS. These companies are Ballast Nedam (NL), Ten Cate (NL), Boskalis (NL), Draka Holding (NL), Fugro (NL), Grontmij (NL), PinkRoccade (NL), Pöyry (Fin), Alten (Fr), Tetra Tech (U.S.), Sweco (S) and WSP (U.K.).
The 2005 remuneration policy, a balance of the different remuneration components, has been designed in such a way that when all goals are achieved, the flexible remuneration, on average, is expected to comprise 50% of the total remuneration package (excluding pensions and fringe benefits). Because the numbers of conditional shares and options that are part of the package have been set for three years, the actual percentage of flexible remuneration can on balance (materially) differ from the percentage mentioned. The Selection and Remuneration Committee will review the
70
remuneration policy every three years to verify its market comparability with the labor market reference group. Material policy changes will be presented to the General Meeting of Shareholders.
Fixed annual salary
To reach a level consistent with the current average salary of the reference group, the 2004 salary was increased in two increments of 5% each (at July 1, 2005 and at July 1, 2006). This includes the annual adjustment based on general trends in wage costs.
ProRail in Amsterdam
Comfortable traffic junction
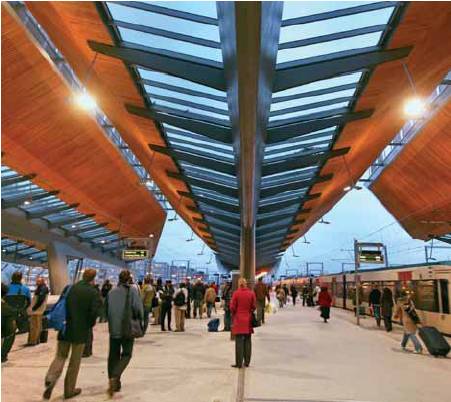

See and be seen was the starting point for the design of the Amsterdam Bijlmer station. The exceptional and transparent design of the building provides travelers a feeling of comfort and safety and gives a good overview. At peak hours, the station handles 25,000 travelers every 90 minutes. ARCADIS and its design partner succeeded in realizing a modern traffic interchange that meets the needs of its users and the municipality.
71
Dutch government in the Netherlands
Expanding transportation capacity quickly

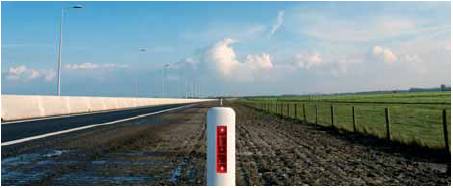
A number of traffic intersections in the Netherlands will soon undergo a transformation aimed at improving traffic flow. On behalf of the Dutch government, ARCADIS is preparing the expansion of three major highways. The 2 by 2 highways will be converted into 2 by 3 highways with emergency lanes.
The highway expansion is part of a program to quickly increase the capacity of a number of highways. ARCADIS is responsible for the area management, bidding procedures and project management of the contract preparations. In addition, we will perform the initial design work for the new lanes and viaducts, ever cognizant of the need to minimize traffic impediments by coordinating with other projects and sensibly planning construction. Construction will begin in early 2008, and the expanded highway will be ready for vehicle traffic at the end of 2009.
Short-term flexible remuneration: bonus
The bonus can vary from 0% to 60% of the fixed annual salary, with 40% (the target bonus) indicating that goals were met. Financial goals determine 75% of the bonus; non-financial goals, the remaining 25%. The goals are annually preset by the Supervisory Board. The financial goals and achievements for 2005 and 2006 are:
· Net income from operations per share (earnings per share - EPS) excluding currency effects, comprising 60%.
The EPS goals are related to the budget for the given year.
With an achieved EPS growth of 40% in 2005 and 50% in 2006, the maximum bonus percentage of 30% for this criterion was reached in both years.
· Return on capital invested (ROCI), comprising 40%.
The goal in principle is 15% but is annually weighted against the budget. With an ROCI of 20.6% in 2005 and 20.3% in 2006, the maximum bonus percentage of 20% was reached in both years for this criterion.
Non-financial goals are benchmarked against the specific responsibility of the individual board member. Non-financial goals cannot be exceeded; however, partial achievement is possible. The bonus percentage for this portion of the remuneration package in 2005 varied from 7% to 10% and in 2006 from 6% to 10%. This resulted in bonus awards in 2005 varying between 57% and 60% and in 2006 from 56% to 60% of the fixed annual salary.
Long-term flexible remuneration: ARCADIS shares and options
This portion of the remuneration package consists of performance-related (rights to the acquisition of) ARCADIS shares and is based on attaining a performance measure after three years. The performance measure is Total Shareholder Return (TSR), defined as share price increase plus dividend. This measure stimulates the creation of shareholder value in the longer term.
72
Each year, a three-year cycle begins, whereby achievements are measured at the end of the period against a peer group of companies of comparable size and breadth: URS (U.S.), WSP (U.K.), Atkins (U.K.), Alten (Fr), Tetra Tech (U.S.), TRC (U.S.), Grontmij (NL), Sweco (S) and Pöyry (Fin). ARCADIS’ position in the peer group determines whether the (conditional) options and shares granted earlier become unconditional according to the following table:
|
| Number of conditional options and shares that |
|
Position against peer group |
| become unconditional |
|
First |
| 150 | % |
Fourth |
| 100 | % |
Seventh |
| 50 | % |
Below seventh |
| 0 | % |
Between first and seventh |
| Determined by interpolation |
|
For 2005, the number of conditional options and shares for which Executive Board members are eligible for three years (2005-2007) are 25,000 options and 10,000 shares for the Chairman and 15,000 options and 7,000 shares for each member. These numbers have been approved by the General Meeting of Shareholders. When the awards were determined for 2006, a change in numbers was considered because of the strong increase in the ARCADIS stock price. It was decided not to change the number of conditional options and shares for Messrs. Noy and Jaski because the gain in the stock price can in part be attributed to their achievements. For Messrs. van der Klift and Schneider, who were appointed to the Executive Board in 2006, the numbers were set at 12,500 options and 5,000 shares.
The exercise price of options granted was the closing price of the ARCADIS share on the Euronext Exchange on the first day of trading after the General Meeting of Shareholders in which Company shares are traded ex-dividend. Options are valid for a 10-year period. Unconditional shares that are received by Executive Board members must be retained for a period of at least two years.
Pensions and early retirement
Members of the Executive Board participate in the pension plan of the Dutch ARCADIS operating companies. This is a premium-based collective plan having as its goal a pension that, under selective criteria, is comparable to the average pay. The recommended retirement age is 63 years. Contribution to this plan is 6% of the salary at which the pension is calculated. Mr. Schneider gets compensation for the limited fiscal deductibility due to the fact that he lives in Germany.
73
Members of the Executive Board receive reimbursement for expenses, as well as other customary fringe benefits such as a company car. Members of the Executive Board can participate in the ARCADIS NV 2002 Employee Share Purchase Plan, under which to a maximum of € 400 per month of ARCADIS NV shares can be bought from the Lovinklaan Foundation at a discount.
Employment contracts and severance pay
Messrs. Noy and Jaski have been appointed for an indefinite period. Their contracts do not contain details regarding fixed severance pay. For the members of the Executive Board appointed in 2006, Messrs. van der Klift and Schneider, a four-year term limit and a maximum severance pay of one year’s salary have been set. There are no agreements in place between management and ARCADIS NV determining severance payments at the termination of a labor contract resulting from a public bid on the firm.
For an overview of the remuneration of the Executive Board, please refer to page 128, and for information on shares and options held by board members, please refer to page 128 of this annual report.
Remuneration Supervisory Board
In 2004, the General Meeting of Shareholders changed the compensation for Supervisory Board members; additional compensation was granted for membership on board committees. Compensation for a Supervisory Board member is not dependent on Company results. A Supervisory Board member is not eligible to receive (rights to) ARCADIS shares. Possible share ownership of ARCADIS shares by a Supervisory Board member is a long-term investment.
For an overview of remuneration and share ownership, please refer to pages 129 and 130 in this annual report.
Other information
The Company has not pledged any loans, guarantees or other benefits to members of the Executive Board and Supervisory Board. In 2005, ARCADIS NV granted members of the Executive Board indemnification for costs related to their positions. A similar indemnification was provided to the members of the Supervisory Board in 2005, as approved by the General Meeting of Shareholders.
74
During the year under report, no transactions took place introducing conflicts of interest for Executive Board members or Supervisory Board members that are material to the Company.
On behalf of the Selection and Remuneration Committee, Rijnhard W.F. van Tets, Chairman
Empresa de Pesquisa Energética in Brazil
Sustainable energy solutions

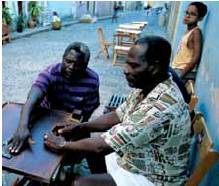
To feed Brazil’s growing need for energy, ARCADIS is evaluating the environmental sustainability of the Tocatins River basin in the Amazon for potential energy production. We will identify existing and possible conflicting areas and will also provide recommendations for environmental management for the longer term. While involving all regional stakeholders, the study also focuses on the socio-economic aspects of the river.
75
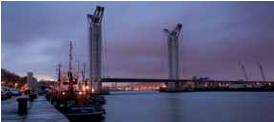
The 6th bridge over the Seine River in Rouen is the primary section of a new direct link between the A13 highway to the south and the A150 highway to the north. It will carry 50,000 vehicles a day and reduce car traffic in the city center.
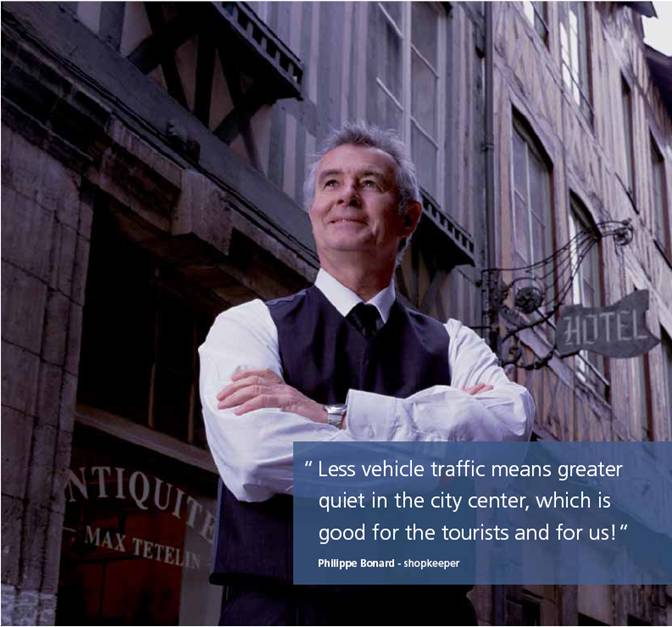
Creativity
Creativity — Landmarks are not born, they are made. Taking what needs to be done to a next level. Applying creativity to enhance value. Function and form combined. The old and the new, matched to perfection. Balanced yet beautiful. A must-see design that works.
Frederic Carmillet (l) — Civil engineer - Public Works Department
Michel Moussard (r) — Business Practice Manager for Civil Engineering and Bridges — ARCADIS
Carmillet — The design of the sixth bridge over the Seine River had to take into account a number of external challenges. The bridge couldn’t affect the historic view of Rouen, with its famous cathedral. And, it needed to allow sea traffic, including the large sail boats of the Armada event, to go upriver near the city center.
Moussard — With the Papillon, we combined innovative technology and elegant design. The lift bridge with four elegant vertical piers has two decks moving horizontally, thanks to an ingenious upper cable system that is included in a butterfly steel structure. The bridge can be raised to 180 feet, which makes it the highest vertical lift bridge in the world!
Carmillet — With this height, it can easily allow the passage of large yachts.
Moussard — All in all, the bridge forms a harmonious link between the historic center dominated by the cathedral and the port facilities and cranes.
Carmillet — Indeed, while the butterflies provide a striking view, the structure is well integrated into Rouen’s urban landscape.
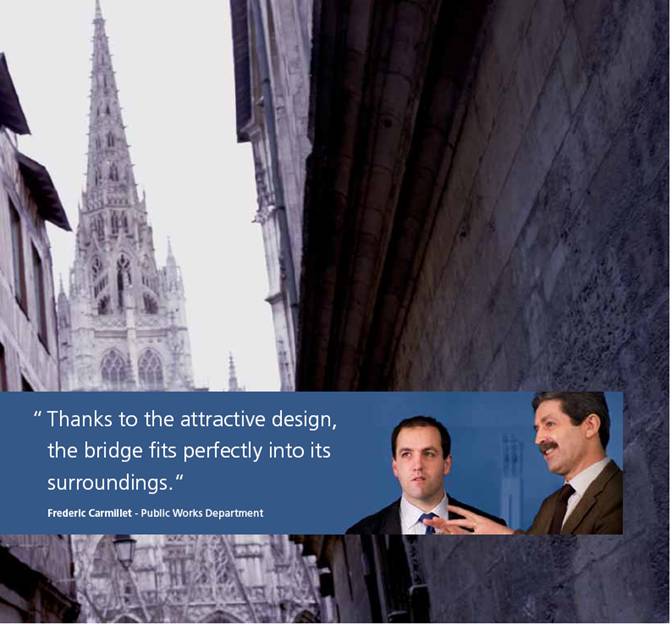
Corporate Governance
Corporate Governance
Introduction
Integrity, transparency and accountability are key components of our corporate governance structure, as is a strong supervision of management. ARCADIS is committed to the principles and best practice provisions contained in the Dutch Corporate Governance Code (the Code) that became effective in 2003, with a few exceptions. Our 2003 annual report extensively described the corporate governance structure of the Company and adherence to the Code. At the May 12, 2004 General Meeting of Shareholders, the way in which ARCADIS would apply the Code was discussed and approved. With the implementation of that decision, ARCADIS is in compliance with the Code. Material changes in the corporate governance structure will be submitted for consideration to the General Meeting of Shareholders.
An overview of ARCADIS’ corporate governance structure and an explanation of ARCADIS’ departures from the principles and best practice provisions of the Code are provided below. For more detailed information, please visit the ARCADIS website (www.arcadis-global.com).
Organizational structure
ARCADIS NV is a Dutch naamloze vennootschap (public limited company) under Dutch law and, since the amendment of its Articles of Association in 2003, an international holding company according to Dutch regulations. This means that, unlike under a statutory structure regime, there are no limitations on the influence of shareholders, and Executive Board members and the Supervisory Board members are appointed and dismissed by the General Meeting of Shareholders.
Based on a proposal by the Executive Board, the General Meeting of Shareholders can with Supervisory Board and Stichting Prioriteit ARCADIS N.V. (Priority Foundation) approval amend the Articles of Association. Such a decision requires a majority of at least three-fourths of the votes in a meeting where at least three-fourths of the outstanding capital is represented.
Executive Board
The Executive Board is responsible for the management of the Company, which means among other things that it is responsible for the realization of the Company’s goals, strategy and policy and the ensuing development of profits. The Supervisory Board determines the number of members of the Executive Board who are appointed by the General Meeting of Shareholders. For every appointment, the Supervisory Board is entitled to propose a nomination. If the nomination is binding, the General Meeting may only defeat the nomination by a resolution passed by a majority of at least two-thirds of votes cast, representing more than half the issued capital. If the nomination is non-binding, the General Meeting decides by simple majority. The Supervisory Board appoints a Chairman from among the members of the Executive Board and, in consultation with the Executive Board, allocates responsibilities.
78
The General Meeting of Shareholders can suspend or dismiss a member of the Executive Board. Such a decision, other than proposed by the Supervisory Board, requires a majority of at least two-thirds of votes cast, representing at least one-half of the outstanding capital.
An overview of the current composition of the Executive Board can be found on page 66 of this annual report. The current members of the Executive Board hold no supervisory board positions at other stock exchange-listed companies.
Supervisory Board
The responsibility of the Supervisory Board is to supervise management policy and the day-to-day operation of the Company and its affiliates. It also advises the Executive Board. The Supervisory Board must be comprised of at least three members (currently six) who are appointed by the General Meeting of Shareholders in the same way as the members of the Executive Board except for the majority condition. If shareholders decide to defeat a binding nomination, they need a resolution passed by a majority of at least two-thirds of votes cast, representing more than one-third of the issued capital. The Supervisory Board members appoint a chairman from their own ranks. Supervisory Board members are appointed for a maximum of four years, after which they may or may not be reappointed. After the first term of office, Supervisory Board members are only eligible to serve two additional full terms, which means the maximum term of office is twelve years.
The General Meeting of Shareholders can suspend or dismiss a member of the Supervisory Board. Such a decision, other than proposed by the Supervisory Board, requires a majority of two-thirds of votes cast in a meeting where at least one-third of the outstanding capital is represented.
The Supervisory Board has created two internal committees: an Audit Committee and a Selection and Remuneration Committee. These committees prepare the activities and decisions of the Supervisory Board. The tasks and procedures of the committees are outlined in charters.
An overview of the current composition of the Supervisory Board can be found on page 65 of this annual report. All members of the Supervisory Board, except one, are independent as defined by the Code. According to Sarbanes-Oxley Act criteria, all members of the Supervisory Board qualify as independent. None of the members of the Supervisory Board hold more than five supervisory board positions at Dutch stock exchange-listed companies (a chairmanship counts as two memberships).
General Meeting of Shareholders
A General Meeting of Shareholders is held each year. Other shareholders’ meetings may be held at the request of the Executive Board or the Supervisory Board. Shareholders who represent at least 10% of the Company’s issued capital may also convene a meeting. The party convening the meeting prepares the agenda for the meeting. Shareholders who represent at least 1% of the Company’s issued capital may submit proposals up to 60 days prior to the meeting. All shares carry voting rights pro rata to the nominal value of the shares. Resolutions are adopted by absolute majority of votes cast unless the law or Articles of Association prescribe a qualified majority. The holder of the priority shares has a number of special rights according to the statute.
79
ARCADIS advocates active shareholder participation at shareholders’ meetings. Shareholders who hold their shares through the NASDAQ have been able since 1993 to take part in the adoption of resolutions by means of “proxy solicitation.” The option of a “record date” has been incorporated into ARCADIS’ Articles of Association since 2002.
For an overview of the main responsibilities of the General Meeting of Shareholders, as well as the Articles of Association of the Company, please visit the ARCADIS website.
Capital and shares
ARCADIS has ordinary shares, cumulative financing preference shares, priority shares, and cumulative preferred (protective) shares. For a further explanation of the capital structure and the issuance or purchasing of shares, please refer to Note 11 in the Financial Statements (page 104). Priority shares and cumulative preferred shares have special meaning in relation to the governance.
Priority shares The 200 priority shares are held by the Stichting Prioriteit ARCADIS NV - ARCADIS Priority Foundation. Important decisions regarding the Company’s development require prior approval from the holder of these 200 priority shares. Important decisions include the issuance, acquisition or disposal of shares in the Company; amendments to the Articles of Association; dissolution or filing for bankruptcy; cooperative ventures of far-reaching significance and major divestments and acquisitions. The board of the Foundation has equal representation: 10 members from the Executive and Supervisory Boards of the Company and 10 members from ARCADIS’ international employee base. Decisions require a voting majority of at least 60%. Therefore, the composition of the Foundation is a touchstone for ensuring a level of support from the employee base for far-reaching decisions. For more information, please refer to page 104 of this annual report.
Cumulative Preferred Shares In the event of an unfriendly or a hostile takeover attempt, these shares are intended to prevent major changes in the control of the Company without due consideration of the interests of the Company and all those involved with it. To this end, an option agreement has been signed with the Stichting Preferente Aandelen ARCADIS NV (ARCADIS Preferred Stock Foundation). For more information, please refer to page 105 of this annual report.
Financial reporting and the external auditor
Before being presented to the General Meeting of Shareholders for adoption, the Company’s annual financial statements as prepared by the Executive Board must be examined by an external “certified public accountant.” The Audit Committee advises on the (re)appointment of the external auditor, and the General Meeting of Shareholders has the authority to appoint the auditor. Should the General Meeting choose not to use this authority, the auditor is appointed by the Supervisory Board. The external auditor’s assignment (including his remuneration) for the performance of audit activities is approved by the Supervisory Board on the recommendation of the Audit Committee.
80
Pursuant to the Sarbanes-Oxley Act, all the accounting firm’s services outside the audit of the annual financial statements are verified in advance by the Audit Committee to ensure the auditor’s objectivity and independence. In addition, the Sarbanes-Oxley Act stipulates certain services that may not be provided by the external auditor and requires companies to change their audit partner every five years. ARCADIS changed its partner in 2001 and 2006.
The quarterly financial statements and quarterly reports are discussed with the Audit Committee in preparation for their consideration by the Supervisory Board. This is done prior to the publication of the quarterly results and in the presence of the external auditor. The external auditor attends the meeting of the Supervisory Board in which the annual financial statements and the half-year results are discussed.
Departures from the Code
The following sections describe ARCADIS’ departure from the Code.
· The provision concerning the maximum four-year term of office (II.1.1) will not be observed for the members of the Executive Board who were appointed in 1994 and 2000 as their contracts stipulate that they have been appointed for an indefinite period. This complies with the preamble to the Code that indicates that existing contracts will be honored. For the two members appointed to the Executive Board in 2006, the four-year term limit has been imposed.
· The contracts of the two directors who were appointed prior to the introduction of the Code do not provide for (maximum) severance pay (II.2.7). Consequently, in the event of involuntary dismissal, compensation will be determined in light of applicable statutory regulations, the grounds for dismissal, the salary and the legal position of the person concerned as determined, inter alia, by length of service at the Company. For the two new members of the Executive Board appointed in 2006, a maximum severance pay in line with the Code has been established.
· ARCADIS does not have a separate remuneration committee and selection and appointment committee (III.5) but combines both committees as the Selection and Remuneration Committee in keeping with the practice established in 1998. The current size of the Supervisory Board, the allocation of responsibilities among its members and the fact that the current committee is functioning satisfactorily justifies this departure. The Chairman of the Supervisory Board also chairs this committee. This is a departure from best practice provision III.5.11.
· Only the General Meeting of Shareholders can cancel the binding nature of the appointment or dismissal of an Executive Board member or a Supervisory Board member with a qualified majority. When the Articles of Association were amended in 2003 to abandon the statutory structure regime of the Company, this proportion of required votes was selected based on the percentage of shareholders’ interest in the Lovinklaan Foundation. The amendment stated that nominations to the Executive Board would normally be binding, whereas nominations to the Supervisory Board would, under normal circumstances, be non-binding. The shareholders agreed to this procedure at their meeting in 2003. This is a departure from best practice provision IV.1.1.
81
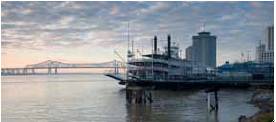
ARCADIS in a joint venture with Bioengineering Group has a framework contract to provide sustainable design services for hurricane protection primarily within the New Orleans district for the New Orleans District of the U.S. Army Corps of Engineers.
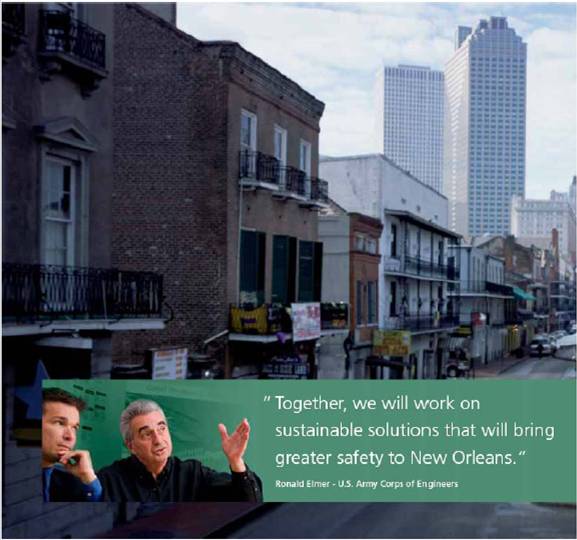
Safety
Safety – A warning sign of global warming. Floods destroying neighborhoods. A city under siege. Never again. Safety is the key to the solution. Dry feet for more than a few decades. Designs you can rely on. For protection. For life. Forever.
Ronald Elmer (r) – Project Chief Hurricane Protection Office, New Orleans District, U.S. Army Corps of Engineers
Rudy Guichard (l) – Principal-in-Charge, ARCADIS
Elmer – Rebuilding and improving the hurricane flood protection system for greater New Orleans requires the very best engineering expertise. We needed partners who could offer outstanding expertise and experience in flood protection, with a local presence and thorough understanding of the Corps.
Guichard – Our experienced local staff combined with the extensive flood protection experience of our Dutch colleagues enable us to provide a unique team.
Elmer – Your team will be challenged to develop sustainable solutions that will make the New Orleans district safer.
Guichard – So, we will study, design, and manage the construction of levees, floodwalls and closure gates to better protect the local communities. Additionally, we will launch innovative concepts such as “smart” levees with embedded sensors, warning signs that supply an added safety measure to the New Orleans region.
Guichard – We welcome your support and commitment to protect the people of Louisiana against flooding. We intend to work collaboratively to make greater New Orleans a secure area in which to live and work.

Financial Statements 2006
Consolidated balance sheet at December 31
Consolidated balance sheet at December 31
Assets |
| 2006 |
| 2005 |
|
Non-current assets |
|
|
|
|
|
Intangible assets (1) |
| 154,170 |
| 127,861 |
|
Property, plant & equipment (2) |
| 55,006 |
| 55,994 |
|
Investments in equity accounted associates (3) |
| 5,227 |
| 7,451 |
|
Other investments (4) |
| 6,202 |
| 1,939 |
|
Other assets (5) |
| 5,810 |
| 10,683 |
|
Deferred tax assets (13) |
| 8,291 |
| 13,212 |
|
Total non-current assets |
| 234,706 |
| 217,140 |
|
Current assets |
|
|
|
|
|
Inventories (6) |
| 451 |
| 374 |
|
Derivatives (7) |
| — |
| 1,723 |
|
(Un)billed receivables (8) |
| 373,428 |
| 321,013 |
|
Other current assets (9) |
| 23,836 |
| 31,950 |
|
Corporate income tax receivables |
| 2,561 |
| 4,037 |
|
Cash and cash equivalents (10) |
| 101,488 |
| 73,884 |
|
Total current assets |
| 501,764 |
| 432,981 |
|
Total |
| 736,470 |
| 650,121 |
|
|
|
|
|
|
|
Equity and liabilities |
|
|
|
|
|
Shareholders’ equity |
|
|
|
|
|
Share capital |
| 1,030 |
| 1,030 |
|
Additional paid-in capital |
| 44,153 |
| 44,153 |
|
Reserve exchange rate differences |
| (7,659 | ) | 6,403 |
|
Retained earnings |
| 106,421 |
| 91,203 |
|
Net income |
| 44,936 |
| 33,414 |
|
Total issued capital and reserves attributable to equity holders of the Company |
| 188,881 |
| 176,203 |
|
Minority interest |
| 11,836 |
| 11,885 |
|
Total equity (11) |
| 200,717 |
| 188,088 |
|
Non-current liabilities |
|
|
|
|
|
Provisions (12) |
| 19,943 |
| 15,818 |
|
Deferred tax liabilities (13) |
| 20,444 |
| 26,252 |
|
Long-term debt (14) |
| 119,286 | �� | 116,149 |
|
Derivatives (7) |
| 5,829 |
| — |
|
Total non-current liabilities |
| 165,502 |
| 158,219 |
|
Current liabilities |
|
|
|
|
|
Billing in excess of cost (8) |
| 111,882 |
| 89,269 |
|
Corporate tax liabilities |
| 1,913 |
| 8,172 |
|
Current portion of long-term debt |
| 1,580 |
| 2,456 |
|
Accounts payable |
| 87,052 |
| 72,517 |
|
Accrued expenses |
| 24,885 |
| 12,587 |
|
Other current liabilities (15) |
| 142,939 |
| 118,813 |
|
Total current liabilities |
| 370,251 |
| 303,814 |
|
Total |
| 736,470 |
| 650,121 |
|
Amounts in thousands of euros unless otherwise stated
The Notes on page 98 to page 121 are an integral part of these financial statements
86
Consolidated statement of income
Consolidated statement of income for the year ended December 31
|
| 2006 |
| 2005 |
|
Revenues |
| 1,235,479 |
| 999,743 |
|
Gain on sale of investments |
| — |
| 2,893 |
|
Change in work in progress |
| (2,436 | ) | (1,537 | ) |
Gross revenue (16) |
| 1,233,043 |
| 1,001,099 |
|
Materials, services of third parties and subcontractors |
| 395,583 |
| 297,849 |
|
Net revenue |
| 837,460 |
| 703,250 |
|
Personnel costs (17) |
| (581,333 | ) | (484,481 | ) |
Other operational costs (17) |
| (159,643 | ) | (143,204 | ) |
Depreciation (1 and 2) |
| (17,733 | ) | (15,210 | ) |
Amortization identifiable intangible assets (1) |
| (8,270 | ) | (5,967 | ) |
Operating income |
| 70,481 |
| 54,388 |
|
Financial income |
| 14,116 |
| 2,784 |
|
Financial expenses |
| (10,063 | ) | (6,351 | ) |
Fair value change of derivatives (7) |
| (7,552 | ) | 1,723 |
|
Total financing items (18) |
| (3,499 | ) | (1,844 | ) |
Income from associates |
| (458 | ) | 1,382 |
|
Income before taxes |
| 66,524 |
| 53,926 |
|
Income taxes (19) |
| (20,119 | ) | (17,342 | ) |
Profit for the period |
| 46,405 |
| 36,584 |
|
Attributable to: |
|
|
|
|
|
Net income (Equity holders of the Company) |
| 44,936 |
| 33,414 |
|
Minority interest |
| 1,469 |
| 3,170 |
|
Profit for the period |
| 46,405 |
| 36,584 |
|
Earnings per share (in euros) |
|
|
|
|
|
Basic |
| 2.22 |
| 1.65 |
|
Diluted |
| 2.13 |
| 1.60 |
|
Weighted average number of shares used to compute income per share: |
|
|
|
|
|
Basic |
| 20,234,295 |
| 20,260,712 |
|
Diluted |
| 21,074,137 |
| 20,816,777 |
|
Net income from operations |
| 2006 |
| 2005 |
|
Net income |
| 44,936 |
| 33,414 |
|
Pensions |
| — |
| (394 | ) |
Net effect of financial instruments* |
| (802 | ) | (1,213 | ) |
Non-recurring income net of taxes |
| — |
| (2,486 | ) |
Amortization identifiable intangible assets |
| 5,901 |
| 4,045 |
|
Net income from operations |
| 50,035 |
| 33,366 |
|
Net income from operations per share (in euros) |
|
|
|
|
|
Basic |
| 2.47 |
| 1.65 |
|
Diluted |
| 2.37 |
| 1.60 |
|
* Net effect of financial instruments: the currency translation adjustment of the US$ 120 million loan and the fair value change of the swaps, and after taxes.
Amounts in thousands of euros unless otherwise stated
87
Consolidated cash flow statement
Consolidated cash flow statement for the year ended December 31
Cash flow from operating activities |
| 2006 |
| 2005 |
|
Profit for the period |
| 46,405 |
| 36,584 |
|
Income from associates |
| 458 |
| (1,382 | ) |
Taxes on income |
| 20,119 |
| 17,342 |
|
Financing income / expenses |
| 3,499 |
| 1,844 |
|
Operating income |
| 70,481 |
| 54,388 |
|
Depreciation and amortization |
| 26,003 |
| 21,177 |
|
Operating cash flow before changes in working capital and provisions |
| 96,484 |
| 75,565 |
|
Share-based compensation |
| 1,751 |
| 561 |
|
Dividend received |
| 1,532 |
| 632 |
|
Sale of activities, net of cost |
| — |
| (2,486 | ) |
Interest received |
| 8,703 |
| 1,996 |
|
Interest paid |
| (12,975 | ) | (5,799 | ) |
Corporate tax paid |
| (19,634 | ) | (16,114 | ) |
Changes in inventories |
| (77 | ) | 94 |
|
Changes in receivables |
| (36,850 | ) | (35,723 | ) |
Changes in deferred taxes |
| 1,361 |
| 10,533 |
|
Changes in provisions |
| (1,475 | ) | (10,640 | ) |
Changes in billing in excess of costs |
| 25,000 |
| 36,429 |
|
Changes in current liabilities |
| 22,536 |
| 11,742 |
|
Net cash provided by operating activities |
| 86,356 |
| 66,790 |
|
|
|
|
|
|
|
Cash flow from investing activities |
|
|
|
|
|
Investments in (in)tangible assets |
| (19,292 | ) | (17,667 | ) |
Divestments of (in)tangible assets |
| 870 |
| 2,725 |
|
Investments in consolidated companies |
| (46,082 | ) | (75,039 | ) |
Divestments of consolidated companies |
| (23 | ) | 8,527 |
|
Investments in equity accounted associates and other non-current assets |
| (6,707 | ) | (5,858 | ) |
Divestments of equity accounted associates and other non-current assets |
| 2,378 |
| 2,198 |
|
Net cash used in investing activities |
| (68,856 | ) | (85,114 | ) |
|
|
|
|
|
|
Cash flow from financing activities |
|
|
|
|
|
Issued shares by subsidiaries |
| 30 |
| 49 |
|
Options exercised |
| 4,611 |
| 2,624 |
|
Own shares purchased |
| (17,596 | ) | (6,562 | ) |
New long-term debt |
| 26,062 |
| 79,931 |
|
Repayment of long-term debt |
| (8,664 | ) | (24,136 | ) |
Changes in short-term borrowings |
| 19,639 |
| 39 |
|
Dividends paid |
| (13,590 | ) | (10,848 | ) |
Other changes in equity |
| 2,171 |
| 966 |
|
Net cash used in financing activities |
| 12,663 |
| 42,063 |
|
Exchange rate differences |
| (2,559 | ) | 1,926 |
|
Total increase / (decrease) in cash and cash equivalents |
| 27,604 |
| 25,665 |
|
Cash and cash equivalents at beginning of year |
| 73,884 |
| 48,219 |
|
Cash and cash equivalents at end of year |
| 101,488 |
| 73,884 |
|
Amounts in thousands of euros unless otherwise stated
88
Consolidated statement of changes in equity
Consolidated statement of changes in equity
|
|
|
|
|
|
|
|
|
| Reserve |
|
|
|
|
|
|
|
|
|
|
| Number |
| Number of |
|
|
| Additional |
| exchange |
|
|
| Share- |
|
|
|
|
|
|
| of priority |
| common |
| Share |
| paid-in |
| rate |
| Retained |
| holders |
| Minority |
| Total |
|
|
| shares |
| stock |
| capital |
| capital |
| differences |
| earnings |
| equity |
| interest |
| equity |
|
Balance at January 1, 2005 |
| 200 |
| 20,645,615 |
| 1,030 |
| 37,644 |
| (3,633 | ) | 101,330 |
| 136,371 |
| 8,994 |
| 145,365 |
|
Exchange rate differences |
|
|
|
|
|
|
|
|
| 10,036 |
|
|
| 10,036 |
| 1,581 |
| 11,617 |
|
Share-based compensation and related taxes |
|
|
|
|
|
|
|
|
|
|
| 3,487 |
| 3,487 |
|
|
| 3,487 |
|
Income directly recognized in equity |
|
|
|
|
|
|
|
|
| 10,036 |
| 3,487 |
| 13,523 |
| 1,581 |
| 15,104 |
|
Profit for the period |
|
|
|
|
|
|
|
|
|
|
| 33,414 |
| 33,414 |
| 3,170 |
| 36,584 |
|
Comprehensive income net of tax |
|
|
|
|
|
|
|
|
| 10,036 |
| 36,901 |
| 46,937 |
| 4,751 |
| 51,688 |
|
Dividends to shareholders |
|
|
|
|
|
|
|
|
|
|
| (9,745 | ) | (9,745 | ) | (1,103 | ) | (10,848 | ) |
Own shares purchased for granted options |
|
|
|
|
|
|
|
|
|
|
| (6,562 | ) | (6,562 | ) |
|
| (6,562 | ) |
Options exercised |
|
|
|
|
|
|
|
|
|
|
| 2,624 |
| 2,624 |
|
|
| 2,624 |
|
Expansion ownership |
|
|
|
|
|
|
|
|
|
|
|
|
|
|
| (787 | ) | (787 | ) |
Capital increase |
|
|
|
|
|
|
|
|
|
|
|
|
|
|
| 49 |
| 49 |
|
Additional paid-in capital |
|
|
|
|
|
|
| 6,509 |
|
|
|
|
| 6,509 |
|
|
| 6,509 |
|
Other changes |
|
|
|
|
|
|
|
|
|
|
| 69 |
| 69 |
| (19 | ) | 50 |
|
Balance at December 31, 2005 |
| 200 |
| 20,645,615 |
| 1,030 |
| 44,153 |
| 6,403 |
| 124,617 |
| 176,203 |
| 11,885 |
| 188,088 |
|
Balance at January 1, 2006 |
| 200 |
| 20,645,615 |
| 1,030 |
| 44,153 |
| 6,403 |
| 124,617 |
| 176,203 |
| 11,885 |
| 188,088 |
|
Exchange rate differences |
|
|
|
|
|
|
|
|
| (14,062 | ) |
|
| (14,062 | ) | (9 | ) | (14,071 | ) |
Taxes related to share-based compensation |
|
|
|
|
|
|
|
|
|
|
| 6,416 |
| 6,416 |
|
|
| 6,416 |
|
Income directly recognized in equity |
|
|
|
|
|
|
|
|
| (14,062 | ) | 6,416 |
| (7,646 | ) | (9 | ) | (7,655 | ) |
Profit for the period |
|
|
|
|
|
|
|
|
|
|
| 44,936 |
| 44,936 |
| 1,469 |
| 46,405 |
|
Comprehensive income net of tax |
|
|
|
|
|
|
|
|
| (14,062 | ) | 51,352 |
| 37,290 |
| 1,460 |
| 38,750 |
|
Share-based compensation |
|
|
|
|
|
|
|
|
|
|
| 1,751 |
| 1,751 |
|
|
| 1,751 |
|
Dividends to shareholders |
|
|
|
|
|
|
|
|
|
|
| (13,378 | ) | (13,378 | ) | (312 | ) | (13,690 | ) |
Own shares purchased for granted options |
|
|
|
|
|
|
|
|
|
|
| (17,596 | ) | (17,596 | ) |
|
| (17,596 | ) |
Options exercised |
|
|
|
|
|
|
|
|
|
|
| 4,611 |
| 4,611 |
|
|
| 4,611 |
|
Expansion ownership |
|
|
|
|
|
|
|
|
|
|
|
|
|
|
| (910 | ) | (910 | ) |
Capital increase |
|
|
|
|
|
|
|
|
|
|
|
|
|
|
| 30 |
| 30 |
|
Other changes |
|
|
|
|
|
|
|
|
|
|
|
|
|
|
| (317 | ) | (317 | ) |
Balance at December 31, 2006 |
| 200 |
| 20,645,615 |
| 1,030 |
| 44,153 |
| (7,659 | ) | 151,357 |
| 188,881 |
| 11,836 |
| 200,717 |
|
Amounts in thousands of euros unless otherwise stated
89
Valuation principles
Valuation principles
General
ARCADIS NV is a public company organized under the laws of the Kingdom of the Netherlands. Its principal office is located at: Nieuwe Stationsstraat 10, 6811 KS, Arnhem, the Netherlands. Phone: +31-26-3778911.
ARCADIS NV and its consolidated subsidiaries (“ARCADIS”or the “Company”), is an international provider of comprehensive knowledge-based consulting services in the areas of infrastructure, environment and facilities.
Statement of compliance
The consolidated financial statements have been prepared in accordance with International Financial Reporting Standards (IFRSs) as endorsed by the European Union and in conformity with the Dutch Civil Code, Book 2 Title 9. For ARCADIS, there are no significant differences between the IFRSs as endorsed by the European Union and IFRSs.
The Financial Statements were authorized for issue by the Executive Board and Supervisory Board on March 2, 2007.
Basis of preparation
The consolidated financial statements are presented in euros, which is the Company’s functional currency. All amounts shown in the financial statements are in thousands of euros unless otherwise stated.
Use of estimates and judgments
The preparation of financial statements requires management to make judgments, estimates and assumptions that affect the application of accounting policies and the reported amounts of assets, liabilities, income and expenses. Actual results may differ from these estimates.
Estimates and underlying assumptions are reviewed on an ongoing basis. Revisions to accounting estimates are recognized in the period in which the estimate is revised and in any future periods affected.
Consolidation
The consolidated financial statements include the accounts of ARCADIS NV and its subsidiaries. Subsidiaries are companies over which ARCADIS NV has control. Control exists when the Company has the power, directly or indirectly, to govern the financial and operating policies of an entity so as to obtain benefits from its activities. In assessing control, potential voting rights that presently are exercisable or convertible are taken into account. Hundred percent of the operations of subsidiaries are included with the minority interest in group equity and group income shown separately.
The financial statements of subsidiaries are included in the consolidated financial statements from the date that control commences until the date control ceases.
Jointly controlled entities are those entities over whose activities the Company has joint control, established by contractual agreement. The consolidated financial statements include the Company’s proportionate share of the entities’ assets, liabilities, revenue and expenses with items of a similar nature on a line-by-line basis, from the date that joint control commences until the date that joint control ceases.
Transactions eliminated on consolidation
Intragroup balances and any unrealized gains and losses or income and expenses arising from intragroup transactions are eliminated in preparing the consolidated financial statements. Unrealized gains arising from transactions with equity accounted associates and jointly controlled entities are eliminated to the extent of the Company’s interest in the investee. Unrealized losses are eliminated in the same way as unrealized gains, but only to the extent that there is no evidence of impairment.
Foreign currency
Foreign currency transactions For statement of income data, amounts in foreign currencies are converted into euros at the exchange rates at the date of the transactions. Exchange rate differences are included in the income statement.
Foreign operations The assets and liabilities of foreign operations, including goodwill and fair value adjustments arising on acquisition, are translated to euros at exchange rates at the reporting date.
90
Foreign currency differences are recognized directly in equity. Since January 1, 2004, the Company’s date of transition to IFRSs, such differences have been recognized in the reserve exchange rate differences (RERD). When a foreign operation is disposed of, in part or in full, the relevant amount in the RERD is transferred to profit or loss.
Derivative Financial Instruments
Only for specific purposes derivative financial instruments are used to hedge the Company’s exposure to foreign exchange and interest rate risks arising from operational, financing and investment activities. In accordance with its treasury policy, the Company does not hold or issue derivative financial instruments for trading purposes. Derivatives that do not qualify for hedge accounting under IFRS are accounted for as trading instruments.
Derivatives are recognized initially at fair value. The gain or loss on remeasurement to fair value is recognized immediately as profit or loss. The fair value of interest rate swaps is the estimated amount that the Company would receive or pay to terminate the swap at the balance sheet date, taking into account current interest rates and the current creditworthiness of the swap counterparties. The fair value of forward exchange contracts is their quoted market price at the balance sheet date, being the present value of the quoted forward price.
Principles of valuation of assets and liabilities
Intangible assets
Goodwill All acquisitions are accounted for by applying the purchase method. Goodwill represents the excess of the cost of the acquisition over the Company’s interest in the net fair value of assets, liabilities and contingent liabilities of the acquiree. When the excess is negative (negative goodwill), it is recorded immediately in profit. Goodwill has an indefinite useful life and is stated at cost less any accumulated impairment losses. Goodwill is tested annually for impairment.
Identifiable intangible assets Acquired identifiable intangible assets, mainly consisting of expected profits in the backlog of the acquired companies at the moment of acquisition, are stated at cost less accumulated amortization and impairment losses. Identifiable intangible assets have a finite useful life and are amortized over the estimated useful life. For identifiable intangible assets the useful life varies from 0.5 to 5 years. There are no intangible assets that could not be recognized or reliably measured.
Software Software is valued at cost less accumulated depreciation and impairment losses. Software has a finite life and is depreciated on a straight-line basis over the estimated useful life, which is 3 to 5 years.
Depreciation methods and useful lives, as well as residual values, are reassessed annually.
Property, plant & equipment
Land and buildings Real estate is valued at cost less accumulated depreciation and impairment losses. Depreciation is charged to the income statement on a straight-line basis over the estimated useful life and generally amounts to 3% of the historical value. Land is not depreciated.
Furniture and fixtures Furniture and fixtures are valued at cost. Depreciation is charged to the income statement on a straight-line basis over the estimated useful life. For furniture and fixtures the useful life varies from 3 to 8 years; annual depreciation is 12% to 33% of cost.
Depreciation methods and useful lives, as well as residual values, are reassessed annually.
When portions of an item of property, plant & equipment have different useful lives, they are accounted for as separate items (major components) of property, plant & equipment.
Leased assets Leases in which the Company assumes substantially all the risks and rewards of ownership are classified as finance leases. Upon initial recognition the leased asset is measured at an amount equal to the lower of its fair value and the present value of the minimum lease payments. Subsequent to initial recognition, the asset is accounted for in accordance with the accounting policy applicable to that asset.
91
Other leases are operating leases, and the leased assets are not recognized on the Company’s balance sheet.
Investments in associates Associates, in which ARCADIS has significant influence, but not control over the financial and operating management, are accounted for using the equity method. Associates in which ARCADIS has no significant influence are valued at amortized cost less any impairment losses. Long-term receivables are valued at amortized cost less any impairment losses.
Deferred taxes Deferred tax assets and liabilities are recorded on the basis of the expected fiscal consequences of temporary differences between the book value in the financial statements and the tax reporting of all assets and liabilities. Calculation of the deferred taxes is done using the at balance sheet date enacted or substantially enacted tax rates and tax laws that are applicable when the deferred taxes will be settled. Deferred tax assets are only recorded when it is more likely than not that there will be future fiscal profits with which to settle these temporary differences or not-yet-compensated fiscal losses. Deferred taxes are not discounted.
Inventories Goods for resale, raw materials and supplies are valued at the lower of cost or net realizable value on balance sheet date.
(Un)billed receivables
(Un)billed receivables Unbilled receivables are stated at cost plus profit recognized to date less a provision for foreseeable losses and less progress billings. Cost includes all expenditures related directly to specific projects and an allocation of fixed and variable overheads incurred in the Company’s contract activities based on normal operating capacity. Billed receivables are valued at amortized cost less any impairment losses. If payments received from customers exceed the income recognized, the difference is presented as deferred income in the balance sheet.
Other receivables Other receivables are valued at amortized cost less any impairment losses.
Cash and cash equivalents Cash and cash equivalents comprise cash balances and call deposits.
Equity
Repurchase of shares The consideration paid for temporary repurchased shares, which are repurchased in order to prevent dilution through the share option plan, is deducted from equity at cost.
Dividends Dividends are recognized as a liability in the period in which they are declared.
Provisions
General Provisions are recognized when there is a present obligation (legal or constructive) as a result of a past event for which it is probable that an outflow of resources embodying economic benefits will be required to settle the obligation, and a reliable estimate can be made of the amount of the obligation.
Provisions are stated at the net present value, taking into account the timing of the cash outflows.
Pensions In some countries minor plans are in place that qualify as defined benefit plans. For these minor defined benefit plans, a provision is created, which is based on actuarial calculations. The net obligation with respect to these defined benefit pension plans is calculated separately for each plan by estimating the amount of future benefit that employees have earned in return for their service in the current and prior periods; that benefit is discounted to determine its present value, and any unrecognized past service costs and the fair value of any plan assets are deducted. The discount rate is the yield at the reporting date on bonds that have maturity dates approximating the terms of the obligations. The calculation is performed by a qualified actuary using the projected unit credit method. When the calculation results in a benefit, the recognized asset is limited to the net total of any unrecognized past service costs and the present value of any future refunds from the plan or reductions in future contributions to the plan.
When the benefits of a plan are improved, the portion of the increased benefit relating to past service by employees is recognized in profit or loss on a straight-line basis over the average period until the benefits become vested. To the extent that the benefits vest immediately, the expense is recognized immediately in profit or loss.
92
Obligations for contributions to defined contribution pension plans are recognized as a cost in the income statement as incurred.
Other long-term employee benefits The Company’s net obligation for long-term service benefits, other than pension plans, is the amount of future benefit that employees have earned in return for their service in the current and prior periods. The obligation is calculated using the projected unit credit method and is discounted to its present value of any related assets that are deducted. Any actuarial gains or losses are recognized in profit or loss in the period in which they arise.
Long-term debt Interest bearing debts are recorded against amortized cost, in which the difference between the proceeds and the final repayment amount is charged to the income statement during the duration of the debts. The portion of the long-term debt that has to be repaid within 1 year after balance sheet date is recorded as the current portion of long-term debt under the current liabilities.
Impairment For the treatment of impairment please refer to ‘impairment’ in the section ‘Critical accounting judgments in applying ARCADIS NV’s accounting policies’ on page 95.
Method of determination of income
Gross revenues
Revenues As soon as the outcome of a construction contract can be estimated reliably, contract revenue and expenses are recognized in profit or loss in proportion to the stage of completion of the contract. Contract revenue includes the initial amount agreed in the contract plus any variations in contract work, claims and incentive payments to the extent that it is probable that they will result in revenue and can be measured reliably.
The stage of completion is assessed by reference to surveys of work performed. When the outcome of a construction contract cannot be estimated reliably, contract revenue is recognized only to the extent of contract costs incurred that are likely to be recoverable. An expected loss on a contract is recognized immediately in profit or loss. The balances of the projects on which no confirmation of order has been received are charged to income.
Advance investments that can be separately identified, measured reliably and that are attributable to design, build, finance and operate contracts are accounted for as contract costs only when it is probable that the contract will be obtained. Advance investments in the development of a contract that do not meet these criteria are expensed. It is only considered probable that a design, build, finance and operate contract will be obtained upon receipt of a contract signed by the client.
In case of a partnership, the consolidated financial statements include the Company’s proportionate share of the contract costs for jointly controlled entities. Investments in which the Company has significant influence but not control over the financial and operating management are valued using the equity method.
Furthermore, we evaluate our investments in partnership projects for potential beneficial interest.
Sale of investments When the sale of a group company classified as a continued operation, a jointly controlled entity or an associate leads to a gain, this gain is shown separately as part of gross revenue. A loss is recorded under other business costs.
Change in work in progress The invoicing of projects that are in production mostly does not equal the project costs and project results per balance sheet date. The difference between these amounts at year end, compared to that amount at January 1, is shown separately as part of gross revenue.
Materials, services of third parties and subcontractors This amount represents all project-related costs of materials and services charged by third parties including the costs of subcontractors.
Operational cost All costs related to employees, as well as non-project-related out-of-pocket expenses, are taken into account as operational cost in the year to which these items relate.
93
Share-based payments The grant date fair value of share-based incentives under the ARCADIS long-term incentive plan is recognized as an employee expense, with a corresponding increase in equity, over the period in which the employees become unconditionally entitled to the options. The amount recognized as an expense is adjusted to reflect the actual number of share options that vest.
The fair value of the 2006 granted options is determined using the binominal model taking into account the effect of the applications. The cost charged will be adjusted for the actual number of share-based incentives that are cancelled. The vesting and exercise of shares may be conditional on the satisfaction of performance conditions or on continued employment, or both, as set by the Supervisory Board.
Financing items Financing items comprise interest income and expenses and are accounted for in the year to which these items relate using the effective interest rate method, and (unrealized) gains or losses on financial instruments.
Income from associates The proportionate share in earnings from equity accounted associates is accounted for in the year these earnings are recorded by those participations. For associates in which ARCADIS does not have significant influence, only dividends received are included in income.
Income taxes Income tax on income comprises both current and deferred tax. Income tax is recognized in the income statement except to the extent that it relates to items recognized directly in equity in which case it is recognized in equity.
Segment reporting The four segments on which the Company reports are the geographical segments. The Company is operated on a geographic basis and considers those geographical areas with economic and operating similarities to be separate primary operating segments. The Company mainly operates in a local-to-local market; therefore, risks and rates of returns are reflected predominately by the geographical market. Management reporting systems, legal structures and consolidation are based on solely geographic segments. The chief decision-making officer manages the business and allocates resources on geographical basis only.
The differentiation in the type of services provided by the various group companies is limited. These services extend in general to consulting, engineering and project management services.
Earnings per share
Basic earnings per share are computed using the weighted average number of shares outstanding during the period excluding the temporarily repurchased shares used to cover option plans. Diluted earnings per share are computed using the weighted average number of shares and options outstanding during the period, as far as the exercise price of these options is lower than the share price.
For calculating the earnings per share, the following numbers of shares were used:
|
|
|
| Shares of |
| Diluted number |
|
|
| Priority |
| common |
| of shares of |
|
Year |
| shares |
| stock |
| common stock |
|
2006 |
| 200 |
| 20,234,095 |
| 21,073,937 |
|
2005 |
| 200 |
| 20,260,512 |
| 20,816,577 |
|
The diluted number of shares is calculated by using the monthly number of options outstanding and the monthly average stock price on the Euronext Amsterdam Stock Market and the U.S. NASDAQ Market. Only options with exercise prices below the average stock price are taken into account.
Principles of preparing the Consolidated Cash Flow Statement
The consolidated cash flow statement compares the balance sheet at January 1 with that at December 31. Changes because of conversion of foreign currencies are eliminated. Investments in and divestments of consolidated companies are presented after the reduction of the cash and cash equivalents of the investee or divested companies.
New standards and interpretations not yet adopted
A number of new standards, amendments to standards and interpretations are not yet effective for the year ended December 31, 2006, and have not been applied in preparing these consolidated financial statements. The following standards are relevant to the Company:
94
· IFRS 7 Financial Instruments: Disclosures and the Amendment to IAS 1 Presentation of Financial Statements: Capital Disclosures require extensive disclosures about the significance of financial instruments for an entity’s financial position and performance, and qualitative and quantitative disclosures on the nature and extent of risks. IFRS 7 and amended IAS 1, which become mandatory for the Company’s 2007 financial statements, will require extensive additional disclosures with respect to Company’s financial instruments and share capital.
· IFRIC 10 Interim Financial Reporting and Impairment prohibits the reversal of an impairment loss recognized in a previous interim period with respect to goodwill, an investment in an equity instrument or a financial asset carried at cost. IFRIC 10 will become mandatory for the Company’s 2007 financial statements, and will apply to goodwill, investments in equity instruments, and financial assets carried at cost prospectively from the date that the Company first applied the measurement criteria of IAS 36 and IAS 39 respectively (i.e., January 1, 2004). The impact on the financial statements of the Company of implementation of this IFRIC 10 is expected to be very limited.
Critical accounting judgments in applying ARCADIS NV’s accounting policies
The preparation of our financial statements requires us to make estimates and judgments that affect the reported amounts of assets and liabilities, revenues and expenses, and related disclosure of contingent liabilities at the date of our financial statements. The policies that management considers to be most important to the presentation of our financial condition and results of operations and to require the most significant demands on management’s judgments and estimates about matters that are inherently uncertain are discussed below. Management cautions that future events often vary from forecasts and that estimates routinely require adjustment.
Work in progress Revenue is generally recognized when services are rendered. Revenue from fixed fee contracts is recognized on the percentage-of-completion method, measured generally by estimating the status of completion of the project and recognizing the related estimated percentage of revenue and gross profit expected from the project. Revenue from cost-plus contracts is recognized as costs are incurred plus applicable fees. Revenue from time-and-material contracts is recognized at contract rates when work is performed and material costs are incurred. Revenue is recognized on additional services requested by clients for which a formal change order has not been obtained when the realization is probable and the amount can be reliably estimated. Provisions for estimated losses on contracts are recorded when identified. Unbilled fees, at estimated billable amounts, represent revenue recognized for which billings have not yet been presented to customers.
Costs Contract costs include direct labor costs, subcontractor costs, other direct costs and indirect costs. Our method of revenue recognition requires us to prepare estimates of the costs to complete contracts in progress. In making such estimates, judgments are required to evaluate contingencies, such as potential variances in schedule and labor and other contract costs, liability claims, contract disputes or achievement of contractual performance standards. Changes in total estimated contract costs and losses, if any, are recognized in the period they are determined.
Impairment The carrying amounts of the assets of ARCADIS, other than work in progress and deferred tax assets, are reviewed at each balance sheet date to determine whether there is any indication of impairment.
For goodwill and assets that have an indefinite useful life, the recoverable amount is estimated at each balance sheet date.
An impairment loss is recognized whenever the carrying amount of an asset or its cash-generating unit exceeds its recoverable amount. Impairment losses are recognized in the income statement. Impairment losses recognized with regard to cash-generating units are allocated first to reduce the carrying amount of any goodwill allocated to cash-generating units and then to reduce the carrying amount of the other assets in the unit on a pro rata basis.
95
The recoverable amount is the greater of the net selling price and value in use. In assessing the value in use, estimated future cash flows are discounted to present value using a discount rate that reflects current market assessments of the time value of money and the risks specific to the asset.
An impairment loss of goodwill cannot be reversed. Regarding other assets, an impairment loss can be reversed if there has been a change in the estimates used to determine the recoverable amount. An impairment loss is reversed only to the extent that the asset’s carrying amount does not exceed the carrying amount that would have been determined, net of depreciation or amortization, if no impairment loss had been recognized.
Provisions for contingent liabilities By their nature, provisions for contingent liabilities are dependent upon estimates and assessments of whether the criteria for recognition have been met, including estimates as to the outcome and the amount of the potential cost of resolution. Contingent liabilities are recognized by a charge against income when it is probable that a liability has been incurred and the amount of such liability can be reasonably estimated. The most likely amount is accrued for costs of future liabilities that may ultimately arise when such an amount can be determined. Contingent liabilities and provisions for restructuring, other litigation, and tax disputes are discussed in Note 12—Provisions and in Note 15—Trade and other Liabilities to our Consolidated Financial Statements. The provision for restructuring is based on an estimate of the costs of dismissal of permanent staff, taking into account legal advice and the current facts and circumstances. Provisions for other litigation and tax disputes are also based on an estimate of the costs, taking into account legal advice and information currently available. Should the actual outcome differ from the assumptions and estimates, revisions to the estimated provisions would be required, which could impact our financial position and results of operations.
Accounting for income taxes As part of the process of preparing our consolidated financial statements, we are required to estimate income taxes in each of the jurisdictions in which we operate. This process involves estimating actual current tax expense and temporary differences between tax and financial reporting. Temporary differences result in deferred tax assets and liabilities, which are included in our consolidated balance sheet. We must then assess the likelihood that deferred tax assets will be recovered from future taxable income. Deferred tax assets are recognized to the extent that it is more likely than not that all or some portion of the deferred tax assets will be realized.
Allowances for doubtful accounts Allowances for doubtful accounts are maintained for estimated losses resulting from the inability of our customers to make required payments. If the financial condition of customers were to deteriorate, resulting in an impairment of their ability to make payments, additional allowances may be required.
96
Notes to the consolidated financial statements
Notes to the consolidated financial statements
Group companies
In accordance with articles 379, 392, and 414, Book 2 of the Dutch Civil Code, the list of subsidiaries and associates is filed with the Chamber of Commerce in Arnhem.
Consolidated interests
The main consolidated companies are listed below, stating the country in which they are domiciled, if outside the Netherlands, and the percentage of ownership (these percentages have not changed in 2006).
ARCADIS Nederland BV, (100%) Arnhem
ARCADIS Aqumen Facility Management BV, (50%) Arnhem
PRC Holding BV, (100%) Bodegraven
ARCADIS US, Inc., (100%) Denver, Colorado, United States
ARCADIS Belgium NV, (100%) Deurne, Belgium
ARCADIS Deutschland GmbH, (100%) Darmstadt, Germany
ARCADIS FC International SAS, (100%) Paris, France
AYH, PLC, (100%), London, United Kingdom
ARCADIS GMI Ltd, (100%), Newmarket, United Kingdom
ARCADIS Polska SP.z.o.o., (100%), Warsaw, Poland
ARCADIS Geotecnica Consultores SA, (100%) Santiago, Chile
ARCADIS Logos Engenharia SA, (50% + 1 share) São Paulo, Brazil
ARCADIS Euroconsult BV, (100%) Arnhem
Changes in consolidated interests
During 2006 the following companies were acquired:
In Situ Technieken BV (acquired 100% through an asset deal), Wageningen
Dresdner Grundwasser Consulting GmbH (100%), Dresden, Germany
Berkeley Consulting Partnership, (acquired 100% through an asset deal), Surrey, United Kingdom
ECOLAS NV, (100%), Ghent, Belgium
BCT scrl, (100%), Luik, Belgium
PinnacleOne, Inc. (100%), Phoenix, Arizona, United States
In total, the gross annual revenue added by these companies is estimated at € 53 million.
The total investment in acquisitions in 2006 was € 52.7 million, which resulted in goodwill of € 29.9 million. This goodwill was assigned to our geographic segments as follows:
In millions of euros |
|
|
|
|
|
|
|
The Netherlands |
| 1.9 |
|
Europe excluding the Netherlands |
| 11.7 |
|
United States |
| 15.6 |
|
Rest of the world |
| 0.7 |
|
Total goodwill paid |
| 29.9 |
|
Of the € 52.7 million invested in acquisitions in 2006, up to € 3.8 million will be paid after 2006 and is consequently recorded as a liability.
For the impact of the acquisitions and divestments of business interests on the financial statements of ARCADIS NV, please refer to Note 21.
97
Notes to the consolidated balance sheet
1_Intangible assets
|
|
|
| Identifiable |
|
|
|
|
|
|
|
|
| intangible |
|
|
|
|
|
|
| Goodwill |
| assets |
| Software |
| Total |
|
Purchase price |
|
|
|
|
|
|
|
|
|
Balance at January 1, 2005 |
| 49,926 |
| 2,951 |
| 18,101 |
| 70,978 |
|
(De)consolidations |
| 1,118 |
| — |
| (840 | ) | 278 |
|
Investments |
| 61,273 |
| 11,540 |
| 2,846 |
| 75,659 |
|
Divestments |
| — |
| — |
| (751 | ) | (751 | ) |
Effect of movements in foreign exchange |
| 3,666 |
| 188 |
| 777 |
| 4,631 |
|
Balance at December 31, 2005 |
| 115,983 |
| 14,679 |
| 20,133 |
| 150,795 |
|
|
|
|
|
|
|
|
|
|
|
Balance at January 1, 2006 |
| 115,983 |
| 14,679 |
| 20,133 |
| 150,795 |
|
Consolidations |
| — |
| — |
| 81 |
| 81 |
|
Investments |
| 29,858 |
| 10,793 |
| 2,928 |
| 43,579 |
|
Divestments |
| (59 | ) | — |
| (1,655 | ) | (1,714 | ) |
Effect of movements in foreign exchange |
| (6,535 | ) | (764 | ) | (711 | ) | (8,010 | ) |
Other changes |
| 186 |
| — |
| 2,210 |
| 2,396 |
|
Balance at December 31, 2006 |
| 139,433 |
| 24,708 |
| 22,986 |
| 187,127 |
|
|
|
|
|
|
|
|
|
|
|
Amortization and depreciation |
|
|
|
|
|
|
|
|
|
Balance at January 1, 2005 |
| (63 | ) | 439 |
| 15,246 |
| 15,622 |
|
Amortization and depreciation charge for the year |
| — |
| 5,967 |
| 1,732 |
| 7,699 |
|
Deconsolidations |
| — |
| — |
| (665 | ) | (665 | ) |
Divestments |
| — |
| — |
| (424 | ) | (424 | ) |
Effect of movements in foreign exchange |
| 7 |
| 66 |
| 629 |
| 702 |
|
Reclassification |
| 56 |
| (56 | ) | — |
| — |
|
Balance at December 31, 2005 |
| — |
| 6,416 |
| 16,518 |
| 22,934 |
|
|
|
|
|
|
|
|
|
|
|
Balance at January 1, 2006 |
| — |
| 6,416 |
| 16,518 |
| 22,934 |
|
Amortization and depreciation charge for the year |
| — |
| 8,270 |
| 2,302 |
| 10,572 |
|
Divestments |
| — |
| — |
| (1,586 | ) | (1,586 | ) |
Effect of movements in foreign exchange |
| — |
| (390 | ) | (580 | ) | (970 | ) |
Other changes |
| — |
| 15 |
| 1,992 |
| 2,007 |
|
Balance at December 31, 2006 |
| — |
| 14,311 |
| 18,646 |
| 32,957 |
|
Amounts in thousands of euros unless otherwise stated
During 2006 and 2005, no changes were made in the useful lives, amortization and depreciation methods and the residual values of the intangible assets.
98
Carrying amounts
|
|
|
| Identifiable |
|
|
|
|
|
|
|
|
| intangible |
|
|
|
|
|
|
| Goodwill |
| assets |
| Software |
| Total |
|
At January 1, 2005 |
| 49,989 |
| 2,512 |
| 2,855 |
| 55,356 |
|
At December 31, 2005 |
| 115,983 |
| 8,263 |
| 3,615 |
| 127,861 |
|
|
|
|
|
|
|
|
|
|
|
At January 1, 2006 |
| 115,983 |
| 8,263 |
| 3,615 |
| 127,861 |
|
At December 31, 2006 |
| 139,433 |
| 10,397 |
| 4,340 |
| 154,170 |
|
Amounts in thousands of euros unless otherwise stated
The total goodwill capitalized was assigned to our geographic segments as follows:
|
| 2006 |
| 2005 |
|
The Netherlands |
| 17,118 |
| 15,223 |
|
Europe excluding the Netherlands |
| 45,218 |
| 32,759 |
|
United States |
| 71,841 |
| 63,154 |
|
Rest of the world |
| 5,256 |
| 4,847 |
|
Total goodwill |
| 139,433 |
| 115,983 |
|
The amortization and depreciation charge is recognized in the following line items in the income statement:
|
| 2006 |
| 2005 |
|
Amortization identifiable intangible assets |
| 8,270 |
| 5,967 |
|
Depreciation of software |
| 2,302 |
| 1,732 |
|
Impairment testing for cash-generating units
The impairment test compares the carrying value of the cash-generating units with the recoverable amounts. The recoverable value is determined based on a calculation of the value in use based on cash flow projections and furthermore compared to recent multiples of comparable activities on the stock exchange. These cash flow projections are based on actual operating results and the three-year strategic plan as approved by the Executive Board. Projections are extrapolated beyond this three-year period using an appropriate perpetual growth rate that is consistent with the long-term average market growth rate and that typically does not exceed 3% (2005: 3%) in our calculations. The estimated post-tax cash flows are discounted to their present value using a post-tax weighted average cost of capital (WACC). The post-tax WACC used is 8% (2005: 8%), and where applicable a surcharge is added for specific country risks.
The key assumptions used in the predictions are:
· Revenue growth: based on actual experience and market analysis;
· Margin development: based on actual experience and management’s long-term projections.
The impairment test for cash-generating units carried out in 2006 showed that the recoverable amount for each cash-generating unit exceeds the carrying amount; hence, the test did not result in impairment.
99
2_Property, plant & equipment
|
| Land and buildings |
| Furniture and fixtures |
| Total |
|
Purchase price |
|
|
|
|
|
|
|
Balance at January 1, 2005 |
| 18,663 |
| 115,719 |
| 134,382 |
|
(De)consolidations |
| 8,865 |
| (5,158 | ) | 3,707 |
|
Investments |
| 1,218 |
| 13,649 |
| 14,867 |
|
Divestments |
| (443 | ) | (20,624 | ) | (21,067 | ) |
Effect of movements in foreign exchange |
| 66 |
| 5,618 |
| 5,684 |
|
Balance at December 31, 2005 |
| 28,369 |
| 109,204 |
| 137,573 |
|
|
|
|
|
|
|
|
|
Balance at January 1, 2006 |
| 28,369 |
| 109,204 |
| 137,573 |
|
Consolidations |
| — |
| 1,757 |
| 1,757 |
|
Investments |
| 950 |
| 15,414 |
| 16,364 |
|
Divestments |
| (236 | ) | (13,469 | ) | (13,705 | ) |
Effect of movements in foreign exchange |
| (1,498 | ) | (5,436 | ) | (6,934 | ) |
Other changes |
| 412 |
| (3,018 | ) | (2,606 | ) |
Balance at December 31, 2006 |
| 27,997 |
| 104,452 |
| 132,449 |
|
|
|
|
|
|
|
|
|
Depreciation |
|
|
|
|
|
|
|
Balance at January 1, 2005 |
| 6,109 |
| 84,638 |
| 90,747 |
|
Depreciation charge for the year |
| 1,372 |
| 12,107 |
| 13,479 |
|
Deconsolidations |
| (1,256 | ) | (7,009 | ) | (8,265 | ) |
Divestments |
| (164 | ) | (18,460 | ) | (18,624 | ) |
Effect of movements in foreign exchange |
| 13 |
| 4,229 |
| 4,242 |
|
Balance at December 31, 2005 |
| 6,074 |
| 75,505 |
| 81,579 |
|
|
|
|
|
|
|
|
|
Balance at January 1, 2006 |
| 6,074 |
| 75,505 |
| 81,579 |
|
Depreciation charge for the year |
| 1,498 |
| 13,933 |
| 15,431 |
|
Divestments |
| (212 | ) | (12,749 | ) | (12,961 | ) |
Effect of movements in foreign exchange |
| (367 | ) | (3,913 | ) | (4,280 | ) |
Other changes |
| 758 |
| (3,084 | ) | (2,326 | ) |
Balance at December 31, 2006 |
| 7,751 |
| 69,692 |
| 77,443 |
|
|
|
|
|
|
|
|
|
Carrying amounts |
|
|
|
|
|
|
|
At January 1, 2005 |
| 12,554 |
| 31,081 |
| 43,635 |
|
At December 31, 2005 |
| 22,295 |
| 33,699 |
| 55,994 |
|
|
|
|
|
|
|
|
|
At January 1, 2006 |
| 22,295 |
| 33,699 |
| 55,994 |
|
At December 31, 2006 |
| 20,246 |
| 34,760 |
| 55,006 |
|
Amounts in thousands of euros unless otherwise stated
At December 31, 2006, the book value of tangible fixed assets, financed by financial lease, was € 1,665 (2005: € 1,709).
During 2006 and 2005 no changes were made in the useful lives, depreciation methods and the residual values of the property, plant & equipment.
100
3_Investments in equity accounted associates
Valued using the equity method |
| 2006 |
| 2005 |
|
Balance at January 1 |
| 7,451 |
| 5,597 |
|
Changes as a result of |
|
|
|
|
|
Equity share in income |
| (505 | ) | 1,382 |
|
Investments |
| 156 |
| 416 |
|
Deconsolidations |
| (819 | ) | (734 | ) |
Divestments |
| (13 | ) | 34 |
|
Received dividends |
| (1,485 | ) | (631 | ) |
Other changes and exchange rate differences |
| 442 |
| 1,387 |
|
|
| (2,224 | ) | 1,854 |
|
Balance at December 31 |
| 5,227 |
| 7,451 |
|
Summary of financial information on the main equity accounted associates – 100% in millions:
|
|
|
|
|
|
|
| Gross |
| Net |
|
|
| Assets |
| Liabilities |
| Equity |
| revenue |
| income |
|
2006 |
| 146.5 |
| 50.5 |
| 96.0 |
| 3.5 |
| (12.6 | ) |
2005 |
| 103.2 |
| 20.3 |
| 82.9 |
| 75.5 |
| 30.7 |
|
The financial condition and results of operations of the followings associates are included in the Balance Sheet Data and Income Statement Data presented above:
Amounts in thousands of euros unless otherwise stated
Associates |
| % of equity |
|
PIE-RP Termelétrica S.A |
| 25.0 | % |
Breitener Energética S.A |
| 5.5 | %* |
VOF De Ruyterkade |
| 50.0 | % |
VOF EMC Starc |
| 35.0 | % |
Brainliner B.V. |
| 33.3 | % |
VOF X-Pact |
| 12.0 | %* |
* These companies are valued using the equity method, as ARCADIS has significant influence, because the Company is represented on the board of directors and participates in policy making.
101
4_Other investments
Investments valued at amortized cost |
| 2006 |
| 2005 |
|
Balance at January 1 |
| 501 |
| 641 |
|
Changes as a result of |
|
|
|
|
|
Equity share in income |
| 47 |
| — |
|
Investments |
| 3,921 |
| 499 |
|
Deconsolidations |
| — |
| (583 | ) |
Divestments |
| (85 | ) | (74 | ) |
Received dividends |
| (47 | ) | — |
|
Other changes and exchange rate differences |
| 20 |
| 18 |
|
|
| 3,856 |
| (140 | ) |
Balance at December 31 |
| 4,357 |
| 501 |
|
Long-term receivables |
| 2006 |
| 2005 |
|
Balance at January 1 |
| 1,438 |
| 456 |
|
Changes as a result of |
|
|
|
|
|
New receivables |
| 525 |
| 1,526 |
|
Received |
| (119 | ) | (593 | ) |
Other changes and exchange rate differences |
| 1 |
| 49 |
|
|
| 407 |
| 982 |
|
Balance at December 31 |
| 1,845 |
| 1,438 |
|
|
|
|
|
|
|
Other investments |
| 6,202 |
| 1,939 |
|
5_Other assets
|
| 2006 |
| 2005 |
|
Balance at January 1 |
| 10,683 |
| 6,991 |
|
Changes as a result of |
|
|
|
|
|
Consolidations |
| 13 |
| 1,016 |
|
New receivables |
| 2,137 |
| 3,416 |
|
Received |
| (2,139 | ) | (1,565 | ) |
Reclassification |
| — |
| (180 | ) |
Offsetting* |
| (3,765 | ) | — |
|
Other changes and exchange rate differences |
| (1,119 | ) | 1,005 |
|
|
| (4,873 | ) | 3,692 |
|
Balance at December 31 |
| 5,810 |
| 10,683 |
|
* See Note 12
6_Inventories
|
| 2006 |
| 2005 |
|
Goods for resale |
| 8 |
| 46 |
|
Raw materials and supplies |
| 443 |
| 328 |
|
|
| 451 |
| 374 |
|
Amounts in thousands of euros unless otherwise stated
7_Derivatives
The Company has purchased three cross currency interest rate swaps to hedge the currency risk as well as the interest rate risk on the $120 million long-term loan (2005: $ 90 million). These derivatives do not qualify for hedge accounting and are accounted for as trading instruments. Accordingly the swaps are recorded at their fair value and the unrealized gain or loss on re-measurement is recognized immediately as profit or loss.
102
Two of the Company’s cross currency interest rate swaps were purchased in 2005 in connection with ARCADIS’ acquisition of BBL. ARCADIS financed the BBL acquisition through a loan denominated in US dollars, and to hedge the currency and interest risk associated with the loan, the company purchased the swaps. In 2005, changes in the fair value of the swaps were included in the income statement, while the changes in the fair value of the loan resulting from movements of the US dollar were reported directly in equity. In 2006 ARCADIS changed the reporting currency of the financing entity, ARCADIS North America GP, into Euros since ARCADIS North America GP’s sole purpose is to hold investments. Accordingly as of 2006, changes in the fair value of both the swaps and the corresponding loan are reported through the income statement. Since ARCADIS financed the BBL acquisition in the fourth quarter 2005, the impact of this change on the profit and loss 2005 was limited and comparative figures are therefore not adjusted. The fair value of the derivatives decreased in 2006 from an asset of € 1.7 million into a liability of € 5.8 million. The difference of € 7.5 million is recognized as a loss from fair value changes of derivatives under financing items. The currency translation adjustment of the related US-dollar loan is also recognized under financing items as financial income for a positive effect of € 8.7 million (see Note 18).
8_(Un)billed receivables
(Includes items maturing within 1 year)
|
| 2006 |
| 2005 |
|
Unbilled receivables |
| 151,238 |
| 113,721 |
|
Trade receivables |
| 228,385 |
| 215,474 |
|
Provision for bad debts |
| (8,715 | ) | (11,140 | ) |
Receivables from associates |
| 2,520 |
| 2,958 |
|
Total receivables |
| 373,428 |
| 321,013 |
|
The provision for bad debts has developed as follows:
|
| 2006 |
| 2005 |
|
Balance at beginning of year |
| 11,140 |
| 13,348 |
|
Addition charged to income |
| 1,346 |
| 3,438 |
|
Exchange rate differences |
| (350 | ) | 527 |
|
Deductions / write offs |
| (3,738 | ) | (3,796 | ) |
Acquisitions / divestments |
| 317 |
| (2,377 | ) |
Balance at end of year |
| 8,715 |
| 11,140 |
|
Work in progress
Costs and estimated earnings on uncompleted contracts are as follows:
|
| 2006 |
| 2005 |
|
Costs incurred on uncompleted contracts |
| 760,601 |
| 604,140 |
|
Estimated earnings |
| 49,247 |
| 20,763 |
|
Subtotal |
| 809,848 |
| 624,903 |
|
Less: Billings to date |
| 770,492 |
| 600,451 |
|
Total work in process |
| 39,356 |
| 24,452 |
|
All amounts are expected to be collected within 1 year
|
| 2006 |
| 2005 |
|
Costs incurred and estimated earnings in excess of billings |
| 151,238 |
| 113,721 |
|
Billings in excess of costs incurred and estimated earnings |
| (111,882 | ) | (89,269 | ) |
Total work in process |
| 39,356 |
| 24,452 |
|
Amount of advances received |
| 21,149 |
| 17,675 |
|
Amount of retentions held by clients |
| 933 |
| 1,392 |
|
Amounts in thousands of euros unless otherwise stated
103
9_Other current assets
|
| 2006 |
| 2005 |
|
Other receivables |
| 11,635 |
| 18,902 |
|
Prepaid expenses |
| 12,201 |
| 13,048 |
|
|
| 23,836 |
| 31,950 |
|
10_Cash and cash equivalents
The Company’s policy is to invest cash in excess of operating requirements in highly liquid investments with a maturity of three months or less. Cash and cash equivalents at December 31, 2006 and 2005 consisted of the following:
|
| 2006 |
| 2005 |
|
Deposits |
| 3,540 |
| 8,737 |
|
Cash in banks restricted for taxes/social premiums |
| 167 |
| 307 |
|
Bank and cash |
| 97,781 |
| 64,840 |
|
|
| 101,488 |
| 73,884 |
|
The effective interest rates for cash at balance sheet date were 4.4% (2005: 3%).
Amounts in thousands of euros unless otherwise stated
11_Issued share capital
The Company’s authorized share capital amounts to € 5,000,010 divided into 40,000,000 shares of common stock, 50,000,000 shares of cumulative preferred stock, and 10,000,000 shares of cumulative financing preferred stock (divided over four series of 2,500,000 shares each) and 200 priority shares, all with a nominal value of € 0.05 each. At December 31, 2006, 20,645,615 (2005: 20,645,615) shares of common stock and 200 (2005: 200) priority shares had been issued. No shares of cumulative preferred or cumulative financing preferred stock are issued or outstanding.
Priority shares
The priority shares have been issued since 1987 and are held by the Stichting Prioriteit ARCADIS NV, a foundation established in Arnhem. The special statutory right under ARCADIS’ Articles of Association regarding to these priority shares is decision making related to:
1. The issuance, acquisition and disposal of shares in the Company;
2. Amendments to the Articles of Association;
3. The dissolution of the Company and the filing for bankruptcy;
4. The entry into or termination of long-term cooperative ventures of substantial significance; and
5. Investments (including entering into participations) for an amount equal to at least 25% of shareholders’ equity.
The board of the Stichting Prioriteit ARCADIS NV is administered by 20 board members: 7 members of ARCADIS’ Supervisory Board, 3 members of ARCADIS’ Executive Board, and 10 members from the board of Foundation Bellevue (a foundation established in Arnhem, whose board members are appointed by and from the international employees of the ARCADIS group).
At balance sheet date, the board of the Stichting Prioriteit ARCADIS NV is comprised of the following persons:
Rijnhard W.F. van Tets, Chairman
Harrie L.J. Noy, Secretary
Jürgen Christoph Boenecke, Deputy Chairman
Joao Bandeira de Mello Laterza
Thomas M. Cohn
Marc A. Elbers
Carlos Espinosa de los Monteros
Pascal P.L. Guedon
C. Michiel Jaski
Piotr Miaso
George R. Nethercutt
Jan Peelen
Marc van Put
Friedrich Schneider
Ewoud van der Sluis
Marcel P. Stuart
Peter E. Yakimowich
Gerrit Ybema
Two vacancies
104
The Executive Board of ARCADIS NV and the Board of the Stichting Prioriteit ARCADIS NV are both of the opinion that, regarding the exercising of the voting right on the priority shares by the Stichting Prioriteit ARCADIS NV, there is full compliance with the requirements stipulated in Section X Book II of the general regulations of Euronext Amsterdam Stock Market.
Cumulative Preferred Shares
The Stichting Preferente Aandelen ARCADIS NV (Preferred Stock Foundation ARCADIS N.V.) established in Arnhem since 1995, has as its objective the protection and promotion of the interests of ARCADIS NV and its affiliated companies and all parties involved. The Foundation has been granted the right to acquire ARCADIS’ preferred (protection) shares up to a maximum equal to the number of outstanding shares issued at the date in question. ARCADIS NV has been granted the right to issue the same number of preferred shares to the Foundation. Both options may only be exercised provided the interests of ARCADIS NV, its affiliated enterprises, and all parties involved were to warrant this. In the event of an unfriendly or hostile take over attempt, these shares are provided to prevent any major changes in the control of the Company without due consideration of the interest of the Company and all those involved with it. The Board of the Foundation consists of four persons appointed by the Company’s Executive Board.
At balance sheet date, the Board of said Foundation is comprised of the following persons:
Jan A. Dekker, Chairman
Bram A. Anbeek van der Meijden, Secretary
Liesbeth E. M. Kneppers-Heijnert
Frits W. Mulder
The Executive Board of ARCADIS NV and the Board of the Stichting Preferente Aandelen ARCADIS NV are both of the opinion that, regarding the independence of the management, there is full compliance with the requirements stipulated in Section X Book II of the general regulations of Euronext Amsterdam Stock Market.
Cumulative Financing Preferred Shares
Since 2002, the Articles of Association incorporate the possibility to issue shares of cumulative financing preferred stock. Currently, no cumulative financing preferred stock have been issued.
Agreements with shareholders
The Articles of Association of the Stichting Lovinklaan stipulate that its board needs prior approval of the Stichting Prioriteit ARCADIS NV for any decisions concerning the disposal or pledge of the Foundation’s shares in ARCADIS NV, or to transfer them as security or otherwise encumber them.
Option and share purchase plans
To stimulate the realization of long-term Company objectives and goals ARCADIS NV has option and share plans, as well as a share purchase plan. Following is an overview.
ARCADIS NV 1994 and 1996 Incentive Plan At the time of the merger with Geraghty & Miller in 1993, ARCADIS has taken over and later in 1994 and 1996 expanded the existing employee option plans. These employee stock option plans were dedicated to employees of the American subsidiaries and ended in 2003 and 2005, respectively, so that since then, no new options can be granted under these plans. The options granted under these plans are valid for a ten-year period and generally become vested after a three-year period. At December 31, 2006, 79,787 (2005: 287,664) options were outstanding. These can be exercised at prices
105
ranging from US$ 6.75 to US$ 15.00 (2005: US$ 6.75 and US$ 15.00); the average exercise price is US$ 11.78 (2005: US$ 10.20). During 2006, 207,877 options were exercised (2005: 142,350) with exercise prices between US$ 6.75 and US$ 14.60 (2005: US$ 6.75 and US$ 11.50). During 2006, no options were cancelled. The closing price of ARCADIS shares on NASDAQ on December 29, 2006, was US$ 61.16 (2005: US$ 31.60). One option entitles the holder to one share. On December 31, 2006, option holders had the opportunity to exercise 52,012 options at prices ranging from US$ 6.75 to US$ 11.80.
ARCADIS NV 2001 Long-Term Incentive Share Option Plan
In the General Meeting of Shareholders of May 2001, the ARCADIS 2001 Long-Term Incentive Share Option Plan was introduced. Under this plan, a maximum of 2,500,000 options are expected to be granted from 2001 to 2006 to key staff members of ARCADIS NV and its subsidiaries. Options under this plan are conditional and can be exercised after three years of the issue date, provided the staff member is still employed by the Company. The options are valid for a period of 10 years starting on the issue date. At January 1, 2006, the number of outstanding options was 899,391 with exercise prices ranging from € 8.50 to € 21.77. During 2006, 322,013 options were exercised, while 8,806 options were cancelled. At December 31, 2006, 568,572 options are outstanding with exercise prices between € 8.50 and € 21.77. The average exercise price is € 13.35. On December 31, 2006, option holders had the opportunity to exercise 336,635 options against prices varying from € 8.50 to € 21.77. The closing price of ARCADIS shares on Euronext on December 29, 2006 was € 46.70. In May 2005, this plan was replaced by the ARCADIS NV Long-Term Incentive Plan.
ARCADIS NV 2005 Long-Term Incentive Plan In May 2005, the General Meeting of Shareholders agreed to a number of changes in the 2001 plan. These changes are the result of the implementation of the Dutch Corporate Governance Code, as well as the expiration of the ARCADIS 1996 Incentive Plan. Following are the primary changes that were introduced:
· In addition to rights to shares (option rights) other share-related incentives can be granted, such as Stock Appreciation Rights, Restricted Stock (units) and Incentive shares.
· The granting of (rights to) shares can be related to the goals or performance criteria as set by the ARCADIS NV Supervisory Board. This Committee also determines the moment at which the granted (rights to) shares can be exercised.
· The number of (rights to) shares totals 2,500,000; the plan is valid until December 31, 2011.
In its December 2005 meeting, the Supervisory Board approved the revised text of the 2001 plan, now titled the ARCADIS NV 2005 Long-Term Incentive Plan.
On May 19, 2006, 253,200 options were granted under this plan and accepted by 126 employees worldwide with an exercise price of € 37.13. To the members of the Executive Board on the same date, a total of 65,000 conditional options were granted and to the members of the Senior Management Committee 28,800 conditional options, all with an exercise price of € 37.13. In addition on May 19, 2006, under the 2005 Plan the members of the Executive Board were granted 27,000 conditional options, in line with the Remuneration policy for the Executive Board as agreed on by the General Meeting of Shareholders in May 2005 and 20,400 conditional options for the members of the Senior Management Committee.
106
Several times during 2006, 32,749 options with exercise prices ranging from € 34.90 to € 38.20 were granted to the Corporate Director of Mergers & Acquisitions. In July 2006, 7,000 options were granted to the management and key staff of Berkeley Consulting, related to the acquisition of the company. The exercise price is € 36.39. At October 1, 2006, 3,000 options with an exercise price of € 34.59 were granted to the Director of Human Resources, while 1,000 conditional shares were granted in relation to his employment contract. On December 31, 2006, a total number of 622,033 options were outstanding under the 2005 plan. The average exercise price is € 30.71. No options granted under the 2005 plan were exercisable at December 31.
Overview of incentive shares granted
Provisional (rights to) shares granted on |
| Granted |
| Unconditional in |
| Amount in € to be expensed |
| Expired |
|
May 11, 2005 |
| 17,000 |
| 2008 |
| 191,000 |
| — |
|
May 19, 2006 |
| 47,400 |
| 2009 |
| 1,105,000 |
| 1,547 |
|
October 1, 2006 |
| 1,000 |
| 2009 |
| 22,000 |
| — |
|
A summary of the combined activities under ARCADIS Stock Option Plans for each year in the two-year period ended December 31, 2006 is as follows:
|
| Number of |
|
|
| Number of |
|
|
|
|
| ARCADIS |
| Exercise price |
| ARCADIS |
| Exercise price |
|
|
| options |
| range in US$ |
| options |
| range in € |
|
Balance – January 1, 2005 |
| 454,139 |
| 6.75 to 15.00 |
| 809,802 |
| 8.50 to 10.79 |
|
Granted |
| 23,060 |
| 23.00 to 23.01 |
| 515,108 |
| 17.94 to 21.77 |
|
Exercised |
| (142,350 | ) | 6.75 to 11.50 |
| (160,889 | ) | 8.93 to 10.79 |
|
Forfeited |
| (24,125 | ) | 6.75 to 15.00 |
| (37,722 | ) | 8.50 to 19.25 |
|
Balance - December 31, 2005 |
| 310,724 |
| 6.75 to 23.01 |
| 1,126,299 |
| 8.50 to 21.77 |
|
Granted |
| — |
| — |
| 389,749 |
| 34.59 to 38.20 |
|
Exercised |
| (215,564 | ) | 6.75 to 23.01 |
| (314,326 | ) | 8.50 to 21.77 |
|
Forfeited |
| (0 | ) | — |
| (26,490 | ) | 8.50 to 37.13 |
|
Balance - December 31, 2006 |
| 95,160 |
| 6.75 to 23.01 |
| 1,175,232 |
| 8.50 to 38.20 |
|
At December 31, 2006 and 2005, options to purchase 388,647 and 315,839 shares, respectively, were exercisable. No granted options expired in 2006.
107
Total options outstanding and exercisable at December 31, 2006 were as follows:
|
| Options Outstanding |
| Options Exercisable |
| ||||||||
|
|
|
|
|
| Weighted |
|
|
| Weighted |
| ||
Option price per |
|
|
| Weighted |
| average exercise |
|
|
| average exercise |
| ||
share |
| Number |
| average life |
| price per share |
| Number |
| price per share |
| ||
$6.75-8.50 |
| 12,500 |
| 4.0 |
| $ | 7.48 |
| 12,500 |
| $ | 7.48 |
|
$8.51-10.00 |
| 11,862 |
| 5.9 |
| $ | 9.14 |
| 11,862 |
| $ | 9.14 |
|
$10.01-11.50 |
| 17,650 |
| 6.0 |
| $ | 11.50 |
| 17,650 |
| $ | 11.50 |
|
$11.51-15.00 |
| 37,775 |
| 7.6 |
| $ | 14.15 |
| 10,000 |
| $ | 11.80 |
|
$15.01-20.00 |
| — |
| — |
| — |
| — |
| — |
| ||
$20.01-24.00 |
| 15,373 |
| 8.5 |
| $ | 23.01 |
| — |
| — |
| |
Total |
| 95,160 |
|
|
| Average $13.59 |
| 52,012 |
| Average $10.05 |
| ||
€ 8.50-11.00 |
| 314,915 |
| 6.1 |
| € | 9.15 |
| 314,915 |
| € | 9.15 |
|
€ 11.01-17.00 |
| — |
| — |
| — |
| — |
| — |
| ||
€ 17.01-22.00 |
| 478,582 |
| 8.5 |
| € | 19.86 |
| 21,720 |
| € | 21.07 |
|
€ 22.01-34.00 |
| — |
| — |
| — |
| — |
| — |
| ||
€ 34.01-39.00 |
| 381,735 |
| 9.4 |
| € | 37.88 |
| — |
| — |
| |
Total | �� | 1,175,232 |
|
|
| Average € 22.84 |
| 336,635 |
| Average € 9.92 |
| ||
Issuance of shares
The General Meeting of Shareholders decides, under the approval of the Stichting Prioriteit ARCADIS NV, about the issuance of shares. The meeting can also appoint the Supervisory Board to issue shares, and as long as this appointment stands, the meeting cannot decide to issue. Issuance of shares to someone who has an earlier right to take shares can be decided by the Executive Board and does not fall under the stipulations outlined above.
Purchase of shares
The Executive Board can, with a mandate from the General Meeting of Shareholders and under approval from the Supervisory Board and the Stichting Prioriteit ARCADIS NV, purchase issued and paid-in shares in ARCADIS NV. The heretofore mentioned mandate is not needed in case the shares are purchased to be issued to employees in line with existing employee share or option plans.
Regarding the ARCADIS Incentive plans, the intention is to minimize dilution by purchasing (a portion of) the shares needed for these plans. In 2006, no shares were issued as a result of options being exercised (2005: zero). The following amounts of shares were purchased:
Year |
| Number of shares |
| Price at time of purchase |
|
2002 |
| 300,000 |
| €10.75 |
|
2003 |
| 112,972 |
| €7.74 to € 8.65 |
|
2004 |
| 500 |
| €8.65 |
|
2004 |
| 11,400 |
| US$18.40 to US$18.65 |
|
2005 |
| 217,013 |
| €18.25 to € 27.24 |
|
2005 |
| 115,033 |
| US$17.00 to US$30.94 |
|
2006 |
| 454,838 |
| €26.60 to € 41.51 |
|
2006 |
| 40,000 |
| US$44.10 to US$47.69 |
|
108
The repurchased shares are to cover the options granted. This temporary repurchase has been deducted from the Retained Earnings.
Of the shares purchased, throughout 2006 a total number of 529,890 have been placed back in the market through the exercise of options. The net proceeds were € 4,611,000.
At December 31, 2006, the number of repurchased shares that was in possession was 340,627.
Outstanding shares of common stock:
|
|
|
| Issuing |
| Repurchase |
| Reissuing |
|
|
|
|
| January 1 |
| shares |
| shares |
| shares |
| December 31 |
|
2004 |
| 20,017,405 |
| 215,238 |
| 11,900 |
| 78,000 |
| 20,298,743 |
|
2005 |
| 20,298,743 |
| — |
| 332,046 |
| 303,239 |
| 20,269,936 |
|
2006 |
| 20,269,936 |
| — |
| 494,838 |
| 529,890 |
| 20,304,988 |
|
Additional paid-in capital
Additional paid-in capital represents the premium paid in excess of par value of shares at the time of issuance of new shares or exercise of stock options. If ARCADIS declared a distribution to shareholders of additional paid-in-capital, at least € 17.6 million of the additional paid-in capital would not be taxable under the 1964 Dutch income tax legislation.
At the end of 2005 an agreement was made with the Lovinklaan Foundation, ARCADIS’ largest shareholder, that this foundation would pay ARCADIS € 6,509 to support an adjustment of the early retirement plan for Dutch employees (see Note 17). Such payment by a shareholder is considered additional paid-in capital.
Reserve exchange rate differences
Reserve exchange rate differences (a legal reserve) comprise all foreign exchange differences arising as of 2004 from the translation of the net assets of foreign operations outside the euro-zone.
Retained earnings
The Executive Board is authorized to propose to the Annual General Meeting of Shareholders, with the approval of the Supervisory Board, which part of the profit shall be paid as dividend. That which remains shall be added to the equity of the Company. The holder of the priority shares is entitled to a dividend of 5% of the par value of the priority shares. For fiscal year 2006, the Executive Board with the approval of the Supervisory Board proposes to add the amount of € 24.6 million to the retained earnings. The remainder of € 20.3 million can be distributed as a dividend which represents a dividend of € 1.00 per outstanding share of common stock.
For fiscal year 2005, a dividend was proposed and accepted amounting to € 0.66 per outstanding share of common stock. There are no restrictions on the distribution of retained earnings.
109
The earnings per share for the years 2006 and 2005 is calculated as follows:
|
| 2006 |
| 2005 |
|
Average number of issued shares |
| 20,645,815 |
| 20,645,815 |
|
Average number of repurchased shares |
| 411,520 |
| 385,103 |
|
Average number of outstanding shares |
| 20,234,295 |
| 20,260,712 |
|
Of which priority shares |
| 200 |
| 200 |
|
Shares of common stock |
| 20,234,095 |
| 20,260,512 |
|
For the calculation of earnings per share, no distinction is made between the different classes of shares.
Total earnings of ARCADIS:
|
| 2006 |
| 2005 |
|
Net income from operations |
| 50,035,000 |
| 33,366,000 |
|
Net income |
| 44,936,000 |
| 33,414,000 |
|
Earnings per share: |
|
|
|
|
|
Net income from operations |
| 2.47 |
| 1.65 |
|
Net income |
| 2.22 |
| 1.65 |
|
As mentioned on page 107 of this annual report, at December 31, 2006, the number of outstanding options is 1,270,392 (2005: 1,437,023). At December 31, 2006 all outstanding options were in the money, although not all options were exercisable. Exercising options may lead to dilution. This dilution is calculated on a monthly average basis. To avoid dilution as much as possible, ARCADIS repurchages own shares that are reissued at the time of option exercises.
|
| 2006 |
| 2005 |
|
Average number of outstanding shares |
| 20,234,295 |
| 20,260,712 |
|
Average number of diluting shares |
| 839,842 |
| 556,065 |
|
Average number of diluted shares |
| 21,074,137 |
| 20,816,777 |
|
Earnings per diluted share: |
|
|
|
|
|
Net income from operations |
| 2.37 |
| 1.60 |
|
Net income |
| 2.13 |
| 1.60 |
|
110
12_Provisions
|
| Pension |
| Deferred |
|
|
|
|
|
|
|
|
|
|
| obligations |
| compensation |
| Restructuring |
| Litigation |
| Others |
| Total |
|
Balance at January 1, 2005 |
| 18,903 |
| 1,194 |
| 4,460 |
| 1,403 |
| 1,459 |
| 27,419 |
|
Change as a result of |
|
|
|
|
|
|
|
|
|
|
|
|
|
(De)consolidations |
| — |
| — |
| (966 | ) | 348 |
| (861 | ) | (1,479 | ) |
Additions |
| 1,820 |
| 95 |
| 2,424 |
| 2,739 |
| 234 |
| 7,312 |
|
Amounts used |
| (499 | ) | (27 | ) | (3,158 | ) | (791 | ) | (377 | ) | (4,852 | ) |
Unused amounts reversed during the period |
| (13,100 | ) | — |
| — |
| — |
| — |
| (13,100 | ) |
Exchange rate differences |
| 460 |
| — |
| — |
| — |
| 58 |
| 518 |
|
Balance at December 31, 2005 |
| 7,584 |
| 1,262 |
| 2,760 |
| 3,699 |
| 513 |
| 15,818 |
|
|
|
|
|
|
|
|
|
|
|
|
|
|
|
Balance at January 1, 2006 |
| 7,584 |
| 1,262 |
| 2,760 |
| 3,699 |
| 513 |
| 15,818 |
|
Change as a result of |
|
|
|
|
|
|
|
|
|
|
|
|
|
Consolidations |
| — |
| — |
| — |
| — |
| 32 |
| 32 |
|
Additions |
| 1,377 |
| 17 |
| 669 |
| 1,259 |
| 344 |
| 3,666 |
|
Amounts used |
| (1,265 | ) | (27 | ) | (1,691 | ) | (1,955 | ) | (203 | ) | (5,141 | ) |
Unused amounts reversed during the period |
| — |
| — |
| (25 | ) | — |
| (35 | ) | (60 | ) |
Offsetting |
| (3,765 | ) | — |
| — |
| — |
| — |
| (3,765 | ) |
Other changes |
| — |
| — |
| — |
| 9,706 |
| 169 |
| 9,875 |
|
Exchange rate differences |
| (418 | ) | — |
| (45 | ) | (10 | ) | (9 | ) | (482 | ) |
Balance at December 31, 2006 |
| 3,513 |
| 1,252 |
| 1,668 |
| 12,699 |
| 811 |
| 19,943 |
|
Amounts in thousands of euros unless otherwise stated
No significant amount will be utilized within one year. As such, all provisions are recorded as non-current.
Pension obligations In the German and French operating companies for limited groups of (ex)employees, pension plans are in place. For these plans, provisions have been made based on IAS 19. At year-end 2006 these provisions amounted to € 3.2 million.
The United States operating company has a plan for deferred compensation. The management of the company can elect not to have its salary paid out, but rather invested in a fund by the company, and is offered a choice of three different portfolio types: risk averse, neutral and risky. The risk is the responsibility of the participants. At the end of 2005 the company owed the participants € 4.4 million in deferred salaries. This amount has been included in the Pension provision. Offsetting this was a receivable on the fund equal to the value of the portfolio of € 4.1 million, and this amount has been included in the line item other long-term receivables in the category Other assets. Further study of this special pension plan has shown that according to IAS 19.128 the amounts have to be balanced. At December 31, 2006 this leads to a net amount of € 0.3 million.
See also Note 17.
Deferred compensation A provision to the amount of € 1.3 million has been taken related to an already activated early retirement plan for a former manager of an acquired company and to a provision for future jubilee payments based on the current agreements in the collective labor agreements and the related staff levels.
Provisions for restructuring Provisions for restructuring includes costs related to certain compensation to staff and cost directly related to the existing plans to execute certain restructurings. A provision can only be taken if the decision to execute said restructuring has been taken, its costs can be reasonably and fairly estimated and its intended execution has been announced. Existing plans currently include small restructurings in certain parts of the company which are expected to be phased in on a step-by-step basis in the coming 24 months.
111
Provisions for litigation ARCADIS has global professional liability insurance coverage and in addition has local insurance in a number of countries. In general, these insurance policies have a self-insured retention and a maximum pay out level. Clients sometimes claim, justified or not, that they are not satisfied with the services provided by ARCADIS. Estimates by management and external advisors lead to an indication of the potential financial risk and whether or not that risk is covered by the insurance policies. This, in turn, determines the amount of the provision ARCADIS itself have to take. Other changes mainly consists of a movement from project-related loss provision recorded under (un)billed receivables to a litigation provision and movements from provisions with a short-term nature to a long-term nature.
Other provisions In some cases ARCADIS may extend warranties after the completion of activities for which no or no adequate compensation is received. In such cases, estimates form the basis for a provision.
Because settlement in these cases generally takes place in a brief time frame and because the amounts are relatively limited, no discounts are made.
13_Deferred tax assets and liabilities
|
| Deferred |
| Deferred |
|
|
|
|
| tax assets |
| tax liabilities |
| Net |
|
Balance at January 1, 2005 |
| 9,676 |
| 12,129 |
| (2,453 | ) |
Change as a result of |
|
|
|
|
|
|
|
(De)consolidations |
| 6,122 |
| 5,588 |
| 534 |
|
Additions |
| 4,810 |
| 7,427 |
| (2,617 | ) |
Amounts used |
| (3,881 | ) | (503 | ) | (3,378 | ) |
Unused amounts reversed during the period |
| (4,127 | ) | — |
| (4,127 | ) |
Exchange rate differences |
| 612 |
| 1,611 |
| (999 | ) |
Balance at December 31, 2005 |
| 13,212 |
| 26,252 |
| (13,040 | ) |
|
|
|
|
|
|
|
|
Balance at January 1, 2006 |
| 13,212 |
| 26,252 |
| (13,040 | ) |
Change as a result of |
|
|
|
|
|
|
|
(De)consolidations |
| 2,279 |
| 1,691 |
| 588 |
|
Additions |
| 3,626 |
| 9,666 |
| (6,040 | ) |
Amounts used |
| (1,951 | ) | (6,630 | ) | 4,679 |
|
Exchange rate differences |
| (24 | ) | (1,684 | ) | 1,660 |
|
Offsetting |
| (8,851 | ) | (8,851 | ) | — |
|
Balance at December 31, 2006 |
| 8,291 |
| 20,444 |
| (12,153 | ) |
Amounts in thousands of euros unless otherwise stated
Deferred tax assets and liabilities are offset only when there is a legally enforceable right to set off tax assets against tax liabilities and when the deferred tax assets and liabilities relate to the same tax authority.
Approximately € 17.4 million of the deferred tax liabilities at December 31, 2006, will be utilized within one year.
112
The components of deferred taxes included in the Consolidated Balance Sheets at December 31, 2006 and 2005 are as follows:
|
| Assets |
| Liabilities |
| Net |
| ||||||
Sources of deferral |
| 2006 |
| 2005 |
| 2006 |
| 2005 |
| 2006 |
| 2005 |
|
Goodwill/identifiables |
| 2,297 |
| — |
| 2,158 |
| 3,038 |
| (139 | ) | 3,038 |
|
Derivatives |
| — |
| — |
| — |
| 510 |
| — |
| 510 |
|
Work in progress |
| 745 |
| 580 |
| 23,907 |
| 18,958 |
| 23,162 |
| 18,378 |
|
Accrued expenses |
| 281 |
| 5,482 |
| (5,486 | ) | — |
| (5,767 | ) | (5,482 | ) |
Share-based compensation |
| 3,097 |
| 1,960 |
| — |
| — |
| (3,097 | ) | (1,960 | ) |
Deferred compensation |
| 1,340 |
| 2,202 |
| — |
| — |
| (1,340 | ) | (2,202 | ) |
Net operating losses |
| 642 |
| 2,988 |
| — |
| — |
| (642 | ) | (2,988 | ) |
Cash method |
| — |
| — |
| — |
| 3,054 |
| — |
| 3,054 |
|
Others |
| (111 | ) | — |
| (135 | ) | 692 |
| (24 | ) | 692 |
|
Balance at December 31 |
| 8,291 |
| 13,212 |
| 20,444 |
| 26,252 |
| 12,153 |
| 13,040 |
|
The gross operating losses which might be compensated by future profits amount to € 5,857 in 2006 and € 13,035 in 2005. For these pre-tax losses, there is no expiration date.
In assessing the valuation of the deferred tax assets, management considers whether it is probable that some portion or all of the deferred tax assets will be realized. The ultimate realization of the deferred tax assets is dependent upon the generation of future taxable income during the periods in which those temporary differences become deductible. Management considers the scheduled reversal of deferred tax liabilities, projected future taxable income, and tax planning strategies in making this assessment. The amount of the deferred tax assets considered realizable, however, could change in the near term if future estimates of projected taxable income during the carry-forward period are revised.
In 2006 a deferred tax asset of € 1.9 million (2005: € 1.9 million) of net operating losses was not recognized. The opinion of management is that these losses will not be compensated by future profits in the companies where these losses were made.
14_Long-term debt
|
| 2006 |
| 2005 |
|
Bank loans |
|
|
|
|
|
(interest rates between 3.2% and 18.9%) |
| 97,190 |
| 85,691 |
|
Financial lease contracts |
|
|
|
|
|
(interest rates between 3.0% and 6.8%) |
| 780 |
| 1,172 |
|
Other long-term debt |
|
|
|
|
|
(interest rates between 3.0% and 7.0%) |
| 22,896 |
| 31,742 |
|
Subtotal |
| 120,866 |
| 118,605 |
|
Current portion |
| 1,580 |
| 2,456 |
|
|
| 119,286 |
| 116,149 |
|
Aggregate maturities of long-term debt are as follows:
2008 |
| 1,060 |
|
2009 |
| 23,074 |
|
2010 |
| 1,356 |
|
2011 |
| 851 |
|
2012 |
| 57,285 |
|
after 2012 |
| 35,660 |
|
|
| 119,286 |
|
Amounts in thousands of euros unless otherwise stated
The weighted average interest rate for 2006 and 2005 on interest-bearing debt (including the interest effect of the swap) was 3.6% and 3.1%, respectively.
113
Under this heading the retention for the acquisition of BBL is included amounting to €17.6 million. Also included are other expected after payments related to acquisitions, amounting to € 4.0 million. Under the terms of the lease agreements, no contingent rents are payable.
In 2006, ARCADIS finalized the refinancing of the long-term loan and short-term debt facility. The long-term loan amounts to $ 120 million with US LIBOR-dominated interest rate. The full amount of $ 120 million is swapped to a EURIBOR-dominated interest rate of which an euro equivalent of $ 45 million is swapped to a fixed rate of 3.18%. For the disclosure on the derivatives, please refer to Note 7. The debt covenants are disclosed under Note 15.
15_Other current liabilities
|
| 2006 |
| 2005 |
|
Taxes and social security contributions |
| 34,110 |
| 26,845 |
|
Payable to employees |
| 56,686 |
| 34,082 |
|
Bank overdrafts and short-term borrowings |
| 22,342 |
| 4,196 |
|
After payments acquisitions |
| 8,016 |
| 2,486 |
|
Other liabilities |
| 21,785 |
| 51,204 |
|
|
| 142,939 |
| 118,813 |
|
In 2006, ARCADIS finalized the refinancing. Part of this is a centralized short-term multi-currency debt facility totaling € 100 million with an EONIA-dominated interest rate, and a guarantee facility totaling € 50 million, was concluded with a consortium of banks. The debt covenant at balance sheet date for the long-term loan, as well as for the short-term facility is that the net debt to EBITDA ratio should not exceed 3.
Besides the central facility there are short-term facilities available for the amount of € 35 million. For a small portion of the other available credit facilities, current receivables and other assets have been pledged. The total short-term debt facilities amount to € 196.5 million.
The effective interest rates for bank overdrafts are between 2.7% and 6.0%.
Commitments and contingent liabilities Banks have issued bonds up to the amount of € 41.0 million (2005: € 40.0 million).
Operational leases
Future minimum payments for the non-cancelable operating leases during the next five years and thereafter are as follows (in millions of €):
Years ending December 31, |
| Amount operational lease |
|
2007 |
| 34.9 |
|
2008 |
| 30.8 |
|
2009 |
| 30.5 |
|
2010 |
| 19.3 |
|
2011 |
| 15.3 |
|
Thereafter |
| 29.7 |
|
Total |
| 160.5 |
|
114
The Company’s lease arrangements relate to contracts for leased cars and buildings.
During the year ended December 31, 2006, € 34.4 million was recognized as an expense in the income statement with regard to operating leases (2005: € 29.6).
Litigation For legal and judicial proceedings and claims against the Company and its operating entities, a liability is accrued only if an adverse outcome is probable and the amount of the loss can be reasonably estimated. If one of these conditions is not met, the proceeding or claim is disclosed as contingent liability, if material. The actual outcome of a proceeding or claim may differ from the estimated liability, and consequently may affect the actual result. The prediction of the outcome and the assessment of a possible loss by management is based on management’s judgments and estimates. Management usually consults lawyers and other specialists for support.
Guarantees As a partner in a number of partnerships, ARCADIS is liable for the contractual obligations these companies enter into. The potential risk pertaining to these obligations amounted to € 0.1 million (2005: € 0.3 million).
115
Notes to the consolidated statement of income
Notes to the consolidated statement of income
16_Segment information
Presented below is the geographical segmentation that coincides with the Company’s reporting structure.
Inter-segment pricing is determined on an arm’s length basis.
|
|
|
|
|
| Europe |
|
|
|
|
|
|
|
|
|
|
|
|
| ||||||
|
|
|
|
|
| excluding |
| United |
| Rest of |
|
|
|
|
|
|
|
|
| ||||||
Amounts in millions of euros |
| The Netherlands |
| the Netherlands |
| States |
| world |
| Eliminations |
| Consolidated |
| ||||||||||||
|
| 2006 |
| 2005 |
| 2006 |
| 2005 |
| 2006 |
| 2005 |
| 2006 |
| 2005 |
| 2006 |
| 2005 |
| 2006 |
| 2005 |
|
Gross revenue |
| 323.3 |
| 287.7 |
| 277.9 |
| 267.1 |
| 518.4 |
| 348.9 |
| 113.4 |
| 97.4 |
|
|
|
|
| 1,233.0 |
| 1,001.1 |
|
Revenue between regions |
| 2.7 |
| 3.0 |
| 4.3 |
| 2.6 |
| 0.3 |
| 0.1 |
| 0.3 |
| 0.2 |
| (7.6 | ) | (5.9 | ) | — |
| — |
|
Total revenue regions |
| 326.0 |
| 290.7 |
| 282.2 |
| 269.7 |
| 518.7 |
| 349.0 |
| 113.7 |
| 97.6 |
| (7.6 | ) | (5.9 | ) | 1,233.0 |
| 1,001.1 |
|
Materials, services of third parties and subcontractors |
| 103.1 |
| 78.4 |
| 55.4 |
| 60.2 |
| 186.8 |
| 115.7 |
| 57.9 |
| 49.4 |
| (7.6 | ) | (5.9 | ) | 395.6 |
| 297.8 |
|
Net revenue |
| 222.9 |
| 212.3 |
| 226.8 |
| 209.4 |
| 331.9 |
| 233.3 |
| 55.8 |
| 48.2 |
|
|
|
|
| 837.4 |
| 703.3 |
|
Operating costs regions |
| 199.9 |
| 193.8 |
| 203.1 |
| 184.3 |
| 290.7 |
| 208.1 |
| 47.2 |
| 41.6 |
|
|
|
|
| 740.9 |
| 627.7 |
|
Depreciation regions |
| 5.6 |
| 5.0 |
| 4.9 |
| 4.9 |
| 6.4 |
| 4.4 |
| 0.8 |
| 0.8 |
|
|
|
|
| 17.7 |
| 15.2 |
|
EBITA |
| 17.4 |
| 13.5 |
| 18.8 |
| 20.2 |
| 34.8 |
| 20.9 |
| 7.8 |
| 5.8 |
|
|
|
|
| 78.8 |
| 60.4 |
|
Amortization identifiable intangible assets |
| 2.6 |
| 2.0 |
| 1.5 |
| 1.4 |
| 3.7 |
| 2.6 |
| 0.5 |
|
|
|
|
|
|
| 8.3 |
| 6.0 |
|
Operating income |
| 14.8 |
| 11.5 |
| 17.3 |
| 18.8 |
| 31.1 |
| 18.3 |
| 7.3 |
| 5.8 |
|
|
|
|
| 70.5 |
| 54.4 |
|
Financing items |
|
|
|
|
|
|
|
|
|
|
|
|
|
|
|
|
|
|
|
|
| (3.5 | ) | (1.8 | ) |
Income from associates |
| 0.2 |
| 0.2 |
|
|
| 0.0 |
|
|
|
|
| (0.7 | ) | 1.2 |
|
|
|
|
| (0.5 | ) | 1.4 |
|
Taxes |
|
|
|
|
|
|
|
|
|
|
|
|
|
|
|
|
|
|
|
|
| (20.1 | ) | (17.3 | ) |
Group income after taxes |
|
|
|
|
|
|
|
|
|
|
|
|
|
|
|
|
|
|
|
|
| 46.4 |
| 36.6 |
|
Minority interest |
|
|
|
|
|
|
|
|
|
|
|
|
|
|
|
|
|
|
|
|
| (1.5 | ) | (3.2 | ) |
Net income |
| 11.7 |
| 11.4 |
| 10.5 |
| 11.1 |
| 21.0 |
| 9.1 |
| 1.7 |
| 1.8 |
|
|
|
|
| 44.9 |
| 33.4 |
|
EBITA on recurring basis |
| 17.4 |
| 12.5 |
| 18.8 |
| 18.1 |
| 34.8 |
| 20.9 |
| 7.8 |
| 5.8 |
|
|
|
|
| 78.8 |
| 57.3 |
|
Net income from operations |
| 14.0 |
| 11.4 |
| 11.7 |
| 11.1 |
| 22.2 |
| 9.1 |
| 2.1 |
| 1.8 |
|
|
|
|
| 50.0 |
| 33.4 |
|
Total assets |
| 433.9 |
| 318.6 |
| 193.9 |
| 157.6 |
| 284.4 |
| 268.6 |
| 60.5 |
| 59.3 |
| (236.2 | ) | (154.0 | ) | 736.5 |
| 650.1 |
|
Total financial assets |
| 1.8 |
| 1.5 |
| 1.3 |
| 1.7 |
| 0.9 |
| 6.3 |
| 13.2 |
| 10.6 |
|
|
|
|
| 17.2 |
| 20.1 |
|
Total liabilities |
| 247.7 |
| 142.0 |
| 132.3 |
| 135.4 |
| 233.1 |
| 225.5 |
| 36.5 |
| 39.5 |
| (113.8 | ) | (80.4 | ) | 535.8 |
| 462.0 |
|
Total investments |
| 7.8 |
| 4.0 |
| 3.9 |
| 5.8 |
| 6.5 |
| 6.2 |
| 1.1 |
| 1.6 |
|
|
|
|
| 19.3 |
| 17.7 |
|
Total number of employees |
| 2,587 |
| 2,389 |
| 3,044 |
| 2,751 |
| 3,557 |
| 3,098 |
| 1,230 |
| 905 |
|
|
|
|
| 10,418 |
| 9,143 |
|
17_Operational costs
|
| 2006 |
| 2005 |
|
Salaries and wages |
| 435,470 |
| 349,966 |
|
Social charges |
| 62,749 |
| 55,284 |
|
Pension and early retirement charges |
| 19,143 |
| 15,574 |
|
Other personnel costs including temporary labor |
| 63,971 |
| 63,657 |
|
Total personnel costs |
| 581,333 |
| 484,481 |
|
Occupancy expenses |
| 50,574 |
| 44,009 |
|
Travel expenses |
| 38,749 |
| 32,244 |
|
Office expenses |
| 24,887 |
| 22,574 |
|
Audit and consultants costs |
| 18,818 |
| 14,687 |
|
Insurance costs |
| 10,144 |
| 8,446 |
|
Other operational costs |
| 16,471 |
| 21,244 |
|
Total other operational costs |
| 159,643 |
| 143,204 |
|
Total operational costs |
| 740,976 |
| 627,685 |
|
Amounts in thousands of euros unless otherwise stated
116
The average number of employees in 2006 was 9,685 (2005: 9,208). The headcount includes the total number of employees of the proportionately consolidated company ARCADIS Aqumen Facility Management B.V. (228) (2005: 166).
Share-based compensation
In accordance with IFRS 2, the Company’s stock option plans qualify as so-called equity-settled plans. As a consequence, the Company has to charge the fair value of the stock options against income (spread over the vesting period). The corresponding amount is directly credited to equity.
Under other personnel cost, an amount of € 1.5 million is included for the options granted to personnel in 2006, 2005 and 2004 under the different option plans. In calculating the amount, the fair value of each option was estimated as of the 2006 date of grant using the binominal option-pricing model with the following weighted average assumptions:
Expected dividend yield |
| 2.09% |
|
Risk-free interest rate |
| 3.9% |
|
Expected volatility |
| 25% |
|
Expected life of option |
| 5 years |
|
Expected forfeitures |
| 9.2% |
|
Incentive shares On May 11, 2005, the Annual General Meeting of Shareholders approved the conditional granting of 17,000 incentive shares to the members of the Executive Board. The costs of this grant amount to € 0.2 million. These costs are amortized over the 3-year period because the grant becomes unconditional after three years. The expenses for 2006 amount to € 0.1 million and are included in the other personnel costs.
In May 2006, 47,400 incentive shares were granted to the members of the Executive Board and senior management. The expenses for 2006 amount to € 0.2 million
The following parameters were used to calculate the costs:
Share price at grant date 2005 |
| € | 17.94 |
|
Share price at grant date 2006 |
| € | 37.13 |
|
Expected dividend yield |
| 2.57% |
| |
Risk-free interest rate |
| 3.30% |
| |
Foregone dividend |
| 7.2% |
| |
Performance discount |
| 30.0% |
| |
Options and shares granted are conditional in nature and depend on attaining a performance measure after 3 years. The performance measure is Total Shareholder Return (TSR), defined as share price increase plus dividend. This measure stimulates the creation of shareholder value in the longer term.
Each year, a 3-year cycle begins, whereby achievements are measured at the end of the period against a peer group of companies of comparable size and breadth. ARCADIS’ position in the peer group (10 companies including ARCADIS) determines whether the (conditional) options and shares granted earlier become unconditional.
117
The following table indicates the number of options and shares that can become unconditional at the end of each 3-year period depending on ARCADIS’ relative position in comparison to the peer group.
|
| Number of conditional options and shares |
| Number of conditional options that |
|
Position against peer group |
| that become unconditional for management |
| become unconditional for key staff |
|
First |
| 150 | % | 115 | % |
Second |
| 133.3 | % | 110 | % |
Third |
| 116.7 | % | 105 | % |
Fourth |
| 100 | % | 100 | % |
Fifth |
| 83.3 | % | 95 | % |
Sixth |
| 66.7 | % | 90 | % |
Seventh |
| 50 | % | 85 | % |
Eighth |
| 0 | % | 80 | % |
Below eighth |
| — |
| 0 | % |
Pension costs
The difference between the pension costs of 2006 compared to those of 2005 is largely caused by a couple of one off amounts in the figures for 2005. These are related to changes in the pension plans for Dutch employees.
Per January 1, 2004, the pension plan for Dutch employees, excluding employees of PRC, was changed into a pension plan that is classified as a defined contribution plan. This means that, except for the pension premium, this plan does not affect ARCADIS’ results and balance sheet. The introduction of new legislation on January 1, 2006 however, impacts the early retirement plan. The Lovinklaan Foundation, which – as a major ARCADIS shareholder – acts in the interest of employees, pledged funding to correct this impact. The required one off donation of € 9.5 million to the pension fund was charged against 2005 income. Thanks to the € 6.5 million capital contribution by the Lovinklaan Foundation, the effect (after taxes) on ARCADIS equity was zero.
Due to the transition of the PRC pension plan by the end of 2005 to a defined contribution plan, a provision of € 13.1 million was released to income in 2005 (see note 10). In the 2004 IFRS income statement a benefit of € 1.2 million was recorded regarding this plan. This is a non-recurring effect. The transition to a defined contribution plan required in 2005 a one time additional contribution to the PRC pension fund of € 2.3 million. The total effect of these was a one off additional pension premium of € 0.6 million.
18_Financial items
|
| 2006 |
| 2005 |
|
Financial income |
| 14,116 |
| 2,784 |
|
Financial expenses |
| (10,063 | ) | (6,351 | ) |
Fair value changes of derivatives(*) |
| (7,552 | ) | 1,723 |
|
|
| (3,499 | ) | (1,844 | ) |
(*) In 2005, ARCADIS financed the BBL acquisition through USD loan. To hedge currency and interest risks, cross currency swaps were purchased. In 2005, the swaps were included in the income statement, while the value changes of the loan were reported directly in equity. As of 2006, value changes of both the swaps and the corresponding loan are reported through the income statement. See also Note 7.
Amounts in thousands of euros unless otherwise stated
118
19_Income taxes
ARCADIS NV is for income tax purposes the parent of the fiscal unit ARCADIS NV and is therefore liable for the liabilities of the fiscal unit as a whole. The weighted average tax rate on income from operations was 30.2% (2005: 32.2%).
|
| 2006 |
| 2005 |
| ||||||||
Explanation effective tax rate |
| Gross amount |
| Taxes |
| In % |
| Gross amount |
| Taxes |
| In % |
|
Income from operations |
| 66,982 |
| 20,119 |
| 30.0 | % | 52,544 |
| 17,342 |
| 33.0 | % |
Income (loss) from associates |
| (458 | ) | — |
| — |
| 1,382 |
| — |
| — |
|
Total |
| 66,524 |
| 20,119 |
| 30.2 | % | 53,926 |
| 17,342 |
| 32.2 | % |
Nominal tax rate in the Netherlands |
|
|
|
|
| 29.6 | % |
|
|
|
| 31.5 | % |
Foreign tax rate differences |
|
|
|
|
| 4.6 | % |
|
|
|
| 2.9 | % |
Tax losses previously not recognized |
|
|
|
|
| (0.1 | )% |
|
|
|
| — |
|
Settlements related to previous years |
|
|
|
|
| 0.2 | % |
|
|
|
| (0.1 | )% |
Amortization |
|
|
|
|
| — |
|
|
|
|
| 0.8 | % |
Income (loss) from associates |
|
|
|
|
| 0.2 | % |
|
|
|
| (0.8 | )% |
Non taxable amounts and others |
|
|
|
|
| (2.9 | )% |
|
|
|
| (1.5 | )% |
Change in corporate tax rate the Netherlands |
|
|
|
|
| (1.4 | )% |
|
|
|
| (0.6 | )% |
Effective tax rate |
|
|
|
|
| 30.2 | % |
|
|
|
| 32.2 | % |
Explanation taxes |
| 2006 |
| 2005 |
|
Current year |
| 20,019 |
| 6,232 |
|
Adjustments for previous years |
| 122 |
| 342 |
|
Total current tax |
| 20,141 |
| 6,574 |
|
Deferred tax |
| (22 | ) | 10,768 |
|
|
| 20,119 |
| 17,342 |
|
The tax effects of significant timing differences that give rise to year-end deferred tax assets and liabilities are offset within each taxable entity. Deferred tax assets in excess of these amounts are recognized if their realization is more likely than not.
The geographic breakdown of income before taxes, including income before taxes from associates and longterm investments in 2006 and 2005 are as follows:
|
| 2006 |
| 2005 |
|
The Netherlands |
| 14,921 |
| 12,442 |
|
Foreign |
| 51,603 |
| 41,484 |
|
Income before taxes |
| 66,524 |
| 53,926 |
|
The geographic breakdown of income taxes in the Consolidated Statements of Income is as follows:
|
| 2006 |
| 2005 |
|
Current tax |
|
|
|
|
|
The Netherlands |
| 2,289 |
| (5,420 | ) |
Foreign |
| 17,852 |
| 11,994 |
|
|
| 20,141 |
| 6,574 |
|
Deferred tax |
|
|
|
|
|
The Netherlands |
| (130 | ) | 6,824 |
|
Foreign |
| 108 |
| 3,944 |
|
|
| (22 | ) | 10,768 |
|
Total taxes |
| 20,119 |
| 17,342 |
|
At December 31, 2006, operating loss carry-forwards for tax purposes amounted to € 5.9 million which can be carried forward indefinitely. Net operating losses of € 6.8 million were utilized during 2006 and zero in 2005.
Amounts in thousands of euros unless otherwise stated
119
Subsequent events, acquisitions and divestments
20_Subsequent events
No events have occurred after December 31, 2006, that would have changed the judgment and analysis by management of the financial condition of the Company at December 31, 2006, or the profit for the period for the year 2006.
21_Effect of the acquisition and divestment of interests
The acquisitions and disposal of interests, as stated in the Notes to the consolidated financial statements on page 97, had the following effect on the ARCADIS assets and liabilities.
Assets |
| Acquisitions |
| Divestments |
| Total |
|
Non-current assets |
|
|
|
|
|
|
|
Intangible assets |
| 10,874 |
|
|
| 10,874 |
|
Property, plant & equipment |
| 1,757 |
|
|
| 1,757 |
|
Investments in equity accounted associates |
| 24 |
|
|
| 24 |
|
Other investments |
| 68 |
|
|
| 68 |
|
Deferred tax assets |
| 2,279 |
|
|
| 2,279 |
|
Total non-current assets |
| 15,002 |
|
|
| 15,002 |
|
Current assets |
|
|
|
|
|
|
|
Inventories |
| 8 |
|
|
| 8 |
|
(Un)billed receivables |
| 13,045 |
| (50 | ) | 12,995 |
|
Corporate tax receivable |
| 120 |
|
|
| 120 |
|
Cash and cash equivalents |
| 3,596 |
|
|
| 3,596 |
|
Total current assets |
| 16,769 |
| (50 | ) | 16,719 |
|
Total assets |
| 31,771 |
| (50 | ) | 31,721 |
|
Equity and liabilities |
| Acquisitions |
| Divestments |
| Total |
|
Minority interest |
| (930 | ) |
|
| (930 | ) |
Provisions |
| 36 |
|
|
| 36 |
|
Deferred tax liabilities |
| 1,691 |
|
|
| 1,691 |
|
Long-term debt |
| 117 |
|
|
| 117 |
|
Total non-current liabilities |
| 1,844 |
|
|
| 1,844 |
|
Billing in excess of cost |
| 661 |
|
|
| 661 |
|
Corporate tax liabilities |
| 507 |
|
|
| 507 |
|
Trade and other liabilities |
| 6,873 |
| (73 | ) | 6,800 |
|
Total current liabilities |
| 8,041 |
| (73 | ) | 7,968 |
|
Total equity and liabilities |
| 8,955 |
| (73 | ) | 8,882 |
|
Total net value |
| 22,816 |
| 23 |
| 22,839 |
|
|
|
|
|
|
|
|
|
Recorded goodwill / (Book gain) |
| 29,858 |
|
|
| 29,858 |
|
Consideration paid / (received) |
| 52,674 |
| 23 |
| 52,697 |
|
|
|
|
|
|
|
|
|
After payments not paid yet |
| (3,845 | ) |
|
| (3,845 | ) |
After payment paid related to 2005 acquisition |
| 846 |
|
|
| 846 |
|
Cash (acquired) / disposed |
| (3,593 | ) |
|
| (3,593 | ) |
Net cash outflow / (inflow) |
| 46,082 |
| 23 |
| 46,105 |
|
No equity instruments were issued with respect to the 2006 acquisitions.
Amounts in thousands of euros unless otherwise stated
120
Related ventures
For 2006 the acquired interests contributed a profit for the period (after amortization of identifiable intangible assets of € 1.1 million net) of € (0.2) million to the consolidated profit for the period for the year, excluding financing expenses related to these acquisitions. If the acquisitions had occurred on January 1, 2006, the addition to ARCADIS’ net revenue would have been € 49.3 million, and addition to ARCADIS’ profit for the period would have been € 3.4 million, excluding financing expenses related to these acquisitions, and based on local GAAP.
Related party transactions
From time to time the Company entered into related party transactions with associates. These transactions are conducted on an arm’s length basis with terms comparable to transactions with third parties. Intercompany transactions, balances and unrealised gains on transactions between group companies are eliminated on consolidation and are not disclosed in this Note. In 2006, ARCADIS was no party to any transaction or loan with other parties who hold at least 10% of the shares in ARCADIS. In 2005 the transaction with the Lovinklaan Foundation was the only related party transaction.
Interests in jointly controlled entities
The group has a 50% interest in the jointly controlled entity ARCADIS Aqumen Facility Management BV and a 33.3% interest in the jointly controlled entity Biogás Energia Ambiental S.A. The financial statements of these jointly controlled entities are (in millions of euros):
|
| 2006 |
| 2005 |
|
Non-current assets |
| 8.6 |
| 5.6 |
|
Current assets |
| 28.6 |
| 13.7 |
|
Total assets |
| 37.2 |
| 19.3 |
|
Non-current liabilities |
| 4.4 |
| 5.5 |
|
Current liabilities |
| 27.7 |
| 10.1 |
|
Minority interest |
| — |
| — |
|
Total liabilities |
| 32.1 |
| 15.6 |
|
Gross revenue |
| 89.0 |
| 46.5 |
|
Expenses |
| 85.1 |
| 43.5 |
|
121
Company balance sheet at December 31
Assets |
| 2006 |
| 2005 |
|
Non-current assets |
|
|
|
|
|
Intangible assets (22)(*) |
| 444 |
| 2,686 |
|
Property, plant & equipment (23) |
| 750 |
| 230 |
|
Investment in subsidiaries (24) |
| 133,561 |
| 136,887 |
|
Other investments (25) |
| 18,502 |
| 9,130 |
|
Deferred tax assets (29) |
| 3,371 |
| 2,275 |
|
Total non-current assets |
| 156,628 |
| 151,208 |
|
Current assets |
|
|
|
|
|
Derivatives (7) |
| — |
| 1,723 |
|
Receivables (26) |
| 80,303 |
| 59,885 |
|
Corporate tax receivables |
| 8,114 |
| 4,744 |
|
Cash and cash equivalents |
| 7,606 |
| 3,455 |
|
Total current assets |
| 96,023 |
| 69,807 |
|
Total |
| 252,651 |
| 221,015 |
|
|
|
|
|
|
|
Equity and liabilities |
|
|
|
|
|
Shareholders’ equity |
|
|
|
|
|
Share capital |
| 1,030 |
| 1,030 |
|
Additional paid-in capital |
| 44,153 |
| 44,153 |
|
Reserve exchange rate differences |
| (7,659 | ) | 6,403 |
|
Retained earnings |
| 106,421 |
| 91,203 |
|
Undistributed profits |
| 44,936 |
| 33,414 |
|
Total shareholders’ equity (27) |
| 188,881 |
| 176,203 |
|
Non-current liabilities |
|
|
|
|
|
Provisions (28) |
| 7,363 |
| 1,000 |
|
Deferred tax liabilities (29) |
| 570 |
| 1,262 |
|
Long-term debt |
| 148 |
| 7,270 |
|
Derivatives |
| 5,829 |
| — |
|
Total non-current liabilities |
| 13,910 |
| 9,532 |
|
Current liabilities |
|
|
|
|
|
Corporate tax liabilities |
| 2,500 |
| — |
|
Trade and other liabilities (30) |
| 47,360 |
| 35,280 |
|
Total current liabilities |
| 49,860 |
| 35,280 |
|
Total |
| 252,651 |
| 221,015 |
|
(*) Goodwill for both 2006 and 2005 is included in the line item Investments in subsidiaries as the Company is using the equity method for valuation of their investments in subsidiaries.
Amounts in thousands of euros unless otherwise stated
122
Company statement of income at December 31
Notes to the Company balance sheet
Company statement of income at December 31
Amounts in thousands of euros unless otherwise stated
|
| 2006 |
| 2005 |
|
Net income subsidiaries |
| 50,881 |
| 43,135 |
|
Other results |
| (5,945 | ) | (9,721 | ) |
Net income |
| 44,936 |
| 33,414 |
|
Notes to the Company balance sheet
General
The Company financial statements have been prepared in accordance with Title 9 Book 2 of the Dutch Civil Code using article 362 paragraph 8 that implies that the accounting policies of the consolidated financial statements are used.
Subsidiaries are valued using the net equity method.
The conversion of foreign currencies and the method of determination of income are the same as those used in the consolidated financial statements.
The Company’s statement of income has been condensed in accordance with article 402 Book 2 of the Dutch Civil Code.
As a result of the application of the option in section 362 of Book 2 of the Dutch Civil Code to use the same accounting principles as for the consolidated financial statements, the financial statements of ARCADIS NV have been prepared in accordance with International Financial Reporting Standards (IFRS) and its interpretations as adopted by the International Accounting Standards Board (IASB) and endorsed by the European Union. By making use of this option, reconciliation is maintained between the consolidated and the Company’s shareholders’equity.
123
22_Intangible assets
|
| Identifiable |
|
|
|
|
|
|
| intangible |
|
|
|
|
|
|
| assets |
| Software |
| Total |
|
Purchase price |
|
|
|
|
|
|
|
Balance at January 1, 2005 |
| — |
| 3,276 |
| 3,276 |
|
Investments |
| 4,492 |
| 126 |
| 4,618 |
|
Balance at December 31, 2005 |
| 4,492 |
| 3,402 |
| 7,894 |
|
|
|
|
|
|
|
|
|
Balance at January 1, 2006 |
| 4,492 |
| 3,402 |
| 7,894 |
|
Investments |
| — |
| 563 |
| 563 |
|
Divestments |
| — |
| (151 | ) | (151 | ) |
Transfer to consolidated companies |
| (4,492 | ) | — |
| (4,492 | ) |
Balance at December 31, 2006 |
| — |
| 3,814 |
| 3,814 |
|
|
|
|
|
|
|
|
|
Amortization and depreciation |
|
|
|
|
|
|
|
Balance at January 1, 2005 |
| — |
| 3,263 |
| 3,263 |
|
Amortization and depreciation charge for the year |
| 1,901 |
| 44 |
| 1,945 |
|
Balance at December 31, 2005 |
| 1,901 |
| 3,307 |
| 5,208 |
|
|
|
|
|
|
|
|
|
Balance at January 1, 2006 |
| 1,901 |
| 3,307 |
| 5,208 |
|
Depreciation charge for the year |
| — |
| 119 |
| 119 |
|
Divestments |
| — |
| (56 | ) | (56 | ) |
Transfer to consolidated companies |
| (1,901 | ) | — |
| (1,901 | ) |
Balance at December 31, 2006 |
| — |
| 3,370 |
| 3,370 |
|
|
| Identifiable |
|
|
|
|
|
|
| intangible |
|
|
|
|
|
|
| assets |
| Software |
| Total |
|
Carrying amounts |
|
|
|
|
|
|
|
At January 1, 2005 |
| — |
| 13 |
| 13 |
|
At December 31, 2005 |
| 2,591 |
| 95 |
| 2,686 |
|
|
|
|
|
|
|
|
|
At January 1, 2006 |
| 2,591 |
| 95 |
| 2,686 |
|
At December 31, 2006 |
| — |
| 444 |
| 444 |
|
Amounts in thousands of euros unless otherwise stated
124
23_Property, plant & equipment
|
| Furniture and fixtures |
|
Purchase price |
|
|
|
Balance at January 1, 2005 |
| 1,896 |
|
Investments |
| 141 |
|
Divestments |
| (302 | ) |
Balance at December 31, 2005 |
| 1,735 |
|
|
|
|
|
Balance at January 1, 2006 |
| 1,735 |
|
Investments |
| 622 |
|
Divestments |
| (1,512 | ) |
Balance at December 31, 2006 |
| 845 |
|
|
|
|
|
Depreciation |
|
|
|
Balance at January 1, 2005 |
| 1,534 |
|
Depreciation charge for the year |
| 273 |
|
Divestments |
| (302 | ) |
Balance at December 31, 2005 |
| 1,505 |
|
|
|
|
|
Balance at January 1, 2006 |
| 1,505 |
|
Depreciation charge for the year |
| 74 |
|
Divestments |
| (1,484 | ) |
Balance at December 31, 2006 |
| 95 |
|
|
|
|
|
Carrying amounts |
|
|
|
At January 1, 2005 |
| 362 |
|
At December 31, 2005 |
| 230 |
|
|
|
|
|
At January 1, 2006 |
| 230 |
|
At December 31, 2006 |
| 750 |
|
24_ Investments in subsidiaries
|
| 2006 |
| 2005 |
|
Balance at January 1 |
| 136,887 |
| 89,625 |
|
Changes as a result of |
|
|
|
|
|
Share in income |
| 50,881 |
| 43,135 |
|
Deconsolidations |
| — |
| (309 | ) |
Investments |
| — |
| 47,363 |
|
Goodwill |
| — |
| (18,789 | ) |
Changes to consolidated companies |
| (28,955 | ) | — |
|
Exchange rate differences |
| (13,941 | ) | 9,795 |
|
Dividends received |
| (22,757 | ) | (40,656 | ) |
Other changes |
| 11,446 |
| 6,723 |
|
|
| (3,326 | ) | 47,262 |
|
Balance at December 31 |
| 133,561 |
| 136,887 |
|
Amounts in thousands of euros unless otherwise stated
125
25_Other investments
|
| 2006 |
| 2005 |
|
Balance at January 1 |
| 9,130 |
| 8,001 |
|
Changes as a result of |
|
|
|
|
|
Loans issued |
| 9,372 |
| 1,129 |
|
|
| 9,372 |
| 1,129 |
|
Balance at December 31 |
| 18,502 |
| 9,130 |
|
26_Receivables
|
| 2006 |
| 2005 |
|
Receivables from subsidiaries |
| 79,880 |
| 51,191 |
|
Taxes and social security contributions |
| — |
| 1,302 |
|
Other receivables |
| 423 |
| 7,392 |
|
|
| 80,303 |
| 59,885 |
|
27_Shareholders’ Equity
|
|
|
|
|
| Reserve |
|
|
|
|
|
|
|
|
|
|
| Additional |
| exchange |
|
|
|
|
|
|
|
|
| Share |
| paid-in |
| rate |
| Retained |
| Undistributed |
|
|
|
|
| capital |
| capital |
| differences |
| earnings |
| profits |
| Total |
|
Balance at January 1, 2005 |
| 1,030 |
| 37,644 |
| (3,633 | ) | 79,154 |
| 22,176 |
| 136,371 |
|
Exchange rate differences |
|
|
|
|
| 10,036 |
|
|
|
|
| 10,036 |
|
Share-based compensation and related taxes |
|
|
|
|
|
|
| 3,487 |
|
|
| 3,487 |
|
Income directly recognized in equity |
|
|
|
|
| 10,036 |
| 3,487 |
|
|
| 13,523 |
|
Net income |
|
|
|
|
|
|
|
|
| 33,414 |
| 33,414 |
|
Comprehensive income net of tax |
|
|
|
|
| 10,036 |
| 3,487 |
| 33,414 |
| 46,937 |
|
Dividends to shareholders |
|
|
|
|
|
|
|
|
| (9,745 | ) | (9,745 | ) |
Addition to other reserves |
|
|
|
|
|
|
| 12,431 |
| (12,431 | ) | — |
|
Own share purchase for granted options |
|
|
|
|
|
|
| (6,562 | ) |
|
| (6,562 | ) |
Options exercised |
|
|
|
|
|
|
| 2,624 |
|
|
| 2,624 |
|
Additional paid-in capital |
|
|
| 6,509 |
|
|
|
|
|
|
| 6,509 |
|
Other changes |
|
|
|
|
|
|
| 69 |
|
|
| 69 |
|
Balance at December 31, 2005 |
| 1,030 |
| 44,153 |
| 6,403 |
| 91,203 |
| 33,414 |
| 176,203 |
|
Balance at January 1, 2006 |
| 1,030 |
| 44,153 |
| 6,403 |
| 91,203 |
| 33,414 |
| 176,203 |
|
Exchange rate differences |
|
|
|
|
| (14,062 | ) |
|
|
|
| (14,062 | ) |
Tax related to share-based compensation |
|
|
|
|
|
|
| 6,416 |
|
|
| 6,416 |
|
Income directly recognized in equity |
|
|
|
|
| (14,062 | ) | 6,416 |
|
|
| (7,646 | ) |
Net income |
|
|
|
|
|
|
|
|
| 44,936 |
| 44,936 |
|
Comprehensive income net of tax |
|
|
|
|
| (14,062 | ) | 6,416 |
| 44,936 |
| 37,290 |
|
Share-based compensation |
|
|
|
|
|
|
| 1,751 |
|
|
| 1,751 |
|
Dividends to shareholders |
|
|
|
|
|
|
|
|
| (13,378 | ) | (13,378 | ) |
Addition to other reserves |
|
|
|
|
|
|
| 20,036 |
| (20,036 | ) | — |
|
Own share purchase for granted options |
|
|
|
|
|
|
| (17,596 | ) |
|
| (17,596 | ) |
Options exercised |
|
|
|
|
|
|
| 4,611 |
|
|
| 4,611 |
|
Balance at December 31, 2006 |
| 1,030 |
| 44,153 |
| (7,659 | ) | 106,421 |
| 44,936 |
| 188,881 |
|
Amounts in thousands of euros unless otherwise stated
126
28_Provisions
|
| Deferred compensation |
| Litigation |
| Total |
|
Balance at January 1, 2005 |
| 1,000 |
| — |
| 1,000 |
|
Balance at December 31, 2005 |
| 1,000 |
| — |
| 1,000 |
|
|
|
|
|
|
|
|
|
Balance at January 1, 2006 |
| 1,000 |
| — |
| 1,000 |
|
Change as a result of |
|
|
|
|
|
|
|
Other changes |
| — |
| 6,363 |
| 6,363 |
|
Balance at December 31, 2006 |
| 1,000 |
| 6,363 |
| 7,363 |
|
The provision is for a relatively small number of staff who are eligible for jubilee payments and a provision for litigation which is recorded at a consolidated level. The significant increase is a movement from project-related loss provision recorded under (un)billed receivables to a litigation provision.
29_Deferred tax assets and liabilities
|
| Deferred |
| Deferred |
|
|
|
|
| tax assets |
| tax liabilities |
| Total |
|
Balance at January 1, 2006 |
| (2,275 | ) | 1,262 |
| (1,013 | ) |
Change as a result of |
|
|
|
|
|
|
|
Additions |
| (1,137 | ) | 151 |
| (986 | ) |
Change in corporate tax percentage Netherlands |
| 41 |
| (91 | ) | (50 | ) |
Changes to consolidated companies |
| — |
| (752 | ) | (752 | ) |
Balance at December 31, 2006 |
| (3,371 | ) | 570 |
| (2,801 | ) |
30_Trade and other liabilities
|
| 2006 |
| 2005 |
|
Bank overdrafts |
| 17,546 |
| 17,432 |
|
Suppliers |
| 1,169 |
| 1,097 |
|
Payable to group companies |
| 13,904 |
| 897 |
|
Additional pension premium |
| — |
| 9,510 |
|
Other liabilities |
| 14,741 |
| 6,344 |
|
|
| 47,360 |
| 35,280 |
|
Amounts in thousands of euros unless otherwise stated
The short-term credit facilities total € 162 million. No current receivables or other assets have been pledged.
Commitments and contingent liabilities
The Company is for income tax purposes the parent of the fiscal unit ARCADIS NV and is therefore liable for the liabilities of the fiscal unit as a whole.
Warranties
ARCADIS NV has pledged warranties for the short-term credit facilities that are available for use to its operating companies. The total amount available under these facilities is € 65 million of which € 25.5 million was used at the balance sheet date.
127
Notes to the Company statement of income
Notes to the Company statement of income
Net income subsidiaries
Net income of subsidiaries is the share of ARCADIS NV in the results of its subsidiaries.
Remuneration of Executive Board and Supervisory Board
During the General Meeting of Shareholders in May 2006, two new members of the Executive Board were appointed.
In 2006, an amount of € 1,442,000 (2005: € 1,167,000) was charged to the Company for remuneration of Executive Board members including pension charges. As flexible remuneration, 27,000 performance shares and 65,000 performance options were granted. In the schedule below, the different components of the remuneration for each Executive Board member are provided. For an explanation of the remuneration policy, please refer to the remuneration report included in this report.
|
|
|
|
|
|
|
|
|
| Performance |
| Performance |
| ||||
|
| Year |
| Salary(1) |
| Bonus(2) |
| Pension |
| Number |
| Amount(3) |
| Number |
| Amount(3) |
|
Harrie Noy |
| 2006 |
| 356 |
| 219 |
| 76 |
| 10,000 |
| 233 |
| 25,000 |
| 216 |
|
|
| 2005 |
| 339 |
| 209 |
| 79 |
| 10,000 |
| 113 |
| 25,000 |
| 93 |
|
Michiel Jaski |
| 2006 |
| 266 |
| 159 |
| 42 |
| 7,000 |
| 163 |
| 15,000 |
| 129 |
|
|
| 2005 |
| 254 |
| 148 |
| 30 |
| 7,000 |
| 79 |
| 15,000 |
| 56 |
|
Ben van der Klift(4) |
| 2006 |
| 168 |
| 153 |
| 17 |
| 5,000 |
| 117 |
| 12,500 |
| 108 |
|
Friedrich Schneider(4) |
| 2006 |
| 137 |
| 145 |
| 22 |
| 5,000 |
| 117 |
| 12,500 |
| 108 |
|
(1) On July 1, 2006 the salaries of the members of the Executive Board were raised by 5% (2005: 5%).
(2) The bonus is based on the results achieved in 2006 respectively 2005. This bonus is paid in 2007 respectively 2006.
(3) This amount will be charged over a 3-year period to the Company’s profit and loss account.
(4) The salaries mentioned are the amounts as of the date of appointment as members of the Executive Board (May 17, 2006).
Amounts in thousands of euros unless otherwise stated
Interests held by members of the Executive Board
The interests held in the share capital of ARCADIS NV by those who in 2006 were a member of the Executive Board are noted in the table below:
|
| December 31, 2005 |
| December 31, 2006 |
|
Shares ARCADIS NV |
|
|
|
|
|
Harrie Noy |
| 34,122 |
| 37,305 |
|
Michiel Jaski |
| 1,719 |
| 1,870 |
|
Ben van der Klift* |
| — |
| 699 |
|
Friedrich Schneider* |
| — |
| — |
|
Conditional shares ARCADIS NV** |
|
|
|
|
|
Harrie Noy |
| 10,000 |
| 20,000 |
|
Michiel Jaski |
| 7,000 |
| 14,000 |
|
Ben van der Klift |
| — |
| 5,000 |
|
Friedrich Schneider |
| — |
| 5,000 |
|
* Ben A. van der Klift and Friedrich M.T. Schneider were appointed members of the Executive Board on May 17, 2006.
** Amounts based on granting of 100% of the reference numbers, with maximal extension to 150%. Please refer to Note 17.
For a description of the plan, please refer to the paragraph “long-term flexible remuneration” on page 72 of this annual report.
128
Overview of options outstanding to members of the Executive Board at December 31, 2006
| Option plan |
| Granted |
|
|
| Exercise |
| Exercised |
|
|
|
|
| ||
|
| from year |
| in |
| Granted |
| price |
| to date |
| Outstanding |
| Expiration |
| |
Harrie Noy |
| 2001 |
| 2001 |
| 30,000 |
| € | 9.20 |
| 30,000 |
| 0 |
| 05-22-2011 |
|
|
|
| 2002 |
| 15,000 |
| € | 10.79 |
| — |
| 15,000 |
| 05-15-2012 |
| |
|
|
| 2003 |
| 17,500 |
| € | 8.93 |
| — |
| 17,500 |
| 05-13-2013 |
| |
| 2005 |
| 2005 |
| 25,000 | * | € | 17.94 |
| — |
| 25,000 |
| 05-10-2015 |
| |
|
|
| 2006 |
| 25,000 | * | € | 37.13 |
| — |
| 25,000 |
| 05-18-2016 |
| |
Michiel Jaski |
| 2001 |
| 2002 |
| 10,000 |
| € | 10.79 |
| 10,000 |
| 0 |
| 05-15-2012 |
|
|
|
|
| 2003 |
| 14,000 |
| € | 8.93 |
| — |
| 14,000 |
| 05-13-2013 |
|
|
| 2005 |
| 2005 |
| 15,000 | * | € | 17.94 |
| — |
| 15,000 |
| 05-10-2015 |
|
|
|
|
| 2006 |
| 15,000 | * | € | 37.13 |
| — |
| 15,000 |
| 05-18-2016 |
|
Ben van der Klift |
| 2001 |
| 2003 |
| 12,285 |
| € | 8.50 |
| 4,000 |
| 8,285 |
| 10-16-2013 |
|
|
|
| 2005 |
| 9,000 |
| € | 17.94 |
| — |
| 9,000 |
| 05-10-2015 |
| |
| 2005 |
| 2006 |
| 12,500 | * | € | 37.13 |
| — |
| 12,500 |
| 05-18-2016 |
| |
Friedrich Schneider |
| 2005 |
| 2006 |
| 12,500 | * | € | 37.13 |
| — |
| 12,500 |
| 05-18-2016 |
|
* Amounts based on granting of 100% of the referenced numbers, with maximal extension to 150%. Please refer to Note 17.
Currently, the Supervisory Board consists of six members. The joint fixed remuneration for 2006 totaled € 213,000 (2005: € 216,000), specified as follows.
Remuneration |
| 2006 |
| 2005 |
|
Rijnhard van Tets |
| 49 |
| 50 |
|
Thomas Cohn |
| 30 |
| 30 |
|
Carlos Espinosa de los Monteros |
| 30 |
| 30 |
|
George Nethercutt (as of May 11, 2005) |
| 28 |
| 13 |
|
Jan Peelen |
| 30 |
| 30 |
|
Ross Webber (until May 17, 2006) |
| 15 |
| 30 |
|
Gerrit Ybema |
| 31 |
| 33 |
|
Amounts in thousands of euros unless otherwise stated
129
Shares and options held by members of the Supervisory Board The interests held in the share capital of ARCADIS NV by those who during 2006 were members of the Supervisory Board are noted in the table below:
Shares ARCADIS NV |
| December 31, 2005 |
| December 31, 2006 |
|
R.A. Webber* |
| 1,130 |
| 130 |
|
* Mr. Webber resigned his position on the Supervisory Board on May 17, 2006 due to the completion of his third term as a board member.
Members of the Supervisory Board hold no ARCADIS options or shares.
Arnhem, the Netherlands, March 2, 2007
Executive Board
Harrie L.J. Noy
C. Michiel Jaski
Ben A. van der Klift
Friedrich M.T. Schneider
Supervisory Board
Rijnhard W.F. van Tets
Thomas M. Cohn
Carlos Espinosa de los Monteros
George R. Nethercutt
Jan Peelen
Gerrit Ybema
130
Other information
Other information
Profit allocation
Article 27 of the Articles of Association stipulates, among other things, that the Executive Board with the approval of the Supervisory Board shall annually propose which part of the profit shall be allocated to the reserves. The remaining part of the profit shall be at the disposal of the Annual General Meeting of Shareholders.
The Executive Board with the approval of the Supervisory Board proposes to present for acceptance to the Annual General Meeting of Shareholders to reserve an amount of € 24.6 million and distribute a dividend amount of € 20.3 million from the profits of the fiscal year 2006, amounting to € 44.9 million, which represents a dividend of € 1.00 per share.
Principal accountant fees and services
Fees and services The following table details the aggregate fees billed by our principal accountant, KPMG Accountants N.V., for the last two fiscal years for various services (in millions of €):
Type of services provided |
| 2006 |
| 2005 |
|
Audit fees |
| 2.4 |
| 1.3 |
|
Audit-related fees (1) |
| 0.8 |
| 0.7 |
|
Tax fees (2) |
| 0.3 |
| 0.4 |
|
(1) Audit-related fees for the years ended December 31, 2006 and 2005 consist of fees for services that are traditionally performed by the independent accountants. These services include accounting consultations, internal control reviews on implementation of information systems, services related to the implementation of § 404 of the Sarbanes-Oxley Act of 2002 regarding management’s report over internal control over financial reporting, and other similar services, consultations concerning financial accounting and reporting standard (especially related to the transition to International Financial Reporting Standards), due diligence and audits in connection with acquisitions or divestments.
(2) Tax fees as of the years ended December 31, 2006 and 2005 consist of fees expensed for tax planning services and tax.
Audit Committee pre-approval policies and procedures The Audit Committee of our Supervisory Board has adopted a charter which details the duties and responsibilities of our Audit Committee. These duties and responsibilities include, among other things, reviewing and monitoring our financial statements and internal accounting procedures, approving the scope and terms of audit services to be provided by our independent auditor and monitoring the services provided by our independent auditor. All non-audit services provided by our independent auditor must be pre-approved by our Audit Committee. The Audit Committee will consider whether the provision of such services by our auditor is compatible with our auditor’s independence.
131
Auditor’s report
Report of the independent auditor to the shareholders of ARCADIS NV
Auditor’s report
Report on the financial statements
We have audited the accompanying financial statements 2006 of ARCADIS NV, Arnhem on page 86 to 131. The financial statements consist of the consolidated financial statements and the company financial statements. The consolidated financial statements comprise the consolidated balance sheet at December 31, 2006, consolidated profit and loss account, consolidated statement of changes in equity and consolidated cash flow statement for the year then ended, and a summary of significant accounting policies and other explanatory Notes. The company financial statements comprise the company balance sheet at December 31, 2006, the company profit and loss account for the year then ended and the Notes.
Management’s responsibility Management is responsible for the preparation and fair presentation of the financial statements in accordance with International Financial Reporting Standards as adopted by the European Union and with Part 9 of Book 2 of the Netherlands Civil Code, and for the preparation of the management board report in accordance with Part 9 of Book 2 of the Netherlands Civil Code. This responsibility includes: designing, implementing and maintaining internal control relevant to the preparation and fair presentation of the financial statements that are free from material misstatement, whether due to fraud or error; selecting and applying appropriate accounting policies; and making accounting estimates that are reasonable in the circumstances.
Auditor’s responsibility Our responsibility is to express an opinion on the financial statements based on our audit. We conducted our audit in accordance with Dutch law. This law requires that we comply with ethical requirements and plan and perform the audit to obtain reasonable assurance whether the financial statements are free from material misstatement.
An audit involves performing procedures to obtain audit evidence about the amounts and disclosures in the financial statements. The procedures selected depend on the auditor’s judgment, including the assessment of the risks of material misstatement of the financial statements, whether due to fraud or error. In making those risk assessments, the auditor considers internal control relevant to the entity’s preparation and fair presentation of the financial statements in order to design audit procedures that are appropriate in the circumstances, but not for the purpose of expressing an opinion on the effectiveness of the entity’s internal control. An audit also includes evaluating the appropriateness of accounting policies used and the reasonableness of accounting estimates made by management, as well as evaluating the overall presentation of the financial statements.
We believe that the audit evidence we have obtained is sufficient and appropriate to provide a basis for our audit opinion.
Opinion with respect to the consolidated financial statements In our opinion, the consolidated financial statements give a true and fair view of the financial position of ARCADIS NV at December 31, 2006, and of its result and its cash flow for the year then ended in accordance with International Financial Reporting Standards as adopted by the European Union and with Part 9 of Book 2 of the Netherlands Civil Code.
Opinion with respect to the company financial statements In our opinion, the company financial statements give a true and fair view of the financial position of ARCADIS NV at December 31, 2006, and of its result for the year then ended in accordance with Part 9 of Book 2 of the Netherlands Civil Code.
Report on other legal and regulatory requirements
Pursuant to the legal requirement under 2:393 sub 5 part e of the Netherlands Civil Code, we report, to the extent of our competence, that the management board report is consistent with the financial statements as required by 2:391 sub 4 of the Netherlands Civil Code.
Amstelveen, the Netherlands, March 2, 2007
KPMG ACCOUNTANTS N.V.
F.A.C.M. van Kasteren RA
132
Other financial data
Other financial data
Consolidated statement of income in percentages |
| 2006 |
| 2005 |
|
Gross revenue |
| 147.2 | % | 142.4 | % |
Materials, services of third parties and subcontractors |
| (47.2 | )% | (42.4 | )% |
Net revenue |
| 100.0 | % | 100.0 | % |
Operational cost |
| (88.5 | )% | (89.3 | )% |
Depreciation |
| (2.1 | )% | (2.2 | )% |
Amortization identifiable intangible assets |
| (1.0 | )% | (0.8 | )% |
|
|
|
|
|
|
Operating income |
| 8.4 | % | 7.7 | % |
Financial items |
| (0.4 | )% | (0.3 | )% |
|
|
|
|
|
|
Income before taxes |
| 8.0 | % | 7.5 | % |
Taxes |
| (2.4 | )% | (2.5 | )% |
|
|
|
|
|
|
Income of consolidated companies after taxes |
| 5.6 | % | 5.0 | % |
Income of equity accounted associates and cost accounted associates |
| (0.1 | )% | 0.2 | % |
|
|
|
|
|
|
Group income after taxes |
| 5.5 | % | 5.2 | % |
|
|
|
|
|
|
Attributable to: |
|
|
|
|
|
Income for the period (Equity holders of the parent) |
| 5.3 | % | 4.7 | % |
Minority interest |
| 0.2 | % | 0.5 | % |
|
|
|
|
|
|
Net income from operations |
| 6.0 | % | 4.7 | % |
EBITA margin recurring |
| 9.4 | % | 8.2 | % |
net revenue = 100%
|
| 2006 |
| 2005 |
| ||||||||||||
Quarterly financial data |
| 1 |
| 2 |
| 3 |
| 4 |
| 1 |
| 2 |
| 3 |
| 4 |
|
Gross Revenue |
|
|
|
|
|
|
|
|
|
|
|
|
|
|
|
|
|
Quarterly |
| 287,273 |
| 293,316 |
| 310,912 |
| 341,542 |
| 223,109 |
| 233,376 |
| 235,764 |
| 308,850 |
|
Cumulative |
| 287,273 |
| 580,589 |
| 891,501 |
| 1,233,043 |
| 223,109 |
| 456,485 |
| 692,249 |
| 1,001,099 |
|
In percent per quarter |
| 23.3 | % | 23.8 | % | 25.2 | % | 27.7 | % | 22.3 | % | 23.3 | % | 23.6 | % | 30.9 | % |
In percent cumulative |
| 23.3 | % | 47.1 | % | 72.3 | % | 100.0 | % | 22.3 | % | 45.6 | % | 69.1 | % | 100.0 | % |
|
|
|
|
|
|
|
|
|
|
|
|
|
|
|
|
|
|
Net income from operations |
|
|
|
|
|
|
|
|
|
|
|
|
|
|
|
|
|
Quarterly |
| 9,421 |
| 11,826 |
| 12,253 |
| 16,535 |
| 5,876 |
| 7,373 |
| 7,501 |
| 12,616 |
|
Cumulative |
| 9,421 |
| 21,247 |
| 33,500 |
| 50,035 |
| 5,876 |
| 13,249 |
| 20,750 |
| 33,366 |
|
In percent per quarter |
| 18.8 | % | 23.6 | % | 24.5 | % | 33.0 | % | 17.6 | % | 22.1 | % | 22.5 | % | 37.8 | % |
In percent cumulative |
| 18.8 | % | 42.5 | % | 67.0 | % | 100.0 | % | 17.6 | % | 39.7 | % | 62.2 | % | 100.0 | % |
|
|
|
|
|
|
|
|
|
|
|
|
|
|
|
|
|
|
Net income from operations per share (in euros) |
|
|
|
|
|
|
|
|
|
|
|
|
|
|
|
|
|
Quarterly |
| 0.47 |
| 0.58 |
| 0.61 |
| 0.81 |
| 0.29 |
| 0.36 |
| 0.37 |
| 0.63 |
|
Cumulative |
| 0.47 |
| 1.05 |
| 1.66 |
| 2.47 |
| 0.29 |
| 0.65 |
| 1.02 |
| 1.65 |
|
Amounts in thousands of euros unless otherwise stated
133
Ten-year summary
Ten-year summary
Consolidaded balance sheet |
| 2006 |
| 2005 |
| 2004 |
| 2003 |
| 2002 |
| 2001 |
| 2000 |
| 1999 |
| 1998 |
| 1997 |
|
Intangible assets |
| 154.2 |
| 127.9 |
| 55.4 |
| 41.4 |
| 12.7 |
| 7.6 |
| 7.1 |
| 6.4 |
| 4.9 |
| 1.1 |
|
Tangible assets |
| 55.0 |
| 56.0 |
| 43.6 |
| 44.9 |
| 41.2 |
| 37.8 |
| 40.6 |
| 46.3 |
| 44.5 |
| 49.1 |
|
Investments in non-consolidated companies |
| 5.2 |
| 7.5 |
| 5.6 |
| — |
| — |
| — |
| — |
| — |
| — |
| — |
|
Other non-current assets |
| 12.0 |
| 12.6 |
| 8.1 |
| 12.4 |
| 9.6 |
| 6.4 |
| 10.5 |
| 10.4 |
| 7.7 |
| 7.9 |
|
Deferred tax assets |
| 8.3 |
| 13.2 |
| 9.7 |
| — |
| — |
| — |
| — |
| — |
| — |
| — |
|
Total non-current assets |
| 234.7 |
| 217.1 |
| 122.4 |
| 98.7 |
| 63.4 |
| 51.8 |
| 58.2 |
| 63.1 |
| 57.1 |
| 58.1 |
|
Inventories |
| 0.5 |
| 0.4 |
| 0.5 |
| 15.2 |
| 21.5 |
| 27.5 |
| 30.2 |
| 44.6 |
| 33.2 |
| 24.9 |
|
Derivatives |
| — |
| 1.7 |
| — |
| — |
| — |
| — |
| — |
| — |
| — |
| — |
|
(Un)billed receivables |
| 397.3 |
| 353.0 |
| 271.3 |
| 202.1 |
| 205.7 |
| 187.0 |
| 192.1 |
| 176.6 |
| 152.8 |
| 149.0 |
|
Corporate tax receivable |
| 2.6 |
| 4.0 |
| — |
| — |
| — |
| — |
| — |
| — |
| — |
| — |
|
Cash and cash equivalents |
| 101.5 |
| 73.9 |
| 48.2 |
| 31.3 |
| 53.2 |
| 43.7 |
| 18.3 |
| 12.0 |
| 10.0 |
| 13.4 |
|
Total current assets |
| 501.8 |
| 433.0 |
| 320.0 |
| 248.6 |
| 280.4 |
| 258.2 |
| 240.6 |
| 233.2 |
| 196.0 |
| 187.3 |
|
Total assets |
| 736.5 |
| 650.1 |
| 442.3 |
| 347.3 |
| 343.8 |
| 310.0 |
| 298.8 |
| 296.3 |
| 253.1 |
| 245.4 |
|
Share capital |
| 1.0 |
| 1.0 |
| 1.0 |
| 1.0 |
| 1.0 |
| 1.0 |
| 1.0 |
| 1.0 |
| 0.4 |
| 0.4 |
|
Additional paid-in capital |
| 44.2 |
| 44.2 |
| 37.6 |
| 36.0 |
| 35.1 |
| 34.9 |
| 34.9 |
| 27.4 |
| 27.8 |
| 27.4 |
|
Revaluation reserve real estate |
| — |
| — |
| — |
| — |
| — |
| — |
| 0.1 |
| 0.1 |
| 0.4 |
| 1.3 |
|
Statutory reserves |
| — |
| — |
| — |
| — |
| — |
| — |
| — |
| — |
| — |
| — |
|
Reserve exchange rate differences |
| (7.7 | ) | 6.4 |
| (3.6 | ) | — |
| — |
| — |
| — |
| — |
| — |
| — |
|
Retained earnings |
| 106.4 |
| 91.2 |
| 79.2 |
| 99.5 |
| 98.6 |
| 97.8 |
| 79.2 |
| 71.9 |
| 58.7 |
| 52.1 |
|
Net income |
| 44.9 |
| 33.4 |
| 22.2 |
| — |
| — |
| — |
| — |
| — |
| — |
| — |
|
Total shareholders’ equity |
| 188.9 |
| 176.2 |
| 136.4 |
| 136.5 |
| 134.7 |
| 133.7 |
| 115.2 |
| 100.4 |
| 87.3 |
| 81.2 |
|
Minority interest |
| 11.8 |
| 11.9 |
| 9.0 |
| 7.6 |
| 7.1 |
| 6.1 |
| 4.4 |
| 3.3 |
| 5.6 |
| 6.0 |
|
Total group equity |
| 200.7 |
| 188.1 |
| 145.4 |
| 144.1 |
| 141.8 |
| 139.8 |
| 119.6 |
| 103.7 |
| 92.9 |
| 87.2 |
|
Provisions |
| 19.9 |
| 15.8 |
| 27.4 |
| 20.0 |
| 13.5 |
| 13.1 |
| 14.4 |
| 16.4 |
| 16.9 |
| 15.7 |
|
Deferred tax liabilites |
| 20.4 |
| 26.3 |
| 12.1 |
| — |
| — |
| — |
| — |
| — |
| — |
| — |
|
Long-term debts |
| 119.3 |
| 116.1 |
| 13.0 |
| 29.7 |
| 27.6 |
| 22.0 |
| 23.1 |
| 5.7 |
| 6.4 |
| 6.4 |
|
Derivatives |
| 5.8 |
| — |
| — |
| — |
| — |
| — |
| — |
| — |
| — |
| — |
|
Total non-current liabilities |
| 165.5 |
| 158.2 |
| 52.5 |
| 49.7 |
| 41.1 |
| 35.1 |
| 37.5 |
| 22.1 |
| 23.3 |
| 22.1 |
|
Billing in excess of cost |
| 111.9 |
| 89.3 |
| 40.3 |
| — |
| — |
| — |
| — |
| — |
| — |
| — |
|
Corporate tax payable |
| 1.9 |
| 8.2 |
| 9.9 |
| — |
| — |
| — |
| — |
| — |
| — |
| — |
|
Trade and other liabilities |
| 256.5 |
| 206.4 |
| 194.3 |
| 153.5 |
| 160.9 |
| 135.1 |
| 141.7 |
| 170.5 |
| 136.9 |
| 136.1 |
|
Total current liabilities |
| 370.3 |
| 303.8 |
| 244.5 |
| 153.5 |
| 160.9 |
| 135.1 |
| 141.7 |
| 170.5 |
| 136.9 |
| 136.1 |
|
Total equity and liabilities |
| 736.5 |
| 650.1 |
| 442.3 |
| 347.3 |
| 343.8 |
| 310.0 |
| 298.8 |
| 296.3 |
| 253.1 |
| 245.4 |
|
Total equity as % of balance sheet total |
| 27 | % | 29 | % | 33 | % | 41 | % | 41 | % | 45 | % | 40 | % | 35 | % | 37 | % | 36 | % |
Interest coverage ratio |
| 17 |
| 17 |
| 10 |
| 13 |
| 19 |
| 15 |
| 11 |
| 12 |
| 9 |
| 15 |
|
|
|
|
|
|
|
|
|
|
|
|
|
|
|
|
|
|
|
|
|
|
|
Net Debt/EBITDA ratio |
| 0.4 |
| 0.6 |
| (0.1 | ) | 0.7 |
| 0.7 |
| 0.6 |
| 0.7 |
| 1.3 |
| 1.2 |
| 1.1 |
|
|
|
|
|
|
|
|
|
|
|
|
|
|
|
|
|
|
|
|
|
|
|
Acquisitions |
| 53.8 |
| 80.9 |
| 17.3 |
| 46.1 |
| 16.2 |
| 5.6 |
| 7.3 |
| 13.3 |
| 6.5 |
| 14.6 |
|
Investments |
| 19.3 |
| 17.7 |
| 12.5 |
| 18.2 |
| 14.2 |
| 15.3 |
| 17.2 |
| 18.2 |
| 20.3 |
| 16.4 |
|
Depreciation |
| 17.7 |
| 15.2 |
| 15.7 |
| 16.1 |
| 15.9 |
| 15.4 |
| 17.9 |
| 16.2 |
| 13.8 |
| 13.5 |
|
Cash flow (net income + amortization and depreciation) |
| 70.9 |
| 54.6 |
| 38.3 |
| 38.6 |
| 40.8 |
| 40.6 |
| 38.7 |
| 33.7 |
| 27.5 |
| 33.1 |
|
Net cash provided by operating activities |
| 86.4 |
| 66.8 |
| 44.8 |
| 59.1 |
| 45.8 |
| 49.7 |
| 49.7 |
| 23.9 |
| 24.6 |
| 21.3 |
|
|
|
|
|
|
|
|
|
|
|
|
|
|
|
|
|
|
|
|
|
|
|
Average number of employees (in thousands) |
| 9,685 |
| 9,208 |
| 9,419 |
| 8,827 |
| 8,020 |
| 7,619 |
| 7,657 |
| 7,217 |
| 6,635 |
| 6,471 |
|
Total shares issued (x 1,000) |
| 20,234 |
| 20,646 |
| 20,646 |
| 20,431 |
| 20,297 |
| 20,285 |
| 20,275 |
| 19,769 |
| 19,256 |
| 18,904 |
|
Maximum increase from exercising options |
| 1,270 |
| 1,437 |
| 1,267 |
| 1,561 |
| 1,134 |
| 692 |
| 719 |
| 718 |
| 853 |
| 908 |
|
Amounts in millions of euros unless otherwise stated
The 2003 and prior financial data are not adjusted to comply with the International Financial Reporting Standards (IFRS).
134
Consolidated statement of income |
| 2006 |
| 2005 |
| 2004 |
| 2003 |
| 2002 |
| 2001 |
| 2000 |
| 1999 |
| 1998 |
| 1997 |
| ||||||||||
Net sales |
| 1,235.5 |
| 999.7 |
| 894.4 |
| 848.5 |
| 817.1 |
| 806.2 |
| 798.2 |
| 656.4 |
| 571.1 |
| 567.4 |
| ||||||||||
Gain on sale of investments |
| — |
| 2.9 |
| 6.5 |
| — |
| — |
| — |
| — |
| — |
| — |
| — |
| ||||||||||
Change in work in progress |
| (2.4 | ) | (1.5 | ) | (0.1 | ) | (7.8 | ) | 2.0 |
| (8.8 | ) | (22.0 | ) | (0.9 | ) | 7.5 |
| 7.9 |
| ||||||||||
Gross revenue |
| 1,233.0 |
| 1,001.1 |
| 900.8 |
| 840.6 |
| 819.1 |
| 797.4 |
| 776.2 |
| 655.5 |
| 578.6 |
| 575.3 |
| ||||||||||
Materials, services of third parties and subcontractors |
| (395.6 | ) | (297.8 | ) | (268.2 | ) | (245.2 | ) | (241.4 | ) | (233.9 | ) | (225.3 | ) | (195.7 | ) | (167.8 | ) | (192.7 | ) | ||||||||||
Net revenue |
| 837.5 |
| 703.3 |
| 632.5 |
| 595.4 |
| 577.8 |
| 563.5 |
| 550.9 |
| 459.8 |
| 410.8 |
| 382.6 |
| ||||||||||
Personnel costs |
| (581.3 | ) | (484.5 | ) | (448.7 | ) | (428.8 | ) | (413.4 | ) | (404.4 | ) | (397.4 | ) | (329.1 | ) | (288.0 | ) | (260.6 | ) | ||||||||||
Other business costs |
| (159.6 | ) | (143.2 | ) | (132.3 | ) | (114.5 | ) | (105.5 | ) | (104.8 | ) | (100.4 | ) | (86.7 | ) | (81.8 | ) | (82.2 | ) | ||||||||||
Depreciation |
| (17.7 | ) | (15.2 | ) | (15.7 | ) | (16.1 | ) | (15.9 | ) | (15.4 | ) | (17.9 | ) | (16.2 | ) | (13.8 | ) | (13.5 | ) | ||||||||||
EBITA |
| 78.8 |
| 60.4 |
| 35.9 |
| 36.0 |
| 42.9 |
| 38.9 |
| 35.2 |
| 27.8 |
| 27.2 |
| 26.2 |
| ||||||||||
Amortization goodwill and identifiable intangible assets |
| (8.3 | ) | (6.0 | ) | (0.4 | ) | (1.2 | ) | (0.2 | ) | (0.1 | ) | — |
| — |
| — |
| — |
| ||||||||||
Operating income |
| 70.5 |
| 54.4 |
| 35.5 |
| 34.9 |
| 42.7 |
| 38.8 |
| 35.2 |
| 27.8 |
| 27.2 |
| 26.2 |
| ||||||||||
Operational margin |
| 8.4 | % | 7.7 | % | 5.6 | % | 5.9 | % | 7.4 | % | 6.9 | % | 6.4 | % | 6.1 | % | 6.6 | % | 6.8 | % | ||||||||||
Financial items |
| (3.5 | ) | (1.8 | ) | (3.5 | ) | (2.8 | ) | (2.2 | ) | (2.7 | ) | (3.3 | ) | (2.3 | ) | (2.9 | ) | (1.7 | ) | ||||||||||
Income from associates |
| (0.5 | ) | 1.4 |
| 2.4 |
| 2.6 |
| 0.7 |
| 0.5 |
| 0.8 |
| 1.4 |
| 0.2 |
| (0.8 | ) | ||||||||||
Income before taxes |
| 66.5 |
| 53.9 |
| 34.5 |
| 34.6 |
| 41.2 |
| 36.6 |
| 32.7 |
| 26.9 |
| 24.5 |
| 23.7 |
| ||||||||||
|
|
|
|
|
|
|
|
|
|
|
|
|
|
|
|
|
|
|
|
|
| ||||||||||
Taxes |
| (20.1 | ) | (17.3 | ) | (10.4 | ) | (11.7 | ) | (14.4 | ) | (12.5 | ) | (11.2 | ) | (8.5 | ) | (7.8 | ) | (7.9 | ) | ||||||||||
Income after taxes |
| 46.4 |
| 36.6 |
| 24.1 |
| 22.9 |
| 26.7 |
| 24.1 |
| 21.5 |
| 18.4 |
| 16.7 |
| 15.8 |
| ||||||||||
Extraordinary items after taxes |
| — |
| — |
| — |
| — |
| — |
| 2.0 |
| — |
| — |
| (1.8 | ) | 5.0 |
| ||||||||||
Income after taxes |
| 46.4 |
| 36.6 |
| 24.1 |
| 22.9 |
| 26.7 |
| 26.1 |
| 21.5 |
| 18.4 |
| 14.9 |
| 20.8 |
| ||||||||||
Attributable to: |
|
|
|
|
|
|
|
|
|
|
|
|
|
|
|
|
|
|
|
|
| ||||||||||
Net income (Equity holders of the parent) |
| 44.9 |
| 33.4 |
| 22.2 |
| 21.4 |
| 24.7 |
| 25.1 |
| 20.7 |
| 17.6 |
| 13.7 |
| 19.6 |
| ||||||||||
Minority interest |
| 1.5 |
| 3.2 |
| 1.9 |
| 1.5 |
| 2.1 |
| 1.0 |
| 0.8 |
| 0.8 |
| 1.2 |
| 1.2 |
| ||||||||||
Net income from operations |
| 50.0 |
| 33.4 |
| 23.8 |
| 22.5 |
| 24.9 |
| 23.2 |
| 20.7 |
| 17.6 |
| 15.5 |
| 14.6 |
| ||||||||||
|
|
|
|
|
|
|
|
|
|
|
|
|
|
|
|
|
|
|
|
|
| ||||||||||
EBITA as % of net sales |
| 9.4 | % | 8.6 | % | 5.7 | % | 6.0 | % | 7.4 | % | 6.9 | % | 6.4 | % | 6.0 | % | 6.6 | % | 6.8 | % | ||||||||||
Return on equity |
| 24.6 | % | 21.4 | % | 16.3 | % | 15.8 | % | 18.4 | % | 20.2 | % | 19.2 | % | 18.8 | % | 16.3 | % | 25.5 | % | ||||||||||
Return on assets |
| 9.6 | % | 9.9 | % | 8.7 | % | 10.0 | % | 12.6 | % | 12.0 | % | 11.0 | % | 9.8 | % | 9.8 | % | 10.2 | % | ||||||||||
Dividend proposal |
| 20.3 |
| 13.4 |
| 9.9 |
| 9.8 |
| 9.7 |
| 8.9 |
| 7.9 |
| 6.5 |
| 5.8 |
| 5.3 |
| ||||||||||
|
|
|
|
|
|
|
|
|
|
|
|
|
|
|
|
|
|
|
|
|
| ||||||||||
Data per share (in euros. unless otherwise stated) |
|
|
|
|
|
|
|
|
|
|
|
|
|
|
|
|
|
|
|
|
| ||||||||||
Earnings per share from operations |
| 2.47 |
| 1.65 |
| 1.18 |
| 1.13 |
| 1.23 |
| 1.14 |
| 1.04 |
| 0.90 |
| 0.81 |
| 0.77 |
| ||||||||||
Net earnings per share |
| 2.22 |
| 1.65 |
| 1.10 |
| 1.07 |
| 1.23 |
| 1.24 |
| 1.04 |
| 0.90 |
| 0.72 |
| 1.04 |
| ||||||||||
Dividend proposal |
| 1.00 |
| 0.66 |
| 0.48 |
| 0.48 |
| 0.48 |
| 0.44 |
| 0.39 |
| 0.33 |
| 0.30 |
| 0.28 |
| ||||||||||
Shareholders’ equity |
| 9.34 |
| 8.53 |
| 6.61 |
| 6.68 |
| 6.64 |
| 6.59 |
| 5.68 |
| 5.08 |
| 4.53 |
| 4.29 |
| ||||||||||
Closing price Amsterdam Euronext |
| 46.70 |
| 26.80 |
| 13.70 |
| 9.34 |
| 7.94 |
| 9.35 |
| 8.55 |
| 7.85 |
| 6.67 |
| 10.16 |
| ||||||||||
Closing price NASDAQ |
| $ | 61.160 |
| $ | 31.600 |
| $ | 18.418 |
| $ | 11.800 |
| $ | 8.380 |
| $ | 8.390 |
| $ | 7.625 |
| $ | 6.825 |
| $ | 7.750 |
| $ | 10.688 |
|
Amounts in millions of euros unless otherwise stated
These figures are derived from the published financial statements of the years concerned.
135
Company addresses
Head office
ARCADIS NV
Nieuwe Stationsstraat 10
6811 KS Arnhem
P.O. Box 33
6800 LE Arnhem
The Netherlands
Phone +31 26 3778911
Fax +31 26 3515235
Principal offices
Belgium
ARCADIS Belgium
Clara Snellingsstraat 27
2100 Antwerpen
Belgium
Phone +32 3 3608300
Fax +32 3 3608301
CEO
Ludo Smans
Brazil
ARCADIS Logos Ltda.
Rua Líbero Badaró, 377 - 11 andar
CEP 01009-906, São Paulo
Brazil
Phone +55 11 3117 3161
Fax +55 11 3115 1009
CEO
Eng. Antonio João Oliveira Rocha
Chile
ARCADIS Geotécnica SA
Av. Eliodoro Yáñez 1893
Providencia, Santiago
Chile
Phone +56 2 3816000
Fax +56 2 3816001
CEO
Hernán Bezamat Cuadra, Civ. Eng.
DPA
China
ARCADIS Asia
Zhongrong Plaza, Unit 1203
1088 South Pu Dong Road,
Pudong New Area
Shanghai, 200122
China
Phone +86 21 587 61 451
Fax +86 21 587 82 738
Managing Director
Theo Tombeur
Czech Republic
SG-Geotechnika
ul. Geologická 988/4
152 00 Praha 5 - Barrandov
Czech Republic
Phone +420 234 654111
Fax +420 234 654112
Managing Director
Václav Horejsí
France
ARCADIS ESG
18 rue Troyon
92316 Sèvres Cedex
France
Phone +33 1 46237850
Fax +33 1 46237807
Managing Directors
Yann Leblais, Civ. Ing. (CEO)
Jean-Claude Popelard, Civ. Ing.
Germany
ARCADIS Deutschland GmbH
Europaplatz 3
64293 Darmstadt
P.O. Box 100331
64203 Darmstadt
Germany
Phone +49 6151 3880
Fax +49 6151 388992
Managing Directors
Ulrich Behr, Dipl.-Ing. (CEO)
Adam Mahr
ARCADIS Homola AG
Voltastrasse 31
D-60486 Frankfurt
Germany
Tel +49(0)69795900
Fax +49(0)6979590590
Managing Director
Josef F. Homola, Dipl.-Ing.,
Architect, FRICS
The Netherlands
ARCADIS Nederland BV
Piet Mondriaanlaan 26
3812 GV Amersfoort
P.O. Box 220
3800 AE Amersfoort
The Netherlands
Phone +31 33 4771000
Fax +31 33 4772000
CEO
Drs. Ing. Douwe Kras
PRC BV
Goudseweg 181
P.O. Box 1051
2410 CB Bodegraven
The Netherlands
Phone +31 172 631414
Fax +31 172 611902
Managing Director
Ir. Leo van der Kemp
Poland
ARCADIS Polska Sp.zo.o.
ul. Tarnogajska 18
50-512 Wroclaw
Poland
Phone +48 71 7823030
Fax +48 71 7823010
CEO
Marek Adamek, MSc
Romania
ARCADIS Eurométudes
Calea Grivitei nr. 136
Corp B, etaj 2
Sector 1 Bucharest
Romania
Phone +40 21 31 22699
Fax +40 21 31 22697
Managing Director
Nicolae Micu
United Kingdom
ARCADIS G&M International Ltd.
Craven Court
Willie Snaith Road
Newmarket
Suffolk CB8 7FA
United Kingdom
Phone +44 1638 674767
Fax +44 1638 668191
Managing Director
Dr. Brian Crook
AYH plc
10 Furnival Street
London EC4A 1YH
United Kingdom
Phone +44 20 72161000
Fax +44 20 72161001
Managing Director
Peter Vince
United States
ARCADIS U.S., Inc.
630 Plaza Drive
Suite 200
Highlands Ranch
Colorado 80129
United States
Phone +1 720 344 3500
Fax +1 720 344 3535
CEO
Steve Blake, PE, PG
ARCADIS BBL
6723 Towpath Road
P.O. Box 66
Syracuse
New York 13214
United States
Phone +1 315 4469120
Fax +1 315 4490017
President
Ed Lynch, BSc, Civ. Eng.
PinnacleOne
950 West Elliot Road
Suite 220
Tempe, Arizona 85284
Phone +1 480.296.7540
Fax + 1 480.296.7541
Toll Free +1 800.229.9050
President
Charles Dahill
136
Geographical distribution | Organization structure
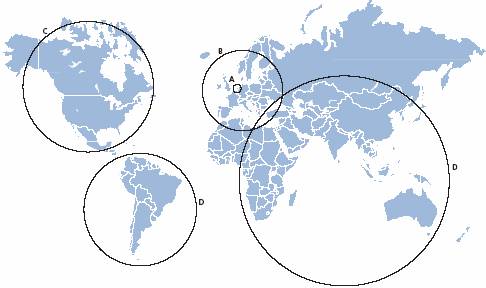
Geographical distribution
A_The Netherlands
Gross revenue € 323 million
Percentage of total gross revenue 26%
EBITA € 17.4 million
Of total EBITA 22%
B_Europe excluding the Netherlands
Gross revenue € 278 million
Percentage of total gross revenue 23%
EBITA € 18.8 million
Of total EBITA 24%
C_United States
Gross revenue € 519 million
Percentage of total gross revenue 42%
EBITA € 34.8 million
Of total EBITA 44%
D_Rest of world
Gross revenue € 113 million
Percentage of total gross revenue 9%
EBITA € 7.8 million
Of total EBITA 10%
Organization structure
ARCADIS NV
The Netherlands |
| United States |
| Europe excl. the Netherlands |
| Rest of world |
ARCADIS Nederland |
| ARCADIS US |
| Belgium |
| Brazil |
PRC |
|
|
| Czech Republic |
| Chile |
|
|
|
| France |
|
|
|
|
|
| Germany |
|
|
|
|
|
| Poland |
|
|
|
|
|
| United Kingdom |
|
|
|
|
|
| AYH |
|
|
137
Publication
Publication:
ARCADIS NV, April 2007
Editing:
Karen Bernhard
Design and layout:
Interbrand, Amsterdam, The Netherlands
Typesetting and DTP:
Océ Business Services, Arnhem, The Netherlands
Photography:
Jonathan Andrew, The Netherlands
Tineke Dijkstra, The Netherlands
Gareth Gardner, United Kingdom
Reinier Gerritsen, The Netherlands
Michel Kievits, The Netherlands
Sjaak Ramakers, The Netherlands
John Ripley, United States
John Voermans, The Netherlands
Andreas Zierhut, Germany
Lithography and printing:
Hollandia Printing, Heerhugowaard, The Netherlands
Edition:
18.000 copies
This Annual Report is printed on:
150 grs Eurobulk
138
Glossary
Glossary
AAC_ARCADIS Audit Committee.
Advanced Management Program_Internal training program for ARCADIS managers.
Organic growth_The development of our results adjusted for acquisitions, divestments and currency effects.
Gross Revenue_Total of billed activities added with value of current activities in accordance with the percentage-of-completion method.
Billability_At ARCADIS: The number of billable hours, related to the number of available working hours minus holidays and sick leave.
Carbon Credits_Credits that are a result of diminishing CO2 emissions under the recently ratified Kyoto protocol. Since recently, it is possible to trade in carbon credits.
DBFO_Design Build Finance and Operate: projects in which ARCADIS is entirely responsible (often in cooperation with partners) for design, realization, finance and operations.
Defined Benefit_in relation to pensions, system whereby the value of the distribution from the pension fund to its participants is fixed.
Defined Contribution_in relation to pensions, system whereby the value of the contribution to the pension fund made by the company is fixed.
EBITA_Indication of results: Earnings Before Interest, Tax and Amortization.
Facility management_Company activity: The management of buildings, grounds and infrastructure of our clients’ locations, including services like catering, security and purchasing utilities like water and electricity.
General Business Principles_A set of working ethics for our employees.
Goodwill_The sum that is paid above the fair value when acquiring a company.
GRiP®_Guaranteed Remediation Program: form of environmental services whereby ARCADIS takes responsibility for possible risks with remediation projects.
IFRS_International Financial Reporting Standards International valuation principles for financial reporting.
Impairment test_Test to assess how the net cash value (based on future cash flows) of assets acquired compares to the current book value.
Liquidity providers_In relation to the ARCADIS share: Banks that offer protection from the fluctuations of the stock market are acting as counter part so transactions can always be made and as a consequence of that transaction volumes increase.
Multinational clients_Private sector clients with offices in various countries.
Net income from operations_Net income excluding extraordinary items and excluding amortization of goodwill.
Net revenue_Gross revenue minus third party activities or materials delivered by third parties.
One-firm concept_A uniform services offering across operating companies
One-stop shopping concept_At ARCADIS: to execute as full range of activities as possible for one specific client.
Order intake_The number of new projects for which contracts have been signed.
Peer group_Group of companies that are comparable with ARCADIS both in size and activity.
Percentage-of-completion_Calculation method in which the actual cost in a project is offset against the expected final cost of a project at completion.
Proxy solicitation_Means to provide shareholders the opportunity to vote without being present at the shareholders meeting.
RECLAIM™_Redevelopment, Closure, Asset and Industrial Management a service in which ARCADIS is responsible for the remediation and redevelopment of a contaminated site.
SAFETEA_Safe, Accountable, Flexible and Efficient Transportation Equity Act: United States draft bill for infrastructure investment.
Sarbanes Oxley Act_American legislation for companies that are listed on American stock exchanges.
SEC Securities and Exchange Commission_United States stock market authority.
Senior Management Committee_ARCADIS senior managers consisting of the Executive Board, the Staff Directors and the CEO’s of major operating companies.
Total shareholder return_Stock price appreciation plus dividend yield
US GAAP_United States Generally Accepted Accounting Principles: American valuation principles for financial reporting.
Webcasting_Broadcast via internet of press-conferences or annalyst meetings
139