Goldman Sachs Fifteenth Annual Agricultural Biotech Forum
Smithfield Foods, Inc.C. Larry PopePresident and Chief Executive OfficerRobert W. ManlyExecutive Vice President and Chief Financial Officer
Forward-Looking Statements
This presentation contains “forward-looking” statements within the meaning of the federal securities laws. The forward-looking statements include statements concerning the Company’s outlook for the future, as well as other statements of beliefs, future plans and strategies or anticipated events, and similar expressions concerning matters that are not historical facts. The Company’s forward-looking information and statements are subject to risks and uncertainties that could cause actual results to differ materially from those expressed in, or implied by, the statements. These risks and uncertainties include the availability and prices of live hogs, raw materials, fuel and supplies, food safety, livestock disease, live hog production costs, product pricing, the competitive environment and related market conditions, risks associated with our indebtedness, including cost increases due to rising interest rates or changes in debt ratings or outlook, hedging risk, operating efficiencies, changes in foreign currency exchange rates, access to capital, the cost of compliance with changes to regulations and laws, including changes in accounting standards, tax laws, environmental laws, agricultural laws and occupational, health and safety laws, adverse results from on-going litigation, actions of domestic and foreign governments, labor relations issues, credit exposure to large customers, the ability to make effective acquisitions and dispositions and s uccessfully integrate newly acquired businesses into existing operations, the Company’s ability to effectively restructure portions of its operations and achieve cost savings from such restructurings and other risks and uncertainties described in the Company’s Annual Report on Form 10-K for fiscal 2010 and in its subsequent Quarterly Reports on Form 10-Q. Readers are cautioned not to place undue reliance on forward-looking statements because actual results may differ materially from those expressed in, or implied by, the statements. Any forward looking statement that the Company makes speaks only as of the date of such statement, and the Company undertakes no obligation to update any forward-looking statements, whether as a result of new information, future events or otherwise. Comparisons of results for current and any prior periods are not intended to express any future trends or indications of future performance, unless expressed as such, and should only be viewed as historical data.
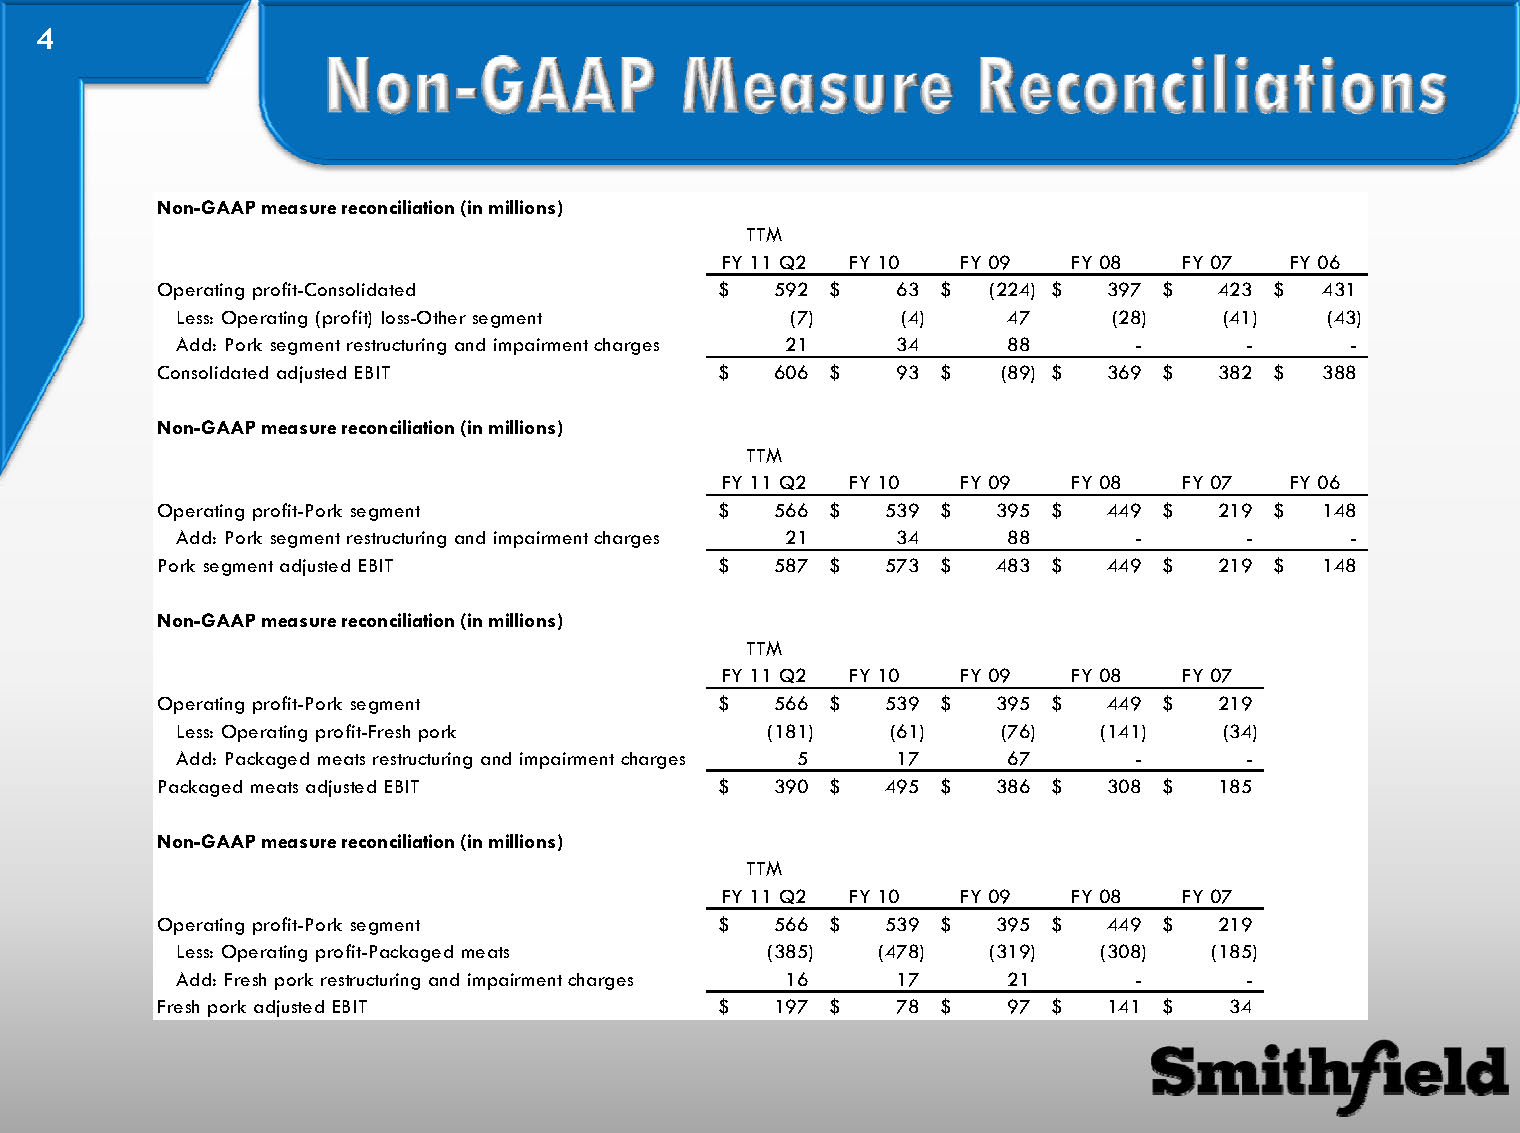
Non-GAAP Measure Reconcilia tions Non-GAAP measure reconciliation (in millions)
TTMFY 11 Q2FY 10FY 09FY 08FY 07FY 06Operating profit-Consolidated592$ 63$ (224)$ 397$ 423$ 431$ Less: Operating (profit) loss-Other segment(7) (4) 47 (28) (41) (43) Add: Pork segment restructuring and impairment charges21 34 88 - - - Consolidated adjusted EBIT606$ 93$ (89)$ 369$ 382$ 388$
Non-GAAP measure reconciliation (in millions)
TTMFY 11 Q2FY 10FY 09FY 08FY 07FY 06Operating profit-Pork segment566$ 539$ 395$ 449$ 219$ 148$ Add: Pork segment restructuring and impairment charges21 34 88 - - - Pork segment adjusted EBIT587$ 573$ 483$ 449$ 219$ 148$
Non-GAAP measure reconciliation (in millions)
TTMFY 11 Q2FY 10FY 09FY 08FY 07Operating profit-Pork segment566$ 539$ 395$ 449$ 219$ Less: Operating profit-Fresh pork(181) (61) (76) (141) (34) Add: Packaged meats restructuring and impairment charges5 17 67 - - Packaged meats adjusted EBIT390$ 495$ 386$ 308$ 185$
Non-GAAP measure reconciliation (in millions)
TTMFY 11 Q2FY 10FY 09FY 08FY 07Operating profit-Pork segment566$ 539$ 395$ 449$ 219$ Less: Operating profit-Packaged meats(385) (478) (319) (308) (185) Add: Fresh pork restructuring and impairment charges16 17 21 - - Fresh pork adjusted EBIT197$ 78$ 97$ 141$ 34$
The New Era of Smithfield
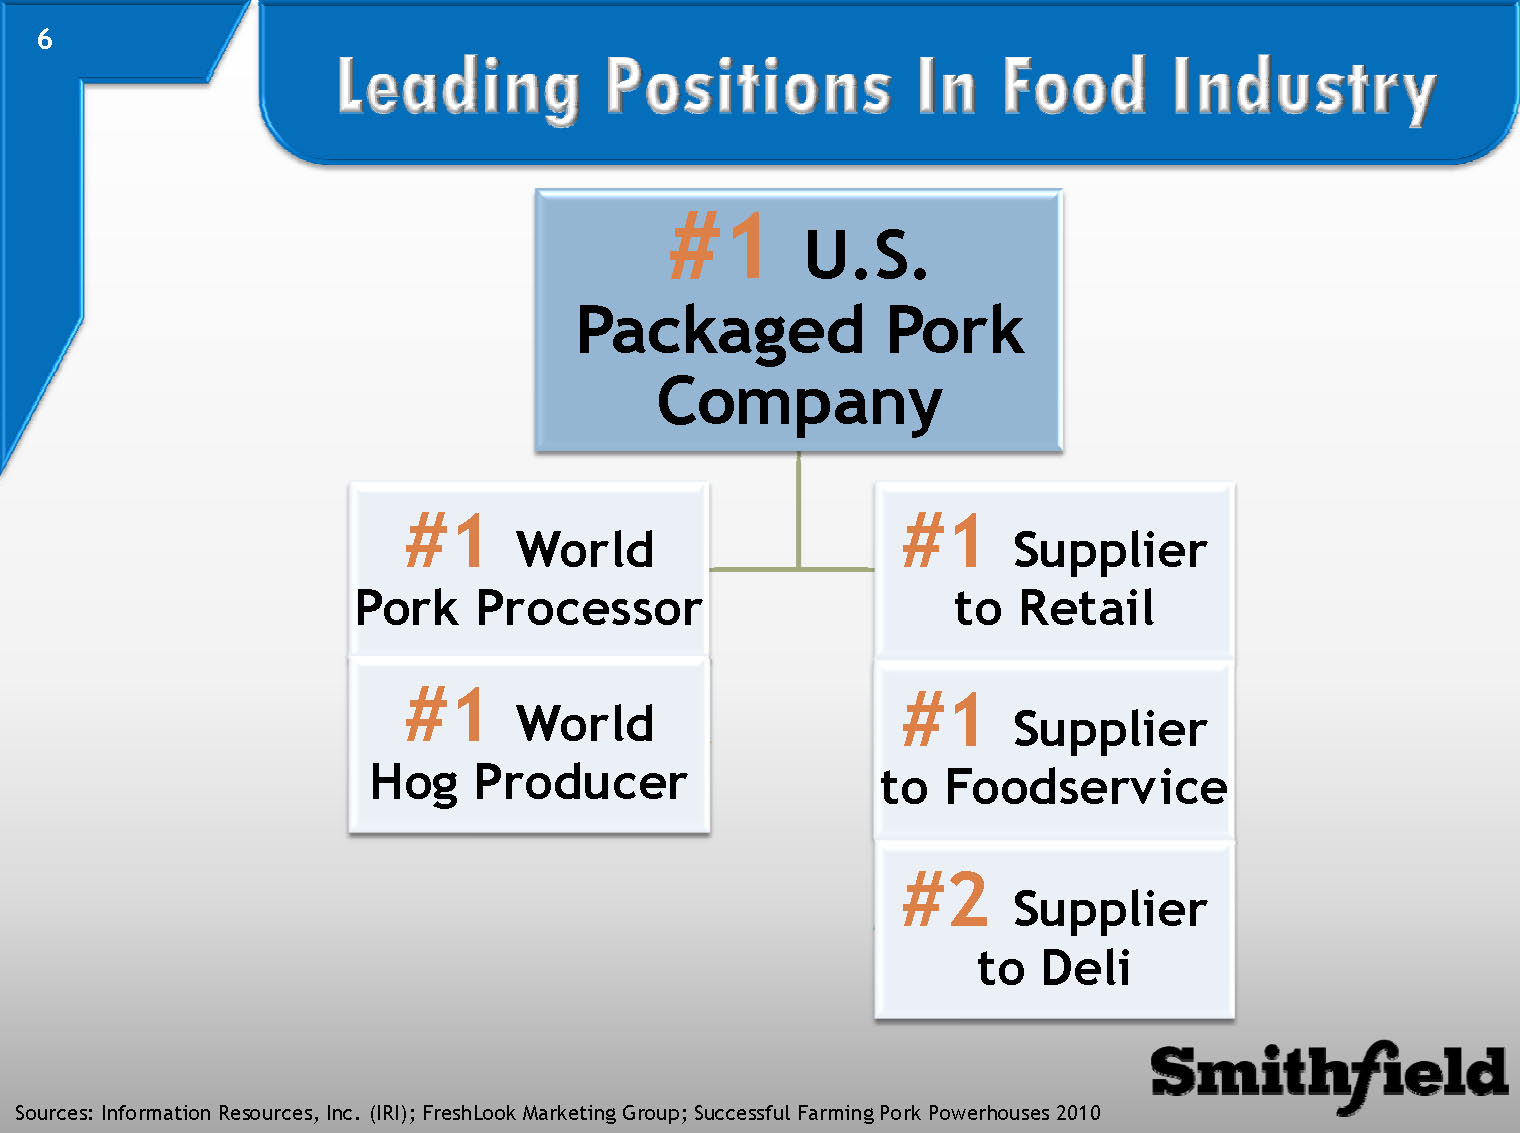
Leading Positions In Food Industry
#1U.S. Packaged Pork Company
#1World Pork Processor
#1World Hog Producer
#1Supplier to Retail
#1Supplier to Foodservice
#2Supplier to Deli
Sources: Information Resources, Inc. (IRI); FreshLook Marketing Group; Successful Farming Pork Powerhouses 2010
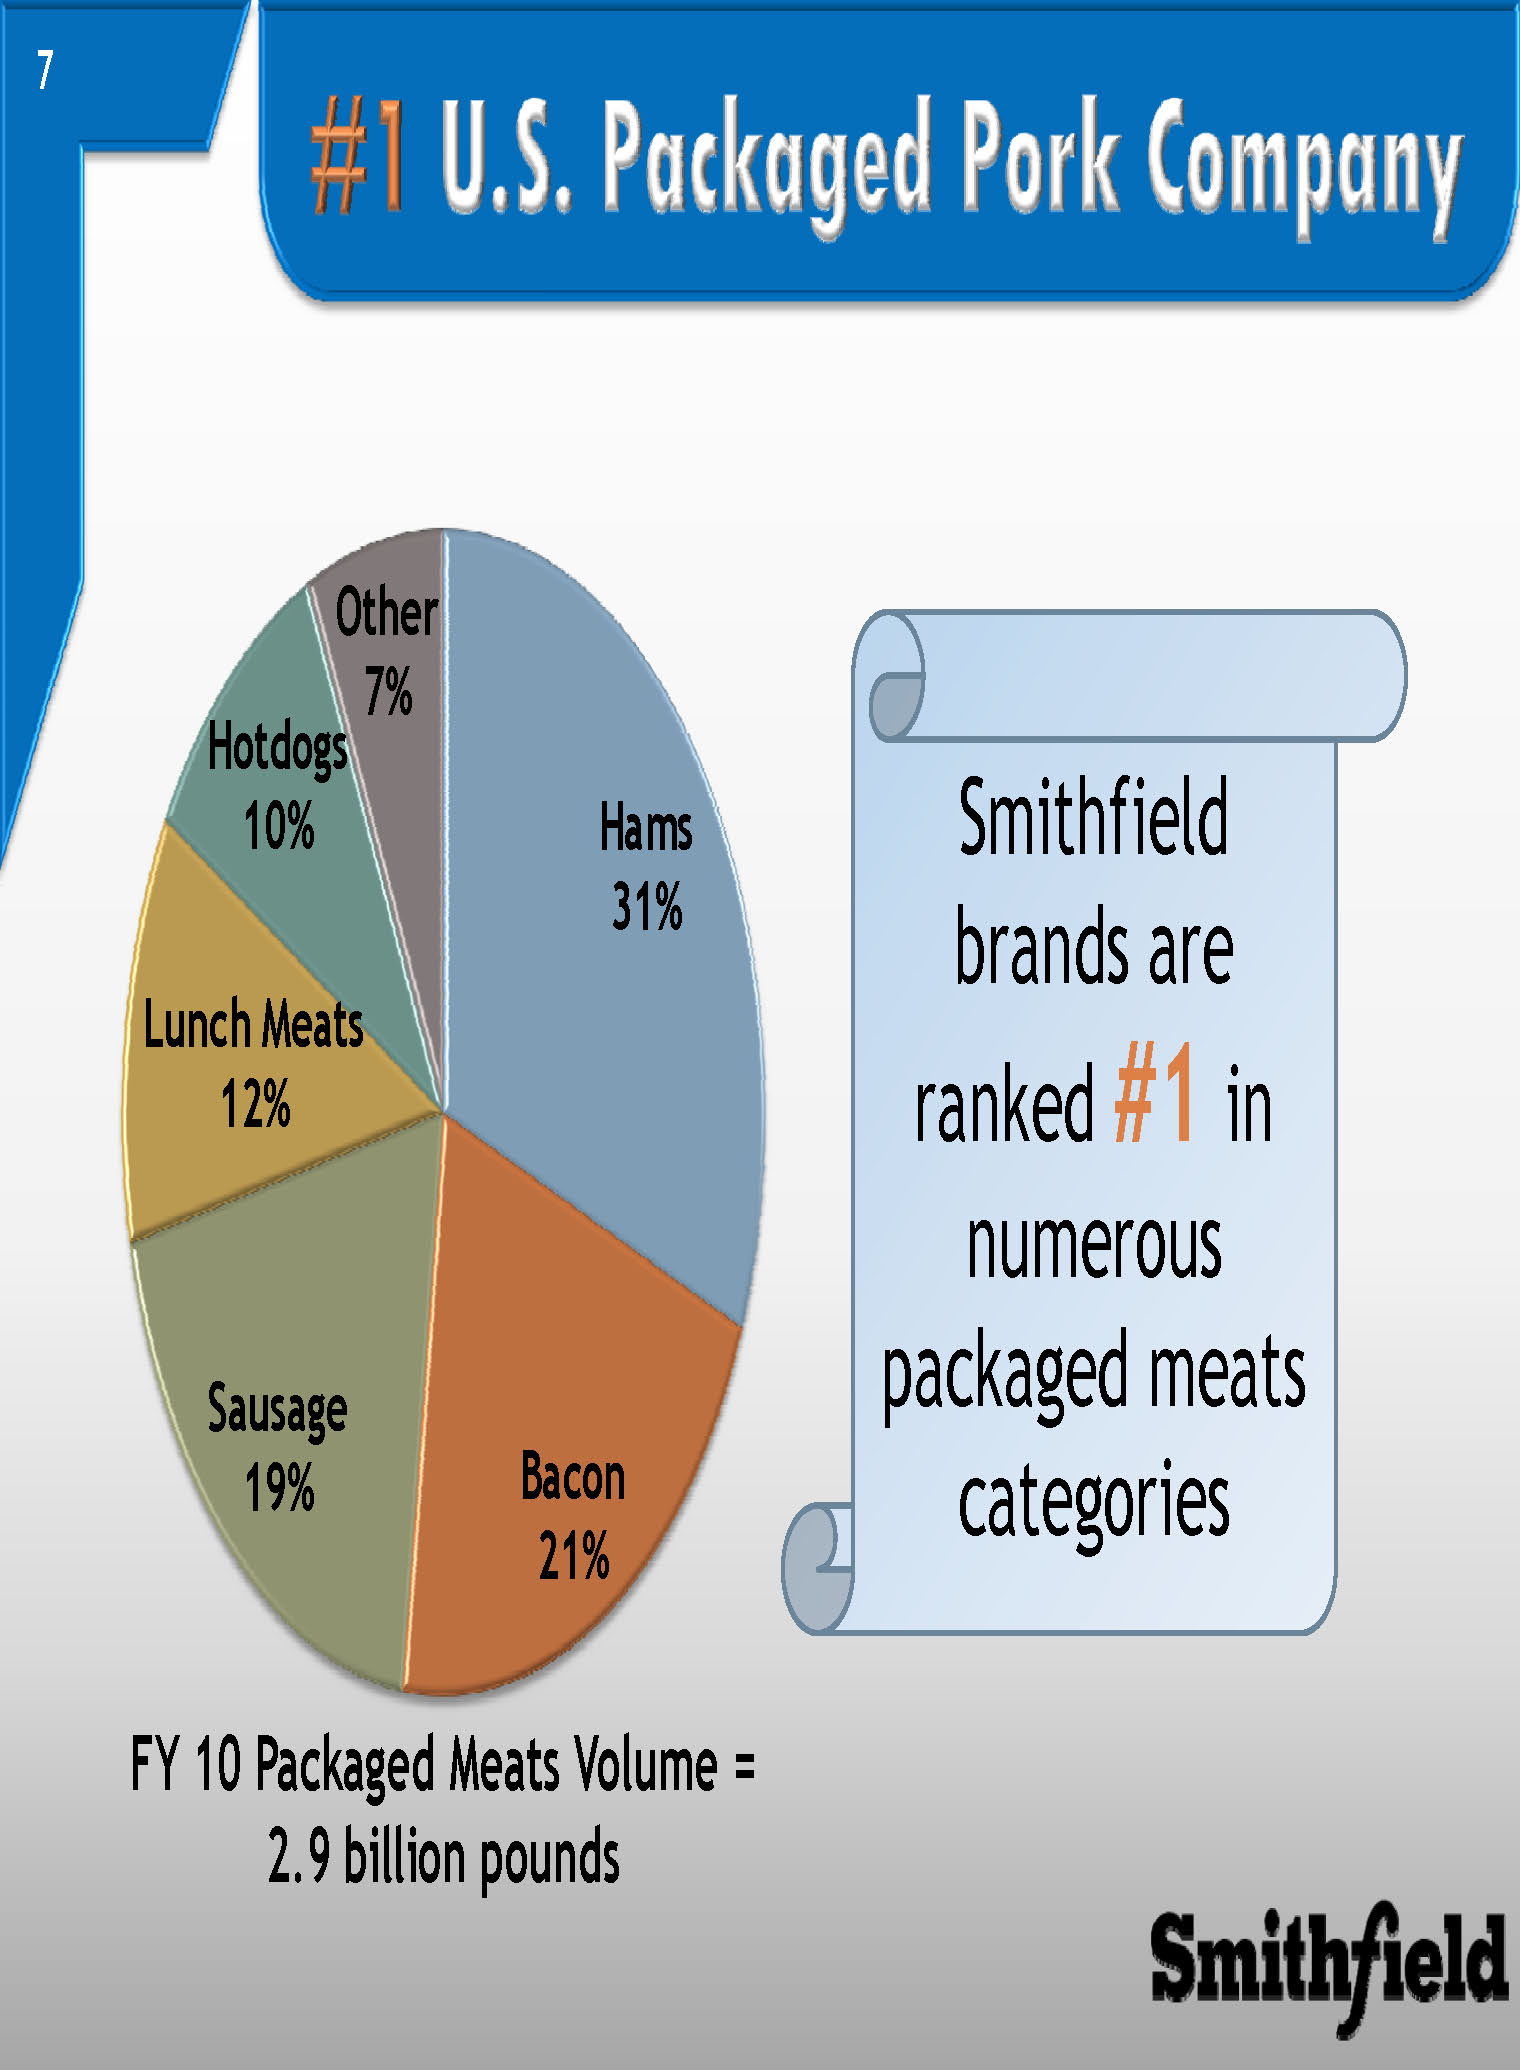
#1 U.S. Packaged Pork Company
Hams 31% Bacon21% Sausage19% Lunch Meats12% Hotdogs10% Other7%
Smithfield brands are ranked #1 in numerous packaged meats categories
FY 10 Packaged Meats Volume = 2.9 billion pounds
The New Era of Smithfield
Driving profitable top and bottom line growth
Competitive cost structure in all operating segments
Closely coordinated sales & marketing platform
Consolidated portfolio of leading consumer brands
Focus on quality and consistent earnings
Conservative balance sheet with focus on ROIC
Competitive Cost Structure
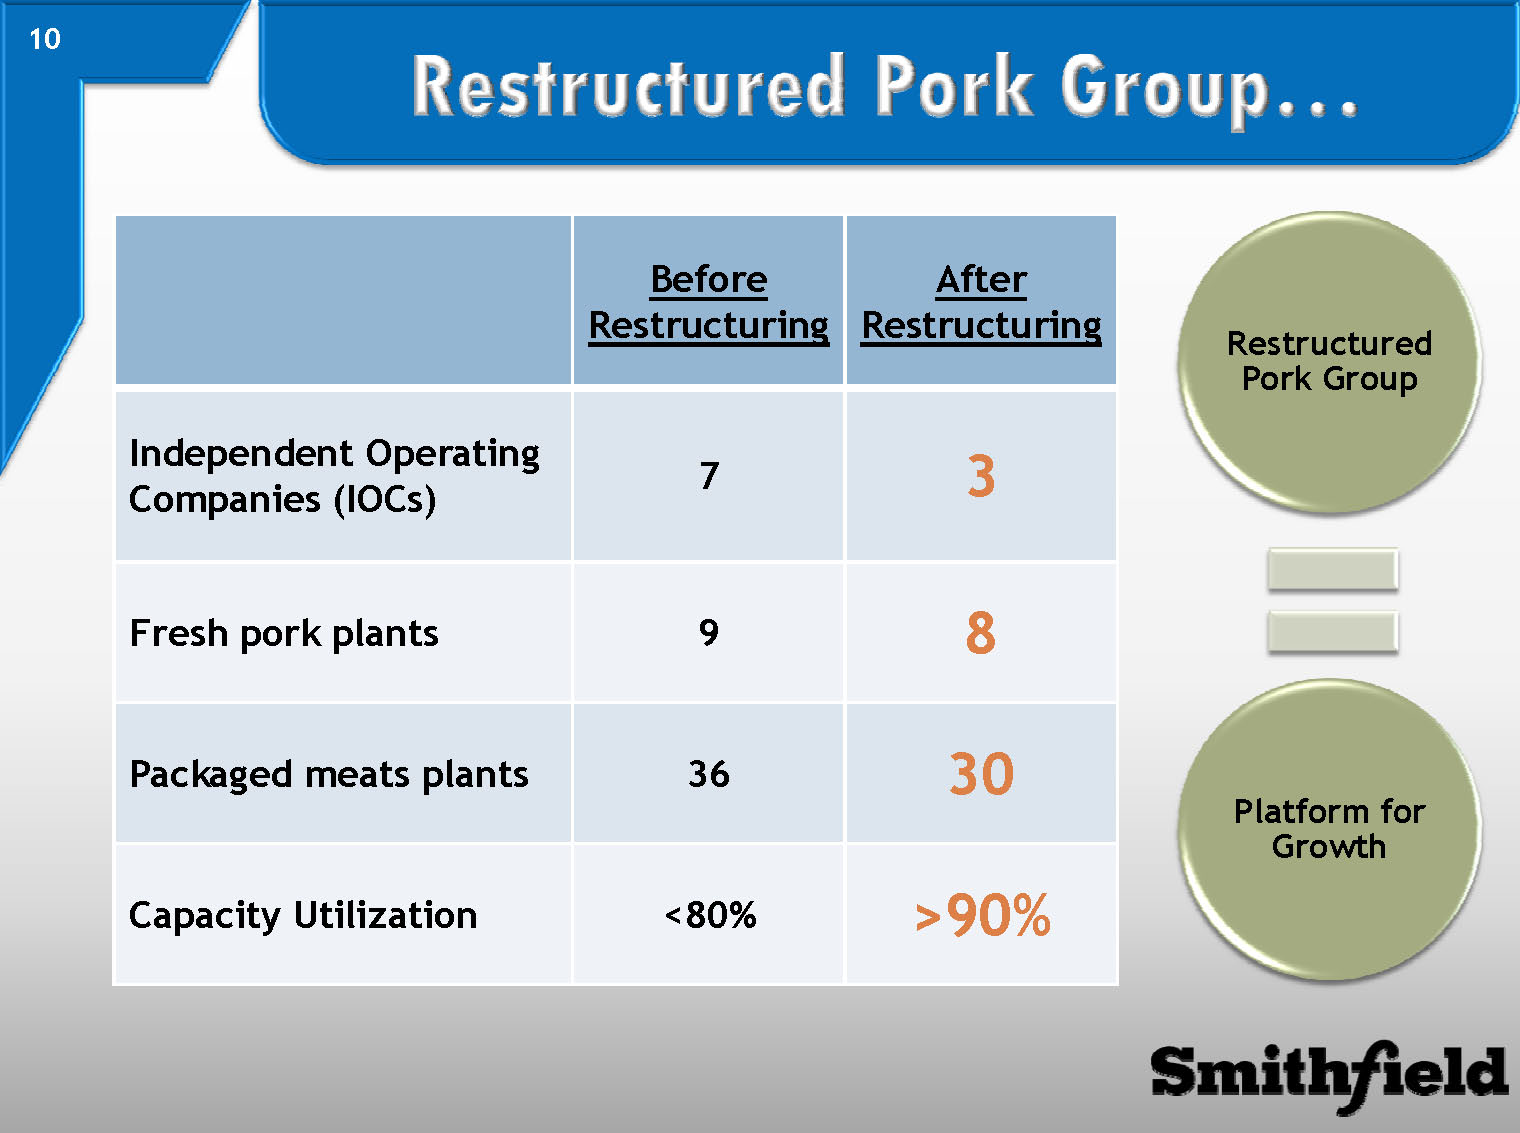
Restructured Pork Group…
Before Restructuring After Restructuring
Independent Operating Companies (IOCs) 7 3
Fresh pork plants 9 8
Packaged meats plants 36 30
Capacity Utilization <80% >90%
Restructured Pork Group = Platform for Growth
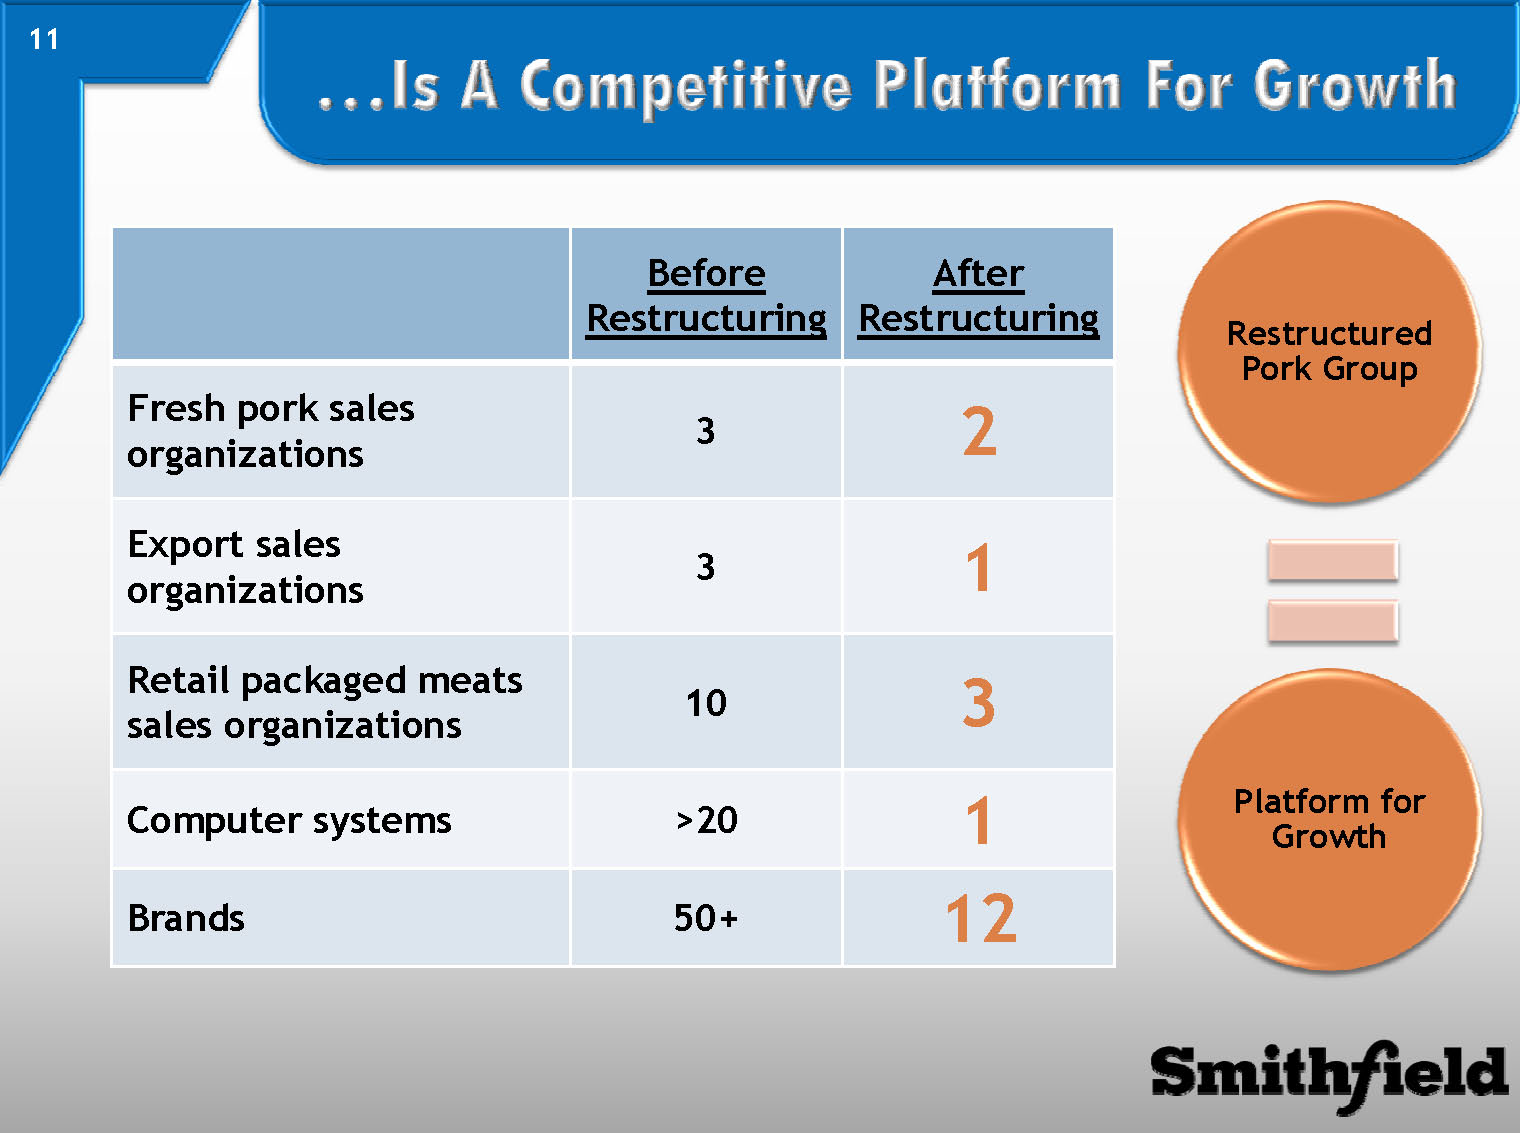
…Is A Competitive Platform For Growth
Before Restructuring After Restructuring
Fresh pork sales organizations 3 2
Export sales organizations 3 1
Retail packaged meats sales organizations 10 3
Computer systems >20 1
Brands 50+ 12
Restructured Pork Group = Platform for Growth
Hog Production Cost Savings Initiative
oPhilosophy –Least cost is only competitively sustainable position
oPlan –Improve operating efficiencies, productivity, competitive cost structure and profitability
oBenefits –Fully achieved by end of three-year period
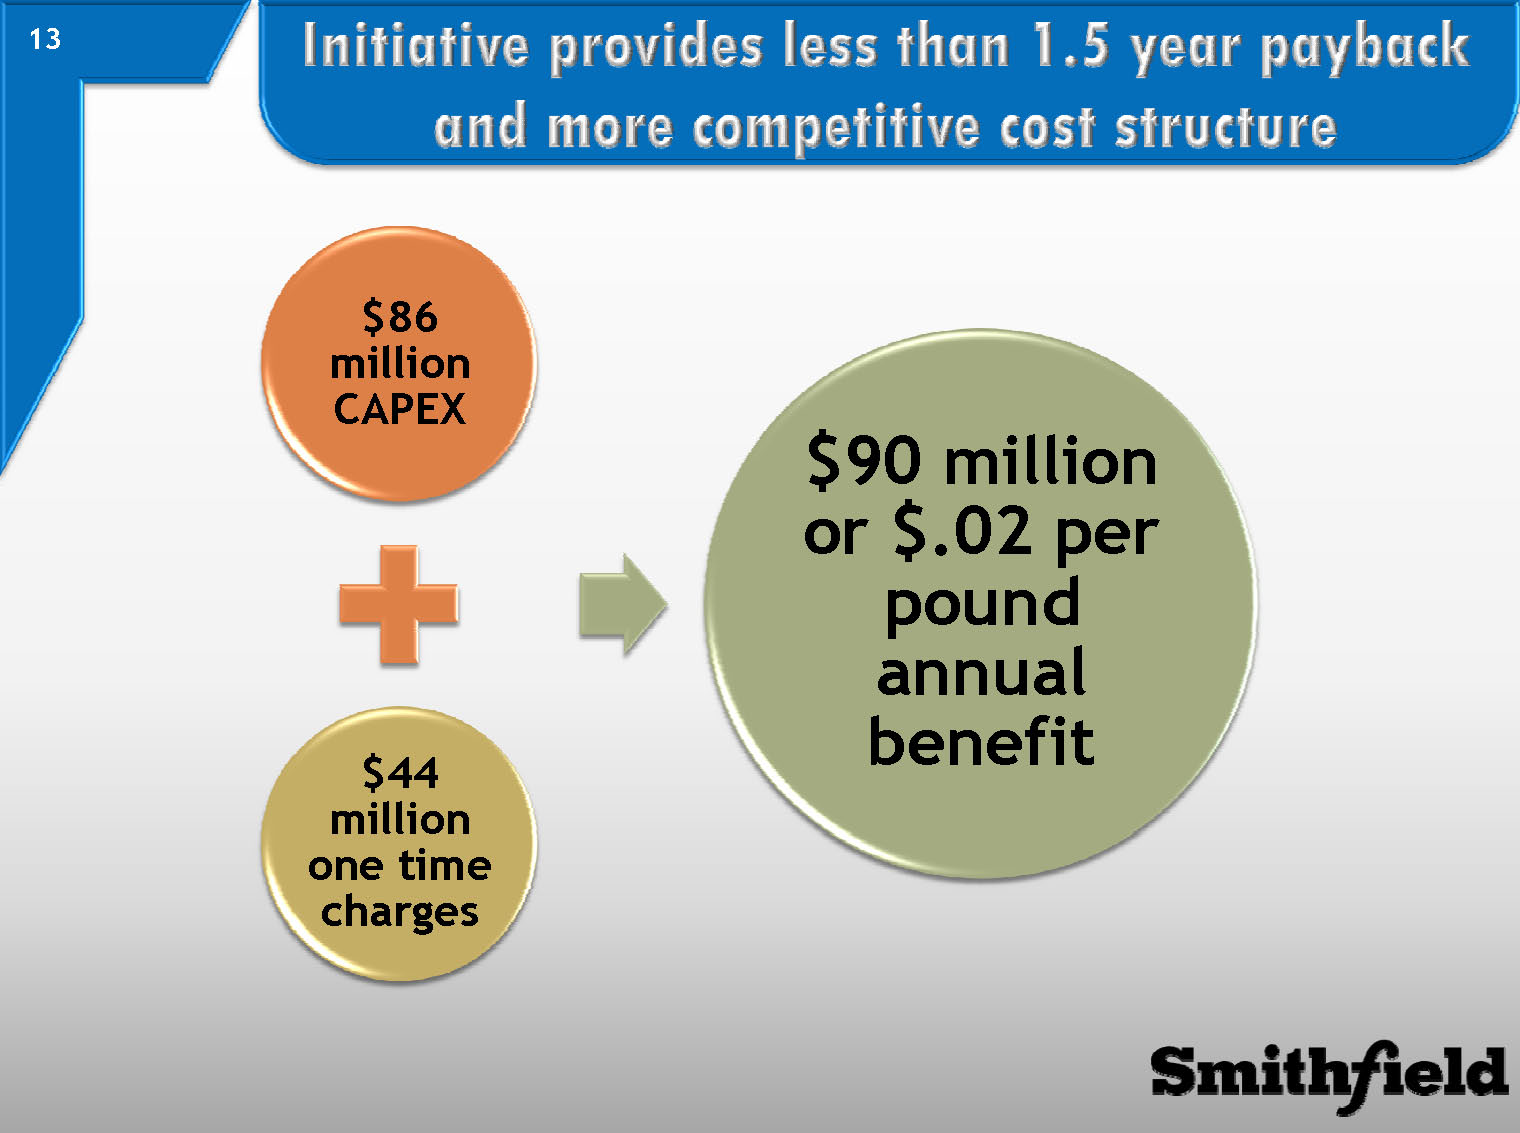
Initiative provides less than 1.5 year payback and more competitive cost structure
$86 million CAPEX
$44 million one time charges
$90 million or $.02 per pound annual benefit
Sales & Marketing Platform
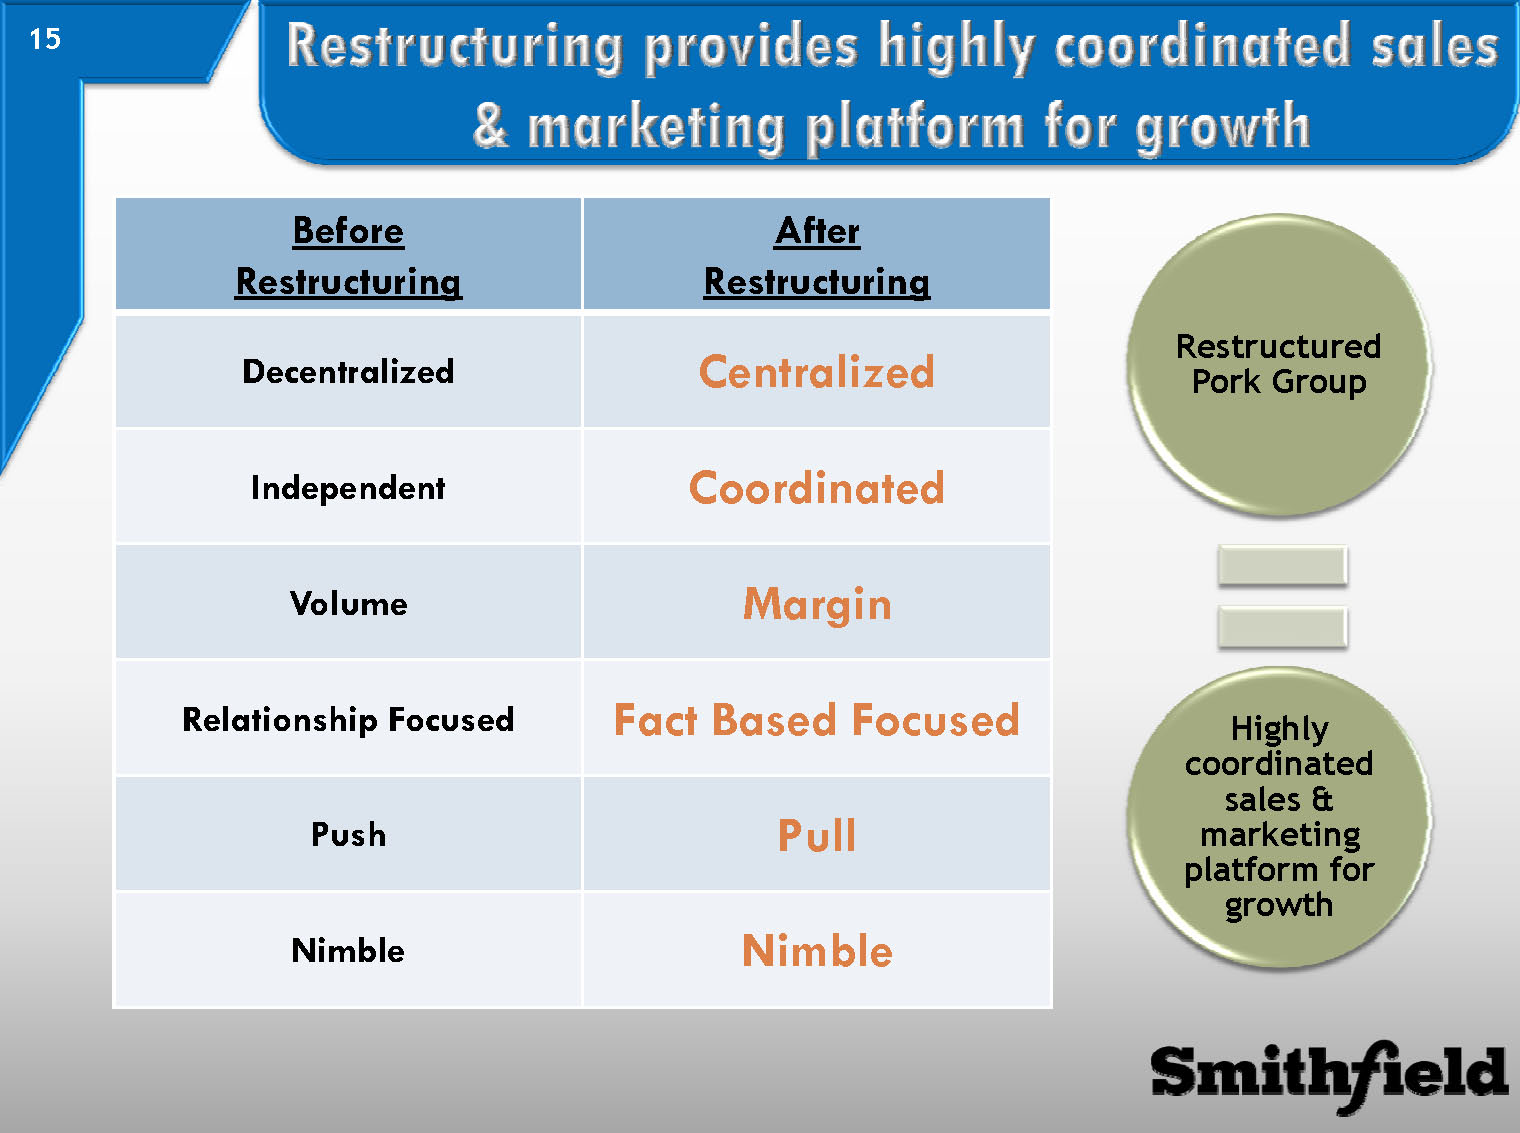
Restructuring provides highly coordinated sales & marketing platform for growth
Restructured Pork Group = Highly coordinated sales & marketing platform for growth
Before Restructuring After Restructuring
Decentralized Centralized
Independent Coordinated
Volume Margin
Relationship Focused Fact Based Focused
Push Pull
Nimble Nimble
Leading Consumer Brands
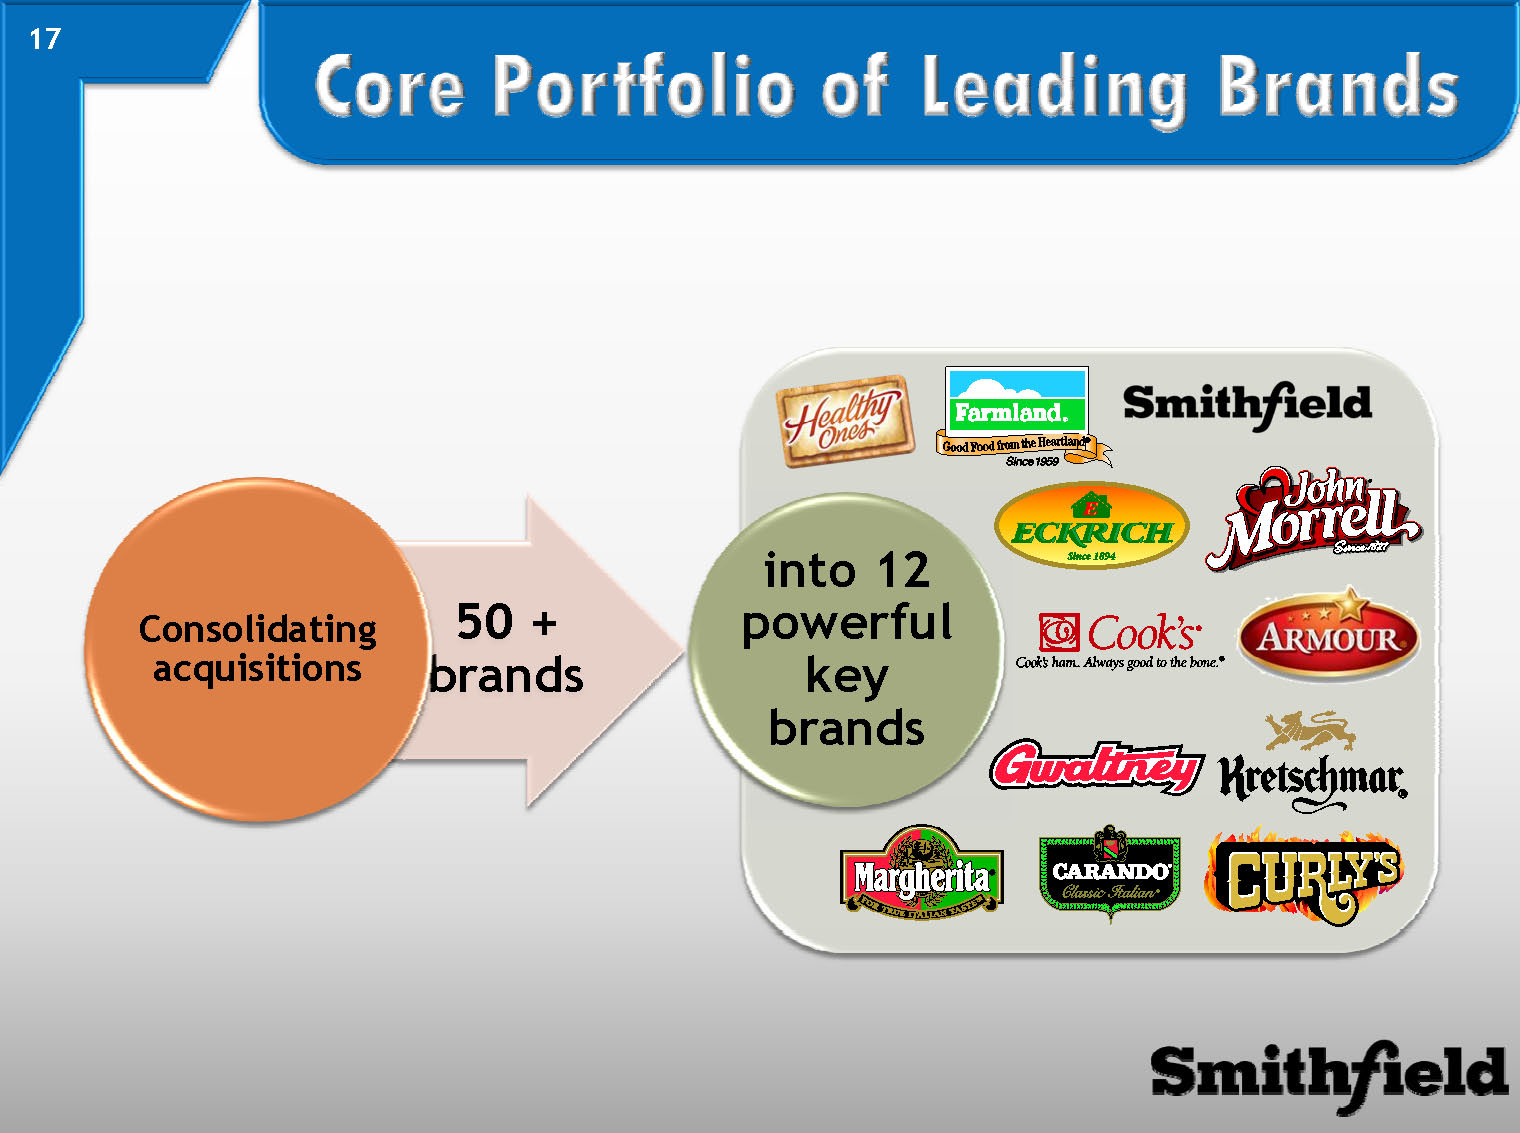
Core Portfolio of Leading Brands
50 + brands Consolidating acquisitions into 12 powerful key brands
Quality and Consistent Earnings
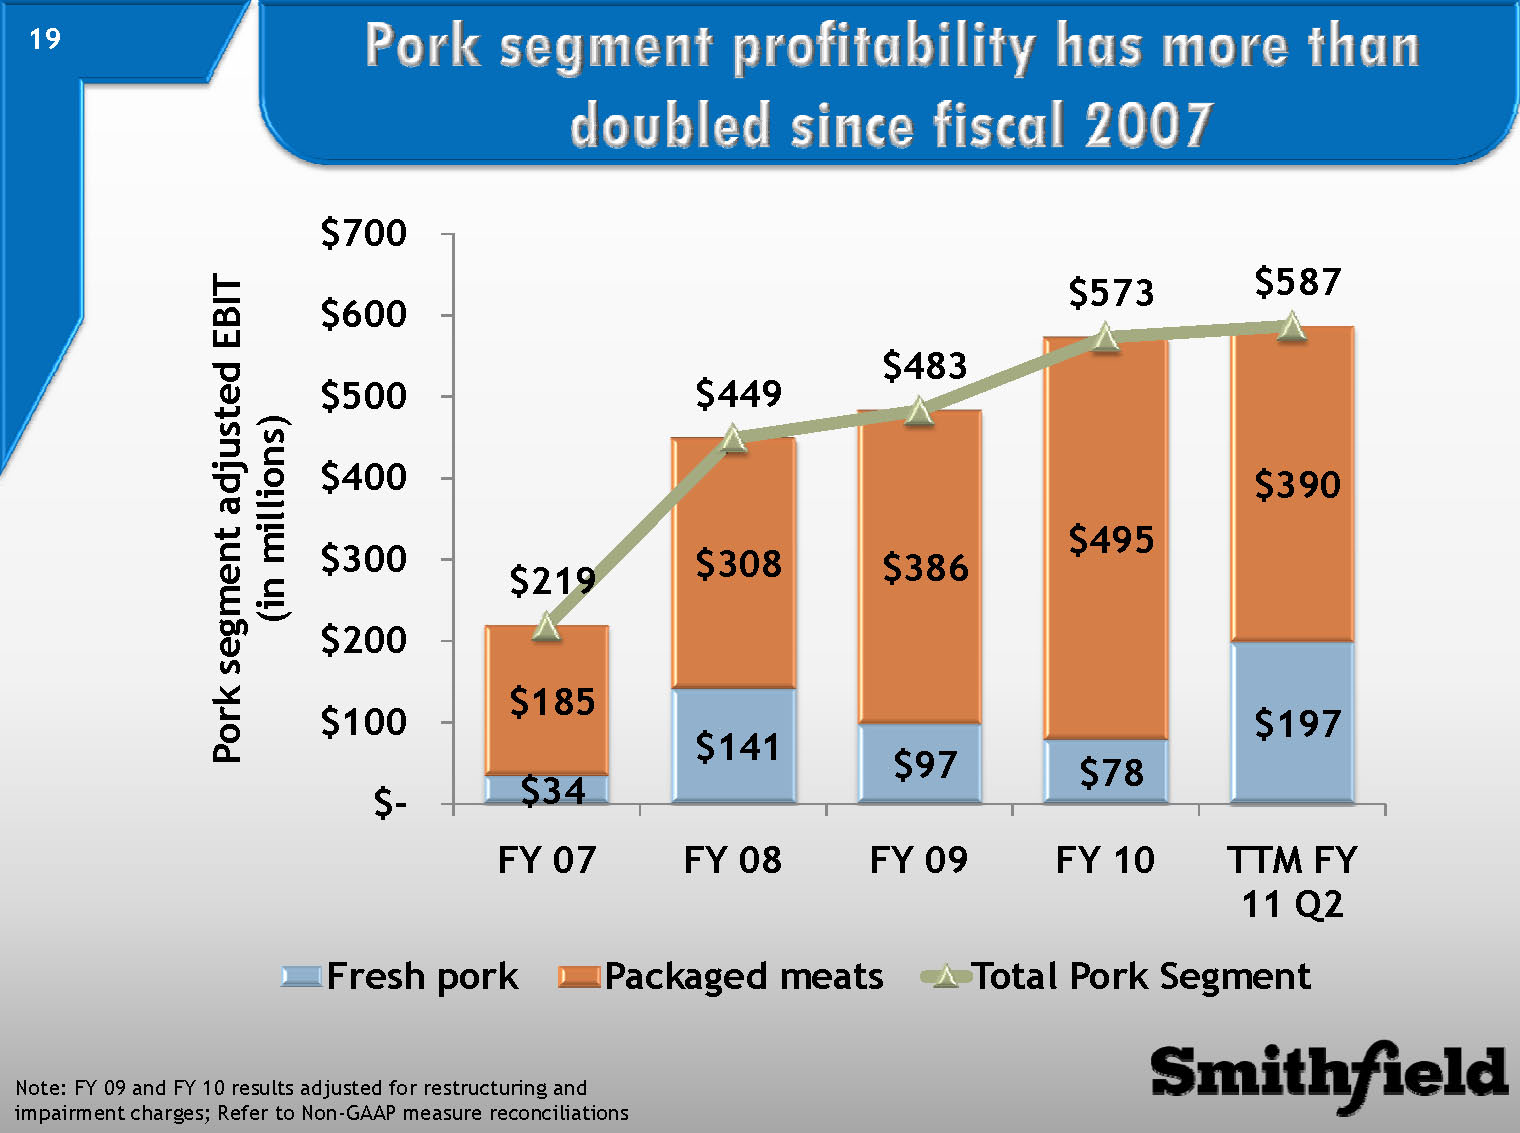
Pork segment profitability has more than doubled since fiscal 2007
Note: FY 09 and FY 10 results adjusted for restructuring and impairment charges; Refer to Non-GAAP measure reconciliations
Pork segment adjusted EBIT (in millions) Fresh pork Packaged meats Total Pork Segment
FY 07 $34 $185 $219
FY 08 $141 $308 $449
FY 09 $97 $386 $483
FY 10 $78 $495 $573
TTM FY 11 Q2 $197 $390 $587
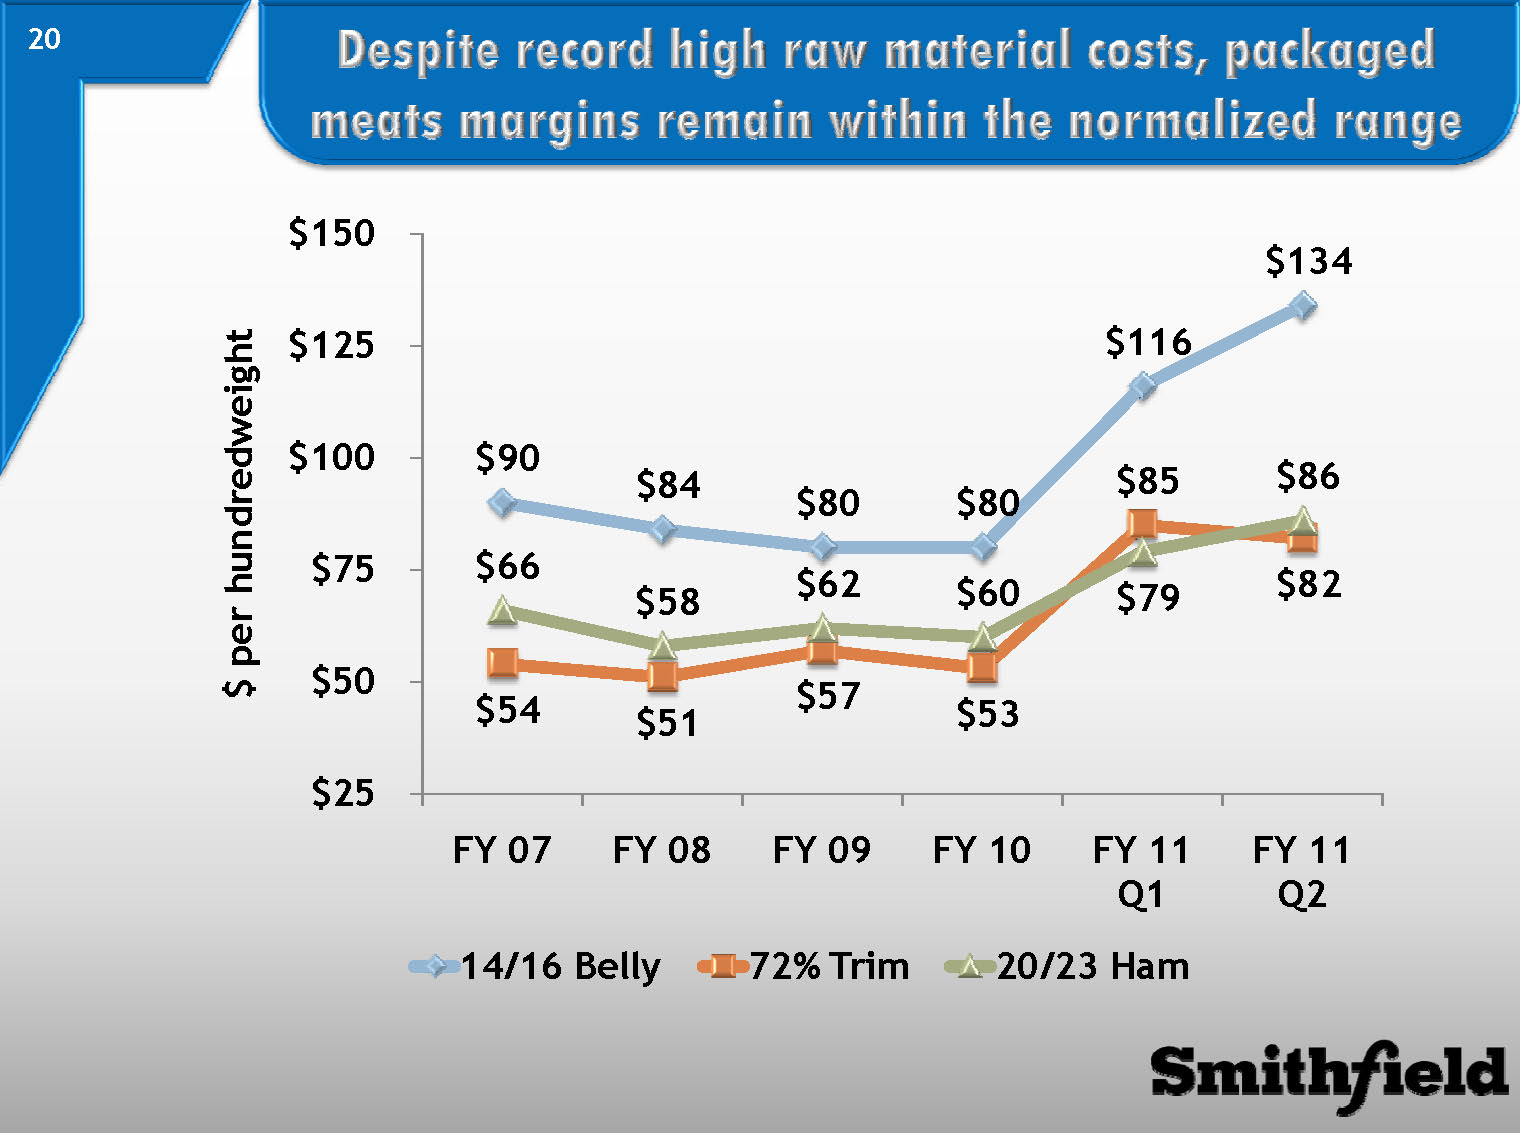
Despite record high raw material costs, packaged meats margins remain within the normalized range
$ per hundredweight 14/16 Belly 72% Trim 20/23 Ham
FY 07 $90 $54 $66
FY 08 $84 $51 $58
FY 09 $80 $57 $62
FY 10 $80 $53 $60
FY 11 Q1 $116 $85 $79
FY 11 Q2 $134 $82 $86
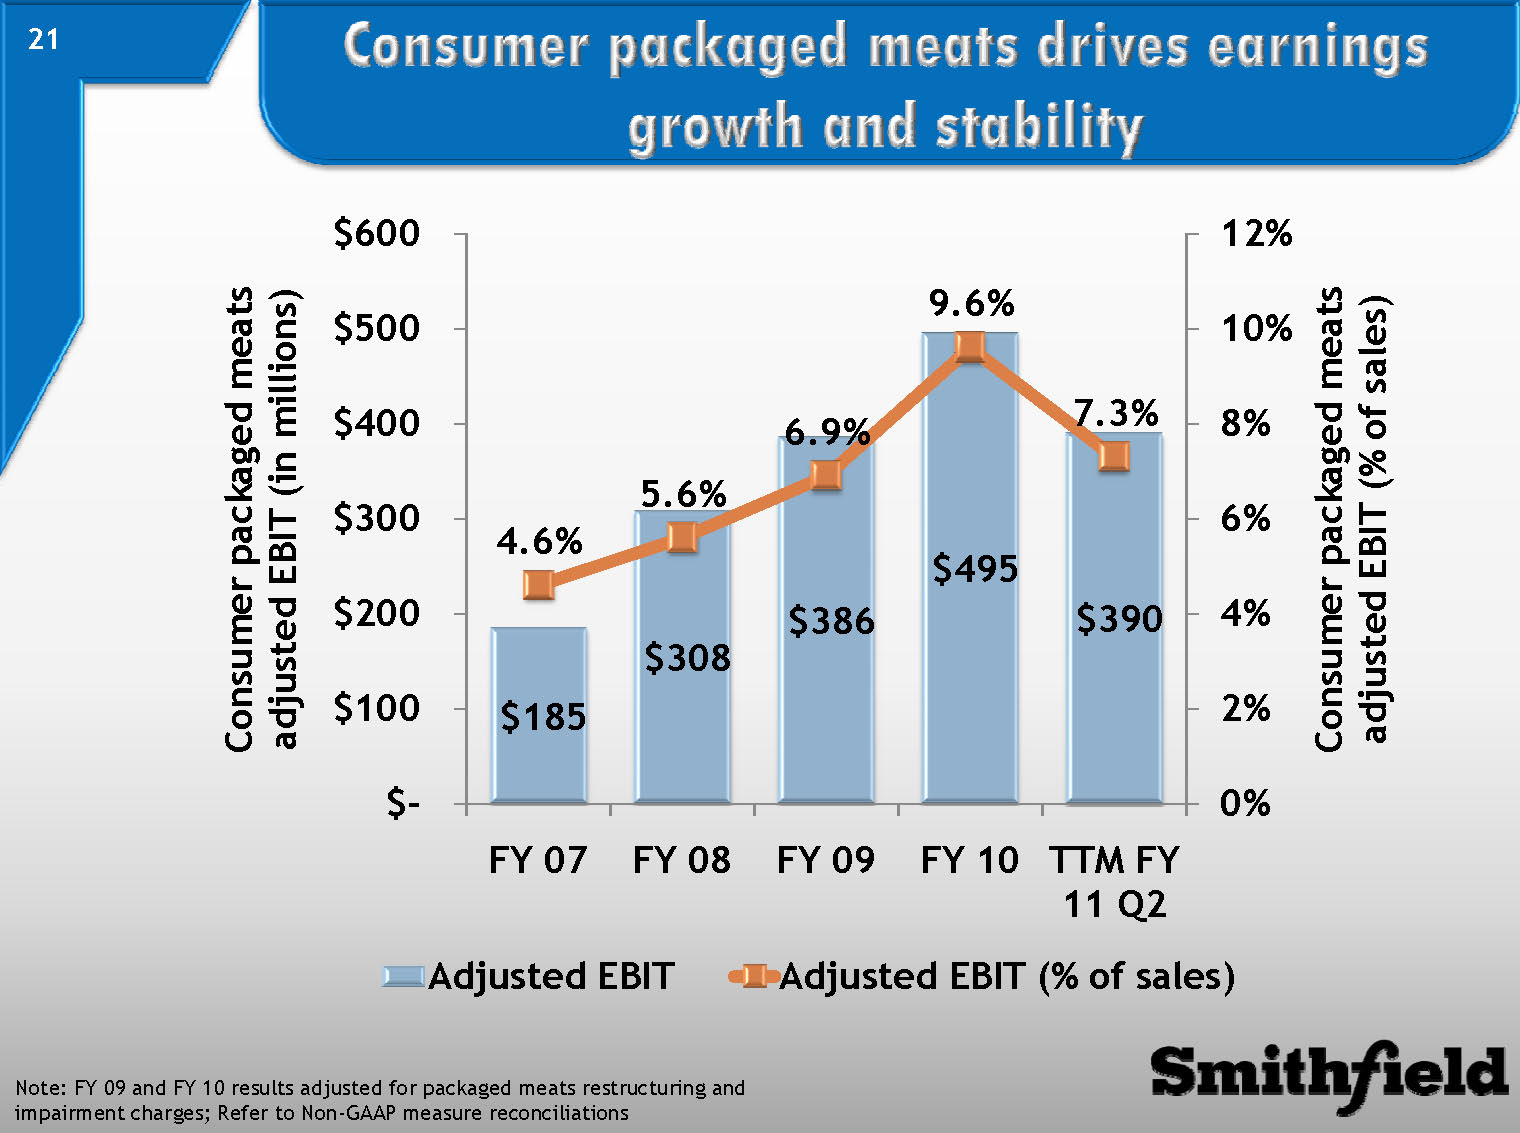
Consumer packaged meats drives earnings growth and stability
Note: FY 09 and FY 10 results adjusted for packaged meats restructuring and impairment charges; Refer to Non-GAAP measure reconciliations
Consumer packaged meats adjusted EBIT (in millions) Consumer packaged meats adjusted EBIT (% of sales)
FY 07 $185 4.6%
FY 08 $308 5.6%
FY 09 $386 6.9%
FY 10 $495 9.6%
TTM FY 11 Q2 $390 7.3%
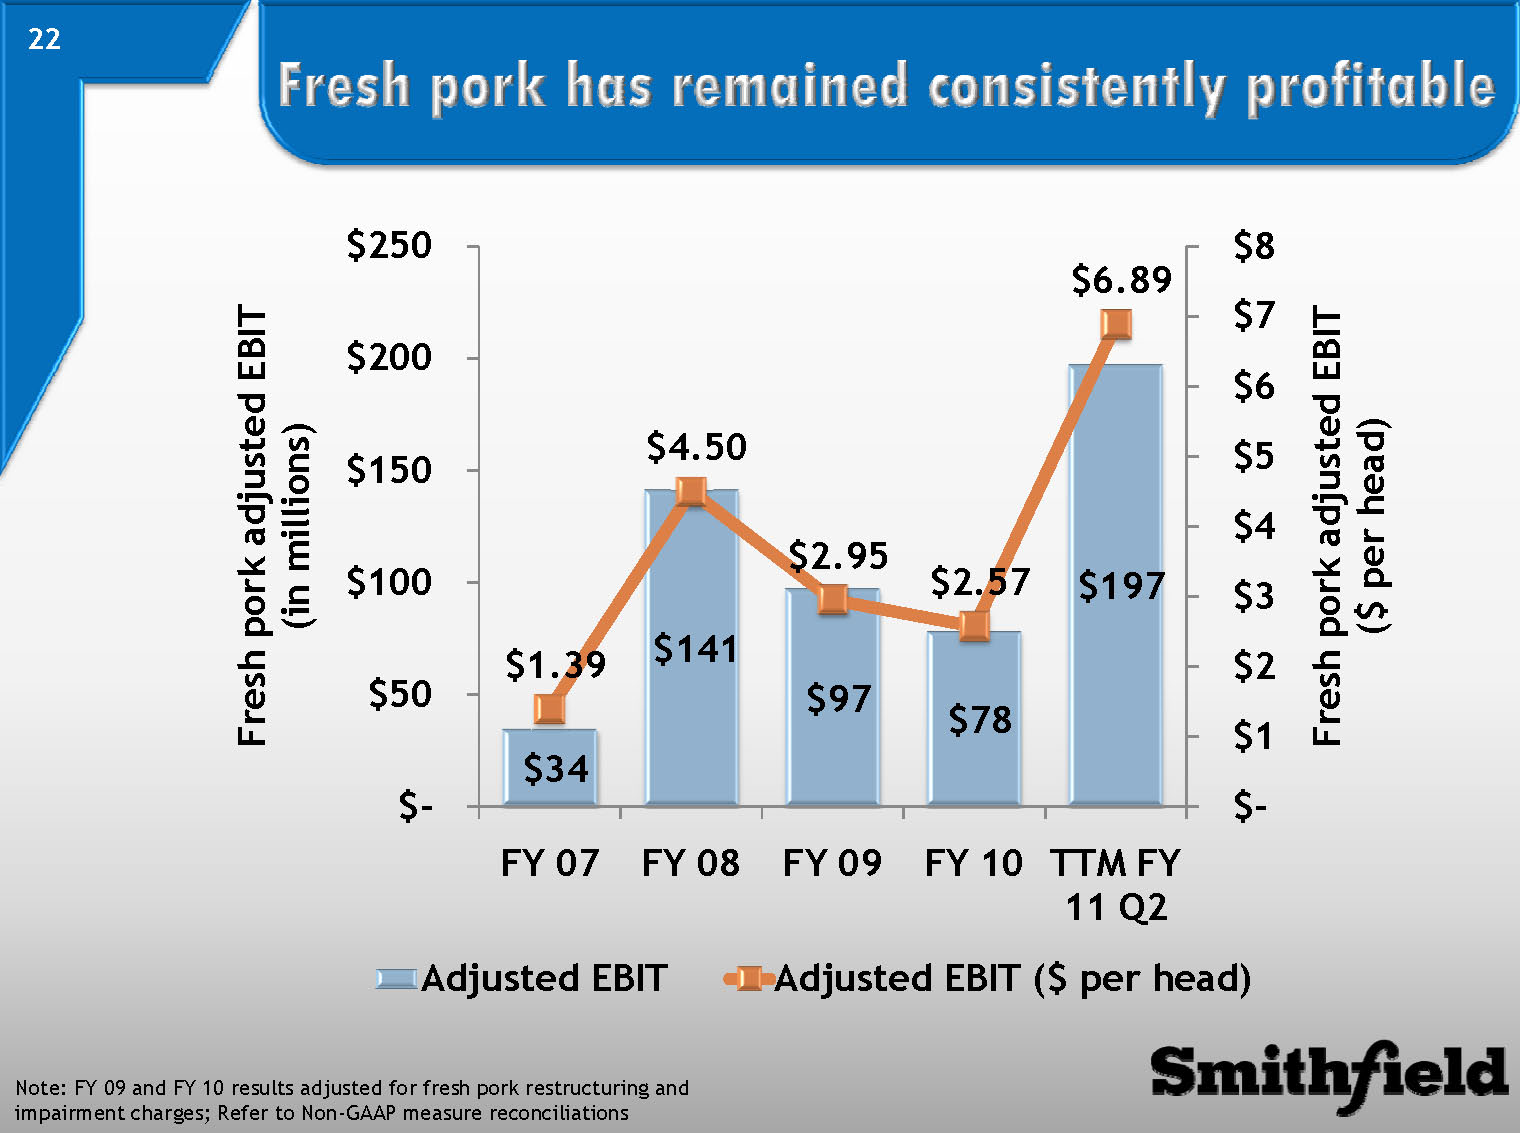
Fresh pork has remained consistently profitable
Note: FY 09 and FY 10 results adjusted for fresh pork restructuring and impairment charges; Refer to Non-GAAP measu re reconciliations
Fresh pork adjusted EBIT(in millions) Fresh pork adjusted EBIT($ per head)
FY 07 $34 $1.39
FY 08 $141 $4.50
FY 09 $97 $2.95
FY 10 $78 $2.57
TTM FY 11 Q2 $197 $6.89
;
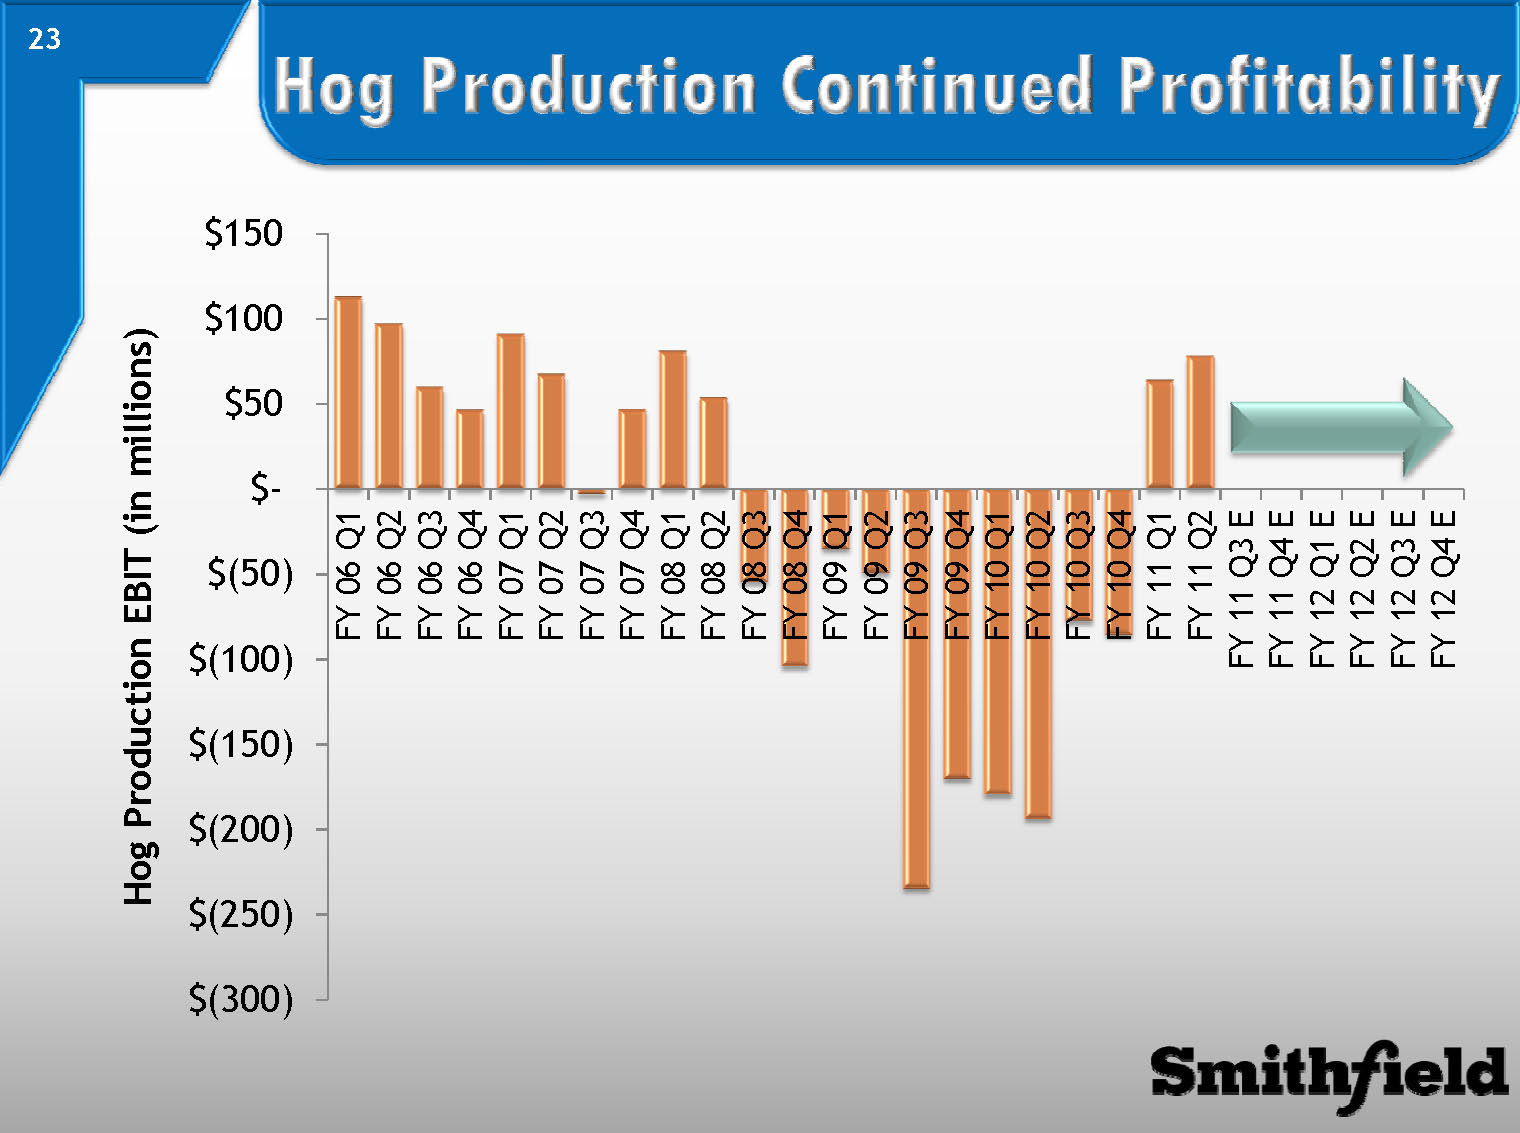
Hog Production Continued Profitability
Hog Production EBIT (in millions)
Conservative Balance Sheet with Focus on ROIC
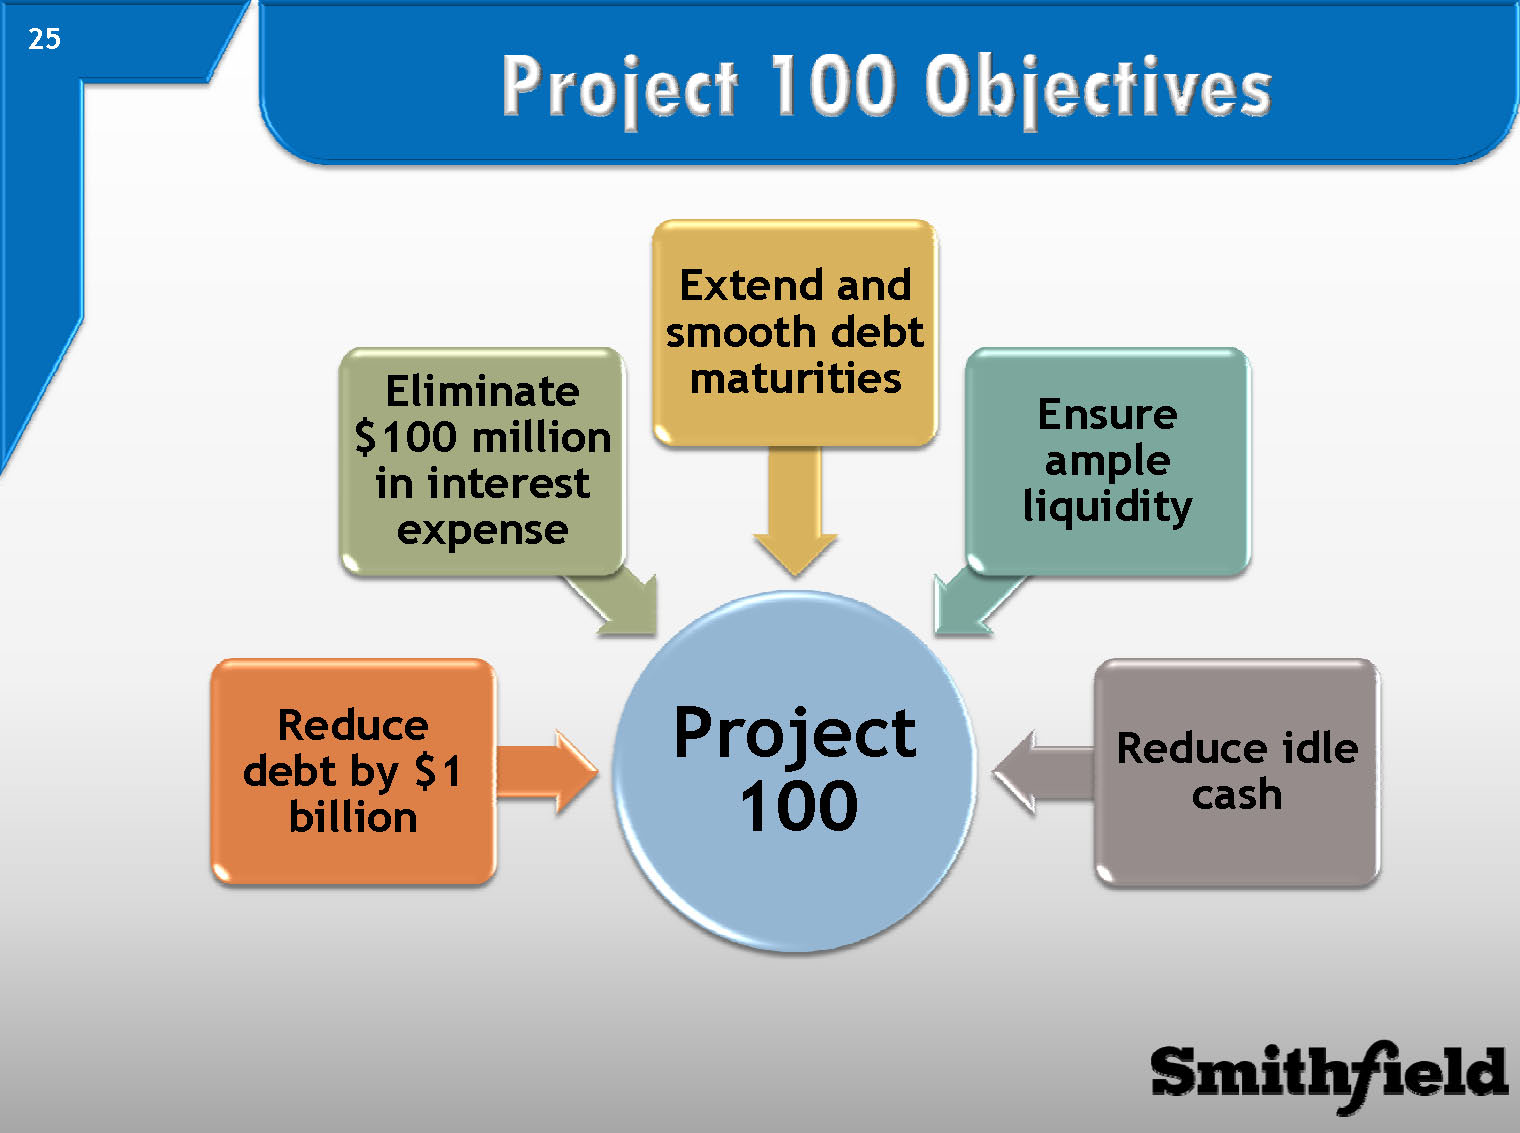
Project 100 Objectives
Project 100 Reduce debt by $1 billion Eliminate $100 million in interest exp ense Extend and smooth debt maturities Ensure ample liquidity Reduce idle cash
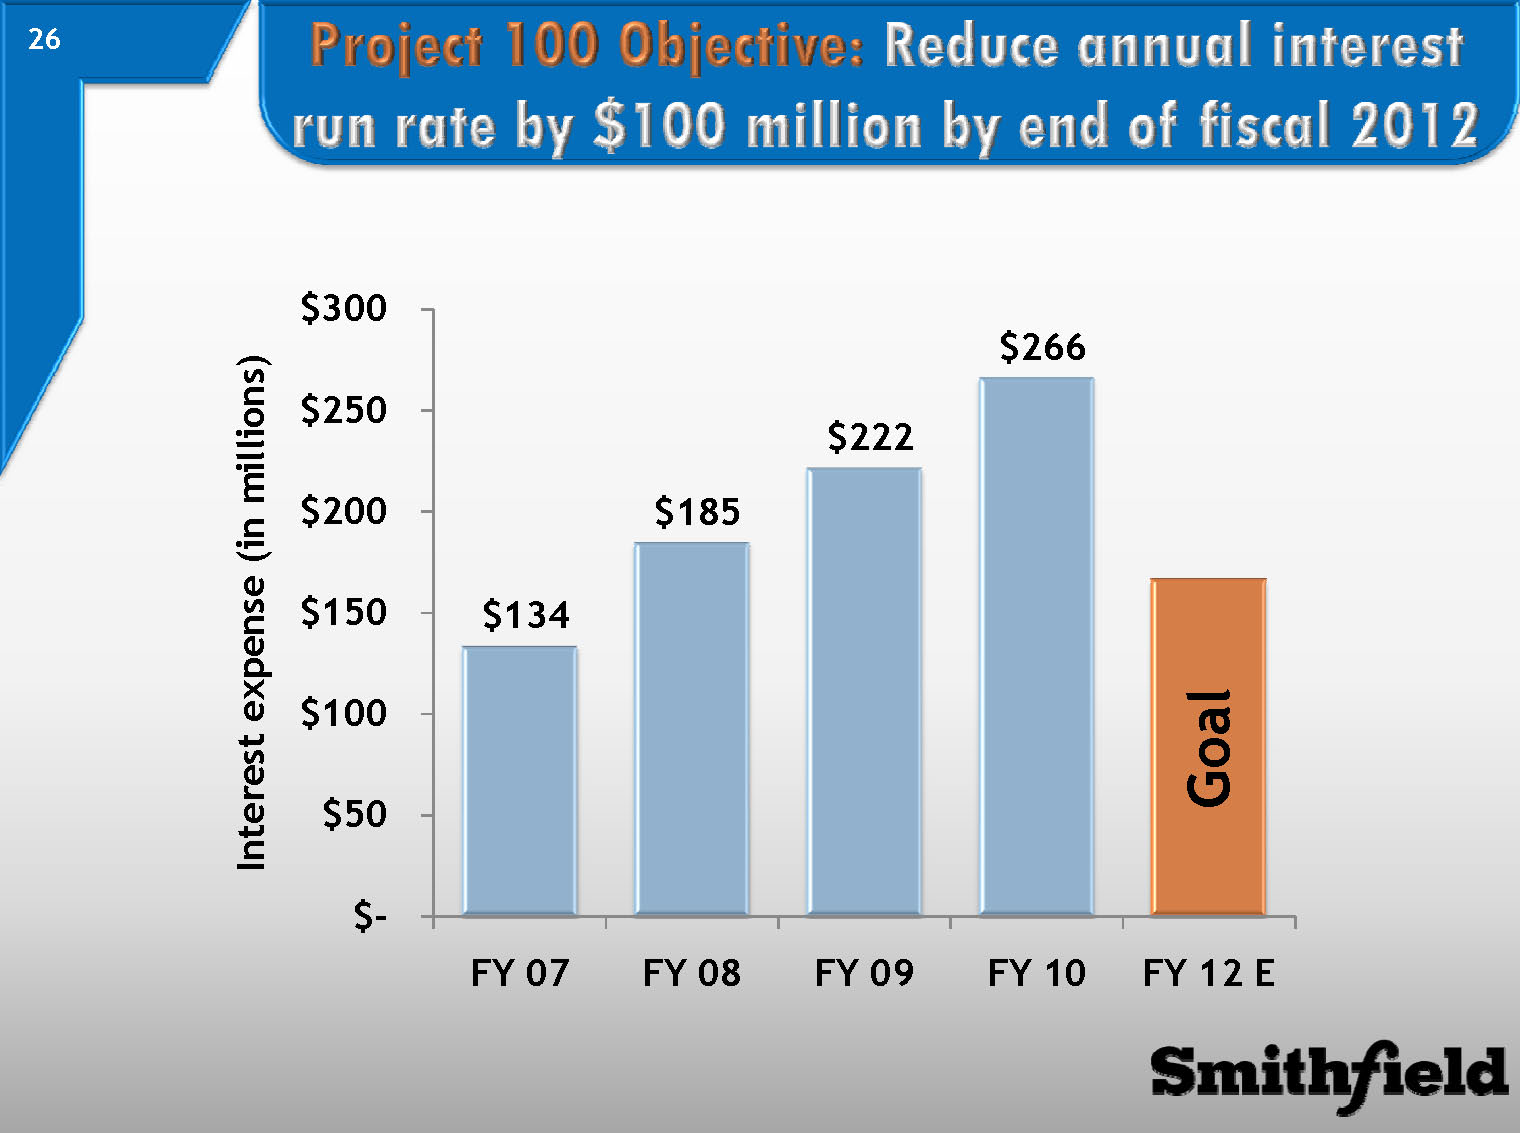
Project 100 Objective: Reduce annual interest run rate by $100 million by end of fiscal 2012
Interest expense (in millions)
FY 07 $134
FY 08 $185
FY 09 $222
FY 10 $266
FY 12 E Goal
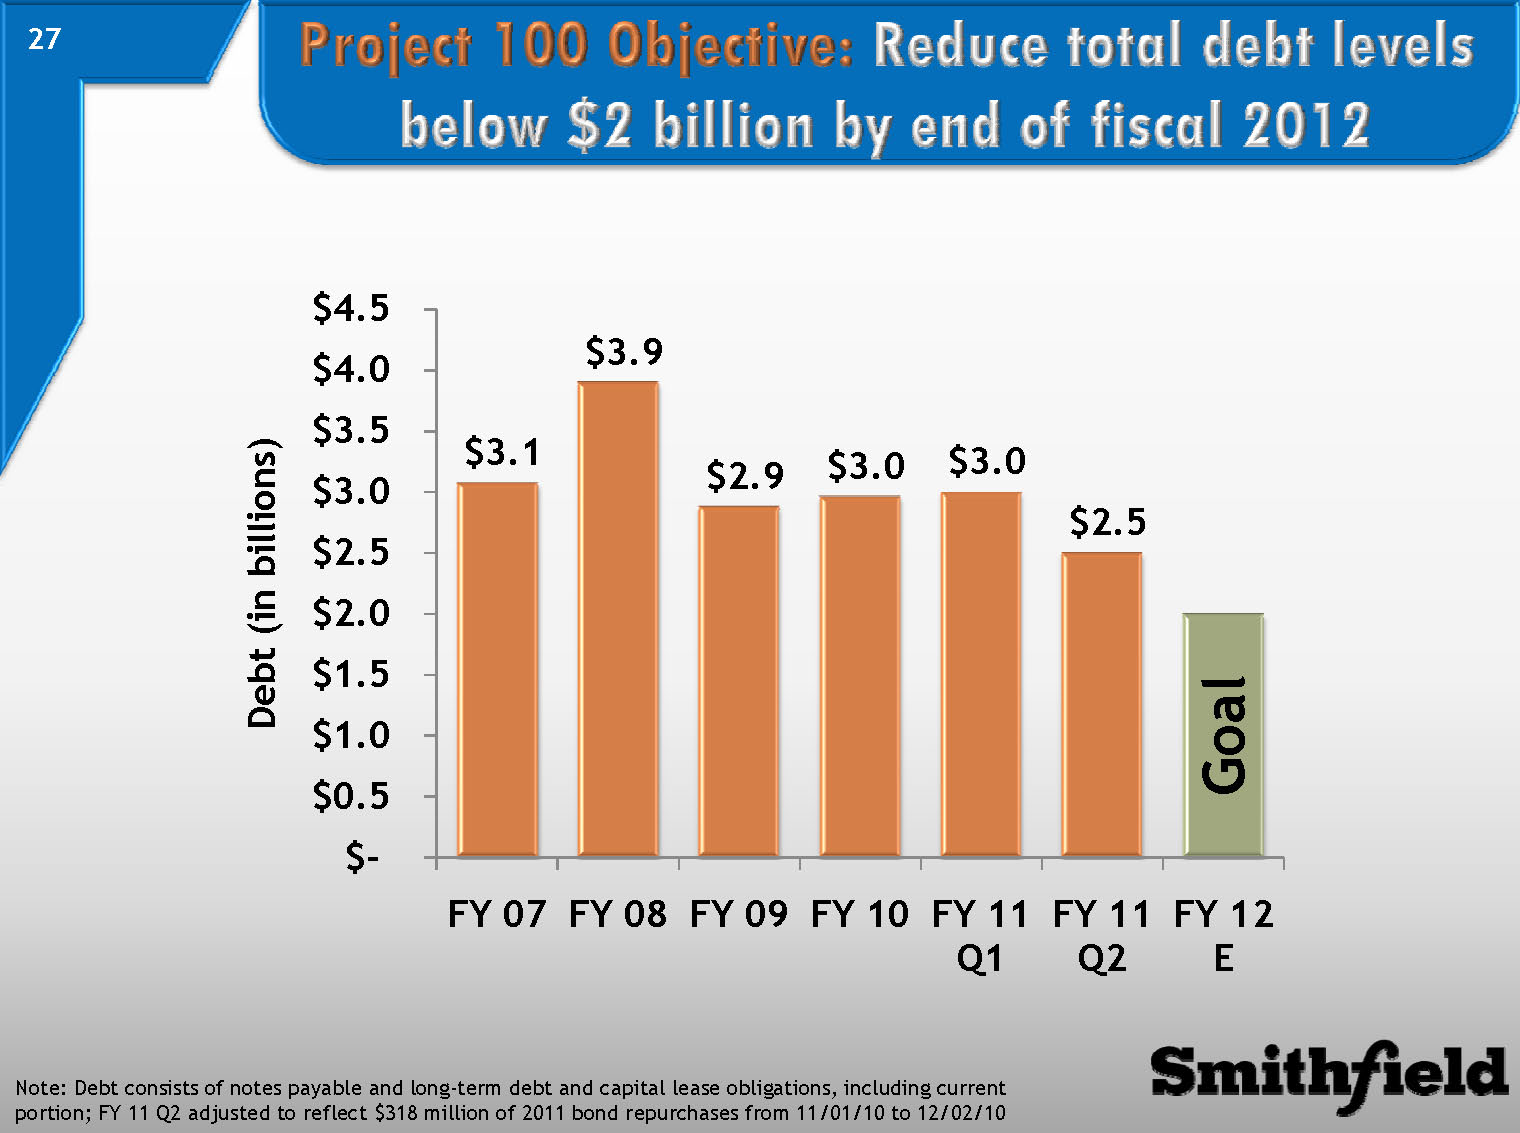
Project 100 Objective: Reduce total debt levels below $2 billion by end of fiscal 2012
Note: Debt consists of notes payable and l ong-term debt and capital lease obligations, including current
portion; FY 11 Q2 adjusted to reflect $318 million of 2011 bond repurchases from 11/01/10 to 12/02/10
Debt (in billions)
FY 07 $3.1
FY 08 $3.9
FY 09 $2.9
FY 10 $3.0
FY 11 $3.0
Q1 FY 11 $2.5
Q2 FY 12 E Goal
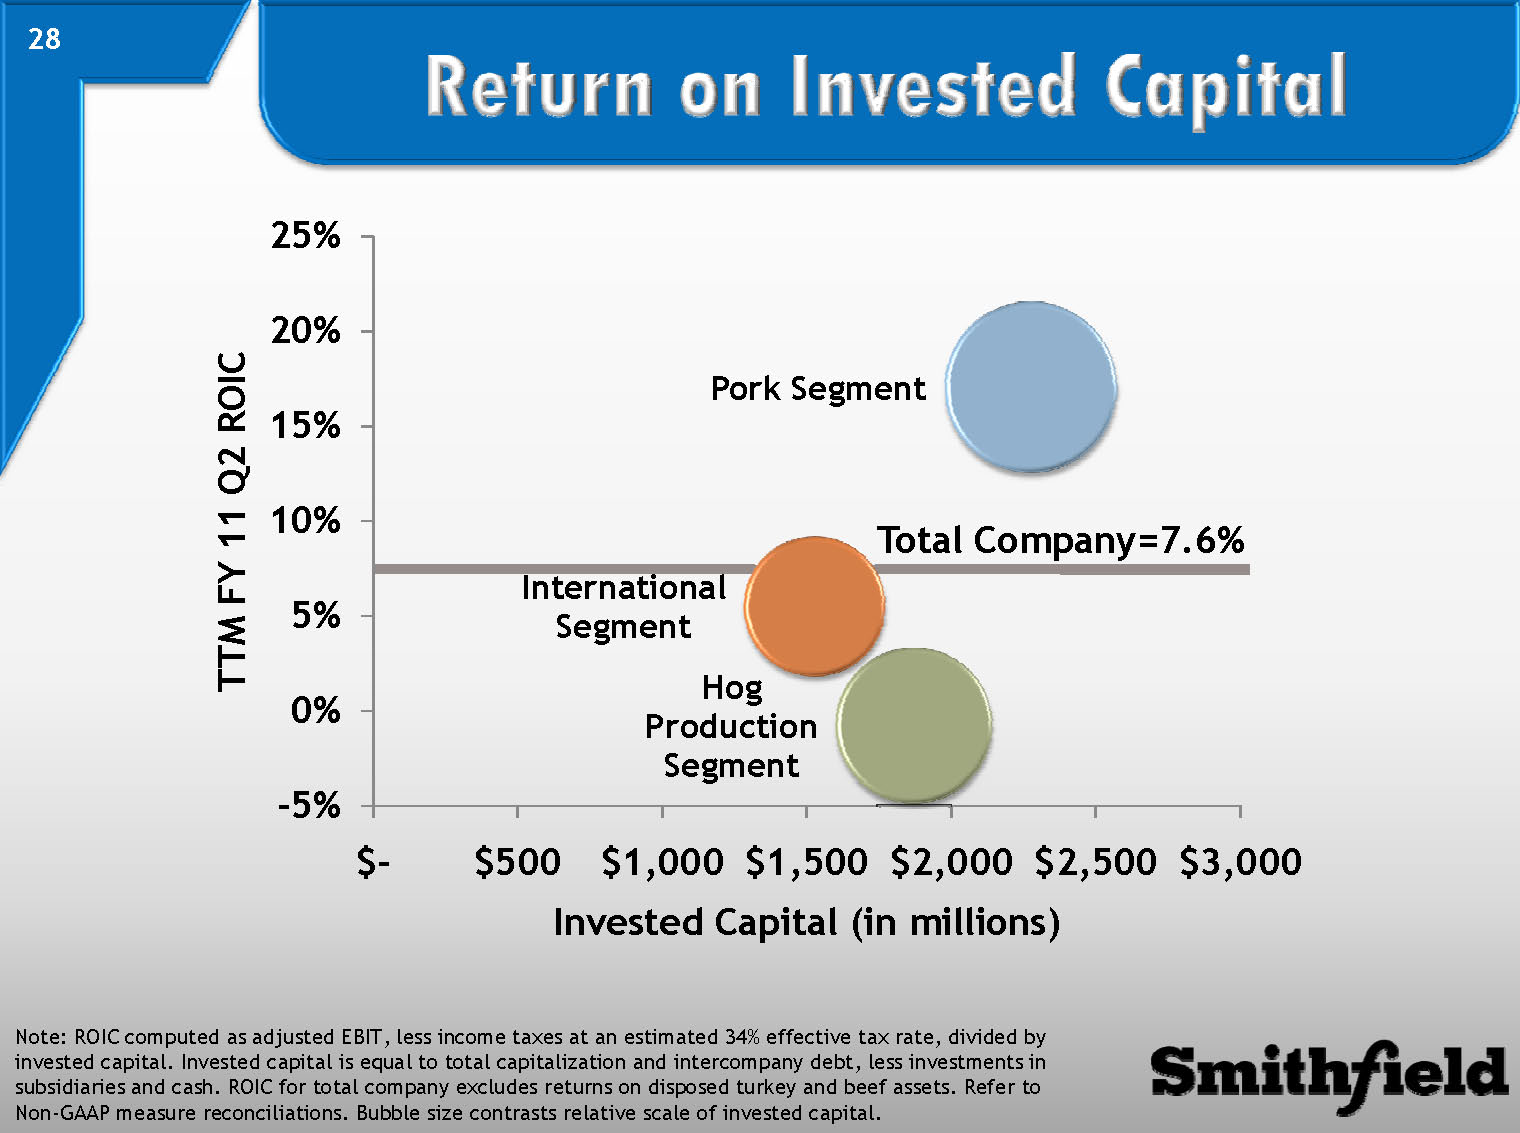
Return on Invested Capital
Note: ROIC computed as adjusted EBIT, less income taxes at an estimated 34% effective tax rate, divided by
invested capital. Invested capital is equal to total capitalization and intercompany debt, less investments in
subsidiaries and cash. ROIC for total company excludes returns on disposed turkey and beef assets. Refer to
Non-GAAP measure reconciliations. Bubble size contrasts relative scale of invested capital.
TTM FY 11 Q2 ROIC Invested Capital (in millions)
Total Company=7.6%
Pork Segment International SegmentHog Production Segment
Market Dynamics
Fundamentals Remain Strong
oFresh pork margins remain robust
oExport demand strong
oPork cold storage levels relatively flat
Company expects profitability in Hog Production segment in fiscal 2011 and beyond
oRaising costs in the mid-$50’s per hundredweight in fiscal 2011, despite higher grain prices
oTotal breeding herd historically low
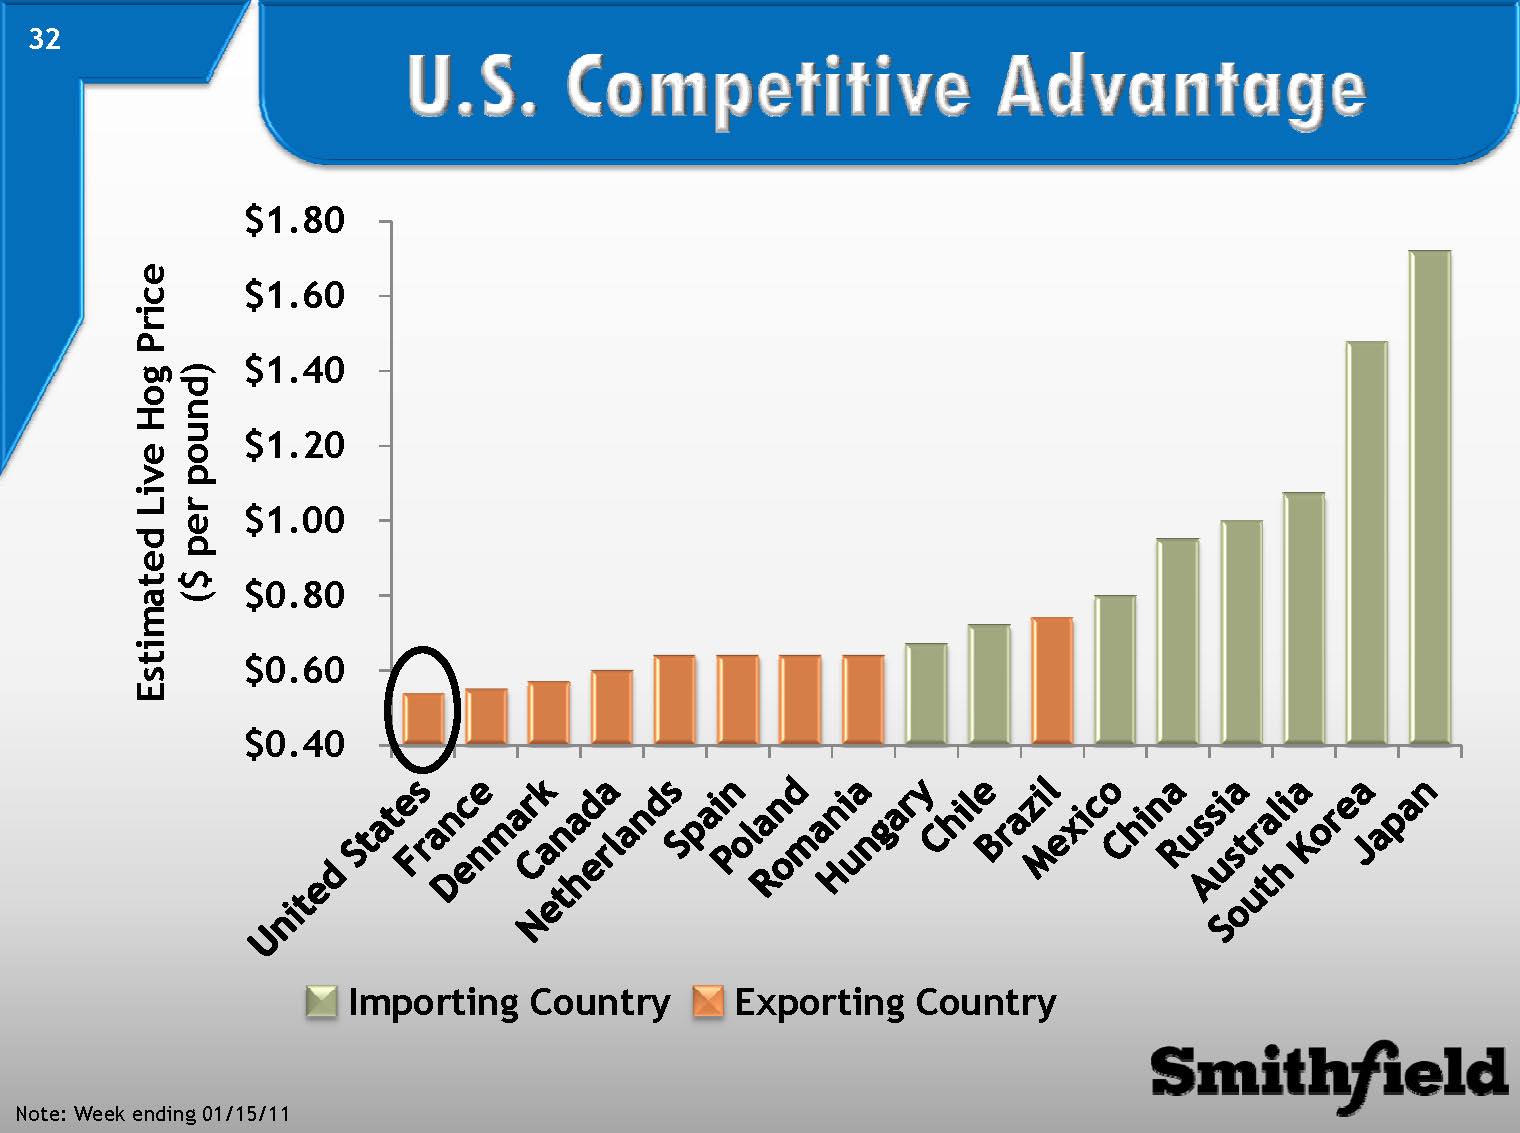
U.S. Is Most Competitive Exporter
U.S. Competitive Advantage
Note: Week ending 01/15/11
Estimated Live Hog Price ($ per pound)
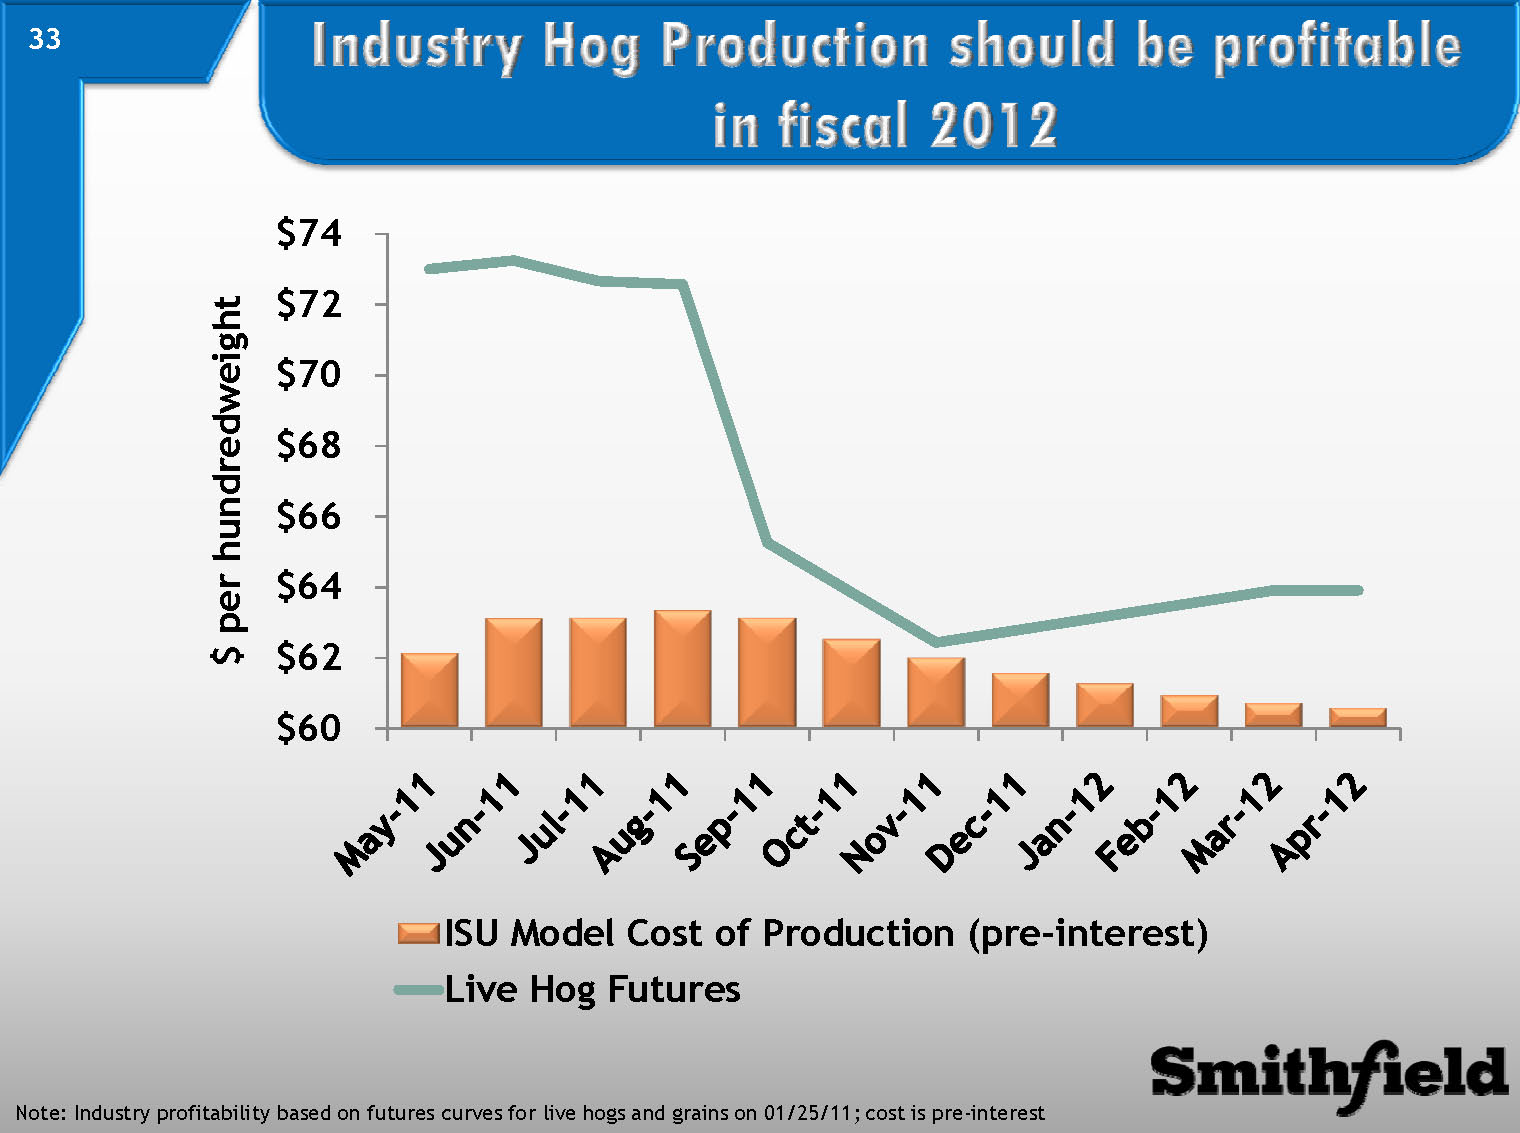
Industry Hog Production should be profitable in fiscal 2012
$ per hundredweightISU Model Cost of Production (pre-interest)
Note: Industry profitability based on futures curves for live hogs and grains on 01/25/11; cost is pre-interest
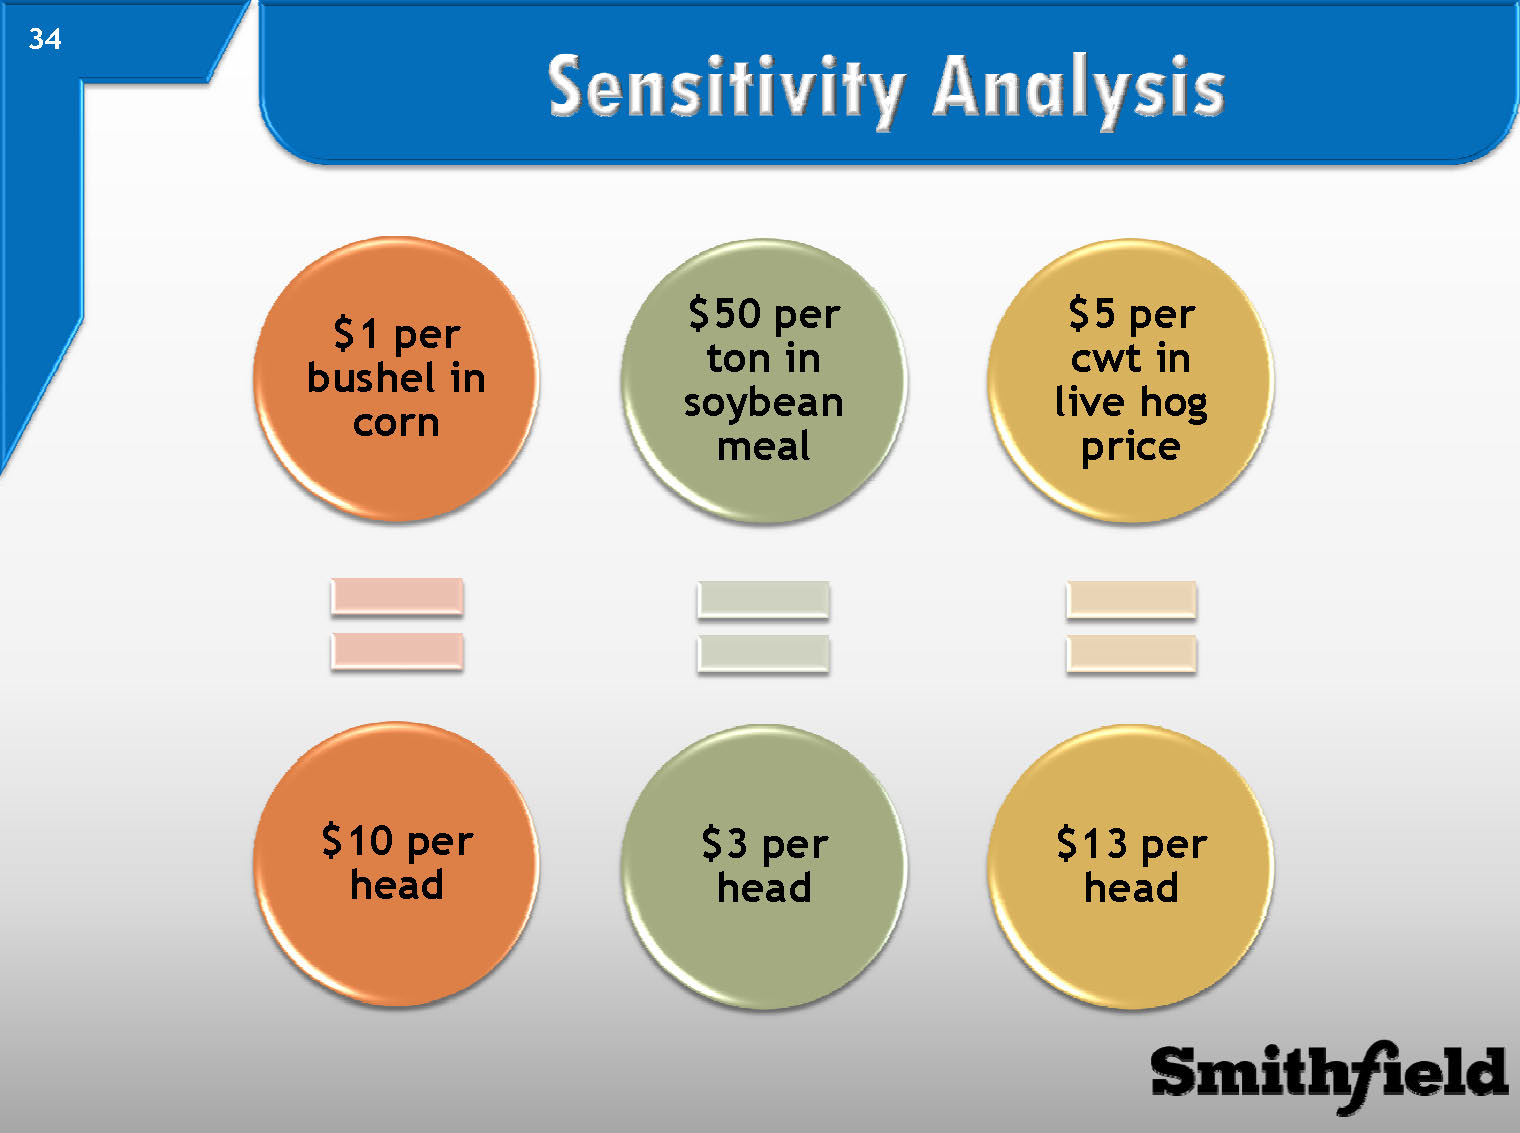
Sensitivity Analysis
$1 per bushel in corn = $10 per head
$50 per ton in soybean meal = $3 per head
$5 per cwt in live hog price = $13 per head
Conclusion
Conclusion
oThis is a New Era for Smithfield Foods
oSmithfield evolving to a Consumer Packaged Meat company
oRestructured Pork Segment has highly competitive cost structure driving profitability
oSales and marketing coordinated across all trade channels with focus on consolidated brand portfolio
oHog Production Cost Savings Init iative will improve cost structure by $90 million annually
oSmithfield continues to improve conservative balance sheet with focus on ROIC
Smithfield has growth opportunities in all business segments
Questions?
Appendix
#1 World Pork Processor
Smithfield31% Tyson19%JBS11%Excel9%Hormel7%Other23%(% of U.S. hogs processed)
TTMFY 11 Q2 Fresh Pork Packaged Meats Sales $4.4 billion $5.3 billion Volume 29 million hogs 2.8 billion pounds Operating Profit $181.2 million $385.0 million Normalized EBIT Range $3-7 per head 10 to 14 cents per pound
Note: TTM FY 11 Q2 sales (before inter-segment eliminations), volume and operating profit Source: United States Industry Data Successful Farming
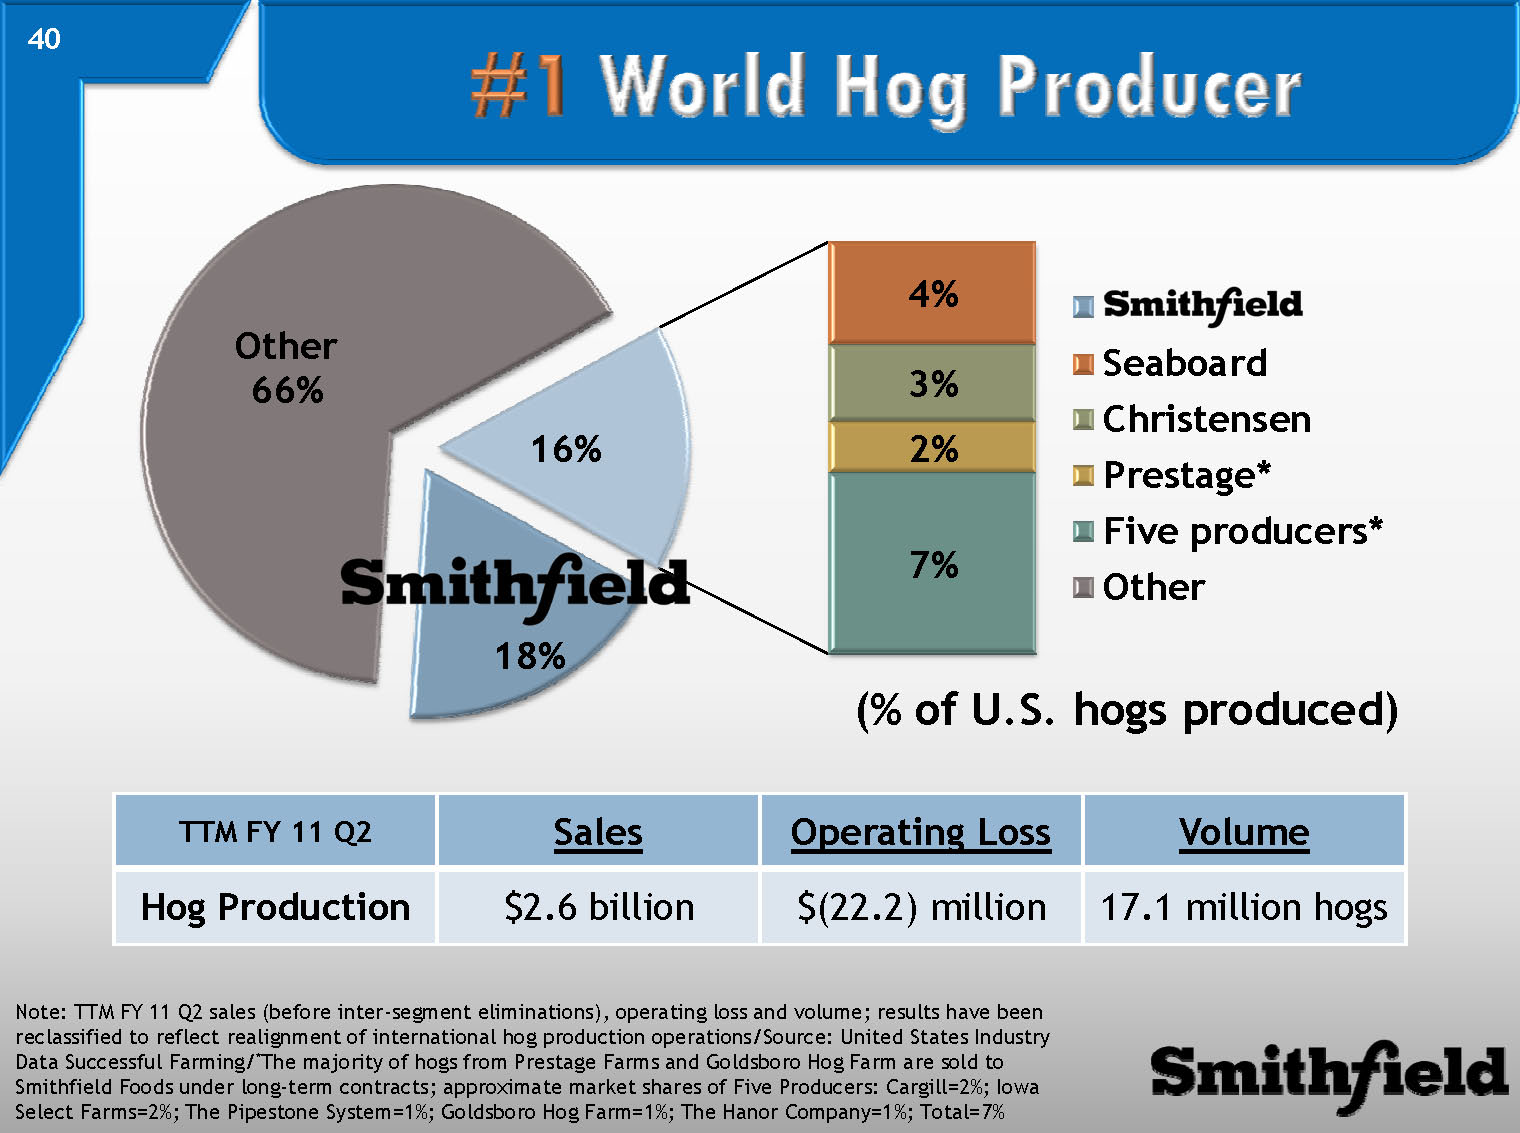
#1 World Hog Producer
(% of U.S. hogs produced) Other66%Smithfield18%Five producers*7%Seaboard4%Christensen3%Prestage*2%
TTMFY 11 Q2 Sales Operating Loss Volume HogProduction $2.6 billion $(22.2) million 17.1 million hogs
Note: TTM FY 11 Q2 sales (before inter-segment eliminations), operating loss and volume; results have been reclassified to reflect realignment of international hog production operations/Source: United States Industry Data Successful Farming/*The majority of hogs from Prestage Farms and Goldsboro Hog Farm are sold to Smithfield Foods under long-term contracts; approximate market shares of Five Producers: Cargill=2%; Iowa Select Farms=2%; The Pipestone System=1%; Goldsboro Hog Farm=1%; The HanorCompany=1%; Total=7%
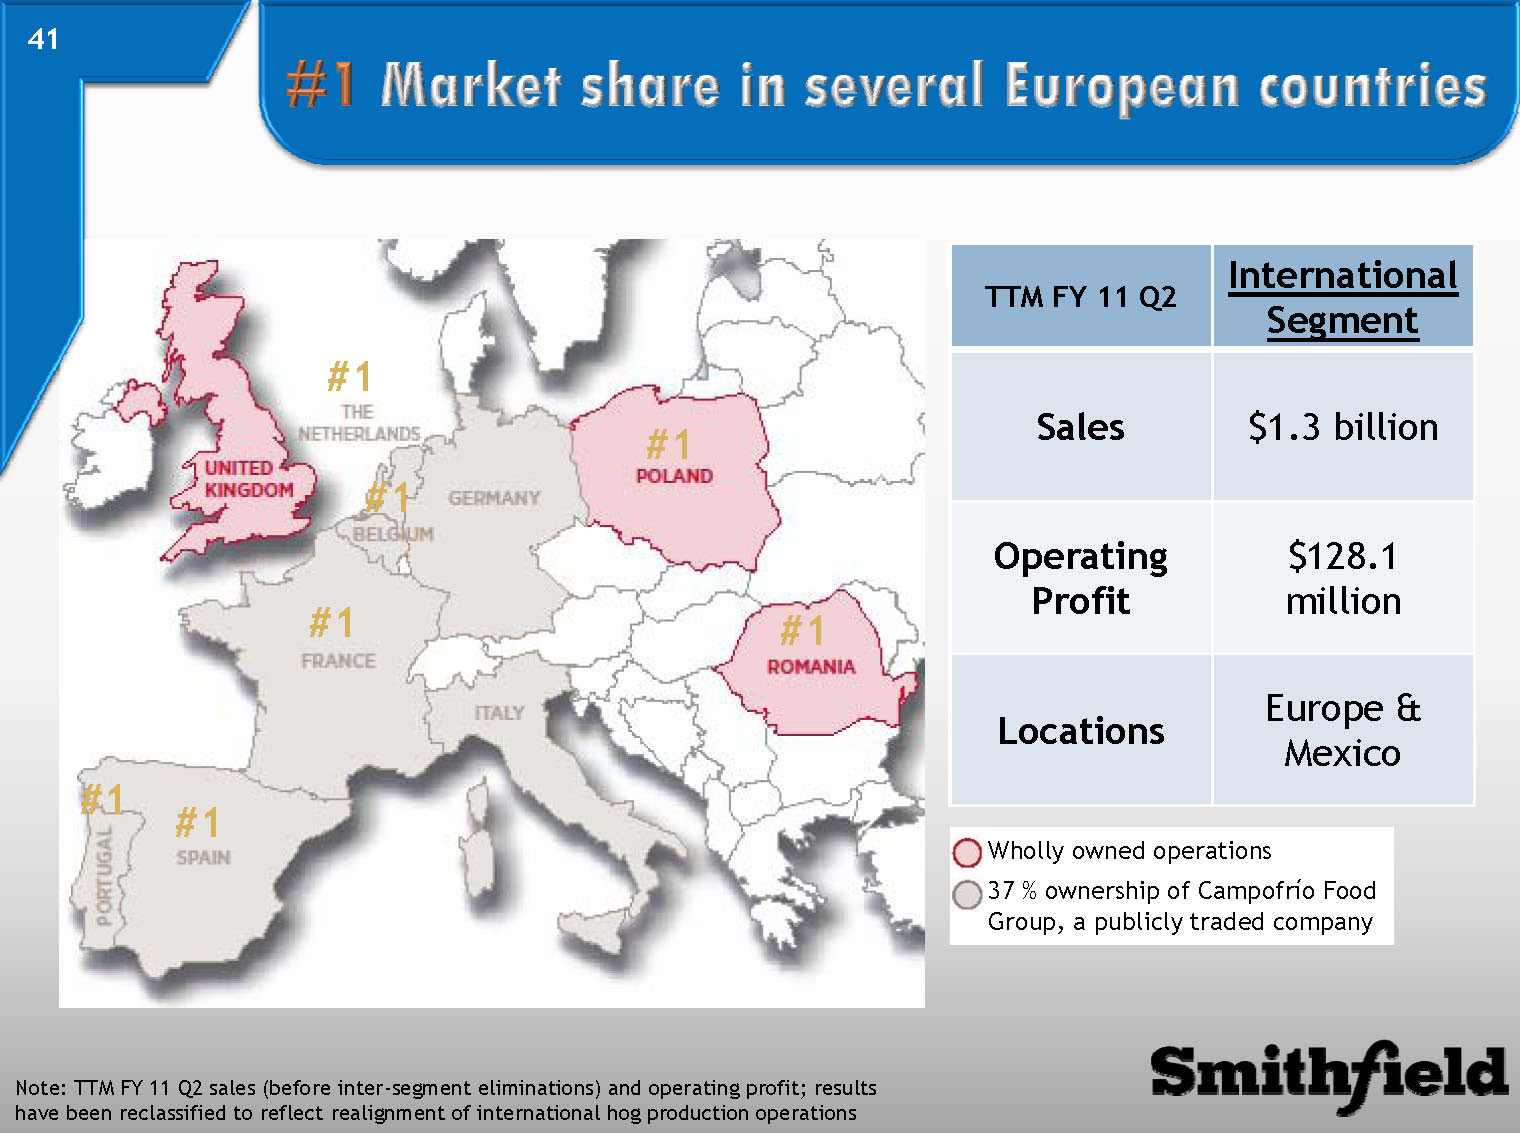
#1 Market share in several European countries
TTMFY 11 Q2 International Segment Sales $1.3billion Operating Profit $128.1 million Locations Europe & Mexico
Note: TTM FY 11 Q2 sales (before inter-segment eliminations) and operating profit; results have been reclassified to reflect realignment of international hog production operations
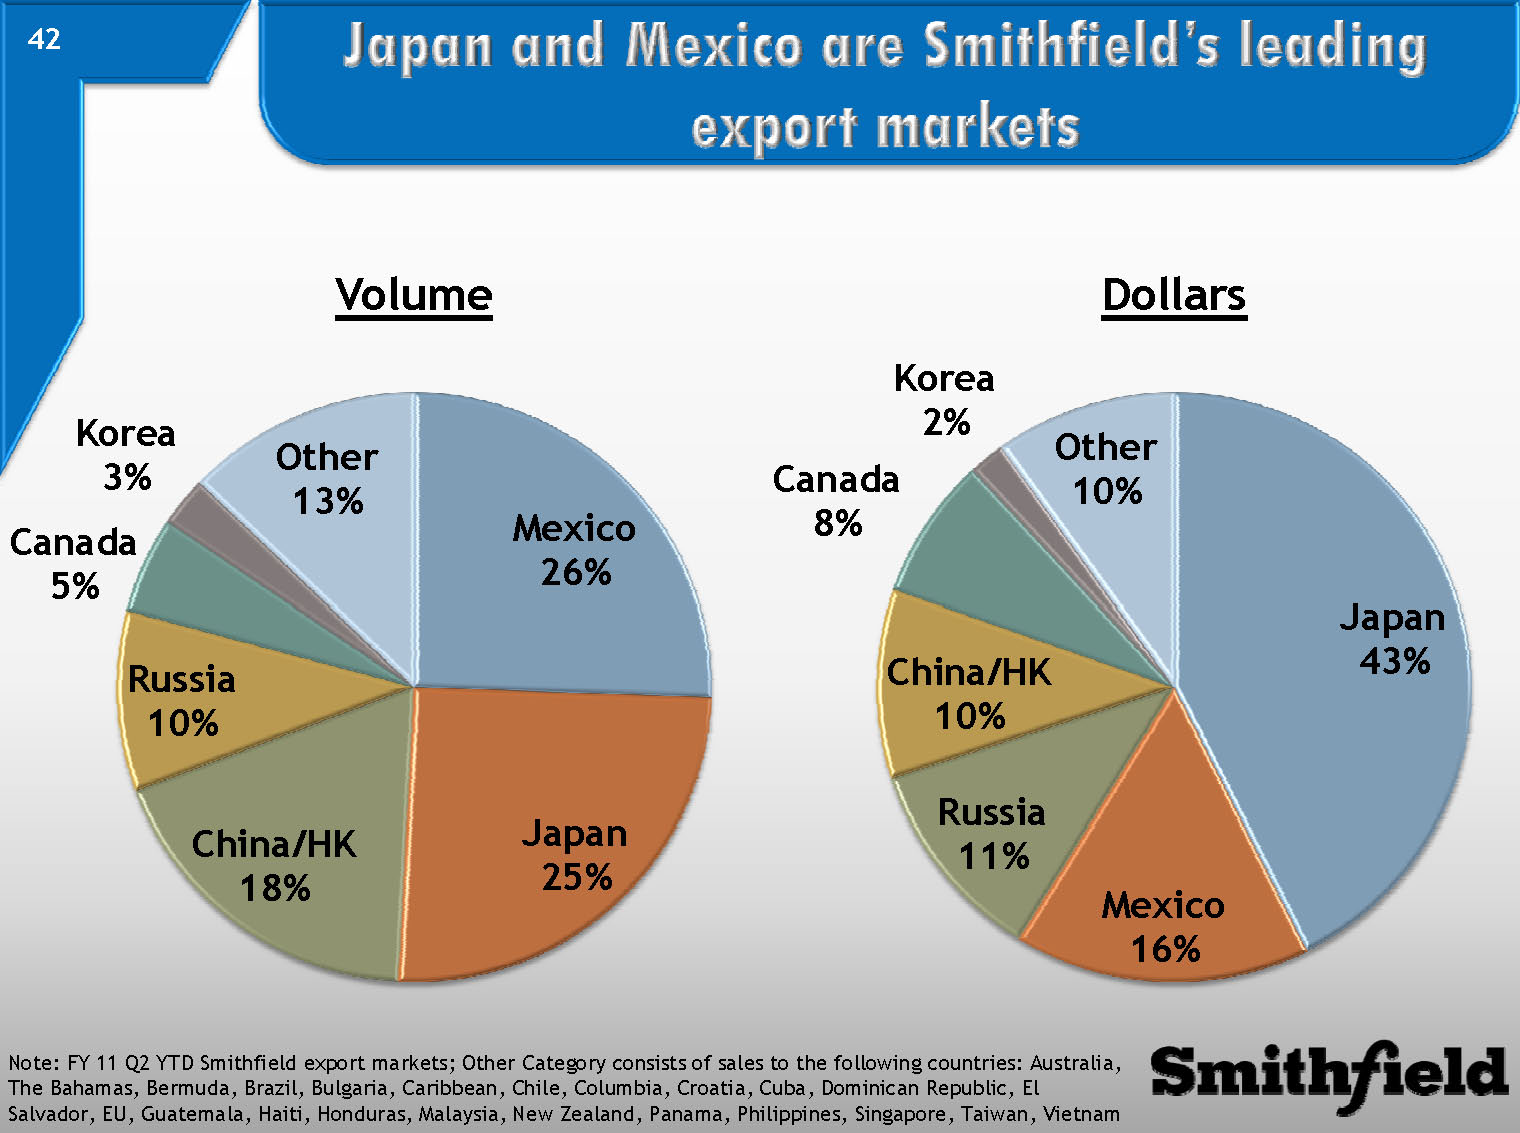
Japan and Mexico are Smithfield’s leading export markets
Volume Mexico26% Japan25% China/HK18% Russia10% Canada5% Korea3% Other13% DollarsJapan43% Mexico16% Russia11% China/HK10% Canada8% Korea2% Other10%
Note: FY 11 Q2 YTD Smithfield export markets; Other Category consists of sales to the following countries: A ustralia, The Bahamas, Bermuda, Brazil, Bulgaria, Caribbean, Chile, Columbia, Croatia, Cuba, Dominican Republic, El Salvador, EU, Guatemala, Haiti, Honduras, Malaysia, New Zealand, Panama, Philippines, Singapore, Taiwan, Vietnam
Smithfield Foods, Inc.