Addressing Investors’ Frequently Asked Questions C. Larry Pope President and Chief Executive Officer Robert W. Manly Executive Vice President and Chief Financial Officer
Forward-Looking Statements This presentation contains “forward-looking” statements within the meaning of the federal securities laws. The forward-looking statements include statements concerning the Company’s outlook for the future, as well as other statements of beliefs, future plans and strategies or anticipated events, and similar expressions concerning matters that are not historical facts. The Company’s forward-looking information and statements are subject to risks and uncertainties that could cause actual results to differ materially from those expressed in, or implied by, the statements. These risks and uncertainties include the availability and prices of live hogs, raw materials, fuel and supplies, food safety, livestock disease, live hog production costs, product pricing, the competitive environment and related market conditions, risks associated with our indebtedness, including cost increases due to rising interest rates or changes in debt ratings or outlook, hedging risk, operating efficiencies, changes in foreign currency exchange rates, access to capital, the cost of compliance with changes to regulations and laws, including changes in accounting standards, tax laws, environmental laws, agricultural laws and occupational, health and safety laws, adverse results from on-going litigation, actions of domestic and foreign governments, labor relations issues, credit exposure to large customers, the ability to make effective acquisitions and dispositions and successfully integrate newly acquired businesses into existing operations, the Company’s ability to effectively restructure portions of its operations and achieve cost savings from such restructurings and other risks and uncertainties described in the Company’s Annual Report on Form 10-K for fiscal 2011 and the Company’s Quarterly Report on Form 10-Q for the quarter ended October 30, 2011. Readers are cautioned not to place undue reliance on forward-looking statements because actual results may differ materially from those expressed in, or implied by, the statements. Any forward-looking statement that the Company makes speaks only as of the date of such statement, and the Company undertakes no obligation to update any forward-looking statements, whether as a result of new information, future events or otherwise. Comparisons of results for current and any prior periods are not intended to express any future trends or indications of future performance, unless expressed as such, and should only be viewed as historical data. 3
What is Smithfield’s strategy for growth?
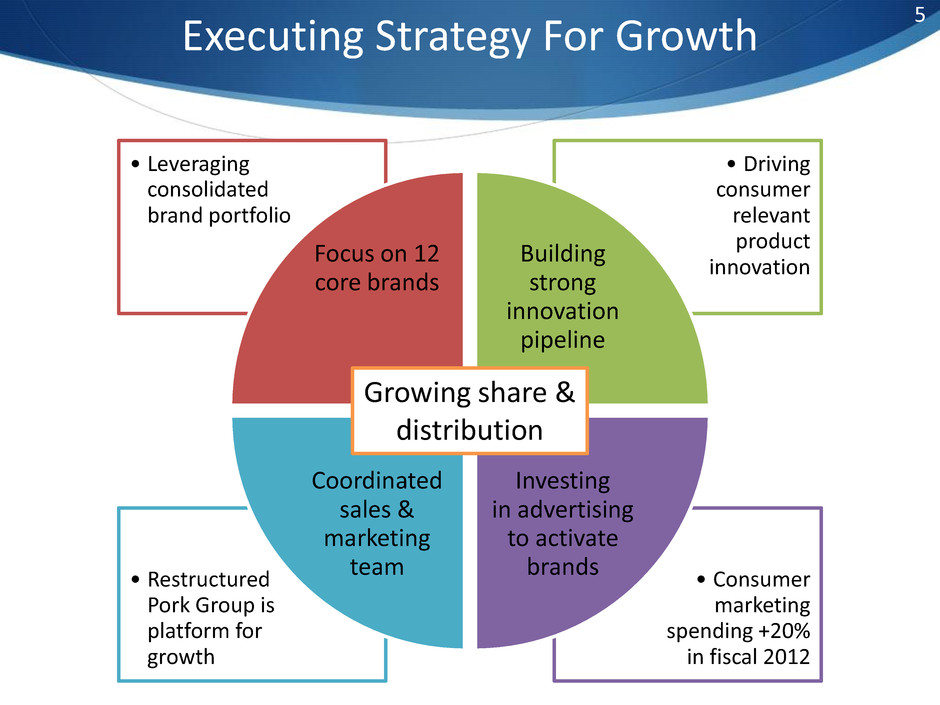
Executing Strategy For Growth • Consumer marketing spending +20% in fiscal 2012 • Restructured Pork Group is platform for growth • Driving consumer relevant product innovation • Leveraging consolidated brand portfolio Focus on 12 core brands Building strong innovation pipeline Investing in advertising to activate brands Coordinated sales & marketing team Growing share & distribution 5
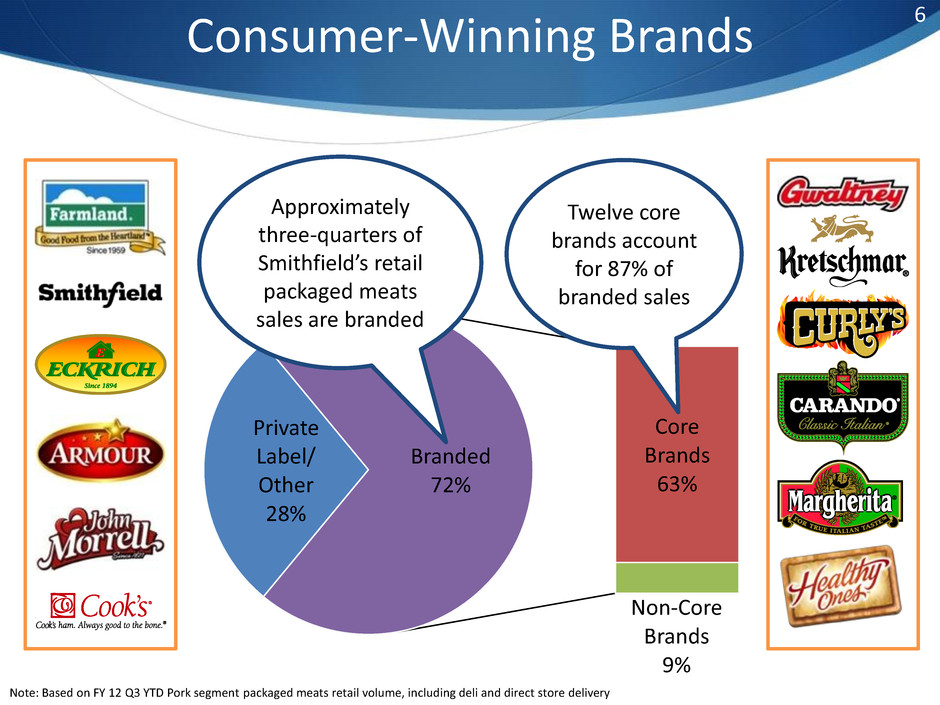
Consumer-Winning Brands Note: Based on FY 12 Q3 YTD Pork segment packaged meats retail volume, including deli and direct store delivery Private Label/ Other 28% Core Brands 63% Non-Core Brands 9% Branded 72% Approximately three-quarters of Smithfield’s retail packaged meats sales are branded Twelve core brands account for 87% of branded sales 6
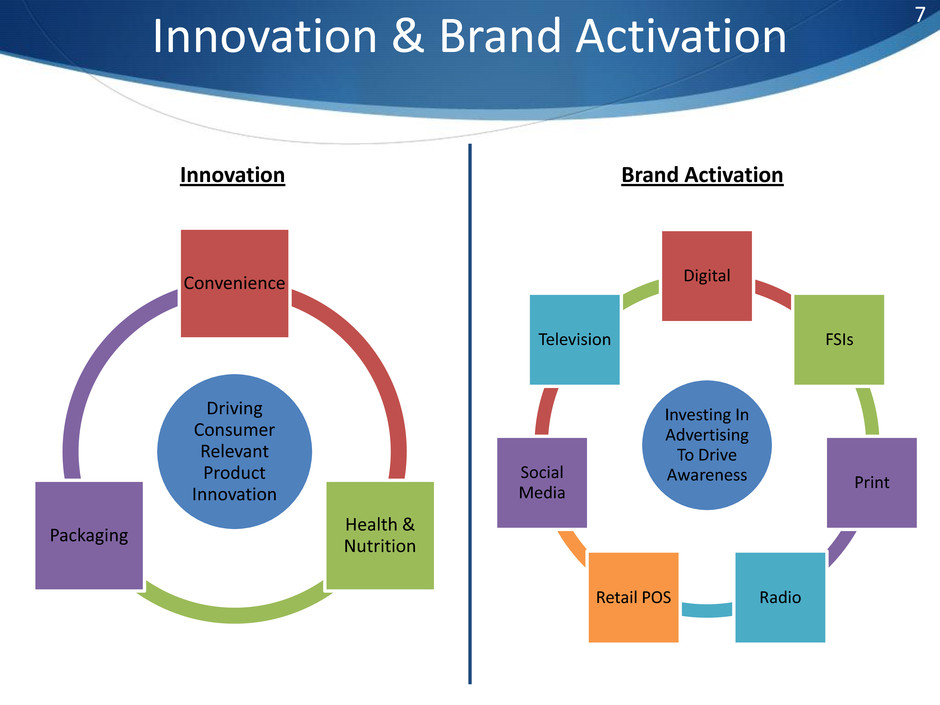
Innovation & Brand Activation Driving Consumer Relevant Product Innovation Convenience Health & Nutrition Packaging Investing In Advertising To Drive Awareness Digital FSIs Print Radio Retail POS Social Media Television Innovation Brand Activation 7
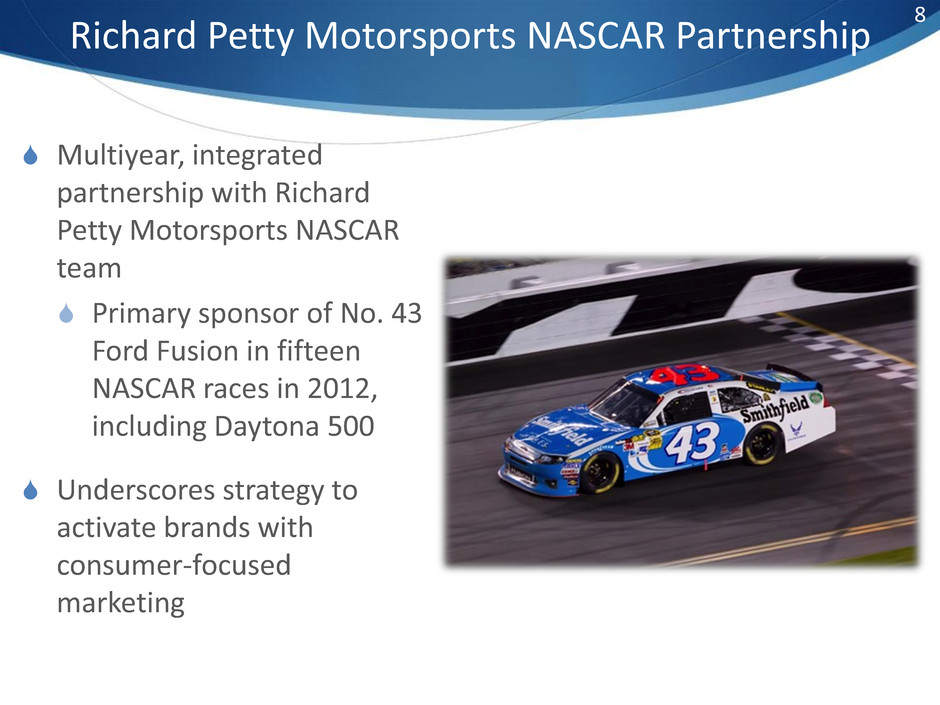
8 Richard Petty Motorsports NASCAR Partnership Multiyear, integrated partnership with Richard Petty Motorsports NASCAR team Primary sponsor of No. 43 Ford Fusion in fifteen NASCAR races in 2012, including Daytona 500 Underscores strategy to activate brands with consumer-focused marketing

9 Smithfield Innovation Center New 37,000 square foot R&D facility houses Innovation Center and Pilot Plant Three specialized state-of-the- art kitchens Dedicated product cutting room Multimedia technologies throughout USDA inspected pilot plant simulates full-scale manufacturing processes Co-development of prototypes with key customers Quick product modifications for speed to market

Health & Nutrition Platform • Consumers demand great taste with less sodium for healthier lifestyle • Made with all-natural sodium replacer • Patented technology • Tastes and functions like salt Key Lower-Sodium Products • All Healthy Ones Retail and Deli Products • Armour Retail Lower-Sodium Pepperoni • Margherita Deli Lower-Sodium Pepperoni • Eckrich Deli Lower-Sodium Hard Salami • John Morrell Lower-Sodium Bacon 10 Lower-Sodium Products Strategy Over 100 lower-sodium SKUs across all channels Increase from approximately 75-80 last year Health & Nutrition
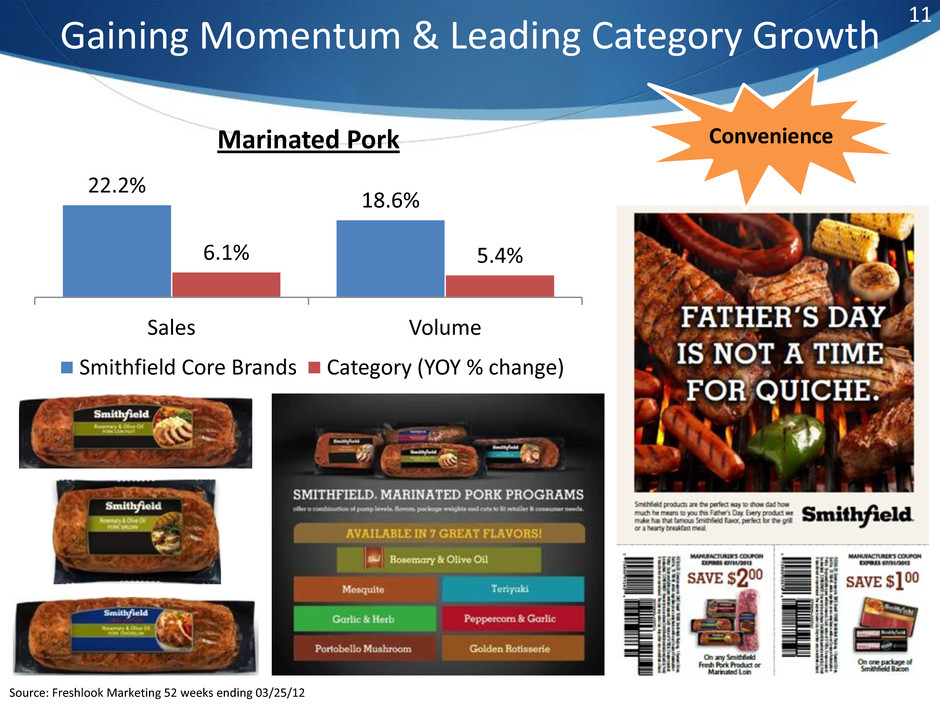
11 Gaining Momentum & Leading Category Growth 22.2% 18.6% 6.1% 5.4% Sales Volume Marinated Pork Smithfield Core Brands Category (YOY % change) Source: Freshlook Marketing 52 weeks ending 03/25/12 Convenience

12 Bacon Innovation Driving Success What Consumers’ Want… …Smithfield PouchPack Delivers Consumers want fresh bacon = Only bacon package to offer two individually sealed, perforated pouches that provide fresh bacon now and later 75% of consumers have leftover uncooked bacon = Six slices in each pouch is perfect portion for average consumer Current packaging is messy and doesn’t keep bacon fresh = E-Z peel opening and stacked bacon make it neat and easy to get to fresh bacon 23.1% 10.8% 8.4% -3.4% Sales Volume Uncooked Bacon Smithfield Core Brands Category (YOY % change) Source: Information Resources, Inc. (IRI) 52 weeks ending 03/25/12 Packaging
What is happening in the fresh pork complex?
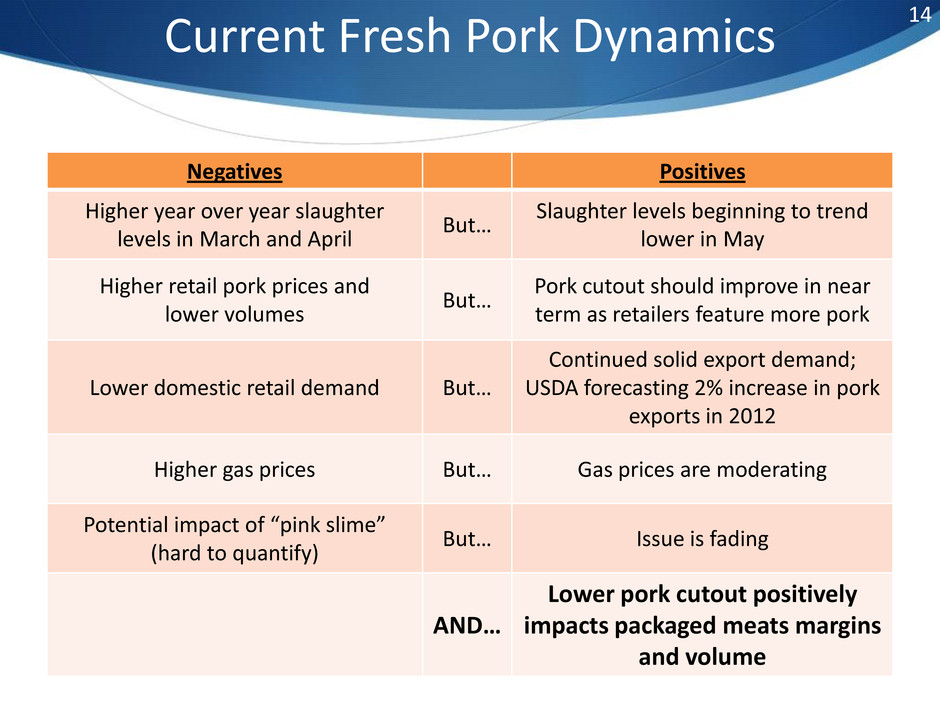
14 Current Fresh Pork Dynamics Negatives Positives Higher year over year slaughter levels in March and April But… Slaughter levels beginning to trend lower in May Higher retail pork prices and lower volumes But… Pork cutout should improve in near term as retailers feature more pork Lower domestic retail demand But… Continued solid export demand; USDA forecasting 2% increase in pork exports in 2012 Higher gas prices But… Gas prices are moderating Potential impact of “pink slime” (hard to quantify) But… Issue is fading AND… Lower pork cutout positively impacts packaged meats margins and volume
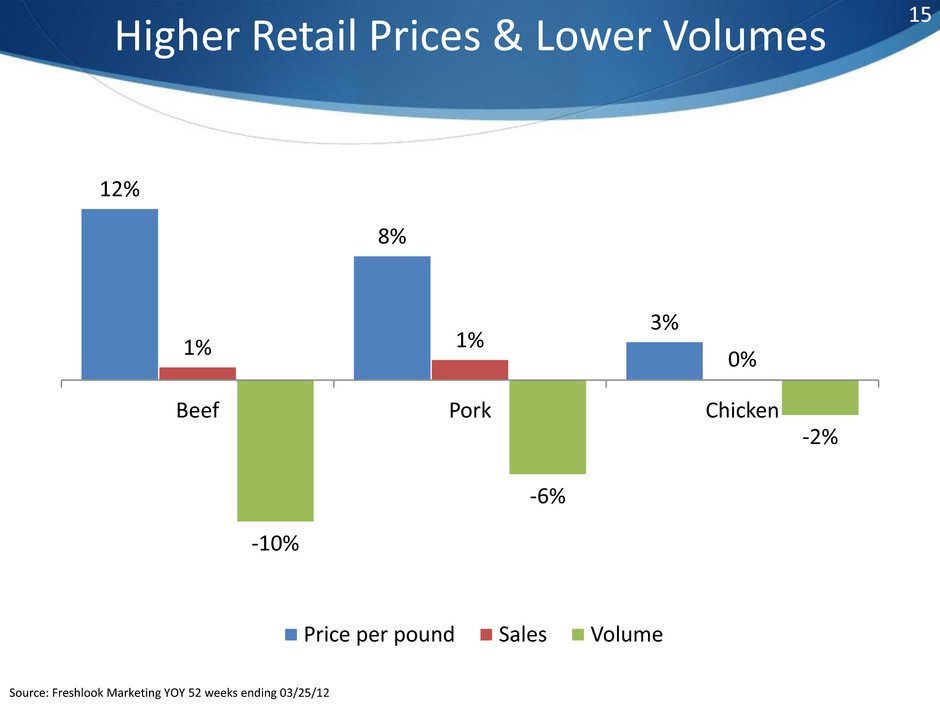
Higher Retail Prices & Lower Volumes 15 12% 8% 3% 1% 1% 0% -10% -6% -2% Beef Pork Chicken Price per pound Sales Volume Source: Freshlook Marketing YOY 52 weeks ending 03/25/12
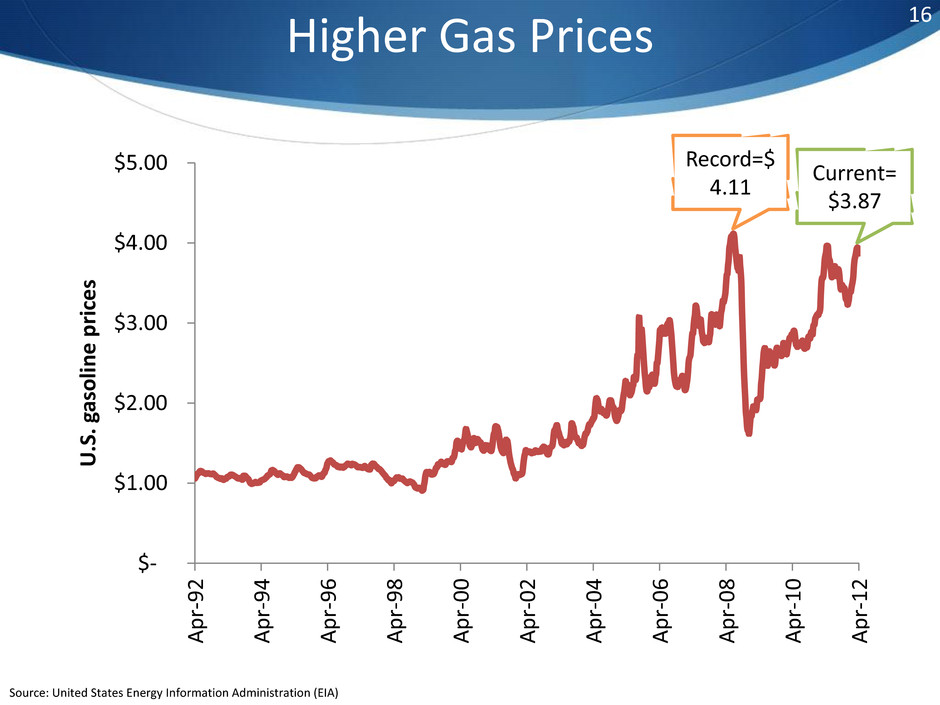
Higher Gas Prices $- $1.00 $2.00 $3.00 $4.00 $5.00 Ap r- 9 2 Ap r- 9 4 Ap r- 9 6 Ap r- 9 8 Ap r- 0 0 Ap r- 0 2 Ap r- 0 4 Ap r- 0 6 Ap r- 0 8 Ap r- 1 0 Ap r- 1 2 U .S. g as o lin e p ric e s Record=$ 4.11 Current= $3.87 16 Source: United States Energy Information Administration (EIA)
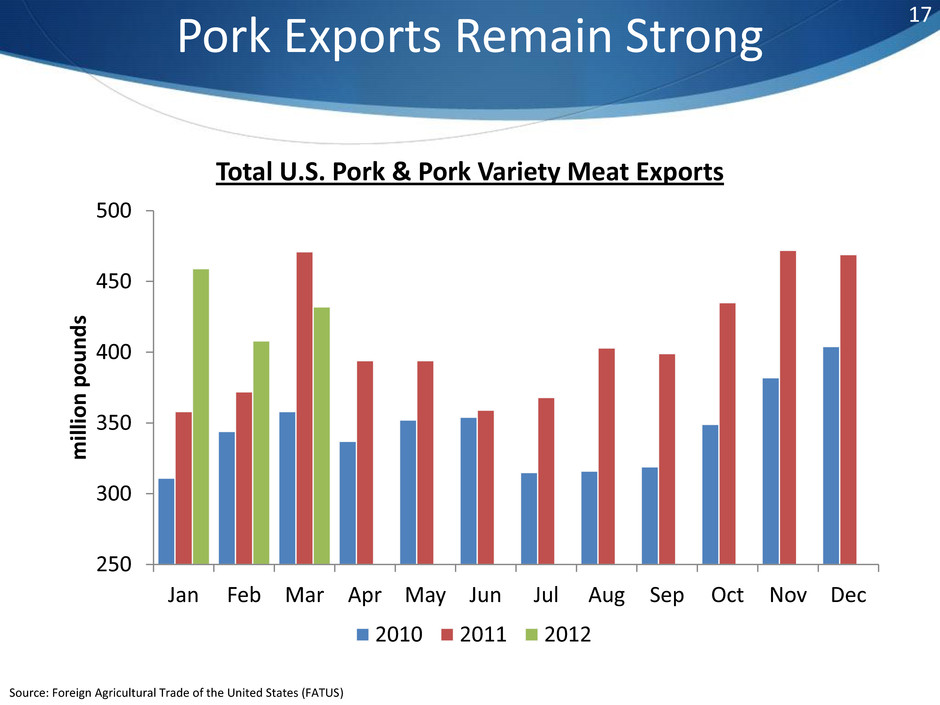
250 300 350 400 450 500 Jan Feb Mar Apr May Jun Jul Aug Sep Oct Nov Dec milli o n p o u n d s Total U.S. Pork & Pork Variety Meat Exports 2010 2011 2012 Source: Foreign Agricultural Trade of the United States (FATUS) Pork Exports Remain Strong 17
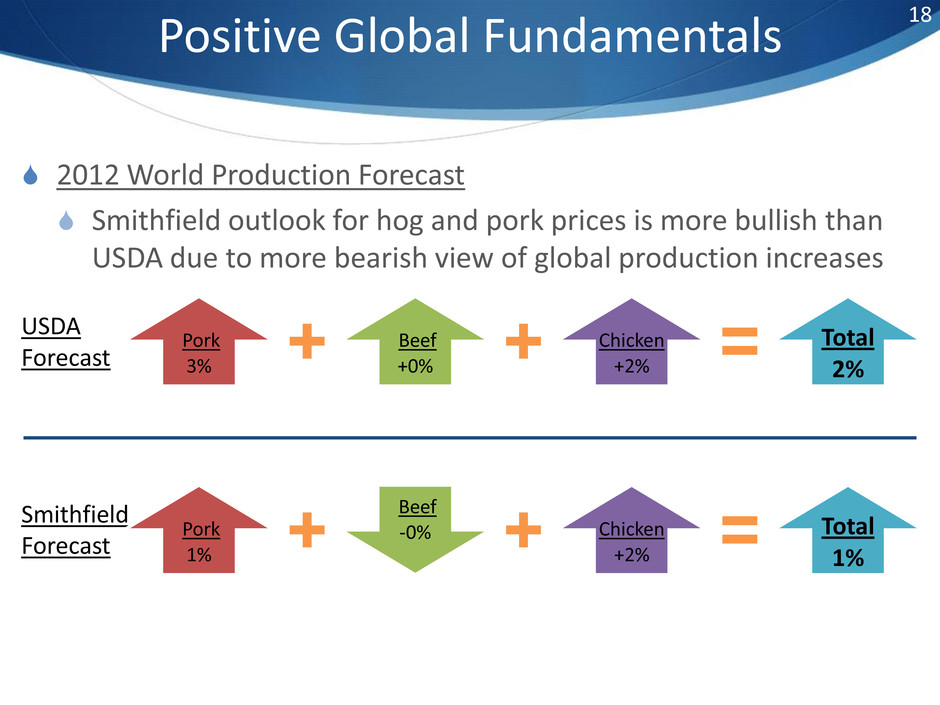
USDA Forecast Smithfield Forecast 18 Positive Global Fundamentals 2012 World Production Forecast Smithfield outlook for hog and pork prices is more bullish than USDA due to more bearish view of global production increases Pork 3% Beef +0% Chicken +2% Total 2% Pork 1% Beef -0% Chicken +2% Total 1%

19 U.S. & China Hog Prices $104 $60 $20 $40 $60 $80 $100 $120 $140 Jan-07 Jan-08 Jan-09 Jan-10 Jan-11 Jan-12 Li ve h og p ric e ( p e r h u n d re d w e ig h t) China U.S.

What are the company’s priorities for uses of excess cash?
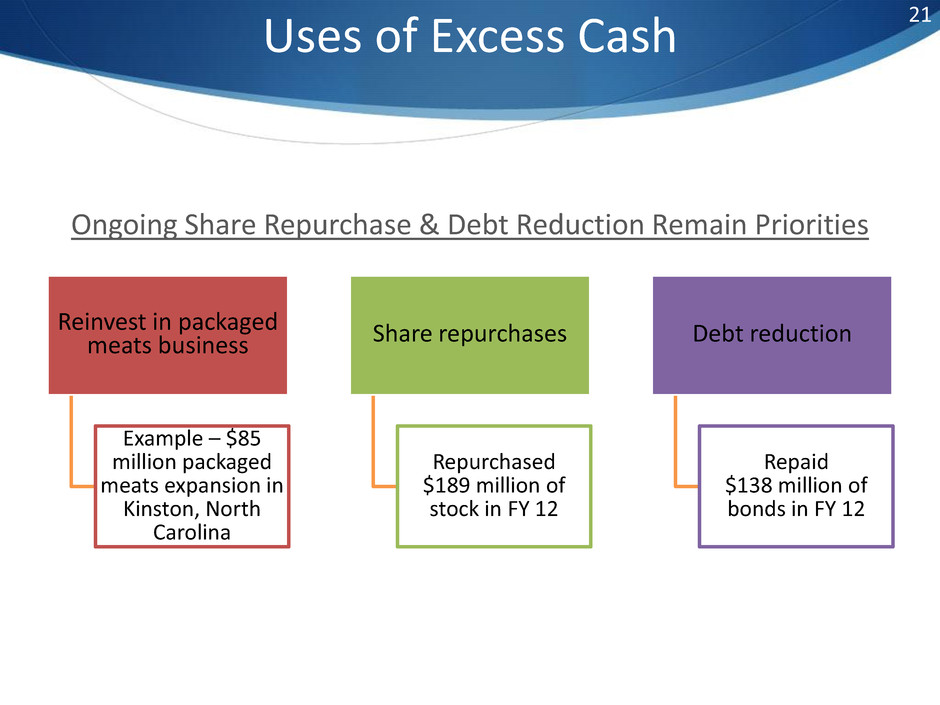
21 Uses of Excess Cash Ongoing Share Repurchase & Debt Reduction Remain Priorities Reinvest in packaged meats business Example – $85 million packaged meats expansion in Kinston, North Carolina Share repurchases Repurchased $189 million of stock in FY 12 Debt reduction Repaid $138 million of bonds in FY 12

Can Smithfield continue to consistently deliver solid earnings?
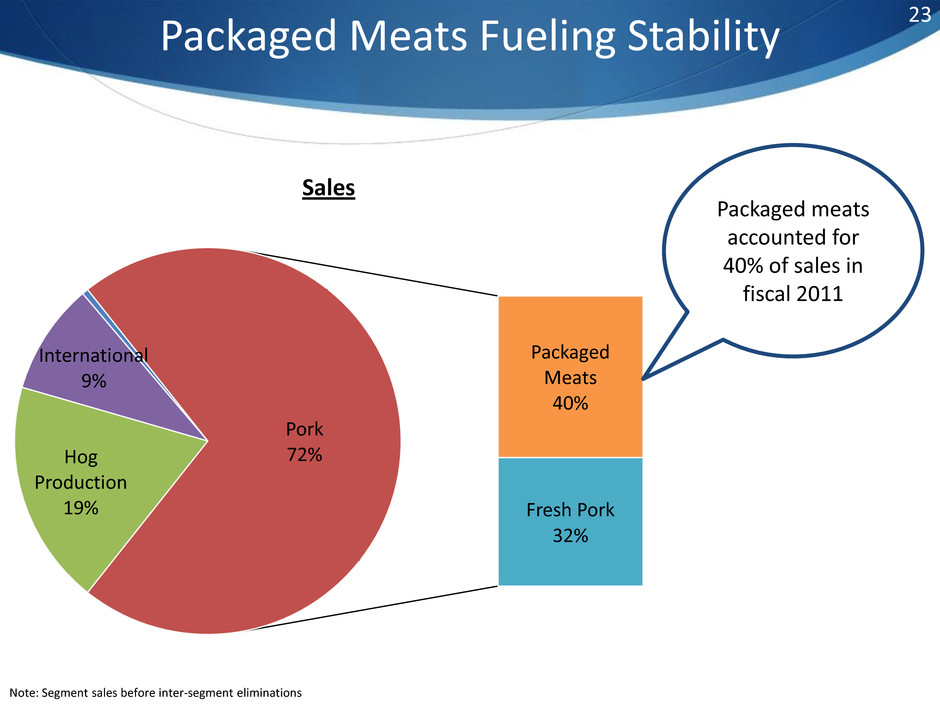
Packaged Meats Fueling Stability Note: Segment sales before inter-segment eliminations Hog Production 19% International 9% Packaged Meats 40% Fresh Pork 32% Pork 72% Sales Packaged meats accounted for 40% of sales in fiscal 2011 23
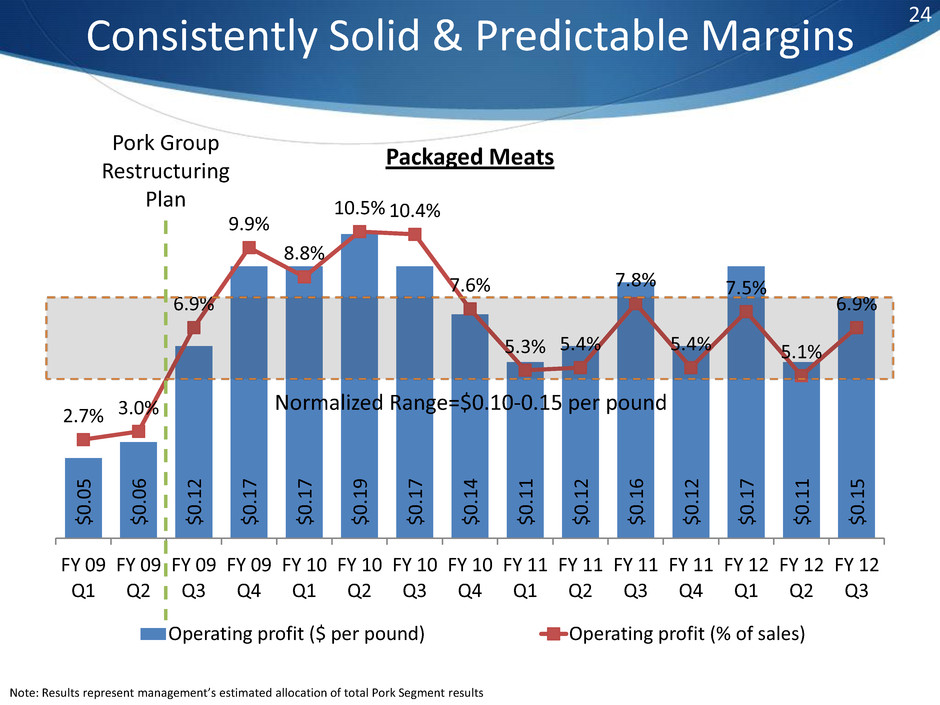
$ 0 .0 5 $ 0 .0 6 $ 0 .1 2 $ 0 .1 7 $ 0 .1 7 $ 0 .1 9 $ 0 .1 7 $ 0 .1 4 $ 0 .1 1 $ 0 .1 2 $ 0 .1 6 $ 0 .1 2 $ 0 .1 7 $ 0 .1 1 $ 0 .1 5 2.7% 3.0% 6.9% 9.9% 8.8% 10.5% 10.4% 7.6% 5.3% 5.4% 7.8% 5.4% 7.5% 5.1% 6.9% FY 09 Q1 FY 09 Q2 FY 09 Q3 FY 09 Q4 FY 10 Q1 FY 10 Q2 FY 10 Q3 FY 10 Q4 FY 11 Q1 FY 11 Q2 FY 11 Q3 FY 11 Q4 FY 12 Q1 FY 12 Q2 FY 12 Q3 Packaged Meats Operating profit ($ per pound) Operating profit (% of sales) Consistently Solid & Predictable Margins Note: Results represent management’s estimated allocation of total Pork Segment results Normalized Range=$0.10-0.15 per pound Pork Group Restructuring Plan 24
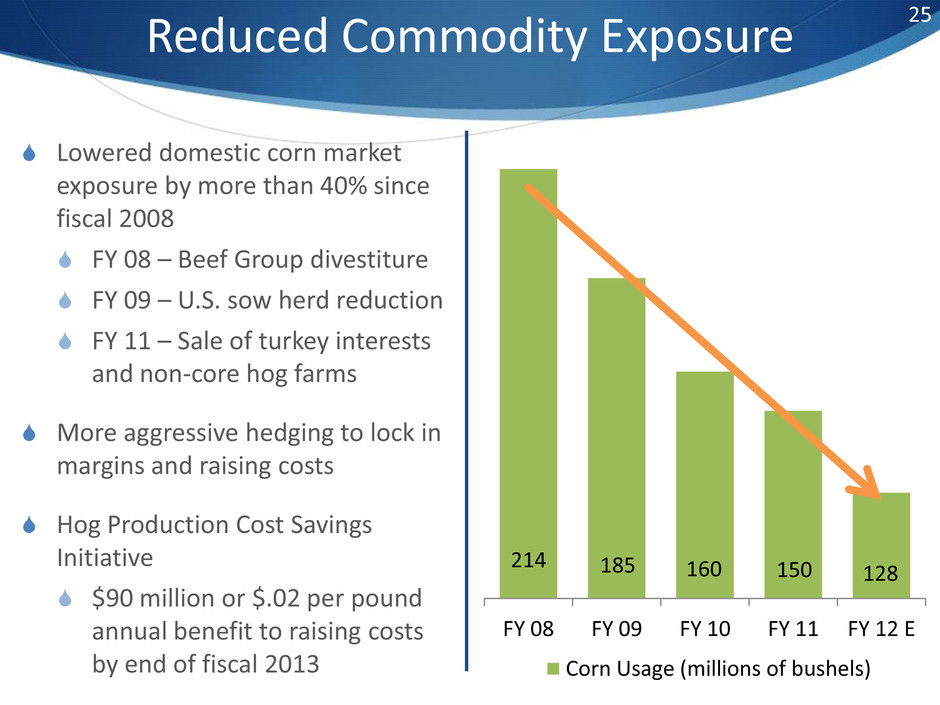
Reduced Commodity Exposure Lowered domestic corn market exposure by more than 40% since fiscal 2008 FY 08 – Beef Group divestiture FY 09 – U.S. sow herd reduction FY 11 – Sale of turkey interests and non-core hog farms More aggressive hedging to lock in margins and raising costs Hog Production Cost Savings Initiative $90 million or $.02 per pound annual benefit to raising costs by end of fiscal 2013 214 185 160 150 128 FY 08 FY 09 FY 10 FY 11 FY 12 E Corn Usage (millions of bushels) 25
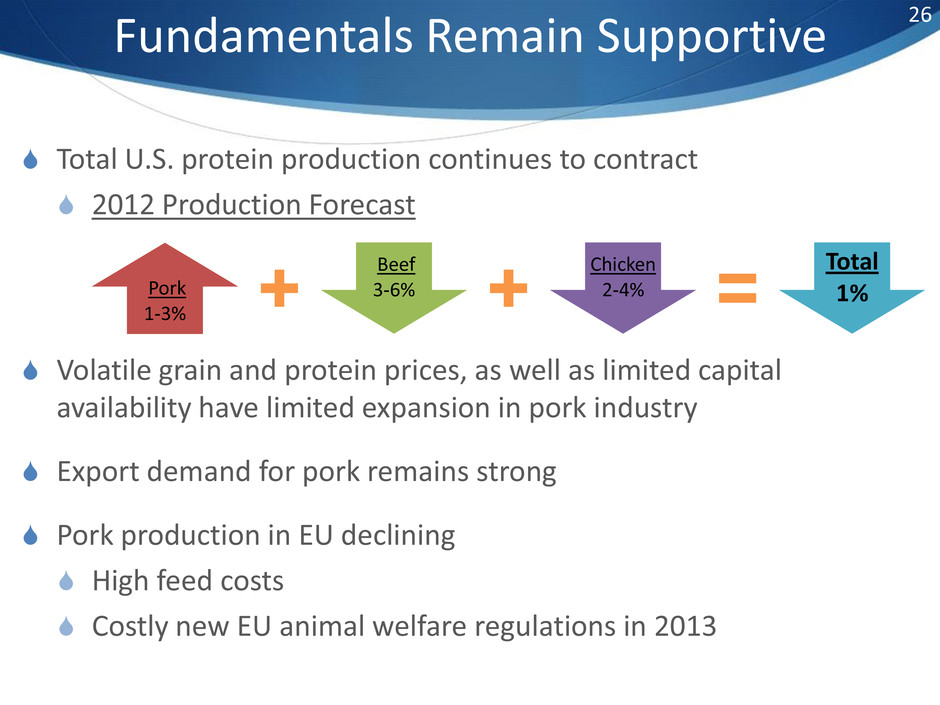
Fundamentals Remain Supportive Total U.S. protein production continues to contract 2012 Production Forecast Volatile grain and protein prices, as well as limited capital availability have limited expansion in pork industry Export demand for pork remains strong Pork production in EU declining High feed costs Costly new EU animal welfare regulations in 2013 Pork 1-3% Beef 3-6% Chicken 2-4% Total 1% 26
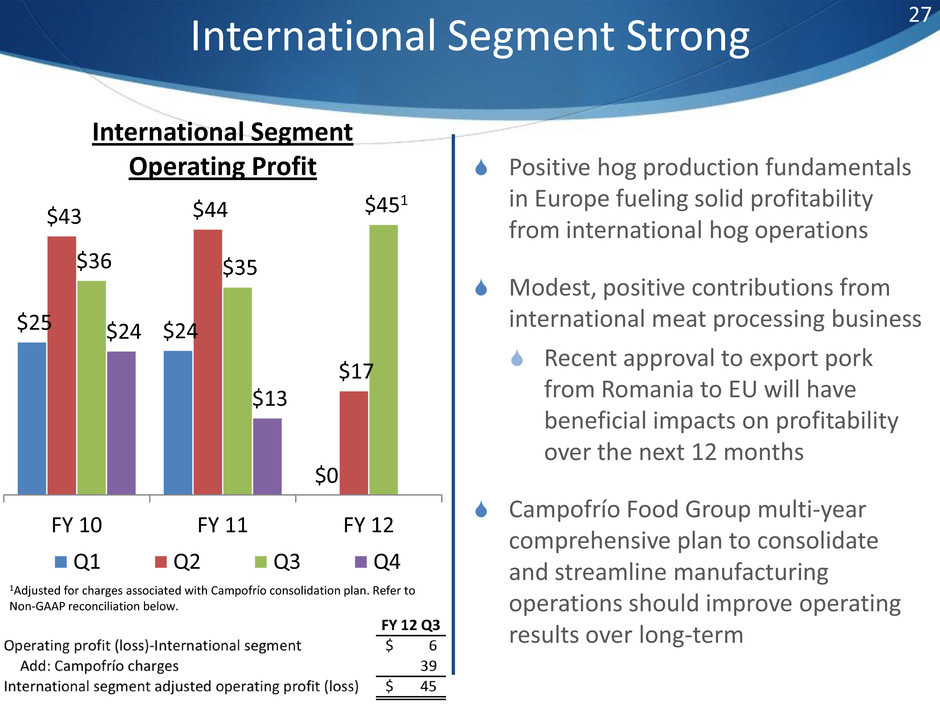
International Segment Strong Positive hog production fundamentals in Europe fueling solid profitability from international hog operations Modest, positive contributions from international meat processing business Recent approval to export pork from Romania to EU will have beneficial impacts on profitability over the next 12 months Campofrío Food Group multi-year comprehensive plan to consolidate and streamline manufacturing operations should improve operating results over long-term $25 $24 $0 $43 $44 $17 $36 $35 $451 $24 $13 FY 10 FY 11 FY 12 International Segment Operating Profit Q1 Q2 Q3 Q4 27 1Adjusted for charges associated with Campofrío consolidation plan. Refer to Non-GAAP reconciliation below.
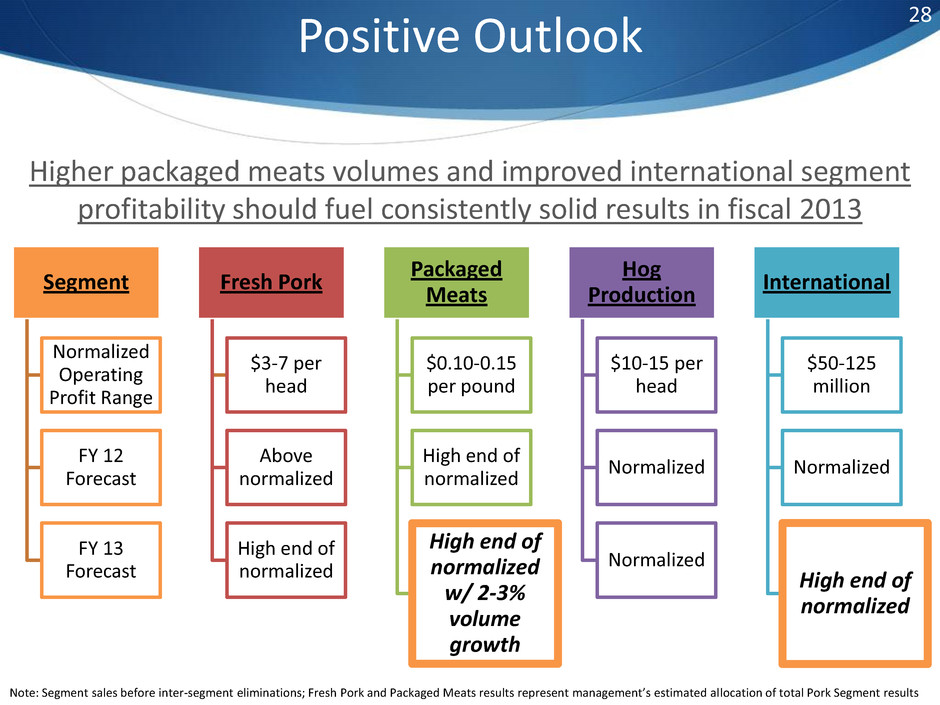
Segment Normalized Operating Profit Range FY 12 Forecast FY 13 Forecast Fresh Pork $3-7 per head Above normalized High end of normalized Packaged Meats $0.10-0.15 per pound High end of normalized High end of normalized w/ 2-3% volume growth Hog Production $10-15 per head Normalized Normalized International $50-125 million Normalized High end of normalized 28 Positive Outlook Higher packaged meats volumes and improved international segment profitability should fuel consistently solid results in fiscal 2013 Note: Segment sales before inter-segment eliminations; Fresh Pork and Packaged Meats results represent management’s estimated allocation of total Pork Segment results
